
Bollinger Bands Explained Tutorial PDF
12
Bollinger Bands Explained Tutorial PDF Bollinger Bands were created by John Bollinger in the 1980s and are one of the most popular and widely used technical analysis indicators in the markets today. 1
-
Upload
khangminh22 -
Category
Documents
-
view
0 -
download
0
Transcript of Bollinger Bands Explained Tutorial PDF
Bollinger Bands Explained Tutorial PDF
Bollinger Bands were created by John Bollinger in the 1980s and are one of the
most popular and widely used technical analysis indicators in the markets today.
1

Not only can Bollinger Bands be used in a large number of markets from Forex,
Cryptocurrencies and stocks, they can also be used on all time frames.
Bollinger Bands are most often used as a trend following indicator as well as
gauging if a market is overbought or oversold.
In this post we go through how you can set them up on your charts and three easy
strategies you can use to trade with them.
Bollinger Bands Settings
Bollinger Bands are created by three ‘bands’; the upper, middle and lower band.
The common standard setting is to have the middle band set to a 20 period simple
moving average.
The upper band is created by taking the middle band and adding twice the
standard deviation.
The lower band is created by taking the middle band minus twice the standard
deviation.
2
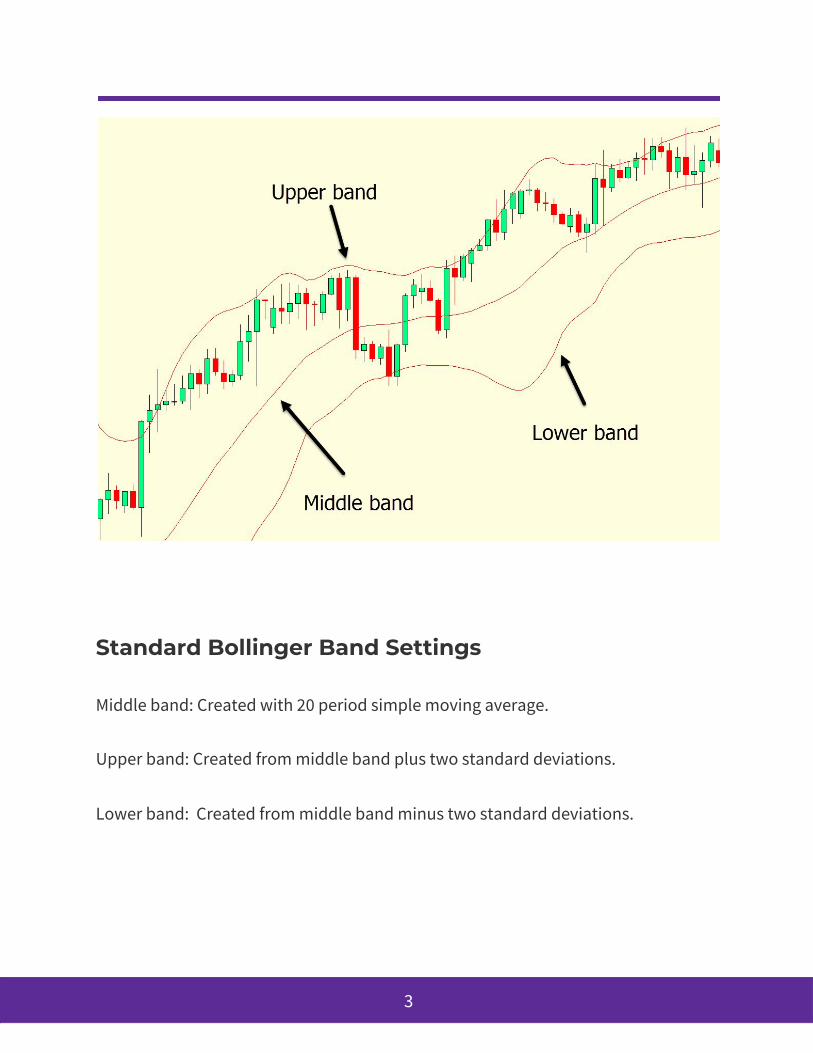
Standard Bollinger Band Settings
Middle band: Created with 20 period simple moving average.
Upper band: Created from middle band plus two standard deviations.
Lower band: Created from middle band minus two standard deviations.
3
Three Bollinger Bands Strategies
Overbought and Oversold Bollinger Bands Strategy
One of the most common Bollinger Band strategies is using them to gauge if a
market is overbought or oversold.
A lot of traders will use these bands and look for price to revert back the middle
band or to the mean.
When using a mean reversion strategy we are assuming that if price deviates or
moves too far away from the mean it will eventually have to come back.
This is often looked at as price moving back from an overbought or oversold
market into more true value.
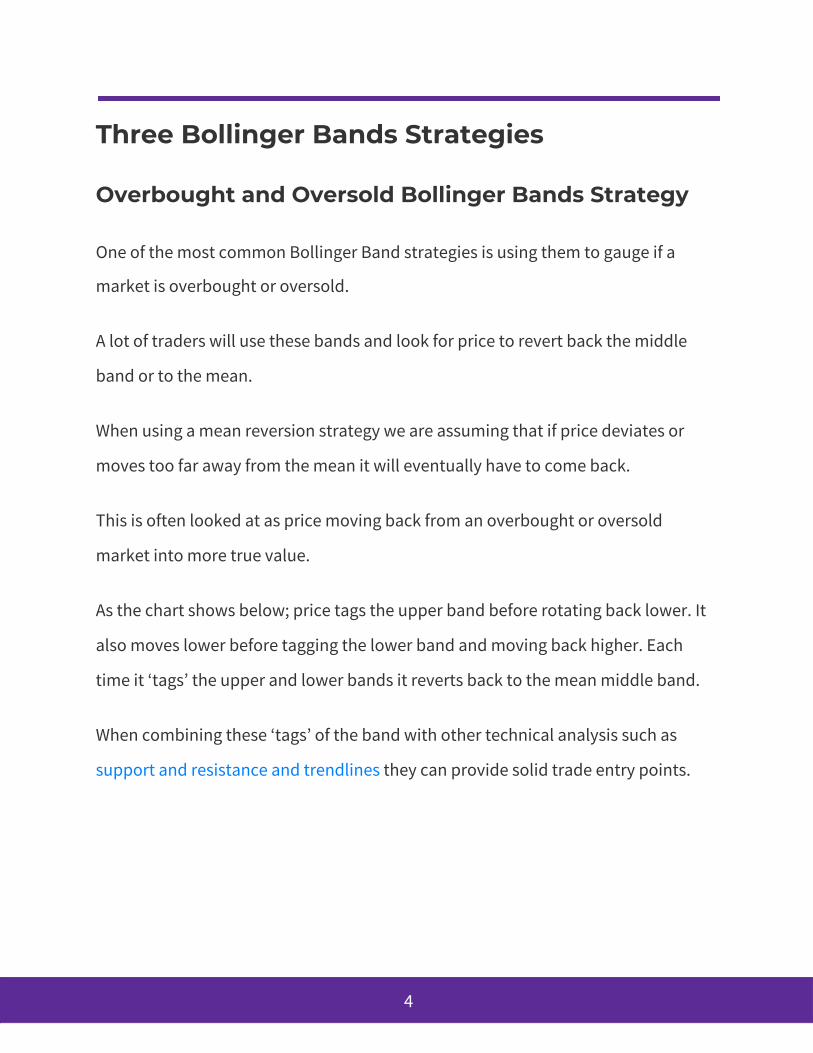
As the chart shows below; price tags the upper band before rotating back lower. It
also moves lower before tagging the lower band and moving back higher. Each
time it ‘tags’ the upper and lower bands it reverts back to the mean middle band.
When combining these ‘tags’ of the band with other technical analysis such as
support and resistance and trendlines they can provide solid trade entry points.
4

This strategy can work well in ranging and sideways conditions.
However, if price goes on a long trending run, then we can see long periods where
price does not move back to the mean and middle band.
This is where using Bollinger Bands in trending markets can be used.
Trend Trading With Bollinger Bands
In strong trending markets where the move has a lot of momentum price will
spend a lot of time away from the mean.
5
If you are trying to trade looking for price to reverse back into the mean and middle
band in these market conditions it can lead to endless stop-outs.
Bollinger Bands react to price as it is being created in live time. They will constrict
and expand as price moves depending on what the price action is doing.
Using other technical analysis and indicators with Bollinger Bands can help you
more clearly identify the trend and also confirm potential trades.
One strategy is to use another moving average such as the 50 EMA.
When all the bands are clearly under the 50 EMA you could look for short trades.
The opposite would be true if price was trending higher and all the bands were
above the 50 EMA.
See the example below of the clear trend lower with all the bands below the 50
EMA.
6

Scalping With Bollinger Bands
Because Bollinger Bands can be used on many markets and on all time frames they
can make a great tool for scalping.
They can also be a good indicator to find scalp trades because if done right they
will help you find fast moving markets where there could be potential for high
reward trades.
7
There are a lot of potential strategies you could test in your own trading, but one
scalping strategy is to combine Bollinger Bands with another moving average such
as the 50 EMA.
Often when a market is moving in a strong trend above or below the 50 EMA price
can make sharp moves. When price is making these sharp moves it will often not
revert to the mean and middle band for some time.
An example of this is on the chart below; price is below the 50 EMA in a down trend.
A potential entry could be when price closes below the lower band.
The trade could have the profit taken when price eventually does revert to the
mean and price closes back above the middle band.
8

To add confirmation to this strategy you could use both the 200 and 50 EMA’s
looking for the golden cross.
An example of this could be if looking to go long; the 50 EMA crosses above the 200
EMA indicating an uptrend.
The Bollinger Bands are above both EMA’s.
9
When price closes above the upper band entry is taken. When price closes back
below the middle band the trade is closed.
NOTE: Make sure you use a news calendar like the DailyFx Economics and news
calendar when scalping to make sure you don’t open any trades directly into major
news announcements.
Using Bollinger Indicator in MT4 and MT5
Using Bollinger Bands inside your MT4 and MT5 charts is very easy.
First make sure you have the correct and best charts to use Bollinger Bands.
Once you have your charts open click “Insert” > “Indicators” > “Bollinger Bands”.
A box will open on your charts with the standard settings.
You can change these settings as well as the colors you would like the bands to
show on your chart.
10

Lastly
Whilst Bollinger bands can be excellent for gauging the strength of the market, the
trend and if a market is overbought or oversold, they should not be used alone.
Other technical analysis and indicators will help you confirm your trade entries
such as support and resistance, trendlines, moving averages and the MACD.
When making trades with Bollinger Bands you always want to take into account
the overall market conditions. Using ‘tags’ of the upper and lower bands for entries
11

may work well in ranging markets, but during strong trends it could see you take a
lot of losses.
Lastly, always test new indicators, analysis techniques and strategies on a demo
trading account to make sure you are profitable with them before ever risking real
money.
12