Sandstones Jackson, MD1, Vinograd - CORE
45
Evidence, Mechanisms and Improved Understanding of Controlled Salinity 1 Waterflooding Part 1: Sandstones 2 3 Jackson, M.D. 1 , Vinogradov, J. 1,2 , Hamon, G. 3 and Chamerois, M. 3 4 1. Department of Earth Science and Engineering, Imperial College London, UK 5 2. Now at the School of Engineering, University of Aberdeen, UK 6 3. TOTAL Research, Pau, France. 7 8 Abstract 9 It is widely accepted that oil recovery during waterflooding can be improved by modifying the 10 composition of the injected brine, typically by lowering the total salinity to less than 5,000ppm. 11 Numerous laboratory experiments and field tests, in both clastic and carbonate rock samples 12 and reservoirs, have demonstrated this ‘low salinity effect’ (LSE). However, despite a plethora 13 of studies and data, the LSE remains poorly understood. Evidence to support the widely held 14 view that improved recovery is conditional on the presence of clay minerals in sandstones, 15 multivalent ions in the formation brine, and significant dilution of the injection brine, is 16 surprisingly scarce. Moreover, there is no method to determine the optimum injection brine 17 composition for a given crude-oil-brine-rock (COBR) system. Many studies have reported the 18 successful application of controlled salinity water injection. However, many others (and more 19 unpublished) observed no benefit, and the available data are often inconsistent and 20 contradictory. 21 This review collects and summarizes the available data for the first time and discusses the pore- 22 to mineral-surface-scale mechanisms that have been proposed to explain the LSE. Based on 23 this, it outlines an integrated experimental programme that could be used to identify the optimal 24 injection brine composition for a given COBR system. The available evidence suggests that 25 the LSE is real, and is caused by one or more pore- to mineral-surface-scale mechanism(s) 26 which facilitate improved oil recovery at the core- to reservoir-scale. These mechanisms occur 27 at COBR interfaces, and are multi-ion exchange (MIE), local increase in pH (∆pH) and double 28 layer expansion (DLE). However, the available evidence is not sufficient to unambiguously 29 identify which, if any, of these mechanisms are essential. Other proposed mechanisms, such 30 as clay swelling and fines migration, formation of natural surfactants at elevated pH, reduction 31 in oil/brine interfacial tension, and increased solubility of polar oil compounds in brine, may 32 occur in some cases but do not appear to be necessary to observe improved oil recovery. 33 Understanding is hampered by a lack of common experimental conditions across length-scales. 34 Core-scale measurements are often obtained at reservoir conditions of pressure, temperature, 35 brine salinity and crude oil composition. In contrast, pore- and mineral-surface-scale 36 measurements such as atomic force or scanning electron microscopy, contact angle and wetting 37 surface, adsorption and adhesion, are often obtained at laboratory temperature and pressure, 38 brought to you by CORE View metadata, citation and similar papers at core.ac.uk provided by Aberdeen University Research Archive
-
Upload
khangminh22 -
Category
Documents
-
view
0 -
download
0
Transcript of Sandstones Jackson, MD1, Vinograd - CORE
Evidence, Mechanisms and Improved Understanding of Controlled Salinity 1 Waterflooding Part 1: Sandstones 2
3
Jackson, M.D.1, Vinogradov, J.1,2, Hamon, G.3 and Chamerois, M.3 4
1. Department of Earth Science and Engineering, Imperial College London, UK 5 2. Now at the School of Engineering, University of Aberdeen, UK 6 3. TOTAL Research, Pau, France. 7
8
Abstract 9
It is widely accepted that oil recovery during waterflooding can be improved by modifying the 10 composition of the injected brine, typically by lowering the total salinity to less than 5,000ppm. 11 Numerous laboratory experiments and field tests, in both clastic and carbonate rock samples 12 and reservoirs, have demonstrated this ‘low salinity effect’ (LSE). However, despite a plethora 13 of studies and data, the LSE remains poorly understood. Evidence to support the widely held 14 view that improved recovery is conditional on the presence of clay minerals in sandstones, 15 multivalent ions in the formation brine, and significant dilution of the injection brine, is 16 surprisingly scarce. Moreover, there is no method to determine the optimum injection brine 17 composition for a given crude-oil-brine-rock (COBR) system. Many studies have reported the 18 successful application of controlled salinity water injection. However, many others (and more 19 unpublished) observed no benefit, and the available data are often inconsistent and 20 contradictory. 21
This review collects and summarizes the available data for the first time and discusses the pore- 22 to mineral-surface-scale mechanisms that have been proposed to explain the LSE. Based on 23 this, it outlines an integrated experimental programme that could be used to identify the optimal 24 injection brine composition for a given COBR system. The available evidence suggests that 25 the LSE is real, and is caused by one or more pore- to mineral-surface-scale mechanism(s) 26 which facilitate improved oil recovery at the core- to reservoir-scale. These mechanisms occur 27 at COBR interfaces, and are multi-ion exchange (MIE), local increase in pH (∆pH) and double 28 layer expansion (DLE). However, the available evidence is not sufficient to unambiguously 29 identify which, if any, of these mechanisms are essential. Other proposed mechanisms, such 30 as clay swelling and fines migration, formation of natural surfactants at elevated pH, reduction 31 in oil/brine interfacial tension, and increased solubility of polar oil compounds in brine, may 32 occur in some cases but do not appear to be necessary to observe improved oil recovery. 33 Understanding is hampered by a lack of common experimental conditions across length-scales. 34 Core-scale measurements are often obtained at reservoir conditions of pressure, temperature, 35 brine salinity and crude oil composition. In contrast, pore- and mineral-surface-scale 36 measurements such as atomic force or scanning electron microscopy, contact angle and wetting 37 surface, adsorption and adhesion, are often obtained at laboratory temperature and pressure, 38
brought to you by COREView metadata, citation and similar papers at core.ac.uk
provided by Aberdeen University Research Archive
lower brine salinity and simplified crude composition. These contrasting experimental 39 conditions may explain the contradictory data obtained to date. 40
A common feature of all three proposed mechanisms for the LSE is that they lead to changes 41 in zeta potential at mineral surfaces, either through changes in mineral surface charge (MIE, 42 ∆pH) or changes in the thickness of the double layer (DLE). Thus they change the magnitude 43 of the electrostatic forces acting between mineral surfaces and polar organic species. 44 Experiments that can probe this effect at conditions appropriate to reservoir displacements, 45 whilst also measuring oil recovery, oil and brine composition and pH, and (if possible) the in-46 situ distribution of the fluids, are required to understand the LSE and predict the optimum 47 injection brine composition for a given COBR system. 48
49
Introduction 50
It is now widely accepted that oil recovery during secondary or tertiary waterflooding can be 51 improved by modifying the composition of the injected brine, typically by lowering the total 52 salinity to less than 5,000ppm (for comparison, seawater salinity is c. 35,000ppm and many 53 formation brines have salinities in excess of 200,000ppm; e.g. Barth, 1990). Numerous 54 laboratory experiments and field tests, in both clastic and carbonate rock samples and 55 reservoirs, have demonstrated this ‘low salinity effect’ (LSE) (e.g. Tang and Morrow, 1999a; 56 1999b; Webb et al., 2004; 2005; McGuire et al., 2005; Lager et al., 2008a; 2008b; Seccombe 57 et al., 2008; 2010; Ligthelm et al., 2009; Vledder et al., 2010; Yousef et al., 2010; 2012a; 58 2012b; 2012c). Modification of injected brine composition was first suggested as an IOR 59 method in clastic reservoirs in the late 1950s by Martin (1959) and again in the 1960s by 60 Bernard (1967). However, the approach did not gain traction until the 1990s and 2000s, when 61 Morrow and co-workers published a series of papers that demonstrated the LSE in coreflooding 62 experiments on outcrop and reservoir sandstones (Jadhunandan and Morrow, 1995; Yildiz and 63 Morrow, 1996; Tang and Morrow, 1997; 1999a,b; 2002; Morrow et al., 1998; Zhang and 64 Morrow, 2006). Shortly after, BP published the results of a ‘log-inject-log’ field trial which 65 showed that injection of low salinity brine (<3,000ppm) in a clastic reservoir reduced the 66 residual oil saturation relative to the injection of seawater or high salinity formation brine (c. 67 220,000ppm; Webb et al., 2004). 68
Since these early studies, a large and increasing number of papers have been published on 69 controlled salinity waterflooding. These have demonstrated its successful application in other 70 laboratory experiments and field trials (e.g. Loaharjo et al., 2007; Lager et al., 2008a; 2008b; 71 Patil et al., 2008; Alotaibi et al., 2010; Cissokho et al., 2010; see, for example, Figure 1a,b) and 72 in carbonate as well as clastic rocks and reservoirs (e.g. Yousef et al., 2011a; 2011b; 2012a; 73 2012b; 2012c). Increases in oil recovery of up to 35% compared to re-injection of formation 74 brine have been observed in laboratory coreflooding experiments (e.g. McGuire et al., 2005; 75 Ligthelm et al., 2009; Austad et al., 2010), and field tests have demonstrated decreases in 76 residual oil saturation of 50% compared to conventional water injection (e.g. Webb et al., 2004; 77 Seccombe et al., 2010). Moreover, there has been increasing focus on the collection of 78
laboratory data to explain the LSE, including contact angles (e.g. Alotaibi et al., 2011), oil-79 brine interfacial tension (e.g. Gupta et al., 2011), coreflood effluent brine composition and pH 80 (e.g. Lager et al., 2008a), zeta potential of mineral surfaces (e.g. Nasralla and Nasr-El-Din, 81 2014), cation-exchange-capacity (CEC) (e.g. Pingo-Almada et al., 2013), adhesion maps (e.g. 82 Buckley et al., 1989; Buckley and Morrow, 1990), adsorption studies (e.g. Austad et al., 2010), 83 and imaging of mineral surfaces at a variety of lengthscales (e.g. Berg et al., 2010; Wideroe et 84 al., 2010; Fogden, 2011). However, despite this plethora of new studies and data, the LSE 85 remains poorly understood. Many published studies have reported the successful application 86 of controlled salinity water injection (e.g. Tang and Morrow, 1999a; 1999b; Webb et al., 2004; 87 2005; McGuire et al., 2005; Lager et al., 2008a; 2008b; Seccombe et al., 2008; 2010; Ligthelm 88 et al., 2009; Vledder et al., 2010), but there are also many other published experiments (and 89 many more unpublished), in which no benefit was observed (e.g. Sharma and Filoco, 2000; 90 Zhang and Morrow, 2006; Pu et al., 2008; Boussour et al., 2009; Alotaibi et al., 2010; Cissokho 91 et al., 2010; Rivet et al., 2010; RezaeiDoust et al., 2010; Skrettingland et al., 2011; Shiran and 92 Skauge, 2012; Nasralla and Nasr-El-Din, 2014; see, for example, Figure 1c,d). Moreover, 93 many studies report data that support a particular hypothesis but contradict, or are inconsistent 94 with, the results of other studies. Other studies fail to obtain, or report, data other than those 95 required to test a given hypothesis, so the results cannot be cross-compared (see Al-Adasani et 96 al., 2012 for an overview and also Table 1). 97
The aim of this review is to facilitate such a comparison where possible and, in other cases, to 98 collect and summarize the available data. The objectives of the review are fivefold: (i) to 99 summarize the evidence that supports the LSE; (ii) to identify the key mechanisms that have 100 been proposed for the LSE and the evidence to support these, (iii) to identify where evidence 101 for a particular mechanism contradicts, or is inconsistent with, the results of other studies, (iv) 102 to highlight the key issues that must be resolved before the LSE can be properly explained, and 103 (v) to suggest approaches to resolve these. Three recent summaries provide good but relatively 104 brief introductions to the topic (Morrow and Buckley, 2011; Skauge, 2013; Sheng, 2014); this 105 review explores the data and mechanisms in rather more depth. We do not discuss numerical 106 simulation of the LSE (see Sheng 2014 for an overview). We focus here on sandstone rock 107 samples and reservoirs; controlled salinity waterflooding in carbonates will discussed in a 108 companion paper. 109
110
Evidence to support the low salinity effect 111
Much of the evidence to support the LSE, defined here as an increase in oil recovery with 112 decreased injection brine salinity or altered brine composition, comes from laboratory 113 coreflood experiments, either in secondary or tertiary mode. Coreflood data are often 114 supplemented by spontaneous imbibition (SI) experiments. We focus here on the results of 115 coreflooding experiments, and also on a number of field tests which report data consistent with 116 the LSE. SI experiments can quantify wettability changes associated with the LSE, but 117 increases in oil recovery in SI experiments are often poorly correlated with improved oil 118 recovery in corefloods (e.g. Skauge, 2013; Masalmeh et al., 2014; Sorop et al., 2015). 119
The earliest evidence of the LSE came from coreflood experiments using synthetic cores 120 containing sand and montmorillonite, Berea cores, and outcrop cores from Wyoming. In these 121 experiments, injecting brine containing <10,000ppm NaCl yielded higher recovery of Soltrol 122 in both secondary and tertiary waterfloods compared to brine containing up to 150,000ppm 123 NaCl (Bernard et al., 1967). Improved oil recovery was associated with a significant increase 124 in pressure drop across the samples at the residual oil saturation. All cores were clay bearing, 125 although the Berea samples contained only trace amounts (Table 1). Further indirect evidence 126 of the LSE in sandstones was provided by Yildiz and Morrow (1996), who investigated the 127 impact of mono- and divalent ions on waterflooding using simple synthetic brines. Tang and 128 Morrow (1997) investigated the impact on oil recovery of aging and displacement temperature, 129 oil composition, and initial and invading brine salinity. The LSE was not specifically identified 130 in these studies; indeed, reducing the invading brine salinity was reported to yield only modest 131 recovery increases. Reducing the initial brine salinity was observed to have a much more 132 significant effect. The first comprehensive study of the LSE in sandstones was undertaken by 133 Morrow et al. (1998) and Tang and Morrow (1999a,b) who demonstrated that injection of low 134 salinity brine increased oil recovery in both secondary and tertiary mode. 135
Since then, numerous studies have demonstrated the LSE in sandstone coreflooding 136 experiments, and have investigated various aspects of the experimental method, rock and fluid 137 materials, and initial and flooding conditions (see Table 1 for a summary). A number of field 138 tests have also reported data consistent with the LSE. Webb et al. (2004) observed reduced 139 residual oil saturation in log-inject-log tests after low salinity water injection in secondary 140 mode, while single-well-chemical-tracer-tests (SWCTT) have demonstrated reduced residual 141 oil saturation and improved oil recovery following secondary and tertiary low salinity water 142 injection in sandstone (McGuire et al., 2005; Seccombe et al., 2008) and carbonate (Yousef et 143 al., 2012c) reservoirs. Inter-well tests have provided evidence of the LSE at the reservoir scale 144 (Lager et al., 2008b; Seccombe et al., 2010), as has some historical field data (Robertson et al., 145 2007; Batias et al., 2009; Vledder et al., 2010). 146
147
Necessary conditions for the low salinity effect 148
It is widely accepted that the following conditions are necessary for the LSE to be observed in 149 sandstones (see also Tang and Morrow, 1999a; Morrow and Buckley, 2011): 150
1. Significant clay fraction. 151 2. Presence of formation water. 152 3. Exposure to crude oil containing acid or basic polar components to create mixed- or 153
oil-wet initial conditions. 154 4. Significant reduction in salinity of injection brine. 155 5. Presence of multivalent ions in the connate water. 156
These necessary conditions are qualitative; they are not sufficient to quantitatively predict the 157 LSE. Moreover, in some cases they appear to be necessary but not sufficient, because 158 experimental studies have been published that appear to meet these conditions but in which the 159
LSE was not observed. Thus they cannot be used to screen candidate reservoirs for low salinity 160 water injection. The supporting evidence for these conditions is discussed briefly in the 161 following sections. 162
163
Presence and type of clay minerals 164
It is widely agreed that clay minerals are required to observe the LSE effect in sandstones. The 165 importance of clay minerals was initially highlighted by Bernard (1967) and further 166 investigated by Tang and Morrow (1999a), who claimed that the LSE was not observed in 167 clean sandstones, or sandstones in which clay minerals had been stabilised by firing and 168 acidizing. However, only one low salinity coreflood was reported in a clean sandstone, and 169 this contained an iron oxide coating which was interpreted to significantly modify the quartz 170 surface properties; moreover, firing and acidizing modifies crude oil-brine-rock (COBR) 171 interactions beyond stabilizing clay fines. Thus the presence of clays as a necessary condition 172 for the LSE was not supported by abundant evidence. Subsequent papers by Morrow and co-173 workers assumed clays were necessary, and experiments investigating the LSE were almost all 174 conducted on clay-bearing sandstone samples (e.g. Tang and Morrow 1999b; Zhang and 175 Morrow, 2006; Loahardjo et al., 2007, 2010; Zhang et al, 2007). 176
The importance of clay minerals was also emphasized by Lager et al. (2007) and Seccombe et 177 al. (2008), who published a correlation suggesting the LSE increases with increasing kaolinite 178 content. However, the correlation was based on only four data points and the lowest kaolinite 179 content investigated was c. 4.5 wt%. Lebedeva et al. (2011) observed the LSE in sandpacks 180 with kaolinite-coated sand, but not in pure quartz sand. Zhang and Morrow (2006) further 181 claimed that the type of clay mineral was important, attributing the lack of LSE in some Berea 182 sandstone samples to the presence of chlorite. Later studies have argued that the LSE should 183 be favoured by clay minerals with high CEC (e.g. Austad et al. 2010), although this criterion 184 alone would not rule out chlorite, and suggests kaolinite is suboptimal (Table 2). The LSE has 185 been demonstrated with clay mineral types other than kaolinite (e.g. Cissokho et al., 2010). 186 Recent studies have argued that clay minerals are important because they are more susceptible 187 to wettability alteration in the presence of multivalent ions such as Ca2+ (e.g. Mugele et al., 188 2015). However, shortly after the pioneering work of Tang and Morrow (1999a), the presence 189 of clay minerals as a necessary condition for the LSE became widely accepted and, as a result, 190 very few studies have investigated the LSE in clay-free sandstones (although not all report the 191 clay content; see Table 1). Some studies have observed the LSE in clay-free sandstones and 192 sandpacks, and at quartz mineral surfaces (e.g. Pu et al., 2008, 2010; Hassenkam et al., 2011, 193 2012; Suman et al., 2014). It has also been suggested that organic material adsorbed onto the 194 surface of quartz grains may enhance the LSE (Mathiesen et al., 2014; Hilner et al., 2015). The 195 published evidence supporting the presence of clay minerals as a necessary condition is 196 therefore far from overwhelming. 197
198
Wettability alteration and the LSE 199

It is also widely agreed that the LSE effect in sandstones is observed when (i) the initial wetting 200 state has changed from strongly water-wet towards mixed-wet after aging, and (ii) the 201 wettability of the mineral surfaces changes to become more water-wet when low salinity brine 202 enters the pore-space. 203
A number of mechanisms have been proposed to facilitate wettability alteration of silicate 204 mineral surfaces following primary drainage. These include (i) surface precipitation, observed 205 when the oil is a poor solvent for polar organic compounds, (ii) direct adsorption of polar 206 organic compounds onto oppositely charged mineral surface sites following collapse of the 207 water film at low pH and/or high salinity, and (iii) multivalent cation bridging to allow polar 208 organic compounds to adsorb onto mineral surfaces with the same polarity (e.g. Buckley et al., 209 1989, 1997, 1998). Wettability alteration therefore depends upon the properties of the oil (polar 210 compounds and solvency), the properties of the mineral surfaces (CEC, surface groups and 211 electrical charge) and the composition and pH of the formation brine that initially wets the 212 surfaces (e.g. Drummond and Israelachvili, 2004; Suijkerbuijk et al., 2012). It is widely agreed 213 that the LSE is observed only if one or more of these mechanisms caused wettability alteration 214 prior to low salinity brine injection. 215
The majority of the evidence to support wettability alteration towards more water-wet 216 conditions when low salinity brine enters the pore-space has been obtained from core-scale SI 217 experiments. These have yielded higher imbibition rate and total oil production with decreased 218 salinity of the invading brine in both secondary and tertiary mode (e.g. Fig. 2a). Measurements 219 of contact angle and/or oil wetting area at oil-brine-mineral interfaces have also shown a 220 decrease with decreasing salinity, consistent with a change to more water-wet conditions (e.g. 221 Alotaibi et al., 2011; Suijkerbruik et al., 2013; Mahani et al., 2013; Fig. 2b). However, we note 222 that nano-scale imaging of the pore-scale distribution of oil and water in natural sandstone 223 using cryogenic broad ion-beam polishing in combination with scanning electron microscopy 224 (cryo-BIB-SEM) is casting doubt on the utility of contact-angle measurements to characterize 225 wettability (Schmatz et al., 2015). Some evidence for wettability change is also provided by 226 Nuclear Magnetic Resonance (NMR) analysis, which has suggested a more water-wetting state 227 following low salinity brine injection in intact sandstone samples (Chen et al., 2010; Wideroe 228 et al. 2010). At the mineral-surface scale, direct imaging of clay-coated surfaces using optical 229 microscopy (Berg et al., 2010; Cense et al., 2011; Fig. 2c) and SEM (Fogden et al., 2011) has 230 suggested that oil droplets can be detached by low salinity brine to expose more water-wet 231 surfaces, consistent with a change to a more water-wetting state. However, in the study by 232 Fogden et al. (2011), it was argued that increased adhesion of polar oil components to clay 233 minerals at low salinity (discussed further below) caused clay particles to be detached and 234 mobilized with the oil; the clay minerals became less water-wet with decreasing salinity, but 235 their mobilisation revealed more water-wet surfaces. A similar mechanism may also have 236 operated in the study by Berg and co-workers (Berg et al., 2010; Cense et al., 2011). 237
Atomic Force Mapping (AFM) at the molecular scale has, in contrast, suggested decreased 238 rather than increased adhesion of both polar and non-polar oil components to silica and natural 239 quartz surfaces at low salinity (Hassenkam et al., 2011, 2012; Mathieson et al., 2014; Hilner et 240 al., 2015). However, illite clay and mica were less sensitive than pure silica, which is 241

inconsistent with the view that clay minerals play an important role (Hassenkam et al., 2011, 242 2012). SEM imaging has also suggested that aged glass surfaces can become more water-wet 243 (or have the advancing contact modified to mimic water-wet behaviour) when in contact with 244 low salinity brine at moderate to high pH (Fogden, 2011). Indirect evidence of the importance 245 of wettability alteration is also suggested by the temperature dependence of the LSE observed 246 in some studies, although the evidence is contradictory: some studies suggest secondary 247 recovery increases with increasing temperature (Cissokho et al., 2010; Robertson, 2010) and 248 others suggest the opposite (Gamage and Thyne, 2011), while tertiary recovery appears to be 249 maximized at intermediate temperature (Cissokho et al., 2010; Gamage and Thyne, 2011). 250 Wettability change is known to be temperature dependent (e.g. Jadhunandan and Morrow; 251 1995; Liu and Buckley, 1997; Tang and Morrow, 1997). 252
Despite the broad consensus that the LSE is associated with a change to more water-wetting 253 conditions, the evidence is still contradictory. At the core-scale, Ashraf et al. (2010) 254 determined initial wettability after aging using the Amott-Harvey method and correlated this 255 with the LSE; low salinity corefloods yielded the highest incremental recovery for the samples 256 which were initially most water-wet, not mixed-wet (Fig. 2d). Sandegen et al. (2011) history 257 matched successful low salinity corefloods and obtained the best match for lower imbibition 258 capillary pressure curves, consistent with a change to more oil-wet conditions; however, the 259 results were uncertain owing to a lack of constraining experimental data. At the mineral-260 surface scale, adhesion measurements by Buckley and co-workers (Buckley et al., 1989, 261 Buckley and Morrow, 1990) for various crude oils on glass surfaces have demonstrated that 262 adhesion is pH-dependent at low salinity, consistent with the Derjaguin-Landau-Verwey-263 Overbeek (DLVO) theory that describes the relative contribution of electrostatic and van-der-264 Waals forces dictating colloidal stability (e.g. Evans and Wennerstrom, 1999). However, a 265 transition from no adhesion to adhesion was typically observed with decreasing salinity at fixed 266 pH (e.g. Fig. 2e), inconsistent with the wettability changes described above. The trend could 267 be reversed at elevated temperature for some crude oils (Buckley and Morrow, 1990). 268 Similarly, Drummond and Israelachvili (2002, 2004) recorded an increase in the static contact 269 angle of mica surfaces with decreasing salinity at moderate pH, inconsistent with increasingly 270 water-wet behaviour (e.g. Fig. 2f). However, the brines in these studies did not contain any 271 divalent cations such as Ca2+ or Mg2+. Lebedeva and co-workers (Lebedeva and Fogden, 2010; 272 Lebedeva et al., 2010) found that adhesion (characterised via the hysteresis of advancing and 273 receding contact angles) of crude oil to kaolinite increased with decreasing pH and salinity of 274 both NaCl and CaCl2 brines. Adsorption of polar oil components onto silicate mineral surfaces 275 has also been shown to be strongly pH dependent (e.g. Austad et al. 2010; RezaiDoust et al., 276 2011; Aksulu et al., 2012; see Fig. 3a,b); changes in pH are often associated with the LSE (e.g. 277 Fig. 3c). 278
Wettability change is a consequence, not a cause, of the processes underlying the LSE, and 279 several mechanisms have been proposed that relate wettability changes to the injection of low 280 salinity brine (see next section). Optimum oil recovery is usually observed in mixed-wet 281 conditions, which yield relatively low water relative permeability and residual oil saturation 282
(e.g. Jadhunandan and Morrow, 1995). Thus a shift to more water-wet conditions during low 283 salinity waterflooding should not favour increased recovery (Li, 2011). 284
During injection of high salinity brine into an initially mixed-wet system, in which the larger 285 pores are preferentially oil-wet, the invading brine first displaces oil from the water-wet pores 286 in the order smallest to largest. It then displaces oil from the oil-wet pores from largest to 287 smallest, until the capillary entry pressure exceeds the driving pressure, leaving oil trapped on 288 oil-wet surfaces and in the intermediate-sized pores. This process yields higher recovery than 289 waterflooding a water-wet system, in which the invading brine displaces oil from the pores in 290 the order smallest to largest, leaving oil trapped in the largest pores (Jadhunandan and Morrow, 291 1995). Sorbie et al. (2010) suggested that injecting low salinity brine into the same system 292 decreases the contact angle and therefore the capillary entry pressure of the oil-wet pores, thus 293 allowing low salinity brine to displace oil from smaller pores for the same driving pressure and 294 reducing the residual oil saturation. This hypothesis has not been confirmed by pore-scale 295 imaging or modelling, although advances in nano-scale imaging may make this possible (e.g. 296 Cissokho et al., 2011; Fogden et al., 2011; Schmatz et al., 2015). Such imaging techniques 297 have shown that a non-wetting oil phase may be separated from quartz mineral surfaces by a 298 thin brine film, but there can be direct points of contact between oil and mineral at asperities 299 and clay aggregates. Such contact points act as pinning points and cause discontinuous motion 300 of the oil-water-solid contact line. The LSE may involve the de-pinning of these contact lines 301 rather than wholesale wettability alteration of mineral surfaces (Schmatz et al., 2015). 302
303
Reduction in injection brine salinity 304
Tang and Morrow (1999a) observed the LSE effect with injection of 10 and 100 times diluted 305 formation brine (c. 24,000ppm TDS, yielding injection brine salinities of c. 2,400 and 240ppm 306 TDS); higher injection brine salinities were not tested. Improved recovery was observed with 307 dilution of injection brine, and also formation plus injection brine (see also Yildiz and Morrow, 308 1996; Tang and Morrow, 2002; Zhang and Morrow, 2006). Lager, Webb and co-workers found 309 no LSE with injection of seawater into cores containing higher salinity formation brine, but a 310 significant LSE in the same system when injecting 1,000ppm brine (Fig. 4a); they suggested, 311 based on experience from (mostly unreported) coreflooding experiments, that the LSE is 312 observed only for injection brine salinities below c. 5000ppm (Webb et al., 2004, 2005; Lager 313 et al., 2007). Subsequent studies have almost all used low salinity brines with concentrations 314 below 5000ppm (see Table 1). Cissokho et al. (2010) reported a clear threshold in injected 315 brine (NaCl+CaCl2) salinity of 1000ppm below which the LSE was observed (Fig. 4b). 316
However, no model is available to predict this threshold value for a given COBR system. 317 Moreover, numerous studies have demonstrated that simply reducing the injected brine salinity 318 below a threshold value is not sufficient for the LSE to be observed (e.g. Sharma and Filoco, 319 2000; Zhang and Morrow, 2006; Pu et al., 2008; Alotaibi et al., 2010; Cissokho et al., 2010; 320 Rivet et al., 2010; RezaeiDoust et al., 2010; Skrettingland et al., 2011; Nasralla and Nasr-El-321 Din, 2014; Fig. 1c,d). In some cases, improved recovery has been observed by increasing the 322
injection brine salinity relative to the formation brine (e.g. Tang and Morrow, 1997; Sharma 323 and Filocco, 2000; Fig. 1e). RezaeiDoust et al. (2011) observed a modest increase in recovery 324 when injecting NaCl brine of higher salinity, but the same ionic strength, into a core containing 325 crude oil and CaCl2 brine (Fig. 1f). Thus the evidence that improved recovery is necessarily 326 associated with a significant reduction in brine salinity is not conclusive. Rather, it appears that 327 recovery can be improved by modifying the injection brine salinity (composition) in some 328 controlled way that has not yet been identified. 329
330
Initial water saturation and presence of multivalent ions in the formation brine 331
Most oil reservoirs initially contain some formation water containing multivalent ions (e.g. 332 Barth, 1990); thus these necessary conditions are normally satisfied. Tang and Morrow (1999a) 333 observed no LSE in cores aged in crude oil with no formation brine, while Lager et al. (2008a) 334 observed no LSE in cores from which multivalent ions had been flushed from the mineral 335 surfaces, prior to aging in crude oil and brine containing no multivalent ions. They argued that 336 multivalent ions must be initially present to promote wettability alteration of clay mineral 337 surfaces through bridging mechanisms specifically involving these cations (see also Anderson, 338 1986 and references therein). As discussed above, the presence of formation water, and of 339 multivalent ions in the formation water, appears to be related to the initial mixed-wetting state 340 required for the LSE. 341
However, the LSE has been reported in cores aged in crude oil and brine containing no 342 multivalent ions other than those initially adsorbed onto mineral surfaces (Agbalaka et al., 343 2008). Moreover, Li (2011) observed the highest incremental oil recovery during tertiary low 344 salinity waterflooding in a weakly water-wet Berea sandstone sample aged with crude oil 345 without initial water present. Numerous studies have demonstrated that formation brine 346 containing multivalent ions is not sufficient for the LSE to be observed (e.g. Sharma and Filoco, 347 2000; Zhang and Morrow, 2006; Alotaibi et al., 2010; Cissokho et al., 2010; Rivet et al., 2010; 348 RezaeiDoust et al., 2010; Skrettingland et al., 2011; Nasralla and Nasr-El-Din, 2014). Aksulu 349 et al. (2012) argued that the initial pH is also important, with low pH (c. 5) promoting 350 adsorption of polar oil compounds (e.g. Fig 3a,b). However, numerous studies have observed 351 the LSE at higher initial pH (e.g. Morrow et al., 1998; Maas et al., 2001; McGuire et al., 2005; 352 Lager et al., 2008a; Cissokho et al., 2010; Fjelde et al., 2012; see Table 1). As yet, no model 353 or dataset is available that allows the optimal initial brine saturation, composition or pH to be 354 predicted. 355
356
Summary 357
Evidence to support the widely accepted necessary conditions for the LSE to be observed in 358 sandstones is surprisingly sparse, despite the large number of published studies. Formation 359 water is invariably present so this condition is naturally met; however, evidence supporting the 360 necessary presence of clay minerals and multivalent ions, initially mixed-wet conditions, and 361
a significant reduction in injection brine salinity, is far from overwhelming. To properly 362 predict the necessary conditions for the LSE to be observed requires an understanding of the 363 underlying mechanisms; these are reviewed in the next section. 364
365
Proposed mechanisms for the low salinity effect in sandstones 366
Clay swelling and fines migration 367
Mechanism: Early studies of the LSE suggested that improved recovery is associated with clay 368 swelling and fines migration (Bernard, 1967; Tang and Morrow, 1999a) which are known to 369 be promoted at low salinity (e.g. Lever and Dawe, 1984). Bernard (1967) suggested that the 370 LSE is associated with swelling clays such as montmorillonite. Tang and Morrow (1999a) 371 suggested that the LSE results from (i) adsorption of polar components from crude oil onto 372 fines-coated mineral surfaces through one of the mechanisms discussed previously (Fig. 5a), 373 (ii) stripping of the mixed-wet fines during low salinity water injection, and (iii) accumulation 374 of the oil-bearing fines at the oil-water interface (Fig. 5b). In their model, the LSE results from 375 the mobilization of oil attached to the fines, with exposure of the water-wet surfaces beneath 376 the stripped fines yielding more water-wet behaviour (Fig. 5c). 377
Supporting evidence: Bernard (1967) observed improved recovery in coreflooding experiments 378 only when associated with an increase in pressure drop (at constant rate) consistent with 379 formation damage (e.g. Krueger, 1986). Elution of fines was not reported. Tang and Morrow 380 (1999a) observed increased oil recovery (e.g. Fig. 6a), an increase in pH, and an increase in 381 pressure drop associated with production of fines (e.g. Fig. 6b), when dilute formation brine 382 (<1550 ppm TDS) was injected in secondary and tertiary mode into sandstone cores containing 383 kaolinite. The LSE ceased after firing of the cores (compare Fig. 6c,d), injection of Ca2+ ions 384 during successful low salinity waterfloods (e.g. Fig. 6a), reduction of the initial water saturation 385 to zero (Fig. 6e), and with the use of refined oil. Tang and Morrow (1999a) argued that each 386 of these actions stabilized or removed the fines, which is why the LSE effect ceased. A number 387 of subsequent studies have also observed evidence of fines migration associated with the LSE, 388 either through elution of fines (e.g. Loaharjo et al., 2007; Agbalaka et al., 2008; Boussour et 389 al., 2009) or by SEM imaging of the pore-space (e.g. Cissokho et al. 2011; Fogden et al., 2011). 390
Contrary evidence: Numerous studies have observed the LSE without production of fines (e.g. 391 Zhang and Morrow, 2006; Zhang et al., 2007; Lager et al., 2008a; 2008b; Alagic and Skauge, 392 2010; Ligthelm et al., 2009; Cissokho et al., 2010; Alotaibi et al., 2010; Rivet et al., 2010; 393 RezaeiDoust et al., 2011); others have observed modest or no reduction in permeability (e.g. 394 Zhang et al., 2007; Lager et al., 2008a,b; Ligthelm et al., 2009; Alotaibi et al., 2010; Rivet et 395 al., 2010; Pu et al., 2010; Robertson et al., 2010; RezaeiDoust et al., 2011). Several studies 396 have observed fines production and/or permeability decrease with no LSE (e.g. Boussour et 397 al., 2009; Cissokho et al., 2010; 2012; Nasralla and Nasr-El-Din 2014). This suggests that 398 fines migration and associated permeability changes are not always associated with the LSE 399 and vice-versa. Moreover, it is clear that clay swelling and/or fines migration cannot explain 400 the LSE observed in carbonates (e.g. PART 2). 401
Summary: Clay swelling and fines migration may be the underlying mechanism that causes the 402 LSE in some cases, but the LSE is not conditional on the occurrence of clay swelling and fines 403 migration. 404
405
pH increase and surfactant generation 406
Mechanism: McGuire et al. (2005) suggested that the increase in pH observed in some low 407 salinity corefloods (e.g. Fig. 3c) leads to the generation of surfactants from the residual oil. 408 These reduce the oil-water interfacial tension (IFT), and also the oil-water contact angle to 409 yield more water-wet conditions. When crude oil is contacted by the low salinity water with 410 elevated pH, the acid components in the oil are saponified. McGuire et al. (2005) argued that 411 this leads to improved oil recovery in a process analogous to alkaline surfactant flooding. They 412 further argued that the reduction in Ca2+ and Mg2+ concentration in low salinity brine inhibits 413 the precipitation of surfactants observed in high salinity systems. Thus the injection of low 414 salinity brine both causes surfactants to be generated, and allows them to function more 415 efficiently to increase oil recovery. 416
Supporting evidence: pH increases associated with the LSE have been reported by a number of 417 authors (e.g. Fig. 3c). McGuire et al. (2005) suggested that the sensitivity of surfactant 418 precipitation to Ca2+ is responsible for the effect observed by Tang and Morrow (1999a) in 419 which injection of Ca2+ ions during a successful low salinity waterflood terminated the LSE 420 (e.g. Fig. 6a). 421
Contrary evidence: Although effluent oil-brine IFT has been observed to decrease (from c. 422 25mN/m to c. 18mN/m) with a concomitant increase in pH during successful low salinity 423 corefloods, the few reported values remain too high for saponification to have occurred (Tang 424 and Morrow, 2002). The saponification reaction requires high acid number, yet the LSE has 425 been observed with lower AN crudes (e.g. Zhang and Morrow, 2006; Loaharjo et al., 2007; 426 Zhang et al., 2007; Boussour et al., 2009; Pu et al., 2010; RezaeiDoust et al., 2011). No 427 correlation between the LSE and AN has been observed (Fig. 7; Lager et al., 2008a). Moreover, 428 it has been suggested that the pH required for saponification (pH>9) is unlikely to be observed 429 at reservoir conditions, owing to the presence of CO2 and other pH buffers. A number of 430 studies have demonstrated the LSE in unbuffered systems with pH<9 suggesting saponification 431 did not occur (e.g. Fig. 3d; see also Table 1). Zhang et al. (2007) found no relationship between 432 effluent pH and the LSE. 433
Summary: If sufficiently high pH (>9) is reached with high acid number oils (>0.2 mgKOH/g), 434 then saponification may occur, but this seems unlikely in many reservoir settings and the LSE 435 is not conditional on saponification. 436
437
Multi-ion exchange (MIE) 438

Mechanism: Lager et al. (2008a) were the first to measure effluent brine composition during 439 coreflooding experiments and noted that Ca2+ and Mg2+ concentrations initially fell below those 440 in the low salinity injection brine (Fig. 8). They suggested that this ‘stripping’ of multivalent 441 ions is associated with ion exchange between the low salinity brine and clay minerals. In their 442 model, adsorption of multivalent ions such as Ca2+ and Mg2+ onto clay mineral surfaces is 443 promoted at low concentration, in exchange for directly adsorbed polar oil compounds. Thus 444 MIE releases oil previously adsorbed onto clay mineral surfaces and makes these surfaces more 445 water-wet (Fig. 9). For the LSE to be observed, the model predicts that clay minerals must be 446 present along with Ca2+ and Mg2+ cations in the formation brine; moreover, polar oil 447 compounds must have been adsorbed directly onto the clay mineral surfaces following primary 448 drainage. 449
Supporting evidence: MIE has been observed when fresher groundwater invades a more saline 450 sandstone aquifer containing clay minerals (or other ion exchangers) and multivalent ions (e.g. 451 Valocchi et al., 1981; Appelo et al., 1994), and also in clay-bearing sandstone corefloods at the 452 residual oil saturation (Pingo-Almada et al., 2013). Lager et al. (2008a) tested the link between 453 MIE and the LSE by removing all Ca2+ and Mg2+ from the clay mineral surfaces in a sandstone 454 core and then flooding with high and then low salinity NaCl brine; the low salinity brine yielded 455 no additional recovery. Subsequent addition of Ca2+ and Mg2+ to the low salinity brine also 456 yielded no additional recovery. When Ca2+ and Mg2+ ions were initially present in the same 457 plug, low salinity flooding (with Ca2+ and Mg2+ present) yielded an additional 5% recovery. 458 Lager et al. (2008a) further argued that the absence of a LSE observed by Tang and Morrow 459 (1999a) after firing of their Berea sample was because ion exchange with the clay minerals was 460 prevented. Alagic and Skauge (2010) found that Mg2+ was retained in aged samples during 461 successful LSE corefloods, which is consistent with MIE if Mg2+ present in the initial brine 462 was adsorbed onto clay mineral surfaces after injection of low salinity NaCl brine. Ca2+ was 463 eluted, but this was ascribed to calcite dissolution. 464
Contrary evidence: Adsorption of Ca2+ and Mg2+ at low salinity is inconsistent with the 465 increased pH observed in many studies if this reflects cation exchange with protons in response 466 to low salinity injection as discussed in the next section (e.g. Austad et al. 2010); however, pH 467 increase may also reflect the presence and dissolution of small amounts of carbonate material 468 (e.g. Tang and Morrow, 1999a; McGuire et al., 2005; Lager et al., 2008a; Pu et al., 2008; 2010). 469 Lager et al. (2008a) argue that clay minerals act as ion exchangers, suggesting those with high 470 CEC are optimal, yet kaolinite has been closely associated with the LSE despite its relatively 471 low CEC (Table 2; Lager et al. 2007; Seccombe et al. 2008). Evidence to link MIE and the 472 LSE is sparse: only two papers report effluent cation depletion below that of the injected lower 473 salinity brine in association with a significant LSE (Lager et al. 2008a,b; see Fig. 8a,b); a third 474 claimed effluent cation depletion but the reported data are insufficient to confirm this and the 475 observed LSE was in any case very small (Wideroe et al., 2010). 476
Summary: MIE has been observed in field and laboratory experiments and is known in the 477 water resources literature. However, MIE alone is not enough to cause the LSE: an additional 478 requirement is the presence of crude oil containing polar components initially adsorbed directly 479 onto clay mineral surfaces that can exchange with divalent cations in the brine. No optimum 480
clay type, crude oil or injection brine composition, or method for predicting these, has been 481 derived from the MIE model. Moreover, published evidence to directly link MIE with the LSE 482 is sparse. The MIE mechanism alone does not explain the numerous coreflooding experiments 483 where the conditions for MIE were met but no LSE was observed. 484
485
Local increase in pH (∆pH) 486
Mechanism: Austad and co-workers (Austad et al. 2010; RezaiDoust et al., 2009, 2011; Aksulu 487 et al., 2012) proposed a model that also invokes ion exchange but, in contrast to the MIE model 488 of Lager et al. (2008a), they suggested that injection of low salinity brine leads to desorption 489 of surface-active cations from clay mineral surfaces and replacement by protons. This causes 490 a concomitant increase in local pH, which is sufficient to release previously adsorbed acidic 491 and basic organic materials (Fig. 10). For the LSE to be observed, the model requires clay 492 minerals to be present, along with surface-active cations in the formation brine (particularly 493 Ca2+ and Mg2+), and polar oil compounds initially adsorbed directly onto the clay mineral 494 surfaces following primary drainage (similar to the MIE model). Moreover, adsorption of polar 495 oil compounds must be strongly pH dependent. 496
Supporting evidence: Austad and co-workers noted that many unbuffered laboratory 497 coreflooding experiments show an increase in pH following the injection of low salinity brine 498 (e.g. Fig. 3c); moreover, RezaiDoust et al. (2011) found that pH increase depended upon the 499 prevalent cation affinity to clay mineral surfaces, with low salinity NaCl brines showing the 500 largest pH increase consistent with the low affinity of Na+. Austad and co-workers also 501 reported adsorption tests that show a strong pH dependence of both acidic and basic organic 502 adsorption on clay minerals (Austad et al. 2010; RezaiDoust et al., 2011; Aksulu et al., 2012), 503 consistent with the requirements of their model (e.g. Fig. 3a,b). The composition of the 504 injection brine is predicted to be relatively unimportant so long as it is dilute enough to yield 505 significant desorption of surface-active cations. However, the removal of Ca2+ from the 506 injection brine is argued to be particularly favourable, because pH increase is then more 507 significant, consistent with a number of studies that show the LSE with injection of dilute NaCl 508 brine, although not all of these observed the expected increase in pH (Loahardjo et al., 2007; 509 Alagic and Skauge, 2010; Boussour et al., 2009; Ligthelm et al., 2009; RezaeiDoust et al., 510 2011; Nasralla and Nasr-El-Din, 2014). Tang and Morrow (1999a) found that increasing the 511 Ca2+ concentration terminated the LSE, but there was no consistent decrease in pH (e.g. Figs. 512 6a,b). RezaeiDoust et al. (2011) reported modest increases in oil recovery when injecting 513 higher salinity NaCl brine into a core containing crude oil and CaCl2 brine, and argued that 514 this reflected the differing affinities of Na+ and Ca2+ cations toward clay mineral surfaces, 515 consistent with the model predictions. Ion exchange leading to pH increase has been observed 516 and modelled in other studies relating to formation damage, although these studies considered 517 only monovalent ions in single phase flow (e.g. Vaidya and Fogler, 1990; Souto and Bazin, 518 1993). 519

Contrary evidence: Several unbuffered experimental studies report little or no change in 520 effluent pH associated with the LSE (e.g. Fig. 3d); moreover, in the reservoir, such a global pH 521 change is unlikely to occur owing to the presence of pH buffers such as CO2. Nevertheless, 522 Austad and co-workers argue that local increases in pH adjacent to the clay mineral surfaces 523 are sufficient to cause desorption of organic materials. Several studies have observed effluent 524 pH increases in unbuffered experiments but no associated LSE (e.g. Cissokho et al., 2010; 525 RezaeiDoust et al. 2010; Wideroe et al., 2010). Austad et al. (2010) suggested that the decrease 526 in Ca2+ and Mg2+ observed in the laboratory experiments of Lager et al. (2008a) resulted from 527 deposition of Mg(OH)2 and Ca(OH)2 rather than MIE, but Ca(OH)2 deposition was predicted 528 to occur only at pH > 11; such high pH was not observed. Austad et al. (2010) also suggested 529 that the ∆pH model explains the field test data of Lager et al (2008b) (Fig. 8b), ascribing the 530 initial increase in Mg2+ at the producer well to desorption of Mg2+ on contact with low salinity 531 injected water. The subsequent decrease in Mg2+, which Lager et al (2008b) ascribed to MIE, 532 was suggested to reflect Mg(OH)2 precipitation at pH > 9. However, such high pH was not 533 observed at the production well. Alagic and Skauge (2010) found that Mg2+ was retained in 534 aged samples during successful LSE corefloods, which is inconsistent with desorption. Similar 535 to Lager et al (2008a), Austad et al. (2010) suggest that clay minerals with high CEC are 536 optimal, yet kaolinite is closely associated with the LSE and has relatively low CEC (Table 2). 537
Summary: Adsorption of organic polar compounds is pH dependent (along with many other 538 factors) so pH change is likely to lead to desorption. However, not all unbuffered experiments 539 that show the LSE display effluent brine pH increases, and pH increases in buffered reservoirs 540 will be limited. Local pH increase at mineral surfaces is difficult to prove. Desorption of 541 multivalent cations at low salinity has yet to be satisfactorily reconciled with the depletion 542 observed in aquifers and coreflooding experiments; there is no evidence of brine compositional 543 changes consistent with multivalent cation desorption. No model capable of quantitatively 544 predicting the dilution required to ensure desorption and associated LSE has been published. 545 The ∆pH model does not explain those coreflooding experiments where pH change was 546 recorded and the other LSE requirements were met, but no LSE was observed. 547
548
Double layer expansion (DLE) 549
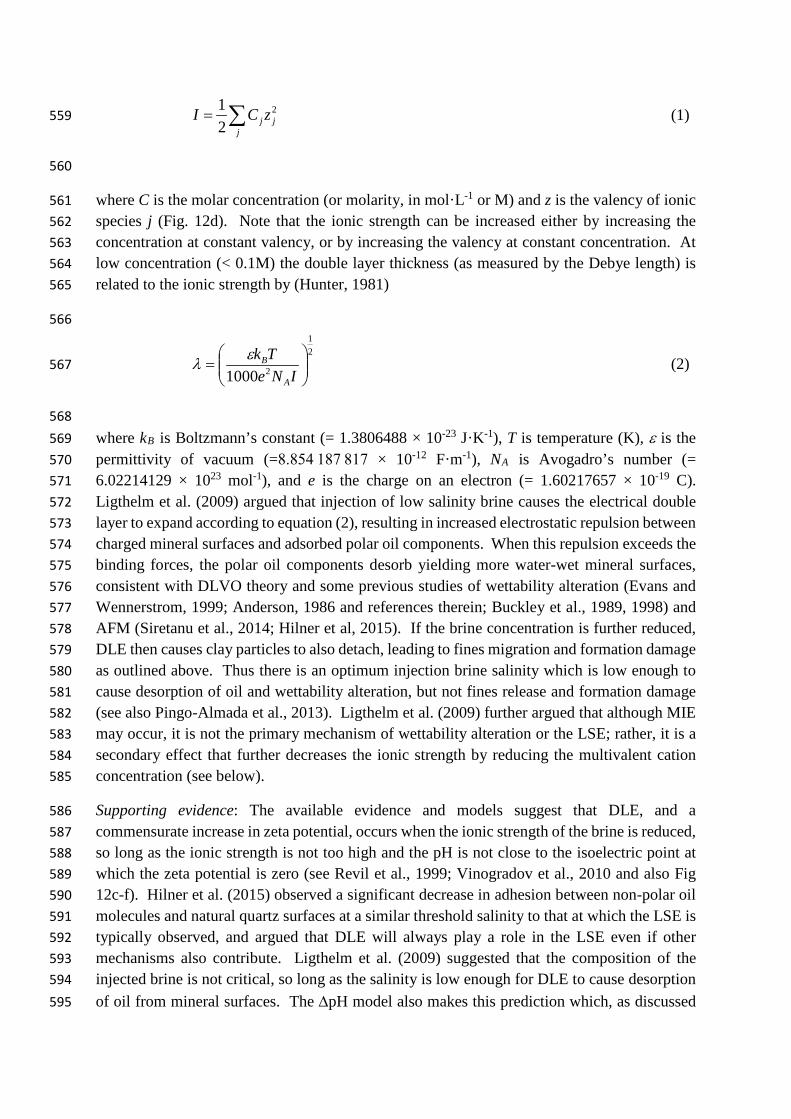
Mechanism: Ligthelm et al. (2009) suggested that expansion of the electrical double layer at 550 mineral-brine interfaces, as a result of low salinity brine injection, is the primary mechanism 551 leading to the LSE. It is well known that at low to moderate salinity, the thickness of the diffuse 552 part of the electrical double layer at mineral-brine interfaces increases with decreasing ionic 553 strength. Likewise, the zeta potential, which is a measure of the electrical potential at the so-554 called shear plane where the electrical charges are mobile (see Fig. 11), also increases with 555 decreasing ionic strength (e.g. Fig. 12a,b; see also Vinogradov et al., 2010). The ionic strength 556 of an electrolyte is related to concentration and valency by (Hunter, 1981) 557
558
∑=j
jj zCI 2
21 (1) 559
560
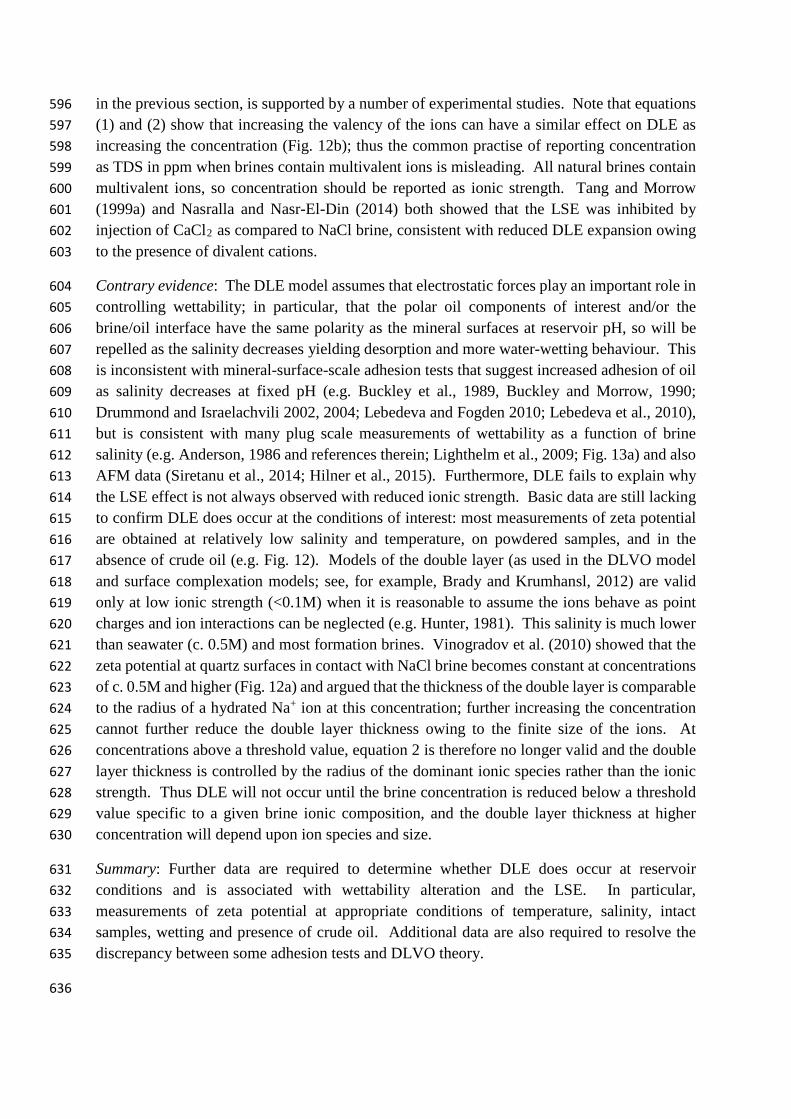
where C is the molar concentration (or molarity, in mol·L-1 or M) and z is the valency of ionic 561 species j (Fig. 12d). Note that the ionic strength can be increased either by increasing the 562 concentration at constant valency, or by increasing the valency at constant concentration. At 563 low concentration (< 0.1M) the double layer thickness (as measured by the Debye length) is 564 related to the ionic strength by (Hunter, 1981) 565
566
21
21000
=
INeTk
A
Bελ (2) 567
568 where kB is Boltzmann’s constant (= 1.3806488 × 10⁻²³ J·K-1), T is temperature (K), ε is the 569 permittivity of vacuum (=8.854 187 817 × 10-12 F·m-1), NA is Avogadro’s number (= 570 6.02214129 × 10²³ mol-1), and e is the charge on an electron (= 1.60217657 × 10⁻¹⁹ C). 571 Ligthelm et al. (2009) argued that injection of low salinity brine causes the electrical double 572 layer to expand according to equation (2), resulting in increased electrostatic repulsion between 573 charged mineral surfaces and adsorbed polar oil components. When this repulsion exceeds the 574 binding forces, the polar oil components desorb yielding more water-wet mineral surfaces, 575 consistent with DLVO theory and some previous studies of wettability alteration (Evans and 576 Wennerstrom, 1999; Anderson, 1986 and references therein; Buckley et al., 1989, 1998) and 577 AFM (Siretanu et al., 2014; Hilner et al, 2015). If the brine concentration is further reduced, 578 DLE then causes clay particles to also detach, leading to fines migration and formation damage 579 as outlined above. Thus there is an optimum injection brine salinity which is low enough to 580 cause desorption of oil and wettability alteration, but not fines release and formation damage 581 (see also Pingo-Almada et al., 2013). Ligthelm et al. (2009) further argued that although MIE 582 may occur, it is not the primary mechanism of wettability alteration or the LSE; rather, it is a 583 secondary effect that further decreases the ionic strength by reducing the multivalent cation 584 concentration (see below). 585
Supporting evidence: The available evidence and models suggest that DLE, and a 586 commensurate increase in zeta potential, occurs when the ionic strength of the brine is reduced, 587 so long as the ionic strength is not too high and the pH is not close to the isoelectric point at 588 which the zeta potential is zero (see Revil et al., 1999; Vinogradov et al., 2010 and also Fig 589 12c-f). Hilner et al. (2015) observed a significant decrease in adhesion between non-polar oil 590 molecules and natural quartz surfaces at a similar threshold salinity to that at which the LSE is 591 typically observed, and argued that DLE will always play a role in the LSE even if other 592 mechanisms also contribute. Ligthelm et al. (2009) suggested that the composition of the 593 injected brine is not critical, so long as the salinity is low enough for DLE to cause desorption 594 of oil from mineral surfaces. The ∆pH model also makes this prediction which, as discussed 595
in the previous section, is supported by a number of experimental studies. Note that equations 596 (1) and (2) show that increasing the valency of the ions can have a similar effect on DLE as 597 increasing the concentration (Fig. 12b); thus the common practise of reporting concentration 598 as TDS in ppm when brines contain multivalent ions is misleading. All natural brines contain 599 multivalent ions, so concentration should be reported as ionic strength. Tang and Morrow 600 (1999a) and Nasralla and Nasr-El-Din (2014) both showed that the LSE was inhibited by 601 injection of CaCl2 as compared to NaCl brine, consistent with reduced DLE expansion owing 602 to the presence of divalent cations. 603
Contrary evidence: The DLE model assumes that electrostatic forces play an important role in 604 controlling wettability; in particular, that the polar oil components of interest and/or the 605 brine/oil interface have the same polarity as the mineral surfaces at reservoir pH, so will be 606 repelled as the salinity decreases yielding desorption and more water-wetting behaviour. This 607 is inconsistent with mineral-surface-scale adhesion tests that suggest increased adhesion of oil 608 as salinity decreases at fixed pH (e.g. Buckley et al., 1989, Buckley and Morrow, 1990; 609 Drummond and Israelachvili 2002, 2004; Lebedeva and Fogden 2010; Lebedeva et al., 2010), 610 but is consistent with many plug scale measurements of wettability as a function of brine 611 salinity (e.g. Anderson, 1986 and references therein; Lighthelm et al., 2009; Fig. 13a) and also 612 AFM data (Siretanu et al., 2014; Hilner et al., 2015). Furthermore, DLE fails to explain why 613 the LSE effect is not always observed with reduced ionic strength. Basic data are still lacking 614 to confirm DLE does occur at the conditions of interest: most measurements of zeta potential 615 are obtained at relatively low salinity and temperature, on powdered samples, and in the 616 absence of crude oil (e.g. Fig. 12). Models of the double layer (as used in the DLVO model 617 and surface complexation models; see, for example, Brady and Krumhansl, 2012) are valid 618 only at low ionic strength (<0.1M) when it is reasonable to assume the ions behave as point 619 charges and ion interactions can be neglected (e.g. Hunter, 1981). This salinity is much lower 620 than seawater (c. 0.5M) and most formation brines. Vinogradov et al. (2010) showed that the 621 zeta potential at quartz surfaces in contact with NaCl brine becomes constant at concentrations 622 of c. 0.5M and higher (Fig. 12a) and argued that the thickness of the double layer is comparable 623 to the radius of a hydrated Na+ ion at this concentration; further increasing the concentration 624 cannot further reduce the double layer thickness owing to the finite size of the ions. At 625 concentrations above a threshold value, equation 2 is therefore no longer valid and the double 626 layer thickness is controlled by the radius of the dominant ionic species rather than the ionic 627 strength. Thus DLE will not occur until the brine concentration is reduced below a threshold 628 value specific to a given brine ionic composition, and the double layer thickness at higher 629 concentration will depend upon ion species and size. 630
Summary: Further data are required to determine whether DLE does occur at reservoir 631 conditions and is associated with wettability alteration and the LSE. In particular, 632 measurements of zeta potential at appropriate conditions of temperature, salinity, intact 633 samples, wetting and presence of crude oil. Additional data are also required to resolve the 634 discrepancy between some adhesion tests and DLVO theory. 635
636
Discussion 637
The key mechanisms underlying the LSE have yet to be determined, but the available evidence 638 suggests that the LSE is the macroscopic (core- to reservoir-scale) manifestation of 639 microscopic (mineral-surface to pore-scale) changes following injection of low salinity brine 640 (or brine of controlled composition). These microscopic changes may include wettability 641 alteration (manifested by a change in contact angle, contact angle hysteresis, or wetting surface 642 area), a reduction in IFT, and/or an increase in the solubility of polar oil compounds in the 643 brine. Such changes affect the efficiency with which brine displaces oil, by releasing oil 644 previously adsorbed to mineral surfaces, allowing water to invade oil-filled pores that would 645 be otherwise bypassed, or reducing oil trapped by snap-off. A common factor across three of 646 the key mineral-surface scale mechanisms that have been invoked to explain the LSE is a 647 change in the magnitude of electrostatic interactions between charged mineral surfaces and 648 polar organic compounds: the zeta potential will change in response to (i) multi-ion exchange 649 (MIE), because adsorption or desorption of ions changes the surface charge, (ii) local pH 650 increase (∆pH), because this also changes the surface charge (see Fig. 12), and (iii) a decrease 651 in ionic strength because this causes double layer expansion (DLE) (see Fig. 12). However, 652 the relationship between MIE, ∆pH, ionic strength and the zeta potential is still poorly 653 understood owing to a lack of data acquired at the relevant conditions, despite the efforts of 654 groups such as those at Texas A & M (e.g. Alotaibi et al. 2010; 2011; Nasralla and Nasr-El-655 Din, 2014) and Shell (e.g. Suijkerbuik et al. 2014). Thus the contribution of electrostatic forces 656 remains poorly understood. For example, modest increases in oil recovery have been observed 657 when injecting higher salinity NaCl brine into a core containing crude oil and CaCl2 brine of 658 the same ionic strength (RezaeiDoust et al., 2011); this may reflect (i) a change in surface 659 charge owing to the differing affinities of Na+ and Ca2+ cations toward clay minerals (e.g. 660 Mugele et al., 2015), (ii) local pH change and/or (iii) a change in the double layer thickness. 661 However, as surface charge was not measured, the mechanism cannot be determined. 662
At present, the ∆pH and MIE mechanisms are difficult to reconcile, as the former requires 663 desorption of multivalent cations at low concentration and exchange with protons to increase 664 pH, whereas the latter requires the opposite: adsorption of multivalent cations at low 665 concentration and exchange with polar oil compounds, accompanied by little or no change in 666 pH. In both cases, pH change recorded in effluent brine may be dominated by the presence of 667 buffers such as CO2, or by dissolution of small amounts of carbonate material, so may not be 668 diagnostic of mechanisms occurring at the mineral-surface scale. McGuire et al. (2005) 669 calculated that dissolution of just 7.2g of calcite (<0.1wt% of core sample material) over 15 670 pore-volumes (PV) of waterflooding of a North Sea core increased effluent pH by 2 pH units; 671 even trace amounts of carbonate material or other soluble minerals in natural samples can 672 influence pH. There is still a need for carefully designed coreflooding experiments to allow 673 individual mechanisms to be isolated and identified; this will likely require the use of synthetic 674 core materials in the first instance, so mineralogy can be precisely controlled, allowing 675 processes such as carbonate mineral dissolution to be eliminated or quantified. Moreover, 676 studies are required that report a broad range of data types and measurements, to facilitate 677
cross-comparison of results and allow the underlying mechanisms to be identified or eliminated 678 (e.g. Table 3). 679
Of the other proposed mechanisms, the available evidence suggests that fines migration or 680 saponification may be responsible for the LSE only in some specific cases with (in the former 681 mechanism) swelling clays, very low salinity brine, high brine pH and (in the latter mechanism) 682 high AN crude. However, it is worth noting that several studies have reported a link between 683 IFT and salinity, with IFT generally decreasing with decreasing salinity (e.g. Badakshan and 684 Bakes, 1990; Ikeda et al., 1992; Cai et al., 1996); some studies have also found that the IFT 685 drops to a minimum at a critical salinity (Fig. 13b). For example, Moeini et al. (2014) observed 686 a minimum of c. 13mN/m at a salinity of c. 30,000 ppm NaCl or CaCl2 brine, although this is 687 higher than the injection brine salinity typically associated with the LSE. A salinity-dependent 688 decrease in IFT reduces the capillary entry pressure, consistent with the pore-scale LSE 689 proposed by Sorbie et al. (2010). Moreover, it is well known that the solubility of polar organic 690 compounds in brine increases with decreasing salinity; adjusting the solubility by varying the 691 salt concentration is a process termed ‘salting in/out’ (RezaeiDoust et al., 2009). This 692 mechanism has been suggested to contribute to the LSE, although it has been largely ignored 693 and remains comparatively under investigated (RezaeiDoust et al., 2009, 2011). 694
Many of the proposed mechanisms underlying the LSE occur at mineral surfaces; 695 consequently, rather than the bulk rock properties, it is the surface properties that are of interest 696 and how these are affected by the presence of crude oil, formation brine, and low salinity brine 697 (Suijkerbuijk et al., 2013; Mathieson et al., 2014; Mugele et al., 2015; Hilner et al., 2015). For 698 example, extremely small volumes of clay or organic matter may be present in a sample but if 699 this material coats the mineral surfaces then it will dominate the surface interactions. 700 Characterisation of surface properties can include imaging of clay mineral distribution, 701 measurements of zeta potential, contact angle, adhesion and adsorption, AFM, SEM, and 702 NMR. However, where required, it is essential that these measurements are conducted at 703 reservoir conditions of salinity, temperature and pressure, and in the presence of crude oil; 704 otherwise the resulting data cannot directly be applied to interpret the LSE. Ensuring consistent 705 experimental conditions may help to reconcile the differences observed in wetting behaviour 706 as a function of salinity at different scales. 707
For example, several mineral-surface-scale studies have observed a decrease in adhesion of 708 crude oil to mineral surfaces with increasing salinity (e.g. Buckley et al., 1989, Buckley and 709 Morrow, 1990; Drummond and Israelachvili, 2002, 2004; Lebedeva and Fogden, 2010; 710 Lebedeva et al., 2010), yet plug-scale measurements of wettability suggest the opposite (e.g. 711 Anderson, 1986 and references therein; Lighthelm et al., 2009; compare Figs. 2e,f and Fig. 712 13a). The difference may relate to the experimental conditions such as temperature (e.g. 713 Buckley and Morrow 1990) and the presence of multivalent cations (for example, Brown and 714 Neustadter 1980). Similarly, adsorption tests on polar compounds and clay minerals have 715 demonstrated strong pH dependence at room temperature, but it is not clear whether the results 716 apply at elevated temperature and pressure (e.g. Fig. 3a,b). Measurements of zeta potential are 717 typically obtained at relatively low ionic strength and temperature; few data are available at 718 seawater salinity and above (e.g. Fig. 12). Furthermore, surface properties that may control 719

the LSE, such as electrical charge, reaction sites and CEC, may be affected by the history of 720 the rock samples, including any previous experiments, cleaning, and storage, yet surface 721 properties are rarely measured prior to coreflooding experiments. Initial surface conditions 722 may vary, even though bulk properties are similar. This may explain why repeat corefloods on 723 the same sample can yield different results, and why outcrop and reservoir cores often behave 724 differently (e.g. Loardarjho et al., 2010; Winoto et al., 2012). Finally, reaction kinetics likely 725 play a role in dictating the mechanisms underlying the LSE, including the rate of adsorption 726 and desorption of ions and polar organic compounds (e.g. Mahani et al., 2013; Suijkerbuijk et 727 al., 2013). If the timescales of ion exchange and/or wettability alteration are longer than the 728 duration of an experiment, then no LSE will be observed. 729
Identification of the underlying mechanism(s) is essential to allow prediction of the optimum 730 conditions to observe the LSE. At present, no model can predict these conditions a-priori, or 731 even whether the LSE will be observed; there are still no criteria that can be used with 732 confidence to screen candidate reservoirs for low salinity water injection prior to conducting 733 laboratory tests. The necessary conditions outlined earlier in this paper relate partly to the 734 initial conditions, and partly to the secondary or tertiary low salinity flooding conditions; a 735 useful step to elucidate the underlying mechanism(s) may be to separate these initial and 736 flooding conditions. The evidence reviewed here suggests that the initial conditions may 737 include a change from water- to mixed-wettability for the LSE to be observed, which requires 738 specific formation brine and crude oil composition, brine pH, mineralogy (including the 739 presence of clay minerals) and aging temperature and duration. All of these should be 740 replicated in laboratory experiments, but in many studies they are not (for example, the initial 741 pH is too high, failing to account for pH buffers at reservoir conditions); in others, the initial 742 conditions are not reported or measured. In these cases, a failure to observe the LSE cannot be 743 properly diagnosed, because it cannot be determined whether the flooding conditions were at 744 fault, or the initial conditions failed to create the necessary wetting state. 745
A key requirement of any mechanism is that it can explain (and predict) those cases where the 746 LSE is not observed, as well as those cases where it is observed. Most studies concentrate on 747 the latter. The laboratory and field experiments reported by Skrettingland et al. (2011) provide 748 a key test in this respect: (i) the COBR system apparently met all of the necessary conditions 749 (Amott Index of aged samples indicated initially mixed- to weakly water-wet conditions, crude 750 contained polar components, sandstone contained clay minerals including kaolinite and 751 chlorite, formation brine contained multivalent cations including Ca2+ and Mg2+), (ii) the 752 salinity of the injection brine was significantly reduced, (iii) experiments were conducted at 753 reservoir conditions, (iv) there was an increase in effluent brine pH in some coreflooding 754 experiments to pH > 12 when alkaline low salinity brine was injected, and (v) an associated 755 increase in pressure drop associated with formation damage. Yet no LSE was observed. None 756 of the proposed mechanisms can explain this. Aksulu et al. (2012) suggested the initial 757 reservoir pH was too high (at c. 7) for significant adsorption of organic components to have 758 occurred (cf. Fig. 3a,b), which suggests the failure lay with the initial rather than the flooding 759 conditions, but this is inconsistent with the measured initial wettability, and also the numerous 760 studies in which the LSE has been observed at comparable initial pH. Another key test is to 761
explain the contradictory evidence concerning the temperature dependence of the LSE 762 discussed previously. As yet, little or no data are available to determine or predict the 763 temperature dependence of the proposed MIE, ∆pH or DLE mechanisms. Finally, an important 764 issue is that of capillary effects in coreflooding experiments: during low salinity water 765 injection, changes in wettability, permeability (owing to formation damage) or IFT change the 766 relative importance of capillary forces in fixed-rate corefloods, so recovery may be affected by 767 changes in capillary end effects (e.g. Skauge, 2013; Masalmeh et al., 2014). While some 768 studies have recognized this, many have not. 769
770
Conclusions 771
The LSE is real, but the necessary conditions for improved oil recovery have not yet been 772 identified and may require a controlled change in brine composition rather than a simple 773 salinity reduction. The currently available criteria reviewed here are insufficient to even screen 774 potential candidate reservoirs, let alone identify the optimal injection brine composition for a 775 given reservoir. Furthermore, the available evidence supporting many of the conditions 776 currently believed to be necessary is not compelling. 777
The outstanding research question now is to identify the pore- and mineral-scale mechanism(s) 778 which facilitate improved oil recovery at the core- to reservoir-scale by controlling the injection 779 brine composition. The most likely mechanisms identified to date occur at COBR interfaces 780 and are multi-ion exchange (MIE), local increase in pH (∆pH) and double layer expansion 781 (DLE). Other mechanisms, such as clay swelling and fines migration, formation of natural 782 surfactants at elevated pH, reduction in oil/brine interfacial tension, and increased solubility of 783 polar oil compounds in brine, may occur in some cases but do not appear to be necessary to 784 observe improved oil recovery. 785
However, the available evidence is not sufficient to unambiguously identify which, if any, of 786 these mechanisms are essential. Moreover, understanding is hampered by a lack of common 787 experimental conditions across length-scales; core-scale measurements are often obtained at 788 reservoir pressure, temperature, brine salinity, crude oil composition and other conditions, but 789 pore- and mineral-surface-scale measurements such as AFM, SEM, contact angle and wetting 790 surface, adsorption and adhesion, are often obtained at laboratory temperature and pressure, 791 for lower brine salinity and simplified crude composition. Contrasting experimental conditions 792 may explain the contradictory data obtained to date. 793
A common feature of all three proposed mechanisms is that they will lead to changes in zeta 794 potential at mineral surfaces, either through changes in mineral surface charge (MIE, ∆pH) or 795 changes in the thickness of the double layer (DLE). Thus they will change the magnitude of 796 electrostatic forces acting between mineral surfaces and polar organic species. Measurements 797 of zeta potential at the appropriate conditions are urgently required to determine the 798 commonality and significance of changes in surface charge during controlled salinity 799 waterflooding and whether these are associated with improved recovery. 800
Acknowledgements 801
TOTAL are thanked for partial supporting Jackson through the TOTAL Chairs programme at 802 Imperial College London, for supporting Vinogradov through the TOTAL Laboratory for 803 Reservoir Physics at Imperial College London, and for granting permission to publish this 804 work. 805
References 806
1. Abass, E., Abdalla, A. A., & Alawad, F. A. 2013. Experimental Investigation of Low 807 Salinity Hot Water Injection to Enhance the Recovery of Heavy Oil Reservoirs. Society 808 of Petroleum Engineers. doi:10.2118/164768-MS. 809
2. Agbalaka C. C., Dandekar A. Y., Patil S. L., Khataniar S. and Hemsath J. H. 2008. 810 Coreflooding studies to evaluate the impact of salinity and wettability on oil recovery 811 efficiency. Transp. Porous Media 76 77–94. doi: 10.1007/s11242-008-9235-7. 812
3. Aksulu, H., Hamsø, D., Strand, S., Puntervold, T., and T.Austad. 2012. Evaluation of 813 Low-Salinity Enhanced Oil Recovery Effects in Sandstone: Effects of the Temperature 814 and pH Gradient. Energy Fuels, 2012, 26 (6), pp 3497–3503. doi:10.1021/ef300162n. 815
4. Al-Adasani, A., Bai, B., and Wu, Y.-S. 2012. Investigating Low-Salinity Waterflooding 816 Recovery Mechanisms in Sandstone Reservoirs. Society of Petroleum Engineers. 817 doi:10.2118/152997-MS. 818
5. Alagic, E. and Skauge, A. 2010. Combined Low Salinity Brine Injection and Surfactant 819 Flooding in Mixed-Wet Sandstone Cores. Energy & Fuels 24 (6): 3551–3559. 820 doi:10.1021/ef1000908. 821
6. Alotaibi, M. B., Azmy, R., & Nasr-El-Din, H. A. 2010. A Comprehensive EOR Study 822 Using Low Salinity Water in Sandstone Reservoirs. Society of Petroleum Engineers. 823 doi:10.2118/129976-MS. 824
7. Alotaibi, M. B., Nasralla, R. A., & Nasr-El-Din, H. A. 2011. Wettability Studies Using 825 Low-Salinity Water in Sandstone Reservoirs. Society of Petroleum Engineers. 826 doi:10.2118/149942-PA. 827
8. Amashukeli, X., Grunthaner, F.J., Patrick, S.B. and Yung, P.T. 2008. Subcritical water 828 extractor for Mars analog soil analysis, Astrobiology, 8 597–604. 829
9. Anderson, W.G., 1986, Wettability Literature Survey- Part 1: Rock/Oil/Brine 830 Interactions and the Effects of Core Handling on Wettability, Journal of Petroleum 831 Technology, October, 1125-1144. 832
10. Appelo, C. A. J. 1994. Cation and proton exchange, pH variations, and carbonate 833 reactions in a freshening aquifer. Water Resources Research, 30(10), pp. 2793-2805. 834 doi: 10.1029/94WR01048. 835
11. Ashraf, A., Hadia, N.J., Torsæter, O., and Tweheyo, M.T. 2010. Laboratory investigation 836 of low salinity waterflooding as secondary recovery process: effect of wettability. Paper 837 SPE 129012 presented at the SPE Oil and Gas India Conference and Exhibition, Mumbai, 838 India, 20–22 January. doi: 10.2118/129012-MS. 839
12. Aubrey, A.D., Chalmers, J.H., Bada, J.L., Grunthaner, F.J., Amashukeli, X., Willis, P., 840 Skelley, A.M., Mathies, R.A., Quinn, R.C., Zent, A.P., Ehrenfreund, P., Amundson, R., 841 Glavin, D.P., Botta, O., Barron, L., Blaney, D.L., Clark, B.C., Coleman, M., Hofmann, 842
B.A., Josset, J-L., Rettberg, P., Ride, S., Robert, F., Sephton, M.A. and Yen, A. 2008. 843 Astrobiology, 8: 583-595. doi:10.1089/ast.2007.0169. 844
13. Austad, T., RezaeiDoust, A., & Puntervold, T. 2010. Chemical Mechanism of Low 845 Salinity Water Flooding in Sandstone Reservoirs. Society of Petroleum Engineers. 846 doi:10.2118/129767-MS. 847
14. Badakshan, A., and Bakes, P., 1990. The Influence of Temperature and Surfactant 848 Concentration on Interfacial Tension of Saline Water and Hydrocarbon Systems in 849 Relation to Enhanced Oil Recovery by Chemical Flooding, SPE Paper. 850
15. Barth, T. 1991. Organic acids and inorganic ions in waters from petroleum reservoirs, 851 Norwegian continental shelf: a multivariate statistical analysis and comparison with 852 American reservoir formation waters. Applied Geochemistry, Volume 6, Issue 1, Pages 853 1-15, ISSN 0883-2927. doi:10.1016/0883-2927(91)90059-X. 854
16. Batias, J., Hamon, G., Lalanne, B., and Romero, C. 2009. Field and Laboratory 855 Observations of Remaining Oil Saturations in a Light Oil Reservoir Flooded by a Low 856 Salinity Aquifer. Paper SCA2009-01 presented at the 23rd International Symposium of 857 the Society of Core Analysts, Noordwijk aan Zee, The Netherlands, 27–30 September. 858
17. Berg, S., Cense, A. W., Jansen, E., and Bakker, K. 2010. Direct Experimental Evidence 859 of Wettability Modification By Low Salinity. Society of Petrophysicists and Well-Log 860 Analysts. 861
18. Bernard, G. G. 1967. Effect of Floodwater Salinity on Recovery of Oil from Cores 862 Containing Clays. Society of Petroleum Engineers. doi:10.2118/1725-MS. 863
19. Boussour, S., Cissokho, M., Cordier, P., Bertin, H. J., and Hamon, G. 2009. Oil Recovery 864 by Low-Salinity Brine Injection: Laboratory Results on Outcrop and Reservoir Cores. 865 Society of Petroleum Engineers. doi:10.2118/124277-MS. 866
20. Brady, P.V. and Krumhansl, J.L., 2012, A surface complexation model of oil-brine-867 sandstone interfaces at 100°C: Low salinity waterflooding, Journal of Petroleum Science 868 and Engineering 81, 171-176. 869
21. Brown, C.E. and Neustadter, E.L., 1980, The Wettability of Oil/Water/Silica Systems 870 With Reference to Oil Recovery, J. Cdn. Pet. Tech., 19, 100-110. 871
22. Buckley, J. S., and Morrow, N. R. 1990. Characterization of Crude Oil Wetting Behavior 872 by Adhesion Tests. Society of Petroleum Engineers. doi:10.2118/20263-MS. 873
23. Buckley, J. S., Liu, Y., and Monsterleet, S. 1998. Mechanisms of Wetting Alteration by 874 Crude Oils. Society of Petroleum Engineers. doi:10.2118/37230-PA. 875
24. Buckley, J. S., Liu, Y., Xie, X., and Morrow, N. R. 1997. Asphaltenes and Crude Oil 876 Wetting - The Effect of Oil Composition. Society of Petroleum Engineers. 877 doi:10.2118/35366-PA. 878
25. Buckley, J. S., Takamura, K., and Morrow, N. R. 1989. Influence of Electrical Surface 879 Charges on the Wetting Properties of Crude Oils. Society of Petroleum Engineers. 880 doi:10.2118/16964-PA. 881
26. Burgos, W. D., Pisutpaisal, N., Mazzarese, M. C. and Chorover. J. 2002. Adsorption of 882 Quinoline to Kaolinite and Montmorillonite. Environmental Engineering Science. 19(2): 883 59-68. doi:10.1089/10928750252953697. 884
27. Carroll, D. 1959. Ion exchange in clays and other minerals. Geological Society of 885 America Bulletin 70 (6): 749‐780. doi:10.1130/0016-7606 886

28. Cai, B.-Y., Yang, J.-T., Guo, T.-M., 1996, J. Chem. Eng. Data 41, 493-496. 887 29. Cense, A.W., Berg, S., Jansen, E. and Bakker, K. 2011. Direct Visualization of Designer 888
Waterflooding in Model Experiments, SPE paper 144936 presented at the SPE Enhanced 889 Oil Recovery Conference. 890
30. Chassagne, C., Mietta, F. and Winterwerp, J.C. 2009. Electrokinetic study of kaolinite 891 suspensions. Journal of Colloid and Interface Science, Volume 336, Issue 1, Pages 352-892 359, ISSN 0021-9797, doi:10.1016/j.jcis.2009.02.052. 893
31. Chen, Q., Mercer, D., and Webb, K. 2010. NMR Study on Pore Occupancy and 894 Wettability Modification during Low Salinity Waterflooding. Paper SCA 2010-27 895 presented at the 24th International Symposium of Core Analysts, Halifax, Canada, 4–7 896 October. 897
32. Cissokho, M., Ahmadi, A., Bertin, H., Omari, A., and Hamon, G. 2012. Some 898 investigations on the role of microparticles on the low salinity process. Paper SCA2012-899 15 presented at the International Symposium of the Society of Core Analysts, Aberdeen, 900 Scotland, UK, 27-30 August, 2012. 901
33. Cissokho, M., Bertin, H., and Hamon, H. 2011. Low salinity waterflooding in sandstones 902 pore scale observations. Flows and mechanics in natural porous media from pore to field 903 scale. Pore2Field. 16-18 November 2011, IFP Energies nouvelles (France). 904
34. Cissokho, M., Bertin, H., Boussour, S., Cordier, P., and Hamon, G. 2010. Low Salinity 905 Oil Recovery On Clayey Sandstone: Experimental Study. Petrophysics, 51, 5, 305-313. 906
35. Drever, J.I., 1982, The Geochemistry of Natural Waters, Prentice-Hall, Englewood 907 Cliffs, 388pp. 908
36. Drummond, C. and Israelachvili, J. 2004. Fundamental studies of crude oil–surface water 909 interactions and its relationship to reservoir wettability. Journal of Petroleum Science and 910 Engineering, Volume 45, Issues 1–2, Pages 61-81, ISSN 0920-4105. 911 doi:10.1016/j.petrol.2004.04.007. 912
37. Duman, O. and Tunç, S. 2009. Electrokinetic and rheological properties of Na-bentonite 913 in some electrolyte solutions. Microporous and Mesoporous Materials, Volume 117, 914 Issues 1–2, Pages 331-338, ISSN 1387-1811, doi:10.1016/j.micromeso.2008.07.007. 915
38. Durán, J.D.G., Ramos-Tejada, M.M., Arroyo, F.J. and González-Caballero, F. 2000. 916 Rheological and Electrokinetic Properties of Sodium Montmorillonite Suspensions: I. 917 Rheological Properties and Interparticle Energy of Interaction. Journal of Colloid and 918 Interface Science, 229, 107-117, doi:10.1006/jcis.2000.6956. 919
39. Evans and Wennerstrom, 1999. The Colloidal Domain: Where Physics, Chemistry, 920 Biology and Technology Meet. 921
40. Fjelde, I., Asen, S. M., and Omekeh, A. V. 2012. Low Salinity Water Flooding 922 Experiments and Interpretation by Simulations. Society of Petroleum Engineers. 923 doi:10.2118/154142-MS. 924
41. Fogden, A. 2011. Effect of water salinity and pH on the wettability of a model substrate, 925 Energy and Fuels, 25, 5113-5125, doi: 10.1021/ef200920s. 926
42. Fogden, A., Kumar, M., Morrow, N., and Buckley, J. 2011, Mobilization of fine particles 927 during flooding of sandstones and possible relations to enhanced oil recovery. Energy 928 and Fuels, 25, 1605-1616. doi: 10.1021/ef101572n. 929
43. Gamage, P. and Thyne, G. 2011. Systematic Investigation of the Effect of Temperature 930 During Aging and Low Salinity Flooding of Berea Sandstone and Minn. 16th European 931 Symposium on Improved Oil Recovery, Cambridge, UK, 12-14 April, 2011. 932
44. Glover P. W.J. and Jackson M.D. 2010, Borehole electrokinetics. The Leading Edge, 29, 933 724-728. doi: 10.1190/1.3447786. 934
45. Gupta, R., Smith, G. G., Hu, L., Willingham, T., Lo Cascio, M., Shyeh, J. J., and Harris, 935 C. R. 2011. Enhanced Waterflood for Carbonate Reservoirs - Impact of Injection Water 936 Composition. Society of Petroleum Engineers. doi:10.2118/142668-MS. 937
46. Hassenkam, T., Mitchell, A.C., Pedersen, C.S., Skovbjerg, L.L., Bovet, N., and Stipp, 938 S.L.S. 2012. The low salinity effect observed on sandstone model surfaces. Colloids Surf. 939 A Physicochem. Eng. Aspects, 403, 79–86. doi: 10.1016/j.colsurfa.2012.03.058. 940
47. Hassenkam, T., Pedersen, C.S., Dalby, K., Austad, T., and Stipp, S.L.S. 2011. Pore-scale 941 observation of low salinity effects on outcrop and oil reservoir sandstone. Colloids Surf. 942 A Physicochem. Eng. Aspects, 490, 179–88. doi: 10.1016/j.colsurfa.2011.09.025. 943
48. Hilner, E., Andersson, M.P., Hassenkam, T., Matthiesen, J., Salino P.A. and Stipp, S.L.S. 944 2015. The effect of ionic strength on oil adhesion in sandstone – the search for the low 945 salinity mechanism. Scientific Reports 5, 9933. doi: 10.1038/srep09933 946
49. Hunter, R. J. 1981. Zeta Potential in Colloid Science, Academic Press, New York. 947 50. Jadhunandan, P. P., and Morrow, N. R. 1995. Effect of Wettability on Waterflood 948
Recovery for Crude-Oil/Brine/Rock Systems. Society of Petroleum Engineers. 949 doi:10.2118/22597-PA. 950
51. Ikeda, N., Aratono, M., Motomura, J., 1992, J. Colloid Interface Sci., 149, 208-215. 951 52. Kosmulski, M. and Dahlsten, P. 2006. High ionic strength electrokinetics of clay 952
minerals. Colloids and Surfaces A: Physicochemical and Engineering Aspects, 291, 212-953 218, doi:10.1016/j.colsurfa.2006.06.037. 954
53. Krueger, R. F. 1986. An Overview of Formation Damage and Well Productivity in 955 Oilfield Operations. Society of Petroleum Engineers. doi:10.2118/10029-PA. 956
54. Lebedeva, E.V. and Fogden, A., 2010. Adhesion of Oil to Kaolinite in Water, Environ. 957 Sci. Technol., 44, 9470-9475, doi: 10.1021/es102041b. 958
55. Lebedeva, E.V., Fogden, A., Senden, T.J and Knackstadt, M.A., 2010, Kaolinite 959 wettability – the effect of salinity, pH and calcium, Society of Core Analysts paper 960 SCA2010-11. 961
56. Lebedeva, E.V. and Fogden, A., 2011, Micro-CT and Wettability Analysis of Oil 962 Recovery from Sand Packs and the Effect of Waterflood Salinity and Kaolinite, Energy 963 and Fuels, 25, 5683-5694, doi: 10.1021/ef201242s. 964
57. Lager A., K.J. Webb and C.J.J. Black. 2007. Impact of Brine Chemistry on Oil Recovery. 965 Paper A24 presented at the 14th European Symposium on Improved Oil Recovery. 966
58. Lager, A., Webb, K. J., Black, C. J. J., Singleton, M. & Sorbie, K. S. 2008a. Low salinity 967 oil recovery - An experimental investigation. Petrophysics, 49, 1, 28-35. 968
59. Lager, A., Webb, K.J., Collins, I.R., and Richmond, D.M. 2008b. LoSal™ Enhanced Oil 969 Recovery: Evidence of Enhanced Oil Recovery at the Reservoir Scale. Paper SPE 113976 970 presented at the SPE/DOE Improved Oil Recovery Symposium, Tulsa, 19–23 April. doi: 971 10.2118/113976-MS. 972
60. Lever A., and R.A. Dowe. 1984. Water sensitivity and migration of fines in the Hopeman 973 sandstone. J. Pet. Geology, 7(1), 97-108. doi: 10.1111/j.1747-5457.1984.tb00165.x. 974
61. Li, Y., 2011. Oil Recovery by Low Salinity Water Injection into a Reservoir: A New 975 Study of Tertiary Oil Recovery Mechanism. Transport in Porous Media, Volume 90, 976 Issue 2, pp 333-362. doi: 10.1007/s11242-011-9788-8. 977
62. Liegthelm, D.J., Gronsveld, J., Hofman, J.P., Brussee, N., Marcelis, F., and van der 978 Linde, H.A. 2009. Novel Waterflooding Strategy by Manipulation of Injection Brine 979 Composition. Paper SPE 119835 presented at the EUROPEC/EAGE Annual Conference 980 and Exhibition, Amsterdam, 8–11 June. doi: 10.2118/119835-MS. 981
63. Liu, Y. and Buckley, J. S. 1997. Evolution of Wetting Alteration by Adsorption From 982 Crude Oil. Society of Petroleum Engineers. doi:10.2118/28970-PA. 983
64. Loahardjo, N., Xie, X., and Morrow, N.R. 2010. Oil Recovery by Sequential 984 Waterflooding of Mixed-Wet Sandstone and Limestone. Energy & Fuels 24 (9): 5073–985 5080. doi:10.1021/ef100729b. 986
65. Loahardjo, N., Xie, X., Yin, P., and Morrow, N.R. 2007. Low Salinity Waterflooding of 987 a Reservoir Rock. Paper SCA 2007-29 presented at the 2007 SCA International 988 Symposium, Calgary, 10–12 September. 989
66. Maas, J.G., Wit, K., and Morrow, N.R. 2001. Enhanced Oil Recovery by Dilution of 990 Injection Brine: Further Interpretation of Experimental Results. Paper SCA 2001-13 991 presented at the 2001 International Symposium of the Society of Core Analysts, 992 Edinburgh, UK, 17–19 September. 993
67. Madsen, L., and Lind, I. 1998. Adsorption of Carboxylic Acids on Reservoir Minerals 994 From Organic and Aqueous Phase. Society of Petroleum Engineers. doi:10.2118/37292-995 PA. 996
68. Mahani, H., Berg, S., Bartels, W.-B., Joekar-Niasar, V., and Ilic, D. 2013. Kinetics of the 997 Low Salinity Waterflooding Effect Studied in a Model System. Society of Petroleum 998 Engineers paper SPE165255MS. doi:10.2118/165255-MS. 999
69. Martin, J. C. 1959. The Effects of Clay on the Displacement of Heavy Oil by Water. 1000 Society of Petroleum Engineers. doi:10.2118/1411-G. 1001
70. Martinez, R. E., Sharma, P. and Kappler, A. 2010. Surface binding site analysis of Ca2+-1002 homoionized clay–humic acid complexes, Journal of Colloid and Interface Science, 1003 Volume 352, Issue 2, Pages 526-534, ISSN 0021-9797, doi:10.1016/j.jcis.2010.08.082. 1004
71. Masalmeh, S. K., Sorop, T.G., Suijkerbuijk, B.M.J.M, Vermolen, E.C.M., Douma, S., 1005 van del Linde, H.A. and Pieterse, S.G.J., 2014. Low Salinity Flooding: Experimental 1006 Evaluation and Numerical Interpretation. International Petroleum Technology 1007 Conference. doi: 10.2523/17558-MS. 1008
72. Matthiesen, J., Bovet, N., Hilner, E., Andersson, M.P., Schmidt, D.A., Webb, K.J., 1009 Dalby, K.N., Hassenkam, T., Crouch, J., Collins, I.R. and Stipp, S.L.S. 2014. Energy 1010 Fuels, 28, 4849−4858. doi: 10.1021/ef500218x. 1011
73. McGuire, P. L., Chatham, J. R., Paskvan, F. K., Sommer, D. M., and Carini, F. H. 2005. 1012 Low Salinity Oil Recovery: An Exciting New EOR Opportunity for Alaska’s North 1013 Slope. Society of Petroleum Engineers. doi:10.2118/93903-MS. 1014
74. Morrow, N., and Buckley, J. 2011. Improved Oil Recovery by Low-Salinity 1015 Waterflooding. Society of Petroleum Engineers. doi:10.2118/129421-JPT. 1016
75. Morrow, N.R., Tang, G., Valat, M., Xie, X., 1998. Prospects of improved oil recovery 1017 related to wettability and brine composition. Journal of Petroleum Science and 1018 Engineering, 20, 267–276. doi: 10.1016/S0920-4105(98)00030-8. 1019
76. Mugele, F., Bera, B., Cavalli, A., Siretanu, I., Maestro, A., Duits, M., Cohen-Stuart, M., 1020 van den Ende, D., Stocker I. and Collins, I., 2015, Ion adsorption-induced wetting 1021 transition in oil-water-mineral systems. Sci. Rep. 5, 10519; doi: 10.1038/srep10519. 1022
77. Nasralla, R. A., and Nasr-El-Din, H. A. 2014. Double-Layer Expansion: Is It a Primary 1023 Mechanism of Improved Oil Recovery by Low-Salinity Waterflooding? Society of 1024 Petroleum Engineers. doi:10.2118/154334-PA. 1025
78. Patil, S. B., Dandekar, A. Y., Patil, S., and Khataniar, S. 2008. Low Salinity Brine 1026 Injection for EOR on Alaska North Slope (ANS). International Petroleum Technology 1027 Conference. doi:10.2523/12004-MS. 1028
79. Pingo Almada, M. B., Pieterse, S. G. J., Marcelis, A. H. M., van Haasterecht, M. J. T., 1029 Brussee, N. J., and van der Linde, H. A. 2013. Experimental Investigation on the Effects 1030 of Very Low Salinity on Middle Eastern Sandstone Corefloods. Society of Petroleum 1031 Engineers. doi:10.2118/165180-MS. 1032
80. Pu, H., Xie, X., Yin, P., and Morrow, N.R. 2010. Low Salinity Waterflooding and 1033 Mineral Dissolution. Paper SPE 134042 presented at the SPE Annual Technical 1034 Conference and Exhibition, Florence, Italy, 19–22 September. doi: 10.2118/134042-MS. 1035
81. Pu, H.; Xie, X.; Yin, P.; Morrow, N. R., 2008. Application of coalbed methane water to 1036 oil recovery by low salinity waterflooding. Paper SPE 113410 presented at the 2008 SPE 1037 Improved Oil Recovery Symposium, Tulsa, OK, USA, April 19-23, 2008. 1038 doi:10.2118/113410-MS. 1039
82. Revil, A., P. A. Pezard, and P. W. J. Glover. 1999. Streaming potential in porous media: 1040 1. Theory of the zeta potential, J. Geophys. Res., 104(B9), 20021-20031. 1041 doi: 10.1029/1999JB900089. 1042
83. RezaeiDoust, A., Puntervold, T., Strand, S. & Austad, T., 2009, Smart Water as 1043 Wettability Modifier in Carbonate and Sandstone: A Discussion of 1044 Similarities/Differences in the Chemical Mechanisms, Energy Fuels 23, 4479–4485. 1045 doi:10.1021/ef900185q. 1046
84. RezaeiDoust, A., Puntervold, T., & Austad, T. 2010. A Discussion of the Low-Salinity 1047 EOR Potential for a North Sea Sandstone Field. Society of Petroleum Engineers. 1048 doi:10.2118/134459-MS. 1049
85. RezaeiDoust, A., T. Puntervold,and T. Austad. 2011. Chemical verification of the EOR 1050 mechanism by using low saline/smart water in sandstone. Energy & Fuels, 25, 2151-1051 2162, doi:10.1021/ef200215y. 1052
86. Rivet, S.M., Lake, L.W., and Pope, G.A. 2010. A Coreflood Investigation of Low-1053 Salinity Enhanced Oil Recovery. Paper SPE 134297 presented at the SPE Annual 1054 Technical Conference and Exhibition, Florence, Italy, 19–22 September. 1055 doi:10.2118/134297-MS. 1056
87. Robertson, E.P. 2007. Low-Salinity Waterflooding to Improve Oil Recovery—Historical 1057 Field Evidence. Paper SPE 109965 paper presented at the Annual Technical Conf. and 1058 Exhibition, Anaheim, California, USA, 11–14 November. doi: 10.2118/109965-MS. 1059
88. Robertson, E.P. 2010. Oil Recovery Increases by Low-Salinity Flooding: Minnelusa and 1060 Green River Formations. Paper SPE 132154 presented at the SPE Annual Technical 1061 Conference and Exhibition, Florence, Italy, 19–22 September. doi: 10.2118/132154-MS. 1062
89. Robertson, E.P., Thomas, C.P., Zhang, Y. and Morrow, N.R. 2003. Improved 1063 Waterflooding through Injection-Brine Modification. Technical Report, INEEL/EXT-1064 02-01591. 1065
90. Sandengen , K., Tweheyo, M.T., Raphaug, M., Kjølhamar, A., Crescente, C. and Kippe, 1066 V. 2011. Experimental evidence of low salinity water flooding yielding a more oil-wet 1067 behaviour. SCA2011-16. Presented at the International Symposium of the Society of 1068 Core Analysts held in Austin, Texas, USA 18-21 September, 2011. 1069
91. Schmatz, J., Urai, J.L., Berg, S. and Ott, H. 2015. Nanoscale imaging of pore-scale fluid-1070 fluid-solid contacts in sandstone, Geophys. Res. Lett., 42, 2189–2195, 1071 doi:10.1002/2015GL063354. 1072
92. Seccombe, J. C., Lager, A., Webb, K. J., Jerauld, G., and Fueg, E. 2008. Improving 1073 Wateflood Recovery: LoSalTM EOR Field Evaluation. Society of Petroleum Engineers. 1074 doi:10.2118/113480-MS. 1075
93. Seccombe, J., Lager, A., Jerauld, G., Jhaveri, B., Buikema, T., Bassler, S., Denis, J., 1076 Webb, K., Cockin, A., and Fueg, E. 2010. Demonstration of Low-Salinity EOR at 1077 Interwell Scale, Endicott Field, Alaska. Society of Petroleum Engineers. 1078 doi:10.2118/129692-MS. 1079
94. Shaker Shiran, B. and Skauge, A. 2012. Wettability and Oil Recovery by Low Salinity 1080 Injection. Society of Petroleum Engineers. doi:10.2118/155651-MS. 1081
95. Sharma, M.M. and Filoco, P.R. 2000. Effect of Brine Salinity and Crude-Oil Properties 1082 on Oil Recovery and Residual Saturations. SPE J. 5, 293–300. doi: 10.2118/65402-PA. 1083
96. Siretanu, I., Ebeling, D., Andersson, M.P., Stipp, S.L.S., Philipse, A., Stuart, M.C., van 1084 den Ende, D. and Mugele, F. 2014. Direct observation of ionic structure at solid-liquid 1085 interfaces: a deep look into the Stern Layer. Sci. Rep. 4, 4956. doi::10.1038/srep04956. 1086
97. Sorop, T.G., Masalmeh, S.K., Suijkerbuijk, B.M.J.M., van der Linde, H.A., Mahani, H., 1087 Brussee, N.J., Marcelis, F.A.H.M. and Coom, A. 2015. Relative Permeability 1088 Measurments to Quantify the Low Salinity Waterflooding Effect at Field Scale, SPE 1089 paper 177856, presented at the Abu Dhabi International Petroleum Exhibition and 1090 Conference. 1091
98. Skauge A. 2013. Low Salinity Flooding - A Critical Review. IOR 2013 - From 1092 Fundamental Science to Deployment. 1093
99. Skrettingland, K., Holt, T., Tweheyo, M. T., & Skjevrak, I. 2011. Snorre Low-Salinity-1094 Water Injection--Coreflooding Experiments and Single-Well Field Pilot. Society of 1095 Petroleum Engineers. doi:10.2118/129877-PA. 1096
100. Sondi, I., Bišćan, J. and Pravdić, V. 1996. Electrokinetics of Pure Clay Minerals 1097 Revisited. Journal of Colloid and Interface Science, Volume 178, Issue 2, Pages 514-1098 522, ISSN 0021-9797, doi:10.1006/jcis.1996.0146. 1099
101. Sorbie, K.S. and Collins, I.R. 2010. A Proposed Pore-Scale Mechanism for How Low 1100 Salinity Waterflooding Works. Paper SPE 129833 presented at the SPE Improved Oil 1101 Recovery Symposium, Tulsa, 24–28 April. doi: 10.2118/129833-MS. 1102
102. Souto, E. and Bazin, B., 1993, Ion Exchange Between Hydrogen and Homoionic Brines 1103 Related to Permeability Reduction, SPE paper SPE25203. 1104
103. Suijkerbuijk, B., Hofman, J., Ligthelm, D. J., Romanuka, J., Brussee, N., van der Linde, 1105 H., and Marcelis, F. 2012. Fundamental Investigations into Wettability and Low Salinity 1106 Flooding by Parameter Isolation. Society of Petroleum Engineers. doi:10.2118/154204-1107 MS. 1108
104. Suijkerbuijk, M.J.M., H.P.C.E. Kuipers, C.P.J.W. van Kruijsdijk, S. Berg, J.F. van 1109 Winden, D.J. Ligthelm, H. Mahani, M. Pingo Almada, E. Van den Pol, V. Joekar Niasar, 1110 J. Romanuka, E.C.M. Vermolen, I.S.M. Al-Qarshubi. 2013. The Development of a 1111 Workflow to Improve Predictive Capability of Low Salinity Response. 6th International 1112 Petroleum Technology Conference. doi:10.2523/17157-MS. 1113
105. Suman, Y., E. Shirif, H. Ibrahim and A. Ala-Ktiwi. 2014. Evaluation of Low Saline 1114 “Smart Water” Enhanced Oil Recovery in Light Oil Reservoirs. World Journal of 1115 Engineering and Technology, Vol. 2 No. 1, pp. 13-22. doi: 10.4236/wjet.2014.21002. 1116
106. Tang, G. and Morrow, N.R. 2002. In: Injection of dilute brine and crude oil/brine/rock 1117 interactions. American Geophysical Union, Washington D.C.. 129: 9. doi: 1118 10.1029/129GM16. 1119
107. Tang, G. Q. and Morrow, N. R. 1997. Salinity, temperature, oil composition, and oil 1120 recovery by waterflooding. SPE Reservoir Engineering, 12, 4, 269-276. 1121 doi:10.2118/36680-PA. 1122
108. Tang, G.-Q. and Morrow, N. R. 1999a. Influence of brine composition and fines 1123 migration on crude oil brine rock interactions and oil recovery. Journal of Petroleum 1124 Science & Engineering, vol.24, p. 99–111. doi: 10.1016/S0920-4105(99)00034-0. 1125
109. Tang, G.-Q. and Morrow, N.R. 1999b. Oil Recovery by Waterflooding and Imbibition – 1126 Invading Brine Cation Valency and Salinity. Paper SCA-9911 presented at the 1999 1127 International Symposium of the Society of Core Analysts, Golden, Colorado, USA, 1–4 1128 August. 1129
110. Vaidya, R.N. and Fogler, H.S., 1990, Fines Migration and Formation Damage: Influence 1130 of pH and Ion Exchange, SPE paper SPE19413. 1131
111. Valocchi A.J., Street, R. L., and Roberts, P. V. 1981. Transport of ion exchanging solutes 1132 in groundwater: Chromatographic theory and field simulation. Water Resources 1133 Research, 17(5), pp. 1517-1527. doi: 10.1029/WR017i005p01517. 1134
112. van Olphen, H. and Fripiat, J.J., 1979, Data Handbook for Clay Minerals and other Non-1135 Metallic Minerals, Pergamon Press, New York, 346pp. 1136
113. Vledder, P., Gonzalez, I. E., Carrera Fonseca, J. C., Wells, T., and Ligthelm, D. J. 2010. 1137 Low Salinity Water Flooding: Proof Of Wettability Alteration On A Field Wide Scale. 1138 Society of Petroleum Engineers. doi:10.2118/129564-MS. 1139
114. Wainipee, W., Cuadros, J., Sephton, M. A., Unsworth, C., Gill, M. G., Strekopytov, S. 1140 and Weiss, D. J. 2013. The effects of oil on As(V) adsorption on illite, kaolinite, 1141 montmorillonite and chlorite. Geochimica et Cosmochimica Acta, Volume 121, Pages 1142 487-502, ISSN 0016-7037, doi:10.1016/j.gca.2013.07.018. 1143
115. Webb, K. J., Black, C. J. J., and Al-Ajeel, H. 2004. Low Salinity Oil Recovery - Log-1144 Inject-Log. Society of Petroleum Engineers. doi:10.2118/89379-MS. 1145
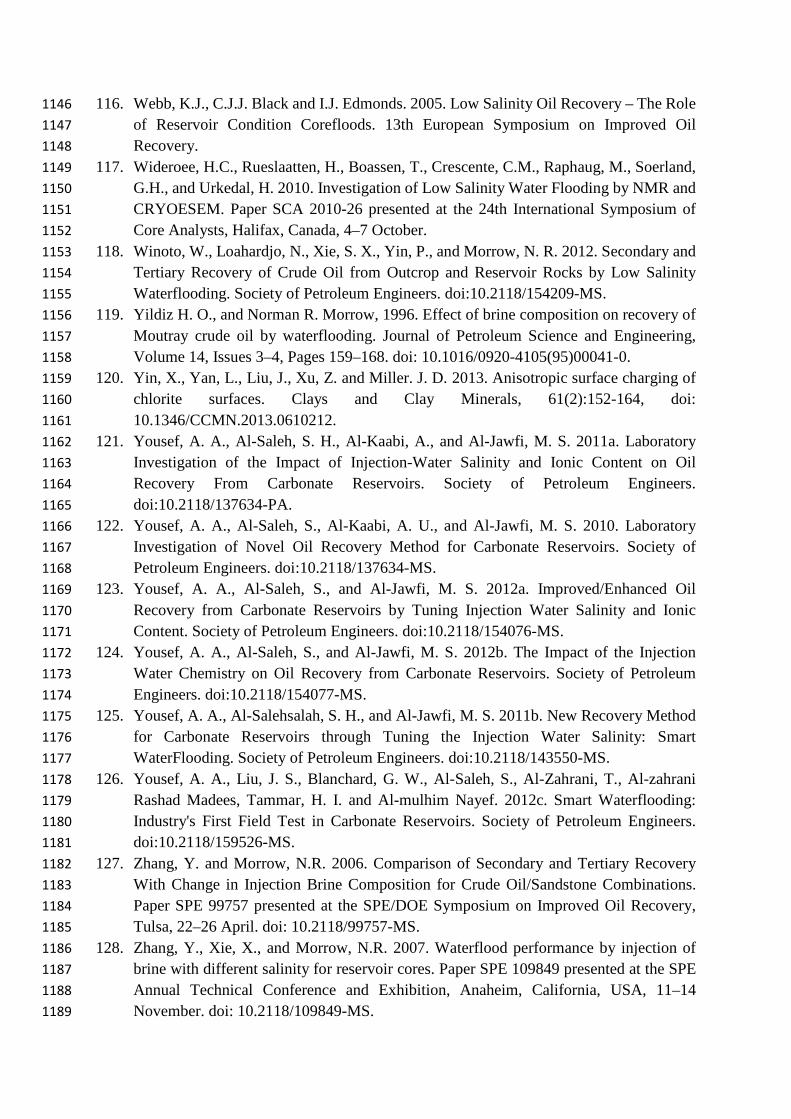
116. Webb, K.J., C.J.J. Black and I.J. Edmonds. 2005. Low Salinity Oil Recovery – The Role 1146 of Reservoir Condition Corefloods. 13th European Symposium on Improved Oil 1147 Recovery. 1148
117. Wideroee, H.C., Rueslaatten, H., Boassen, T., Crescente, C.M., Raphaug, M., Soerland, 1149 G.H., and Urkedal, H. 2010. Investigation of Low Salinity Water Flooding by NMR and 1150 CRYOESEM. Paper SCA 2010-26 presented at the 24th International Symposium of 1151 Core Analysts, Halifax, Canada, 4–7 October. 1152
118. Winoto, W., Loahardjo, N., Xie, S. X., Yin, P., and Morrow, N. R. 2012. Secondary and 1153 Tertiary Recovery of Crude Oil from Outcrop and Reservoir Rocks by Low Salinity 1154 Waterflooding. Society of Petroleum Engineers. doi:10.2118/154209-MS. 1155
119. Yildiz H. O., and Norman R. Morrow, 1996. Effect of brine composition on recovery of 1156 Moutray crude oil by waterflooding. Journal of Petroleum Science and Engineering, 1157 Volume 14, Issues 3–4, Pages 159–168. doi: 10.1016/0920-4105(95)00041-0. 1158
120. Yin, X., Yan, L., Liu, J., Xu, Z. and Miller. J. D. 2013. Anisotropic surface charging of 1159 chlorite surfaces. Clays and Clay Minerals, 61(2):152-164, doi: 1160 10.1346/CCMN.2013.0610212. 1161
121. Yousef, A. A., Al-Saleh, S. H., Al-Kaabi, A., and Al-Jawfi, M. S. 2011a. Laboratory 1162 Investigation of the Impact of Injection-Water Salinity and Ionic Content on Oil 1163 Recovery From Carbonate Reservoirs. Society of Petroleum Engineers. 1164 doi:10.2118/137634-PA. 1165
122. Yousef, A. A., Al-Saleh, S., Al-Kaabi, A. U., and Al-Jawfi, M. S. 2010. Laboratory 1166 Investigation of Novel Oil Recovery Method for Carbonate Reservoirs. Society of 1167 Petroleum Engineers. doi:10.2118/137634-MS. 1168
123. Yousef, A. A., Al-Saleh, S., and Al-Jawfi, M. S. 2012a. Improved/Enhanced Oil 1169 Recovery from Carbonate Reservoirs by Tuning Injection Water Salinity and Ionic 1170 Content. Society of Petroleum Engineers. doi:10.2118/154076-MS. 1171
124. Yousef, A. A., Al-Saleh, S., and Al-Jawfi, M. S. 2012b. The Impact of the Injection 1172 Water Chemistry on Oil Recovery from Carbonate Reservoirs. Society of Petroleum 1173 Engineers. doi:10.2118/154077-MS. 1174
125. Yousef, A. A., Al-Salehsalah, S. H., and Al-Jawfi, M. S. 2011b. New Recovery Method 1175 for Carbonate Reservoirs through Tuning the Injection Water Salinity: Smart 1176 WaterFlooding. Society of Petroleum Engineers. doi:10.2118/143550-MS. 1177
126. Yousef, A. A., Liu, J. S., Blanchard, G. W., Al-Saleh, S., Al-Zahrani, T., Al-zahrani 1178 Rashad Madees, Tammar, H. I. and Al-mulhim Nayef. 2012c. Smart Waterflooding: 1179 Industry's First Field Test in Carbonate Reservoirs. Society of Petroleum Engineers. 1180 doi:10.2118/159526-MS. 1181
127. Zhang, Y. and Morrow, N.R. 2006. Comparison of Secondary and Tertiary Recovery 1182 With Change in Injection Brine Composition for Crude Oil/Sandstone Combinations. 1183 Paper SPE 99757 presented at the SPE/DOE Symposium on Improved Oil Recovery, 1184 Tulsa, 22–26 April. doi: 10.2118/99757-MS. 1185
128. Zhang, Y., Xie, X., and Morrow, N.R. 2007. Waterflood performance by injection of 1186 brine with different salinity for reservoir cores. Paper SPE 109849 presented at the SPE 1187 Annual Technical Conference and Exhibition, Anaheim, California, USA, 11–14 1188 November. doi: 10.2118/109849-MS. 1189
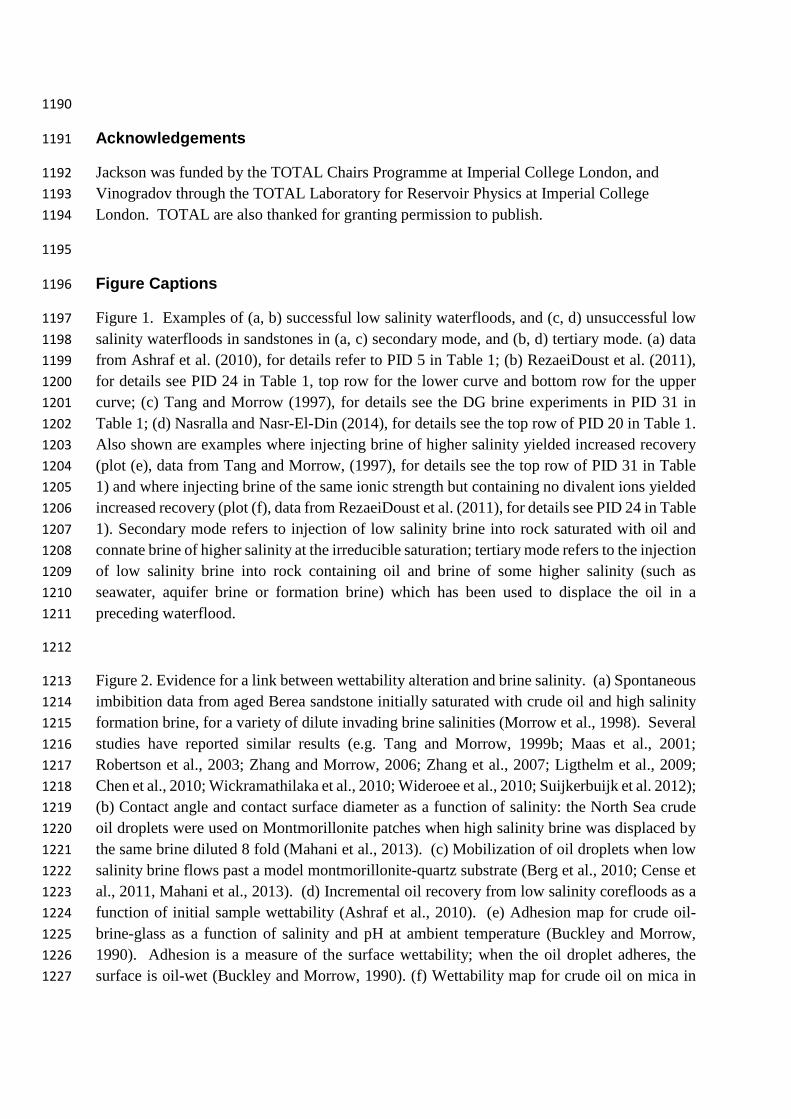
1190
Acknowledgements 1191
Jackson was funded by the TOTAL Chairs Programme at Imperial College London, and 1192 Vinogradov through the TOTAL Laboratory for Reservoir Physics at Imperial College 1193 London. TOTAL are also thanked for granting permission to publish. 1194
1195
Figure Captions 1196
Figure 1. Examples of (a, b) successful low salinity waterfloods, and (c, d) unsuccessful low 1197 salinity waterfloods in sandstones in (a, c) secondary mode, and (b, d) tertiary mode. (a) data 1198 from Ashraf et al. (2010), for details refer to PID 5 in Table 1; (b) RezaeiDoust et al. (2011), 1199 for details see PID 24 in Table 1, top row for the lower curve and bottom row for the upper 1200 curve; (c) Tang and Morrow (1997), for details see the DG brine experiments in PID 31 in 1201 Table 1; (d) Nasralla and Nasr-El-Din (2014), for details see the top row of PID 20 in Table 1. 1202 Also shown are examples where injecting brine of higher salinity yielded increased recovery 1203 (plot (e), data from Tang and Morrow, (1997), for details see the top row of PID 31 in Table 1204 1) and where injecting brine of the same ionic strength but containing no divalent ions yielded 1205 increased recovery (plot (f), data from RezaeiDoust et al. (2011), for details see PID 24 in Table 1206 1). Secondary mode refers to injection of low salinity brine into rock saturated with oil and 1207 connate brine of higher salinity at the irreducible saturation; tertiary mode refers to the injection 1208 of low salinity brine into rock containing oil and brine of some higher salinity (such as 1209 seawater, aquifer brine or formation brine) which has been used to displace the oil in a 1210 preceding waterflood. 1211
1212
Figure 2. Evidence for a link between wettability alteration and brine salinity. (a) Spontaneous 1213 imbibition data from aged Berea sandstone initially saturated with crude oil and high salinity 1214 formation brine, for a variety of dilute invading brine salinities (Morrow et al., 1998). Several 1215 studies have reported similar results (e.g. Tang and Morrow, 1999b; Maas et al., 2001; 1216 Robertson et al., 2003; Zhang and Morrow, 2006; Zhang et al., 2007; Ligthelm et al., 2009; 1217 Chen et al., 2010; Wickramathilaka et al., 2010; Wideroee et al., 2010; Suijkerbuijk et al. 2012); 1218 (b) Contact angle and contact surface diameter as a function of salinity: the North Sea crude 1219 oil droplets were used on Montmorillonite patches when high salinity brine was displaced by 1220 the same brine diluted 8 fold (Mahani et al., 2013). (c) Mobilization of oil droplets when low 1221 salinity brine flows past a model montmorillonite-quartz substrate (Berg et al., 2010; Cense et 1222 al., 2011, Mahani et al., 2013). (d) Incremental oil recovery from low salinity corefloods as a 1223 function of initial sample wettability (Ashraf et al., 2010). (e) Adhesion map for crude oil-1224 brine-glass as a function of salinity and pH at ambient temperature (Buckley and Morrow, 1225 1990). Adhesion is a measure of the surface wettability; when the oil droplet adheres, the 1226 surface is oil-wet (Buckley and Morrow, 1990). (f) Wettability map for crude oil on mica in 1227

NaCl solutions. Static contact angle measurements show that three wettability regimes can be 1228 distinguished (Drummond and Israelachvili, 2004) 1229
1230
Figure 3. Evidence for a link between pH and the LSE. (a,b) Impact of pH on adsorption of 1231 polar oil compounds on clay mineral surfaces, and (c,d) observed pH changes during successful 1232 LSE corefloods. Plots (a – Madsen and Lind, 1998; 0.1M NaCl) and (b – Burgos et al., 2002) 1233 show adsorption of acid (4-tetr-benzoic-acid PTBBA) and basic (Quinoline) polar organic 1234 compounds respectively onto kaolinite as a function of pH. Plot (c) shows an example of 1235 increased effluent brine pH associated with the LSE (Cissokho et al., 2012: for details see PID 1236 10 in Table 1); similar pH increases have been observed in a number of studies (e.g. Tang and 1237 Morrow, 1999a; Maas et al., 2001; McGuire et al., 2005; Loaharjo et al., 2007; Austad et al. 1238 2010; Alotaibi et al., 2010; Cissokho et al. 2010; RezaeiDoust et al., 2011). Plot (d) shows an 1239 example of approximately constant effluent brine pH associated with the LSE (Loaharjo et al., 1240 2007: for details see PID 15 in Table 1); a similar lack of pH change has been observed in a 1241 number of studies (e.g. Zhang et al., 2007; Loaharjo et al., 2007; Lager et al., 2008a,b; Austad 1242 et al. 2010; Alotaibi et al., 2010; RezaeiDoust et al., 2011; Nasralla and Nasr-El-Din, 2014). 1243
1244
Figure 4. Impact of injection brine salinity on the LSE. (a) Comparison of secondary 1245 coreflooding with seawater and 1,000ppm dilute brine (Webb et al., 2005; for details see PID 1246 33 in Table 1). (b) Incremental recovery as a function of injection brine salinity during tertiary 1247 waterflooding (Cissokho et al., 2010; for details see the top row of PID 9 in Table 1). 1248
1249
Figure 5. Fines migration as a mechanism for the LSE (Tang and Morrow, 1999a). 1250
1251
Figure 6. Impact of low salinity brine injection on (a) oil recovery from a kaolinite-bearing CS 1252 sandstone reservoir sample in tertiary mode; curves 1-3 denote sequential waterfloods on the 1253 same plug after cleaning and restoration; note also the cessation of the LSE on injecting Ca2+ 1254 ions; (b) pressure drop and pH associated with the same corefloods as in (a); note fines elution 1255 progressively decreased from flood 1 to flood 3; (c) oil recovery from a Berea sandstone sample 1256 in secondary mode, and (d) a fired and acidized Berea sample; (e) Berea sandstone sample in 1257 secondary mode with Swi=0. From Tang and Morrow (1999a); for more details see PID 31 in 1258 Table 1. 1259
1260
Figure 7. Compilation of data relating the LSE and acid number (AN) of the crude oil. 1261
1262
Figure 8. Ca2+ and Mg2+ concentration in produced brine during low salinity brine injection in 1263 (a) a coreflooding experiment (Lager et al., 2008a) and (b) a production well test (Lager et al., 1264

2008b; solid lines represent the concentration of the cations in the initial formation brine, 1265 dashed lines denote concentration of the cations in the injected low salinity brine). Both tests 1266 (a) and (b) showed increased oil recovery. 1267
1268
Figure 9. Proposed mechanisms for adsorption of polar compounds onto clay mineral surfaces 1269 associated with MIE (Lager et al. 2008b). During low salinity waterflooding, the organic polar 1270 compounds or organo-metallic complexes of oil that are directly attached to clay minerals via 1271 cation exchange or cation/ligand/water bridging are replaced with uncomplexed cations from 1272 low salinity brine. 1273
1274
Figure 10. ∆pH mechanism at clay mineral surfaces (Austad et al., 2010). During low salinity 1275 waterflooding, basic (plots a-c) or acidic (plots d-f) components of oil are desorbed from clay 1276 mineral surfaces via exchange with protons, leading to an increase in pH. 1277
1278
Figure 11. Charge distribution at the quartz mineral – brine interface, from Glover and 1279 Jackson (2010). 1280
1281
Figure 12. Effect of brine ionic strength on (a) zeta potential measured in sandstones saturated 1282 with NaCl brine (Vinogradov et al., 2010); note the constant zeta potential at high ionic 1283 strength, and (b) the Debye length, a measure of the thickness of the diffuse part of the double 1284 layer; note that the same double layer thickness can be observed for varying concentration and 1285 valency. Also shown is the pH dependence of the zeta potential of (c) kaolinite, (d) illite, (e) 1286 chlorite and (f) montmorillonite in brines of various composition and ionic strength ((1) - Duran 1287 et al., 2000; (2) - Kosmulsi and Dahlsten, 2006; (3) - Duman and Tunc, 2009; (4) - Chassagne 1288 et al., 2009; (5) - Martinez et al., 2010; (6) - Wainipee et al., 2013; (7) - Sondi et al., 1996; (8) 1289 - Yin et al., 2013; (9) - Alotaibi et al. 2011). 1290
1291
Figure 13. (a) Wettability index of intact samples as a function of initial brine salinity (from 1292 Ligthelm et al., 1989). Samples become increasingly oil-wet with increasing salinity, 1293 consistent with DVLO theory. Wetting layer collapse and cation bridging are promoted at high 1294 salinity owing to the decrease in thickness of the electrical double layers. (b) IFT as a function 1295 of salinity for NaCl and CaCl2 brine, from Moeini et al. (2014). 1296
1297
1298
Figure 1
(a)
(d)
(b)
(c)
(e) (f)
Figure 2
(a) (b)
(c)
(f)
Oil
reco
very
, %O
OIP
Dimensionless time
Time (minutes)
Very strongly water-wet referenceSwitch from
high-salinity to low-salinity brine
(d) (e)
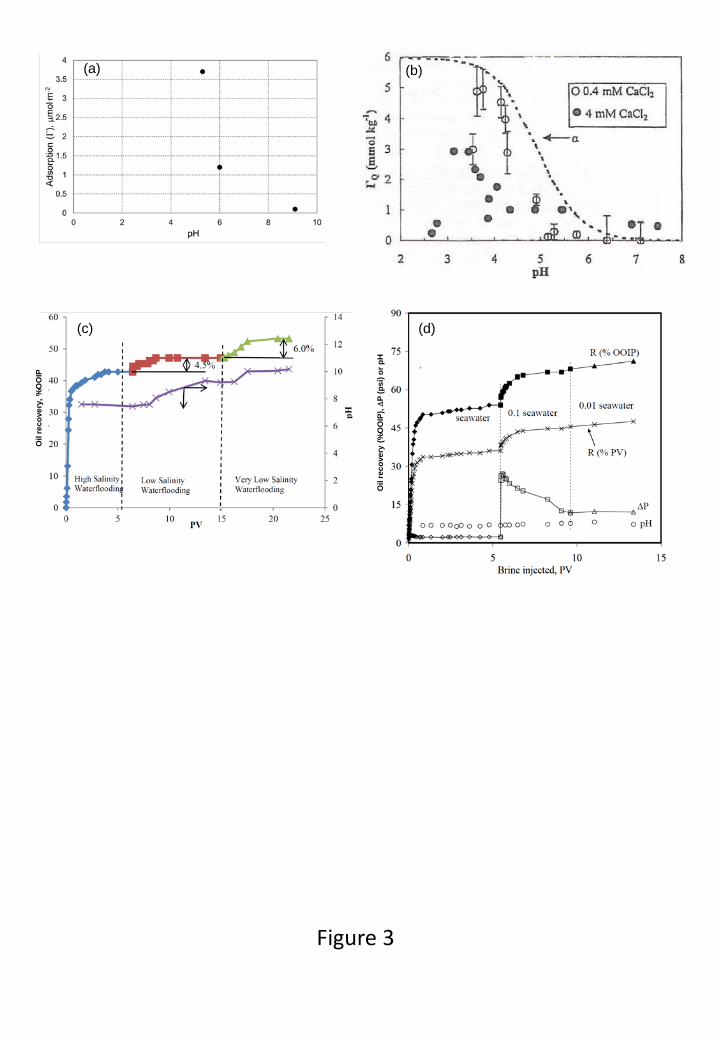
Figure 3
(b)
(c) (d)
(a)
Oil
reco
very
, %O
OIP
Oil
reco
very
(%O
OIP
), ∆
P (p
si) o
r pH
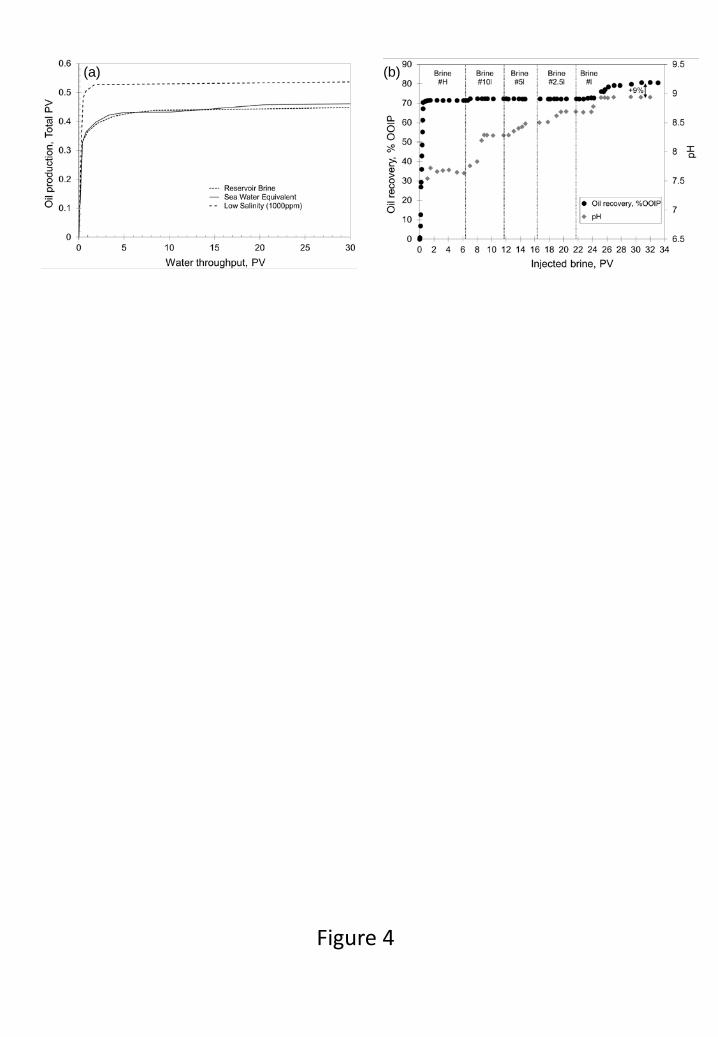
Figure 4
(a) (b)

Figure 5
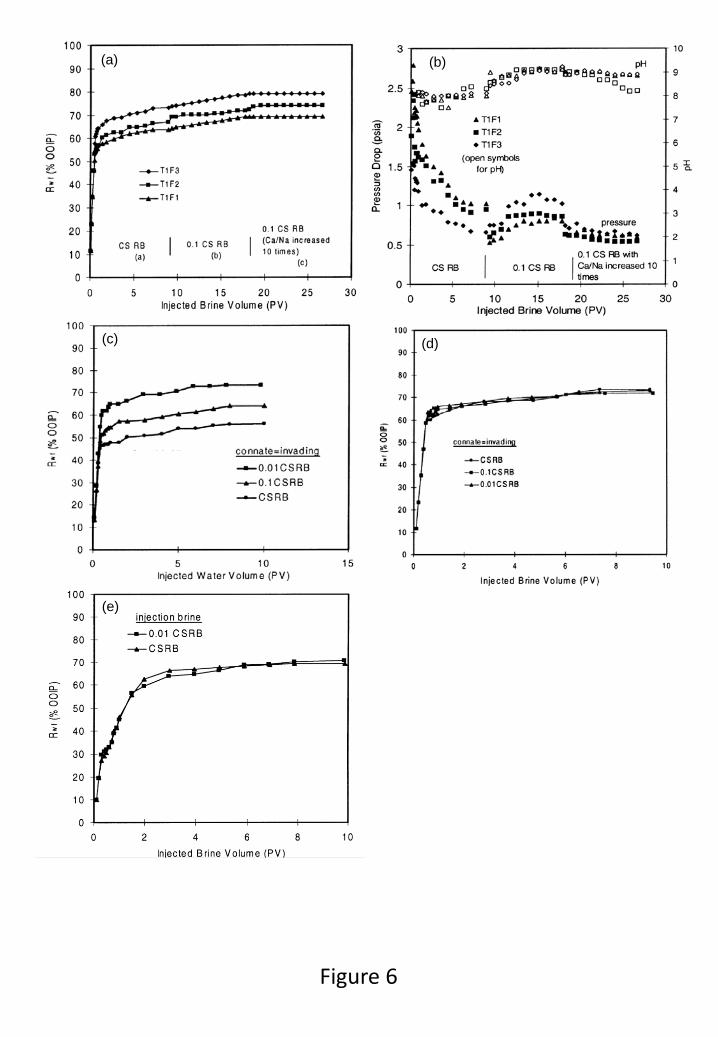
Figure 6
(a) (b)
(c) (d)
(e)
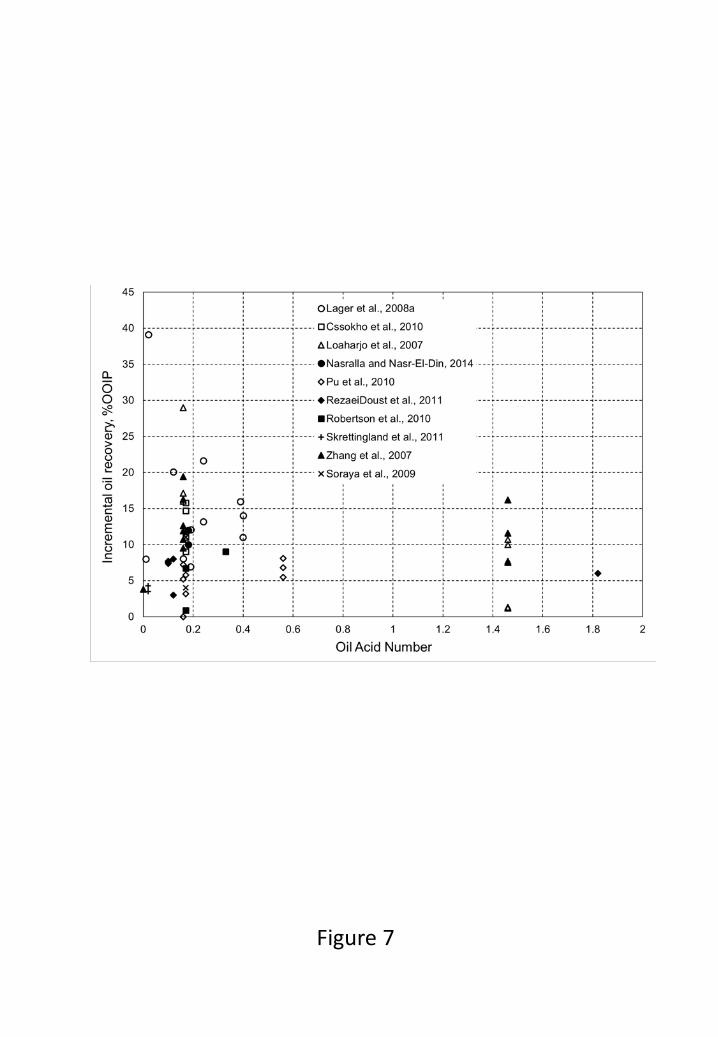
Figure 7
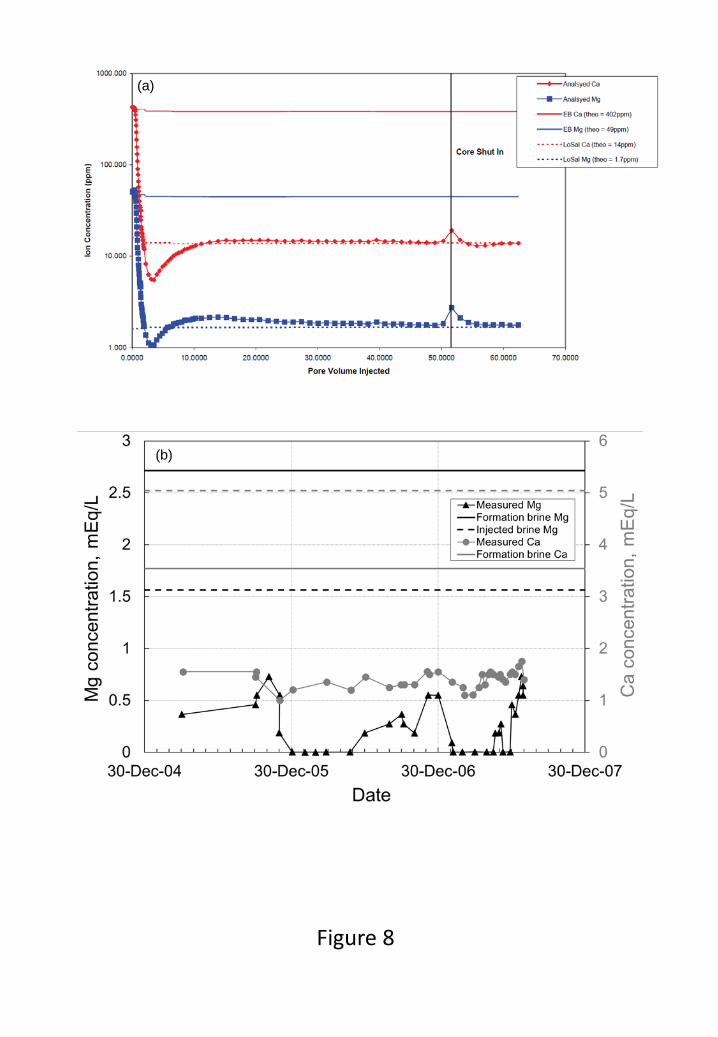
Figure 8
(a)
(b)
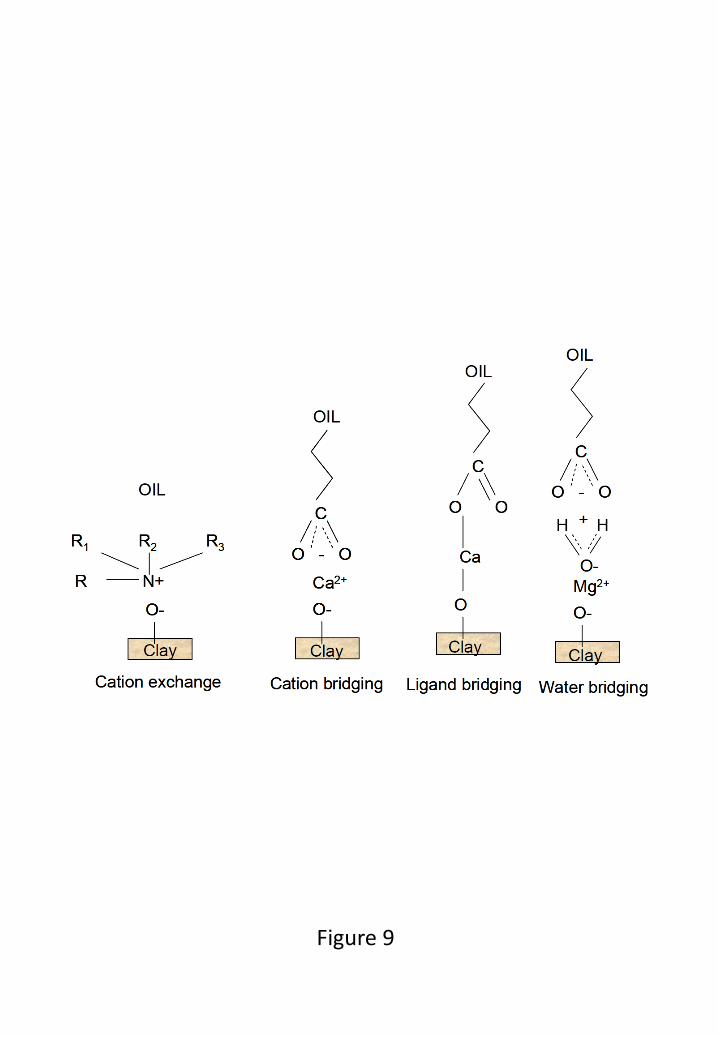
Figure 9

Figure 10
(a) (b) (c)
(d) (e) (f)
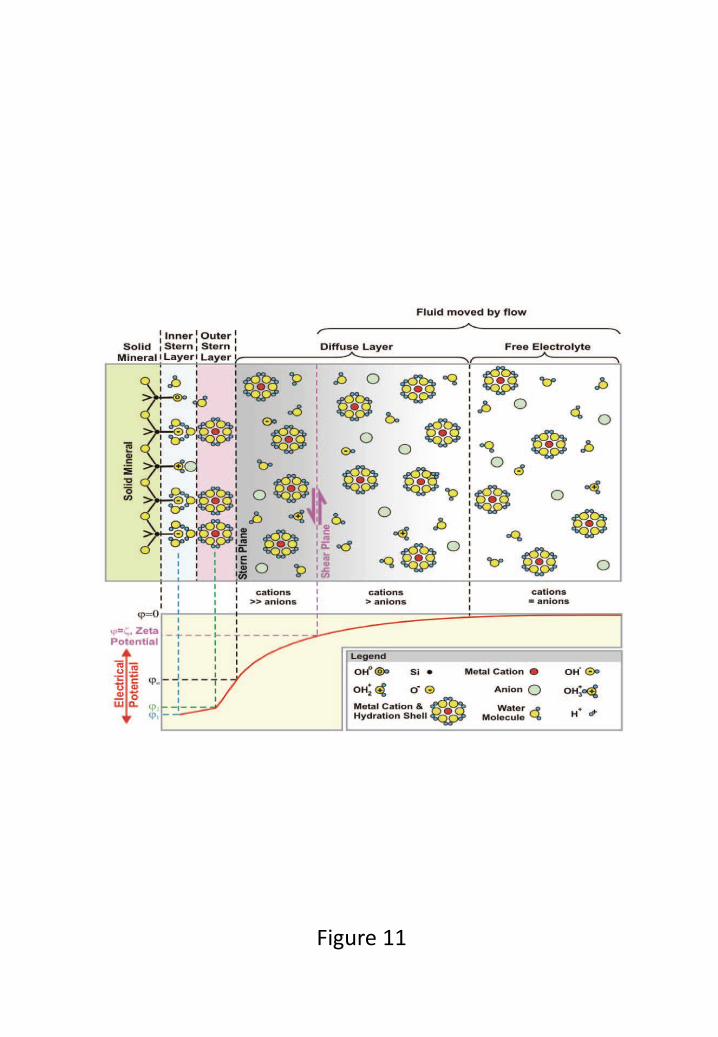
Figure 11

Figure 12
(c) (d)
(e) (f)
(b)(a)
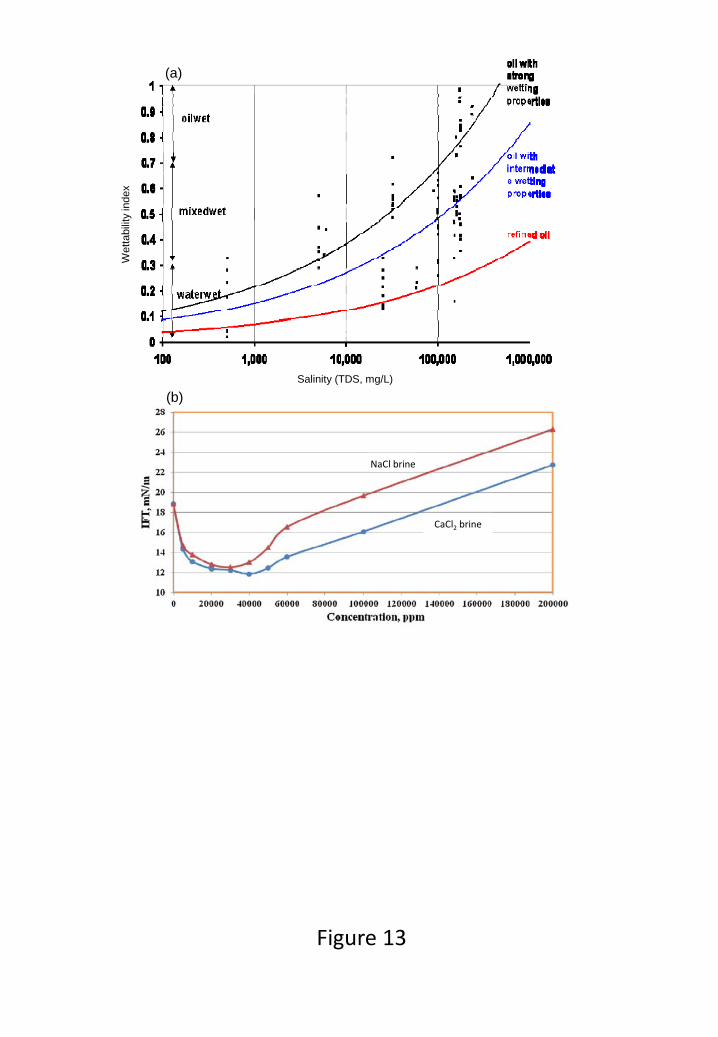
Figure 13
Wet
tabi
lity
inde
x
Salinity (TDS, mg/L)
(a)
(b)
NaCl brine
CaCl2 brine