What do workers know and practise? - Bergen Open ...
155
Israel Paul Nyarubeli What do workers know and practise? Occupational noise exposure and noise-induced hearing loss among Tanzanian iron and steel workers 2019 Thesis for the degree of Philosophiae Doctor (PhD) University of Bergen, Norway
-
Upload
khangminh22 -
Category
Documents
-
view
0 -
download
0
Transcript of What do workers know and practise? - Bergen Open ...

Israel Paul Nyarubeli
What do workers know andpractise?Occupational noise exposure and noise-induced hearing loss amongTanzanian iron and steel workers
2019
Thesis for the degree of Philosophiae Doctor (PhD)University of Bergen, Norway
at the University of Bergen
Avhandling for graden philosophiae doctor (ph.d )
ved Universitetet i Bergen
.
2017
Dato for disputas: 1111
Israel Paul Nyarubeli
What do workers know andpractise?
Occupational noise exposure and noise-inducedhearing loss among Tanzanian iron and steel workers
Thesis for the degree of Philosophiae Doctor (PhD)
Date of defense: 21.10.2019

The material in this publication is covered by the provisions of the Copyright Act.
Print: Skipnes Kommunikasjon / University of Bergen
© Copyright Israel Paul Nyarubeli
Name: Israel Paul Nyarubeli
Title: What do workers know and practise?
Year: 2019

2
Scientific Environment
This project was implemented in a scientific community at the University of Bergen,
Centre for International Health; the Research group for Occupational and
Environmental Medicine – Haukeland University Hospital, Bergen Norway; the
Muhimbili University of Health and Allied Sciences (MUHAS), Tanzania; and the
Occupational Safety and Health Authority (OSHA) under the Ministry of Labour in
Tanzania. The project was also associated with the larger project named “Reduction of
burden of injuries and diseases due to occupational exposures through capacity
building in low income countries” funded by NORHED and implemented by the
University of Bergen, the Muhimbili University of Health and Allied Sciences, in
Tanzania and the Addis Ababa University in Ethiopia, thereby forming a strong
supporting scientific environment for its accomplishments.
The project was implemented during the period 2016‒2019, with financial support
from the Norwegian State Educational Loan Fund (Lånekassen).

3
Knowledge is powerful if acquired at an appropriate time, but
information is only powerful if delivered at the right time to the right
people!
Israel P. Nyarubeli
4
Acknowledgements
I thank the almighty God for blessing me with commitment, strength and endurance
throughout my PhD journey. I appreciate everyone who has contributed towards this end. I
will do my best to acknowledge most of them even though it is likely that I will forget
important people. For this, please forgive me.
I wish to express my sincere gratitude to the Norwegian Government, through its Quota
scholarship Scheme, the Norwegian State Educational Loan Fund (Lånekassen) for financial
support during my stay in Norway and for funding my research.
I owe a large debt of gratitude to my wonderful supervisors Professor Bente Elisabeth Moen,
Magne Bråtveit as well as a colleague and friend, Dr. Alexander M. Tungu. Words alone
cannot express my thanks! You have been my guardians, mentors and guides throughout my
PhD career. I appreciate your tireless efforts, guidance and motivation enabling me to reach
my goal. I will miss you, but I sincerely hope that our professional relationship will continue
to flourish in the future.
Special thanks to the scientific group from MUHAS, Tanzania, led by Dr. Simon H. Mamuya
for always being there to help me. Likewise, my thanks go to the Norwegian Programme for
Capacity Development in Higher Education and Research for Development (NORHED)
project titled ‘Reduction of the burden of injuries and occupational exposures through
capacity building in low income countries’ for providing equipment for my PhD research.
I want to express my thanks for the fruitful cooperation with The Occupational Safety and
Health Authority (OSHA) in Tanzania, which enabled me to construct a booth and conduct
all audiometry at their premises. Thanks also to the management and administration of the
four individual iron and steel factories and the public primary schools in Dar es Salaam, with
special gratitude to the core research participants, i.e. ‒the factory workers and teachers. In
addition, my heartfelt thanks go to the research assistants, Mr. Alistides Medard and Ms.
Judith Haule, for their tireless field work. To my friend and colleague Erlend Sunde, thank
you for being such helpful person during my field work, especially in the field of noise
assessment. And, to my partner and brother Akeza Awealom, you were an incredible guy
with whom I was always happy to meet and share my PhD life.
Special thanks to the many employees at Haukeland University Hospital whose names and
titles are too numerous to list here. You all worked tirelessly on my health. May the almighty
God bless you all!

5
To my fellow master’s and doctoral students: during the period 2015‒2019 I was privileged
to become acquainted with friends from all over the world; in the Tanzanian community in
Bergen (Unbergen) I met wonderful people, including Peter John Binyaruka (my first host at
Fantoft Hostel), who truly made me feel at home. In addition, you were always willing to
lend a helping hand whenever I needed a favour.
I appreciate the employees and colleagues at the research group for Occupational and
Environmental Medicine: Bjørg Eli Hollund, Ole Jacob Møllerløkken, Camilla Hauge, Diwas
Timilsina, Akeza Awealom, Cecilie Svanes, Vilhelm F Koefoed, Nadia Ousman, Rune
Djurhuus, Jon Magnus Haga, Marit Grønning, Ingrid Gjesteland, Hilde Ridderseth, Erlend
Sunde, Gro Tjalvin, Inger Haukenes, Kaja Irgens Hansen, Jorunn Kirkeleit, Thank you,
everyone, for your academic and social support.
To the woman of my life, Imelda Simon Mlishi. I very highly value your endurance,
sacrifice, care and above all, your love for me and our children Miriam and Corlin. You
watched over our family in my absence, taking good care of our daughter Miriam and later
our second-born, Corlin, who was born in 2016 while I was away.
I will always cherish the memories of my late parents, my mother Aksa Donald Masami, and
my father who passed away during my PhD journey, Pastor Paul Isaac (Magesa) Nyarubeli;
Thank you for your love, care, encouragement, and the moral and material support that kept
me going. You were the best parents ever. This work is dedicated to you and to my son Corlin
who was born a month after my father’s death. This work is a tribute to them and a
motivation to excel in life.
To the professors of the Center for International Health (CIH), the administration and the
PhD coordination unit, I sincerely appreciate your help and support during my study period.
Gunhild Koldah, Daniel Gundersen, Solfrid Vikøren and Linda Karin Forshaw, you are an
exceptional team that one can always rely on.
Finally, I am grateful to my employer, the Kiteto District Council [Directors: Tamim H.
Kambona and John Bosco Ndunguru], and the Government of my lovely country, Tanzania,
for allowing me to travel to this part of the world to achieve the highest level of academic
education and training.

6
Abbreviations
ACGIH American Conference of Governmental Industrial Hygienists
ACOEM The American College of Occupational and Environmental Medicine
AMA American Medical Association
ANOVA Analysis of variance
CI Confidence Interval
dB Decibel
HPDs Hearing Protective Devices
HTL Hearing Threshold Level
Hz Hertz
ISO International Organization for Standardization
KAP Knowledge, Attitude and Practice
LMICs Low- and Middle-Income Countries
MUHAS Muhimbili University of Health and Allied Sciences
NDC National Development Corporation
NIHL Noise-Induced Hearing Loss
NIPTS Noise-Induced Permanent Threshold Shift
NIOSH-US National Institute for Occupational Safety and Health- United States
OSHA Occupational Safety and Health Authority
PTA Pure Tone Audiometry
REK Regional Committees for Medical and Health Research Ethics
SLM Sound Level Meter
SNHL Sensorineural Hearing Loss
SPSS Statistical Package for Social Sciences
TTS Temporary Threshold Shift
TWA Time Weighted Average
US United States
WHO World Health Organization

7
Abstract
Background: Employees work to earn a living. Noise-induced hearing loss (NIHL)
due to occupational noise is an underrated public health problem that has been
increasing during the past two decades, mostly in low-income countries. Iron and steel
factories are among the workplaces that have high levels of noise exposure, and
because of heavy industrial investments, a significant number of people are employed
in these factories. However, little is known about the status of occupational noise
exposure and prevalence of NIHL. In addition, we have no information on workers’
knowledge, attitude and practices in terms of occupational noise, NIHL and the use of
hearing protection devices (HPDs).
Objectives: We aimed at gaining knowledge about occupational noise exposure levels
and NIHL among iron and steel workers in Tanzania. We also wanted to assess the
level of knowledge, attitude and practice (KAP) regarding noise exposure, NIHL and
the use of hearing protection devices.
Material and methods: We randomly selected 253 male production line workers
from four randomly selected iron and steel factories in Tanzania. All the selected
workers participated in a KAP study, 163 participated in an exposure study, and 221
workers in prevalence of NIHL study together with external control group of 107
workers. We did a Walk-through survey (with checklist) and assessed both personal
and area noise exposure respectively using personal noise dosimeter (Brüel and Kjaer
type 4448) and sound level meter (Brüel and Kjaer type 2250). We assessed NIHL by
Pure Tone Audiometry (PTA) using Interacoustics AD 226. In addition, we used an
interview questionnaire to conduct a KAP study and to acquire information about
basic sociodemographic characteristics.
Results: Workers were exposed to an average personal noise exposure (LEX,8h) of 92.0
dB (A) (n=326). Workers did not use HPDs. About 90% of all measurements were
above the OEL of 85 dB(A).
The average area noise level was 90.5 dB(A). The personal noise exposure was
significantly higher (2.6 dB (A); 95 CI = 2.1- 3.1) compared to the corresponding area
measurements. A total of six determinants for noise exposure (three in each section)

8
were identified. These were; - the furnace installation, billet weighing/transfer and
manual handing or raw materials/ billets/crowbars for furnace section and the size of
cutting machine, the steel billet weight and feeding re heating furnace in the rolling
mill section. The overall prevalence of hearing loss was significantly higher among
exposed workers (48%) than among the controls (31%). The mean scores for attitude
and practice related to occupational noise, NIHL and the use of hearing protection
devices (HPDs) differed significantly between the four factories (one-way ANOVA,
p<0.001) while mean knowledge scores did not differ between any of the four
factories. In addition, the majority of workers had poor knowledge and practice but
had a positive attitude.
Conclusions: The workers in Tanzania’s iron and steel factories were exposed to high
noise levels above the occupational exposure limit of 85dB(A) and they did not use
HPDs. The prevalence of NIHL was higher than among the controls. The workers had
poor knowledge regarding noise exposure and related NIHL. Implementation of noise
control measures such as provision of HPDs and establishment of a hearing
conservation programme (HCP) is recommended.

9
Ikisiri
Utangulizi: Watu hufanya kazi ili wapate riziki. Tatizo la Uziwi utokanao na kelele
mahali pa kazi limekuwa halipewi kipaumbele na limethibitika kuongezeka kwa
miongo miwili iliyopita, hasa miongoni mwa nchi zinazoendelea. Mazingira ya kazi
katika viwanda vya nondo na chuma ni miongoni mwa maeneo yanayoainishwa kuwa
na viwango vikubwa vya kelele. Viwanda hivi vimeajiri watu wengi kutokana na wingi
na ukubwa wake. Kwa bahati mbaya hakuna ufahamu wa kutosha kuhusu viwango
vya kelele na uwepo wa uziwi miongoni mwa wafanyakazi wa viwanda hivi. Isitoshe,
hakuna taarifa sahihi juu ya kiwango cha uelewa wa wafanyakazi juu ya kiwango cha
makelele na athali zake kwa usikivu, mitazamo na vitendo vyao juu ya matumizi ya
vifaa vya kujikinga na na kelele wawapo kazini.
Malengo: Kuongeza elimu na ufahamu juu ya viwango vya kelele pamoja na athari
kwa usikivu (uziwi) miongoni mwa wafanyakazi wa viwanda vya nondo na chuma
nchini Tanzania. Pia, kutathmini kiwango cha uelewa wa wafanyakazi juu ya kiwango
cha makelele na athali zake kwa usikivu, mitazamo na vitendo vyao juu ya matumizi
ya vifaa vya kujikinga na kelele wawapo kazini.
Mbinu na vifaa vya utafiti: Utafiti huu ulishirikisha sampuli ya wafanyakazi 253
kutoka miongoni mwa wafanyakazi wa kiume waliokuwa kwenye mitambo ya
uzalishaji wa nondo viwandani nchini Tanzania. Wafanyakazi wote 253
waliochaguliwa walishiriki katika tathmini ya kiwango cha uelewa wa wafanyakazi
juu ya kelele mahali pa kazi na athali zake kwa usikivu, wafanyakazi 163 walishiriki
katika upimaji ili kutambua viwango vya kelele katika mazingira ya kazi ndani ya
viwanda wafanyakazi 221 walishiriki katika upimaji kiwango cha tatizo la uziwi
miongoni mwa wafanyakazi wa viwandani sambamba na kundi linganifu la waalimu
107 kutoka shule za msingi za umma. Vifaa maalumu vilitumika katika upimaji wa
kelele kwa wafanyakazi (personal noise dosimeter) pamoja na maeneo wafanyiayo
kazi (sound level meter). Vilevile njia na kifaa maalumu (audiometer) kilitumika
kupima kiwango cha usikivu kwa wafanyakazi wote walioshiriki. Pia, mbinu ya hojaji
kwa kutumia dodoso ilitumika katika kupima kiwango cha uelewa miongoni mwa
wafanyakazi wafanyakazi juu ya kiwango cha makelele na athali zake kwa usikivu,

10
mitazamo na vitendo vyao juu ya matumizi ya vifaa vya kujikinga na na kelele
wawapo kazini.
Matokeo: Wastani wa kiwango cha kelele kwa wafanyakazi-kilichopimwa kwa
mfanyakazi mmoja mmoja (LEX,8h) kilikuwa desibeli 92 (n=326). Wafanyakazi
hawakutumia vifaa vya kujikinga na kelele masikioni. Kiasi cha 90% ya vipimo vyote
vya viwango vya kelele vilikuwa juu zaidi ya kiwango salama cha kelele mahali pa
kazi ambacho ni desibeli 85.
Wastani wa kiwango cha kelele-kilichopimwa kwa maeneo ya kufanyia kazi kilikuwa
desibeli 90.5. Wastani wa kiwango cha kelele kilichopimwa kwa mfanyakazi mmoja
mmoja kilikuwa kikubwa kulinganisha na kile kilichopimwa maeneo ya kazi (desibeli
2.6; 95 CI = 2.1- 3.1). Visababishi sita vya mabadiliko ya kelele (kupanda au
kushuka) viliainishwa kutoka idara zote mbili. Katika idara ya tanuru, visababishi
vilikuwa; - mahali tanuru lijengwapo (juu ya sakafu au chini ya ardhi), namna ya
upimaji wa bileti za chuma na namna ya ubebaji na utumiaji wa vifaa. Kwenye idaya
ya vinu vya kutengeneza nondo, visababishi vilikuwa ukubwa wa mashine ya kukatia
nondo, jinsi ya ulishaji wa tanuru la uyeyushaji wa bileti za chuma na uzito wa bileti
za chuma.
Kiwango cha uziwi (hearing loss) kilikuwa kikubwa miongozi mwa wafanyakazi wa
viwandani (48%) zaidi ya kundi linganifu la waalimu (31%). Wastani wa matokeo ya
Mtizamo na Vitendo miongoni mwa wafanyakazi yalitofautiana baina ya wafanyakazi
wa kiwanda kimoja na kingine, wakati wastani wa kiwango cha uelewa
hakikutofautiana niongoni mwa wafanyakazi wa viwanda vyote. Vilevile, wafanyakazi
walio wengi walikuwa na uelewa hafifu juu ya athari za kufanya kazi katika mazingira
yenye kelele kubwa.
Muhtasari na hitimisho: Wafanyakazi katika viwanda vya nondo na chuma Tanzania
waligundulika kufanya kazi katika mazingira yenye kelele kubwa zaidi ya kiwango
salama cha kelele mahali pa kazi ambacho ni desibeli 85 na hawakutumia vifaa
stahiki vya kujikinga. Kiwango cha uziwi kilikuwa kikubwa miongoni mwa fanyakazi
wa viwandani kuliko kundi linganifu. Wafanyakazi walio wengi walikuwa na uelewa
hafifu juu ya athari zitokanazo na kufanya kazi katika mazingira yenye kelele kubwa.

11
Hivyo basi, tunapendekeza uwepo wa uthibiti wa kiwango cha kelele viwandani
ikijumuisha matumizi ya vifaa kinga pamoja na uanzishaji wa programu endelevu ya
uhifadhi wa usikivu mahali pa kazi.

12
List of publications
The intellectual content of this thesis is built on the following papers
Paper I
Nyarubeli, I.P.; Tungu, A.M.; Bråtveit, M.; Sunde, E.; Kayumba, A.V.; Moen,
B.E. Variability and Determinants of Occupational Noise Exposure Among
Iron and Steel Factory Workers in Tanzania. Ann Work Expo Health
2018;62(9): 1109-1122.doi:10.1093/annweh/wxy071.
Paper II
Nyarubeli, I.P.; Tungu, A.M.; Moen, B.E; Bråtveit, M. Prevalence of Noise-
Induced Hearing Loss among Tanzanian iron and steel workers: A Cross-
Sectional Study. Int. J. Environ. Res. Public Health 2019, 16, 1367;
doi:10.3390/ijerph16081367.
Paper III
Nyarubeli, I.P.; Tungu, A.M.; Bråtveit, M; Moen, B.E. Occupational noise
exposure and hearing loss: A study of Knowledge, Attitude and Practice among
Tanzanian iron and steel workers. Arch Env Occup Health 2019.
doi:10.1080/19338244.2019.1607816

13
Contents
Scientific Environment ................................................................................................... 2
Acknowledgements ........................................................................................................ 4
Abbreviations .................................................................................................................. 6
Abstract ........................................................................................................................... 7
Ikisiri ............................................................................................................................... 9
List of publications ....................................................................................................... 12
Contents ........................................................................................................................ 13
Definition of terms ........................................................................................................ 16
1.0 Introduction ........................................................................................................ 17
1.1 Noise and hearing loss .................................................................................... 17
1.2 Occupational noise exposure .......................................................................... 19
1.3 Assessment of occupational noise exposure ................................................... 20
1.4 Effects of occupational noise exposure........................................................... 21
1.5 The magnitude of NIHL .................................................................................. 25
1.6 Evaluation of NIHL ........................................................................................ 25
1.7 Occupational exposure limits (OEL) .............................................................. 27
1.8 Noise control in the workplace ....................................................................... 29
1.9 An overview of the Iron and Steel manufacturing industry............................ 33
1.10 Overview of studies on occupational noise exposure on and NIHL among steel
workers in developing countries 2003-2015 ..................................................... 34
2.0 KAP regarding occupational noise and NIHL ................................................ 38
2.1 Project rationale .............................................................................................. 41
3.0 Objectives ........................................................................................................... 43
3.1 Main objective................................................................................................. 43
3.2 Specific Objectives ......................................................................................... 43
4.0 Materials and methods ........................................................................................ 44
4.1 Occupational noise exposure and the NIHL project ....................................... 44
4.2 Study setting .................................................................................................... 44
4.3 Iron and steel manufacturing in Tanzania ....................................................... 44
4.4 Study design .................................................................................................... 51
4.5 Study population ............................................................................................. 51
4.6 Participants ...................................................................................................... 52

14
4.7 Interview questionnaire and checklists ........................................................... 54
4.8 Personal noise measurement ........................................................................... 55
4.9 Area noise measurement ................................................................................. 56
4.10 Pure tone audiometry ...................................................................................... 57
4.11 Statistical analysis ........................................................................................... 58
4.12 Ethical clearance ............................................................................................. 61
5.0 Results ................................................................................................................ 62
5.1 Summary results in Paper I: Variability and determinants of occupational noise
exposure ............................................................................................................. 62
5.2 Summary results in Paper II: Prevalence of NIHL ......................................... 62
5.3 Summary results in Paper III: KAP study....................................................... 63
6.0 Discussions ......................................................................................................... 65
6.1 Main Discussion .............................................................................................. 65
6.2 Methodological discussion .............................................................................. 70
6.2.1 Study design ............................................................................................. 70
6.2.2 Study population ...................................................................................... 70
6.2.3 Noise exposure assessment ...................................................................... 73
6.2.4 Audiometry (Pure Tone Audiometry) ...................................................... 74
6.2.5 Questionnaire ........................................................................................... 75
7.0 Conclusions ........................................................................................................ 76
8.0 Recommendations .............................................................................................. 77
9.0 Future Research Perspectives ............................................................................. 77
References .................................................................................................................... 78

15
ANNEXES
Annex I: Information letter & Informed Consent
Annex IIa: Interview-based questionnaire (in Swahili)
Annex IIb: Interview-based questionnaire (in English)
Annex IIIa: Checklist for a Walk-through Survey
Annex IIIb: Checklist &protocol for audiometry (in Swahili)

16
Definition of terms
Audiogram: a presentation, in graphical or tabular form, of the hearing threshold
levels of the ears of the test subject, determined under specified conditions and by a
specified method, as a function of frequency, i.e. a picture of how a person hears at a
given place and time under given conditions.
Decibel: In Acoustics, it is a unit used to measure the intensity of a sound or the sound
power level of an electrical signal by comparing it with a given level (reference
quantity) on a logarithmic scale. It is used to measure sound intensity.
dBHL: decibels hearing level, a logarithmic measurement of human hearing that,
through standardization, has defined 0 dBHL as the faintest sound that the average
normal-hearing person can detect.
Hearing loss: deviation or change for the worse from what is normal on the threshold
of hearing.
Hearing threshold: Is the sound level below which a person’s ear is unable to detect
any sound. For adults, 0 dB is the reference level
Noise: is unwanted sound. In this thesis, we use the term occupational noise for
unwanted sound in the workplace.
Noise-induced hearing loss (NIHL)in this thesis: Hearing Threshold Level ≥ 25 dB
hearing level in either ear at 3, 4 or 6 kHz.

17
1.0 Introduction
This thesis is about occupational noise exposure and noise-induced hearing loss
(NIHL) among iron and steel workers in Tanzania. Employment in iron and steel
factories has been a blessing to a significant number of people in Tanzania, but the
presence of workplace hazards such as occupational noise might be a problem. High
noise levels associated with the increased risk of NIHL is an underestimated global
public health concern [4]. It is estimated that 466 million people live with disabling
hearing loss (above 40 dB) globally, one-third of which is attributed, at least in part, to
noise exposure [5, 6]. The prevalence of NIHL is estimated to be higher in lower and
middle-income countries (LMICs) including Tanzania, than other parts of the world
[7]. However, there is inadequate information about the existing situation in factories
in Tanzania and no accessed research in this country or the neighbouring countries
specifically addresses the noise exposure levels and prevalence of NIHL. This
information is necessary for planning and implementing workplace NIHL preventive
interventions. Hence, this study was important.
The synopsis is built on three papers published in peer reviewed international journals
and presents the knowledge gained in the area of occupational noise and NIHL. This
information can be shared and used in intervention programmes by workers,
management-level personnel, governing institutions, global academia and
stakeholders for similar workplaces with the same characteristics. We have
systematically presented the general understanding of noise and hearing loss and have
narrowed the focus to occupational noise exposure and NIHL which is central to our
methodology, results and discussion. Finally, we draw conclusions and present
recommendations for improvement and further research.
1.1 Noise and hearing loss
The World Health Organization (WHO) and International Labour Organization (ILO)
define noise as unwanted sound [8, 9]. Sound is the result of pressure variations, or
oscillations, in an elastic medium (e.g., air, water, solids), generated by a vibrating
surface, or turbulent fluid flow [9]. Sound is characterized by frequency, i.e. the
number of pressure variation cycles per second, in Hertz (Hz); wavelength, i.e. the

18
distance travelled by the pressure wave during one cycle; and the period, i.e. the time
taken for one cycle of a wave to pass a fixed point. Usually, sound level is measured
in decibel (dB), i.e. the logarithm of the ratio of two sound intensities or two sound
pressures [10]. Sound waves are detected in human ear, starting with vibrations of the
eardrum. In addition, the human ear has different sensitivities to different frequencies,
i.e. less sensitive to extreme high and low frequencies [9]. The human ear has a
remarkable dynamic range of roughly 0-120 dB (106 sound pressure level), which
allows for detection of sound from the faintest noise to painful stimulation [11]. At a
given sound pressure level, a healthy human cochlea can detect and encode sound
waves across frequencies ranges from 20Hz to 20kHz [9, 11].
When sound waves are received by the external ear, the waves move in the external
ear canal and may vibrate the ear drum (tympanic membrane), connected to three
bones (malleus, incus and stapes). The vibration causes movement of the fluid within
the inner ear cochlea. Thus, the cells in the inner ear transduces vibration into nervous
impulses while producing a frequency and intensity analysis of the sound. The latter is
then transmitted to the brain where the details of the sound are analysed. However, the
sound or noise-sensitive components of sound within the ear are the outer hair cells in
the basilar part of the cochlea. This is the most sensitive, in part because of the
harmonic amplification of the ear canal and in part because of absolute sensitivity
[12]. This part responds to 4kHz and adjacent frequencies of 3kHz and 6kHz. It is
worth noting that once these hair cells degenerate for any reason, including being
exposed to excessive noise for a long period of time, they do not recover, and
permanent hearing loss eventually develops with an increase in hearing threshold [12,
13]. When assessing impact on humans, noise is normally classified as occupational
noise, i.e. noise in the workplace (industries, mining, agriculture, military,
constructions etc.), or as environmental noise, which includes noise in all other places
at domestic, community or residential level such as leisure, traffic, music noise [14].
For brevity, we use the term noise throughout this thesis to mean occupational noise.

19
1.2 Occupational noise exposure
In this study, occupational noise denotes unwanted sound level in the workplace that
has a potential to cause hearing damage [15]. Exposure of human ears to high
intensity sound level above 85 dB(A) for 8 hours a day over time is associated with an
increased risk of damage to hearing [16]. Occupational noise is of paramount
importance because the associated hearing loss is in principle preventable. Studies
have reported that workers in the military, mining, construction, agriculture, and
manufacturing industries, including iron and steel factories, work in high noise levels
emitted from operating machines, tools, equipment and from various tasks and
activities performed [17-21]. It was estimated that more than 15% of industrial
workers were exposed to a noise level above 85 dB(A) in 1990s in industrialized
countries, including Germany. In the United States (USA) alone, the figure was over
22 million (17%) of employees [17, 22, 23]. In recent years, the world has witnessed
an industrial shift from the developed part of the world to the developing countries
including sub-Saharan Africa [24-26]. Unfortunately, there is lack of reliable data, and
empirical studies on noise levels for many manufacturing industries including iron and
steel are still scarce. Governments in these countries need to be aware of this; hence,
protection of workers from high noise levels at work should be an integral part of
public health interventions.
Worker’s exposure to detrimental noise in the workplace depends on several factors.
During production processes, noise generation is an inherent trait of operating
machines, equipment and tools used, and of the way different tasks are performed by
individual workers. In addition, the design of the workplace influences the
occupational noise level and may include sound absorbing materials in the building
structure as well as whether the machinery and processes are enclosed or have sound
barriers [17].

20
1.3 Assessment of occupational noise exposure
Noise assessment is typically done to establish and document the levels at which the
noise is hazardous to the human ear. Identification of work locations and tasks with
harmful noise exposure and workers who may be at increased risk of hearing loss [27]
is an important part in establishment of workplace hearing conservation programme
with effective noise control measures. To achieve this, prior to noise measurement in
the workplace, a Walk-through survey is recommended as an important part of noise
hazard identification (in the risk assessment process) to collect information necessary
to describe the working environment and identify determinants for noise exposure,
which is also a basic prerequisite for planning how sampling is to be conducted [28].
Such information includes noise sources, workplace layout, types of machines and
production processes, number of workers per section with their shift patterns,
production capacity, working durations, changes in production processes or machinery
(if any). In addition, information is normally collected on the availability of health and
safety policies, the use of hearing protection devices and the perceived noise levels on
the site.
The two common devices for noise exposure assessment at workplaces are
integrating- averaging sound level meter (SLM) and personal sound exposure meters
(dosimeters) [29]. SLM is a hand- held device that is normally used to measure static
or stationary sound pressure level (from noise emitting substances such as machines or
equipment or tasks) over a period (referred to as area measurement or survey). Also, it
is used for noise measurement at ear level (10–20 cm from human ear). This device is
relatively cheap, easy to use and has the advantage that a single device can be used to
gather details about the source of noise in the workplace for noise mapping. The
personal noise dosimeter, on other hand, is a specific device for measurement of
personal noise exposure. The device is portable and is fitted to the worker’s shoulder
(10 -15 cm from the most exposed ear) for the full-shift noise measurement and
provides a noise profile of the working shift taking various variabilities in working
conditions, tasks and activities into consideration. However, the current personal
dosimeters cannot measure noise level above 140dB. In addition, measured values
maybe confounded by worker’s behaviour (accidental or deliberate) such as touching

21
the microphone, whistling, blowing or shouting into the microphone, or even
removing and replacing it before the noise accessor is due to collect it[30].These two
devices (the SLM and the personal noise dosimeter) have been widely used in
different noise exposure studies[30-32].
The International Organization for Standardization (ISO standard) 9612:2009 provides
an appropriate engineering method for measuring and calculating noise exposure level
at workplace. Estimates obtained through this method may provide useful information
for planning and implementing noise control measures. The two devices, i.e.
integrating-SLM and personal noise dosimeters are recommended in this ISO standard
for conducting workplace noise exposure assessment [29].
1.4 Effects of occupational noise exposure
Workers’ ears exposed to excessive continuous or impulsive sound levels above
85dB(A) are likely to have their hearing threshold increased [7, 13, 21]. The increase
in threshold of hearing due to noise exposure is commonly referred to as noise-
induced hearing loss (NIHL) or sometimes sensorineural hearing loss because it
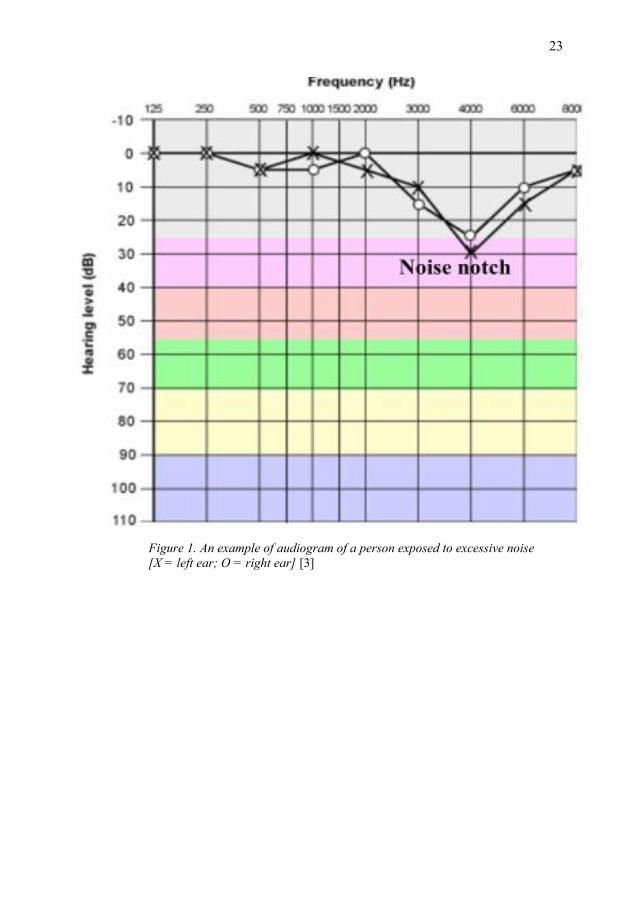
affects the inner part of the ear [13, 33]. This is why, the audiogram of an ear that has
been exposed to high noise shows a dip or notch at frequencies of 3-6kHz (figure 1)
[12]. The risk of NIHL is related to the duration and intensity of occupational noise
exposure, as well as individual susceptibility to noise trauma [11].
In general, occupational noise exposure may result in both auditory health effects such
as NIHL (an irreversible loss of auditory sensory cells in the cochlea) and tinnitus
(change in sound perception, for example ringing in the ear that cannot be attributed to
the external source) as well as non-auditory health effects such as speech
intelligibility, cognitive performance, decreased self-esteem, social isolation,
annoyance and sleep disturbance. Occupational noise may cause daytime sleepiness,
decreased attention to tasks (which in turn can cause accidents and injuries at work),
increased workers’ compensation costs and expenses for hearing aids, in addition to
an increased risk of cardiovascular diseases [14, 34, 35]. In this study, we focused on
NIHL as a primary outcome due to occupational noise exposure.

22
The different definition or metrics of NIHL makes comparisons among studies
problematic (Table 1) [4, 36]. Some definitions are based on a hearing threshold shift
from the baseline audiogram such as that of the National Institute for Occupational
Safety and Health (NIOSH) and the Occupational Safety and Health Administration
(OSHA) from the United States of America (Table 1). Other regulatory bodies use the
‘noise notch’ definition (a dip at 3, 4 or 6kHz with recovery at 8kHz) (figure 1), while
others use the average threshold level estimates for one (worse or better) or both ears
at selected frequencies with a cut-off value of 25 dB HL [4, 37-40]. In addition, there
may be other definitions and explanations applied based on other methods such as
tympanometry, OAE and self-report. However, there is a common understanding that
low frequencies (0.5 – 2kHz) are used for assessing speech comprehension and the
higher frequencies (3, 4 and or 6kHz) are primarily associated with noise exposure
[40, 41]. For this reason, the NIHL definition based on the higher frequencies from the
Norwegian Labour Authority and corresponding to the recent WHO definition and
The American College of Occupational and Environmental Medicine (ACOEM) (at 3,
4 or 6 kHz) was used in our study because no such guidance exists in Tanzania (Table
1).
23
Figure 1. An example of audiogram of a person exposed to excessive noise
[X = left ear; O = right ear] [3]

24
Table 1: Definition of NIHL from selected regulatory institutions
Institution (ref) NIHL definition/metric
WHO [42] Permanent decrement in hearing threshold levels (HTLs), with a
characteristic reduction of hearing sensitivity at frequencies of 3, 4
and/or 6 kHz, and relatively better hearing sensitivity in
surrounding frequencies (i.e. 2 or 8 kHz)
NIOSH- US (as STS)
[23]
An increase in the HTL of 15dB or more at any frequency (0.5, 1,
2, 3, 4 or 6 kHz) in either ear, that is confirmed for the same ear
and frequency by a second test within 30 days after the first test.
American Medical
Association (AMA) -
hearing impairment [4]
Hearing threshold average at 0.5, 1, 2, and 3 kHz >25dB HL, with
1.5% monaural impairment for each decibel greater than 25.
OSHA-US (STS)[4] A 10-dB change from the baseline audiogram in the average of
HTLs at 2, 3 and 4 kHz, with age correction allowed
Or
A 10-dB change from the baseline audiogram in the average of
HTLs at 2, 3 and 4 kHz ≥ 25dB HL.
Norwegian Labour
Authority [43]
HTL ≥ 25 dB hearing level in either ear at 3, 4 or 6 kHz
Health and Safety
Executive -UK (hearing
impairment) [44]
Sum of HTLs at 1, 2, 3, 4 and 6 kHz. Compare value with figure
given for appropriate age band and gender in a standardized table.
ACOEM [40] Hearing loss (sensorineural) that is a function of continuous or
intermittent noise exposure, intensity and duration, and which
usually develops slowly over several years, characterized by a dip
sign of the audiogram at the high frequencies of 3, 4 and 6 kHz
recovering at 8 kHz

25
1.5 The magnitude of NIHL
Hearing loss is an underestimated public health concern [4, 45]. The global magnitude
of disabling hearing loss (above 40 dB) from all causes has increased during the past
two decades from 120 to 466 million people in the period 1995‒2018 and the figures
are expected to increase in the future [5, 7]. Apart from occupational noise exposure,
hearing loss may also be caused by a number of risk factors such as increasing age
[46-48], smoking [49], exposure to organic solvents, [50] the use of ototoxic
medicines, [49, 50] vibration, genetics, congenital factors (maternal rubella, syphilis,
low birth weight, birth asphyxia), blunt head or ear injury and or surgery, ear
infections, illnesses (meningitis, measles, mumps, otitis media) [11, 49, 51, 52].
However, in workplaces, noise exposure contributes significantly to the increased
prevalence of hearing loss [53]. Estimates of the prevalence of hearing loss related to
noise exposure, i.e. NIHL above 85dB(A) vary in the range of 7‒21% or higher [49].
Approximately 5% of world population suffers from occupational or recreational
NIHL at great economic cost and detriment to the quality of life of affected
individuals [52]. Prevalence is estimated to be higher in the low and middle-income
countries compared to the findings in other parts of the world [49]. In Tanzania for
example, the prevalence of NIHL in studies in the field of mining was 47% [54]. This
may be due to ongoing economic investments in industrialization coupled with
challenges related to an inadequate public health policy, lack of regulatory
frameworks and limited resources [55]. In addition, the coverage of occupational
health services and hence awareness in the working population has been low [56].
1.6 Evaluation of NIHL
NIHL can be screened or diagnosed in several ways. The most commonly used
method and technique is Pure tone Audiometry (PTA). Other methods include
tympanometry, and Otoacoustic emission (OAE) [57-59]. Some simple tests for
hearing loss include the Whispered voice test, which has been used in primary care
when access to an audiometer is problematic; the Tuning fork test, such as Rinne and
Weber tests [11, 60]; also, Self-report and a Rubbing sound from examiner’s fingers
[61] have been used.

26
Tympanometry measures acoustic impedance (resistance of acoustic energy flowing
from the ossicular chain to inner ear) and admittance (how easily the acoustic energy
flows) in the middle ear [57, 58]. It is a clinical diagnostic method used to measure the
physical properties of the middle ear system. It has been widely used in the evaluation
of middle ear functioning during routine examination as it is cheap, quick and non-
invasive [57]. However, it is not effective on infants [62].
Otoacoustic emission (OAE) is an acoustic energy generated by outer hair cell
receptor that disappears when the inner ear has been damaged [63]. OAEs are caused
by the motion of the cochlea’s sensory hair cells as they are responding to auditory
stimulus and can be recorded by a microphone fitted into the ear canal [64]. The
presence of OAE means that the middle ear and cochlea respond normally to sound
stimulation. This makes easier to access the sensitivity of efferent auditory system
after exposure to high noise levels or ototoxic medicines [65]. This method is said to
be effective and reliable for identifying hearing defects in infants and children under
the age of three, but with infants, it is usually not easy to conduct [65]. For NIHL
diagnosis, this method still needs more investigation [34].
Pure Tone Audiometry (PTA) or simply Audiometry is an ear screening procedure
that can detect small changes in either ear in the hearing threshold of an individual.
This method is most frequently used to examine the hearing ability of adults. Results
are presented as an audiogram expressed as a graph of hearing threshold level based
on a function of frequency and time under given conditions [23]. This makes it easier
to identify individuals at work who are at risk of developing hearing loss due to
exposure to high noise levels and to determine possible preventive measures. An
electronic set of devices called audiometer is the commonly referred diagnostic
device, i.e. pure tone air conduction audiometer. It has proved to be highly sensitive
(94%) and specific (70-80%) in detection of SNHL [66]. The test is conducted after
otoscopic examination of the ear with an objective of examination of gross
abnormalities such as impacted ear wax, pus, blood or any other occlusion. During
audiometry, the background noise had to be controlled, with the test preferably

27
conducted in a booth [67]. Despite this limitation, PTA is still the gold standard tool
for hearing screening and/or evaluation in adults [68, 69].
For valid audiometric results, ISO 8253-1:2010 [Acoustics-Audiometric test methods
Part1: Pure-tone air and borne conduction audiometry] specifies procedure and
requirements for PTA. It provides, in addition, conditions for the audiometric test
environment and the maximum values for the sound pressure levels. For example, the
maximum permissible ambient sound pressure levels in one-third octave bands, Ls,max
(in dB) for PTA to be conducted with the test frequency range 0.25-8kHz, are 66dB
for 31.5Hz and 33dB for 8kHz respectively [70]. Furthermore, the audiometer should
comply with the International Electrotechnical Commission (IEC) standard [IEC
606450-1:2012, Part 1; Electroacoustics- Audiometric equipment: Equipment for
pure-tone audiometry]. The ISO 1999 provides a model for the prediction and
distribution of risk of noise-induced permanent threshold shift (NIPTS) synonyms to
Permanent NIHL at a given frequency, in a population of a given age, after an
exposure to a certain continuous equivalent noise level (steady state) [71]. However,
the estimates may be compromised by noise characteristics in different workplaces,
for example in iron and steel factories, where a mix of noise characteristics are
common. Also, this standard uses a reference population mainly from the USA, which
differs (in socio-demographic characteristics) from other countries and regions,
including Tanzania, where normative data on hearing loss in the community and other
working population does not exist.
1.7 Occupational exposure limits (OEL)
The range of audible frequencies of the human ear is between 20 Hz to 20 kHz [72].
The effects caused by noise on human hearing have prompted actions geared to
safeguard normal hearing ability. It is estimated that the risk of hearing loss due to
exposure to an average A-weighted equivalent sound level of 80dB(A), 85dB(A) and
90dB(A) and above is negligible, marginal and material respectively [73].
Nevertheless, there might still be individuals acquiring NIHL due to variation in the
susceptibility of the ear to the effect of noise. Therefore, different country/regional

28
and or professional institutions set safe noise limits, i.e. OEL to prevent the majority
of the population from developing NIHL. The OEL is used as a guide for planning and
establishment of a hearing conservation programme and for monitoring occupational
noise exposure among workers (as a compliance tool). It is worth noting that selection
and or setting of occupational noise exposure limits (which is done by regulatory
bodies) takes into consideration ethical, economic, social and political factors not
amenable to international standardization, resulting in differing OEL values set by
different responsible bodies or entities [71]. In addition, the administration of the set
OEL values varies in different countries and regions of the World. In the USA, for
example, the NIOSH, a professional body, has set the Recommended Exposure Limit
(REL) at 85 dB(A) TWA with a peak of 140dB(A) aiming at reducing excess risk of
material impairment of 8% of noise exposed population over working lifetime
(normally 40 years) [23]. The American Conference of Governmental Industrial
Hygienists (ACGIH) have a Threshold Limit Value (TLV) of 85 dB(A) with a peak of
140dBC using a 3 dB exchange rate [74]. This noise exposure limit is used by many
countries in the world, including Tanzania [42]. The European Union (EU) sets lower
and upper exposure action values of 80 dB(A) and 85dB(A) respectively, with the
exposure limit at 87dB(A) with a peak noise level of 135 dB(C); the United Kingdom
uses the same value [75, 76]. On the other hand, the USA Occupational Safety and
Health Administration (OSHA) ‒ a regulatory body, has set a permissible exposure
limit (PEL) at 90 dB(A) TWA with a 5dB exchange rate aiming at reducing excess
risk of material impairment for 25% of the noise-exposed population over their
working lifetime [23]. This is also used in some other countries, such as India [77].
In Tanzania, OEL for noise was recently set by the Tanzania Bureau of Standards
(TBS), a government agency that is responsible for formulation of all national
standards. OSHA- Tanzania (a regulatory body) on the other side, administers the
OEL. Currently, there is no independent professional institution responsible for
occupational safety and health that provides technical guidelines, and this is the case
in many developing countries.

29
1.8 Noise control in the workplace
Controlling noise in the workplace may be challenging due to inherent characteristics
of industrial machines, equipment and tools used in production processes.
Consideration of some other potential factors such as cost, effectiveness, technical
feasibility and sociocultural aspects are necessary when planning for and selecting
noise control measures [14]. There are potential noise control measures technically
arranged in hierarchical order. These measures are grouped under general categories
such as elimination, substitution, administrative and the use of hearing protective
devices, which is regarded as the last option [23, 78]. However, the effectiveness of
the noise control measures in workplaces largely depends on actions taken to control
the underlying noise determinants, i.e. those factory and worker-related factors that
potentially influence the occupational noise [79]. Usually, a combination of control
measures yields maximum output [79].
Elimination measures are aimed at eradicating the noise at the source or reducing it to
a level that no longer puts the human ear at risk [44]. These may include direct actions
to diminish noise at the source, such as elimination of impact between metal surfaces
or avoiding the use of noisy machinery when introducing new machines or work
processes. Elimination measures are perceived as the most effective way to control
noise. However, in iron and steel factories, elimination of noise due to the inherent
characteristics of production machinery is practically infeasible [17].
Engineering measures involve actions that reduce noise being generated and or
transmitted to the receiver. These encompass, for example, modifying the design of
machinery, tools, processes and equipment; substitution, i.e. replacing a noisy process,
material, tool or equipment with a quieter one; redesigning equipment to eliminate
noise source; re-designing work layout; regular equipment and machine maintenance;
introducing cushioning materials; enclosing noisy machinery with sound-absorbent
materials; and introducing barriers such as walls [23, 79]. In some instances, potential
obstacles to engineering noise controls such as lack of noise reduction options (quieter
machinery), weak technical skills and experience and feasibility issues have been
reported [80]. The recent systematic review of intervention studies employing
engineering controls in workplaces indicated varying results, and more intervention

30
studies are recommended [81]. However, these are the preferred measures for noise
control despite the costs and technological challenges. Furthermore, in some
classifications, substitution measures are grouped together with elimination measures.
Administrative measures are employed whenever engineering controls are not
feasible. These include changes in the work schedule, management policy or
operations that reduce the worker’s exposure to occupational noise. Such measures
comprise introducing rest breaks away from noisy areas; identifying, sign posting or
zoning noisy areas; job re-designing to allow few workers into noisy areas, shortening
shifts and modifying work schedules [23]. The implementation and success of
administrative measures requires the commitment of management, regular follow-ups
and workers’ compliance.
Use of hearing protection devices (HPDs). These are measures (ear plugs, canal caps
and ear muffs) designed to protect worker from the adverse effect of noise exposure
during work. Each of these has pros and cons that vary according to worker activity,
tools, equipment and the work environment. In principle, the workers’ use of HPDs
should attenuate occupational noise exposure at least down to a level below the
recommended OEL. They are ranked as a last option in the hierarchy of noise control,
i.e. when all other noise control measures are not feasible. Mild impact has been
reported in the effectiveness of using HPDs among construction workers in the USA,
although its effectiveness largely depends on training and their proper use [82].
However, in a well implemented hearing loss prevention programme (HLPP), the use
of HPDs was associated with less NIHL [81].
The Hearing Conservation Programme (HCP) is the recommended workplace noise
intervention designed to protect workers exposed to significant noise above OEL
(85dB(A)) from developing or reduce the progression of NIHL [83]. Before its
introduction, all workers at risk need to be identified. The programme comprises a
series of interconnected steps that involve both the workers and employers in
collaboration to improve results (figure 2). Such steps involve an initial audit of
workplace procedures (assessment of noise risks), design and implementation of noise
control measures (engineering, administrative, use of HPDs), health surveillance for

31
workers at risk (audiometric evaluation and monitoring of workers’ hearing), record
keeping, and programme evaluation (Figure 2) [44, 83]. Implementation of HCP has
been successful [84]. However, the effectiveness of HCP largely depends on effective
worker education regarding all aspects of the programme, and there is a need for
support from management, policies, availability and use of HPDs and motivations
including incentive packages [23, 85-87].
In Tanzania, the Occupational Safety and Health Act (OSHA) No. 5 of 2003, requires
the employer to provide and maintain effective personal protective equipment
(including HPDs) for the use of employees, and that a thorough pre-placement and
periodic medical examination (including ear screening in this case) should be
conducted [88]. However, access to occupational health and safety services in the
working community is still low, and raising awareness remains problematic [56].
These factors may result in difficulties implementing and achieving the intended
outcomes in workplaces.

32
Figure 2. Schematic diagram showing HCP steps towards managing noise risks in the
workplace (adopted from HSE- Control of noise at work regulations 2005, guidance to
regulations) [44]
33
1.9 An overview of the Iron and Steel manufacturing industry
The use of iron and steel materials has a long history and has contributed much to
industrial development and current global economic growth. The world yearly blast-
furnace iron (pig iron) production has increased from 505,944,000 tonnes in the 1980s
to 1,183, 451, 000 tonnes in 2014. Out of this, Africa as a whole produced 5,540,000
tonnes in 2014 [89]. The observed high production rate is highly correlated with
market demand, production technology and economic advancement. However, it is
noteworthy that the steel industry employs a significant number of workers. This
sector needs capital investment in terms of labour, financial investments and
technology which in turn necessitate better occupational health services in place to
prevent workers from exposures to hazardous noise.
The steel manufacturing industry is said to be the second largest industry in the world
behind oil and gas, providing employment for some fifty (50) million people [90]. It is
estimated that the products from the steel manufacturing industry may be recycled;
from 50% for electrical appliances, up to 85% for construction, up to 90% for
machinery and up to 100% for automobiles in different countries of the world [91].
Due to increasing global demand, the yearly production has been doubled in the past
fifteen years, i.e. from 850 million tonnes in 2000 to 1,665 million tonnes in 2014
[90].
In Tanzania, it is believed that carbon steel production through pre-heated draft
furnaces was already practised around 2250 years ago (during the Iron Age) by the
Haya tribes, west of Lake Victoria [92]. After independence, several changes have
taken place in Tanzania. The first formal iron and steel industry (Aluminium Africa
Limited-ALAF) was established in 1960 followed by the National Steel cooperation
(under National Development Corporation-NDC) in 1966 and Steel Rolling Mill in
1970.
To date, more than 25 large steel-iron manufacturing industries exist, producing more
than 200,000 tonnes of steel iron per annum. It was estimated that the construction
industry accounted for up to 8.3% of the national revenues in 2013 [93]. Currently the
most reliable raw materials for these industries are metal scraps and imported steel
34
billet sheets. However, following the discovery of Liganga iron ore and construction
of the steel plant, the production and raw materials are expected to increase
dramatically (52,53).
1.10 Overview of studies on occupational noise exposure on and NIHL
among steel workers in developing countries 2003-2015
Studies show that metal workers including iron and steel factories in industrialized
countries are among the workplaces with high noise levels [17, 18], but only a few
studies have been conducted in developing countries. There is only one accessed study
in Tanzania on noise exposure in small-scale industrial areas with metal works and
fabrications [94-98]. Also, research findings indicate that workplace noise exposure
and related NIHL seems to decrease in the developed world, likely due to improved
prevention measures, in contrast to the developing regions [18]. However, effective
noise control measures in workplaces remains a major challenge across the globe, and
further studies are recommended [81, 99].
In a literature search through Ovid Medline, nine studies published in English between
2003 and 2015 were retrieved on occupational noise exposure and NIHL in iron and
steel factories (Table 2). These studies were from Africa and Asian regions classified
as LMICs presumably due to the shift of manufacturing industries from industrialized
economies to developing and emerging industrial economies [25]. Two studies were
from India [100, 101] and one study each in the following countries: Saudi Arabia
[98], Nepal [102], United Arab Emirates [103], Iran [104], Nigeria [96], China [105],
and Tanzania [106]. Among these studies, only two studies were conducted on the
African continent, which supports the claim of a current lack of information on
occupational noise exposure levels and magnitude of NIHL among iron and steel
workers in Africa, whereas industrial investments are concurrently on the rise. In all
studies, noise levels were assessed by using SLM (device stationed at workstations or
close to worker’s ear) and recorded noise levels were assumed to represent workers’
noise exposure while none of these studies used personal noise dosimeter. The latter is
despite the recent consensus that dosimetry is the preferred method for assessment of

35
personal noise exposure in the workplace [107]. Findings from these studies show that
iron and steel workers were exposed to noise levels above the recommended OELs,
indicating that noise may still be, to date, an inherent characteristic of this type of
factory and hence noise-preventive measures would be necessary from the inception
of steel/rebar production activities.
Regardless of the definition used in accessed studies, the prevalence of NIHL was
above the global average of 7-21% with a wide range of 28% and up to 90% (Table
2). The same high prevalence was reported even when workers were reported to use
hearing protective devices. This calls for more research on the effectiveness of these
preventive measures.

36
T
ab
le 2
. A
n o
ver
vie
w o
f st
ud
ies
on
occ
up
ati
on
al
no
ise
exp
osu
re a
nd
NIH
L a
mo
ng
iro
n a
nd
ste
el (
met
al)
wo
rker
s fr
om
20
03
-
20
15
Au
tho
r, Y
ear
&
Co
un
try
Stu
dy
des
ign
, st
ud
y p
op
ula
tio
n
Are
a l
evel
(L
Aeq
) in
dB
A
Def
init
ion
of
HL
P
rev
ale
nce
of
NIH
L
Hea
rin
g p
rote
ctio
n
dev
ices
Ag
arw
al G
, 2
01
5
[10
0]
Ind
ia
Cro
ss s
ecti
on
al,
stee
l fa
cto
ry w
ork
ers,
N=
34
1
65
.0-9
2.0
An
av
erag
e h
eari
ng t
hre
sho
ld
lev
els
> 2
5d
B h
eari
ng l
evel
at
0.5
, 1
, 2
, an
d 4
kH
z in
th
e ri
gh
t
and
th
e le
ft e
ar s
epar
atel
y
(usi
ng P
ure
To
ne
Au
dio
met
ry)
40
% f
or
the
Rig
ht
ear,
46
% f
or
the
Lef
t
ear
No
in
form
atio
n o
n
use
of
hea
rin
g
pro
tect
ion
dev
ices
.
No
wei
r M
H,
et a
l.
20
14
[9
8]
Sau
di
Ara
bia
No
ise
surv
ey/m
app
ing,
Met
alw
ork
in
du
stri
es
i.
Ste
el s
hee
ts f
orm
ing a
nd
pro
cess
ing i
nd
ust
ries
ii.
Ste
el r
ein
forc
emen
t
form
ing f
or
con
cret
e
ind
ust
ries
i.
Ste
el s
hee
ts
ind
ust
ries
=
86
.7-9
0.9
ii.
Ste
el
rein
forc
emen
t
ind
ust
ries
=
90
.5-9
5.0
-
-
Au
tho
r re
com
men
d
wea
rin
g h
eari
ng
pro
tect
ion
dev
ices
at
hig
her
no
ise
lev
el
abo
ve
10
0%
do
se.
Wh
itta
ker
JD
, et
al.
20
14
[1
02
]
Nep
al
Cro
ss s
ecti
on
al,
Sm
all
scal
e M
etal
/ste
el i
nd
ust
ry,
(N=
11
5)
65
-85
Th
e p
eak
th
resh
old
bet
wee
n 3
and
6k
Hz
(an
in
crea
sed
thre
sho
ld w
ith
in t
his
ran
ge
that
red
uce
d a
gai
n a
t 8
kH
z)
(usi
ng P
ure
To
ne
Au
dio
met
ry)
30
%
Ear
pro
tect
ion
dev
ices
pro
vid
ed
Sin
gh
LP
, et
al.
20
13
[1
01
]
Ind
ia
Iro
n a
nd
ste
el i
nd
ust
ry
-No
ise
exp
ose
d w
ork
ers
eng
aged
in v
ario
us
pro
cess
es o
f ca
stin
g a
nd
forg
ing i
nd
ust
ry (
N=
16
5)
60
-10
5
An
av
erag
e h
eari
ng t
hre
sho
ld
lev
els
> 2
5d
B h
eari
ng l
evel
at
all
mea
sure
d f
req
uen
cies
(0
.25
– 8
.0 k
Hz)
(usi
ng P
ure
To
ne
Au
dio
met
ry)
90
%
17
% u
sed
hea
rin
g
pro
tect
ion
dev
ices

37
Ah
med
HO
,
20
12
[1
03
]
Un
ited
Ara
b
Em
irat
es (
UA
E)
Cro
ss s
ecti
on
al
Iro
n a
nd
ste
el f
acto
ry
70
-96
-
-
45
% h
ad n
ever
use
d
hea
rin
g p
rote
ctiv
e
dev
ices
Att
arch
i M
S,
et a
l.
20
10
[1
04
]
Iran
Cro
ss s
ecti
on
al,
Ste
el i
nd
ust
ry
(N=
31
0)
≥8
5
Sig
nif
ican
t T
hre
sho
ld S
hif
t
(ST
S):
An
av
erag
e h
eari
ng
thre
sho
ld l
evel
s >
25
dB
hea
rin
g l
evel
in
eit
her
ear
at
freq
uen
cies
3,4
,6 a
nd
8k
Hz.
(Pu
re T
on
e A
ud
iom
etry
)
41
% i
n 2
00
9
Hea
rin
g p
rote
ctio
n
dev
ices
wo
rn
Olo
ge
FE
,
20
06
[9
6]
Nig
eria
Cro
ss s
ecti
on
al,
Ste
el r
oll
ing m
ills
(N=
10
3)
49
- 9
3
An
av
erag
e h
eari
ng t
hre
sho
ld
lev
els
> 2
5 d
B h
eari
ng l
evel
in
eith
er e
ar a
t fr
equ
enci
es 0
.5-
4k
Hz,
cla
ssif
ied
fro
m m
ild
to
pro
fou
nd
hea
rin
g l
oss
.
(def
init
ion
no
t st
ated
).
(usi
ng P
ure
To
ne
Au
dio
met
ry)
28
% f
or
the
bet
ter
ear
and
57
% f
or
the
wo
rse
ear
No
in
form
atio
n o
n
use
of
hea
rin
g
pro
tect
ion
dev
ices
No
mu
ra K
, et
al.
20
05
[1
05
]
Ch
ina
Cro
ss s
ecti
on
al,
Met
al w
ork
ers
(N=
18
9)
85
-95
A p
erso
n u
nab
le t
o h
ear
40
dB
aud
iom
etri
c te
st s
ou
nd
at
4k
Hz
64
% a
mo
ng n
ois
e
exp
ose
d w
ork
ers
Hea
rin
g p
rote
ctio
n
dev
ices
wo
rn
Min
ja B
M,
et a
l.
20
03
[1
06
]
Tan
zan
ia
Cro
ss s
ecti
on
al,
Sm
all
scal
e in
du
stri
al a
reas
A.
(In
clu
din
g M
etal
wo
rks)
(N f
or
A=
12
4)
Are
a A
: m
etal
fab
rica
tio
n,
bla
ck
smit
her
y,
carp
entr
y a
nd
tai
lori
ng
of
mo
tor
veh
icle
acc
esso
ries
, sm
all
sho
ps
for
mar
ket
ing p
rod
uct
s.
68
-86
.8
No
t d
efin
ed
Ear
scr
een
ed b
y P
ure
To
ne
Au
dio
met
ry
51
%
No
hea
rin
g p
rote
ctio
n
dev
ices
wo
rn

38
2.0 KAP regarding occupational noise and NIHL
At workplaces, we would like to effectively control hazards such as occupational
noise and reduce the risk of NIHL. Behavioural interventional measures to reduce
hearing loss such as administrative measures and the use of HPDs require both the
employers and workers to have a better and common understanding. It may not be
good enough to just inform workers about risks for development of NIHL or use of
legislations and expect to have a successful noise control intervention, other actions
are needed to change their behaviour. Workers involvement in planning and
implementation of noise control measures is therefore necessary. This is because some
immediate intervention in working environments with high noise levels above OEL
would require workers to be provided with and wear HPDs which will require their
compliance and hence change their behaviour into good practice.
In this case it is necessary to establish what workers know, to observe and document
their practices and assess their attitude towards occupational noise and NIHL. To
come up with such useful information, a KAP survey could be used. A KAP survey is
defined as a quantitative method (predefined questions formatted in standardized
questionnaires) that provides access to quantitative and qualitative information which
reveals misconceptions or misunderstandings that may represent obstacles to the
activities that we would like to implement, and potential barriers to behaviour change
[108]. The KAP model has three interrelated domains, i.e. knowledge, attitude and
practice explained below and illustrated in figure 3.
Knowledge may be explained as a belief that is correct, justified and retained acquired
through learning, practice and experience [109]. Knowledge is believed to provide
human lives with orderliness which in turn affects behaviour. In research, explicitly
knowledge at an individual level may be assessed in several ways such as self-report
using questionnaire, quantitative and or qualitative surveys, free elicitation and paper-
and-pencil tests. However, validity of results highly depends on the study design, tool
used and characteristics of participants [110]. The main hypothesis when studying
health-based knowledge in many populations, for example workers in iron and steel
factories, is that there appears to be a direct relationship between knowledge and

39
behaviour [111], but that relationship involves many other factors. Nevertheless,
knowing what workers know about noise exposure and NIHL is the pre-requisite in
planning for appropriate and effective control measures at workplace. This also helps
to identify areas where information and education are most needed.
Attitude refers to a hypothetical construct, namely a tendency to evaluate some object
in a favourable or unfavourable manner [112, 113]. Attitude consists of affect,
cognition and behaviour and is normally linked with knowledge [112, 114]. Various
techniques are available to measure attitude, for example explicit self-report
(Thurstone, Guttman and Likert Scales), implicit attitude measures (response time
measure, response facilitation measure and response competition measure),
psychophysiological measures (measurement of brain activity, assessing changes in
individual’s physical expression in response to an attitude) and behaviour observation
[113]. These methods are context-sensitive, and they are likely to give varying
conclusions. However, as one of the strategies towards behaviour change, the World
Bank (WB) recommends measuring existing attitudes before attempting to change
them [115].
Practice reveals the acquisition of knowledge and any change in attitude caused by
removal of misconceptions about a specific problem or disease that translates into
preventive behaviour [112]. Practices include observable actions in response to an
intervention. This can be measured by questionnaire and be substantiated by
observational methods.
The three domains (knowledge, attitude and practice) form the so called KAP model
which is useful in studying human behaviour when affected by a problem or a disease
[112]. The theory postulates that the three domains are related, and that knowledge
and attitude are likely to influence practice [111, 112]. In our case, therefore, the
workers’ knowledge and attitude towards occupational noise, NIHL, audiometry and
the use of HPDS are likely to influence practices; for example, implementation of the
occupational noise control measures including the use of HPDs (Figure 3).

40
KAP studies are conducted to collect information from a specific sample of a
population about what is known, believed and done in relation to a particular topic
[116]. In this present study, the goal is to acquire information pertaining to
occupational noise exposure and related NIHL. Results from KAP studies help to
bridge the knowledge gap, identify needs and barriers, attitudes and practices that are
commonly shared. This information is useful for stakeholders (owners, workers and
policy/decision makers) in planning and implementing noise control measures in the
workplace. In addition, results may be used in selecting the most appropriate and cost-
effective strategy [116], and in evaluating educational and communication
interventions [117]. KAP studies have been reported to be more cost-effective and
resource-conserving than other social research methods, because they are tightly
focused and limited in scope [111, 112].
NIHL among workers has been linked with individual workers’ knowledge of health
and their attitude towards it. These may affect practices at work, although behavioural
changes normally take a long time to manifest themselves [118]. Increased prevalence
Figure 3. An illustrative KAP model for occupational noise and NIHL. The model is modified from
cognitive-affective-behaviour theorem [1, 2]

41
of NIHL has been related to a low KAP score among workers. For instance, a cross-
sectional study of 97 Malaysian quarry workers found a prevalence of NIHL (57%),
while the KAP scores were low, i.e. 11% for knowledge, 10% for attitude and 28% for
practice [119]. Two studies on NIHL and occupational hazards respectively, in
Malaysia and in Nigeria, found good knowledge, a positive attitude but poor practice
among workers [120, 121].
2.1 Project rationale
Occupational noise exposure and related hearing loss (HL) are prevalent and the
second most commonly reported occupational related injuries or illnesses in
workplaces worldwide [7]. Workplace noise exposure above 85dB- time weighted
average (TWA) over 8-hours is associated with increased risk and severity of NIHL.
In the USA, for example, it is estimated that 8% of the workers exposed to 85dB(A),
22% of the workers exposed to 90dB(A), 38% of the workers exposed to 95dB(A),
and 44% of those exposed to 100dB(A) are likely to develop NIHL within ten or more
years of occupational noise exposure [6, 122]. NIHL presents a public health problem
that is chronic and has an irreversible effect on human hearing. Its consequences
include loss of productivity, social isolation, impaired communication between the
affected person and co-workers and family members, with the accompanying potential
to cause accidents and injuries, impair one’s ability to monitor the work environment,
decreased self-esteem and heighten expenses for workers’ compensation and hearing
aids [14]. Its prevalence is highest in LMIC countries, including Tanzania, partly
because of industrial investments with lack of preventive services and limited
resources [7, 14, 54, 96, 123]. Iron and steel factory workers are likely to be at higher
risk of hearing loss as the result of a poor and uncontrolled high-noise working
environment. In Tanzania, there is to our knowledge no accessed published studies on
occupational noise exposure levels and hearing loss in this sector. The iron and steel
industry sector is growing rapidly and employs a significant number of workers. Also,
little is known about the knowledge workers have about noise exposure in workplaces.
This information is fundamental in designing workplace preventive interventions,
policy making and focused research in the country.

42
Due to rapid major investments in the industrial sector in Tanzania, a significant
number of workers employed in iron and steel industries are likely to be exposed to
high noise levels. Lack of reliable information on noise as an occupational hazard and
the prevalence of NIHL among workers; unavailability or poorly implemented hearing
conservation programme; low access to health and safety services including poor
knowledge and use of HPDs hamper efforts towards improving the working
environment.
This project was therefore aimed at documenting the noise exposure levels and the
magnitude of NIHL among workers in iron and steel industries in Tanzania and
furthermore to provide information regarding KAP to guide policy dialogues among
stakeholders and help in decision-making process targeting hearing conservation in
workplaces.

43
3.0 Objectives
3.1 Main objective
The main objective of this thesis was to gain knowledge about occupational noise
exposure levels and NIHL among iron and steel workers in Tanzania. This
information would be relevant for planning and implementing noise control measures
in workplaces.
3.2 Specific Objectives
i. To document occupational noise exposure levels and to identify potential
determinants of noise exposure in iron and steel factories.
ii. To determine the prevalence of NIHL among iron and steel workers, and to
compare the hearing thresholds at different frequencies between these workers and
a control group exposed to a low level of occupational noise, and
iii. To assess the level of knowledge, attitude and practice regarding noise exposure,
NIHL and the use of hearing protection devices among iron and steel industry
workers in Tanzania.
44
4.0 Materials and methods
4.1 Occupational noise exposure and the NIHL project
In 2015, the project ‘Occupational noise exposure and hearing loss’ was established
and implemented by the University of Bergen, Norway in collaboration with The
Muhimbili University of Health and Allied Sciences (MUHAS), Occupational Safety
and Health Authority (OSHA) and Iron and Steel Factories in Tanzania.
4.2 Study setting
We obtained a list of 22 registered iron and steel factories in the Eastern Tanzania
Zone from the headquarter of the OSHA-Tanzania. We examined these factories
individually to ensure that they were operational and accessible. Also, we checked
whether they had complete steel production processes, a known factory address and at
least 50 permanent employees. Twelve factories qualified. Of these, we selected five
factories randomly for the study. We had initial contact with the selected factories
between December 2015 and January 2016. One factory changed production just prior
to project start-up and was therefore excluded from the study. Thus, we were left with
four factories.
4.3 Iron and steel manufacturing in Tanzania
The manufacturing process in the four steel factories is divided into two separate
sections – the furnace section, where metal scraps are processed into steel billets
(ingots), and the rolling mill section, where steel bars (rebars) are manufactured. Each
section has several job groups assigned different tasks which may result into
difference in their noise exposure levels (Table 3)
The raw materials commonly used are domestically available metal scraps and
imported billet sheets (figure 4&5). In the furnace section, metal scraps are fed into
and melted in the induction furnace to form molten steel with floating furnace slag
which is removed by raking (Figure 6). The molten steel is then refined by the
addition of gases such as carbon dioxide and nitrogen at the base of the furnaces (54).
A sample of this slag is tapped and sent to the laboratory to be checked for its carbon
and other impurities content (according to the steel production standards). Normally it

45
is estimated that the carbon content in the final steel should be adjusted to 0.04% (55).
The molten steel is then poured into a ladle and then into smaller ladles/crucibles that
are carried manually to the prepared moulds of varied sizes to form steel billets
(Figure 7). The billets are cooled and later weighed before they are sent to rolling mill
processing [124, 125]. Noise is emitted by the machines and manual handling of metal
scraps, steel billets and feeding metal scraps into the furnace oven. Other sources of
noise include the weighing process and the moving and dropping of billets onto the
weighing scale (Table 3).
The rolling mill process involves heating steel billets to a temperature of about 960oC
in a gas furnace, after which the billets are transferred as red-hot bars to a roughing
machine, where they are shaped and lengthened. Electric motor-operated conveyor
rails transport the hot steel billets between the machines. The red-hot bars are fed into
six serially arranged rolling mill machines where steel rebars are manufactured as
needed (Figure 8). Normally, the width of rebars range from 8, 10, 12, 16, 20 to 25mm
depending on the purpose. Very wide rebars are weighty and are likely to increase
noise during production. Rebars are then moved into a cooling bed and cut into
standard lengths (normally 6 metres) (Figure 9). The large cutting machine produces
more noise than the smaller cutting machine. In addition, all these processes involve
noise emission from the operating machines, movement of materials and the operating
tasks (Table 3). The products are bend-tested to ensure conformity with required
standards. The final products are bundled and stored for transport.

46
Figure 4: steel billets made from domestic scraps: Two different billet weights
(100-120kgs vs 20-30kgs) were used in the rebar production process. The large
billet weight was related to higher noise levels that the smaller billet weight.
Figure 5: imported steel billet sheets, normally cut into larger billet weight for
rebar production

47
Figure 6: feeding a furnace oven with metal scraps: droning noise from operating
furnace, noise from collision of metal scraps during furnace feeding, loading
handcart and siren. Noise from explosive materials accidentally fed into the
furnace.
Figure 7: Pouring molten steel into moulds

48
Figure 8: steel manufacturing using a rolling mill machine: Droning noise
from multiple operating six-strand rolling machines, flywheels, electric fans,
motors, conveyor rails, frequent collision of metal rods in motion and
hammering.
Figure 9: steel cutting into 6-metre length: large cutting machines produce
higher noise levels than the smaller cutting machines

49
49
T
ab
le 3
. D
escr
ipti
on
of
job
gro
up
, ta
sks
an
d n
ois
e so
urc
es a
mo
ng
wo
rker
s in
iro
n a
nd
ste
el f
acto
ries
in
Ta
nza
nia
Sec
tio
n
Jo
b g
rou
p
Ma
in T
ask
S
ou
rces
of
no
ise
Fu
rnac
e S
ecti
on
M
elte
rs
Off
load
ing m
etal
scr
aps
usi
ng c
ran
es,
fin
al
sort
ing o
f m
etal
scr
aps
to r
emo
ve
exp
losi
ves
,
feed
ing t
he
ind
uct
ion
furn
ace
ov
en w
ith
raw
mat
eria
ls u
sin
g h
and
s, h
and
cart
s an
d c
row
bar
s.
Dro
nin
g n
ois
e fr
om
op
erat
ing i
nd
uct
ion
fu
rnac
e p
lan
t.
No
ise
fro
m c
oll
isio
n o
f m
etal
s sc
rap
s d
uri
ng o
fflo
adin
g b
y
ov
erh
ead
cra
ne,
lo
adin
g a
nd
off
load
ing i
nto
han
dca
rts,
lo
adin
g o
f
met
al s
crap
s in
to f
urn
ace,
sir
en.
No
ise
fro
m e
xp
losi
ve
mat
eria
ls a
ccid
enta
lly f
ed i
nto
fu
rnac
e.
Mo
uld
ers
Po
uri
ng m
olt
en s
teel
fro
m l
adle
to
tu
rn d
ish
and
th
en t
ran
sfer
by c
ruci
ble
s to
mo
uld
s w
her
e
it c
oo
ls t
o f
orm
ste
el b
ille
ts.
No
ise
fro
m s
iren
an
d n
ois
e g
ener
ated
fro
m i
nd
uct
ion
furn
ace
sect
ion
as
thes
e tw
o a
re u
nd
er s
ame
roo
f ex
cep
t fo
r fa
cto
ry B
.
Bil
let
shif
ters
T
ran
sfer
of
stee
l b
ille
t fr
om
th
e fu
rnac
e se
ctio
n
to t
he
pu
sher
.
No
ise
fro
m s
iren
, w
eigh
ing b
ille
ts,
and
lo
adin
g b
ille
ts i
nto
han
dca
rts
tran
spo
rted
to
pu
sher
sec
tio
n.
No
ise
gen
erat
ed f
rom
in
du
ctio
n f
urn
ace.
Wo
rker
s at
bil
let
wei
gh
ing
Wei
gh
ing a
nd
rec
ord
ing s
teel
bil
lets
fo
r th
e
stee
l p
rod
uct
ion
pro
cess
.
No
ise
gen
erat
ed b
y p
utt
ing b
ille
ts o
n t
he
wei
gh
sca
le a
nd
lo
adin
g
bil
lets
in
to h
and
cart
s tr
ansp
ort
ed t
o p
ush
er s
ecti
on
.
Wo
rker
s at
con
tin
uo
us
cast
ing
mac
hin
e (C
CM
)
(av
aila
ble
on
ly i
n
fact
ory
C)
Op
erat
e an
au
tom
atic
mac
hin
e th
at r
ecei
ves
mo
lten
ste
el t
o f
orm
ste
el b
ille
ts.
Dro
nin
g n
ois
e fr
om
CC
M m
ach
iner
y.
No
ise
fro
m a
dja
cen
t in
du
ctio
n f
urn
ace,
sir
en,
pu
sher
, an
d r
oll
ing
mil
l se
ctio
ns
(as
they
are
all
un
der
sam
e ro
of)
.
Ref
lect
ive
sou
nd
s.
Ro
llin
g M
ill
Sec
tio
n
Pu
sher
F
eed
s re
hea
tin
g g
as f
urn
ace
wit
h b
ille
ts a
t
char
gin
g s
ide.
Dro
nin
g n
ois
e fr
om
op
erat
ing g
as f
urn
ace,
off
load
ing b
ille
ts f
rom
han
dca
rts,
lo
adin
g o
f b
ille
ts i
nto
th
e p
ush
er m
ach
ine.
No
ise
fro
m a
dja
cen
t o
per
atin
g r
oll
ing m
ach
ines
, el
ectr
ic f
ans,
sir
en
and
mo
tors
.
Ref
lect
ive
sou
nd
s.
Fir
emen
C
on
tro
llin
g r
ehea
tin
g b
ille
ts i
nto
red
-ho
t
pro
cess
.
Rem
ov
ing r
ed-h
ot
bil
lets
fro
m g
as f
urn
ace
usi
ng c
row
bar
s an
d d
irec
t th
em i
nto
an
elec
tric
op
erat
ed m
etal
co
nv
eyo
r.
Sam
e as
pu
sher
.
No
ise
fro
m c
oll
isio
n o
f re
d-h
ot
bil
lets
, co
nv
eyo
r ra
ils
and
sid
es.

50
50
Wo
rker
s at
rou
gh
ing
Fla
tten
red
-ho
t b
ille
ts (
bac
k a
nd
fort
h)
into
thin
ner
an
d m
ore
elo
ng
ated
sh
ape
than
th
e
ori
gin
al s
teel
bil
let.
Sam
e as
in
Fir
emen
.
No
ise
fro
m p
ress
uri
zin
g/f
latt
enin
g p
roce
ss.
To
ngs
men
Mac
hin
e o
per
ato
rs
(in
fac
tory
C)
Ste
el b
ar r
oll
ing m
ills
. A
s in
ro
ugh
ing s
ecti
on
.
No
ise
gen
erat
ed f
rom
fre
qu
ent
met
al i
mp
act
fro
m m
ov
ing m
etal
rod
s in
to r
oll
ing m
ills
an
d t
he
con
veyo
r sy
stem
an
d f
rom
th
e
ham
mer
ing o
f m
etal
rod
s st
uck
in
th
e m
ach
ines
.
Wo
rker
s at
co
oli
ng
bed
Mo
vin
g h
ot
stee
l b
ars
fro
m r
oll
ing m
ach
ines
into
a c
oo
lin
g p
latf
orm
.
Dro
nin
g n
ois
e fr
om
ro
llin
g m
ill
and
cu
ttin
g m
ach
ines
, si
ren
,
refl
ecti
ve
sou
nd
, m
ov
ing h
ot
stee
l b
ars
thro
ugh
met
al c
on
veyo
r
bea
ms
and
rai
ls.
Cu
tter
s/b
un
dle
rs
Cu
ttin
g s
teel
bar
s in
to r
equ
ired
len
gth
(no
rmal
ly 6
met
res)
an
d b
un
dli
ng s
teel
bar
s fo
r
sto
rag
e/tr
ansp
ort
.
No
ise
fro
m c
utt
ing m
ach
ine,
mo
vin
g s
teel
bar
s in
to c
on
veyo
rs.
No
ise
fro
m r
oll
ing m
ills
mac
hin
es.
Lo
adin
g o
f fi
nis
hed
pro
du
cts
imm
edia
tely
aft
er c
utt
ing
so
met
imes
pro
du
ced
no
ise.
Sh
eare
rs
Cu
ttin
g r
ejec
ted
ste
el b
ars
into
ch
un
ks
for
recycl
ing.
Dro
nin
g n
ois
e fr
om
th
e o
per
atin
g m
ach
ines
, si
ren
.
No
ise
fro
m p
iece
s o
f st
eel
dro
pped
in
to c
arry
ing b
uck
ets.

51
4.4 Study design
The project comprised an exposure study (Paper I) and a cross sectional study with two parts
involving audiometry (Paper II) and interviews on questions regarding KAP (Paper III)
conducted among noise exposed male production workers from four iron and steel factories
located in different industrial areas in Dar es Salaam, Tanzania. The fieldwork was conducted
between June 2016 and June 2017. In the study to establish the magnitude of NIHL (Paper II),
male teachers from public primary school made up the control group. To achieve the planned
main objective, the project goal was divided into three specific objectives that were
accomplished through various scientific methods for the different outcomes (Figure 10).
4.5 Study population
We conducted a study involving 253 randomly selected workers in the production line, i.e. 71 in
factory A, 57 in factory B, 61 in factory C and 64 in factory D. In addition, 123 randomly
selected male teachers from 34 public primary school made up a control group (Figure 11).
Figure 10: Schematic diagram of occupational noise exposure and the NIHL project
among iron and steel workers in Tanzania

52
4.6 Participants
Our participants were male workers in the production line. We did not encounter female
workers except in other sections performing administrative services. The control group in Paper
II comprised male workers randomly selected from the teachers in public primary schools.
Since there was no available information about hearing loss among noise exposed workers or
among the general population in Tanzania, the sample size was calculated based on a
community baseline survey conducted in Uganda that found the prevalence of hearing loss
among adults to be 12% [51]. In our study the effect of noise on hearing loss was hypothesized
to be doubled, i.e. 24%. To achieve 90% power and be able to detect a difference in hearing loss
between noise exposed workers and a non-exposed group at a significance level of 0.05 (Using
Open-Epi online calculator Version 3.3a) [126], a total number of 230 exposed workers were
needed. We added 10% to account for non-responders, providing a total sample size of 253
workers.
We held meetings with both management at the individual factories and the administration at
the public primary school. We presented the purpose of the project and asked for a research
permit. Each of these partners referred us to a contact person who helped the research team in
planning the research activities. We were provided with a list of permanent workers by each
factory management team and by the administration of the primary schools. We randomly
Figure 11. Flow chart describing the participants in the occupational noise
exposure and hearing loss among iron and steel workers in Tanzania
53
selected a total of 376 workers (253 workers from the four iron and steel factories and 123
teachers from 34 public primary schools) using a table of random numbers. We invited the
selected workers to participate in the study. These workers were informed about the project
objectives and were required to give written consent (Annex I).
All selected workers consented to participate in the study. The 253 workers from the four iron
and steel factories exposed to noise at work gave their consent and participated in the KAP
study (Paper III). The same participants formed the noise exposed group for the NIHL study
(Paper II) in which we had, in addition, the control group consisting of 123 male teachers from
public primary schools. The latter were hypothesized to have a lower levels of noise exposure at
work (Figure 11). In the NIHL study (Paper II), we excluded 32 and 16 workers respectively
from the noise exposed group and the control group based on exclusion criteria [49, 70]. We
used information collected through a structured interview to exclude those with congenital
hearing loss (n= 1) and a history of otitis media during childhood (n= 6) [70]. Five workers
were on sick leave and could not be present for audiometry. In addition, 20 workers who
initially consented to participate in the study changed jobs and could not be located during the
audiometry testing. Among the controls, three workers were not accessible; one had retired;
three been transferred to other schools; one worker had incomplete audiometry because of an
electrical power cut, (electrical outage) and was not accessible for a new test, while two workers
declined to participate in audiometry. Before analysis, we excluded those who reported using
long-term medication (n = 4) because the participants did not have adequate knowledge of the
type of medication they used [50]. Thus, we were left with a total of 328 participants, i.e. 221
exposed and 107 control workers for the NIHL study (figure 11).
For the exposure study (Paper 1), workers in same job group/title, i.e. those doing similar tasks
in the same working area, were assumed to constitute similar exposure groups [127]. We had a
total of 13 job exposure groups according to their jobs, i.e. melters, moulders, billet shifters,
workers at billet weighing and workers at continuous casting machines (CCM) in the furnace
section; and tongs-men, pushers, firemen, cutters, workers at the cooling bed, workers at
roughing, rolling mill automated machine operators and shearers in the rolling mill section
(table 3). We aimed at randomly selecting 5-10 workers from each job group in each factory.
However, the number of workers in each job group and the number of job groups respectively
varied within the factory and between factories. Thus, we ended up with a total of 163 workers

54
from the four factories, i.e. 46 from factory A, 43 from factory B, 34 from factory C and 40
from factory D.
4.7 Interview questionnaire and checklists
For the KAP study (Paper III), we modified and used a validated, structured questionnaire from
a study of sawmill workers in Malaysia to collect information from participants through an
interview [120, 128]. Statements regarding legislation in Malaysia were modified into neutral
statements unrelated to any country law. The statement asking for hobbies was modified to omit
the word ‘scuba’, adding ‘listening to loud music for long time’ instead. The word ‘sawmill’
was omitted, and the word ‘deafness’ was translated into ‘hearing loss’. The English version of
the questionnaire was translated into Swahili and then back into English to check for logical
consistency and meaning. The modification was so done to suit the local context. In addition,
the questionnaire collected demographic characteristics of the participants, i.e. factory
identification, age in years, educational level (no formal education, primary education,
secondary and tertiary education), working section (furnace section, rolling mill section). The
complete questionnaire is provided in Annex IIa and Annex IIb.
Workers’ knowledge regarding NIHL was assessed using 18 statements, each with a score of
‘1’ for correct response and a maximum score of 18 points, equivalent to 100%. The 18
statements in the knowledge domain were for collection of information on the causes,
symptoms, treatment and prevention of NIHL.
Workers’ attitudes to the importance of noise reduction at the workplace, NIHL, audiometry
and wearing of hearing protection devices were assessed by 13 statements, using a five-point
scale ranging from ‘strongly disagree’, ‘disagree’ and ‘neither disagree or agree’ to ‘agree’ and
‘strongly agree’, each with a corresponding score of between one and five. The maximum score
was 65 points, equivalent to 100%.
Workers’ practice regarding provision and use of hearing protection devices, health and safety
training and audiometry were assessed using 12 statements with the three possible responses
‘always’, ‘sometimes’ and ‘never’, and with scores of 3, 2 and 1 respectively. The maximum
score was 36 points, equivalent to 100%.
For Paper II, we also collected information on confounding factors for hearing loss that were
necessary to control for during analysis [49]. These were duration of work, history of noise

55
exposure, current smoking, current use of long-term medication, exposure to organic solvents,
ear infections as a child or adult, injury/trauma, tinnitus, known congenital hearing loss, relative
with hearing loss, history of ear-related medical condition and the use of hearing protection
devices while working in noisy areas. The questionnaire used in the interview is found in Annex
IIa and Annex IIb.
We used two separate checklists. The first was for the Walk-through survey in all factories
(Paper I-Annex IIIa). We collected information about factory background including listed
numbers of workers per each section, occupation noise-producing machinery and tools,
available job groups, tasks, production capacity, shifts and shift pattern, presence of HCP and
related training, availability of safety and health policy. In addition, we observed the availability
and use of hearing protection devices during work. A second checklist was for screening
workers on the audiometric day (Paper II- Annex IIIb). We asked and checked workers for
symptoms of upper respiratory infections and ear discharge [129-131]. In addition, we recorded
the time (in hours) and date they left work to check whether it complies with the requirement
for audiometric screening protocol where a minimum of 12 hours out of the noisy environment
was required.
4.8 Personal noise measurement
We conducted full-shift personal noise measurements using personal noise dosimeter (Brüel and
Kjaer type 4448) according to ISO 9612:2009. The dosimeters had A-weighted noise level (Lp,A)
and a measurement range from 50-140 dB. A 3-dB exchange rate was used, and the dosimeters
logged noise data each minute. The instruments were calibrated before and after the sampling
period, and no shifts in baseline were detected. The dosimeters were attached to workers’
shoulders approximately 10–15 cm from the ear. Workers were instructed to handle the
dosimeters carefully while working, not to touch or shout into the microphone and to report any
mishap with the instrument during the measurement period. During the sampling period, we
checked two to five times to verify that the dosimeters were working properly. We instructed
workers not to tamper with devices during resting periods. We recorded tasks performed by
each worker on a sampling sheet including information on noise sources. The workers
confirmed this information during lunch and at the end of the sampling period. The values
recorded from the dosimeters were the start- and end-time of the sampling period, the A-
weighted equivalent noise level for the duration of the measurement (Lp,A,eqT) and the C-
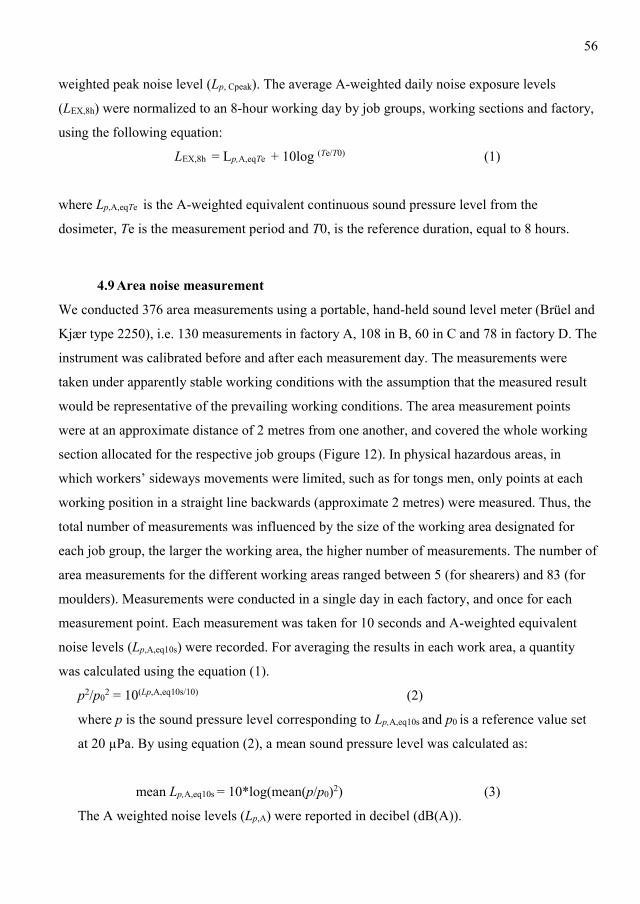
56
weighted peak noise level (Lp, Cpeak). The average A-weighted daily noise exposure levels
(LEX,8h) were normalized to an 8-hour working day by job groups, working sections and factory,
using the following equation:
LEX,8h = Lp,A,eqTe + 10log (Te/T0) (1)
where Lp,A,eqTe is the A-weighted equivalent continuous sound pressure level from the
dosimeter, Te is the measurement period and T0, is the reference duration, equal to 8 hours.
4.9 Area noise measurement
We conducted 376 area measurements using a portable, hand-held sound level meter (Brüel and
Kjær type 2250), i.e. 130 measurements in factory A, 108 in B, 60 in C and 78 in factory D. The
instrument was calibrated before and after each measurement day. The measurements were
taken under apparently stable working conditions with the assumption that the measured result
would be representative of the prevailing working conditions. The area measurement points
were at an approximate distance of 2 metres from one another, and covered the whole working
section allocated for the respective job groups (Figure 12). In physical hazardous areas, in
which workers’ sideways movements were limited, such as for tongs men, only points at each
working position in a straight line backwards (approximate 2 metres) were measured. Thus, the
total number of measurements was influenced by the size of the working area designated for
each job group, the larger the working area, the higher number of measurements. The number of
area measurements for the different working areas ranged between 5 (for shearers) and 83 (for
moulders). Measurements were conducted in a single day in each factory, and once for each
measurement point. Each measurement was taken for 10 seconds and A-weighted equivalent
noise levels (Lp,A,eq10s) were recorded. For averaging the results in each work area, a quantity
was calculated using the equation (1).
p2/p02 = 10(Lp,A,eq10s/10)
(2)
where p is the sound pressure level corresponding to Lp,A,eq10s and p0 is a reference value set
at 20 µPa. By using equation (2), a mean sound pressure level was calculated as:
mean Lp,A,eq10s = 10*log(mean(p/p0)2) (3)
The A weighted noise levels (Lp,A) were reported in decibel (dB(A)).

57
4.10 Pure tone audiometry
We conducted pure tone audiometry (PTA) in an ear-screening locally-constructed booth in a
quiet room at the headquarters of the OSHA in Tanzania. We used an Interacoustics AD226
(Interacoustics, DK-5500 Middelfart, Denmark) with Amplivox Audiocup earphones having
lower test limit of −10 dB. The equipment was pre-calibrated. Test frequencies were 250–8000
Hz in the order starting with 1000, 2000, 3000, 4000, 6000, 8000, 500, 250 and finish at 1000
Hz [70]. A manual test procedure was used in compliance with ISO 8253-1:2010 [70, 129, 130].
The same technical personnel conducted all audiometric tests using a standardized protocol.
Background noise in the test booth was monitored by a calibrated hand-held Sound Level Meter
(Brüel and Kjær, type 2250), and checked for conformity with ISO 8253-1:2010 standard [70].
For best results, audiometry was conducted in the morning before any work exposure.
Figure 12: Illustration of area measurements performed using Sound Level Meter (in dB(A)) in
factory A in the furnace section in a study among iron and steel factory workers in Tanzania

58
4.11 Statistical analysis
Descriptive statistics were presented as means and standard deviation for continuous variables
and frequencies or percentages for categorical variables (Papers I-III). All statistical analyses
are summarized in Table 4.
In Paper I, we computed Lp,A for both area and personal measurements using Microsoft Excel
Sheets. The difference between area and personal noise exposure was analysed using linear
mixed effects model to account for repeated measurements within job groups and factories.
Factory and job group were entered as random factors and sample type (personal/area) as fixed
effects.
In preparatory analyses for noise exposure modelling for identification of determinants for noise
exposure, potential, dichotomous noise determinants were dichotomized. The first group
comprised factory-related determinants, i.e. size of the cutting machines (large/small); presence
of roughing machine (yes/no); separated shearing machines (yes/no); steel billet weight (20-
30kgs/100-120kgs); furnace installation (above ground floor/below ground floor); production
capacity (5,400-15,400/80,000 tonnes per year) and rolling mill plant operation technology
(traditional, manual/modern, automated). The second group comprised task-related
determinants, i.e. manual handing of raw materials/billets/crowbars (yes/no); feeding the
furnace oven (yes/no); pouring molten steel into molds (yes/no); billet weighing/transfer
(yes/no); feeding re heating furnace (yes/no); feeding roughing machine (yes/no); work at
rolling machines (yes/no); and steel bar cooling/cutting (yes/no). Independent sample t- test was
used to analyse differences in noise exposure within each of these determinants. Linear mixed
effects models were used to identify significant explanatory variables/determinants for noise
exposure in the furnace and in the rolling mill sections, respectively. Personal noise exposure
(LEX,8h) was entered as a dependent variable. Worker identification and factory were entered as
random effects. Significant determinants (p< 0.05) from the initial t- test analysis (rolling mill
plant technology, production capacity, furnace installation, steel billet weight, separated
shearing machine, size of the cutting machine, manual handing of raw materials/
billets/crowbars, pouring molten steel into molds, billet weighing/transfer and feeding re
heating furnace) were entered as fixed effects in two steps, starting with process-related and
then task-related determinants. In addition, intercorrelation between determinants was tested
using the Spearman correlation test. When two or more determinants correlated, we chose the
determinant that contributed to the highest percentage of explained variability in noise level.

59
In Paper II, we defined NIHL as the hearing threshold level ≥25 dB hearing level in either ear at
3000, 4000 or 6000 Hz [43]. Potential determinants of hearing loss were identified. Age was
categorized into three age groups (tertiles) based on the age distribution among the controls.
Duration of work was categorized arbitrarily into three groups (≤2 years, 2–10 years, 11–37
years). History of ear-related medical conditions (diabetes, hypertension, ear infections and
head injury) were combined as a dichotomized variable (yes/no), current smoking (yes/no),
relatives with hearing impairment (yes/no), tinnitus (yes/no) and previous noisy work (yes/no).
A chi-square test was used to explore the relationship between these variables and hearing loss
in exposed participants compared with controls. The intercorrelation between participant’s age
and duration of work determinants was tested with the Pearson correlation test.
We used log binomial regression models with a 95% confidence interval (CI) to ascertain
differences in hearing loss (yes/no) between exposed and controls within each age strata and
within the total group of workers while adjusting for the significant determinants selected from
Chi-square analyses and the correlation test.
We computed the mean hearing threshold for the different test frequencies for both exposed
participants and controls, as well as for the three age groups within the main exposure groups.
For each test frequency, multiple linear regression was used to analyse for differences between
exposed and controls, while adjusting for age as a continuous variable, previous noisy work and
history of ear-related medical condition.
We calculated the predicted noise-induced permanent threshold shift (NIPTS) corresponding to
these three mean exposure durations according to ISO 1999 section 6.3, that provides a formula
and method that predicts NIPTS at 1000, 2000, 3000, 4000 and 6000 Hz as a function of the
logarithm of exposure duration (d) (in years), and the square of noise exposure level (LAeq8h),
with frequency specific constants u, v, and L0 (a sound pressure level, defined as a function of a
given constant value for each frequency in decibels [71]:
NIPTS = [u + vlog10 (d)] ( LAeq8h - l0) 2 (4)
In Paper III, we computed the sum scores for the KAP domains, converted into percentages of
the total score and then dichotomized, with knowledge and attitude scores of ≥ 75% being defined
as good knowledge and positive attitude respectively [120] whilst the practice score of ≥ 50%
was defined as good practice.

60
In the sum scores for KAP, we explored the differences between age and duration of work using
one-way Analysis of Variance (ANOVA), whilst an independent samples t-test was used to
analyse the association between sum score for the KAP and the continuous variables. Chi-squared
test was used to analyse the association between dichotomized KAP domains and categorical
variables. In addition, multiple linear regression was used to explore the relationship between
attitude and practice scores, respectively and the significant variables from the preliminary
analyses, i.e. educational level and the factory. In this analysis, three dummy variables were used
for factory B, factory C and factory D. Factory A was used as reference. We evaluated the internal
consistency in distinct items in each domain of knowledge, attitude and practice using Cronbach’s
Alpha coefficient (α), and the results were α= 0.74, 0.70 and 0.72 respectively.
In all statistical analyses, we used IBM SPSS Statistics, Version 24 & 25 (Allen & Unwin, 83
Alexander Street, Crown Nest NSW, Australia) and set a parameter of p < 0.05 as statistical
significance. For Paper II, NIPTS was estimated using Microsoft Excel (Office 365, Microsoft
Corporation, Redmond, WA 98052-7329, USA).
Table 4. Summary of statistical methods used
Statistical method Paper I Paper II Paper III
Chi-square test √ √
Independent sample t-test √ √ √
One-way ANOVA √ √
Pearson’s correlation test √
Spearman correlation test √
Log binomial regression √
Multiple linear regression √ √
Linear mixed effects model √
Cronbach’s Alpha coefficient √
Microsoft Excel √ √

61
4.12 Ethical clearance
We conducted the study in accordance with the Helsinki Declaration of 1975 and its
subsequent revisions. We obtained ethical clearance from The Regional Committee of
Medical and Health Research Ethics (REK-VEST) in Norway number 2016/635/REK sør-
øst dated 20 May 2016; and The Muhimbili University of Health and Allied Sciences
(MUHAS) Ethics Committee in Tanzania with Institutional Review Board (IRB) number
2016-06-24/AEC/Vol. XI/38 dated 24 June 2016. Each iron and steel factory (Papers I‒III)
and primary school administration (Paper II) was contacted individually, and all of them
granted permission to conduct the study. Each individual participant was contacted and
informed about the research objectives and activities to be conducted; all participants gave
written consent prior to inclusion in the study. The information collected was treated as
confidential. Workers with severe or profound hearing loss (defined as hearing threshold
>60dB) were referred to a specialist for further examinations.

62
5.0 Results
5.1 Summary results in Paper I: Variability and determinants of occupational noise
exposure
A total of 163 workers participated in this study with repeated personal noise measurement. The
average personal noise exposure (LEX,8h) was 92.0 dB (A) (n=326). The mean measurement time
was 7.3 (SD=0.9) hours. About 90% of all measurements were above the OEL of 85 dB(A).
There was a significant difference in average noise exposure among the four factories (p<0.01).
Factory B had the highest equivalent noise exposure followed by factory C, while factory D had
the lowest noise exposure Personal exposure was significantly higher in the rolling mill section
(93.0 dB(A)) than in the furnace section (89.7 dB(A)). There was a significant difference at the
p < 0.05 level in noise exposure among the 13 job groups (p<0.001). Thirty-three percent (n=
108) of the personal measurements had Lp, Cpeak exceeding 135 dB(C) of which factory A had
the highest fraction (41%) while factory C had the lowest fraction (28%).
The average area noise level was 90.5 dB(A). Factory B had the highest average noise level
while factory D had the lowest level. The personal noise exposure was significantly higher (2.6
dB (A); 95 CI = 2.1- 3.1) compared to the corresponding area measurements.
In the linear mixed effects models for noise exposure in the furnace, the three variables: furnace
installation, billet weighing/transfer and manual handing or raw materials/ billets/crowbars were
significant determinants and explained 40% of the total variance in noise exposure. Furnace
installation below the ground floor was associated with a 2.3 dB(A) reduction in noise exposure
whereas manual handling and billet weighing/transfer increased noise exposure by 2.2 dB(A)
and 2.1dB(A), respectively. In the rolling mill section, the size of the cutting machine, the steel
billet weight and feeding the reheating furnace were significant determinants and explained
46% of the total variance in noise exposure. Large cutting machines were associated with an
increase of 1.8 dB(A) in noise exposure. Additionally, the large steel billet weight (100–120
kgs) was associated with a 3.6 dB(A) increase and feeding the reheating furnace with 1.9 dB(A)
decrease in noise exposure.
5.2 Summary results in Paper II: Prevalence of NIHL
The participation rate was 87% for both the exposed [N=221] and controls [N=107]. The mean
age was 32 (SD=8) years and 40 (SD=7) years respectively for the exposed and the control
groups. The exposed group had a mean duration of work of 5 years (range: 0-24 years). The

63
overall prevalence of hearing loss was significantly higher (Chi square test, p = 0.003) among
exposed workers (48%, n=221) than among the controls (31%, n=107).
Results from the log binomial regression model, adjusted for age, previous noisy work and
history of ear-related medical condition, showed a statistically higher risk of hearing loss among
exposed workers compared to controls, with a prevalence ratio of 1.3 (95% Confidence Interval:
1.10-1.62). The mean hearing threshold between exposed and control workers at 3000, 4000
and 6000 Hz differed significantly (independent samples t-test, p < 0.05). In linear regression
analyses within each age stratum, there were significant differences in hearing threshold
between exposed and controls for the frequencies 4000 and 6000 Hz within the youngest age
group (18–35 years) adjusting for age as a continuous variable, previous noisy work and history
of ear-related medical condition. In analogous analyses, the hearing threshold for the
frequencies 3000, 4000 and 6000 Hz were significantly different in the 36–43 years age group,
and in the age group 44–59 years, only the frequency 6000 Hz was significantly different.
When comparing the hearing threshold with the predictions from ISO 1999, the mean hearing
threshold among the exposed participants in the 18–35 age group was similar to the predicted
NIPTS according to ISO 1999 at the lower frequencies (1000, 2000 and 3000 Hz), while it was
about 1 dB higher than ISO 1999 for the higher frequencies (4000 and 6000 Hz). For the 36–44
and 45–59 age groups, the hearing threshold for the higher frequencies were lower (3, 1 dB and
6, 4dB lower, respectively) for same frequencies than the predicted NIPTS in ISO 1999.
5.3 Summary results in Paper III: KAP study
The participation was 100% [n=253]. Sixty-seven percent had received primary education. The
mean scores for attitude and practice differed significantly between the four factories (one-way
ANOVA, p<0.001). Factory A had a significantly lower mean attitude score than the other three
factories, whilst there was no significant difference between those other three factories. The
mean practice score for Factory D was significantly lower than for the other three factories (A,
B and C), whilst there was no significant difference in mean practice scores between those three
factories. The mean knowledge scores did not differ between any of the four factories (one-way
ANOVA, p> 0.05).
Overall, the mean score for knowledge did not differ significantly between the subgroups for
age, duration of work and educational level. There was a significant difference in attitude scores

64
between participants who had received primary education and those who had received
secondary and tertiary education (independent samples t-test, p=0.01). The participants who had
received primary education had a significantly more positive attitude than those who had
received secondary and tertiary education (chi-square test, p<0.05). In the practice domain,
participants who had received primary education had significantly lower scores than their
counterparts (independent samples t-test, p=0.03). The overall mean scores for practice was
low.
A high proportion of the participants had a poor overall knowledge of the specific causes of
NIHL. For example, only 16% responded correctly to the statement ‘HL may occur due to high-
impact noise exposure, e.g. gunfire, and 45% to the statement ‘HL may occur if an individual is
continuously exposed to a noisy environment’. Regarding NIHL symptoms, 88% responded
correctly to the statement ‘Poor hearing of normal speech is a sign of HL’ and 79% to the
statement ‘Ringing in the ear is the sign of HL’. Nevertheless, only 33% responded correctly to
the statement ‘HL due to noise exposure is permanent’, 21% to the statement ‘HL due to noise
exposure cannot be treated by using medicines’ and only 14% to the statement ‘Stopping
working in high noise level results into complete recovery when you have acquired HL’.
Regarding prevention, 87% responded correctly to the statement ‘Wearing earplugs/earmuffs
prevents HL’, 43% to the statement ‘Encapsulating the noisy machines reduces noise exposure’,
38% to the statement ‘Reducing hours of working in a noisy section prevents HL’ and 53% to
the statement ‘Laws exist to protect workers from being exposed to high noise at work’.
Overall 76% of the participants had a positive attitude to the importance of noise reduction in
the workplace, NIHL, audiometry and wearing of hearing protection devices. About 94% of the
participants displayed poor practice regarding provision and use of hearing protection devices,
health and safety training and audiometry. Most of the participants responded ‘Never’ to most
of the statements. For example, 82% responded ‘Never’ to the statement ‘availability of posters
in sections required to wear earplugs/muffs’, 95% to the statement ‘Workers attend organized
training sessions on using hearing protection devices in the workplace’ and 91% to the
statement ‘Workers undergo ear-screening test (audiometry) annually’. In addition, 86% of the
participants responded ‘Never’ to ‘Workers provided with hearing protection devices at work’,
and a similar percentage responded likewise to ‘Workers wear hearing protection devices when
working in a noisy environment’.

65
6.0 Discussions
6.1 Main Discussion
We found a higher prevalence of NIHL among workers in iron and steel factories compared to
the controls. The workers were exposed to a sound level above the recommended occupational
exposure limit values, and they did not use HPDs. This suggests a relationship between the
occupational noise exposure and NIHL among iron and steel workers. However, due to the
epidemiological design of the study, the causal relationship cannot be confirmed.
The average duration of work for workers in the iron and steel factories was 5 years (range 0-
24 years). This average work duration is within the first 10 years-period in which the risk of
hearing damage is estimated to be high when the ear is exposed to high noise levels [16, 49, 71].
Although many workers in our study have not worked as much as 10 years. In addition, about
20% of workers had previously worked in noisy jobs and they might have been sufficiently
exposed to high sound levels over time which would have increased their risk of NIHL.
However, we have no information of the sound levels these workers were previously exposed
to.
It has been established in previous literature that occupational noise exposure above 85dB (A) is
associated with an increased risk of NIHL among exposed workers and the effect is evident at
frequencies of 3,4 and 6 kHz [16, 42, 73, 132, 133]. Below this level, the risk of hearing
damage is estimated to be insignificant [134]. In addition, it is estimated that between 22% and
38% of workers exposed to occupational noise of 90 dB(A) and 95dB(A) respectively are likely
to develop NIHL with 10 years of exposure or more [6]. In our case, 17% of workers had more
than 10 years of exposure and this may partly explain the high prevalence of NIHL in this
group. The OEL of 85 dB(A) is used by many countries is the world, and it is considered as a
health-based limit, i.e. a maximum sound level that is set to protect workers from hearing
damage, although some people may develop NIHL at lower sound levels due to different
biological susceptibilities among individuals [42]. Nevertheless, some other countries use
different exposure limits, for example India and US-OSHA use 90 dB(A), thus reflecting that
decisions of occupational noise exposure limits often do not only consider health aspects, but
also technical feasibility in the workplaces, ethical, political and socio-economic status [77,
135].
Age is one of the main factors for the hearing loss. To adjust for age can be difficult in
statistical analyses. In this study, we stratified the working population into three age groups and

66
found a borderline increased risk of hearing loss among the younger age group (18–35 years),
and significant differences between exposed and controls in hearing thresholds for the
frequencies of 4000 and 6000Hz. The significant difference in the dip for the 4000 and 6000 Hz
frequencies is a sign indicating hearing loss due to noise exposure in this age stratum [94, 96,
136, 137]. Similar findings have been shown among gold miners in South Africa, where the
greatest difference in hearing threshold between age strata was found among the younger age
group (16–40 years) at the noise dip of 4000 Hz [47].
In this study we found higher estimates of NIPTS than predicted by ISO 1999 standard for the
age group 18–35 years at frequencies of 4000 and 6000 Hz. This supports our findings when we
used the control group for comparison. The pattern of NIPTS among our participants was
similar to that of ISO 1999. The results suggest the likelihood of NIHL because of the
significant effect observed in higher frequencies which are related to the noise exposure [40].
However, the characteristics of noise, size of ear canal and other factors determine the location
of notch for the higher frequencies (from 3000-6000 Hz) [41]; the notch at these frequencies,
and especially at 4000 Hz, is an established clinical sign and may be valuable in confirming the
diagnosis of NIHL [40, 42]. In addition, our NIPTS estimates, though generally lower than
those predicted by ISO 1999, show similar patterns, especially at higher frequencies. This result
differs from a study conducted in the USA that reported estimates more in agreements with ISO
1999 [43]. The lower results and estimates from our study may be explained partly by
differences in the reference population characteristics. The ISO 1999 standard was prepared
based on populations from developed and industrialized countries such as the USA and with
more continuous noise [30], making it difficult to compare with the results of our study since
we encountered a mix of noise characteristics.
Other studies among iron and steel workers also have found an increased prevalence of hearing
loss due to high occupational noise (Table 2). For example, a study conducted among Indian
iron and steel workers exposed to noise level above 90 dB(A) found that over 90% of the
workers engaged in casting and forging had hearing loss in the higher frequencies, i.e. 4000 and
6000 Hz [97]. This is probably caused by tasks and tools that emit high noise level during the
steel production process. In addition, noise characteristics and the increased level of factory
mechanization may increase the risk of NIHL. A study done in Nigeria also found a higher
prevalence in the worse ear (57%) among steel mill workers exposed to 75–93 dB (A), with a
pure tone average hearing loss of 30 dB, 31 dB and 32 dB for the finishing, mill floor and

67
mechanical departments respectively, as compared to a pure tone average of 21 dB among
administrative workers with lower noise exposure (49 dB (A)) [96]. In Nepal, the prevalence
among workers in a steel factory was comparable to our study, i.e., 40% and 46% for the right
and left ear, respectively. However, the Nepalese study excluded workers over 45 years and
information on factory characteristics were not available [138]. Another study done in Nepal
among 115 small-scale metal industry workers and 123 controls found a lower prevalence for
the exposed (30%) and only 4% for the controls [102]. The difference in prevalence between the
Nepal study and our study may be partly due to the definition used for hearing loss (Table 2). In
addition, the workers in Nepal used ear protection during work [4, 102]. Nevertheless, the high
prevalence presented in these studies suggests that noise exposure contributes substantially to
hearing loss [53].
The measured hearing loss in our control group was lower than that reported among the controls
in South African miners study for the higher test frequencies, i.e. 31% versus 46% respectively
[48]. The control group in the South African study was the administration group of the same
workplaces, and the control group was not screened for previous noise exposure as we did in
our study. The participants in our control group were screened for several factors responsible
for hearing loss and were thus expected to have low prevalence. Yet, the prevalence of hearing
loss in our control was far higher than the one reported in a community study in Uganda, i.e.
the prevalence of hearing loss of 12% [51]. This indicates that there might be factors other than
noise that may have contributed to the hearing loss in the South African study. Furthermore, the
Ugandan study was conducted in a rural district which is likely to have less noise than urban
areas. In Tanzania, there are no published data on community hearing profile among adult.
Community studies conducted in other African countries such as Nigeria and Egypt found a
lower prevalence of hearing loss (defined as hearing threshold >25dB) than we found, i.e. 18%
and 16% respectively [139]. However, in these community studies, there is no information on
noise exposure profile among the participants, and this makes it difficult to compare with the
control group in our study. Based on the selection of examined workers, our control group can
be used in the present study.
Several studies from Africa (Nigeria; 72-93dB(A)) and Asia [China; 85-95dB(A), India; 60-
105dB(A), UAE; 70-96dB(A), Iran; ≥85dB(A), and Saudi Arabia; 90.5-95.0dB(A)] have
reported comparable high noise levels in iron and steel factories (Table 2). This shows that the

68
working environment in iron and steel factories involves high noise levels that may increase the
risk of NIHL. The moulders, one of the job groups, in the Indian study [101], had a higher noise
exposure (91 dB(A)) than we found for this job group, i.e. 88 dB(A). The differences in the
results may be partly explained by differences in tasks, processes, machines, tools and
production technology. Furthermore, the methods and devices used in these studies might have
contributed to differences in the recorded noise levels.
In our study, we identified six potential noise exposure determinants, three in each section, i.e.
in the furnace and rolling mill section respectively. These determinants were further categorized
into task-related determinants (those based on specific job/activity or task assigned to workers)
and factory-related determinants (those based on factory layout and or design). Two of the three
determinants in the furnace section were task-related, i.e. manual handing of raw materials/
billets/crowbars and billet weighing/transfer and they increased noise exposure by about 2
dB(A)’s each. This was presumably caused by colliding objects in motion, tools and metals
when offloading raw materials from vehicles, sorting raw materials/metal scraps, transfer and
feeding into the furnace, as well as collisions during manual weighing of steel billets. The
factory-related determinant, i.e. furnace installation below the ground floor, reduced the noise
exposure by 2 dB(A) probably by reducing the direct sound transmission form the furnace to the
workers, suggesting the importance of encompassing noise control considerations in
engineering design. In addition, two determinants in the rolling mill section, i.e. the use of large
billet weight (100 – 120kgs) and a large cutting machine increased noise by 3 dB(A) and almost
2 dB(A), respectively. This may be due to the heavy weight of the steel billet that might result
into high impacts with various machines while in motion during the steel bar production
process. In this section, feeding of the re-heating furnace was the only task-related determinant
that was observed to reduce noise by 2 dB(A), presumably since this working area is located at
the far end of the rolling mill section and is thus less impacted by high noise level from the rest
of working areas where noise is emitted by machines and operations. Several other studies in
other types of industries have used this approach to identify exposure determinants [140, 141].
Descriptions of such exposure determinants and their contributions to the recorded noise levels
provide a basis for planning and implementation of appropriate noise control measures; for
example, training workers encouraged to handle metal objects and tools more gently may
reduce the noise levels associated with tasks such as weighing of billets and loading the pusher

69
machines. Also, reducing dropping height and/or installation of vibration-absorbent material on
surfaces may reduce noise emission from colliding surfaces.
Most workers had a poor knowledge of NIHL. Furthermore, they also had poor practice
regarding the use of HPDs, which might not be surprising since the majority of the workers
reported non-availability of these devices at their workplaces. Nevertheless, the majority had a
positive attitude regarding the importance of noise reduction in the workplace, prevention of
NIHL, audiometry and use of HPDs. Low knowledge and poor practice concerning
occupational noise and NIHL might be related to the increased prevalence of NIHL. The non-
availability of HPDs in the workplace may be due to weak implementation of legislation and
follow-ups from governing institutions. A study of Malaysian quarry workers found a similar
trend, i.e. a high prevalence of NIHL (57%), with a low level of knowledge (11%) and practice
(16%) among workers [119]. In contrast to this, two studies done in Nigeria among steel-mill
and textile dye workers respectively found a good level of knowledge of 93% and 74% [121,
142], but a high prevalence of NIHL (57%) [96], indicating that a good level of knowledge may
not be sufficient to prevent NIHL, and that the relationship between knowledge and NIHL is not
likely to be linear. This might be an interplay of multiple other factors. On the other hand,
several studies in Nigeria and Malaysia reported poor practice [119-121, 142]. Although
information regarding provision of HPDs for workers in these studies varied, it is likely that
non-provision of HPDs by employers at the workplaces was the reason for a low level of
utilization of the protective measures, or even non-utilization. Thus, provision of HPDs with
education and fit-training in workplaces where workers are exposed to harmful noise is
important.
Our findings indicate that the majority of our study participants had a positive attitude towards
the importance of noise reduction at the workplace, NIHL, audiometry and wearing of hearing
protection devices. Our finding is in line with two studies of Malaysian sawmill and quarry
workers, whose attitude scores were 61% and 70% respectively [119, 120] The positive attitude
of our study participants may be regarded as an intention to change their behaviour [143] and is
probably a good sign for future preventive work.

70
6.2 Methodological discussion
6.2.1 Study design
Our study consisted of an exposure study and an epidemiological study with cross-sectional
design where exposure (occupational noise) and outcome (NIHL) were measured in the same
period. This study design reduces the possibility of drawing conclusions regarding the existence
of a causal association between occupational noise exposure and the prevalence of NIHL [144,
145]. A longitudinal study design would be an alternative with noise measurements/assessments
for a longer period and studies of hearing loss at baseline and follow-up. However, longitudinal
study designs are costly and require longer follow-up time [146, 147]. Most longitudinal studies
on the incidence of NIHL have been done in other regions (mostly the USA and Europe) and
only a few in African countries. Limited studies in Africa raises a question about the external
validity of the previous studies, as development of hearing loss is partly influenced by
biological susceptibility to noise, inner ear melanin and cochlear melanocytes [47, 148].
Theoretically, it would be of interest to perform longitudinal studies of NIHL in the factories of
the present study. However, with the present knowledge about high occupational noise exposure
found in these iron and steel factories, it is very likely that workers are at high risk of
developing NIHL, and hence it would be unethical to opt for longitudinal studies. Intervention
studies would be a better choice. The knowledge gained in the present study which include
documentation of the high occupational noise exposure levels and related determinants in iron
and steel factories, the high prevalence of NIHL among noise exposed workers and low level of
knowledge, poor practice with positive attitude measured in workers, may provide sufficient
information for some policy and decision-making regarding noise control interventions in these
workplaces.
6.2.2 Study population
Our study participants were randomly selected from a list of the workers provided by their
respective management. All workers had equal chances of being selected for the study. We used
a table of random numbers to obtain the previously estimated sample size. In so doing, we were
able to minimize the possibility of selection bias. Thus, we have no reason to doubt the
representativeness of our sample of iron and steel workers. In addition, for Papers I and II, the
response rate was 100% and 87% respectively. In the prevalence of NIHL study (Paper II), it
was necessary to exclude some participants (32 from the exposed and 16 from the control

71
groups), based on exclusion criteria; those who reported having congenital hearing loss, a
history of otitis media during childhood, having worked in noisy jobs only among the controls,
and those who reported using long-term medication because the participants did not have
adequate knowledge about the type of medication they used. This was done to reduce the
potential of contamination (bias) in the outcomes estimates, i.e. the prevalence of NIHL [149].
For the exposure study, workers in the same job group performing similar tasks, processes and
using the same tools in the same area were assumed to constitute similar exposure profiles
[127]. Consequently, the workers were categorized into a total of 13 exposure groups according
to their job (Table 3). Rappaport and Kupper suggested 10–20 measurements in each exposure
group, i.e. repeated measurements of 5–10 workers [150, 151]. Thus, we aimed at randomly
selecting 5–10 workers from each job group in each factory. However, not all job groups were
available in each factory, and when they were available, the total number of workers per job
group varied from 2 to 35. All workers were selected if the job group comprised five or fewer
workers. This might have resulted in imprecise estimates of the mean occupational noise
exposure among those job-groups with a lesser number of workers compared to the ones with a
larger number of workers. More repeated personal measurements on different days would
probably provide more precise estimates of occupational noise exposure and a better
understanding of the patterns (day-to-day), characteristics and determinants for occupational
noise exposure. Furthermore, the grouping scheme used in an exposure study was the a priori
grouping (using existing job groups, tasks and sections). For example, the mean personal noise
exposure for cutters/bundlers job-group was 96dB(A) with wide standard deviation of 5dB(A)
suggesting existence of variability in noise exposure even within same job group. However, the
a priori grouping scheme and related exposure data was not used in epidemiological study on
the prevalence of NIHL where a posteriori grouping scheme (re-grouping based on measured
noise exposure levels) would probably have yielded higher contrast in noise exposure.
The control group for the prevalence of NIHL study comprised the public primary school
teachers. We assumed from the published studies that this job group is exposed to a low level of
occupational noise [49, 152-154]. The 8-hour equivalent noise exposure among these controls at
work was 79.7 dB(A). Hence, one would expect an overall lesser prevalence of hearing loss
among this group [134]. However, the prevalence of hearing loss in this group (31 %) was
higher compared to the prevalence population survey in Uganda (12%) [51] that we previously

72
used for sample size calculation. This suggests that there are likely other contributing factors for
this high prevalence, and these warrant more investigation. Using another control group such as
data from a population survey might have been an alternative, but such population studies and
community baseline data do not exist in Tanzania. Nevertheless, the availability of the control
group strengthened our study.
Bias (selection bias and information bias) is explained as any systematic error in the design,
conduct, or analysis of a study and may highly affect the study validity. We collected part of the
study information using an interview-based questionnaire. Questionnaires are prone to recall
and social desirability bias [155]. The contents of the KAP study did not demand much
memory, as the information collected was basically from daily work, although some events and
tasks such as the provision and the use of HPDs might be better recalled than others, for
example, audiometry [155]. To minimize this, the tool we used was validated, and the items
used in the KAP domains had high internal consistence assessed by estimating Cronbach’s
alpha coefficient (α), resulting in α= 0.74, 0.70 and 0.72 for knowledge, attitude and practice
domains respectively. [155]. Hence, the study results are presumed to be valid.
The interview of all the participants was conducted privately by the same research personnel
who is a Tanzanian and knew the language and culture. Also, the research personnel had prior
training, and the objective of the study was clearly explained to each participant [156]. This
provided an opportunity for reliable responses. The interviews were performed at the
workplace, and the research team was available in the factories during data collection. This was
probably beneficial for obtaining correct information from participants since they could have
tried to hide problems due to fear that the information would leak to the employer. However, we
are not certain of this and have no reason to suspect such thoughts on the part of the
participants.
Despite the mentioned potential bias issues, we believe that this study had good internal validity
and that the results are reliable.
The four studied iron and steel factories in Tanzania had similarities in characteristics of study
participants, re-bar production process, plant technology, job groups, sections and tasks, with
some differences. Factory owners (companies) reported having iron and steel factories in other
regions of the country and some other sub-Saharan Africa countries with similar structure,
characteristics and production technologies. These other iron and steel factories are also likely

73
to have high occupational noise levels, as we measured in our study. Without any intervention,
workers are at increased risk of acquiring NIHL over time. This suggests that our study results
for occupational noise exposure (Paper I) and the prevalence of NIHL (Paper II) may be
representative for the other iron and steel factories in Tanzania and other countries with similar
characteristics and production technology, i.e. the study has this type of external validity.
However, generalization of the KAP study results must be done with caution because studies
use different design methods and scoring or grading criteria, i.e. cut-off points for good and
poor scores [112, 117-120].
6.2.3 Noise exposure assessment
In this study, we used two calibrated devices to measure occupational noise exposure, i.e. a
hand-held sound level meter (SML) for area measurements and a portable noise dosimeter for
personal measurements. Area measurements using the sound level meter have been widely used
to indicate workers’ noise exposure in regions of limited economic resources including African
and Asian countries (Table 2). Some reasons for this may be that the use of SLM is relatively
inexpensive; it is easy to conduct, and it takes less time than personal measurements. However,
we must acknowledge not only the strength and applicability but also the weaknesses of these
instruments [30]. The mean personal noise measurement was higher compared to the area
measurements, i.e. 92.0 vs. 90.5 dB(A). One explanation might be that the area noise level
corresponding to the work area for a job group was based on the unweighted mean of several
points of measurements, while the worker within the job group could have spent more time in
subareas with higher noise levels than the estimated mean area noise level. However, we did not
track the movements of the workers to confirm this. Other studies in different workplaces have
found an analogous difference between personal and area noise measurements, for example in
an iron and steel factory in India (130 vs. 105 dB(A)) [97], in Swedish pulp mills ((85.1 vs. 83.6
dB(A)) [107] and in a Norwegian Navy study (a difference of > 10 dB(A) among personnel
aboard frigates and Coast guard vessels) [19]. Thus, area measurements may underestimate the
actual noise exposure among workers, suggesting that a conservative approach should be taken
in using area measurements in risk assessment related to hearing loss.
The personal noise measurements were performed over several days, with repeated
measurements using high quality instruments following the ISO 9612:2009 standard, and this

74
must be considered a strength of this study. More detailed assessment of tasks performed might
have improved the noise exposure models by explaining parts of the within-worker variability.
On the other hand, the area noise measurement was done in only one day in each factory.
However, the area measurements were assumed to be performed during stable working
condition and should be representative for the work tasks done at the time. Our descriptions of
factory buildings, noise sources and the measured workers’ noise exposure are important inputs
in noise control measures [79].
Some of the variability in the individual measurement might be due to mechanical contact with
the microphone during work [19]. We were present in the factory during the sampling period
and we did not record any of this event. Although we cannot ignore the possibility of it having
occurred, its contribution should have a minimal impact on the overall results when taking into
account the generally high noise levels in the factories. Furthermore, the factory production rate
during noise measurements was stable and thus representative of normal working condition in
iron and steel factories.
6.2.4 Audiometry (Pure Tone Audiometry)
We used a factory pre-calibrated, gold standard manual PTA for all participants in the study
[129]. Measurements were conducted by trained personnel following the same test procedure and
protocol for all study participants. These measures minimized the occurrence of measurement
error. The participants were instructed to avoid areas with a high level of noise for a minimum of
12 hours prior to audiometric examinations to minimize the possibility of temporary threshold
shift (TTS) [6, 23, 129]. This means workers scheduled for examination left their workplace
earlier than normal. The duration since last occupational noise exposure (free noise exposure)
was recorded before the audiometric test was administered. Other studies used a varied minimum
time of 16 hours or more before audiometry for exclusion of possible contribution of TTS to
permanent threshold shift [157-160] however, the validity for these variations (minimum of 12,
16, 24 or more resting time after noise exposure) need more investigations for humans. Given the
occupational noise exposure variability in our study, more resting time probably would be an
alternative option but would have been practically difficult [159] as more working hours would
have had to be sacrificed while waiting for audiometry. Furthermore, although measurements
were done in a locally constructed booth within a quiet room, monitoring of background noise in
the booth using a calibrated portable hand-held SLM showed that all measurements were in

75
conformity with ISO 8253 standard. For best results, audiometry was conducted in the morning
before any work exposure. In addition, the city is less noisy in the morning compared to other
times of the day when the participants could potentially be exposed to a higher level of
environmental noise.
In many societies today, people listen to music at high volume levels, and this may affect their
hearing ability. We have limited information about leisure time exposure to noise among our
study participants, but we have no reason to believe that the workers in iron and steel factories
are more exposed to leisure time sound than are the control workers. In future studies, monitoring
of leisure time exposure should be performed.
6.2.5 Questionnaire
Deterioration of humans’ hearing ability might also be related to other risk factors apart from
exposure to noise and the age, which we have discussed above. Such factors are current
smoking, exposure to organic solvents, use of ototoxic medicines, vibration, genetics, head and
ear injury, ear infections and illnesses. These risk factors need to be controlled for when
analysing to ascertain the association between noise exposure and NIHL. In this study, we used
an interview-based questionnaire to collect information about these variables. We then used
statistical analyses to control for confounding effect. In addition, we used information collected
through a structured interview with both exposed participants and controls to exclude those with
congenital hearing loss (one participant), six with history of otitis media during childhood and
two among the controls who reported to have worked in a noisy job. In addition, we excluded
four participants who reported using long-term medication because the participants did not have
adequate knowledge of the type of medication they used. Through this process, one might not
ignore the effect of residual confounding [161, 162].
Language differences in questionnaire may have consequences, because concepts in one
language may be understood differently in another language. Hence, in research, language
translation involves interpretation [163]. In addition, during translation, the items must retain
the intended meaning and measurement properties of the source questionnaire while
accommodating the local culture and language. The English version of the validated
questionnaire was translated into Swahili and then back to English for logical consistency and
meaning, then shared among experts of the research team. The word ‘deafness’ was translated

76
into ‘hearing loss’ reflecting the contextual area for the research [164]. The final version was
used for pre-testing and training the research assistant who then administered the interview.
This ensured consistency and familiarity with each term used in the questionnaire. Furthermore,
to collect information for the KAP study, interview-based questionnaire was used as a preferred
tool over self-administered questionnaire [165, 166].
7.0 Conclusions
The findings in our study show that workers in the iron and steel factories were exposed to
noise levels above OEL of 85 dB (A) and that they did not use HPDs. This may increase the risk
of developing NIHL. In the furnace section, three determinants of noise exposure were
significant: furnace installation, billet weighing/transfer, and manual handling of raw
materials/billets/crowbars. In addition, three determinants (the size of the cutting machine, steel
billet weight and feeding re-heating furnace) were significant in the rolling mills section.
We also, found a higher prevalence of hearing loss among iron and steel factory workers
exposed to noise than among the controls, i.e. 48% vs. 31% respectively. In addition, a
comparison of hearing thresholds between the two groups for the frequencies sensitive to noise,
i.e. 4000 and 6000Hz, revealed significant differences.
Most workers in the studied iron and steel factories had a poor knowledge of NIHL, as well as
poor practice regarding provision and use of hearing protection devices, health and safety
training. However, they had a positive attitude to the importance of noise reduction at the
workplace, NIHL, audiometry and wearing of hearing protection devices which is a potential
attribute towards successful HCP.

77
8.0 Recommendations
8.1 Workers in the factories who participated in the present study should be provided
with HPDs with proper fit-training and education on why and how to use HPDs.
8.2 Efforts should be made to reduce occupational noise levels to acceptable limits by
addressing the determinants for noise exposure. Noise assessment should be carried
out after improvements have been made to confirm reduced sound levels.
8.3 In Tanzania, it would be appropriate to establish and or strengthen a functioning
workplace surveillance and monitoring system for noise levels and hearing.
9.0 Future Research Perspectives
9.1 Interventional studies on various noise control measures including the use of HPDs.
Evaluation on effectiveness of such interventional programmes is necessary
component of research.
9.2 Occupational noise and NIHL awareness programmes, workers training on task-based
noise determinants may provide useful knowledge for effectiveness studies targeting
noise reduction and prevention of development of NIHL.
9.3 Noise assessment using task-based strategy may provide detailed knowledge on noise
reduction in iron and steel factories

78
References
1. Bano Rafia, AlShammari E, Fatima S. Bushra, Al-Shammari N A: A comparative study
of knowledge, attitude, practice of nutrition and non-nutrition student towards a
balanced diet in Hail University. Nurs Health Sci 2013, 2(3):29-36.
2. Schwartz NE: Nutritional knowledge, attitudes, and practices of high school
graduates. J Am Diet Assoc 1975, 66(1):28-31.
3. Rabinowitz PM: Noise-induced hearing loss. Am Fam Physician 2000, 61(9):2749-
2756, 2759-2760.
4. Rabinowitz PM: The Public Health Significance of Noise-Induced Hearing Loss. In:
Noise-Induced Hearing Loss: Scientific Advances; C.G Le Prell, D. Henderson, R.R.
Fay, A.N. Popper, eds. Springer Handbook of Auditory Research 40, Springer Science +
Business Media, LLC, 233 Spring Street, New York USA, 2012, pp.13-25,
doi:10.1007/978-1-4419-9523-0_2. ISBN: 978-1-4419-9523-0.
5. World Health Organization (WHO) [internet]: Prevention of blindness and deafness:
Global estimates on prevalence of hearing loss. WHO; 2018. Available from:
http://www.who.int/pbd/deafness/estimates/en/. [last accessed on June 2019].
6. Morata TC: Hearing disorders. In: Occupational and Environmental Health:
Recognizing and preventing disease and injury. eds. Barry S Levy, David H. Wegman,
Sherry L Baron, Rosemary K Sokas. Philadelphia, 5th Edition, U.S: Lippincott Williams
& Wilkins; 2006: 587-596.
7. Nelson DI, Nelson RY, Concha-Barrientos M, Fingerhut M: The global burden of
occupational noise-induced hearing loss. Am J Ind Med 2005, 48:446–458.
8. International Labour Organization (ILO)[internet]. Physical hazards-Noise;
Occupational Safety and Health Brief no.3a. Available at
https://www.ilo.org/wcmsp5/groups/public/---americas/---ro-lima/---sro-
port_of_spain/documents/presentation/wcms_250190.pdf. [last accessed June 2019].
9. Hansen CH: Fundamentals of Acoustic. In: Occupational exposure to noise Evaluation,
Prevention and Control. eds. Goelzer BIF. [WHO electronic book], Geneva; 2001.
Available at: http://www.who.int/occupational_health/publications/noise1.pdf?ua=1.
[last accessed June 2019].
10. Dobie RA, Hemel SV: Hearing loss: Determining Eligibility for Social Security
Benefits. In: Committee on Disability Determination for Individuals with Hearing
Impairments. eds Dobie RA, Hemel SV. Washington, DC: National Academy od
Sciences; 2004.
11. Jacob Johnson, Scott T. Robison: Hearing loss. In: Current Occupational &
Environmental Medicine. eds. Joseph Ladou. Volume 4, New York: Mc GrawHill
Medical; 2007: 104- 121.
12. Peter W.Albeert: The Pathophysiology of the ear. In: Occupational exposure to noise
Evaluation, Prevention and Control. eds. Goelzer BIF. [WHO electronic book], Geneva;
2001. Available at:
http://www.who.int/occupational_health/publications/noise3.pdf?ua=1. [last accessed
June 2019].

79
13. Hopkins K: Deafness in cochlear and auditory nerve disorders. Handb Clin Neurol
2015, 129:479-494.
14. Concha-Barrientos M, Campbell-Lendrum D, Steenland K. Occupational noise:
assessing the burden of disease from work-related hearing impairment at national
and local levels. World Health Organization, Geneva, 2004. (WHO Environmental
Burden of Disease Series, No. 9). Available from
https://www.who.int/quantifying_ehimpacts/publications/9241591927/en/ [last accessed
june 2019]
15. Johnson DL, Papadopoulos P, Watfa N, J. T: Exposure criteria, occupational exposure
levels. In: Occupational exposure to noise Evaluation, Prevention and Control. eds.
Goelzer BIF. [WHO electronic book], Geneva; 2001. Available at:
http://www.who.int/occupational_health/publications/noise 4.pdf?ua=1. [last accessed
June 2019].
16. Seixas NS, Neitzel R, Stover B, Sheppard L, Feeney P, Mills D, Kujawa S: 10-Year
prospective study of noise exposure and hearing damage among construction
workers. Occup Environ Med 2012, 69(9):643-650.
17. Sameer NY Gerges, Gustav A Sehrndt, Wolfgang Parthey: Noise sources. In:
Occupational exposure to noise Evaluation, Prevention and Control. eds. Goelzer BIF.
[WHO electronic book], Geneva; 2001: p 103. Available at:
http://www.who.int/occupational_health/publications/noise 4.pdf?ua=1. [last accessed
June 2019].
18. Lie A, Skogstad M, Johannessen HA, Tynes T, Mehlum IS, Nordby KC, Engdahl B,
Tambs K: Occupational noise exposure and hearing: A systematic review. Int Arch
Occup Environ Health 2016, 89(3):351-372.
19. Sunde E, Irgens-Hansen K, Moen BE, Gjestland T, Koefoed VF, Oftedal G, Bråtveit M:
Noise and exposure of personnel aboard vessels in the Royal Norwegian Navy. Ann
Occup Hyg 2015, 59(2):182-199.
20. Gomes J, Lloyd O, Norman N: The health of the workers in a rapidly developing
country: effects of occupational exposure to noise and heat. Occup Med (Oxford,
England) 2002, 52(3):121-128.
21. International Labour Organization (ILO) [internet]: Encyclopedia of Occupational
Health and Safety. Eds. Suter AH, Part VI General Hazards: Noise. 4th Edition.
Geneva: ILO; 1998, last modified 2011. Available from:
http://www.iloencyclopaedia.org/contents/part-vi-16255/noise. [last accessed June 2019].
22. Tak S, Davis RR, Calvert GM: Exposure to hazardous workplace noise and use of
hearing protection devices among US workers--NHANES, 1999-2004. Am J Ind Med
2009, 52(5):358-371.
23. National Institute for Occupational Safety and Health (NIOSH) [internet]: Criteria For
A Recommended Standard: Occupational Noise Exposure Revised Criteria

80
1998.105. NIOSH. Cincinnati, Ohio. Available from:
https://www.cdc.gov/niosh/docs/98-126/pdfs/98-126.pdf.[last accessed June 2019].
24. Lin JY, Rosenblatt D: Shifting patterns of economic growth and rethinking
development. Journal of Economic Policy Reform 2012, 15(3):171-194.
25. United Nations Industrial Development Organization (UNIDO) [internet]: Industrial
Development Report 2018:Demand for Manufacturing: Driving Inclusive and
Sustainable Industrial Development. Vienna: UNIDO; 2017. Available from
https://www.unido.org/sites/default/files/files/2017-
11/IDR2018_FULL%20REPORT.pdf.[last accessed June 2019].
26. Dobie RA: The burdens of age-related and occupational noise-induced hearing loss
in the United States. Ear Hear 2008, 29(4):565-577.
27. Behar A, Plener R: Noise exposure--sampling strategy and risk assessment. Am Ind
Hyg Assoc J 1984, 45(2):105-109.
28. Lester H, Malchaire J,: Strategies for noise surveys. In: Occupational exposure to noise
Evaluation, Prevention and Control. eds. Goelzer BIF. [WHO electronic book], Geneva;
2001: p 145-155. Available at:
http://www.who.int/occupational_health/publications/noise 7.pdf?ua=1. [last accessed
June 2019].
29. International Standard Organization (ISO): ISO standard 9612:2009: Acoustics-
Determination of occupational noise exposure- Engineering method. Geneva; 2009.
30. Warrington DN, JR. M: Evaluation of Occupational Noise Exposure- Advantages and
disadvantages of Noise dosimetry versus sampling using a Sound level meter.
Proceedings of ACOUSTICS 2005. Busselton, Western Australia; 2005: 345-349.
31. Kardous CA, Willson RD: Limitations of using dosimeters in impulse noise
environments. J Occup Environ Hyg 2004, 1(7):456-462.
32. Neitzel RL, Heikkinen MSA, Williams CC, Viet SM, Dellarco M: Pilot study of
methods and equipment for in-home noise level measurements. Appl Acoust 2015,
102:1-11.
33. Le TN, Straatman LV, Lea J, Westerberg B: Current insights in noise-induced hearing
loss: A literature review of the underlying mechanism, pathophysiology,
asymmetry, and management options. Otolaryngol Head Neck Surg 2017, 46(1):41.
34. Basner M, Babisch W, Davis A, Brink M, Clark C, Janssen S, Stansfeld S: Auditory
and non-auditory effects of noise on health. Lancet (London, England) 2014,
383(9925):1325-1332.
35. Szalma JL, Hancock PA: Noise effects on human performance: a meta-analytic
synthesis. Psychological bulletin 2011, 137(4):682-707.
36. Colin Mathers, Andrew Smith, Concha M: World Health Organization (WHO):
Global burden of hearing loss in the year 2000. WHO 2000.

81
37. Agarwal G, Prakash SN, Pal KS, Kaushal AK, Kumar M: Audiometric notching at 4
kHz: Good screening test for assessment of early onset of occupational hearing loss.
Indian Journal of Otology 2015, 21(4):270-273.
38. Rabinowitz PM, Galusha D, Slade MD, Dixon-Ernst C, Sircar KD, Dobie RA:
Audiogram notches in noise-exposed workers. Ear Hear 2006, 27(6):742-750.
39. McBride D, Williams S: Characteristics of the audiometric notch as a clinical sign of
noise exposure. Scand Audiol 2001, 30(2):106-111.
40. Kirchner DB, Evenson E, Dobie RA, Rabinowitz P, Crawford J, Kopke R, Hudson TW:
Occupational noise-induced hearing loss: ACOEM Task Force on Occupational
Hearing Loss. J Occup Environ Med 2012, 54(1):106-108.
41. Tekriwal R, Parmar DM, Saxena R: Noise induced hearing loss - A comparison
between speech frequency and 4000Hz frequency. Natl J Physiol, Pharm Pharmacol
2011, 1(2):79-85.
42. R. Neitzel, Fligor B: Make listerning safe, WHO [internet]: Determination of risk of
noise-induced hearing loss due to recreational sound: Review. WHO; Geneva 2017.
Available from:
https://www.who.int/pbd/deafness/Monograph_on_determination_of_risk_of_HL_due_t
o_exposure_to_recreational_sounds.pdf?ua=1. [last accessed June 2019].
43. The Norwegian Labour Inspection Authority: Audiometric testing in noise exposed
workers 2013. (in Nowegian).
44. Health and Safety Executive (HSE) [internet]: Controlling noise at work. The Controll
of Noise at Work Regulations 2005 .Guidance on Regulations. HSE 2005. Available
from: http://www.hse.gov.uk/pUbns/priced/l108.pdf.[last accessed June 2019].
45. Daniell WE, Swan SS, McDaniel MM, Camp JE, Cohen MA, Stebbins JG: Noise
exposure and hearing loss prevention programmes after 20 years of regulations in
the United States. Occup Environ Med 2006, 63(5):343-351.
46. Macca I, Scapellato ML, Carrieri M, Maso S, Trevisan A, Bartolucci GB: High-
frequency hearing thresholds: effects of age, occupational ultrasound and noise
exposure. Int Arch Occup Environ Health 2015, 88(2):197-211.
47. Strauss S, Swanepoel DW, Becker P, Eloff Z, Hall JW, 3rd: Noise and age-related
hearing loss: a study of 40 123 gold miners in South Africa. Int J Audiol 2014, 53
Suppl 2:S66-75.
48. Strauss S, Swanepoel DW, Becker P, Hall JWI, Swanepoel DW, Swanepoel DW, Becker
P, Eloff Z: Prevalence and degree of noise-induced hearing loss in South African
gold miners : original research. Occupational Health Southern Africa 2012, 18(6):20-
25.
49. Lie A, Skogstad M, Johannessen HA, Tynes T, Mehlum IS, Nordby KC, Engdahl B,
Tambs K: Occupational noise exposure and hearing: a systematic review. Int Arch
Occup Environ Health 2015.
50. Campo P, Morata TC, Hong O: Chemical exposure and hearing loss. Dis Mon 2013,
59(4):119-138.

82
51. Westerberg BD, Lee PK, Lukwago L, Zaramba S, Bubikere S, Stewart I: Cross-
sectional survey of hearing impairment and ear disease in Uganda. Otolaryng Head
Neck Surg 2008, 37(6):753-758.
52. World Health Organization (WHO) [internet]. Deafness and hearing loss:key facts.
Available from: https://www.who.int/news-room/fact-sheets/detail/deafness-and-hearing-
loss. [last accessed June 2019]
53. Dobie RA: The burdens of age-related and occupational noise-induced hearing loss
in the United States. Ear Hear 2008, 29(4):565-577.
54. Musiba Z: The prevalence of noise-induced hearing loss among Tanzanian miners.
Occup Med (Oxford, England) 2015, 65(5):386-390.
55. United Republic f Tanzania (URT). National Occupational Health and safety policy
2010. Ministry of Labour, Employment and Youth Development. Dar es Salaam 2010.
56. Mrema EJ, Ngowi AV, Mamuya SH: Status of Occupational Health and Safety and
Related Challenges in Expanding Economy of Tanzania. Ann Glob Health 2015,
81(4):538-547.
57. Yasui T, Iwasaki S, Sugasawa K, Sakamoto T, Kashio A, Suzuki M, Kakigi A,
Yamasoba T: Admittance tympanometry with 2-kHz probe tones in patients with
low-frequency hearing loss. Laryngoscope 2012, 122(10):2252-2255.
58. Hamid M, Brookler KH: Auditory and vestibular medicine clinic:Tympanometry.
Ear Nose Throat J 2007, 86(11):668-669.
59. Barros SMDS, Frota S, Atherino CCT, Osterne F: The efficiency of otoacoustic
emissions and pure-tone audiometry in the detection of temporary auditory changes
after exposure to high sound pressure levels. Braz J Otorhinolaryngol 2007,
73(5):592-598.
60. British Society of Audiology (BSA) [internet]: Recommended Procedure: Rinne and
Weber tuning fork tests. British Society of Audiology 2016. Available from:
https://www.thebsa.org.uk/wp-content/uploads/1987/04/Recommended-Procedure-
Tuning-Forks-2016.pdf. [last accessed June 2019]
61. Pirozzo S, Papinczak T, P G: Primary care: Whispered voice test for screening for
hearing impairment in adults and children: systematic review. BMJ 2003, 327:1-5.
62. Thornton JL, Chevallier KM, Koka K, Gabbard SA, Tollin DJ: Conductive hearing loss
induced by experimental middle-ear effusion in a chinchilla model reveals impaired
tympanic membrane-coupled ossicular chain movement. J Assoc Res Otolaryngol
2013, 14(4):451-464.
63. Trosman SJ, Geelan-Hansen K, Anne S: A Charge Comparison of Audiometric
Testing in the Pediatric Population. Otolaryngol Head Neck Surg 2016.
64. Kemp DT: Otoacoustic, their oringin in cochlear function, and use. Br Med Bull
2002, 63:223 241.
65. Barros SM, Frota S, Atherino CCT, F O: The efficiency of otoacoustic emissions and
pure tone audiometry in detecting temporary changes after exposure to high sound
pressure levels. Rev Bras Otorrinolaringol 2007, 73(5):592-598.

83
66. Yueh B, Shapiro N, MacLean CH, PG S: Screening and Management of adult hearing
loss in Primary Care. JAMA 2003, 289(15):1976- 1985.
67. Walker JJ, Cleveland LM, Davis JL, JS S: Audiometric screening and Interpretation.
Am Fam Physician 2013, 87(1):41-47.
68. Masterson EA, Tak S, Themann CL, Wall DK, Groenewold MR, Deddens JA, Calvert
GM: Prevalence of hearing loss in the United States by industry. Am J Ind Med 2013,
56(6):670-681.
69. Davies RA: Audiometry and other hearing tests. Handb Clin Neurol 2016, 137:157-
176.
70. International Organization for Standardization (ISO) Acoustics-Audiometric test
methods. - Part1: pure tone air and borne conduction audiometry. Geneva. ISO
standard 8253-1: 2010.
71. International Organization for Standardization (ISO): Acoustics - Estimation of noise-
induced hearing loss. Geneva, ISO standard 1999:2013.
72. Malchaire M: Sound measuring instruments. In Occupational exposure to noise
Evaluation, Prevention and Control. eds. Goelzer BIF. [WHO electronic book], Geneva
2001: p 125-126. Available at:
http://www.who.int/occupational_health/publications/noise 7.pdf?ua=1. [last accessed
June 2019].
73. Lutman ME: What is the risk of noise-induced hearing loss at 80, 85, 90 dB(A) and
above? Occup Med (Oxford, England) 2000, 50(4):274-275.
74. American Conference of Governmental Industrial Hygienists (ACGIH): 2005-2006
Threshold Limit Values for chemical substances and physical agents and biological
exposure indices (BEIs): Noise. 2006b.
75. European Parliament and Council [internet]: Directive 2003/10/EC of the European
Parliament and of the Council of 6 February 2003 on the minimum health and
safety requirements regarding the exposure of workers to the risks arising from
physical agents (noise) 2003. Available from: https://eur-
lex.europa.eu/LexUriServ/LexUriServ.do?uri=OJ:L:2003:042:0038:0044:EN:PDF [last
accessed June, 2019]
76. Health and Safety Executive (HSE) [internet]: Statutory instruments. 2005 No. 1643.
The Control of Noise at Work Regulations 2005. HSE 2005. Available from:
http://www.legislation.gov.uk/uksi/2005/1643/pdfs/uksi_20051643_en.pdf [last accessed
June 2019].
77. Nandi SS, Dhatrak SV: Occupational noise-induced hearing loss in India. Indian J
Occup Environ Med 2008, 12(2):53-56.
78. Sameer NY Gerges, Vedsmand L, Lester H: Personal measures and hearing
conservation. In: Occupational exposure to noise evaluation, prevention and control.
eds. Goelzer BIF. [WHO electronic book], Geneva 2001: p 302. Available at:
http://www.who.int/occupational_health/publications/noise 11.pdf?ua=1. [last accessed
June 2019].

84
79. Hansen CH, Goelzer B [internet]: Engineering Noise Control. In: Occupational
exposure to noise: evaluation, prevention and control. eds. Goelzer BIF. [WHO
electronic book], Geneva 2001: p 245-296. Available at:
http://www.who.int/occupational_health/publications/noise 10.pdf?ua=1. [last accessed
June 2019].
80. Davies HW, Louie A, Nahid M, Shoveller J: Potential barriers to engineered noise
control in food and beverage manufacturing in British Columbia, Canada: a
qualitative study. Int J Audiol 2012, 51 Suppl 1:S43-50.
81. Tikka C, Verbeek JH, Kateman E, Morata TC, Dreschler WA, Ferrite S: Interventions
to prevent occupational noise-induced hearing loss. Cochrane Database Syst Rev
2017, 7:Cd006396.
82. Seixas NS, Neitzel R, Stover B, Sheppard L, Daniell B, Edelson J, Meischke H: A multi-
component intervention to promote hearing protector use among construction
workers. Int J Audiol 2011, 50(SUPPL. 1):S46-S56.
83. American Conference of Governmental Industrial Hygienists (ACGIH): TLVs and
BEIs: based on the Documentation of the Threshold Limit Values for Chemical and
Physical agents & Biological exposure Indicies. ACGIH 2019.
84. Donoghue AM, Frisch N, Dixon-Ernst C, Chesson BJ, Cullen MR: Hearing
conservation in the primary aluminium industry. Occup Med (Oxford, England)
2015.
85. Leinster P, Baum J, Tong D, Whitehead C: Management and motivational factors in
the control of noise induced hearing loss (NIHL). Ann Occup Hyg 1994, 38(5):649-
662.
86. Rogers B, Meyer D, Summey C, Scheessele D, Atwell T, Ostendorf J, Randolph SA,
Buckheit K: What makes a successful hearing conservation program? AAOHN J
2009, 57(8):321-335; quiz 336-327.
87. Morata TC, Meinke D: Uncovering effective strategies for hearing loss prevention.
Acoust Aust 2016, 44(1):67-75.
88. The United Republic of Tanzania (URT): The occupational Safety and Health Act of
2003.
89. Association Steel Association [internet]: World Blast Furnace production 1980-2014.
Association Steel Association 2015. Available from: https://www.worldsteel.org/media-
centre/press-releases/2015/world-Steel-in-figures-2015-is-available-online.html. [last
accessed June 2019]
90. Association Steel Association [internet]: World Steel in Figures 2015. Association Steel
Association 2015. Available from: https://www.worldsteel.org/en/dam/jcr:7f5a36e2-
e71e-4c58-b93f-f78d0c5933e4/WSIF_2015_vfinal.pdf.[last accessed June 2019]
91. World Steel Association [internet]: Fact sheet. Steel and raw materials 2014. World
Steel Association 2019. Available from:
https://www.worldsteel.org/en/dam/jcr:16ad9bcd-dbf5-449f-b42c-
b220952767bf/fact_raw%2520materials_2019.pdf . [last accessed June 2019]

85
92. Schmidt P, Avery DH: Complex Iron Smelting and Prehistoric Culture in Tanzania.
Science 1978, 201(4361):1085-1089.
93. Tanzania Daily News: Tanzania: Steel Metals expansion set to improve
manufacturing industry 2013. Available from:
https://allafrica.com/stories/201408250538.html [last accessed June 2019]
94. Kamal AA, Mikael RA, Faris R: Follow-up of hearing thresholds among forge
hammering workers. Am J Ind Med 1989, 16(6):645-658.
95. Pandya GH, Dharmadhikari DM: A comprehensive investigation of noise exposure in
and around an integrated iron and steel works. AIHA J (Fairfax, Va) 2002, 63(2):172-
177.
96. Ologe FE, Akande TM, Olajide TG: Occupational noise exposure and sensorineural
hearing loss among workers of a steel rolling mill. EUFOS 2006, 263(7):618-621.
97. Singh LP, Bhardwaj A, Kumar DK: Prevalence of permanent hearing threshold shift
among workers of Indian iron and steel small and medium enterprises: a study.
Noise Health 2012, 14(58):119-128.
98. Noweir MH, Bafail AO, Jomoah IM: Noise pollution in metalwork and woodwork
industries in the Kingdom of Saudi Arabia. JOSE 2014, 20(4):661-670.
99. Rabinowitz P, Cantley LF, Galusha D, Trufan S, Swersey A, Dixon-Ernst C, Ramirez V,
Neitzel R: Assessing hearing conservation program effectiveness: Results of a
multisite assessment. J Occup Environ Med 2018, 60(1):29-35.
100. Agarwal G, S P, Nagpure, Gadge SV: Noise Induced Hearing Loss in Steel Factory
Workers. Int J Occup Safety and Health 2015, 4(2):34-43.
101. Singh LP, Bhardwaj A, Deepak KK: Occupational noise-induced hearing loss in
Indian steel industry workers: an exploratory study. Human factors 2013, 55(2):411-
424.
102. Whittaker JD, Robinson T, Acharya A, Singh D, Smith M: Noise-induced hearing loss
in small-scale metal industry in Nepal. J laryngol Otol 2014, 128(10):871-880.
103. Ahmed HO: Noise exposure, awareness, practice and noise annoyance among steel
workers in United Arab Emirates. Open Public Health Journal 2012, 5:28-35.
104. Attarchi MS, Sadeghi Z, Dehghan F, Sohrabi MM, Mohammadi S: Assessment of
hearing standard threshold shift based on audiometric findings in steel company
workers. Iran Red Crescent Med J 2010, 12(6):644-649.
105. Nomura K, Nakao M, Yano E: Hearing loss associated with smoking and
occupational noise exposure in a Japanese metal working company. Int Arch Occup
Environ Health 2005, 78(3):178-184.
106. Minja BM, Moshi NH, Riwa P: Noise induced hearing loss among industrial workers
in dar es salaam. East Afr Med J 2003, 80(6):238-242.
107. Neitzel RL, Andersson M, Andersson E: Comparison of Multiple Measures of Noise
Exposure in Paper Mills. Ann Occup Hyg 2016, 60(5):581-596.
108. USAID: The KAP Survey MOdel (Knowledge, Attitude and Practices). Agriculture
an Nutrition Assessment Tool locator 2011. Available from: https://www.spring-

86
nutrition.org/publications/tool-summaries/kap-survey-model-knowledge-attitudes-and-
practices [last accessed June 2019].
109. Darwin P. Hunt: The concept of knowledge and how to measure it. Journal of
Intellectual Capital 2003, 4(1):100-113.
110. Rajesh Kanwar, Lorna Grund a, Olson JC: When Do the Measures of Knowledge
Measure What We Think They Are Measuring? Advances in Consumer Research
1990:17,603-608.
111. Launiala A: How much can a KAP survey tell us about people's knowledge, attitudes
and practices? Some observations from medical anthropology research on malaria
in pregnancy in Malawi. Anthropology Matters 2009, 11(1).
112. Wan TTH, Rav-Marathe K, Marathe S: A Systematic Review Of KAP-O Framework
For Diabetes. Medical Research Archives 2016, 3(9).
113. Schwarz N: Attitude Measurement. International Encyclopedia of the Social &
Behavioral Sciences (Second Edition). eds. Wright JD. Oxford: Elsevier 2015: 178-182.
114. Guyer JJ, Fabrigar LR: Attitudes and Behavior. International Encyclopedia of the
Social & Behavioral Sciences (Second Edition) eds. Wright JD. Oxford: Elsevier; 2015:
183-189.
115. World Bank (WB) [internet]: Theories of Behavior Change (English):
Communication for Governance & Accountability program (CommGAP). World
Bank 2010. Available from:
http://siteresources.worldbank.org/EXTGOVACC/Resources/CommGAPBrochureweb.p
df [last accessed June 2019].
116. World Health Organization (WHO) [internet]: Advocacy, communication and social
mobilization (ACSM) for TB control: A guide to developing knowledge, attitude
and practice surveys. Geneva 2008: 5-7. Available from:
https://www.who.int/tb/publications/tb-advocacy-report/en/ [last accessed June 2019]
117. Sayapathi, S.B.; Su, T.A.; Koh, D: Knowledge, Attitude and Practice in Relation to
noise - Induced Hearing Loss in Two factories. Research Journal of Biological
Sciences 2014, 9(6):197-2014.
118. Badran IG: Knowledge, attitude and practice the three pillars of excellence and
wisdom: A place in the medical profession. East Mediterr Health J 1995, 1(1):8-16.
119. Ismail AF, Daud A, Ismail Z, Abdullah B: Noise-induced hearing loss among quarry
workers in a north-eastern state of malaysia: a study on knowledge, attitude and
practice. Oman Med J 2013, 28(5):331-336.
120. Razman Mohd Rus, Daud A, Musa KI, Naing L: Knowledge, attitude and practice of
sawmill workers towards noise-induced hearing loss in Kota Bharu, Kelantan.
Malays J Med Sci 2008, 15(4):28-34.
121. Okafoagu NC, Oche M, Awosan KJ, Abdulmulmuni HB, Gana GJ, Ango JT, Raji I:
Determinants of Knowledge and Safety Practices of Occupational Hazards of
Textile Dye Workers in Sokoto, Nigeria: A Descriptive Analytic Study. Journal of
public health in Africa 2017, 8(1):664.

87
122. Prince MM, Stayner LT, Smith RJ, Gilbert SJ: A re-examination of risk estimates
from the NIOSH Occupational Noise and Hearing Survey (ONHS). J Acoust Soc Am
1997, 101(2):950-963.
123. Thurston FE: The worker's ear: a history of noise-induced hearing loss. Am J Ind
Med 2013, 56(3):367-377.
124. Peden J, Miller, G.D., Burke, E., Case, L., Harris C, Lindsey, T. C., Merrifield, L.,
Brown,, J. B, L. L., Shen, L.: The Steel Making Industry. In Pollution Prevention In
the Primary Metals Industry: A Manual for Technical Assistance Providers.
Champaign, IL: Illinois Waste Management and Research Center (WMRC) 1998.
125. The Free Encyclopedia UK [internet]: Steel construction information; Steel
manufacture. Available from: steelconstruction.info:
https://www.steelconstruction.info/Steel_manufacture [last accessed June 2019]
126. Dean AG, Soe MM. OpenEpi: 0pen source epidemiologic statistics for public health,
version 3.03a. Available from http://www.openepi.com/ [last accessed June 2019]
127. Mulhausen J, Damiano J: Establishing similar exposure groups. In A strategy for
assessing and managing occupational exposures. 3rd edition. Volume 3, eds. Bullock WH,
Ignacio JS, Fairfax, VA, USA: American Industrial Hygiene 2006: p33-44.
128. Razman MR.; Naing L.; Azian D., Kamarul IM: Validation of Noise Induced Hearing
Loss Questionnaire Among Malay Sawmill Workers in Kelantan Malaysia. The
internaltional medical Journal of Malaysia 2010, 9(2):51-56.
129. John R. Franks: Hearing measurement. In: Occupational exposure to noise evaluation,
prevention and control. eds. Goelzer BIF. [WHO electronic book], Geneva; 2001: p 183-
232. Available at: http://www.who.int/occupational_health/publications/noise
8.pdf?ua=1. [last accessed June 2019].
130. British Society of Audiology (BSA) [Internet]: Recommended Procedure: Pure tone
air conduction and borne conduction threshold audiometry with or without
masking. 80 Brighton Road, Reading Berkshire, RG6 1PS, UK: British Society of
Audiology 2011. Available from: http://www.thebsa.org.uk/wp-
content/uploads/2014/04/BSA_RP_PTA_FINAL_24Sept11_MinorAmend06Feb12.pdf.
[last accessed June 2019].
131. Centre for Disease Control (CDC) [internet]: National Health and Nutrition Examination
Survey (NHANES): Audiometric procedures manual. Antlanta, US 2003. Available
from: https://www.cdc.gov/nchs/data/nhanes/nhanes_07_08/manual_au.pdf [last
accessed June 2019].
132. Metidieri MM, Rodrigues HF, Filho FJ, Ferraz DP, Neto AF, Torres S: Noise-Induced
Hearing Loss (NIHL): Literature review with a focus on occupational medicine. Int
Arch Otorhinolaryngol 2013, 17(2):208-212.
133. Rabinowitz PM, Galusha D, McTague MF, Slade MD, Wesdock JC, Dixon-Ernst C:
Tracking occupational hearing loss across global industries: a comparative analysis
of metrics. Noise Health 2012, 14(56):21-27.

88
134. Rabinowitz PM, Galusha D, Dixon-Ernst C, Clougherty JE, Neitzel RL: The dose-
response relationship between in-ear occupational noise exposure and hearing loss.
Occup Environ Med 2013, 70(10):716-721.
135. Arenas J, Suter A: Comparison of occupational noise legislation in the Americas: An
overview and analysis. Noise Health 2014, 16(72):306-319.
136. Sulkowski WJ: Hearing impairment caused by impulse noise: survey in the drop
forging industry. Scand Audiol Suppl 1980(Suppl 12):307-317.
137. Kitcher ED, Ocansey G, Tumpi DA: Early occupational hearing loss of workers in a
stone crushing industry: our experience in a developing country. Noise Health 2012,
14(57):68-71.
138. Gaurav Agarwal, Prakash S Nagpure, Gadge. SV: Noise Induced Hearing Loss in Steel
Factory workers. International Journal of Occupational Safety and Health 2015,
4(2):34 - 43.
139. Mulwafu, W.; Kuper, H.; Ensink, R.J: Prevalence and causes of hearing impairment
in Africa. Trop. Med. Int. Health 2016, 21:158–165.
140. Burdorf A: Identification of determinants of exposure: consequences for
measurement and control strategies. Occup Environ Med 2005, 62(5):344-350.
141. Davies HW, Teschke K, Kennedy SM, Hodgson MR, Demers PA: Occupational Noise
Exposure and Hearing Protector Use in Canadian Lumber Mills. J Occup Environ
Hyg 2008, 6(1):32-41.
142. Ologe FE, Akande TM, Olajide TG: Noise exposure, awareness, attitudes and use of
hearing protection in a steel rolling mill in Nigeria. Occup Med (Oxford, England)
2005, 55(6):487-489.
143. World Health Organization (WHO): Health education: theoretical concepts, effective
strategies, and core competencies: A foundation document to guide capacity
development of health educators. East Mediterr Health J 2012; 1-82.
144. Polychronopoulou A, Pandis N: Interpretation of observational studies. Am J
Orthodont Dentof Orthoped 2014, 146(6):815-817.
145. Grimes DA, Schulz KF: Bias and causal associations in observational research.
Lancet (London, England) 2002, 359(9302):248-252.
146. Chinn S: Longitudinal studies: objectives and ethical considerations. Rev Epidemiol
Sante Publique 1989, 37(5-6):417-429.
147. Aquino EML, Vasconcellos-Silva PR, Coeli CM, Araújo MJ, Santos SM, Figueiredo
RCd, Duncan BB: Aspectos éticos em estudos longitudinais: o caso do ELSA-Brasil.
Rev Saude Publica 2013, 47:19-26 [in English].
148. Flamme GA, Deiters K, Needham T: Distributions of pure-tone hearing threshold
levels among adolescents and adults in the United States by gender, ethnicity, and
age: Results from the US National Health and Nutrition Examination Survey. Int J
Audiol 2011, 50 Suppl 1:S11-20.
149. Patino CM, Ferreira JC: Inclusion and exclusion criteria in research studies:
definitions and why they matter. J Bras Pneumol 2018, 44(2):84-84.

89
150. Rappaport SM, Kromhout H, Symanski E: Variation of exposure between workers in
homogeneous exposure groups. Am Ind Hyg Assoc J 1993, 54(11):654-662.
151. Rappaport S, Kupper L: Quantitative Exposure Assessment. Calfonia, USA: Stephen
Rappaport, El Cerrito; 2008.
152. Shield B, Dockrell JE: External and internal noise surveys of London primary
schools. J Acoust Soc Am 2004, 115(2):730-738.
153. Sarantopoulos G, Lykoudis S, Kassomenos P: Noise levels in primary schools of
medium sized city in Greece. Sci Total Environ 2014, 482-483:493-500.
154. Silva LT, Oliveira IS, Silva JF: The impact of urban noise on primary schools.
Perceptive evaluation and objective assessment. Appl Acoust 2016, 106:2-9.
155. Althubaiti A: Information bias in health research: definition, pitfalls, and
adjustment methods. J Multidiscip Health 2016, 9:211-217.
156. L Fadnes AT, T Tylleskär: How to identify information bias due to self-reporting in
epidemiological research. Internet Journal of Epidemiology 2008, 7(2):1-9.
157. Health and Safety Executive (HSE) [internet]: Current practice in health surveillance
for noise: RR 966 Research Report. London, UK: Health and Safety executive; 2013.
Available from: http://www.hse.gov.uk/research/rrpdf/rr966.pdf [last accessed June
2019].
158. Le Prell CG, Dell S, Hensley B, Hall JW, 3rd, Campbell KCM, Antonelli PJ, Green GE,
Miller JM, Guire K: Digital music exposure reliably induces temporary threshold
shift in normal-hearing human subjects. Ear Hear 2012, 33(6):e44-e58.
159. Atherley GRC: Monday Morning Auditory Threshold in Weavers. Br J Ind Med
1964, 21(2):150-153.
160. Dobie RA, Humes LE: Commentary on the regulatory implications of noise-induced
cochlear neuropathy. Int J Audiol 2017, 56(sup1):74-78.
161. Liang W, Zhao Y, Lee AH: An Investigation of the Significance of Residual
Confounding Effect. Biomed Res Int 2014, 2014:6.
162. Fewell Z, Davey Smith G, Sterne JA: The impact of residual and unmeasured
confounding in epidemiologic studies: a simulation study. Am J Epidemiol 2007,
166(6):646-655.
163. van Nes F, Abma T, Jonsson H, Deeg D: Language differences in qualitative
research: is meaning lost in translation? Eur J Ageing 2010, 7(4):313-316.
164. Hall DA, Zaragoza Domingo S, Hamdache LZ, Manchaiah V, Thammaiah S, Evans C,
Wong LLN: A good practice guide for translating and adapting hearing-related
questionnaires for different languages and cultures. Int J Audiol 2018, 57(3):161-175.
165. Bergmann MM, Jacobs EJ, Hoffmann K, Boeing H: Agreement of self-reported
medical history: comparison of an in-person interview with a self-administered
questionnaire. Eur J Epidemiol 2004, 19(5):411-416.
166. Opdenakker, Raymond: Advantages and Disadvantages of Four Interview
Techniques in Qualitative Research. Forum Qualitative Social Research;2006, 7(4).
Revised 2014.

ANNEX I: Information letter & Request for participation in a research project
Title: Noise exposure and Hearing Loss among iron and steel workers in Tanzania
Principal Investigator: Israel P. Nyarubeli
Institution Address: University of Bergen, Department of Global Public Health and Primary Care,
Centre for International Health; N-5020, Bergen; Norway
Background and purpose
This is a request for you to participate in a research study that intends to obtain knowledge on noise
exposure levels and hearing loss among iron and steel workers in Tanzania. You have been randomly
selected to participate as one of representative of workers in the factory. For being sure that you are
informed about participating in the research, we are asking you to read this consent form. You will also
be asked to sign it (or make your mark). Before contacting you, we have obtained a permission to
conduct this study from the Factory authority.
What does the study entail?
The study will involve measuring of noise levels from workplaces, measurement of personal noise
exposure levels, interviews, ear examinations and audiometric tests. We will ask you some questions
related to personal information and with regards to your occupation. Some of you will be asked to wear
personal noise sampling equipment for the whole day shift and interviews on tasks performed during
working shift will be done and you will undergo ear examination. Please feel free to Participate
Potential advantages and disadvantages
This study will generate knowledge on occupational noise exposure levels and establish the magnitude
of hearing loss among workers. This information will be useful in improving working condition in
factories and policy making at National level. You will have chance to know your hearing status and the
level of noise you are working with. You might expect immediate changes of working environment
after the project, however, we cannot guarantee that the employer will follow any recommendation on
this matter. This study is not expected to harm its participants.
What will happen to the samples and the information about you?
The data that are registered about you will only be used in accordance with the purpose of the study as
described above. All the data and samples will be processed without name, ID number or other directly
recognisable type of information. A code number links you to your data through a list of names. Only
authorised project personnel will have access to the list of names and be able to identify you. It will not
be possible to identify you in the results of the study when these are published.
Voluntary participation
Participation in the study is voluntary. You can withdraw your consent to participate in the study at any
time and without stating any particular reason. This will not have any consequences for your further

treatment. If you wish to participate, sign the declaration of consent on the final page. If you agree to
participate at this time, you may later withdraw your consent without your treatment being affected in
any way. If you later wish to withdraw your consent or have questions concerning the study, you may
contact Prof. Mainen J. Moshi, Chairman of the Senate Research and Publications Committee, P.O.
BOX 65001, Dar es Salaam (Tel 2150302-6, 2152489) or Dr. Alexander Tungu, MUHAS, P.O.
BOX 65015, Dar es Salaam (Tel 0713170409) who is one of supervisors for this research.
Further information on the study can be found in Chapter A – Further elaboration of what the
study entails.
The declaration of consent follows Chapter B.

Chapter A – Further elaboration of what the study entails
• Criteria for participation: The study participants will be workers in iron and steel
industries working in noisy environment. Exclusion criteria will include; For
audiometry; workers with ear surgery or confirmed hearing loss from congenital or
any other diagnosis.
• Hearing loss due to noise exposure is a public health problem and commonly reported
illness among workers exposed to noisy environment. Workplace exposure to high
noise levels above 85dB Time Weighted Average is associated with increased risk of
hearing loss. This problem is likely to be higher in developing countries including
Tanzania where the economic growth agenda have attracted industrial investments
and significant number of workers are employed. However, no documentation has
been made on levels of noise workers are exposed to and the magnitude of hearing
loss in industrial sector. Also, it is not clear whether workers are aware of the health
effects relating to their working environment. This creates a threat towards preventive
measures to health and safety of workers in this sector. This study is designed to
gather such useful information for policy and preventive services.
• 253 workers from four iron and steel industries will be invited to participate in the
study. They will be interviewed, and audiometric test will be done. In addition, 163
workers will be requested to wear portable sampling devices (dosimeter) for full shift.
Also, area noise sampling will be done using specialized equipment.
• Potential advantages: The information gathered may be used by respective industry
for improvement of workplace environment, participants will have an opportunity to
know their hearing status, policy makers may use this information as an input when
making country policy and scientific world will have the knowledge regarding noise
and hearing loss through international conferences and publications.
• Potential adverse events: The study is not expected to have any harm to participants
• Potential discomfort or disadvantages: Screening for hearing loss is a normal practice
conducted under strictly confidential rule between an employee and research team and
the procedure is non-invasive for participants, thus it is not expected to cause any
discomfort. Portable sampling device (dosimeter) is a small device that does not even
reduce efficiency of work and does not add any significant weight to a research
participant, thus, it is not expected to cause any discomfort.

• Study participants’ responsibility: It will be the responsibility of study participants to
wear and keep sampling device at the sampling position up the end of sampling
period. During audiometry, it will be a responsibility of study participants to observe
and follow instructions provided. Also, they will be obliged to provide correct
information to the best of their understandings during interview.
• The study participants will be informed as soon as possible in case new information
becomes available that might influence their willingness to participate.
• There will be no any compensation events. Only transport will be provided where
there is no suitable room to accommodate audiometric test.
Consent for participation in the study
Title of study: Noise exposure levels and hearing loss among iron and steel workers in
Tanzania
I am willing to participate in the study.
----------------------------------------------------------------------------------------------------------------
(Signed by the project participant, date)
I confirm that I have given information about the study.
----------------------------------------------------------------------------------------------------------------
(Signed, researcher, date)

ANNEX IIa: Field data collection tool- Interview based questionnaire (in Swahili)
DODOSO/hojaji juu ya kiwango cha kelele na upotevu wa uwezo wa kusikia (uziwi) miongoni
mwa wafanyakazi wa viwanda vya nondo na chuma Tanzania.
Namba ya utambulisho ya kiwanda: ……………….
Namba ya utambulisho ya mashiriki: ………………Tarehe ya hojaji: ...............................
Maelekezo
i. Tafadhali zungushia namba ya chaguo sahihi
ii. Andika jibu sahihi katika nafasi iliyo wazi: Mfano, umri katika miaka.
A: Taarifa Binafsi
Na. Taarifa hitajika Jibu
A.1 Umri (katika miaka)
A.2 Jinsi 1= Me
2= Ke
A.3 Hali ya ndoa 1= Sijaoa
2= nimeoa/kuolewa
3= tengana
A.4 Kiwango cha elimu 1= sikusoma
2= elimu ya msingi
3= elimu ya sekondari
4= elimu ya juu/ufundi/chuo
A.5 Sehemu afanyayo kazi kiwandani (idara/kitengo)
A.6 Masaa ya kazi/siku
A.7 Aina ya ajira 1= kudumu
2= muda/kibarua
A.8 Umri kazini
B: Mazingira ya kazi na Viashiria hatarishi vya upotevu wa uwezo wa kusikia
Na Taarifa hitajika Jibu
B.1a Je ni mara ngapi unafanya kazi katika mazingira
yenye kelele kubwa kazini?
1= Hapana
2= mara chache
3 = mara zote
B.1b Kama jibu ni 2 na 3 kwenye swali no. B.1a hapo juu;
Je ni mara ngapi unalazimika kupaza sauti kumfanya
aliye jirani yako umbali wa urefu wa mkono
kukusikia?
1= Hapana
2= mara chache
3 = mara zote
B.2 Uliwahi kufanya kazi katika mazingira ya kelele
kabla ya ajira hii?
Kama ‘ndiyo’ tafadhali taja;
Jina la kazi ……………………………………
Mahali ……………………………………….
Shughuli ulizofanya……………………………
Muda uliofanya kazi hiyo ……………………..
1= ndiyo
2= hapana
B.3 Je unatumia/ulitumia vifaa ya kuzuia kelele masikioni
unapofanya/ulipofanya kazi katika mazingira ya
kelele nyingi?
1= Ndiyo, mara zote
2= mara chache
3= hapana
4= hakuna kelele
B.4 Je umewahi kuwa katika mazingira yenye kelele
kubwa kwa mara moja au mlipuko;
1= ndiyo

i. Kazini?
Kama jibu ni ‘ndiyo’ mara ngapi?
ii. Nje ya kazi?
Kama jibu ni ‘ndiyo’ mara ngapi?
2= hapana
Mara …….
1= ndiyo
2= hapana
Mara …….
B.5 Je ni mara ngapi hufanya kazi katika mazingira
ambayo kemikali hutumika?
1= mara zote (kila siku)
2= mara chache (1 au 2/wiki)
3= kwa nadra sana
4= hapana
B.6 Uliwahi kufanya kazi katika mazingira ya kemikali
kabla ya kazi hii?
1= ndiyo
2= hapana
B.7 Kama ‘ndiyo’ kwa swali no. B.6, tafadhali taja;
Jina la kazi ……………………………………
Mahali ……………………………………….
Shughuli ulizofanya……………………………
Muda uliofanya kazi hiyo ……………………..
B.8 Je uliwahi kuambiwa na daktari wakati wa uchunguzi
kuwa una ugonjwa ufuatao?
i. Kisukari
ii. Shinikizo la damu
iii. Matatizo ya usikivu utotoni (miaka 0 – 17)
iv. Matatizo ya usikivu ukubwani
1= ndiyo
2= hapana
3= sijui
1= ndiyo
2= hapana
3= sijui
1= ndiyo
2= hapana
3= sijui
1= ndiyo
2= hapana
3= sijui
B.9 Je huwa una tatizo la kusikia kelele mfululizo
masikioni?
Kama ni ’ndiyo’ , je huwa unapata usumbufu
wowote?
1= ndiyo
2= hapana
1= hapana
2= husumbuliwa kidogo
3= husumbuliwa sana
B.10 Je uliwahi kupata ugonjwa au matatizo yoyote ya
masikio?
Kama ni ’ndiyo’, tafadhali taja ugonjwa au tatizo
ulilowahi kulipata
1= ndiyo
2= hapana
……………………………….
B.11 Je uliwahi kuumia au kupata ajali iliyopelekea jeraha
ndani ya sikio?
1= ndiyo
2= hapana
B.12 Je unaamini una tatizo la usikivu? 1= ndiyo
2= hapana
B.13 Je kuna ndugu au jamaa yako wa damu aliwahi kuwa
au ana tatizo la usikivu?
1= mama (Ndiyo/hapana)
2= baba (ndiyo/hapana)
3= ndugu wa damu
(ndiyo/hapana)
4= watoto (ndiyo/hapana)
5= hakuna

B.14 Je uliwahi au unavuta sigara? 1= ndiyo, kila siku
2= mara chache
3= nishaacha
4= hapana
B.15 Kama ni ’ndiyo’ kwa swali no. 14;
Tafadhali taja idadi ya miaka uliyovuta
Tafadhali taja idadi ya sigara kwa siku
Miaka ……….
Idadi ya sigara/siku ………
B.16 Je huwa unakunywa pombe/kileo?
Kama ‘ndiyo’ tafadhali taja
i. Aina ya kileo unachotumia
………………………………….
Idadi ya chupa/glass/makopo utumiayo kwa wiki
…………………………
1= ndiyo
2= hapana
B.17 Je uliwahi kuwa katika matibabu ya madawa kwa
muda mrefu?
Kama ‘ndiyo’ tafadhali taja jina la madawa au tatizo
ulilokuwa unatibiwa kwalo?
Jina la madawa ………………………….AU
Tatizo/ugonjwa …………………………
1= ndiyo
2= hapana
B.18 Je huwa unajishughulisha na shughuli zingine au
kuwa katika maeneo ya kelele baada ya kazi hii?
1= ndiyo
2= hapana
B.19 Kama ‘ndiyo’ kwa swali no. 18, tafadhali taja;
Kazi ………………………………….
Kumbi za starehe au bar …………
Kusikiliza muziki kwa sauti kubwa ……………
Nyinginezo (taja) ………………………………
B.20 Je kuna shughuli au mashine inayotoa kelele kubwa
nyumbani au jirani na makazi yako?
Kama ‘ndiyo’ tafadhali taja;
i. Gereji
ii. Mashine ya kusaga au mashine yoyote
iii. Generator
iv. Bar au club
v. Nyinginezo, taja
1= ndiyo
2= hapana
C. Maarifa
Tafadhali soma sentensi zifuatazo na kwa kila moja zungushia ‘ndiyo’ kama unadhani ni sahihi, ‘hapana’
kama unadhani si sahihi, na ‘sifahamu’ endapo huna uhakika na jibu lako.
Na Taarifa hitajika Jibu Alama
C.1 Je uliwahi kusikia kuwepo kwa uziwi
unaosababishwa na kufanya kazi mazingira yenye
kelele?
1= ndiyo
2=hapana
3= sifahamu
C.2 Uziwi unaosababishwa na kelele hautibiki 1= ndiyo
2=hapana
3= sifahamu

C.3 Uziwi hutokea endapo mfanyakazi anafanya kazi
katika mazingira ya kelele
1= ndiyo
2=hapana
3= sifahamu
C.4 Uziwi unaweza kutokea endapo mtu atakuwa
kwenye matukio yenye kelele nyingi kama mlio wa
risasi au kugongana kwa vitu vyenye nyuso ngumu
1= ndiyo
2=hapana
3= sifahamu
C.5 Hatari ya uziwi inaweza kuongezeka endapo mtu
atatumia kileo na huku akifanya kazi katika
mazingira yenye kelele
1= ndiyo
2=hapana
3= sifahamu
C.6 Matumizi ya baadhi ya madawa yanaweza
kusababisha uziwi
1= ndiyo
2=hapana
3= sifahamu
C.7 Baadhi ya mambo mtu apendayo kama kuogelea
kwenye kina kirefu na kusikiliza muziki kwa sauti
ya juu vinaweza kusababisha uziwi
1= ndiyo
2=hapana
3= sifahamu
C.8 Hatari ya uziwi inaweza kuongezeka endapo mtu
atavuta sigara/tumbaku na huku akifanya kazi
mazingira yenye kelele
1= ndiyo
2=hapana
3= sifahamu
C.9 Maambizi ya sikio yanaweza sababisha uziwi
1= ndiyo
2=hapana
3= sifahamu
C.10 Usaha sikioni ni dalili za awali za uziwi
unaosababishwa na kelele
1= ndiyo
2=hapana
3= sifahamu
C.11 Kutoweza kutambua sauti ya maongezi ni dalili ya
uziwi
1= ndiyo
2=hapana
3= sifahamu
C.12 Kusikia kelele masikioni ni dalili ya uziwi
1= ndiyo
2=hapana
3= sifahamu
C.13 Uziwi unaweza kutibiwa kwa madawa
1= ndiyo
2=hapana
3= sifahamu
C.14 Kuacha kufanya kazi mazingira ya kelele kunaweza
kusababisha kupona kabisa kwa mtu mwenye uziwi
1= ndiyo
2=hapana
3= sifahamu
C.15 Uziwi mahali pa kazi unaweza kuzuiwa kwa kuvaa
vizuia kelele masikioni
1= ndiyo
2=hapana
3= sifahamu
C.16 Uziwi mahali pa kazi unaweza kuzuiwa kwa
kupunguza masaa ya kufanya kazi kwenye vitengo
vyenye kelele
1= ndiyo
2=hapana
3= sifahamu
C.17 Uziwi mahali pa kazi unaweza kuzuiwa kwa
kuweka vizuia kelele kwenye mashine zinazotoa
kelele.
1= ndiyo
2=hapana
3= sifahamu
C.18 Kuna sharia na kanuni zinazo wakinga wafanyakazi
kutofanya kazi maeneo yenye kelele
1= ndiyo
2=hapana
3= sifahamu
D: Mtazamo
Tafadhali soma sentensi zifuatazo, kisha zungusia ‘nakubaliana sana’ au ‘nakubali’ kwa sentensi sahihi
kulingana na uzito wake, ‘sikubaliani’ au ‘sikubaliani kabisa’ kwa sentensi isiyo sahihi, na ‘wala sikubali
ama sikatai’ endapo huna msimamo wowote.

Namba Taarifa hitajika Jibu Alama
D.1 Sifanyi kazi katika mazingira ya kelele inayoweza
sababisha uziwi
5= nakubaliana sana
4= nakubaliana
3= wala sikubali ama sikatai
2= sikubaliani
1= sikubaliani kabisa
D.2 Naamini kufanya kazi katika mazingira ya kelele kwa
‘shift’ moja kwa siku hakuwezi kusababisha uziwi
5= nakubaliana sana
4= nakubaliana
3= wala sikubali ama sikatai
2= sikubaliani
1= sikubaliani kabisa
D.3 Nadhani uziwi husababisha na vitu vingine kama uzee,
jeraha sikioni na kufanya kazi katika mazingira ya kelele
5= nakubaliana sana
4= nakubaliana
3= wala sikubali ama sikatai
2= sikubaliani
1= sikubaliani kabisa
D.4 Nahisi, sipaswi kujipa taabu juu ya kiwango cha juu cha
kelele ili mradi nina nguvu na mwenye afya njema
5= nakubaliana sana
4= nakubaliana
3= wala sikubali ama sikatai
2= sikubaliani
1= sikubaliani kabisa
D.5 Naamini, naweza kupata tiba kutoka kwa mganga wa jadi
nikipatwa na uziwi
5= nakubaliana sana
4= nakubaliana
3= wala sikubali ama sikatai
2= sikubaliani
1= sikubaliani kabisa
D.6 Nadhani, uchunguzi wa masikio siyo wa muhimu katika
mahali pangu pa kazi
5= nakubaliana sana
4= nakubaliana
3= wala sikubali ama sikatai
2= sikubaliani
1= sikubaliani kabisa
D.7 Nahisi, mwajili wangu anapaswa kujulishwa endapo
nitapatwa uziwi
5= nakubaliana sana
4= nakubaliana
3= wala sikubali ama sikatai
2= sikubaliani
1= sikubaliani kabisa
D.8 Nahisi, ni wajibu wetu wote kupunguza kiwango cha
kelele mahali pa kazi
5= nakubaliana sana
4= nakubaliana
3= wala sikubali ama sikatai
2= sikubaliani
1= sikubaliani kabisa
D.9 Nahisi, si wajibu wangu kuvaa vizuia kelele masikioni
nikiwa nafanya kazi sehenu zenye kiwango kikubwa cha
kelele
5= nakubaliana sana
4= nakubaliana
3= wala sikubali ama sikatai
2= sikubaliani
1= sikubaliani kabisa
D.10 Kwa maoni yangu, siyo muhimu sana kuwa na sheria za
kupunguza kiwango cha kelele mahali pa kazi
5= nakubaliana sana
4= nakubaliana
3= wala sikubali ama sikatai
2= sikubaliani
1= sikubaliani kabisa
D.11 Nahisi, kuvaa vizuia kelele masikioni wakati nafanya kazi
ni mzigo na unanifanya nisiwe huru kufanya kazi vizuri
5= nakubaliana sana
4= nakubaliana
3= wala sikubali ama sikatai
2= sikubaliani
1= sikubaliani kabisa
D.12 Nadhani, naweza kutumia vizuia kelele masikioni vizuri
kabisa bila ya kupata mafunzo yoyote
5= nakubaliana sana
4= nakubaliana
3= wala sikubali ama sikatai

2= sikubaliani
1= sikubaliani kabisa
D.13 Kwa maoni yangu, mwajili anapaswa kunilipa fidia
endapo nitapatwa na uziwi kwa shughuli niifanyayo.
5= nakubaliana sana
4= nakubaliana
3= wala sikubali ama sikatai
2= sikubaliani
1= sikubaliani kabisa
E. Vitendo
Zifuatazo ni sentensi zinazohusu maisha ya kazi ya kila siku, tafadhali toa jibu sahihi kwa kila sentensi juu ya
kile kifanyikacho kila siku kwa kuzungushia ‘hapana’ kama kitendo hakifanyiki, ‘mara chache’ endapo
kitendo hiki hufanyika kwa nadra, ‘mara zote’ endapo kitendo hufanyika siku zote.
Namba Taarifa hitajika Jibu Alama
E.1 Kuna mabango sehemu zote ninazohitajika kuvaa
vizuia kelele masikioni
1= hapana
2= mara chache
3= mara zote
E.2 Nimepewa vizuia kelele masikioni vilivyothibitishwa
kutumika mahali pangu pa kazi
1= hapana
2= mara chache
3= mara zote
E.3 Huwa nanunua vizuia kelele masikioni kwa ajili ya kazi
yangu
1= hapana
2= mara chache
3= mara zote
E.4 Huwa nahudhuria mafunzo yaliyoandaliwa juu ya
namna ya kutumia vizuia kelele masikioni mahali
pangu pa kazi
1= hapana
2= mara chache
3= mara zote
E.5 Huwa natumia vizuia kelele masikioni kipindi
nifanyapo kazi kwenye kelele nyingi
1= hapana
2= mara chache
3= mara zote
E.6 Huwa namuarifu msimamizi wangu pindi kizuia kelele
masikioni changu kikipata hitirafu au kuharibika
1= hapana
2= mara chache
3= mara zote
E.7 Huwa nahifadhi kizuia kelele mazikioni changu
nyumbani kwa sababu za kiusalama
1= hapana
2= mara chache
3= mara zote
E.8 Huwa hahifadhi vifaa vyangu vya kuzuia kelele katika
mahali maalumu hapa kazini
1= hapana
2= mara chache
3= mara zote
E.9 Huwa Napata taarifa kutoka kwa kamati ya afya na
usalama kazini juu ya kujikinga na kiwango kikubwa
cha kelele
1= hapana
2= mara chache
3= mara zote
E.10 Huwa nafanyiwa uchunguzi wa masikio kila mwaka ili
kufahamu hali halisi ya usikivu wa masikio yangu
1= hapana
2= mara chache
3= mara zote
E.11 Huwa namwonesha mwajiri wangu majibu yangu ya
usikivu yakitoka
1= hapana
2= mara chache
3= mara zote
E.12 Huwa nawaonesha kamati ya afya na usalama kazini
majibu yangu ya usikivu yakitoka
1= hapana
2= mara chache
3= mara zote

ANNEX IIb: Field data collection tool- Interview based questionnaire (in English)
Title: Noise exposure levels and Hearing Loss among iron and steel workers in Tanzania
Factory Identification: ……………………………………….
Participant identification: ..................... Date of Interview: ...............................
Instructions
i. Please circle the correct number in given options
ii. Write a correct number in spaces provided for example age in years
A: Socio - Demographics
Qn. no Information needed Response
A.1 Age (in years)
A.2 Sex 1= Male
2= Female
A.3 Highest level of education 1= No formal education
2= Primary education
3= Secondary education
4= Tertiary
A.4 Working section
A.5 Main task(s)
A.6 Working hours/day
A.7 Type of employment 1= permanent
2= casual/temporary
A.8 Duration of employment in this work
B: Work, Noise exposure and risk factors
Qn. no Information needed Response
B.1a How often are you exposed to high noise levels at
your work?
1= No, never
2= Sometimes
3= Always
B.2b If the answer is 2, and 3 in question B.1 above,
How often did you have to raise your voice to
make yourself heard by someone an arm’s length
away from because of noise at work?
1= No, never
2= Sometimes
3= Always
B.2 Have you worked in noisy job before this job?
If ‘Yes’ please specify
Name of job……………………………….
Place ……………………………………….
Task ……………………………………….
Years worked ………………………………
B.3 Do you/Have you used hearing protective devices
(e.g. earmuffs, earplugs) at work in noisy areas?
1= Yes, always
2= Sometimes
3= No
4= Not applicable (No noise)

B.4 Have you ever been exposed to impulse noise
(sudden very loud noises or blast) without using
hearing protective devices the last 12 months?
i) At work?
If ‘Yes’ how many times?
ii) Outside work?
If ‘Yes’ how many times?
1=Yes
2=No
Number exposed ……………………….
1=Yes
2=No
Number exposed ……………………….
B.5 How often do you have to work where you use
chemicals/organic solvents?
1= Always (daily)
2= Sometimes (1 or 2 times a week)
3= Very rare
4= Never
B.6 Have you ever been exposed to chemicals/organic
solvents in any other work?
1= Yes
2= No
B.7 If ‘yes’ to qn 6 above, please specify;
Name of job ……………………………………
Place …………………………………………….
Tasks ……………………………………………
Years worked …………………………………..
B.8 Have you ever diagnosed of any of the following
conditions?
v. Diabetes
vi. Hypertension
vii. Transient hearing conditions e.g. otitis
during childhood (0- 17 yrs?
viii. Have you had reduced hearing conditions
e.g. otitis during adulthood?
1= Yes
2= No
3= Don’t know (never checked)
1= Yes
2= No
3= Don’t know (never checked)
1= Yes
2= No
3= Don’t know (never checked)
1= Yes
2= No
3= Don’t know (never checked)
B.9 Do you have tinnitus (constant ringing in the
ear)?
If ‘Yes’ how bothered are you?
1= Yes
2= No
1= not bothered
2= a bit bothered
3= highly bothered
B.10 Have you had other ear disease/injury?
If ‘Yes’ can you please tell us the
disease/condition/injury?
1= Yes
2= No
…………………………………………
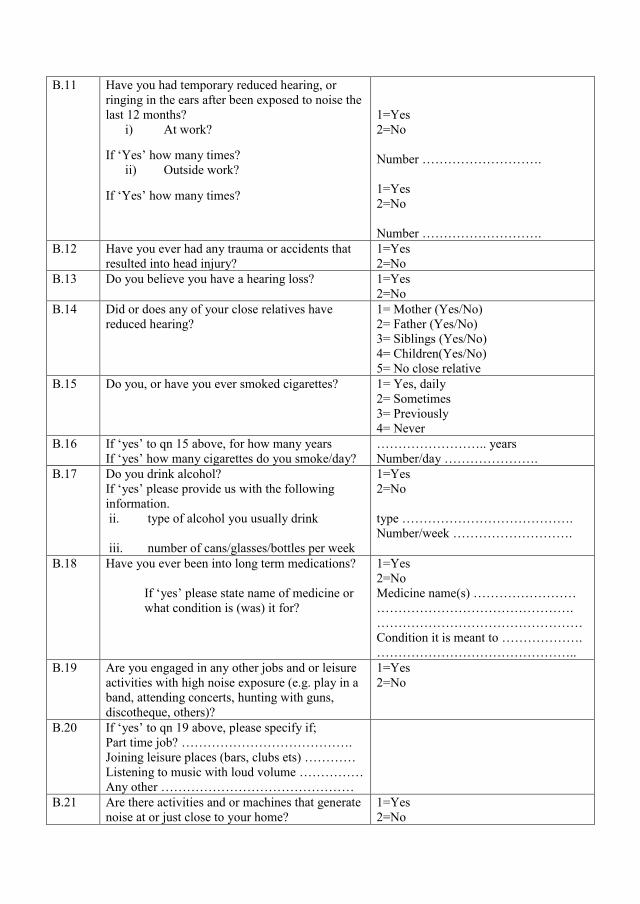
B.11 Have you had temporary reduced hearing, or
ringing in the ears after been exposed to noise the
last 12 months?
i) At work?
If ‘Yes’ how many times?
ii) Outside work?
If ‘Yes’ how many times?
1=Yes
2=No
Number ……………………….
1=Yes
2=No
Number ……………………….
B.12 Have you ever had any trauma or accidents that
resulted into head injury?
1=Yes
2=No
B.13 Do you believe you have a hearing loss? 1=Yes
2=No
B.14 Did or does any of your close relatives have
reduced hearing?
1= Mother (Yes/No)
2= Father (Yes/No)
3= Siblings (Yes/No)
4= Children(Yes/No)
5= No close relative
B.15 Do you, or have you ever smoked cigarettes? 1= Yes, daily
2= Sometimes
3= Previously
4= Never
B.16 If ‘yes’ to qn 15 above, for how many years
If ‘yes’ how many cigarettes do you smoke/day?
…………………….. years
Number/day ………………….
B.17 Do you drink alcohol?
If ‘yes’ please provide us with the following
information.
ii. type of alcohol you usually drink
iii. number of cans/glasses/bottles per week
1=Yes
2=No
type ………………………………….
Number/week ……………………….
B.18 Have you ever been into long term medications?
If ‘yes’ please state name of medicine or
what condition is (was) it for?
1=Yes
2=No
Medicine name(s) ……………………
……………………………………….
…………………………………………
Condition it is meant to ……………….
………………………………………..
B.19 Are you engaged in any other jobs and or leisure
activities with high noise exposure (e.g. play in a
band, attending concerts, hunting with guns,
discotheque, others)?
1=Yes
2=No
B.20 If ‘yes’ to qn 19 above, please specify if;
Part time job? ………………………………….
Joining leisure places (bars, clubs ets) …………
Listening to music with loud volume ……………
Any other ………………………………………
B.21 Are there activities and or machines that generate
noise at or just close to your home?
1=Yes
2=No

If ‘yes’ please mention them
i) Garage ………………….
ii) Milling or any other machine …….
iii) Generators ………………………
iv) Bar or club …………………….
v) Any other (specify) …………….
C. Knowledge
Please read the following statements and for each circle ‘yes’ if you think it is correct, circle ‘no’
if you think it is not correct and ‘don’t know’ if you are not sure or you don’t know the answer. Qn. No Information needed Response Score C.1 Have you ever heard of hearing loss due to
noise exposure?
1= yes
2=no
3= Don’t know
C.2 Hearing loss due to noise exposure is
permanent
1= yes
2=no
3= Don’t know
C.3 HL may occur if an individual is exposed to
noisy environment
1= yes
2=no
3= Don’t know
C.4 HL may occur if an individual is exposed to
events of high noise such as gun fire or impact
between two hard surfaces
1= yes
2=no
3= Don’t know
C.5 The risk of HL may be higher if an individual
drinks alcohol and works in noisy environment
1= yes
2=no
3= Don’t know
C.6 The use of some medicines is likely to cause
HL
1= yes
2=no
3= Don’t know
C.7 Hobbies like diving and listening to louder
music for long time may cause hearing loss
1= yes
2=no
3= Don’t know
C.8 The risk of HL may be higher if an individual
smoke and works in noisy environment
1= yes
2=no
3= Don’t know
C.9 Ear infections can cause HL 1= yes
2=no
3= Don’t know
C.10 Ear discharge is a sign of HL due to noise
exposure
1= yes
2=no
3= Don’t know
C.11 Poor hearing of normal speech is the sign of
HL
1= yes
2=no
3= Don’t know
C.12 Ringing in the ear is the sign of HL 1= yes
2=no
3= Don’t know
C.13 HL due to noise exposure can be treated by
using medicines
1= yes
2=no

3= Don’t know C.14 Stopping working in high noise level may
result into complete recovery or cure when you
have acquired HL
1= yes
2=no
3= Don’t know
C.15 HL due to noise exposure can be prevented by
workers wearing earplugs and ear muffs
1= yes
2=no
3= Don’t know
C.16 HL due to noise exposure can be prevented by
reducing hours of working in noisy sections
1= yes
2=no
3= Don’t know
C.17 HL due to noise exposure can be prevented by
encapsulating the noisy generating machines
1= yes
2=no
3= Don’t know
C.18 There is a law and regulation to protect
workers from being exposed to high noise
levels at workplace
1= yes
2=no
3= Don’t know
D: Attitude
Please read the following statements, circle ‘strongly agree’ or ‘agree’ for correct statement,
‘disagree’ or ‘strongly disagree’ for incorrect statement and ‘neither agree nor disagree’ when you
are indifferent.
Qn. No Information needed Response Score
D.1 I don’t work in noise level that may harm my hearing
5= strongly agree
4= agree
3= neither agree nor disagree
2= disagree
1= strongly disagree
D.2 I believe working in a noisy environment for one
shift in a day does not cause HL
5= strongly agree
4= agree
3= neither agree nor disagree
2= disagree
1= strongly disagree
D.3 I think HL is due to other factors such as age, ear
injury and not due to noise exposure
5= strongly agree
4= agree
3= neither agree nor disagree
2= disagree
1= strongly disagree
D.4 I feel, I should not bother on high noise levels as long
as I am energetic and healthy
5= strongly agree
4= agree
3= neither agree nor disagree
2= disagree
1= strongly disagree
D.5 I believe, I can consult traditional healer when I have
HL
5= strongly agree
4= agree
3= neither agree nor disagree
2= disagree
1= strongly disagree
D.6 I think ear screening program (audiometry) is not so
important in my workplace
5= strongly agree
4= agree
3= neither agree nor disagree
2= disagree

1= strongly disagree
D.7 I feel my employer should be informed if I have HL 5= strongly agree
4= agree
3= neither agree nor disagree
2= disagree
1= strongly disagree
D.8 I feel it is our shared responsibility to reduce
workplace noise exposure
5= strongly agree
4= agree
3= neither agree nor disagree
2= disagree
1= strongly disagree
D.9 I feel wearing hearing protective devices in high
noise levels is not my sore responsibility
5= strongly agree
4= agree
3= neither agree nor disagree
2= disagree
1= strongly disagree
D.10 In my opinion, it is not important to have regulations
on noise control at my site
5= strongly agree
4= agree
3= neither agree nor disagree
2= disagree
1= strongly disagree
D.11 I feel wearing hearing protective devices during work
is burden and uncomfortable
5= strongly agree
4= agree
3= neither agree nor disagree
2= disagree
1= strongly disagree
D.12 I think, I can use hearing protective devices
effectively without any training
5= strongly agree
4= agree
3= neither agree nor disagree
2= disagree
1= strongly disagree
D.13 In my opinion, my employer should compensate me
if I have HL from this work am doing
5= strongly agree
4= agree
3= neither agree nor disagree
2= disagree
1= strongly disagree
E. Practice
The following statements relate to daily works, please respond to each statement according to what
is always done at your workplace. Circle ‘never’ if you don’t practice, ‘sometimes’ is you do it
occasionally, and ‘always’ if you normally do it.
Qn. No Information needed Response Score
E.1 There are posters in sections required to wear
earplugs/muffs
1= never
2= sometimes
3= always
E.2 I am provided with approved ear plugs/muffs at my
workplace
1= never
2= sometimes
3= always
E.3 I buy earplugs/muffs for use in my working section 1= never
2= sometimes
3= always

E.4 I attend organized training on using hearing protective
devices at workplace
1= never
2= sometimes
3= always
E.5 I wear hearing protective devices when working in
noisy environment
1= never
2= sometimes
3= always
E.6 I inform my supervisor when my earplug/muffs are
damaged by any means
1= never
2= sometimes
3= always
E.7 I keep earplug/muffs at home for safety 1= never
2= sometimes
3= always
E.8 I keep earplug/muff at special places in my workplace 1= never
2= sometimes
3= always
E.9 I get information from health and safety committee on
noise control
1= never
2= sometimes
3= always
E.10 I undergo ear screening test annually to discover my
hearing status
1= never
2= sometimes
3= always
E.11 I share my audiometry result with my employer 1= never
2= sometimes
3= always
E.12 I share my audiometry results with health and safety
representative
1= never
2= sometimes
3= always

ANNEX IIIa: A checklist for walk through survey for iron and steel industries in Dar es
salaam, Tanzania
AIM: To describe the workplace environment with respect to noise sources in iron and steel
industries in Tanzania
Date of survey.............................................................
1. INDUSTRY IDENTIFICATION
i. Name of Industry........................................ Owner....................................................
ii. Location...............................................................
iii. Address: ............................................................
iv. Nature of work: ...................................................
v. Year started operation: ........................................
vi. Number of sections................. With high noise level..................
vii. Total number of employees: ......... (M/F) M= ........, F=.........
viii. Average production rate/day..........................................................................
ix. Number of shifts ………. Start at………. end at …….
x. Does the industry have a standard map/floor plan? (Yes/No) ..........
xi. If yes in (x) above can the flow plan be availed? (Yes/No
xii. Make a rough sketch if flow plan is not available
xiii. Names and tittles of those participated in walkthrough survey
Name Position Task employed to perform

2.
SO
UR
CE
S O
F N
OIS
E
Sec
tio
n
Eq
uip
men
t/m
ach
ine
cap
ab
le o
f
pro
du
cin
g
no
ise
Ty
pe
of
no
ise
pro
du
ced
[im
pu
lse/
co
nti
nu
ou
s]
Yea
r
inst
all
ed
No
ise
con
tro
l
mea
sure
s
av
ail
ab
le t
o t
his
equ
ipm
ent
(en
gin
eeri
ng
con
tro
l)
No
. o
f
wo
rker
s in
sect
ion
Sh
ift
pa
tter
n
(if
av
ail
ab
le
)
Av
ail
ab
ilit
y o
f
pro
du
ctio
n l
ine
sket
ch
(Yes
/No)
Ta
sks
per
form
ed a
t th
is s
ecti
on
M
F
i.
....
....
....
....
....
....
....
....
....
....
ii.
....
....
....
....
....
....
....
....
....
....
iii.
....
....
....
....
....
....
....
....
....
....
iv.
....
....
....
....
....
....
....
....
....
....
...
v.
....
....
....
....
....
....
....
....
....
....
.
vi.
....
....
....
....
....
....
....
....
....
....
..
i.
....
....
....
....
....
....
....
....
....
....
ii.
....
....
....
....
....
....
....
....
....
....
iii.
....
....
....
....
....
....
....
....
....
....
iv.
....
....
....
....
....
....
....
....
....
....
...
v.
....
....
....
....
....
....
....
....
....
....
.
vi.
....
....
....
....
....
....
....
....
....
....
.

3. Hazard identification
Interview five (05) selected workers from each industry who are knowledgeable on working
environment
Ask /observe Yes No
(observe) Is a raised voice needed to communicate with someone that is
only about one meter away?
Do workers complain that there is too much noise? (Explain)
Do workers say that they can’t hear each other or hear instructions or warning signals?
(describe which situation/working period)
Do people working in the area notice a reduction in hearing over the
course of the day? (This reduction might not be noticed until after
work.)
Do workers experience any of the following:
(a) ringing in the ears
(b) the same sound having a different tone in each ear
(c) blurred hearing
(observe) Are personal hearing protectors provided?
(observe) If yes, are they used?
(observe) Are signs, indicating that personal hearing protectors should
be worn, posted at the entrance or in the work area?
(Ask) Do employees undergo baseline audiometry? or any planned
periodic medical examination?
4. Training on Hearing Conservation
Determine whether Yes No
i. Is there any Occupational Safety and Health training conducted
at workplace (verify documentation)
ii. If yes. Does it cover hearing conservation?

iii. Standards of noise exposure limits are available and
documented?
iv. Health and safety committees available and functional? (verify
documentation)
• Additional notes:

ANNEX IIIb: ITIFAKI (UTARATIBU) YA UCHUNGUZI WA KIWANGO CHA USIKIVU
Namba ya Mshiriki: ………………………… Tarehe ya Uchunguzi: …………………….
A. UTANGULIZI
(rejea form ya mshiriki kutoa idhini ya kushiriki kwenye utafiti)
B. UCHUNGUZI WA AWALI WA MFUMO WA HEWA NA MAAMBUKIZI YA SIKIO
1. Je una dalili zifuatazo?
a. Kamasi kutoka puani? Ndiyo/Hapana
b. Kutoka usaha masikioni? Ndiyo/Hapana
C. MAZINGIRA YA KELELE SIKU MOJA KABLA YA UPIMAJI
i. Je ulitoka kazini muda gani jana/ au juzi?
ii. Tarehe ya siku ulipotoka kazini ……………… Muda ………………………
iii. Je ulivaa vizuia kelele masikioni ulipokuwa kazini? Ndiyo/ Hapana
D. UCHUNGUZI WA AWALI WA SIKIO
1. Chunguza uwepo wa nta au uchafu katika njia ya sikio kwa kila sikio.
KUSHOTO KULIA
2. Chunguza mfereji wa sikio
KUSHOTO KULIA
3. Chunguza ngoma ya sikio
SIKIO LA KULIA: kawaida/ina jeraha/imetoboka
SIKIO LA KUSHOTO: kawaida/ina jeraha/imetoboka

4. Uchunguzi mwingine wa SIKIO na MAONI kwa ujumla.
E. UCHUNGUZI WA KIWANGO CHA USIKIVU
Melekezo (yametoholewa kutoka mwongozo wa WHO)
Je huwa unasikia vizuri sikio moja zaidi ya jingine? (Kama jibu ni ndiyo, ni SIKIO lipi. Kama jibu ni
NDIYO, uliza ni sikio lipi. Endapo jibu ni HAPANA, anza na sikio la KULIA.) Utakuwa ukisikia mlio
wa sauti nyembamba, Kwanza, kwenye sikio lako <linalosikia vizuri au sikio la kulia> na kisha sikio
lako < jingine au la kushoto>. Mlio wa sauti utakuwa wa kufuatana na punde kutakuwa na ukimya.
Pindi utakaposikia mlio wa sauti hiyo < bonyeza kitufe ulichonacho mkononi> ili kuonesha kuwa
umesikia. Mlio utapungua kila mara kwa kadri tunavyoendelea. <Kumbuka kubonyeza kitufe
ulichonacho mkononi kila mara usikiapo mlio wa sauti>. Mlio wa sauti utabadilika, kwanza mlio
utazidi kuwa mwembamba na kisha utaongezeka. Uchunguzi wa sikio lako < jingine au la kulia>
hautafanyika hadi uchunguzi wa sikio lako < linalosikia vizuri au la kulia> utakapokuwa umekamilika
kwa frequency zote. Endapo utakuwa na uhakika wa kusikia mlio wa sauti, hauhitajiki kusubiri hadi
ukimya <bonyeza kitufe ulichonacho mkononi>. Na, hauhitajiki <kubonyeza kifute kwa muda mrefu>
pindi usikiapo mlio wa sauti. Unaweza tu < kubonyeza kitufe ulichonacho mkononi na kukiachia> kwa
mara moja. Kama huna swali, nakuwekea visikilizia sauti masikioni (headphones) ili tuanze kufanya
uchunguzi (JIBU swali lolote litakaloulizwa). Baada ya kumaliza upimaji, subiri niondoe visikilizia
sauti (headphones) masikioni.
Namna ya kufanya uchunguzi wa kiwango cha usikivu
a. Mfanye mshiriki awe huru na mazingira ya upimaji
b. Kagua Kifaa (Audiometer) na vifaa vyake kama vipo sawa kwa upimaji.
c. Washa kifaa cha upimaji (Audiometer)
d. Pitia ufanyaji kazi wa kifaa na jiridhishe
e. Hakikisha Frequency zinazotumika katika vipimo ni sahihi yaani; - 1000, 2000, 3000,
4000, 6000, 8000 Hz kisha 500 Hz, 250 Hz na malizia na 1000 Hz.
f. Weka visikilizia sauti (headphones) masikioni mwa mpimwaji na umpatie kitufe cha
kubonyeza mwitikio.
g. Chunguza tena kama kila kisikilizia sauti vimevishwa kwenye sikio stahiki.
h. Bonyeza sauti ya kusikilizia ili kutoa mfano wa mlio sahihi.
i. Kubaliana na mpimwaji juu ya utaratibu wa kupima
j. Anza kufanya upimaji.
F. HATUA ZA KUFANYA
Ahsante kwa Ushirikiano
MAJIBU:

© The Author(s) 2018. Published by Oxford University Press on behalf of the British Occupational Hygiene Society.
Original Article
Variability and Determinants of Occupational Noise Exposure Among Iron and Steel Factory Workers in TanzaniaIsrael P. Nyarubeli1,2,*, Alexander M. Tungu2, Magne Bråtveit1, Erlend Sunde1, Akwilina V. Kayumba3 and Bente E. Moen1
1Department of Global Public Health and Primary Care, Centre for International Health, University of Bergen, Årstadveien 21, 5009 Bergen, Norway; 2Department of Environmental and Occupational Health, Muhimbili University of Health and Allied Sciences, P.O Box 65015, Dar es salaam, Tanzania; 3Occupational Safety and Health Authority (OSHA), P.O Box 519, Dar es Salaam, Tanzania
*Author to whom correspondence should be addressed. E-mail: [email protected]
Submitted 12 October 2017; revised 28 June 2018; editorial decision 5 July 2018; revised version accepted 16 July 2018.
Abstract
Background: Machines, processes, and tasks in the iron and steel factories may produce noise levels that are harmful to hearing if not properly controlled. Studies documenting noise exposure levels and related determinants in sub-Saharan Africa, including Tanzania are lacking. The aim of this study was to document noise exposure and to identify determinants of noise exposure with a view to establishing an effective hearing conservation programme.Methods: A walk-through survey was conducted to describe the working environment in terms of noise sources in four metal factories (A–D) in Tanzania. Noise measurements were conducted by both personal, full-shift noise measurements (8 h) using dosimeters and area measurements (10-s measurements) using a sound level meter. A total of 163 participants had repeated personal noise measurements (Factory A: 46 participants, B: 43, C: 34, and D: 40). Workers were randomly selected and categorized into 13 exposure groups according to their job. Linear mixed effects models were used to identify significant determinants of noise exposure in the furnace section and the rolling mill section.Results: The average personal noise exposure in the four factories was 92.0 dB(A) (range of job group means; 85.4–96.2 dB(A)) (n = 326). Personal exposure was significantly higher in the rolling mill section (93.0 dB(A)) than in the furnace section (89.6 dB(A)). Among the job groups, the cutters located in the rolling mill section had the highest noise exposure (96.2 dB(A)). In the furnace section, furnace installation (below the ground floor), manual handling of raw materials/billets/crowbars, and billet weighing/transfer were significant determinants explaining 40% of the total variance in per-sonal noise exposure. In the rolling mill section, the size of the cutting machine, steel billet weight
This is an Open Access article distributed under the terms of the Creative Commons Attribution Non-Commercial License (http://creativecommons.org/licenses/by-nc/4.0/), which permits non-commercial re-use, distribution, and reproduction in any medium, provided the original work is properly cited. For commercial re-use, please contact [email protected]
Annals of Work Exposures and Health, 2018, Vol. 62, No. 9, 1109–1122doi: 10.1093/annweh/wxy071
Advance Access publication 3 August 2018Original Article
Dow
nloaded from https://academ
ic.oup.com/annw
eh/article-abstract/62/9/1109/5064905 by guest on 09 July 2019
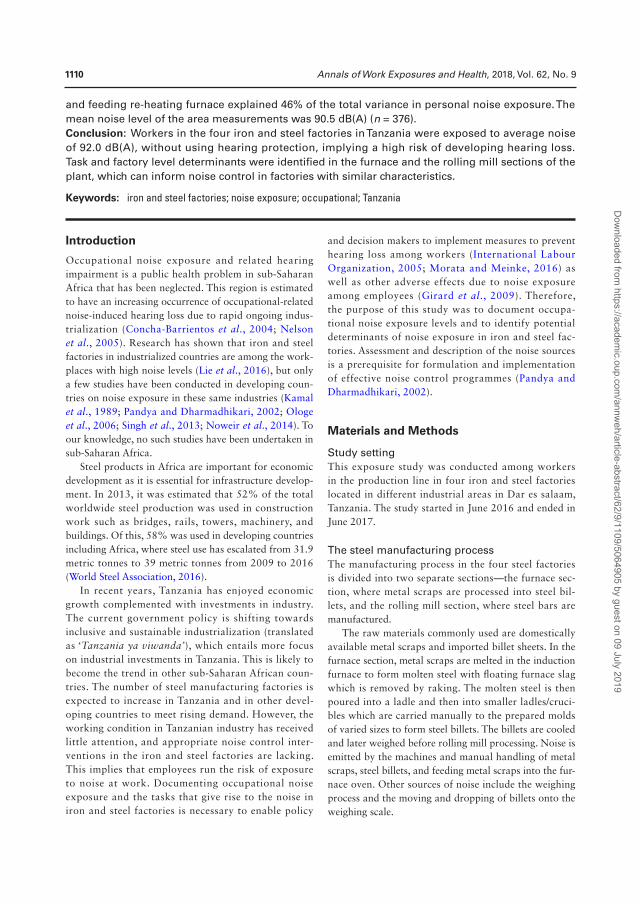
1110 Annals of Work Exposures and Health, 2018, Vol. 62, No. 9
and feeding re-heating furnace explained 46% of the total variance in personal noise exposure. The mean noise level of the area measurements was 90.5 dB(A) (n = 376).Conclusion: Workers in the four iron and steel factories in Tanzania were exposed to average noise of 92.0 dB(A), without using hearing protection, implying a high risk of developing hearing loss. Task and factory level determinants were identified in the furnace and the rolling mill sections of the plant, which can inform noise control in factories with similar characteristics.
Keywords: iron and steel factories; noise exposure; occupational; Tanzania
Introduction
Occupational noise exposure and related hearing impairment is a public health problem in sub-Saharan Africa that has been neglected. This region is estimated to have an increasing occurrence of occupational-related noise-induced hearing loss due to rapid ongoing indus-trialization (Concha-Barrientos et al., 2004; Nelson et al., 2005). Research has shown that iron and steel factories in industrialized countries are among the work-places with high noise levels (Lie et al., 2016), but only a few studies have been conducted in developing coun-tries on noise exposure in these same industries (Kamal et al., 1989; Pandya and Dharmadhikari, 2002; Ologe et al., 2006; Singh et al., 2013; Noweir et al., 2014). To our knowledge, no such studies have been undertaken in sub-Saharan Africa.
Steel products in Africa are important for economic development as it is essential for infrastructure develop-ment. In 2013, it was estimated that 52% of the total worldwide steel production was used in construction work such as bridges, rails, towers, machinery, and buildings. Of this, 58% was used in developing countries including Africa, where steel use has escalated from 31.9 metric tonnes to 39 metric tonnes from 2009 to 2016 (World Steel Association, 2016).
In recent years, Tanzania has enjoyed economic growth complemented with investments in industry. The current government policy is shifting towards inclusive and sustainable industrialization (translated as ‘Tanzania ya viwanda’), which entails more focus on industrial investments in Tanzania. This is likely to become the trend in other sub-Saharan African coun-tries. The number of steel manufacturing factories is expected to increase in Tanzania and in other devel-oping countries to meet rising demand. However, the working condition in Tanzanian industry has received little attention, and appropriate noise control inter-ventions in the iron and steel factories are lacking. This implies that employees run the risk of exposure to noise at work. Documenting occupational noise exposure and the tasks that give rise to the noise in iron and steel factories is necessary to enable policy
and decision makers to implement measures to prevent hearing loss among workers (International Labour Organization, 2005; Morata and Meinke, 2016) as well as other adverse effects due to noise exposure among employees (Girard et al., 2009). Therefore, the purpose of this study was to document occupa-tional noise exposure levels and to identify potential determinants of noise exposure in iron and steel fac-tories. Assessment and description of the noise sources is a prerequisite for formulation and implementation of effective noise control programmes (Pandya and Dharmadhikari, 2002).
Materials and Methods
Study settingThis exposure study was conducted among workers in the production line in four iron and steel factories located in different industrial areas in Dar es salaam, Tanzania. The study started in June 2016 and ended in June 2017.
The steel manufacturing processThe manufacturing process in the four steel factories is divided into two separate sections—the furnace sec-tion, where metal scraps are processed into steel bil-lets, and the rolling mill section, where steel bars are manufactured.
The raw materials commonly used are domestically available metal scraps and imported billet sheets. In the furnace section, metal scraps are melted in the induction furnace to form molten steel with floating furnace slag which is removed by raking. The molten steel is then poured into a ladle and then into smaller ladles/cruci-bles which are carried manually to the prepared molds of varied sizes to form steel billets. The billets are cooled and later weighed before rolling mill processing. Noise is emitted by the machines and manual handling of metal scraps, steel billets, and feeding metal scraps into the fur-nace oven. Other sources of noise include the weighing process and the moving and dropping of billets onto the weighing scale.
Dow
nloaded from https://academ
ic.oup.com/annw
eh/article-abstract/62/9/1109/5064905 by guest on 09 July 2019
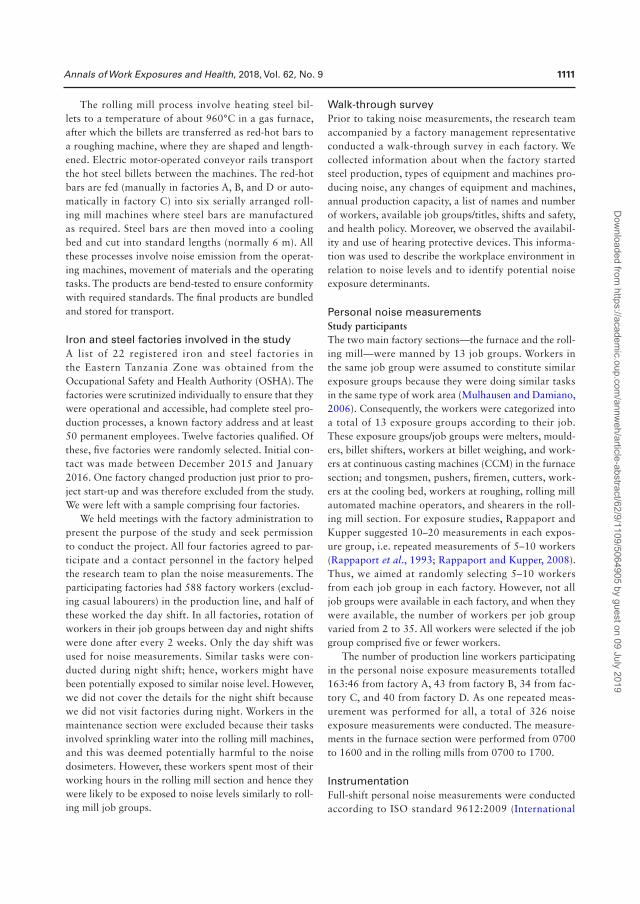
Annals of Work Exposures and Health, 2018, Vol. 62, No. 9 1111
The rolling mill process involve heating steel bil-lets to a temperature of about 960°C in a gas furnace, after which the billets are transferred as red-hot bars to a roughing machine, where they are shaped and length-ened. Electric motor-operated conveyor rails transport the hot steel billets between the machines. The red-hot bars are fed (manually in factories A, B, and D or auto-matically in factory C) into six serially arranged roll-ing mill machines where steel bars are manufactured as required. Steel bars are then moved into a cooling bed and cut into standard lengths (normally 6 m). All these processes involve noise emission from the operat-ing machines, movement of materials and the operating tasks. The products are bend-tested to ensure conformity with required standards. The final products are bundled and stored for transport.
Iron and steel factories involved in the studyA list of 22 registered iron and steel factories in the Eastern Tanzania Zone was obtained from the Occupational Safety and Health Authority (OSHA). The factories were scrutinized individually to ensure that they were operational and accessible, had complete steel pro-duction processes, a known factory address and at least 50 permanent employees. Twelve factories qualified. Of these, five factories were randomly selected. Initial con-tact was made between December 2015 and January 2016. One factory changed production just prior to pro-ject start-up and was therefore excluded from the study. We were left with a sample comprising four factories.
We held meetings with the factory administration to present the purpose of the study and seek permission to conduct the project. All four factories agreed to par-ticipate and a contact personnel in the factory helped the research team to plan the noise measurements. The participating factories had 588 factory workers (exclud-ing casual labourers) in the production line, and half of these worked the day shift. In all factories, rotation of workers in their job groups between day and night shifts were done after every 2 weeks. Only the day shift was used for noise measurements. Similar tasks were con-ducted during night shift; hence, workers might have been potentially exposed to similar noise level. However, we did not cover the details for the night shift because we did not visit factories during night. Workers in the maintenance section were excluded because their tasks involved sprinkling water into the rolling mill machines, and this was deemed potentially harmful to the noise dosimeters. However, these workers spent most of their working hours in the rolling mill section and hence they were likely to be exposed to noise levels similarly to roll-ing mill job groups.
Walk-through surveyPrior to taking noise measurements, the research team accompanied by a factory management representative conducted a walk-through survey in each factory. We collected information about when the factory started steel production, types of equipment and machines pro-ducing noise, any changes of equipment and machines, annual production capacity, a list of names and number of workers, available job groups/titles, shifts and safety, and health policy. Moreover, we observed the availabil-ity and use of hearing protective devices. This informa-tion was used to describe the workplace environment in relation to noise levels and to identify potential noise exposure determinants.
Personal noise measurementsStudy participantsThe two main factory sections—the furnace and the roll-ing mill—were manned by 13 job groups. Workers in the same job group were assumed to constitute similar exposure groups because they were doing similar tasks in the same type of work area (Mulhausen and Damiano, 2006). Consequently, the workers were categorized into a total of 13 exposure groups according to their job. These exposure groups/job groups were melters, mould-ers, billet shifters, workers at billet weighing, and work-ers at continuous casting machines (CCM) in the furnace section; and tongsmen, pushers, firemen, cutters, work-ers at the cooling bed, workers at roughing, rolling mill automated machine operators, and shearers in the roll-ing mill section. For exposure studies, Rappaport and Kupper suggested 10–20 measurements in each expos-ure group, i.e. repeated measurements of 5–10 workers (Rappaport et al., 1993; Rappaport and Kupper, 2008). Thus, we aimed at randomly selecting 5–10 workers from each job group in each factory. However, not all job groups were available in each factory, and when they were available, the number of workers per job group varied from 2 to 35. All workers were selected if the job group comprised five or fewer workers.
The number of production line workers participating in the personal noise exposure measurements totalled 163:46 from factory A, 43 from factory B, 34 from fac-tory C, and 40 from factory D. As one repeated meas-urement was performed for all, a total of 326 noise exposure measurements were conducted. The measure-ments in the furnace section were performed from 0700 to 1600 and in the rolling mills from 0700 to 1700.
InstrumentationFull-shift personal noise measurements were conducted according to ISO standard 9612:2009 (International
Dow
nloaded from https://academ
ic.oup.com/annw
eh/article-abstract/62/9/1109/5064905 by guest on 09 July 2019

1112 Annals of Work Exposures and Health, 2018, Vol. 62, No. 9
Standard Organization, 2009) using personal noise dosimeters (Brüel and Kjær type 4448). The dosim-eters had a measurement range from 50 to 140 dB [A – weighted noise level (Lp,A)], and a 3-dB exchange rate was used. The dosimeters logged noise data each min-ute during the measurement period. The instruments were calibrated before and after the sampling period, and no shifts in baseline were detected. The dosimeters were attached to workers’ shoulder approximately 10–15 cm from the ear. Workers were instructed to han-dle the dosimeters carefully while working, not to touch or shout into the microphone and to report any mishap with the instrument during the measurement period. Two members of the research team circulated two to five times during the sampling period, checking if dosim-eters worked properly. During resting periods, the work-ers were instructed not to tamper with the devices. The researchers recorded tasks performed by each worker on a sampling sheet including information on noise sources. The workers confirmed this information during lunch and at the end of the sampling period. The values recorded from the dosimeters were the start- and end-time of the sampling period, the A-weighted equivalent noise level for the duration of the measurement (Lp,A,eqT) and the C-weighted peak noise level (Lp,Cpeak). The data were normalized to daily noise exposure levels (LEX,8h) by noise exposure groups (job groups), using the following equation:
L p TT T
EX 8h A eq ee L 1 log, , ,
( / )= + 0 0 (1)
where Lp,A,eqTe is the A-weighted equivalent continuous sound pressure level from dosimeter, Te is the measure-ment period, and T0 is the reference duration, equal to 8 h.
Area noise measurementArea measurements were performed using a portable, hand-held sound level meter (Brüel and Kjær type 2250). A total of 376 measurements were conducted, i.e. 130 measurements in factory A, 108 in B, 60 in C, and 78 in factory D. The instrument was calibrated before and after each measurement day. The measurements were taken under apparently stable working conditions with the assumption that the measured result would be rep-resentative of the prevailing working situation. The area measurement points were at an approximate distance of 2 m from one another, and covered the whole working section allocated for the respective job groups. In physi-cal hazardous areas, in which workers’ sideways move-ments were limited, such as for tongsmen, only points at each working position in a straight line backwards (approximately 2 m) were measured. Thus, the total
number of measurements were influenced by the size of the working area designated for each job group, i.e. the larger the working area, the higher number of measure-ments. The number of area measurements for the differ-ent working areas ranged between 5 (for shearers) and 83 (for moulders). Measurements were conducted in a single day in each factory, and once for each measure-ment point. For uniformity of analysis of data from vari-ous job groups, each measurement was taken for 10 s and A-weighted equivalent noise levels (Lp,A,eq10s) were recorded. For averaging the results in each work area, a quantity was calculated using the equation (1):
p p Lp2 2 A eq1 s 1 1/ ( , , / )0
0 00= (2)
where p is the sound pressure level corresponding to Lp,A,eq10s and p0 is a reference value set at 20 µPa. By using formula (2), a mean sound pressure level was calculated as:
mean 1 log meanA eq1 s
2L p pp, , * ( / )0 00= ( ) (3)
The A weighted noise levels (Lp,A) were reported in decibel (dB(A)).
Occupational exposure limit (OEL) for noise
In Tanzania, the OEL for occupational noise exposure is 85 dB(A) as an 8-h time-weighted average and is used by OSHA Tanzania for compliance. This level is equal to the Recommended Exposure Limit for noise from The National Institute for Occupational Safety and Health (NIOSH), United States (NIOSH, 1998). A peak noise level of 135 dB(C) was used as the lower action value that is also used in the European Union (EU) and the UK for the peak sound pressure (European Parliament and Council, 2003; Health and Safety Executive, 2005).
Statistical analysisData from data collection tools were consolidated into Microsoft Excel 2016. IBM SPSS version 24 for Windows was used in statistical analysis. Descriptive statistics (mean, standard deviation, and percentage of measurements with levels above OEL) were computed for Lp,A for both area and personal measurements. The number of personal measurements with Lp,Cpeak exceed-ing 135dB(C) were identified. The difference between area and personal noise exposure was analysed using linear mixed effects model to account for repeated meas-urements within job groups and factories. Noise lev-els from all personal and area measurements were the dependent variable, sample type (personal measurement versus area measurement) was entered as fixed effect
Dow
nloaded from https://academ
ic.oup.com/annw
eh/article-abstract/62/9/1109/5064905 by guest on 09 July 2019

Annals of Work Exposures and Health, 2018, Vol. 62, No. 9 1113
while factory and job group were entered as random fac-tors in the mixed effects model.
A one-way analysis of variance (ANOVA) was con-ducted to explore the difference in mean noise exposure (dB(A)) between job groups. Additionally, ANOVA using the Games–Howell test was conducted to explore the difference in the noise exposure between the four facto-ries; A, B, C, and D.
Potential, dichotomous noise determinants were grouped into two groups. The first group comprised factory-related determinants, i.e. size of the cutting machines (large/small); presence of roughing machine (yes/no); separated shearing machines (yes/no); steel billet weight (20-30kgs/100-120kgs); furnace installa-tion (above ground floor/below ground floor); produc-tion capacity (5400–15,400/80,000 tonnes per year), and rolling mill plant operation technology (traditional, manual/modern, automated). The second group com-prised task-related determinants, i.e. manual handing of raw materials/billets/crowbars (yes/no); feeding the furnace oven (yes/no); pouring molten steel into molds (yes/no); billet weighing/transfer (yes/no); feeding re-heating furnace (yes/no); feeding roughing machine (yes/no); work at rolling machines (yes/no); and steel bar cooling/cutting (yes/no). The job groups assigned to manual handling of raw materials/billets/crowbars were melters, billet shifters, pushers, tongsmen, and work-ers at roughing. In preliminary analyses for exposure modelling, independent sample t-test was used to ana-lyse differences in noise exposure within each of these determinants.
Linear mixed effects models were used to iden-tify significant explanatory variables/determinants for noise exposure in the furnace and in the rolling mill sections, respectively. Personal noise exposure (LEX,8h) was entered as a dependent variable. Worker identification and factory were entered as random effects. Significant determinants (P < 0.05) from the initial t-test analysis (rolling mill plant technology, production capacity, furnace installation, steel billet weight, separated shearing machine, size of the cut-ting machine, manual handing of raw materials/ bil-lets/crowbars, pouring molten steel into molds, billet weighing/transfer, and feeding re-heating furnace) were entered as fixed effects in two steps starting with pro-cess-related and then task-related determinants. Inter-correlation between determinants was tested with Spearman correlation test. When two or more determi-nants correlated, the determinant that contributed to the highest percentage of explained variability in noise level was chosen. Determinants were retained in the models when significant (P < 0. 05).
Ethical considerationClearance was issued by The Regional Committee for Medical and Health Research Ethics (REK- VEST) in Norway and the Muhimbili University of Health and Allied Sciences (MUHAS) Ethics Committee. Permission to conduct the study was also sought and acquired from the respective iron and steel factories. Each participat-ing worker gave written, informed consent. No informa-tion about individual participants was at any point made available to the employers.
Results
The walk-through surveyThe four iron and steel factories had generally simi-lar semi-open building structures comprised inverted v-shaped continuous roofing supported by metal beams or blocks from the ground allowing for installation of machines, equipment and for ventilation. The building had no sound absorbents. In the rolling mill sections, one side of solid walls were constructed by cement-blocks and had air vents in it approximately 1.5 m above the foundation. Mobile cranes were installed in between the roofing structure and the supporting metal beams.
Table 1 shows similarities and differences in major characteristics among the four factories. The induction furnaces of the factories were raised to approximately 3.5 m above the ground surfaces except for factory D, where the furnace was below the ground surface. In factory B, the furnace and rolling mill sections were in separate plots, and steel billets were transported to the rolling mill section by vehicles. Factory A, B, and D had manually operated rolling mill machines with minor dif-ferences. Factory C had an automated rolling machine. In addition, factory C had a CCM for making billets from molten steel (equivalent to moulding section in the other factories). Furthermore, the annual production capacity, the steel billet weight and size of the cutting machine all varied between the factories. The workers were not observed wearing hearing protective devices. The various machines, as well as colliding metals during different tasks, produced both continuous and intermit-tent noise (Table 2).
Noise exposure levelsPersonal noise exposureThe average personal noise exposure (LEX,8h) was 92.0 dB (A) (n = 326) (Table 3). The mean measure-ment time was 7.3 (SD = 0.9) hours. About 90% of all measurements were above the OEL of 85 dB(A). There was a significant difference in average noise exposure among the four factories (P < 0.01). Factory B had the
Dow
nloaded from https://academ
ic.oup.com/annw
eh/article-abstract/62/9/1109/5064905 by guest on 09 July 2019

1114 Annals of Work Exposures and Health, 2018, Vol. 62, No. 9
Tab
le 1
. C
har
acte
rist
ics
of
the
fou
r (A
, B, C
, an
d D
) ir
on
an
d s
teel
fac
tori
es in
Tan
zan
ia.
Cha
ract
eris
tic
Des
crip
tion
Fact
orie
s
AB
CD
Yea
r es
tabl
ishe
d19
9719
9520
0420
05
Prod
ucti
on li
ne w
orke
rs14
217
912
014
7
Maj
or m
achi
ne c
hang
esIn
duct
ion
Furn
ace
3–5
tonn
es in
201
43–
5 to
nnes
3–5
tonn
es in
200
63
tons
inst
alle
d in
201
4
Rol
ling
mill
sM
otor
run
ning
the
flyw
heel
in 2
015
Aut
omat
ed s
yste
m p
lant
inst
alle
d
Prod
ucti
on c
apac
ity
(ton
s/ye
ar)
12,0
00–1
5,40
060
00–1
0,00
080
,000
5400
–720
0
Size
of
the
furn
ace
sect
ion
65 m
leng
th ×
29 m
wid
e
65 m
leng
th ×
32 m
wid
e
130
m le
ngth
× 6
0 m
wid
e an
d
hous
ed b
oth
furn
ace,
con
tinu
ous
cast
ing
mac
hine
s an
d ro
lling
mill
sec
tion
50 m
leng
th ×
35
m w
ide
Size
of
the
rolli
ng m
ill s
ecti
on98
m le
ngth
×
30 m
wid
e
98 m
leng
th ×
30 m
wid
e
97 m
leng
th ×
30
m w
ide
Rol
ling
mill
ope
rati
on s
yste
mA
utom
ated
wit
h C
CM
--
Pres
ent
-
Rou
ghin
g m
achi
neFr
ee-s
tand
ing
unit
-Pr
esen
t-
Pres
ent
Furn
ace
inst
alla
tion
3.5
m a
bove
the
floo
rPr
esen
tPr
esen
tPr
esen
t-
Bel
ow t
he fl
oor
surf
ace
--
-Pr
esen
t
Shea
ring
mac
hine
Free
-sta
ndin
g an
d se
para
tePr
esen
t-
--
Con
nect
ed w
ith
cutt
ing
unit
-Pr
esen
tPr
esen
tPr
esen
t
Cut
ting
mac
hine
Lar
ge-
Pres
ent
--
Smal
lPr
esen
t-
Pres
ent
Pres
ent
Stee
l bill
et w
eigh
t us
ed in
ste
el
prod
ucti
on
20–3
0 kg
Pres
ent
--
Pres
ent
100–
120
kg-
Pres
ent
Pres
ent
-
War
ning
sig
ns f
or n
oise
haz
ard
-Pr
esen
tPr
esen
t-
Dow
nloaded from https://academ
ic.oup.com/annw
eh/article-abstract/62/9/1109/5064905 by guest on 09 July 2019

Annals of Work Exposures and Health, 2018, Vol. 62, No. 9 1115
Table 2. Description of job groups, main tasks, and sources of noise in the furnace and rolling mill sections of the four (A, B, C, and D) iron and steel factories in Tanzania.
Section Job group Main task Sources of noise
Furnace
Section
Melters Offloading metal scraps using
cranes; final sorting of metal scraps
to remove explosives, feeding the
induction furnace oven with raw
materials using hands, handcarts, and
crowbars.
Droning noise from operating induction
furnace plant.
Noise from collision of metals scraps during
offloading by overhead crane, loading and
offloading into handcarts; loading of metal
scraps into furnace; siren.
Noise from explosive materials accidentally
fed into furnace
Moulders Pouring molten steel from ladle to
turndish and then transfer by
crucibles to moulds where it cools
to form steel billets.
Noise from siren and noise generated from
induction furnace section as these two are
under same roof except for factory B.
Billet shifters Transfer of steel billet from the
furnace section to the pusher.
Noise from siren, weighing billets, and
loading billets into handcarts transported
to pusher section.
Noise generated from induction furnace
Workers at
billet weighing
Weighing and recording steel
billets for the steel production process.
Noise generated by putting billets on the
weigh scale, and loading billets into
handcarts transported to pusher section.
Workers at CCM
(available only in
factory C)
Operate an automatic machine
that receives molten steel to form
steel billets.
Droning noise from CCM machinery.
Noise from adjacent induction furnace,
siren, pusher, and rolling mill sections
(as they are all under same roof).
Reflective sounds
Rolling Mill
Section
Pusher Feeds re-heating gas furnace
with billets at charging side.
Droning noise from operating gas furnace,
offloading billets from handcarts, loading
of billets into the pusher machine.
Noise from adjacent operating rolling
machines, electric fans, siren and motors.
Reflective sounds
Firemen Controlling re-heating billets into
red-hot process.
Removing red-hot billets from gas
furnace using crow bars and direct
them into an electric operated metal
conveyor.
Same as pusher.
Noise from collision of red-hot billets,
conveyor rails and sides.
Workers at roughing Flatten red-hot billets (back and forth)
into thinner and more elongated
shape than the original steel billet.
Same as in Firemen.
Noise from pressurizing/flattening process
Tongsmen
Machine operators
(in factory C)
Steel bar rolling mills. As in roughing section.
Noise generated from frequent metal
impact from moving metal rods into roll-
ing mills and the conveyor system and from
the hammering of metal rods stuck in the
machines.
Workers at
cooling bed
Moving hot steel bars from rolling
machines into a cooling platform.
Droning noise from rolling mill and cutting
machines, siren, reflective sound, moving
hot steel bars through metal conveyor
beams and rails
Dow
nloaded from https://academ
ic.oup.com/annw
eh/article-abstract/62/9/1109/5064905 by guest on 09 July 2019

1116 Annals of Work Exposures and Health, 2018, Vol. 62, No. 9
highest equivalent noise exposure followed by fac-tory C, while factory D had the lowest noise expos-ure [see Supplementary Table S1 in the Supplementary Material (available at Annals of Work Exposures and Health online)]. Personal exposure was significantly higher in the rolling mill section (93.0 dB(A)) than in the furnace section (89.7 dB(A)). The exposure was significantly higher in the rolling mill section than in the furnace for factories B, C, and D, but not in fac-tory A (Fig. 1). There was a significant difference at
the P < 0.05 level in noise exposure among the 13 job groups (P < 0.001). The shearers had the lowest and the cutters/bundlers had the highest equivalent noise exposure (Table 3).
Thirty-three percent (n = 108) of the personal meas-urements had Lp,Cpeak exceeding 135 dB(C) of which fac-tory A had the highest fraction (41%) while factory C had the lowest fraction (28%). Among the job groups, the billet shifters had the highest percent of measure-ments with such peak levels (67%) (Table 3).
Table 3. Noise levels (personal and area) in four iron and steel factories in Tanzania: comparison between factories and job groups.
Job group Personal noise exposure Area noise level
LEX,8h in dB(A)a Lp,A,eq10s in dB(A)d
N Mean SD %> 85 dB(A)b NP (%)c N Mean SD
All factories All measurements 326 92.0 3.4 90 107 (33) 376 90.5 6.0
Furnace section Moulders 34 88.3 3.2 50 9 (26) 83 81.6 2.9
Melters 54 89.5 2.6 94 25 (46) 64 88.1 2.9
Billet shifters 12 87.9 1.7 100 8 (67) 10 91.0 2.4
Workers at billet weighing 6 92.5 1.3 100 1 (17) 10 94.2 3.7
Workers at CCM 12 87.4 0.5 83 1 (1) 9 94.1 1.4
Furnace section 118 89.6 3.0 44 (37) 176 91.6 3.6
Rolling mill section Pushers 38 91.4 2.8 92 16 (42) 35 89.4 5.0
Firemen 26 93.1 2.1 100 9 (35) 26 91.4 2.3
Tongsmen 36 93.4 3.1 100 15 (42) 37 92.7 2.7
Workers at cooling bed 28 92.2 2.6 100 5 (21) 28 91.3 5.3
Workers at roughing 24 93.6 2.6 100 12 (50) 24 94.8 3.8
Cutters/bundlers 46 96.2 5.1 93 5 (11) 39 93.3 6.4
Machine operators-
automated system
4 92.7 0.2 100 - 6 83.1 3.1
Shearers 6 85.4 1.3 50 1 (17) 5 93.3 2.7
Rolling mill section 208 93.0 3.7 63 (30) 200 92.1 2.9
aLEX,8h The A-weighted personal noise exposure calculated using equation no. (1) above; b%>85OEL (occupational exposure limit) = [number of measurements >85
(dB(A)/total number of measurements (dB(A)]×100; cNP, number of measurements with Lp,Cpeak > 135 dB(C); dLp,A,eq10s the A-weighted equivalent area noise levels
measured in 10 s.
Section Job group Main task Sources of noise
Cutters/bundlers Cutting steel bars into required
length (normally 6 m) and bundling
steel bars for storage/transport.
Noise from cutting machine, moving steel
bars into conveyors. Noise from rolling mills
machines. Loading of finished products
immediately after cutting sometimes
produced noise.
Shearers Cutting rejected steel bars into
chunks for recycling.
Droning noise from the operating machines,
siren.
Noise from pieces of steel dropped into
carrying buckets.
Table 2. Continued
Dow
nloaded from https://academ
ic.oup.com/annw
eh/article-abstract/62/9/1109/5064905 by guest on 09 July 2019
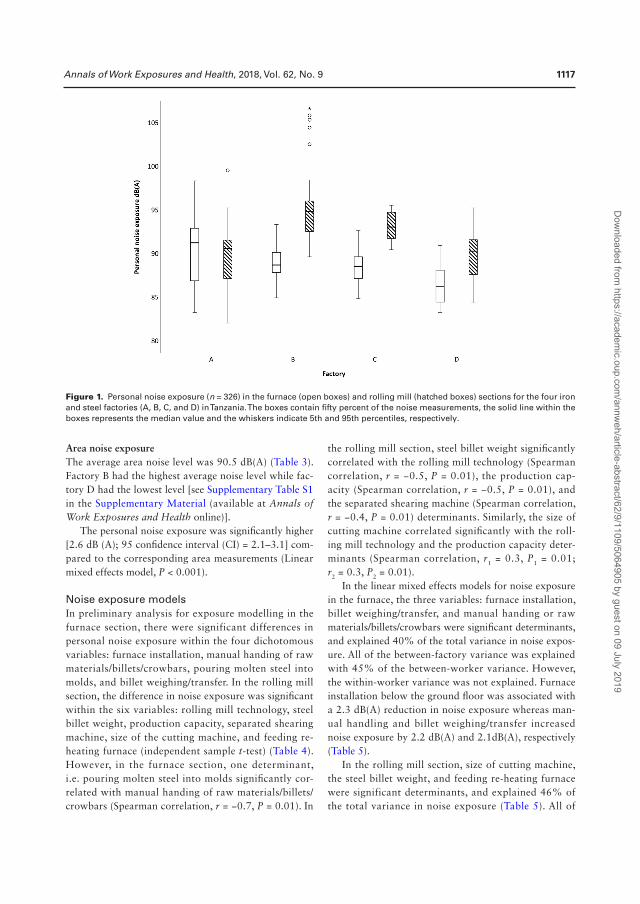
Annals of Work Exposures and Health, 2018, Vol. 62, No. 9 1117
Area noise exposureThe average area noise level was 90.5 dB(A) (Table 3). Factory B had the highest average noise level while fac-tory D had the lowest level [see Supplementary Table S1 in the Supplementary Material (available at Annals of Work Exposures and Health online)].
The personal noise exposure was significantly higher [2.6 dB (A); 95 confidence interval (CI) = 2.1–3.1] com-pared to the corresponding area measurements (Linear mixed effects model, P < 0.001).
Noise exposure modelsIn preliminary analysis for exposure modelling in the furnace section, there were significant differences in personal noise exposure within the four dichotomous variables: furnace installation, manual handing of raw materials/billets/crowbars, pouring molten steel into molds, and billet weighing/transfer. In the rolling mill section, the difference in noise exposure was significant within the six variables: rolling mill technology, steel billet weight, production capacity, separated shearing machine, size of the cutting machine, and feeding re-heating furnace (independent sample t-test) (Table 4). However, in the furnace section, one determinant, i.e. pouring molten steel into molds significantly cor-related with manual handing of raw materials/billets/crowbars (Spearman correlation, r = −0.7, P = 0.01). In
the rolling mill section, steel billet weight significantly correlated with the rolling mill technology (Spearman correlation, r = −0.5, P = 0.01), the production cap-acity (Spearman correlation, r = −0.5, P = 0.01), and the separated shearing machine (Spearman correlation, r = −0.4, P = 0.01) determinants. Similarly, the size of cutting machine correlated significantly with the roll-ing mill technology and the production capacity deter-minants (Spearman correlation, r1 = 0.3, P1 = 0.01; r2 = 0.3, P2 = 0.01).
In the linear mixed effects models for noise exposure in the furnace, the three variables: furnace installation, billet weighing/transfer, and manual handing or raw materials/billets/crowbars were significant determinants, and explained 40% of the total variance in noise expos-ure. All of the between-factory variance was explained with 45% of the between-worker variance. However, the within-worker variance was not explained. Furnace installation below the ground floor was associated with a 2.3 dB(A) reduction in noise exposure whereas man-ual handling and billet weighing/transfer increased noise exposure by 2.2 dB(A) and 2.1dB(A), respectively (Table 5).
In the rolling mill section, size of cutting machine, the steel billet weight, and feeding re-heating furnace were significant determinants, and explained 46% of the total variance in noise exposure (Table 5). All of
Figure 1. Personal noise exposure (n = 326) in the furnace (open boxes) and rolling mill (hatched boxes) sections for the four iron and steel factories (A, B, C, and D) in Tanzania. The boxes contain fifty percent of the noise measurements, the solid line within the boxes represents the median value and the whiskers indicate 5th and 95th percentiles, respectively.
Dow
nloaded from https://academ
ic.oup.com/annw
eh/article-abstract/62/9/1109/5064905 by guest on 09 July 2019

1118 Annals of Work Exposures and Health, 2018, Vol. 62, No. 9
the between-factory variance was explained with 9% of between-workers variance. Large cutting machine was associated with an increase of 1.8 dB(A) in noise exposure. Additionally, the large steel billet weight (100–120 kg) was associated with 3.6 dB(A) increase and feeding re-heating furnace with 1.9 dB(A) decrease in noise exposure (Table 5).
Discussion
The workers in the four iron and steel factories were exposed to an average noise of 92 dB(A), with 90% of the personal measurements exceeding the OEL of 85 dB (A). Workers did not use personal hearing protect-ive devices. The noise exposure in the rolling mill section
Table 4. Potential determinants for personal noise exposure (LEX,8h) in decibel (dB(A)) in the four (A, B, C, and D) iron and steel factories in Tanzania.
Determinant Attributes Furnace section Rolling mill section
N Mean (SD) aP value N Mean (SD) aP value
Factory-related determinants
Rolling mill technology 0 = Traditional, manual 164 91.6 (4.1) <0.001
1 = Modern, automated
with CCM
44 93.2 (1.6)
Presence of the roughing machine 0 = No 86 91.6 (3.0) 0.2
1 = Yes 122 92.2 (4.2)
Steel billet weight (kg) 0 = light (20–30) 60 89.1 (3.7) 0.4 106 89.7 (2.8) <0.001
1 = Heavy (100–120) 58 88.7 (2.0) 102 94.2 (3.2)
Production capacity(tonnes/year) 0 = Low (6000–15,400) 94 89.0 (3.2) 0.3 164 91.6 (4.1) <0.001
1 = High (80,000) 24 88.4 (1.9) 44 93.2 (1.6)
Separated shearing machine 0 = No 166 92.5 (3.5) <0.001
1 = Yes 42 89.8 (3.3)
Furnace installation 0 = 3.5 m above the
ground floor
102 89.3 (2.9) <0.001
1 = Below the ground
floor
16 86.4 (2.3)
Size of the cutting machine 0 = Small, well
lubricated
150 90.8 (3.0) <0.001
1 = Large, not well
lubricated
58 95.0 (3.8)
Task-related determinants
Manual handing of raw materials/
billets/crowbars
0 = no 46 87.1 (2.9) <0.001 146 92.0 (4.1) 0.5
1 = Yes, most of time 72 90.0 (2.4) 62 91.7 (2.9)
Feeding furnace oven 0 = no 64 88.5 (3.4) 0.1
1 = Yes 54 89.4 (2.3)
Pouring molten steel into moulds 0 = no 84 89.7 (2.5) <0.001
1 = Yes 34 87.0 (3.2)
Billet weighing/transfer 0 = no 100 88.3 (2.8) <0.001
1 = Yes 18 92.0 (1.4)
Feeding re-heating furnace 0 = no 170 92.2 (3.9)
1 = Yes 38 90.7 (2.7) 0.008
Feeding roughing machine 0 = no 184 91.8 (3.9)
1 = Yes 24 93.1 (2.6) 0.09
Work at rolling machines 0 = no 172 91.8 (3.8)
1 = Yes 36 92.6 (3.0) 0.2
Steel cooling/cutting 0 = no 134 91.9 (3.2)
1 = Yes 74 92.0 (4.6) 0.9
aIndependent sample t-test, significant at P < 0.05. N = number of personal noise measurements.
Dow
nloaded from https://academ
ic.oup.com/annw
eh/article-abstract/62/9/1109/5064905 by guest on 09 July 2019

Annals of Work Exposures and Health, 2018, Vol. 62, No. 9 1119
was significantly higher than in the furnace section. The workers were found to be exposed to high peak levels, of which 33% of the personal measurements exceeded 135 dB(C). In the noise exposure models for the furnace section, the furnace installation, billet weight, and man-ual handling of raw materials/billets/crowbars explained 40% of total variance. In the rolling mill section, 46% of the total variance was explained by steel billet weight, the size of the cutting machine and feeding re-heating furnace. The personal noise exposure correlated with the area noise level. To our knowledge, this is the first study from sub-Saharan Africa documenting noise exposure and identifying the determinants for noise exposure in iron and steel factories.
A study conducted among Indian steel industrial workers showed high mean noise levels for both personal (83–130 dB(A)) and area (89–105 dB(A)) measurements (Singh et al., 2013). These ranges indicate that groups of workers in the Indian study had even higher noise expos-ure than reported in our study. For instance, the moulders in the Indian study had a personal noise exposure of 99 dB(A) while we found 88 dB(A) for this job group. The difference in results may be partly explained by differ-ences in tasks, processes, machines, and tools. However, the Indian study did not describe the tasks undertaken by each job group, and this makes it difficult to compare the studies. Our study differs from the Indian study also in methodological aspects, that is, the Indian study did only
Table 5. Linear mixed effects model for determinants of A-weighted noise exposure (LEX,8h) in decibel (dB(A)) in the fur-nace and rolling mill sections for the four iron and steel factories in Tanzania.
Determinants Description Personal noise exposure (dB(A))
Furnace section (N = 118) Rolling mill section (N = 208)
Random effects model
β (SE)
Mixed-effects model β (SE)
Random effects model
β (SE)
Mixed-effects model β (SE)
Intercept 88.5 (0.75)*** 87.5 (0.44)*** 91.9 (2.29)*** 90.0 (0.38)***
Factory-related determinants
Size of the cutting machine 0 = Small 1.8 (0.75)*
1 = Large
Furnace installation 0 = 3.5 m above
the ground floor
1 = Below the
ground floor
−2.3 (0.78)**
Steel billet weight 0 = Light
(20–30 kg)
1 = Heavy
(100–120 kg)
- 3.6 (0.84)***
Task-related determinants
Manual handing of raw
materials, billets and
crowbars
0 = no
1 = Yes, most of
the time
2.2 (0.57)***
Billet weighing/transfer 0 = no
1 = Yes 2.1 (0.93)**
Feeding re-heating furnace 0 =no
1 = yes −1.9 (0.68)*
Within-worker variance (wwδ2) 3.30 (0.61) 3.30 (0.61) 2.49 (0.35) 2.49 (0.35)
Between-worker variance (bwδ2) 4.42 (1.20) 2.43 (0.87) 6.44 (1.10) 5.87 (1.0)
Between-factory variance (bfδ2) 1.81 (1.92) - 6.56 (5.59) -
% of total variance explained by the fixed effects 40 46
***P < 0.001, **P < 0.01, *P < 0.05
Dow
nloaded from https://academ
ic.oup.com/annw
eh/article-abstract/62/9/1109/5064905 by guest on 09 July 2019

1120 Annals of Work Exposures and Health, 2018, Vol. 62, No. 9
one personal full-shift measurement per job group while we conducted several measurements per job group.
The linear mixed effects model for the furnace sec-tion showed that the task-related determinants, i.e. man-ual handing of raw materials/billets/crowbars and billet weighing/transfer increased noise exposure by about 2 dB(A)’s each. This was presumably caused by collid-ing objects in motion, tools and metals when offload-ing raw materials from vehicles, sorting raw materials/metal scraps, transfer and feeding into the furnace oven, as well as collisions during manual weighing of steel bil-lets. On the other hand, furnace installation below the ground floor reduced the noise exposure by 2 dB(A) probably by reducing the direct sound transmission form the furnace to the workers, suggesting the import-ance of encompassing noise control considerations in engineering design. The three identified determinants in the furnace explained the between-factory variance and partly the between-workers variance, but not the within-worker variance of noise exposure. This seems logical since furnace installation was a factory-related determinant while manual handling and billet weigh-ing/transfer were linked to job groups’ tasks in which there were no changes in the recorded tasks performed from day to day for individual workers and none of the workers changed factory or between the two sections. Additional factors such as changes in production-related activities from day to day for example, volume of work, breakdowns, changes in product specifications, were not recorded and might have caused the unexplained within worker variance.
In the rolling mill section, a 3 dB(A) and almost 2 dB(A) increase in noise were attributed to the use of large billet weight (100–120 kg) and a large cutting machine respectively. The factory that had both two determinants (factory B) recorded the highest mean noise exposure and this was reflected in the particularly high noise level in the working area for the cutters in this factory. Factory C which used large steel billet in steel bar production also recorded high noise compared to other factories that used light billet weight. This may be due to the heavy weight of the steel billet that might result into high impacts with various machines while in motion during steel bar production process. On the other hand, feeding re-heating furnace was the only task-related determinant in this section that was observed to reduce noise by 2 dB(A) presumably since this working area is located at the far end of the rolling mill section and is thus less impacted by high noise level from the rest of working areas where noise is emitted by machines and operations. As for the furnace model, these factory and task-related determinants exclusively explained
the between-factory and between-workers variances. Descriptions of roles for these determinants and their contributions to the recorded noise level in this section provide a room for proper noise control.
Our results indicate that design of the factory build-ings, location, and type of production machinery and job tasks associated with colliding metal parts contributed to recorded noise exposure. This is closely related to the Indian study that found that manual handling of steel products was an important noise source (Pandya and Dharmadhikari, 2002). The impact of manual handling of metal parts on noise exposure in the present study suggests that training workers to handle metal objects and tools more gently may reduce the noise levels associ-ated with tasks such as weighing of billets and loading the pusher machines. Reducing dropping height and/or installation of vibration-absorbent material on surfaces are recognized measures to reduce noise emission from colliding materials. To our knowledge, documentation of any noise reducing effects related to such factors in steel production facilities are scarce, and none has been con-ducted in sub-Saharan Africa.
In the present study, we included area measurements to investigate the compliance between these measure-ments and corresponding personal measurements. Area measurements using sound level meter have been widely used to indicate workers’ noise exposure in regions of limited economic resources including African and Asian countries (Pandya and Dharmadhikari, 2002; Warrington and McLoughin, 2005; Ologe et al., 2006; Singh et al., 2013; Noweir et al., 2014). Some reasons to this could be that the method is relatively inexpen-sive by using only one instrument, it is easy to conduct, and it takes less time than personal measurements. However, we have to acknowledge not only the strength and applicability but also the weaknesses of these instru-ments (Warrington and McLoughin, 2005). The mean personal noise measurement was higher compared to the area measurements, i.e. 92.0 versus 90.5 dB(A). One explanation might be that the area noise level corre-sponding to the work area for a job group was based on the unweighted mean of several points of measurements, while the worker within the job group could actually have spent more time in subareas with higher noise levels than the estimated mean area noise level. However, we did not track the movements of the workers to confirm this. Other studies in different workplaces have found an analogous difference between personal and area noise measurements, for example, in an iron and steel factory in India (130 versus 105 dB(A)) (Singh et al., 2013), in the Swedish pulp mills study ((85.1 versus 83.6 dB(A)) (Neitzel et al., 2016), and in a Norwegian Navy study
Dow
nloaded from https://academ
ic.oup.com/annw
eh/article-abstract/62/9/1109/5064905 by guest on 09 July 2019

Annals of Work Exposures and Health, 2018, Vol. 62, No. 9 1121
(a difference of > 10 dB(A) among abroad frigates and Coast guard vessels) (Sunde et al., 2015). Thus, area measurements may underestimate the actual noise exposure among workers, suggesting that a conservative approach should be taken using these data in risk assess-ment related to hearing loss. Nevertheless, this infor-mation is useful in planning for noise control and thus prevents development of noise-induced hearing loss.
Studies using area measurements have shown high noise levels comparable to those we have described; in a foundry in Egypt (range 82–94 dB(A)) (Kamal et al., 1989), in the mill production area in Nigeria ((93 dB(A)) (Ologe et al., 2006), in two factories in the Kingdom of Saudi Arabia (90.5 dB(A) and 95 dB(A)) (Noweir et al., 2014) and in integrated iron and steel industry in India ((92–100 dB(A)) (Pandya and Dharmadhikari, 2002). In most of these studies, the measurements were taken close to the worker’s head assuming that it represented the worker’s noise exposure (Barrigón Morillas et al., 2016). However, the wide range of tasks and processes in these factories present a challenge for the single fixed-point noise measurement to represent occupational noise expos-ure, and it is better to map the whole working area and describe the tasks done by workers to increase the valid-ity of results. In addition, a stationary area noise meas-urement strategy has been recently found to have lower validity in occupational noise exposure compared to the personal noise measurement strategy, unless it is done in accordance to the ISO 9612:2009 (Neitzel et al., 2016).
One strength of this study is that the personal noise measurements were performed over several days, with repeated measurements using high quality instruments. Inclusion of more factories could have strengthened the exposure models by distributing more than four facto-ries into the subgroups of the respective determinants. More detailed assessment of tasks performed might have improved the models by explaining parts of the within-worker variability. On the other hand, the area noise meas-urement was done in only one day in each factory. However, the area measurements were assumed to be performed dur-ing stable working condition and should be representative for the work tasks done at the time. Our descriptions of factory buildings, noise sources, and the measured workers’ noise exposure are important inputs in engineering noise control (Hansen and Goelzer, 2001). Furthermore, some of the variability in the individual measurement might be due to mechanical contact with the microphone during work (Sunde et al., 2015), but its contribution should have min-imal impact on the overall results when taking into account the generally high noise levels in the factories.
Future studies may be performed with task-based measurements of noise level, which will provide more
detailed knowledge for work on noise reduction. We also recommend establishment of noise control measures including hearing conservation programme with com-pulsory periodic noise monitoring.
Iron and steel factories included in this study are likely to be representative of other factories in Tanzania and sub-Saharan Africa, as some of the factories not included in the present study have the same owners as the participating factories and may also share plant characteristics and technology. Because of these aspects, we believe that our findings can be generalized to iron and steel factories in Tanzania and other sub-Saharan Africa where the factories have similar characteristics.
Conclusion
This study found that most workers in the studied iron and steel factories were exposed to noise levels exceeding the OEL of 85 dB(A) and that they did not use hearing protection. This may result in hearing loss among work-ers. Furnace installation, billet weighing/transfer, and manual handling of raw materials/billets/crowbars were significant determinants in the furnace section while the size of the cutting machine, the steel billet weight and feeding re-heating furnace were significant determinants in the rolling mill section. Noise control measures based on identified determinants including hearing conserva-tion programme are important in these factories.
Supplementary Data
Supplementary data are available at Annals of Work Exposures and Health online.
Acknowledgements
We are grateful to management in the four factories for host-ing the project and allowing employees to participate. We thank the workers for their participation into the project. Similarly, the field research assistants (Ms. Judith A. Haule and Mr. Alistides Medard), the Muhimbili University of Health and Allied Sciences and the Occupational Safety and Health Authority in Tanzania for their valuable contribution to this work.
Funding
This work was supported by the Norwegian State Educational Loan Fund (Lånekassen) and the Norad funded Project Norhed: Reduction of the burden of injuries and diseases due to occupa-tional exposures through capacity building in low income coun-tries, a cooperation between University of Bergen (Norway), Addis Ababa University (Ethiopia) and Muhimbili University of Health and Allied Sciences (Tanzania).
Dow
nloaded from https://academ
ic.oup.com/annw
eh/article-abstract/62/9/1109/5064905 by guest on 09 July 2019

1122 Annals of Work Exposures and Health, 2018, Vol. 62, No. 9
Conflict of Interest
We declare that we have no conflict of interest.
References
Barrigón Morillas JM, Montes González D, Rey Gozalo G. (2016) A review of the measurement procedure of the ISO 1996 standard. Relationship with the European Noise Directive. Sci Total Environ; 565: 595–606.
Concha-Barrientos M, Campbell-Lendrum D, Steenland K. (2004) Occupational noise: assessing the burden of dis-ease from work-related hearing impairment at national and local levels. Geneva: World Health Organization (WHO Environmental Burden of Disease Series, No. 9), ISBN 9241591927.
European Parliament and Council. (2003) Directive 2003/10/EC of the European Parliament and of the Council of 6 February 2003 on the minimum health and safety require-ments regarding the exposure of workers to the risks aris-ing from physical agents (noise). Brussels: Official Journal of the European Union. L 42/38. Available at http://eur-lex.europa.eu/legal. content/EN/TXT/PDF/?uri=CELEX:32003L0010&rid=1 (accessed 11 December 2016).
Girard SA, Picard M, Davis AC et al. (2009) Multiple work-related accidents: tracing the role of hearing status and noise exposure. Occup Environ Med; 66: 319–24.
Hansen CH, Goelzer BIF. (2001) Engineering Noise control. In: Occupational exposure to noise: evaluation, prevention and control. Chapter 10. pp. 245–96 [WHO electronic book]. Geneva, World Health Organization. Available at http://www.who.int/occupational_health/publications/noise10.pdf?ua=1 (accessed 12 August 2017).
Health and Safety Executive. (2005) Controlling noise at work. The Control of Noise at Work Regulations 2005. Guidance on Regulations. ISBN 9780717661644.
International Labour Organization. (2005) Sectoral Activities Programme. Code of practice on safety and health in the iron and steel industry. MEISI/2005/8. Available at http://www.ilo.org/safework/info/standards-and-instruments/codes/WCMS_112443/lang--en/index.htm (accessed 22 June 2017).
International Standardization Organization. (2009) ISO 9612:2009, Acoustics - Determination of occupational noise exposure - Engineering method. Geneva, Switzerland: International Organization for Standardization.
Kamal AA, Mikael RA, Faris R. (1989) Follow-up of hearing thresholds among forge hammering workers. Am J Ind Med; 16: 645–58.
Lie A, Skogstad M, Johannessen HA et al. (2016) Occupational noise exposure and hearing: a systematic review. Int Arch Occup Environ Health; 89: 351–72.
Morata TC, Meinke D. (2016) Uncovering effective strategies for hearing loss prevention. Acoust Aust; 44: 67–75.
Mulhausen J, Damiano J. (2006) Establishing similar exposure groups. In Bullock WH, Ignacio JS, editors. A strategy for assessing and managing occupational exposures. 3rd edn. Fairfax, VA: American Industrial Hygiene. pp. 33–44. ISBN 9781931504690.
Neitzel RL, Andersson M, Andersson E. (2016) Comparison of multiple measures of noise exposure in paper mills. Ann Occup Hyg; 60: 581–96.
Nelson DI, Nelson RY, Concha-Barrientos M et al. (2005) The global burden of occupational noise-induced hearing loss. Am J Ind Med; 48: 446–58.
NIOSH. (1998) Criteria for a Recommended Standard: Occupat ional noise exposure . Revised cr i ter ia ; 1998: 105.
Noweir MH, Bafail AO, Jomoah IM. (2014) Noise pollution in metalwork and woodwork industries in the Kingdom of Saudi Arabia. Int J Occup Saf Ergon; 20: 661–70.
Ologe FE, Akande TM, Olajide TG. (2006) Occupational noise exposure and sensorineural hearing loss among workers of a steel rolling mill. Eur Arch Otorhinolaryngol; 263: 618–21.
Pandya GH, Dharmadhikari DM. (2002) A comprehensive investigation of noise exposure in and around an integrated iron and steel works. AIHA J (Fairfax, Va); 63: 172–7.
Rappaport SM, Kromhout H, Symanski E. (1993) Variation of exposure between workers in homogeneous exposure groups. Am Ind Hyg Assoc J; 54: 654–62.
Rappaport SM, Kupper LL. (2008) Quantitative exposure assessment. Califonia: Stephen Rappaport, El Cerrito. ISBN 9780980242805.
Singh LP, Bhardwaj A, Deepak KK. (2013) Occupational noise-induced hearing loss in Indian steel industry workers: an exploratory study. Hum Factors; 55: 411–24.
Sunde E, Irgens-Hansen K, Moen BE et al. (2015) Noise and exposure of personnel aboard vessels in the Royal Norwegian Navy. Ann Occup Hyg; 59: 182–99.
Warrington DN, McLoughlin JR. (2005) Evaluation of occu-pational noise exposure- advantages and disadvantages of noise dosimetry versus sampling using sound level meter. Proceedings of ACOUSTICS: Paper presented at Australian Acoustic Society. Acoust Aust: 345–349: Available at https://pdfs.semanticscholar.org/2763/5ea35c33cd4841902da9c056f3988e987828.pdf (accessed February 2018).
World Steel Association. (2016) Steel Statistical Yearbook 2016. Worldsteel, Brussels, Belgium. Available at https://www.worldsteel.org/en/dam/jcr:37ad1117-fefc-4df3-b84f-6295478ae460/Steel+Statistical+Yearbook+2016.pdf (accessed 14 June 2017).
Dow
nloaded from https://academ
ic.oup.com/annw
eh/article-abstract/62/9/1109/5064905 by guest on 09 July 2019

International Journal of
Environmental Research
and Public Health
Article
Prevalence of Noise-Induced Hearing LossAmong Tanzanian Iron and Steel Workers:A Cross-Sectional Study
Israel P. Nyarubeli 1,2,3,* , Alexander M. Tungu 4, Bente E. Moen 1,3 and Magne Bråtveit 3
1 Centre for International Health, Department of Global Public and Primary Care, University of Bergen,Årstadveien 21, 5020 Bergen, Norway; [email protected]
2 Department of Environmental and Occupational Health, Muhimbili University of Health and AlliedSciences, P.O. Box 65015, Dar es Salaam, Tanzania
3 Research Group for Occupational and Environmental Medicine, Department of Global Public and PrimaryCare, University of Bergen, 5020 Bergen, Norway; [email protected]
4 Department of Physiology, Muhimbili University of Health and Allied Sciences, P.O. Box 65001,Dar es Salaam, Tanzania; [email protected]
* Correspondence: [email protected]
Received: 8 March 2019; Accepted: 13 April 2019; Published: 16 April 2019�����������������
Abstract: Iron and steel factory workers in Tanzania are likely to develop noise-induced hearingloss (NIHL) due to exposure to high sound levels. Studies on hearing status in this populationare lacking. The aims of this study were to determine prevalence of NIHL among iron and steelworkers and compare hearing thresholds at different frequencies with a control group. We conducteda cross-sectional study among 221 iron and steel workers exposed to average noise level of 92 dB(A),compared with 107 primary school teachers recruited as controls and exposed to average noise levelof 79.7 dB(A). We used a questionnaire-based interview to collect information on socio demographiccharacteristics and other confounding variables. Hearing loss was defined as hearing thresholdlevels ≥25 dB hearing loss in either ear at 3000, 4000 or 6000 Hz. The prevalence of hearing loss wassignificantly higher among the exposed group than among the controls, i.e. 48% and 31%, respectively.There were significant differences in hearing thresholds between the exposed and control groups at3000, 4000, 6000, and 8000 Hz. Hearing loss was more frequent among workers exposed to highernoise levels than among the controls suggesting that iron and steel workers run a higher risk ofdeveloping hearing loss.
Keywords: audiometry; occupational; noise-induced hearing loss; hearing threshold; exposed; ironand steel; Tanzania
1. Introduction
Noise-induced hearing loss (NIHL) is an underestimated public health concern [1,2]. Globally,the magnitude of disabling hearing loss (above 40 dB) from all causes has increased in the past twodecades from 120 to 466 million people from 1995 to 2018 [3,4]. Estimates of the prevalence of hearingloss related to noise exposure above 85 dB(A) vary in the range of 7–21% or higher [5]. Prevalence isestimated to be higher in the low and middle-income countries compared to the findings in other partsof the world [4]. This may be due to ongoing economic investments in industrialization coupled withchallenges related to an inadequate public health policy, lack of regulatory frameworks and limitedresources spent on preventive measures.
Studies highlight noise exposure as one major risk factor contributing to hearing loss [1,4,5].Other suggested risk factors for hearing loss include increasing age, [6–8] smoking, [5] exposure to
Int. J. Environ. Res. Public Health 2019, 16, 1367; doi:10.3390/ijerph16081367 www.mdpi.com/journal/ijerph

Int. J. Environ. Res. Public Health 2019, 16, 1367 2 of 13
organic solvents, [9] the use of ototoxic medicines, [5,9] gender, vibration, genetics, ear surgery, earinfections and illnesses [5,10]. In addition, exposure to noise has been associated with increased risksof cardiovascular diseases and diabetes [5,11–14].
Studies conducted in Sub-Saharan Africa (SSA) have mainly focused on the mining sector andindicate, for instance, that the prevalence of hearing loss in this industry was 37% in Zimbabwe and 47%in Tanzania [15,16]. Despite the presence of hearing conservation programmes aimed at prevention,the prevalence of hearing loss was above 50% among gold miners in South Africa, while it was 21%among stone crushers in Ghana [8,17]. To our knowledge, there are no published studies on hearingloss in large iron and steel factories in SSA. One study among iron and steel mill workers in WesternAfrica, specifically Nigeria, found a hearing loss prevalence of 28% and 57% in the better and theworse ears, respectively [18]. This prevalence is almost twice as high as that found in the general adultpopulation in Uganda [10]. One must take into account that the definition and presentation of hearingloss may differ from study to study [1]. Nevertheless, the prevalence of hearing loss is still alarming.
In Tanzania, like in other SSA countries, investments in the manufacturing industries, includingiron and steel industries, create jobs for a significant large number of employees. Globally thedemand for steel is increasing, and this sector has provided employment for 50 million people [19].The construction of new infrastructures such as bridges, flyover exchange roads, buildings, towersand railways obviously create numerous workplaces. Although the construction of industrial-levelinfrastructure represents significant increase in economic assets across SSA, little is known aboutthe prevalence of NIHL in these industries, and documentation is scarce to inform policy-makersand stakeholders working in preventive health services. In a recent study, the eight-hour averagenoise level among iron and steel workers in Tanzania was 92 dB(A), and 90% of the measurementswere above the occupational exposure limit of 85 dB(A). The workers did not use hearing protectiondevices [20] implying that the workers are at increased risk of developing NIHL. There is a need forassessing NIHL in this working group with a view to developing a plan for implementation of ahearing conservation programme. Therefore, the aims of this study were to determine the prevalenceof NIHL among iron and steel workers, and to compare the hearing thresholds at different frequenciesbetween these workers and a control group exposed to a low level of occupational noise.
2. Materials and Methods
2.1. Study Population
This cross-sectional study was conducted from June 2016 until June 2017 and involved permanentmale workers from four iron and steel factories in Tanzania exposed to noise. Characteristics anddetails of noise-exposure assessments in these factories have been presented elsewhere [20]. The resultsshowed a personal, mean equivalent noise exposure (LEX,8h) for these workers of 92.0 dB(A) [20].
Controls were male teachers from 34 public primary schools in Tanzania. This control groupwas chosen because they were expected to be exposed to low levels of occupational noise [5,21–23].In the control group, 24 full-shift noise measurements from six primary schools were conducted usingpersonal dosimeters (type 4448, Brüel and Kjær, DK-2850 Nærum, Denmark) attached to the teacher’sshoulder (ISO standard 9612:2009). The 8-hour equivalent noise exposure among these controls atwork was 79.7 dB(A).
The sample size calculation was based on the estimated prevalence of hearing loss among workersexposed to loud noise at work. Since there was no available information about hearing loss amongnoise exposed workers or among the general population in Tanzania, the sample size was calculatedbased on a community baseline survey conducted in Uganda that found the prevalence of hearing lossamong adults to be 12% [10]. In our study the effect of noise on hearing loss was hypothesized to bedoubled i.e., 24%. To achieve 90% power and be able to detect a difference in hearing loss betweennoise exposed workers and a non-exposed group at a significance level of 0.05 (Using Open-Epi online

Int. J. Environ. Res. Public Health 2019, 16, 1367 3 of 13
calculator Version 3.3a, OpenEpi, Atlanta, GA, USA) [24], totally 230 exposed workers was needed.We added 10% to account for non-responders, providing a total sample size of 253 workers.
2.2. Study Participants
A total of 376 permanent workers (253 from four iron and steel factories and 123 teachers from34 public primary schools) were randomly selected by using a table of random numbers from theprovided list of workers and were invited to participate in the study (Figure 1). Workers list wasprovided by the respective employers. We held meetings with both the management for each factoryand the administration at the public primary school where we presented the purpose of the projectand asked for a research permit. Each of these partners referred us to a contact person who helpedthe research team in the planning of the research activities. The study participants were informed ofthe purpose of the project and those who agreed to participate, provided written consent. This paperpresents the audiometry results.
Int. J. Environ. Res. Public Health 2019, 16, x; 3 of 15
workers was needed. We added 10% to account for non-responders, providing a total sample size of 253 workers.
2.2. Study Participants
A total of 376 permanent workers (253 from four iron and steel factories and 123 teachers from 34 public primary schools) were randomly selected by using a table of random numbers from the provided list of workers and were invited to participate in the study (Figure 1). Workers list was provided by the respective employers. We held meetings with both the management for each factory and the administration at the public primary school where we presented the purpose of the project and asked for a research permit. Each of these partners referred us to a contact person who helped the research team in the planning of the research activities. The study participants were informed of the purpose of the project and those who agreed to participate, provided written consent. This paper presents the audiometry results.
Figure 1. Flow chart describing the participants in the study of hearing loss among exposed iron and steel factory workers (n = 221) and controls—primary school teachers (n = 107) in Tanzania.
We used information collected through a structured interview with both exposed participants and controls to exclude the following categories of workers from the data analysis: those with congenital hearing loss, history of otitis media during childhood .and those reported to have worked in noisy job among the controls. In addition, we excluded those who reported using long-term medication because the participants did not have adequate knowledge of the type of medication they used. Thus, we ended with a total of 328 (221 exposed and 107 controls) persons taking audiometric measurements (Figure 1).
Figure 1. Flow chart describing the participants in the study of hearing loss among exposed iron andsteel factory workers (n = 221) and controls—primary school teachers (n = 107) in Tanzania.
We used information collected through a structured interview with both exposed participants andcontrols to exclude the following categories of workers from the data analysis: those with congenitalhearing loss, history of otitis media during childhood and those reported to have worked in noisyjob among the controls. In addition, we excluded those who reported using long-term medicationbecause the participants did not have adequate knowledge of the type of medication they used. Thus,

Int. J. Environ. Res. Public Health 2019, 16, 1367 4 of 13
we ended with a total of 328 (221 exposed and 107 controls) persons taking audiometric measurements(Figure 1).
The participants were instructed to avoid areas with high level of noise for a minimum of 12 hprior to audiometric examinations to minimize the possibility of temporary threshold shift (TTS).The duration since last occupational noise exposure (free noise exposure) was recorded before theaudiometric test was administered [25,26].
2.3. Interview Questionnaire and Checklist
A structured interview questionnaire was used to collect information on demographiccharacteristics and factors that may influence hearing loss. These included age (in years), number ofyears of employment, history of noise exposure at work (yes/no), current smoking (yes/no), presentuse of long-term medication (yes/no), exposure to chemicals/organic solvents (yes/no), use of hearingprotection while working in noisy areas (yes/no), ear infections as a child or adult (yes/no), headinjury/trauma (yes/no), tinnitus (yes/no). In addition, information about otitis in childhood (yes/no),known congenital hearing loss (yes/no), any relatives with hearing loss and any history of ear-relatedmedical condition (diabetes and hypertension) was collected. This information was collected beforethe audiometry day and used to exclude participants before audiometry (Figure 1).
Prior to otoscopy, but on the same day as the audiometry, participants were interviewed using achecklist indicating whether they had symptoms of upper respiratory infections (e.g., running nose)(yes/no), ear discharge (yes/no), time and date they left work (hours) and the most recent time theywere exposed to high noise at a level that made it difficult to communicate. Afterwards, otoscopywas performed by an occupational physician; in circumstances when the ear canal was completelyobstructed with wax or cerumen, the latter were removed, and a new appointment was scheduled foraudiometry. This also applied to participants with upper respiratory infections; the test was postponeduntil they were asymptomatic.
2.4. Pure Tone Audiometry
Audiometric measurements (pure tone audiometry) were conducted in an ear-screeninglocally-constructed booth in a quiet room at the headquarters of the Occupational Safety and HealthAuthority (OSHA) in Tanzania. The same technical personnel conducted all audiometric tests using astandardized protocol. Background noise in the test booth was monitored by a calibrated hand-heldSound Level Meter (Brüel and Kjær, type 2250), and checked for conformity with ISO 8253-1:2010standard [27]. The highest background noise level (Lmax) in the booth was 51 dB at 31.5 Hz. For bestresults, audiometry was conducted in the morning before any work exposure. In addition, the city isless noisy in the morning compared to other times of the day when the participants could potentiallybe exposed to a higher level of environmental noise. Pure tone audiometry was conducted usingan Interacoustics AD226 (Interacoustics, DK-5500, Middelfart, Denmark) with Amplivox Audiocupearphones having lower test limit of −10 dB. The equipment was pre-calibrated. Test frequencieswere 250–8000 Hz in the order starting with 1000, 2000, 3000, 4000, 6000, 8000, 500, 250 and finish at1000 Hz [27]. A manual test procedure was used in compliance with ISO 8253-1:2010 [26–28].
2.5. Data Analysis
Descriptive statistics were presented as mean and standard deviation or percentage. Chi-squareand independent samples t-tests were used to compare categorical and continuous descriptive variables,respectively. NIHL was defined as hearing threshold level ≥25 dB hearing loss in either ear at 3000,4000 or 6000 Hz [29].
Potential determinants of hearing loss were identified. Age was categorized into three age groups(tertiles) based on the age distribution among the controls. Duration of work was categorized arbitrarilyinto three groups (≤2 years, 2–10 years, 11–37 years). History of ear-related medical conditions (diabetes,hypertension, ear infections and head injury) was combined into a dichotomized variable (yes/no),

Int. J. Environ. Res. Public Health 2019, 16, 1367 5 of 13
current smoking (yes/no), relatives with hearing impairment (yes/no), tinnitus (yes/no) and previousnoisy work (yes/no). A chi-square test was used to explore the relationship between these variablesand hearing loss in exposed participants compared with controls.
The intercorrelation between participant’s age and duration of work determinants was tested withthe Pearson correlation test. In multiple regression analyses, we chose the determinant that contributedmost to the hearing loss.
We used log binomial regression models with a 95% confidence interval (CI) to ascertain differencesin hearing loss (yes/no) between exposed and controls within each age strata and within the total groupof workers while adjusting for the significant determinants selected from Chi-square analyses and thecorrelation test.
We computed the mean hearing threshold for the different test frequencies for both exposedparticipants and controls, as well as for the three age groups within the main exposure groups. For eachtest frequency, multiple linear regression was used to analyze for differences between exposed andcontrols, while adjusting for age as a continuous variable, previous noisy work and history of ear-relatedmedical condition.
The exposed group had a mean exposure duration of 5 years (range: 0–24 years) and a LAeq8h
of 92 dB(A) [20]. Within the three age groups (≤2 years, 2–10 years, 11–37 years) the mean durationof exposure in these factories were 1, 5, and 17 years, respectively. We calculated the predictednoise-induced permanent threshold shift (NIPTS) corresponding to these three mean exposuredurations according to ISO 1999 section 6.3, that provides a formula and method that predicts NIPTSat 1000, 2000, 3000, 4000 and 6000 Hz as a function of the logarithm of exposure duration (d) (in years),and the square of noise exposure level (LAeq8h), with frequency specific constants u, v, and L0 (a soundpressure level, defined as a function of a given constant value for each frequency in decibels [30]:
NIPTS = [u + vlog10 (d)] (LAeq8h − L0)2 (1)
We used IBM SPSS Statistics, Version 25 (Allen & Unwin, 83 Alexander Street, Crown Nest, NSW,Australia) for data analysis and set a parameter of p < 0.05 as statistical significance. NIPTS wasestimated using Microsoft Excel (Office 365, Microsoft Corporation, Redmond, WA, USA).
2.6. Ethical Clearance
We obtained ethical clearance from The Regional Committee of Medical and Health ResearchEthics (REK-VEST) in Norway (number 2016/635/REK sør-øst dated 20 May 2016); and later fromThe Muhimbili University of Health and Allied Sciences (MUHAS) Ethics Committee in Tanzanianumber 2016-06-24/AEC/Vol. XI/38 dated 24 June 2016. Each iron and steel factory and primary schooladministration was contacted individually, and all of them granted permission to conduct the study.Individual participants were contacted and informed about the research objectives and activities to beconducted and gave written consent. Information that was collected was treated as confidential andwas not accessed by unauthorized parties. We used participants’ identification instead of names indata collection, processing and analysis.
3. Results
The participation rate was 87% for both the exposed and controls. The exposed group wassignificantly younger than the controls (independent sample t-test; p < 0.001) (Table 1). There wasa significant difference between exposed and controls for the three descriptive variables; age group,duration of work and previous noisy work, (Chi square test; p < 0.001) but not for the other variablesi.e., current smoking, tinnitus, relative with hearing impairment and history of ear-related medicalcondition (Table 1). Among the exposed, 67% of the workers fell in the youngest age group (18–35 years)(Table 1). In addition, there were significant differences in hearing loss between exposed and controlsfor the four determinants—age group, duration of work, previous noisy work and history of ear-related

Int. J. Environ. Res. Public Health 2019, 16, 1367 6 of 13
medical condition (Chi-square test; p < 0.05). The overall prevalence of hearing loss was significantlyhigher (Chi square test, p = 0.003) among exposed workers (48%) than among the controls (31%)(Table 2).
Table 1. Descriptive characteristics of the participants in the study among noise-exposed (n = 221) andcontrol (n = 107) workers in Tanzania.
CharacteristicsDescriptive p-Value
Exposed (n (%)) Controls (n (%))
Age: Mean (SD) 32 (8) 40 (7) <0.001 a
Age group (years) (group mean for Exposed))18–35 (27) 149 (67.4) 36 (33.6) <0.001 b
36–43 (39) 58 (26.2) 37 (34.6)44–59 (47) 14 (6.3) 34 (31.8)
Total 221 (100.0) 107 (100.0)
Duration of work (years) (group mean for Exposed)≤2 (1) 86 (38.9) - <0.001 b
3–10 (5) 108 (48.9) 27 (25.2)11–37 (17) 27 (12.2) 80 (74.8)
Current smokingno 183 (82.8) 96 (89.7)yes 38 (17.2) 11 (10.3) 0.07
Previous noisy workno 178 (80.5) 107 (100.0)yes 43 (19.5) - <0.001 b
Tinnitusno 202 (91.4) 104 (97.2)yes 19 (8.6) 3 (2.8) 0.06
Relative with hearing impairmentno 199 (90.0) 96 (89.7)yes 22 (10.0) 11 (10.3) 0.9
History of ear-related medical conditionno 176 (79.6) 93 (86.9)yes 45 (20.4) 14 (13.1) 0.01 b
a independent samples t-test; b Chi-square test.
Table 2. Prevalence of hearing loss among exposed (n = 221) and control (n = 107) workers in Tanzania.
Variable
Hearing Loss a (n (%))
Exposed Controls Chi-Square Test(p-Value)
Prevalence Ratio95% Confidence Interval) †
Age group (years)18–35 63 (42.3) 5 (13.9) 0.002 * 2.5 (0.93, 6.76)36–43 34 (58.6) 12 (32.4) 0.013 * 1.7 (0.79, 3.47)44–59 10 (71.4) 16 (47.0) 0.124 1.5 (0.58, 3.70)
All 107 (48.4) 33 (30.8) 1.3 (1.10, 1.62)a Hearing loss defined as ≥25 dB in either ear at 3000, 4000 or 6000 Hz; † log-binomial analysis within each agegroup, adjusted for age as a continuous variable, previous noisy work and history of ear-related medical condition;* p < 0.05.
Hearing loss increased with advancing age among both exposed and controls (Table 2). Withinthe age-groups, there were significant differences in hearing loss between exposed and the controls forthe youngest and middle-aged group (Chi square test, p 1 = 0.002; p 2 = 0.013) but not for the older agegroup (Table 2).
Results from the log binomial regression model, adjusted for age, previous noisy work and historyof ear-related medical condition, showed a statistically higher risk of hearing loss among exposedworkers compared to controls, with a prevalence ratio of 1.3. When performing the analysis within

Int. J. Environ. Res. Public Health 2019, 16, 1367 7 of 13
each age stratum, the youngest age group (18–35 years) had the highest prevalence ratio (2.5), althoughit was not statistically significant (Table 2).
The mean hearing threshold between exposed and control workers at 3000, 4000 and 6000 Hzdiffered significantly (independent samples t-test, p < 0.05) (Table 3). In linear regression analyseswithin each age stratum, there were significant differences in hearing threshold between exposed andcontrols for the frequencies 4000 and 6000 Hz within the youngest age group (18–35 years) adjustingfor age as a continuous variable, previous noisy work and history of ear-related medical condition(Figure 2). In analogous analyses, the hearing threshold for the frequencies 3000, 4000 and 6000 Hzwere significantly different in the 36–43 years age group, and in the age group 44–59 years, only thefrequency 6000 Hz was significantly different (Figure 2).
Table 3. Hearing threshold of the worse ear among noise exposed and controls for the tested frequencies.
Workers’Group
Number ofWorkers
Mean Hearing Thresholds in Decibel (dB) for Each Frequency
250 500 1000 2000 3000 4000 6000 8000
Exposed 221 17.0 (6.1) 19.0 (5.2) 19.4 (6.0) 19.6 (7.3) 23.6 (8.9) a 25.0 (9.7) a 24.3 (10.6) a 16.0 (9.7) a
Control 107 17.2 (5.5) 18.0 (5.7) 19.7 (5.2) 18.8 (8.1) 20.8 (8.0) 21.7 (8.8) 19.6 (9.2) 13.6 (9.8)a independent samples t-test, p < 0.05.
Int. J. Environ. Res. Public Health 2019, 16, x; 8 of 15
Hearing loss increased with advancing age among both exposed and controls (Table 2). Within the age-groups, there were significant differences in hearing loss between exposed and the controls for the youngest and middle-aged group (Chi square test, p 1 = 0.002; p 2 = 0.013) but not for the older age group (Table 2).
Results from the log binomial regression model, adjusted for age, previous noisy work and history of ear-related medical condition, showed a statistically higher risk of hearing loss among exposed workers compared to controls, with a prevalence ratio of 1.3. When performing the analysis within each age stratum, the youngest age group (18–35 years) had the highest prevalence ratio (2.5), although it was not statistically significant (Table 2).
The mean hearing threshold between exposed and control workers at 3000, 4000 and 6000 Hz differed significantly (independent samples t-test, p < 0.05) (Table 3). In linear regression analyses within each age stratum, there were significant differences in hearing threshold between exposed and controls for the frequencies 4000 and 6000 Hz within the youngest age group (18–35 years) adjusting for age as a continuous variable, previous noisy work and history of ear-related medical condition (Figure 2). In analogous analyses, the hearing threshold for the frequencies 3000, 4000 and 6000 Hz were significantly different in the 36–43 years age group, and in the age group 44–59 years, only the frequency 6000 Hz was significantly different (Figure 2).
Table 4 shows the age-stratified differences in hearing thresholds for the different test frequencies in exposed and controls. The regression coefficients show that for the frequencies with significant findings, the difference between exposed and controls was about 3–6 dB among the youngest age group, 4–6 dB in the middle-aged group and about 10 dB for the oldest age group.
The mean hearing threshold among the participants in the 18–35 age group was similar to the predicted NIPTS according to ISO 1999 at the lower frequencies (1000, 2000 and 3000 Hz), while it was about 1 dB higher than ISO 1999 for the higher frequencies (4000 and 6000 Hz) (Figure 3a). For the 36–44 and 45–59 age groups, the hearing threshold for the higher frequencies were lower (3, 1 dB and 6, 4dB lower, respectively) for same frequencies than that the NIPTS predicted by ISO 1999 (Figures 3b and 3c).
Figure 2. Hearing threshold of noise-exposed male workers (n = 221) (dotted lines) compared with male controls (n = 107) (solid lines) in Tanzania, stratified into age groups (triplets).
Figure 2. Hearing threshold of noise-exposed male workers (n = 221) (dotted lines) compared withmale controls (n = 107) (solid lines) in Tanzania, stratified into age groups (triplets).
Table 4 shows the age-stratified differences in hearing thresholds for the different test frequenciesin exposed and controls. The regression coefficients show that for the frequencies with significantfindings, the difference between exposed and controls was about 3–6 dB among the youngest agegroup, 4–6 dB in the middle-aged group and about 10 dB for the oldest age group.

Int.
J.En
viro
n.R
es.P
ublic
Hea
lth20
19,1
6,13
678
of13
Tabl
e4.
Hea
ring
thre
shol
dat
the
test
edfr
eque
ncie
sst
ratifi
edby
age
grou
psam
ong
expo
sed
iron
and
stee
lfac
tory
wor
kers
(n=
221)
and
cont
rols
(n=
107)
inTa
nzan
ia.
Age
Gro
up
Aud
iom
etry
Freq
uenc
y(H
z)
250
500
1000
3000
4000
6000
8000
β95
%C
Iβ
95%
CI
β95
%C
Iβ
95%
CI
β95
%C
Iβ
95%
CI
β95
%C
I
18–3
50.
16−
2.31
,2.6
3−
1.54
−3.
47,0
.39
−0.
53−
2.57
,1.5
2−
3.05
−6.
19,0
.11
−4.
94*−
8.57
,−1.
31−
5.84
*−
10.1
6,−
1.52
−4.
90*−
8.66
,−1.
1436
–43
−0.
14−
3.06
,2.7
7−
1.92
−4.
63,0
.79
−1.
45−
4.54
,1.6
4−
5.70
*−
10.1
1,−
2.27
−6.
37*−
10.9
3,−
1.81
−4.
32*
−8.
73,0
.09
−3.
36−
7.51
,0.7
944
–59
−0.
72−
5.51
,4.0
7−
2.47
−6.
52,1
.59
−1.
070.
67,−
6.20
−6.
85−
14.6
6,0.
95−
4.95
−13
.23,
3.33
−10
.22
*−
18.8
7,−
1.58
−6.
00−
15.4
1,3.
41
Line
arre
gres
sion
anal
ysis
,adj
uste
dfo
rag
eas
aco
ntin
uous
vari
able
,pre
viou
sno
isy
wor
kan
dhi
stor
yof
ear-
rela
ted
med
ical
cond
itio
n.*
Stat
isti
cals
igni
fican
tatp
<0.
05.
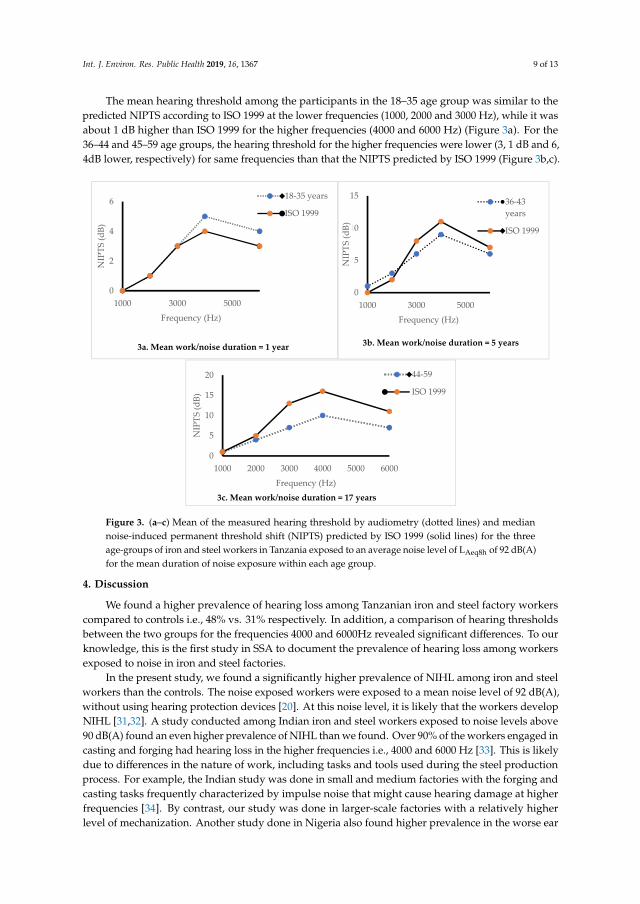
Int. J. Environ. Res. Public Health 2019, 16, 1367 9 of 13
The mean hearing threshold among the participants in the 18–35 age group was similar to thepredicted NIPTS according to ISO 1999 at the lower frequencies (1000, 2000 and 3000 Hz), while it wasabout 1 dB higher than ISO 1999 for the higher frequencies (4000 and 6000 Hz) (Figure 3a). For the36–44 and 45–59 age groups, the hearing threshold for the higher frequencies were lower (3, 1 dB and 6,4dB lower, respectively) for same frequencies than that the NIPTS predicted by ISO 1999 (Figure 3b,c).Int. J. Environ. Res. Public Health 2019, 16, x; 10 of 15
Figure 3. (a, b, c). Mean of the measured hearing threshold by audiometry (dotted lines) and median noise-induced permanent threshold shift (NIPTS) predicted by ISO 1999 (solid lines) for the three age-groups of iron and steel workers in Tanzania exposed to an average noise level of LAeq8h of 92 dB (A) for the mean duration of noise exposure within each age group.
0
2
4
6
1000 3000 5000
NIP
TS (d
B)
Frequency (Hz)
18-35 years
ISO 1999
3a. Mean work/noise duration = 1 year
0
5
10
15
1000 3000 5000
NIP
TS (d
B)
Frequency (Hz)
36-43years
ISO 1999
3b. Mean work/noise duration = 5 years
0
5
10
15
20
1000 2000 3000 4000 5000 6000
NIP
TS (d
B)
Frequency (Hz)
44-59
ISO 1999
3c. Mean work/noise duration = 17 years
Figure 3. (a–c) Mean of the measured hearing threshold by audiometry (dotted lines) and mediannoise-induced permanent threshold shift (NIPTS) predicted by ISO 1999 (solid lines) for the threeage-groups of iron and steel workers in Tanzania exposed to an average noise level of LAeq8h of 92 dB(A)for the mean duration of noise exposure within each age group.
4. Discussion
We found a higher prevalence of hearing loss among Tanzanian iron and steel factory workerscompared to controls i.e., 48% vs. 31% respectively. In addition, a comparison of hearing thresholdsbetween the two groups for the frequencies 4000 and 6000Hz revealed significant differences. To ourknowledge, this is the first study in SSA to document the prevalence of hearing loss among workersexposed to noise in iron and steel factories.
In the present study, we found a significantly higher prevalence of NIHL among iron and steelworkers than the controls. The noise exposed workers were exposed to a mean noise level of 92 dB(A),without using hearing protection devices [20]. At this noise level, it is likely that the workers developNIHL [31,32]. A study conducted among Indian iron and steel workers exposed to noise levels above90 dB(A) found an even higher prevalence of NIHL than we found. Over 90% of the workers engaged incasting and forging had hearing loss in the higher frequencies i.e., 4000 and 6000 Hz [33]. This is likelydue to differences in the nature of work, including tasks and tools used during the steel productionprocess. For example, the Indian study was done in small and medium factories with the forging andcasting tasks frequently characterized by impulse noise that might cause hearing damage at higherfrequencies [34]. By contrast, our study was done in larger-scale factories with a relatively higherlevel of mechanization. Another study done in Nigeria also found higher prevalence in the worse ear

Int. J. Environ. Res. Public Health 2019, 16, 1367 10 of 13
(57%) among steel mill workers exposed to 75–93 dB(A), with pure tone averages of 30 dB, 31 dB and32 dB for the finishing, mill floor and mechanical departments respectively, as compared to a pure toneaverage of 21 dB among administrative workers with lower noise exposure (49 dB(A)) [18]. In Nepal,the prevalence among workers in a steel factory was comparable to our study, i.e., 40% and 46% for theright and left ear, respectively. However, the study excluded workers over 45 years and information onfactory characteristics were not available [35]. Another study done in Nepal among 115 small-scalemetal industry workers and 123 controls found lower prevalence for the exposed (30%) and only 4%for the controls [36]. The difference in prevalence between the Nepal study and our study may be dueto the definition used to define hearing loss [1,36]. However, the high prevalence presented based onthese studies suggests that noise exposure among iron and steel workers contribute substantially tohearing loss [37].
Age is one of the main factors for the development of hearing loss. To adjust for age can be difficultin statistical analyses. In the present study, we stratified the working population into three age groupsand found a borderline increased risk for hearing loss among the younger age group (18–35 years),and significant differences between exposed and controls in hearing thresholds for the frequencies of4000 and 6000Hz. The significant difference in the dip for the 4000 and 6000 Hz frequencies is a signindicating hearing loss due to noise exposure in this age stratum [17,18,38,39]. Similar findings havebeen shown among gold miners in South Africa where the greatest difference in hearing thresholdbetween age strata was found among the younger age group (16–40 years) at the noise dip of 4000 Hz [7].Therefore, it is essential that noise control measures, including hearing conservation programmesshould be established particularly to protect workers from developing NIHL.
In this study we found higher estimates of NIPTS than predicted by ISO 1999 standard for18–35 years at frequencies of 4000 and 6000 Hz. These frequencies are likely to be affected by noiseexposure [40]. The characteristics of noise, size of ear canal and other factors determines the locationof notch for the higher frequencies [41]. However, the notch at these frequencies and especially at4000 Hz is an established clinical sign and may be valuable in confirming the diagnosis of NIHL [40,42].In addition, Our NIPTS estimates, though generally lower than that of ISO 1999 predictions, showsimilar patterns especially at higher frequencies. This result differs from a study conducted inUnited States which reported estimates in agreements to that of ISO 1999 [43]. The lower results andestimates from our study may be explained partly by differences in reference population characteristics.ISO 1999 standard was prepared based on populations from developed and industrialized countriessuch as United States and with steady state noise [30], which it is difficult to compare results to ourstudy that had mixed noise characteristics. However, although the hearing threshold in the age range44–59 years was somewhat lower than predicted from the ISO 1999, the overall results suggests thatnoise exposure among the iron and steel workers leads to an increased risk of NIPTS.
The control group in our study had a significant lower prevalence of hearing loss compared to theexposed workers at higher frequencies. The measured hearing loss in this group was lower than thatrecorded among the controls in South African miners study for the higher test frequencies i.e., 31%versus 46% respectively [8]. The control group in the South Africa study was the administration group,and this makes it difficult to compare with our study. Moreover, the control group in the South Africastudy was not screened for previous noise exposure as we did in our study. The participants in ourcontrol group were screened for several factors responsible for hearing loss and were thus expectedto have low prevalence. This indicates that there might be factors other than noise that may havecontributed to the hearing loss in the South African study. In Tanzania, there are no published data oncommunity hearing profile among adults. Community studies conducted in other African countriessuch as Nigeria and Egypt found a lower prevalence of hearing loss (defined as hearing threshold>25 dB) than we found i.e., 18% and 16%, respectively [44]. However, in these community studies,there is no information on noise exposure profile among the participants, and this makes it difficult tocompare with the control group in our study. Based on the selection of examined workers, including

Int. J. Environ. Res. Public Health 2019, 16, 1367 11 of 13
the control group, we think that it is likely that occupational noise exposure has contributed to thedifference in hearing loss between our two groups.
Strengths of this study are the high response rate among the participants, the use of a controlgroup from workplaces with low sound levels, and the use of standardized methods for audiometry.In addition, it was possible to control for the effect of age in hearing thresholds by stratification of agegroups while adjusting for age as a continuous variable within the age strata. The statistical analysesmade it possible to adjust for potential confounding factors related to hearing loss, such as currentsmoking, previous noise exposure, tinnitus, history of ear-related medical conditions, duration ofwork and relatives with hearing impairments. The use of calibrated research equipment and devicestogether with adherence to the novel procedure related to audiometry testing and ISO 8253-1:2010standard for ambient noise improved the findings.
Our study had some limitations; The design of the study was cross-sectional, and this reducesthe possibility to conclude regarding the causal relationship between noise at work and hearing loss.Still, this study indicates that the sound levels are of importance to the registered hearing losses in thisworking population, as the frequencies involved are in the upper frequency area and the sound levelsmeasured were above 85 dB(A). A longitudinal study would have provided a better exposure-effectassociation. Information collected through interview questionnaire might introduced recall bias.To minimize this bias, we used the same trained research personnel and method for both the exposedand the controls. In addition, in many societies today, people listen to music at high volume levels,and this may affect their hearing ability. We have limited information about leisure time exposure tonoise among our study participants, but we have no reason to believe that the workers in iron and steelfactories are more exposed to leisure time sound than are the control workers. In addition, iron andsteel workers spent most of their time during the day at work. Lastly, it was impractical to monitorworkers at their homes before audiometry.
5. Conclusions
Based on these findings, this study should be a wake-up call for stakeholders in the establishmentand should serve to encourage the implementation of noise control measures such as the use of hearingprotection devices in these workplaces. The information we found on the high prevalence of hearingloss may be used by policy and decision-makers in awareness creation programmes aimed at noisecontrol such as establishing hearing conservation programmes and preventive services among workingpopulations exposed to noise [33].
Author Contributions: I.P.N., B.E.M., M.B. and A.M.T. were involved in project conceptualization, methodology,validation, formal analysis, data curation, writing (original draft preparation), writing (review and editing) andvisualization. I.P.N., J.A.H. and A.M.T. were involved in investigation. In addition, B.E.M. and M.B. were involvedin resources, supervision and project administration.
Funding: This work was financially supported by the Norwegian State Educational Loan Fund (Lånekassen).We also wish to thank the Norwegian Programme for Capacity Development in Higher Education and Researchfor Development (NORHED) for providing equipment for this study.
Acknowledgments: The authors are indebted to administrators in the four factories and 34 primary schools forhosting the project and allowing workers to participate. We thank the workers for their participation. Likewise,our gratitude goes to the field research assistant (Ms. Judith A. Haule), the Muhimbili University of Health andAllied Sciences and the Occupational Safety and Health Authority in Tanzania for their helpful involvement inthis work.
Conflicts of Interest: The authors declare no conflict of interest.
References
1. Rabinowitz, P.M. The Public Health Significance of Noise-Induced Hearing Loss. In Noise-Induced HearingLoss: Scientific Advances; Springer Handbook of Auditory Research 40; le Prell, C.G., Henderson, D.,Fay, R.R., Popper, A.N., Eds.; Springer Science + Business Media, LLC: New York, NY, USA, 2012; pp. 13–25.ISBN 978-1-4419-9523-0.

Int. J. Environ. Res. Public Health 2019, 16, 1367 12 of 13
2. Daniell, W.E.; Swan, S.S.; McDaniel, M.M.; Camp, J.E.; Cohen, M.A.; Stebbins, J.G. Noise exposure andhearing loss prevention programmes after 20 years of regulations in the United States. Occup. Environ. Med.2006, 63, 343–351. [CrossRef]
3. World Health Organization (WHO). Prevention of Blindness and Deafness: Global Estimates on Prevalenceof Hearing Loss, Estimates 2018. Available online: http://www.who.int/pbd/deafness/estimates/en/ (accessedon 14 August 2018).
4. Nelson, D.I.; Nelson, R.Y.; Concha-Barrientos, M.; Fingerhut, M. The global burden of occupationalnoise-induced hearing loss. Am. J. Ind. Med. 2005, 48, 446–458. [CrossRef]
5. Lie, A.; Skogstad, M.; Johannessen, H.A.; Tynes, T.; Mehlum, I.S.; Nordby, K.C.; Engdahl, B.; Tambs, K.Occupational noise exposure and hearing: A systematic review. Int. Arch. Occup. Environ. Health 2015, 89,351–372. [CrossRef]
6. Macca, I.; Scapellato, M.L.; Carrieri, M.; Maso, S.; Trevisan, A.; Bartolucci, G.B. High-frequency hearingthresholds: Effects of age, occupational ultrasound and noise exposure. Int. Arch. Occup. Environ. Health2015, 88, 197–211. [CrossRef] [PubMed]
7. Strauss, S.; Swanepoel, D.W.; Becker, P.; Eloff, Z.; Hall, J.W., III. Noise and age-related hearing loss: A studyof 40 123 gold miners in South Africa. Int. J. Audiol. 2014, 53, 66–75. [CrossRef] [PubMed]
8. Strauss, S.; Swanepoel, D.W.; Becker, P.; Eloff, Z.; Hall, J.W., III. Prevalence and degree of noise-inducedhearing loss in South African gold miners: Original research. Occup. Health South. Afr. 2012, 18, 20–25.
9. Campo, P.; Morata, T.C.; Hong, O. Chemical exposure and hearing loss. Dis. Mon. 2013, 59, 119–138. [CrossRef]10. Westerberg, B.D.; Lee, P.K.; Lukwago, L.; Zaramba, S.; Bubikere, S.; Stewart, I. Cross-sectional survey of
hearing impairment and ear disease in Uganda. J. Otolaryngol. Head Neck Surg. 2008, 37, 753–758.11. Chang, T.Y.; Liu, C.S.; Young, L.H.; Wang, V.S.; Jian, S.E.; Bao, B.Y. Noise frequency components and the
prevalence of hypertension in workers. Sci. Total Environ. 2012, 416, 89–96. [CrossRef]12. Fischer, M.E.; Schubert, C.R.; Nondahl, D.M.; Dalton, D.S.; Huang, G.H.; Keating, B.J.; Klein, B.E.K.;
Klein, R.; Tweed, T.S.; Cruickshanks, K.J. Subclinical atherosclerosis and increased risk of hearing impairment.Atherosclerosis 2015, 238, 344–349. [CrossRef]
13. Ismaila, S.O.; Odusote, A. Noise exposure as a factor in the increase of blood pressure of workers in a sackmanufacturing industry. Beni-Suef Univ. J. Basic Appl. Sci. 2014, 3, 116–121. [CrossRef]
14. Lee, J.H.; Kang, W.; Yaang, S.R.; Choy, N.; Lee, C.R. Cohort study for the effect of chronic noise exposure onblood pressure among male workers in Busan, Korea. Am. J. Ind. Med. 2009, 52, 509–517. [CrossRef]
15. Musiba, Z. The prevalence of noise-induced hearing loss among Tanzanian miners. Occup. Med. 2015, 65,386–390. [CrossRef]
16. Chadambuka, A.; Mususa, F.; Muteti, S. Prevalence of noise induced hearing loss among employees at amining industry in Zimbabwe. Afr. Health Sci. 2013, 13, 899–906. [CrossRef]
17. Kitcher, E.D.; Ocansey, G.; Tumpi, D.A. Early occupational hearing loss of workers in a stone crushingindustry: Our experience in a developing country. Noise health 2012, 14, 68–71. [CrossRef]
18. Ologe, F.E.; Akande, T.M.; Olajide, T.G. Occupational noise exposure and sensorineural hearing loss amongworkers of a steel rolling mill. Eur. Arch. Otorhinolaryngol. 2006, 263, 618–621. [CrossRef]
19. World Steel Association. Worlds Steel in Figures 2015. Available online: https://www.worldsteel.org/media-centre/press-releases/2015/world-Steel-in-figures-2015-is-available-online.html (accessed on 22 April 2018).
20. Nyarubeli, I.P.; Tungu, A.M.; Bråtveit, M.; Sunde, E.; Kayumba, A.V.; Moen, B.E. Variability and determinantsof occupational noise exposure among iron and steel factory workers in Tanzania. Ann. Work Expo. Health2018, 62, 1109–1122. [CrossRef]
21. Shield, B.; Dockrell, J.E. External and internal noise surveys of London primary schools. J. Acoust. Soc. Am.2004, 115, 730–738. [CrossRef]
22. Sarantopoulos, G.; Lykoudis, S.; Kassomenos, P. Noise levels in primary schools of medium sized city inGreece. Sci. Total Environ. 2014, 482–483, 493–500. [CrossRef]
23. Silva, L.T.; Oliveira, I.S.; Silva, J.F. The impact of urban noise on primary schools. Perceptive evaluation andobjective assessment. Appl. Acoust. 2016, 106, 2–9. [CrossRef]
24. Dean, A.G.; Soe, M.M. OpenEpi: Open Source Epidemiologic Statistics for Public Health, Version 3.03a.Available online: http://www.openepi.com/ (accessed on 7 March 2019).

Int. J. Environ. Res. Public Health 2019, 16, 1367 13 of 13
25. National Institute for Occupational Safety and Health (NIOSH). Criteria for A Recommended Standard:Occupational Noise Exposure Revised Criteria 1998. NIOSH, Ed.; Cincinnati, Ohio. Available online:https://www.cdc.gov/niosh/docs/98-126/pdfs/98-126.pdf (accessed on 1 August 2018).
26. Franks, J.R. Hearing measurement. In Occupational Exposure to Noise: Evaluation, Prevention and Control;World Health Organization, Ed.; WHO Electronic Book; WHO: Dortmund, The Netherlands, 2001; Chapter 8;pp. 183–232.
27. International Organization for Standardization (ISO). Acoustics-Audiometric Test Methods—Part1: Pure ToneAir and Borne Conduction Audiometry; ISO standard 8253-1:2010; ISO: Geneva, Switzerland, 2010.
28. British Society of Audiology (BSA). Recommended Procedure: Pure Tone Air Conduction and BorneConduction Threshold Audiometry with or without Masking. 80 Brighton Road, Reading Berkshire, RG61PS, UK: British Society of Audiology; 2011. Available online: http://www.thebsa.org.uk/wp-content/uploads/2014/04/BSA_RP_PTA_FINAL_24Sept11_MinorAmend06Feb12.pdf (accessed on 9 November 2017).
29. The Norwegian Labour Inspection Authority. Audiometric Testing in Noise Exposed Workers; The NorwegianLabour Inspection Authority: Trondheim, Norway, 2013. (In Nowegian)
30. International Organization for Standardization (ISO). Acoustics-Estimation of Noise-Induced Hearing Loss;ISO standard 1999:2013; ISO: Geneva, Switzerland, 2013.
31. Rabinowitz, P.M.; Galusha, D.; McTague, M.F.; Slade, M.D.; Wesdock, J.C.; Dixon-Ernst, C. Trackingoccupational hearing loss across global industries: A comparative analysis of metrics. Noise Health 2012, 14,21–27. [CrossRef]
32. Lutman, M.E. What is the risk of noise-induced hearing loss at 80, 85, 90 dB(A) and above? Occup. Med.2000, 50, 274–275. [CrossRef]
33. Singh, L.P.; Bhardwaj, A.; Kumar, D.K. Prevalence of permanent hearing threshold shift among workers ofIndian iron and steel small and medium enterprises: A study. Noise health 2012, 14, 119–128.
34. Mantysalo, S.; Vuori, J. Effects of impulse noise and continuous steady state noise on hearing. Br. J. Ind. Med.1984, 4, 122–132. [CrossRef]
35. Agarwal, G.; Nagpure, P.S.; Gadge, S.V. Noise Induced Hearing Loss in Steel Factory workers. Int. J. Occup.Saf. Health 2015, 4, 34–43. [CrossRef]
36. Whittaker, J.D.; Robinson, T.; Acharya, A.; Singh, D.; Smith, M. Noise-induced hearing loss in small-scalemetal industry in Nepal. J. Laryngol. Otol. 2014, 128, 871–880. [CrossRef]
37. Dobie, R.A. The burdens of age-related and occupational noise-induced hearing loss in the United States.Ear Hear. 2008, 29, 565–577. [CrossRef]
38. Sulkowski, W.J. Hearing impairment caused by impulse noise: Survey in the drop forging industry.Scand. Audiol. Suppl. 1980, 12, 307–317.
39. Kamal, A.A.; Mikael, R.A.; Faris, R. Follow-up of hearing thresholds among forge hammering workers.Am. J. Ind. Med. 1989, 16, 645–658. [CrossRef]
40. McBride, D.I.; Williams, S. Audiometric notch as a sign of noise induced hearing loss. Occup. Environ. Med.2001, 58, 46–51. [CrossRef]
41. Kirchner, D.B.; Evenson, C.E.; Dobie, R.A.; Rabinowitz, P.M.; Crawford, J.; Kopke, R.; Hudson, T.W.Occupational Noise Induced Hearing Loss. ACOEM task force on Occupational Hearing Loss. ACOEMguidance statement. J. Occup. Environ. Med. 2012, 54, 106–108. [CrossRef] [PubMed]
42. Rabinowitz, P.M.; Galusha, D.; Slade, M.D.; Dixon-Ernst, C.; Sircar, K.D.; Dobie, R.A. Audiogram Notches inNoise-Exposed Workers. Ear Hear. 2006, 27, 742–750. [CrossRef] [PubMed]
43. Dobie, R.A. Noise-induced permanent threshold shifts in occupational noise and hearing survey:An explanation for elevated risk estimates. Ear Hear. 2007, 28, 580–591. [CrossRef] [PubMed]
44. Mulwafu, W.; Kuper, H.; Ensink, R.J. Prevalence and causes of hearing impairment in Africa. Trop. Med. Int.Health 2016, 21, 158–165. [CrossRef]
© 2019 by the authors. Licensee MDPI, Basel, Switzerland. This article is an open accessarticle distributed under the terms and conditions of the Creative Commons Attribution(CC BY) license (http://creativecommons.org/licenses/by/4.0/).
Full Terms & Conditions of access and use can be found athttps://www.tandfonline.com/action/journalInformation?journalCode=vaeh20
Archives of Environmental & Occupational Health
ISSN: 1933-8244 (Print) 2154-4700 (Online) Journal homepage: https://www.tandfonline.com/loi/vaeh20
Occupational noise exposure and hearing loss: Astudy of knowledge, attitude and practice amongTanzanian iron and steel workers
Israel P. Nyarubeli, Alexander M. Tungu, Magne Bråtveit & Bente E. Moen
To cite this article: Israel P. Nyarubeli, Alexander M. Tungu, Magne Bråtveit & Bente E. Moen(2019): Occupational noise exposure and hearing loss: A study of knowledge, attitude and practiceamong Tanzanian iron and steel workers, Archives of Environmental & Occupational Health, DOI:10.1080/19338244.2019.1607816
To link to this article: https://doi.org/10.1080/19338244.2019.1607816
© 2019 The Author(s). Published withlicense by Taylor & Francis Group, LLC
Published online: 29 Apr 2019.
Submit your article to this journal
Article views: 426
View Crossmark data

Occupational noise exposure and hearing loss: A study of knowledge,attitude and practice among Tanzanian iron and steel workers
Israel P. Nyarubelia,b,c, Alexander M. Tungud, Magne Bråtveitc, and Bente E. Moena,c
aDepartment of Global Public and Primary Care, Centre for International Health, University of Bergen, Bergen, Norway; bDepartmentof Environmental and Occupational Health, Muhimbili University of Health and Allied Sciences, Dar es Salaam, Tanzania; cDepartmentof Global Public and Primary Care, Research Group for Occupational and Environmental Medicine, University of Bergen, Norway;dDepartment of Physiology, Muhimbili University of Health and Allied Sciences, Dar es Salaam, Tanzania
ABSTRACTWe assessed Knowledge Attitude and Practice (KAP) regarding occupational noise exposure,Noise-induced hearing loss, audiometry and use of hearing protection devices among ironand steel factory workers exposed to high noise level. A modified, validated, structuredquestionnaire was used to collect information from 253 male workers randomly selectedfrom the four factories. The sum scores for each domain of KAP were computed. Scoresabove 75% were defined as good knowledge and positive attitude. For practice, scores of>50% were defined as good. Independent samples t-test and Chi-squared test were used toanalyze association between KAP and continuous/categorical variables respectively. Majorityof workers displayed poor knowledge and poor practice (94%), but 76% displayed a positiveattitude. Most of the workers (86%) had never been provided with hearing protection devi-ces. The mean scores for attitude and practice differed significantly between the four facto-ries (one-way ANOVA, p< 0.001). Implementation of hearing conservation program withprovision of hearing protection devices are suggested.
KEYWORDSHearing conservationprogram; hearing protectiondevices; iron and steelfactory; knowledge; noiseexposure; noise-inducedhearing loss; worker health
Introduction
Noise-induced hearing loss (NIHL) is a public healthproblem1 that has been increasing in developing coun-tries (including Tanzania), as compared with otherparts of the world.2 The estimated prevalence of NIHLin studies in the field of mining and in iron and steelfactories in Tanzania was 47% and 48% respectively,3,4
which is above the average global prevalence of NIHL,that ranges from 7%–21%.5 A high prevalence of NIHLhas been linked to increased industrialization coupledwith governing institutions’ low capacity for provisionof adequate preventive measures against noise, effectiveprograms to prevent NIHL,6,7 poor data collection sys-tems8,9 and limited research to document the magni-tude of the problem.2 In addition, the coverage ofoccupational health services in the working populationhas been low,7,10 and this might in turn have affectedworkers’ knowledge of occupational noise exposure andprevention of hearing loss.
NIHL (with a permanent threshold shift) is irre-versible once it has occurred, thus effective preventive
solutions are necessary.11 Various noise-control meas-ures exist, namely engineering control (elimination,substitution, targeting of noise-source manipulation),administrative control (changing work practices andschedules, policy-making and enforcing regulationsthat target workers’ behavior) and use of personalprotective equipment (PPE) to protect individualworkers, with regular surveillance.12,13 Evaluation ofthe effectiveness of the interventions implemented hasyielded varied results.14 Nevertheless, studies suggestthat a comprehensive hearing conservation program,including provision and use of hearing protectiondevices (HPDs), may be effective, even when adminis-trative and engineering methods of noise control arenot feasible,15,16 and such intervention has been foundto be associated with less NIHL.17 In countries withlimited resources like Tanzania it would be feasible toadvocate establishment and implementation of hearingconservation programs. To achieve this, it is necessaryto establish and document workers’ Knowledge,Attitude and Practice (KAP) as a prerequisite for
CONTACT Israel P. Nyarubeli [email protected] Department of Global Public and Primary Care, Centre for International Health, Universityof Bergen, Årstadveien 21, 5009 Bergen, Norway.� 2019 The Author(s). Published with license by Taylor & Francis Group, LLCThis is an Open Access article distributed under the terms of the Creative Commons Attribution-NonCommercial-NoDerivatives License (http://creativecommons.org/licenses/by-nc-nd/4.0/), which permits non-commercial re-use, distribution, and reproduction in any medium, provided the original work is properly cited, and is not altered, transformed,or built upon in any way.
ARCHIVES OF ENVIRONMENTAL & OCCUPATIONAL HEALTHhttps://doi.org/10.1080/19338244.2019.1607816

effective planning of interventions. This study is thusbeing conducted to document the level of KAP iniron and steel workers.
There are interactions between various aspects ofindividuals’ knowledge of health and their attitude toit that may affect practices at work.18 A high preva-lence of NIHL has been associated with a low level ofKAP in workers. For example, a cross-sectional studyof 97 Malaysian quarry workers found a high preva-lence of NIHL (57%), while the KAP scores were low,i.e. 11% for knowledge, 10% for attitude and 28% forpractice.19 Other KAP studies have documented vary-ing results about KAP. Two studies, one in Malaysiaand the other in Nigeria, found good knowledge, apositive attitude but poor practice among workers.20,21
In addition, two other studies in Nigeria havereported good knowledge with poor practice.22,23
Practice can also be influenced by factors such asnon-availability of hearing protection devices, highfinancial costs, poorly fitting of hearing protectiondevices, and maintenance, though regular training andsupervision improve usage.20,21,23,24 Also, KAP scoresdiffer among workers in different sectors, necessitatingthe documentation of sectoral related findings foreffective planning and implementation of preventiveinterventions.
Our recent findings show that workers in the ironand steel factories in Tanzania were exposed to per-sonal mean equivalent noise exposure (LEX,8h) of92.0 dB (A).3 Several processes contributed to therecorded sound level such as various operatingmachines, manual handling of metal scraps and steelbillets and feeding metal scraps into furnace.3 Theprevalence of NIHL in these workers was 48%,25 sug-gesting an urgent need for effective noise-controlintervention. To our knowledge, there is no publishedinformation from iron and steel factories in Tanzaniathat would inform policy and decision makers andmight be useful in the formulation and implementa-tion of preventive measures seeking to improve thesituation of workers. The purpose of this study wasthus to assess KAP in iron and steel factory workersin Tanzania exposed to a high level of noise.
Materials and methods
Study population
We conducted a cross-sectional study of 253 ran-domly selected male participants working in steel-barproduction lines in four iron and steel factories inDar es Salaam, Tanzania between June 2016 and June2017. The main study also comprised audiometry to
examine hearing loss among the workers and meas-urement of noise exposure in the factories. The detailsof noise levels and the characteristics of the studiedfactories are presented elsewhere.3
The sample size calculation was based on the esti-mated prevalence of hearing loss among workersexposed to loud noise at work. Since there was noavailable information about hearing loss among noiseexposed workers or among the general population inTanzania, the sample size was calculated based on acommunity baseline survey conducted in Uganda thatfound the prevalence of hearing loss among adults tobe 12%.26 In our study the effect of noise on hearingloss was hypothesized to be doubled i.e. 24%. Toachieve 90% power and be able to detect a differencein hearing loss between noise exposed workers and anon-exposed group at a significance level of 0.05(Using Open-Epi online calculator Version 3.3a),27
totally 230 exposed workers was needed. We added10% to account for non-responders, providing totalsample size of 253 workers.
Study participants
The research team held meetings with the manage-ment of each factory, explained the purpose of theresearch and requested permission to conduct the pro-ject. All four factories agreed to participate. The man-agements of these factories each assigned a contactpersonnel to help the research team with the planningand implementation of the research activities. Weincluded permanent production line workers whoconsented to participate and excluded workers inother sections without occupational noise exposure. Alist of permanent workers was provided, and 253workers were randomly selected from a total of 588production workers of four factories. These workerswere contacted and informed about the project objec-tives and were required to give written consent. Allworkers selected agreed to participate in the project.This study was ethically cleared by Ethical committeesin Norway and Tanzania and all workers participatedgave informed consent prior to their inclusion intothe study.
Interview questionnaire
A modified, validated, structured KAP questionnairefrom a study of Malaysian sawmill workers was usedto collect information from 253 workers through aninterview.20,28 This Malaysian questionnaire wasmodified to suit the local context, e.g. the statementin the knowledge-assessment part asking for hobbies
2 I. P. NYARUBELI ET AL.

was modified to omit the word ‘scuba’, adding‘listening to loud music for long time’. A statementinvolving specific legislation in Malaysia was modifiedand remained as a neutral statement unrelated to anycountry. The word ‘sawmill’ was omitted, and theword ‘deafness’ was translated into ‘hearing loss’ (HL).The English version of the questionnaire was trans-lated into Swahili and then back into English once tocheck for logical consistency and meaning. Nochanges were made after translation.
Workers’ knowledge regarding NIHL was assessedusing 18 statements, each with a score of ‘1’ for cor-rect response and a maximum score of 18 points,equivalent to 100%. The 18 statements in the know-ledge domain were for collection of information onthe causes, symptoms, treatment and preventionof NIHL.
Workers’ attitudes to the importance of noisereduction at the workplace, NIHL, audiometry andwearing of hearing protection devices were assessedby 13 statements, using a five-point scale rangingfrom ‘strongly disagree’, ‘disagree’ and ‘neither dis-agree or agree’ to ‘agree’ and ‘strongly agree’, eachwith a corresponding score of between one and five.The maximum score was 65 points, equivalentto 100%.
Workers’ practice regarding provision and use ofhearing protection devices, health and safety trainingand audiometry were assessed using 12 statementswith the three possible responses ‘always’, ‘sometimes’and ‘never’, and with scores of 3, 2 and 1, respectively.The maximum score was 36 points, equivalentto 100%.
Information regarding participants’ socio-demo-graphics, i.e. age in years, duration of work (in years)and educational level (no formal education, primaryeducation, secondary and tertiary education) was alsocollected. All information was collected by a researchassistant trained for the study.
Data analysis
Descriptive statistics were presented as means andstandard deviation for continuous variables and fre-quencies or percentages for categorical variables.
The variable age in years was categorized as tertiles,with almost equal percentages of participants.Duration of work was arbitrarily categorized inaccordance with three groups (�2 years, 3–10 years,11–24 years). The educational-level variable was dicho-tomized (primary education¼ 0 vs secondary and
tertiary education¼ 1), as there were no participantswithout any formal education.
The sum scores for the KAP domains were com-puted, converted into percentages of the total scoreand then dichotomized, with knowledge and attitudescores of �75% being defined as good knowledge andpositive attitude, respectively,20 whilst the practicescore of �50% was defined as good practice.
In the sum scores for KAP, the differences betweenage and duration of work were explored using one-way Analysis of Variance (ANOVA), whilst an inde-pendent samples t-test was used to analyze the associ-ation between KAP and the continuous variables, i.e.age, duration of work and educational level. Chi-squared test was used to analyze the associationbetween dichotomized KAP and categorical variables,i.e. age group, duration of work and educational level.Two multiple linear regression analysis was used toexplore the relationship between attitude and practicescores as dependent variables, respectively and the sig-nificant variables from the preliminary analyses, i.e.educational level and the factory. In this analysis,three dummy variables were used for factory B, fac-tory C and factory D. Factory A was usedas reference.
Internal consistency in distinct items in eachdomain of knowledge, attitude and practice was eval-uated using Cronbach’s Alpha coefficient (a), theresults being a¼ 0.74, 0.70 and 0.72, respectively.
The IBM SPSS statistics, Version 25 was used fordata analysis and a parameter of p< 0.05 was set asstatistical significance.
Ethical consideration
This study was completed in accordance with theHelsinki Declaration of 1975 and its subsequent revi-sions. The ethical clearance for this study was issuedby The Regional Committee of Medical and HealthResearch Ethics (REK-VEST) in Norway number2016/635/REK sør-øst dated 20th May 2016; and TheMuhimbili University of Health and Allied Sciences(MUHAS) Ethics Committee in Tanzania withInstitutional Review Board (IRB) number 2016-06-24/AEC/Vol. XI/38 dated 24th June 2016. Permission toconduct the study was granted by each iron and steelfactory. The information collected was treated as con-fidential. Each individual participant was contactedand informed about the research objectives and activ-ities to be conducted and gave written consent priorto inclusion into the study.
ARCHIVES OF ENVIRONMENTAL & OCCUPATIONAL HEALTH 3

Results
The participants’ mean age (in years) was 32 (range:18-64), and 68% of them were under 35. The meanage for Factory A was 29 (SD¼ 6), for Factory B 36(9), for Factory C 29 (8) and for Factory D 33 (7).Sixty-seven per cent had received primary education,33% had received secondary and tertiary educationand 88% had worked for 3 to 10 years (Table 1). Theparticipation was 100%.
The mean scores for attitude and practice differedsignificantly between the four factories (one-wayANOVA, p< 0.001) (Table 1). Factory A had a sig-nificantly lower mean attitude score than the otherthree factories, whilst there was no significant differ-ence between those other three factories. The meanpractice score for Factory D was significantly lowerthan for the other three factories (A, B and C), whilstthere was no significant difference in mean practicescores between those three factories. The mean know-ledge scores did not differ between any of the fourfactories (one-way ANOVA, p> 0.05).
Overall the mean score for knowledge did not dif-fer significantly between the subgroups for age, dur-ation of work and educational level (Table 1). Only23% of participants had a good knowledge (score �75%) of occupational noise-exposure hearing loss(Table 1).
There was a significant difference in attitude scoresbetween participants who had received primary educa-tion and those who had received secondary and ter-tiary education (independent samples t-test, p¼ 0.01)(Table 1). The participants who had received primaryeducation had a significantly more positive attitudethan those who had received secondary and tertiaryeducation (chi-square test, p< 0.05) (Table 1). In thepractice domain, participants who had received pri-mary education had significantly lower scores thantheir counterparts (independent samples t-test,p¼ 0.03) (Table 1). The overall mean scores for prac-tice was low (Table 1).
In the multiple linear regression model for the atti-tude domain, factory B, factory C and factory D had
Table 1. Descriptive characteristics of the participants and their association with KAP in the study among Tanzanian iron andsteel workers (N¼ 253).
KAP distribution
Descriptive Knowledge† Attitude‡ Practice§
Variable Frequency (%) Good [n (%)]Mean score[mean (SD)] Positive [n (%)]
Mean score[mean (SD)] Good [n (%)]
Mean score[mean (SD)]
Age: Mean (SD) 32 (8)Factory identificationFactory A 71 (28.1) 8 (11.3) 9.1 (3.3) 27 (38.0) 48.5 (9.2)†† 5 (7.0) 13.8 (2.1)††
Factory B 57 (22.5) 4 (7.0) 9.5 (2.9) 52 (91.2) 57.1 (4.5) 3 (5.3) 13.6 (1.8)Factory C 61 (24.1) 7 (11.5) 9.0 (3.1) 51 (83.6) 56.2 (6.1) 7 (11.5) 13.9 (3.3)Factory D 64 (25.3) 4 (6.3) 9.0 (3.2) 61 (95.3) 58.5 (5.1) 0 12.1 (0.2)Total 253 (100.0) 23 (9.1) 9.1 (3.1) 191 (75.5) 54.8 (7.7) 15 (5.9) 13.3 (2.3)
Age group (years)18–27 89 (35.2) 11 (12.4) 9.0 (3.4) 61 (68.5) 53.9 (8.3) 7 (7.9) 13.5 (2.7)28–35 84 (33.2) 7 (8.3) 9.3 (3.1) 63 (75.0) 54.6 (7.9) 3 (3.6) 13.0 (2.0)36–64 80 (31.6) 5 (6.3) 9.0 (2.9) 67 (83.8) 56.1 (6.7) 5 (6.3) 13.4 (1.9)
Duration of work (years)�2 105 (41.5) 10 (9.5) 9.2 (3.1) 79 (75.2) 55.0 (8.0) 7 (6.7) 13.2 (2.1)3–10 117 (46.2) 12 (10.3) 9.0 (3.3) 87 (74.4) 54.6 (7.9) 6 (5.1) 13.3 (2.5)11–37 31 (12.3) 1 (3.2) 9.0 (2.4) 25 (80.6) 55.8 (6.1) 2 (6.5) 13.8 (2.0)
Education levelPrimary education 169 (66.8) 16 (9.5) 9.2 (3.0) 136 (80.5)¶ 55.7 (6.9)# 7 (4.1) 13.1 (1.8)#
Secondary and ter-tiary education
84 (33.2) 7 (8.3) 9.0 (3.4) 55 (65.5) 53.0 (8.9) 8 (9.5) 13.8 (2.9)
†Knowledge score (as a percentage) categorized as Good (�75%/poor< 75%); ‡attitude score (as a percentage) categorized as positive(�75%/negative< 75%).
§practice score (as a percentage) categorized as Good (�50%/poor< 50%); ¶Chi-square test, statistically significant at p< 0.05.#independent samples t-test, statistically significant at p< 0.05.††One-way analysis of variance (ANOVA) with Post-hoc Turkey HSD test, statistically significant at p< 0.05.
Table 2. Determinants for attitude and practice in a KAPstudy among 253 iron and steel factory workers in Tanzania.
DeterminantAttitude Practice
b 95%, CI b 95%, CI
Factory identificationFactory A Ref. Ref.Factory B 12.91� 11.89, 13.93 –0.10 –0.70, 0.49Factory C 11.71� 10.75, 12.68 0.35 –0.21, 0.91Factory D 15.19� 14.22, 16.16 –4.39� –4.96, –3.83
Education levelPrimary education Ref. Ref.Secondary and tertiaryeducation
–0.94� –1.71, –0.17 1.33� 0.88, 1.78
�Multiple linear regression, statistical significant at p< 0.05.
4 I. P. NYARUBELI ET AL.

higher scores than factory A, while secondary/tertiaryeducation was associated with lower score than pri-mary education. This regression model explained 28%of the total variance in attitude score (Table 2).
For the practice domain, factory D had lower scorethan factory A (reference), while secondary/tertiaryeducation was associated with higher score than pri-mary education (Table 2). These two determinants(educational level and factory D) explained 12% of thetotal variance in practice.
A high proportion of the participants had a pooroverall knowledge of the specific causes of NIHL(Figure 1). For example, only 16% responded correctlyto the statement ‘HL may occur due to high-impactnoise exposure, e.g. gunfire, and 45% to the statement‘HL may occur if an individual is continuouslyexposed to a noisy environment’. Regarding NIHLsymptoms, 88% responded correctly to the statement‘Poor hearing of normal speech is a sign of HL’ and79% to the statement ‘Ringing in the ear is the sign ofHL’. Nevertheless, only 33% responded correctly tothe statement ‘HL due to noise exposure is perman-ent’, 21% to the statement ‘HL due to noise exposurecan be treated by using medicines’ and only 14% tothe statement ‘Stopping working in high noise levelresults into complete recovery when you haveacquired HL’ (Figure 1). With regard to prevention,87% responded correctly to the statement ‘Wearing
earplugs/earmuffs prevents HL’, 43% to the statement‘Encapsulating the noisy machines reduces noiseexposure’, 38% to the statement ‘Reducing hours ofworking in a noisy section prevents HL’ and 53% tothe statement ‘Laws exist to protect workers frombeing exposed to high noise at work’ (Figure 1).
Overall 76% of the participants had a positive atti-tude to the importance of noise reduction at theworkplace, NIHL, audiometry and wearing of hearingprotection devices. Findings from specific items showthat about 86% of the participants ‘strongly disagreed’with the statement ‘I think ear-screening program(audiometry) is not so important at my workplace’,80% with the statement ‘I feel wearing hearing protec-tion devices during work is a burden and is uncom-fortable’ and about 66% with the statement ‘I don’twork in noise level that may harm my hearing’(Figure 2). However, about 78% ‘strongly disagreed’with the statement ‘I feel my employer should beinformed if I have HL’ and about 61% with the state-ment ‘I feel it is our shared responsibility to reduceworkplace noise exposure’ (Figure 2).
About 94% of the participants displayed poor prac-tice regarding provision and use of hearing protectiondevices, health and safety training and audiometry(Figure 3). The majority of the participants responded‘Never’ to most of the statements. For example, 82%responded ‘Never’ to the statement ‘availability of
Figure 1. Knowledge score (as a percentage) regarding noise-induced hearing loss (NIHL) (causes, symptoms, treatment and pre-vention) for various items in 253 iron and steel workers in Tanzania. The correct answer for each item is indicated by Y¼ yesand N¼ no.
ARCHIVES OF ENVIRONMENTAL & OCCUPATIONAL HEALTH 5

posters in sections required to wear earplugs/muffs’,95% to the statement ‘Workers attend organized train-ings on using hearing protection devices at the work-place’ and 91% to the statement ‘Workers undergoear-screening test (audiometry) annually’. In addition,86% of the participants responded ‘Never’ to ‘Workersprovided with hearing protection devices at work’,and a similar percentage responded likewise to‘Workers wear hearing protection devices when work-ing in a noisy environment’ (Figure 3).
Discussion
Overall few workers in the four iron and steel facto-ries had a good knowledge of NIHL. In addition, amajority of them displayed poor practice regardinguse of hearing protection devices and a considerablenumber of them reported non-availability of thesedevices at their workplaces. However, the majoritywere found to have a positive attitude to the import-ance of noise reduction at the workplace, NIHL, audi-ometry and wearing of hearing protection devices.
Figure 2. Attitude score (as a percentage) for noise exposure and control, noise-induced hearing loss (NIHL), audiometry and wear-ing of hearing protection devices for various items in 253 iron and steel workers in Tanzania. The correct answer is indicated in abox following each statement, where SD¼ Strongly disagree and SA¼ Strongly agree.
Figure 3. Percentage score for 13 items used for assessment of workers’ practice in a study among 253 iron and steel workersin Tanzania.
6 I. P. NYARUBELI ET AL.

This suggests limited availability of education andtraining and a lack of hearing protection devicesfor workers.
A study of Malaysian quarry workers found a highprevalence of NIHL (57%), with a low level of know-ledge (11%) among workers.19 The present studyfound a fairly similar result, with the majority of ourstudy participants displaying poor knowledge, and inthese workers, the prevalence of NIHL was found tobe high, i.e. 48%.25 A study of Ghanaian mill workersalso reported similar findings, with a high prevalenceof NIHL (44%) and a relatively low level of knowledge(55%).29 Thus, in these three studies there is an asso-ciation between a low level of knowledge and a highprevalence of NIHL among noise exposed workers.Contrastingly, a study of Nigerian steel-mill workersfound a good level of knowledge in workers (93%),22
but a high prevalence of NIHL (57%),30 indicatingthat a good level of knowledge may not be sufficientto prevent NIHL, and that there may be other con-tributory factors.31
Our study participants displayed less knowledge ofspecific items, e.g. whether noise exposure may causeNIHL, than workers in Malaysian sawmills (78%) andNigerian steel-mills (93%).20,22 The high knowledgescore in those studies was presumably the result ofpersonal experience of work in a noisy environ-ment.22,32 In addition, the majority of our participantswere not aware that stopping work in a high noiselevel will not result in complete recovery if NIHL hasalready been acquired, compared with 54% and 22%among workers in Malaysian sawmills and quarriesrespectively. One explanation may be the lack of aneffective education and training program regardingoccupational noise hazards and related hearing lossamong iron and steel workers. An integrated educa-tion and training program for workers may thus beappropriate to improve workers’ knowledgeof NIHL.14,15,29
Our findings indicate that the majority of our studyparticipants had a positive attitude to the importanceof noise reduction at the workplace, NIHL, audiom-etry and wearing of hearing protection devices. Oneexplanation may be what they perceive to be the riskof working in noisy environment. Our finding is inline with two studies of Malaysian sawmill and quarryworkers, whose attitude scores were 61% and 70%respectively.19,20 The positive attitude of our studyparticipants may be regarded as an intention tochange their behavior,33 and is likely to be a goodsign for future preventive work.
The attitude of our participants regarding specificitems was analogous to that ascertained in the studies
of Malaysian sawmill and quarry workers.19,20 Mostworkers had a positive attitude to use of hearing pro-tection devices. For example, 80% of our participantshad a positive attitude, whilst in Malaysian sawmilland quarry workers the proportional of the partici-pants were 92% and 94% respectively. This may indi-cate the potential success of noise-preventivemeasures, including provision of hearing protectiondevices. In addition, 86% of our participants had apositive attitude to ear screening, comparable to thatin Malaysian sawmill and quarry workers, ie 84% and89% respectively. However, 78% had a negative atti-tude to sharing their ear-screening (audiometry)results with their employers – an attitude quite similarto that displayed by Malaysian quarry workers(87%).19 This careful attitude may be due to a fear oflosing their job. It may also be due to a lack of know-ledge of the effect of occupational noise exposureon hearing.
Our results show that participants who havereceived secondary and tertiary education displayedbetter practice than those who have received primaryeducation. Our findings are in line with a study ofMalaysian quarry workers, where workers who hadreceived education below secondary level displayedignorance of the use of personal protective equip-ment.19 This is probably because of the increasedknowledge gained in school, which can sometimes betranslated into the way people think and act.Surprisingly, in our study workers who had receivedprimary education had a more positive attitude to theimportance of noise reduction at the workplace,NIHL, audiometry and wearing of hearing protectiondevices. than those who had received secondary andtertiary education. These findings differ from thosefor Malaysian quarry workers. One of the explanationsmay be that formal education does not necessarilychange human perception of workplace hazards suchas noise. Also, the difference between our study andthe Malaysian quarry study might lie in the method-ology, whereby workers who had not received any for-mal education were compared with those who hadreceived a formal education, whilst there were noworkers who had not received a formal education inour present study.
In our study the overall practice was poor, as only14% of the participants had been provided with andused hearing protection devices. In addition, factoryD has the lowest practice score among others. This isanalogous to the Malaysian sawmill and quarry stud-ies, where 12% and 14% of workers respectively usedhearing protection devices.20 This may in part beexplained by the non-availability of these devices in
ARCHIVES OF ENVIRONMENTAL & OCCUPATIONAL HEALTH 7
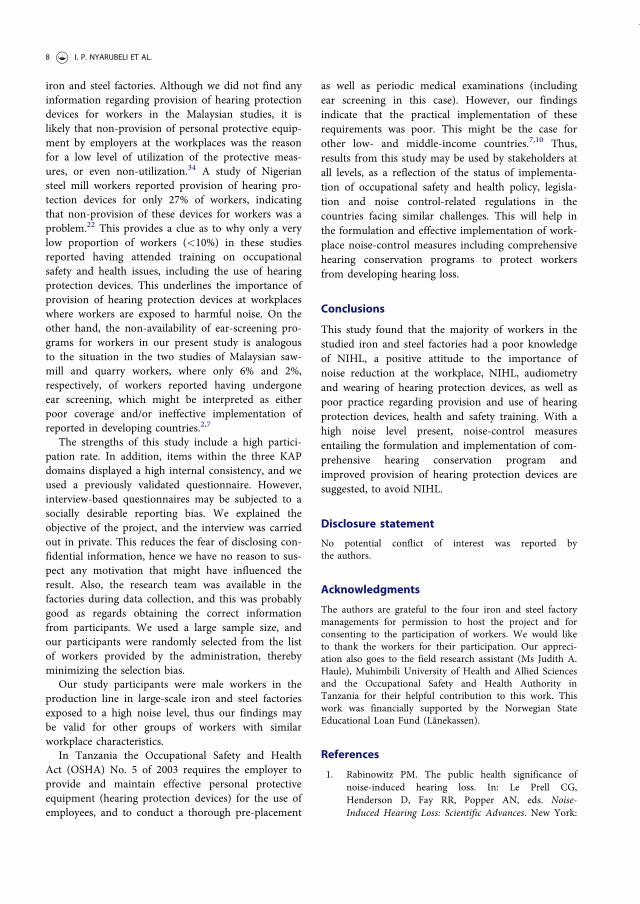
iron and steel factories. Although we did not find anyinformation regarding provision of hearing protectiondevices for workers in the Malaysian studies, it islikely that non-provision of personal protective equip-ment by employers at the workplaces was the reasonfor a low level of utilization of the protective meas-ures, or even non-utilization.34 A study of Nigeriansteel mill workers reported provision of hearing pro-tection devices for only 27% of workers, indicatingthat non-provision of these devices for workers was aproblem.22 This provides a clue as to why only a verylow proportion of workers (<10%) in these studiesreported having attended training on occupationalsafety and health issues, including the use of hearingprotection devices. This underlines the importance ofprovision of hearing protection devices at workplaceswhere workers are exposed to harmful noise. On theother hand, the non-availability of ear-screening pro-grams for workers in our present study is analogousto the situation in the two studies of Malaysian saw-mill and quarry workers, where only 6% and 2%,respectively, of workers reported having undergoneear screening, which might be interpreted as eitherpoor coverage and/or ineffective implementation ofreported in developing countries.2,7
The strengths of this study include a high partici-pation rate. In addition, items within the three KAPdomains displayed a high internal consistency, and weused a previously validated questionnaire. However,interview-based questionnaires may be subjected to asocially desirable reporting bias. We explained theobjective of the project, and the interview was carriedout in private. This reduces the fear of disclosing con-fidential information, hence we have no reason to sus-pect any motivation that might have influenced theresult. Also, the research team was available in thefactories during data collection, and this was probablygood as regards obtaining the correct informationfrom participants. We used a large sample size, andour participants were randomly selected from the listof workers provided by the administration, therebyminimizing the selection bias.
Our study participants were male workers in theproduction line in large-scale iron and steel factoriesexposed to a high noise level, thus our findings maybe valid for other groups of workers with similarworkplace characteristics.
In Tanzania the Occupational Safety and HealthAct (OSHA) No. 5 of 2003 requires the employer toprovide and maintain effective personal protectiveequipment (hearing protection devices) for the use ofemployees, and to conduct a thorough pre-placement
as well as periodic medical examinations (includingear screening in this case). However, our findingsindicate that the practical implementation of theserequirements was poor. This might be the case forother low- and middle-income countries.7,10 Thus,results from this study may be used by stakeholders atall levels, as a reflection of the status of implementa-tion of occupational safety and health policy, legisla-tion and noise control-related regulations in thecountries facing similar challenges. This will help inthe formulation and effective implementation of work-place noise-control measures including comprehensivehearing conservation programs to protect workersfrom developing hearing loss.
Conclusions
This study found that the majority of workers in thestudied iron and steel factories had a poor knowledgeof NIHL, a positive attitude to the importance ofnoise reduction at the workplace, NIHL, audiometryand wearing of hearing protection devices, as well aspoor practice regarding provision and use of hearingprotection devices, health and safety training. With ahigh noise level present, noise-control measuresentailing the formulation and implementation of com-prehensive hearing conservation program andimproved provision of hearing protection devices aresuggested, to avoid NIHL.
Disclosure statement
No potential conflict of interest was reported bythe authors.
Acknowledgments
The authors are grateful to the four iron and steel factorymanagements for permission to host the project and forconsenting to the participation of workers. We would liketo thank the workers for their participation. Our appreci-ation also goes to the field research assistant (Ms Judith A.Haule), Muhimbili University of Health and Allied Sciencesand the Occupational Safety and Health Authority inTanzania for their helpful contribution to this work. Thiswork was financially supported by the Norwegian StateEducational Loan Fund (Lånekassen).
References
1. Rabinowitz PM. The public health significance ofnoise-induced hearing loss. In: Le Prell CG,Henderson D, Fay RR, Popper AN, eds. Noise-Induced Hearing Loss: Scientific Advances. New York:
8 I. P. NYARUBELI ET AL.
Springer ScienceþBusiness Media, LLC; 2012:13–25.doi:10.1007/978-1-4419-9523-0_2.
2. Smith AW. The World Health Organization and theprevention of deafness and hearing impairmentcaused by noise. Noise Health. 1998;1:6–12.
3. Nyarubeli IP, Tungu AM, Bratveit M, Sunde E,Kayumba AV, Moen BE. Variability and determinantsof occupational noise exposure among iron and steelfactory workers in Tanzania. Ann Work ExpoHealth.2018;62(9):1109–1122. doi:10.1093/annweh/wxy071.
4. Musiba Z. The prevalence of noise-induced hearingloss among Tanzanian miners. OCCMED. 2015;65(5):386–390. doi:10.1093/occmed/kqv046.
5. Nelson DI, Nelson RY, Concha-Barrientos M, et al.The global burden of occupational noise-inducedhearing loss. Am J Ind Med. 2005;48(6):446–458. doi:10.1002/ajim.20223.
6. Concha-Barrientos M, Campbell-Lendrum D,Steenland, K. Occupational Noise: assessing the Burdenof Disease from Work-Related Hearing Impairment atNational and Local Levels. Geneva: World HealthOrganization; 2004, (WHO Environmental Burden ofDisease Series, No. 9), ISBN 9241591927.
7. Mrema EJ, Ngowi AV, Mamuya SH. Status of occupa-tional health and safety and related challenges inexpanding economy of Tanzania. Ann Glob Health.2015;81(4):538–547. doi:10.1016/j.aogh.2015.08.021.
8. Nuwayhid IA. Occupational health research in devel-oping countries: a partner for social justice. Am JPublic Health. 2004;94(11):1916–1921. doi:10.2105/AJPH.94.11.1916.
9. Christiani DC, Durvasula R, Myers J. Occupationalhealth in developing countries: review of researchneeds. Am J Ind Med. 1990;17(3):393–401. doi:10.1002/ajim.4700170311.
10. Rantanen J, Lehtinen S, Valenti A, Iavicoli S. A globalsurvey on occupational health services in selectedinternational commission on occupational health(ICOH) member countries. BMC Public Health 2017;17(1):787. doi:10.1186/s12889-017-4800-z.
11. Basner M, Babisch W, Davis A, et al. Auditory andnon-auditory effects of noise on health. Lancet 2014;383(9925):1325–1332. doi:10.1016/S0140-6736(13)61613-X.
12. National Institute for Occupational Safety and Health(NIOSH). Criteria For A Recommended Standard:Occupational Noise Exposure Revised Criteria1998:105. NIOSH, Ed. Cincinnati, Ohio; 1998.
13. Health and Safety Executive (HSE). Controlling noiseat work. The Control of Noise at Work Regulations2005 no. 1643. Guidance on Regulations; 2005.
14. Verbeek JH, Kateman E, Morata TC, Dreschler WA,Mischke C. Interventions to prevent occupationalnoise-induced hearing loss: a Cochrane systematicreview. Int J Audiol. 2014;53(Supp. 2):S84–S96. doi:10.3109/14992027.2013.857436.
15. Okpala NC. Knowledge and attitude of infantry sol-diers to hearing conservation. Mil Med. 2007;172(5):520–522.
16. Dobie RA. Cost-effective hearing conservation: regula-tory and research priorities. Ear Hear.2018;39(4):621–630. doi:10.1097/AUD.0000000000000523.
17. Tikka C, Verbeek JH, Kateman E, Morata TC, DreschlerWA, Ferrite S. Interventions to prevent occupationalnoise-induced hearing loss. Cochrane Database Syst Rev.2017;7:Cd006396. doi:10.1002/14651858.
18. Badran IG. Knowledge, attitude and practice the threepillars of excellence and wisdom: a place in the med-ical profession. East Mediterr Health J. 1995;1(1):8–16.
19. Ismail AF, Daud A, Ismail Z, Abdullah B. Noise-induced hearing loss among quarry workers in anorth-eastern state of Malaysia: a study on knowledge,attitude and practice. Oman Med J. 2013;28(5):331–336. doi:10.5001/omj.2013.9.
20. Razman Mohd R, Daud A, Musa KI, Naing L.Knowledge, attitude and practice of sawmill workerstowards noise-induced hearing loss in Kota Bharu,Kelantan. Malays J Med Sci. 2008;15(4):28–34.
21. Okafoagu NC, Oche M, Awosan KJ, et al.Determinants of knowledge and safety practices ofoccupational hazards of textile dye workers in Sokoto,Nigeria: a descriptive analytic study. J Public HealthAfr. 2017;8(1):664. doi:10.4081/jphia.2017.664.
22. Ologe FE, Akande TM, Olajide TG. Noise exposure,awareness, attitudes and use of hearing protection ina steel rolling mill in Nigeria. Occup Med (Lond).2005;55(6):487–489. doi:10.1093/occmed/kqi089.
23. Sogebi OA, Amoran OE, Iyaniwura CA, Oyewole EA.Awareness and attitudes to noise and its hazards inmotor parks in a sub-urban Nigerian town. NigerPostgrad Med J. 2014; 21(1):40–45.
24. Sayapathi SB, Su TA, Koh D. Knowledge, attitude andpractice in relation to noise - induced hearing loss intwo factories. Res J Biol Sci. 2014;9(6):197–2014.
25. Nyarubeli IP, Tungu AM, Moen BE, Bråtveit M.Prevalence of Noise-Induced Hearing Loss AmongTanzanian Iron and Steel Workers: A Cross- SectionalStudy.Int J. Environ. Res. Public Health 2019;16:1367;doi:10.3390/ijerph16081367
26. Westerberg BD, Lee PK, Lukwago L, Zaramba S,Bubikere S, Stewart I. Cross-sectional survey of hear-ing impairment and ear disease in Uganda. JOtolaryngol Head Neck Surg. 2008;37(6):753–758.
27. Dean AG, Soe MM. OpenEpi: Open source epidemio-logic statistics for public health, version 3.03a. http://www.openepi.com/. Last accessed March 7, 2019.
28. Razman MR, Naing L, Azian D, Kamarul IM.Validation of noise induced hearing loss questionnaireamong Malay sawmill workers in Kelantan Malaysia.Int Med J Malaysia. 2010;9(2):51–56.
29. Kitcher ED, Ocansey G, Abaidoo B, Atule A.Occupational hearing loss of market mill workers inthe city of Accra, Ghana. Noise Health. 2014;16(70):183–188. doi:10.4103/1463-1741.134919.
30. Ologe FE, Akande TM, Olajide TG. Occupationalnoise exposure and sensorineural hearing loss amongworkers of a steel rolling mill. Eur ArchOtorhinolaryngol. 2006;263(7):618–621. doi:10.1007/s00405-006-0043-9.
31. Rashaad Hansia M, Dickinson D. Hearing protectiondevice usage at a South African gold mine. Occup
ARCHIVES OF ENVIRONMENTAL & OCCUPATIONAL HEALTH 9

Med (Lond). 2010;60(1):72–74. doi:10.1093/occmed/kqp114.
32. Kahan E, Ross E. Knowledge and attitudes of a groupof South African mine workers towards noise inducedhearing loss and the use of hearing protective devices.S Afr J Commun Disord. 1994;41:37–47.
33. World Health Organization (WHO). Health educa-tion: theoretical concepts, effective strategies, and core
competencies: a foundation document to guide cap-acity development of health educators. EasternMediterranean Health; 2012:1–82.
34. Haldiya KR, Sachdev R, Mathur ML, Saiyed HN.Knowledge, attitude and practices related to occupa-tional health problems among salt workers working inthe desert of Rajasthan, India. J Occup Health. 2005;47(1):85–88. doi:10.1539/joh.47.85.
10 I. P. NYARUBELI ET AL.


Graphic design: Comm
unication Division, UiB / Print: Skipnes Komm
unikasjon AS
uib.no
ISBN: 9788230863336 (print)9788230867969 (PDF)