Correlation Between Microstructure and Flow Behavior in Porous Sandstones
19
Petroleum Science and Technology, 27:511–529, 2009 Copyright © Taylor & Francis Group, LLC ISSN: 1091-6466 print/1532-2459 online DOI: 10.1080/10916460701856666 Correlation Between Microstructure and Flow Behavior in Porous Sandstones S. Baraka-Lokmane, 1;2 I. G. Main, 3 B. T. Ngwenya, 3 S. C. Elphick, 3 C. Jones, 4 and S. A. Hamilton 1 1 Institute of Petroleum Engineering, Heriot-Watt University, Edinburgh UK 2 School of Environment and Technology, University of Brighton, Brighton, UK 3 School of GeoSciences, University of Edinburgh, UK 4 Weatherford Production and Completion Systems Expandable Technology, Aberdeen UK Abstract: The correlation between permeability and petrographical parameters in cored samples can be used by extrapolations to predict permeability in uncored intervals. The core analysis described here is concerned with the study of fluid- rock interactions in rock samples from three sandstone reservoirs, in particular the effect of petrographical parameters on flow behavior. A positive correlation between liquid permeability and the volume fraction of silica is clearly demonstrated. Liquid permeability was correlated using multivariate regressions to one to five petrographical parameters, the results of which have useful application in the estimation of reservoir permeability where samples are not available for experimental testing. Keywords: laboratory study, permeability, petrography, sandstone INTRODUCTION Reservoir engineers, petrophysicists and exploration geologists are interested in discovering how permeability and porosity are related to petrographical properties so they can predict permeability from petrographic data. Many authors have tried to obtain quantitative relationships between petrographic properties (two dimensions) and petrophysical properties (three dimensions). They aim to predict, by extrapolating or interpolating, the petrophysical properties of a porous medium, such as porosity, specific surface of pores, permeability, and capillary pressure versus saturation, and electrical proper- ties, such as formation factor and cementation exponent (Mowers and Budd, Address correspondence to S. Baraka-Lokmane, School of Environment and Technology, University of Brighton, Cockcroft Building, Lewes Road, Brighton, BN2 4GJ, UK. E-mail: [email protected] 511
Transcript of Correlation Between Microstructure and Flow Behavior in Porous Sandstones

Petroleum Science and Technology, 27:511–529, 2009
Copyright © Taylor & Francis Group, LLC
ISSN: 1091-6466 print/1532-2459 online
DOI: 10.1080/10916460701856666
Correlation Between Microstructure and Flow
Behavior in Porous Sandstones
S. Baraka-Lokmane,1;2 I. G. Main,3 B. T. Ngwenya,3 S. C. Elphick,3
C. Jones,4 and S. A. Hamilton1
1Institute of Petroleum Engineering, Heriot-Watt University, Edinburgh UK2School of Environment and Technology, University of Brighton, Brighton, UK
3School of GeoSciences, University of Edinburgh, UK4Weatherford Production and Completion Systems Expandable Technology,
Aberdeen UK
Abstract: The correlation between permeability and petrographical parameters in
cored samples can be used by extrapolations to predict permeability in uncored
intervals. The core analysis described here is concerned with the study of fluid-
rock interactions in rock samples from three sandstone reservoirs, in particular the
effect of petrographical parameters on flow behavior. A positive correlation between
liquid permeability and the volume fraction of silica is clearly demonstrated. Liquid
permeability was correlated using multivariate regressions to one to five petrographical
parameters, the results of which have useful application in the estimation of reservoir
permeability where samples are not available for experimental testing.
Keywords: laboratory study, permeability, petrography, sandstone
INTRODUCTION
Reservoir engineers, petrophysicists and exploration geologists are interested
in discovering how permeability and porosity are related to petrographical
properties so they can predict permeability from petrographic data. Many
authors have tried to obtain quantitative relationships between petrographic
properties (two dimensions) and petrophysical properties (three dimensions).
They aim to predict, by extrapolating or interpolating, the petrophysical
properties of a porous medium, such as porosity, specific surface of pores,
permeability, and capillary pressure versus saturation, and electrical proper-
ties, such as formation factor and cementation exponent (Mowers and Budd,
Address correspondence to S. Baraka-Lokmane, School of Environment and
Technology, University of Brighton, Cockcroft Building, Lewes Road, Brighton, BN2
4GJ, UK. E-mail: [email protected]
511

512 S. Baraka-Lokmane et al.
1996; Anselmetti et al., 1998). Ioannidis et al. (1996) have investigated the
possibility of using statistical analysis of the porous microstructure as a
means of estimating reservoir permeability. The objective of their studies
is to examine empirically the relationship between reservoir permeability and
appropriate statistical attributes of the pore space. Ali and Chawathé (2000)
have used neural networks to predict permeability from petrographic data
from very fine-grained arkosic sandstone. This study underscored various
important aspects of using neutral networks as nonlinear estimators in a mul-
tivariate analysis. Cerepi et al. (2001) described a method of characterization
and quantification of petrophysical properties of carbonate pore systems from
petrographic image analysis on length scales spanning more than three orders
of magnitude, from submicron to millimeter scale. They compared these
results with petrophysical property values obtained by classical petrophysical
methods (3-D).
In this study, permeability measurements as well as petrographic exami-
nation of three sandstone reservoir samples (Fife and Locharbriggs sandstones
both from southwest Scotland and Slick Rock Aeolian sandstone from Utah,
United States) were used to evaluate the effect of mineralogy on permeability.
The choice of three different types of sandstones that differ in grain size,
porosity, and mineralogy will show that variations in the porous microstruc-
ture can be linked to the flow behavior of single fluids.
DESCRIPTION OF ROCK MATERIAL
Several complementary and overlapping methods have been used in this
study to characterize the material composition and texture characteristics.
This strategy allows both a full range of characteristics to be determined and
internal checking between measurements. These methods are particle size
analysis, point-counting method based on petrographic thin sections, X-Ray
Difraction (XRD), and X-Ray Fluorescence (XRF)
Particle Size Analysis
The Beckmann Coulter LS 100 Grain Size Analyzer is used for these mea-
surements. Particles in the range of 0.4 �m to 800 �m diameter are analyzed
by laser light at 750 nm. The individual analyzed grain particles have been
obtained by simple hand crashing; this was possible because of the weak
cementation of the sandstone samples. The 3-D bulk particle size analyses
were used for characterizing and classifying the samples and for determining
their heterogeneity, the percentages of the different particles (clays, silt, and
sand), the degree of sorting (So), and the mean grain size of the samples
(MGS) (Table 1). However, this information does not describe the spatial
relationships of the minerals and cements in the rock microstructure. This

Correlation between Microstructure and Flow Behavior 513
Table 1. Particle size analysis of the three groups of samples
Sample% ofclay
% ofsilt
% ofsand
d10
(mm)d50
(mm) So Uc
MGS(�m)
S2 1.77 8.94 91.06 0.07 0.14 0.26 2.36 163.4S4 0.83 6.29 93.71 0.08 0.22 0.26 2.92 225.3S5 1.46 6.17 93.83 0.08 0.25 0.26 3.25 243.1S6 1.33 5.25 94.75 0.08 0.32 0.29 2.92 233.9S7 0.97 6.08 93.92 0.08 0.18 0.29 2.36 191.2S8 1.97 12.06 87.94 0.05 0.14 0.24 3.25 170.2S9 1.08 5.87 94.13 0.08 0.20 0.26 2.62 221.6S10 1.51 6.78 93.22 0.08 0.16 0.29 2.36 183.5S11 0.89 6.96 93.04 0.08 0.20 0.29 2.62 213.8S12 1.02 7.09 92.91 0.07 0.22 0.26 3.25 230.5L1 1.6 7.68 92.32 0.07 0.18 0.29 2.92 197.2L3 1.37 13.85 86.15 0.02 0.20 0.29 10.58 193.7L4 1.16 11.78 88.22 0.03 0.20 0.29 6.89 206.1L5 1.11 15.68 84.32 0.02 0.20 0.263 10.58 198.4F2 0.00 0.00 100.0 0.20 0.31 0.32 1.53 328.4F8 0.00 0.00 100.0 0.22 0.34 0.36 1.71 368.4
d10: grain size (mm) of 10% (cumulative wt%); So: degree of sorting; Uc: coefficientof uniformity; MGS: mean grain size.
study has shown that the three groups of samples are very well sorted. The
Fife sandstone samples present the largest mean grain size (348 �m ˙ 28)
(Table 7).
Petrography
The study has been extended to the thin sections analysis, using a point-
counting technique. Forty-two thin sections were point-counted using a 400-
point density per square mm. The results are reported as percentages of
the different mineral constituents, the dominant cement, and the porosity
(Table 2). During the liquid permeability measurements, clays may absorb
brine and increase in volume. Such swelling clays may then move in the
flow field and block pore throats, thus reducing permeability. We therefore
characterized the clay content of the samples as closely as possible, both in
the bulk sample and also the separate fraction of mobile fine particles or
“fines.”
This study has shown that for the Slick Rock Aeolian sandstone samples,
the grains are rounded, well sorted, and friable. The permeability is controlled
by the porosity, varying between 20% and 23%, rather than the cement, which
varies between 7% and 13%. Quartz (77–88%), K-feldspar (3–11%), various
rock fragments (0.6–3%), and detrital mica (muscovite), which is only a minor
component (0–0.3%), are the main detrital components of the Slick Rock

Table 2. Mineralogy compositions of the three groups of samples (from 2-D thin sections analysis)
Framework Cement
Sample
Quartz
(%)
Feldspar
(%)
Mica
(%)
Rock
fragments
(%)
Clay C
Hematite
(%)
Calcite or
Pyrite
(%)
Quartz
overgrowths
(%)
Feldspar
overgrowths
(%)
Porosity
(%)
S2 77.36 11.03 0.24 3.02 5.81 1.94 0.25 0.35 22.60
S4 86.76 3.17 0.25 1.73 4.18 3.66 0.00 0.25 20.00
S5 88.63 3.30 0.00 1.25 4.57 1.23 0.25 0.77 20.70
S6 78.59 7.86 0.35 1.53 7.24 3.80 0.00 0.63 21.00
S7 82.32 6.85 0.25 1.62 4.98 3.73 0.00 0.25 20.70
S8 81.94 3.96 0.00 0.62 5.81 7.05 0.00 0.62 20.70
S9 79.47 8.50 0.25 1.48 4.95 4.33 0.25 0.77 20.20
S10 82.84 3.90 0.00 1.65 5.96 4.63 0.77 0.25 23.00
S11 82.22 2.94 0.00 2.47 4.30 6.30 0.00 1.77 21.00
S12 82.35 6.01 0.00 1.69 5.32 3.13 0.00 1.50 20.20
L1 81.22 11.41 0.00 1.61 4.51 0.72 0.33 0.20 23.00
L2 78.81 13.46 0.00 1.61 5.10 0.68 0.00 0.34 22.60
L4 83.47 8.87 0.00 0.41 5.98 0.72 0.28 0.27 20.00
L5 72.23 16.87 0.00 0.68 8.63 0.78 0.34 0.47 20.00
F2 82.85 10.16 0.00 0.63 6.35 0.00 0.00 0.00 27.00
F8 83.19 8.07 0.00 4.03 4.03 0.00 0.67 0.00 25.00
51
4
Correlation between Microstructure and Flow Behavior 515
Aeolian sandstones (Figure 1). Between 7% and 18% of the sample consist
of cements, which are in the form of clay minerals (mainly illite), hematite
interspersed with illite, carbonate (calcite), and quartz and feldspar in the form
of overgrowths. Most of the microcline is largely replaced by calcite. The
samples are characterized by a large amount of clay minerals, mainly illite.
Early stages of clay cementation are visible with thin, authigenic coatings
of clays having formed around most of the detrital grains. Even such thin
coatings may serve to isolate the grains from the pore fluids and thus inhibit
alteration or cementation processes. In certain areas the illite cement forms a
thick grain coating as well as completely bridging pores in numerous places.
Fluid movements would be greatly retarded by such cementation. Hematite
cementation, when it is present, is interspersed with clays around the detrital
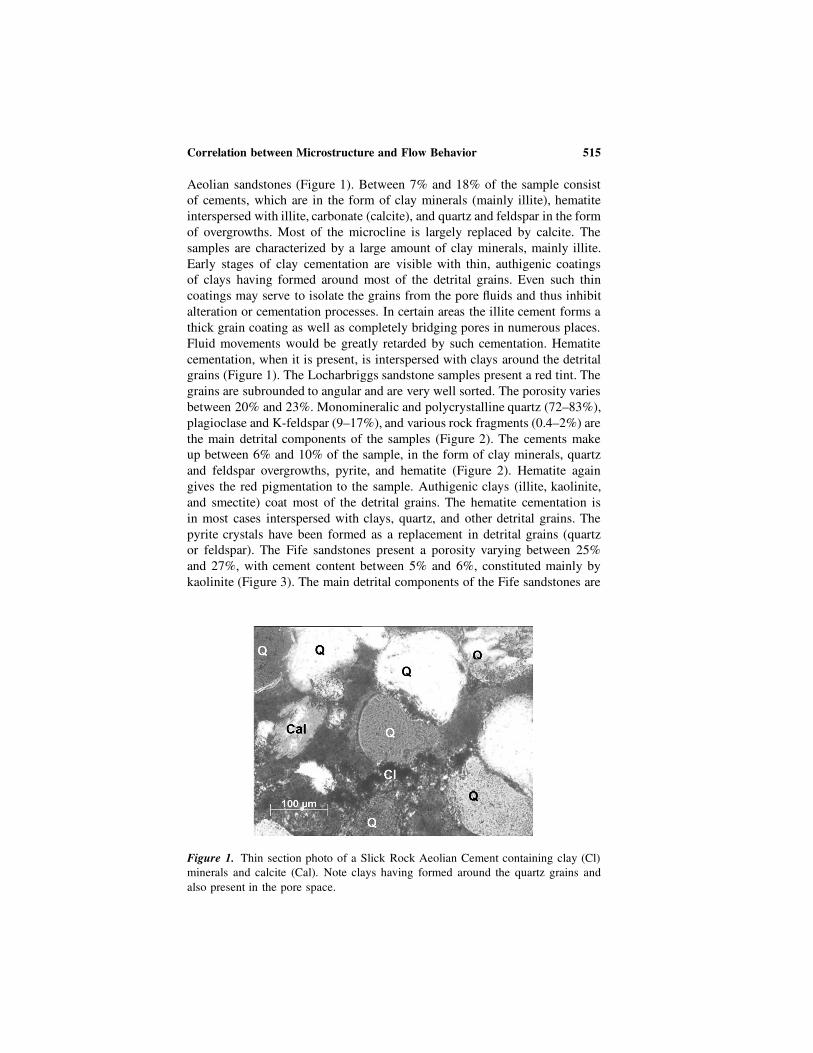
grains (Figure 1). The Locharbriggs sandstone samples present a red tint. The
grains are subrounded to angular and are very well sorted. The porosity varies
between 20% and 23%. Monomineralic and polycrystalline quartz (72–83%),
plagioclase and K-feldspar (9–17%), and various rock fragments (0.4–2%) are
the main detrital components of the samples (Figure 2). The cements make
up between 6% and 10% of the sample, in the form of clay minerals, quartz
and feldspar overgrowths, pyrite, and hematite (Figure 2). Hematite again
gives the red pigmentation to the sample. Authigenic clays (illite, kaolinite,
and smectite) coat most of the detrital grains. The hematite cementation is
in most cases interspersed with clays, quartz, and other detrital grains. The
pyrite crystals have been formed as a replacement in detrital grains (quartz
or feldspar). The Fife sandstones present a porosity varying between 25%
and 27%, with cement content between 5% and 6%, constituted mainly by
kaolinite (Figure 3). The main detrital components of the Fife sandstones are
Figure 1. Thin section photo of a Slick Rock Aeolian Cement containing clay (Cl)
minerals and calcite (Cal). Note clays having formed around the quartz grains and
also present in the pore space.

516 S. Baraka-Lokmane et al.
Figure 2. Cement containing clay minerals (Cl), hematite (H), and Pyrite (P)
(Locharbriggs sandstone)
represented by quartz (83%), microcline (8–10%), and various rock fragments
(0.6–4%) (Table 2).
X-Ray Diffraction Analyses
X-Ray diffraction (XRD) analyses were carried out both on whole rock
(Table 3) and the fine particle fraction (Table 4) to quantify the mineralogy
independently from the point-counting exercise and to estimate clay type and
Figure 3. Thin section photo of a Fife sandstone. Note the homogeneity of the rock
material (Q: quartz, Cl: clay)

Correlation between Microstructure and Flow Behavior 517
Table 3. Mineralogy composition of the three groups of samples
(from XRD analyses)
Sample
Quartz
(%)
Microcline
(%)
Calcite
(%)
Muscovite
(%)
Kaolinite
(%)
S2 80 15 2 2 0
S4 91 5 1 2 0
S5 93 5 1 0 0
S6 86 9 2 2 0
S7 87 8 1 2 0
S8 93 4 1 0 0
S9 83 11 3 2 0
S10 92 5 2 0 0
S11 93 4 1 0 0
S12 91 7 1 0 0
L1 85 14 0 0 0
L3 82 17 0 0 0
L4 88 11 0 0 0
L5 79 20 0 0 0
F2 100 Trace 0 0 0
F8 97 3 Trace 0 Trace
Table 4. Mineralogy composition of the fine particles of the three groups of
samples (from XRD analyses)
Sample
Quartz
(%)
Microcline
(%)
Calcite
(%)
Illite
(%)
Hematite
(%)
Kaolinite
(%)
Smectite
(%)
S2 45 15 5 35 0 0 0
S4 85 10 5 0 0 0 0
S5 75 10 5 10 0 0 0
S6 70 10 5 15 0 0 0
S7 40 15 5 40 0 0 0
S8 90 5 5 0 0 0 0
S9 35 10 5 50 0 0 0
S10 80 10 5 5 0 0 0
S11 91 5 4 0 0 0 0
S12 60 10 5 25 0 0 0
L1 40 35 0 10 5 5 5
L3 55 25 0 6 5 4 4
L4 55 20 0 10 5 4 5
L5 50 25 0 10 5 5 5
F2 80 7 0 0 0 13 0
F8 60 10 0 0 0 30 0

518 S. Baraka-Lokmane et al.
its abundance. The equipment used for this type of measurement is Philips
PW1800 X-ray diffractometer with Cu target tube run at 40 kV and 50 mA.
Approximately 5 g of material were cut from each rock sample; the cut
pieces were crushed and the chips ground in a tungsten carbide barrel for 2
min. The samples are prepared by dropping the slurry of fine sediment and
water on the circular glass slides and allowing the water to evaporate at room
temperature. All samples are run from 2 to 60 degrees 2� , which covers all
the minerals. The intensity of the peaks generated gives an indication of the
amount present, and the position of the peaks identifies the minerals. When a
unique peak is chosen to characterize a particular mineral, it is obvious that
the peak has to be free of interference from the peaks of other minerals. For
the analyses of the fine particle fraction, the bulk sample had been mixed with
50 ml of distilled water and stirred. The top 30-ml suspension was removed
after 4 hours. The suspension was allowed to settle out over the next 4 days.
Nearly all the water was poured off, leaving about 2 ml for making slurry
with the sediment. The slurry was transferred to a glass slide and the water
allowed to evaporate at room temperature.
The results of the XRD analysis of the Locharbriggs sandstone samples
show that two mineral compounds (quartz and microcline) are identified.
The Slick Rock Aeolian sandstones possess calcite in addition to these two
minerals. The analysis of the fine particles of the Fife sandstone samples
shows the presence of two clay minerals (kaolinite and illite). Illite is the
only clay mineral found in the Slick Rock Aeolian sandstones. The XRD
measurements show the presence of three clay minerals in the case of the
Locharbriggs sandstones (kaolinite, smectite and illite).
X-Ray Fluorescence Analyses
Approximately 50 g of material was cut from each rock sample. The cut
pieces were crushed in a tungsten carbide barrel for 2 min. Samples were
analyzed for major elements using Philips PW 1480 automatic x-ray fluores-
cence (XRF) spectrometer with Rh-anode x-ray tube. Major-element analysis
was carried out on fused glass discs prepared by a method based on that
of Norrish and Hutton (1969) and described by Fitton et al. (1998). Rock
powders were dried in an oven overnight at 110ıC. Approximately 1 g of
each powder was ignited for 20 min in a Pt-5% Au crucible at 1100ıC
and a value for LOI (D H2O loss C CO2 loss � O2 gain) was calculated
from the weight change. The ignited powder was then fused for 20 min
at 1100ıC using a lithium borate flux (Johnson Matthey Spectroflux 105)
with a 5:1 (flux: sample) dilution. The molten material was poured from the
crucible into a graphite plate and pressed into a disc by lowering an aluminium
plunger into the globule. The casting operation was carried out on a hotplate
at 220ıC, and the glass disc was annealed at this temperature for 10 min
before cooling. Corrections for matrix effects on the intensities of major

Correlation between Microstructure and Flow Behavior 519
Table 5. X-Ray fluorescence results of the three groups of samples
Sample SiO2 Al2O3 Fe2O3 MgO CaO K2O TiO2 MnO P2O5 LOI Total
S2 91.61 2.97 0.26 0.17 1.73 1.622 0.063 0.028 0.020 1.89 100.22
S4 91.06 2.90 0.35 0.16 1.20 1.640 0.082 0.040 0.024 2.19 99.65
S5 91.58 3.27 0.34 0.18 1.34 1.744 0.068 0.030 0.024 1.77 100.25
S6 91.39 2.95 0.29 0.14 1.17 1.628 0.081 0.037 0.024 2.00 99.66
S7 91.92 3.08 0.31 0.15 1.22 1.751 0.075 0.034 0.026 1.45 99.92
S8 91.10 3.04 0.32 0.18 1.77 1.731 0.080 0.038 0.024 2.00 100.15
S9 91.71 2.88 0.34 0.16 1.58 1.592 0.080 0.048 0.023 1.73 100.15
S10 90.64 2.92 0.30 0.21 2.08 1.664 0.073 0.041 0.024 2.21 100.06
S11 91.77 3.03 0.31 0.17 1.44 1.645 0.078 0.039 0.023 1.84 100.23
S12 92.13 3.04 0.32 0.14 1.19 1.707 0.087 0.034 0.024 1.40 100.28
L1 93.40 3.41 0.66 0.13 0.06 2.032 0.086 0.022 0.014 0.59 99.77
L3 93.05 3.54 0.64 0.12 0.05 2.116 0.084 0.013 0.014 0.60 99.57
L4 92.69 3.81 0.65 0.13 0.06 2.112 0.084 0.014 0.014 0.59 99.52
L5 92.63 3.89 0.64 0.13 0.06 2.101 0.083 0.012 0.017 0.58 99.55
F2 97.41 0.95 0.04 0.18 0.01 0.367 0.077 0.001 0.006 0.12 99.04
F8 97.56 1.05 0.04 0.20 0.01 0.389 0.069 0.001 0.005 0.28 99.32
element lines were made using theoretical alpha coefficients calculated using
the Philips software. The coefficients were calculated to allow for the amount
of extra flux replacing volatile components in the sample so those analytical
totals would be 100% less the measured LOI (limiting oxygen index). Average
major-elements counts were calculated from four measurements for each
element. Major-element data were screened by the total of the measured
oxides plus LOI. The analysis of samples with totals lying outside the range
99.4 to 100.4 wt% were repeated using new glass discs to confirm the total
or to obtain an analysis in the expected range. XRF analyses of the samples
were also used to determine the chemical composition of the samples using
offcuts before the flow tests, confirming the presence of iron oxide (Table 5).
XRF analyses show that Fife sandstone present the highest percentage of
SiO2 (mainly quartz), with an average around 97.5% ˙ 0.1 and Slick Rock
Aeolian sandstones present the lowest percentage of SiO2 with an average
around 91.5% ˙ 0.4 (Tables 5 and 7).
PETROPHYSICAL DESCRIPTION—PERMEABILITY
AND POROSITY
Both gas and liquid permeability were measured. The gas permeability tests
were measured using a nitrogen gas permeameter. For the liquid permeability,
the cores were mounted vertically in a core holder known as a Hoek cell,
which is normally used in rock deformation experiments. This cell provided
a means of applying confining pressure to the sample. It consisted of a steel
body (rated to 10,000 psi) within which was located a polyurethane sleeve.
Confining pressure was transmitted to the radial surface of the sample via
hydraulic oil in the annulus between the steel body and the sleeve. The vertical

520 S. Baraka-Lokmane et al.
or greatest principal stress was applied using an external ram, via porous
platens. During the course of an experiment brine was pumped through the
sample via the porous platens. Axial and radial strains have been measured
throughout the experiment using strain gauges. Movements of fluid through
the sample and volume measurements were made using a pumping network.
The network allows brine to be pumped in either direction through the core;
the direction can be reversed instantaneously. Expelled volume measurements
of brine were used to determine average saturation. Brine was pumped in
the inlet using a Pharmacia pump (1–499 ml/hr). Fluid flowed through the
core and was collected in a reservoir mounted on a balance. The weight
measurements were used to calculate flow rates. The balance was also used
in this configuration to measure the expelled pore fluid. Before permeability
testing, the samples were vacuum saturated with brine, which gave 90–95%
brine saturation. The samples were then saturated in a high-pressure cell at
2000 psi pore pressure for two days. The brine saturation was then confirmed
to be 100% by weight. Brine permeability was carried out at 400 psi. The
brine used in the experiment was 9% KCl brine, with a density of 1.067 g/cc
and a viscosity at 20ıC of 1.31 cp. These are measured values.
Tables 6 and 7 shows brine permeability and Klinkenberg-corrected
gas permeability values for the three groups of samples. The Slick Rock
Aeolian sandstones have the lowest liquid permeability, which is in the
range of 285 mD ˙ 71, and the lowest gas permeability, 499 mD ˙ 49.
The Fife sandstones have the highest liquid permeability, 1980 mD ˙ 388,
Table 6. Petrophysical parameters of the three groups of samples
Sample
Brine permeability,
kl (mD)
Gas permeability,
kg (mD)
Ratio
kg/kl
S2 290 447 1.54
S4 306 558 1.82
S5 280 425 1.52
S6 292 521 1.78
S7 289 470 1.63
S8 210 530 2.52
S9 280 473 1.69
S10 177 577 3.26
S11 280 521 1.86
S12 450 473 1.05
L1 894 1392 1.56
L3 664 1446 2.18
L4 784 1396 1.78
L5 480 1462 3.05
F2 1706 1411 0.83
F8 2255 1322 0.59

Correlation between Microstructure and Flow Behavior 521
Table 7. Petrographical and petrophysical parameters of the three groups of samples
Sandstone Locharbriggs Slick Rock Aeolian Fife
Brine permeability, kl (mD) 706 ˙ 177 285 ˙ 71 1980 ˙ 388
Gas permeability, kg (mD)
(200 psi)
1424 ˙ 35 499 ˙ 49 1366 ˙ 63
kg/kl 2.1 ˙ 0.7 1.9 ˙ 0.6 0.7 ˙ 0.2
Porosity, ˆ (%) 26.1 ˙ 0.1 22.3 ˙ 0.5 23 ˙ 3
Mean Grain size,
MGS (�m)
199 ˙ 5 208 ˙ 28 348 ˙ 28
SiO2 content (%) 92.9 ˙ 0.4 91.5 ˙ 0.4 97.5 ˙ 0.1
Cement content (%) 7 ˙ 2 10 ˙ 2 5 ˙ 1
Type of cement illite, kaolinite,
smectite,
hematite
calcite
illite
hematite
kaolinite
Clays content (%) 6 ˙ 2 5.3 ˙ 0.9 5 ˙ 2
Type of clays illite, kaolinite,
smectite,
hematite
illite kaolinite
and gas permeability is in the range of 1366 mD ˙ 63. The Locharbriggs
sandstones have liquid permeability, 706 mD ˙ 177, and the highest gas
permeability, 1424 mD ˙ 35. These petrophysical results can be reasonably
explained by the microstructural properties, essentially by the type and the
percentage of cement and the mean grain size, as described in the following
sections.
PETROPHYSICAL CONTROLS ON FLUID FLOW
The three different types of sandstones used in this study represent a wide
range of petrophysical properties such as permeabilities and porosities and
very variable microstructural properties. These include the nature of the
constituent minerals and cement, the degree of rock cementation, and the
degree of sorting or equivalently the particle size distribution of the grains.
Table 6 summarizes the average numbers of the different parameters. The
Fife sandstones present the most homogeneous rock material. They present
the highest percentage of SiO2 content (97.5% ˙ 0.1), and the largest mean
grain size (348 �m ˙ 28). They present the lowest percentage of cement
(5% ˙ 1) constituted mainly by kaolinite. These microstrutural characteri-
zations explain the highest values of liquid permeability (1980 mD ˙ 388)
measured in these samples. Gas permeability (1366 mD ˙ 63) are equivalent
to liquid permeability, this confirms the homogeneity and the purity of this
rock material.

522 S. Baraka-Lokmane et al.
The Slick Rock Aeolian sandstones present the lowest permeability,
in the range of 285 mD ˙ 71 for liquid permeability and in the range
of 499 mD ˙ 49 for gas permeability. Indeed these sandstones present
the highest percentage of cement (10% ˙ 2), which are in the form of
clay minerals (mainly illite, which represents 6% of the rock material),
and hematite interspersed with illite and calcite. The ratio between the gas
permeability (kg) and liquid permeability (kl) ranges from 1 to 3 (Table 6).
During the liquid permeability measurements, swelling of the illite may be
responsible for the migration of the clay particles, which remain in the
system, and therefore liquid permeability is reduced. The Slick Rock Aeolian
sandstones present the lowest percentage of SiO2 content, with an average
equal to 91.5% ˙ 0.4. The Locharbriggs sandstone samples present the
smallest mean grain size (199 �m ˙ 5). In spite of the high values of
porosity (26.1% ˙ 0.1), these sandstones do not posses the highest values
of permeability (706 mD ˙ 177 for liquid permeability and 1424 mD ˙ 35
for gas permeability). This is explained by a relatively high percentage of
cement (7% ˙ 2), mainly in the form of clay minerals (illite, kaolinite and
smectite). These swelling clays may be responsible for the reduction of the
liquid permeability.
To study the fluid-rock interactions, liquid permeability was correlated
using multivariate regression to one to five petrographical parameters. These
parameters are: percentages of silica (SiO2) measured with x-ray fluores-
cence (XRF) analysis, cement and porosity (determined with point-counting
based on petrographic thin sections), and clay and mean grain size (MGS)
(measured with particle size analysis). This analysis was carried out to de-
termine the influence of petrographic elements on permeability. Absolute
values of correlation coefficients, which represent quality of fit, are used to
rank petrographic elements in conventional regression analysis. The results of
regression analysis are shown in Table 8 and Figures 4 to 8. Table 8 (Eqs. [a]
to [e]) and Figures 4 to 8 represent relationships between liquid permeability
Figure 4. Cross-plots of Slick Rock Aeolian, Locharbriggs and Fife sandstones, for
kl versus percentage of SiO2

Correlation between Microstructure and Flow Behavior 523
Table 8. Regression results of Locharbriggs, Slick Rock Aeolian, and Fife
sandstones data, with a correlation coefficient (R2), standard deviations (SD)
and Akaike’s Information Criterion (AIC)
Variables:
petrographic elements Least squares fit R2 S.D. AIC
SiO2 a. kl D 279.27% SiO2 � 25259.20 0.95 132.44 �100.30
MGS b. kl D 9.15 �m MGS � 1439.50 0.72 319.35 �114.38
ˆ c. kl D 220.73% ˆ � 4194.40 0.60 392.63 �117.68
Cement d. kl D � 153.84% Cement C 1967.60 0.47 439.83 �119.49
Clay e. kl D � 804.79% Clay C 1511.20 0.56 402.37 �118.07
SiO2 , MGS f. kl D 254.11% SiO2 C 1.13 �m MGS � 23181.2 0.95 132.68 �99.74
SiO2 , Clay g. kl D 283.78% SiO2 C 21.88% Clay � 25701 0.94 137.20 �101.68
SiO2 , ˆ h. kl D 285.41% SiO2 � 7.86% ˆ � 25656.60 0.94 137.04 �100.25
SiO2 , Cement i. kl D 265.82% SiO2 � 15.84% Cement �
23872.60
0.95 133.35 �99.81
MGS, ˆ j. kl D 6.61 �m MGS C 113.16% ˆ � 3331.46 0.79 267.65 �110.96
MGS, Cement k. kl D 7.27 �m MGS � 77.39% Cement � 331.71 0.78 273.31 �111.29
SiO2 , MGS, Clay l. kl D 259.75% SiO2 C 2.20 �m MGS C
142.96% Clay � 24102.9
0.95 131.51 �98.96
SiO2 , MGS, Cement m. kl D 235.27% SiO2 C 1.28 �m MGS �
18.25% Cement � 21308.2
0.95 132.31 �99.05
SiO2 , Cement, Clay n. kl D 266.92% SiO2 � 15.68% Cement C 4.70%
Clay � 23981.40
0.94 138.78 �99.81
SiO2 , Clay, ˆ o. kl D 294.77% SiO2 C 34.14% Clay � 10.85%
ˆ � 26496.90
0.94 142.09 �100.19
SiO2 , MGS, ˆ p. kl D 257.14% SiO2 C 1.10 �m MGS � 3.20%
ˆ � 23386.4
0.94 138.03 �99.73
MGS, Cement, ˆ q. kl D 5.69 �m MGS � 59.35% Cement C
89.68% ˆ � 2089.31
0.83 238.75 �108.49
MGS, Clays, ˆ r. kl D 5.73 �m MGS � 97.57% Clay C 114.65%
ˆ � 3056.58
0.78 277.06 �110.88
SiO2 , MGS, Clay, ˆ s. kl D 272.01% SiO2 C 2.22 �m MGS C
158.13% Clay � 12.34% ˆ � 24992.4
0.95 136.31 �98.83
SiO2 , MGS, Cement, ˆ t. kl D 236.19% SiO2 C 1.27 �m MGS � 18.20%
Cement � 0.92% ˆ � 21371.8
0.94 138.18 �99.05
SiO2 , MGS, Cement,
Clay
u. kl D 242.86% SiO2 C 2.20 �m MGS � 15.71%
Cement C 125.82% Clay � 22379.9
0.95 132.77 �124.63
SiO2 , Cement, Clay, ˆ v. kl D 275.45% SiO2 � 15.09% Cement C
14.15% Clay � 7.79% ˆ � 24617.7
0.94 144.56 �99.77
SiO2 , MGS, Cement,
Clay, ˆ
w. kl D 252.86% SiO2 C 2.21 �m MGS � 15.00%
Cement C 138.02% Clay � 9.30% ˆ � 23127.4
0.94 138.61 �98.34
Figure 5. Cross-plots of Slick Rock Aeolian, Locharbriggs and Fife sandstones, for
kl versus mean grain size (MGS)

524 S. Baraka-Lokmane et al.
Figure 6. Cross-plots of Slick Rock Aeolian, Locharbriggs and Fife sandstones, for
kl versus percentage of porosity
Figure 7. Cross-plots of Slick Rock Aeolian, Locharbriggs and Fife sandstones for
kl versus percentage of cement
Figure 8. Cross-plots of Slick Rock Aeolian, Locharbriggs and Fife sandstones, for
kl versus percentage of clay

Correlation between Microstructure and Flow Behavior 525
(kl) and an individual petrographic element. This study shows a very good
correlation between kl and SiO2, with R2 equal to 0.95 (Eq. [a], Table 8
and Figure 4), and a quite good correlation between kl and mean grain size
(MGS), with R2 equal to 0.72 (Eq. [b], Table 8 and Figure 5), as well as
between kl and porosity, with R2 equal to 0.60 (Eq. [c], Table 8 and Figure 6).
There is an inverse correlation between liquid permeability (kl) and cement
and between kl and clay, with coefficient of correlations (R2) equal to 0.47
(Eq. [d], Table 8 and Figure 7) and R2 equal to 0.56 (Eq. [e], Table 8 and
Figure 8), respectively. Cements are composed by clay, calcite, and hematite,
as well as quartz and feldspar overgrowths. There are trends of decreasing kl
with increasing clay and therefore cement (Eqs. [d] and e], Table 8; Figures
7 and 8).
A set of multivariate regressions were performed using two to five vari-
ables of petrographic elements. To determine if what appears to be the best
model is really the best model, parameters like correlation coefficient (R2),
standard deviations (SD) and Akaike’s Information Criterion (AIC) have been
calculated (Table 8). The basic idea behind model selection is to choose from
a set of competing models the one—according to some criterion—which best
describes the data. A flexible approach to model discrimination is the Akaike
information criterion (AIC), introduced 30 years ago by H. Akaike (1973),
an information criterion for the identification of an optimal model from a
class of competing models (Main et al., 1999):
AIC3 D
�
�
hn
2
i
� LnML�
� p (1)
ML D
X
.obs � pred/2 (2)
where n is the number of data points in the regression, p is the number of
independently adjusted parameters within the model, ML is the maximum
likelihood method, and Ln is the natural log.
The first term on the right-hand side of Eq. (1) accounts for the criterion
of the goodness of fit, while the second one incorporates the doctrine of
parameter parsimony into the AIC. The best model is the one that yields the
largest AIC. Of these results, Table 8 reports only the regressions, using more
than one variable, with a correlation coefficient (R2) greater than 0.70. This
table shows that volume fraction of SiO2 alone gives a correlation coeffi-
cient of 0.95 (Eq. [a]). The most influential petrographic element controlling
permeability is therefore the volume fraction of SiO2 (silica); However the
best model is given by Eq. (s) in Table 8 (kl D 272.01% SiO2 C 2.22 �m
MGS C 158.13% Clay � 0.92% ˆ � 24992.4) by using the variables MGS
and percentages of SiO2, clay, cement, and porosity. This model presents a
correlation coefficient equal to 0.95, a standard deviation equal to 136.31,
and AIC equal to �98.83.

526 S. Baraka-Lokmane et al.
DISCUSSION
Reservoir quality, primarily determined by the porosity and permeability of
the relevant formations, can be a function of many controls including the
nature of the constituent minerals and cement, the degree of rock cementation,
the degree of sorting (or equivalently the grain size distribution of the grains),
and the pore-size distribution (Cade et al., 1994; Baraka-Lokmane et al.,
2001). Regression analyses have been carried out between liquid permeability
values and petrographical and petrophysical parameters such as grain size and
percentages of SiO2, clay, cement, and porosity.
Fife sandstones present systematically different petrographical and petro-
physical characteristics than Slick Rock Aeolian and Lochabriggs sandstones.
These sandstone samples present the most homogeneous rock material; the
main detrital components are represented by quartz (Tables 2 to 4), they
represent the largest percentage of SiO2 content (97.5% ˙ 0.1), the largest
mean grain size (348 �m ˙ 28), and the lowest percentage of cement
(5% ˙ 1). These microstructural characterizations explain the highest values
of permeability. Fife sandstones show good agreement between gas and liquid
permeability; this is explained by the low percentage of clays (5% ˙ 2),
represented by kaolinite. In addition, kaolinite is not prone to swelling with
changes in water content. Kaolinite, having a stable, “rigid” structure (due
to the strong book bonds) reacts with water to a minimum extent (Pajak-
Komorowska, 2003).
Slick Rock Aeolian and Lochabriggs sandstones show higher values of
the ratio between gas and liquid permeability, around (kg/kl), which is around
2. These rock materials present higher percentages of clays represented by
illite, smectite, and kaolinite (5.3% ˙ 0.9 for Slick Rock Aeolian sandstones
and 6% ˙ 2 for Lochabriggs sandstones). The impact of clay migration on
impairing reservoir permeability is a well-known problem (Baraka-Lokmane,
2002). Strongly hydrophilic minerals, particularly swelling clays, can be im-
portant in controlling the liquid permeability (Bitton and Gerba, 1984; Appelo
and Postma, 1993; Bloomfield and Williams, 1995; Baraka-Lokmane, 2002;
Pajak-Komorowska, 2003). During the liquid permeability measurements, the
swelling clays may be responsible for the migration of the clay particles,
which remain in the system, and therefore liquid permeability is reduced.
Smectite tends to swell when exposed to brine. It is very hydrophilic due
to its labile, “mobile” structure. Illite, in turn, is a mineral that reacts with
brine to a limited extent (Pajak-Komorowska, 2003). This study has shown an
excellent correlation between silica content (SiO2) and the liquid permeability
(kl), with a correlation coefficient (R2) equal to 0.95 (Eq. [a] in Table 8 and
Figure 4). This shows that the percentage of silica is the most influential
petrographic parameter controlling permeability. Silica (SiO2) is present in
the framework as well as in the cement of the sandstone rock. Quartz is
composed of silica, but other minerals like feldspar, clays, and rock fragments
also contain silica in their chemical composition. We observe a quite good

Correlation between Microstructure and Flow Behavior 527
correlation between kl and MGS, with R2 equal to 0.72 (Eq. [b] in Table 8 and
Figure 5) as well as between kl and porosity, with R2 equal to 0.60 (Eq. [c]
in Table 8 and Figure 6). There is correlation between liquid permeability
(kl) and cement and between kl and clay, with R2 equal to 0.47 (Eq. [d] in
Table 8 and Figure 7) and R2 equal to 0.56 (Eq. [e] in Table 8 and Figure 8),
respectively. Cement content is composed by clay, calcite, hematite, quartz,
and feldspar overgrowths. Reduction in permeability and porosity occur via
compaction, cementation, and increasing clay content. Clay, whether having a
diagenetic or detrital origin, tends to sit between grains blocking pore throats
(see Figure 2).
The regressions results reported in Table 8 show that Eq. (f) in Table 8
presents the best model by using two variables (SiO2 and MGS), with R2
equal to 0.95, SD equal to 132.68, and an AIC equal to �99.74. This shows
that after the percentage of SiO2, the mean grain size is the most influential
petrographic parameter controlling permeability. Using three variables, the
best model is represented in Eq. (l) in Table 8, where R2 D 0.95, SD D
131.51, and AIC D �98.96. After the percentage of SiO2 and the mean
grain size, the percentage of clays is the most influential petrographic pa-
rameter controlling permeability. The regression results have shown that the
best model has been obtained by using four variables: percentages of SiO2,
porosity, and clays, as well as the mean grain size (Eq. (s) in Table 8), with
R2 D 0.95, SD D 136.31 and AIC D �98.83. The regression in Eq. (w) in
Table 8 using 5 variables (percentages of SiO2, porosity, clays, and cement, as
well as the mean grain size) does not improve the model described in Eq. (s).
This study shows that the best model according to all criteria (maximum R2,
minimum SD and maximum AIC) is described in Eq. (s). In this model four
variables have been used: percentages of SiO2, porosity and clays as well as
the mean grain size (in micrometer); however, the model described in Eq. (a)
using a single variable (SiO2) can predict the liquid permeability kl. Indeed,
comparing the models described in Eq. (1) and Eq. (s), only the value of the
maximum AIC is better in the case of Eq. (s). In this study the majority of
the rock samples are from the Slick Rock Aeolian sandstone (10 samples out
of the 16 tested samples); future work requires testing a larger number of
samples of Locharbriggs and Fife sandstones, as well as testing two or three
other sandstone samples to draw a general conclusion for the sandstone rock
samples.
CONCLUSION
Several complementary and overlapping methods have been used in this study
to characterize three groups of samples (Locharbriggs, Slick Rock Aeolian
and Fife sandstones). This strategy allows a full range of characteristics to be
determined, with internal checking between measurements. The determination
of the mineralogical composition of the samples, the type and the abundance

528 S. Baraka-Lokmane et al.
of the cements, and particularly the location and the abundance of hematite,
are all well characterized by several independent methods including point-
counting method and the (quantitative) XRD analysis. The characterization of
the samples has shown that the results of the point-counting method are com-
parable with those of the XRD analysis. However, point-counting has shown
the finite presence of hematite in the case of the Slick Rock Aeolian sandstone
samples. This was not detected with the XRD measurement because of its
small concentration (less than 1% of the sample). A structural method (point-
counting technique) is therefore complementary to a quantitative method
(bulk XRD analysis) to identify the different mineral species and quantify
their abundance. Regression analyses between liquid permeability values and
petrophysical or petrographical parameters such as percentages of SiO2, clay,
cement, and porosity as well as mean grain size (MGS) have been carried out.
This study has shown an excellent correlation between silica (SiO2) and liquid
permeability (kl), with a correlation factor equal to 0.95; liquid permeability
increases with the increase of the volume fraction of silica. This study has
shown that the best model according to all criteria (maximum R2, minimum
SD, and maximum AIC) is (kl D 272.01% SiO2 C 2.22 �m MGS C 158.13%
Clay � 0.92% ˆ � 24992.4). The model described in Eq. (a) using a single
variable, SiO2, can predict the liquid permeability kl (kl D 279.27% SiO2 �
25259.20), with R2 D 0.95, SD D 132.44 and AIC D �100.30.
This study shows that the permeability of sandstone cores can be pre-
dicted from the measurement of the percentages of silica (SiO2); which can
be performed with the help of XRF analyses using only 50 g of material
from rock sample. The results obtained in this study have useful application
in the estimation of reservoir permeability where samples are not available
for experimental testing.
ACKNOWLEDGMENTS
This work was funded by the Engineering and Physical Sciences Research
Council, grant: GR/M6 2150, with support from Exxon-Mobil, BP Amoco,
DTS, and RML.
REFERENCES
Akaike, H. (1973). Information theory and an extension of the maximum
likelihood principle. In: B. N. Petrov and F. C. Saki, (eds.) 2nd Interna-
tional Symposium on Information Theory, Budapest: Akademiai Kiado,
pp. 267–281.
Ali, M., and Chawathé, A. (2000). Using artificial intelligence to predict
permeability from petrographic data. Computer & Geoscience 26:915–
925.

Correlation between Microstructure and Flow Behavior 529
Anselmetti, F. S., Luthi, S., and Eberli, G. P. (1998). Quantitative characteri-
zation of carbonate pore systems by digital image analysis, Bull. AAPG
82:1815–1836.
Appelo, C. A. J., and Postma, D. (1993). Geochemistry, Groundwater and
Pollution. Rotterdam: Balkema.
Baraka-Lokmane, S. (2002). Hydraulic versus pneumatic measurements of
fractured sandstone permeability. J. Petr. Sci. Eng. 36:183–192.
Baraka-Lokmane, S., Main, I., Elphick, S., and Ngwenya, B. (2001). Com-
plementary methods for characterising Slick Rock Aeolian sandstone.
International Symposium of the Society of Core Analysts (SCA), Septem-
ber 17–19.
Bitton, G., and Gerba, C. P. (1984). Microbiological pollutants, their survival
and transport pattern to groundwater. Groundwater Pollution Microbiol-
ogy, Gerba, C. P. (Ed.). New York: John Wiley & Sons, pp. 65–88.
Bloomfield, J. P., and Williams, A. T. (1995). An empirical liquid
permeability—Gas permeability correlation for use in aquifer properties
studies. Q. J. Eng. Geol. 28:143–150.
Cade, C. A., Evans, I. J., and Bryant, S. L. (1994). Analysis of permeability
controls—A new approach. Clay Mine. 29:491–501.
Cerepi, A., Humbert, L., and Burlot, T. (2001). Petrophysical properties
of porous media from petrographic image analysis data, Colloids and
Surfaces, A: Physicochem. Eng. Asp., 187, 233–256.
Fitton, J. G., Saunders, A. D., Larsen, L. M., Hardarson, B. S., and Norry,
M. J. (1998). Volcanic rocks from the Southeast Greenland Margin at
63ıN: Composition, petrogenesis, and mantle sources. In: Saunders, A.
D., Larsen, H. C., and Wise, S. W., Jr. (Eds.), Proc. ODP, Sci. Results
College Station, TX, 331–350.
Ioannidis, M. A., Kwiecien, M. J., and Chatzis, I. (1996). Statistical anal-
ysis of the porous microstructure as a method for estimating reservoir
permeability. J. Petr. Sci. Eng. 16:251–261.
Main, I. G., Leonard, T, Papasouliotis, O., Hatton, C. G., and Meredith,
P. G., 1999. One slope or two? Detecting satatistically significant breaks
of slope in geophysical data, with application to fracture scaling rela-
tionships. Geophysical Research Letters 26:2801–2804.
Mowers, T. T., and Budd, D. A. (1996). Quantification of porosity and per-
meability reduction due to calcite cementation using computer-assisted
petrographic image techniques, AAPG Bull. 80:309–322.
Norrish, K., and Hutton, J. T. (1969). An Accurate X-ray spectrographic
method for the analysis of a wide range of geological samples. Geochim.
Cosmochim. Acta. 33:431–453.
Pajak-Komorowska, A. (2003). Swelling, expansion and shrinkage properties
of selected clays in the Mazowsze Province, central Poland. Geol. Q.
47:55–62.