Role of Rhenium on Solidification, Microstructure, and Mechanical Properties of Standard Alloy 718
Upload
khangminh22Category
view
3download
0
Solidification Behaviour and Microstructure Development of Mg-Al-RE (Ce and La) Alloys
A thesis submitted in fulfilment of the requirements for the degree of
Doctor of Philosophy
Charlotte Chiaw Wuen Wong
B.Eng(ChemEng)(Hons), Monash University
School of Engineering
College of Science, Engineering and Health
RMIT University
April 2019

ii
This thesis is dedicated to all colleagues, friends, family and strangers who believed in me
before anyone knew what they were believing in.
“Working hard is important but there is something that matters even more;
believing in yourself.”
Harry Potter
iii
Declaration
I certify that except where due acknowledgement has been made, the work is that of the author
alone; the work has not been submitted previously, in whole or in part, to qualify for any other
academic award; the content of the thesis is the result of work which has been carried out since
the official commencement date of the approved research program; any editorial work, paid
or unpaid, carried out by a third party is acknowledged; and, ethics procedures and guidelines
have been followed.
I acknowledge the support I have received for my research through the provision of an
Australian Government Research Training Program Scholarship.
CHARLOTTE WONG
15th April 2019
iv
Acknowledgements
Throughout the journey of my PhD study I have received a great deal of support and assistance
without which none of this would be possible. Therefore, I would like to use this opportunity
to express my gratitude to professors, advisors, friends and family who were there for me
during the good and tough times of this journey.
To my primary supervisor, Prof. Mark A. Easton, you have given me so much guidance and
support in this research. I am genuinely grateful for your endless patience in me and the
opportunity you have given me to be part of your research team. I also deeply appreciate the
time you have spent with me, especially towards the end of the PhD study and journal papers
writing.
To my industry co-supervisor, A/Prof. Trevor Abbott from Magontec, your time spent with me
online for numerous fruitful discussions helped me greatly with solving multiple technical
challenges throughout the research. Your help and support were paramount in my success in
this PhD journey.
To my CSIRO’s supervisor, Dr. Mark J. Styles, you have been an endless resource, and you
have always gone beyond the call of duty as a PhD supervisor to provide me with endless
support. Without your help this would have never been possible. For this, I am grateful for life,
and I am indebted to you, for your constant support.
To my co-supervisor from the University of Queensland, A/Prof. Kazuhiro Nogita, thank you
for giving me the opportunity to have my experiments done at the SPring-8 Synchrotron in
Japan. The experiments performed using the synchrotron beamline have formed an essential
piece of the puzzle in this research.
To my co-supervisor from RMIT University, Dr. Suming Zhu, your enormous support on TEM
images are highly appreciated. I would also like to thank you for providing useful feedback
during my candidature.
Further, I would like to thank and acknowledge Prof. Mark A. Gibson and Prof. David StJohn
for your inspirations and words of wisdom in relation to completing a thesis. Also thank you,
Prof Mark A. Gibson, for your great support in proofreading the thesis chapters towards the
end of my PhD study. Thank you, Dr. Dong Qiu, for the useful discussions related to my
research as well as all the time we spent having meaningful discussions.

v
My earnest thanks to Mr. Gary Savage and Mr. Andrew Yob from CSIRO for your help and
advice on the foundry and casting experiments. Without you the sophisticated thermal analysis
and casting experiments could not be succeeded. I enjoyed working with you very much, and
it was my great pleasure to have you be part of my PhD journey. I also thank Mr. Peter Rummel
from RMMF for your great support on sample preparations and Mr. Matthew Field and all
microscopists from RMMF for your assistance with training me on numerous electron
microscopies. Also, I acknowledge Dr. Aaron Seeber from CSIRO for your support and help
with XRD measurements. Thanks to Mr. Viranga Ratnaike for proofreading of the thesis.
Greatest thanks go to my friends and colleagues: Syed Islam, Mitesh Patel, Subir Ghosh, Ting
Ting Song, Matthew Gear and many more. Our friendships are one of the greatest awards I
received from this journey. Thank you for your support and motivations whenever I needed to
go through the tough times.
I am also grateful to Australian Research Council (ARC) for funding this research through the
linkage project LP130100828. Further, a very special gratitude goes out to Magontec for
providing the funding and support for the work during my candidature.
To my life-long friends, Soo Siaw Vun, Cristine Cheng, Tay Lee Hwa, Carine Ng, Ian Thien,
Jane Lee, Grace Kong, thank you for simply being there for me whenever needed. I would also
like to express my greatest gratitude to my buddy, Soo Siaw Vun, for providing me with the
emotional support and help when they were needed the most. Special thanks to a buddy,
Cristine Cheng, for listening to me about my research project while none was interested in the
technical story.
To my life-long friends but who have also become part of my family, Chelsy Yu, Chian Mei
Hsing, Chung Hsiao Ping, Wong Wan Yee, thank you for being there for mom and dad while
I was busy focussing on my PhD journey. I owe a debt of gratitude to you for your support,
love and friendship. To my friends scattered around the world, thank you for your caring
emails, texts, visits and being there whenever I needed a friend.
Finally, I would like to express my deepest thanks to mom and dad. Thank you for encouraging
me in all my pursuits to follow my dreams. You have always believed in me and wanted the
best for me. Your endless love and support are the essence of my success. Thank you for
making who I am. To my brother and sister in law, thank you for all the love and accepting
who I am, I will feel even more loved if I receive more presents from you. I would also like to

vi
acknowledge all my family who currently live overseas, especially grandpa, grandma, aunty
Connie Liaw, cousins, aunties and uncles, for caring me even though I am far from you.
But most of all, I owe thanks to a very special person, my husband, Alex Thai, for your
unfailing love and support. Thank you for your understanding of my eccentricity and weirds.
You are always with me at times I thought that it is impossible to continue in this journey. My
frustration and burden significantly reduced every time you presented me with your cooking,
meals that filled with love. Thank you, my dearest, for everything and for making me the
luckiest.
vii
Abstract
The high specific strength of magnesium alloys makes them attractive for use in transport
applications where potential weight savings can be significant. However, the most common
magnesium alloys such as AZ91 (Mg-9Al-1Zn) and AM60 (Mg-6Al-0.3Mn) tend to suffer
from poor creep resistance, limiting their use in high-temperature environments. The elevated
temperature applications, such as powertrain components, offer significant potential for vehicle
weight reductions. This limitation has stimulated the development of a number of high creep
resistance magnesium alloys for powertrain components. Moreover, rare earth (RE) alloying
additions in magnesium-aluminium based alloys are widely accepted to improve the creep
resistance. The development of magnesium casting alloys depends significantly on the ability
to control the as-cast microstructure. Microstructure in hyper-eutectic Mg-Al-RE (RE = Ce and
La) alloys are analogous to those in A390 alloys used for pistons and cylinder liners. Both of
these alloy systems form a large amount of hard secondary phase particles and fine eutectic
similar to the composite structure. These attribute to improved properties of the alloys.
Previous studies have been performed to understand the effect of REs on the microstructure of
Mg-Al-RE (AE) alloys, but different phases were reported. In addition, there is limited
information about the effect of individual RE elements on AE alloys, especially on the hyper-
eutectic region of these alloy systems. The lack of a comprehensive understanding of the
microstructure evolution in AE alloys hinders the accuracy of thermodynamic predictions and
hence limit the knowledge in magnesium alloy design and optimisation. Herein, the work
described in this thesis aims to gain an improved understanding of the microstructural
development of AE alloys.
The first objective in this research is to understand better the solidification sequence and
thermodynamic predictions of the investigated alloys, which would be advantageous for the
research and development of improved magnesium alloys. The second objective is to
investigate the impacts of the individual RE (lanthanum and cerium) elements on the
solidification path and microstructural development of AE alloys. Finally, the third objective
of this thesis is to investigate the effects of cooling rates on the solidification behaviour and
microstructure development of AE alloys. This includes the study of processing-microstructure
relationships for the investigated alloys.
The investigations in this research study were carried out on a series of Mg-4Al-xCe and Mg-
4Al-xLa alloys with “x” being the Ce and La concentration range from 4 wt.% to 13 wt.%. All
viii
alloys were gravity cast into a wedge shape mould comprising two sections: permanent mould
and sand mould. The use of a wedge mould with the combination of permanent and sand
moulds allows a wide range of cooling rates to be explored within a single casting. The
solidification behaviour and microstructure formation of these alloys were studied
experimentally using both ex-situ and in-situ techniques. The as-cast microstructures of these
alloys were studied by X-ray powder diffraction, scanning and transmission electron
microscopy. The microstructure evolution was investigated and observed under a real-time
solidification condition using in-situ synchrotron radiography. The effect of the cooling
parameters on the microstructure and solidification behaviour was studied through computer-
aided cooling curve analysis. The experimental results were compared with thermodynamic
predictions calculated using the CALPHAD method.
There has been relatively little research done on the thermodynamic properties and phase
equilibria of the Mg-Al-RE systems compared to other systems. In this study, thermodynamic
calculations were utilised to understand the solidification sequence of the intermetallic phases
through comparison with experimental data, which includes a real-time in-situ observation of
solidification using the synchrotron radiation. It was determined that the thermodynamic
predictions were contradictory to the experimental data. The discrepancy observed in this
comparison, especially in the liquid-solid and solid-solid phase transformations, suggests that
the Mg-Al-Ce and Mg-Al-La systems should be remodelled to improve the accuracy of the
thermodynamic database.
The effects of alloying compositions on the solidification and microstructure development are
also discussed in this thesis. The resultant microstructures from the as-cast alloys were
characterised. The low RE content alloys, such as ALa44 and ACe44, exhibited a primary α-
Mg phase surrounded by an interdendritic region of Mg and intermetallic(s). On the other hand,
the high RE content alloys, such as ALa413 and ACe413, exhibited a primary intermetallic
phase before the α-Mg grains developed. The morphology of the eutectic was also very distinct
between the investigated alloys. During phase characterisation, there were distinct unknown
peaks observed in the XRD measurements indicating a new type of intermetallic phase. After
a detailed investigation, a new phase, (Al,Mg)3La, was identified, which was found to be the
dominant phase in the ALa44 alloys. The morphology and crystallographic information of this
new (Al,Mg)3La phase is also described in this thesis.
ix
Another goal of this research is to study the relationships between the processing condition (i.e.
cooling rate) and the resultant microstructure of the as-cast AE alloys. The effects of different
cooling rates on the microstructures were analysed. Microstructural features, such as grain size
and secondary dendrite arm spacing (SDAS) of the α-Mg phase, were measured and their
influence on hardness has also been investigated. It was observed that the microstructural
features contribute significantly to the hardness of the alloys. A generalised relationship
between freezing time and SDAS using the commonly used empirical equation has been
developed. In addition, microstructure-property relationships between yield stress and
microstructure features (grain size and SDAS) for these alloys were discussed and established
based on the Hall-Petch equation. This linear relationship with SDAS is observed to be similar
to that obtained for average grain size, in which smaller SDAS and grain size leads to higher
yield stress and hardness. Using these relationships developed in this study, it is possible to
predict the hardness and microstructure features at a given cooling rate for the investigated
alloys.
The consolidation of these objectives and the results of this research study can improve the
knowledge base of AE alloys, especially from the perspective of solidification behaviour and
microstructure development. The results should prove useful for alloy design and development
that are targeted for specific applications, as well as for alloy optimisation to improve cast
magnesium alloys.
Keywords: casting, as-cast magnesium alloys, microstructure, solidification process, cooling
rate, Mg-Al-La system, Mg-Al-Ce system, thermodynamic prediction.
x
Publications and Achievements
Publications
C. Wong, M.J. Styles, S. Zhu, T. Abbott, K. Nogita, S.D. McDonald, D.H. StJohn, M.A. Gibson, M.A.
Easton; Experimental study of the solidification microstructure in the Mg-rich corner of Mg-Al-Ce
system, Magnesium Technology 2018, The Minerals, Metals & Materials Annual Meeting and
Exhibition, Springer, 2018, p. 79-85. (Chapter 4)
C. Wong, M.J. Styles, S. Zhu, D. Qiu, S.D. McDonald, Y. Zhu, M.A. Gibson, T.B. Abbott, M.A.
Easton; (Al,Mg)3La: a new phase in the Mg-Al-La system, Acta Crystallographica Section B: Structural
Science, Crystal Engineering and Materials, 2018, 74(4): p. 370-375. (Chapter 5)
C. Wong, K. Nogita, M.J. Styles, S. Zhu, D. Qiu, S.D. McDonald, M.A. Gibson, T.B. Abbott, M.A.
Easton; Solidification path and microstructure evolution of Mg-3Al-14La alloy: implications for the
Mg-rich corner of the Mg-Al-La phase diagram, Journal of Alloys and Compounds, 2019 (784), p. 527-
534. (Chapter 6)
S. Zhu, C. Wong, M.J. Styles, T.B. Abbott, J.F. Nie, M.A. Easton; Revisiting the intermetallic phases
in high-pressure die-cast Mg-4Al-4Ce and Mg-4Al-4La alloys, Materials Characterization, 2019 (156),
p. 109839. (Chapter 7)
Presentations
The Minerals, Metals & Materials (TMS) 2018 – 147th Annual Meeting and Exhibition
Phoenix, Arizona, USA, 11th – 15th March 2018
The 6th conference of the Combined Australian Materials Societies (CAMS)
Wollongong, NSW, Australia, 27th – 29th November 2018
Poster
Synchrotron User Meeting 2017
Melbourne, Australia, 22nd – 24th November 2017
Award
TMS Light Metals Magnesium Best Paper – Student Award
“Experimental study of the solidification microstructure in the Mg-rich corner of Mg-Al-Ce system”
148th TMS Annual Meeting
San Antonio, Texas, USA, 11th March 2019
xi
Table of Contents Declaration ............................................................................................................................... iii
Acknowledgements ................................................................................................................... iv
Abstract .................................................................................................................................... vii
Publications and Achievements ................................................................................................. x
Table of Contents ...................................................................................................................... xi
List of Figures ......................................................................................................................... xiv
List of Tables ....................................................................................................................... xxvii
Chapter 1 Introduction ............................................................................................................... 1
1.1 Research significance and thesis motivation ............................................................... 2
1.1.1 Magnesium alloy designation .............................................................................. 5
1.1.2 The motivation for magnesium alloy applications............................................... 6
1.2 Magnesium alloy processing and manufacturing ...................................................... 10
1.2.1 Elemental magnesium ........................................................................................ 10
1.2.2 Magnesium alloying process.............................................................................. 11
1.2.3 Die-casting process ............................................................................................ 13
1.2.4 Microstructure in cast alloys .............................................................................. 16
1.3 The Mg-Al-RE systems ............................................................................................. 17
1.3.1 Thermodynamic database for Mg-Al-RE systems ............................................. 21
1.4 Research aims and objectives .................................................................................... 21
1.5 Thesis outline ............................................................................................................ 22
1.6 References ................................................................................................................. 25
Chapter 2 Literature Review .................................................................................................... 36
2.1 Thermodynamics and phase diagrams ...................................................................... 37
2.1.1 Fundamentals of phase diagrams ....................................................................... 37
2.1.2 Equilibrium versus Scheil solidification models ............................................... 39
2.1.3 CALPHAD method ............................................................................................ 41
2.1.4 The binary Mg-Al system .................................................................................. 43
2.1.5 The binary Mg-RE systems ............................................................................... 44
2.1.6 The binary Al-RE systems ................................................................................. 47
2.1.7 The ternary Mg-Al-RE systems ......................................................................... 49
2.2 Solidification and microstructure development in Mg-Al-RE alloys ....................... 52
2.2.1 The binary Mg-Al system .................................................................................. 53
xii
2.2.2 The binary Mg-RE systems ............................................................................... 55
2.2.3 The binary Al-RE systems ................................................................................. 58
2.2.4 The ternary Mg-Al-RE systems ......................................................................... 59
2.3 Effect of processing conditions on microstructure and properties of cast Mg alloys64
2.3.1 Processing conditions on the microstructure of Mg-Al-RE alloys .................... 64
2.3.2 Properties of cast Mg-Al-RE alloys ................................................................... 66
2.3.3 Grain refinement for strengthening mechanical properties ............................... 72
2.4 Summary ................................................................................................................... 74
2.5 References ................................................................................................................. 77
Chapter 3 Methodology ........................................................................................................... 99
3.1 Alloy preparation by gravity casting ....................................................................... 100
3.2 Sample preparation for microstructural study ......................................................... 102
3.2.1 Sample preparation for EDX, SEM and EBSD imaging ................................. 102
3.2.2 Sample preparation for X-Ray Powder Diffraction (XRD) ............................. 105
3.3 Microstructure analysis ........................................................................................... 106
3.3.1 Microstructure characterisation ....................................................................... 106
3.3.2 Phase identification .......................................................................................... 108
3.4 Solidification behaviour .......................................................................................... 110
3.4.1 Thermal analysis .............................................................................................. 110
3.4.2 In-situ synchrotron radiography ....................................................................... 111
3.5 Thermodynamic calculations .................................................................................. 111
3.6 References ............................................................................................................... 113
Chapter 4 Experimental study of the solidification microstructure in the Mg-rich corner of Mg–
Al–Ce system ......................................................................................................................... 115
Chapter 5 (Al,Mg)3La: a new phase in the Mg-Al-La system ............................................... 123
Chapter 6 Solidification path and microstructure evolution of Mg-3Al-14La alloy: implications
for the Mg-rich corner of the Mg-Al-La phase diagram ........................................................ 131
Chapter 7 Revisiting the intermetallic phases in high-pressure die-cast Mg–4Al–4Ce and Mg–
4Al–4La alloys ....................................................................................................................... 140
Chapter 8 A comparative study of the solidification microstructure in sand-cast Mg-Al-Ce and
Mg-Al-La alloys..................................................................................................................... 149
Chapter 9 Influence of alloying elements and cooling rates on the microstructure features of
Mg-Al-RE alloys .................................................................................................................... 175
Chapter 10 Conclusions and Recommendations.................................................................... 209

xiii
10.1 Concluding remarks ................................................................................................ 210
10.2 Contributions to knowledge .................................................................................... 214
10.3 Suggestions for future work .................................................................................... 219
10.4 References ............................................................................................................... 222
Appendix A Copyrights Permission ...................................................................................... 223
xiv
List of Figures
Chapter 1 Introduction
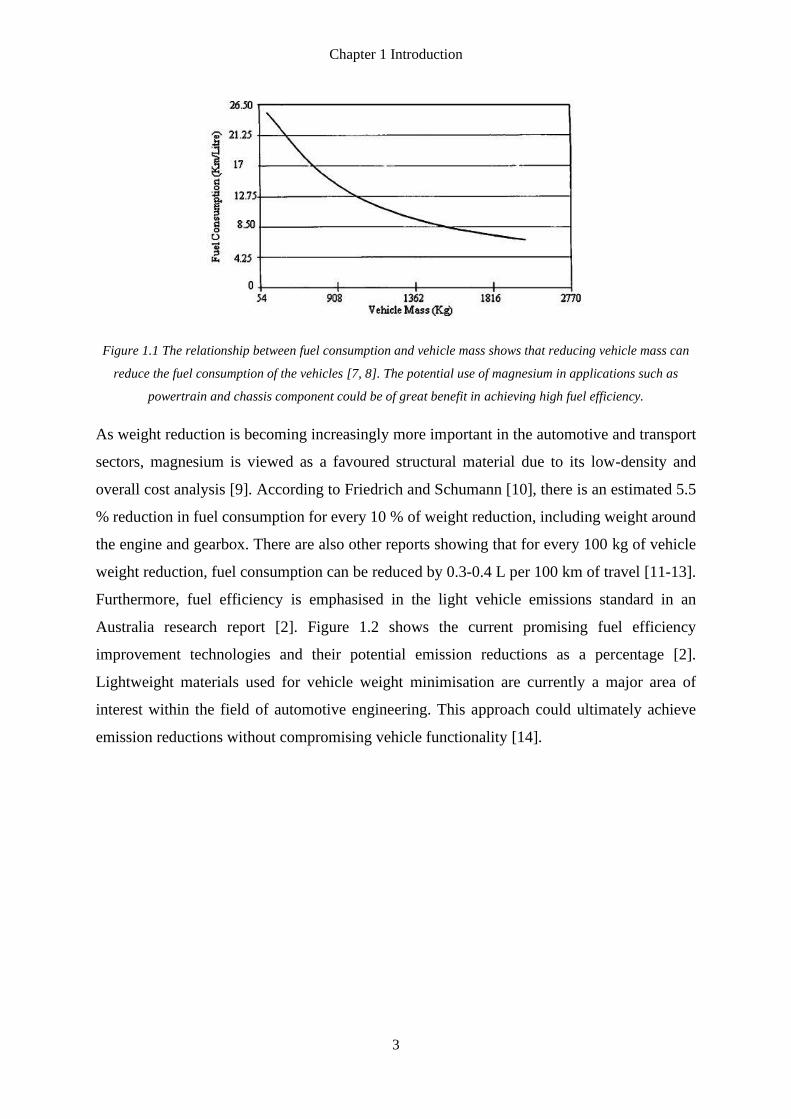
Figure 1.1 The relationship between fuel consumption and vehicle mass shows that reducing
vehicle mass can reduce the fuel consumption of the vehicles [4, 5]. The potential use of
magnesium in applications such as powertrain and chassis component could be of great benefit
in achieving high fuel efficiency................................................................................................ 3
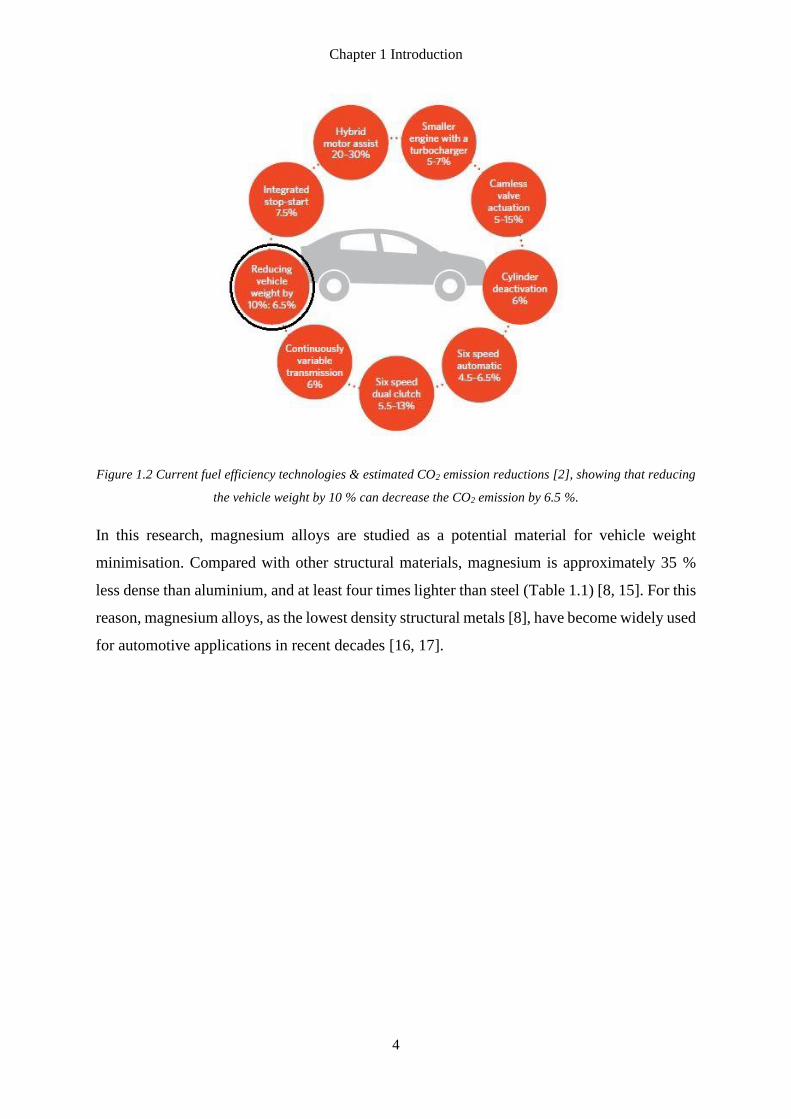
Figure 1.2 Current fuel efficiency technologies & estimated CO2 emission reductions [2],
showing that reducing the vehicle weight by 10 % can decrease the CO2 emission by 6.5 %.. 4
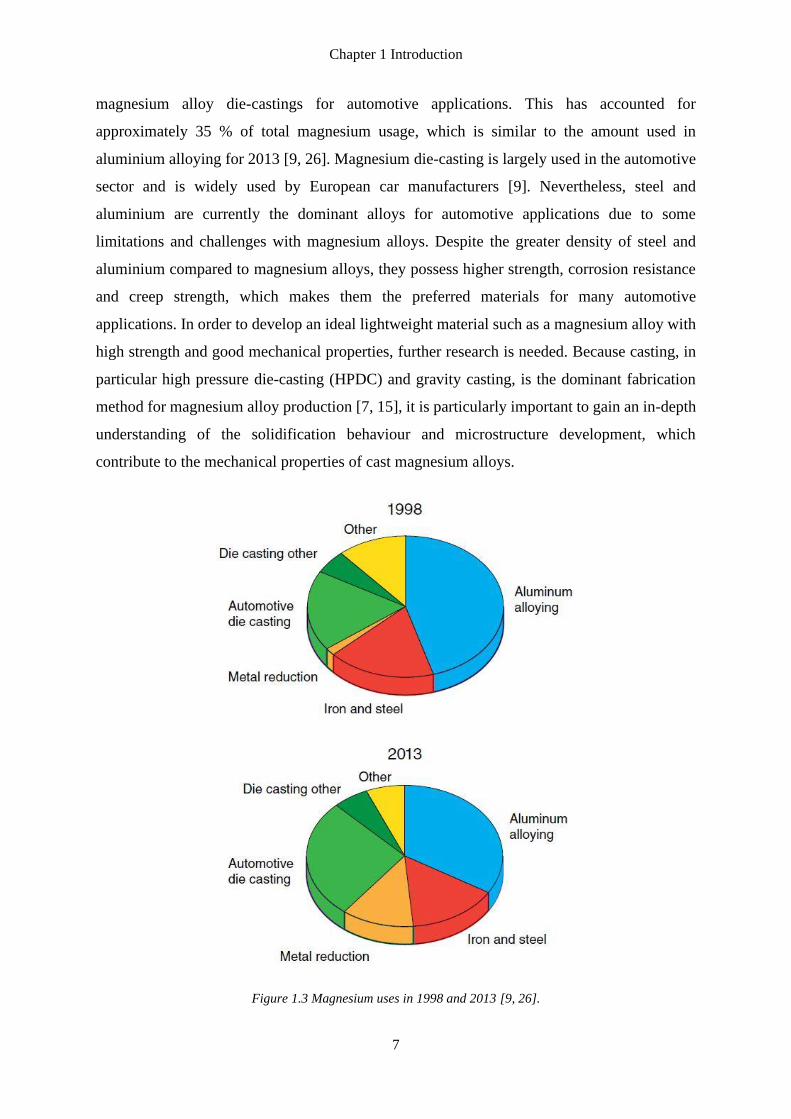
Figure 1.3 Magnesium uses in 1998 and 2013 [6, 23]. .............................................................. 7
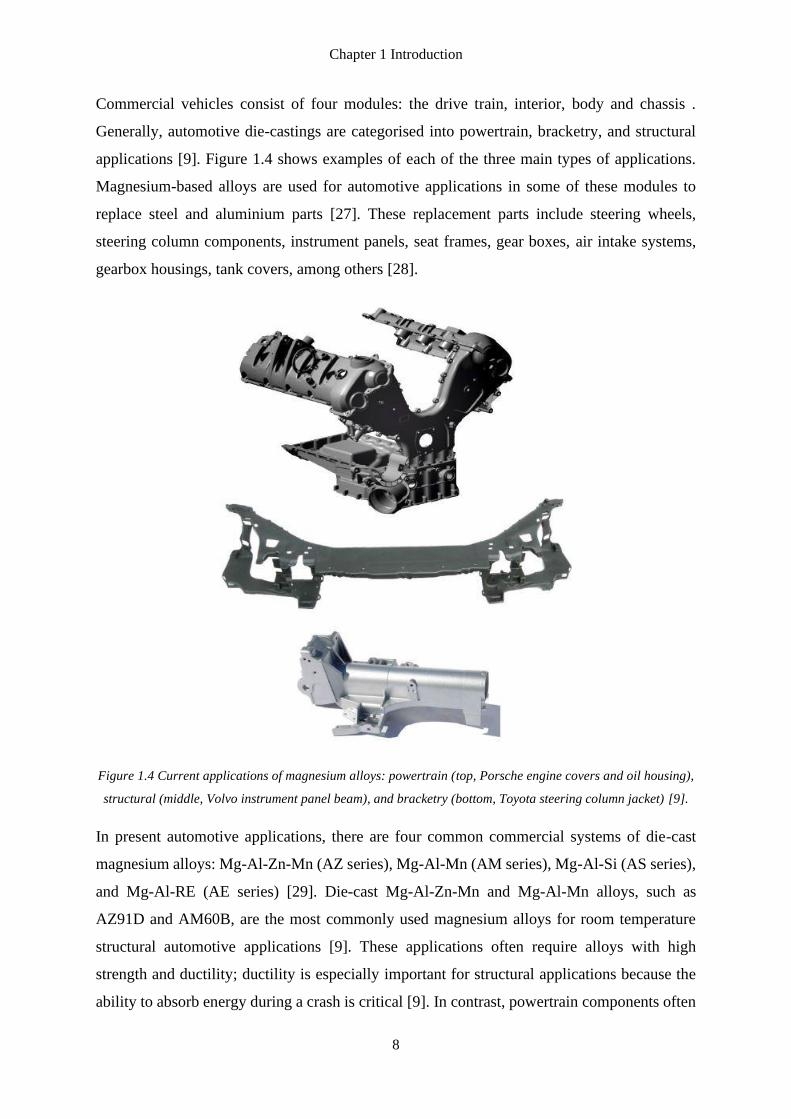
Figure 1.4 Current applications of magnesium alloys: powertrain (top, Porsche engine covers
and oil housing), structural (middle, Volvo instrument panel beam), and bracketry (bottom,
Toyota steering column jacket) [6]. ........................................................................................... 8
Figure 1.5 Fluidity of Mg-Al-xRE alloys [55]......................................................................... 14
Figure 1.6 A typical microstructure of a cast ingot [60]. ......................................................... 17
Figure 1.7 Tensile creep curve for HPDC AZ91, AE44 and ACe44 [70]. .............................. 18
Figure 1.8 Creep strain rate for various magnesium alloys at 150 ˚C under a tensile load of 50
MPa [71]. ................................................................................................................................. 19
Figure 1.9 Microhardness of alloys matrix in Mg-Al and Mg-Al-RE alloys [55]. .................. 19
Figure 1.10 Effect of rare earth contents on TYS of AE alloys [48]. ...................................... 20
xv
Figure 1.11 High performance die-cast AE alloys are selected to produce (a) cylinder head
cover of the high power diesel engine and (b) oil pan for cars [75, 86]. ................................. 20
Chapter 2 Literature Review
Figure 2.1 (a) Equilibrium phase diagram of the Mg-Al binary system [2] and (b) magnification
of the lead-tin phase diagram showing microstructure evolution of a hypo-eutectic alloy [3].
.................................................................................................................................................. 38
Figure 2.2 Liquidus projection for the Mg-Al-Ce system [6]. ................................................. 38
Figure 2.3 Magnified phase diagram with Lever rule illustrations [9]. ................................... 40
Figure 2.4 Equilibrium phase diagram of the Mg–Al binary system [49]. .............................. 44
Figure 2.5 Equilibrium phase diagram of the Mg–Ce binary system [49]. ............................. 44
Figure 2.6 Equilibrium phase diagram of the Mg–La binary system [65]. .............................. 46
Figure 2.7 (a) Al-Ce phase diagram from [77] compared with a selection of experimental points
from [75, 76, 91, 92], and (b) Al-La phase diagram from [77] compared with a selection of
experimental points from [76, 92, 93]. .................................................................................... 48
Figure 2.8 Liquidus projection of the ternary (a) Mg-Al-Ce system and (b) Mg-Al-La system
[95]. .......................................................................................................................................... 50
xvi
Figure 2.9 Solidified microstructure of (a) the Mg-4Al alloy [2] with the primary α-Mg
appearing as the darker part, and the Mg17Al12 (labelled as β) eutectic phase appears brighter,
and (b) the Mg-44Al alloy [122] with the white phase being the Mg17Al12 intermetallic. ...... 54
Figure 2.10 The eutectic (α-Mg + Mg17Al12) is (a) a lamellar or (b) a fibrous morphology when
the aluminium content is more than 12 wt.% in Mg-Al based alloys, whereas the eutectic
structure has (c) partially divorced or (d) fully divorced morphologies when the aluminium
content decreases to less than 9 wt.% [113, 118, 123]. ........................................................... 54
Figure 2.11 Scheil-Gulliver prediction of the solidification path for Mg-4Al alloy [2]. ......... 55
Figure 2.12 SEM Micrographs (a) Mg-5.2 wt.% La, (b) Mg-4.8 wt.% Ce, and (c) Mg-3.5 wt.%
Nd alloys [10]. ......................................................................................................................... 56
Figure 2.13 Optical micrographs of Mg–La alloys at (a) 0.94 wt.%, (c) 3.44 wt.% and (e) 5.07
wt.%; Mg–Nd alloys at (b) 0.47 wt.%, (d) 1.25 wt.% and (f) 3.53 wt.% [10]. ....................... 57
Figure 2.14 As-cast microstructure of (a) Al-10La, (b) Al-15La and (c) Al-20La alloys [128].
.................................................................................................................................................. 58
Figure 2.15 (a) microstructure and (b) line scan of the Al-35La alloy using SEM, showing that
the branch of the dendrite structure is discontinuous with two elements detected [129]. ....... 59
Figure 2.16 Schematic diagram of the proposed alternate nucleation and growth to form two-
phase dendrite structure [129]. ................................................................................................. 59
Figure 2.17 SEM microstructure of AE44 in (a) ingot condition and (b) hot chamber die-casting
[148]. ........................................................................................................................................ 60
xvii
Figure 2.18 Backscatter electron micrographs of (a) Mg-4Al-4La-0.4Mn containing Al11La3,
(b) Mg-4Al-4La/Ce-0.4Mn containing Al11RE3 and Al2RE, and (c) Mg-4Al-4Ce-0.4Mn
containing Al11Ce3 and Al2Ce [131]. ....................................................................................... 62
Figure 2.19 SEM micrographs of the as-cast (a) as-cast Mg-3Al-2Y-1Ce alloy [164] and (b)
AE44 [9]................................................................................................................................... 63
Figure 2.20 Effect of cerium content on the dendrite arm spacing (DAS) of HPDC Mg-Al-Ce
alloys [147]. ............................................................................................................................. 63
Figure 2.21 The effect of cooling rate on the SDAS (d) of the Zn-40Al-1Cu, Zn-40Al-2Cu and
Zn-40Al-3Cu alloys [170]........................................................................................................ 65
Figure 2.22 The effect of cooling rate on eutectic morphology in permanent mould cast hypo-
eutectic Mg-Al alloys [172]. .................................................................................................... 66
Figure 2.23 Creep rates of alloys with different applied stresses at 200 ˚C [180]. .................. 68
Figure 2.24 SEM Images of (a) AZ91 (b) AZ91 with 2 wt.% rare earth in the 24 hours annealed
condition [182]. ........................................................................................................................ 69
Figure 2.25 The effect of SDAS (d) on the hardness of Zn-40Al-1Cu, Zn-40Al-2Cu and Zn-
40Al-3Cu alloys [170]. ............................................................................................................ 72
Figure 2.26 Wettability of potential inoculants in Mg-Al-RE alloys [214]. ............................ 74
Figure 2.27 The identified research gaps in the literature and the respective hypotheses. ...... 76

xviii
Chapter 3 Methodology
Figure 3.1 Wedge mould equipped with three thermocouples attached directly to the permanent
steel mould to monitor the mould temperature. Seven additional thermocouples were set up
inside the mould to have direct contact with the alloy. .......................................................... 100
Figure 3.2 Sample was cast into a wedge-shaped mould consisting of two parts: sand mould
(left) and permanent mould (right). ....................................................................................... 101
Figure 3.3 Locations of the seven samples cut from the wedge castings for microstructural
studies. ................................................................................................................................... 103
Figure 3.4 Wedge cast sample cut in half for XRD. .............................................................. 105
Figure 3.5 Three-dimensional topology of intermetallic phases. .......................................... 107
Figure 3.6 A typical slice and view technique [4]. ................................................................ 107
Figure 3.7 EBSD Kikuchi pattern of Al5La2 for potent nucleant investigation. .................... 108
Figure 3.8 XRD measurement with a sample setup in the Rigaku Smartlab. ........................ 109
Figure 3.9 (a) Experimental setup and (b) sample configuration for in-situ synchrotron
radiography at BL20B2 beamline at SPring-8 [12]. .............................................................. 111
Figure 3.10 Liquidus projection of (a) Mg-Al-La system and (b) Mg-Al-Ce system generated
by Pandat® PanMagnesium 2018 [13]. .................................................................................. 112
xix
Chapter 4 Experimental study of the solidification microstructure in the Mg-rich
corner of Mg–Al–Ce system
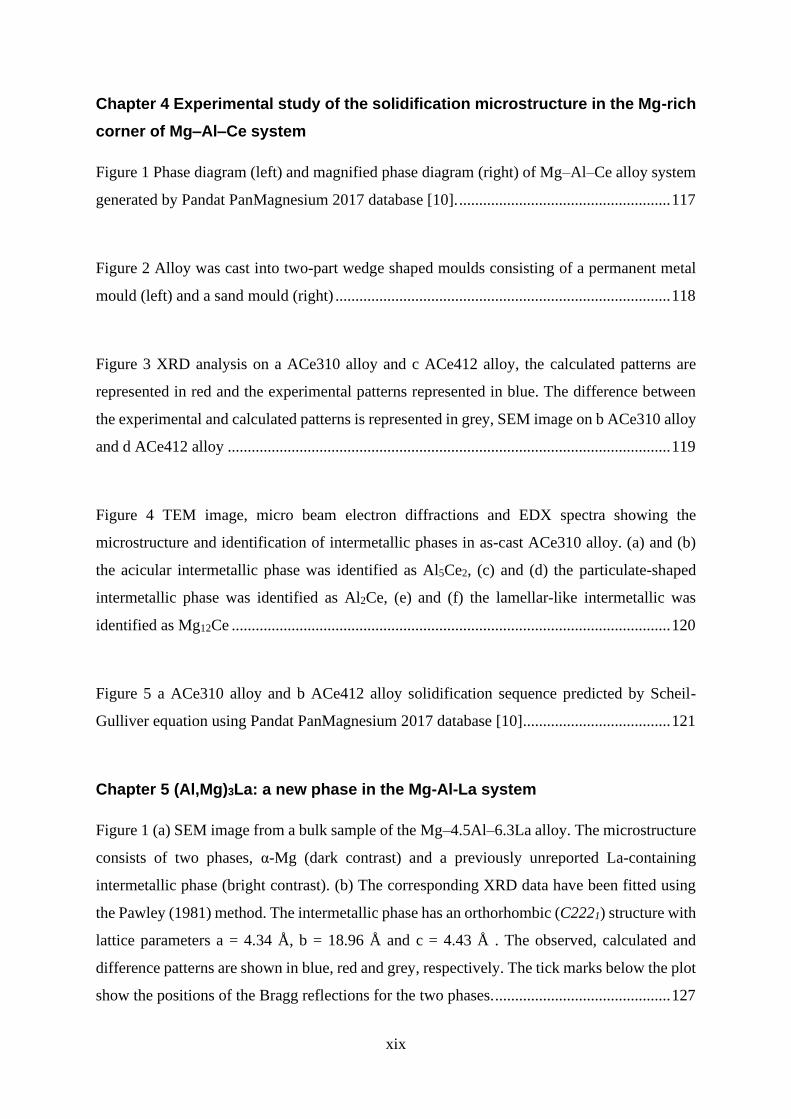
Figure 1 Phase diagram (left) and magnified phase diagram (right) of Mg–Al–Ce alloy system
generated by Pandat PanMagnesium 2017 database [10]. ..................................................... 117
Figure 2 Alloy was cast into two-part wedge shaped moulds consisting of a permanent metal
mould (left) and a sand mould (right) .................................................................................... 118
Figure 3 XRD analysis on a ACe310 alloy and c ACe412 alloy, the calculated patterns are
represented in red and the experimental patterns represented in blue. The difference between
the experimental and calculated patterns is represented in grey, SEM image on b ACe310 alloy
and d ACe412 alloy ............................................................................................................... 119
Figure 4 TEM image, micro beam electron diffractions and EDX spectra showing the
microstructure and identification of intermetallic phases in as-cast ACe310 alloy. (a) and (b)
the acicular intermetallic phase was identified as Al5Ce2, (c) and (d) the particulate-shaped
intermetallic phase was identified as Al2Ce, (e) and (f) the lamellar-like intermetallic was
identified as Mg12Ce .............................................................................................................. 120
Figure 5 a ACe310 alloy and b ACe412 alloy solidification sequence predicted by Scheil-
Gulliver equation using Pandat PanMagnesium 2017 database [10] ..................................... 121
Chapter 5 (Al,Mg)3La: a new phase in the Mg-Al-La system
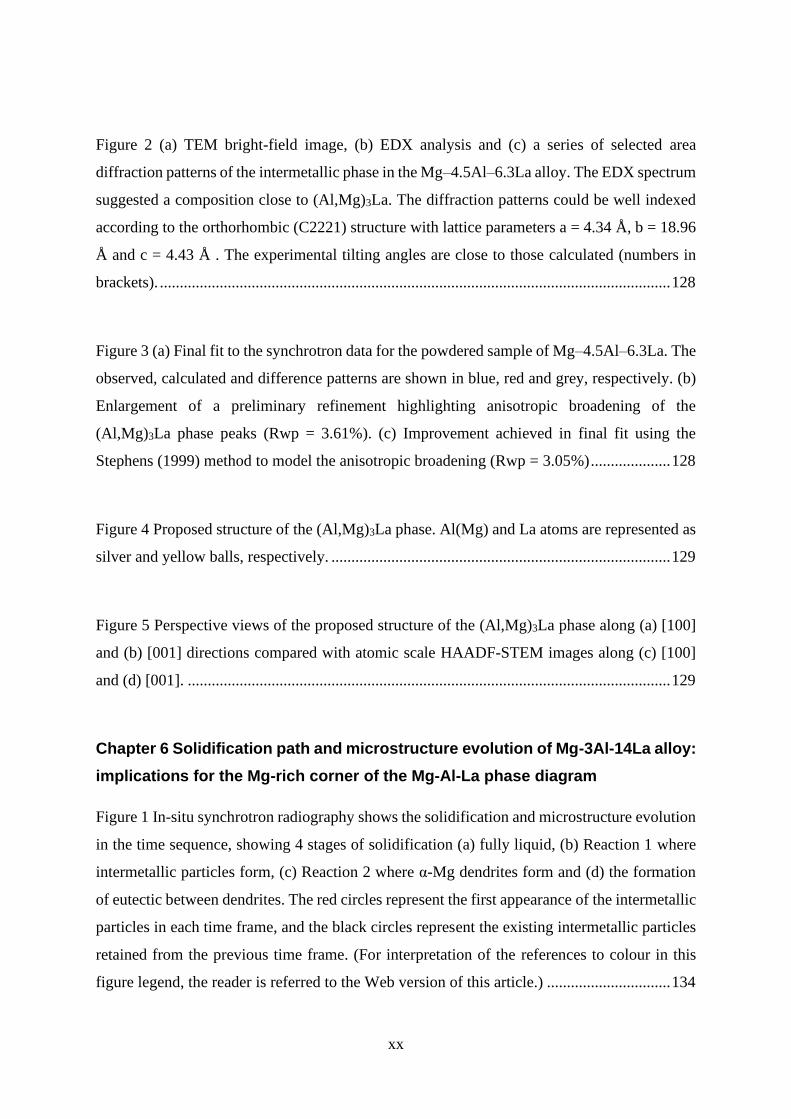
Figure 1 (a) SEM image from a bulk sample of the Mg–4.5Al–6.3La alloy. The microstructure
consists of two phases, α-Mg (dark contrast) and a previously unreported La-containing
intermetallic phase (bright contrast). (b) The corresponding XRD data have been fitted using
the Pawley (1981) method. The intermetallic phase has an orthorhombic (C2221) structure with
lattice parameters a = 4.34 Å, b = 18.96 Å and c = 4.43 Å . The observed, calculated and
difference patterns are shown in blue, red and grey, respectively. The tick marks below the plot
show the positions of the Bragg reflections for the two phases. ............................................ 127
xx
Figure 2 (a) TEM bright-field image, (b) EDX analysis and (c) a series of selected area
diffraction patterns of the intermetallic phase in the Mg–4.5Al–6.3La alloy. The EDX spectrum
suggested a composition close to (Al,Mg)3La. The diffraction patterns could be well indexed
according to the orthorhombic (C2221) structure with lattice parameters a = 4.34 Å, b = 18.96
Å and c = 4.43 Å . The experimental tilting angles are close to those calculated (numbers in
brackets). ................................................................................................................................ 128
Figure 3 (a) Final fit to the synchrotron data for the powdered sample of Mg–4.5Al–6.3La. The
observed, calculated and difference patterns are shown in blue, red and grey, respectively. (b)
Enlargement of a preliminary refinement highlighting anisotropic broadening of the
(Al,Mg)3La phase peaks (Rwp = 3.61%). (c) Improvement achieved in final fit using the
Stephens (1999) method to model the anisotropic broadening (Rwp = 3.05%) .................... 128
Figure 4 Proposed structure of the (Al,Mg)3La phase. Al(Mg) and La atoms are represented as
silver and yellow balls, respectively. ..................................................................................... 129
Figure 5 Perspective views of the proposed structure of the (Al,Mg)3La phase along (a) [100]
and (b) [001] directions compared with atomic scale HAADF-STEM images along (c) [100]
and (d) [001]. ......................................................................................................................... 129
Chapter 6 Solidification path and microstructure evolution of Mg-3Al-14La alloy:
implications for the Mg-rich corner of the Mg-Al-La phase diagram
Figure 1 In-situ synchrotron radiography shows the solidification and microstructure evolution
in the time sequence, showing 4 stages of solidification (a) fully liquid, (b) Reaction 1 where
intermetallic particles form, (c) Reaction 2 where α-Mg dendrites form and (d) the formation
of eutectic between dendrites. The red circles represent the first appearance of the intermetallic
particles in each time frame, and the black circles represent the existing intermetallic particles
retained from the previous time frame. (For interpretation of the references to colour in this
figure legend, the reader is referred to the Web version of this article.) ............................... 134
xxi
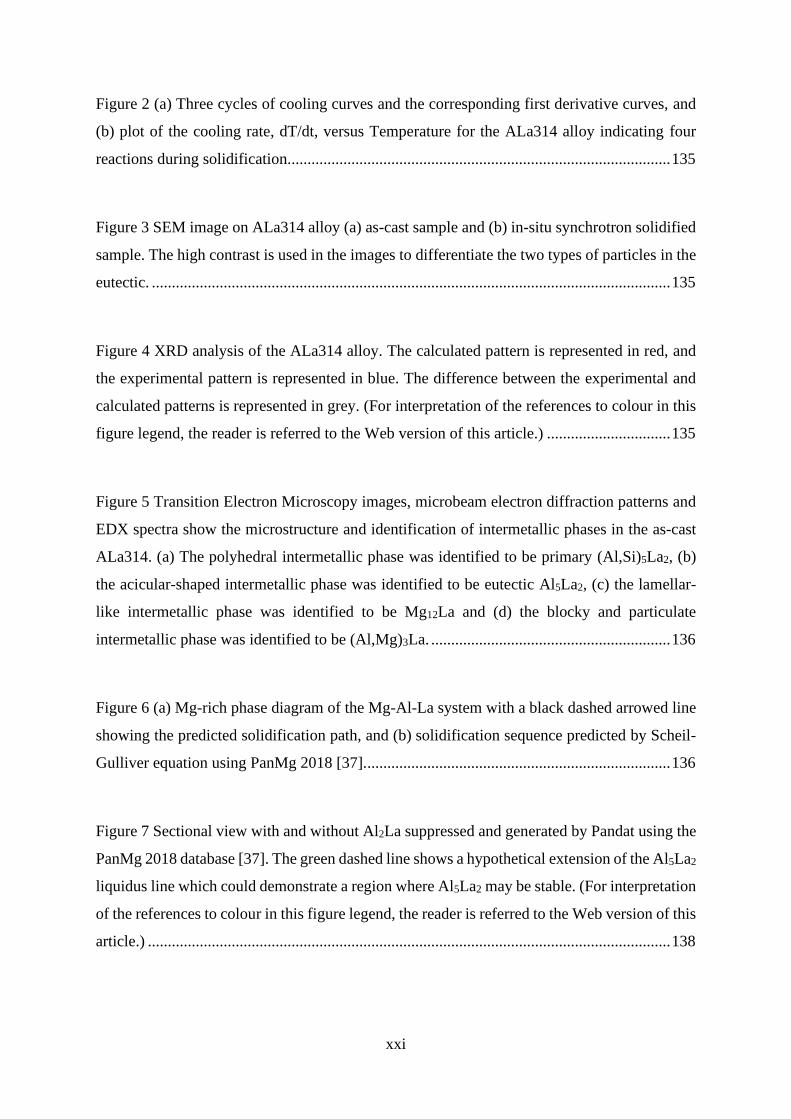
Figure 2 (a) Three cycles of cooling curves and the corresponding first derivative curves, and
(b) plot of the cooling rate, dT/dt, versus Temperature for the ALa314 alloy indicating four
reactions during solidification................................................................................................ 135
Figure 3 SEM image on ALa314 alloy (a) as-cast sample and (b) in-situ synchrotron solidified
sample. The high contrast is used in the images to differentiate the two types of particles in the
eutectic. .................................................................................................................................. 135
Figure 4 XRD analysis of the ALa314 alloy. The calculated pattern is represented in red, and
the experimental pattern is represented in blue. The difference between the experimental and
calculated patterns is represented in grey. (For interpretation of the references to colour in this
figure legend, the reader is referred to the Web version of this article.) ............................... 135
Figure 5 Transition Electron Microscopy images, microbeam electron diffraction patterns and
EDX spectra show the microstructure and identification of intermetallic phases in the as-cast
ALa314. (a) The polyhedral intermetallic phase was identified to be primary (Al,Si)5La2, (b)
the acicular-shaped intermetallic phase was identified to be eutectic Al5La2, (c) the lamellar-
like intermetallic phase was identified to be Mg12La and (d) the blocky and particulate
intermetallic phase was identified to be (Al,Mg)3La. ............................................................ 136
Figure 6 (a) Mg-rich phase diagram of the Mg-Al-La system with a black dashed arrowed line
showing the predicted solidification path, and (b) solidification sequence predicted by Scheil-
Gulliver equation using PanMg 2018 [37]............................................................................. 136
Figure 7 Sectional view with and without Al2La suppressed and generated by Pandat using the
PanMg 2018 database [37]. The green dashed line shows a hypothetical extension of the Al5La2
liquidus line which could demonstrate a region where Al5La2 may be stable. (For interpretation
of the references to colour in this figure legend, the reader is referred to the Web version of this
article.) ................................................................................................................................... 138
xxii
Figure 8 The atomic configuration in the CP plane of (a) (0002)Mg and (b) (1210)Al5La2. The
most CP rows are highlighted by bold solid lines.................................................................. 138
Chapter 7 Revisiting the intermetallic phases in high-pressure die-cast Mg–4Al–
4Ce and Mg–4Al–4La alloys
Figure 1 XRD spectra of the as-cast (a) ACe44 and (b) ALa44 alloys. The measured pattern is
represented in blue and the calculated pattern in red. The difference between the measured and
calculated is represented in grey. ........................................................................................... 143
Figure 2 SEM backscattered electron images showing the microstructure in the as-cast (a)
ACe44 and (b) ALa44 alloys. The typical intermetallic phases are indicated by arrows and
labelled. The phase identifications are based on the SEM-EDS analyses and the TEM analyses
that are shown in Figure 3 and Figure 4. ............................................................................... 143
Figure 3 TEM bright field images, selected area electron diffraction patterns and EDS spectra
of the typical intermetallic phases in the as-cast ACe44 alloy: (a) Al11Ce3, (b) Al2Ce and (c)
Al5Ce2. ................................................................................................................................... 144
Figure 4 TEM bright field images, selected area electron diffraction patterns and EDS spectra
of the typical intermetallic phases in the as-cast ALa44 alloy: (a) (Al,Mg)3La, (b) Al11La3 and
(c) Al5La2. .............................................................................................................................. 145
Figure 5 XRD spectra of (a) ACe44 and (b) ALa44 alloys annealed at 500 ˚C for 100 hrs. The
measured pattern is represented in blue and the calculated pattern in red. The difference
between the measured and calculated is represented in grey. ................................................ 146
Figure 6 SEM backscattered electron images showing the microstructure in (a) ACe44 and (b)
ALa44 alloys annealed at 500 ˚C for 100 hrs. The Al5Ce2 and Al3Ce phases are indicated by
arrows and labelled in (a). The phase identifications are based on the SEM-EDS analyses and
xxiii
the TEM analyses that are shown in Figure 7. Other intermetallic phases are not indicated as
they are not readily distinguishable in morphology. .............................................................. 146
Figure 7 TEM bright field image, selected area electron diffraction pattern and EDS spectrum
of (a) Al5Ce2 and (b) Al3Ce phases in ACe44 alloy annealed at 500 ˚C for 100 hrs. ........... 146
Chapter 8 A comparative study of the solidification microstructure in sand-cast
Mg-Al-Ce and Mg-Al-La alloys
Figure 1 Secondary electron micrographs of the sand-cast (a) ACe44, (b) ACe47, (c) ACe310,
(d) ACe413, (e) ALa44, (f) ALa37, (g) ALa311 and (h) ALa413. ........................................ 155
Figure 2 XRD analysis of (a) ACe44, (b) ACe47, (c) ACe310 and (d) ACe413 alloys. The
calculated patterns are represented in red and the experimental patterns in blue. The difference
between the experimental and calculated patterns is represented in grey. ............................ 157
Figure 3 Identification of intermetallic phases in sand-cast ACe44 by SEM-EDX analysis: (a)
low-magnification backscattered electron image, (b) high-magnification backscattered electron
image, (c) EDX spectrum of Al11Ce3, (d) EDX spectrum of Al2Ce, (e) EDX spectrum of
Mg17Al12 and (f) EDX spectrum of (Al,Si)5Ce2..................................................................... 158
Figure 4 TEM bright field images, selected area electron diffraction patterns and EDX spectra
of the intermetallic phases in the as-cast ACe44 alloys. ........................................................ 159
Figure 5 XRD analysis of (a) ALa44, (b) ALa37, (c) ALa311 and (d) ALa413 alloys. The
calculated patterns are represented in red and the experimental patterns in blue. The difference
between the experimental and calculated patterns is represented in grey. ............................ 160
Figure 6 Identification of intermetallic phases in sand-cast ALa44 by SEM-EDX analysis: (a)
low-magnification backscattered electron image, (b) high-magnification backscattered electron
xxiv
image, (c) EDX spectrum of (Al,Mg)3La, (d) EDX spectrum of Mg17Al12 and (e) EDX
spectrum of (Al,Si)5La2... ....................................................................................................... 161
Figure 7 TEM bright field images, selected area electron diffraction patterns and EDX spectra
of (Al,Mg)3La phase in the as-cast ALa44 alloy. .................................................................. 162
Figure 8 (a) Temperature-fraction solid curves generated using Scheil-Gulliver equation for
Mg-Al-Ce alloys with varying Ce concentrations in the alloys. (b) Is the magnified plot of
liquidus temperature (L + α-Mg for ACe44, ACe47 and ACe310, whereas L + Al2Ce for
ACe413), (c) Is the magnified plot of “L + α-Mg + Al2Ce” for ACe44, ACe47 and ACe310,
whereas “L + Al2Ce + α-Mg” for ACe413, and (d) Is the magnified plot of “α-Mg + Al11Ce3 +
Mg17Al12” for ACe44 and ACe47, whereas “α-Mg + Al2Ce” for ACe310 and “Al2Ce + α-Mg”
for ACe413............................................................................................................................. 164
Figure 9 (a) Temperature-fraction solid curves generated using Scheil-Gulliver equation for
Mg-Al-La alloys with varying La concentrations in the alloys. (b) Is the magnified plot of
liquidus temperature (L + α-Mg for all Mg-Al-La alloys, (c) Is the magnified plot of “L+α-
Mg+Al2La” for ALa44 and “α-Mg+Al2La+Mg12La” for ALa37, ALa311 and ALa413, and (d)
Is the magnified plot of “α-Mg+Al11La3+Mg17Al12” for ALa44. .......................................... 166
Chapter 9 Influence of alloying elements and cooling rates on the microstructure
features of Mg-Al-RE alloys
Figure 1 Schematic of the wedge mould dimensions and thermocouple positions in the wedge
cast sample. ............................................................................................................................ 180
Figure 2 Cooling curves at different locations along the wedge cast, as measured from the
wedge tip, for ALa413. Thermocouple location 1 is located at 10 mm, location 2 is at 30 mm,
location 3 is at 70 mm, location 4 is at 90 mm, location 5 is at 115 mm, location 6 is at 150 mm
and lastly location 7 is at 165 mm, measured from the tip of the wedge cast. ...................... 182
xxv
Figure 3 (a) Instantaneous cooling rate at liquidus (Ṫ) and (b) dendrite growth time (tf) of the
investigated alloys at different wedge locations. The numbers above indicate the locations
within the wedge casting. The instantaneous cooling rate at liquidus at location 1 was estimated
using the extrapolation method, whereas the cooling rates at the remaining locations were
measured directly from the experimental cooling curves. ..................................................... 183
Figure 4 Cooling curve obtained at location 7 of ALa44 showing the different stages of
solidification. ......................................................................................................................... 185
Figure 5 Optical images of ACe44 at location (a) 2, (b) 3, (c) 4, (d) 5, (e) 6 and (f) 7, used for
grain size measurement. ......................................................................................................... 187
Figure 6 SEM images of (a) ACe44, (b) ACe413, (C) ALa44 and (d) ALa413 at different
cooling rates along the wedge cast sample. ........................................................................... 187
Figure 7 The relationship between grain size and instantaneous cooling rate at liquidus for the
four alloys. ............................................................................................................................. 189
Figure 8 SDAS as a function of (a) dendrite growth time for the alloys (Equation 3) and (b)
instantaneous cooling rate at liquidus (Equation 4). .............................................................. 190
Figure 9 The relationship between intermetallic fraction and (a) instantaneous cooling rate at
liquidus and (b) dendrite growth time for all alloys. ............................................................. 192
Figure 10 Hardness at each of the seven locations of the wedge samples for all four investigated
alloys. ..................................................................................................................................... 193
Figure 11 The relationship between hardness and (a) grain size as well as (b) SDAS.......... 194
xxvi
Figure 12 Hall-Petch relationship using yield strength as a function of (a) grain size and (b)
SDAS for all four investigated alloys, in which the yield strength was calculated using Equation
5.............................................................................................................................................. 195
Figure 13 Plot of hardness against the amount of intermetallic phase in area fraction. ........ 196
Chapter 10 Conclusions
Figure 10.1 Liquidus projection of Mg-rich corner of (a) Mg-Al-Ce system, (b) Mg-Al-La
system without Al2La suppressed and (c) Mg-Al-La system with Al2La suppressed and
generated by Pandat® using PanMagnesium 2018 [5], showing a hypothetical extension of
Al2Ce and Al5La2 phase fields towards the Mg-rich corner, respectively. The α-Mg phase field
is smaller than their current predictions. In addition, the (Al,Mg)3La phase is not in the
thermodynamic database of Mg-Al-La system. ..................................................................... 216
Figure 10.2 Microstructure characterisation for sand-cast (a) Mg-Al-Ce alloys with Ce content
and (b) Mg-Al-La alloys with La content range between 4 and 13 wt.%. ............................. 218
xxvii
List of Tables
Chapter 1 Introduction
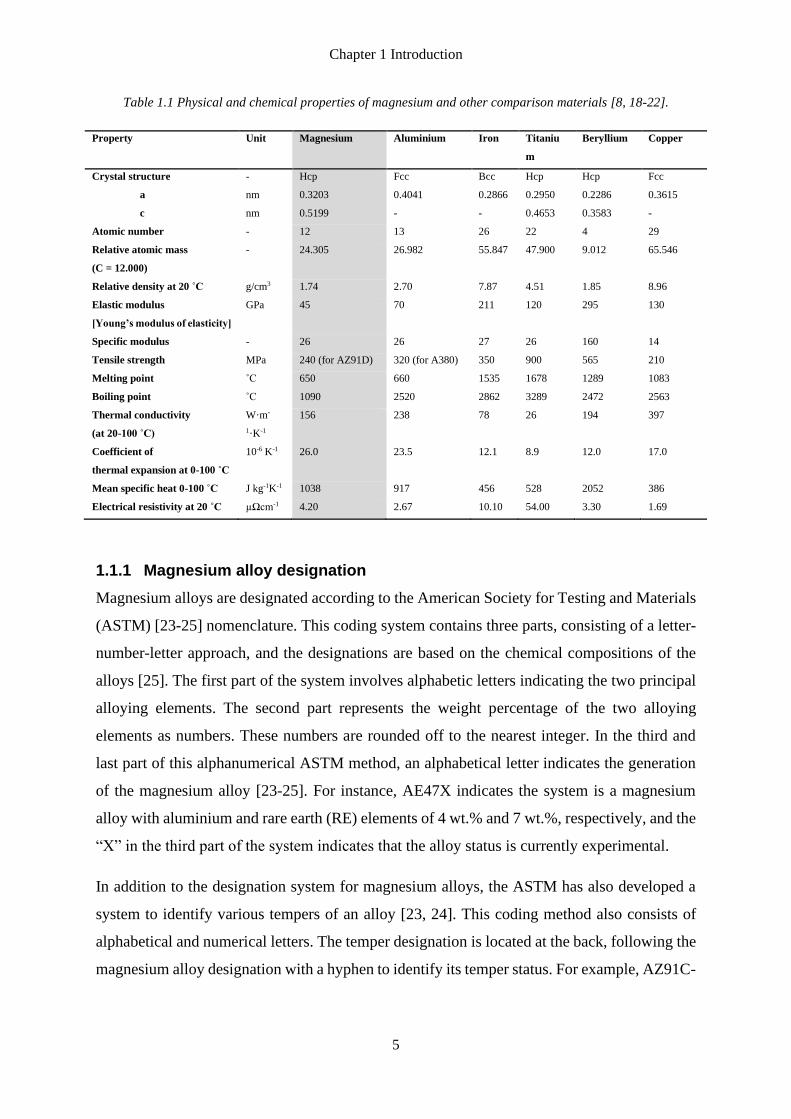
Table 1.1 Physical and chemical properties of magnesium and other comparison materials [5,
15-19]. ........................................................................................................................................ 5
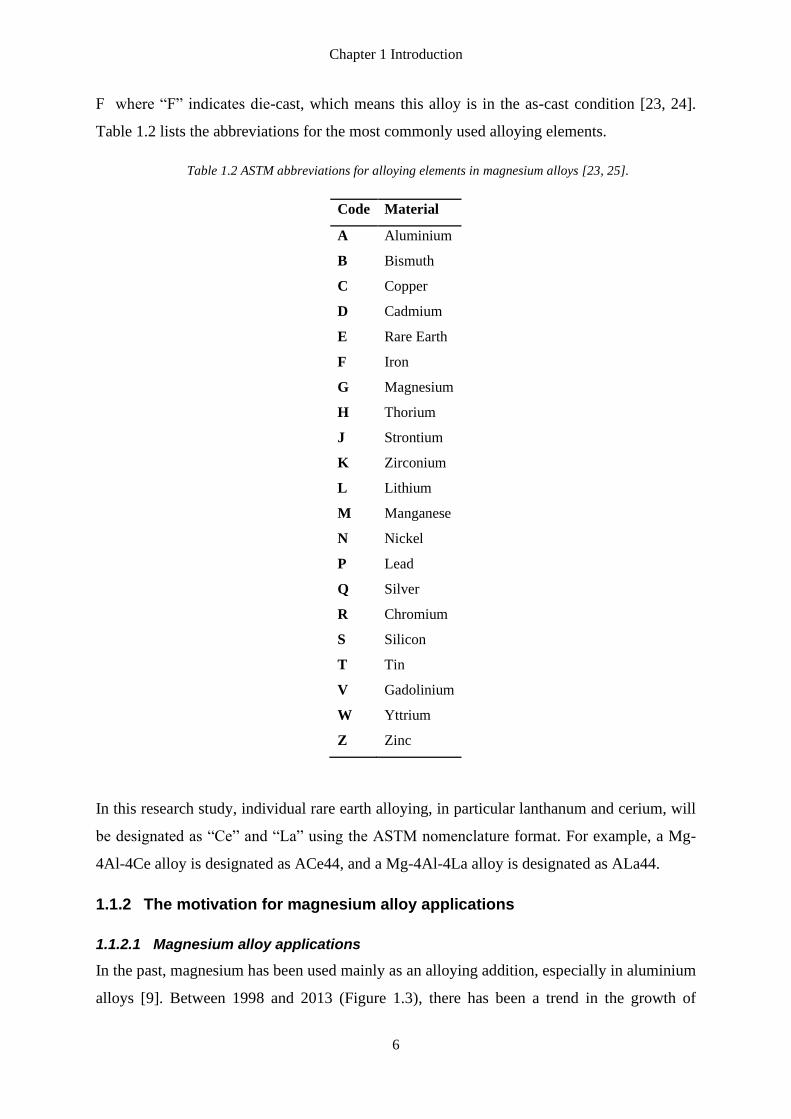
Table 1.2 ASTM abbreviations for alloying elements in magnesium alloys [20, 22]. .............. 6
Table 1.3 Physical properties of magnesium [45]. .................................................................. 11
Table 1.4 The major alloying elements and their effects in magnesium alloys [21, 47-49]. ... 13
Table 1.5 The advantages and disadvantages of high pressure die-cast for Mg alloys [25]. ... 15
Table 1.6 Design parameters for magnesium and aluminium die-casting [12]. ...................... 15
Chapter 2 Literature Review
Table 2.1 Crystal structures for Mg-Al intermetallic phases. .................................................. 43
Table 2.2 Crystal structures for Mg-Ce intermetallic phases [49]. .......................................... 45
Table 2.3 Crystal structures for Mg-La intermetallic phases [65]. .......................................... 46
Table 2.4 The important features obtained from the Mg-RE binary phase diagrams [10, 73, 74].
.................................................................................................................................................. 47
Table 2.5 Al-Ce intermetallic phases and their associated crystallographic information. ....... 48
xxviii
Table 2.6 Al-La intermetallic phases and their associated crystallographic information. ....... 49
Table 2.7 Comparison between the liquidus and solidus temperatures determined by
experimental observations and Scheil calculations [6]. ........................................................... 51
Table 2.8 Volume fraction of the intermetallic phase and α-Mg within the eutectic phase,
estimated using maximum solid solubility from the phase diagrams [10]. ............................. 56
Table 2.9 Scheil simulation of Mg-Al-Ce alloys showing suppression of Mg17Al12 with
increasing cerium content [104]. .............................................................................................. 67
Table 2.10 Tensile properties of the die-cast AE44 and ALa44 alloys at various temperatures
[132]. ........................................................................................................................................ 70
Chapter 3 Methodology
Table 3.1 Composition of the experimental wedge cast alloys in two separate batches, all
compositions are in weight percent (wt.%)............................................................................ 101
Table 3.2 Sample preparation procedure using a Struers RotoForce-21 polishing machine, “>>”
is the co-rotation and “><” is the counter-rotation of the turntable. *OPS solution is a mixture
of 50 % OPS (oxide polishing suspensions) and 50 % Ethanol. ........................................... 104
Chapter 4 Experimental study of the solidification microstructure in the Mg-rich
corner of Mg–Al–Ce system
Table 1 Space group and refined lattice parameters for phases identified in ACe310 alloy (the
lattice parameters for the ACe412 alloy refined to similar values) ....................................... 120

xxix
Chapter 5 (Al,Mg)3La: a new phase in the Mg-Al-La system
Table 1 Existing solid phases identified in the Mg–Al–La system. ...................................... 126
Table 2 Composition of the Mg–4.5Al–6.3La (wt.%) samples measured using the inductively
coupled plasma–atomic emission spectroscopy method. ....................................................... 126
Table 3 Crystallographic parameters refined for the (Al,Mg)3La phase. .............................. 129
Chapter 6 Solidification path and microstructure evolution of Mg-3Al-14La alloy:
implications for the Mg-rich corner of the Mg-Al-La phase diagram
Table 1 Chemical composition of the investigated ALa314 alloy determined by inductively
coupled plasma atomic emission spectroscopy. ..................................................................... 133
Table 2 Space group and refined lattice parameters for phases identified in the ALa314 alloy
................................................................................................................................................ 136
Table 3 Solidification sequence of ALa314 simulated by Pandat [37] and thermal analysis data.
................................................................................................................................................ 138
Chapter 7 Revisiting the intermetallic phases in high-pressure die-cast Mg–4Al–
4Ce and Mg–4Al–4La alloys
Table 1 Chemical composition (wt.% or ppm) of the die-cast ACe44 and ALa44 alloys in this
study. ...................................................................................................................................... 142
Table 2 Summary of the intermetallic phases identified in ACe44 and ALa44 by the Rietveld
refinement of the XRD spectra in this study. ......................................................................... 147
xxx
Chapter 8 A comparative study of the solidification microstructure in sand-cast
Mg-Al-Ce and Mg-Al-La alloys
Table 1 Chemical compositions of the investigated alloys measured by ICP-AES (wt.%). . 153
Table 2 Final phases in the Mg-Al-Ce alloys predicted by equilibrium and Scheil-Gulliver
equations using Pandat [35]. .................................................................................................. 163
Table 3 Final phases in the Mg-Al-La alloys predicted by equilibrium and Scheil-Gulliver
equations using Pandat [35]. .................................................................................................. 165
Table 4 Summary of phases identified for the alloys in this study. O is for observations and P
is for predictions from Pandat PanMg2018 database [35]. ^only equilibrium * only Scheil-
Gulliver. ................................................................................................................................. 167
Chapter 9 Influence of alloying elements and cooling rates on the microstructure
features of Mg-Al-RE alloys
Table 1 Chemical analysis using ICP-AES and the designed compositions of the investigated
alloys (wt.%). ......................................................................................................................... 179
Table 2 Data for lines of best fit in Figure 3 to the equations of (a) pre-solidification cooling
rates and (b) freezing time as a function of wedge distance. *where Ṫ is the pre-solidification
cooling rate (˚C/s), tf is freezing time (s) and D is wedge distance (mm). ............................ 184
Table 3 Solidification sequence and temperature predicted by Scheil-Gulliver equation using
Pandat [35] for ACe44, ALa44 and ACe413, whereas solidification sequence and associated
temperature for ALa413 is determined by [34]. .................................................................... 186
Table 4 Values for the constants in the Equations (a) 3 and (b) 4 from the lines of best fit in
Figure 8. ................................................................................................................................. 191
xxxi
Table 5 Data for lines of best fit to Figure 12 using Hall-Petch relationship, Equation 1 and 2.
................................................................................................................................................ 196
Table 6 A summary of the relationship between SDAS and freezing time (Equation 3) as well
as the pre-solidification cooling rate (Equation 4) for all alloys. .......................................... 198
Table 7 A summary of the Hall-Petch relationship between yield stress and (a) grain size, and
(b) SDAS. ............................................................................................................................... 199
Chapter 10 Conclusions
Table 10.1 Predominant and minor phases identified in HPDC ACe44 and ALa44 alloys. . 217
Table 10.2 The relationships of processing-microstructure-properties for ACe44, ACe413,
ALa44 and ALa413 alloys. .................................................................................................... 219

Chapter 1 Introduction
1
Chapter 1
Introduction
Chapter 1 Introduction
2
1 Introduction
1.1 Research significance and thesis motivation
Sustainable energy supply and climate change are two of the main challenges facing society
today. The transport sector is responsible for approximately 19 % of the total emissions
contribution in Australia [1]. This makes the transportation industry a major source of
environmental pollution, particularly carbon dioxide emissions produced by the consumption
of fossil fuels by vehicles.
In recent years, there has been an increasingly higher demand for the automotive industry to
improve vehicle efficiency using lightweight materials. According to the Australian
Government Climate Change Authority (CCA) [2] and The Centre for International Economics
(The CIE) [3], one of the least costly approaches to reducing emissions in Australia is to
improve vehicle efficiency. This includes vehicle weight minimisation, as weight is strongly
correlated with fuel consumption (Figure 1.1) as well as greenhouse gas (GHG) emissions.
Currently, the ADR 79/04 is the minimum standard for new light vehicles in Australia [4]. This
standard is based on the Euro 5 standards. The CCA also proposes that light vehicle emission
standards will be introduced with effect from the year 2018 [2]. This has received considerable
attention from many industries, particularly the automotive sector. Additionally, monetary
penalties are placed on vehicle carbon dioxide emissions in some regions, such as the European
Union (EU). These regulations are known as Euro 5/6, which set stricter emission limits on
atmospheric pollutants for a new vehicle sold in the market [5]. Euro 7 emission standards will
be implemented in 2020 with a further reduced CO2 emission target [6]. In order to comply
with the Euro emission standards, technology and manufacturing optimisations are essential.
Chapter 1 Introduction
3
Figure 1.1 The relationship between fuel consumption and vehicle mass shows that reducing vehicle mass can
reduce the fuel consumption of the vehicles [7, 8]. The potential use of magnesium in applications such as
powertrain and chassis component could be of great benefit in achieving high fuel efficiency.
As weight reduction is becoming increasingly more important in the automotive and transport
sectors, magnesium is viewed as a favoured structural material due to its low-density and
overall cost analysis [9]. According to Friedrich and Schumann [10], there is an estimated 5.5
% reduction in fuel consumption for every 10 % of weight reduction, including weight around
the engine and gearbox. There are also other reports showing that for every 100 kg of vehicle
weight reduction, fuel consumption can be reduced by 0.3-0.4 L per 100 km of travel [11-13].
Furthermore, fuel efficiency is emphasised in the light vehicle emissions standard in an
Australia research report [2]. Figure 1.2 shows the current promising fuel efficiency
improvement technologies and their potential emission reductions as a percentage [2].
Lightweight materials used for vehicle weight minimisation are currently a major area of
interest within the field of automotive engineering. This approach could ultimately achieve
emission reductions without compromising vehicle functionality [14].
Chapter 1 Introduction
4
Figure 1.2 Current fuel efficiency technologies & estimated CO2 emission reductions [2], showing that reducing
the vehicle weight by 10 % can decrease the CO2 emission by 6.5 %.
In this research, magnesium alloys are studied as a potential material for vehicle weight
minimisation. Compared with other structural materials, magnesium is approximately 35 %
less dense than aluminium, and at least four times lighter than steel (Table 1.1) [8, 15]. For this
reason, magnesium alloys, as the lowest density structural metals [8], have become widely used
for automotive applications in recent decades [16, 17].
Chapter 1 Introduction
5
Table 1.1 Physical and chemical properties of magnesium and other comparison materials [8, 18-22].
Property Unit Magnesium Aluminium Iron Titaniu
m
Beryllium Copper
Crystal structure
a
c
-
nm
nm
Hcp
0.3203
0.5199
Fcc
0.4041
-
Bcc
0.2866
-
Hcp
0.2950
0.4653
Hcp
0.2286
0.3583
Fcc
0.3615
-
Atomic number - 12 13 26 22 4 29
Relative atomic mass
(C = 12.000)
- 24.305 26.982 55.847 47.900 9.012 65.546
Relative density at 20 ˚C g/cm3 1.74 2.70 7.87 4.51 1.85 8.96
Elastic modulus
[Young’s modulus of elasticity]
GPa
45 70 211 120 295 130
Specific modulus - 26 26 27 26 160 14
Tensile strength MPa 240 (for AZ91D) 320 (for A380) 350 900 565 210
Melting point ˚C 650 660 1535 1678 1289 1083
Boiling point ˚C 1090 2520 2862 3289 2472 2563
Thermal conductivity
(at 20-100 ˚C)
W·m-
1·K-1
156 238 78 26 194 397
Coefficient of
thermal expansion at 0-100 ˚C
10-6 K-1 26.0 23.5 12.1 8.9 12.0 17.0
Mean specific heat 0-100 ˚C J kg-1K-1 1038 917 456 528 2052 386
Electrical resistivity at 20 ˚C µΩcm-1 4.20 2.67 10.10 54.00 3.30 1.69
1.1.1 Magnesium alloy designation
Magnesium alloys are designated according to the American Society for Testing and Materials
(ASTM) [23-25] nomenclature. This coding system contains three parts, consisting of a letter-
number-letter approach, and the designations are based on the chemical compositions of the
alloys [25]. The first part of the system involves alphabetic letters indicating the two principal
alloying elements. The second part represents the weight percentage of the two alloying
elements as numbers. These numbers are rounded off to the nearest integer. In the third and
last part of this alphanumerical ASTM method, an alphabetical letter indicates the generation
of the magnesium alloy [23-25]. For instance, AE47X indicates the system is a magnesium
alloy with aluminium and rare earth (RE) elements of 4 wt.% and 7 wt.%, respectively, and the
“X” in the third part of the system indicates that the alloy status is currently experimental.
In addition to the designation system for magnesium alloys, the ASTM has also developed a
system to identify various tempers of an alloy [23, 24]. This coding method also consists of
alphabetical and numerical letters. The temper designation is located at the back, following the
magnesium alloy designation with a hyphen to identify its temper status. For example, AZ91C-
Chapter 1 Introduction
6
F where “F” indicates die-cast, which means this alloy is in the as-cast condition [23, 24].
Table 1.2 lists the abbreviations for the most commonly used alloying elements.
Table 1.2 ASTM abbreviations for alloying elements in magnesium alloys [23, 25].
Code Material
A Aluminium
B Bismuth
C Copper
D Cadmium
E Rare Earth
F Iron
G Magnesium
H
J
Thorium
Strontium
K Zirconium
L Lithium
M Manganese
N Nickel
P Lead
Q Silver
R Chromium
S Silicon
T
V
Tin
Gadolinium
W Yttrium
Z Zinc
In this research study, individual rare earth alloying, in particular lanthanum and cerium, will
be designated as “Ce” and “La” using the ASTM nomenclature format. For example, a Mg-
4Al-4Ce alloy is designated as ACe44, and a Mg-4Al-4La alloy is designated as ALa44.
1.1.2 The motivation for magnesium alloy applications
1.1.2.1 Magnesium alloy applications
In the past, magnesium has been used mainly as an alloying addition, especially in aluminium
alloys [9]. Between 1998 and 2013 (Figure 1.3), there has been a trend in the growth of
Chapter 1 Introduction
7
magnesium alloy die-castings for automotive applications. This has accounted for
approximately 35 % of total magnesium usage, which is similar to the amount used in
aluminium alloying for 2013 [9, 26]. Magnesium die-casting is largely used in the automotive
sector and is widely used by European car manufacturers [9]. Nevertheless, steel and
aluminium are currently the dominant alloys for automotive applications due to some
limitations and challenges with magnesium alloys. Despite the greater density of steel and
aluminium compared to magnesium alloys, they possess higher strength, corrosion resistance
and creep strength, which makes them the preferred materials for many automotive
applications. In order to develop an ideal lightweight material such as a magnesium alloy with
high strength and good mechanical properties, further research is needed. Because casting, in
particular high pressure die-casting (HPDC) and gravity casting, is the dominant fabrication
method for magnesium alloy production [7, 15], it is particularly important to gain an in-depth
understanding of the solidification behaviour and microstructure development, which
contribute to the mechanical properties of cast magnesium alloys.
Figure 1.3 Magnesium uses in 1998 and 2013 [9, 26].
Chapter 1 Introduction
8
Commercial vehicles consist of four modules: the drive train, interior, body and chassis .
Generally, automotive die-castings are categorised into powertrain, bracketry, and structural
applications [9]. Figure 1.4 shows examples of each of the three main types of applications.
Magnesium-based alloys are used for automotive applications in some of these modules to
replace steel and aluminium parts [27]. These replacement parts include steering wheels,
steering column components, instrument panels, seat frames, gear boxes, air intake systems,
gearbox housings, tank covers, among others [28].
Figure 1.4 Current applications of magnesium alloys: powertrain (top, Porsche engine covers and oil housing),
structural (middle, Volvo instrument panel beam), and bracketry (bottom, Toyota steering column jacket) [9].
In present automotive applications, there are four common commercial systems of die-cast
magnesium alloys: Mg-Al-Zn-Mn (AZ series), Mg-Al-Mn (AM series), Mg-Al-Si (AS series),
and Mg-Al-RE (AE series) [29]. Die-cast Mg-Al-Zn-Mn and Mg-Al-Mn alloys, such as
AZ91D and AM60B, are the most commonly used magnesium alloys for room temperature
structural automotive applications [9]. These applications often require alloys with high
strength and ductility; ductility is especially important for structural applications because the
ability to absorb energy during a crash is critical [9]. In contrast, powertrain components often

Chapter 1 Introduction
9
encounter elevated temperatures, hence creep resistant alloys are necessary for these
applications [9].
Despite the popularity of the AZ and AM alloys that have been used in industry, there is an
apparent disadvantage to using these alloys in powertrain parts that operate at elevated
temperatures above 130 °C [16, 29]. Due to this limitation, die-cast Mg-Al-Si (AS series) alloys
were invented for use at temperatures above 150 C where creep resistance is necessary.
AS41A, which can operate at temperatures up to approximately 150 C, was successfully used
in crankcases of air-cooled automotive engines, fan housings by Volkswagen as well as clutch
pistons by General Motors [29]. Despite the high melting temperature of the Mg2Si precipitates
in AS alloys that exhibit improved creep resistance, the alloy is difficult to die-cast [30]. Using
the effects of rare earth additions in magnesium-aluminium based alloys, which were first
discovered in the 1930s [31], die-cast AE41 and AE42 were found to have good creep
resistance and better castability compared to AS alloys [29, 31]. The creep resistance of AE
alloys is further improved, especially when the aluminium content is low in the alloy [29, 31].
Other alloys developed specifically for elevated temperature applications also include AJ62,
MRI-153 (Mg-Al-Ca-Sr based alloy), AS31, and AE44 [9].
1.1.2.2 Market trend of magnesium alloys
Historically, German-based car manufacturers have been the leaders in adopting magnesium
die-cast components. The experience of these manufacturers has proven the weight saving and
performance benefits of using magnesium alloys in automotive applications [9]. There was an
upward trend showing magnesium usage grew throughout the 1930s and continued to grow
exponentially during World War II, but it reduced dramatically again after the War to 10,000 t
per annum [28]. However, with the introduction of the Volkswagen Beetle, magnesium
consumption in the automotive industry increased to a peak in 1971 with an annual production
volume of 42,000 t [10, 15]. In those eras, AS41 and AZ81 alloys were widely used in air-
cooled engines and gearboxes; the vehicle parts with magnesium alloys made up approximately
20 kg of the vehicle weight [10].
As technology advanced, magnesium alloys could not keep up with the greater power
requirements for engines with higher operating temperatures and loads. The consumption of
magnesium for structural applications declined dramatically after the 1970s. In the mid-1970s,
the United States made a major effort to reduce their dependency on imported oil due to the
fuel crisis, during which the import of fuel reduced to 35 % in 1973 [32]. Following on,
Chapter 1 Introduction
10
Corporate Average Fuel Economy (CAFE) legislation was introduced in 1978, and the
regulations enforced vehicle makers to produce vehicles with better fuel efficiency, and hence
the greater use of lightweight materials was seen as a result of the regulation enforcement [32].
In 1993, Ford, Chrysler and General Motors consumed a total of 14,282 t of magnesium, which
represented approximately 70 % of the annual magnesium casting in North America [29, 33].
In 1994, the consumption of magnesium had reached 228,000 t globally [28]. From 1998, the
interests in magnesium applications were renewed again due to environmental regulations as
well as high oil prices. This renewed interest led to an increase in magnesium applications to
360,000 t per annum [28].
It has been shown that magnesium castings are increasingly being used in industry by the major
automotive companies, including GM, Ford, Volkswagen, Audi and Toyota [15, 34-39]. The
major user of magnesium die-cast components is the European automotive industry; where
approximately 50,000 t of magnesium die-cast components are produced each year [9, 40].
Currently, the AZ and AM series alloys are the most commonly used magnesium alloys in the
commercial automotive applications, due to their high strength, elongation and good
manufacturability, e.g. castability and machinability [28, 41]. Apart from the applications in
the automotive industry, magnesium alloys have attractive properties, which make them
suitable for use in sports equipment, industrial tools and electronic equipment such as mobile
phone housings and bicycle frames [28, 42].
1.2 Magnesium alloy processing and manufacturing
1.2.1 Elemental magnesium
Magnesium is the seventh most abundant metal element on earth [43] and the third most
abundant structural metal after aluminium and iron [44]. It is an alkaline earth element located
in Group II of the periodic table. Magnesium has a hexagonal close-packed (HCP) crystal
structure, and it is relatively soft and has a low elastic modulus [7, 28, 45]. It is the lightest
structural metal with a density of 1.738 gcm-3, which makes it attractive for automotive
applications. Apart from its low density, it has good strength to weight ratio as well as good
castability [46]. The physical properties of pure magnesium are shown in Table 1.3. The cost
is relatively low due to the abundance of the element and the extraction process for magnesium
is less costly compared to other elements, such as titanium. Hence, magnesium alloys have
become one of the most promising lightweight materials for automotive applications [47].
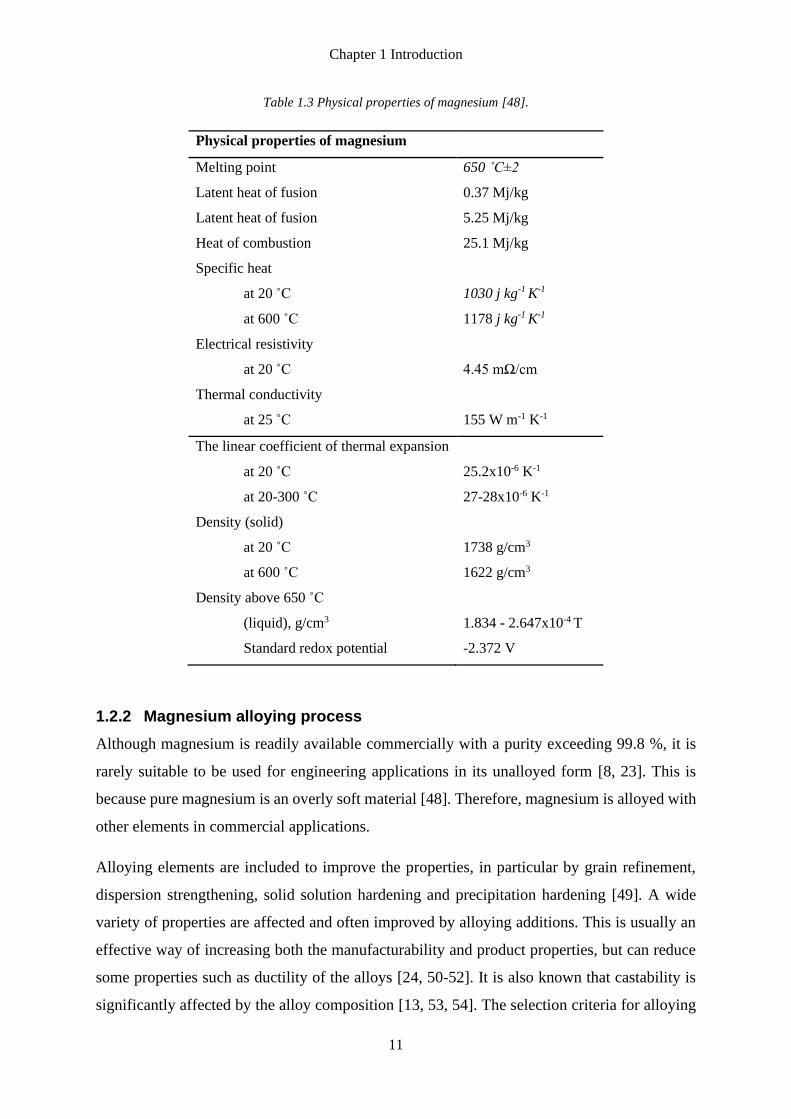
Chapter 1 Introduction
11
Table 1.3 Physical properties of magnesium [48].
Physical properties of magnesium
Melting point 650 ˚C±2
Latent heat of fusion 0.37 Mj/kg
Latent heat of fusion 5.25 Mj/kg
Heat of combustion 25.1 Mj/kg
Specific heat
at 20 ˚C 1030 j kg-1 K-1
at 600 ˚C 1178 j kg-1 K-1
Electrical resistivity
at 20 ˚C 4.45 mΩ/cm
Thermal conductivity
at 25 ˚C
155 W m-1 K-1
The linear coefficient of thermal expansion
at 20 ˚C
at 20-300 ˚C
Density (solid)
at 20 ˚C
at 600 ˚C
Density above 650 ˚C
(liquid), g/cm3
Standard redox potential
25.2x10⁻⁶ K-1
27-28x10-6 K-1
1738 g/cm3
1622 g/cm3
1.834 - 2.647x10⁻⁴ T
-2.372 V
1.2.2 Magnesium alloying process
Although magnesium is readily available commercially with a purity exceeding 99.8 %, it is
rarely suitable to be used for engineering applications in its unalloyed form [8, 23]. This is
because pure magnesium is an overly soft material [48]. Therefore, magnesium is alloyed with
other elements in commercial applications.
Alloying elements are included to improve the properties, in particular by grain refinement,
dispersion strengthening, solid solution hardening and precipitation hardening [49]. A wide
variety of properties are affected and often improved by alloying additions. This is usually an
effective way of increasing both the manufacturability and product properties, but can reduce
some properties such as ductility of the alloys [24, 50-52]. It is also known that castability is
significantly affected by the alloy composition [13, 53, 54]. The selection criteria for alloying
Chapter 1 Introduction
12
elements involve various considerations, such as atomic size, development of intermetallic
phases, and precipitation sequence.
In solid solution strengthening, the alloying elements (solute) completely dissolve in the base
metal (solvent). The solute atoms provide strengthening effects by (i) the misfit of atoms
relative to the packing of the matrix atoms, and (ii) the variance in elastic moduli between the
solute and solvent atoms [49]. In addition, it is also known that solid solution elements can
improve creep resistance under the condition that the solute is able to: (i) increase the
homologous temperature, (ii) enhance elastic modulus, or (iii) reduce diffusivity as described
in the following equation [49],
έ = S(𝜎/𝐸)η𝐷
where έ is steady-state creep rate, S is a structured term such as grain morphology, dislocation
density, distribution and others, σ is stress, E is elastic modulus, D is self-diffusivity, and η is
a stress component.
Precipitation or age hardening is another strengthening process in alloys. This type of
mechanism occurs when the solid solubility reduces with decreasing temperature. The
interaction of glide dislocations with the precipitates can increase the yield stress, as per the
following equation [49, 55],
𝜏𝑦𝑖𝑒𝑙𝑑 =(2𝑎𝐺𝑏)
1+ 𝜏𝑎
where τyield is the yield strength of the precipitation hardened alloy, τa is the yield strength of
the matrix without precipitates, (2aGb/1) is the stress required for the dislocations to bypass
the precipitates. Generally, precipitates alone are not adequate for alloy strengthening, unless
the precipitates are fully coherent, are finely dispersed and are able to resist coarsening [49].
Currently, there are approximately 25 metals identified to be suitable as alloying elements for
magnesium alloys based on their atomic size [41]. However, there are only approximately ten
elements considered to be favourable alloying elements for magnesium alloys [24]. The major
alloying elements and their effects in magnesium alloys have been analysed as shown in Table
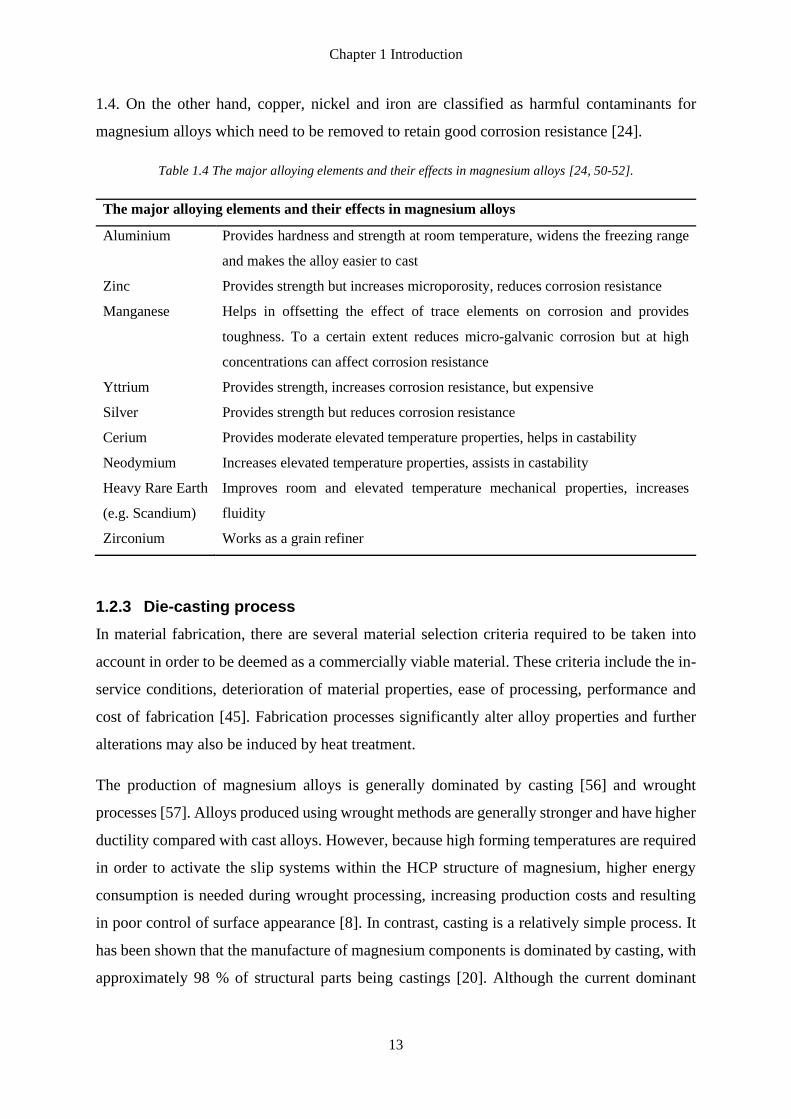
Chapter 1 Introduction
13
1.4. On the other hand, copper, nickel and iron are classified as harmful contaminants for
magnesium alloys which need to be removed to retain good corrosion resistance [24].
Table 1.4 The major alloying elements and their effects in magnesium alloys [24, 50-52].
The major alloying elements and their effects in magnesium alloys
Aluminium Provides hardness and strength at room temperature, widens the freezing range
and makes the alloy easier to cast
Zinc Provides strength but increases microporosity, reduces corrosion resistance
Manganese Helps in offsetting the effect of trace elements on corrosion and provides
toughness. To a certain extent reduces micro-galvanic corrosion but at high
concentrations can affect corrosion resistance
Yttrium Provides strength, increases corrosion resistance, but expensive
Silver Provides strength but reduces corrosion resistance
Cerium Provides moderate elevated temperature properties, helps in castability
Neodymium Increases elevated temperature properties, assists in castability
Heavy Rare Earth
(e.g. Scandium)
Improves room and elevated temperature mechanical properties, increases
fluidity
Zirconium Works as a grain refiner
1.2.3 Die-casting process
In material fabrication, there are several material selection criteria required to be taken into
account in order to be deemed as a commercially viable material. These criteria include the in-
service conditions, deterioration of material properties, ease of processing, performance and
cost of fabrication [45]. Fabrication processes significantly alter alloy properties and further
alterations may also be induced by heat treatment.
The production of magnesium alloys is generally dominated by casting [56] and wrought
processes [57]. Alloys produced using wrought methods are generally stronger and have higher
ductility compared with cast alloys. However, because high forming temperatures are required
in order to activate the slip systems within the HCP structure of magnesium, higher energy
consumption is needed during wrought processing, increasing production costs and resulting
in poor control of surface appearance [8]. In contrast, casting is a relatively simple process. It
has been shown that the manufacture of magnesium components is dominated by casting, with
approximately 98 % of structural parts being castings [20]. Although the current dominant
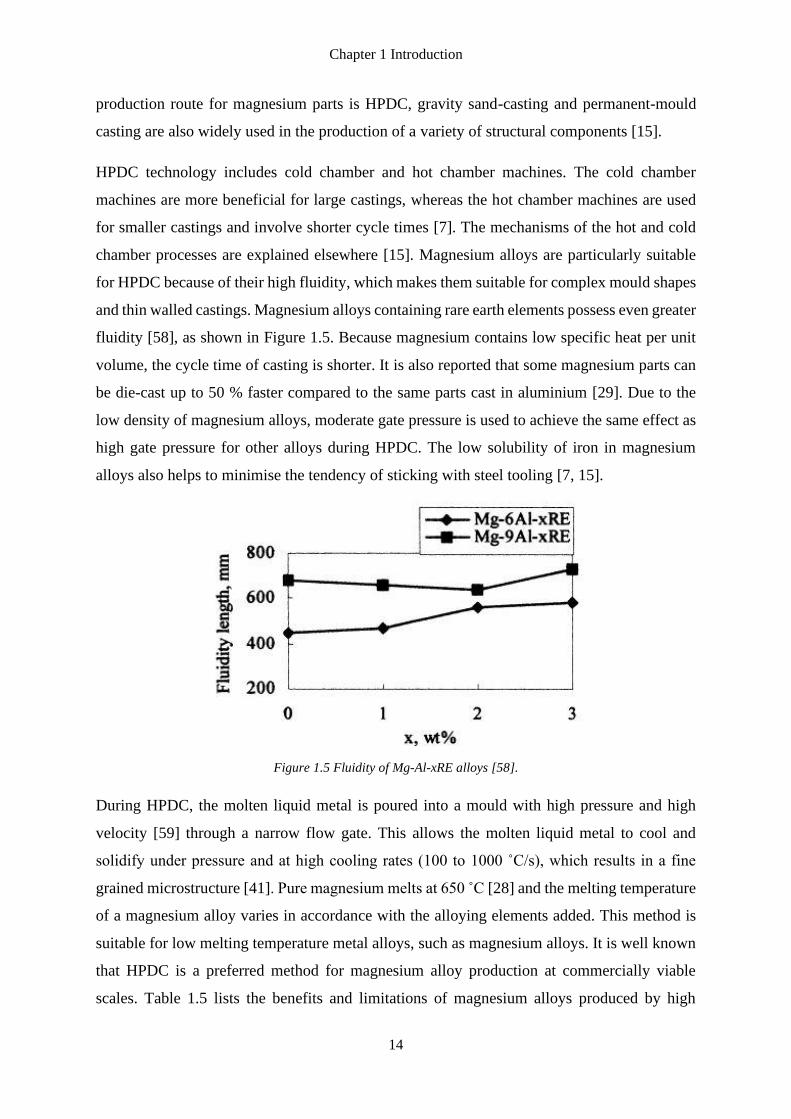
Chapter 1 Introduction
14
production route for magnesium parts is HPDC, gravity sand-casting and permanent-mould
casting are also widely used in the production of a variety of structural components [15].
HPDC technology includes cold chamber and hot chamber machines. The cold chamber
machines are more beneficial for large castings, whereas the hot chamber machines are used
for smaller castings and involve shorter cycle times [7]. The mechanisms of the hot and cold
chamber processes are explained elsewhere [15]. Magnesium alloys are particularly suitable
for HPDC because of their high fluidity, which makes them suitable for complex mould shapes
and thin walled castings. Magnesium alloys containing rare earth elements possess even greater
fluidity [58], as shown in Figure 1.5. Because magnesium contains low specific heat per unit
volume, the cycle time of casting is shorter. It is also reported that some magnesium parts can
be die-cast up to 50 % faster compared to the same parts cast in aluminium [29]. Due to the
low density of magnesium alloys, moderate gate pressure is used to achieve the same effect as
high gate pressure for other alloys during HPDC. The low solubility of iron in magnesium
alloys also helps to minimise the tendency of sticking with steel tooling [7, 15].
Figure 1.5 Fluidity of Mg-Al-xRE alloys [58].
During HPDC, the molten liquid metal is poured into a mould with high pressure and high
velocity [59] through a narrow flow gate. This allows the molten liquid metal to cool and
solidify under pressure and at high cooling rates (100 to 1000 ˚C/s), which results in a fine
grained microstructure [41]. Pure magnesium melts at 650 ˚C [28] and the melting temperature
of a magnesium alloy varies in accordance with the alloying elements added. This method is
suitable for low melting temperature metal alloys, such as magnesium alloys. It is well known
that HPDC is a preferred method for magnesium alloy production at commercially viable
scales. Table 1.5 lists the benefits and limitations of magnesium alloys produced by high
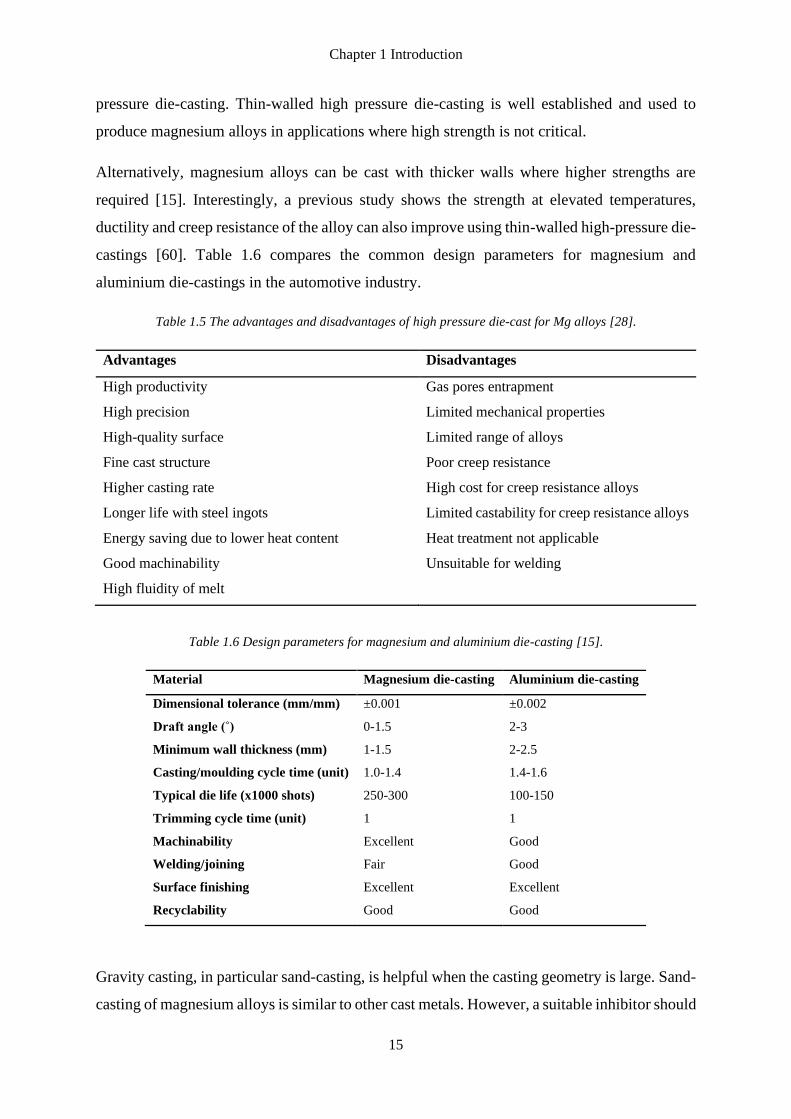
Chapter 1 Introduction
15
pressure die-casting. Thin-walled high pressure die-casting is well established and used to
produce magnesium alloys in applications where high strength is not critical.
Alternatively, magnesium alloys can be cast with thicker walls where higher strengths are
required [15]. Interestingly, a previous study shows the strength at elevated temperatures,
ductility and creep resistance of the alloy can also improve using thin-walled high-pressure die-
castings [60]. Table 1.6 compares the common design parameters for magnesium and
aluminium die-castings in the automotive industry.
Table 1.5 The advantages and disadvantages of high pressure die-cast for Mg alloys [28].
Advantages Disadvantages
High productivity Gas pores entrapment
High precision Limited mechanical properties
High-quality surface Limited range of alloys
Fine cast structure Poor creep resistance
Higher casting rate High cost for creep resistance alloys
Longer life with steel ingots Limited castability for creep resistance alloys
Energy saving due to lower heat content Heat treatment not applicable
Good machinability Unsuitable for welding
High fluidity of melt
Table 1.6 Design parameters for magnesium and aluminium die-casting [15].
Material Magnesium die-casting Aluminium die-casting
Dimensional tolerance (mm/mm) ±0.001 ±0.002
Draft angle (˚) 0-1.5 2-3
Minimum wall thickness (mm) 1-1.5 2-2.5
Casting/moulding cycle time (unit) 1.0-1.4 1.4-1.6
Typical die life (x1000 shots) 250-300 100-150
Trimming cycle time (unit) 1 1
Machinability Excellent Good
Welding/joining Fair Good
Surface finishing Excellent Excellent
Recyclability Good Good
Gravity casting, in particular sand-casting, is helpful when the casting geometry is large. Sand-
casting of magnesium alloys is similar to other cast metals. However, a suitable inhibitor should
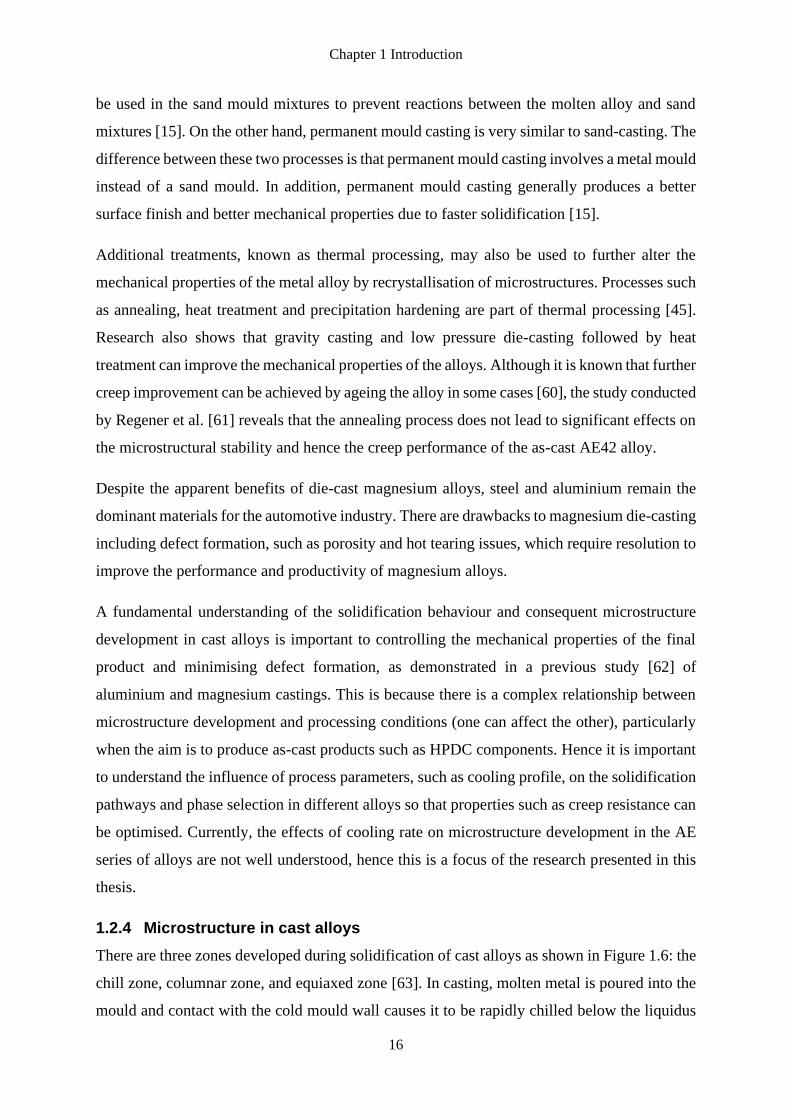
Chapter 1 Introduction
16
be used in the sand mould mixtures to prevent reactions between the molten alloy and sand
mixtures [15]. On the other hand, permanent mould casting is very similar to sand-casting. The
difference between these two processes is that permanent mould casting involves a metal mould
instead of a sand mould. In addition, permanent mould casting generally produces a better
surface finish and better mechanical properties due to faster solidification [15].
Additional treatments, known as thermal processing, may also be used to further alter the
mechanical properties of the metal alloy by recrystallisation of microstructures. Processes such
as annealing, heat treatment and precipitation hardening are part of thermal processing [45].
Research also shows that gravity casting and low pressure die-casting followed by heat
treatment can improve the mechanical properties of the alloys. Although it is known that further
creep improvement can be achieved by ageing the alloy in some cases [60], the study conducted
by Regener et al. [61] reveals that the annealing process does not lead to significant effects on
the microstructural stability and hence the creep performance of the as-cast AE42 alloy.
Despite the apparent benefits of die-cast magnesium alloys, steel and aluminium remain the
dominant materials for the automotive industry. There are drawbacks to magnesium die-casting
including defect formation, such as porosity and hot tearing issues, which require resolution to
improve the performance and productivity of magnesium alloys.
A fundamental understanding of the solidification behaviour and consequent microstructure
development in cast alloys is important to controlling the mechanical properties of the final
product and minimising defect formation, as demonstrated in a previous study [62] of
aluminium and magnesium castings. This is because there is a complex relationship between
microstructure development and processing conditions (one can affect the other), particularly
when the aim is to produce as-cast products such as HPDC components. Hence it is important
to understand the influence of process parameters, such as cooling profile, on the solidification
pathways and phase selection in different alloys so that properties such as creep resistance can
be optimised. Currently, the effects of cooling rate on microstructure development in the AE
series of alloys are not well understood, hence this is a focus of the research presented in this
thesis.
1.2.4 Microstructure in cast alloys
There are three zones developed during solidification of cast alloys as shown in Figure 1.6: the
chill zone, columnar zone, and equiaxed zone [63]. In casting, molten metal is poured into the
mould and contact with the cold mould wall causes it to be rapidly chilled below the liquidus
Chapter 1 Introduction
17
temperature. This is known as the chill zone. Because of the rapid cooling near the cold mould
wall, multiple solid nuclei form on the wall and begin to grow into the liquid. Following the
chill zone, the temperature gradient decreases and the crystals developed from the chill zone
continue to grow dendritically in specific crystallographic directions into the liquid, which is
known as the columnar zone. Then, it continues to grow and form equiaxed grains that are
randomly oriented at the core of the cast. The final stage is the equiaxed zone [64].
Figure 1.6 A typical microstructure of a cast ingot [63].
It is well established that the morphology of constituent phases can be governed by the casting
processing parameters [65]. Generally, in die-casting, the grains formed and located near the
“skin” region of the casting are smaller compared to the grains formed and located within the
“core” region. This can be explained by the rapid solidification rate at the ”skin” region as a
consequence of rapid heat extraction through the walls of the mould [13, 66]. In addition, larger
grains, which can grow up to 100µm or more [13, 66], may form in the “core” region of the
casting and are known as externally solidified grains (ESG) [13, 67]. Although it is known that
the properties of die-cast alloys rely on the microstructure development, Gertsman et al. [65]
emphasised that the fundamental factors of the microstructure formation and evolution during
die-casting remain unclear, and further study is required to understand them fully.
1.3 The Mg-Al-RE systems
In recent years, the Mg-Al-RE (AE) alloys have become promising materials for creep resistant
light-weight magnesium alloys. Previous studies have confirmed that the AE series of
magnesium alloys possess high strength and creep resistance [68]. In addition, a previous study
reported a decrease in creep resistance of AE42 above test temperatures of 175 ˚C [69].
However, the AE42 alloy tends to deteriorate rapidly at temperatures above 150 ˚C [70] along
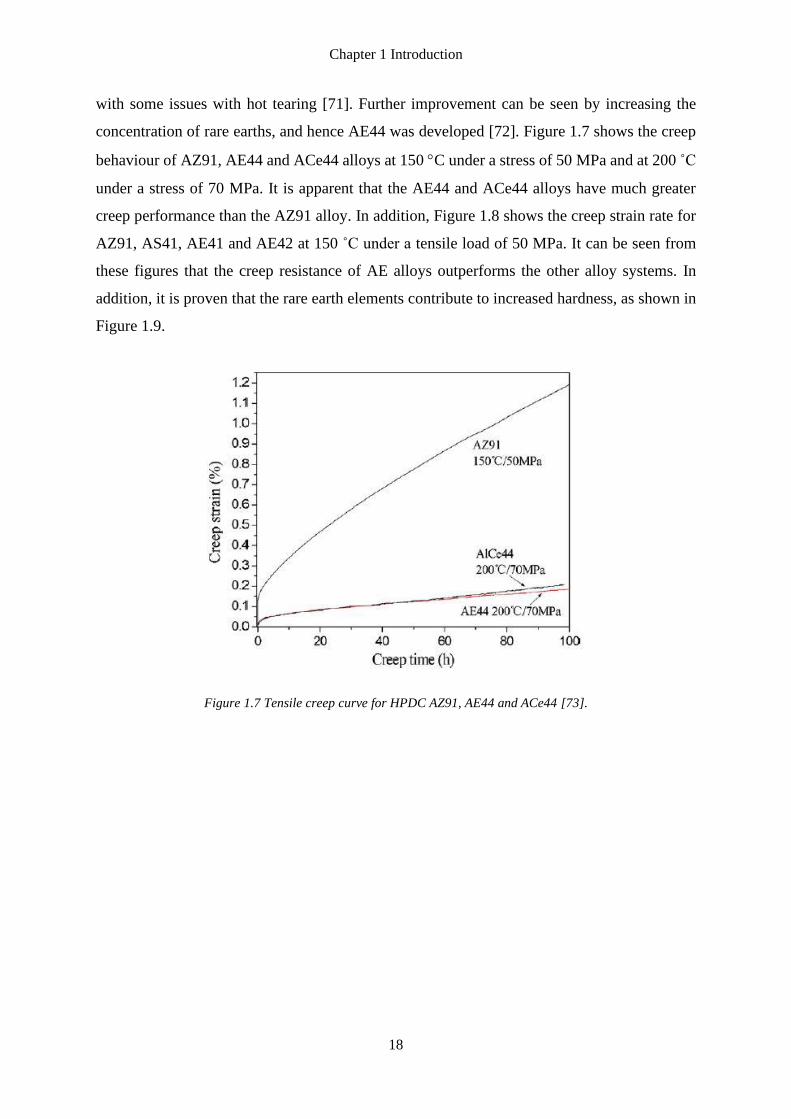
Chapter 1 Introduction
18
with some issues with hot tearing [71]. Further improvement can be seen by increasing the
concentration of rare earths, and hence AE44 was developed [72]. Figure 1.7 shows the creep
behaviour of AZ91, AE44 and ACe44 alloys at 150 C under a stress of 50 MPa and at 200 ˚C
under a stress of 70 MPa. It is apparent that the AE44 and ACe44 alloys have much greater
creep performance than the AZ91 alloy. In addition, Figure 1.8 shows the creep strain rate for
AZ91, AS41, AE41 and AE42 at 150 ˚C under a tensile load of 50 MPa. It can be seen from
these figures that the creep resistance of AE alloys outperforms the other alloy systems. In
addition, it is proven that the rare earth elements contribute to increased hardness, as shown in
Figure 1.9.
Figure 1.7 Tensile creep curve for HPDC AZ91, AE44 and ACe44 [73].
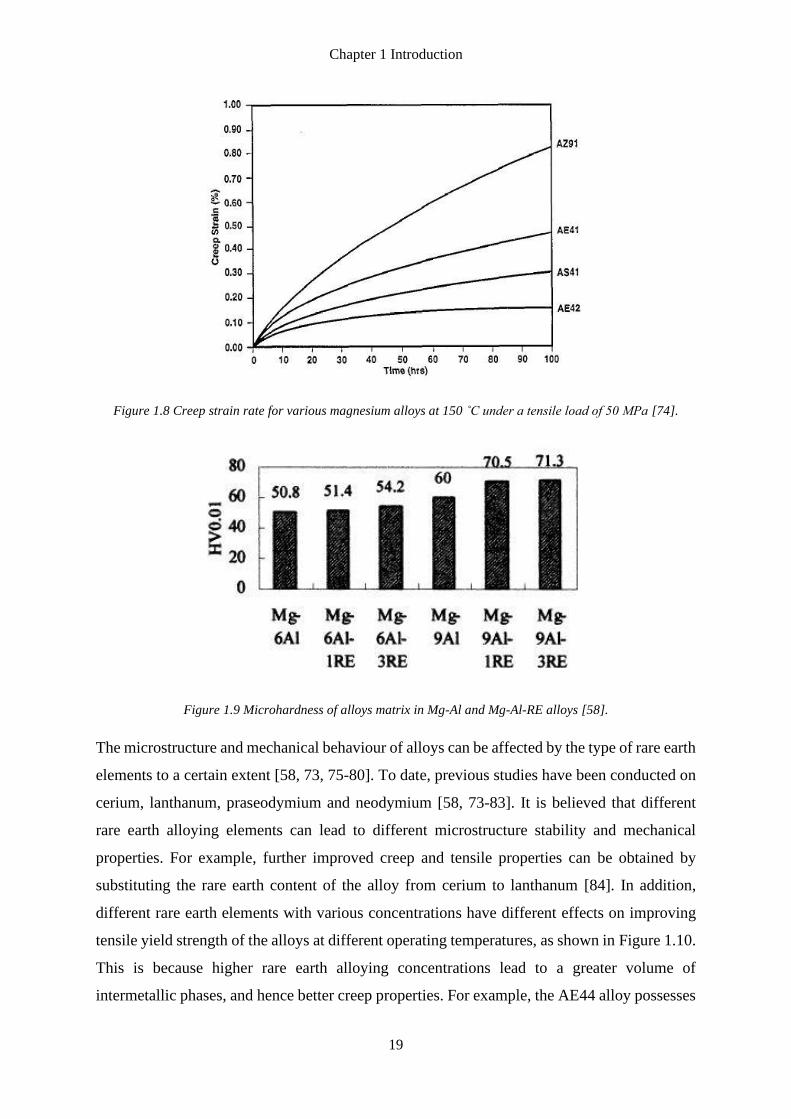
Chapter 1 Introduction
19
Figure 1.8 Creep strain rate for various magnesium alloys at 150 ˚C under a tensile load of 50 MPa [74].
Figure 1.9 Microhardness of alloys matrix in Mg-Al and Mg-Al-RE alloys [58].
The microstructure and mechanical behaviour of alloys can be affected by the type of rare earth
elements to a certain extent [58, 73, 75-80]. To date, previous studies have been conducted on
cerium, lanthanum, praseodymium and neodymium [58, 73-83]. It is believed that different
rare earth alloying elements can lead to different microstructure stability and mechanical
properties. For example, further improved creep and tensile properties can be obtained by
substituting the rare earth content of the alloy from cerium to lanthanum [84]. In addition,
different rare earth elements with various concentrations have different effects on improving
tensile yield strength of the alloys at different operating temperatures, as shown in Figure 1.10.
This is because higher rare earth alloying concentrations lead to a greater volume of
intermetallic phases, and hence better creep properties. For example, the AE44 alloy possesses
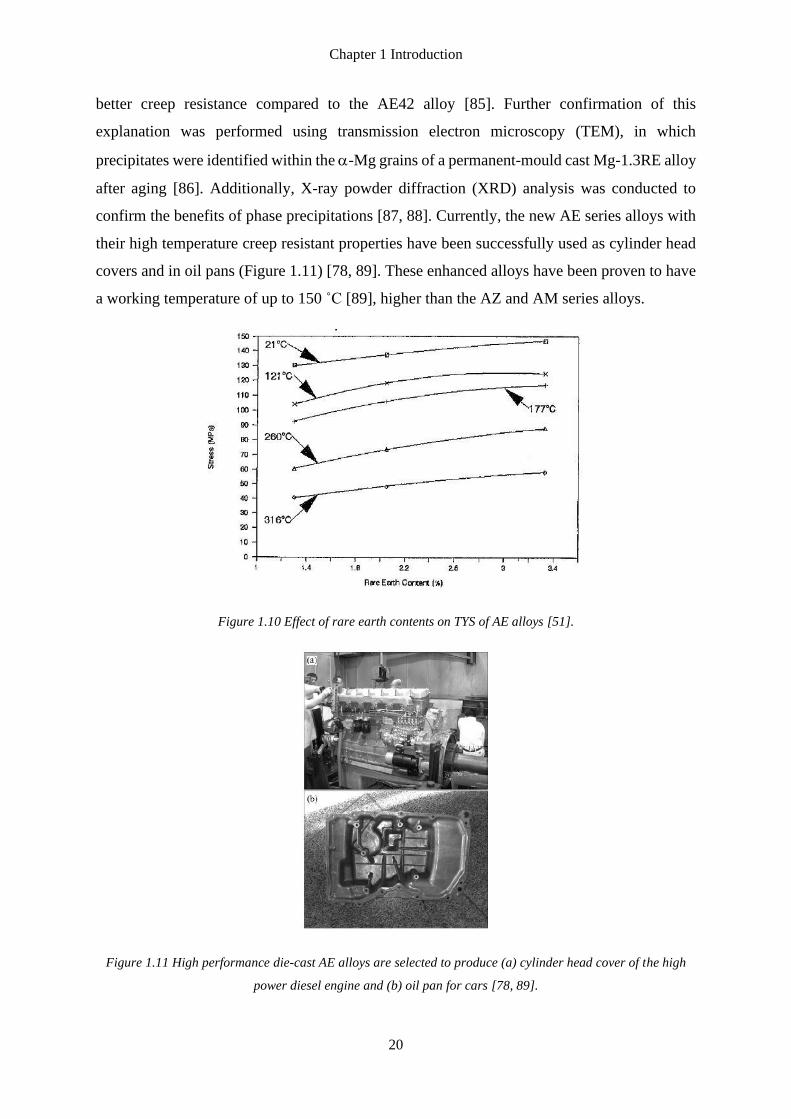
Chapter 1 Introduction
20
better creep resistance compared to the AE42 alloy [85]. Further confirmation of this
explanation was performed using transmission electron microscopy (TEM), in which
precipitates were identified within the -Mg grains of a permanent-mould cast Mg-1.3RE alloy
after aging [86]. Additionally, X-ray powder diffraction (XRD) analysis was conducted to
confirm the benefits of phase precipitations [87, 88]. Currently, the new AE series alloys with
their high temperature creep resistant properties have been successfully used as cylinder head
covers and in oil pans (Figure 1.11) [78, 89]. These enhanced alloys have been proven to have
a working temperature of up to 150 ˚C [89], higher than the AZ and AM series alloys.
Figure 1.10 Effect of rare earth contents on TYS of AE alloys [51].
Figure 1.11 High performance die-cast AE alloys are selected to produce (a) cylinder head cover of the high
power diesel engine and (b) oil pan for cars [78, 89].
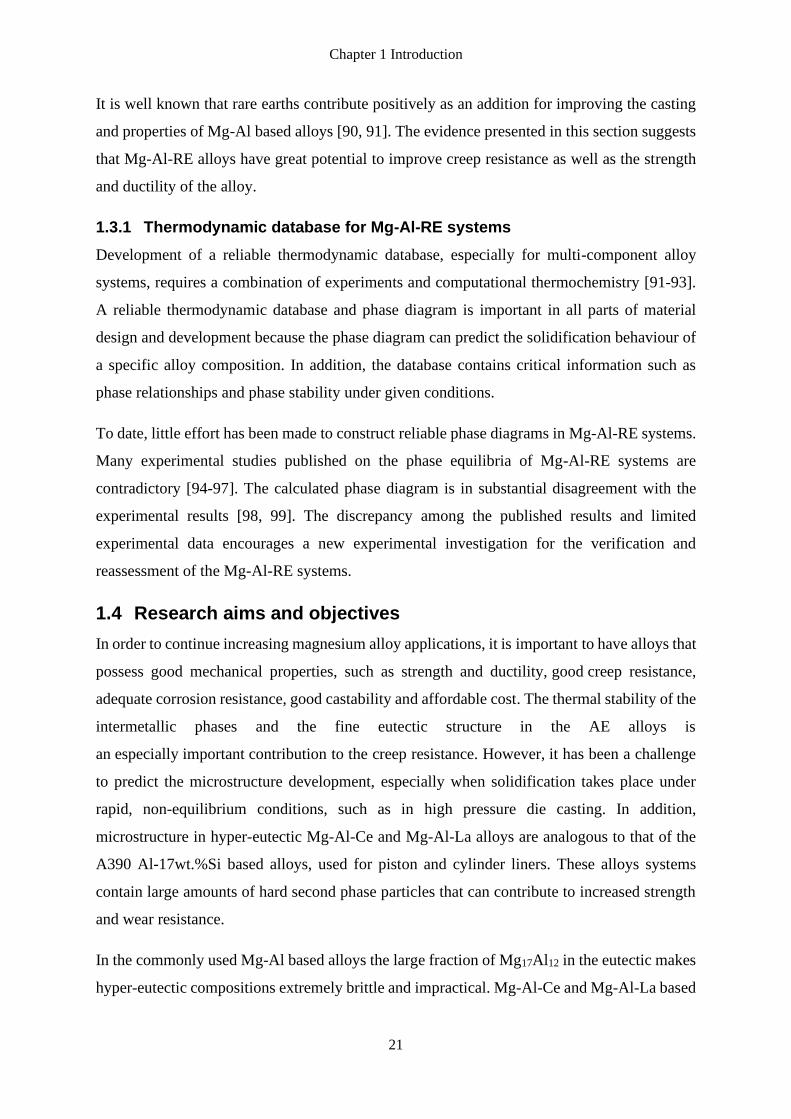
Chapter 1 Introduction
21
It is well known that rare earths contribute positively as an addition for improving the casting
and properties of Mg-Al based alloys [90, 91]. The evidence presented in this section suggests
that Mg-Al-RE alloys have great potential to improve creep resistance as well as the strength
and ductility of the alloy.
1.3.1 Thermodynamic database for Mg-Al-RE systems
Development of a reliable thermodynamic database, especially for multi-component alloy
systems, requires a combination of experiments and computational thermochemistry [91-93].
A reliable thermodynamic database and phase diagram is important in all parts of material
design and development because the phase diagram can predict the solidification behaviour of
a specific alloy composition. In addition, the database contains critical information such as
phase relationships and phase stability under given conditions.
To date, little effort has been made to construct reliable phase diagrams in Mg-Al-RE systems.
Many experimental studies published on the phase equilibria of Mg-Al-RE systems are
contradictory [94-97]. The calculated phase diagram is in substantial disagreement with the
experimental results [98, 99]. The discrepancy among the published results and limited
experimental data encourages a new experimental investigation for the verification and
reassessment of the Mg-Al-RE systems.
1.4 Research aims and objectives
In order to continue increasing magnesium alloy applications, it is important to have alloys that
possess good mechanical properties, such as strength and ductility, good creep resistance,
adequate corrosion resistance, good castability and affordable cost. The thermal stability of the
intermetallic phases and the fine eutectic structure in the AE alloys is
an especially important contribution to the creep resistance. However, it has been a challenge
to predict the microstructure development, especially when solidification takes place under
rapid, non-equilibrium conditions, such as in high pressure die casting. In addition,
microstructure in hyper-eutectic Mg-Al-Ce and Mg-Al-La alloys are analogous to that of the
A390 Al-17wt.%Si based alloys, used for piston and cylinder liners. These alloys systems
contain large amounts of hard second phase particles that can contribute to increased strength
and wear resistance.
In the commonly used Mg-Al based alloys the large fraction of Mg17Al12 in the eutectic makes
hyper-eutectic compositions extremely brittle and impractical. Mg-Al-Ce and Mg-Al-La based
Chapter 1 Introduction
22
alloys, however, have ductile eutectics with relatively small fractions of intermetallic phase.
This opens the possibility for in-situ composites with Al-RE and Mg-RE phases playing an
analogous role to Si, Mg2Si and Al-(Cu, Ni) based intermetallic phases in A390 and similar Al
based alloys.
Currently, the hyper-eutectic regions of Mg-Al-RE systems have been seldom investigated.
This research aims to provide an important opportunity to advance the understanding of
solidification behaviour and microstructure development of hypo- and hyper-eutectic Mg-Al-
RE alloys. The findings in this study should make an important contribution to the field of
magnesium alloys.
The objectives of this research are:
1. To characterise and compare the microstructure and intermetallic phase development
in Mg-Al-Ce and Mg-Al-La alloys.
2. To determine the sequence of intermetallic phases, developed during solidification
processes by combining both the experimental data and thermodynamic predictions,
and to review the inconsistencies in the thermodynamic databases for Mg-Al-Ce and
Mg-Al-La alloys.
3. To Investigate the effects of rare earth alloying elements and their concentrations on
the microstructure development of Mg-Al based alloys.
4. To understand the solidification behaviour of Mg-Al-Ce and Mg-Al-La alloys at
different cooling rates using thermal analysis technique.
5. To correlate the relationship between processing-microstructure-properties for Mg-
Al-Ce and Mg-Al-La alloys.
1.5 Thesis outline
The work presented in this thesis includes six detailed studies of a range of Mg-Al-La and Mg-
Al-Ce alloys. The microstructural evolution and solidification behaviour were investigated
using both in-situ and ex-situ experimental approaches. The thermodynamic software package,
Pandat® with the PanMagnesium 2018 [100] database, has also been used to investigate the
solidification characteristics of magnesium alloys. Comparisons have been made between
thermodynamic predictions and experimental results to better understand the solidification
behaviour and microstructure development of Mg-Al-RE alloys.
Chapter 1 Introduction
23
This thesis is divided into ten chapters and work presented in individual chapters is explained
as follows. Chapter 2 presents a review of the existing literature concerning the microstructural
evolution and solidification behaviour of Mg-Al-RE alloys (where RE can be mischmetal, or
individual cerium or lanthanum alloying additions) with a focus on the intermetallic phases,
such as Al2RE and Al11RE3 that are commonly reported in these alloys. The key feature of
these phases is the effect on the creep performance of the alloys. Whilst the intermetallic phases
have been characterised in these alloys, comparatively little information is available regarding
the effect of individual rare earth alloying additions on the associated microstructure.
Chapter 3 describes the various materials and experimental methodologies used in this study.
This includes the gravity wedge casting process, thermal analysis, and sample preparations for
microscopy work as well as for X-ray powder diffraction and synchrotron radiography. The
microstructure characterisation is also described in this chapter. The individual experimental
techniques are also explained in detail in the following chapters, some of which are published
in peer-reviewed journals (Chapters 4, 5 and 6).
The results of the individual research topics of this thesis are discussed in Chapter 4 to 9. An
investigation of Mg-Al-CE system is presented in Chapter 4. The microstructure in ACe310
and ACe412 alloys were characterised and compared with thermodynamic predictions.
During the investigation of Mg-Al-La system, a new intermetallic phase, (Al,Mg)3La, has been
identified, which is detailed in Chapter 5. The crystal structure has been resolved using high-
resolution synchrotron X-ray powder diffraction.
In Chapter 6 the Mg-Al-La system is investigated using a combination of synchrotron
radiography, thermal analysis and microstructural characterisation. The solidification of an
ALa314 alloy was determined and compared with thermodynamic predictions.
The investigations into the Mg-Al-Ce and Mg-Al-La systems indicate that the intermetallic
phases are not the same as commonly reported in the literature. In Chapter 7 and 8 comparative
studies of alloys from these systems are therefore investigated. The role of individual rare earth
elements on phase selection is also discussed in Chapter 8.
In Chapter 9 the results from previous chapters are rationalised, and quantification of key
microstructural features of the Mg-Al-RE alloys are made to assist with the discussion of the
influence of different rare earth elements and the effects of different cooling rates on the

Chapter 1 Introduction
24
properties of the investigated alloys. The processing – microstructure – property relationships
are developed for the investigated alloys in this study.
Finally, Chapter 10 summarises the overall findings of this thesis and outlines several
recommendations for future work.
Chapter 1 Introduction
25
1.6 References
1. Australian Government - Department of the Environment and Energy, Quarterly
Update of Australia’s National Greenhouse Gas Inventory: December 2018. 2018.
2. Australian Government Climate Change Authority, Light vehicle emissions standards
for Australia research report. 2014.
3. The Centre for International Economics, Reducing greenhouse emissions from light
vehicles. 2016.
4. Australian Government - Department of Infrastructure, T., Cities and Regional
Development, . Vehicle Emission Standards. 2018 18/08/2019]; Available from:
https://www.infrastructure.gov.au/vehicles/environment/emission/index.aspx.
5. Department of Infrastructure and Transport, Final regulation impact statement for
review of Euro5/6 light vehicle emissions standards. 2010.
6. Frost and Sullivan. European Emission Regulations – Will Stringent Emission
Regulations Choke Automotive Industry Or Will OEMs Find Their Way Out? 2016
18/08/2019]; Available from: https://ww2.frost.com/frost-perspectives/european-
emission-regulations-will-stringent-emission-regulations-choke-automotive-industry-
or-will-oems-find-their-way-out/.
7. D. Eliezer, E. Aghion, and F.H. Froes, Magnesium science, technology and
applications. Advanced Performance Materials, 1998. 5(3): p. 201-212.
8. M. Kulekci, Magnesium and its alloys applications in automotive industry. The
International Journal of Advanced Manufacturing Technology, 2008. 39(9-10): p. 851-
865.
9. T.B. Abbott, Magnesium: industrial and research developments over the last 15 years.
Corrosion, 2014. 71(2): p. 120-127.
Chapter 1 Introduction
26
10. H. Friedrich and S. Schumann, Research for a “new age of magnesium” in the
automotive industry. Journal of Materials Processing Technology, 2001. 117(3): p. 276-
281.
11. A. Feng and D.J. Santini, Mass impacts on fuel economies of conventional vs. hybrid
electric vehicles. SAE transactions, 2004. 113(4): p. 258-276.
12. L. Cheah and J. Heywood, Meeting US passenger vehicle fuel economy standards in
2016 and beyond. Energy Policy, 2011. 39(1): p. 454-466.
13. S. Gavras, et al., Microstructure and property evaluation of high-pressure die-cast Mg–
La–rare earth (Nd, Y or Gd) alloys. Journal of Alloys and Compounds, 2014. 597: p.
21-29.
14. A.A. Luo, et al., Computational thermodynamics and kinetics for magnesium alloy
development. Advanced Materials & Processes, 2015. 173(1): p. 26-30.
15. A.A. Luo, Magnesium casting technology for structural applications. Journal of
Magnesium and Alloys, 2013. 1(1): p. 2-22.
16. J.H. Zhang, et al., Microstructures, tensile properties and corrosion behavior of die-
cast Mg–4Al-based alloys containing La and/or Ce. Materials Science and
Engineering: A, 2008. 489(1): p. 113-119.
17. L.Y. Wei and G.L. Dunlop, The solidification behaviour of Mg-Al-rare earth alloys.
Journal of Alloys and Compounds, 1996. 232(1–2): p. 264-268.
18. G. Davies, Materials for automotive bodies. Butterworth-Heinemann, 2003: p. 1327.
19. T.B. Massalki, et al., Binary alloy phase diagrams American Society for Metals, 1986:
p. 787.
20. M.M. Avedesian and H. Baker, ASM specialty handbook: magnesium and magnesium
alloys. 1999: ASM international.
Chapter 1 Introduction
27
21. I.J. Polmear, Light alloys - metallurgy of the light metals. London and New York,
Edward Arnold, 1989. 288.
22. ASM International, Metals handbook: properties and selection. Vol. 2. 1990: ASM
International.
23. I.J. Polmear, Chapter 5 - magnesium alloys, in Light alloys (fourth edition), I.J.
Polmear, Editor. 2005, Butterworth-Heinemann: Oxford. p. 237-297.
24. M.M. Avedesian and H. H. Baker, ASM specialty handbook: magnesium and
magnesium alloys. 1999: ASM International.
25. ASTM International, ASTM B951-11 Standard practice for codification of unalloyed
magnesium and magnesium - alloys, cast and wrought. 2011: West Conshohocken
26. CM Group, 10 year strategic outlook for the global magnesium industry to 2024. 2014.
27. N.D. Saddock, et al., Solidification and microstructure of Mg‐Al‐(Ca, Sr, Ce, La)
ternary alloys. Essential Readings in Magnesium Technology, 2005: p. 199-204.
28. B.L. Mordike and T. Ebert, Magnesium: properties — applications — potential.
Materials Science and Engineering: A, 2001. 302(1): p. 37-45.
29. A.A. Luo, et al., Magnesium castings for automotive applications. The Journal of The
Minerals & Materials Society (TMS), 1995. 47(7): p. 28-31.
30. F. Khomamizadeh, B. Nami, and S. Khoshkhooei, Effect of rare-earth element
additions on high-temperature mechanical properties of AZ91 magnesium alloy.
Metallurgical and Materials Transactions A, 2005. 36(12): p. 3489-3494.
31. A.A. Luo and M.O. Pekguleryuz, Cast magnesium alloys for elevated temperature
applications. Journal of Materials Science, 1994. 29(20): p. 5259-5271.
Chapter 1 Introduction
28
32. R. Grimes and V. Janik, Automotive applications for magnesium. Encyclopedia of
Automotive Engineering, 2014.
33. D.C. Brown, Automakers magnesium usage now and in the future. Magnesium Monthly
Review, 1994. 23(9): p. 2.
34. A.I. Taub, et al., The evolution of technology for materials processing over the last 50
years: the automotive example. The Journal of The Minerals & Materials Society
(TMS), 2007. 59(2): p. 48-57.
35. K.U. Kainer and F. Von Buch, The current state of technology and potential for further
development of magnesium applications. Magnesium-Alloys and Technology, 2003: p.
1-22.
36. A.A. Luo, Magnesium: current and potential automotive applications. The Journal of
The Minerals & Materials Society (TMS), 2002. 54(2): p. 42-48.
37. J.S. Balzer, et al., Structural magnesium front end support assembly. 2003, SAE
Technical Paper.
38. M. Hoeschl, W. Wagener, and J. Wolf, BMW's magnesium-aluminium composite
crankcase, state-of-the-art light metal casting and manufacturing. 2006, SAE
Technical Paper.
39. C.J. Duke and S.D. Logan. Lightweight magnesium spare tire carrier. in IMA
Proceedings. 2007. International Magnesium Association.
40. C. Frantz, Magnesium castings exploring new developments and applications for high
pressure die-casting as a solution for forming magnesium for use in multi-material-
vehicles. Global Automotive Lightweight Material, 2014.
41. M.N. Khan, Solidification study of commercial magnesium alloys. 2009, Concordia
University (Canada): Ann Arbor. p. 108.
Chapter 1 Introduction
29
42. S. Massari and M. Ruberti, Rare earth elements as critical raw materials: focus on
international markets and future strategies. Resources Policy, 2013. 38(1): p. 36-43.
43. Thomas Jefferson National Accelerator Facility - Office of Science Education.
Jefferson lab - the element magnesium. 17 April 2019]; Available from:
https://education.jlab.org/itselemental/ele012.html.
44. T.P. Hanusa. Encycloeped britannica - magnesium chemical element. 17 April 2019];
Available from: https://www.britannica.com/science/magnesium.
45. W.D. Callister and D.G. Rethwisch, Materials science and engineering: an
introduction. 2010: Wiley.
46. M.O. Pekguleryuz and A.A. Kaya, Creep resistant magnesium alloys for powertrain
applications. Advanced Engineering Materials, 2003. 5(12): p. 866-878.
47. E. Aghion, et al., Dead sea magnesium alloys newly developed for high temperature
applications. Proceedings of the Minerals, Metals & Materials Society (TMS), 2003:
p. 177-182.
48. G. Davies, Chapter 5 - component manufacture, in Materials for automobile bodies.
2003, Butterworth-Heinemann: Oxford. p. 158-159.
49. M.O. Pekgüleryüz and M.M. Avedesian, Special issue" magnesium and magnesium
alloys", magnesium alloying, some potentials for alloy development. 軽金属, 1992.
42(12): p. 679-686.
50. H.E. Friedrich and B.L. Mordike, Magnesium technology. Vol. 788. 2006: Springer.
51. J.S. Waltrip. Fresh look at some old magnesium die casting alloys for elevated
temperature applications. in Past to Future: 47th Annual World Magnesium
Conference. 1990.
Chapter 1 Introduction
30
52. W.E. Mercer, Magnesium die cast alloys for elevated temperature applications. 1990,
SAE Technical Paper.
53. K. Strobel, et al., Evaluation of castability of high pressure die cast magnesium based
alloys. International Journal of Cast Metals Research, 2010. 23(2): p. 81-91.
54. W.L. Xiao, et al., Casting defects and mechanical properties of high pressure die cast
Mg‐Zn‐Al‐RE alloys. Advanced Engineering Materials, 2012. 14(1‐2): p. 68-76.
55. J.W. Martin, Precipitation hardening: theory and applications. 2012: Butterworth-
Heinemann.
56. K. Kubota, M. Mabuchi, and K. Higashi, Review processing and mechanical properties
of fine-grained magnesium alloys. Journal of Materials Science, 1999. 34(10): p. 2255-
2262.
57. M.O. Pekguleryuz, Current developments in wrought magnesium alloys, in Advances
in wrought magnesium alloys. 2012, Woodhead Publishing. p. 3-62.
58. Y.Z. Lü, et al., Effects of rare earths on the microstructure, properties and fracture
behavior of Mg–Al alloys. Materials Science and Engineering: A, 2000. 278(1): p. 66-
76.
59. L.P. Barber, Characterization of the solidification behavior and resultant
microstructures of magnesium-aluminum alloys. 2004: Worcester Polytechnic Institute.
60. M.S. Dargusch, et al., Elevated temperature mechanical properties and microstructures
of high pressure die cast magnesium AZ91 alloy cast with different section thicknesses.
Materials Science and Engineering: A, 2009. 523(1): p. 282-288.
61. D. Regener, E. Schick, and H. Heyse, Microstructural changes of pressure die cast
magnesium alloys after long-term thermic loading. Material Wissenschaft Und
Werkstofftechnik 2003. 34(8): p. 721-728.
Chapter 1 Introduction
31
62. S. Otarawanna, High pressure die casting of aluminium and magnesium alloys:
formation of microstructure and defects. 2009, The University of Queensland, School
of Mechanical and Mining Engineering.
63. J.W. Christian, Chapter 14 - Solidification and melting, in The theory of
transformations in metals and alloys. 2002, Pergamon: Oxford. p. 623-701.
64. D.A. Porter, K.E. Easterling, and M. Sherif, Phase transformations in metals and
alloys. 2009: CRC press.
65. V.Y. Gertsman, et al., Microstructure and second-phase particles in low- and high-
pressure die-cast magnesium alloy AM50. Metallurgical and Materials Transactions A,
2005. 36(8): p. 1989-1997.
66. T.L. Chia, et al., The effect of alloy composition on the microstructure and tensile
properties of binary Mg-rare earth alloys. Journal of Intermetallics, 2009. 17(7): p.
481-490.
67. C.M. Gourlay, H.I. Laukli, and A.K. Dahle, Defect band characteristics in Mg-Al and
Al-Si high-pressure die castings. Metallurgical and Materials Transactions A, 2007.
38(8): p. 1833-1844.
68. T. Rzychoń and A. Kiełbus, Effect of rare earth elements on the microstructure of Mg-
Al alloys. Journal of Achievements in Materials and Manufacturing Engineering, 2006.
17(1-2): p. 149-152.
69. E.G. Sieracki, J.J. Velazquez, and K. Kabiri, Compressive stress retention
characteristics of high pressure die casting magnesium alloys. 1996, SAE Technical
Paper.
70. E.G. Sieracki, J.J. Velazquez, and K. Kabiri, SAE Technical Paper Series. SAE,
Warrendale, PA, 1996(960421).
Chapter 1 Introduction
32
71. L. Bichler and C. Ravindran, New developments in assessing hot tearing in magnesium
alloy castings. Materials & Design, 2010. 31: p. S17-S23.
72. P. Bakke, et al., Magnesium technology 2005. Proceedings of the Minerals, Metals &
Materials Society (TMS), 2005: p. 291.
73. J.H. Zhang, et al., Effect of Ce on microstructure, mechanical properties and corrosion
behavior of high-pressure die-cast Mg–4Al-based alloy. Journal of Alloys and
Compounds, 2011. 509(3): p. 1069-1078.
74. G. Pettersen, et al., Microstructure of a pressure die cast magnesium—4wt.%
aluminium alloy modified with rare earth additions. Materials Science and
Engineering: A, 1996. 207(1): p. 115-120.
75. J.H. Zhang, et al., Microstructures and mechanical properties of heat-resistant high-
pressure die-cast Mg–4Al–xLa–0.3 Mn (x= 1, 2, 4, 6) alloys. Materials Science and
Engineering: A, 2010. 527(10): p. 2527-2537.
76. J.H. Zhang, et al., Microstructures, mechanical properties and corrosion behavior of
high-pressure die-cast Mg–4Al–0.4 Mn–xPr (x= 1, 2, 4, 6) alloys. Journal of Alloys
and Compounds, 2009. 480(2): p. 810-819.
77. J.H. Zhang, et al., Effect of Nd on the microstructure, mechanical properties and
corrosion behavior of die-cast Mg–4Al-based alloy. Journal of Alloys and Compounds,
2008. 464(1): p. 556-564.
78. S. Zhu, et al., The relationship between microstructure and creep resistance in die-cast
magnesium–rare earth alloys. Scripta Materialia, 2010. 63(7): p. 698-703.
79. A. Grzybowska and K. Braszczyńska-Malik, Microstructural characterization of the
as-cast AZ91 magnesium alloy with rare earth elements. Archives of Foundry
Engineering, 2012. 12: p. 23-26.
Chapter 1 Introduction
33
80. K.N. Braszczyńska-Malik, Mg-Al-RE magnesium alloys for high-pressure die-casting.
Archives of Foundry Engineering, 2014. 14(2): p. 49-52.
81. J.L. Wang, et al., Investigations of the properties of Mg–5Al–0.3 Mn–xCe (x= 0–3,
wt.%) alloys. Journal of Alloys and Compounds, 2009. 477(1): p. 341-345.
82. K. Meshinchi Asl, A. Masoudi, and F. Khomamizadeh, The effect of different rare earth
elements content on microstructure, mechanical and wear behavior of Mg–Al–Zn alloy.
Materials Science and Engineering: A, 2010. 527(7–8): p. 2027-2035.
83. W.L. Xiao, et al., Effects of cerium on the microstructure and mechanical properties of
Mg–20Zn–8Al alloy. Materials Science and Engineering: A, 2008. 474(1–2): p. 317-
322.
84. J.H. Zhang, et al., Effect of substituting cerium-rich mischmetal with lanthanum on
microstructure and mechanical properties of die-cast Mg–Al–RE alloys. Materials &
Design, 2009. 30(7): p. 2372-2378.
85. S. Zhu, et al., Microstructure and creep behavior of high-pressure die-cast magnesium
alloy AE44. Metallurgical and Materials Transactions A, 2012. 43(11): p. 4137-4144.
86. L.Y. Wei, G.L. Dunlop, and H. Westengen, Age hardening and precipitation in a cast
magnesium-rare-earth alloy. Journal of Materials Science, 1996. 31(2): p. 387-397.
87. B.R. Powell, et al., The relationship between microstructure and creep behavior in
AE42 magnesium die casting alloy. Essential Readings in Magnesium Technology,
2014: p. 275-281.
88. B.R. Powell, et al., Microstructure and creep behavior in AE42 magnesium die-casting
alloy. The Journal of The Minerals & Materials Society (TMS), 2002. 54(8): p. 34-38.
89. G.D. Tong, H.F. Liu, and Y.H. Liu, Effect of rare earth additions on microstructure
and mechanical properties of AZ91 magnesium alloys. Transactions of Nonferrous
Metals Society of China, 2010. 20: p. s336-s340.
Chapter 1 Introduction
34
90. L.L. Jin, Thermodynamic modeling of aluminum-magnesium-rare earth systems. 2012,
École Polytechnique de Montréal.
91. M.D. Parvez, Experimental investigation of the ternary Mg-Al-Sr system. 2004,
Concordia University.
92. R. Schmid‐Fetzer and J. Gröbner, Focused development of magnesium alloys using the
calphad approach. Advanced Engineering Materials, 2001. 3(12): p. 947-961.
93. J. Grobner, et al. The CALPHAD approach in the focused design of magnesium alloys.
in Materials Design Approaches and Experiences as held during the TMS Fall Meeting.
2001.
94. L.L. Jin, et al., Al–Mg–RE (RE = La, Ce, Pr, Nd, Sm) systems: thermodynamic
evaluations and optimizations coupled with key experiments and Miedema’s model
estimations. The Journal of Chemical Thermodynamics 2013. 58: p. 166-195.
95. J. Gröbner, D. Kevorkov, and R. Schmid-Fetzer, Thermodynamic modeling of Al–Ce–
Mg phase equilibria coupled with key experiments. Journal of Intermetallics, 2002.
10(5): p. 415-422.
96. K.O. Odinaev, et al., Phase equilibrium diagram of the aluminum-magnesium-
lanthanum system at 400°C. Izv. Vyss. Uchebn. Zaved., Tsvetn. Met., 1988. 2: p. 81-
85.
97. M. Hosseinifar and D.V. Malakhov, On the fabricability of a composite material
containing the FCC matrix with embedded ductile B2 intermetallics. Journal of Alloys
and Compounds, 2010. 505(2): p. 459-466.
98. C. Wong, et al., Solidification path and microstructure evolution of Mg-3Al-14La alloy:
Implications for the Mg-rich corner of the Mg-Al-La phase diagram. Journal of Alloys
and Compounds, 2019.
Chapter 1 Introduction
35
99. C. Wong, et al. Experimental study of the solidification microstructure in the Mg-rich
corner of Mg–Al–Ce system. in TMS Annual Meeting & Exhibition. 2018. Springer.
100. CompuTherm, Pandat software and PanMagnesium 2018 thermodynamic database,
Madison, Editor.

Chapter 2 Literature Review
36
Chapter 2
Literature Review

Chapter 2 Literature Review
37
2 Chapter 2: Literature review
This chapter begins with an introduction to the phase diagrams of the binary Mg-Al, Mg-RE
and Al-RE systems as well as the ternary Mg-Al-RE systems. Then, the solidification
behaviour and microstructural features of magnesium alloys in these systems are discussed,
including the current literature on intermetallic phase selection and solidification sequence
during cooling in Mg-Al-RE alloys. Lastly, because the alloy properties are strongly influenced
by the microstructure, which is controlled by the processing conditions, the effect of the cooling
rate and the roles of rare earth (RE) alloying elements on the formation of different phases are
outlined in detail, emphasising the importance in phase selection for Mg-Al-RE alloys.
2.1 Thermodynamics and phase diagrams
2.1.1 Fundamentals of phase diagrams
Thermodynamic databases, including phase diagrams, are an essential tool in the optimisation
and development of alloys because they aid in saving material and time [1]. Often phase
diagrams are referred to as maps in alloy design, because by integrating phase diagrams with
the design and development of alloys, prediction of possible precipitating phases, solidification
sequences and the relative amounts of secondary phases for the alloys can be made for any
given temperature, pressure and composition. This information can significantly improve the
control of alloy production.
The important features, such as liquidus and solidus temperatures and phase transitions, can
also be determined using phase diagrams. For example, the phase diagram for the binary Mg-
Al system, shown in Figure 2.1(a), has a liquidus line separating the liquid from the “liquid +
α-Mg” phase field, a solidus line separating the “liquid + α-Mg” from the α-Mg phase field, a
solvus line separating α-Mg from a two phase mixture of solid solutions of “α-Mg + β”, and
eutectic point, at which a liquid and two solid phases co-exist in equilibrium. The development
of microstructure depends on the alloy compositions. For example, the solidification of a hypo-
eutectic alloy will have a microstructure evolution as shown in Figure 2.1(b).
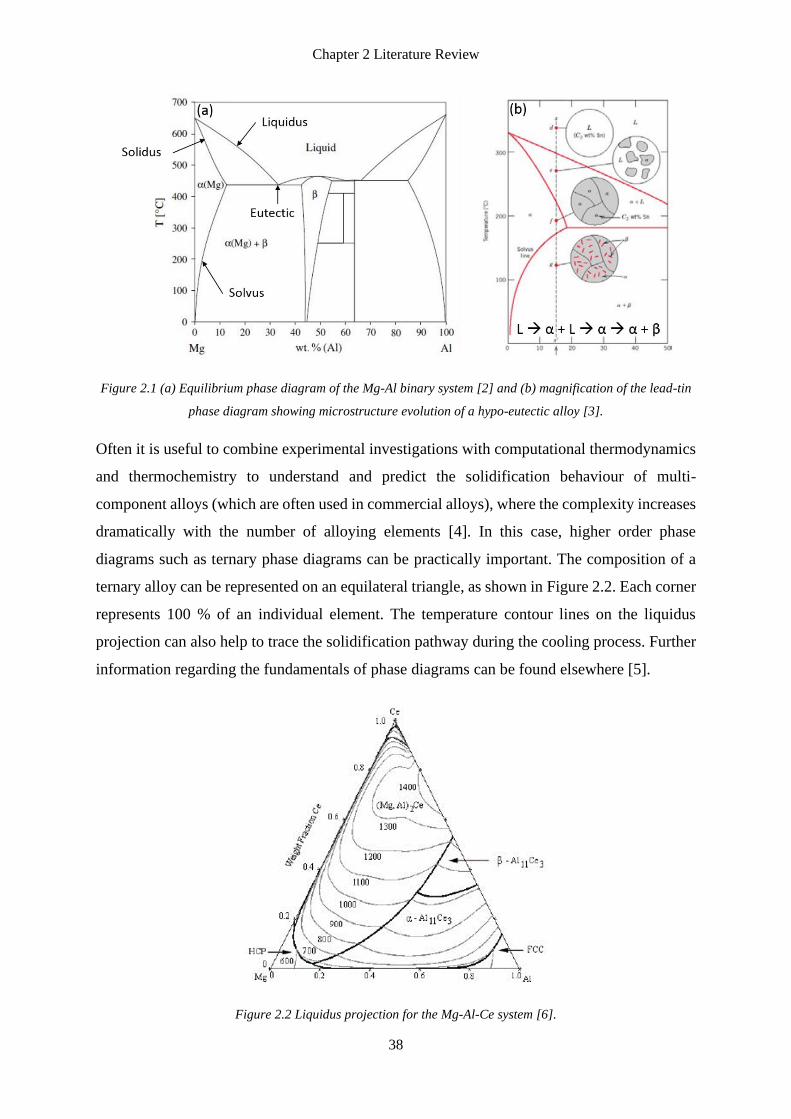
Chapter 2 Literature Review
38
Figure 2.1 (a) Equilibrium phase diagram of the Mg-Al binary system [2] and (b) magnification of the lead-tin
phase diagram showing microstructure evolution of a hypo-eutectic alloy [3].
Often it is useful to combine experimental investigations with computational thermodynamics
and thermochemistry to understand and predict the solidification behaviour of multi-
component alloys (which are often used in commercial alloys), where the complexity increases
dramatically with the number of alloying elements [4]. In this case, higher order phase
diagrams such as ternary phase diagrams can be practically important. The composition of a
ternary alloy can be represented on an equilateral triangle, as shown in Figure 2.2. Each corner
represents 100 % of an individual element. The temperature contour lines on the liquidus
projection can also help to trace the solidification pathway during the cooling process. Further
information regarding the fundamentals of phase diagrams can be found elsewhere [5].
Figure 2.2 Liquidus projection for the Mg-Al-Ce system [6].
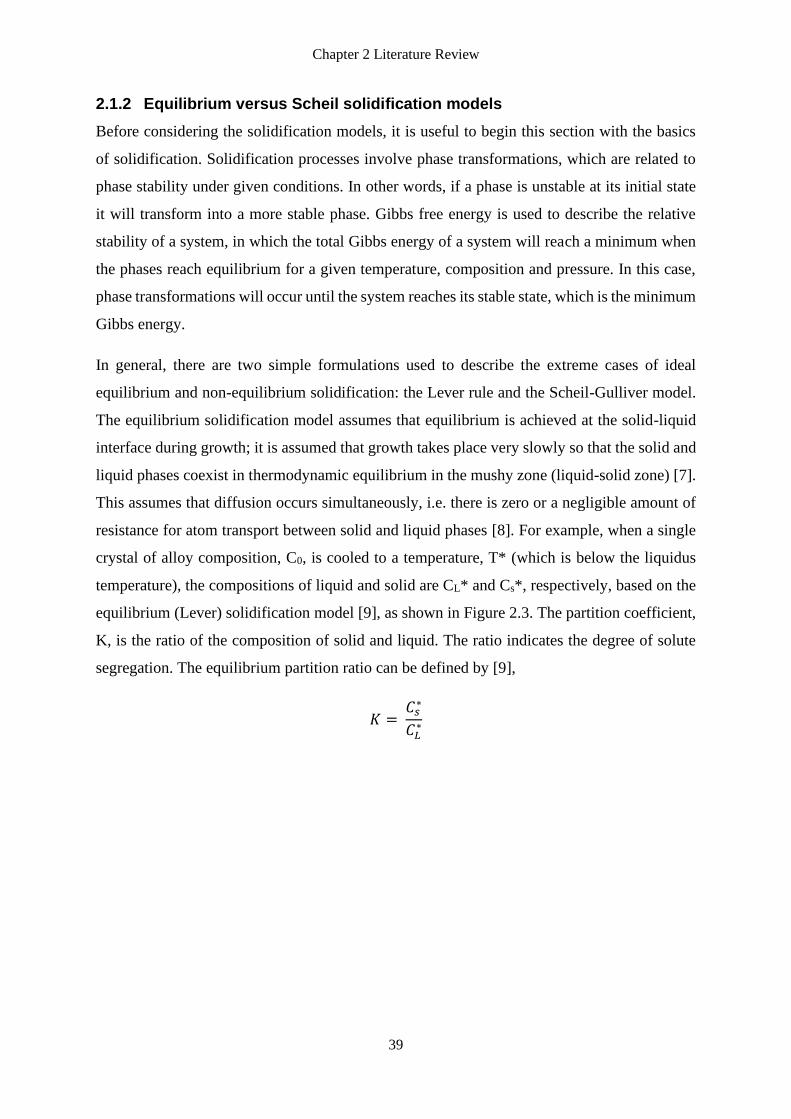
Chapter 2 Literature Review
39
2.1.2 Equilibrium versus Scheil solidification models
Before considering the solidification models, it is useful to begin this section with the basics
of solidification. Solidification processes involve phase transformations, which are related to
phase stability under given conditions. In other words, if a phase is unstable at its initial state
it will transform into a more stable phase. Gibbs free energy is used to describe the relative
stability of a system, in which the total Gibbs energy of a system will reach a minimum when
the phases reach equilibrium for a given temperature, composition and pressure. In this case,
phase transformations will occur until the system reaches its stable state, which is the minimum
Gibbs energy.
In general, there are two simple formulations used to describe the extreme cases of ideal
equilibrium and non-equilibrium solidification: the Lever rule and the Scheil-Gulliver model.
The equilibrium solidification model assumes that equilibrium is achieved at the solid-liquid
interface during growth; it is assumed that growth takes place very slowly so that the solid and
liquid phases coexist in thermodynamic equilibrium in the mushy zone (liquid-solid zone) [7].
This assumes that diffusion occurs simultaneously, i.e. there is zero or a negligible amount of
resistance for atom transport between solid and liquid phases [8]. For example, when a single
crystal of alloy composition, C0, is cooled to a temperature, T* (which is below the liquidus
temperature), the compositions of liquid and solid are CL* and Cs*, respectively, based on the
equilibrium (Lever) solidification model [9], as shown in Figure 2.3. The partition coefficient,
K, is the ratio of the composition of solid and liquid. The ratio indicates the degree of solute
segregation. The equilibrium partition ratio can be defined by [9],
𝐾 = 𝐶𝑠
∗
𝐶𝐿∗

Chapter 2 Literature Review
40
Figure 2.3 Magnified phase diagram with Lever rule illustrations [9].
The value of the equilibrium partition ratio indicates whether an element is partitioning into
the liquid (values less than unity), as is the case in a eutectic system, or whether an element is
partitioning to the solid dendrite (values greater than unity) [9]. When the partition coefficient
is further from unity, the element partitioning is stronger [9]. There are two main physical
parameters which contribute to the partition coefficient: the differences in atomic radii (the
tendency for an element to be in solid solution) and the chemical potential (the tendency for an
element to be in liquid) [9]. The equilibrium solidification model, also known as the Lever rule,
is used to describe the composition of the solid phase with respect to the fraction of solid and
is given in the equation below [9],
𝐶𝑠 =𝐾 ∙ 𝐶0
(1 − 𝑓𝑠) + 𝐾 ∙ 𝑓𝑠
Where Cs is the solute concentration in wt.%, K is the partition coefficient, and fs is the solid
fraction. According to the assumption of the equilibrium model, based on complete diffusion
in the liquid and solid phases, the final product should have a homogeneous composition, Cs =
C0 [8, 9].
In contrast, the Scheil-Gulliver solidification model is based on the assumption that there is no
elemental diffusional in the solid, uniform liquid composition, locally equilibrated solid-liquid
interfaces and equally dense solid and liquid [10]. Based on this assumption, a consistent
increase in rejected solute level in the liquid phase is expected. This segregation continues until
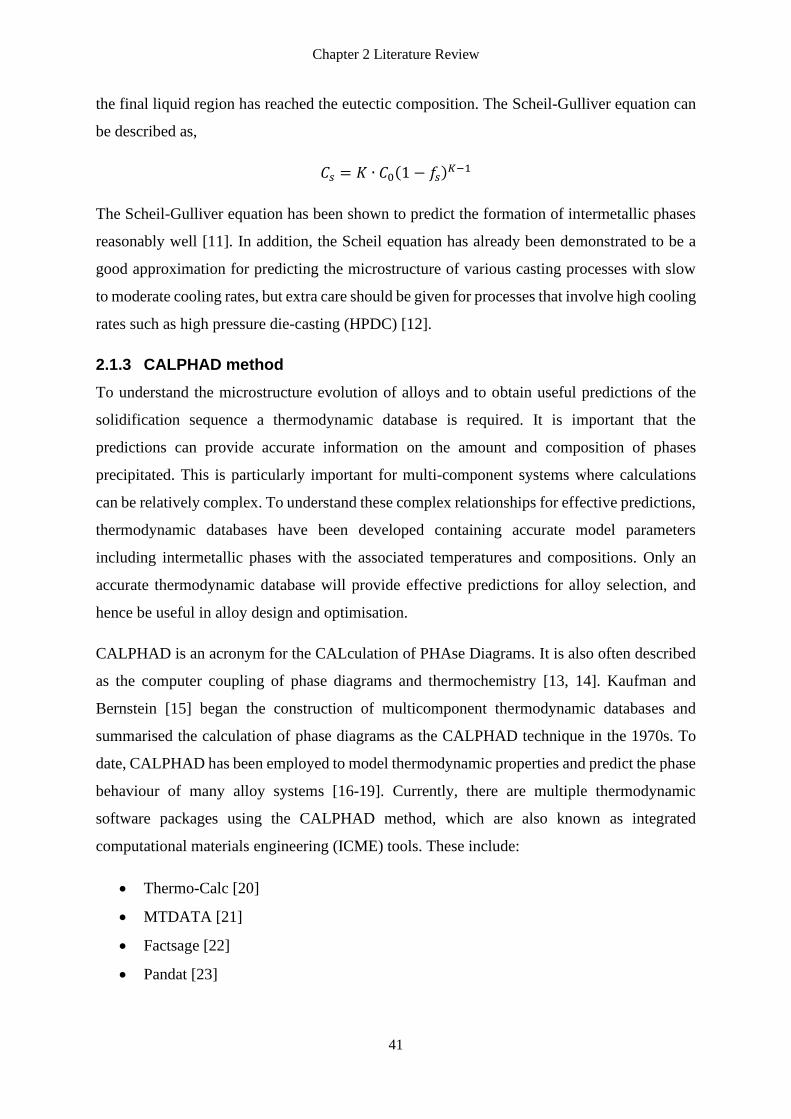
Chapter 2 Literature Review
41
the final liquid region has reached the eutectic composition. The Scheil-Gulliver equation can
be described as,
𝐶𝑠 = 𝐾 ∙ 𝐶0(1 − 𝑓𝑠)𝐾−1
The Scheil-Gulliver equation has been shown to predict the formation of intermetallic phases
reasonably well [11]. In addition, the Scheil equation has already been demonstrated to be a
good approximation for predicting the microstructure of various casting processes with slow
to moderate cooling rates, but extra care should be given for processes that involve high cooling
rates such as high pressure die-casting (HPDC) [12].
2.1.3 CALPHAD method
To understand the microstructure evolution of alloys and to obtain useful predictions of the
solidification sequence a thermodynamic database is required. It is important that the
predictions can provide accurate information on the amount and composition of phases
precipitated. This is particularly important for multi-component systems where calculations
can be relatively complex. To understand these complex relationships for effective predictions,
thermodynamic databases have been developed containing accurate model parameters
including intermetallic phases with the associated temperatures and compositions. Only an
accurate thermodynamic database will provide effective predictions for alloy selection, and
hence be useful in alloy design and optimisation.
CALPHAD is an acronym for the CALculation of PHAse Diagrams. It is also often described
as the computer coupling of phase diagrams and thermochemistry [13, 14]. Kaufman and
Bernstein [15] began the construction of multicomponent thermodynamic databases and
summarised the calculation of phase diagrams as the CALPHAD technique in the 1970s. To
date, CALPHAD has been employed to model thermodynamic properties and predict the phase
behaviour of many alloy systems [16-19]. Currently, there are multiple thermodynamic
software packages using the CALPHAD method, which are also known as integrated
computational materials engineering (ICME) tools. These include:
• Thermo-Calc [20]
• MTDATA [21]
• Factsage [22]
• Pandat [23]
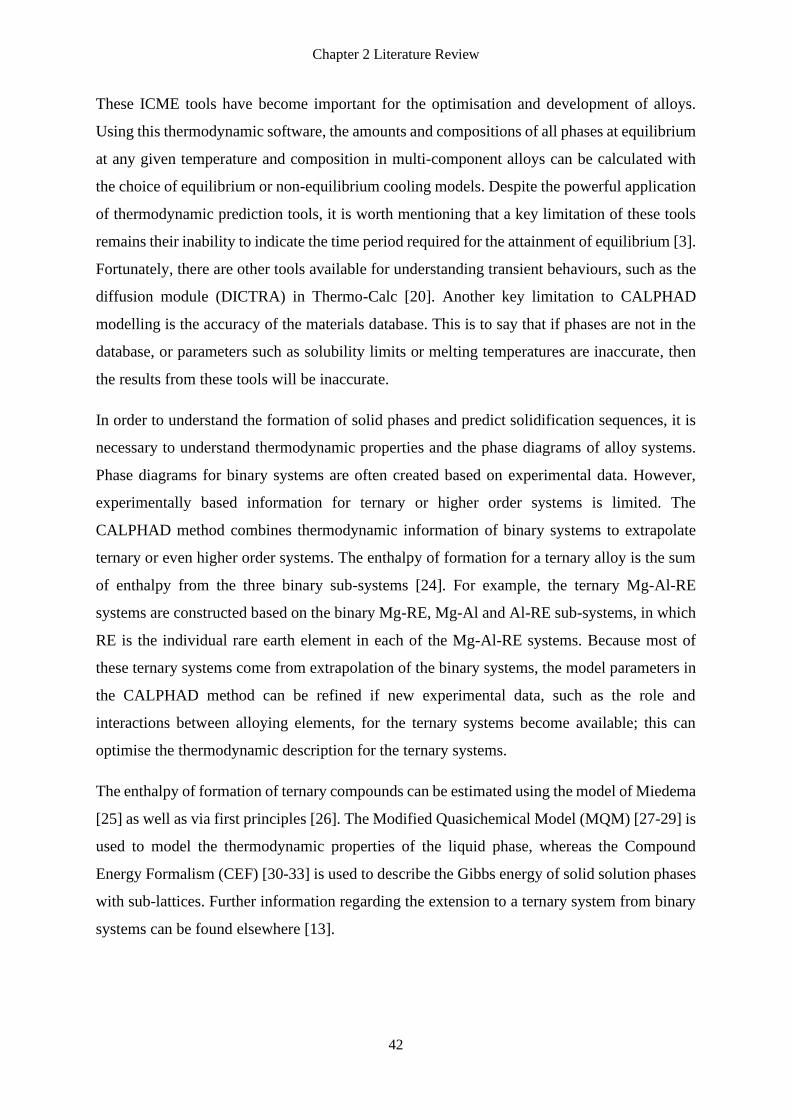
Chapter 2 Literature Review
42
These ICME tools have become important for the optimisation and development of alloys.
Using this thermodynamic software, the amounts and compositions of all phases at equilibrium
at any given temperature and composition in multi-component alloys can be calculated with
the choice of equilibrium or non-equilibrium cooling models. Despite the powerful application
of thermodynamic prediction tools, it is worth mentioning that a key limitation of these tools
remains their inability to indicate the time period required for the attainment of equilibrium [3].
Fortunately, there are other tools available for understanding transient behaviours, such as the
diffusion module (DICTRA) in Thermo-Calc [20]. Another key limitation to CALPHAD
modelling is the accuracy of the materials database. This is to say that if phases are not in the
database, or parameters such as solubility limits or melting temperatures are inaccurate, then
the results from these tools will be inaccurate.
In order to understand the formation of solid phases and predict solidification sequences, it is
necessary to understand thermodynamic properties and the phase diagrams of alloy systems.
Phase diagrams for binary systems are often created based on experimental data. However,
experimentally based information for ternary or higher order systems is limited. The
CALPHAD method combines thermodynamic information of binary systems to extrapolate
ternary or even higher order systems. The enthalpy of formation for a ternary alloy is the sum
of enthalpy from the three binary sub-systems [24]. For example, the ternary Mg-Al-RE
systems are constructed based on the binary Mg-RE, Mg-Al and Al-RE sub-systems, in which
RE is the individual rare earth element in each of the Mg-Al-RE systems. Because most of
these ternary systems come from extrapolation of the binary systems, the model parameters in
the CALPHAD method can be refined if new experimental data, such as the role and
interactions between alloying elements, for the ternary systems become available; this can
optimise the thermodynamic description for the ternary systems.
The enthalpy of formation of ternary compounds can be estimated using the model of Miedema
[25] as well as via first principles [26]. The Modified Quasichemical Model (MQM) [27-29] is
used to model the thermodynamic properties of the liquid phase, whereas the Compound
Energy Formalism (CEF) [30-33] is used to describe the Gibbs energy of solid solution phases
with sub-lattices. Further information regarding the extension to a ternary system from binary
systems can be found elsewhere [13].
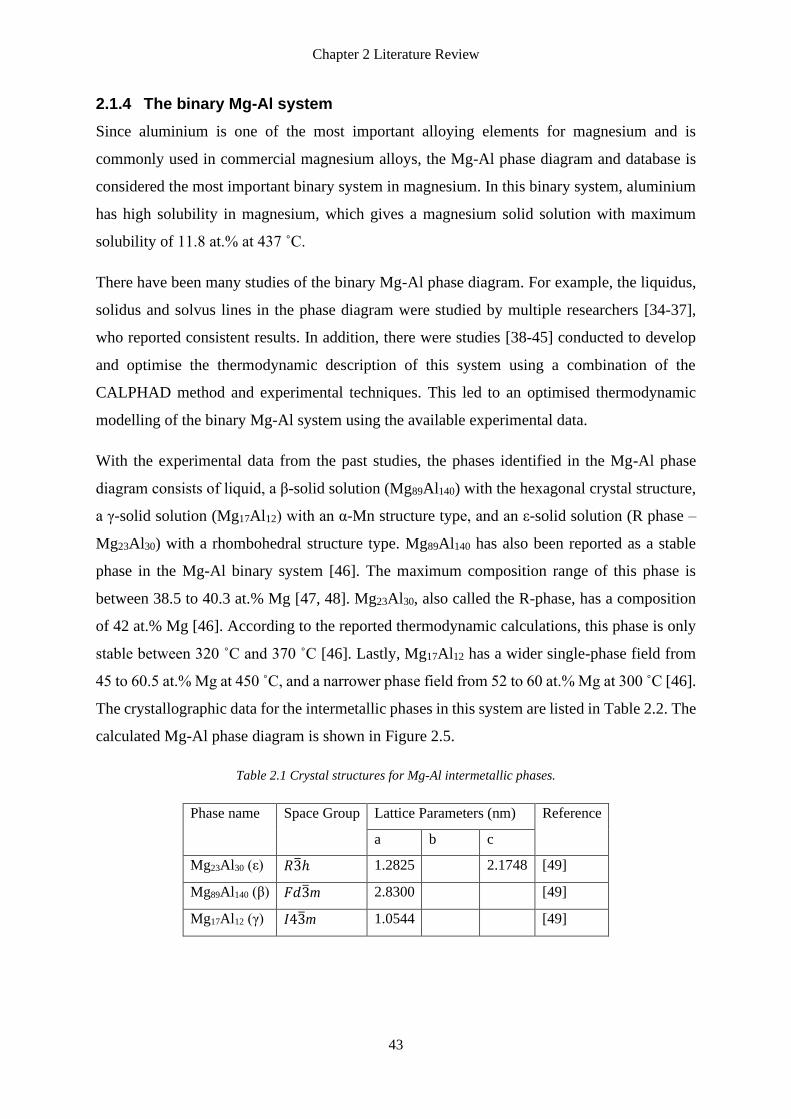
Chapter 2 Literature Review
43
2.1.4 The binary Mg-Al system
Since aluminium is one of the most important alloying elements for magnesium and is
commonly used in commercial magnesium alloys, the Mg-Al phase diagram and database is
considered the most important binary system in magnesium. In this binary system, aluminium
has high solubility in magnesium, which gives a magnesium solid solution with maximum
solubility of 11.8 at.% at 437 ˚C.
There have been many studies of the binary Mg-Al phase diagram. For example, the liquidus,
solidus and solvus lines in the phase diagram were studied by multiple researchers [34-37],
who reported consistent results. In addition, there were studies [38-45] conducted to develop
and optimise the thermodynamic description of this system using a combination of the
CALPHAD method and experimental techniques. This led to an optimised thermodynamic
modelling of the binary Mg-Al system using the available experimental data.
With the experimental data from the past studies, the phases identified in the Mg-Al phase
diagram consists of liquid, a β-solid solution (Mg89Al140) with the hexagonal crystal structure,
a γ-solid solution (Mg17Al12) with an α-Mn structure type, and an ε-solid solution (R phase –
Mg23Al30) with a rhombohedral structure type. Mg89Al140 has also been reported as a stable
phase in the Mg-Al binary system [46]. The maximum composition range of this phase is
between 38.5 to 40.3 at.% Mg [47, 48]. Mg23Al30, also called the R-phase, has a composition
of 42 at.% Mg [46]. According to the reported thermodynamic calculations, this phase is only
stable between 320 ˚C and 370 ˚C [46]. Lastly, Mg17Al12 has a wider single-phase field from
45 to 60.5 at.% Mg at 450 ˚C, and a narrower phase field from 52 to 60 at.% Mg at 300 ˚C [46].
The crystallographic data for the intermetallic phases in this system are listed in Table 2.2. The
calculated Mg-Al phase diagram is shown in Figure 2.5.
Table 2.1 Crystal structures for Mg-Al intermetallic phases.
Phase name Space Group Lattice Parameters (nm) Reference
a b c
Mg23Al30 (ε) 𝑅3ℎ 1.2825 2.1748 [49]
Mg89Al140 (β) 𝐹𝑑3m 2.8300 [49]
Mg17Al12 (γ) 𝐼43m 1.0544 [49]
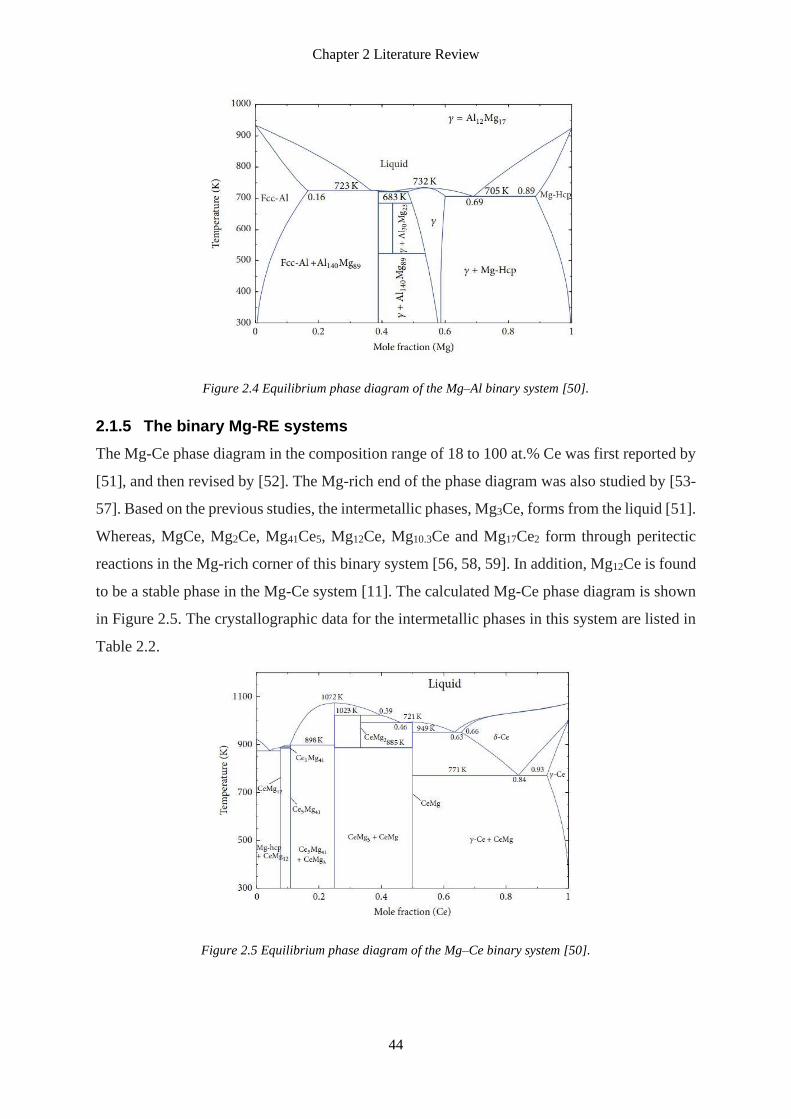
Chapter 2 Literature Review
44
Figure 2.4 Equilibrium phase diagram of the Mg–Al binary system [50].
2.1.5 The binary Mg-RE systems
The Mg-Ce phase diagram in the composition range of 18 to 100 at.% Ce was first reported by
[51], and then revised by [52]. The Mg-rich end of the phase diagram was also studied by [53-
57]. Based on the previous studies, the intermetallic phases, Mg3Ce, forms from the liquid [51].
Whereas, MgCe, Mg2Ce, Mg41Ce5, Mg12Ce, Mg10.3Ce and Mg17Ce2 form through peritectic
reactions in the Mg-rich corner of this binary system [56, 58, 59]. In addition, Mg12Ce is found
to be a stable phase in the Mg-Ce system [11]. The calculated Mg-Ce phase diagram is shown
in Figure 2.5. The crystallographic data for the intermetallic phases in this system are listed in
Table 2.2.
Figure 2.5 Equilibrium phase diagram of the Mg–Ce binary system [50].
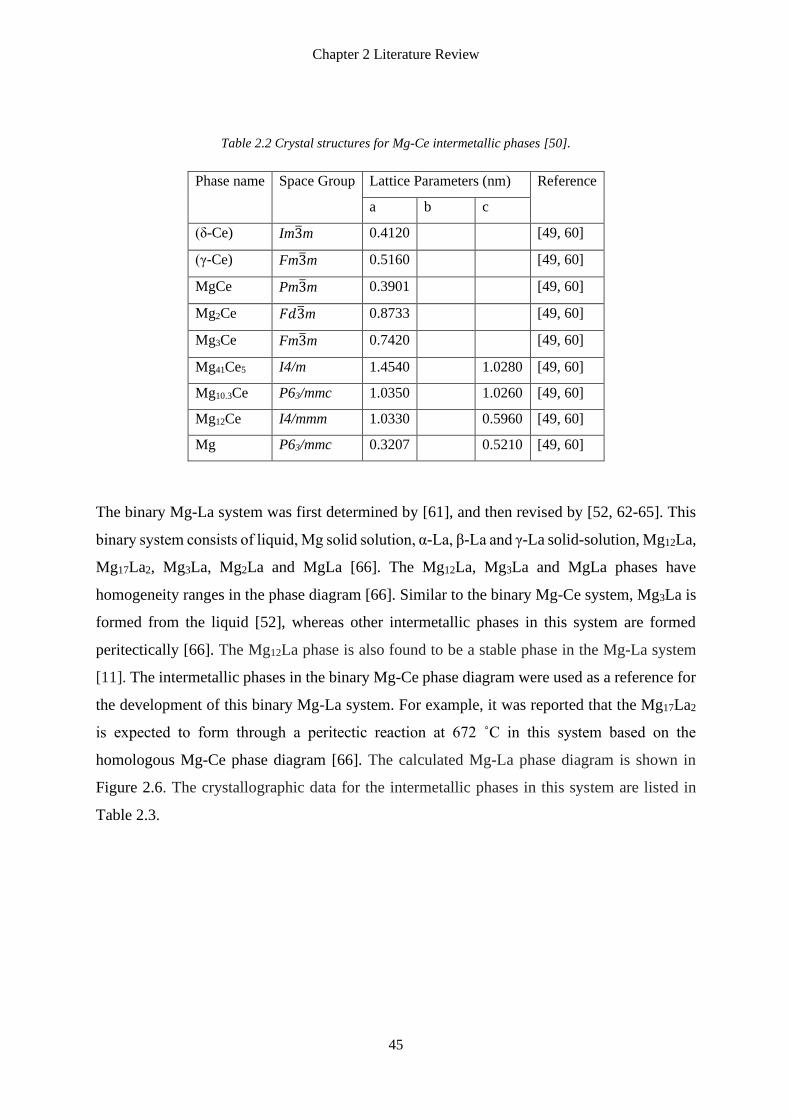
Chapter 2 Literature Review
45
Table 2.2 Crystal structures for Mg-Ce intermetallic phases [50].
Phase name Space Group Lattice Parameters (nm) Reference
a b c
(δ-Ce) Im3m 0.4120 [49, 60]
(γ-Ce) Fm3m 0.5160 [49, 60]
MgCe Pm3m 0.3901 [49, 60]
Mg2Ce 𝐹𝑑3m 0.8733 [49, 60]
Mg3Ce Fm3m 0.7420 [49, 60]
Mg41Ce5 I4/m 1.4540 1.0280 [49, 60]
Mg10.3Ce P63/mmc 1.0350 1.0260 [49, 60]
Mg12Ce I4/mmm 1.0330 0.5960 [49, 60]
Mg P63/mmc 0.3207 0.5210 [49, 60]
The binary Mg-La system was first determined by [61], and then revised by [52, 62-65]. This
binary system consists of liquid, Mg solid solution, α-La, β-La and γ-La solid-solution, Mg12La,
Mg17La2, Mg3La, Mg2La and MgLa [66]. The Mg12La, Mg3La and MgLa phases have
homogeneity ranges in the phase diagram [66]. Similar to the binary Mg-Ce system, Mg3La is
formed from the liquid [52], whereas other intermetallic phases in this system are formed
peritectically [66]. The Mg12La phase is also found to be a stable phase in the Mg-La system
[11]. The intermetallic phases in the binary Mg-Ce phase diagram were used as a reference for
the development of this binary Mg-La system. For example, it was reported that the Mg17La2
is expected to form through a peritectic reaction at 672 ˚C in this system based on the
homologous Mg-Ce phase diagram [66]. The calculated Mg-La phase diagram is shown in
Figure 2.6. The crystallographic data for the intermetallic phases in this system are listed in
Table 2.3.
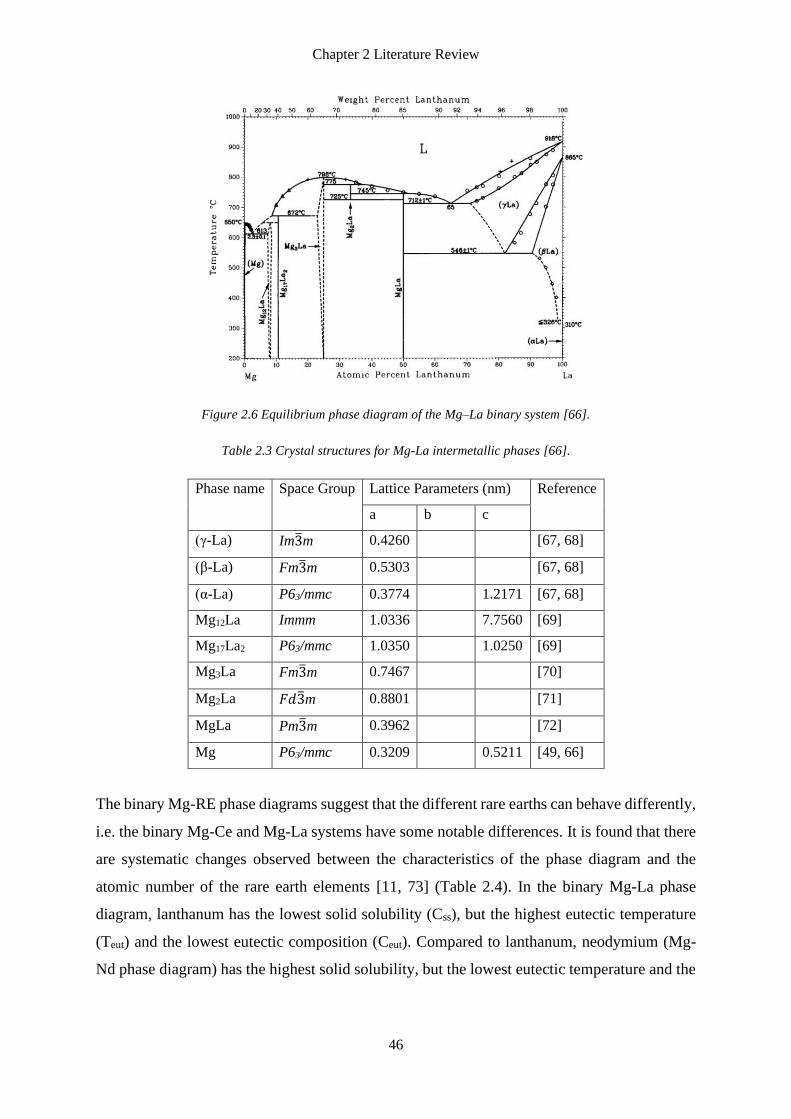
Chapter 2 Literature Review
46
Figure 2.6 Equilibrium phase diagram of the Mg–La binary system [66].
Table 2.3 Crystal structures for Mg-La intermetallic phases [66].
Phase name Space Group Lattice Parameters (nm) Reference
a b c
(γ-La) Im3m 0.4260 [67, 68]
(β-La) Fm3m 0.5303 [67, 68]
(α-La) P63/mmc 0.3774 1.2171 [67, 68]
Mg12La Immm 1.0336 7.7560 [69]
Mg17La2 P63/mmc 1.0350 1.0250 [69]
Mg3La Fm3m 0.7467 [70]
Mg2La 𝐹𝑑3m 0.8801 [71]
MgLa Pm3m 0.3962 [72]
Mg P63/mmc 0.3209 0.5211 [49, 66]
The binary Mg-RE phase diagrams suggest that the different rare earths can behave differently,
i.e. the binary Mg-Ce and Mg-La systems have some notable differences. It is found that there
are systematic changes observed between the characteristics of the phase diagram and the
atomic number of the rare earth elements [11, 73] (Table 2.4). In the binary Mg-La phase
diagram, lanthanum has the lowest solid solubility (Css), but the highest eutectic temperature
(Teut) and the lowest eutectic composition (Ceut). Compared to lanthanum, neodymium (Mg-
Nd phase diagram) has the highest solid solubility, but the lowest eutectic temperature and the
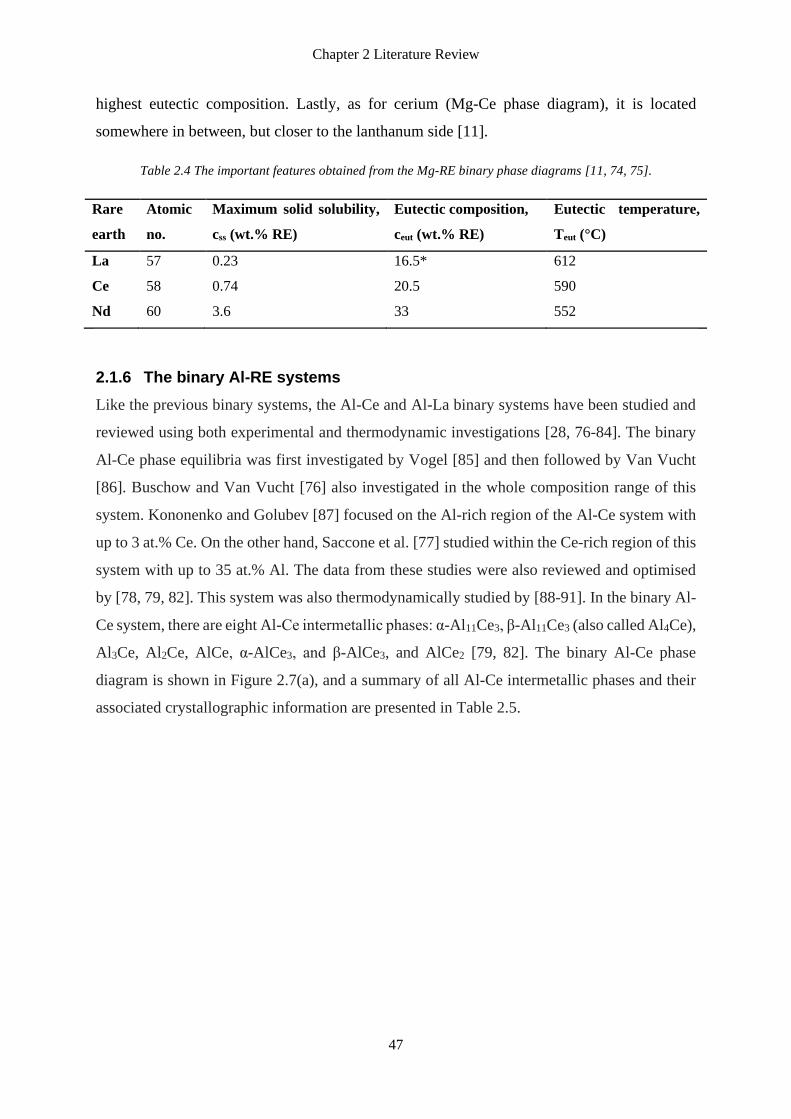
Chapter 2 Literature Review
47
highest eutectic composition. Lastly, as for cerium (Mg-Ce phase diagram), it is located
somewhere in between, but closer to the lanthanum side [11].
Table 2.4 The important features obtained from the Mg-RE binary phase diagrams [11, 74, 75].
Rare
earth
Atomic
no.
Maximum solid solubility,
css (wt.% RE)
Eutectic composition,
ceut (wt.% RE)
Eutectic temperature,
Teut (°C)
La 57 0.23 16.5* 612
Ce 58 0.74 20.5 590
Nd 60 3.6 33 552
2.1.6 The binary Al-RE systems
Like the previous binary systems, the Al-Ce and Al-La binary systems have been studied and
reviewed using both experimental and thermodynamic investigations [28, 76-84]. The binary
Al-Ce phase equilibria was first investigated by Vogel [85] and then followed by Van Vucht
[86]. Buschow and Van Vucht [76] also investigated in the whole composition range of this
system. Kononenko and Golubev [87] focused on the Al-rich region of the Al-Ce system with
up to 3 at.% Ce. On the other hand, Saccone et al. [77] studied within the Ce-rich region of this
system with up to 35 at.% Al. The data from these studies were also reviewed and optimised
by [78, 79, 82]. This system was also thermodynamically studied by [88-91]. In the binary Al-
Ce system, there are eight Al-Ce intermetallic phases: α-Al11Ce3, β-Al11Ce3 (also called Al4Ce),
Al3Ce, Al2Ce, AlCe, α-AlCe3, and β-AlCe3, and AlCe2 [79, 82]. The binary Al-Ce phase
diagram is shown in Figure 2.7(a), and a summary of all Al-Ce intermetallic phases and their
associated crystallographic information are presented in Table 2.5.
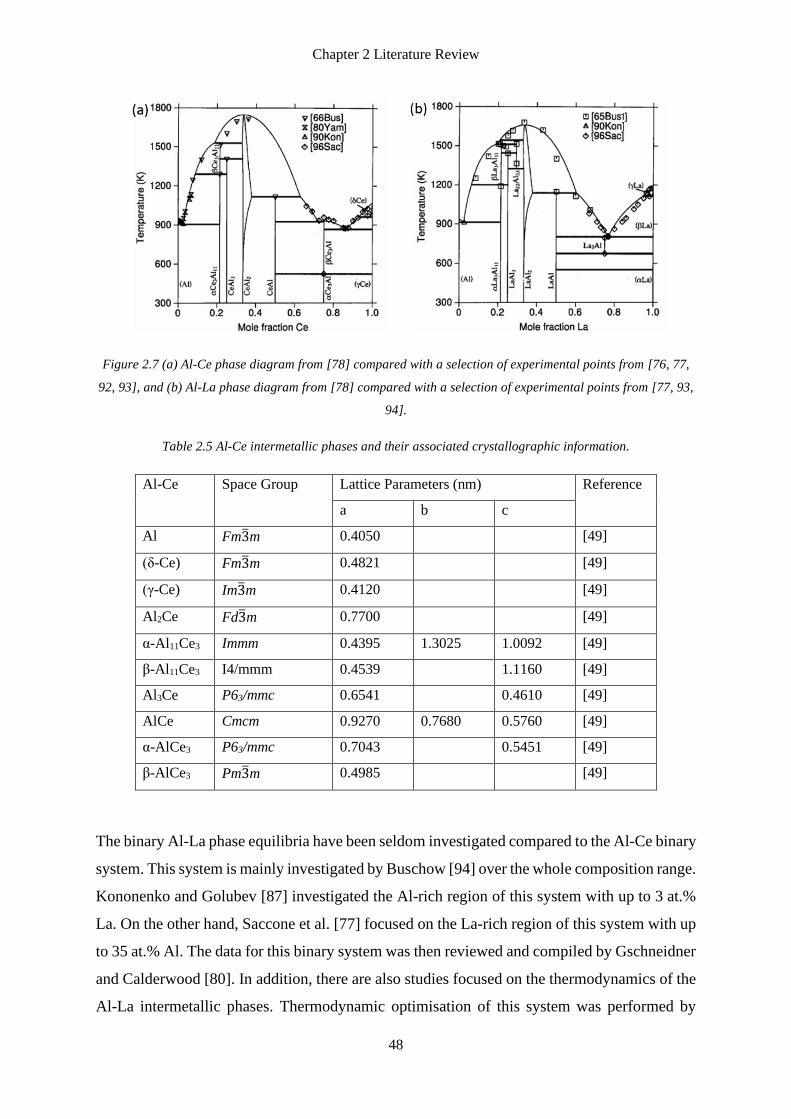
Chapter 2 Literature Review
48
Figure 2.7 (a) Al-Ce phase diagram from [78] compared with a selection of experimental points from [76, 77,
92, 93], and (b) Al-La phase diagram from [78] compared with a selection of experimental points from [77, 93,
94].
Table 2.5 Al-Ce intermetallic phases and their associated crystallographic information.
Al-Ce Space Group Lattice Parameters (nm) Reference
a b c
Al Fm3m 0.4050 [49]
(δ-Ce) Fm3m 0.4821 [49]
(γ-Ce) Im3m 0.4120 [49]
Al2Ce Fd3m 0.7700 [49]
α-Al11Ce3 Immm 0.4395 1.3025 1.0092 [49]
β-Al11Ce3 I4/mmm 0.4539 1.1160 [49]
Al3Ce P63/mmc 0.6541 0.4610 [49]
AlCe Cmcm 0.9270 0.7680 0.5760 [49]
α-AlCe3 P63/mmc 0.7043 0.5451 [49]
β-AlCe3 Pm3m 0.4985 [49]
The binary Al-La phase equilibria have been seldom investigated compared to the Al-Ce binary
system. This system is mainly investigated by Buschow [94] over the whole composition range.
Kononenko and Golubev [87] investigated the Al-rich region of this system with up to 3 at.%
La. On the other hand, Saccone et al. [77] focused on the La-rich region of this system with up
to 35 at.% Al. The data for this binary system was then reviewed and compiled by Gschneidner
and Calderwood [80]. In addition, there are also studies focused on the thermodynamics of the
Al-La intermetallic phases. Thermodynamic optimisation of this system was performed by
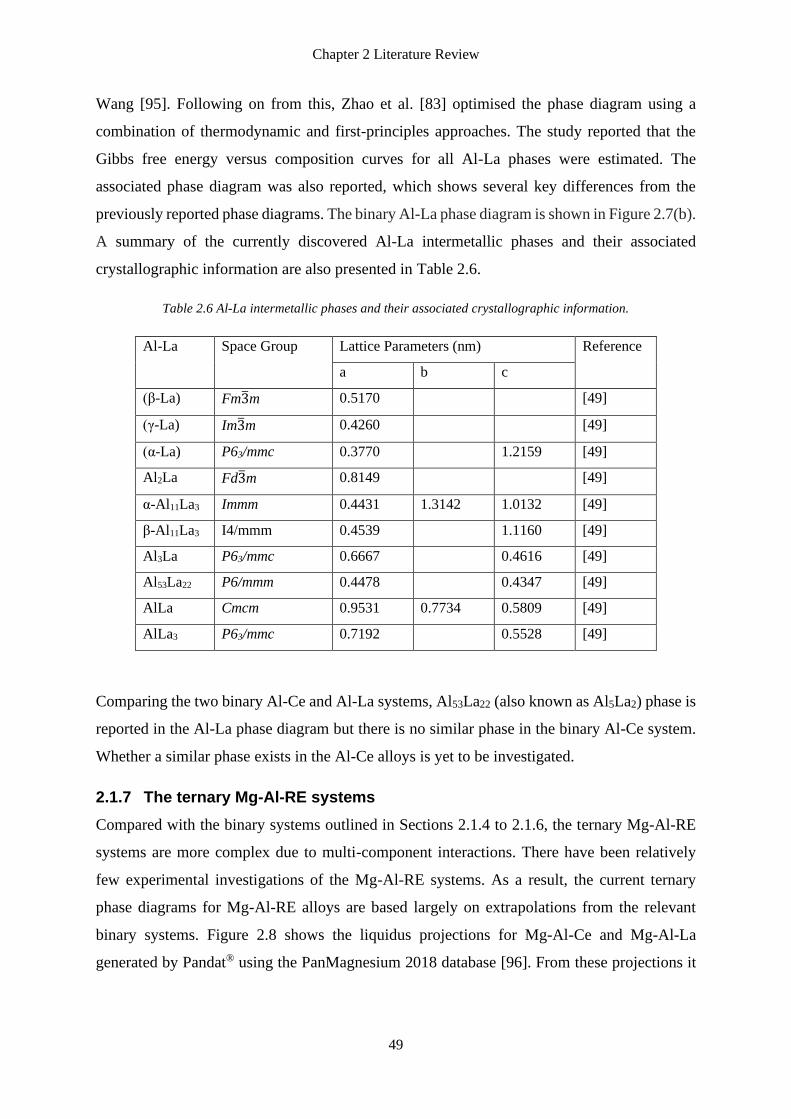
Chapter 2 Literature Review
49
Wang [95]. Following on from this, Zhao et al. [83] optimised the phase diagram using a
combination of thermodynamic and first-principles approaches. The study reported that the
Gibbs free energy versus composition curves for all Al-La phases were estimated. The
associated phase diagram was also reported, which shows several key differences from the
previously reported phase diagrams. The binary Al-La phase diagram is shown in Figure 2.7(b).
A summary of the currently discovered Al-La intermetallic phases and their associated
crystallographic information are also presented in Table 2.6.
Table 2.6 Al-La intermetallic phases and their associated crystallographic information.
Al-La Space Group Lattice Parameters (nm) Reference
a b c
(β-La) Fm3m 0.5170 [49]
(γ-La) Im3m 0.4260 [49]
(α-La) P63/mmc 0.3770 1.2159 [49]
Al2La Fd3m 0.8149 [49]
α-Al11La3 Immm 0.4431 1.3142 1.0132 [49]
β-Al11La3 I4/mmm 0.4539 1.1160 [49]
Al3La P63/mmc 0.6667 0.4616 [49]
Al53La22 P6/mmm 0.4478 0.4347 [49]
AlLa Cmcm 0.9531 0.7734 0.5809 [49]
AlLa3 P63/mmc 0.7192 0.5528 [49]
Comparing the two binary Al-Ce and Al-La systems, Al53La22 (also known as Al5La2) phase is
reported in the Al-La phase diagram but there is no similar phase in the binary Al-Ce system.
Whether a similar phase exists in the Al-Ce alloys is yet to be investigated.
2.1.7 The ternary Mg-Al-RE systems
Compared with the binary systems outlined in Sections 2.1.4 to 2.1.6, the ternary Mg-Al-RE
systems are more complex due to multi-component interactions. There have been relatively
few experimental investigations of the Mg-Al-RE systems. As a result, the current ternary
phase diagrams for Mg-Al-RE alloys are based largely on extrapolations from the relevant
binary systems. Figure 2.8 shows the liquidus projections for Mg-Al-Ce and Mg-Al-La
generated by Pandat® using the PanMagnesium 2018 database [96]. From these projections it
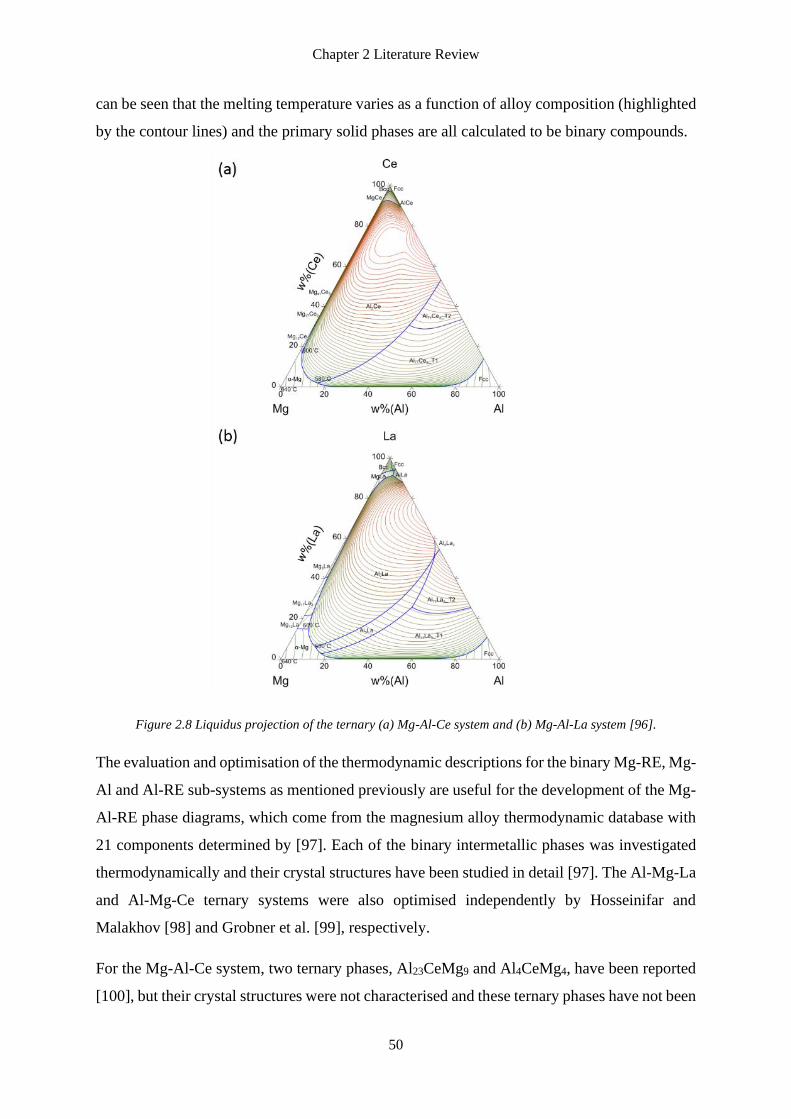
Chapter 2 Literature Review
50
can be seen that the melting temperature varies as a function of alloy composition (highlighted
by the contour lines) and the primary solid phases are all calculated to be binary compounds.
Figure 2.8 Liquidus projection of the ternary (a) Mg-Al-Ce system and (b) Mg-Al-La system [96].
The evaluation and optimisation of the thermodynamic descriptions for the binary Mg-RE, Mg-
Al and Al-RE sub-systems as mentioned previously are useful for the development of the Mg-
Al-RE phase diagrams, which come from the magnesium alloy thermodynamic database with
21 components determined by [97]. Each of the binary intermetallic phases was investigated
thermodynamically and their crystal structures have been studied in detail [97]. The Al-Mg-La
and Al-Mg-Ce ternary systems were also optimised independently by Hosseinifar and
Malakhov [98] and Grobner et al. [99], respectively.
For the Mg-Al-Ce system, two ternary phases, Al23CeMg9 and Al4CeMg4, have been reported
[100], but their crystal structures were not characterised and these ternary phases have not been
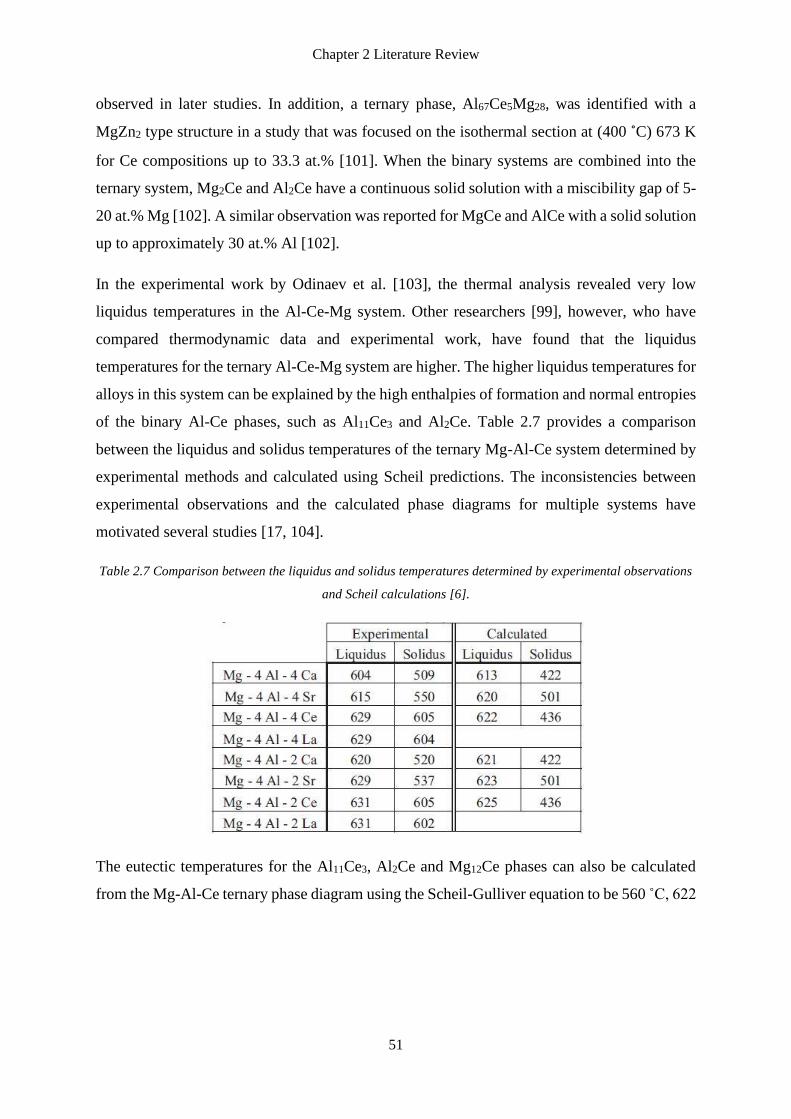
Chapter 2 Literature Review
51
observed in later studies. In addition, a ternary phase, Al67Ce5Mg28, was identified with a
MgZn2 type structure in a study that was focused on the isothermal section at (400 ˚C) 673 K
for Ce compositions up to 33.3 at.% [101]. When the binary systems are combined into the
ternary system, Mg2Ce and Al2Ce have a continuous solid solution with a miscibility gap of 5-
20 at.% Mg [102]. A similar observation was reported for MgCe and AlCe with a solid solution
up to approximately 30 at.% Al [102].
In the experimental work by Odinaev et al. [103], the thermal analysis revealed very low
liquidus temperatures in the Al-Ce-Mg system. Other researchers [99], however, who have
compared thermodynamic data and experimental work, have found that the liquidus
temperatures for the ternary Al-Ce-Mg system are higher. The higher liquidus temperatures for
alloys in this system can be explained by the high enthalpies of formation and normal entropies
of the binary Al-Ce phases, such as Al11Ce3 and Al2Ce. Table 2.7 provides a comparison
between the liquidus and solidus temperatures of the ternary Mg-Al-Ce system determined by
experimental methods and calculated using Scheil predictions. The inconsistencies between
experimental observations and the calculated phase diagrams for multiple systems have
motivated several studies [17, 104].
Table 2.7 Comparison between the liquidus and solidus temperatures determined by experimental observations
and Scheil calculations [6].
The eutectic temperatures for the Al11Ce3, Al2Ce and Mg12Ce phases can also be calculated
from the Mg-Al-Ce ternary phase diagram using the Scheil-Gulliver equation to be 560 C, 622
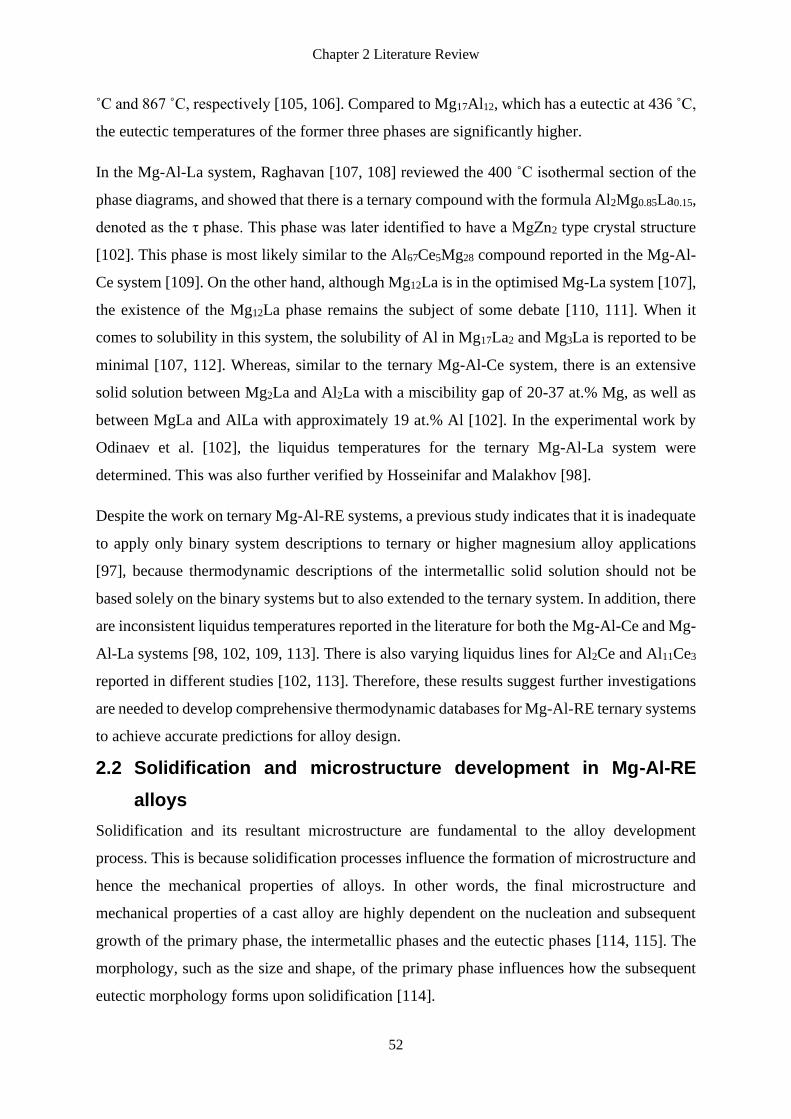
Chapter 2 Literature Review
52
˚C and 867 ˚C, respectively [105, 106]. Compared to Mg17Al12, which has a eutectic at 436 ˚C,
the eutectic temperatures of the former three phases are significantly higher.
In the Mg-Al-La system, Raghavan [107, 108] reviewed the 400 ˚C isothermal section of the
phase diagrams, and showed that there is a ternary compound with the formula Al2Mg0.85La0.15,
denoted as the τ phase. This phase was later identified to have a MgZn2 type crystal structure
[102]. This phase is most likely similar to the Al67Ce5Mg28 compound reported in the Mg-Al-
Ce system [109]. On the other hand, although Mg12La is in the optimised Mg-La system [107],
the existence of the Mg12La phase remains the subject of some debate [110, 111]. When it
comes to solubility in this system, the solubility of Al in Mg17La2 and Mg3La is reported to be
minimal [107, 112]. Whereas, similar to the ternary Mg-Al-Ce system, there is an extensive
solid solution between Mg2La and Al2La with a miscibility gap of 20-37 at.% Mg, as well as
between MgLa and AlLa with approximately 19 at.% Al [102]. In the experimental work by
Odinaev et al. [102], the liquidus temperatures for the ternary Mg-Al-La system were
determined. This was also further verified by Hosseinifar and Malakhov [98].
Despite the work on ternary Mg-Al-RE systems, a previous study indicates that it is inadequate
to apply only binary system descriptions to ternary or higher magnesium alloy applications
[97], because thermodynamic descriptions of the intermetallic solid solution should not be
based solely on the binary systems but to also extended to the ternary system. In addition, there
are inconsistent liquidus temperatures reported in the literature for both the Mg-Al-Ce and Mg-
Al-La systems [98, 102, 109, 113]. There is also varying liquidus lines for Al2Ce and Al11Ce3
reported in different studies [102, 113]. Therefore, these results suggest further investigations
are needed to develop comprehensive thermodynamic databases for Mg-Al-RE ternary systems
to achieve accurate predictions for alloy design.
2.2 Solidification and microstructure development in Mg-Al-RE
alloys
Solidification and its resultant microstructure are fundamental to the alloy development
process. This is because solidification processes influence the formation of microstructure and
hence the mechanical properties of alloys. In other words, the final microstructure and
mechanical properties of a cast alloy are highly dependent on the nucleation and subsequent
growth of the primary phase, the intermetallic phases and the eutectic phases [114, 115]. The
morphology, such as the size and shape, of the primary phase influences how the subsequent
eutectic morphology forms upon solidification [114].
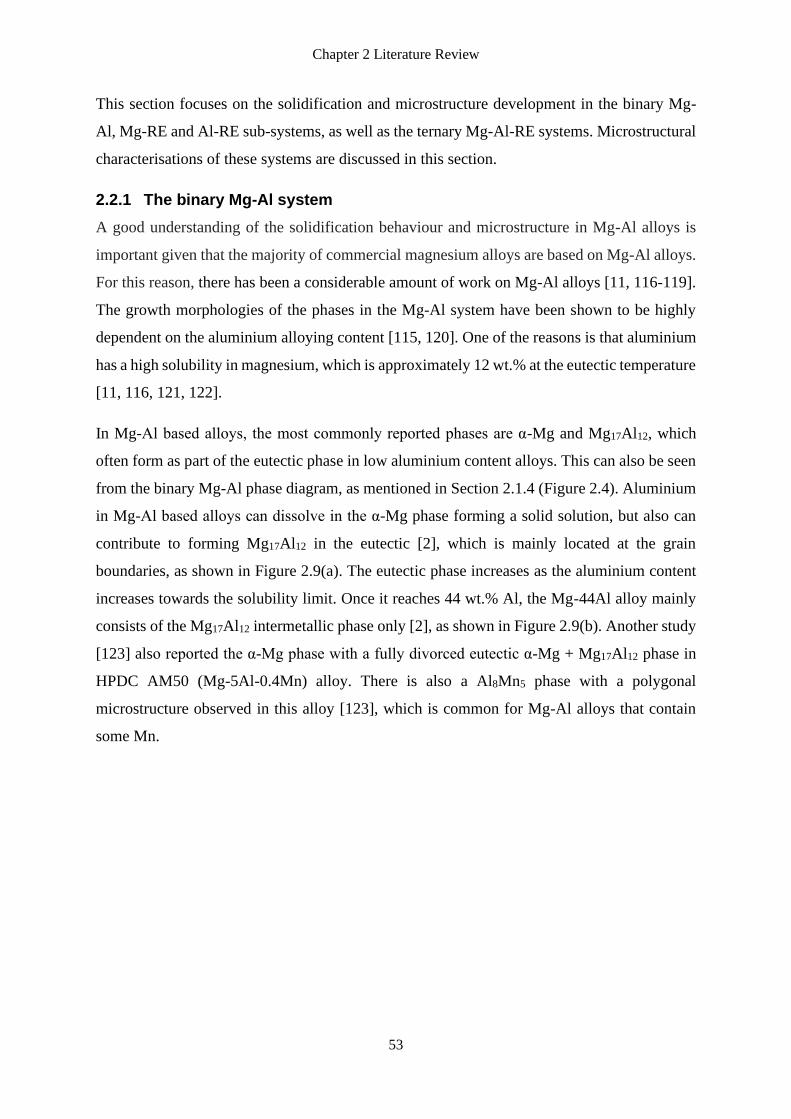
Chapter 2 Literature Review
53
This section focuses on the solidification and microstructure development in the binary Mg-
Al, Mg-RE and Al-RE sub-systems, as well as the ternary Mg-Al-RE systems. Microstructural
characterisations of these systems are discussed in this section.
2.2.1 The binary Mg-Al system
A good understanding of the solidification behaviour and microstructure in Mg-Al alloys is
important given that the majority of commercial magnesium alloys are based on Mg-Al alloys.
For this reason, there has been a considerable amount of work on Mg-Al alloys [11, 116-119].
The growth morphologies of the phases in the Mg-Al system have been shown to be highly
dependent on the aluminium alloying content [115, 120]. One of the reasons is that aluminium
has a high solubility in magnesium, which is approximately 12 wt.% at the eutectic temperature
[11, 116, 121, 122].
In Mg-Al based alloys, the most commonly reported phases are α-Mg and Mg17Al12, which
often form as part of the eutectic phase in low aluminium content alloys. This can also be seen
from the binary Mg-Al phase diagram, as mentioned in Section 2.1.4 (Figure 2.4). Aluminium
in Mg-Al based alloys can dissolve in the α-Mg phase forming a solid solution, but also can
contribute to forming Mg17Al12 in the eutectic [2], which is mainly located at the grain
boundaries, as shown in Figure 2.9(a). The eutectic phase increases as the aluminium content
increases towards the solubility limit. Once it reaches 44 wt.% Al, the Mg-44Al alloy mainly
consists of the Mg17Al12 intermetallic phase only [2], as shown in Figure 2.9(b). Another study
[123] also reported the α-Mg phase with a fully divorced eutectic α-Mg + Mg17Al12 phase in
HPDC AM50 (Mg-5Al-0.4Mn) alloy. There is also a Al8Mn5 phase with a polygonal
microstructure observed in this alloy [123], which is common for Mg-Al alloys that contain
some Mn.
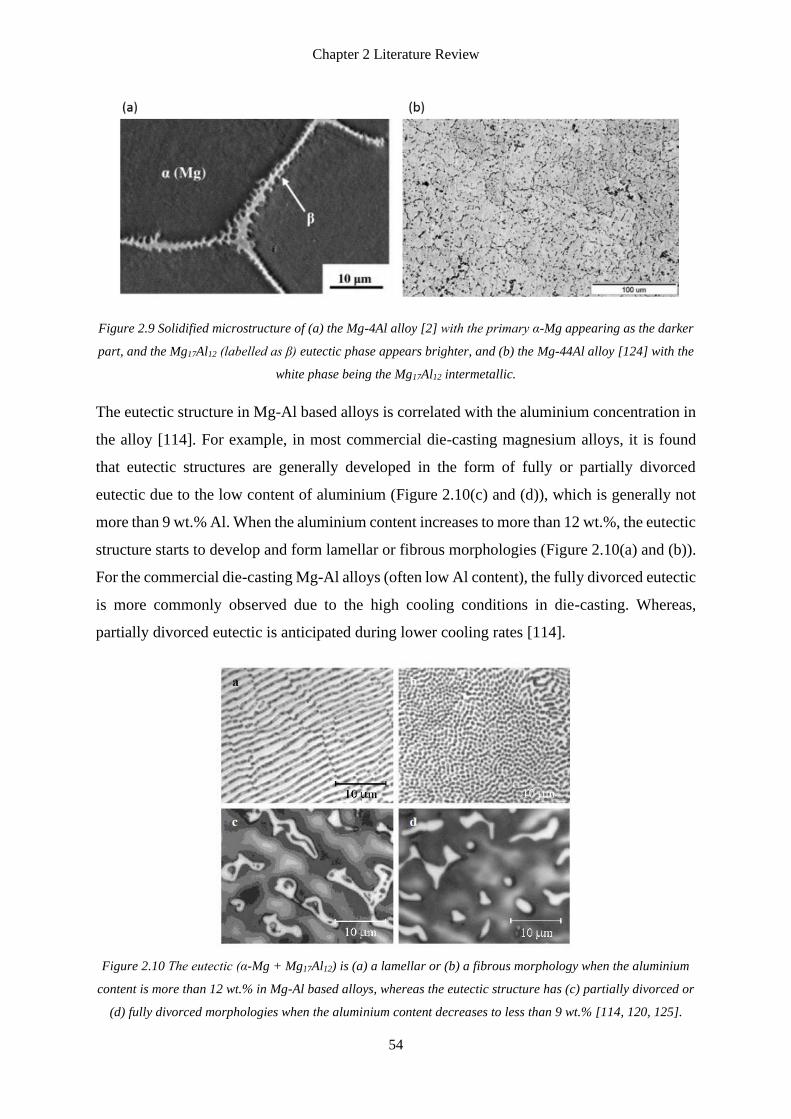
Chapter 2 Literature Review
54
Figure 2.9 Solidified microstructure of (a) the Mg-4Al alloy [2] with the primary α-Mg appearing as the darker
part, and the Mg17Al12 (labelled as β) eutectic phase appears brighter, and (b) the Mg-44Al alloy [124] with the
white phase being the Mg17Al12 intermetallic.
The eutectic structure in Mg-Al based alloys is correlated with the aluminium concentration in
the alloy [114]. For example, in most commercial die-casting magnesium alloys, it is found
that eutectic structures are generally developed in the form of fully or partially divorced
eutectic due to the low content of aluminium (Figure 2.10(c) and (d)), which is generally not
more than 9 wt.% Al. When the aluminium content increases to more than 12 wt.%, the eutectic
structure starts to develop and form lamellar or fibrous morphologies (Figure 2.10(a) and (b)).
For the commercial die-casting Mg-Al alloys (often low Al content), the fully divorced eutectic
is more commonly observed due to the high cooling conditions in die-casting. Whereas,
partially divorced eutectic is anticipated during lower cooling rates [114].
Figure 2.10 The eutectic (α-Mg + Mg17Al12) is (a) a lamellar or (b) a fibrous morphology when the aluminium
content is more than 12 wt.% in Mg-Al based alloys, whereas the eutectic structure has (c) partially divorced or
(d) fully divorced morphologies when the aluminium content decreases to less than 9 wt.% [114, 120, 125].
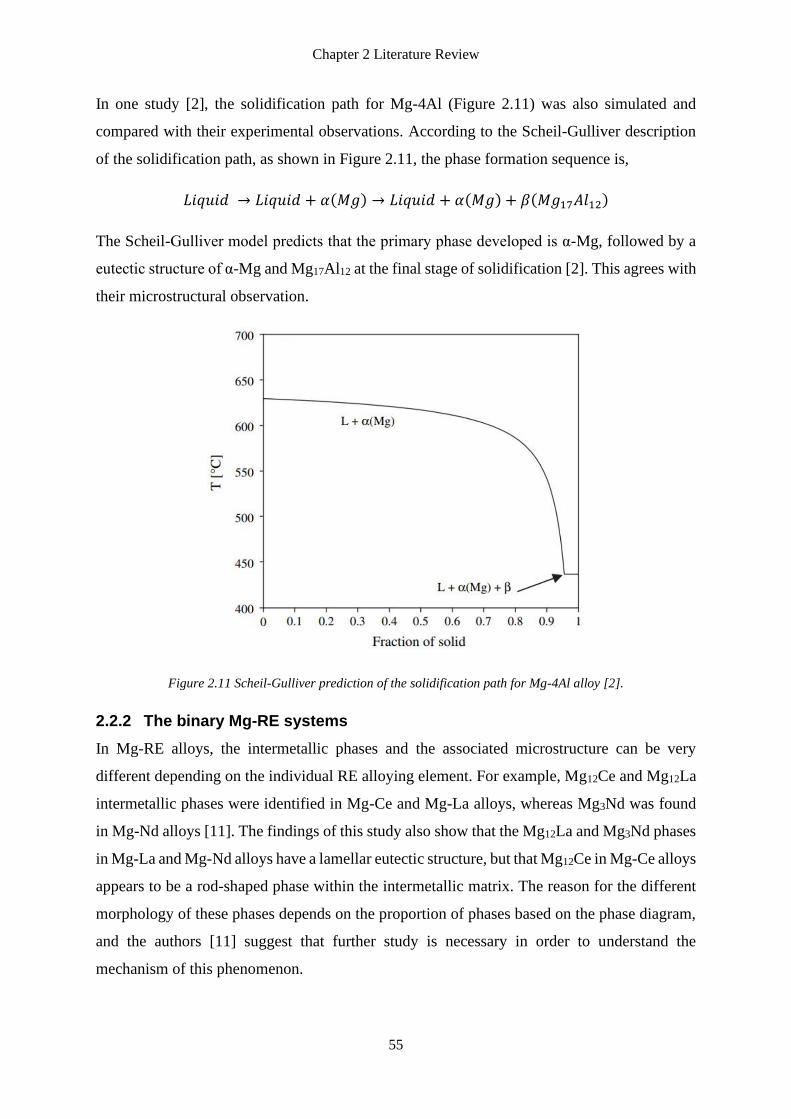
Chapter 2 Literature Review
55
In one study [2], the solidification path for Mg-4Al (Figure 2.11) was also simulated and
compared with their experimental observations. According to the Scheil-Gulliver description
of the solidification path, as shown in Figure 2.11, the phase formation sequence is,
𝐿𝑖𝑞𝑢𝑖𝑑 → 𝐿𝑖𝑞𝑢𝑖𝑑 + 𝛼(𝑀𝑔) → 𝐿𝑖𝑞𝑢𝑖𝑑 + 𝛼(𝑀𝑔) + 𝛽(𝑀𝑔17𝐴𝑙12)
The Scheil-Gulliver model predicts that the primary phase developed is α-Mg, followed by a
eutectic structure of α-Mg and Mg17Al12 at the final stage of solidification [2]. This agrees with
their microstructural observation.
Figure 2.11 Scheil-Gulliver prediction of the solidification path for Mg-4Al alloy [2].
2.2.2 The binary Mg-RE systems
In Mg-RE alloys, the intermetallic phases and the associated microstructure can be very
different depending on the individual RE alloying element. For example, Mg12Ce and Mg12La
intermetallic phases were identified in Mg-Ce and Mg-La alloys, whereas Mg3Nd was found
in Mg-Nd alloys [11]. The findings of this study also show that the Mg12La and Mg3Nd phases
in Mg-La and Mg-Nd alloys have a lamellar eutectic structure, but that Mg12Ce in Mg-Ce alloys
appears to be a rod-shaped phase within the intermetallic matrix. The reason for the different
morphology of these phases depends on the proportion of phases based on the phase diagram,
and the authors [11] suggest that further study is necessary in order to understand the
mechanism of this phenomenon.
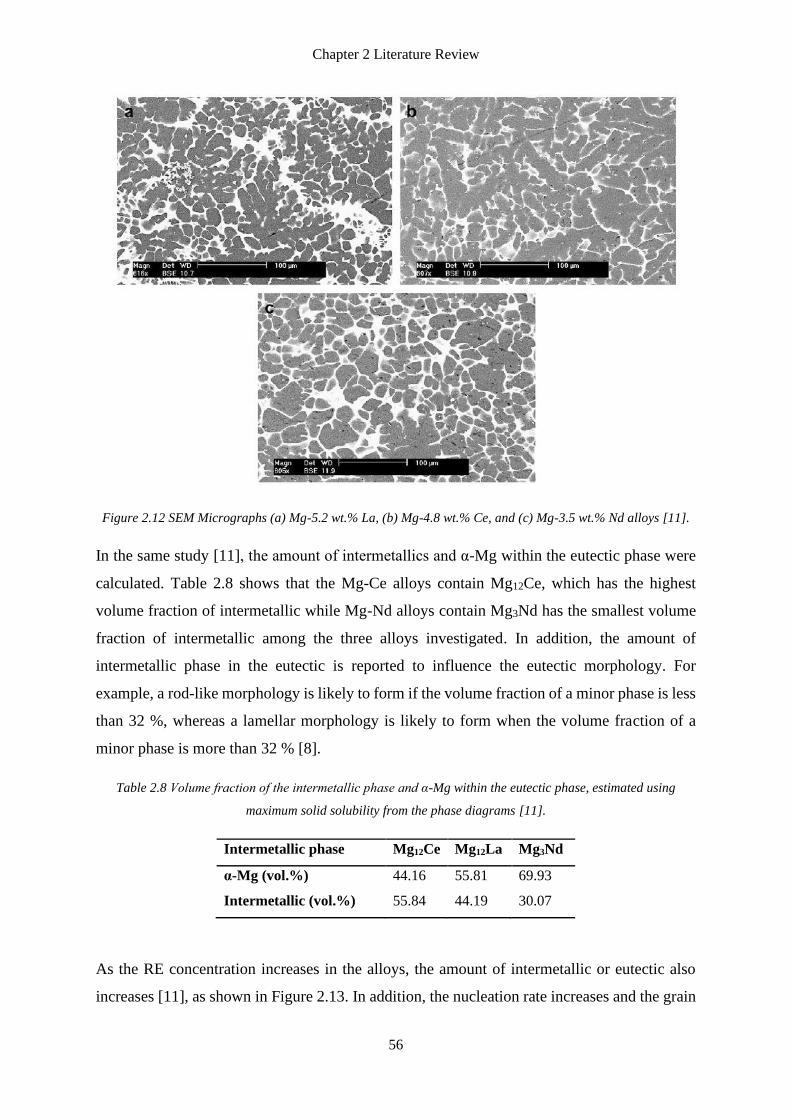
Chapter 2 Literature Review
56
Figure 2.12 SEM Micrographs (a) Mg-5.2 wt.% La, (b) Mg-4.8 wt.% Ce, and (c) Mg-3.5 wt.% Nd alloys [11].
In the same study [11], the amount of intermetallics and α-Mg within the eutectic phase were
calculated. Table 2.8 shows that the Mg-Ce alloys contain Mg12Ce, which has the highest
volume fraction of intermetallic while Mg-Nd alloys contain Mg3Nd has the smallest volume
fraction of intermetallic among the three alloys investigated. In addition, the amount of
intermetallic phase in the eutectic is reported to influence the eutectic morphology. For
example, a rod-like morphology is likely to form if the volume fraction of a minor phase is less
than 32 %, whereas a lamellar morphology is likely to form when the volume fraction of a
minor phase is more than 32 % [8].
Table 2.8 Volume fraction of the intermetallic phase and α-Mg within the eutectic phase, estimated using
maximum solid solubility from the phase diagrams [11].
Intermetallic phase Mg12Ce Mg12La Mg3Nd
α-Mg (vol.%) 44.16 55.81 69.93
Intermetallic (vol.%) 55.84 44.19 30.07
As the RE concentration increases in the alloys, the amount of intermetallic or eutectic also
increases [11], as shown in Figure 2.13. In addition, the nucleation rate increases and the grain
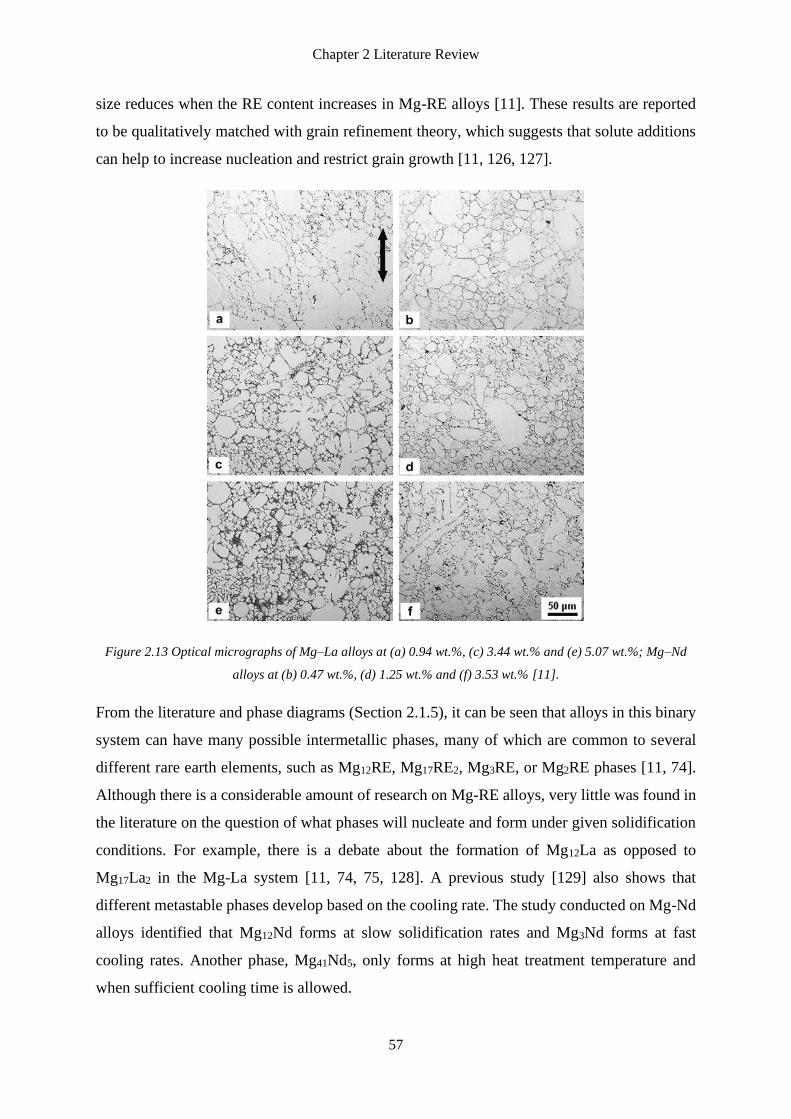
Chapter 2 Literature Review
57
size reduces when the RE content increases in Mg-RE alloys [11]. These results are reported
to be qualitatively matched with grain refinement theory, which suggests that solute additions
can help to increase nucleation and restrict grain growth [11, 126, 127].
Figure 2.13 Optical micrographs of Mg–La alloys at (a) 0.94 wt.%, (c) 3.44 wt.% and (e) 5.07 wt.%; Mg–Nd
alloys at (b) 0.47 wt.%, (d) 1.25 wt.% and (f) 3.53 wt.% [11].
From the literature and phase diagrams (Section 2.1.5), it can be seen that alloys in this binary
system can have many possible intermetallic phases, many of which are common to several
different rare earth elements, such as Mg12RE, Mg17RE2, Mg3RE, or Mg2RE phases [11, 74].
Although there is a considerable amount of research on Mg-RE alloys, very little was found in
the literature on the question of what phases will nucleate and form under given solidification
conditions. For example, there is a debate about the formation of Mg12La as opposed to
Mg17La2 in the Mg-La system [11, 74, 75, 128]. A previous study [129] also shows that
different metastable phases develop based on the cooling rate. The study conducted on Mg-Nd
alloys identified that Mg12Nd forms at slow solidification rates and Mg3Nd forms at fast
cooling rates. Another phase, Mg41Nd5, only forms at high heat treatment temperature and
when sufficient cooling time is allowed.

Chapter 2 Literature Review
58
2.2.3 The binary Al-RE systems
Compared to the binary Mg-Al and Mg-RE systems, there is relatively limited information in
the literature on the solidification and microstructure development in the Al-RE system.
Al11RE3 is a commonly reported phase in the binary Al-RE (and ternary Mg-Al-RE) systems.
In the literature, the microstructure evolution of die-cast Al-La alloys was investigated using
XRD, SEM and EDS by He et al. [130]. These authors investigated three alloys, Al-10La, Al-
15La and Al-20La, all of which consisted of α-Al and Al11La3, in agreement with the binary
Al-La phase diagram [95]. The Al-10La alloy is reported to be a hypo-eutectic alloy, whereas
the Al-15La and Al-20La alloys are hyper-eutectic. Figure 2.14 shows that the Al-10La alloy
mainly consists of α-Al + Al11La3 eutectic phase with a minimal amount of primary α-Al phase
because the α-Al phase field in the phase diagram is very narrow (Figure 2.7(b)). In the Al-
15La alloy, there is an additional laminar shaped primary Al11La3 phase. Lastly, the Al-20La
alloy shows a particle shaped primary Al11La3 phase.
Figure 2.14 As-cast microstructure of (a) Al-10La, (b) Al-15La and (c) Al-20La alloys [130].
In other studies [131, 132], it is interesting that the dendrites in an Al-35La alloy are composed
of two phases, α-Al and Al11La3 (Figure 2.15). The proposed description of these dendrites is
that the alternate nucleation of α-Al and Al11La3 results in the formation of a periodic diphase
dendrite structure (Figure 2.16). This finding is very different from the typical tree-like
dendrite, which is commonly composed of a single phase.
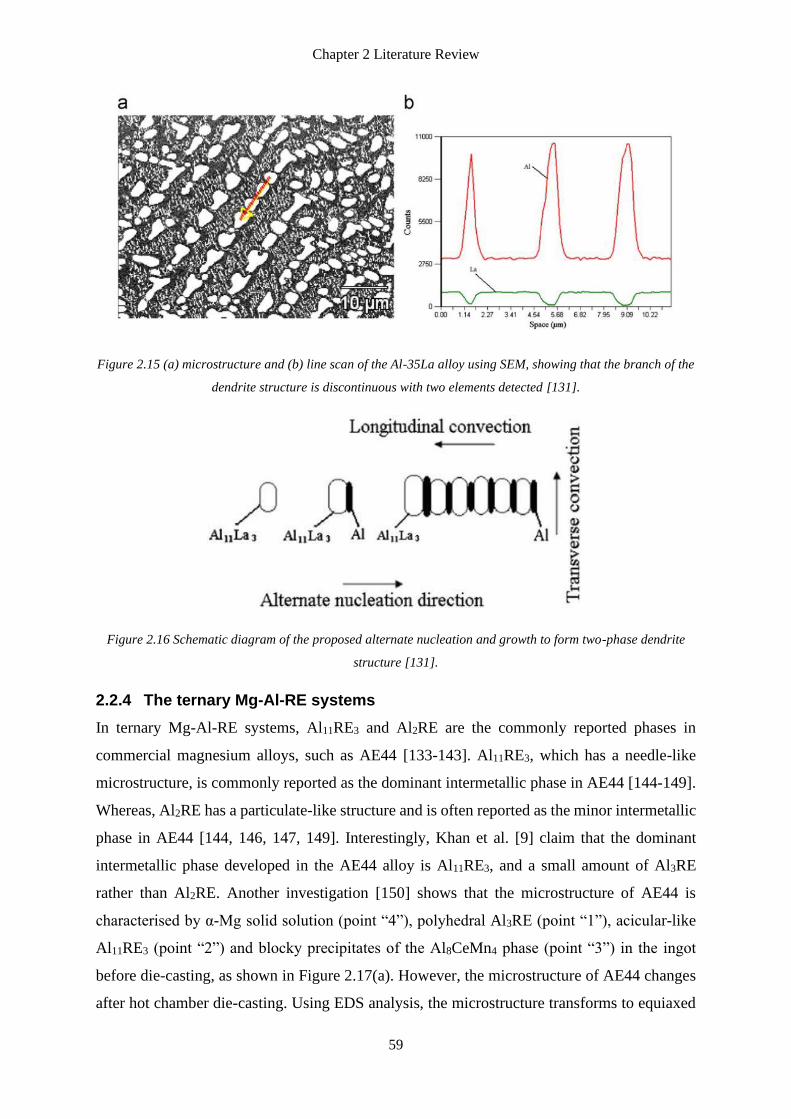
Chapter 2 Literature Review
59
Figure 2.15 (a) microstructure and (b) line scan of the Al-35La alloy using SEM, showing that the branch of the
dendrite structure is discontinuous with two elements detected [131].
Figure 2.16 Schematic diagram of the proposed alternate nucleation and growth to form two-phase dendrite
structure [131].
2.2.4 The ternary Mg-Al-RE systems
In ternary Mg-Al-RE systems, Al11RE3 and Al2RE are the commonly reported phases in
commercial magnesium alloys, such as AE44 [133-143]. Al11RE3, which has a needle-like
microstructure, is commonly reported as the dominant intermetallic phase in AE44 [144-149].
Whereas, Al2RE has a particulate-like structure and is often reported as the minor intermetallic
phase in AE44 [144, 146, 147, 149]. Interestingly, Khan et al. [9] claim that the dominant
intermetallic phase developed in the AE44 alloy is Al11RE3, and a small amount of Al3RE
rather than Al2RE. Another investigation [150] shows that the microstructure of AE44 is
characterised by α-Mg solid solution (point “4”), polyhedral Al3RE (point “1”), acicular-like
Al11RE3 (point “2”) and blocky precipitates of the Al8CeMn4 phase (point “3”) in the ingot
before die-casting, as shown in Figure 2.17(a). However, the microstructure of AE44 changes
after hot chamber die-casting. Using EDS analysis, the microstructure transforms to equiaxed
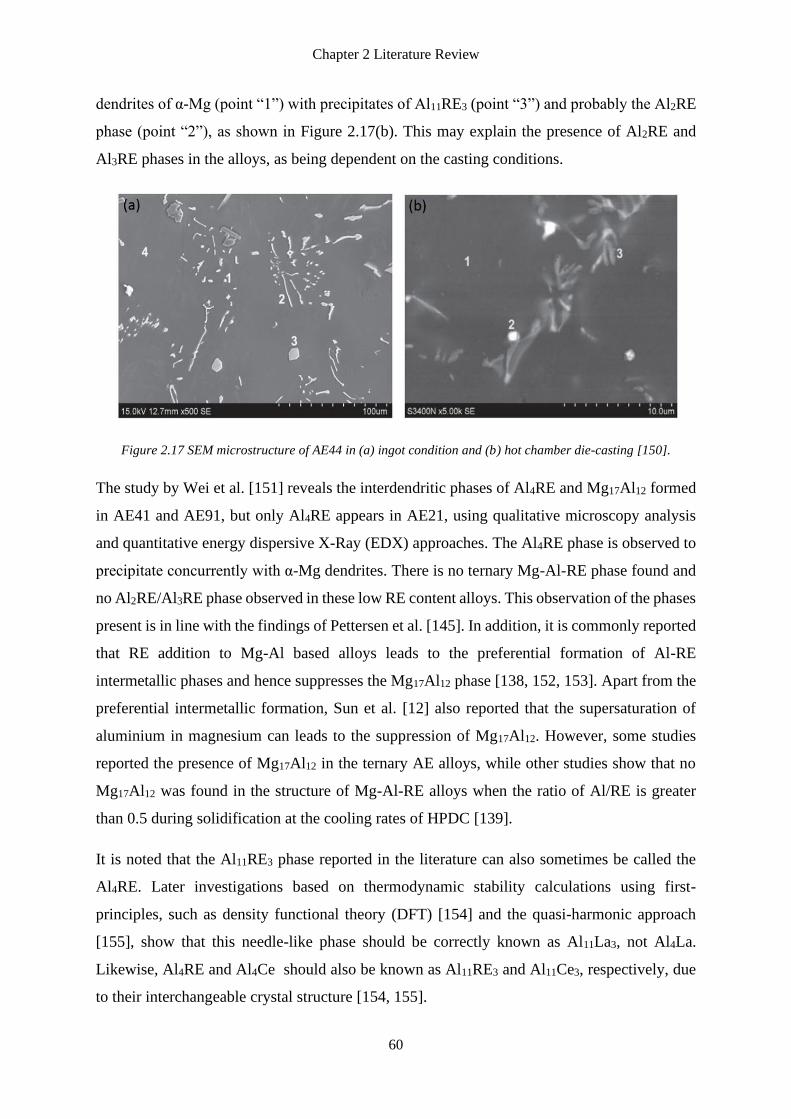
Chapter 2 Literature Review
60
dendrites of α-Mg (point “1”) with precipitates of Al11RE3 (point “3”) and probably the Al2RE
phase (point “2”), as shown in Figure 2.17(b). This may explain the presence of Al2RE and
Al3RE phases in the alloys, as being dependent on the casting conditions.
Figure 2.17 SEM microstructure of AE44 in (a) ingot condition and (b) hot chamber die-casting [150].
The study by Wei et al. [151] reveals the interdendritic phases of Al4RE and Mg17Al12 formed
in AE41 and AE91, but only Al4RE appears in AE21, using qualitative microscopy analysis
and quantitative energy dispersive X-Ray (EDX) approaches. The Al4RE phase is observed to
precipitate concurrently with α-Mg dendrites. There is no ternary Mg-Al-RE phase found and
no Al2RE/Al3RE phase observed in these low RE content alloys. This observation of the phases
present is in line with the findings of Pettersen et al. [145]. In addition, it is commonly reported
that RE addition to Mg-Al based alloys leads to the preferential formation of Al-RE
intermetallic phases and hence suppresses the Mg17Al12 phase [138, 152, 153]. Apart from the
preferential intermetallic formation, Sun et al. [12] also reported that the supersaturation of
aluminium in magnesium can leads to the suppression of Mg17Al12. However, some studies
reported the presence of Mg17Al12 in the ternary AE alloys, while other studies show that no
Mg17Al12 was found in the structure of Mg-Al-RE alloys when the ratio of Al/RE is greater
than 0.5 during solidification at the cooling rates of HPDC [139].
It is noted that the Al11RE3 phase reported in the literature can also sometimes be called the
Al4RE. Later investigations based on thermodynamic stability calculations using first-
principles, such as density functional theory (DFT) [154] and the quasi-harmonic approach
[155], show that this needle-like phase should be correctly known as Al11La3, not Al4La.
Likewise, Al4RE and Al4Ce should also be known as Al11RE3 and Al11Ce3, respectively, due
to their interchangeable crystal structure [154, 155].
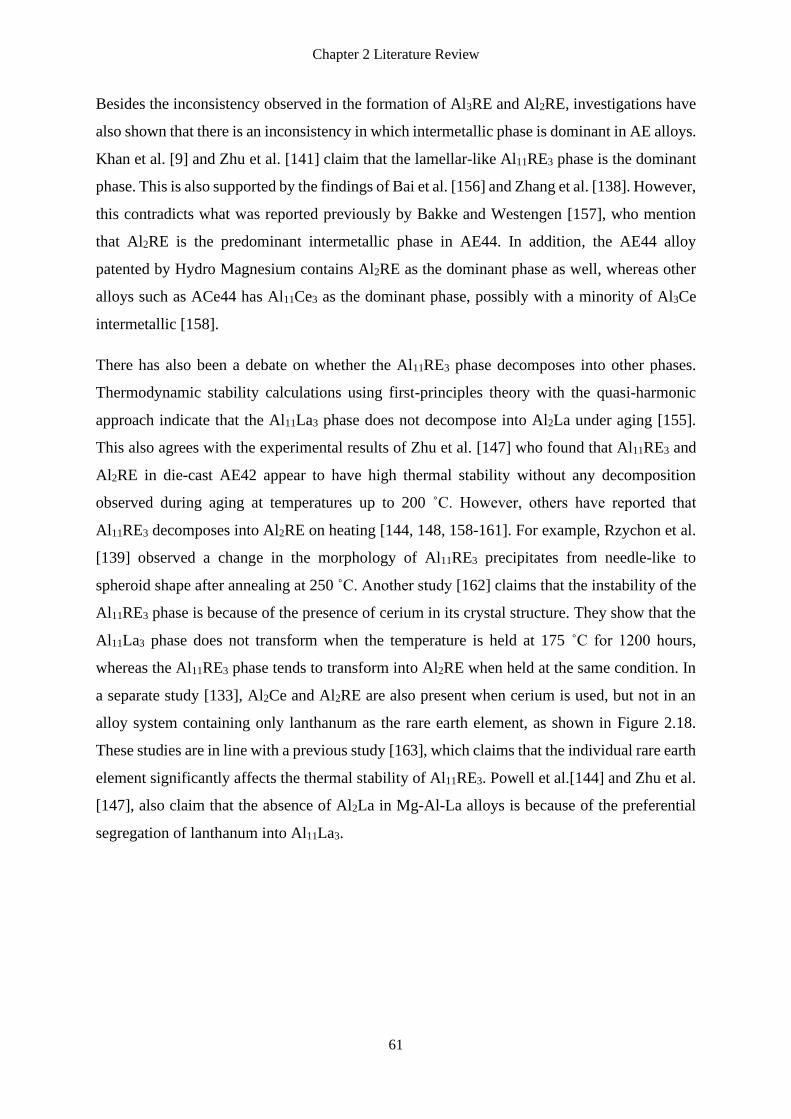
Chapter 2 Literature Review
61
Besides the inconsistency observed in the formation of Al3RE and Al2RE, investigations have
also shown that there is an inconsistency in which intermetallic phase is dominant in AE alloys.
Khan et al. [9] and Zhu et al. [141] claim that the lamellar-like Al11RE3 phase is the dominant
phase. This is also supported by the findings of Bai et al. [156] and Zhang et al. [138]. However,
this contradicts what was reported previously by Bakke and Westengen [157], who mention
that Al2RE is the predominant intermetallic phase in AE44. In addition, the AE44 alloy
patented by Hydro Magnesium contains Al2RE as the dominant phase as well, whereas other
alloys such as ACe44 has Al11Ce3 as the dominant phase, possibly with a minority of Al3Ce
intermetallic [158].
There has also been a debate on whether the Al11RE3 phase decomposes into other phases.
Thermodynamic stability calculations using first-principles theory with the quasi-harmonic
approach indicate that the Al11La3 phase does not decompose into Al2La under aging [155].
This also agrees with the experimental results of Zhu et al. [147] who found that Al11RE3 and
Al2RE in die-cast AE42 appear to have high thermal stability without any decomposition
observed during aging at temperatures up to 200 ˚C. However, others have reported that
Al11RE3 decomposes into Al2RE on heating [144, 148, 158-161]. For example, Rzychon et al.
[139] observed a change in the morphology of Al11RE3 precipitates from needle-like to
spheroid shape after annealing at 250 ˚C. Another study [162] claims that the instability of the
Al11RE3 phase is because of the presence of cerium in its crystal structure. They show that the
Al11La3 phase does not transform when the temperature is held at 175 ˚C for 1200 hours,
whereas the Al11RE3 phase tends to transform into Al2RE when held at the same condition. In
a separate study [133], Al2Ce and Al2RE are also present when cerium is used, but not in an
alloy system containing only lanthanum as the rare earth element, as shown in Figure 2.18.
These studies are in line with a previous study [163], which claims that the individual rare earth
element significantly affects the thermal stability of Al11RE3. Powell et al.[144] and Zhu et al.
[147], also claim that the absence of Al2La in Mg-Al-La alloys is because of the preferential
segregation of lanthanum into Al11La3.
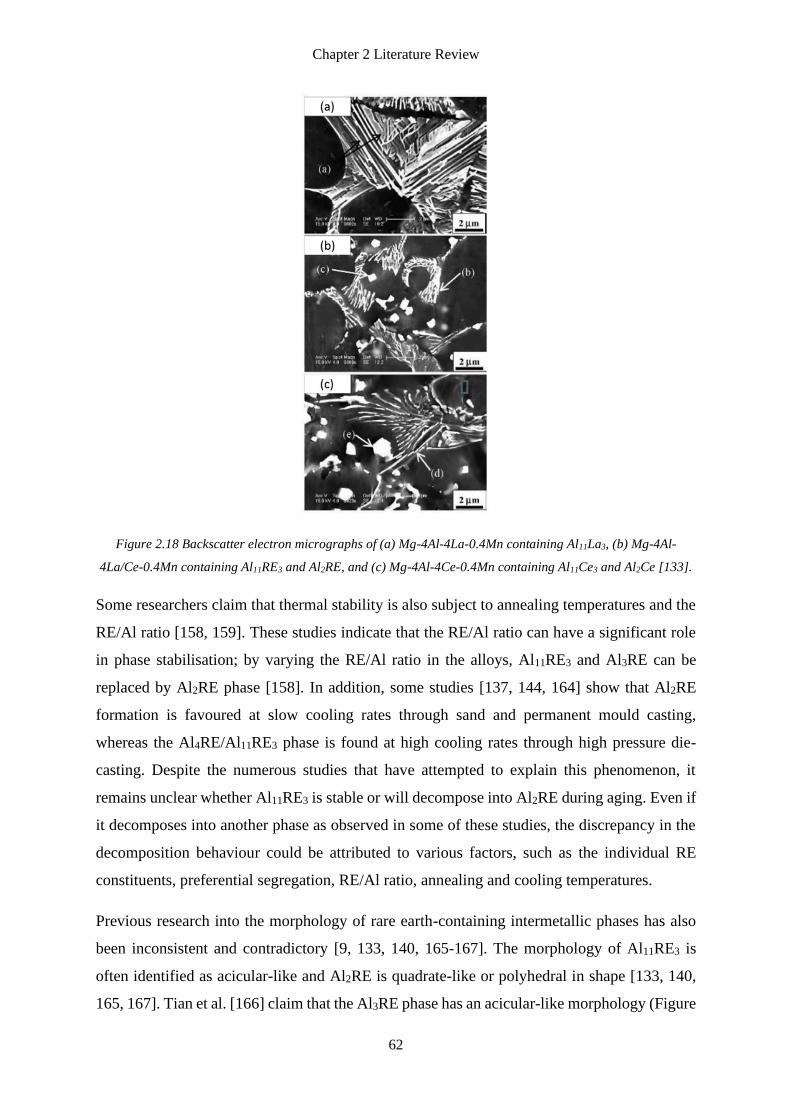
Chapter 2 Literature Review
62
Figure 2.18 Backscatter electron micrographs of (a) Mg-4Al-4La-0.4Mn containing Al11La3, (b) Mg-4Al-
4La/Ce-0.4Mn containing Al11RE3 and Al2RE, and (c) Mg-4Al-4Ce-0.4Mn containing Al11Ce3 and Al2Ce [133].
Some researchers claim that thermal stability is also subject to annealing temperatures and the
RE/Al ratio [158, 159]. These studies indicate that the RE/Al ratio can have a significant role
in phase stabilisation; by varying the RE/Al ratio in the alloys, Al11RE3 and Al3RE can be
replaced by Al2RE phase [158]. In addition, some studies [137, 144, 164] show that Al2RE
formation is favoured at slow cooling rates through sand and permanent mould casting,
whereas the Al4RE/Al11RE3 phase is found at high cooling rates through high pressure die-
casting. Despite the numerous studies that have attempted to explain this phenomenon, it
remains unclear whether Al11RE3 is stable or will decompose into Al2RE during aging. Even if
it decomposes into another phase as observed in some of these studies, the discrepancy in the
decomposition behaviour could be attributed to various factors, such as the individual RE
constituents, preferential segregation, RE/Al ratio, annealing and cooling temperatures.
Previous research into the morphology of rare earth-containing intermetallic phases has also
been inconsistent and contradictory [9, 133, 140, 165-167]. The morphology of Al11RE3 is
often identified as acicular-like and Al2RE is quadrate-like or polyhedral in shape [133, 140,
165, 167]. Tian et al. [166] claim that the Al3RE phase has an acicular-like morphology (Figure
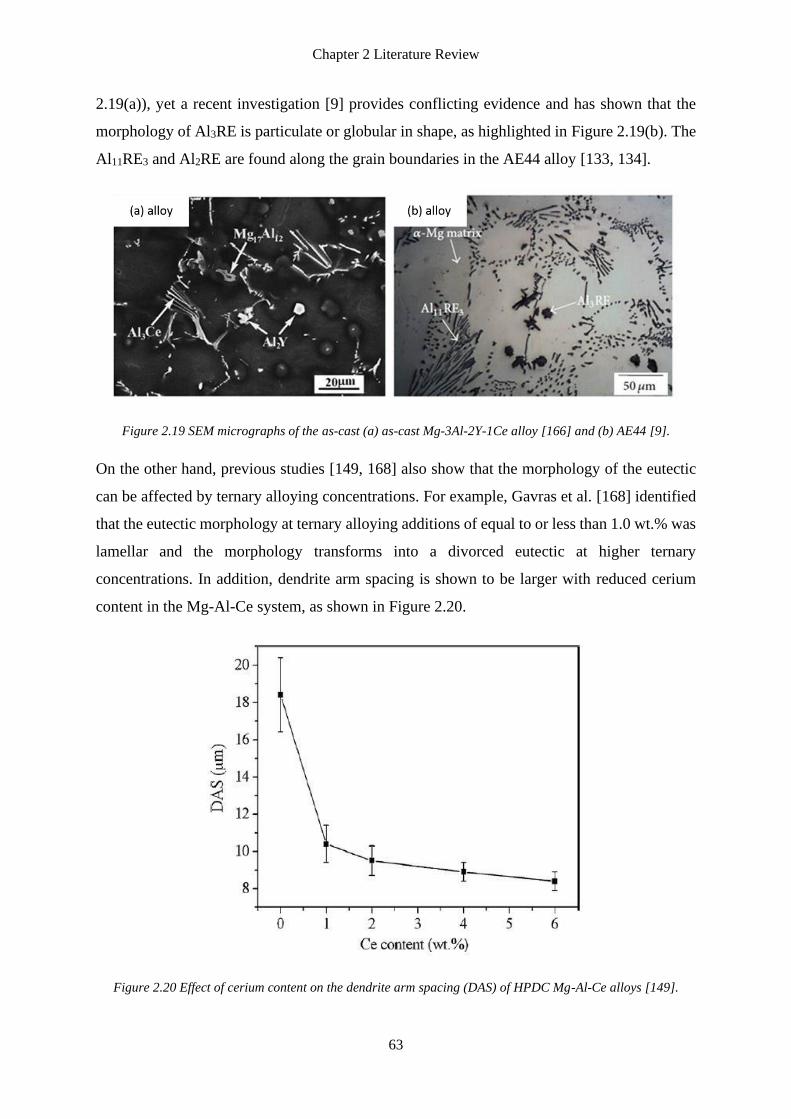
Chapter 2 Literature Review
63
2.19(a)), yet a recent investigation [9] provides conflicting evidence and has shown that the
morphology of Al3RE is particulate or globular in shape, as highlighted in Figure 2.19(b). The
Al11RE3 and Al2RE are found along the grain boundaries in the AE44 alloy [133, 134].
Figure 2.19 SEM micrographs of the as-cast (a) as-cast Mg-3Al-2Y-1Ce alloy [166] and (b) AE44 [9].
On the other hand, previous studies [149, 168] also show that the morphology of the eutectic
can be affected by ternary alloying concentrations. For example, Gavras et al. [168] identified
that the eutectic morphology at ternary alloying additions of equal to or less than 1.0 wt.% was
lamellar and the morphology transforms into a divorced eutectic at higher ternary
concentrations. In addition, dendrite arm spacing is shown to be larger with reduced cerium
content in the Mg-Al-Ce system, as shown in Figure 2.20.
Figure 2.20 Effect of cerium content on the dendrite arm spacing (DAS) of HPDC Mg-Al-Ce alloys [149].
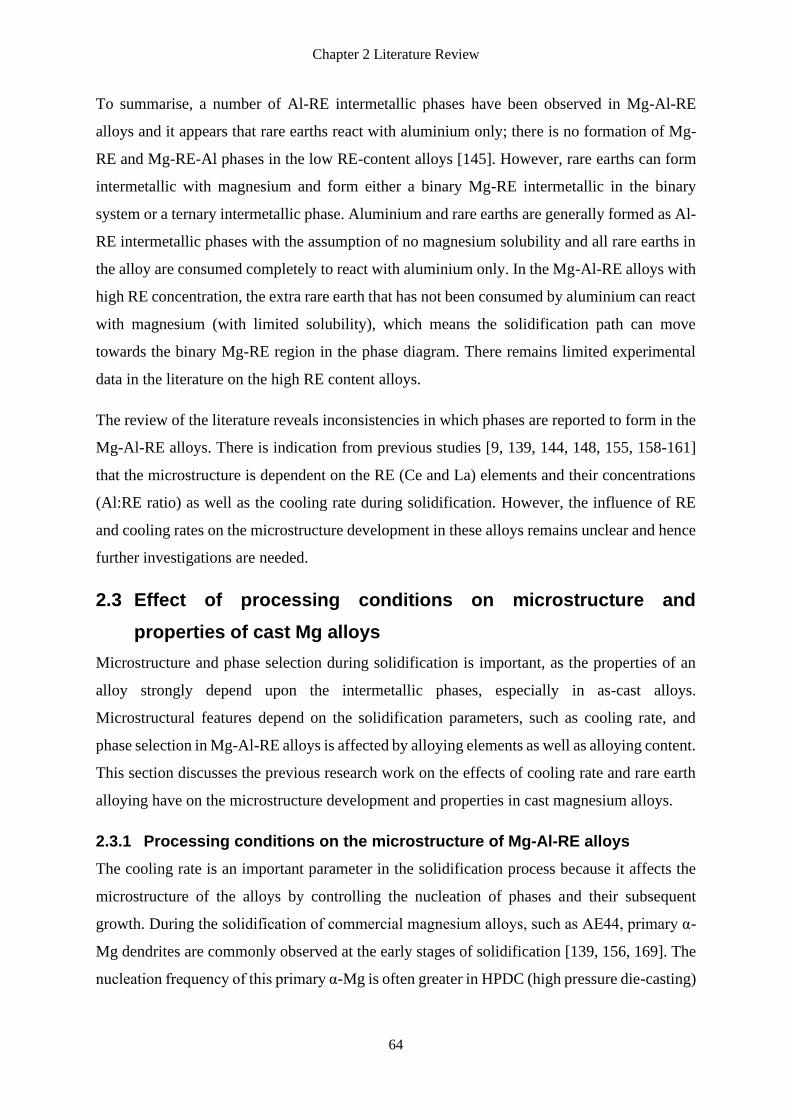
Chapter 2 Literature Review
64
To summarise, a number of Al-RE intermetallic phases have been observed in Mg-Al-RE
alloys and it appears that rare earths react with aluminium only; there is no formation of Mg-
RE and Mg-RE-Al phases in the low RE-content alloys [145]. However, rare earths can form
intermetallic with magnesium and form either a binary Mg-RE intermetallic in the binary
system or a ternary intermetallic phase. Aluminium and rare earths are generally formed as Al-
RE intermetallic phases with the assumption of no magnesium solubility and all rare earths in
the alloy are consumed completely to react with aluminium only. In the Mg-Al-RE alloys with
high RE concentration, the extra rare earth that has not been consumed by aluminium can react
with magnesium (with limited solubility), which means the solidification path can move
towards the binary Mg-RE region in the phase diagram. There remains limited experimental
data in the literature on the high RE content alloys.
The review of the literature reveals inconsistencies in which phases are reported to form in the
Mg-Al-RE alloys. There is indication from previous studies [9, 139, 144, 148, 155, 158-161]
that the microstructure is dependent on the RE (Ce and La) elements and their concentrations
(Al:RE ratio) as well as the cooling rate during solidification. However, the influence of RE
and cooling rates on the microstructure development in these alloys remains unclear and hence
further investigations are needed.
2.3 Effect of processing conditions on microstructure and
properties of cast Mg alloys
Microstructure and phase selection during solidification is important, as the properties of an
alloy strongly depend upon the intermetallic phases, especially in as-cast alloys.
Microstructural features depend on the solidification parameters, such as cooling rate, and
phase selection in Mg-Al-RE alloys is affected by alloying elements as well as alloying content.
This section discusses the previous research work on the effects of cooling rate and rare earth
alloying have on the microstructure development and properties in cast magnesium alloys.
2.3.1 Processing conditions on the microstructure of Mg-Al-RE alloys
The cooling rate is an important parameter in the solidification process because it affects the
microstructure of the alloys by controlling the nucleation of phases and their subsequent
growth. During the solidification of commercial magnesium alloys, such as AE44, primary α-
Mg dendrites are commonly observed at the early stages of solidification [139, 156, 169]. The
nucleation frequency of this primary α-Mg is often greater in HPDC (high pressure die-casting)
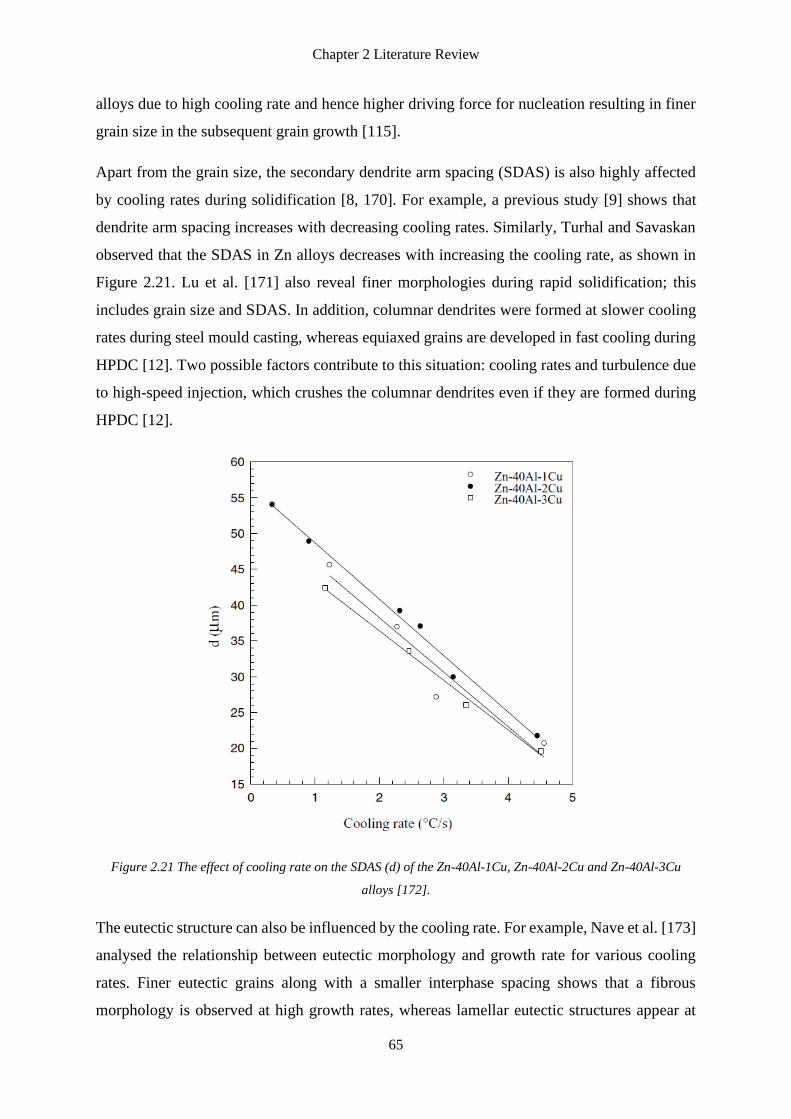
Chapter 2 Literature Review
65
alloys due to high cooling rate and hence higher driving force for nucleation resulting in finer
grain size in the subsequent grain growth [115].
Apart from the grain size, the secondary dendrite arm spacing (SDAS) is also highly affected
by cooling rates during solidification [8, 170]. For example, a previous study [9] shows that
dendrite arm spacing increases with decreasing cooling rates. Similarly, Turhal and Savaskan
observed that the SDAS in Zn alloys decreases with increasing the cooling rate, as shown in
Figure 2.21. Lu et al. [171] also reveal finer morphologies during rapid solidification; this
includes grain size and SDAS. In addition, columnar dendrites were formed at slower cooling
rates during steel mould casting, whereas equiaxed grains are developed in fast cooling during
HPDC [12]. Two possible factors contribute to this situation: cooling rates and turbulence due
to high-speed injection, which crushes the columnar dendrites even if they are formed during
HPDC [12].
Figure 2.21 The effect of cooling rate on the SDAS (d) of the Zn-40Al-1Cu, Zn-40Al-2Cu and Zn-40Al-3Cu
alloys [172].
The eutectic structure can also be influenced by the cooling rate. For example, Nave et al. [173]
analysed the relationship between eutectic morphology and growth rate for various cooling
rates. Finer eutectic grains along with a smaller interphase spacing shows that a fibrous
morphology is observed at high growth rates, whereas lamellar eutectic structures appear at
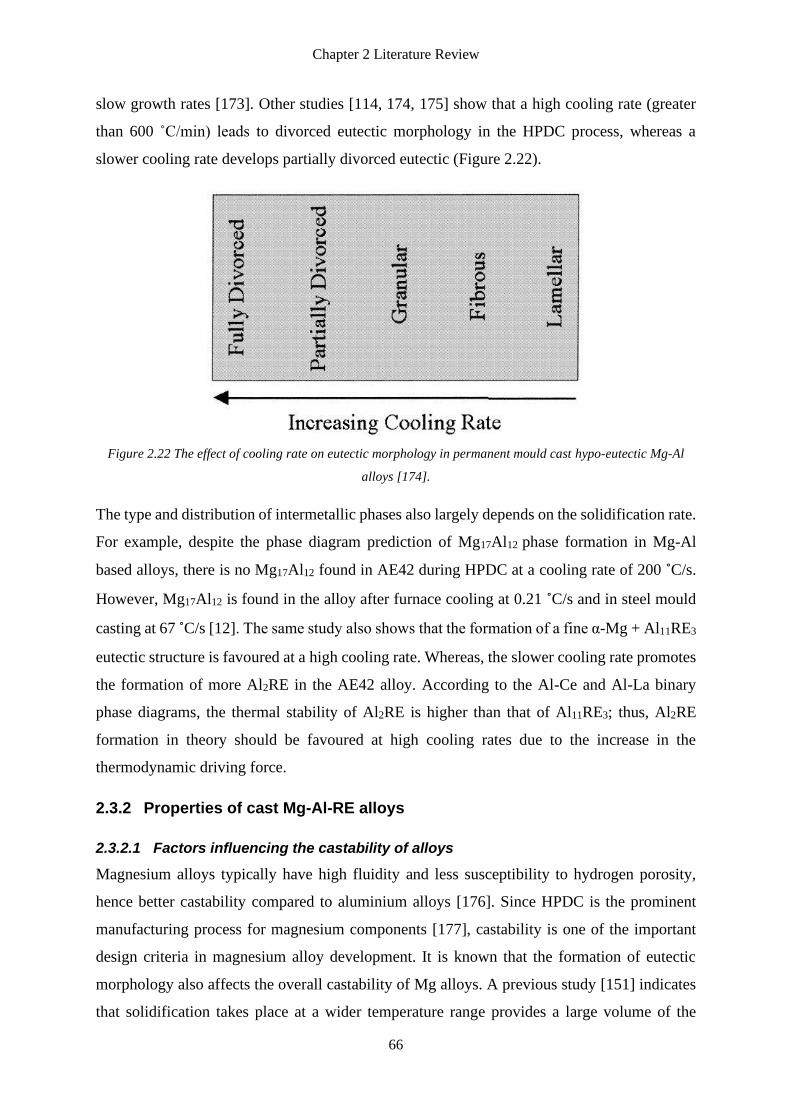
Chapter 2 Literature Review
66
slow growth rates [173]. Other studies [114, 174, 175] show that a high cooling rate (greater
than 600 ˚C/min) leads to divorced eutectic morphology in the HPDC process, whereas a
slower cooling rate develops partially divorced eutectic (Figure 2.22).
Figure 2.22 The effect of cooling rate on eutectic morphology in permanent mould cast hypo-eutectic Mg-Al
alloys [174].
The type and distribution of intermetallic phases also largely depends on the solidification rate.
For example, despite the phase diagram prediction of Mg17Al12 phase formation in Mg-Al
based alloys, there is no Mg17Al12 found in AE42 during HPDC at a cooling rate of 200 ˚C/s.
However, Mg17Al12 is found in the alloy after furnace cooling at 0.21 ˚C/s and in steel mould
casting at 67 ˚C/s [12]. The same study also shows that the formation of a fine α-Mg + Al11RE3
eutectic structure is favoured at a high cooling rate. Whereas, the slower cooling rate promotes
the formation of more Al2RE in the AE42 alloy. According to the Al-Ce and Al-La binary
phase diagrams, the thermal stability of Al2RE is higher than that of Al11RE3; thus, Al2RE
formation in theory should be favoured at high cooling rates due to the increase in the
thermodynamic driving force.
2.3.2 Properties of cast Mg-Al-RE alloys
2.3.2.1 Factors influencing the castability of alloys
Magnesium alloys typically have high fluidity and less susceptibility to hydrogen porosity,
hence better castability compared to aluminium alloys [176]. Since HPDC is the prominent
manufacturing process for magnesium components [177], castability is one of the important
design criteria in magnesium alloy development. It is known that the formation of eutectic
morphology also affects the overall castability of Mg alloys. A previous study [151] indicates
that solidification takes place at a wider temperature range provides a large volume of the
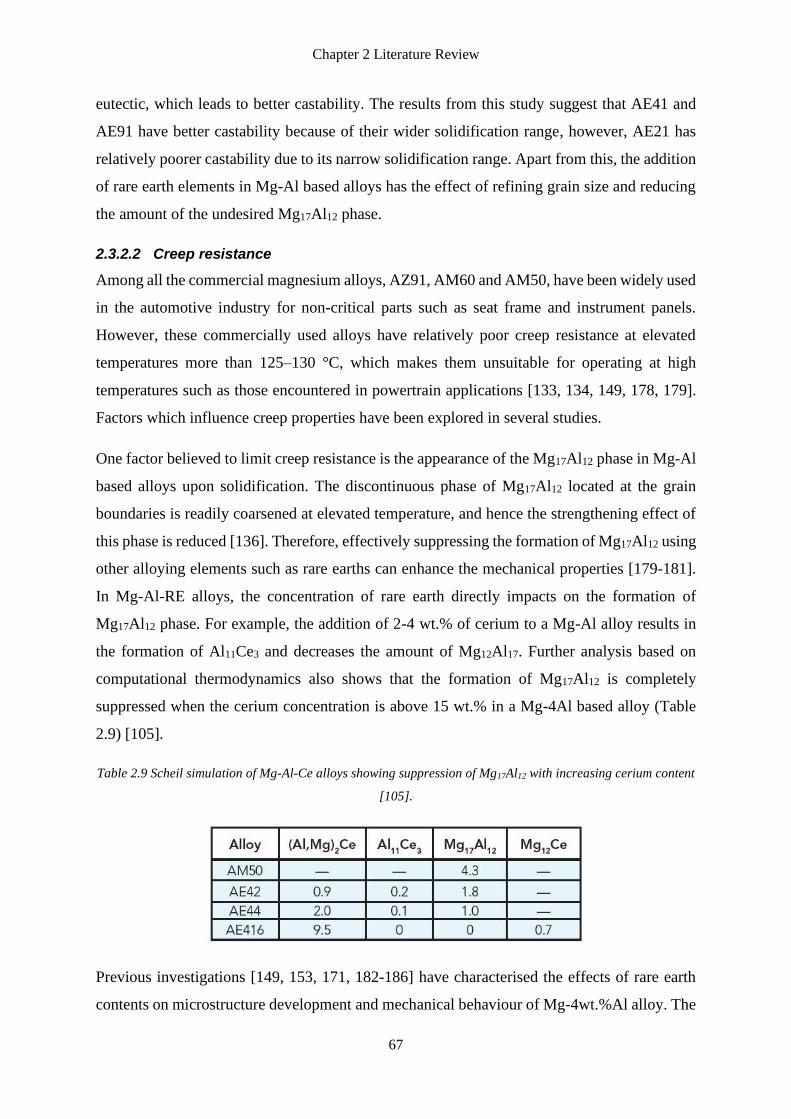
Chapter 2 Literature Review
67
eutectic, which leads to better castability. The results from this study suggest that AE41 and
AE91 have better castability because of their wider solidification range, however, AE21 has
relatively poorer castability due to its narrow solidification range. Apart from this, the addition
of rare earth elements in Mg-Al based alloys has the effect of refining grain size and reducing
the amount of the undesired Mg17Al12 phase.
2.3.2.2 Creep resistance
Among all the commercial magnesium alloys, AZ91, AM60 and AM50, have been widely used
in the automotive industry for non-critical parts such as seat frame and instrument panels.
However, these commercially used alloys have relatively poor creep resistance at elevated
temperatures more than 125–130 °C, which makes them unsuitable for operating at high
temperatures such as those encountered in powertrain applications [133, 134, 149, 178, 179].
Factors which influence creep properties have been explored in several studies.
One factor believed to limit creep resistance is the appearance of the Mg17Al12 phase in Mg-Al
based alloys upon solidification. The discontinuous phase of Mg17Al12 located at the grain
boundaries is readily coarsened at elevated temperature, and hence the strengthening effect of
this phase is reduced [136]. Therefore, effectively suppressing the formation of Mg17Al12 using
other alloying elements such as rare earths can enhance the mechanical properties [179-181].
In Mg-Al-RE alloys, the concentration of rare earth directly impacts on the formation of
Mg17Al12 phase. For example, the addition of 2-4 wt.% of cerium to a Mg-Al alloy results in
the formation of Al11Ce3 and decreases the amount of Mg12Al17. Further analysis based on
computational thermodynamics also shows that the formation of Mg17Al12 is completely
suppressed when the cerium concentration is above 15 wt.% in a Mg-4Al based alloy (Table
2.9) [105].
Table 2.9 Scheil simulation of Mg-Al-Ce alloys showing suppression of Mg17Al12 with increasing cerium content
[105].
Previous investigations [149, 153, 171, 182-186] have characterised the effects of rare earth
contents on microstructure development and mechanical behaviour of Mg-4wt.%Al alloy. The
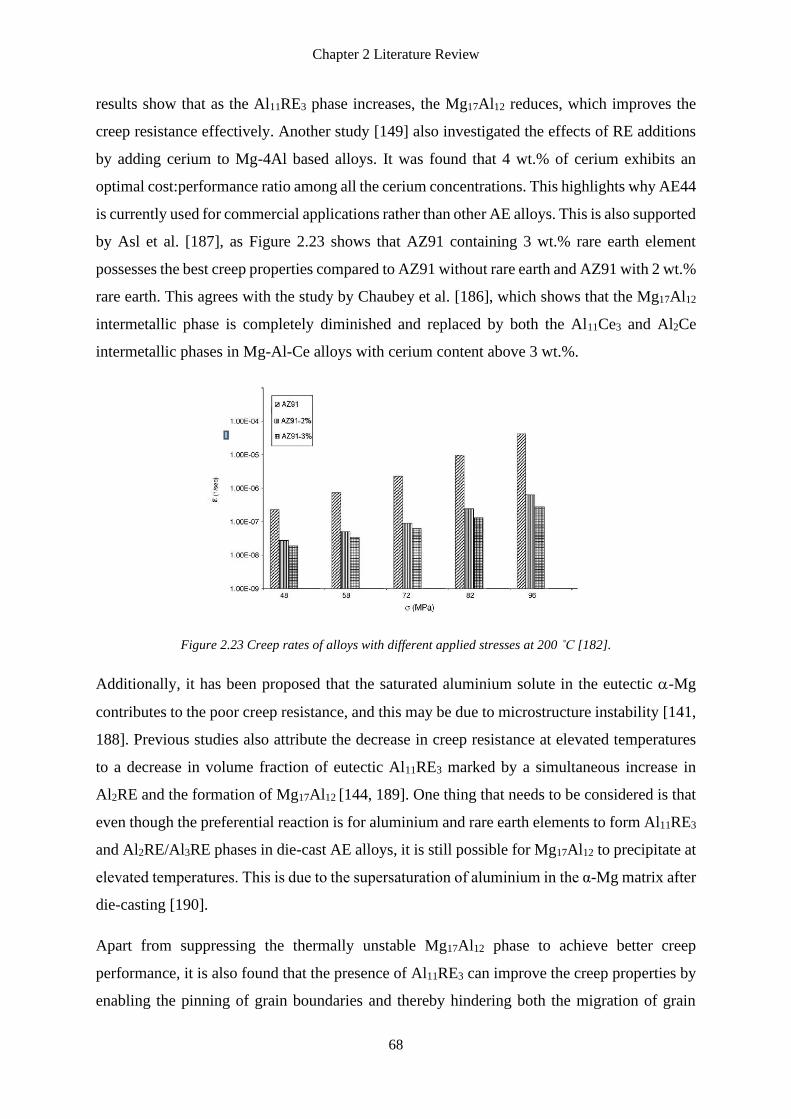
Chapter 2 Literature Review
68
results show that as the Al11RE3 phase increases, the Mg17Al12 reduces, which improves the
creep resistance effectively. Another study [149] also investigated the effects of RE additions
by adding cerium to Mg-4Al based alloys. It was found that 4 wt.% of cerium exhibits an
optimal cost:performance ratio among all the cerium concentrations. This highlights why AE44
is currently used for commercial applications rather than other AE alloys. This is also supported
by Asl et al. [187], as Figure 2.23 shows that AZ91 containing 3 wt.% rare earth element
possesses the best creep properties compared to AZ91 without rare earth and AZ91 with 2 wt.%
rare earth. This agrees with the study by Chaubey et al. [186], which shows that the Mg17Al12
intermetallic phase is completely diminished and replaced by both the Al11Ce3 and Al2Ce
intermetallic phases in Mg-Al-Ce alloys with cerium content above 3 wt.%.
Figure 2.23 Creep rates of alloys with different applied stresses at 200 ˚C [182].
Additionally, it has been proposed that the saturated aluminium solute in the eutectic -Mg
contributes to the poor creep resistance, and this may be due to microstructure instability [141,
188]. Previous studies also attribute the decrease in creep resistance at elevated temperatures
to a decrease in volume fraction of eutectic Al11RE3 marked by a simultaneous increase in
Al2RE and the formation of Mg17Al12 [144, 189]. One thing that needs to be considered is that
even though the preferential reaction is for aluminium and rare earth elements to form Al11RE3
and Al2RE/Al3RE phases in die-cast AE alloys, it is still possible for Mg17Al12 to precipitate at
elevated temperatures. This is due to the supersaturation of aluminium in the α-Mg matrix after
die-casting [190].
Apart from suppressing the thermally unstable Mg17Al12 phase to achieve better creep
performance, it is also found that the presence of Al11RE3 can improve the creep properties by
enabling the pinning of grain boundaries and thereby hindering both the migration of grain
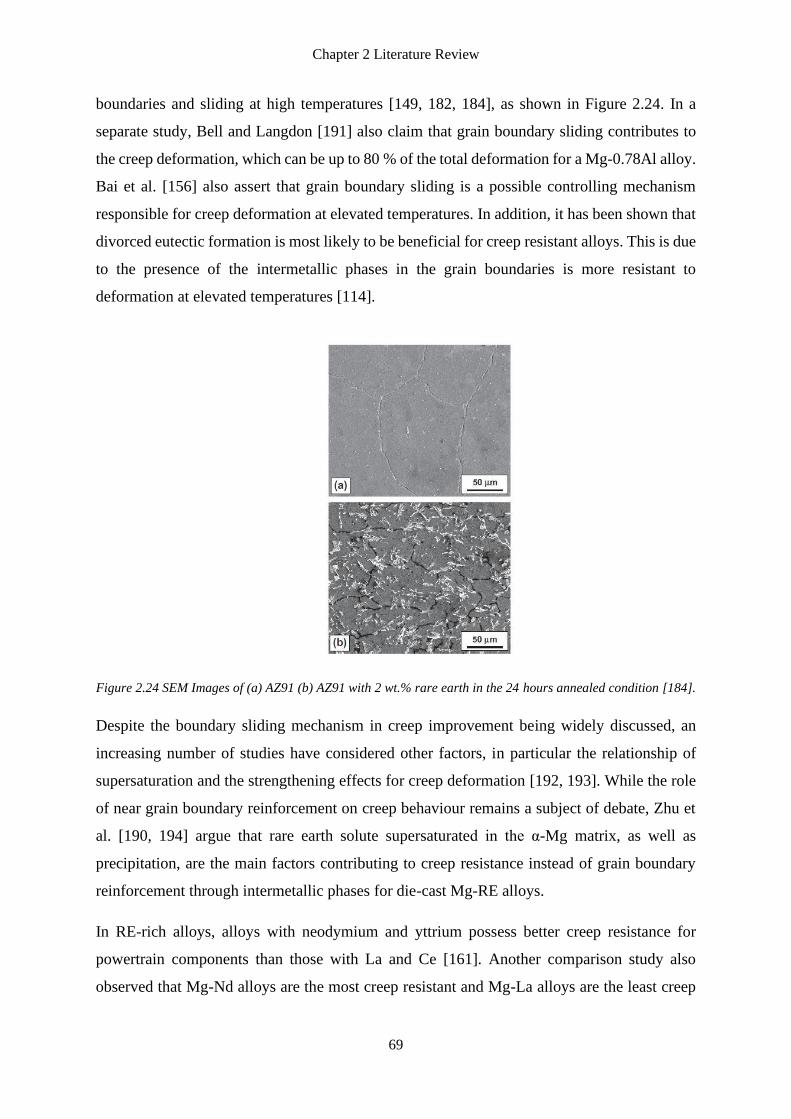
Chapter 2 Literature Review
69
boundaries and sliding at high temperatures [149, 182, 184], as shown in Figure 2.24. In a
separate study, Bell and Langdon [191] also claim that grain boundary sliding contributes to
the creep deformation, which can be up to 80 % of the total deformation for a Mg-0.78Al alloy.
Bai et al. [156] also assert that grain boundary sliding is a possible controlling mechanism
responsible for creep deformation at elevated temperatures. In addition, it has been shown that
divorced eutectic formation is most likely to be beneficial for creep resistant alloys. This is due
to the presence of the intermetallic phases in the grain boundaries is more resistant to
deformation at elevated temperatures [114].
Figure 2.24 SEM Images of (a) AZ91 (b) AZ91 with 2 wt.% rare earth in the 24 hours annealed condition [184].
Despite the boundary sliding mechanism in creep improvement being widely discussed, an
increasing number of studies have considered other factors, in particular the relationship of
supersaturation and the strengthening effects for creep deformation [192, 193]. While the role
of near grain boundary reinforcement on creep behaviour remains a subject of debate, Zhu et
al. [190, 194] argue that rare earth solute supersaturated in the α-Mg matrix, as well as
precipitation, are the main factors contributing to creep resistance instead of grain boundary
reinforcement through intermetallic phases for die-cast Mg-RE alloys.
In RE-rich alloys, alloys with neodymium and yttrium possess better creep resistance for
powertrain components than those with La and Ce [161]. Another comparison study also
observed that Mg-Nd alloys are the most creep resistant and Mg-La alloys are the least creep
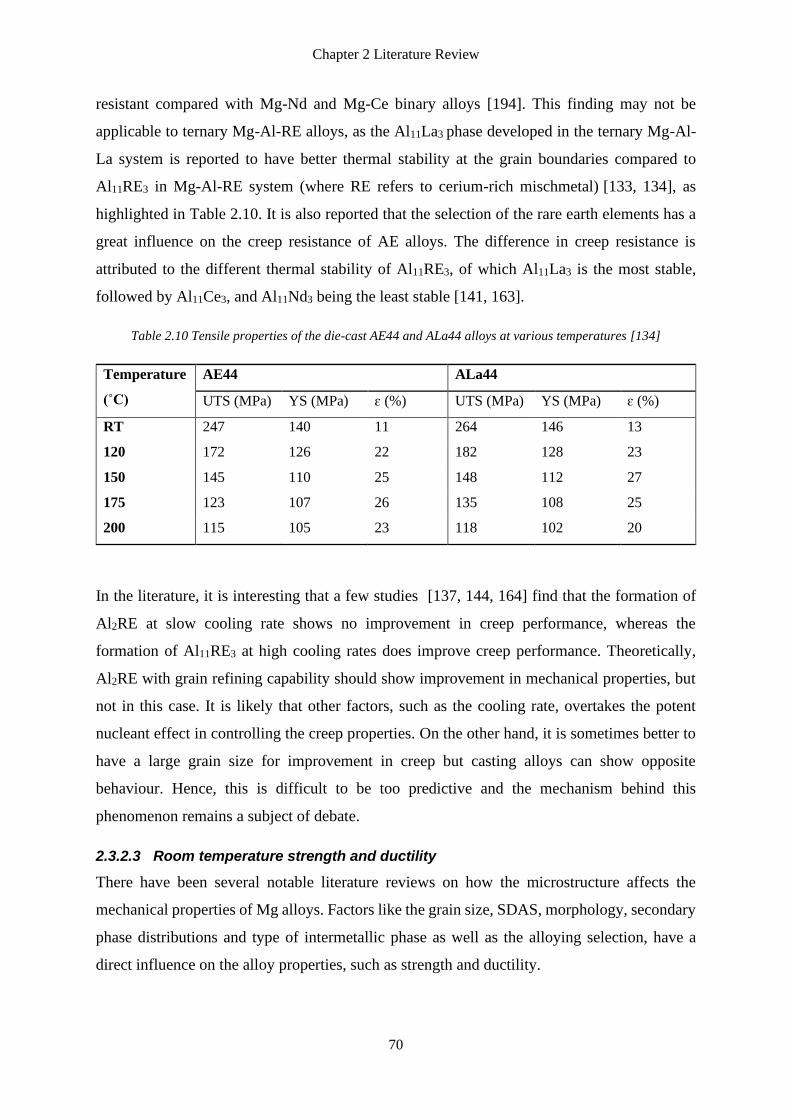
Chapter 2 Literature Review
70
resistant compared with Mg-Nd and Mg-Ce binary alloys [194]. This finding may not be
applicable to ternary Mg-Al-RE alloys, as the Al11La3 phase developed in the ternary Mg-Al-
La system is reported to have better thermal stability at the grain boundaries compared to
Al11RE3 in Mg-Al-RE system (where RE refers to cerium-rich mischmetal) [133, 134], as
highlighted in Table 2.10. It is also reported that the selection of the rare earth elements has a
great influence on the creep resistance of AE alloys. The difference in creep resistance is
attributed to the different thermal stability of Al11RE3, of which Al11La3 is the most stable,
followed by Al11Ce3, and Al11Nd3 being the least stable [141, 163].
Table 2.10 Tensile properties of the die-cast AE44 and ALa44 alloys at various temperatures [134]
Temperature
(˚C)
AE44 ALa44
UTS (MPa) YS (MPa) ɛ (%) UTS (MPa) YS (MPa) ɛ (%)
RT 247 140 11 264 146 13
120 172 126 22 182 128 23
150 145 110 25 148 112 27
175 123 107 26 135 108 25
200 115 105 23 118 102 20
In the literature, it is interesting that a few studies [137, 144, 164] find that the formation of
Al2RE at slow cooling rate shows no improvement in creep performance, whereas the
formation of Al11RE3 at high cooling rates does improve creep performance. Theoretically,
Al2RE with grain refining capability should show improvement in mechanical properties, but
not in this case. It is likely that other factors, such as the cooling rate, overtakes the potent
nucleant effect in controlling the creep properties. On the other hand, it is sometimes better to
have a large grain size for improvement in creep but casting alloys can show opposite
behaviour. Hence, this is difficult to be too predictive and the mechanism behind this
phenomenon remains a subject of debate.
2.3.2.3 Room temperature strength and ductility
There have been several notable literature reviews on how the microstructure affects the
mechanical properties of Mg alloys. Factors like the grain size, SDAS, morphology, secondary
phase distributions and type of intermetallic phase as well as the alloying selection, have a
direct influence on the alloy properties, such as strength and ductility.
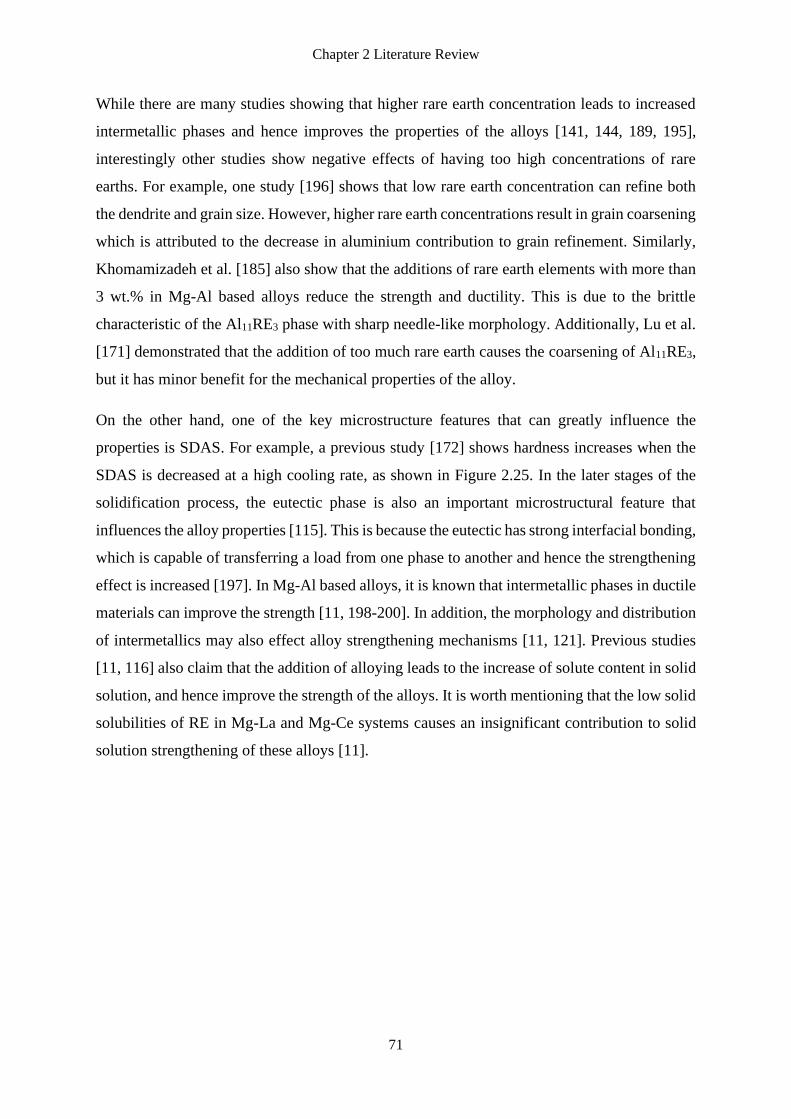
Chapter 2 Literature Review
71
While there are many studies showing that higher rare earth concentration leads to increased
intermetallic phases and hence improves the properties of the alloys [141, 144, 189, 195],
interestingly other studies show negative effects of having too high concentrations of rare
earths. For example, one study [196] shows that low rare earth concentration can refine both
the dendrite and grain size. However, higher rare earth concentrations result in grain coarsening
which is attributed to the decrease in aluminium contribution to grain refinement. Similarly,
Khomamizadeh et al. [185] also show that the additions of rare earth elements with more than
3 wt.% in Mg-Al based alloys reduce the strength and ductility. This is due to the brittle
characteristic of the Al11RE3 phase with sharp needle-like morphology. Additionally, Lu et al.
[171] demonstrated that the addition of too much rare earth causes the coarsening of Al11RE3,
but it has minor benefit for the mechanical properties of the alloy.
On the other hand, one of the key microstructure features that can greatly influence the
properties is SDAS. For example, a previous study [172] shows hardness increases when the
SDAS is decreased at a high cooling rate, as shown in Figure 2.25. In the later stages of the
solidification process, the eutectic phase is also an important microstructural feature that
influences the alloy properties [115]. This is because the eutectic has strong interfacial bonding,
which is capable of transferring a load from one phase to another and hence the strengthening
effect is increased [197]. In Mg-Al based alloys, it is known that intermetallic phases in ductile
materials can improve the strength [11, 198-200]. In addition, the morphology and distribution
of intermetallics may also effect alloy strengthening mechanisms [11, 121]. Previous studies
[11, 116] also claim that the addition of alloying leads to the increase of solute content in solid
solution, and hence improve the strength of the alloys. It is worth mentioning that the low solid
solubilities of RE in Mg-La and Mg-Ce systems causes an insignificant contribution to solid
solution strengthening of these alloys [11].
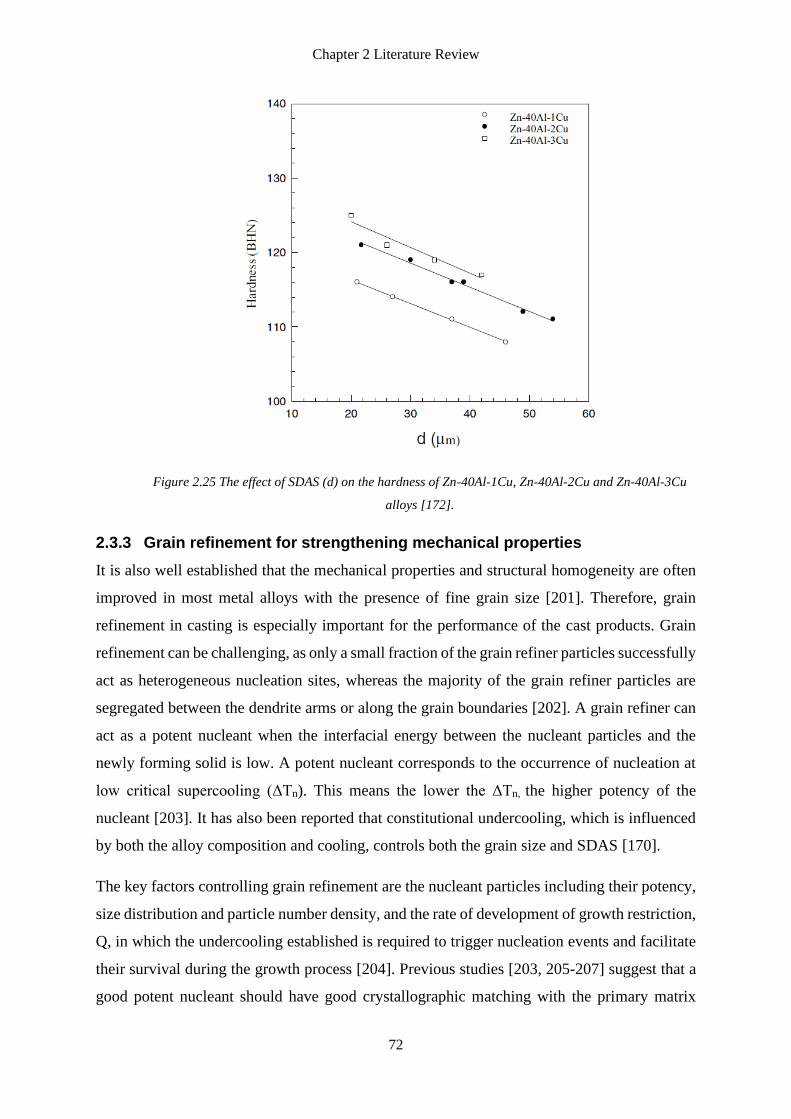
Chapter 2 Literature Review
72
Figure 2.25 The effect of SDAS (d) on the hardness of Zn-40Al-1Cu, Zn-40Al-2Cu and Zn-40Al-3Cu
alloys [172].
2.3.3 Grain refinement for strengthening mechanical properties
It is also well established that the mechanical properties and structural homogeneity are often
improved in most metal alloys with the presence of fine grain size [201]. Therefore, grain
refinement in casting is especially important for the performance of the cast products. Grain
refinement can be challenging, as only a small fraction of the grain refiner particles successfully
act as heterogeneous nucleation sites, whereas the majority of the grain refiner particles are
segregated between the dendrite arms or along the grain boundaries [202]. A grain refiner can
act as a potent nucleant when the interfacial energy between the nucleant particles and the
newly forming solid is low. A potent nucleant corresponds to the occurrence of nucleation at
low critical supercooling (ΔTn). This means the lower the ΔTn, the higher potency of the
nucleant [203]. It has also been reported that constitutional undercooling, which is influenced
by both the alloy composition and cooling, controls both the grain size and SDAS [170].
The key factors controlling grain refinement are the nucleant particles including their potency,
size distribution and particle number density, and the rate of development of growth restriction,
Q, in which the undercooling established is required to trigger nucleation events and facilitate
their survival during the growth process [204]. Previous studies [203, 205-207] suggest that a
good potent nucleant should have good crystallographic matching with the primary matrix
Chapter 2 Literature Review
73
phase. This relationship minimises the interfacial energy between the nuclei and the matrix.
Other researchers propose that the size of inoculant particles should be larger than the critical
threshold for nucleation [203, 208].
Zirconium is a popular grain refiner in Mg alloys, which is also the most potent nucleant
introduced for commercial aluminium-free magnesium-based alloys [209]. However, it is only
suitable for aluminium-free alloys due to the high reactivity between aluminium and zirconium
leading to the formation of intermetallic phases with aluminium [203]. More to the point is that
given the great importance of grain size, there has been a lot of research focusing on
discovering potential grain refiners and optimising the existing grain refiners.
In microstructure and morphology, there remain multiple challenges that require research
effort. One of these challenges is the nucleation crystallography of the very first step upon the
microstructure forming process. Several geometric crystallographic models have been
developed to understand the various types of grain refiner effects on grain refinement: namely
the linear disregistry model [210], planar disregistry model [206] and edge-to-edge matching
model (E2EM) [211, 212]. Experimental studies remain highly challenging due to the difficulty
in obtaining active nucleants in within the grains. The difficulty in finding the active nucleants
due to their scarcity in grains often complicates nucleation studies. However, synchrotron
studies using high energy X-rays enables the observation and study of individual grains in bulk
materials [213-215]. For example, Iqbal et al. [213] observed the grain nucleation and grain
growth of aluminium alloys using this technology. In addition, they demonstrated the
significance of the metastable phase in the enhancement of grain nucleation in liquid
aluminium alloys. From this study, the theoretical model of solidification predictions is verified
through in-situ experiments [213].
Apart from that, a study proved a feasible way to investigate nucleation crystallography
between the active nucleant and metal nuclei in a real casting is to use Focus-Ion-Beam (FIB)
aiding the TEM [216]. Al2Y particles have been confirmed to be the effective grain refiner for
Mg-Al-Y alloys using the FIB aided TEM method as well as E2EM crystallography matching
[202, 216, 217]. Furthermore, the grain refining efficiency of Al2Y has exceeded the
performance of the current popular grain refiner, zirconium. This is because the grains refined
by Al2Y have greater thermal stability compared to those refined by zirconium, under the
conditions of 550 C for 48 hours [202]. In other words, grain coarsening during heat treatment

Chapter 2 Literature Review
74
occurs more rapidly when grains are refined by zirconium compared to grains that are refined
by Al2Y.
Besides the Al2Y being a potent nucleant, Jiang et al. [218] showed that Al2Ce is also a potent
nucleant for the Mg-Al-Ce system using crystallographic calculations. Similarly, microscopic
observations and crystallographic calculations also indicate that Al4Ce is a potential nucleant
for α-Mg grains by promoting heterogeneous nucleation of α-Mg on Al4Ce particles [219]. This
agrees with another study that observed a grain refinement effect with the addition of cerium
into a Mg-20Zn-8Al alloy [220]. Qiu et al. performed a series of interfacial energy calculations
and the result indicated both Al2Y and Al2Ce are effective nucleants according to these
calculations, although Al2La is not predicted to be effective (Figure 2.26) [216]. Although the
preliminary understanding of the principles of grain refinement in magnesium alloys has
improved significantly and a range of potential grain refiners have been identified, a reliable
master alloy for grain refinement of Mg-Al alloys remains to be developed.
Figure 2.26 Wettability of potential inoculants in Mg-Al-RE alloys [216].
2.4 Summary
The review of the literature focused on the solidification and microstructure development in
Mg-Al-RE alloys. The three main gaps from the literature are:
1. The current Mg-Al-RE phase diagrams are largely based on extrapolations from the
relevant binary systems. There are some discrepancies in the literature which suggest
that this is not accurate. For example, the intermetallic phase stability in the Mg-Al-Ce
and Mg-Al-La systems remains unclear. There are various liquidus temperatures also
reported in these systems. To date, there are limited studies on the ternary Mg-Al-RE

Chapter 2 Literature Review
75
systems, in particular the Mg-Al-La system. It is therefore of great importance to
determine and clarify the solidification sequence and hence contribute research data to
improve the thermodynamic database for Mg-Al-RE systems.
2. It was noted that there are debates and uncertainties on the intermetallic phases
developed in Mg-Al-RE alloys. Often all rare earth alloying elements are assumed to
behave in a similar way whilst the microstructure and properties appear to be different.
In addition, the literature shows that the microstructure is dependent on the cooling rate
during solidification, but the relationship of the influences on the microstructure is
unclear. Hence, the research in this thesis will focus on understanding the effects of
individual rare earth elements and cooling rates on the phase selection and
microstructure development in Mg-Al-RE alloys.
3. In casting, there are several factors which influence properties, including grain size,
SDAS, intermetallic type and amount of intermetallic phase. However, the
microstructure-properties relationship is unclear. Therefore, a systematic study of the
effects of alloying element, concentration and cooling rate is needed to better
understand the interdependence relationship between processing-microstructure-
properties in Mg-Al-RE alloys.
From the research gaps identified, three areas of focus have been identified and these have been
the motivations of the research undertaken in this thesis. These gaps are investigated in the
subsequent Chapters 4 to 9. The results from these studies provide better understanding of how
to effectively control and select the microstructure and intermetallic phases of Mg-Al-RE
alloys. A summary of the research gaps and focus in this thesis is shown in Figure 2.27.
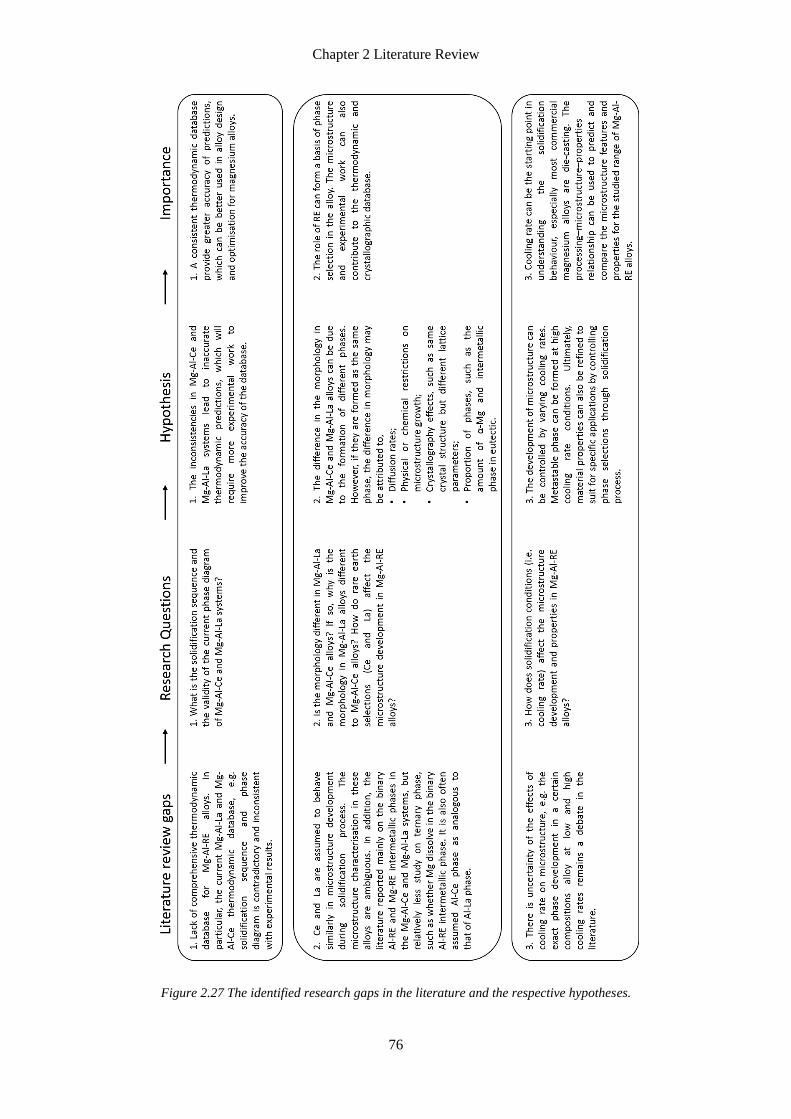
Chapter 2 Literature Review
76
Figure 2.27 The identified research gaps in the literature and the respective hypotheses.
Chapter 2 Literature Review
77
2.5 References
1. B.L. Mordike and T. Ebert, Magnesium: properties — applications — potential.
Materials Science and Engineering: A, 2001. 302(1): p. 37-45.
2. C. Zhang, et al., Microstructure and microsegregation in directionally solidified Mg–
4Al alloy. Journal of Intermetallics, 2007. 15(10): p. 1395-1400.
3. W.D. Callister and D.G. Rethwisch, Materials science and engineering: an
introduction. 2010: Wiley.
4. R. Schmid‐Fetzer, J. Gröbner, and D. Kevorkov, Focused development of magnesium‐
alloys using computational thermochemistry as a powerful tool. Magnesium Alloys and
Their Applications, 2000: p. 9-13.
5. D.A. Porter, K.E. Easterling, and M. Sherif, Phase transformations in metals and
alloys. 2009: CRC press.
6. N.D. Saddock, et al., Solidification and microstructure of Mg‐Al‐(Ca, Sr, Ce, La)
ternary alloys. Essential Readings in Magnesium Technology, 2005: p. 199-204.
7. P. Marchwica, Microstructual and thermal analysis of aluminum-silicon and
magnesium-aluminum alloys subjected to high cooling rates. 2012, University of
Windsor.
8. M.C. Flemings, Solidification processing. Metallurgical Transactions, 1974. 5(10): p.
2121-2134.
9. M.I. Khan, et al., Influence of cooling rate on microsegregation behavior of magnesium
alloys. Journal of Materials, 2014. 2014: p. 18.
10. E. Scheil, Bemerkungen zur schichtkristallbildung. Zeitschrift für Metallkunde, 1942.
34(3): p. 70-72.
Chapter 2 Literature Review
78
11. T.L. Chia, et al., The effect of alloy composition on the microstructure and tensile
properties of binary Mg-rare earth alloys. Journal of Intermetallics, 2009. 17(7): p.
481-490.
12. W. Sun, et al., Investigation of the non-equilibrium solidification microstructure of a
Mg–4Al–2RE (AE42) alloy. Journal of Materials Science, 2016: p. 1-8.
13. A. Shukla, Development of a critically evaluated thermodynamic databse for the
systems containing alkaline-earth oxides. 2012, École Polytechnique de Montréal.
14. L.L. Jin, Thermodynamic modeling of aluminum-magnesium-rare earth systems. 2012,
École Polytechnique de Montréal.
15. L. Kaufman and H. Bernstein, Computer calculation of phase diagrams. With special
reference to refractory metals. 1970, New York: Academic Press Incorporation.
16. G.V. Raynor, Constitution of ternary and some more complex alloys of magnesium.
International Metals Reviews, 1977. 22: p. 65-96.
17. B. Böttger, et al., Controlling microstructure in magnesium alloys: a combined
thermodynamic, experimental and simulation approach. Advanced Engineering
Materials, 2006. 8(4): p. 241-247.
18. S.M. Liang, et al., Thermal analysis and solidification pathways of Mg–Al–Ca system
alloys. Materials Science and Engineering: A, 2008. 480(1-2): p. 365-372.
19. J. Gröbner, et al., Thermodynamic analysis of as-cast and heat-treated microstructures
of Mg–Ce–Nd alloys. Acta Materialia, 2011. 59(2): p. 613-622.
20. B. Sundman, B. Jansson, and J.O. Andersson, The thermo-calc databank system.
Calphad, 1985. 9(2): p. 153-190.
21. R.H. Davies, et al., MTDATA-thermodynamic and phase equilibrium software from the
national physical laboratory. Calphad, 2002. 26(2): p. 229-271.
Chapter 2 Literature Review
79
22. C.W. Bale, et al., FactSage thermochemical software and databases. Calphad, 2002.
26(2): p. 189-228.
23. S.L. Chen, et al., The PANDAT software package and its applications. Calphad, 2002.
26(2): p. 175-188.
24. L.L. Jin, et al., Al–Mg–RE (RE= La, Ce, Pr, Nd, Sm) systems: thermodynamic
evaluations and optimizations coupled with key experiments and Miedema’s model
estimations. The Journal of Chemical Thermodynamics, 2013. 58: p. 166-195.
25. H. Bakker, Enthalpies in alloys, Miedema's semi-empirical model. Trans. Tech.
Publications, 1998: p. 1-78.
26. L.L. Jin, et al., Modeling of thermodynamic properties and phase equilibria in Mg-RE
AND Mg-Al-RE (RE= Rare Earth) systems. Metallurgical and Materials Transactions
A, 2008. 39(3): p. 502-512.
27. A.D. Pelton, et al., The modified quasichemical model I—binary solutions.
Metallurgical and Materials Transactions B, 2000. 31(4): p. 651-659.
28. L.L. Jin, et al., Thermodynamic evaluation and optimization of Al–La, Al–Ce, Al–Pr,
Al–Nd and Al–Sm systems using the modified quasichemical model for liquids.
Calphad, 2011. 35(1): p. 30-41.
29. L.L. Jin, et al., Thermodynamic evaluation and optimization of Al–Gd, Al–Tb, Al–Dy,
Al–Ho and Al–Er systems using a modified quasichemical model for the liquid.
Calphad, 2010. 34(4): p. 456-466.
30. M. Hillert and L. Staffansson, Regular-solution model for stoichiometric phases and
ionic melts. Acta Chem. Scand., 1970. 24(10): p. 3618-3626.
31. H. Harvig, Extended version of the regular solution model for stoichiometric phases
and ionic melts Acta Chem Scand, 1971. 25(9): p. 3199-3204.
Chapter 2 Literature Review
80
32. B. Sundman and J. Ågren, A regular solution model for phases with several components
and sublattices, suitable for computer applications. Journal of Physics and Chemistry
of Solids, 1981. 42(4): p. 297-301.
33. J.O. Andersson, et al., A compound-energy model of ordering in a phase with sites of
different coordination numbers. Acta Metallurgica, 1986. 34(3): p. 437-445.
34. M. Kawakami, Equilibrium diagram of aluminum-magnesium system. Science Reports
of the Tohoku Imperial University Series, 1936. 1: p. 727-747.
35. P. Liang, et al., Experimental investigation and thermodynamic calculation of the
central part of the Mg-Al phase diagram. Z. Metallkd., 1998. 89(8): p. 536-540.
36. D. Hanson and M.L. Gayler, The constitution of the alloys of aluminum and magnesium.
Journal of Institute of Metals, 1920. 24: p. 201-232.
37. E.S. Makarkov, Crystal structure of the gamma phase of the systems Al-Mg and Tl-Bi.
Doklady Akademii Nauk SSSR, 1950. 74: p. 935-938.
38. P.Chartrand and A.D.Pelton, Critical evaluation and optimization of the
thermodynamic properties and phase diagrams of the Al-Mg, Al-Sr, Mg-Sr, and Al-Mg-
Sr systems. Journal of Phase Equilibria, 1994. 15(6): p. 591-605.
39. N. Saunders, A review and thermodynamic assessment of the Al-Mg and Mg-Li systems.
Calphad, 1990. 14(1): p. 61-70.
40. T. Czeppe, W. Zakulski, and E. Bielańska, Study of the thermal stability of phases in
the Mg-Al system. Journal of Phase Equilibria, 2003. 24(3): p. 249-254.
41. Y. Zuo and Y.A. Chang, Thermodynamic calculation of the Al-Mg phase diagram.
Calphad, 1993. 17(2): p. 161-174.
Chapter 2 Literature Review
81
42. Y. Zhong, M. Yang, and Z.K. Liu, Contribution of first-principles energetics to Al–Mg
thermodynamic modeling. Calphad, 2005. 29(4): p. 303-311.
43. G.I. Batalin, V.E. Sokol’skii, and T.B. Shimanskaya, Enthalpies of mixing liquid alloys
of aluminum with magnesium and antimony. Ukrainskii Khimicheskii Zhurnal, 1971.
37: p. 397.
44. Y.J. Bhatt and S.P. Garg, Thermodynamic study of liquid aluminum-magnesium alloys
by vapor pressure measurements. Metallurgical Transactions B, 1976. 7(2): p. 271-275.
45. G.R. Belton and Y.K. Rao, Galvanic cell study of activities in Mg-Al liquid alloys
TRANS MET SOC AIME, 1969. 245(10): p. 2189-2193.
46. J.L. Murray, The Al−Mg (aluminum−magnesium) system. Journal of Phase Equilibria,
1982. 3(1): p. 60.
47. S. Samson, The crsytal structure of the phase β-Mg2Al3. Acta Crystallographica, 1965.
19(3): p. 401-413.
48. J.A. Brown and J.N. Pratt, The thermodynamic properties of solid Al−Mg alloys.
Metallurgical Transactions, 1970. 1(10): p. 2743-2750.
49. P. Villars, L.D. Calvert, and W.B. Pearson, Pearson's handbook of crystallographic
data for intermetallic phases. (volumes 1, 2, 3). American Society for Metals, 1985: p.
3258.
50. M. Mezbahul-Islam, A.O. Mostafa, and M. Medraj, Essential magnesium alloys binary
phase diagrams and their thermochemical data. Journal of Materials, 2014. 2014: p.
33.
51. R. Vogel, On the cerium–magnesium alloys. Z. Anorg. Chem, 1915. 91: p. 277-298.
52. R. Vogel and T. Heumann, Determination of Ce-Mg and La-Mg systems. Z. Metallkd,
1947. 38: p. 1-8.
Chapter 2 Literature Review
82
53. J.L. Haughton and T.H. Schofield, Alloys of magnesium. Part V - the constitution of the
magnesium rich alloys of magnesium and cerium. J. Inst. Met, 1937. 60: p. 339-344.
54. R.L. Crosby and K.A. Fowler, Studies of magnesium alloys for use at moderate
temperatures. 1962, Bureau of Mines. Rolla Metallurigical Research Center, Mo.
55. M.E. Drits, Z.A. Sviderskaya, and L.L. Rokhlin, The phase diagram of Mg–Ce in the
Mg-rich region. Met. Metalloved. Fiz. Khim. Metody, Issled, 1963. 12: p. 143-151.
56. D.H. Wood and E.M. Cramer, Phase relations in the magnesium-rich portion of the
cerium-magnesium system. Journal of the Less Common Metals, 1965. 9(5): p. 321-
337.
57. R.L. Crosby and J.L. Holman, Intermediate phases in the magnesium-cerium system
between magnesium and Mg sub3 Ce. 1966, Bureau of Mines, Rolla, Mo. Rolla
Metallurgy Research Center.
58. A. Saccone, et al., Mg–Ce alloys. experimental investigation by Smith thermal analysis.
Journal of Thermal Analysis and Calorimetry, 2001. 66(1): p. 47-57.
59. A.A. Nayeb-Hashemi and J.B. Clark, The Ce−Mg (Cerium-Magnesium) system.
Journal of Phase Equilibria, 1988. 9(2): p. 162-172.
60. H. Okamoto, Ce-Mg (cerium-magnesium). Journal of Phase Equilibria and Diffusion,
2011. 32(3): p. 265.
61. G. Canneri, The alloys of lanthanides. Metall. Ital., 1931. 23: p. 803-823.
62. F. Weibke and W. Schmidt, On the solubility of lanthanides in Al, Mg and
homogeneous alloys of Mg and Al. Z. Electrochem, 1940. 46: p. 357-364.
63. J.J. Park and L.L. Wyman, Phase relationships in magnesium alloys. period covered:
December 1954 to August 1957. 1957, National Bureau of Standards, Washington, DC.
Chapter 2 Literature Review
83
64. R.R. Joseph and K.A. Gschneidner Jr, Solid solubility of magnesium in some lanthanide
metals. Trans. Met. Soc. AIME, 1965. 233(IS-1174).
65. P. Manfrinetti and K.A. Gschneidner Jr, Phase equilibrium in the La-Mg (0–65 at.%
Mg) and Gd-Mg systems. Journal of the Less Common Metals, 1986. 123(1-2): p. 267-
275.
66. A.A. Nayeb-Hashemi and J.B. Clark, The La−Mg (Lanthanum-Magnesium) system.
Journal of Phase Equilibria, 1988. 9(2): p. 172-178.
67. B.J. Beaudry and K.A. Gschneidner Jr, Preparation and basic properties of the rare
earth metals. Handbook on the Physics and Chemistry of Rare Earths, 1978. 1: p. 173-
232.
68. K.A. Gschneidner Jr and F.W. Calderwood, Intra rare earth binary alloys: phase
relationships, lattice parameters and systematics. Handbook on the Physics and
Chemistry of Rare Earths, 1986. 8: p. 1-161.
69. M. Pezat, et al., French anvar patent 78 203 82, 1978. Mater Res Bull, 1979. 14: p.
377.
70. K. Buschow, Magnetic properties of rare earth-magnesium compounds (RMg3).
Journal of the Less Common Metals, 1976. 44: p. 301-306.
71. K. Buschow, R.C.S., F. Hsu, and K. Knorr, Magnetic properties of rare‐earth
magnesium compounds of the type RMg2. Journal of Applied Physics, 1978. 49(3): p.
1510-1512.
72. K. Buschow, Magnetic properties of CsCl-type rare earth-magnesium compounds.
Journal of the Less Common Metals, 1973. 33(2): p. 239-244.
73. L.L Rokhlin, Structure and properties of alloys of the Mg-REM system. Metal Science
and Heat Treatment, 2006. 48(11-12): p. 487-490.
Chapter 2 Literature Review
84
74. L.L. Rokhlin, Magnesium alloys containing rare earth metals: structure and
properties. 2003: Crc Press.
75. A. Nayeb-Hashemi, Phase diagrams of binary magnesium alloys. ASM International,
1988.
76. K. Buschow and J. Van Vucht, The binary systems cerium-aluminium and
prasedymiun-aluminium. Z. Metallk., 1966. 57.
77. A. Saccone, et al., Phase equilibria in the rare earth metals (R)-rich regions of the R-
Al systems (R = La, Ce, Pr, Nd). Zeitschrift fuer Metallkunde, 1996. 87(2): p. 82-87.
78. G. Cacciamani and R. Ferro, Thermodynamic modeling of some aluminium-rare earth
binary systems: Al-La, Al-Ce and Al-Nd. Calphad, 2001. 25(4): p. 583-597.
79. K.A. Gschneidner and F.W. Calderwood, The Al−Ce (Aluminum-Cerium) system.
Bulletin of Alloy Phase Diagrams, 1988. 9(6): p. 669-672.
80. K.A. Gschneidner and F.W Calderwood, The Al−La (Aluminum-Lanthanum) system.
Bulletin of Alloy Phase Diagrams, 1988. 9(6): p. 686-689.
81. S. Tekumalla, et al., Mechanical properties of magnesium-rare earth alloy systems: a
review. Metals, 2015. 5(1): p. 1-39.
82. M.C. Gao, et al., Reassessment of Al-Ce and Al-Nd binary systems supported by critical
experiments and first-principles energy calculations. Metallurgical and Materials
Transactions A, 2005. 36(12): p. 3269-3279.
83. S.H. Zhou and R.E. Napolitano, Phase equilibria and thermodynamic limits for
partitionless crystallization in the Al–La binary system. Acta Materialia, 2006. 54(3):
p. 831-840.
Chapter 2 Literature Review
85
84. Y.B. Kang, et al., Critical evaluation and thermodynamic optimization of the Al–Ce,
Al–Y, Al–Sc and Mg–Sc binary systems. Calphad, 2008. 32(2): p. 413-422.
85. R. Vogel, Metallographische Mitteilungen aus dem Institut für physikalische Chemie
der Universität Göttingen. LXXIX. Über Cer-Aluminiumlegierungen. Zeitschrift für
Anorganische Chemie, 1912. 75(1): p. 41-57.
86. J. Van Vucht, Some data about the system Cerium-Thorium. Philips Research Repts,
1957. 12: p. 351-4.
87. V.I. Kononenko and S.V. Golubev, On phase diagrams for binary systems of
aluminium with La, Ce, Pr, Nd, Eu, Yb, Sc and Y. Izvestiya Akademii Nauk SSSR,
Metally, 1990: p. 197-199.
88. C. Colinet, A. Pasturel, and K. Buschow, Molar enthalpies of formation of LnAl2
compounds. The Journal of Chemical Thermodynamics, 1985. 17(12): p. 1133-1139.
89. F. Sommer and M. Keita, Determination of the enthalpies of formation of intermetallic
compounds of aluminium with cerium, erbium and gadolinium. Journal of the Less
Common Metals, 1987. 136(1): p. 95-99.
90. G. Borzone, G. Cacciamani, and R. Ferro, Heats of formation of aluminum-cerium
intermetallic compounds. Metallurgical Transactions A, 1991. 22(9): p. 2119-2123.
91. G. Cacciamani, G. Borzone, and R. Ferro, On a simple high temperature direct reaction
calorimeter. Journal of Alloys and Compounds, 1995. 220(1-2): p. 106-110.
92. L.F. Yamshchikov, et al., Yttrium and cerium solubility in fusible metals. Izv. Vyssh.
Uchebn. Zaved., Tsvetn. Metall, 1980: p. 50-54.
93. V.I. Kononenko and S.V. Golubev, On phase diagrams of binary aluminum systems
with La, Ce, Pr, Nd, Sm, Eu, Yb, Sc, and Y. Izv. Akad. Nauk SSSR. Met, 1990. 2: p.
197-199.
Chapter 2 Literature Review
86
94. K.H.J. Buschow, The lanthanum-aluminium system. Philips Research Report, 1965. 20.
95. J.X. Wang, Thermodynamic optimization for Al-La system. Calphad, 1994. 18(3): p.
269-272.
96. CompuTherm, Pandat software and PanMagnesium 2018 thermodynamic database,
Madison, Editor.
97. R. Schmid-Fetzer and J. Gröbner, Thermodynamic database for Mg alloys - progress
in multicomponent modeling. Metals, 2012. 2(3): p. 377-398.
98. M. Hosseinifar and D.V. Malakhov, On the fabricability of a composite material
containing the FCC matrix with embedded ductile B2 intermetallics. Journal of Alloys
and Compounds, 2010. 505(2): p. 459-466.
99. J. Gröbner, D. Kevorkov, and R. Schmid-Fetzer, Thermodynamic modeling of Al–Ce–
Mg phase equilibria coupled with key experiments. Journal of Intermetallics, 2002.
10(5): p. 415-422.
100. Z. Cui and R. Wu, Phase diagram and properties of ternary Al-Mg-Ce alloys. Acta
Metallurgica Sinica, 1984. 20(6): p. B323-31.
101. O.S. Zarechnyuk and P.I. Kripyakevich, X-ray diffraction analysis of the Ce-Mg-Al
system in the 0.33 At. percent Ce range Izv Akad Nauk SSSR Metally, 1967(4): p. 188-
190.
102. K.O. Odinaev, et al., Phase equilibrium diagram of the aluminum-magnesium-
lanthanum system at 400°C. Izv. Vyss. Uchebn. Zaved., Tsvetn. Met., 1988. 2: p. 81-
85.
103. K.O. Odinaev, I.N. Ganiev, and A.Z. Ikromov, Pseudo-binary section and liquidus
surface of Al-Mg-NdAl2 system. Metally, 1996.
Chapter 2 Literature Review
87
104. N. Saddock, Microstructure and creep behavior of magnesium-aluminum alloys
containing alkaline and rare earth additions. 2008, University of Michigan: Ann
Arbor. p. 214.
105. A.A. Luo, et al., Computational thermodynamics and kinetics for magnesium alloy
development. Advanced Materials & Processes, 2015. 173(1): p. 26-30.
106. A.A. Luo, Material design and development: From classical thermodynamics to
CALPHAD and ICME approaches. Calphad, 2015. 50: p. 6-22.
107. V. Raghavan, Al-La-Mg (Aluminum-Lanthanum-Magnesium). J. Phase Equilib.
Diffus., 2008. 29(3): p. 270-271.
108. V. Raghavan, Al-Ce-Mg (Aluminum-Cerium-Magnesium). Journal of Phase Equilibria
and Diffusion, 2007. 28(5): p. 453-455.
109. L.L. Jin, et al., Al–Mg–RE (RE = La, Ce, Pr, Nd, Sm) systems: thermodynamic
evaluations and optimizations coupled with key experiments and Miedema’s model
estimations. The Journal of Chemical Thermodynamics 2013. 58: p. 166-195.
110. C. Guo and Z. Du, Thermodynamic assessment of the La–Mg system. Journal of Alloys
and Compounds, 2004. 385(1): p. 109-113.
111. B. Darriet, et al., Rare Earth Compounds with Magnesium and Their Application in
Hydrogen Storage. Materials Research Bulletin, 1979. 14(3): p. 377-385.
112. O.S. Zarechnyuk, et al., X-ray investigation into Mg-Al-La and Mg-Al-Nd systems in
the range of 0-33. 3 at.% rare earths. Izv. Akad. Nauk. SSSR Met., 1981: p. 221-223.
113. J. Gröbner, D. Kevorkov, and R. Schmid-Fetzer, Thermodynamic modeling of Al–Ce–
Mg phase equilibria coupled with key experiments. Intermetallics, 2002. 10(5): p. 415-
422.
Chapter 2 Literature Review
88
114. D.H. StJohn, et al., Solidification of cast magnesium alloys. Magnesium Technology,
2003: p. 95-100.
115. L.P. Barber, Characterization of the solidification behavior and resultant
microstructures of magnesium-aluminum alloys. 2004: Worcester Polytechnic Institute.
116. C.H. Caceres, et al., Effects of solidification rate and ageing on the microstructure and
mechanical properties of AZ91 alloy. Materials Science and Engineering: A, 2002.
325(1): p. 344-355.
117. T.K. Aune, H. Westengen, and T. Ruden, Mechanical properties of energy absorbing
magnesium alloys. 1993, SAE Technical Paper.
118. M.S. Dargusch, et al., The effect of aluminium content on the mechanical properties
and microstructure of die cast binary magnesium-aluminium alloys. Materials
Transactions, 2006. 47(4): p. 977-982.
119. A.A. Luo, Application of computational thermodynamics and calphad in magnesium
alloy development, in Proceedings of the 2nd World Congress on Integrated
Computational Materials Engineering (ICME), M. Li, et al., Editors. 2016, Springer
International Publishing: Cham. p. 3-8.
120. M.D. Nave, A.K. Dahle, and D.H. StJohn, Eutectic growth morphologies in
magnesium‐aluminium alloys. Magnesium Technology 2000, 2000: p. 233-242.
121. C.H. Cáceres, et al., Section thickness, macrohardness and yield strength in high-
pressure diecast magnesium alloy AZ91. Materials Science and Engineering: A, 2005.
402(1): p. 269-277.
122. H.E. Friedrich and B.L. Mordike, Magnesium technology. Vol. 788. 2006: Springer.
123. A. Kiełbus, T. Rzychoń, and R. Cibis, Microstructure of AM50 die casting magnesium
alloy. Journal of Achievements in Materials and Manufacturing Engineering, 2006.
18(1-2): p. 135.
Chapter 2 Literature Review
89
124. L. Zhang, et al., Effect of Al content on the microstructures and mechanical properties
of Mg–Al alloys. Materials Science and Engineering: A, 2009. 508(1-2): p. 129-133.
125. M.D. Nave, A.K. Dahle, and D.H. StJohn, The role of zinc in the eutectic solidification
of magnesium‐aluminium‐zinc alloys. Magnesium Technology 2000, 2000: p. 243-250.
126. M. Easton and D. StJohn, Grain refinement of aluminum alloys: Part I. The nucleant
and solute paradigms—a review of the literature. Metallurgical and Materials
Transactions A, 1999. 30(6): p. 1613-1623.
127. M. Easton and D. StJohn, Grain refinement of aluminum alloys: Part II. Confirmation
of, and a mechanism for, the solute paradigm. Metallurgical and Materials Transactions
A, 1999. 30(6): p. 1625-1633.
128. Y.F. Wang, et al., First-principles study of structural stabilities and electronic
characteristics of Mg–La intermetallic compounds. Computational Materials Science,
2007. 41(1): p. 78-85.
129. M.A. Easton, et al., The role of crystallography and thermodynamics on phase selection
in binary magnesium–rare earth (Ce or Nd) alloys. Acta Materialia, 2012. 60(11): p.
4420-4430.
130. Y. He, et al., Microstructure evolution and mechanical properties of Al-La alloys with
varying La contents. Materials Science and Engineering: A, 2017. 701: p. 134-142.
131. Y.H. Zheng and Z.D. Wang, A novel periodic dendrite microstructure in Al–La binary
alloy. Journal of Crystal Growth, 2011. 318(1): p. 1013-1015.
132. Y.H. Zheng, Z.D. Wang, and S.M. Zhang, Microstructure of diphase dendrite in Al–
35% La alloy during solidification. Journal of Crystal Growth, 2013. 362: p. 33-37.
Chapter 2 Literature Review
90
133. J.H. Zhang, et al., Microstructures, tensile properties and corrosion behavior of die-
cast Mg–4Al-based alloys containing La and/or Ce. Materials Science and
Engineering: A, 2008. 489(1): p. 113-119.
134. J.H. Zhang, et al., Effect of substituting cerium-rich mischmetal with lanthanum on
microstructure and mechanical properties of die-cast Mg–Al–RE alloys. Materials &
Design, 2009. 30(7): p. 2372-2378.
135. Y. Wang, et al., Effects of Zn and RE additions on the solidification behavior of Mg–
9Al magnesium alloy. Materials Science and Engineering: A, 2003. 342(1–2): p. 178-
182.
136. K.M. Asl, Improving the properties of magnesium alloys for high temperature
applications. 2011: INTECH Open Access Publisher.
137. A.A. Moosa, Effect of lanthanum addition on the microstructure of Mg-4Al alloy. Al-
Khwarizmi Engineering Journal, 2011. 7: p. 75-82.
138. J.H. Zhang, et al., Microstructures and mechanical properties of heat-resistant HPDC
Mg–4Al-based alloys containing cheap misch metal. Materials Science and
Engineering: A, 2011. 528(6): p. 2670-2677.
139. T. Rzychoń, A. Kiełbus, and L. Lityńska-Dobrzyńska, Microstructure, microstructural
stability and mechanical properties of sand-cast Mg–4Al–4RE alloy. Materials
Characterization, 2013. 83: p. 21-34.
140. S. Zhu, et al., Evaluation of magnesium die-casting alloys for elevated temperature
applications: microstructure, tensile properties, and creep resistance. Metallurgical
and Materials Transactions: A, 2015. 46(8): p. 3543-3554.
141. S. Zhu, et al., Microstructure and creep behavior of high-pressure die-cast magnesium
alloy AE44. Metallurgical and Materials Transactions A, 2012. 43(11): p. 4137-4144.
Chapter 2 Literature Review
91
142. A. Grzybowska and K. Braszczyńska-Malik, Microstructural characterization of the
as-cast AZ91 magnesium alloy with rare earth elements. Archives of Foundry
Engineering, 2012. 12: p. 23-26.
143. K.N. Braszczyńska-Malik, Mg-Al-RE magnesium alloys for high-pressure die-casting.
Archives of Foundry Engineering, 2014. 14(2): p. 49-52.
144. B.R. Powell, et al., Microstructure and creep behavior in AE42 magnesium die-casting
alloy. The Journal of The Minerals & Materials Society (TMS), 2002. 54(8): p. 34-38.
145. G. Pettersen, et al., Microstructure of a pressure die cast magnesium—4wt.%
aluminium alloy modified with rare earth additions. Materials Science and
Engineering: A, 1996. 207(1): p. 115-120.
146. M.S. Dargusch, et al., Microstructure and mechanical properties of high pressure die
cast magnesium alloy AE42 with 1% strontium. International Journal of Cast Metals
Research, 2004. 17(3): p. 170-173.
147. S.M. Zhu, et al., Microstructural analysis of the creep resistance of die-cast Mg–4Al–
2RE alloy. Scripta Materialia, 2008. 58(6): p. 477-480.
148. I.P. Moreno, et al., Microstructural stability and creep of rare-earth containing
magnesium alloys. Scripta Materialia, 2003. 48(8): p. 1029-1034.
149. J.H. Zhang, et al., Effect of Ce on microstructure, mechanical properties and corrosion
behavior of high-pressure die-cast Mg–4Al-based alloy. Journal of Alloys and
Compounds, 2011. 509(3): p. 1069-1078.
150. A. Kiełbus, Microstructure of AE44 magnesium alloy before and after hot-chamber die
casting. Journal of Achievements in Materials and Manufacturing Engineering, 2007.
20(1-2): p. 459-462.
151. L.Y. Wei and G.L. Dunlop, The solidification behaviour of Mg-Al-rare earth alloys.
Journal of Alloys and Compounds, 1996. 232(1–2): p. 264-268.
Chapter 2 Literature Review
92
152. M.S. Dargusch, et al., Microstructural analysis of the improved creep resistance of a
die-cast magnesium–aluminium–rare earth alloy by strontium additions. Scripta
Materialia, 2009. 60(2): p. 116-119.
153. A. Żydek, J. Kamieniak, and K.N. Braszczyńska-Malik, Evolution of Mg-5Al-0.4 Mn
microstructure after rare earth elements addition. Archives of Foundry Engineering,
2011. 11(2): p. 157-160.
154. K. Walter and L.J. Sham, Self-consistent equations including exchange and correlation
effects. Physical Review 1965. 140(4A): p. A1133.
155. Q. Yang, et al., First-principles phase stability and elastic properties of Al–La binary
system intermetallic compounds. Intermetallics, 2015. 60: p. 92-97.
156. J. Bai, et al., Microstructures and creep properties of Mg–4Al–(1–4)La alloys produced
by different casting techniques. Materials Science and Engineering: A, 2012. 552: p.
472-480.
157. P. Bakke, et al., Magnesium technology 2005. Proceedings of the Minerals, Metals &
Materials Society (TMS), 2005: p. 291.
158. P. Bakke and H. Westengen, The role of rare earth elements in structure and property
control of magnesium die casting alloys. Essential Readings in Magnesium
Technology, 2005: p. 313-318.
159. J. Zhang, et al., Structure stability and mechanical properties of Mg–Al-based alloy
modified with Y-rich and Ce-rich misch metals. Journal of Alloys and Compounds,
2011. 509(20): p. L187-L193.
160. J. Zhang, et al., Structure stability and mechanical properties of high-pressure die-cast
Mg–Al–La–Y-based alloy. Materials Science and Engineering: A, 2012. 531: p. 70-75.
Chapter 2 Literature Review
93
161. G.D. Tong, H.F. Liu, and Y.H. Liu, Effect of rare earth additions on microstructure
and mechanical properties of AZ91 magnesium alloys. Transactions of Nonferrous
Metals Society of China, 2010. 20: p. s336-s340.
162. I.A. Anyanwu, et al., Effect of substituting cerium-rich mischmetal with lanthanum on
high temperature properties of die-cast Mg–Zn–Al–Ca–RE alloys. Materials Science
and Engineering: A, 2004. 380(1): p. 93-99.
163. J.H. Zhang, et al., Microstructure, tensile properties, and creep behavior of high-
pressure die-cast Mg–4Al–4RE–0.4 Mn (RE= La, Ce) alloys. Journal of Materials
Science, 2009. 44(8): p. 2046-2054.
164. E.G. Sieracki, J.J. Velazquez, and K. Kabiri, Compressive stress retention
characteristics of high pressure die casting magnesium alloys. 1996, SAE Technical
Paper.
165. J. Dai, et al., The formation of intermetallic compounds during interdiffusion of Mg–
Al/Mg–Ce diffusion couples. Journal of Alloys and Compounds, 2015. 619: p. 411-416.
166. X. Tian, et al., The microstructure and mechanical properties of Mg-3Al-3RE alloys.
Journal of Alloys and Compounds, 2008. 465(1–2): p. 412-416.
167. Y. Yi, Y. Fan, and Y. Tang, Effect of lanthanum-praseodymium-cerium mischmetal on
mechanical properties and microstructure of Mg-Al alloys. Journal of Wuhan
University of Technology-Mater. Sci. Ed., 2011. 26(1): p. 102-104.
168. S. Gavras, et al., Microstructure and property evaluation of high-pressure die-cast Mg–
La–rare earth (Nd, Y or Gd) alloys. Journal of Alloys and Compounds, 2014. 597: p.
21-29.
169. T. Rzychoń and A. Kiełbus, Microstructure and tensile properties of sand cast and die
cast AE44 magnesium alloy. Archives of Metallurgy and Materials, 2008. 53(3): p. 901-
907.
Chapter 2 Literature Review
94
170. M. Easton, C. Davidson, and D. StJohn, Grain morphology of as-cast wrought
aluminium alloys. Materials Transactions, 2011. 52(5): p. 842-847.
171. Y.Z. Lü, et al., Effects of rare earths on the microstructure, properties and fracture
behavior of Mg–Al alloys. Materials Science and Engineering: A, 2000. 278(1): p. 66-
76.
172. M.S. Turhal and T. Savaşkan, Relationships between secondary dendrite arm spacing
and mechanical properties of Zn-40Al-Cu alloys. Journal of Materials Science, 2003.
38(12): p. 2639-2646.
173. M.D. Nave, A.K. Dahle, and D.H. StJohn, The effect of solidification rate on the
structure of magnesium-aluminium eutectic grains. International Journal of Cast Metals
Research, 2000. 13: p. 1-7.
174. A.K. Dahle, et al., Development of the as-cast microstructure in magnesium–aluminium
alloys. Journal of Light Metals, 2001. 1(1): p. 61-72.
175. S. Barbagallo, et al., Divorced eutectic in a HPDC magnesium–aluminum alloy. Journal
of Alloys and Compounds, 2004. 378(1): p. 226-232.
176. A.A. Luo and K. Sadayappan, Technology for magnesium castings. American Foundry
Society, IL, 2011. 29: p. 47.
177. A.A. Luo, Magnesium casting technology for structural applications. Journal of
Magnesium and Alloys, 2013. 1(1): p. 2-22.
178. A.A. Luo, Recent magnesium alloy development for elevated temperature applications.
International Materials Reviews, 2004. 49(1): p. 13-30.
179. W. Xiao, et al., Microstructural characterization of high pressure die cast Mg-Zn-Al-
RE alloys. Materials Characterization, 2012. 65: p. 28-36.
Chapter 2 Literature Review
95
180. M. Pekguleryuz and M. Celikin, Creep resistance in magnesium alloys. International
Materials Reviews, 2010. 55(4): p. 197-217.
181. M. Bamberger and G. Dehm, Trends in the development of new Mg alloys. Annu. Rev.
Mater. Res., 2008. 38: p. 505-533.
182. K. Meshinchi Asl, A. Masoudi, and F. Khomamizadeh, The effect of different rare earth
elements content on microstructure, mechanical and wear behavior of Mg–Al–Zn alloy.
Materials Science and Engineering: A, 2010. 527(7–8): p. 2027-2035.
183. J.L. Wang, et al., Investigations of the properties of Mg–5Al–0.3 Mn–xCe (x= 0–3,
wt.%) alloys. Journal of Alloys and Compounds, 2009. 477(1): p. 341-345.
184. R. Mahmudi, F. Kabirian, and Z. Nematollahi, Microstructural stability and high-
temperature mechanical properties of AZ91 and AZ91 + 2RE magnesium alloys.
Materials & Design, 2011. 32(5): p. 2583-2589.
185. F. Khomamizadeh, B. Nami, and S. Khoshkhooei, Effect of rare-earth element
additions on high-temperature mechanical properties of AZ91 magnesium alloy.
Metallurgical and Materials Transactions A, 2005. 36(12): p. 3489-3494.
186. A.K. Chaubey, et al., Microstructure and mechanical properties of Mg–Al-based alloy
modified with cerium. Materials Science and Engineering: A, 2015. 625: p. 46-49.
187. K.M. Asl, Magnesium alloys - design, processing and properties: Improving the
propoerties of magnesium alloy for high temperature applications. Improving the
Properties of Magnesium Alloys for High Temperature Applications. 2011: InTech.
526.
188. M.S. Dargusch, et al., Elevated temperature mechanical properties and microstructures
of high pressure die cast magnesium AZ91 alloy cast with different section thicknesses.
Materials Science and Engineering: A, 2009. 523(1): p. 282-288.
Chapter 2 Literature Review
96
189. B.R. Powell, et al., The relationship between microstructure and creep behavior in
AE42 magnesium die casting alloy. Essential Readings in Magnesium Technology,
2014: p. 275-281.
190. S.M. Zhu, et al., Primary creep of die-cast magnesium–rare Earth based alloys.
Metallurgical and Materials Transactions A, 2009. 40(9): p. 2036-2041.
191. R.L. Bell and T.G. Langdon, An investigation of grain-boundary sliding during creep.
Journal of Materials Science, 1967. 2(4): p. 313-323.
192. R. Labusch and R. Schettler, On the electronic states at dislocations in germanium.
physica Status Solidi (a), 1972. 9(2): p. 455-468.
193. K. Maruyama, M. Suzuki, and H. Sato, Creep strength of magnesium-based alloys.
Metallurgical and Materials Transactions A, 2002. 33(13): p. 875-882.
194. S. Zhu, et al., The relationship between microstructure and creep resistance in die-cast
magnesium–rare earth alloys. Scripta Materialia, 2010. 63(7): p. 698-703.
195. L.Y. Wei, G.L. Dunlop, and H. Westengen, Age hardening and precipitation in a cast
magnesium-rare-earth alloy. Journal of Materials Science, 1996. 31(2): p. 387-397.
196. W. Xiao, et al., The influences of rare earth content on the microstructure and
mechanical properties of Mg–7Zn–5Al alloy. Materials & Design, 2010. 31(7): p. 3542-
3549.
197. V.G. Tkachenko, et al., Design and microstructural analysis of magnesium alloys for
dynamical applications. Journal of Materials Science, 2011. 46(14): p. 4880-4895.
198. J.W. Martin, Micromechanisms in particle-hardened alloys. 1980: CUP Archive.
199. L.M. Brown and D.R. Clarke, Work hardening due to internal stresses in composite
materials. Acta Metallurgica, 1975. 23(7): p. 821-830.
Chapter 2 Literature Review
97
200. M.A. Gharghouri, et al., Study of the mechanical properties of Mg-7.7 at.% Al by in-
situ neutron diffraction. Philosophical Magazine A, 1999. 79(7): p. 1671-1695.
201. D.H. StJohn, et al., Grain refinement of magnesium alloys. Metallurgical and Materials
Transactions A, 2005. 36(7): p. 1669-1679.
202. D. Qiu, et al., A new approach to designing a grain refiner for Mg casting alloys and
its use in Mg–Y-based alloys. Acta Materialia, 2009. 57(10): p. 3052-3059.
203. Y. Ali, et al., Current research progress in grain refinement of cast magnesium alloys:
a review article. Journal of Alloys and Compounds, 2015. 619: p. 639-651.
204. M.A. Easton, et al., Recent advances in grain refinement of light metals and alloys.
Current Opinion in Solid State and Materials Science, 2016. 20(1): p. 13-24.
205. D. Turnbull and B. Vonnegut, Nucleation catalysis. Industrial & Engineering
Chemistry, 1952. 44(6): p. 1292-1298.
206. B.L. Bramfitt, The effect of carbide and nitride additions on the heterogeneous
nucleation behavior of liquid iron. Metallurgical Transactions, 1970. 1(7): p. 1987-
1995.
207. P.M. Kelly and M. Zhang. Edge-to-edge matching-a new approach to the morphology
and crystallography of precipitates. in Materials Forum. 1999. Pergamon Press.
208. A.L. Greer, et al., Modelling of inoculation of metallic melts: application to grain
refinement of aluminium by Al–Ti–B. Acta Materialia, 2000. 48(11): p. 2823-2835.
209. M. Qian and A. Das, Grain refinement of magnesium alloys by zirconium: formation of
equiaxed grains. Scripta Materialia, 2006. 54(5): p. 881-886.
210. D. Turnbull and R. Vonnegut, Grain refining of superalloy and its alloys using
inoculants. Ind Eng Chem, 1952. 44: p. 1292-1294.
Chapter 2 Literature Review
98
211. M.X. Zhang, et al., Crystallographic study of grain refinement in aluminum alloys
using the edge-to-edge matching model. Acta Materialia, 2005. 53(5): p. 1427-1438.
212. M.X. Zhang, et al., Crystallography of grain refinement in Mg–Al based alloys. Acta
Materialia, 2005. 53(11): p. 3261-3270.
213. N. Iqbal, et al., Real-time observation of grain nucleation and growth during
solidification of aluminium alloys. Acta Materialia, 2005. 53(10): p. 2875-2880.
214. B.C. Larson, et al., Three-dimensional X-ray structural microscopy with submicrometre
resolution. Nature, 2002. 415(6874): p. 887-890.
215. E.M. Lauridsen, H.F. Poulsen, and D.J. Jensen. Recrystallization studies using the
3DXRD microscope. in First Joint Chinese-Danish Symposium: Characterisation of
Microstructures Extended Abstracts. 2002.
216. D. Qiu and M.X. Zhang, The nucleation crystallography and wettability of Mg grains
on active Al2Y inoculants in an Mg–10 wt% Y alloy. Journal of Alloys and Compounds,
2014. 586: p. 39-44.
217. D. Qiu, M.X. Zhang, and P.M. Kelly, Crystallography of heterogeneous nucleation of
Mg grains on Al 2 Y nucleation particles in an Mg–10wt.% Y alloy. Scripta Materialia,
2009. 61(3): p. 312-315.
218. Z.T. Jiang, et al., Role of Al modification on the microstructure and mechanical
properties of as-cast Mg–6Ce alloys. Materials Science and Engineering: A, 2015. 645:
p. 57-64.
219. B. Jiang, et al., The effect of addition of cerium on the grain refinement of Mg–3Al–1Zn
cast alloy. Journal of Materials Research, 2013. 28(19): p. 2694-2700.
220. W.L. Xiao, et al., Effects of cerium on the microstructure and mechanical properties of
Mg–20Zn–8Al alloy. Materials Science and Engineering: A, 2008. 474(1–2): p. 317-
322.

Chapter 3 Methodology
99
Chapter 3
Methodology
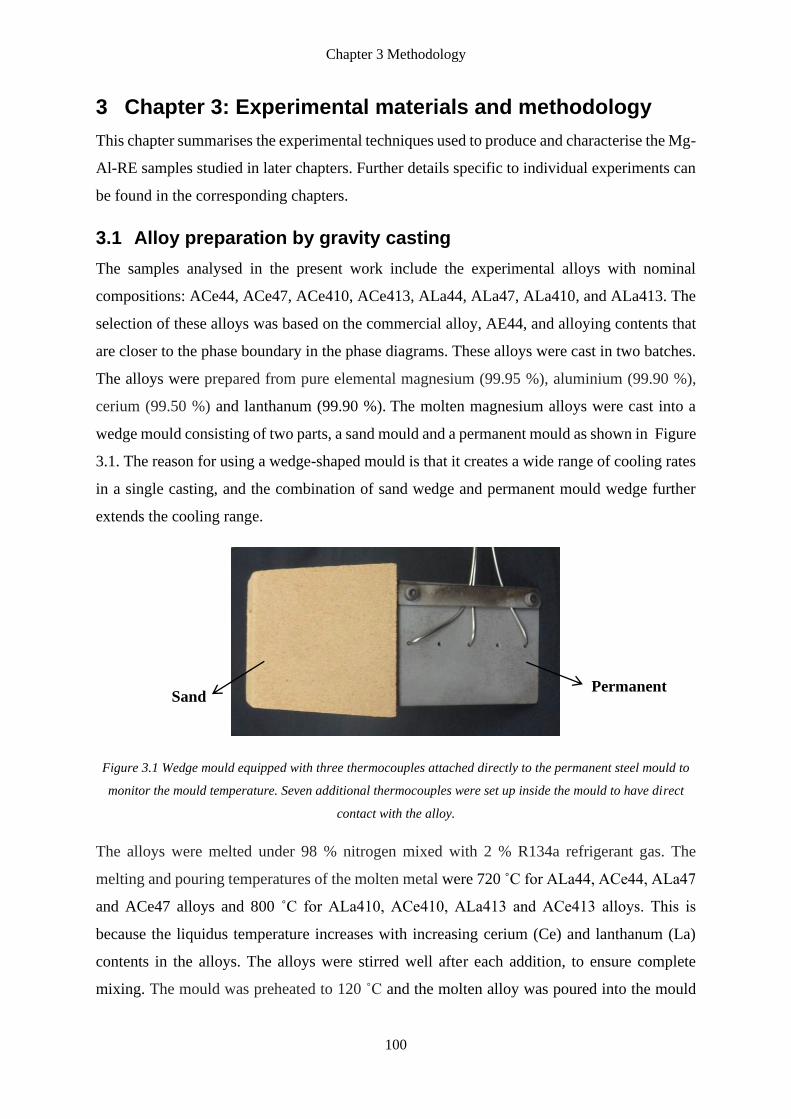
Chapter 3 Methodology
100
3 Chapter 3: Experimental materials and methodology
This chapter summarises the experimental techniques used to produce and characterise the Mg-
Al-RE samples studied in later chapters. Further details specific to individual experiments can
be found in the corresponding chapters.
3.1 Alloy preparation by gravity casting
The samples analysed in the present work include the experimental alloys with nominal
compositions: ACe44, ACe47, ACe410, ACe413, ALa44, ALa47, ALa410, and ALa413. The
selection of these alloys was based on the commercial alloy, AE44, and alloying contents that
are closer to the phase boundary in the phase diagrams. These alloys were cast in two batches.
The alloys were prepared from pure elemental magnesium (99.95 %), aluminium (99.90 %),
cerium (99.50 %) and lanthanum (99.90 %). The molten magnesium alloys were cast into a
wedge mould consisting of two parts, a sand mould and a permanent mould as shown in Figure
3.1. The reason for using a wedge-shaped mould is that it creates a wide range of cooling rates
in a single casting, and the combination of sand wedge and permanent mould wedge further
extends the cooling range.
Figure 3.1 Wedge mould equipped with three thermocouples attached directly to the permanent steel mould to
monitor the mould temperature. Seven additional thermocouples were set up inside the mould to have direct
contact with the alloy.
The alloys were melted under 98 % nitrogen mixed with 2 % R134a refrigerant gas. The
melting and pouring temperatures of the molten metal were 720 ˚C for ALa44, ACe44, ALa47
and ACe47 alloys and 800 ˚C for ALa410, ACe410, ALa413 and ACe413 alloys. This is
because the liquidus temperature increases with increasing cerium (Ce) and lanthanum (La)
contents in the alloys. The alloys were stirred well after each addition, to ensure complete
mixing. The mould was preheated to 120 ˚C and the molten alloy was poured into the mould
Sand
moul
d
Permanent
mould
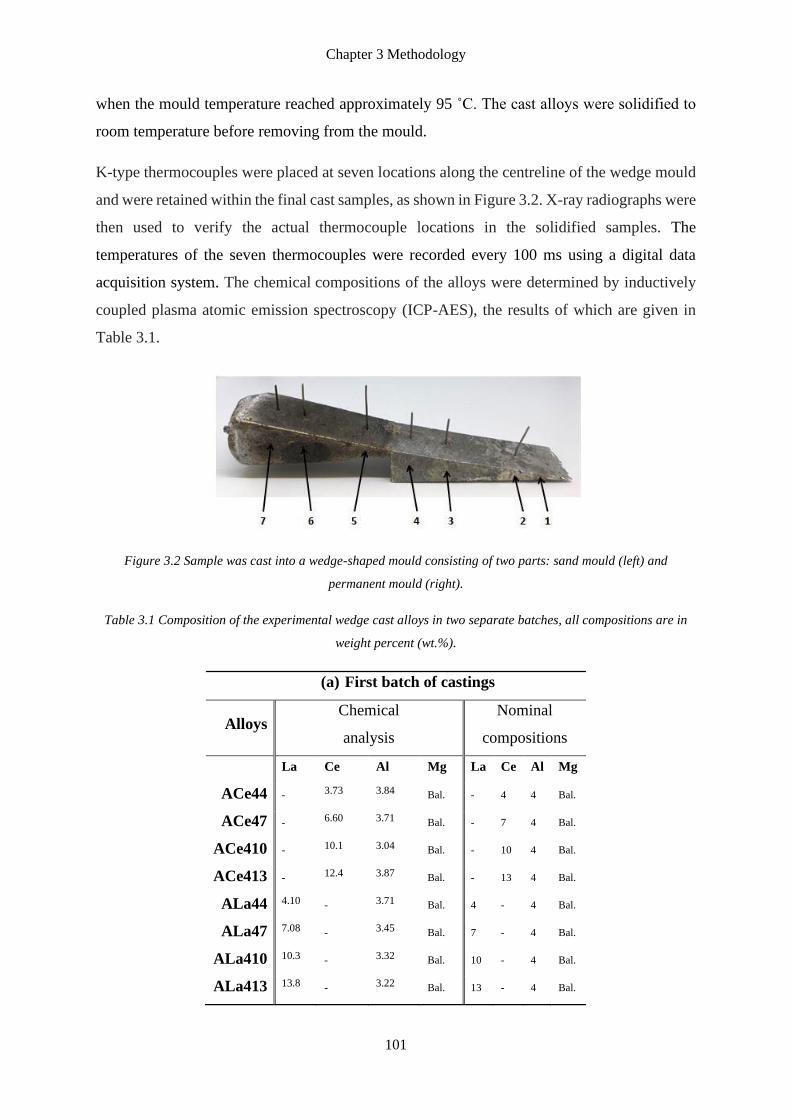
Chapter 3 Methodology
101
when the mould temperature reached approximately 95 ˚C. The cast alloys were solidified to
room temperature before removing from the mould.
K-type thermocouples were placed at seven locations along the centreline of the wedge mould
and were retained within the final cast samples, as shown in Figure 3.2. X-ray radiographs were
then used to verify the actual thermocouple locations in the solidified samples. The
temperatures of the seven thermocouples were recorded every 100 ms using a digital data
acquisition system. The chemical compositions of the alloys were determined by inductively
coupled plasma atomic emission spectroscopy (ICP-AES), the results of which are given in
Table 3.1.
Figure 3.2 Sample was cast into a wedge-shaped mould consisting of two parts: sand mould (left) and
permanent mould (right).
Table 3.1 Composition of the experimental wedge cast alloys in two separate batches, all compositions are in
weight percent (wt.%).
(a) First batch of castings
Alloys Chemical
analysis
Nominal
compositions
La Ce Al Mg La Ce Al Mg
ACe44 - 3.73 3.84 Bal. - 4 4 Bal.
ACe47 - 6.60 3.71 Bal. - 7 4 Bal.
ACe410 - 10.1 3.04 Bal. - 10 4 Bal.
ACe413 - 12.4 3.87 Bal. - 13 4 Bal.
ALa44 4.10 - 3.71 Bal. 4 - 4 Bal.
ALa47 7.08 - 3.45 Bal. 7 - 4 Bal.
ALa410 10.3 - 3.32 Bal. 10 - 4 Bal.
ALa413 13.8 - 3.22 Bal. 13 - 4 Bal.
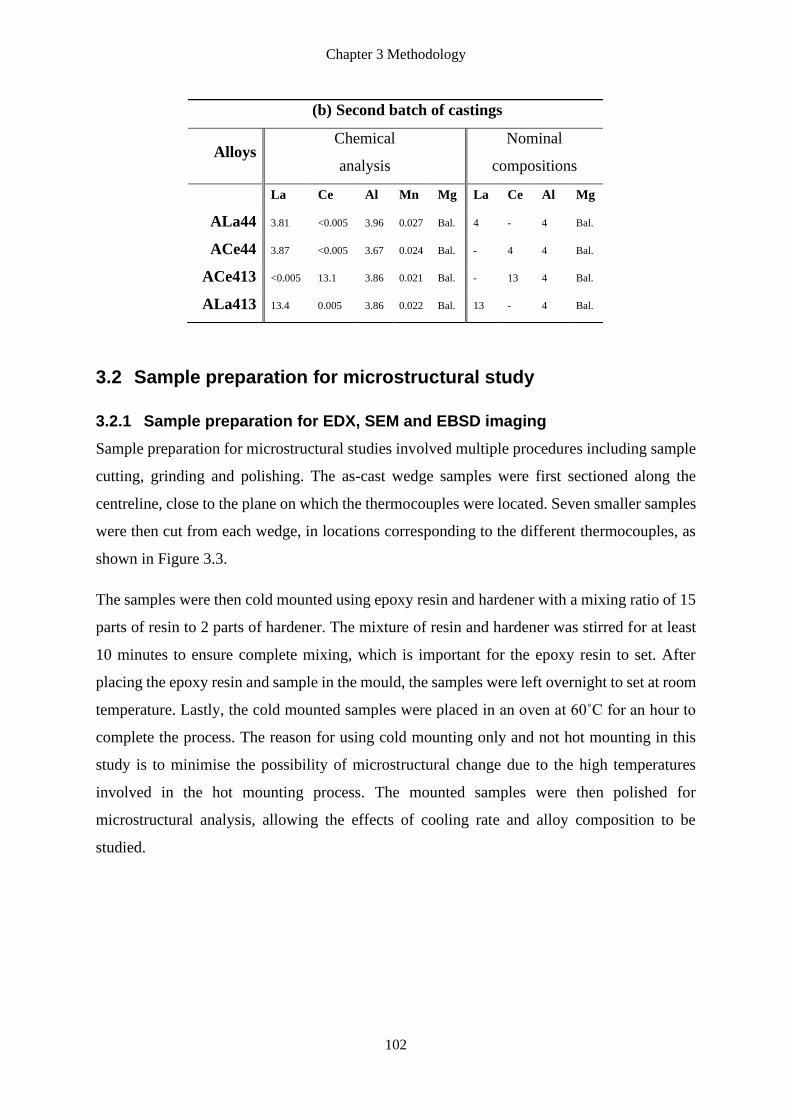
Chapter 3 Methodology
102
3.2 Sample preparation for microstructural study
3.2.1 Sample preparation for EDX, SEM and EBSD imaging
Sample preparation for microstructural studies involved multiple procedures including sample
cutting, grinding and polishing. The as-cast wedge samples were first sectioned along the
centreline, close to the plane on which the thermocouples were located. Seven smaller samples
were then cut from each wedge, in locations corresponding to the different thermocouples, as
shown in Figure 3.3.
The samples were then cold mounted using epoxy resin and hardener with a mixing ratio of 15
parts of resin to 2 parts of hardener. The mixture of resin and hardener was stirred for at least
10 minutes to ensure complete mixing, which is important for the epoxy resin to set. After
placing the epoxy resin and sample in the mould, the samples were left overnight to set at room
temperature. Lastly, the cold mounted samples were placed in an oven at 60˚C for an hour to
complete the process. The reason for using cold mounting only and not hot mounting in this
study is to minimise the possibility of microstructural change due to the high temperatures
involved in the hot mounting process. The mounted samples were then polished for
microstructural analysis, allowing the effects of cooling rate and alloy composition to be
studied.
(b) Second batch of castings
Alloys Chemical
analysis
Nominal
compositions
La Ce Al Mn Mg La Ce Al Mg
ALa44 3.81 <0.005 3.96 0.027 Bal. 4 - 4 Bal.
ACe44 3.87 <0.005 3.67 0.024 Bal. - 4 4 Bal.
ACe413 <0.005 13.1 3.86 0.021 Bal. - 13 4 Bal.
ALa413 13.4 0.005 3.86 0.022 Bal. 13 - 4 Bal.
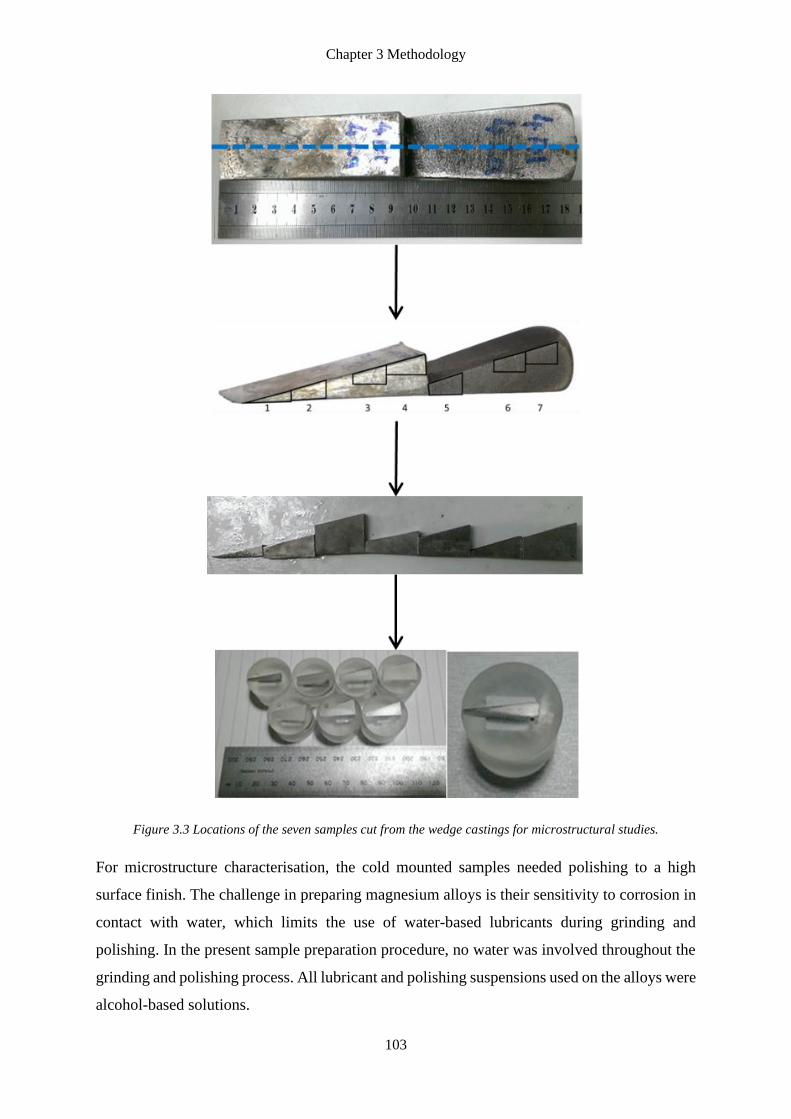
Chapter 3 Methodology
103
Figure 3.3 Locations of the seven samples cut from the wedge castings for microstructural studies.
For microstructure characterisation, the cold mounted samples needed polishing to a high
surface finish. The challenge in preparing magnesium alloys is their sensitivity to corrosion in
contact with water, which limits the use of water-based lubricants during grinding and
polishing. In the present sample preparation procedure, no water was involved throughout the
grinding and polishing process. All lubricant and polishing suspensions used on the alloys were
alcohol-based solutions.
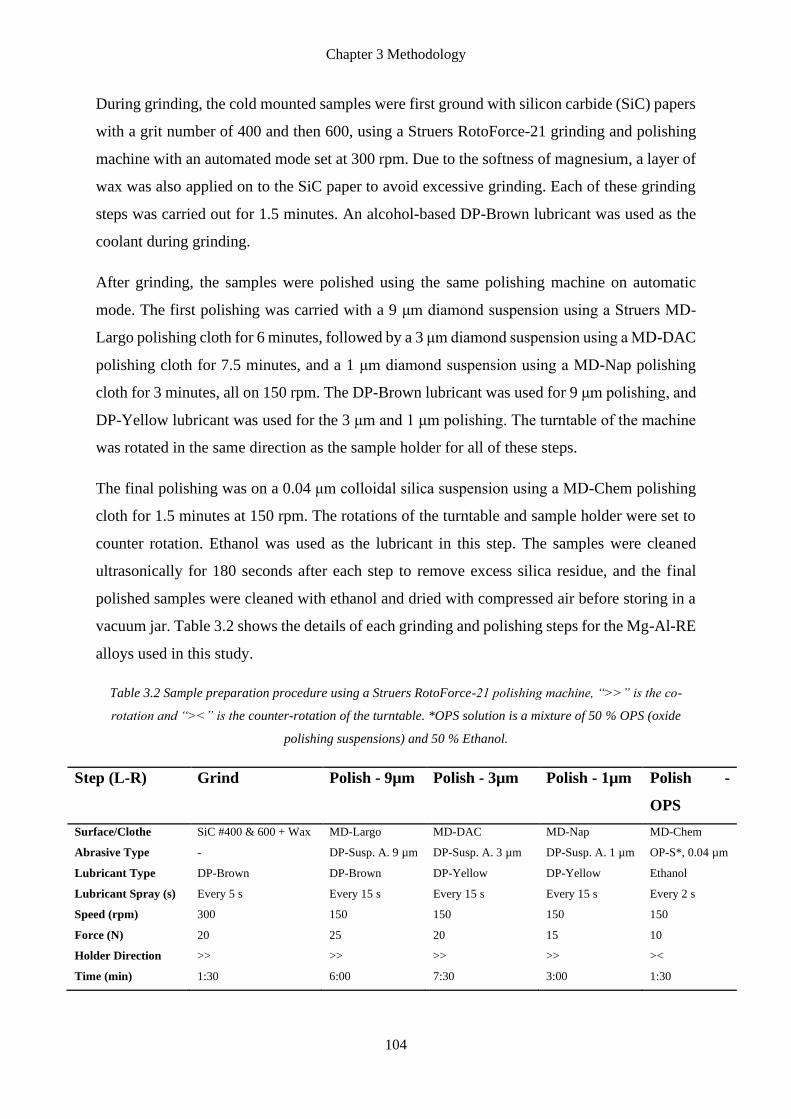
Chapter 3 Methodology
104
During grinding, the cold mounted samples were first ground with silicon carbide (SiC) papers
with a grit number of 400 and then 600, using a Struers RotoForce-21 grinding and polishing
machine with an automated mode set at 300 rpm. Due to the softness of magnesium, a layer of
wax was also applied on to the SiC paper to avoid excessive grinding. Each of these grinding
steps was carried out for 1.5 minutes. An alcohol-based DP-Brown lubricant was used as the
coolant during grinding.
After grinding, the samples were polished using the same polishing machine on automatic
mode. The first polishing was carried with a 9 μm diamond suspension using a Struers MD-
Largo polishing cloth for 6 minutes, followed by a 3 μm diamond suspension using a MD-DAC
polishing cloth for 7.5 minutes, and a 1 μm diamond suspension using a MD-Nap polishing
cloth for 3 minutes, all on 150 rpm. The DP-Brown lubricant was used for 9 μm polishing, and
DP-Yellow lubricant was used for the 3 μm and 1 μm polishing. The turntable of the machine
was rotated in the same direction as the sample holder for all of these steps.
The final polishing was on a 0.04 μm colloidal silica suspension using a MD-Chem polishing
cloth for 1.5 minutes at 150 rpm. The rotations of the turntable and sample holder were set to
counter rotation. Ethanol was used as the lubricant in this step. The samples were cleaned
ultrasonically for 180 seconds after each step to remove excess silica residue, and the final
polished samples were cleaned with ethanol and dried with compressed air before storing in a
vacuum jar. Table 3.2 shows the details of each grinding and polishing steps for the Mg-Al-RE
alloys used in this study.
Table 3.2 Sample preparation procedure using a Struers RotoForce-21 polishing machine, “>>” is the co-
rotation and “><” is the counter-rotation of the turntable. *OPS solution is a mixture of 50 % OPS (oxide
polishing suspensions) and 50 % Ethanol.
Step (L-R) Grind Polish - 9µm Polish - 3µm Polish - 1µm Polish -
OPS
Surface/Clothe SiC #400 & 600 + Wax MD-Largo MD-DAC MD-Nap MD-Chem
Abrasive Type - DP-Susp. A. 9 µm DP-Susp. A. 3 µm DP-Susp. A. 1 µm OP-S*, 0.04 µm
Lubricant Type DP-Brown DP-Brown DP-Yellow DP-Yellow Ethanol
Lubricant Spray (s) Every 5 s Every 15 s Every 15 s Every 15 s Every 2 s
Speed (rpm) 300 150 150 150 150
Force (N) 20 25 20 15 10
Holder Direction >> >> >> >> ><
Time (min) 1:30 6:00 7:30 3:00 1:30
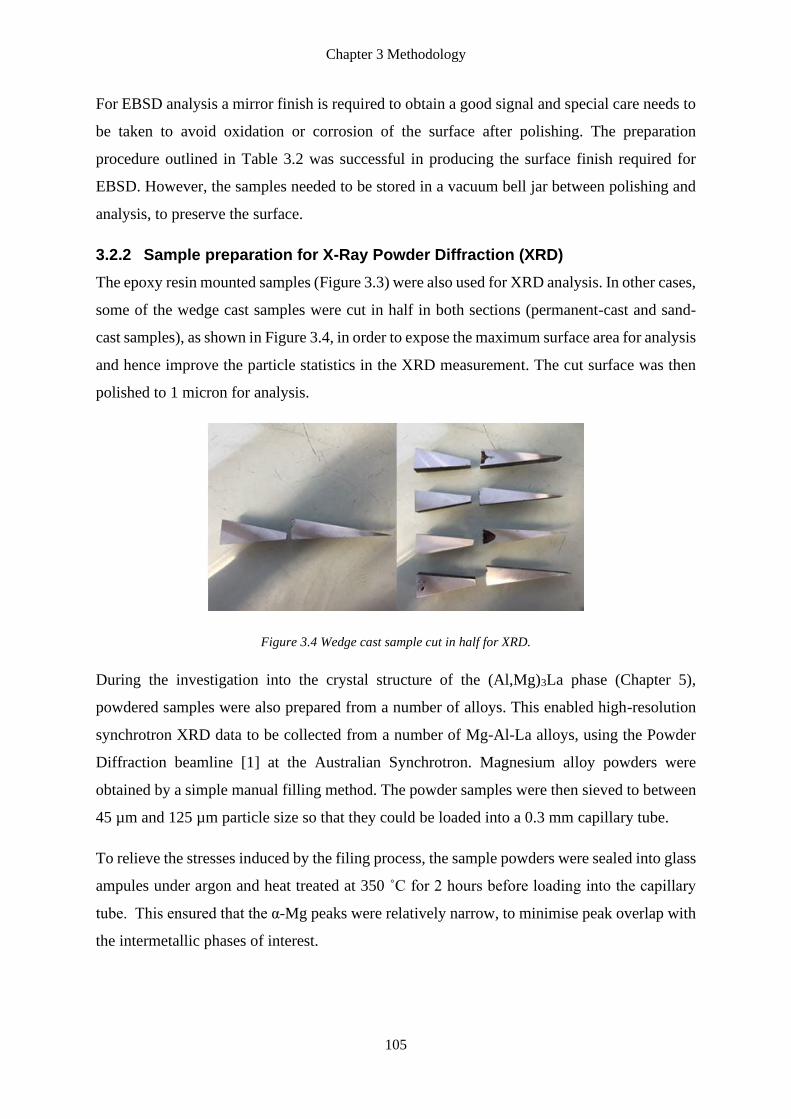
Chapter 3 Methodology
105
For EBSD analysis a mirror finish is required to obtain a good signal and special care needs to
be taken to avoid oxidation or corrosion of the surface after polishing. The preparation
procedure outlined in Table 3.2 was successful in producing the surface finish required for
EBSD. However, the samples needed to be stored in a vacuum bell jar between polishing and
analysis, to preserve the surface.
3.2.2 Sample preparation for X-Ray Powder Diffraction (XRD)
The epoxy resin mounted samples (Figure 3.3) were also used for XRD analysis. In other cases,
some of the wedge cast samples were cut in half in both sections (permanent-cast and sand-
cast samples), as shown in Figure 3.4, in order to expose the maximum surface area for analysis
and hence improve the particle statistics in the XRD measurement. The cut surface was then
polished to 1 micron for analysis.
Figure 3.4 Wedge cast sample cut in half for XRD.
During the investigation into the crystal structure of the (Al,Mg)3La phase (Chapter 5),
powdered samples were also prepared from a number of alloys. This enabled high-resolution
synchrotron XRD data to be collected from a number of Mg-Al-La alloys, using the Powder
Diffraction beamline [1] at the Australian Synchrotron. Magnesium alloy powders were
obtained by a simple manual filling method. The powder samples were then sieved to between
45 µm and 125 µm particle size so that they could be loaded into a 0.3 mm capillary tube.
To relieve the stresses induced by the filing process, the sample powders were sealed into glass
ampules under argon and heat treated at 350 ˚C for 2 hours before loading into the capillary
tube. This ensured that the α-Mg peaks were relatively narrow, to minimise peak overlap with
the intermetallic phases of interest.
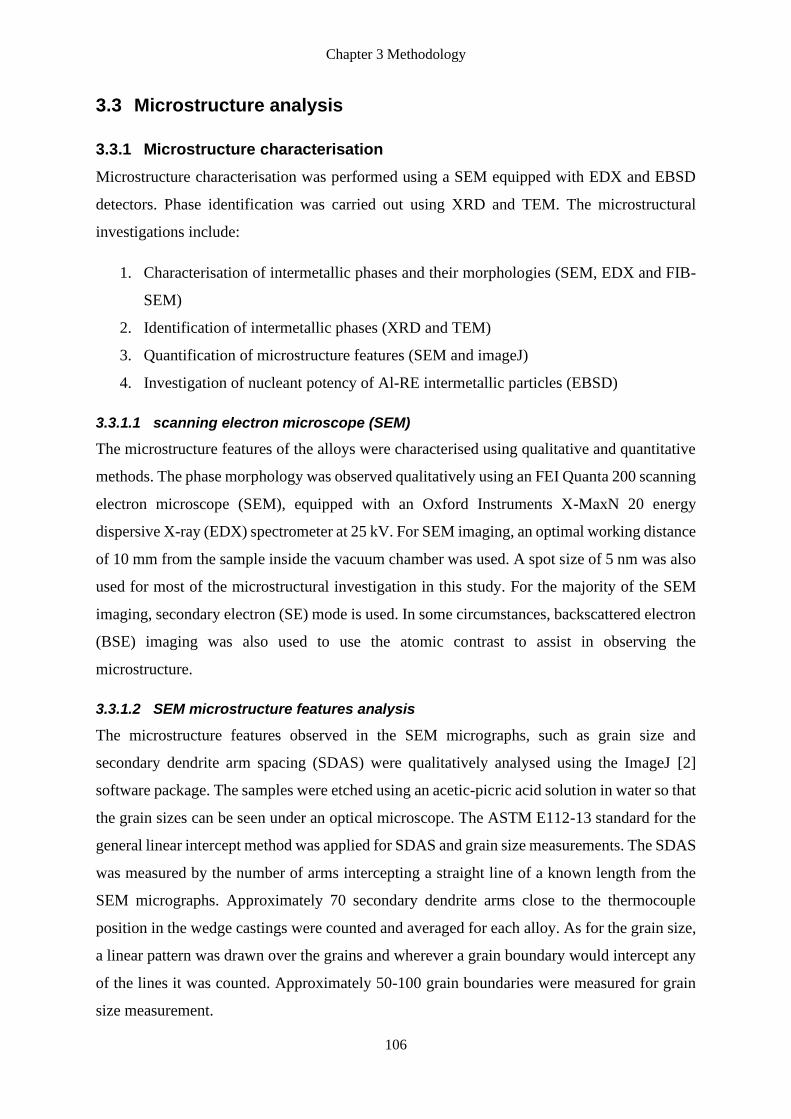
Chapter 3 Methodology
106
3.3 Microstructure analysis
3.3.1 Microstructure characterisation
Microstructure characterisation was performed using a SEM equipped with EDX and EBSD
detectors. Phase identification was carried out using XRD and TEM. The microstructural
investigations include:
1. Characterisation of intermetallic phases and their morphologies (SEM, EDX and FIB-
SEM)
2. Identification of intermetallic phases (XRD and TEM)
3. Quantification of microstructure features (SEM and imageJ)
4. Investigation of nucleant potency of Al-RE intermetallic particles (EBSD)
3.3.1.1 scanning electron microscope (SEM)
The microstructure features of the alloys were characterised using qualitative and quantitative
methods. The phase morphology was observed qualitatively using an FEI Quanta 200 scanning
electron microscope (SEM), equipped with an Oxford Instruments X-MaxN 20 energy
dispersive X-ray (EDX) spectrometer at 25 kV. For SEM imaging, an optimal working distance
of 10 mm from the sample inside the vacuum chamber was used. A spot size of 5 nm was also
used for most of the microstructural investigation in this study. For the majority of the SEM
imaging, secondary electron (SE) mode is used. In some circumstances, backscattered electron
(BSE) imaging was also used to use the atomic contrast to assist in observing the
microstructure.
3.3.1.2 SEM microstructure features analysis
The microstructure features observed in the SEM micrographs, such as grain size and
secondary dendrite arm spacing (SDAS) were qualitatively analysed using the ImageJ [2]
software package. The samples were etched using an acetic-picric acid solution in water so that
the grain sizes can be seen under an optical microscope. The ASTM E112-13 standard for the
general linear intercept method was applied for SDAS and grain size measurements. The SDAS
was measured by the number of arms intercepting a straight line of a known length from the
SEM micrographs. Approximately 70 secondary dendrite arms close to the thermocouple
position in the wedge castings were counted and averaged for each alloy. As for the grain size,
a linear pattern was drawn over the grains and wherever a grain boundary would intercept any
of the lines it was counted. Approximately 50-100 grain boundaries were measured for grain
size measurement.
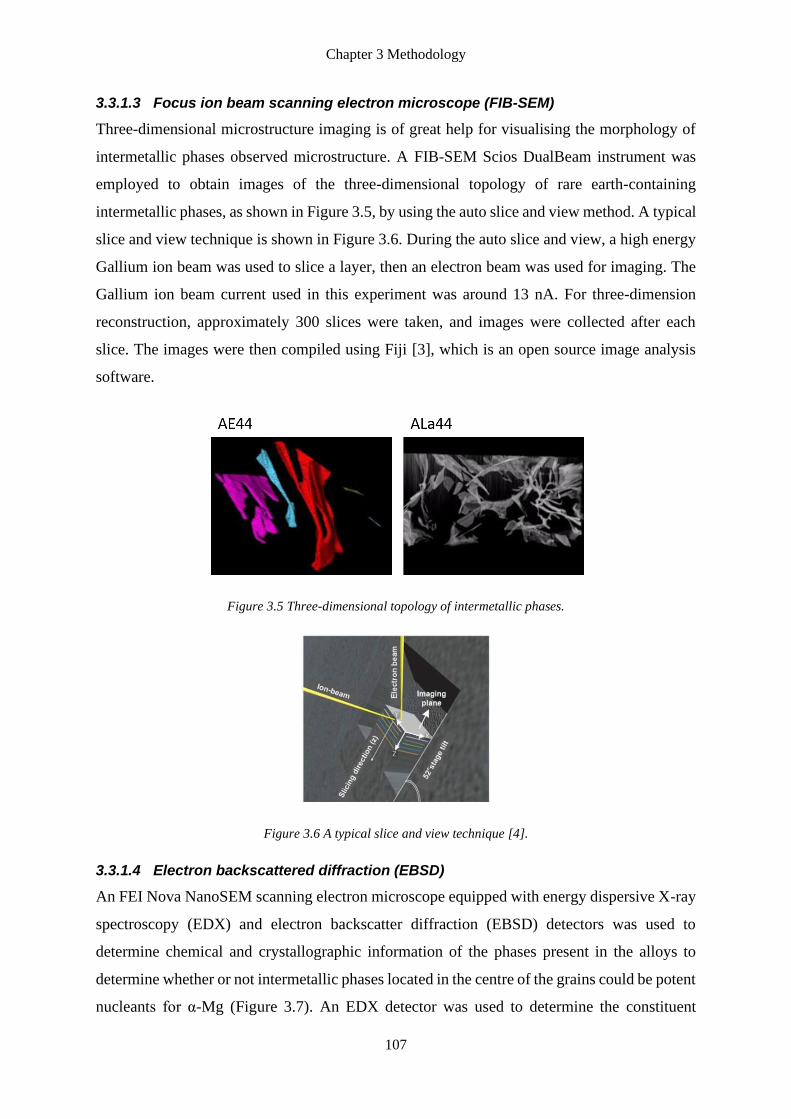
Chapter 3 Methodology
107
3.3.1.3 Focus ion beam scanning electron microscope (FIB-SEM)
Three-dimensional microstructure imaging is of great help for visualising the morphology of
intermetallic phases observed microstructure. A FIB-SEM Scios DualBeam instrument was
employed to obtain images of the three-dimensional topology of rare earth-containing
intermetallic phases, as shown in Figure 3.5, by using the auto slice and view method. A typical
slice and view technique is shown in Figure 3.6. During the auto slice and view, a high energy
Gallium ion beam was used to slice a layer, then an electron beam was used for imaging. The
Gallium ion beam current used in this experiment was around 13 nA. For three-dimension
reconstruction, approximately 300 slices were taken, and images were collected after each
slice. The images were then compiled using Fiji [3], which is an open source image analysis
software.
Figure 3.5 Three-dimensional topology of intermetallic phases.
Figure 3.6 A typical slice and view technique [4].
3.3.1.4 Electron backscattered diffraction (EBSD)
An FEI Nova NanoSEM scanning electron microscope equipped with energy dispersive X-ray
spectroscopy (EDX) and electron backscatter diffraction (EBSD) detectors was used to
determine chemical and crystallographic information of the phases present in the alloys to
determine whether or not intermetallic phases located in the centre of the grains could be potent
nucleants for α-Mg (Figure 3.7). An EDX detector was used to determine the constituent
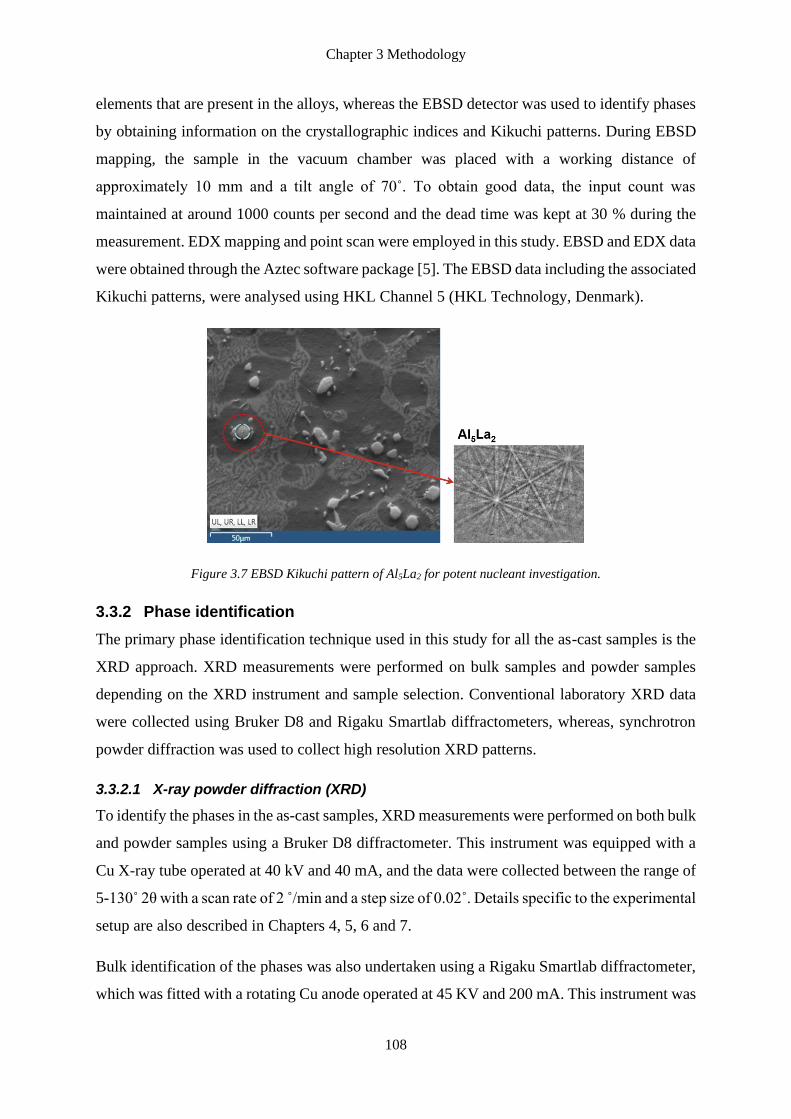
Chapter 3 Methodology
108
elements that are present in the alloys, whereas the EBSD detector was used to identify phases
by obtaining information on the crystallographic indices and Kikuchi patterns. During EBSD
mapping, the sample in the vacuum chamber was placed with a working distance of
approximately 10 mm and a tilt angle of 70˚. To obtain good data, the input count was
maintained at around 1000 counts per second and the dead time was kept at 30 % during the
measurement. EDX mapping and point scan were employed in this study. EBSD and EDX data
were obtained through the Aztec software package [5]. The EBSD data including the associated
Kikuchi patterns, were analysed using HKL Channel 5 (HKL Technology, Denmark).
Figure 3.7 EBSD Kikuchi pattern of Al5La2 for potent nucleant investigation.
3.3.2 Phase identification
The primary phase identification technique used in this study for all the as-cast samples is the
XRD approach. XRD measurements were performed on bulk samples and powder samples
depending on the XRD instrument and sample selection. Conventional laboratory XRD data
were collected using Bruker D8 and Rigaku Smartlab diffractometers, whereas, synchrotron
powder diffraction was used to collect high resolution XRD patterns.
3.3.2.1 X-ray powder diffraction (XRD)
To identify the phases in the as-cast samples, XRD measurements were performed on both bulk
and powder samples using a Bruker D8 diffractometer. This instrument was equipped with a
Cu X-ray tube operated at 40 kV and 40 mA, and the data were collected between the range of
5-130˚ 2θ with a scan rate of 2 /min and a step size of 0.02˚. Details specific to the experimental
setup are also described in Chapters 4, 5, 6 and 7.
Bulk identification of the phases was also undertaken using a Rigaku Smartlab diffractometer,
which was fitted with a rotating Cu anode operated at 45 KV and 200 mA. This instrument was

Chapter 3 Methodology
109
also equipped with a large area detector, which was used to intercept as much of the Debye-
Scherrer rings as possible in order to improve the particle statistics, particularly from the α-Mg
phase. During the XRD measurement, the sample was continuously oscillated ± 360° about the
φ axis to further improve the particle statistics. Data were collected over the range 15-120˚ 2θ
with an equivalent scan rate of 2 ˚/min and a step size of 0.02˚, as shown in Figure 3.8. The
details of the XRD experiment can be found in Chapter 8.
Figure 3.8 XRD measurement with a sample setup in the Rigaku Smartlab.
The high-resolution powder diffraction beamline at the Australian Synchrotron [1] was also
used to aid with structure refinement of the (Al,Mg)3La phase. A monochromatic X-ray beam
of 18 keV was used and measured over the angular range between 2-82.5˚ 2θ. The details of
this experiment are outlined in Chapter 5.
3.3.2.2 XRD data analysis
The acquired XRD patterns were analysed using a combination of the Pawley [6] and Rietveld
[7] methods through the Topas software package (version 5, Bruker). The structure models for
the present phases in the alloys were taken from the Pearson handbook [8] and the ICDD PDF-
4+ database [9].
3.3.2.3 Transmission electron microscopy (TEM)
The intermetallic phases in the alloys were also identified using a JEOL 2100F transmission
electron microscope (TEM), equipped with an Oxford X-MaxN 80T EDX spectrometer. Plates
of 0.5 mm thickness were cut from the bulk sample and discs of 3 mm diameter were punched
from the plates. The discs were then ground to 50 μm. The TEM foils were then polished by
low-angle ion milling using a Gatan Precision Ion Polishing System (PIPS) at 4 kV with an
Chapter 3 Methodology
110
incident angle of ±4° until perforation of the foil; then followed by beam energy of 2.5 kV and
beam angle of ±2˚ for 30 minutes. The sample stage was not cooled during ion milling because
there was no phase transformation expected to occur at temperatures below 150 ˚C for the
intermetallic phases in the studied alloys.
The chemical composition of intermetallic phases was determined from the thin area of the foil
using a focused electron beam in order to minimise the thickness effect and the interference of
the surrounding matrix. The settings for the EDX analysis were based on a condenser aperture
of 100 μm, spot size of 6-8 and acquisition time of 60 s. There were at least five particles
analysed for each intermetallic phase.
Conventional selected area diffraction (SAED) or micro-beam electron diffraction (MBED)
techniques were used to obtain the diffraction patterns, depending on the particle size of
intermetallic phases. The settings for the MBED were based on a condenser aperture of 30 μm
and a spot size of 6-8. Three patterns were normally recorded for a known intermetallic phase.
However, more patterns were recorded for a new intermetallic phase for structure
determination. The TEM work was performed by one of the author’s co-supervisors, Dr.
Suming Zhu.
3.4 Solidification behaviour
In order to understand the solidification behaviour of magnesium and other cast alloys, it is
useful to compare experimental temperature measurements with thermodynamic simulation
results. Cooling curve thermal analysis (CCA) measurements were performed to obtain insights
into the solidification features of the alloys, including the solidification temperature and the
rate of solidification. Solidification was also observed in real-time via an in-situ synchrotron
radiography experiment at the SPring-8 synchrotron facility in Japan. The experimental data
were used to compare with Pandat® simulations.
3.4.1 Thermal analysis
In addition to the microstructural analysis described earlier, the effects of cooling rate and rare
earth alloying concentrations were also studied by thermal analysis techniques. Computer-
aided cooling curve thermal analysis (CA-CCA) of the studied alloys was carried out by
solidifying the molten alloys in the wedge mould with seven K-type thermocouples positioned
at different heights within the mould. The alloys were melted in a furnace and poured into a
wedge mould, letting the melt solidify to room temperature, as described in Section 3.1. During

Chapter 3 Methodology
111
solidification, the temperature variations in the alloy were measured at the seven thermocouple
locations along the wedge casting. These thermocouples were attached to a high-speed Picolog
data acquisition system. The temperature data was translated into a cooling curve through the
Picolog analysis software. The cooling curves (T-t) and their first derivative curves (dT/dt)
were plotted using the software. The reproducibility of the individual measurements from the
thermocouples was confirmed by repeating at least 2 times. The details of selecting the starting
point of the reaction are explained elsewhere [10], and the details of the thermal analysis
experiment are well described in Chapter 9.
3.4.2 In-situ synchrotron radiography
To observe the real-time solidification process, in-situ synchrotron radiography experiments
were performed on the ALa314 alloy at the SPring-8 synchrotron in Hyogo, Japan (beamline
BL20B2). The polished sample was held between two MgO plates, which then sit in between
two alumina plates. This setup was then retained by a sample holder, consisting of BN plates.
The sample holder was placed in a furnace, where there is a window for the synchrotron X-ray
beam to pass through. The setup of the experiment and the sample configuration is shown in
Figure 3.9. The details sample preparation and experimental setup are outlined in Chapter 6
[11].
Figure 3.9 (a) Experimental setup and (b) sample configuration for in-situ synchrotron radiography at BL20B2
beamline at SPring-8 [12].
3.5 Thermodynamic calculations
Thermodynamic calculations and phase diagrams were simulated using the PanMagnesium
2018 [13] database in Pandat®. The liquidus projection for Mg-Al-La system and Mg-Al-Ce
system are shown in Figure 3.10. The solidification predictions were calculated using both the
Scheil-Gulliver (non-equilibrium) and the Lever (equilibrium) conditions. The calculated
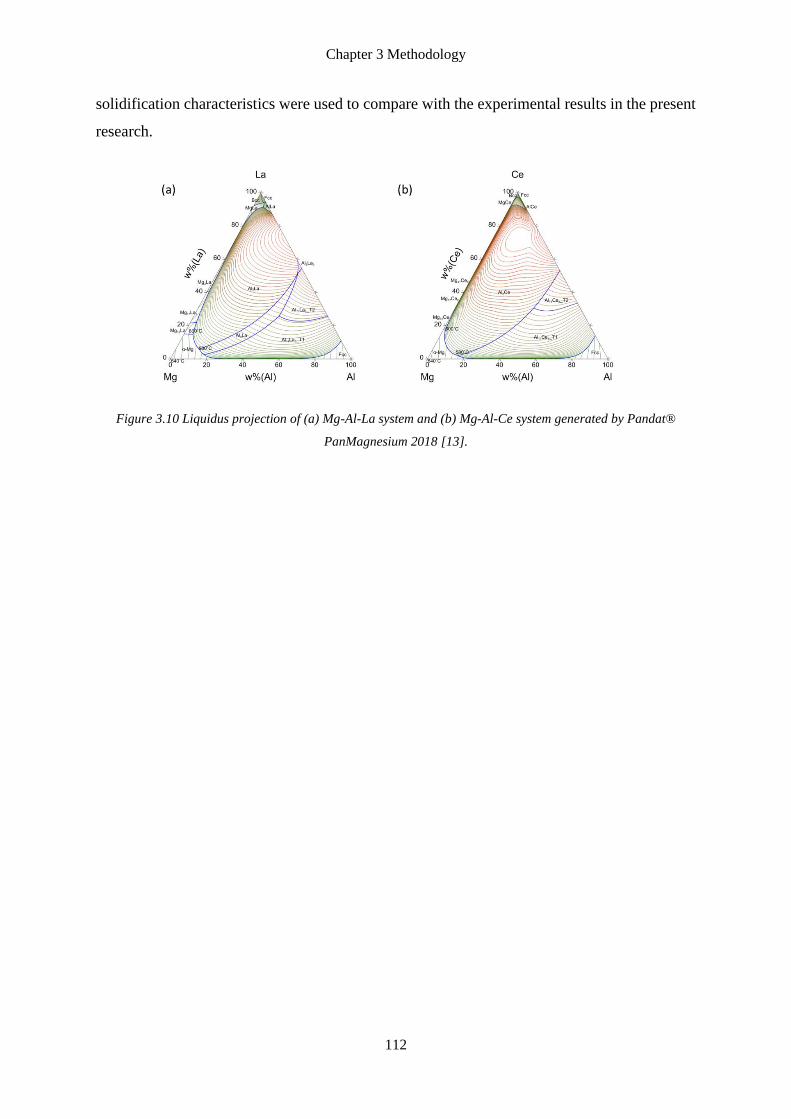
Chapter 3 Methodology
112
solidification characteristics were used to compare with the experimental results in the present
research.
Figure 3.10 Liquidus projection of (a) Mg-Al-La system and (b) Mg-Al-Ce system generated by Pandat®
PanMagnesium 2018 [13].
Chapter 3 Methodology
113
3.6 References
1. K.S. Wallwork, B.J. Kennedy, and D. Wang. The high resolution powder diffraction
beamline for the Australian Synchrotron. in AIP Conference Proceedings. 2007.
2. M.D. Abràmoff, P.J. Magalhães, and S.J. Ram, Image processing with ImageJ.
Biophotonics International, 2004. 11(7): p. 36-42.
3. J. Schindelin, et al., Fiji: an open-source platform for biological-image analysis. Nature
Methods, 2012. 9(7): p. 676.
4. J. Cho, Characterization of the a'-Martensite phase and its decomposition in Ti-6Al-4V
additively manufactured by selective laser melting. 2018, RMIT University.
5. S.A. Hutchinson, J.N. Shadid, and R.S. Tuminaro, Aztec users guide (version 1). 1995,
Sandia National Labs., Albuquerque, NM (United States).
6. G.S. Pawley, Unit-cell refinement from powder diffraction scans. Journal of Applied
Crystallography, 1981. 14(6): p. 357-361.
7. H.M. Rietveld, A profile refinement method for nuclear and magnetic structures.
Journal of Applied Crystallography, 1969. 2(2): p. 65-71.
8. P. Villars, L.D. Calvert, and W.B. Pearson, Pearson's handbook of crystallographic
data for intermetallic phases. (volumes 1, 2, 3). American Society for Metals, 1985: p.
3258.
9. ICDD, International Centre for Diffraction Data (ICDD) PDF-4+ 2017. International
Centre for Diffraction Data, Newtown Square, PA, USA, 2017.
10. L.P. Barber, Characterization of the solidification behavior and resultant
microstructures of magnesium-aluminum alloys. 2004: Worcester Polytechnic Institute.
Chapter 3 Methodology
114
11. C. Wong, et al., Solidification path and microstructure evolution of Mg-3Al-14La alloy:
Implications for the Mg-rich corner of the Mg-Al-La phase diagram. Journal of Alloys
and Compounds, 2019.
12. G. Zeng, et al., Real-time observation of AZ91 solidification by synchrotron
radiography, in Magnesium Technology 2017. 2017, Springer. p. 597-603.
13. CompuTherm, Pandat software and PanMagnesium 2018 thermodynamic database,
Madison, Editor.
Chapter 4
Experimental study of the solidification microstructure in the Mg-rich corner of Mg-Al-Ce system
115
Chapter 4
Experimental study of the solidification microstructure in the Mg-
rich corner of Mg–Al–Ce system
Charlotte Wong a, Mark J. Styles b, Suming Zhu a, Trevor Abbott a,d, Kazuhiro Nogita c, Stuart
D. McDonald c, David H. StJohn c, Mark A. Gibson a,b, Mark A. Easton a
a School of Engineering, RMIT University, Carlton, Victoria 3053, Australia
b CSIRO Manufacturing, Clayton, Victoria 3168, Australia
c School of Mechanical and Mining Engineering, The University of Queensland, Brisbane,
Queensland 4072, Australia
d Magontec Limited, Sydney, New South Wales 2000, Australia
Magnesium Technology, TMS 2018, page 79-85
Available online: https://doi.org/10.1007/978-3-319-72332-7_13
*Authorship statement and permission is included in Appendix A.

Experimental Study of the SolidificationMicrostructure in the Mg-Rich Cornerof Mg–Al–Ce System
Charlotte Wong, Mark J. Styles, Suming Zhu, Trevor Abbott,Kazuhiro Nogita, Stuart D. McDonald, David H. StJohn,Mark A. Gibson, and Mark A. Easton
AbstractThe current lack of comprehensive understanding of themicrostructure evolution in Mg–Al–Ce alloys hinders theaccuracy of thermodynamic predictions. Our investiga-tions have identified shortcomings within the publishedliterature for the Mg-rich end of the Mg–Al–Ce phasediagram. In this study, the microstructure evolution inMg–Al–Ce alloys has been studied by X-ray diffraction,scanning and transmission electron microscopy. Theexperimental results are compared with the Scheil-Gulliver prediction calculated using the CALPHADmethod. The observed microstructure contains both thebinary Al–Ce and Mg–Ce intermetallic phases in thesealloys. The solidification sequence, invariant point andthe phase boundaries in the liquidus projection of theMg–Al–Ce phase diagrams that have been reportedpreviously are inconsistent with this study. The hypoeu-tectic region is smaller compared to the current Mg–Al–Cephase diagram. In addition, a hexagonal Al5Ce2 phasewhich is isostructural with Al5La2 has been identified inthese alloys. The research addresses some of the currentlimitations in understanding the effect of Ce, when addedin isolation, on microstructure development in Mg–Albased alloys.
KeywordsMagnesium alloys Microstructure Phase diagram
Introduction
In recent years, there has been increasing interest in mag-nesium alloys due to their low density and high specificstrength [1], which are beneficial for vehicle weight reduc-tions and hence improved fuel efficiency. In addition to thecommonly used AZ91 and AM50/60 alloy grades, magne-sium alloys containing aluminium and rare earth (RE) ele-ments, known as the AE series, have been developed forelevated temperature applications, such as automotivepowertrain components, where creep resistance is a majorconcern. Two notable AE alloys are AE42 (Mg–4Al–2RE)[2] and AE44 (Mg–4Al–4RE) [3]. AE42 exhibits bettercreep resistance than AZ91 and AM50/60, but it tends to besusceptible to hot tearing during casting [4] and the creepresistance deteriorates rapidly at temperatures above 150 °C[5]. AE44 has improved hot tearing resistance and creepresistance over that of AE42, and has been used for anumber of powertrain applications since its first use in acorvette engine cradle [6].
The RE elements used in commercial AE alloys com-monly comes from mischmetal, which typically comprises52–55% cerium (Ce), 23–25% lanthanum (La), 16–20%neodymium (Nd) and 5–6% praseodymium (Pr) [7]. Tradi-tionally, it has been considered that all individual rare earthelements behave similarly in microstructure evolution in AEalloys [8]. In recent years, Nd and Pr prices have increasedsharply due to the demand for these elements in magneticapplications. Hence, the abundant La and Ce from mis-chmetal has become less expensive [9]. As a result, effortshave been made to investigate the effect of individual REelements in AE alloys. In order to better understand theirattributes, such as mechanical properties, castability andcreep performance, it is necessary to understand the mi-crostructure and its evolution. However, the observedmicrostructures are difficult to reconcile with the publishedphase diagrams. For this reason, the investigation in thepresent study is focused on the microstructure evolution in
C. Wong S. Zhu T. Abbott M. A. Gibson M. A. Easton (&)School of Engineering, RMIT University, Carlton, VIC 3053,Australiae-mail: [email protected]
M. J. Styles M. A. GibsonCSIRO Manufacturing, Clayton, VIC 3168, Australia
K. Nogita S. D. McDonald D. H. StJohnSchool of Mechanical and Mining Engineering, The Universityof Queensland, Brisbane, QLD 4072, Australia
T. AbbottMagontec Limited, Sydney, NSW 2000, Australia
© The Minerals, Metals & Materials Society 2018D. Orlov et al. (eds.), Magnesium Technology 2018, The Minerals,Metals & Materials Series, https://doi.org/10.1007/978-3-319-72332-7_13
79
116
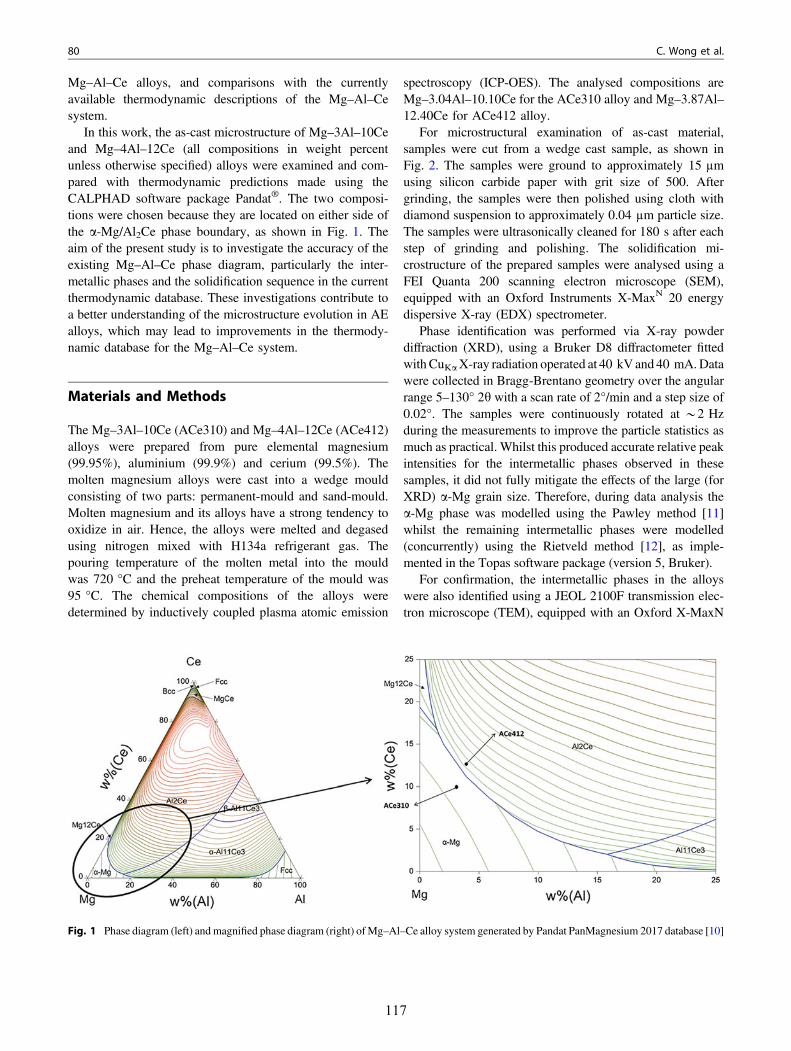
Mg–Al–Ce alloys, and comparisons with the currentlyavailable thermodynamic descriptions of the Mg–Al–Cesystem.
In this work, the as-cast microstructure of Mg–3Al–10Ceand Mg–4Al–12Ce (all compositions in weight percentunless otherwise specified) alloys were examined and com-pared with thermodynamic predictions made using theCALPHAD software package Pandat®. The two composi-tions were chosen because they are located on either side ofthe a-Mg/Al2Ce phase boundary, as shown in Fig. 1. Theaim of the present study is to investigate the accuracy of theexisting Mg–Al–Ce phase diagram, particularly the inter-metallic phases and the solidification sequence in the currentthermodynamic database. These investigations contribute toa better understanding of the microstructure evolution in AEalloys, which may lead to improvements in the thermody-namic database for the Mg–Al–Ce system.
Materials and Methods
The Mg–3Al–10Ce (ACe310) and Mg–4Al–12Ce (ACe412)alloys were prepared from pure elemental magnesium(99.95%), aluminium (99.9%) and cerium (99.5%). Themolten magnesium alloys were cast into a wedge mouldconsisting of two parts: permanent-mould and sand-mould.Molten magnesium and its alloys have a strong tendency tooxidize in air. Hence, the alloys were melted and degasedusing nitrogen mixed with H134a refrigerant gas. Thepouring temperature of the molten metal into the mouldwas 720 °C and the preheat temperature of the mould was95 °C. The chemical compositions of the alloys weredetermined by inductively coupled plasma atomic emission
spectroscopy (ICP-OES). The analysed compositions areMg–3.04Al–10.10Ce for the ACe310 alloy and Mg–3.87Al–12.40Ce for ACe412 alloy.
For microstructural examination of as-cast material,samples were cut from a wedge cast sample, as shown inFig. 2. The samples were ground to approximately 15 µmusing silicon carbide paper with grit size of 500. Aftergrinding, the samples were then polished using cloth withdiamond suspension to approximately 0.04 µm particle size.The samples were ultrasonically cleaned for 180 s after eachstep of grinding and polishing. The solidification mi-crostructure of the prepared samples were analysed using aFEI Quanta 200 scanning electron microscope (SEM),equipped with an Oxford Instruments X-MaxN 20 energydispersive X-ray (EDX) spectrometer.
Phase identification was performed via X-ray powderdiffraction (XRD), using a Bruker D8 diffractometer fittedwithCuKaX-ray radiation operated at 40 kV and 40 mA.Datawere collected in Bragg-Brentano geometry over the angularrange 5–130° 2h with a scan rate of 2°/min and a step size of0.02°. The samples were continuously rotated at *2 Hzduring the measurements to improve the particle statistics asmuch as practical. Whilst this produced accurate relative peakintensities for the intermetallic phases observed in thesesamples, it did not fully mitigate the effects of the large (forXRD) a-Mg grain size. Therefore, during data analysis thea-Mg phase was modelled using the Pawley method [11]whilst the remaining intermetallic phases were modelled(concurrently) using the Rietveld method [12], as imple-mented in the Topas software package (version 5, Bruker).
For confirmation, the intermetallic phases in the alloyswere also identified using a JEOL 2100F transmission elec-tron microscope (TEM), equipped with an Oxford X-MaxN
Fig. 1 Phase diagram (left) andmagnified phase diagram (right) of Mg–Al–Ce alloy system generated by Pandat PanMagnesium 2017 database [10]
80 C. Wong et al.
117
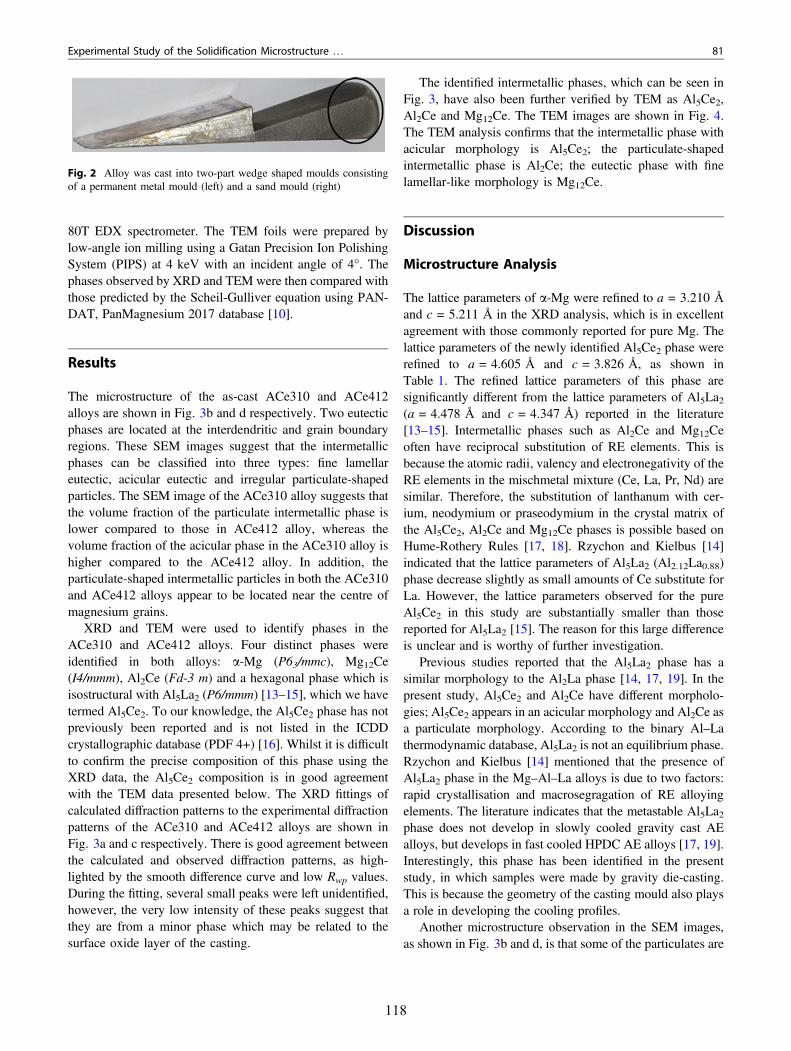
80T EDX spectrometer. The TEM foils were prepared bylow-angle ion milling using a Gatan Precision Ion PolishingSystem (PIPS) at 4 keV with an incident angle of 4°. Thephases observed by XRD and TEM were then compared withthose predicted by the Scheil-Gulliver equation using PAN-DAT, PanMagnesium 2017 database [10].
Results
The microstructure of the as-cast ACe310 and ACe412alloys are shown in Fig. 3b and d respectively. Two eutecticphases are located at the interdendritic and grain boundaryregions. These SEM images suggest that the intermetallicphases can be classified into three types: fine lamellareutectic, acicular eutectic and irregular particulate-shapedparticles. The SEM image of the ACe310 alloy suggests thatthe volume fraction of the particulate intermetallic phase islower compared to those in ACe412 alloy, whereas thevolume fraction of the acicular phase in the ACe310 alloy ishigher compared to the ACe412 alloy. In addition, theparticulate-shaped intermetallic particles in both the ACe310and ACe412 alloys appear to be located near the centre ofmagnesium grains.
XRD and TEM were used to identify phases in theACe310 and ACe412 alloys. Four distinct phases wereidentified in both alloys: a-Mg (P63/mmc), Mg12Ce(I4/mmm), Al2Ce (Fd-3 m) and a hexagonal phase which isisostructural with Al5La2 (P6/mmm) [13–15], which we havetermed Al5Ce2. To our knowledge, the Al5Ce2 phase has notpreviously been reported and is not listed in the ICDDcrystallographic database (PDF 4+) [16]. Whilst it is difficultto confirm the precise composition of this phase using theXRD data, the Al5Ce2 composition is in good agreementwith the TEM data presented below. The XRD fittings ofcalculated diffraction patterns to the experimental diffractionpatterns of the ACe310 and ACe412 alloys are shown inFig. 3a and c respectively. There is good agreement betweenthe calculated and observed diffraction patterns, as high-lighted by the smooth difference curve and low Rwp values.During the fitting, several small peaks were left unidentified,however, the very low intensity of these peaks suggest thatthey are from a minor phase which may be related to thesurface oxide layer of the casting.
The identified intermetallic phases, which can be seen inFig. 3, have also been further verified by TEM as Al5Ce2,Al2Ce and Mg12Ce. The TEM images are shown in Fig. 4.The TEM analysis confirms that the intermetallic phase withacicular morphology is Al5Ce2; the particulate-shapedintermetallic phase is Al2Ce; the eutectic phase with finelamellar-like morphology is Mg12Ce.
Discussion
Microstructure Analysis
The lattice parameters of a-Mg were refined to a = 3.210 Åand c = 5.211 Å in the XRD analysis, which is in excellentagreement with those commonly reported for pure Mg. Thelattice parameters of the newly identified Al5Ce2 phase wererefined to a = 4.605 Å and c = 3.826 Å, as shown inTable 1. The refined lattice parameters of this phase aresignificantly different from the lattice parameters of Al5La2(a = 4.478 Å and c = 4.347 Å) reported in the literature[13–15]. Intermetallic phases such as Al2Ce and Mg12Ceoften have reciprocal substitution of RE elements. This isbecause the atomic radii, valency and electronegativity of theRE elements in the mischmetal mixture (Ce, La, Pr, Nd) aresimilar. Therefore, the substitution of lanthanum with cer-ium, neodymium or praseodymium in the crystal matrix ofthe Al5Ce2, Al2Ce and Mg12Ce phases is possible based onHume-Rothery Rules [17, 18]. Rzychon and Kielbus [14]indicated that the lattice parameters of Al5La2 (Al2.12La0.88)phase decrease slightly as small amounts of Ce substitute forLa. However, the lattice parameters observed for the pureAl5Ce2 in this study are substantially smaller than thosereported for Al5La2 [15]. The reason for this large differenceis unclear and is worthy of further investigation.
Previous studies reported that the Al5La2 phase has asimilar morphology to the Al2La phase [14, 17, 19]. In thepresent study, Al5Ce2 and Al2Ce have different morpholo-gies; Al5Ce2 appears in an acicular morphology and Al2Ce asa particulate morphology. According to the binary Al–Lathermodynamic database, Al5La2 is not an equilibrium phase.Rzychon and Kielbus [14] mentioned that the presence ofAl5La2 phase in the Mg–Al–La alloys is due to two factors:rapid crystallisation and macrosegragation of RE alloyingelements. The literature indicates that the metastable Al5La2phase does not develop in slowly cooled gravity cast AEalloys, but develops in fast cooled HPDC AE alloys [17, 19].Interestingly, this phase has been identified in the presentstudy, in which samples were made by gravity die-casting.This is because the geometry of the casting mould also playsa role in developing the cooling profiles.
Another microstructure observation in the SEM images,as shown in Fig. 3b and d, is that some of the particulates are
Fig. 2 Alloy was cast into two-part wedge shaped moulds consistingof a permanent metal mould (left) and a sand mould (right)
Experimental Study of the Solidification Microstructure … 81
118
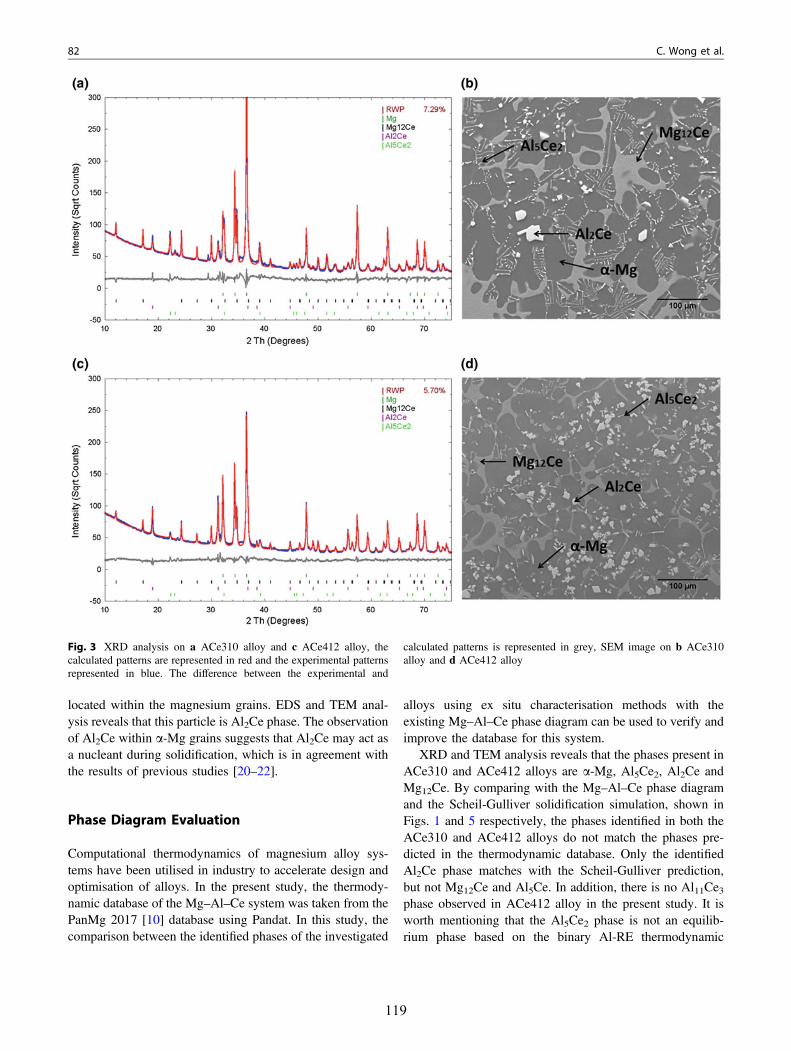
located within the magnesium grains. EDS and TEM anal-ysis reveals that this particle is Al2Ce phase. The observationof Al2Ce within a-Mg grains suggests that Al2Ce may act asa nucleant during solidification, which is in agreement withthe results of previous studies [20–22].
Phase Diagram Evaluation
Computational thermodynamics of magnesium alloy sys-tems have been utilised in industry to accelerate design andoptimisation of alloys. In the present study, the thermody-namic database of the Mg–Al–Ce system was taken from thePanMg 2017 [10] database using Pandat. In this study, thecomparison between the identified phases of the investigated
alloys using ex situ characterisation methods with theexisting Mg–Al–Ce phase diagram can be used to verify andimprove the database for this system.
XRD and TEM analysis reveals that the phases present inACe310 and ACe412 alloys are a-Mg, Al5Ce2, Al2Ce andMg12Ce. By comparing with the Mg–Al–Ce phase diagramand the Scheil-Gulliver solidification simulation, shown inFigs. 1 and 5 respectively, the phases identified in both theACe310 and ACe412 alloys do not match the phases pre-dicted in the thermodynamic database. Only the identifiedAl2Ce phase matches with the Scheil-Gulliver prediction,but not Mg12Ce and Al5Ce. In addition, there is no Al11Ce3phase observed in ACe412 alloy in the present study. It isworth mentioning that the Al5Ce2 phase is not an equilib-rium phase based on the binary Al-RE thermodynamic
Fig. 3 XRD analysis on a ACe310 alloy and c ACe412 alloy, thecalculated patterns are represented in red and the experimental patternsrepresented in blue. The difference between the experimental and
calculated patterns is represented in grey, SEM image on b ACe310alloy and d ACe412 alloy
82 C. Wong et al.
119
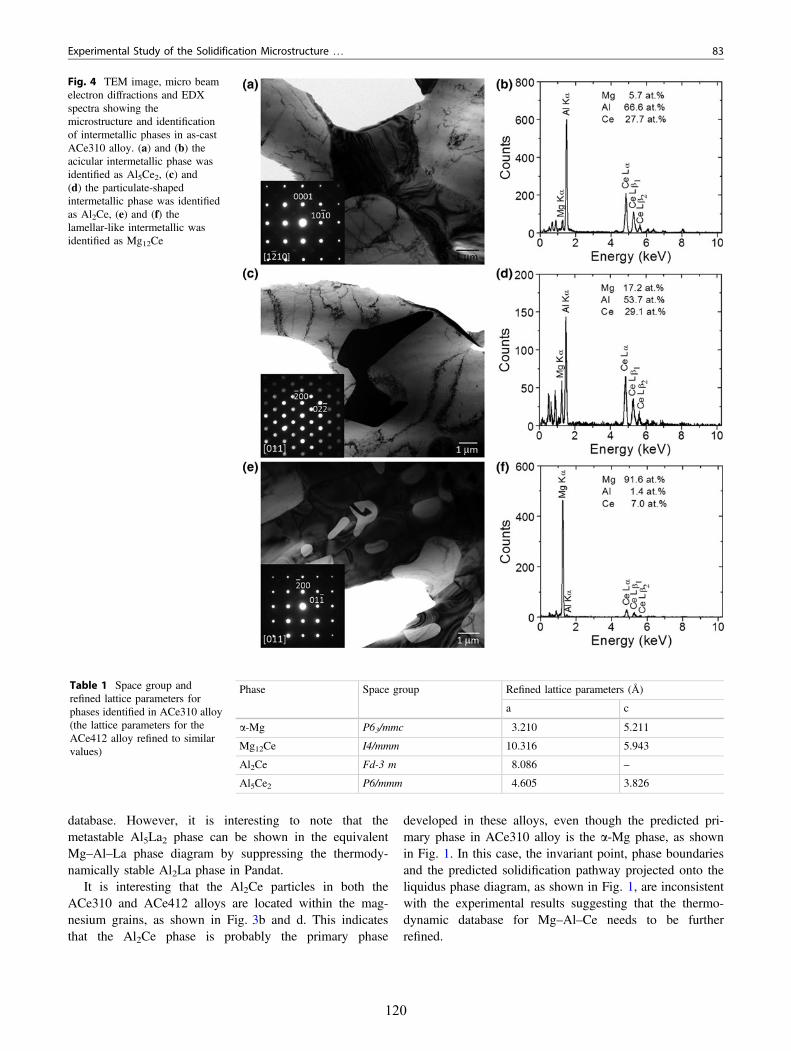
database. However, it is interesting to note that themetastable Al5La2 phase can be shown in the equivalentMg–Al–La phase diagram by suppressing the thermody-namically stable Al2La phase in Pandat.
It is interesting that the Al2Ce particles in both theACe310 and ACe412 alloys are located within the mag-nesium grains, as shown in Fig. 3b and d. This indicatesthat the Al2Ce phase is probably the primary phase
developed in these alloys, even though the predicted pri-mary phase in ACe310 alloy is the a-Mg phase, as shownin Fig. 1. In this case, the invariant point, phase boundariesand the predicted solidification pathway projected onto theliquidus phase diagram, as shown in Fig. 1, are inconsistentwith the experimental results suggesting that the thermo-dynamic database for Mg–Al–Ce needs to be furtherrefined.
Fig. 4 TEM image, micro beamelectron diffractions and EDXspectra showing themicrostructure and identificationof intermetallic phases in as-castACe310 alloy. (a) and (b) theacicular intermetallic phase wasidentified as Al5Ce2, (c) and(d) the particulate-shapedintermetallic phase was identifiedas Al2Ce, (e) and (f) thelamellar-like intermetallic wasidentified as Mg12Ce
Table 1 Space group andrefined lattice parameters forphases identified in ACe310 alloy(the lattice parameters for theACe412 alloy refined to similarvalues)
Phase Space group Refined lattice parameters (Å)
a c
a-Mg P63/mmc 3.210 5.211
Mg12Ce I4/mmm 10.316 5.943
Al2Ce Fd-3 m 8.086 –
Al5Ce2 P6/mmm 4.605 3.826
Experimental Study of the Solidification Microstructure … 83
120
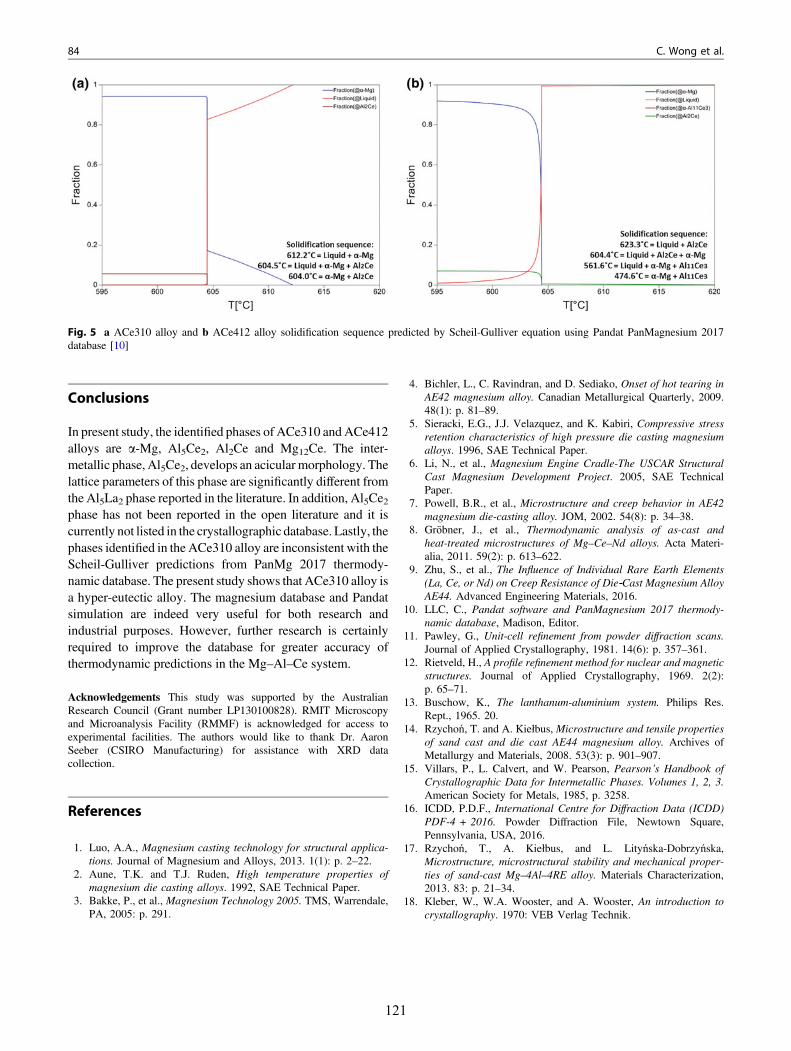
Conclusions
In present study, the identified phases of ACe310 andACe412alloys are a-Mg, Al5Ce2, Al2Ce and Mg12Ce. The inter-metallic phase, Al5Ce2, develops an acicular morphology. Thelattice parameters of this phase are significantly different fromthe Al5La2 phase reported in the literature. In addition, Al5Ce2phase has not been reported in the open literature and it iscurrently not listed in the crystallographic database. Lastly, thephases identified in the ACe310 alloy are inconsistent with theScheil-Gulliver predictions from PanMg 2017 thermody-namic database. The present study shows that ACe310 alloy isa hyper-eutectic alloy. The magnesium database and Pandatsimulation are indeed very useful for both research andindustrial purposes. However, further research is certainlyrequired to improve the database for greater accuracy ofthermodynamic predictions in the Mg–Al–Ce system.
Acknowledgements This study was supported by the AustralianResearch Council (Grant number LP130100828). RMIT Microscopyand Microanalysis Facility (RMMF) is acknowledged for access toexperimental facilities. The authors would like to thank Dr. AaronSeeber (CSIRO Manufacturing) for assistance with XRD datacollection.
References
1. Luo, A.A., Magnesium casting technology for structural applica-tions. Journal of Magnesium and Alloys, 2013. 1(1): p. 2–22.
2. Aune, T.K. and T.J. Ruden, High temperature properties ofmagnesium die casting alloys. 1992, SAE Technical Paper.
3. Bakke, P., et al., Magnesium Technology 2005. TMS, Warrendale,PA, 2005: p. 291.
4. Bichler, L., C. Ravindran, and D. Sediako, Onset of hot tearing inAE42 magnesium alloy. Canadian Metallurgical Quarterly, 2009.48(1): p. 81–89.
5. Sieracki, E.G., J.J. Velazquez, and K. Kabiri, Compressive stressretention characteristics of high pressure die casting magnesiumalloys. 1996, SAE Technical Paper.
6. Li, N., et al., Magnesium Engine Cradle-The USCAR StructuralCast Magnesium Development Project. 2005, SAE TechnicalPaper.
7. Powell, B.R., et al., Microstructure and creep behavior in AE42magnesium die-casting alloy. JOM, 2002. 54(8): p. 34–38.
8. Gröbner, J., et al., Thermodynamic analysis of as-cast andheat-treated microstructures of Mg–Ce–Nd alloys. Acta Materi-alia, 2011. 59(2): p. 613–622.
9. Zhu, S., et al., The Influence of Individual Rare Earth Elements(La, Ce, or Nd) on Creep Resistance of Die‐Cast Magnesium AlloyAE44. Advanced Engineering Materials, 2016.
10. LLC, C., Pandat software and PanMagnesium 2017 thermody-namic database, Madison, Editor.
11. Pawley, G., Unit-cell refinement from powder diffraction scans.Journal of Applied Crystallography, 1981. 14(6): p. 357–361.
12. Rietveld, H., A profile refinement method for nuclear and magneticstructures. Journal of Applied Crystallography, 1969. 2(2):p. 65–71.
13. Buschow, K., The lanthanum-aluminium system. Philips Res.Rept., 1965. 20.
14. Rzychoń, T. and A. Kiełbus, Microstructure and tensile propertiesof sand cast and die cast AE44 magnesium alloy. Archives ofMetallurgy and Materials, 2008. 53(3): p. 901–907.
15. Villars, P., L. Calvert, and W. Pearson, Pearson’s Handbook ofCrystallographic Data for Intermetallic Phases. Volumes 1, 2, 3.American Society for Metals, 1985, p. 3258.
16. ICDD, P.D.F., International Centre for Diffraction Data (ICDD)PDF-4 + 2016. Powder Diffraction File, Newtown Square,Pennsylvania, USA, 2016.
17. Rzychoń, T., A. Kiełbus, and L. Lityńska-Dobrzyńska,Microstructure, microstructural stability and mechanical proper-ties of sand-cast Mg–4Al–4RE alloy. Materials Characterization,2013. 83: p. 21–34.
18. Kleber, W., W.A. Wooster, and A. Wooster, An introduction tocrystallography. 1970: VEB Verlag Technik.
Fig. 5 a ACe310 alloy and b ACe412 alloy solidification sequence predicted by Scheil-Gulliver equation using Pandat PanMagnesium 2017database [10]
84 C. Wong et al.
121

19. Rzychoń, T., et al., Microstructural stability and creep propertiesof die casting Mg–4Al–4RE magnesium alloy. Materials Charac-terization, 2009. 60(10): p. 1107–1113.
20. Jiang, Z., et al., Role of Al modification on the microstructure andmechanical properties of as-cast Mg–6Ce alloys. MaterialsScience and Engineering: A, 2015. 645: p. 57–64.
21. Qiu, D. and M.-X. Zhang, The nucleation crystallography andwettability of Mg grains on active Al2Y inoculants in anMg–10 wt%Y Alloy. Journal of Alloys and Compounds, 2014. 586: p. 39–44.
22. Hu, X., et al., On grain coarsening and refining of the Mg–3Alalloy by Sm. Journal of Alloys and Compounds, 2016. 663:p. 387–394.
Experimental Study of the Solidification Microstructure … 85
122
Chapter 5
(Al,Mg)3La: a new phase in the Mg-Al-La system
123
Chapter 5
(Al,Mg)3La: a new phase in the Mg-Al-La system
Charlotte Wong1, Mark J. Styles2, Suming Zhu1, Dong Qiu1, Stuart D. McDonald3, Yuman
Zhu4, Mark A. Gibson1,2,4, Trevor B. Abbott5, Mark A. Easton1
1 School of Engineering, RMIT University, Carlton, Victoria 3053, Australia
2 CSIRO Manufacturing, Clayton, Victoria 3168, Australia
3 School of Mechanical and Mining Engineering, University of Queensland, Brisbane,
Queensland 4072, Australia
4 Department of Materials Science and Engineering, Monash University, Victoria 3800,
Australia
5 Magontec Ltd, Sydney, New South Wales 2000, Australia
Acta Crystallographica Section B 2018, Volume B74, page 370-375
Available online: https://doi.org/10.1107/S205252061800834X
*Reproduced with permission of the International Union of Crystallography, https://journals.iucr.org/.

electronic reprint
ISSN: 2052-5206
journals.iucr.org/b
(Al,Mg)3La: a new phase in the Mg–Al–La system
Charlotte Wong, Mark J. Styles, Suming Zhu, Dong Qiu, Stuart D.McDonald, Yuman Zhu, Mark A. Gibson, Trevor B. Abbott and Mark A.Easton
Acta Cryst. (2018). B74, 370–375
IUCr JournalsCRYSTALLOGRAPHY JOURNALS ONLINE
Copyright c© International Union of Crystallography
Author(s) of this paper may load this reprint on their own web site or institutional repository provided thatthis cover page is retained. Republication of this article or its storage in electronic databases other than asspecified above is not permitted without prior permission in writing from the IUCr.
For further information see http://journals.iucr.org/services/authorrights.html
Acta Cryst. (2018). B74, 370–375 Charlotte Wong et al. · (Al,Mg)3La: a new phase in the Mg–Al–La system124
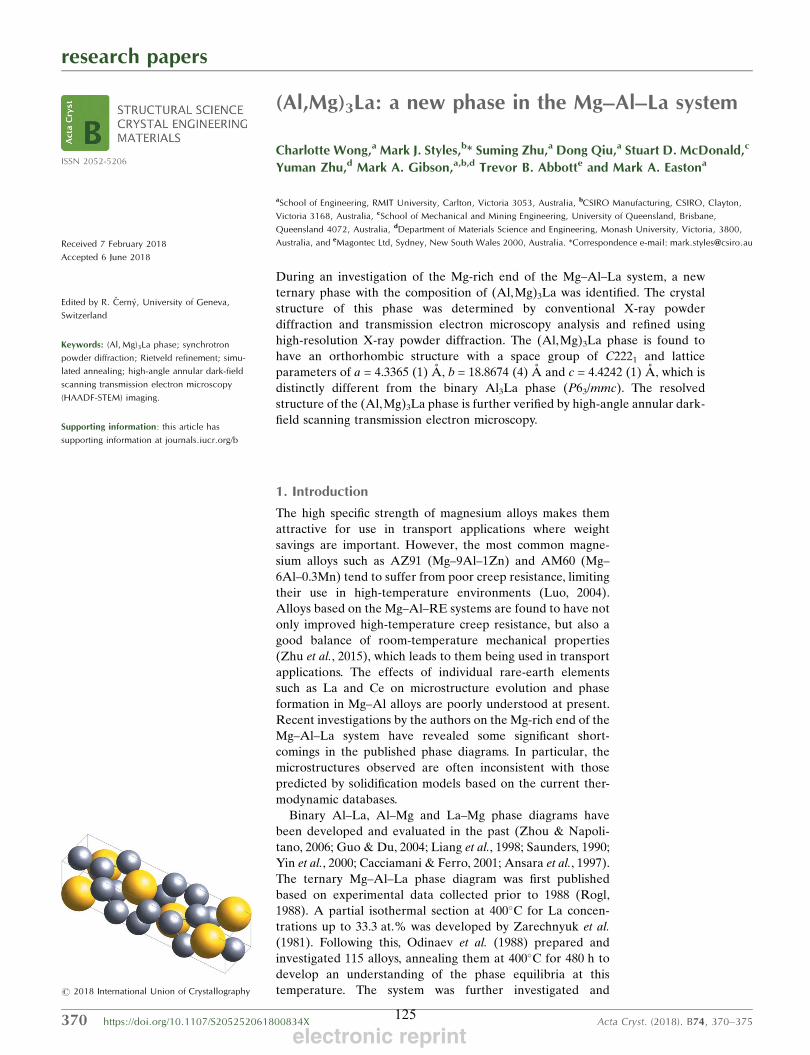
research papers
370 https://doi.org/10.1107/S205252061800834X Acta Cryst. (2018). B74, 370–375
Received 7 February 2018
Accepted 6 June 2018
Edited by R. Cerny, University of Geneva,
Switzerland
Keywords: (Al,Mg)3La phase; synchrotron
powder diffraction; Rietveld refinement; simu-
lated annealing; high-angle annular dark-field
scanning transmission electron microscopy
(HAADF-STEM) imaging.
Supporting information: this article has
supporting information at journals.iucr.org/b
(Al,Mg)3La: a new phase in the Mg–Al–La system
Charlotte Wong,a Mark J. Styles,b* Suming Zhu,a Dong Qiu,a Stuart D. McDonald,c
Yuman Zhu,d Mark A. Gibson,a,b,d Trevor B. Abbotte and Mark A. Eastona
aSchool of Engineering, RMIT University, Carlton, Victoria 3053, Australia, bCSIRO Manufacturing, CSIRO, Clayton,
Victoria 3168, Australia, cSchool of Mechanical and Mining Engineering, University of Queensland, Brisbane,
Queensland 4072, Australia, dDepartment of Materials Science and Engineering, Monash University, Victoria, 3800,
Australia, and eMagontec Ltd, Sydney, New South Wales 2000, Australia. *Correspondence e-mail: [email protected]
During an investigation of the Mg-rich end of the Mg–Al–La system, a new
ternary phase with the composition of (Al,Mg)3La was identified. The crystal
structure of this phase was determined by conventional X-ray powder
diffraction and transmission electron microscopy analysis and refined using
high-resolution X-ray powder diffraction. The (Al,Mg)3La phase is found to
have an orthorhombic structure with a space group of C2221 and lattice
parameters of a = 4.3365 (1) A, b = 18.8674 (4) A and c = 4.4242 (1) A, which is
distinctly different from the binary Al3La phase (P63/mmc). The resolved
structure of the (Al,Mg)3La phase is further verified by high-angle annular dark-
field scanning transmission electron microscopy.
1. Introduction
The high specific strength of magnesium alloys makes them
attractive for use in transport applications where weight
savings are important. However, the most common magne-
sium alloys such as AZ91 (Mg–9Al–1Zn) and AM60 (Mg–
6Al–0.3Mn) tend to suffer from poor creep resistance, limiting
their use in high-temperature environments (Luo, 2004).
Alloys based on the Mg–Al–RE systems are found to have not
only improved high-temperature creep resistance, but also a
good balance of room-temperature mechanical properties
(Zhu et al., 2015), which leads to them being used in transport
applications. The effects of individual rare-earth elements
such as La and Ce on microstructure evolution and phase
formation in Mg–Al alloys are poorly understood at present.
Recent investigations by the authors on the Mg-rich end of the
Mg–Al–La system have revealed some significant short-
comings in the published phase diagrams. In particular, the
microstructures observed are often inconsistent with those
predicted by solidification models based on the current ther-
modynamic databases.
Binary Al–La, Al–Mg and La–Mg phase diagrams have
been developed and evaluated in the past (Zhou & Napoli-
tano, 2006; Guo & Du, 2004; Liang et al., 1998; Saunders, 1990;
Yin et al., 2000; Cacciamani & Ferro, 2001; Ansara et al., 1997).
The ternary Mg–Al–La phase diagram was first published
based on experimental data collected prior to 1988 (Rogl,
1988). A partial isothermal section at 400C for La concen-
trations up to 33.3 at.% was developed by Zarechnyuk et al.
(1981). Following this, Odinaev et al. (1988) prepared and
investigated 115 alloys, annealing them at 400C for 480 h to
develop an understanding of the phase equilibria at this
temperature. The system was further investigated and
ISSN 2052-5206
# 2018 International Union of Crystallography
electronic reprint125
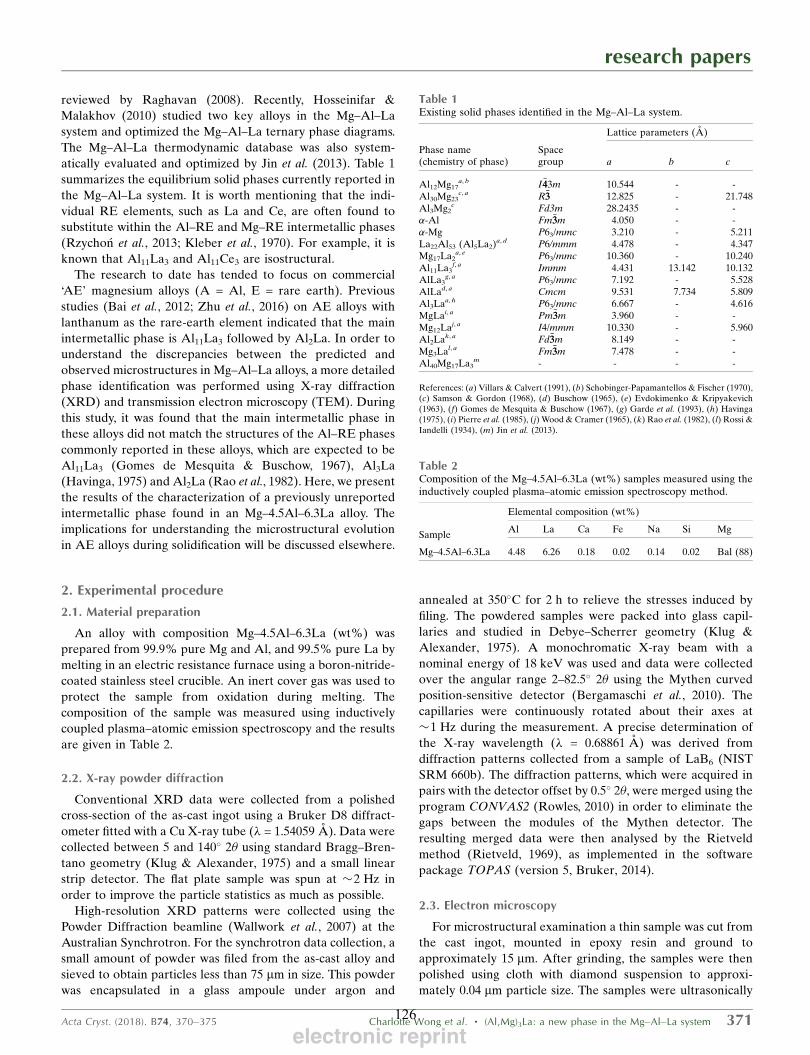
reviewed by Raghavan (2008). Recently, Hosseinifar &
Malakhov (2010) studied two key alloys in the Mg–Al–La
system and optimized the Mg–Al–La ternary phase diagrams.
The Mg–Al–La thermodynamic database was also system-
atically evaluated and optimized by Jin et al. (2013). Table 1
summarizes the equilibrium solid phases currently reported in
the Mg–Al–La system. It is worth mentioning that the indi-
vidual RE elements, such as La and Ce, are often found to
substitute within the Al–RE and Mg–RE intermetallic phases
(Rzychon et al., 2013; Kleber et al., 1970). For example, it is
known that Al11La3 and Al11Ce3 are isostructural.
The research to date has tended to focus on commercial
‘AE’ magnesium alloys (A = Al, E = rare earth). Previous
studies (Bai et al., 2012; Zhu et al., 2016) on AE alloys with
lanthanum as the rare-earth element indicated that the main
intermetallic phase is Al11La3 followed by Al2La. In order to
understand the discrepancies between the predicted and
observed microstructures in Mg–Al–La alloys, a more detailed
phase identification was performed using X-ray diffraction
(XRD) and transmission electron microscopy (TEM). During
this study, it was found that the main intermetallic phase in
these alloys did not match the structures of the Al–RE phases
commonly reported in these alloys, which are expected to be
Al11La3 (Gomes de Mesquita & Buschow, 1967), Al3La
(Havinga, 1975) and Al2La (Rao et al., 1982). Here, we present
the results of the characterization of a previously unreported
intermetallic phase found in an Mg–4.5Al–6.3La alloy. The
implications for understanding the microstructural evolution
in AE alloys during solidification will be discussed elsewhere.
2. Experimental procedure
2.1. Material preparation
An alloy with composition Mg–4.5Al–6.3La (wt%) was
prepared from 99.9% pure Mg and Al, and 99.5% pure La by
melting in an electric resistance furnace using a boron-nitride-
coated stainless steel crucible. An inert cover gas was used to
protect the sample from oxidation during melting. The
composition of the sample was measured using inductively
coupled plasma–atomic emission spectroscopy and the results
are given in Table 2.
2.2. X-ray powder diffraction
Conventional XRD data were collected from a polished
cross-section of the as-cast ingot using a Bruker D8 diffract-
ometer fitted with a Cu X-ray tube ( = 1.54059 A). Data were
collected between 5 and 140 2 using standard Bragg–Bren-
tano geometry (Klug & Alexander, 1975) and a small linear
strip detector. The flat plate sample was spun at 2 Hz in
order to improve the particle statistics as much as possible.
High-resolution XRD patterns were collected using the
Powder Diffraction beamline (Wallwork et al., 2007) at the
Australian Synchrotron. For the synchrotron data collection, a
small amount of powder was filed from the as-cast alloy and
sieved to obtain particles less than 75 mm in size. This powder
was encapsulated in a glass ampoule under argon and
annealed at 350C for 2 h to relieve the stresses induced by
filing. The powdered samples were packed into glass capil-
laries and studied in Debye–Scherrer geometry (Klug &
Alexander, 1975). A monochromatic X-ray beam with a
nominal energy of 18 keV was used and data were collected
over the angular range 2–82.5 2 using the Mythen curved
position-sensitive detector (Bergamaschi et al., 2010). The
capillaries were continuously rotated about their axes at
1 Hz during the measurement. A precise determination of
the X-ray wavelength ( = 0.68861 A) was derived from
diffraction patterns collected from a sample of LaB6 (NIST
SRM 660b). The diffraction patterns, which were acquired in
pairs with the detector offset by 0.5 2, were merged using the
program CONVAS2 (Rowles, 2010) in order to eliminate the
gaps between the modules of the Mythen detector. The
resulting merged data were then analysed by the Rietveld
method (Rietveld, 1969), as implemented in the software
package TOPAS (version 5, Bruker, 2014).
2.3. Electron microscopy
For microstructural examination a thin sample was cut from
the cast ingot, mounted in epoxy resin and ground to
approximately 15 mm. After grinding, the samples were then
polished using cloth with diamond suspension to approxi-
mately 0.04 mm particle size. The samples were ultrasonically
research papers
Acta Cryst. (2018). B74, 370–375 Charlotte Wong et al. (Al,Mg)3La: a new phase in the Mg–Al–La system 371
Table 1Existing solid phases identified in the Mg–Al–La system.
Lattice parameters (A)
Phase name(chemistry of phase)
Spacegroup a b c
Al12Mg17a, b I 443m 10.544 - -
Al30Mg23c, a R33 12.825 - 21.748
Al3Mg2c Fd3m 28.2435 - -
-Al Fm33m 4.050 - --Mg P63/mmc 3.210 - 5.211La22Al53 (Al5La2)
a, d P6/mmm 4.478 - 4.347Mg17La2
a, e P63/mmc 10.360 - 10.240Al11La3
f, a Immm 4.431 13.142 10.132AlLa3
g, a P63/mmc 7.192 - 5.528AlLad, a Cmcm 9.531 7.734 5.809Al3La
a, h P63/mmc 6.667 - 4.616MgLai, a Pm33m 3.960 - -Mg12La
j, a I4/mmm 10.330 - 5.960Al2La
k, a Fd33m 8.149 - -Mg3La
l, a Fm33m 7.478 - -Al40Mg17La3
m - - - -
References: (a) Villars & Calvert (1991), (b) Schobinger-Papamantellos & Fischer (1970),(c) Samson & Gordon (1968), (d) Buschow (1965), (e) Evdokimenko & Kripyakevich(1963), (f) Gomes de Mesquita & Buschow (1967), (g) Garde et al. (1993), (h) Havinga(1975), (i) Pierre et al. (1985), (j) Wood &Cramer (1965), (k) Rao et al. (1982), (l) Rossi &Iandelli (1934), (m) Jin et al. (2013).
Table 2Composition of the Mg–4.5Al–6.3La (wt%) samples measured using theinductively coupled plasma–atomic emission spectroscopy method.
Sample
Elemental composition (wt%)
Al La Ca Fe Na Si Mg
Mg–4.5Al–6.3La 4.48 6.26 0.18 0.02 0.14 0.02 Bal (88)
electronic reprint126
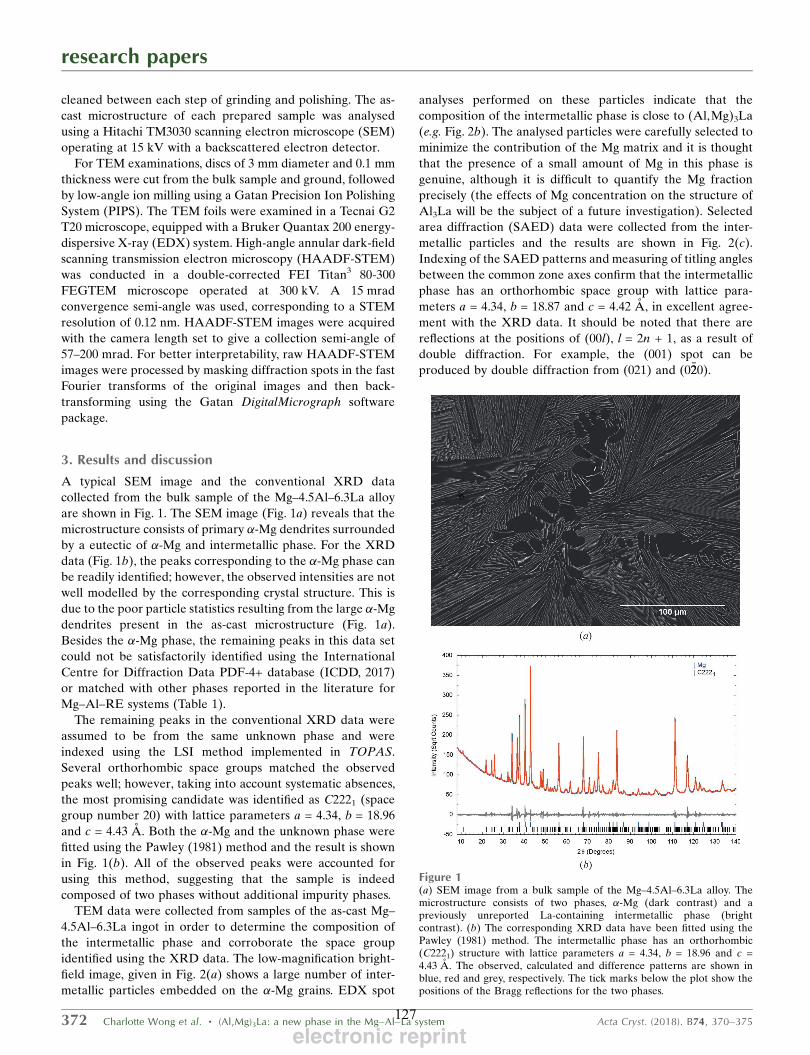
cleaned between each step of grinding and polishing. The as-
cast microstructure of each prepared sample was analysed
using a Hitachi TM3030 scanning electron microscope (SEM)
operating at 15 kV with a backscattered electron detector.
For TEM examinations, discs of 3 mm diameter and 0.1 mm
thickness were cut from the bulk sample and ground, followed
by low-angle ion milling using a Gatan Precision Ion Polishing
System (PIPS). The TEM foils were examined in a Tecnai G2
T20 microscope, equipped with a Bruker Quantax 200 energy-
dispersive X-ray (EDX) system. High-angle annular dark-field
scanning transmission electron microscopy (HAADF-STEM)
was conducted in a double-corrected FEI Titan3 80-300
FEGTEM microscope operated at 300 kV. A 15 mrad
convergence semi-angle was used, corresponding to a STEM
resolution of 0.12 nm. HAADF-STEM images were acquired
with the camera length set to give a collection semi-angle of
57–200 mrad. For better interpretability, raw HAADF-STEM
images were processed by masking diffraction spots in the fast
Fourier transforms of the original images and then back-
transforming using the Gatan DigitalMicrograph software
package.
3. Results and discussion
A typical SEM image and the conventional XRD data
collected from the bulk sample of the Mg–4.5Al–6.3La alloy
are shown in Fig. 1. The SEM image (Fig. 1a) reveals that the
microstructure consists of primary -Mg dendrites surrounded
by a eutectic of -Mg and intermetallic phase. For the XRD
data (Fig. 1b), the peaks corresponding to the -Mg phase can
be readily identified; however, the observed intensities are not
well modelled by the corresponding crystal structure. This is
due to the poor particle statistics resulting from the large -Mg
dendrites present in the as-cast microstructure (Fig. 1a).
Besides the -Mg phase, the remaining peaks in this data set
could not be satisfactorily identified using the International
Centre for Diffraction Data PDF-4+ database (ICDD, 2017)
or matched with other phases reported in the literature for
Mg–Al–RE systems (Table 1).
The remaining peaks in the conventional XRD data were
assumed to be from the same unknown phase and were
indexed using the LSI method implemented in TOPAS.
Several orthorhombic space groups matched the observed
peaks well; however, taking into account systematic absences,
the most promising candidate was identified as C2221 (space
group number 20) with lattice parameters a = 4.34, b = 18.96
and c = 4.43 A. Both the -Mg and the unknown phase were
fitted using the Pawley (1981) method and the result is shown
in Fig. 1(b). All of the observed peaks were accounted for
using this method, suggesting that the sample is indeed
composed of two phases without additional impurity phases.
TEM data were collected from samples of the as-cast Mg–
4.5Al–6.3La ingot in order to determine the composition of
the intermetallic phase and corroborate the space group
identified using the XRD data. The low-magnification bright-
field image, given in Fig. 2(a) shows a large number of inter-
metallic particles embedded on the -Mg grains. EDX spot
analyses performed on these particles indicate that the
composition of the intermetallic phase is close to (Al,Mg)3La
(e.g. Fig. 2b). The analysed particles were carefully selected to
minimize the contribution of the Mg matrix and it is thought
that the presence of a small amount of Mg in this phase is
genuine, although it is difficult to quantify the Mg fraction
precisely (the effects of Mg concentration on the structure of
Al3La will be the subject of a future investigation). Selected
area diffraction (SAED) data were collected from the inter-
metallic particles and the results are shown in Fig. 2(c).
Indexing of the SAED patterns and measuring of titling angles
between the common zone axes confirm that the intermetallic
phase has an orthorhombic space group with lattice para-
meters a = 4.34, b = 18.87 and c = 4.42 A, in excellent agree-
ment with the XRD data. It should be noted that there are
reflections at the positions of (00l), l = 2n + 1, as a result of
double diffraction. For example, the (001) spot can be
produced by double diffraction from (021) and (0220).
research papers
372 Charlotte Wong et al. (Al,Mg)3La: a new phase in the Mg–Al–La system Acta Cryst. (2018). B74, 370–375
Figure 1(a) SEM image from a bulk sample of the Mg–4.5Al–6.3La alloy. Themicrostructure consists of two phases, -Mg (dark contrast) and apreviously unreported La-containing intermetallic phase (brightcontrast). (b) The corresponding XRD data have been fitted using thePawley (1981) method. The intermetallic phase has an orthorhombic(C2221) structure with lattice parameters a = 4.34, b = 18.96 and c =4.43 A. The observed, calculated and difference patterns are shown inblue, red and grey, respectively. The tick marks below the plot show thepositions of the Bragg reflections for the two phases.
electronic reprint127
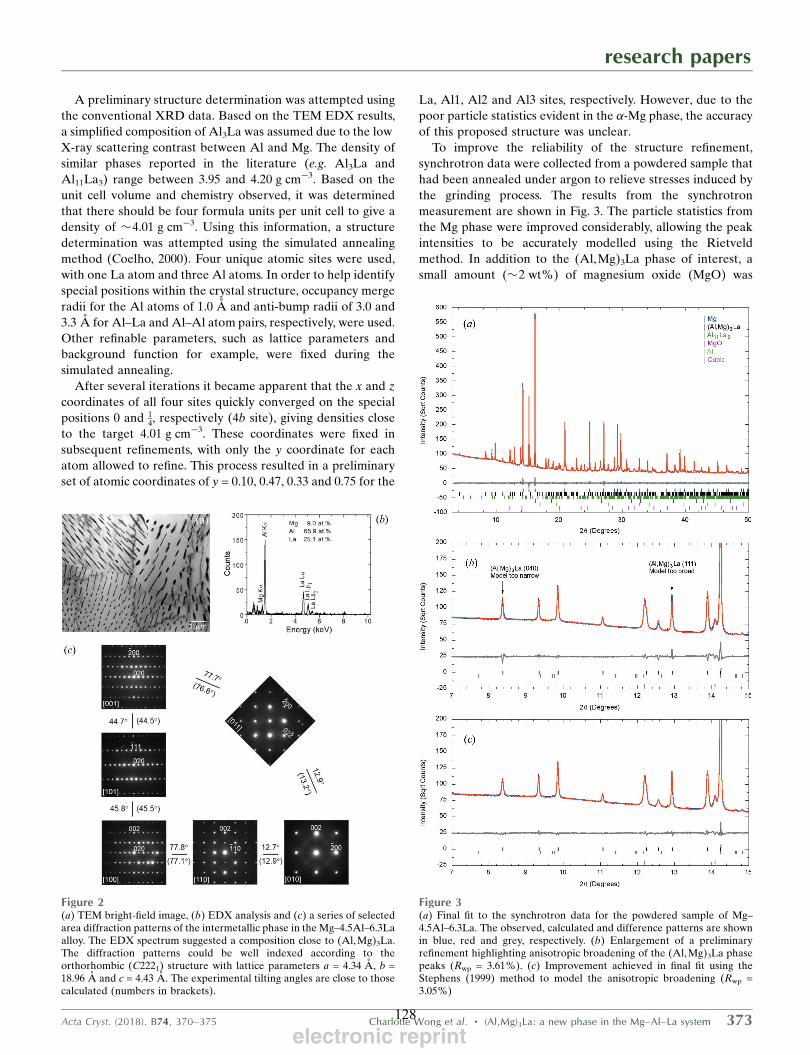
A preliminary structure determination was attempted using
the conventional XRD data. Based on the TEM EDX results,
a simplified composition of Al3La was assumed due to the low
X-ray scattering contrast between Al and Mg. The density of
similar phases reported in the literature (e.g. Al3La and
Al11La3) range between 3.95 and 4.20 g cm3. Based on the
unit cell volume and chemistry observed, it was determined
that there should be four formula units per unit cell to give a
density of 4.01 g cm3. Using this information, a structure
determination was attempted using the simulated annealing
method (Coelho, 2000). Four unique atomic sites were used,
with one La atom and three Al atoms. In order to help identify
special positions within the crystal structure, occupancy merge
radii for the Al atoms of 1.0 A and anti-bump radii of 3.0 and
3.3 A for Al–La and Al–Al atom pairs, respectively, were used.
Other refinable parameters, such as lattice parameters and
background function for example, were fixed during the
simulated annealing.
After several iterations it became apparent that the x and z
coordinates of all four sites quickly converged on the special
positions 0 and 14, respectively (4b site), giving densities close
to the target 4.01 g cm3. These coordinates were fixed in
subsequent refinements, with only the y coordinate for each
atom allowed to refine. This process resulted in a preliminary
set of atomic coordinates of y = 0.10, 0.47, 0.33 and 0.75 for the
La, Al1, Al2 and Al3 sites, respectively. However, due to the
poor particle statistics evident in the -Mg phase, the accuracy
of this proposed structure was unclear.
To improve the reliability of the structure refinement,
synchrotron data were collected from a powdered sample that
had been annealed under argon to relieve stresses induced by
the grinding process. The results from the synchrotron
measurement are shown in Fig. 3. The particle statistics from
the Mg phase were improved considerably, allowing the peak
intensities to be accurately modelled using the Rietveld
method. In addition to the (Al,Mg)3La phase of interest, a
small amount (2 wt%) of magnesium oxide (MgO) was
research papers
Acta Cryst. (2018). B74, 370–375 Charlotte Wong et al. (Al,Mg)3La: a new phase in the Mg–Al–La system 373
Figure 3(a) Final fit to the synchrotron data for the powdered sample of Mg–4.5Al–6.3La. The observed, calculated and difference patterns are shownin blue, red and grey, respectively. (b) Enlargement of a preliminaryrefinement highlighting anisotropic broadening of the (Al,Mg)3La phasepeaks (Rwp = 3.61%). (c) Improvement achieved in final fit using theStephens (1999) method to model the anisotropic broadening (Rwp =3.05%)
Figure 2(a) TEM bright-field image, (b) EDX analysis and (c) a series of selectedarea diffraction patterns of the intermetallic phase in the Mg–4.5Al–6.3Laalloy. The EDX spectrum suggested a composition close to (Al,Mg)3La.The diffraction patterns could be well indexed according to theorthorhombic (C2221) structure with lattice parameters a = 4.34 A, b =18.96 A and c = 4.43 A. The experimental tilting angles are close to thosecalculated (numbers in brackets).
electronic reprint128

detected as a result of the annealing processes. The sample was
also found to contain a very small fraction of the Al11La3phase as well as a cubic phase with a structure similar to a
mixed La–Ce oxide or La hydride (Fm33m, a = 5.61 A) (Korst
& Warf, 1966; Sung Bae et al., 2004). A trace amount of f.c.c.
Al was detected, which is likely to be an impurity introduced
during powder preparation.
The simulated annealing procedure described above was
repeated for the synchrotron data, giving results in excellent
agreement with the laboratory data. The final crystal structure
parameters refined from the synchrotron data (using the
Rietveld method) are given in Table 3 and a three-dimensional
view of the crystal structure is given in Fig. 4. It should be
noted that the high resolution of the synchrotron data also
revealed a small amount of anisotropic broadening of the
(Al,Mg)3La phase peaks, as highlighted in Fig. 3(b). In the
final Rietveld analysis, the (Al,Mg)3La peak shapes were
described using the Stephens (1999) method, which describes
anisotropic microstrain broadening. This approach improved
the quality of fit, as highlighted in Fig. 3(c), but did not
significantly change the refined atomic coordinates. Aniso-
tropic microstrain could indicate the presence of defects
within the (Al,Mg)3La crystallites, or the effects of lattice
mismatch between (Al,Mg)3La and the -Mg matrix. Alter-
natively, the anisotropic broadening could be due to the plate-
like morphology of the small eutectic particles (i.e. anisotropic
crystallite size broadening). The data do not support a detailed
peak profile analysis and further work is required to elucidate
this point.
The crystal structure consists of La atoms coordinated with
14 Al(Mg) atoms, 12 of which are arranged in two hexagonal
rings with plane normals aligned parallel to the a-axis of the
unit cell. The two remaining Al atoms lie in the same plane
(bc) as the La atom. This Al(Mg) atom packing arrangement is
consistent with other Al–La intermetallic phases such as
Al11La3. The Al–La interatomic distances range from 3.31 to
3.53 A, which is significantly larger than in the hexagonal
Al3La phase (2.98–3.32 A, Ni3Sn-type structure) and more
similar to that observed in the Al11La3 phase (3.27–3.78 A).
The incorporation of a low concentration of Mg atoms into the
(Al,Mg)3La phase may account for the slightly larger Al(Mg)
to La distances, compared with Al3La, due to the larger radius
of Mg relative to Al. The Al–Al and La–La interatomic
distances are in the ranges 2.51–3.10 A and 4.34–4.52 A,
respectively, which also compares well with the distances
observed in Al3La and Al11La3.
The proposed structure was verified by atomic scale
HAADF-STEM imaging, shown in Fig. 5. In Figs. 5(c) and
5(d), each bright dot represents a column rich in La atoms
because the intensity of HAADF-STEM imaging is approxi-
mately proportional to the square of the atomic number
(Pennycook & Jesson, 1992) (the atomic number is 12 for Mg,
13 for Al and 57 for La). The Al(Mg) atoms are also detected
around the much brighter La atoms, but with weaker contrast.
Needless to say, it is impossible to distinguish Al atoms from
Mg atoms in the HAADF-STEM images. The atom arrange-
ments viewed along these two directions are consistent with
those in the proposed structure shown in Figs. 5(a) and 5(b).
Lastly, samples of this alloy were heat treated at 350C for
500 h and at 500C for 100 h to investigate the thermal
stability of the (Al,Mg)3La phase. Conventional XRD data
and SEM data collected from these samples also showed two-
research papers
374 Charlotte Wong et al. (Al,Mg)3La: a new phase in the Mg–Al–La system Acta Cryst. (2018). B74, 370–375
Table 3Crystallographic parameters refined for the (Al,Mg)3La phase.
The uncertainties reported in brackets are 2 the estimated standarddeviations (i.e. 2) calculated by TOPAS.
Formula (Al,Mg)3LaDensity (g cm3) 4.0342 (1)Space group C2221Lattice parameters a, b, c (A) 4.3365 (1), 18.8674 (4), 4.4242 (1)Volume (A3) 361.98 (1)
Atomiccoordinates x y z Occupancy
Beq
(A2)
La 0 0.1043 (1) 0.25 1.0 0.70 (3)Al1 0 0.4666 (4) 0.25 1.0 0.9 (2)Al2 0 0.3342 (4) 0.25 1.0 0.9 (2)Al3 0 0.7493 (4) 0.25 1.0 0.7 (2)
Figure 4Proposed structure of the (Al,Mg)3La phase. Al(Mg) and La atoms arerepresented as silver and yellow balls, respectively.
Figure 5Perspective views of the proposed structure of the (Al,Mg)3La phasealong (a) [100] and (b) [001] directions compared with atomic scaleHAADF-STEM images along (c) [100] and (d) [001].
electronic reprint129
phase microstructures consisting of -Mg and (Al,Mg)3La,
indicating that (Al,Mg)3La is an equilibrium phase in the Mg–
Al–La system.
4. Conclusions
A new intermetallic phase has been identified in the Mg–Al–
La system, which has the composition of (Al,Mg)3La. The
crystal structure has been resolved using high-resolution
synchrotron X-ray powder diffraction to be orthorhombic
with space group C2221 and lattice parameters a = 4.3365 (1),
b = 18.8674 (4) and c = 4.4242 (1) A. The resolved unit-cell
parameters and atom occupancy have been verified by
HAADF-STEM imaging and there is an excellent agreement
between the two techniques. The Al(Mg) atom packing
arrangements of the (Al,Mg)3La phase are consistent with
those of the other Al–La intermetallic phases such as Al11La3.
Acknowledgements
The authors would like to thank Professor Kazuhiro Nogita
and Professor Jian-Feng Nie for their support for this project.
Part of this research was undertaken on the Powder Diffrac-
tion beamline at the Australian Synchrotron, Victoria,
Australia (Experiment 12184). The authors wish to thank Mr
Carmelo Todaro, Mr Jackson Smith and Dr Aaron Seeber for
experimental assistance. Monash Centre for Electron Micro-
scopy (MCEM) is acknowledged for access to experimental
facilities.
Funding information
The following funding is acknowledged: Australian Research
Council (grant No. LP130100828).
References
Ansara, I., Chart, T., Guillermet, A. F., Hayes, F., Kattner, U., Pettifor,D., Saunders, N. & Zeng, K. (1997). Calphad, 21, 171–218.
Appa Rao, B., Kistaiah, P., Rajasekhar Reddy, N. & SatyanarayanaMurthy, K. (1982). J. Mater. Sci. Lett. 1, 432–434.
Bai, J., Sun, Y., Xue, F. & Qiang, J. (2012). Mater. Sci. Eng. A, 552,472–480.
Bergamaschi, A., Cervellino, A., Dinapoli, R., Gozzo, F., Henrich, B.,Johnson, I., Kraft, P., Mozzanica, A., Schmitt, B. & Shi, X. (2010). J.Synchrotron Rad. 17, 653–668.
Bruker (2014). TOPAS. Bruker AXS, Karlsruhe, Germany.Buschow, K. (1965). Philips Research Report, No. 20.Cacciamani, G. & Ferro, R. (2001). Calphad, 25, 583–597.Coelho, A. A. (2000). J. Appl. Cryst. 33, 899–908.Evdokimenko, V. I. & Kripyakevich, P. I. (1963). Kristallografiya, 8,186–193.
Garde, C., Ray, J. & Chandra, G. (1993). J. Alloys Compd. 198, 165–172.
Gomes de Mesquita, A. H. & Buschow, K. H. J. (1967). Acta Cryst. 22,497–501.
Guo, C. & Du, Z. (2004). J. Alloys Compd. 385, 109–113.Havinga, E. (1975). J. Less Common Met. 41, 241–254.Hosseinifar, M. & Malakhov, D. V. (2010). J. Alloys Compd. 505, 459–466.
ICDD (2017). PDF-4. International Centre for Diffraction Data,Newtown Square, PA, USA.
Jin, L., Kevorkov, D., Medraj, M. & Chartrand, P. (2013). J. Chem.Thermodyn. 58, 166–195.
Kleber, W., Wooster, W. A. & Wooster, A. (1970). An Introduction toCrystallography. VEB Verlag Technik.
Klug, H. P. & Alexander, L. E. (1975). X-ray Diffraction Proceduresfor Polycrystalline and Amorphous Materials, 2nd edition. NewYork: Wiley-Interscience.
Korst, W. L. & Warf, J. C. (1966). Inorg. Chem. 5, 1719–1726.Liang, P., Su, H.-L., Donnadieu, P., Harmelin, M., Quivy, A., Ochin, P.,Effenberg, G., Seifert, H., Lukas, H. & Aldinger, F. (1998). Z.Metallkd. 89, 536–540.
Luo, A. A. (2004). Int. Mater. Rev. 49, 13–30.Odinaev, K. O., Ganiev, I., Kinzhibalo, V. & Tyvanchuk, A. (1988).
Izv. Vyss. Uchebn. Zaved. Tsvetn. Met. 2, 81–85.Pawley, G. S. (1981). J. Appl. Cryst. 14, 357–361.Pennycook, S. & Jesson, D. (1992). Acta Metall. Mater. 40, S149–S159.
Pierre, J., Galera, R. & Siaud, E. (1985). J. Phys. Fr. 46, 621–626.Raghavan, V. (2008). J. Phase Equilib. Diffus. 29, 270–271.Rietveld, H. M. (1969). J. Appl. Cryst. 2, 65–71.Rogl, P. (1988). In Ternary Alloys: a Comprehensive Compendium of
Evaluated Constitutional Data and Phase Diagrams, edited by G.Petzow & G. Effenberg. Weinheim, New York: VCH.
Rossi, A. & Iandelli, A. (1934). Atti Accad Naz. Lincei Cl. Sci. Fis.Mat. Nat. Rend. 19, 415–420.
Rowles, M. R. (2010). Powder Diffr. 25, 297–301.Rzychon, T., Kiełbus, A. & Litynska-Dobrzynska, L. (2013). Mater.
Charact. 83, 21–34.Samson, S. & Gordon, E. K. (1968). Acta Cryst. B24, 1004–1013.Saunders, N. (1990). Calphad, 14, 61–70.Schobinger-Papamantellos, P. & Fischer, P. (1970). Naturwis-
senschaften, 57, 128–129.Stephens, P. W. (1999). J. Appl. Cryst. 32, 281–289.Sung Bae, J., Kil Choo, W. & Hee Lee, C. (2004). J. Eur. Ceram. Soc.24, 1291–1294.
Villars, P. & Calvert, L. D. (1991). Pearson’s Handbook of Crystal-lographic Data for Intermetallic Phases. Materials Park, OH: ASMInternational.
Wallwork, K. S., Kennedy, B. J. & Wang, D. (2007). AIP Conf. Proc.pp. 879–882.
Wood, D. H. & Cramer, E. M. (1965). J. Less-Common Met. 9, 321–337.
Yin, F., Su, X., Li, Z., Huang, M. & Shi, Y. (2000). J. Alloys Compd.302, 169–172.
Zarechnyuk, O., Kinzhibalo, V., Tyvanchuk, A. & Rykhal, R. (1981).Izv. Akad. Nauk. SSSR Met. pp. 221–223.
Zhou, S. H. & Napolitano, R. E. (2006). Acta Mater. 54, 831–840.Zhu, S., Easton, M. A., Abbott, T. B., Gibson, M. A. & Nie, J. F.(2016). Adv. Eng. Mater. 18, 932–937.
Zhu, S., Easton, M. A., Abbott, T. B., Nie, J.-F., Dargusch, M. S., Hort,N. & Gibson, M. A. (2015). Metall. Mater. Trans. A, 46, 3543–3554.
research papers
Acta Cryst. (2018). B74, 370–375 Charlotte Wong et al. (Al,Mg)3La: a new phase in the Mg–Al–La system 375electronic reprint
130
Chapter 6
Solidification path and microstructure evolution of Mg-3Al-14La alloy: implications for the Mg-rich
corner of the Mg-Al-La phase diagram
131
Chapter 6
Solidification path and microstructure evolution of Mg-3Al-14La
alloy: implications for the Mg-rich corner of the Mg-Al-La phase
diagram
Charlotte Wong1, Kazuhiro Nogita3, Mark J. Styles2, Suming Zhu1,4, Dong Qiu1, Stuart D.
McDonald3, Mark A. Gibson1,2,4, Trevor B. Abbott1,4,5, Mark A. Easton1
1 School of Engineering, RMIT University, Carlton, Victoria 3053, Australia
2 CSIRO Manufacturing, Clayton, Victoria 3168, Australia
3 School of Mechanical and Mining Engineering, University of Queensland, Brisbane,
Queensland 4072, Australia
4 Department of Materials Science and Engineering, Monash University, Victoria 3800,
Australia
5 Magontec Ltd, Sydney, New South Wales 2000, Australia
Journal of Alloys and Compounds 2019, Volume 784, page 527-534
Available online: https://doi.org/10.1016/j.jallcom.2019.01.029
*The authors of this Elsevier article retain the right to include it in this thesis, provided it is not published commercially.
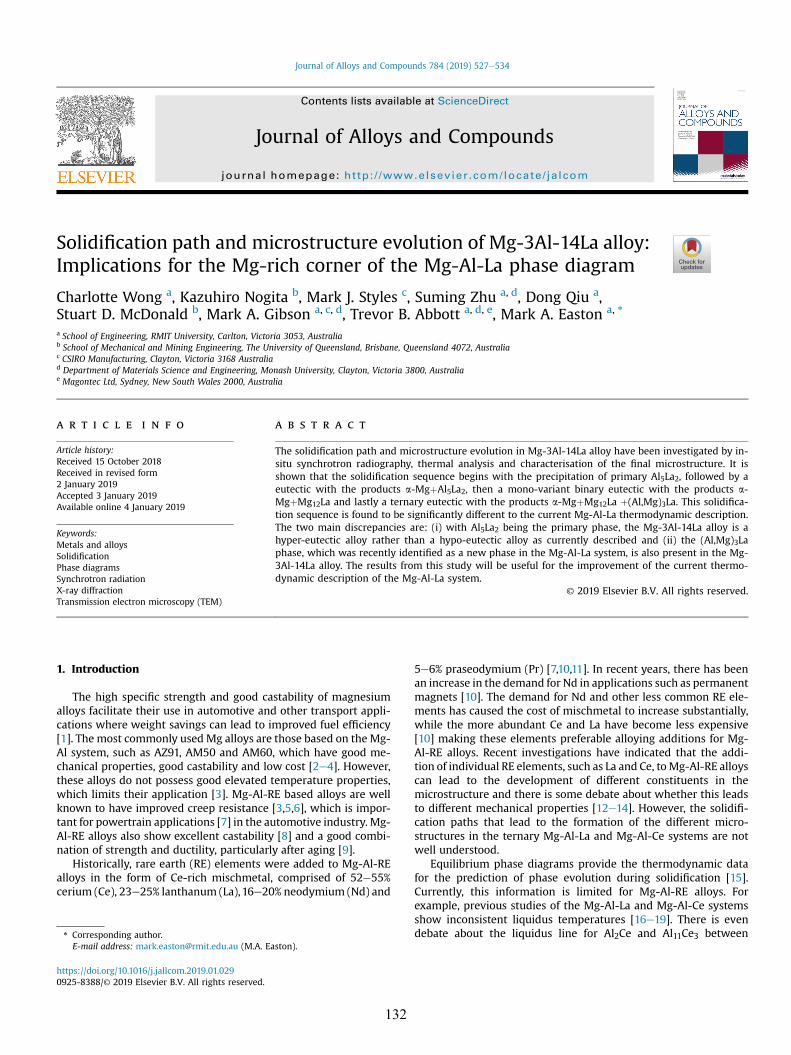
lable at ScienceDirect
Journal of Alloys and Compounds 784 (2019) 527e534
Contents lists avai
Journal of Alloys and Compounds
journal homepage: http: / /www.elsevier .com/locate/ ja lcom
Solidification path and microstructure evolution of Mg-3Al-14La alloy:Implications for the Mg-rich corner of the Mg-Al-La phase diagram
Charlotte Wong a, Kazuhiro Nogita b, Mark J. Styles c, Suming Zhu a, d, Dong Qiu a,Stuart D. McDonald b, Mark A. Gibson a, c, d, Trevor B. Abbott a, d, e, Mark A. Easton a, *
a School of Engineering, RMIT University, Carlton, Victoria 3053, Australiab School of Mechanical and Mining Engineering, The University of Queensland, Brisbane, Queensland 4072, Australiac CSIRO Manufacturing, Clayton, Victoria 3168 Australiad Department of Materials Science and Engineering, Monash University, Clayton, Victoria 3800, Australiae Magontec Ltd, Sydney, New South Wales 2000, Australia
a r t i c l e i n f o
Article history:Received 15 October 2018Received in revised form2 January 2019Accepted 3 January 2019Available online 4 January 2019
Keywords:Metals and alloysSolidificationPhase diagramsSynchrotron radiationX-ray diffractionTransmission electron microscopy (TEM)
* Corresponding author.E-mail address: [email protected] (M.A. Ea
https://doi.org/10.1016/j.jallcom.2019.01.0290925-8388/© 2019 Elsevier B.V. All rights reserved.
a b s t r a c t
The solidification path and microstructure evolution in Mg-3Al-14La alloy have been investigated by in-situ synchrotron radiography, thermal analysis and characterisation of the final microstructure. It isshown that the solidification sequence begins with the precipitation of primary Al5La2, followed by aeutectic with the products a-MgþAl5La2, then a mono-variant binary eutectic with the products a-MgþMg12La and lastly a ternary eutectic with the products a-MgþMg12La þ(Al,Mg)3La. This solidifica-tion sequence is found to be significantly different to the current Mg-Al-La thermodynamic description.The two main discrepancies are: (i) with Al5La2 being the primary phase, the Mg-3Al-14La alloy is ahyper-eutectic alloy rather than a hypo-eutectic alloy as currently described and (ii) the (Al,Mg)3Laphase, which was recently identified as a new phase in the Mg-Al-La system, is also present in the Mg-3Al-14La alloy. The results from this study will be useful for the improvement of the current thermo-dynamic description of the Mg-Al-La system.
© 2019 Elsevier B.V. All rights reserved.
1. Introduction
The high specific strength and good castability of magnesiumalloys facilitate their use in automotive and other transport appli-cations where weight savings can lead to improved fuel efficiency[1]. The most commonly used Mg alloys are those based on the Mg-Al system, such as AZ91, AM50 and AM60, which have good me-chanical properties, good castability and low cost [2e4]. However,these alloys do not possess good elevated temperature properties,which limits their application [3]. Mg-Al-RE based alloys are wellknown to have improved creep resistance [3,5,6], which is impor-tant for powertrain applications [7] in the automotive industry. Mg-Al-RE alloys also show excellent castability [8] and a good combi-nation of strength and ductility, particularly after aging [9].
Historically, rare earth (RE) elements were added to Mg-Al-REalloys in the form of Ce-rich mischmetal, comprised of 52e55%cerium (Ce), 23e25% lanthanum (La),16e20% neodymium (Nd) and
ston).
132
5e6% praseodymium (Pr) [7,10,11]. In recent years, there has beenan increase in the demand for Nd in applications such as permanentmagnets [10]. The demand for Nd and other less common RE ele-ments has caused the cost of mischmetal to increase substantially,while the more abundant Ce and La have become less expensive[10] making these elements preferable alloying additions for Mg-Al-RE alloys. Recent investigations have indicated that the addi-tion of individual RE elements, such as La and Ce, toMg-Al-RE alloyscan lead to the development of different constituents in themicrostructure and there is some debate about whether this leadsto different mechanical properties [12e14]. However, the solidifi-cation paths that lead to the formation of the different micro-structures in the ternary Mg-Al-La and Mg-Al-Ce systems are notwell understood.
Equilibrium phase diagrams provide the thermodynamic datafor the prediction of phase evolution during solidification [15].Currently, this information is limited for Mg-Al-RE alloys. Forexample, previous studies of the Mg-Al-La and Mg-Al-Ce systemsshow inconsistent liquidus temperatures [16e19]. There is evendebate about the liquidus line for Al2Ce and Al11Ce3 between
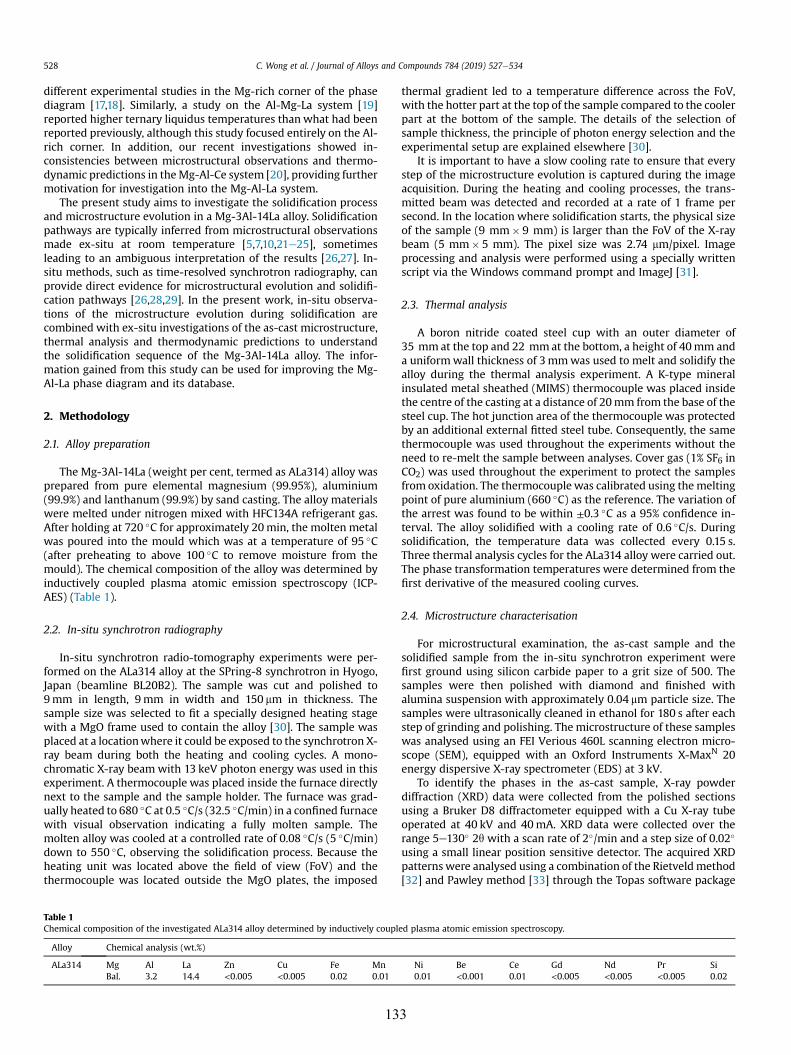
C. Wong et al. / Journal of Alloys and Compounds 784 (2019) 527e534528
different experimental studies in the Mg-rich corner of the phasediagram [17,18]. Similarly, a study on the Al-Mg-La system [19]reported higher ternary liquidus temperatures than what had beenreported previously, although this study focused entirely on the Al-rich corner. In addition, our recent investigations showed in-consistencies between microstructural observations and thermo-dynamic predictions in theMg-Al-Ce system [20], providing furthermotivation for investigation into the Mg-Al-La system.
The present study aims to investigate the solidification processand microstructure evolution in a Mg-3Al-14La alloy. Solidificationpathways are typically inferred from microstructural observationsmade ex-situ at room temperature [5,7,10,21e25], sometimesleading to an ambiguous interpretation of the results [26,27]. In-situ methods, such as time-resolved synchrotron radiography, canprovide direct evidence for microstructural evolution and solidifi-cation pathways [26,28,29]. In the present work, in-situ observa-tions of the microstructure evolution during solidification arecombined with ex-situ investigations of the as-cast microstructure,thermal analysis and thermodynamic predictions to understandthe solidification sequence of the Mg-3Al-14La alloy. The infor-mation gained from this study can be used for improving the Mg-Al-La phase diagram and its database.
2. Methodology
2.1. Alloy preparation
The Mg-3Al-14La (weight per cent, termed as ALa314) alloy wasprepared from pure elemental magnesium (99.95%), aluminium(99.9%) and lanthanum (99.9%) by sand casting. The alloy materialswere melted under nitrogen mixed with HFC134A refrigerant gas.After holding at 720 C for approximately 20min, the molten metalwas poured into the mould which was at a temperature of 95 C(after preheating to above 100 C to remove moisture from themould). The chemical composition of the alloy was determined byinductively coupled plasma atomic emission spectroscopy (ICP-AES) (Table 1).
2.2. In-situ synchrotron radiography
In-situ synchrotron radio-tomography experiments were per-formed on the ALa314 alloy at the SPring-8 synchrotron in Hyogo,Japan (beamline BL20B2). The sample was cut and polished to9mm in length, 9mm in width and 150 mm in thickness. Thesample size was selected to fit a specially designed heating stagewith a MgO frame used to contain the alloy [30]. The sample wasplaced at a locationwhere it could be exposed to the synchrotron X-ray beam during both the heating and cooling cycles. A mono-chromatic X-ray beam with 13 keV photon energy was used in thisexperiment. A thermocouple was placed inside the furnace directlynext to the sample and the sample holder. The furnace was grad-ually heated to 680 C at 0.5 C/s (32.5 C/min) in a confined furnacewith visual observation indicating a fully molten sample. Themolten alloy was cooled at a controlled rate of 0.08 C/s (5 C/min)down to 550 C, observing the solidification process. Because theheating unit was located above the field of view (FoV) and thethermocouple was located outside the MgO plates, the imposed
Table 1Chemical composition of the investigated ALa314 alloy determined by inductively coupl
Alloy Chemical analysis (wt.%)
ALa314 Mg Al La Zn Cu Fe MnBal. 3.2 14.4 <0.005 <0.005 0.02 0.01
13
thermal gradient led to a temperature difference across the FoV,with the hotter part at the top of the sample compared to the coolerpart at the bottom of the sample. The details of the selection ofsample thickness, the principle of photon energy selection and theexperimental setup are explained elsewhere [30].
It is important to have a slow cooling rate to ensure that everystep of the microstructure evolution is captured during the imageacquisition. During the heating and cooling processes, the trans-mitted beam was detected and recorded at a rate of 1 frame persecond. In the location where solidification starts, the physical sizeof the sample (9 mm 9 mm) is larger than the FoV of the X-raybeam (5 mm 5 mm). The pixel size was 2.74 mm/pixel. Imageprocessing and analysis were performed using a specially writtenscript via the Windows command prompt and ImageJ [31].
2.3. Thermal analysis
A boron nitride coated steel cup with an outer diameter of35 mmat the top and 22 mmat the bottom, a height of 40mm anda uniformwall thickness of 3mmwas used to melt and solidify thealloy during the thermal analysis experiment. A K-type mineralinsulated metal sheathed (MIMS) thermocouple was placed insidethe centre of the casting at a distance of 20mm from the base of thesteel cup. The hot junction area of the thermocouple was protectedby an additional external fitted steel tube. Consequently, the samethermocouple was used throughout the experiments without theneed to re-melt the sample between analyses. Cover gas (1% SF6 inCO2) was used throughout the experiment to protect the samplesfrom oxidation. The thermocouple was calibrated using themeltingpoint of pure aluminium (660 C) as the reference. The variation ofthe arrest was found to be within ±0.3 C as a 95% confidence in-terval. The alloy solidified with a cooling rate of 0.6 C/s. Duringsolidification, the temperature data was collected every 0.15 s.Three thermal analysis cycles for the ALa314 alloy were carried out.The phase transformation temperatures were determined from thefirst derivative of the measured cooling curves.
2.4. Microstructure characterisation
For microstructural examination, the as-cast sample and thesolidified sample from the in-situ synchrotron experiment werefirst ground using silicon carbide paper to a grit size of 500. Thesamples were then polished with diamond and finished withalumina suspension with approximately 0.04 mm particle size. Thesamples were ultrasonically cleaned in ethanol for 180 s after eachstep of grinding and polishing. The microstructure of these sampleswas analysed using an FEI Verious 460L scanning electron micro-scope (SEM), equipped with an Oxford Instruments X-MaxN 20energy dispersive X-ray spectrometer (EDS) at 3 kV.
To identify the phases in the as-cast sample, X-ray powderdiffraction (XRD) data were collected from the polished sectionsusing a Bruker D8 diffractometer equipped with a Cu X-ray tubeoperated at 40 kV and 40mA. XRD data were collected over therange 5e130 2q with a scan rate of 2/min and a step size of 0.02
using a small linear position sensitive detector. The acquired XRDpatterns were analysed using a combination of the Rietveldmethod[32] and Pawley method [33] through the Topas software package
ed plasma atomic emission spectroscopy.
Ni Be Ce Gd Nd Pr Si0.01 <0.001 0.01 <0.005 <0.005 <0.005 0.02
3
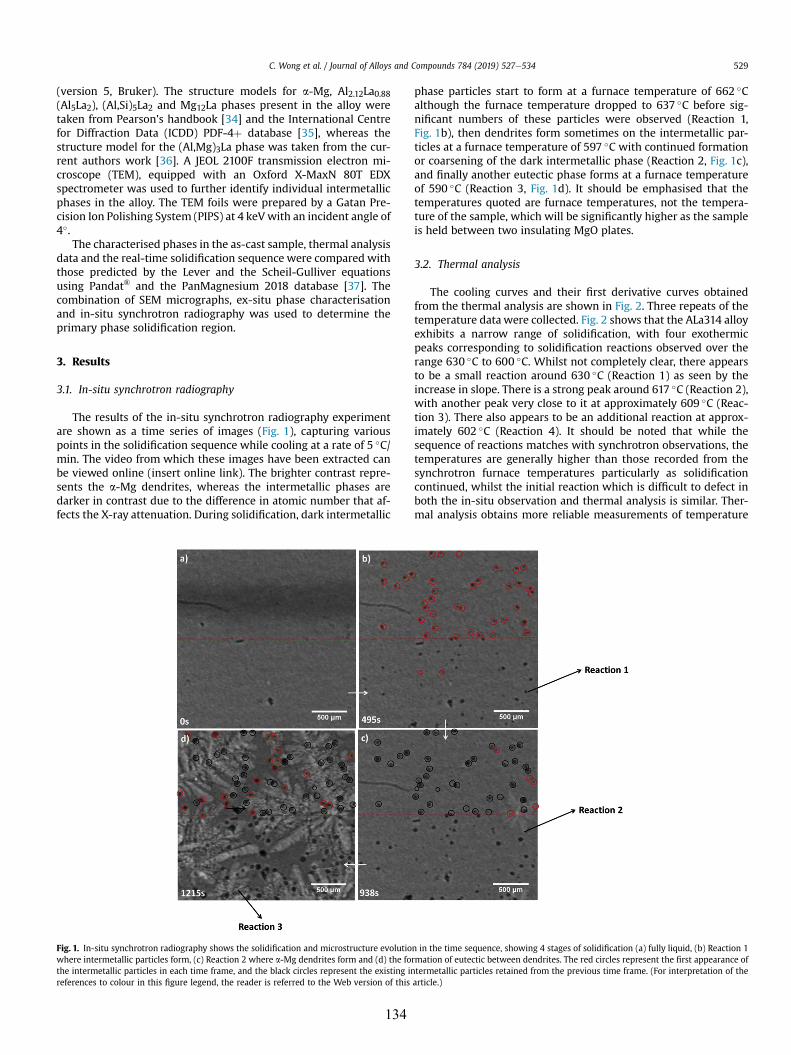
C. Wong et al. / Journal of Alloys and Compounds 784 (2019) 527e534 529
(version 5, Bruker). The structure models for a-Mg, Al2.12La0.88(Al5La2), (Al,Si)5La2 and Mg12La phases present in the alloy weretaken from Pearson's handbook [34] and the International Centrefor Diffraction Data (ICDD) PDF-4þ database [35], whereas thestructure model for the (Al,Mg)3La phase was taken from the cur-rent authors work [36]. A JEOL 2100F transmission electron mi-croscope (TEM), equipped with an Oxford X-MaxN 80T EDXspectrometer was used to further identify individual intermetallicphases in the alloy. The TEM foils were prepared by a Gatan Pre-cision Ion Polishing System (PIPS) at 4 keVwith an incident angle of4.
The characterised phases in the as-cast sample, thermal analysisdata and the real-time solidification sequence were compared withthose predicted by the Lever and the Scheil-Gulliver equationsusing Pandat® and the PanMagnesium 2018 database [37]. Thecombination of SEM micrographs, ex-situ phase characterisationand in-situ synchrotron radiography was used to determine theprimary phase solidification region.
3. Results
3.1. In-situ synchrotron radiography
The results of the in-situ synchrotron radiography experimentare shown as a time series of images (Fig. 1), capturing variouspoints in the solidification sequence while cooling at a rate of 5 C/min. The video from which these images have been extracted canbe viewed online (insert online link). The brighter contrast repre-sents the a-Mg dendrites, whereas the intermetallic phases aredarker in contrast due to the difference in atomic number that af-fects the X-ray attenuation. During solidification, dark intermetallic
Fig. 1. In-situ synchrotron radiography shows the solidification and microstructure evolutiowhere intermetallic particles form, (c) Reaction 2 where a-Mg dendrites form and (d) the fothe intermetallic particles in each time frame, and the black circles represent the existing inreferences to colour in this figure legend, the reader is referred to the Web version of this
134
phase particles start to form at a furnace temperature of 662 Calthough the furnace temperature dropped to 637 C before sig-nificant numbers of these particles were observed (Reaction 1,Fig. 1b), then dendrites form sometimes on the intermetallic par-ticles at a furnace temperature of 597 C with continued formationor coarsening of the dark intermetallic phase (Reaction 2, Fig. 1c),and finally another eutectic phase forms at a furnace temperatureof 590 C (Reaction 3, Fig. 1d). It should be emphasised that thetemperatures quoted are furnace temperatures, not the tempera-ture of the sample, which will be significantly higher as the sampleis held between two insulating MgO plates.
3.2. Thermal analysis
The cooling curves and their first derivative curves obtainedfrom the thermal analysis are shown in Fig. 2. Three repeats of thetemperature data were collected. Fig. 2 shows that the ALa314 alloyexhibits a narrow range of solidification, with four exothermicpeaks corresponding to solidification reactions observed over therange 630 C to 600 C. Whilst not completely clear, there appearsto be a small reaction around 630 C (Reaction 1) as seen by theincrease in slope. There is a strong peak around 617 C (Reaction 2),with another peak very close to it at approximately 609 C (Reac-tion 3). There also appears to be an additional reaction at approx-imately 602 C (Reaction 4). It should be noted that while thesequence of reactions matches with synchrotron observations, thetemperatures are generally higher than those recorded from thesynchrotron furnace temperatures particularly as solidificationcontinued, whilst the initial reaction which is difficult to defect inboth the in-situ observation and thermal analysis is similar. Ther-mal analysis obtains more reliable measurements of temperature
n in the time sequence, showing 4 stages of solidification (a) fully liquid, (b) Reaction 1rmation of eutectic between dendrites. The red circles represent the first appearance oftermetallic particles retained from the previous time frame. (For interpretation of thearticle.)
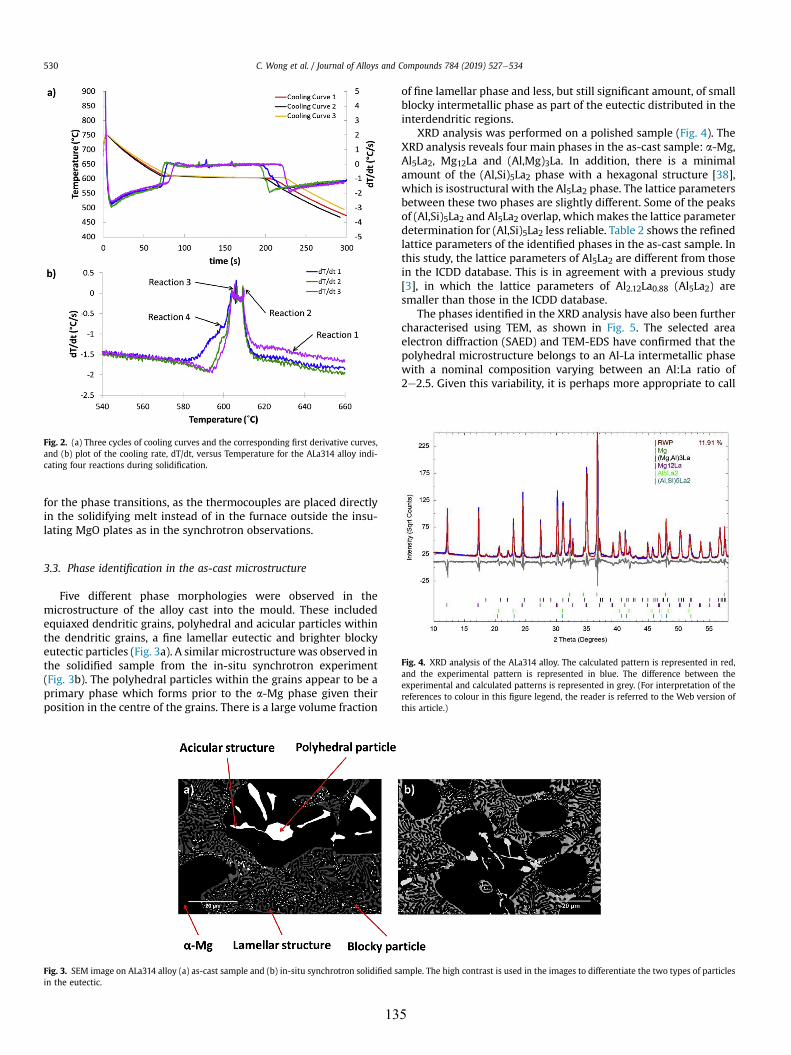
Fig. 2. (a) Three cycles of cooling curves and the corresponding first derivative curves,and (b) plot of the cooling rate, dT/dt, versus Temperature for the ALa314 alloy indi-cating four reactions during solidification.
C. Wong et al. / Journal of Alloys and Compounds 784 (2019) 527e534530
for the phase transitions, as the thermocouples are placed directlyin the solidifying melt instead of in the furnace outside the insu-lating MgO plates as in the synchrotron observations.
Fig. 4. XRD analysis of the ALa314 alloy. The calculated pattern is represented in red,and the experimental pattern is represented in blue. The difference between theexperimental and calculated patterns is represented in grey. (For interpretation of thereferences to colour in this figure legend, the reader is referred to the Web version ofthis article.)
3.3. Phase identification in the as-cast microstructure
Five different phase morphologies were observed in themicrostructure of the alloy cast into the mould. These includedequiaxed dendritic grains, polyhedral and acicular particles withinthe dendritic grains, a fine lamellar eutectic and brighter blockyeutectic particles (Fig. 3a). A similar microstructurewas observed inthe solidified sample from the in-situ synchrotron experiment(Fig. 3b). The polyhedral particles within the grains appear to be aprimary phase which forms prior to the a-Mg phase given theirposition in the centre of the grains. There is a large volume fraction
Fig. 3. SEM image on ALa314 alloy (a) as-cast sample and (b) in-situ synchrotron solidified sin the eutectic.
13
of fine lamellar phase and less, but still significant amount, of smallblocky intermetallic phase as part of the eutectic distributed in theinterdendritic regions.
XRD analysis was performed on a polished sample (Fig. 4). TheXRD analysis reveals four main phases in the as-cast sample: a-Mg,Al5La2, Mg12La and (Al,Mg)3La. In addition, there is a minimalamount of the (Al,Si)5La2 phase with a hexagonal structure [38],which is isostructural with the Al5La2 phase. The lattice parametersbetween these two phases are slightly different. Some of the peaksof (Al,Si)5La2 and Al5La2 overlap, whichmakes the lattice parameterdetermination for (Al,Si)5La2 less reliable. Table 2 shows the refinedlattice parameters of the identified phases in the as-cast sample. Inthis study, the lattice parameters of Al5La2 are different from thosein the ICDD database. This is in agreement with a previous study[3], in which the lattice parameters of Al2.12La0.88 (Al5La2) aresmaller than those in the ICDD database.
The phases identified in the XRD analysis have also been furthercharacterised using TEM, as shown in Fig. 5. The selected areaelectron diffraction (SAED) and TEM-EDS have confirmed that thepolyhedral microstructure belongs to an Al-La intermetallic phasewith a nominal composition varying between an Al:La ratio of2e2.5. Given this variability, it is perhaps more appropriate to call
ample. The high contrast is used in the images to differentiate the two types of particles
5
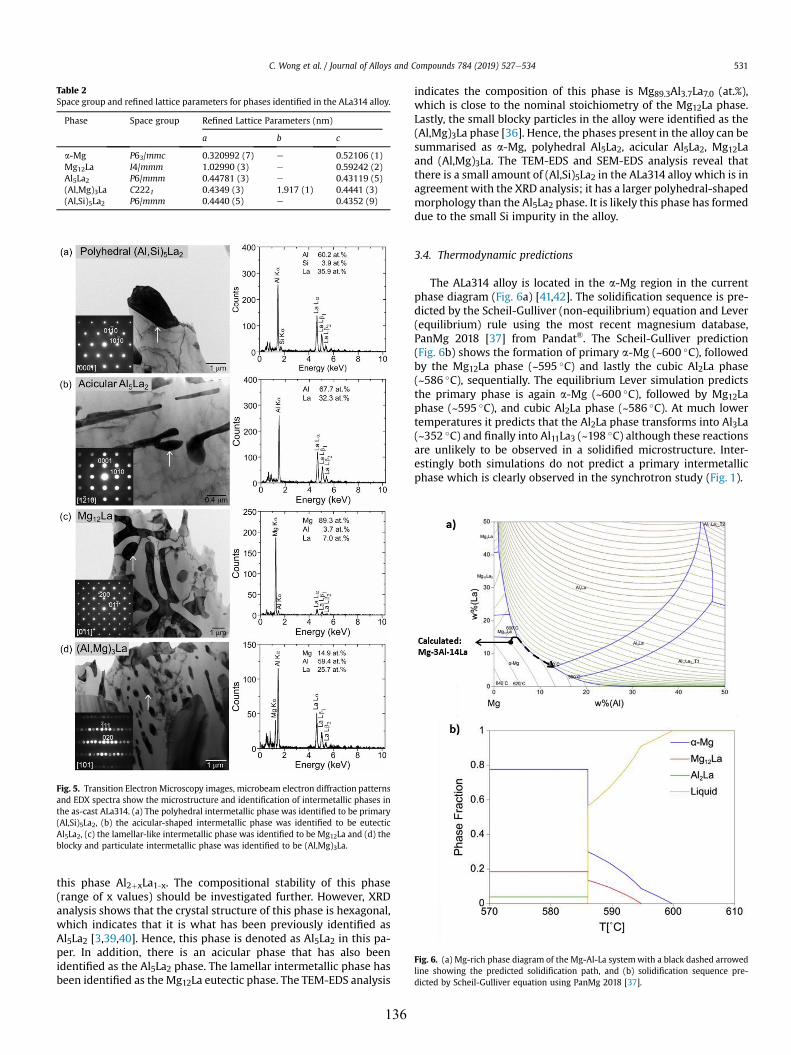
Table 2Space group and refined lattice parameters for phases identified in the ALa314 alloy.
Phase Space group Refined Lattice Parameters (nm)
a b c
a-Mg P63/mmc 0.320992 (7) e 0.52106 (1)Mg12La I4/mmm 1.02990 (3) e 0.59242 (2)Al5La2 P6/mmm 0.44781 (3) e 0.43119 (5)(Al,Mg)3La C2221 0.4349 (3) 1.917 (1) 0.4441 (3)(Al,Si)5La2 P6/mmm 0.4440 (5) e 0.4352 (9)
Fig. 5. Transition Electron Microscopy images, microbeam electron diffraction patternsand EDX spectra show the microstructure and identification of intermetallic phases inthe as-cast ALa314. (a) The polyhedral intermetallic phase was identified to be primary(Al,Si)5La2, (b) the acicular-shaped intermetallic phase was identified to be eutecticAl5La2, (c) the lamellar-like intermetallic phase was identified to be Mg12La and (d) theblocky and particulate intermetallic phase was identified to be (Al,Mg)3La.
Fig. 6. (a) Mg-rich phase diagram of the Mg-Al-La systemwith a black dashed arrowedline showing the predicted solidification path, and (b) solidification sequence pre-dicted by Scheil-Gulliver equation using PanMg 2018 [37].
C. Wong et al. / Journal of Alloys and Compounds 784 (2019) 527e534 531
this phase Al2þxLa1-x. The compositional stability of this phase(range of x values) should be investigated further. However, XRDanalysis shows that the crystal structure of this phase is hexagonal,which indicates that it is what has been previously identified asAl5La2 [3,39,40]. Hence, this phase is denoted as Al5La2 in this pa-per. In addition, there is an acicular phase that has also beenidentified as the Al5La2 phase. The lamellar intermetallic phase hasbeen identified as theMg12La eutectic phase. The TEM-EDS analysis
136
indicates the composition of this phase is Mg89.3Al3.7La7.0 (at.%),which is close to the nominal stoichiometry of the Mg12La phase.Lastly, the small blocky particles in the alloy were identified as the(Al,Mg)3La phase [36]. Hence, the phases present in the alloy can besummarised as a-Mg, polyhedral Al5La2, acicular Al5La2, Mg12Laand (Al,Mg)3La. The TEM-EDS and SEM-EDS analysis reveal thatthere is a small amount of (Al,Si)5La2 in the ALa314 alloy which is inagreement with the XRD analysis; it has a larger polyhedral-shapedmorphology than the Al5La2 phase. It is likely this phase has formeddue to the small Si impurity in the alloy.
3.4. Thermodynamic predictions
The ALa314 alloy is located in the a-Mg region in the currentphase diagram (Fig. 6a) [41,42]. The solidification sequence is pre-dicted by the Scheil-Gulliver (non-equilibrium) equation and Lever(equilibrium) rule using the most recent magnesium database,PanMg 2018 [37] from Pandat®. The Scheil-Gulliver prediction(Fig. 6b) shows the formation of primary a-Mg (~600 C), followedby the Mg12La phase (~595 C) and lastly the cubic Al2La phase(~586 C), sequentially. The equilibrium Lever simulation predictsthe primary phase is again a-Mg (~600 C), followed by Mg12Laphase (~595 C), and cubic Al2La phase (~586 C). At much lowertemperatures it predicts that the Al2La phase transforms into Al3La(~352 C) and finally into Al11La3 (~198 C) although these reactionsare unlikely to be observed in a solidified microstructure. Inter-estingly both simulations do not predict a primary intermetallicphase which is clearly observed in the synchrotron study (Fig. 1).
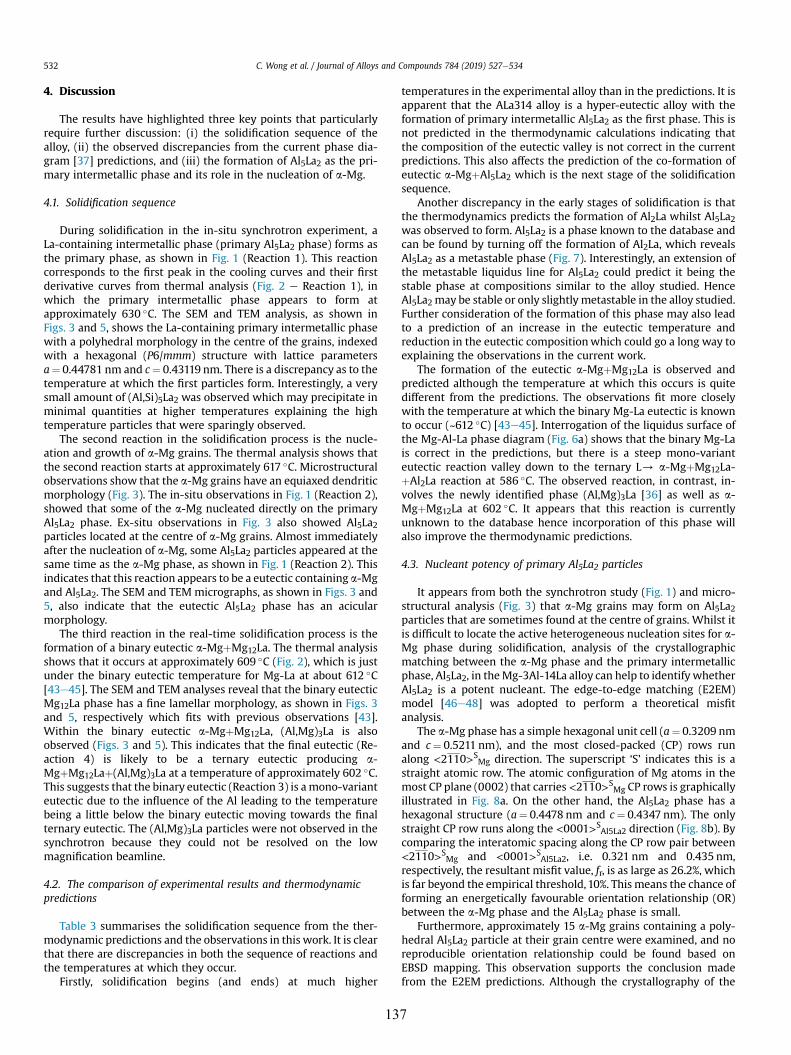
C. Wong et al. / Journal of Alloys and Compounds 784 (2019) 527e534532
4. Discussion
The results have highlighted three key points that particularlyrequire further discussion: (i) the solidification sequence of thealloy, (ii) the observed discrepancies from the current phase dia-gram [37] predictions, and (iii) the formation of Al5La2 as the pri-mary intermetallic phase and its role in the nucleation of a-Mg.
4.1. Solidification sequence
During solidification in the in-situ synchrotron experiment, aLa-containing intermetallic phase (primary Al5La2 phase) forms asthe primary phase, as shown in Fig. 1 (Reaction 1). This reactioncorresponds to the first peak in the cooling curves and their firstderivative curves from thermal analysis (Fig. 2 e Reaction 1), inwhich the primary intermetallic phase appears to form atapproximately 630 C. The SEM and TEM analysis, as shown inFigs. 3 and 5, shows the La-containing primary intermetallic phasewith a polyhedral morphology in the centre of the grains, indexedwith a hexagonal (P6/mmm) structure with lattice parametersa¼ 0.44781 nm and c¼ 0.43119 nm. There is a discrepancy as to thetemperature at which the first particles form. Interestingly, a verysmall amount of (Al,Si)5La2 was observed which may precipitate inminimal quantities at higher temperatures explaining the hightemperature particles that were sparingly observed.
The second reaction in the solidification process is the nucle-ation and growth of a-Mg grains. The thermal analysis shows thatthe second reaction starts at approximately 617 C. Microstructuralobservations show that the a-Mg grains have an equiaxed dendriticmorphology (Fig. 3). The in-situ observations in Fig. 1 (Reaction 2),showed that some of the a-Mg nucleated directly on the primaryAl5La2 phase. Ex-situ observations in Fig. 3 also showed Al5La2particles located at the centre of a-Mg grains. Almost immediatelyafter the nucleation of a-Mg, some Al5La2 particles appeared at thesame time as the a-Mg phase, as shown in Fig. 1 (Reaction 2). Thisindicates that this reaction appears to be a eutectic containing a-Mgand Al5La2. The SEM and TEM micrographs, as shown in Figs. 3 and5, also indicate that the eutectic Al5La2 phase has an acicularmorphology.
The third reaction in the real-time solidification process is theformation of a binary eutectic a-MgþMg12La. The thermal analysisshows that it occurs at approximately 609 C (Fig. 2), which is justunder the binary eutectic temperature for Mg-La at about 612 C[43e45]. The SEM and TEM analyses reveal that the binary eutecticMg12La phase has a fine lamellar morphology, as shown in Figs. 3and 5, respectively which fits with previous observations [43].Within the binary eutectic a-MgþMg12La, (Al,Mg)3La is alsoobserved (Figs. 3 and 5). This indicates that the final eutectic (Re-action 4) is likely to be a ternary eutectic producing a-MgþMg12Laþ(Al,Mg)3La at a temperature of approximately 602 C.This suggests that the binary eutectic (Reaction 3) is amono-varianteutectic due to the influence of the Al leading to the temperaturebeing a little below the binary eutectic moving towards the finalternary eutectic. The (Al,Mg)3La particles were not observed in thesynchrotron because they could not be resolved on the lowmagnification beamline.
4.2. The comparison of experimental results and thermodynamicpredictions
Table 3 summarises the solidification sequence from the ther-modynamic predictions and the observations in this work. It is clearthat there are discrepancies in both the sequence of reactions andthe temperatures at which they occur.
Firstly, solidification begins (and ends) at much higher
13
temperatures in the experimental alloy than in the predictions. It isapparent that the ALa314 alloy is a hyper-eutectic alloy with theformation of primary intermetallic Al5La2 as the first phase. This isnot predicted in the thermodynamic calculations indicating thatthe composition of the eutectic valley is not correct in the currentpredictions. This also affects the prediction of the co-formation ofeutectic a-MgþAl5La2 which is the next stage of the solidificationsequence.
Another discrepancy in the early stages of solidification is thatthe thermodynamics predicts the formation of Al2La whilst Al5La2was observed to form. Al5La2 is a phase known to the database andcan be found by turning off the formation of Al2La, which revealsAl5La2 as a metastable phase (Fig. 7). Interestingly, an extension ofthe metastable liquidus line for Al5La2 could predict it being thestable phase at compositions similar to the alloy studied. HenceAl5La2 may be stable or only slightly metastable in the alloy studied.Further consideration of the formation of this phase may also leadto a prediction of an increase in the eutectic temperature andreduction in the eutectic compositionwhich could go a long way toexplaining the observations in the current work.
The formation of the eutectic a-MgþMg12La is observed andpredicted although the temperature at which this occurs is quitedifferent from the predictions. The observations fit more closelywith the temperature at which the binary Mg-La eutectic is knownto occur (~612 C) [43e45]. Interrogation of the liquidus surface ofthe Mg-Al-La phase diagram (Fig. 6a) shows that the binary Mg-Lais correct in the predictions, but there is a steep mono-varianteutectic reaction valley down to the ternary L/ a-MgþMg12La-þAl2La reaction at 586 C. The observed reaction, in contrast, in-volves the newly identified phase (Al,Mg)3La [36] as well as a-MgþMg12La at 602 C. It appears that this reaction is currentlyunknown to the database hence incorporation of this phase willalso improve the thermodynamic predictions.
4.3. Nucleant potency of primary Al5La2 particles
It appears from both the synchrotron study (Fig. 1) and micro-structural analysis (Fig. 3) that a-Mg grains may form on Al5La2particles that are sometimes found at the centre of grains. Whilst itis difficult to locate the active heterogeneous nucleation sites for a-Mg phase during solidification, analysis of the crystallographicmatching between the a-Mg phase and the primary intermetallicphase, Al5La2, in theMg-3Al-14La alloy can help to identify whetherAl5La2 is a potent nucleant. The edge-to-edge matching (E2EM)model [46e48] was adopted to perform a theoretical misfitanalysis.
The a-Mg phase has a simple hexagonal unit cell (a¼ 0.3209 nmand c¼ 0.5211 nm), and the most closed-packed (CP) rows runalong <2110>S
Mg direction. The superscript ‘S’ indicates this is astraight atomic row. The atomic configuration of Mg atoms in themost CP plane (0002) that carries <2110>S
Mg CP rows is graphicallyillustrated in Fig. 8a. On the other hand, the Al5La2 phase has ahexagonal structure (a¼ 0.4478 nm and c¼ 0.4347 nm). The onlystraight CP row runs along the <0001>S
Al5La2 direction (Fig. 8b). Bycomparing the interatomic spacing along the CP row pair between<2110>S
Mg and <0001>SAl5La2, i.e. 0.321 nm and 0.435 nm,
respectively, the resultant misfit value, fr, is as large as 26.2%, whichis far beyond the empirical threshold,10%. This means the chance offorming an energetically favourable orientation relationship (OR)between the a-Mg phase and the Al5La2 phase is small.
Furthermore, approximately 15 a-Mg grains containing a poly-hedral Al5La2 particle at their grain centre were examined, and noreproducible orientation relationship could be found based onEBSD mapping. This observation supports the conclusion madefrom the E2EM predictions. Although the crystallography of the
7
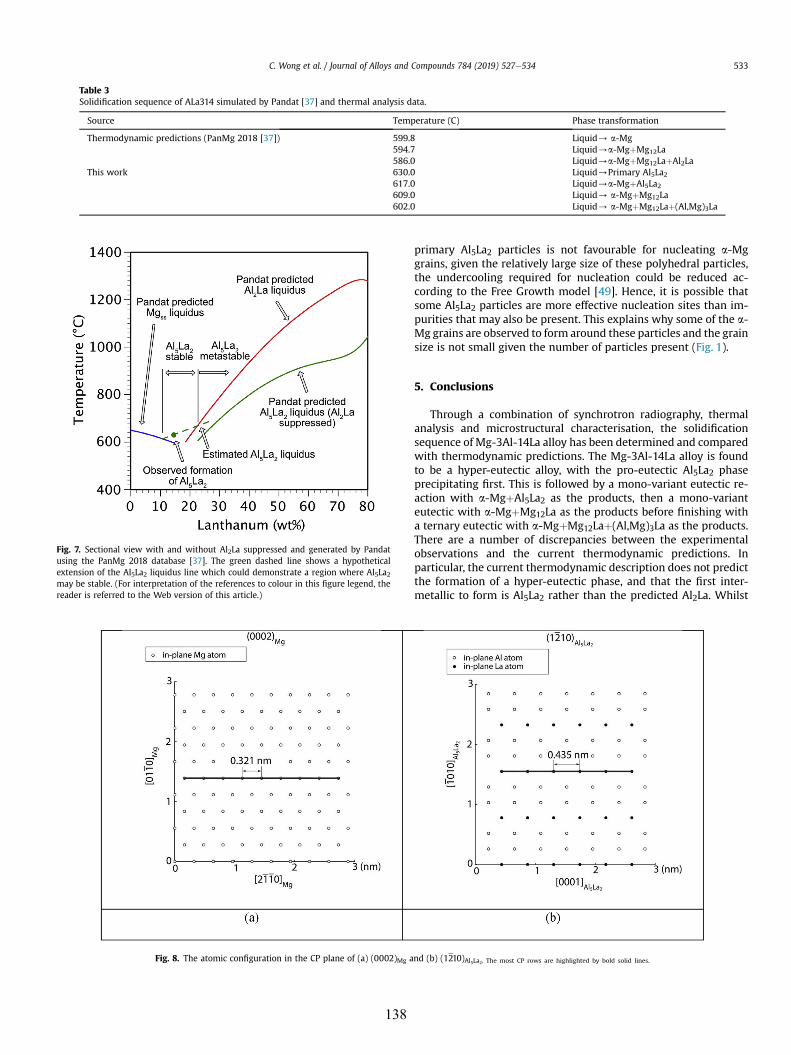
Table 3Solidification sequence of ALa314 simulated by Pandat [37] and thermal analysis data.
Source Temperature (C) Phase transformation
Thermodynamic predictions (PanMg 2018 [37]) 599.8 Liquid/ a-Mg594.7 Liquid/a-MgþMg12La586.0 Liquid/a-MgþMg12LaþAl2La
This work 630.0 Liquid/Primary Al5La2617.0 Liquid/a-MgþAl5La2609.0 Liquid/ a-MgþMg12La602.0 Liquid/ a-MgþMg12Laþ(Al,Mg)3La
Fig. 7. Sectional view with and without Al2La suppressed and generated by Pandatusing the PanMg 2018 database [37]. The green dashed line shows a hypotheticalextension of the Al5La2 liquidus line which could demonstrate a region where Al5La2may be stable. (For interpretation of the references to colour in this figure legend, thereader is referred to the Web version of this article.)
Fig. 8. The atomic configuration in the CP plane of (a) (0002)Mg a
C. Wong et al. / Journal of Alloys and Compounds 784 (2019) 527e534 533
138
primary Al5La2 particles is not favourable for nucleating a-Mggrains, given the relatively large size of these polyhedral particles,the undercooling required for nucleation could be reduced ac-cording to the Free Growth model [49]. Hence, it is possible thatsome Al5La2 particles are more effective nucleation sites than im-purities that may also be present. This explains why some of the a-Mg grains are observed to form around these particles and the grainsize is not small given the number of particles present (Fig. 1).
5. Conclusions
Through a combination of synchrotron radiography, thermalanalysis and microstructural characterisation, the solidificationsequence of Mg-3Al-14La alloy has been determined and comparedwith thermodynamic predictions. The Mg-3Al-14La alloy is foundto be a hyper-eutectic alloy, with the pro-eutectic Al5La2 phaseprecipitating first. This is followed by a mono-variant eutectic re-action with a-MgþAl5La2 as the products, then a mono-varianteutectic with a-MgþMg12La as the products before finishing witha ternary eutectic with a-MgþMg12Laþ(Al,Mg)3La as the products.There are a number of discrepancies between the experimentalobservations and the current thermodynamic predictions. Inparticular, the current thermodynamic description does not predictthe formation of a hyper-eutectic phase, and that the first inter-metallic to form is Al5La2 rather than the predicted Al2La. Whilst
nd (b) (1210)Al5La2. The most CP rows are highlighted by bold solid lines.
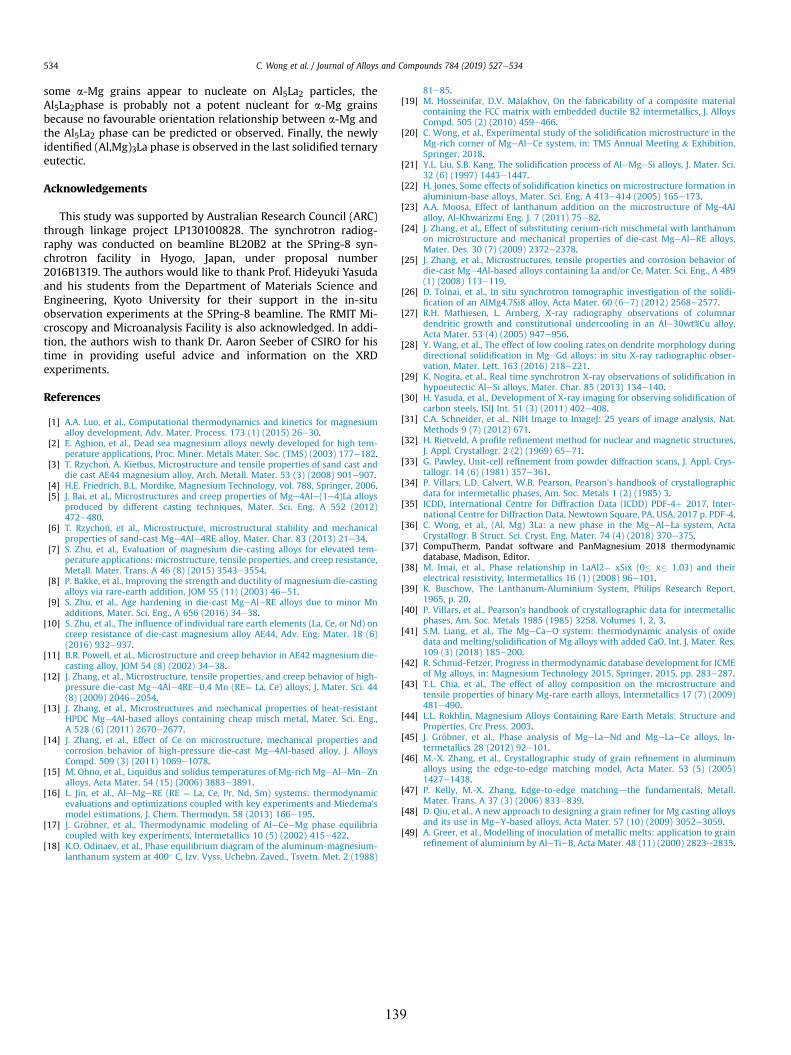
C. Wong et al. / Journal of Alloys and Compounds 784 (2019) 527e534534
some a-Mg grains appear to nucleate on Al5La2 particles, theAl5La2phase is probably not a potent nucleant for a-Mg grainsbecause no favourable orientation relationship between a-Mg andthe Al5La2 phase can be predicted or observed. Finally, the newlyidentified (Al,Mg)3La phase is observed in the last solidified ternaryeutectic.
Acknowledgements
This study was supported by Australian Research Council (ARC)through linkage project LP130100828. The synchrotron radiog-raphy was conducted on beamline BL20B2 at the SPring-8 syn-chrotron facility in Hyogo, Japan, under proposal number2016B1319. The authors would like to thank Prof. Hideyuki Yasudaand his students from the Department of Materials Science andEngineering, Kyoto University for their support in the in-situobservation experiments at the SPring-8 beamline. The RMIT Mi-croscopy and Microanalysis Facility is also acknowledged. In addi-tion, the authors wish to thank Dr. Aaron Seeber of CSIRO for histime in providing useful advice and information on the XRDexperiments.
References
[1] A.A. Luo, et al., Computational thermodynamics and kinetics for magnesiumalloy development, Adv. Mater. Process. 173 (1) (2015) 26e30.
[2] E. Aghion, et al., Dead sea magnesium alloys newly developed for high tem-perature applications, Proc. Miner. Metals Mater. Soc. (TMS) (2003) 177e182.
[3] T. Rzychon, A. Kiełbus, Microstructure and tensile properties of sand cast anddie cast AE44 magnesium alloy, Arch. Metall. Mater. 53 (3) (2008) 901e907.
[4] H.E. Friedrich, B.L. Mordike, Magnesium Technology, vol. 788, Springer, 2006.[5] J. Bai, et al., Microstructures and creep properties of Mge4Ale(1e4)La alloys
produced by different casting techniques, Mater. Sci. Eng. A 552 (2012)472e480.
[6] T. Rzychon, et al., Microstructure, microstructural stability and mechanicalproperties of sand-cast Mge4Ale4RE alloy, Mater. Char. 83 (2013) 21e34.
[7] S. Zhu, et al., Evaluation of magnesium die-casting alloys for elevated tem-perature applications: microstructure, tensile properties, and creep resistance,Metall. Mater. Trans. A 46 (8) (2015) 3543e3554.
[8] P. Bakke, et al., Improving the strength and ductility of magnesium die-castingalloys via rare-earth addition, JOM 55 (11) (2003) 46e51.
[9] S. Zhu, et al., Age hardening in die-cast MgeAleRE alloys due to minor Mnadditions, Mater. Sci. Eng., A 656 (2016) 34e38.
[10] S. Zhu, et al., The influence of individual rare earth elements (La, Ce, or Nd) oncreep resistance of die-cast magnesium alloy AE44, Adv. Eng. Mater. 18 (6)(2016) 932e937.
[11] B.R. Powell, et al., Microstructure and creep behavior in AE42 magnesium die-casting alloy, JOM 54 (8) (2002) 34e38.
[12] J. Zhang, et al., Microstructure, tensile properties, and creep behavior of high-pressure die-cast Mge4Ale4REe0.4 Mn (RE¼ La, Ce) alloys, J. Mater. Sci. 44(8) (2009) 2046e2054.
[13] J. Zhang, et al., Microstructures and mechanical properties of heat-resistantHPDC Mge4Al-based alloys containing cheap misch metal, Mater. Sci. Eng.,A 528 (6) (2011) 2670e2677.
[14] J. Zhang, et al., Effect of Ce on microstructure, mechanical properties andcorrosion behavior of high-pressure die-cast Mge4Al-based alloy, J. AlloysCompd. 509 (3) (2011) 1069e1078.
[15] M. Ohno, et al., Liquidus and solidus temperatures of Mg-rich MgeAleMneZnalloys, Acta Mater. 54 (15) (2006) 3883e3891.
[16] L. Jin, et al., AleMgeRE (RE ¼ La, Ce, Pr, Nd, Sm) systems: thermodynamicevaluations and optimizations coupled with key experiments and Miedema'smodel estimations, J. Chem. Thermodyn. 58 (2013) 166e195.
[17] J. Gr€obner, et al., Thermodynamic modeling of AleCeeMg phase equilibriacoupled with key experiments, Intermetallics 10 (5) (2002) 415e422.
[18] K.O. Odinaev, et al., Phase equilibrium diagram of the aluminum-magnesium-lanthanum system at 400 C, Izv. Vyss. Uchebn. Zaved., Tsvetn. Met. 2 (1988)
13
81e85.[19] M. Hosseinifar, D.V. Malakhov, On the fabricability of a composite material
containing the FCC matrix with embedded ductile B2 intermetallics, J. AlloysCompd. 505 (2) (2010) 459e466.
[20] C. Wong, et al., Experimental study of the solidification microstructure in theMg-rich corner of MgeAleCe system, in: TMS Annual Meeting & Exhibition,Springer, 2018.
[21] Y.L. Liu, S.B. Kang, The solidification process of AleMgeSi alloys, J. Mater. Sci.32 (6) (1997) 1443e1447.
[22] H. Jones, Some effects of solidification kinetics on microstructure formation inaluminium-base alloys, Mater. Sci. Eng. A 413e414 (2005) 165e173.
[23] A.A. Moosa, Effect of lanthanum addition on the microstructure of Mg-4Alalloy, Al-Khwarizmi Eng. J. 7 (2011) 75e82.
[24] J. Zhang, et al., Effect of substituting cerium-rich mischmetal with lanthanumon microstructure and mechanical properties of die-cast MgeAleRE alloys,Mater. Des. 30 (7) (2009) 2372e2378.
[25] J. Zhang, et al., Microstructures, tensile properties and corrosion behavior ofdie-cast Mge4Al-based alloys containing La and/or Ce, Mater. Sci. Eng., A 489(1) (2008) 113e119.
[26] D. Tolnai, et al., In situ synchrotron tomographic investigation of the solidi-fication of an AlMg4.7Si8 alloy, Acta Mater. 60 (6e7) (2012) 2568e2577.
[27] R.H. Mathiesen, L. Arnberg, X-ray radiography observations of columnardendritic growth and constitutional undercooling in an Ale30wt%Cu alloy,Acta Mater. 53 (4) (2005) 947e956.
[28] Y. Wang, et al., The effect of low cooling rates on dendrite morphology duringdirectional solidification in MgeGd alloys: in situ X-ray radiographic obser-vation, Mater. Lett. 163 (2016) 218e221.
[29] K. Nogita, et al., Real time synchrotron X-ray observations of solidification inhypoeutectic AleSi alloys, Mater. Char. 85 (2013) 134e140.
[30] H. Yasuda, et al., Development of X-ray imaging for observing solidification ofcarbon steels, ISIJ Int. 51 (3) (2011) 402e408.
[31] C.A. Schneider, et al., NIH Image to ImageJ: 25 years of image analysis, Nat.Methods 9 (7) (2012) 671.
[32] H. Rietveld, A profile refinement method for nuclear and magnetic structures,J. Appl. Crystallogr. 2 (2) (1969) 65e71.
[33] G. Pawley, Unit-cell refinement from powder diffraction scans, J. Appl. Crys-tallogr. 14 (6) (1981) 357e361.
[34] P. Villars, L.D. Calvert, W.B. Pearson, Pearson's handbook of crystallographicdata for intermetallic phases, Am. Soc. Metals 1 (2) (1985) 3.
[35] ICDD, International Centre for Diffraction Data (ICDD) PDF-4þ 2017, Inter-national Centre for Diffraction Data, Newtown Square, PA, USA, 2017 p. PDF-4.
[36] C. Wong, et al., (Al, Mg) 3La: a new phase in the MgeAleLa system, ActaCrystallogr. B Struct. Sci. Cryst. Eng. Mater. 74 (4) (2018) 370e375.
[37] CompuTherm, Pandat software and PanMagnesium 2018 thermodynamicdatabase, Madison, Editor.
[38] M. Imai, et al., Phase relationship in LaAl2 xSix (0 x 1.03) and theirelectrical resistivity, Intermetallics 16 (1) (2008) 96e101.
[39] K. Buschow, The Lanthanum-Aluminium System, Philips Research Report,1965, p. 20.
[40] P. Villars, et al., Pearson's handbook of crystallographic data for intermetallicphases, Am. Soc. Metals 1985 (1985) 3258. Volumes 1, 2, 3.
[41] S.M. Liang, et al., The MgeCaeO system: thermodynamic analysis of oxidedata and melting/solidification of Mg alloys with added CaO, Int. J. Mater. Res.109 (3) (2018) 185e200.
[42] R. Schmid-Fetzer, Progress in thermodynamic database development for ICMEof Mg alloys, in: Magnesium Technology 2015, Springer, 2015, pp. 283e287.
[43] T.L. Chia, et al., The effect of alloy composition on the microstructure andtensile properties of binary Mg-rare earth alloys, Intermetallics 17 (7) (2009)481e490.
[44] L.L. Rokhlin, Magnesium Alloys Containing Rare Earth Metals: Structure andProperties, Crc Press, 2003.
[45] J. Gr€obner, et al., Phase analysis of MgeLaeNd and MgeLaeCe alloys, In-termetallics 28 (2012) 92e101.
[46] M.-X. Zhang, et al., Crystallographic study of grain refinement in aluminumalloys using the edge-to-edge matching model, Acta Mater. 53 (5) (2005)1427e1438.
[47] P. Kelly, M.-X. Zhang, Edge-to-edge matchingdthe fundamentals, Metall.Mater. Trans. A 37 (3) (2006) 833e839.
[48] D. Qiu, et al., A new approach to designing a grain refiner for Mg casting alloysand its use in MgeY-based alloys, Acta Mater. 57 (10) (2009) 3052e3059.
[49] A. Greer, et al., Modelling of inoculation of metallic melts: application to grainrefinement of aluminium by AleTieB, Acta Mater. 48 (11) (2000) 2823e2835.
9
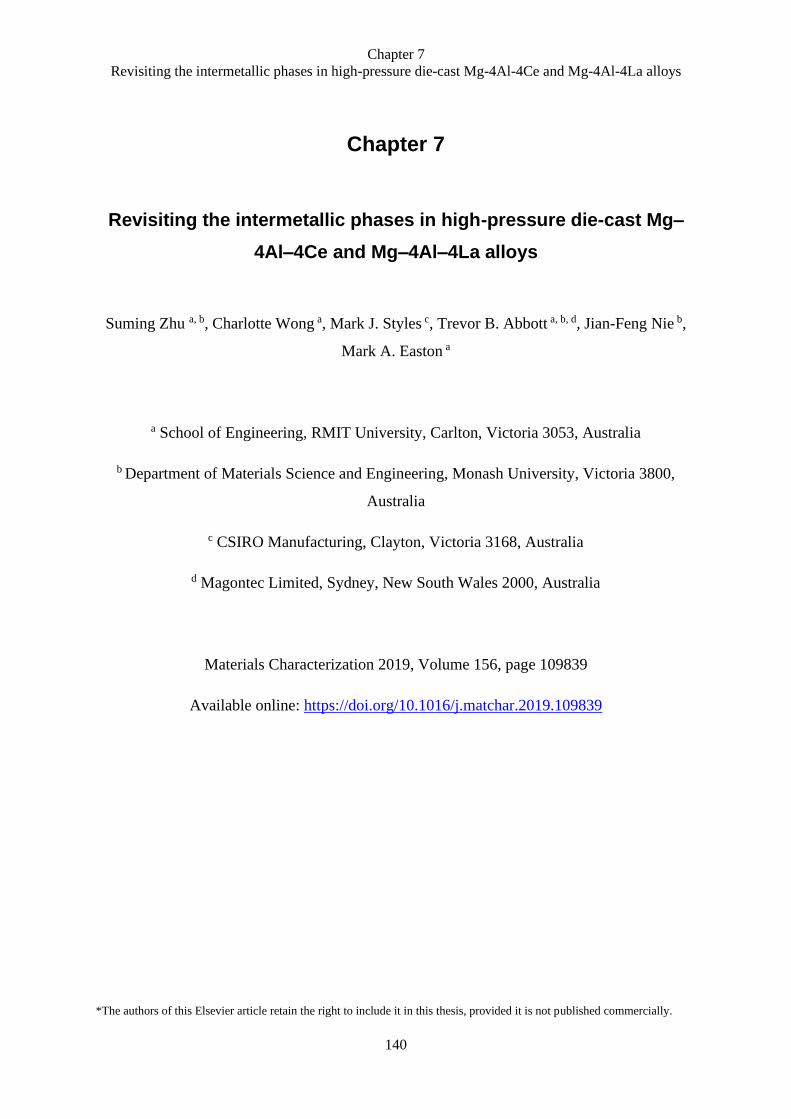
Chapter 7
Revisiting the intermetallic phases in high-pressure die-cast Mg-4Al-4Ce and Mg-4Al-4La alloys
140
Chapter 7
Revisiting the intermetallic phases in high-pressure die-cast Mg–
4Al–4Ce and Mg–4Al–4La alloys
Suming Zhu a, b, Charlotte Wong a, Mark J. Styles c, Trevor B. Abbott a, b, d, Jian-Feng Nie b,
Mark A. Easton a
a School of Engineering, RMIT University, Carlton, Victoria 3053, Australia
b Department of Materials Science and Engineering, Monash University, Victoria 3800,
Australia
c CSIRO Manufacturing, Clayton, Victoria 3168, Australia
d Magontec Limited, Sydney, New South Wales 2000, Australia
Materials Characterization 2019, Volume 156, page 109839
Available online: https://doi.org/10.1016/j.matchar.2019.109839
*The authors of this Elsevier article retain the right to include it in this thesis, provided it is not published commercially.

Contents lists available at ScienceDirect
Materials Characterization
journal homepage: www.elsevier.com/locate/matchar
Revisiting the intermetallic phases in high-pressure die-cast Mg–4Al–4Ceand Mg–4Al–4La alloysSuming Zhua,b,⁎, Charlotte Wonga, Mark J. Stylesc, Trevor B. Abbotta,b,d, Jian-Feng Nieb,Mark A. Eastona
a School of Engineering, RMIT University, Carlton, Victoria 3053, Australiab Department of Materials Science and Engineering, Monash University, Victoria 3800, Australiac CSIRO Manufacturing, Clayton, Victoria 3168, Australiad Magontec Limited, Sydney, New South Wales 2000, Australia
A R T I C L E I N F O
Keywords:Mg–Al–La alloyMg–Al–Ce alloyMicrostructure characterizationIntermetallic phaseHigh-pressure die-casting
A B S T R A C T
Mg–Al–RE based alloys such as AE42 (Mg–4Al–2RE) and AE44 (Mg–4Al–4RE) are commonly known to containA111RE3 and Al2RE intermetallic phases, with the former being predominant. However, it was found recentlythat the predominant intermetallic phase in a gravity-cast Mg–4.5Al–6.3La alloy is not A111La3 but a new ternaryphase with the composition of (Al,Mg)3La. In this work, the intermetallic phases in high-pressure die-castMg–4Al–4Ce and Mg–4Al–4La alloys are thus re-examined by X-ray diffraction (XRD), scanning electron mi-croscopy (SEM) and transmission electron microscopy (TEM). It is shown that the predominant intermetallicphase is A111Ce3 in the die-cast Mg–4Al–4Ce alloy but (Al,Mg)3La in the die-cast Mg–4Al–4La alloy. BothA111Ce3 and (Al,Mg)3La remain thermally stable upon annealing at 500 °C for 100 h and are most likely equi-librium phases in each alloy. This study provides strong evidence that the formation of intermetallic phases inMg–Al–RE alloys is affected by the choice of individual RE elements.
1. Introduction
Mg–Al–rare earth (RE) based alloys are one family of magnesiumdie-casting alloys developed for elevated temperature applications. Twonotable alloys are AE42 (Mg–4Al–2RE–0.3Mn, wt%) [1] and AE44(Mg–4Al–4RE–0.3Mn) [2]. These alloys exhibit superior creep re-sistance to MgeAl based alloys such as AZ91 (Mg–9Al–1Zn) and AM60(Mg–6Al–0.3Mn), owing to the formation of more stable Al–RE inter-metallic phases instead of Mg17Al12 phase [3] and the beneficial effectof the minor Mn additions in these alloys [4].
The intermetallic phases and their thermal stability in die-castMg–Al–RE alloys have been investigated previously by a number ofstudies [5–11]. There is a general agreement that A111RE3 (body-centred orthorhombic structure) is the predominant intermetallic phasein these alloys, with Al2RE (diamond structure) being the minor one.Occasionally, Al10RE2Mn7 (hexagonal structure) can also be detected,which is associated with the addition of 0.15–0.5 wt% Mn for im-provement of corrosion resistance. However, there seems to be a debateregarding the thermal stability of A111RE3 phase. Some studies [6,9,10]reported that A111RE3 is unstable and decomposes to Al2RE at elevatedtemperatures, releasing Al that subsequently reacts with Mg to form
Mg17Al12. In contrast, other studies [5,7,8,11] reported that A111RE3 isthermally stable at least up to 200 °C. To resolve this dispute, first-principles density functional calculations were conducted recently onthe thermal stability of A111RE3 phase[12,13]. According to thesestudies, A111RE3 should be thermodynamically stable and will not de-compose to Al2RE at temperatures up to 450 °C for La, Ce, Pr, Nd andSm, but it may become unstable for Yb, Dy, Y, Ho and Er.
Traditionally, RE elements were added to Mg–Al–RE alloys in theform of misch metal, with Ce being the most abundant element, fol-lowed by La, Nd and Pr. However, the increased demand for Nd inmagnetic applications over the past decades has led to two-elementmisch metal (containing only Ce and La) becoming considerablycheaper as the by-products of the separation of Nd and Pr from the four-element misch metal. As such, efforts have been made to develop cost-effective die-cast Mg–Al–RE alloys that contain either La [14–16] or Ce[16,17] or La + Ce misch metal [9,10]. From these studies, the choiceof RE elements appears to have a discernible influence on the me-chanical properties, especially creep resistance, of die-cast Mg–Al–REalloys. While earlier studies [9,14,17] related the influence of RE to thethermal stability of the A111RE3 phase, later work [16] suggested thatthe fraction of intermetallic phases and the content of Mn are more
https://doi.org/10.1016/j.matchar.2019.109839Received 18 January 2019; Received in revised form 3 July 2019; Accepted 24 July 2019
⁎ Corresponding author at: School of Engineering, RMIT University, Carlton, Victoria 3053, Australia.E-mail address: [email protected] (S. Zhu).
Materials Characterization 156 (2019) 109839
Available online 25 July 20191044-5803/ © 2019 Elsevier Inc. All rights reserved.
T
141

likely to be influential. It should be pointed out that, in all studies,A111RE3 was identified to be the predominant intermetallic phase, re-gardless the choice of RE elements.
A new ternary phase with the composition of (Al,Mg)3La was re-cently identified in a gravity-cast Mg–4.5Al–6.3La alloy [18]. Thisphase was found to have an orthorhombic structure with a space groupof C2221 and lattice parameters of a = 4.3365 Å, b = 18.8674 Å andc = 4.4242 Å, which is distinctly different from that of the binaryA111La3 or Al3La phases. In the present work, the intermetallic phasesin the die-cast Mg–4Al–4La alloy [16] are thus revisited. For compar-ison, the die-cast Mg–4Al–4Ce alloy [16] is also re-examined. Thepurposes of this study are (i) to determine whether the (Al,Mg)3Laphase is present in die-cast Mg–Al–La alloys or not and (ii) to clarify ifthe formation of intermetallic phases in Mg–Al–RE alloys is affected byindividual RE elements. The information obtained should be helpful forunderstanding the mechanical properties of die-cast Mg–Al–RE alloysand for designing new Mg–Al–RE alloys.
2. Experimental methods
The Mg–4Al–4Ce (ACe44) and Mg–4Al–4Ce (ALa44) alloys used inthis work were produced by high-pressure die-casting. The details ofalloy preparation can be found elsewhere [19] but are briefly sum-marized here. The alloys were cast in a 250 t Toshiba cold chamberhigh-pressure die-casting machine. The alloy melts were produced in aresistance heated crucible and held at around 700 °C before casting.During melting and holding, the melts were protected using AM-cover(HFC-134a in CO2 carrier gas). The temperature of the oil for heating upthe die was set at 250 °C, with the actual die temperature being around190 °C. For the casting, the plunger speed was 2 m/s and the in-tensification pressure was 120 MPa.
X-ray diffraction (XRD), scanning electron microscopy (SEM),transmission electron microscopy (TEM) were used to characterize thealloy microstructure, especially the intermetallic phases. The XRDanalysis was carried out using a Rigaku SmartLab diffractometerequipped with a Cu rotating anode source and operated at 45 kV and200 mA. The XRD data were collected from the alloy powders over a 2θrange of 10–120°, with an equivalent scan rate of 2°/min and step sizeof 0.02°. Samples were oscillated ± 360° about the scattering vectorduring data collection to improve the particle statistics as much aspractical. The acquired XRD data were analysed by the Rietveld method[20] using the Topas software package (Version 5, Bruker) to obtain anestimate of the phase fractions. Crystal structure models for the phaseswere taken from the Pearson's handbook [21] and the InternationalCentre for Diffraction Data (ICDD) PDF 4+ database [22]. The Rwp
(weighted profile factor) and S (goodness of fit) parameters were usedas numerical criteria for the quality of fitting of XRD data [20]. A JEOLJSM-7001F FEGSEM machine, equipped with Oxford Instruments AZtecenergy dispersive spectroscopy (EDS) analysis system, was used forSEM observations. For TEM characterization, thin foils were preparedby low-angle ion milling using Gatan Precision Ion Polishing System(PIPS) and were examined in a Tecnai G2 T20 microscope, equippedwith Bruker Quantax 200 EDS analysis system. The alloys were char-acterized in both as-cast and annealed (500 °C for 100 h) conditions. Forannealing, the as-cast samples were sealed into evacuated quartz tubesto prevent oxidation.
3. Results
3.1. Alloy composition
The chemical compositions of the alloys were analysed by in-ductively coupled plasma-optical emission spectroscopy (ICP-OES) andthe results are shown in Table 1. It can be seen that the analysedcontents of Al and Ce or La are quite close to the nominal ones. Bothalloys also contain minor Mn, which is commonly added to control Fe
content for improved corrosion resistance. It is noted that the level ofimpurity Si is relatively high (410 ppm) in ACe44, which will be shownto affect the formation of intermetallic phases.
3.2. Intermetallic phases in the as-cast alloys
The phases identified by XRD for the as-cast ACe44 and ALa44 al-loys are shown in Fig. 1. From the S values, the fitting of the calculatedpattern to the measured pattern appears to be sufficiently good for bothalloys. Estimates for the phase fractions (calculated using the Hill-Ho-ward method [23]) are included for the purpose of identifying themajor and minor intermetallic phases. For ACe44, the XRD analysisreveals the following four intermetallic phases: Al11Ce3, Al5Ce2, Al2Ceand AlxCeSi2−x, with Al11Ce3 being the predominant phase. The Al5Ce2
phase is identified on the assumption that it is isostructural to Al5La2
[21] or Al2.12La0.88 [24], which has a hexagonal crystal structure. Theobservations of Al11Ce3 and Al2Ce in this alloy are consistent with thosereported previously [16,17], but no Al5Ce2 phase was identified in theprevious studies. The ternary AlxCeSi2−x phase, which is identified tohave a AB2-type hexagonal structure as reported [25], is believed to beformed due to the relatively high Si level in ACe44. For ALa44, theintermetallic phases identified by XRD are (Al,Mg)3La, Al11La3 andAl5La2, with (Al,Mg)3La being the predominant one. It should behighlighted that the currently identified intermetallic phases in ALa44do not agree with those reported previously [14–16], in which Al11La3
was identified to be the predominant intermetallic phase and Al2La theminor one. It is also worth noting that no Al5La2 phase was identified inthe previous work [14–16]. From the present results, it is apparent thatthe intermetallic phases in ALa44 are not identical to those in ACe44.
To confirm the phase identification by XRD, the intermetallic phasesin ACe44 and ALa44 were further characterized by SEM and TEM,coupled with EDS. The SEM examination of the as-cast microstructure isshown in Fig. 2 and the detailed phase identification by TEM is shownin Figs. 3 and 4 for ACe44 and ALa44, respectively. For both alloys, theas-cast microstructure is characterized by primary α-Mg dendritessurrounded by intermetallic phases in the interdendritic regions. ForACe44, the intermetallic phases identified by XRD are confirmed by theSEM and TEM analyses, i.e. Al11Ce3, Al5Ce2, Al2Ce and AlxCeSi2−x arepresent in the microstructure, with Al11Ce3 being the most abundant. Aspreviously reported [16,17], the Al11Ce3 phase has a fibrous or la-mellar-like morphology while the Al2Ce phase has a particulate shape.The Al5Ce2 phase appears to have an acicular morphology, whichmakes it distinguishable from the Al11Ce3 phase although the differenceis not obvious in some occasions. Similarly, the SEM and TEM analysesalso confirm the intermetallic phases identified by XRD in ALa44, i.e.the presence of (Al,Mg)3La, Al11La3 and Al5La2 in the microstructure.Like the Al5Ce2 phase in ACe44, the Al5La2 phase has an acicularmorphology but it appears to have a very low fraction in the micro-structure (Fig. 2b). It is not easy to distinguish the (Al,Mg)3La phasefrom the Al11La3 phase in the microstructure as both phases seem tohave a fibrous or lamellar-like morphology, but the (Al,Mg)3La phaseappears to be slightly finer than the Al11La3 phase.
3.3. Thermal stability of the intermetallic phases
The as-cast alloys were further annealed at 500 °C for 100 h to in-vestigate the thermal stability of intermetallic phases and to reveal
Table 1Chemical composition (wt% or ppm) of the die-cast ACe44 and ALa44 alloys inthis study.
Alloy Al% Mn% Ce% La% Nd% Zn% Fe ppm Si ppm
ACe44 3.97 0.14 4.04 0.03 < 0.005 0.008 114 410ALa44 4.05 0.27 0.01 3.87 < 0.005 0.04 70 80
S. Zhu, et al. Materials Characterization 156 (2019) 109839
2142
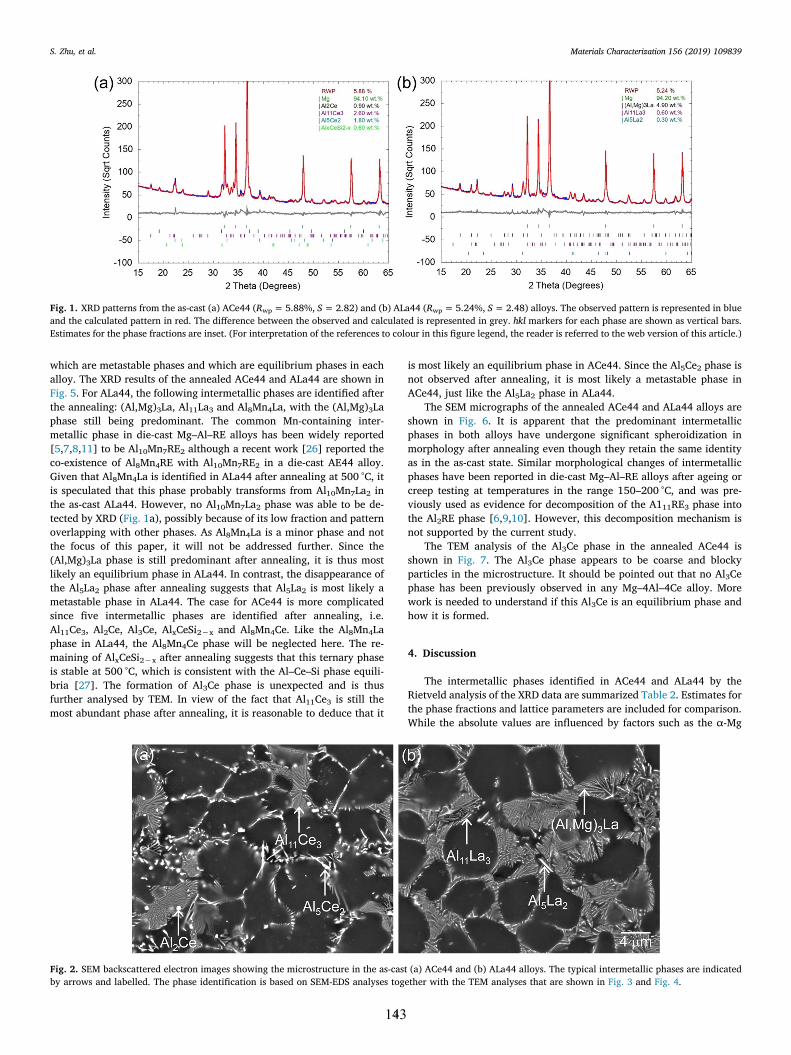
which are metastable phases and which are equilibrium phases in eachalloy. The XRD results of the annealed ACe44 and ALa44 are shown inFig. 5. For ALa44, the following intermetallic phases are identified afterthe annealing: (Al,Mg)3La, Al11La3 and Al8Mn4La, with the (Al,Mg)3Laphase still being predominant. The common Mn-containing inter-metallic phase in die-cast Mg–Al–RE alloys has been widely reported[5,7,8,11] to be Al10Mn7RE2 although a recent work [26] reported theco-existence of Al8Mn4RE with Al10Mn7RE2 in a die-cast AE44 alloy.Given that Al8Mn4La is identified in ALa44 after annealing at 500 °C, itis speculated that this phase probably transforms from Al10Mn7La2 inthe as-cast ALa44. However, no Al10Mn7La2 phase was able to be de-tected by XRD (Fig. 1a), possibly because of its low fraction and patternoverlapping with other phases. As Al8Mn4La is a minor phase and notthe focus of this paper, it will not be addressed further. Since the(Al,Mg)3La phase is still predominant after annealing, it is thus mostlikely an equilibrium phase in ALa44. In contrast, the disappearance ofthe Al5La2 phase after annealing suggests that Al5La2 is most likely ametastable phase in ALa44. The case for ACe44 is more complicatedsince five intermetallic phases are identified after annealing, i.e.Al11Ce3, Al2Ce, Al3Ce, AlxCeSi2−x and Al8Mn4Ce. Like the Al8Mn4Laphase in ALa44, the Al8Mn4Ce phase will be neglected here. The re-maining of AlxCeSi2−x after annealing suggests that this ternary phaseis stable at 500 °C, which is consistent with the Al–Ce–Si phase equili-bria [27]. The formation of Al3Ce phase is unexpected and is thusfurther analysed by TEM. In view of the fact that Al11Ce3 is still themost abundant phase after annealing, it is reasonable to deduce that it
is most likely an equilibrium phase in ACe44. Since the Al5Ce2 phase isnot observed after annealing, it is most likely a metastable phase inACe44, just like the Al5La2 phase in ALa44.
The SEM micrographs of the annealed ACe44 and ALa44 alloys areshown in Fig. 6. It is apparent that the predominant intermetallicphases in both alloys have undergone significant spheroidization inmorphology after annealing even though they retain the same identityas in the as-cast state. Similar morphological changes of intermetallicphases have been reported in die-cast Mg–Al–RE alloys after ageing orcreep testing at temperatures in the range 150–200 °C, and was pre-viously used as evidence for decomposition of the A111RE3 phase intothe Al2RE phase [6,9,10]. However, this decomposition mechanism isnot supported by the current study.
The TEM analysis of the Al3Ce phase in the annealed ACe44 isshown in Fig. 7. The Al3Ce phase appears to be coarse and blockyparticles in the microstructure. It should be pointed out that no Al3Cephase has been previously observed in any Mg–4Al–4Ce alloy. Morework is needed to understand if this Al3Ce is an equilibrium phase andhow it is formed.
4. Discussion
The intermetallic phases identified in ACe44 and ALa44 by theRietveld analysis of the XRD data are summarized Table 2. Estimates forthe phase fractions and lattice parameters are included for comparison.While the absolute values are influenced by factors such as the α-Mg
Fig. 1. XRD patterns from the as-cast (a) ACe44 (Rwp = 5.88%, S = 2.82) and (b) ALa44 (Rwp = 5.24%, S = 2.48) alloys. The observed pattern is represented in blueand the calculated pattern in red. The difference between the observed and calculated is represented in grey. hkl markers for each phase are shown as vertical bars.Estimates for the phase fractions are inset. (For interpretation of the references to colour in this figure legend, the reader is referred to the web version of this article.)
Fig. 2. SEM backscattered electron images showing the microstructure in the as-cast (a) ACe44 and (b) ALa44 alloys. The typical intermetallic phases are indicatedby arrows and labelled. The phase identification is based on SEM-EDS analyses together with the TEM analyses that are shown in Fig. 3 and Fig. 4.
S. Zhu, et al. Materials Characterization 156 (2019) 109839
3143
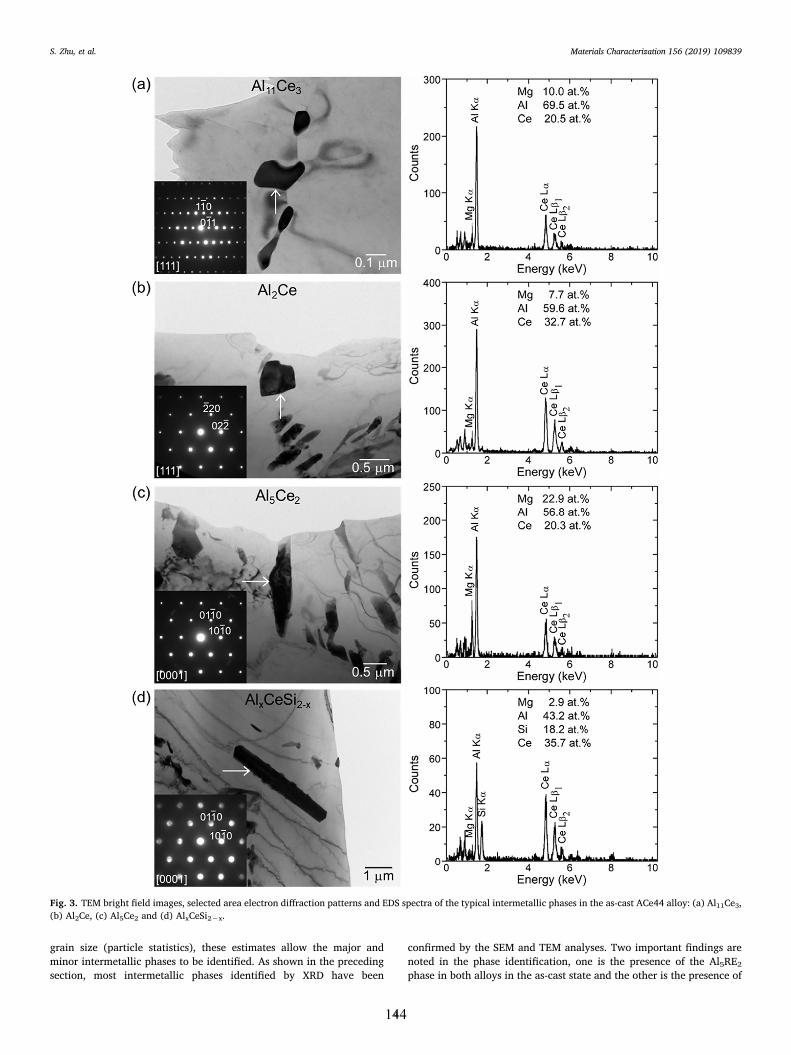
grain size (particle statistics), these estimates allow the major andminor intermetallic phases to be identified. As shown in the precedingsection, most intermetallic phases identified by XRD have been
confirmed by the SEM and TEM analyses. Two important findings arenoted in the phase identification, one is the presence of the Al5RE2
phase in both alloys in the as-cast state and the other is the presence of
Fig. 3. TEM bright field images, selected area electron diffraction patterns and EDS spectra of the typical intermetallic phases in the as-cast ACe44 alloy: (a) Al11Ce3,(b) Al2Ce, (c) Al5Ce2 and (d) AlxCeSi2−x.
S. Zhu, et al. Materials Characterization 156 (2019) 109839
4144
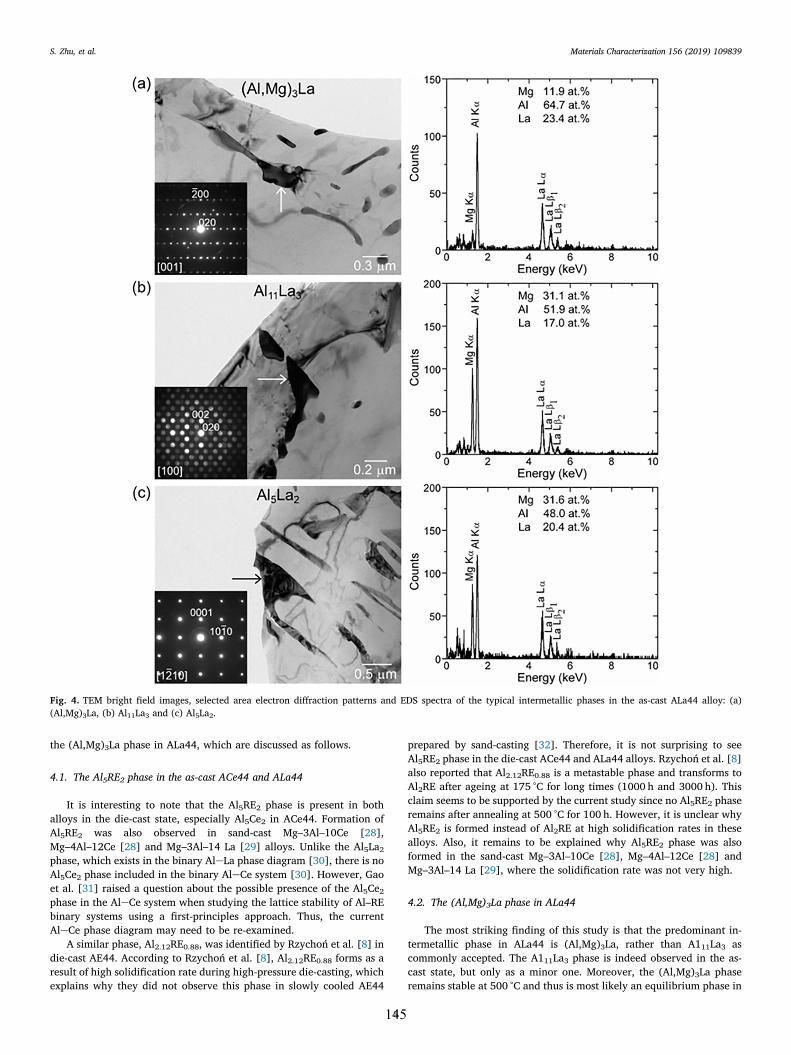
the (Al,Mg)3La phase in ALa44, which are discussed as follows.
4.1. The Al5RE2 phase in the as-cast ACe44 and ALa44
It is interesting to note that the Al5RE2 phase is present in bothalloys in the die-cast state, especially Al5Ce2 in ACe44. Formation ofAl5RE2 was also observed in sand-cast Mg–3Al–10Ce [28],Mg–4Al–12Ce [28] and Mg–3Al–14 La [29] alloys. Unlike the Al5La2
phase, which exists in the binary AleLa phase diagram [30], there is noAl5Ce2 phase included in the binary AleCe system [30]. However, Gaoet al. [31] raised a question about the possible presence of the Al5Ce2
phase in the AleCe system when studying the lattice stability of Al–REbinary systems using a first-principles approach. Thus, the currentAleCe phase diagram may need to be re-examined.
A similar phase, Al2.12RE0.88, was identified by Rzychoń et al. [8] indie-cast AE44. According to Rzychoń et al. [8], Al2.12RE0.88 forms as aresult of high solidification rate during high-pressure die-casting, whichexplains why they did not observe this phase in slowly cooled AE44
prepared by sand-casting [32]. Therefore, it is not surprising to seeAl5RE2 phase in the die-cast ACe44 and ALa44 alloys. Rzychoń et al. [8]also reported that Al2.12RE0.88 is a metastable phase and transforms toAl2RE after ageing at 175 °C for long times (1000 h and 3000 h). Thisclaim seems to be supported by the current study since no Al5RE2 phaseremains after annealing at 500 °C for 100 h. However, it is unclear whyAl5RE2 is formed instead of Al2RE at high solidification rates in thesealloys. Also, it remains to be explained why Al5RE2 phase was alsoformed in the sand-cast Mg–3Al–10Ce [28], Mg–4Al–12Ce [28] andMg–3Al–14 La [29], where the solidification rate was not very high.
4.2. The (Al,Mg)3La phase in ALa44
The most striking finding of this study is that the predominant in-termetallic phase in ALa44 is (Al,Mg)3La, rather than A111La3 ascommonly accepted. The A111La3 phase is indeed observed in the as-cast state, but only as a minor one. Moreover, the (Al,Mg)3La phaseremains stable at 500 °C and thus is most likely an equilibrium phase in
Fig. 4. TEM bright field images, selected area electron diffraction patterns and EDS spectra of the typical intermetallic phases in the as-cast ALa44 alloy: (a)(Al,Mg)3La, (b) Al11La3 and (c) Al5La2.
S. Zhu, et al. Materials Characterization 156 (2019) 109839
5145
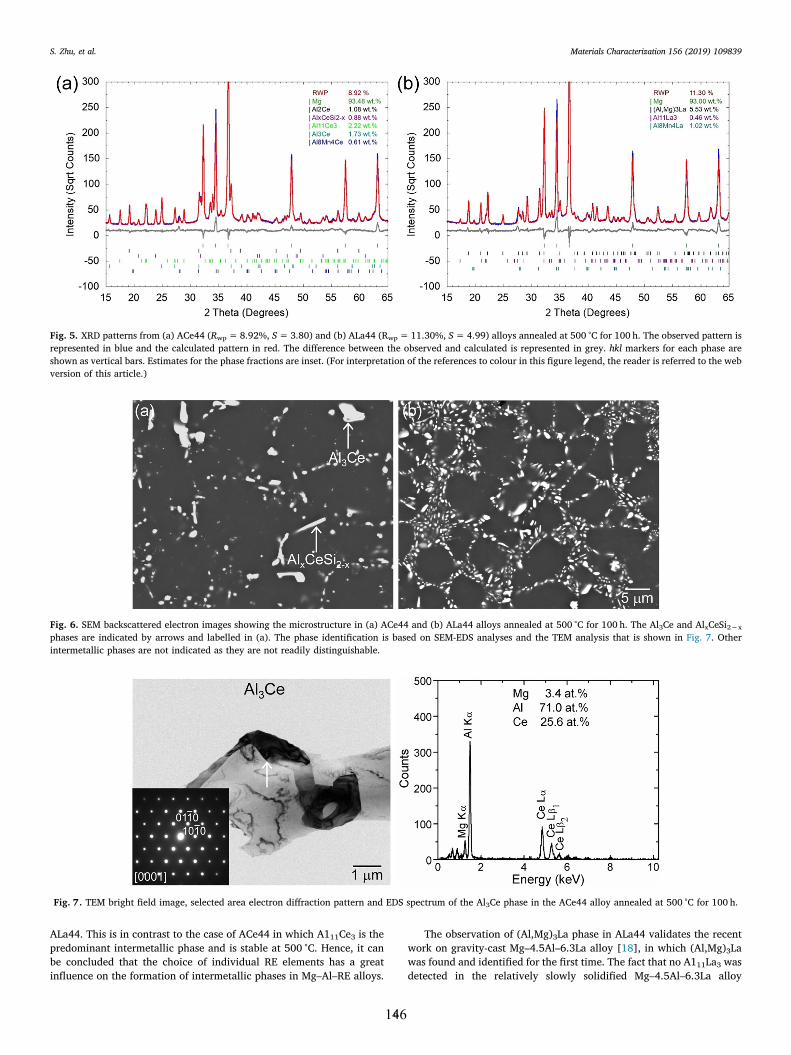
ALa44. This is in contrast to the case of ACe44 in which A111Ce3 is thepredominant intermetallic phase and is stable at 500 °C. Hence, it canbe concluded that the choice of individual RE elements has a greatinfluence on the formation of intermetallic phases in Mg–Al–RE alloys.
The observation of (Al,Mg)3La phase in ALa44 validates the recentwork on gravity-cast Mg–4.5Al–6.3La alloy [18], in which (Al,Mg)3Lawas found and identified for the first time. The fact that no A111La3 wasdetected in the relatively slowly solidified Mg–4.5Al–6.3La alloy
Fig. 5. XRD patterns from (a) ACe44 (Rwp = 8.92%, S = 3.80) and (b) ALa44 (Rwp = 11.30%, S = 4.99) alloys annealed at 500 °C for 100 h. The observed pattern isrepresented in blue and the calculated pattern in red. The difference between the observed and calculated is represented in grey. hkl markers for each phase areshown as vertical bars. Estimates for the phase fractions are inset. (For interpretation of the references to colour in this figure legend, the reader is referred to the webversion of this article.)
Fig. 6. SEM backscattered electron images showing the microstructure in (a) ACe44 and (b) ALa44 alloys annealed at 500 °C for 100 h. The Al3Ce and AlxCeSi2−x
phases are indicated by arrows and labelled in (a). The phase identification is based on SEM-EDS analyses and the TEM analysis that is shown in Fig. 7. Otherintermetallic phases are not indicated as they are not readily distinguishable.
Fig. 7. TEM bright field image, selected area electron diffraction pattern and EDS spectrum of the Al3Ce phase in the ACe44 alloy annealed at 500 °C for 100 h.
S. Zhu, et al. Materials Characterization 156 (2019) 109839
6146
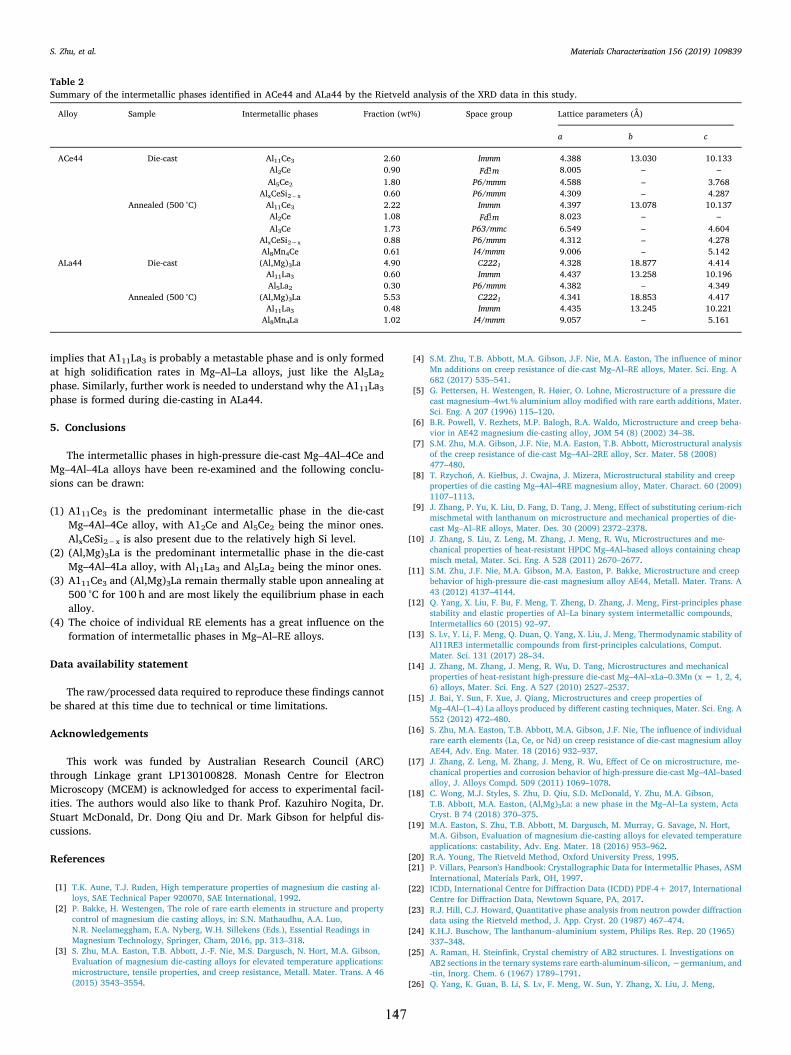
implies that A111La3 is probably a metastable phase and is only formedat high solidification rates in Mg–Al–La alloys, just like the Al5La2
phase. Similarly, further work is needed to understand why the A111La3
phase is formed during die-casting in ALa44.
5. Conclusions
The intermetallic phases in high-pressure die-cast Mg–4Al–4Ce andMg–4Al–4La alloys have been re-examined and the following conclu-sions can be drawn:
(1) A111Ce3 is the predominant intermetallic phase in the die-castMg–4Al–4Ce alloy, with A12Ce and Al5Ce2 being the minor ones.AlxCeSi2−x is also present due to the relatively high Si level.
(2) (Al,Mg)3La is the predominant intermetallic phase in the die-castMg–4Al–4La alloy, with Al11La3 and Al5La2 being the minor ones.
(3) A111Ce3 and (Al,Mg)3La remain thermally stable upon annealing at500 °C for 100 h and are most likely the equilibrium phase in eachalloy.
(4) The choice of individual RE elements has a great influence on theformation of intermetallic phases in Mg–Al–RE alloys.
Data availability statement
The raw/processed data required to reproduce these findings cannotbe shared at this time due to technical or time limitations.
Acknowledgements
This work was funded by Australian Research Council (ARC)through Linkage grant LP130100828. Monash Centre for ElectronMicroscopy (MCEM) is acknowledged for access to experimental facil-ities. The authors would also like to thank Prof. Kazuhiro Nogita, Dr.Stuart McDonald, Dr. Dong Qiu and Dr. Mark Gibson for helpful dis-cussions.
References
[1] T.K. Aune, T.J. Ruden, High temperature properties of magnesium die casting al-loys, SAE Technical Paper 920070, SAE International, 1992.
[2] P. Bakke, H. Westengen, The role of rare earth elements in structure and propertycontrol of magnesium die casting alloys, in: S.N. Mathaudhu, A.A. Luo,N.R. Neelameggham, E.A. Nyberg, W.H. Sillekens (Eds.), Essential Readings inMagnesium Technology, Springer, Cham, 2016, pp. 313–318.
[3] S. Zhu, M.A. Easton, T.B. Abbott, J.-F. Nie, M.S. Dargusch, N. Hort, M.A. Gibson,Evaluation of magnesium die-casting alloys for elevated temperature applications:microstructure, tensile properties, and creep resistance, Metall. Mater. Trans. A 46(2015) 3543–3554.
[4] S.M. Zhu, T.B. Abbott, M.A. Gibson, J.F. Nie, M.A. Easton, The influence of minorMn additions on creep resistance of die-cast Mg–Al–RE alloys, Mater. Sci. Eng. A682 (2017) 535–541.
[5] G. Pettersen, H. Westengen, R. Høier, O. Lohne, Microstructure of a pressure diecast magnesium–4wt.% aluminium alloy modified with rare earth additions, Mater.Sci. Eng. A 207 (1996) 115–120.
[6] B.R. Powell, V. Rezhets, M.P. Balogh, R.A. Waldo, Microstructure and creep beha-vior in AE42 magnesium die-casting alloy, JOM 54 (8) (2002) 34–38.
[7] S.M. Zhu, M.A. Gibson, J.F. Nie, M.A. Easton, T.B. Abbott, Microstructural analysisof the creep resistance of die-cast Mg–4Al–2RE alloy, Scr. Mater. 58 (2008)477–480.
[8] T. Rzychoń, A. Kiełbus, J. Cwajna, J. Mizera, Microstructural stability and creepproperties of die casting Mg–4Al–4RE magnesium alloy, Mater. Charact. 60 (2009)1107–1113.
[9] J. Zhang, P. Yu, K. Liu, D. Fang, D. Tang, J. Meng, Effect of substituting cerium-richmischmetal with lanthanum on microstructure and mechanical properties of die-cast Mg–Al–RE alloys, Mater. Des. 30 (2009) 2372–2378.
[10] J. Zhang, S. Liu, Z. Leng, M. Zhang, J. Meng, R. Wu, Microstructures and me-chanical properties of heat-resistant HPDC Mg–4Al–based alloys containing cheapmisch metal, Mater. Sci. Eng. A 528 (2011) 2670–2677.
[11] S.M. Zhu, J.F. Nie, M.A. Gibson, M.A. Easton, P. Bakke, Microstructure and creepbehavior of high-pressure die-cast magnesium alloy AE44, Metall. Mater. Trans. A43 (2012) 4137–4144.
[12] Q. Yang, X. Liu, F. Bu, F. Meng, T. Zheng, D. Zhang, J. Meng, First-principles phasestability and elastic properties of Al–La binary system intermetallic compounds,Intermetallics 60 (2015) 92–97.
[13] S. Lv, Y. Li, F. Meng, Q. Duan, Q. Yang, X. Liu, J. Meng, Thermodynamic stability ofAl11RE3 intermetallic compounds from first-principles calculations, Comput.Mater. Sci. 131 (2017) 28–34.
[14] J. Zhang, M. Zhang, J. Meng, R. Wu, D. Tang, Microstructures and mechanicalproperties of heat-resistant high-pressure die-cast Mg–4Al–xLa–0.3Mn (x = 1, 2, 4,6) alloys, Mater. Sci. Eng. A 527 (2010) 2527–2537.
[15] J. Bai, Y. Sun, F. Xue, J. Qiang, Microstructures and creep properties ofMg–4Al–(1–4) La alloys produced by different casting techniques, Mater. Sci. Eng. A552 (2012) 472–480.
[16] S. Zhu, M.A. Easton, T.B. Abbott, M.A. Gibson, J.F. Nie, The influence of individualrare earth elements (La, Ce, or Nd) on creep resistance of die-cast magnesium alloyAE44, Adv. Eng. Mater. 18 (2016) 932–937.
[17] J. Zhang, Z. Leng, M. Zhang, J. Meng, R. Wu, Effect of Ce on microstructure, me-chanical properties and corrosion behavior of high-pressure die-cast Mg–4Al–basedalloy, J. Alloys Compd. 509 (2011) 1069–1078.
[18] C. Wong, M.J. Styles, S. Zhu, D. Qiu, S.D. McDonald, Y. Zhu, M.A. Gibson,T.B. Abbott, M.A. Easton, (Al,Mg)3La: a new phase in the Mg–Al–La system, ActaCryst. B 74 (2018) 370–375.
[19] M.A. Easton, S. Zhu, T.B. Abbott, M. Dargusch, M. Murray, G. Savage, N. Hort,M.A. Gibson, Evaluation of magnesium die-casting alloys for elevated temperatureapplications: castability, Adv. Eng. Mater. 18 (2016) 953–962.
[20] R.A. Young, The Rietveld Method, Oxford University Press, 1995.[21] P. Villars, Pearson's Handbook: Crystallographic Data for Intermetallic Phases, ASM
International, Materials Park, OH, 1997.[22] ICDD, International Centre for Diffraction Data (ICDD) PDF-4+ 2017, International
Centre for Diffraction Data, Newtown Square, PA, 2017.[23] R.J. Hill, C.J. Howard, Quantitative phase analysis from neutron powder diffraction
data using the Rietveld method, J. App. Cryst. 20 (1987) 467–474.[24] K.H.J. Buschow, The lanthanum–aluminium system, Philips Res. Rep. 20 (1965)
337–348.[25] A. Raman, H. Steinfink, Crystal chemistry of AB2 structures. I. Investigations on
AB2 sections in the ternary systems rare earth-aluminum-silicon, −germanium, and-tin, Inorg. Chem. 6 (1967) 1789–1791.
[26] Q. Yang, K. Guan, B. Li, S. Lv, F. Meng, W. Sun, Y. Zhang, X. Liu, J. Meng,
Table 2Summary of the intermetallic phases identified in ACe44 and ALa44 by the Rietveld analysis of the XRD data in this study.
Alloy Sample Intermetallic phases Fraction (wt%) Space group Lattice parameters (Å)
a b c
ACe44 Die-cast Al11Ce3 2.60 Immm 4.388 13.030 10.133Al2Ce 0.90 Fd3m 8.005 – –Al5Ce2 1.80 P6/mmm 4.588 – 3.768
AlxCeSi2−x 0.60 P6/mmm 4.309 – 4.287Annealed (500 °C) Al11Ce3 2.22 Immm 4.397 13.078 10.137
Al2Ce 1.08 Fd3m 8.023 – –Al3Ce 1.73 P63/mmc 6.549 – 4.604
AlxCeSi2−x 0.88 P6/mmm 4.312 – 4.278Al8Mn4Ce 0.61 I4/mmm 9.006 – 5.142
ALa44 Die-cast (Al,Mg)3La 4.90 C2221 4.328 18.877 4.414Al11La3 0.60 Immm 4.437 13.258 10.196Al5La2 0.30 P6/mmm 4.382 – 4.349
Annealed (500 °C) (Al,Mg)3La 5.53 C2221 4.341 18.853 4.417Al11La3 0.48 Immm 4.435 13.245 10.221
Al8Mn4La 1.02 I4/mmm 9.057 – 5.161
S. Zhu, et al. Materials Characterization 156 (2019) 109839
7147

Microstructural characterizations on Mn-containing intermetallic phases in a high-pressure die-casting Mg–4Al–4RE–0.3Mn alloy, Mater. Charact. 132 (2017)381–387.
[27] J. Gröbner, D. Mirković, R. Schmid-Fetzer, Thermodynamic aspects of the con-stitution, grain refining, and solidification enthalpies of Al-Ce-Si alloys, Metall.Mater. Trans. A 35 (2004) 3349–3362.
[28] C. Wong, M.J. Styles, S. Zhu, T. Abbott, K. Nogita, S.D. McDonald, D.H. StJohn,M.A. Gibson, M.A. Easton, Experimental study of the solidification microstructurein the Mg-rich corner of Mg–Al–Ce system, in: D. Orlov, V. Joshi, K. Solanki,N. Neelameggham (Eds.), Magnesium Technology 2018, Springer, Cham, 2018, pp.79–85.
[29] C. Wong, K. Nogita, M.J. Styles, S. Zhu, D. Qiu, S.D. McDonald, M.A. Gibson,T.B. Abbott, M.A. Easton, Solidification path and microstructure evolution of Mg-3Al-14La alloy: implications for the Mg-rich corner of the Mg-Al-La phase diagram,J. Alloys Compd. 784 (2019) 527–534.
[30] H. Okamoto, Desk Handbook: Phase Diagrams for Binary Alloys, ASM International,Materials Park, OH, 2010.
[31] M.C. Gao, A.D. Rollett, M. Widom, Lattice stability of aluminum-rare earth binarysystems: a first-principles approach, Phys. Rev. B 75 (2007) 174120.
[32] T. Rzychoń, A. Kiełbus, L. Lityńska-Dobrzyńska, Microstructure, microstructuralstability and mechanical properties of sand-cast Mg–4Al–4RE alloy, Mater. Charact.83 (2013) 21–34.
S. Zhu, et al. Materials Characterization 156 (2019) 109839
8148
Chapter 8
A comparative study of the solidification microstructure in sand-cast Mg-Al-Ce and Mg-Al-La alloys
149
Chapter 8
A comparative study of the solidification microstructure in sand-
cast Mg-Al-Ce and Mg-Al-La alloys
Charlotte Wong1, Suming Zhu1,4, Mark J. Styles2, Trevor B. Abbott1,4,5, Kazuhiro Nogita3,
Jian-Feng Nie4, Mark A. Gibson1,2,4, Mark A. Easton1
1 School of Engineering, RMIT University, Carlton, Victoria 3053, Australia
2 CSIRO Manufacturing, Clayton, Victoria 3168, Australia
3 School of Mechanical and Mining Engineering, University of Queensland, Brisbane,
Queensland 4072, Australia
4 Department of Materials Science and Engineering, Monash University, Victoria 3800,
Australia
5 Magontec Ltd, Sydney, New South Wales 2000, Australia
(Manuscript will be submitted to the Journal of Materials Characterization)
Chapter 8
A comparative study of the solidification microstructure in sand-cast Mg-Al-Ce and Mg-Al-La alloys
150
Title
A comparative study of the solidification microstructure in sand-cast Mg-Al-Ce and Mg-Al-
La alloys
Charlotte Wong1, Suming Zhu1,4, Mark J. Styles2, Trevor B. Abbott1,4,5, Kazuhiro Nogita3, Jian-
Feng Nie4, Mark A. Gibson1,2,4, Mark A. Easton1*
1 School of Engineering, RMIT University, Carlton, Victoria 3053, Australia
2 CSIRO Manufacturing, Clayton, Victoria 3168, Australia
3 School of Mechanical and Mining Engineering, University of Queensland, Brisbane,
Queensland 4072, Australia
4 Department of Materials Science and Engineering, Monash University, Victoria 3800,
Australia
5 Magontec Ltd, Sydney, New South Wales 2000, Australia
*Corresponding author: Mark Easton ([email protected])
Abstract
The microstructure of a series of sand-cast Mg-(3-4)Al-xCe and Mg-(3-4)Al-xLa alloys, where
“x” ranges between 4 wt.% and 13 wt.%, has been characterised by scanning electron
microscopy, X-ray powder diffraction and transmission electron microscopy. The
experimentally identified phases have been compared with those from the Scheil-Gulliver and
Lever predictions made using PANDAT®. As commonly reported in commercial Mg-Al-RE
alloys (RE being Ce-rich mischmetal), Al11Ce3 was found to be the predominant intermetallic
phase in the Mg-Al-xCe alloy series, particularly in ACe44. Al2Ce and Al5Ce2 were also
observed, and alloys with greater than 10 wt.% Ce, such as the ACe310 and ACe413 alloys,
were found to be hyper-eutectic alloys with Al2Ce as the primary phase. In the Mg-4Al-xLa
alloys, the recently reported (Al,Mg)3La phase was observed extensively and there was no
evidence of either Al11La3 nor Al2La phase. In addition, differences are noted between the
current observations and the most recently published Mg-Al-Ce and Mg-Al-La phase diagrams.
Keywords: Mg–Al–La alloy; Mg–Al–Ce alloy; Microstructure characterization; Intermetallic
phase; Gravity-cast; Sand-cast
Chapter 8
A comparative study of the solidification microstructure in sand-cast Mg-Al-Ce and Mg-Al-La alloys
151
Introduction
Magnesium alloys are the lowest density structural metal alloys. This has motivated the
development of lightweight components for automobiles due to the increasing demand for
vehicle weight reduction to achieve high fuel efficiency [1, 2]. In addition, the excellent
castability and low melting temperature of magnesium make it suitable for producing thin-
walled and complex castings at a relatively low cost [3, 4]. The most commonly used
magnesium alloys in current automotive applications are AZ91 (Mg-9Al-1Zn, all compositions
are in weight percent unless otherwise specified), AM50 (Mg-5Al-0.4Mn) and AM60 (Mg-
6Al-0.4Mn) [5]. However, these alloys have poor creep resistance at operating temperatures
above 130˚C, which makes them unsuitable for high-temperature powertrain applications [3].
This limitation has led to the development of new creep-resistant magnesium alloys based on
the Mg-Al-RE (RE = Ce, La) systems for use in powertrain components, such as engine blocks
and transmission cases, which are most commonly produced in cast aluminium alloys and cast
iron [6].
AE44 (Mg-4Al-4RE, with “A” representing Al and “E” representing mischmetal) is a
magnesium alloy that is increasingly used in higher performance applications. Currently,
mischmetal is used in commercial AE44 alloys. Prior to 2011 a four-element mischmetal,
which contains neodymium (Nd) and praseodymium (Pr) as well as cerium (Ce) and lanthanum
(La) has been used [2]. Since Nd and Pr are in demand for magnetic applications, two element
mischmetal containing only La and Ce is cheaper and has replaced four element mischmetal in
the alloy [7]. However, some researchers have reported that different rare earths lead to
different microstructures [7, 8] and may affect the performance of the alloys [7-10].
Consequently, understanding the role of different rare earth elements and their concentration
on the performance and microstructure of these alloys is important both commercially and
scientifically.
There have been several experimental investigations into the microstructure of AE alloys [8, 9,
11, 12]. The needle-like Al11RE3 phase has been reported to be the dominant intermetallic
phase [10, 13-17], and the particulate Al2RE has been reported to be an additional minor phase
[10, 13, 15, 16] in AE44 alloys. Previous studies have also been performed to understand the
effect of RE on microstructure, including the refinement and morphology of α-Mg and
intermetallic phases in AE alloys [7, 9, 18-21], but there are differences in the phases reported.
For example, some studies [22, 23] reported that the microstructure of high pressure die-cast
Chapter 8
A comparative study of the solidification microstructure in sand-cast Mg-Al-Ce and Mg-Al-La alloys
152
(HPDC) AE44 alloys contain α-Mg, Al11RE3, Al2RE, and Al5RE2 phases, however, other
studies did not observe the Al5RE2 phase in the same alloy [19, 21, 24]. A previous study also
observed Al11RE3 and Al10RE2Mn7 in an HPDC AE41 alloy [14]. In addition, there have been
studies on sand-cast AE44 and AE55 alloys, in which the microstructure was observed to
contain α-Mg, Al11RE3, Al2RE, and Al10RE2Mn7 [23, 25, 26].
In ternary Mg-Al-Ce alloys, multiple studies [7, 9, 21] have reported similar phases to AE44
alloys. For example, HPDC ACe44 alloys have been reported to contain Al11Ce3 and Al2Ce [7,
9, 21]. On the other hand, the literature on Mg-Al-La alloys with La as the individual RE
alloying element has greater inconsistencies. For example, Zhang et al. [8, 9, 21] and Bai et al.
[20] reported that the microstructure of HPDC and gravity cast ALa44 alloy consists of α-Mg
and Al11La3 [9, 21]. Recently, Zhu et al. [7, 19, 24] identified the phases in ALa44 using X-ray
powder diffraction (XRD) and selected area electron diffraction (SAED) patterns and found
Al2La in addition to the other phases. Zhang et al. [8] also proposed that the Al2La phase would
be present if the La content in the alloy is above 5.5 wt.%. This is in contradiction to Zhu et al.
[19, 24] who observed Al2La in a 4 wt.% La containing AE alloy. Another study claimed that
an Mg-4Al-1.5La alloy contains α-Mg, Al11La3 and Al4La using XRD [18]. Given that the
RE/Al ratio is less than 0.5 in this alloy, Mg17Al12 would be expected [25, 27], but it was not
observed in their alloy.
It is also apparent that the morphology of the intermetallics in Mg-Al-Ce and Mg-Al-La alloys
are different, as reported in [28] (Chapter 7). However, despite the difference in microstructure
and morphology in these alloys, it has been assumed that similar intermetallic phases are
developed in these systems [7, 21]. The differences in the phases identified by different
researchers in the AE alloys have instigated this investigation into the intermetallic phases
present in these alloys.
Experimental methods
In this study, a series of sand-cast Mg-(3-4)Al-xCe and Mg-(3-4)Al-xLa alloys, where “x”
ranges between 4 wt.% and 13 wt.%, were investigated. These alloys were prepared from pure
elemental magnesium (99.95 %), aluminium (99.90 %), cerium (99.50 %) and lanthanum
(99.90 %), respectively. Magnesium was melted first, then aluminium was added and finally
the rare earths. The weighed elements were melted in a crucible under a cover gas of nitrogen
and R134a. The molten alloy was stirred well after each addition, to ensure complete mixing.
After the ingots were completely melted in the crucible, the alloy was gravity cast into a
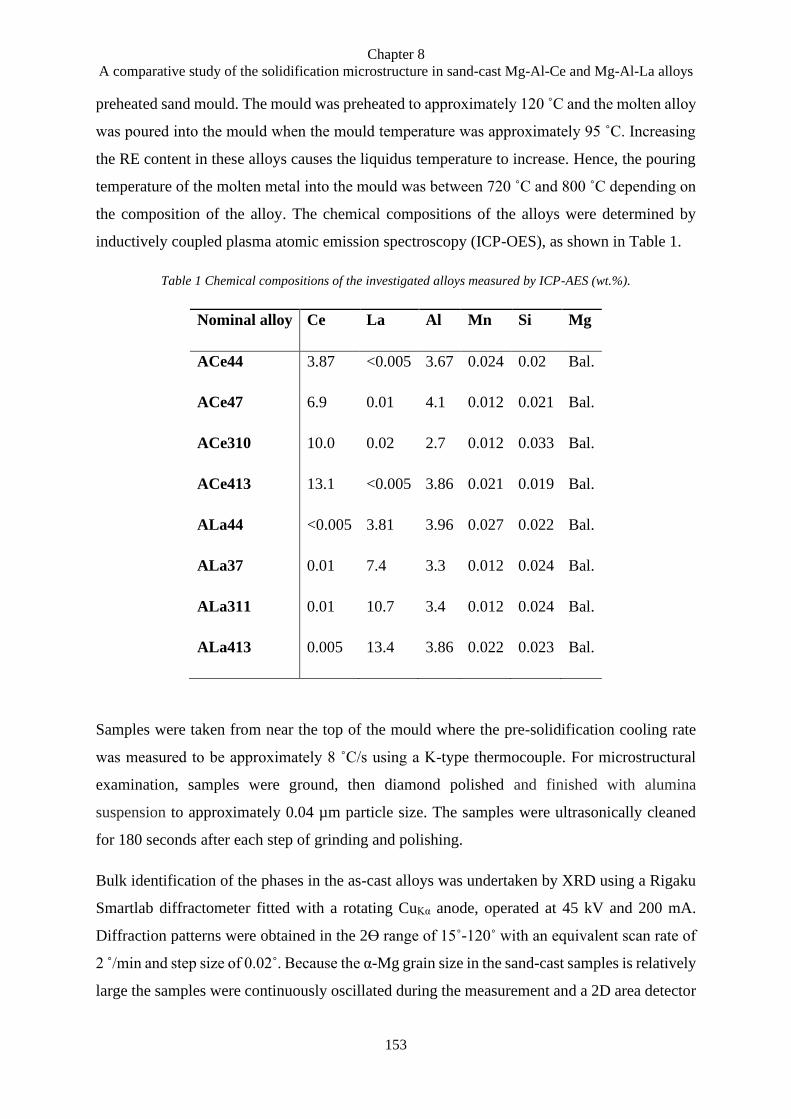
Chapter 8
A comparative study of the solidification microstructure in sand-cast Mg-Al-Ce and Mg-Al-La alloys
153
preheated sand mould. The mould was preheated to approximately 120 ˚C and the molten alloy
was poured into the mould when the mould temperature was approximately 95 ˚C. Increasing
the RE content in these alloys causes the liquidus temperature to increase. Hence, the pouring
temperature of the molten metal into the mould was between 720 ˚C and 800 ˚C depending on
the composition of the alloy. The chemical compositions of the alloys were determined by
inductively coupled plasma atomic emission spectroscopy (ICP-OES), as shown in Table 1.
Table 1 Chemical compositions of the investigated alloys measured by ICP-AES (wt.%).
Nominal alloy Ce La Al Mn Si Mg
ACe44 3.87 <0.005 3.67 0.024 0.02 Bal.
ACe47 6.9 0.01 4.1 0.012 0.021 Bal.
ACe310 10.0 0.02 2.7 0.012 0.033 Bal.
ACe413 13.1 <0.005 3.86 0.021 0.019 Bal.
ALa44 <0.005 3.81 3.96 0.027 0.022 Bal.
ALa37 0.01 7.4 3.3 0.012 0.024 Bal.
ALa311 0.01 10.7 3.4 0.012 0.024 Bal.
ALa413 0.005 13.4 3.86 0.022 0.023 Bal.
Samples were taken from near the top of the mould where the pre-solidification cooling rate
was measured to be approximately 8 ˚C/s using a K-type thermocouple. For microstructural
examination, samples were ground, then diamond polished and finished with alumina
suspension to approximately 0.04 µm particle size. The samples were ultrasonically cleaned
for 180 seconds after each step of grinding and polishing.
Bulk identification of the phases in the as-cast alloys was undertaken by XRD using a Rigaku
Smartlab diffractometer fitted with a rotating CuKα anode, operated at 45 kV and 200 mA.
Diffraction patterns were obtained in the 2ϴ range of 15˚-120˚ with an equivalent scan rate of
2 /min and step size of 0.02˚. Because the α-Mg grain size in the sand-cast samples is relatively
large the samples were continuously oscillated during the measurement and a 2D area detector
Chapter 8
A comparative study of the solidification microstructure in sand-cast Mg-Al-Ce and Mg-Al-La alloys
154
was used to capture as much of the Debye-Scherrer rings as possible, in order to maximise the
particle statistics. While this approach provided accurate relative peak intensities for all of the
intermetallic phases observed, the peak intensities of α-Mg were not suitable for quantitative
analysis. Hence, during the XRD data analysis the α-Mg phase was modelled using the Pawley
method [29], whereas the remaining intermetallic phases were modelled using the Rietveld
method [30], as implemented in the Topas software package (version 5, Bruker). The structure
models for the α-Mg, Al11Ce3, Al2Ce, Mg12Ce/La, (Al,Si)5Ce/La2, Al5La2, CeSi2 and MgLa
phases present in the alloys were taken from the Pearson handbook [31] and ICDD PDF-4+
database [32], whereas the structure for (Al,Mg)3La and Al5Ce2 were taken from Wong et al.
[33] and [34], respectively.
The as-cast microstructures were analysed using an FEI Quanta 200 scanning electron
microscope (SEM) equipped with an Oxford Instruments X-MaxN 20 energy dispersive X-ray
(EDX) spectrometer at 25 kV. The intermetallic phases in the alloys were further confirmed by
transmission electron microscopy (TEM) in a JEOL 2100F TEM equipped with an Oxford X-
MaxN 80T EDX spectrometer. The TEM foils were prepared by low-angle ion milling using a
Gatan Precision Ion Polishing System (PIPS) at 4 keV with an incident angle of 4°.
The phases identified by XRD and TEM were compared with those predicted by the Scheil-
Gulliver (non-equilibrium) and Lever (equilibrium) equations using PANDAT®,
PanMagnesium 2018 database [35].
Results
Microstructure overview
The as-cast microstructure in the selected series of AE alloys was examined by SEM, as shown
in Figure 1. The α-Mg dendrites are surrounded by the intermetallic phase(s) in the
interdendritic and grain boundary regions. As the RE concentration increases from 4 wt.% to
7 wt.% Ce and 11 wt.% La, there are additional polyhedral intermetallic particles observed
inside the grains. In addition, the amount of fine eutectic increases as the RE content increases;
this is especially significant in Mg-Al-La alloys, as shown in Figure 1(g) and (h).
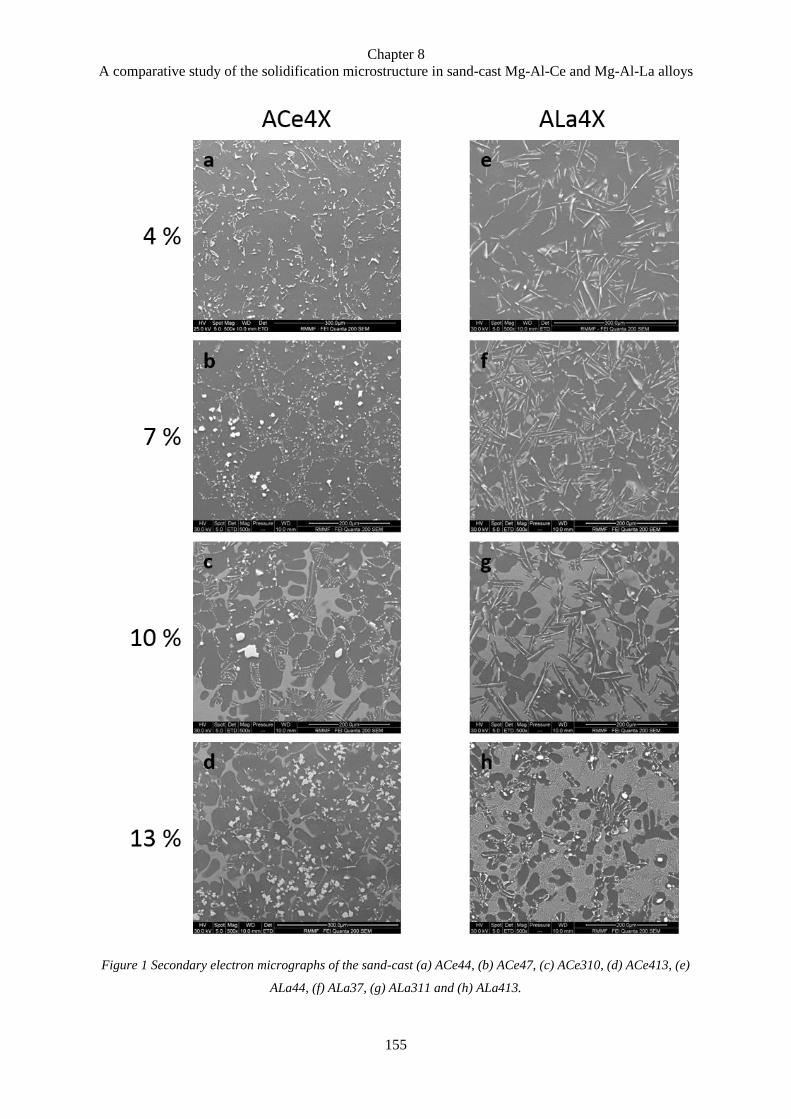
Chapter 8
A comparative study of the solidification microstructure in sand-cast Mg-Al-Ce and Mg-Al-La alloys
155
Figure 1 Secondary electron micrographs of the sand-cast (a) ACe44, (b) ACe47, (c) ACe310, (d) ACe413, (e)
ALa44, (f) ALa37, (g) ALa311 and (h) ALa413.
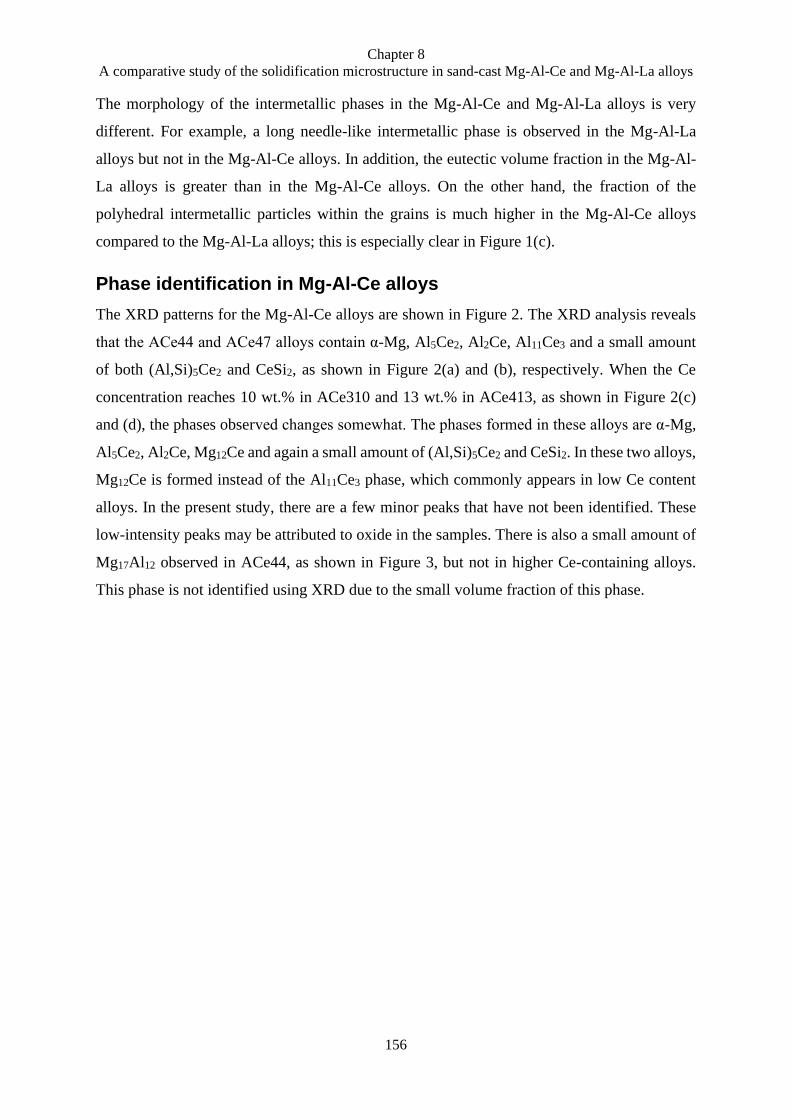
Chapter 8
A comparative study of the solidification microstructure in sand-cast Mg-Al-Ce and Mg-Al-La alloys
156
The morphology of the intermetallic phases in the Mg-Al-Ce and Mg-Al-La alloys is very
different. For example, a long needle-like intermetallic phase is observed in the Mg-Al-La
alloys but not in the Mg-Al-Ce alloys. In addition, the eutectic volume fraction in the Mg-Al-
La alloys is greater than in the Mg-Al-Ce alloys. On the other hand, the fraction of the
polyhedral intermetallic particles within the grains is much higher in the Mg-Al-Ce alloys
compared to the Mg-Al-La alloys; this is especially clear in Figure 1(c).
Phase identification in Mg-Al-Ce alloys
The XRD patterns for the Mg-Al-Ce alloys are shown in Figure 2. The XRD analysis reveals
that the ACe44 and ACe47 alloys contain α-Mg, Al5Ce2, Al2Ce, Al11Ce3 and a small amount
of both (Al,Si)5Ce2 and CeSi2, as shown in Figure 2(a) and (b), respectively. When the Ce
concentration reaches 10 wt.% in ACe310 and 13 wt.% in ACe413, as shown in Figure 2(c)
and (d), the phases observed changes somewhat. The phases formed in these alloys are α-Mg,
Al5Ce2, Al2Ce, Mg12Ce and again a small amount of (Al,Si)5Ce2 and CeSi2. In these two alloys,
Mg12Ce is formed instead of the Al11Ce3 phase, which commonly appears in low Ce content
alloys. In the present study, there are a few minor peaks that have not been identified. These
low-intensity peaks may be attributed to oxide in the samples. There is also a small amount of
Mg17Al12 observed in ACe44, as shown in Figure 3, but not in higher Ce-containing alloys.
This phase is not identified using XRD due to the small volume fraction of this phase.

Chapter 8
A comparative study of the solidification microstructure in sand-cast Mg-Al-Ce and Mg-Al-La alloys
157
Figure 2 XRD analysis of (a) ACe44, (b) ACe47, (c) ACe310 and (d) ACe413 alloys. The calculated patterns
are represented in red and the experimental patterns in blue. The difference between the experimental and
calculated patterns is represented in grey.

Chapter 8
A comparative study of the solidification microstructure in sand-cast Mg-Al-Ce and Mg-Al-La alloys
158
Figure 3 Identification of intermetallic phases in sand-cast ACe44 by SEM-EDX analysis: (a) low-magnification
backscattered electron image, (b) high-magnification backscattered electron image, (c) EDX spectrum of
Al11Ce3, (d) EDX spectrum of Al2Ce, (e) EDX spectrum of Mg17Al12 and (f) EDX spectrum of (Al,Si)5Ce2.
TEM images for the intermetallic phases in ACe44 alloys are shown in Figure 4. From the
indexing of electron diffraction patterns, the intermetallic phases were confirmed to be Al11Ce3,
Al2Ce, Al5Ce2 and (Al,Si)5Ce2. SAED in combination with EDX confirms that the eutectic
needle-like intermetallic phase is Al11Ce3; the particulate-shape intermetallic phase is Al2Ce;
the acicular phase is Al5Ce2/(Al,Si)5Ce2, and the eutectic lamellar-like phase is Mg12Ce.

Chapter 8
A comparative study of the solidification microstructure in sand-cast Mg-Al-Ce and Mg-Al-La alloys
159
Figure 4 TEM bright field images, selected area electron diffraction patterns and EDX spectra of the
intermetallic phases in the as-cast ACe44 alloys.
Phase identification in Mg-Al-La alloys
The XRD patterns for the Mg-Al-La alloys are shown in Figure 5. The XRD analysis reveals
that the ALa44 alloy contains α-Mg, Al5La2 and (Al,Mg)3La (Figure 5(a)). As the La content
increases from 4 wt.% to 7 wt.% in ALa37, as shown in Figure 5(b), (Al,Si)5La2 and Mg12La
are also observed in addition to the phases found in ALa44 alloy. These phases are the same in
ALa311, as shown in Figure 5(c). The (Al,Si)5La2 phase is present due to the presence of trace
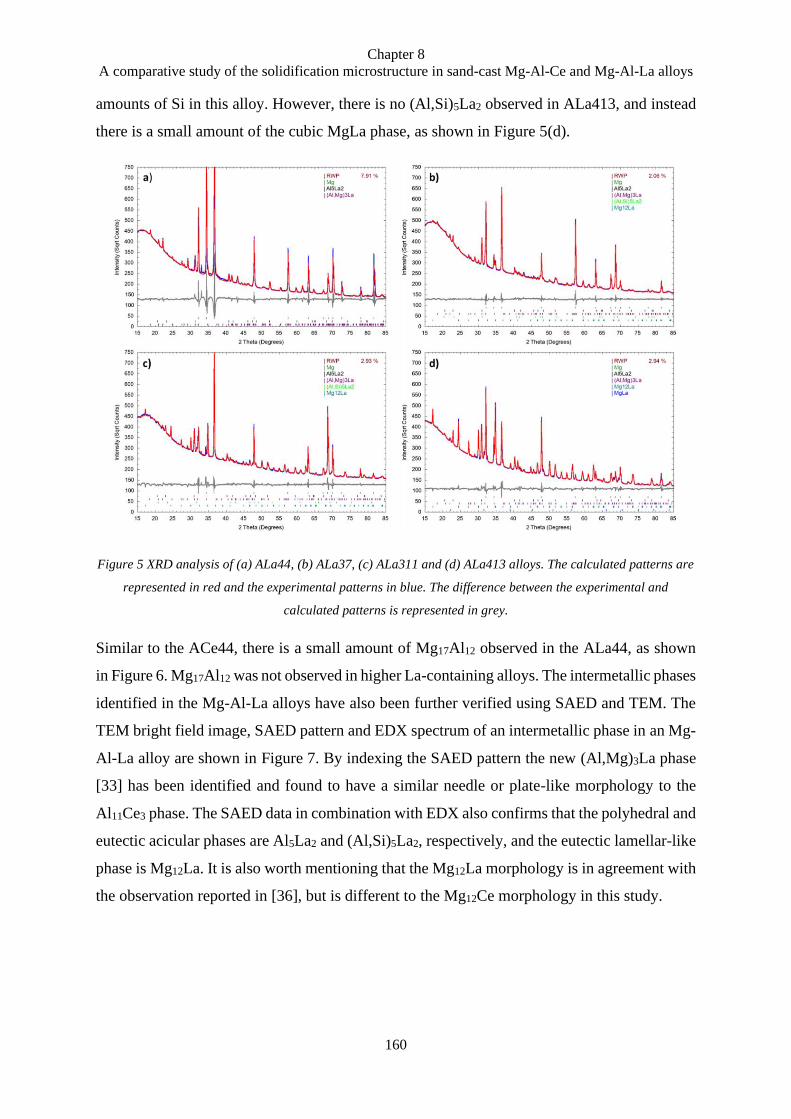
Chapter 8
A comparative study of the solidification microstructure in sand-cast Mg-Al-Ce and Mg-Al-La alloys
160
amounts of Si in this alloy. However, there is no (Al,Si)5La2 observed in ALa413, and instead
there is a small amount of the cubic MgLa phase, as shown in Figure 5(d).
Figure 5 XRD analysis of (a) ALa44, (b) ALa37, (c) ALa311 and (d) ALa413 alloys. The calculated patterns are
represented in red and the experimental patterns in blue. The difference between the experimental and
calculated patterns is represented in grey.
Similar to the ACe44, there is a small amount of Mg17Al12 observed in the ALa44, as shown
in Figure 6. Mg17Al12 was not observed in higher La-containing alloys. The intermetallic phases
identified in the Mg-Al-La alloys have also been further verified using SAED and TEM. The
TEM bright field image, SAED pattern and EDX spectrum of an intermetallic phase in an Mg-
Al-La alloy are shown in Figure 7. By indexing the SAED pattern the new (Al,Mg)3La phase
[33] has been identified and found to have a similar needle or plate-like morphology to the
Al11Ce3 phase. The SAED data in combination with EDX also confirms that the polyhedral and
eutectic acicular phases are Al5La2 and (Al,Si)5La2, respectively, and the eutectic lamellar-like
phase is Mg12La. It is also worth mentioning that the Mg12La morphology is in agreement with
the observation reported in [36], but is different to the Mg12Ce morphology in this study.
Chapter 8
A comparative study of the solidification microstructure in sand-cast Mg-Al-Ce and Mg-Al-La alloys
161
Figure 6 Identification of intermetallic phases in sand-cast ALa44 by SEM-EDX analysis: (a) low-magnification
backscattered electron image, (b) high-magnification backscattered electron image, (c) EDX spectrum of
(Al,Mg)3La, (d) EDX spectrum of Mg17Al12 and (e) EDX spectrum of (Al,Si)5La2.
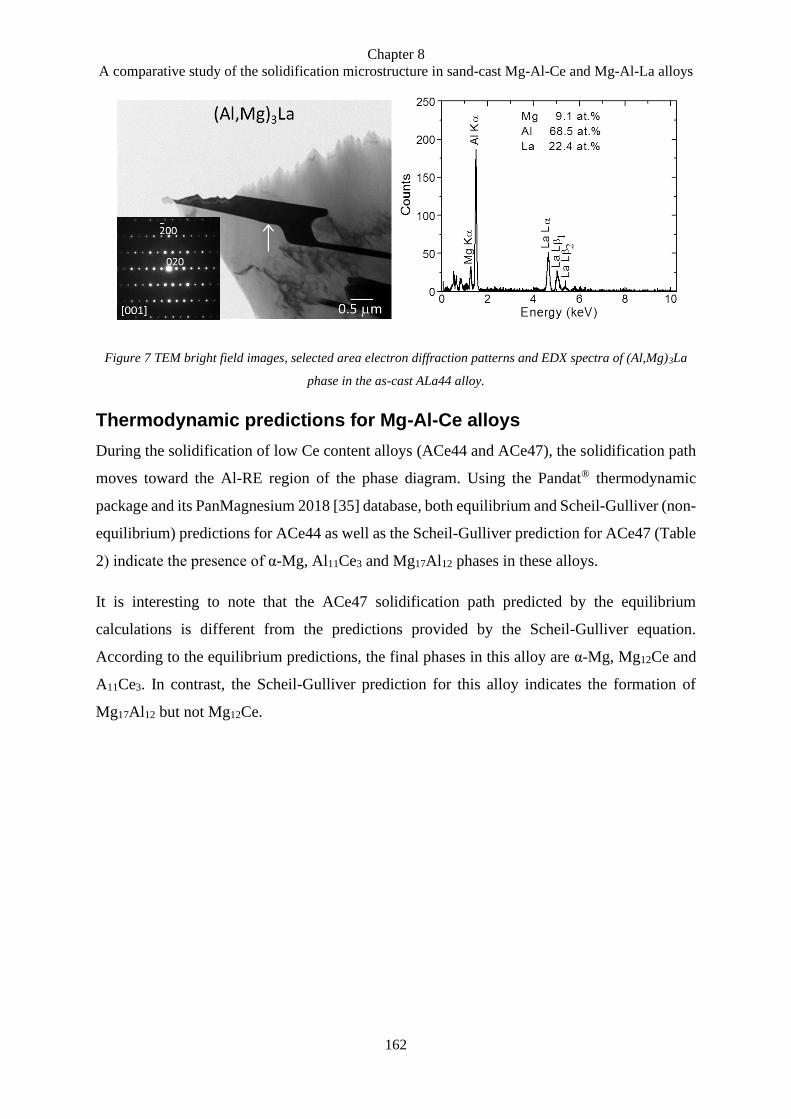
Chapter 8
A comparative study of the solidification microstructure in sand-cast Mg-Al-Ce and Mg-Al-La alloys
162
Figure 7 TEM bright field images, selected area electron diffraction patterns and EDX spectra of (Al,Mg)3La
phase in the as-cast ALa44 alloy.
Thermodynamic predictions for Mg-Al-Ce alloys
During the solidification of low Ce content alloys (ACe44 and ACe47), the solidification path
moves toward the Al-RE region of the phase diagram. Using the Pandat® thermodynamic
package and its PanMagnesium 2018 [35] database, both equilibrium and Scheil-Gulliver (non-
equilibrium) predictions for ACe44 as well as the Scheil-Gulliver prediction for ACe47 (Table
2) indicate the presence of α-Mg, Al11Ce3 and Mg17Al12 phases in these alloys.
It is interesting to note that the ACe47 solidification path predicted by the equilibrium
calculations is different from the predictions provided by the Scheil-Gulliver equation.
According to the equilibrium predictions, the final phases in this alloy are α-Mg, Mg12Ce and
A11Ce3. In contrast, the Scheil-Gulliver prediction for this alloy indicates the formation of
Mg17Al12 but not Mg12Ce.
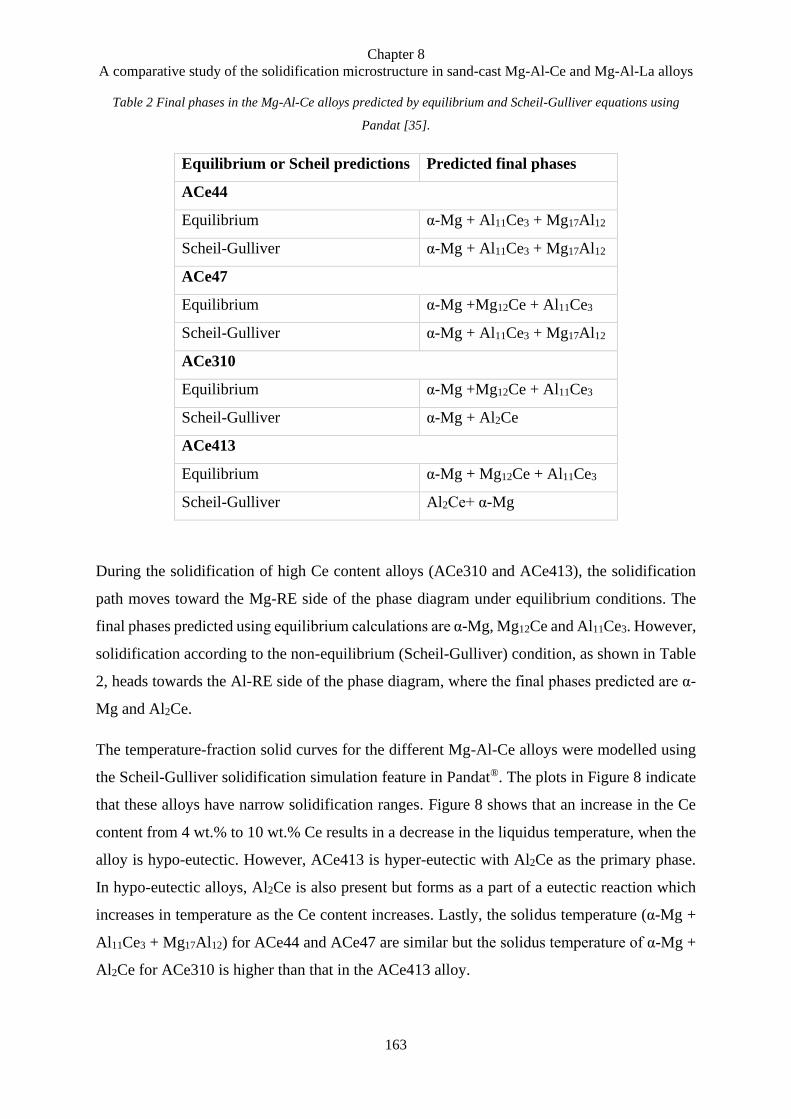
Chapter 8
A comparative study of the solidification microstructure in sand-cast Mg-Al-Ce and Mg-Al-La alloys
163
Table 2 Final phases in the Mg-Al-Ce alloys predicted by equilibrium and Scheil-Gulliver equations using
Pandat [35].
Equilibrium or Scheil predictions Predicted final phases
ACe44
Equilibrium α-Mg + Al11Ce3 + Mg17Al12
Scheil-Gulliver α-Mg + Al11Ce3 + Mg17Al12
ACe47
Equilibrium α-Mg +Mg12Ce + Al11Ce3
Scheil-Gulliver α-Mg + Al11Ce3 + Mg17Al12
ACe310
Equilibrium α-Mg +Mg12Ce + Al11Ce3
Scheil-Gulliver α-Mg + Al2Ce
ACe413
Equilibrium α-Mg + Mg12Ce + Al11Ce3
Scheil-Gulliver Al2Ce+ α-Mg
During the solidification of high Ce content alloys (ACe310 and ACe413), the solidification
path moves toward the Mg-RE side of the phase diagram under equilibrium conditions. The
final phases predicted using equilibrium calculations are α-Mg, Mg12Ce and Al11Ce3. However,
solidification according to the non-equilibrium (Scheil-Gulliver) condition, as shown in Table
2, heads towards the Al-RE side of the phase diagram, where the final phases predicted are α-
Mg and Al2Ce.
The temperature-fraction solid curves for the different Mg-Al-Ce alloys were modelled using
the Scheil-Gulliver solidification simulation feature in Pandat®. The plots in Figure 8 indicate
that these alloys have narrow solidification ranges. Figure 8 shows that an increase in the Ce
content from 4 wt.% to 10 wt.% Ce results in a decrease in the liquidus temperature, when the
alloy is hypo-eutectic. However, ACe413 is hyper-eutectic with Al2Ce as the primary phase.
In hypo-eutectic alloys, Al2Ce is also present but forms as a part of a eutectic reaction which
increases in temperature as the Ce content increases. Lastly, the solidus temperature (α-Mg +
Al11Ce3 + Mg17Al12) for ACe44 and ACe47 are similar but the solidus temperature of α-Mg +
Al2Ce for ACe310 is higher than that in the ACe413 alloy.
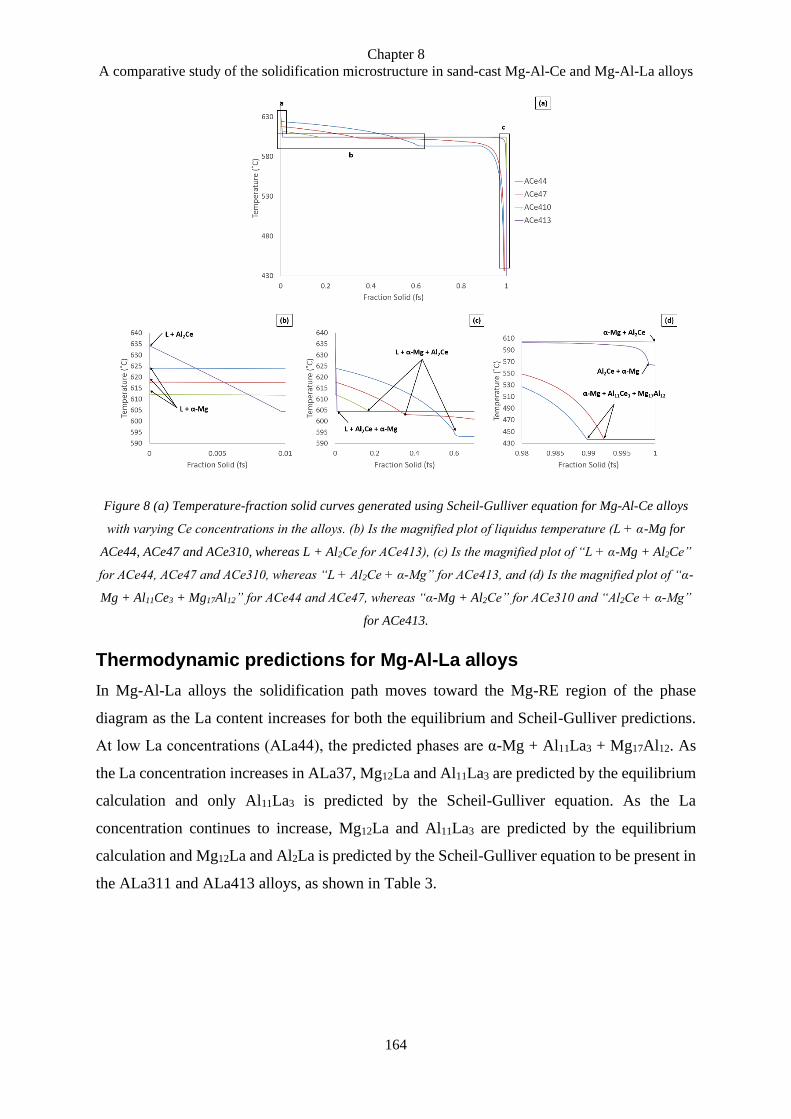
Chapter 8
A comparative study of the solidification microstructure in sand-cast Mg-Al-Ce and Mg-Al-La alloys
164
Figure 8 (a) Temperature-fraction solid curves generated using Scheil-Gulliver equation for Mg-Al-Ce alloys
with varying Ce concentrations in the alloys. (b) Is the magnified plot of liquidus temperature (L + α-Mg for
ACe44, ACe47 and ACe310, whereas L + Al2Ce for ACe413), (c) Is the magnified plot of “L + α-Mg + Al2Ce”
for ACe44, ACe47 and ACe310, whereas “L + Al2Ce + α-Mg” for ACe413, and (d) Is the magnified plot of “α-
Mg + Al11Ce3 + Mg17Al12” for ACe44 and ACe47, whereas “α-Mg + Al2Ce” for ACe310 and “Al2Ce + α-Mg”
for ACe413.
Thermodynamic predictions for Mg-Al-La alloys
In Mg-Al-La alloys the solidification path moves toward the Mg-RE region of the phase
diagram as the La content increases for both the equilibrium and Scheil-Gulliver predictions.
At low La concentrations (ALa44), the predicted phases are α-Mg + Al11La3 + Mg17Al12. As
the La concentration increases in ALa37, Mg12La and Al11La3 are predicted by the equilibrium
calculation and only Al11La3 is predicted by the Scheil-Gulliver equation. As the La
concentration continues to increase, Mg12La and Al11La3 are predicted by the equilibrium
calculation and Mg12La and Al2La is predicted by the Scheil-Gulliver equation to be present in
the ALa311 and ALa413 alloys, as shown in Table 3.
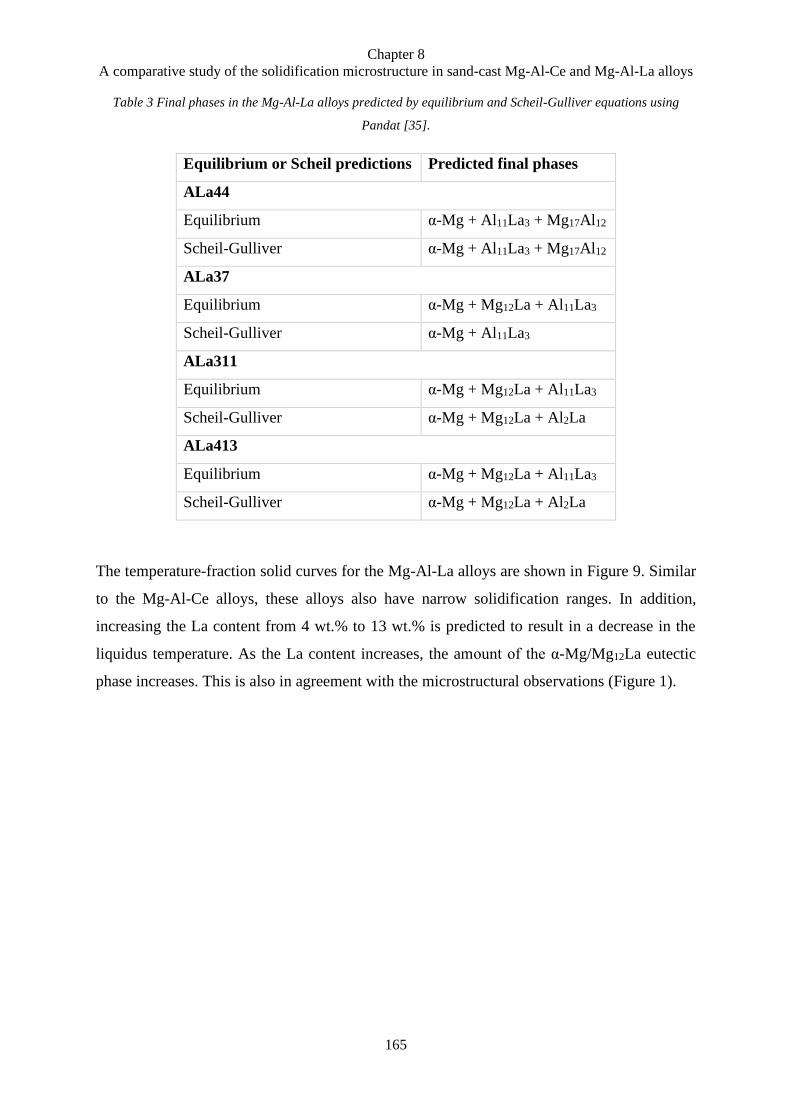
Chapter 8
A comparative study of the solidification microstructure in sand-cast Mg-Al-Ce and Mg-Al-La alloys
165
Table 3 Final phases in the Mg-Al-La alloys predicted by equilibrium and Scheil-Gulliver equations using
Pandat [35].
Equilibrium or Scheil predictions Predicted final phases
ALa44
Equilibrium α-Mg + Al11La3 + Mg17Al12
Scheil-Gulliver α-Mg + Al11La3 + Mg17Al12
ALa37
Equilibrium α-Mg + Mg12La + Al11La3
Scheil-Gulliver α-Mg + Al11La3
ALa311
Equilibrium α-Mg + Mg12La + Al11La3
Scheil-Gulliver α-Mg + Mg12La + Al2La
ALa413
Equilibrium α-Mg + Mg12La + Al11La3
Scheil-Gulliver α-Mg + Mg12La + Al2La
The temperature-fraction solid curves for the Mg-Al-La alloys are shown in Figure 9. Similar
to the Mg-Al-Ce alloys, these alloys also have narrow solidification ranges. In addition,
increasing the La content from 4 wt.% to 13 wt.% is predicted to result in a decrease in the
liquidus temperature. As the La content increases, the amount of the α-Mg/Mg12La eutectic
phase increases. This is also in agreement with the microstructural observations (Figure 1).
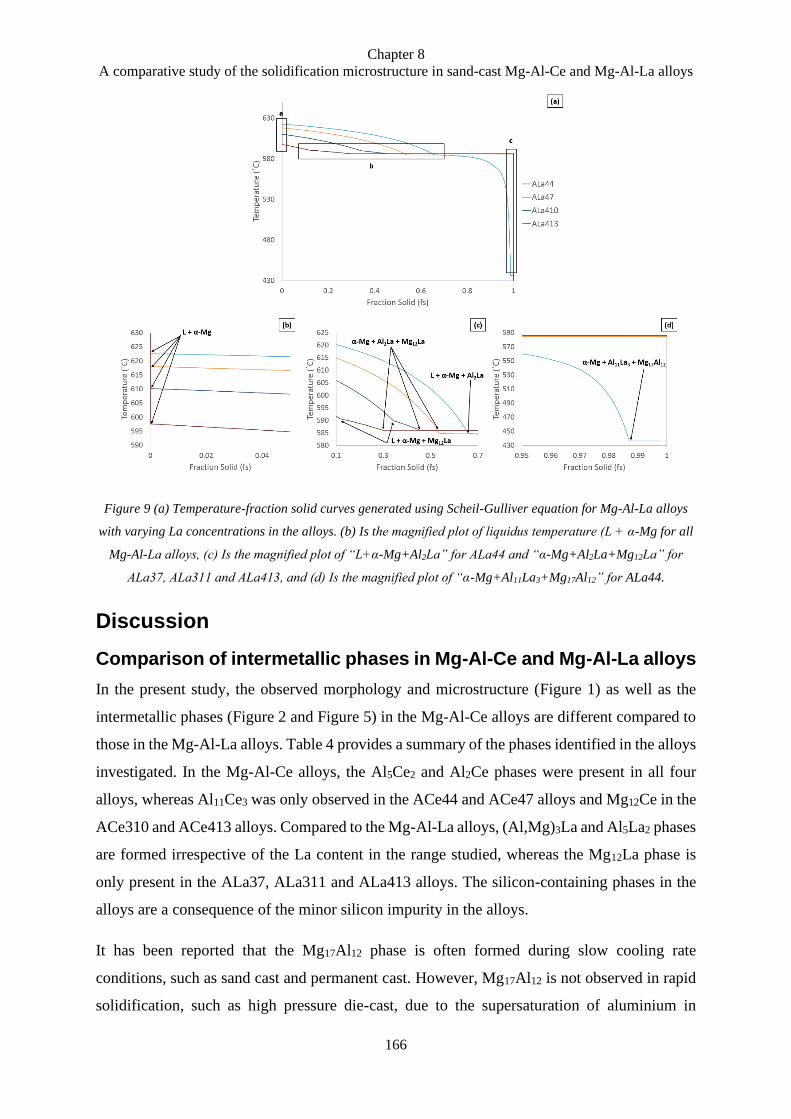
Chapter 8
A comparative study of the solidification microstructure in sand-cast Mg-Al-Ce and Mg-Al-La alloys
166
Figure 9 (a) Temperature-fraction solid curves generated using Scheil-Gulliver equation for Mg-Al-La alloys
with varying La concentrations in the alloys. (b) Is the magnified plot of liquidus temperature (L + α-Mg for all
Mg-Al-La alloys, (c) Is the magnified plot of “L+α-Mg+Al2La” for ALa44 and “α-Mg+Al2La+Mg12La” for
ALa37, ALa311 and ALa413, and (d) Is the magnified plot of “α-Mg+Al11La3+Mg17Al12” for ALa44.
Discussion
Comparison of intermetallic phases in Mg-Al-Ce and Mg-Al-La alloys
In the present study, the observed morphology and microstructure (Figure 1) as well as the
intermetallic phases (Figure 2 and Figure 5) in the Mg-Al-Ce alloys are different compared to
those in the Mg-Al-La alloys. Table 4 provides a summary of the phases identified in the alloys
investigated. In the Mg-Al-Ce alloys, the Al5Ce2 and Al2Ce phases were present in all four
alloys, whereas Al11Ce3 was only observed in the ACe44 and ACe47 alloys and Mg12Ce in the
ACe310 and ACe413 alloys. Compared to the Mg-Al-La alloys, (Al,Mg)3La and Al5La2 phases
are formed irrespective of the La content in the range studied, whereas the Mg12La phase is
only present in the ALa37, ALa311 and ALa413 alloys. The silicon-containing phases in the
alloys are a consequence of the minor silicon impurity in the alloys.
It has been reported that the Mg17Al12 phase is often formed during slow cooling rate
conditions, such as sand cast and permanent cast. However, Mg17Al12 is not observed in rapid
solidification, such as high pressure die-cast, due to the supersaturation of aluminium in
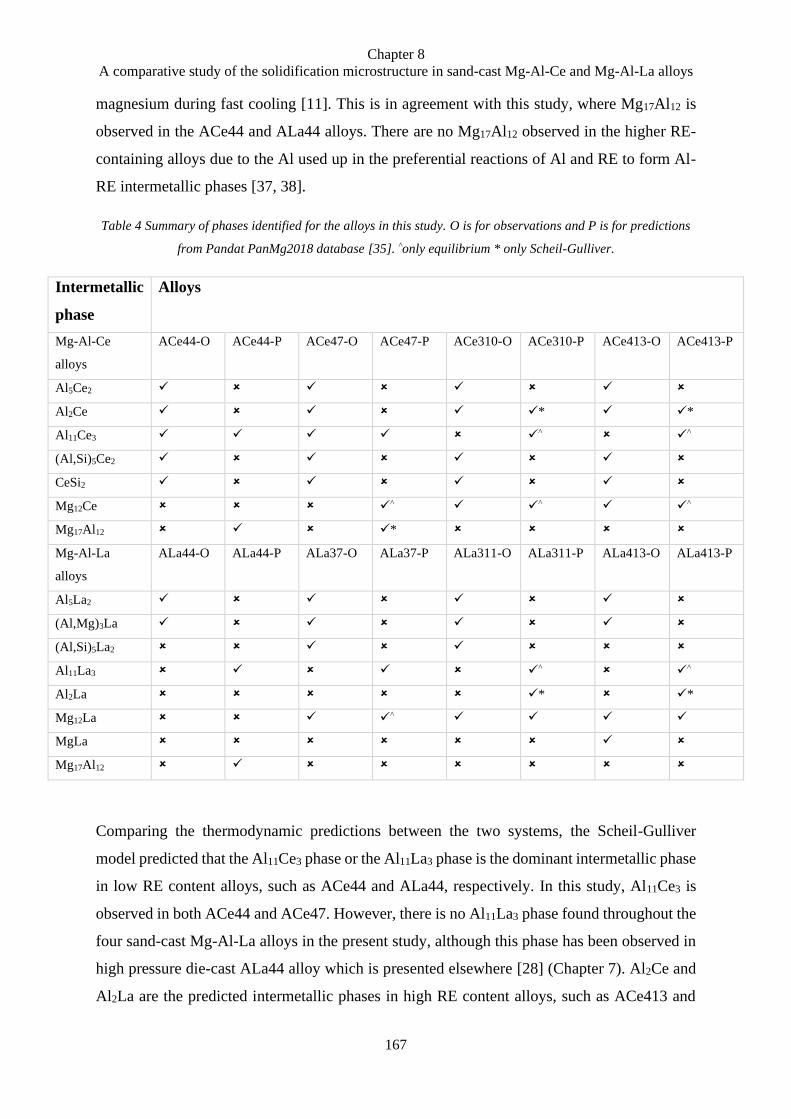
Chapter 8
A comparative study of the solidification microstructure in sand-cast Mg-Al-Ce and Mg-Al-La alloys
167
magnesium during fast cooling [11]. This is in agreement with this study, where Mg17Al12 is
observed in the ACe44 and ALa44 alloys. There are no Mg17Al12 observed in the higher RE-
containing alloys due to the Al used up in the preferential reactions of Al and RE to form Al-
RE intermetallic phases [37, 38].
Table 4 Summary of phases identified for the alloys in this study. O is for observations and P is for predictions
from Pandat PanMg2018 database [35]. ^only equilibrium * only Scheil-Gulliver.
Intermetallic
phase
Alloys
Mg-Al-Ce
alloys
ACe44-O ACe44-P ACe47-O ACe47-P ACe310-O ACe310-P ACe413-O ACe413-P
Al5Ce2
Al2Ce * *
Al11Ce3 ^
^
(Al,Si)5Ce2
CeSi2
Mg12Ce ^
^ ^
Mg17Al12 *
Mg-Al-La
alloys
ALa44-O ALa44-P ALa37-O ALa37-P ALa311-O ALa311-P ALa413-O ALa413-P
Al5La2
(Al,Mg)3La
(Al,Si)5La2
Al11La3 ^
^
Al2La * *
Mg12La ^
MgLa
Mg17Al12
Comparing the thermodynamic predictions between the two systems, the Scheil-Gulliver
model predicted that the Al11Ce3 phase or the Al11La3 phase is the dominant intermetallic phase
in low RE content alloys, such as ACe44 and ALa44, respectively. In this study, Al11Ce3 is
observed in both ACe44 and ACe47. However, there is no Al11La3 phase found throughout the
four sand-cast Mg-Al-La alloys in the present study, although this phase has been observed in
high pressure die-cast ALa44 alloy which is presented elsewhere [28] (Chapter 7). Al2Ce and
Al2La are the predicted intermetallic phases in high RE content alloys, such as ACe413 and
Chapter 8
A comparative study of the solidification microstructure in sand-cast Mg-Al-Ce and Mg-Al-La alloys
168
ALa413, respectively. However, the observations in this study show that Al2Ce is present in
all four Mg-Al-Ce alloys, but Al2La is not observed in any of the Mg-Al-La alloys. There is
also an additional Al3La phase in the Mg-Al-La system database, but there is no equivalent
phase in the Mg-Al-Ce system. It is worth mentioning that the Al3La (currently in the database)
is not the same as the (Al,Mg)3La phase described in [33], although the chemical compositions
of Al3La and (Al,Mg)3La are similar. The hexagonal Al3La phase has a distinctly different
crystal structure compared to the observed orthorhombic (Al,Mg)3La phase, as reported in [33].
In addition, the thermal stability of the (Al,Mg)3La phase is higher than the Al2La and Al11La3
phases in the Mg-Al-La system, as reported in [28] (Chapter 7).
Another observation is that the Al2Ce particles are found at the centre of magnesium grains
from 7 wt.% of cerium and above (Figure 1). This suggests that the ACe47, ACe310 and
ACe413 are all hyper-eutectic alloys. A previous study by the authors also indicated that
ACe310 and ACe413 are hyper-eutectic [34]. In the Mg-Al-La alloys, however, the primary
intermetallic particles (Al5La2) are not seen until the lanthanum concentration reaches 11 wt.%
or more. The formation of different primary intermetallic phases in Mg-Al-Ce and Mg-Al-La
alloys are detailed in previous studies by the authors [33, 34].
As the solidification process continues, the phase selection of the eutectics is also different
between the Mg-Al-Ce and Mg-Al-La alloys. For low Ce content alloys (ACe44 and ACe47),
the solidification tends to move towards the Al5Ce2/Al11Ce3 mono-variant eutectics. Whereas,
in higher Ce content alloys (ACe310 and ACe413), the solidification ends in the Mg12Ce phase
and bypasses the formation of Al11Ce3. However, the solidification path for the lower La
content alloys, such as the ALa44, heads toward the Al5La2 and (Al,Mg)3La containing
eutectic, but continues to Mg12La as the La content increases (ALa37 and ALa311), and ends
with very small amounts of the MgLa-containing eutectic at the highest La content (ALa413).
Lastly, the proportion of eutectic is higher in the La content alloys compared with the Ce alloys
with a similar concentration. Hence it is clear that the intermetallic phase(s) that form in the
Mg-Al-Ce and Mg-Al-La alloys are different.
Conclusions
The microstructure of sand-cast Mg-Al-Ce and Mg-Al-La alloys have been characterised in
this study. The intermetallic phases formed in the Ce-containing alloys and La-containing
alloys are different. The key findings in this study are:
Chapter 8
A comparative study of the solidification microstructure in sand-cast Mg-Al-Ce and Mg-Al-La alloys
169
• In the Mg-Al-Ce alloys, the primary intermetallic phase, Al2Ce, is found to be at the
centre of the grains at Ce concentrations of 7 wt.% and above. This indicates that the
ACe44 alloy is a hypo-eutectic alloy, whereas ACe47, ACe310 and ACe413 are all
hyper-eutectic. On the other hand, the primary intermetallic phase, Al5La2, only appears
in 11 wt.% La or more in the Mg-Al-La alloys (ALa311 and ALa413).
• The Al11Ce3 eutectic phase forms in low Ce content alloys (ACe44 and ACe47),
whereas the Mg12Ce eutectic phase forms in high Ce content alloys (ACe310 and
ACe413). However, in Mg-Al-La alloys, Al5La2 and (Al,Mg)3La containing eutectics
are formed in ALa44, but in ALa37, ALa311 and ALa413 solidification continue to
form the Mg12La eutectic phase. As the La content increases in ALa413, the MgLa
phase is also found in the alloy.
Acknowledgements
This study was supported by the Australian Research Council (ARC) through linkage project
LP130100828. The authors would like to thank Dr. Aaron Seeber of CSIRO for his time in
providing useful advice and information on the XRD experiments. In addition, the authors
wish to thank Mr. Gary Savage and Mr. Andrew Yob of CSIRO for their time in assisting the
casting process as well as providing support throughout the casting experiments. The RMIT
Microscopy and Microanalysis Facility (RMMF) as well as the Monash Centre for Electron
Microscopy (MCEM) are acknowledged for the microstructure characterisation presented in
this paper.
Chapter 8
A comparative study of the solidification microstructure in sand-cast Mg-Al-Ce and Mg-Al-La alloys
170
References
1. S. Das, Magnesium for automotive applications: primary production cost assessment.
The Journal of the Minerals, Metals and Materials Society (TMS), 2003. 55(11): p. 22-
26.
2. T.B. Abbott, Magnesium: industrial and research developments over the last 15 years.
Corrosion, 2014. 71(2): p. 120-127.
3. B.L. Mordike and T. Ebert, Magnesium: properties — applications — potential.
Materials Science and Engineering: A, 2001. 302(1): p. 37-45.
4. M. Easton, et al., The application of magnesium alloys to the lightweighting of
automotive structures, in Sustainable automotive technologies 2012: proceedings of the
4th international conference. 2012, Springer Berlin Heidelberg: Berlin, Heidelberg. p.
17-23.
5. Z. Yang, et al., Review on research and development of magnesium alloys. Acta
Metallurgica Sinica 2008. 21(5): p. 313-328.
6. M.O. Pekguleryuz and A.A. Kaya, Creep resistant magnesium alloys for powertrain
applications. Advanced Engineering Materials, 2003. 5(12): p. 866-878.
7. S. Zhu, et al., The influence of individual rare earth elements (La, Ce, or Nd) on creep
resistance of die‐cast magnesium alloy AE44. Advanced Engineering Materials, 2016.
18(6): p. 932-937.
8. J.H. Zhang, et al., Microstructures and mechanical properties of heat-resistant high-
pressure die-cast Mg–4Al–xLa–0.3 Mn (x= 1, 2, 4, 6) alloys. Materials Science and
Engineering: A, 2010. 527(10): p. 2527-2537.
9. J.H. Zhang, et al., Effect of substituting cerium-rich mischmetal with lanthanum on
microstructure and mechanical properties of die-cast Mg–Al–RE alloys. Materials &
Design, 2009. 30(7): p. 2372-2378.
Chapter 8
A comparative study of the solidification microstructure in sand-cast Mg-Al-Ce and Mg-Al-La alloys
171
10. J.H. Zhang, et al., Effect of Ce on microstructure, mechanical properties and corrosion
behavior of high-pressure die-cast Mg–4Al-based alloy. Journal of Alloys and
Compounds, 2011. 509(3): p. 1069-1078.
11. W. Sun, et al., Investigation of the non-equilibrium solidification microstructure of a
Mg–4Al–2RE (AE42) alloy. Journal of Materials Science, 2016: p. 1-8.
12. I.A. Anyanwu, et al., Effect of substituting cerium-rich mischmetal with lanthanum on
high temperature properties of die-cast Mg–Zn–Al–Ca–RE alloys. Materials Science
and Engineering: A, 2004. 380(1): p. 93-99.
13. B.R. Powell, et al., Microstructure and creep behavior in AE42 magnesium die-casting
alloy. The Journal of The Minerals & Materials Society (TMS), 2002. 54(8): p. 34-38.
14. G. Pettersen, et al., Microstructure of a pressure die cast magnesium—4wt.%
aluminium alloy modified with rare earth additions. Materials Science and
Engineering: A, 1996. 207(1): p. 115-120.
15. M.S. Dargusch, et al., Microstructure and mechanical properties of high pressure die
cast magnesium alloy AE42 with 1% strontium. International Journal of Cast Metals
Research, 2004. 17(3): p. 170-173.
16. S.M. Zhu, et al., Microstructural analysis of the creep resistance of die-cast Mg–4Al–
2RE alloy. Scripta Materialia, 2008. 58(6): p. 477-480.
17. I.P. Moreno, et al., Microstructural stability and creep of rare-earth containing
magnesium alloys. Scripta Materialia, 2003. 48(8): p. 1029-1034.
18. A.A. Moosa, Effect of lanthanum addition on the microstructure of Mg-4Al alloy. Al-
Khwarizmi Engineering Journal, 2011. 7: p. 75-82.
Chapter 8
A comparative study of the solidification microstructure in sand-cast Mg-Al-Ce and Mg-Al-La alloys
172
19. S. Zhu, et al., Evaluation of magnesium die-casting alloys for elevated temperature
applications: microstructure, tensile properties, and creep resistance. Metallurgical
and Materials Transactions: A, 2015. 46(8): p. 3543-3554.
20. J. Bai, et al., Microstructures and creep properties of Mg–4Al–(1–4)La alloys produced
by different casting techniques. Materials Science and Engineering: A, 2012. 552: p.
472-480.
21. J.H. Zhang, et al., Microstructures, tensile properties and corrosion behavior of die-
cast Mg–4Al-based alloys containing La and/or Ce. Materials Science and
Engineering: A, 2008. 489(1): p. 113-119.
22. T. Rzychoń, et al., Microstructural stability and creep properties of die casting Mg–
4Al–4RE magnesium alloy. Materials Characterization, 2009. 60(10): p. 1107-1113.
23. T. Rzychoń and A. Kiełbus, Microstructure and tensile properties of sand cast and die
cast AE44 magnesium alloy. Archives of Metallurgy and Materials, 2008. 53(3): p. 901-
907.
24. S.M. Zhu, et al., Microstructure and creep behavior of high-pressure die-cast
magnesium alloy AE44. Metallurgical and Materials Transactions A, 2012. 43(11): p.
4137-4144.
25. T. Rzychoń, A. Kiełbus, and L. Lityńska-Dobrzyńska, Microstructure, microstructural
stability and mechanical properties of sand-cast Mg–4Al–4RE alloy. Materials
Characterization, 2013. 83: p. 21-34.
26. K.N. Braszczyńska-Malik and E. Przełożyńska, Microstructure of Mg–Al–RE-type
exerimental magnesium alloy gravity cast into sand mould. Archives of Foundry
Engineering, 2016. 16(2): p. 115-118.
27. T. Rzychoń, Structure and properties of cast AE44 magnesium alloy. 2009: Katowice,
Poland.
Chapter 8
A comparative study of the solidification microstructure in sand-cast Mg-Al-Ce and Mg-Al-La alloys
173
28. S. Zhu, et al., Revisiting the intermetallic phases in high-pressure die-cast Mg–4Al–
4Ce and Mg–4Al–4La alloys. Materials Characterization, 2019. 156: p. 109839.
29. G.S. Pawley, Unit-cell refinement from powder diffraction scans. Journal of Applied
Crystallography, 1981. 14(6): p. 357-361.
30. H.M. Rietveld, A profile refinement method for nuclear and magnetic structures.
Journal of Applied Crystallography, 1969. 2(2): p. 65-71.
31. P. Villars, L.D. Calvert, and W.B. Pearson, Pearson's handbook of crystallographic
data for intermetallic phases. (volumes 1, 2, 3). American Society for Metals, 1985: p.
3258.
32. ICDD, International Centre for Diffraction Data (ICDD) PDF-4+ 2017. International
Centre for Diffraction Data, Newtown Square, PA, USA, 2017.
33. C. Wong, et al., (Al, Mg)3La: a new phase in the Mg–Al–La system. Acta
Crystallographica Section B: Structural Science, Crystal Engineering and Materials,
2018. 74(4): p. 370-375.
34. C. Wong, et al. Experimental study of the solidification microstructure in the Mg-rich
corner of Mg–Al–Ce system. in TMS Annual Meeting & Exhibition. 2018. Springer.
35. CompuTherm, Pandat software and PanMagnesium 2018 thermodynamic database,
Madison, Editor.
36. T.L. Chia, et al., The effect of alloy composition on the microstructure and tensile
properties of binary Mg-rare earth alloys. Journal of Intermetallics, 2009. 17(7): p.
481-490.
37. A. Żydek, J. Kamieniak, and K.N. Braszczyńska-Malik, Evolution of Mg-5Al-0.4 Mn
microstructure after rare earth elements addition. Archives of Foundry Engineering,
2011. 11(2): p. 157-160.

Chapter 8
A comparative study of the solidification microstructure in sand-cast Mg-Al-Ce and Mg-Al-La alloys
174
38. M.S. Dargusch, et al., Microstructural analysis of the improved creep resistance of a
die-cast magnesium–aluminium–rare earth alloy by strontium additions. Scripta
Materialia, 2009. 60(2): p. 116-119.
Chapter 9
Influence of alloying elements and cooling rates on the microstructure features of Mg-Al-RE alloys
175
Chapter 9
Influence of alloying elements and cooling rates on the
microstructure features of Mg-Al-RE alloys
Charlotte Wong1, Suming Zhu1,4, Trevor B. Abbott1,4,5, Mark J. Styles2, Kazuhiro Nogita3,
Mark A. Gibson1,2,4, Mark A. Easton1
1 School of Engineering, RMIT University, Carlton, Victoria 3053, Australia
2 CSIRO Manufacturing, Clayton, Victoria 3168, Australia
3 School of Mechanical and Mining Engineering, University of Queensland, Brisbane,
Queensland 4072, Australia
4 Department of Materials Science and Engineering, Monash University, Victoria 3800,
Australia
5 Magontec Ltd, Sydney, New South Wales 2000, Australia
Chapter 9
Influence of alloying elements and cooling rates on the microstructure features of Mg-Al-RE alloys
176
Title
The influences of RE alloying element and cooling rate on the solidification microstructure of
Mg-Al-La and Mg-Al-Ce alloys
Charlotte Wong1, Suming Zhu1,4, Ace Christopher Dacaya1, Trevor B. Abbott1,4,5, Mark J.
Styles2, Kazuhiro Nogita3, Mark A. Gibson1,2,4, Mark A. Easton1*
1 School of Engineering, RMIT University, Carlton, Victoria 3053, Australia
2 CSIRO Manufacturing, Clayton, Victoria 3168, Australia
3 School of Mechanical and Mining Engineering, University of Queensland, Brisbane,
Queensland 4072, Australia
4 Department of Materials Science and Engineering, Monash University, Victoria 3800,
Australia
5 Magontec Ltd, Sydney, New South Wales 2000, Australia
*Corresponding author: Mark Easton ([email protected])
Abstract
The effects of RE alloying elements and cooling rates on the solidification microstructure of
Mg-Al-RE alloys were investigated. A series of Mg-Al-La and Mg-Al-Ce alloys were gravity
cast into a wedge-shaped mould to achieve a gradient in cooling rate. Microstructural features,
such as grain size and secondary dendrite arm spacing (SDAS), were analysed by optical
microscopy and scanning electron microscopy. The relationship between the dendrite growth
time and the SDAS was analysed by the commonly used empirical equation. In addition,
microstructure-property relationships between yield stress and microstructure features (SDAS
and grain size) for these alloys were discussed and established based on the Hall-Petch
equation. Using the relationships developed in this study, it is possible to predict the
microstructure features and yield stress at a given cooling rate for the investigated alloys.
Chapter 9
Influence of alloying elements and cooling rates on the microstructure features of Mg-Al-RE alloys
177
Introduction
Magnesium alloys have attracted interest in the automotive industry because of their low
density and high specific strength, which makes them suitable for light weighting applications
in vehicles to achieve substantial fuel savings [1, 2]. Mg-Al alloys are the most commonly used
alloys in industry, including the Mg-Al-Zn (AZ) and Mg-Al-Mn (AM) series of alloys.
However, these alloys tend to suffer from poor creep resistance and significant reduction in
tensile strength at elevated temperatures [3], which limits their application to temperatures
below 125 ˚C [4].
To further improve the elevated temperature properties of Mg alloys, one of the most effective
approaches is the addition of rare earth (RE) elements. This allows the formation of high
thermal stability intermetallic phases in preference to the less stable Mg17Al12 phase [5-8]. Mg-
Al-RE (AE) alloys, including AE42 and AE44, are currently used in commercial applications,
such as engine crankcases, oil housings and oil pans [4, 9, 10]. Recent investigations have
indicated that the addition of individual RE elements, such as lanthanum (La) and cerium (Ce)
to Mg-Al alloys (AE alloys) can lead to the formation of different microstructures and hence
possibly different mechanical properties of the alloys [11-13].
High pressure die-casting (HPDC) is still the prominent manufacturing process for magnesium
components, representing the vast majority of applications of Mg alloys [14]. It is well known
that the morphology of microstructure and intermetallic phases have an important influence on
the properties of the alloys [15]. Solidification behaviour is critical, especially in the die-casting
process, because it determines the final microstructure morphology, such as secondary dendrite
arm spacing (SDAS) and grain size, which affects the properties of the alloys [16-20].
Grain size and SDAS decrease with increased cooling rate [21, 22]. The average grain size and
SDAS have a direct influence on the mechanical properties, such as the yield stress and
hardness. The relationship between yield strength or flow stress and grain size is often
described by the Hall-Petch equation (Equation 1) [23]. In alloys with dendritic grain
morphologies, often the SDAS can be the microstructural parameter that is important in
controlling the strength (Equation 2) [24, 25].
𝜎 = 𝜎0 + 𝑘𝑑−1/2 [1]
𝜎 = 𝜎0 + ℎ𝜆2−1/2 [2]
Chapter 9
Influence of alloying elements and cooling rates on the microstructure features of Mg-Al-RE alloys
178
where σ0 is the intercept stress, also known as the friction stress when dislocations move on the
slip plane, whereas k and h are the Hall-Petch coefficients, which represents the stress
concentration factor. d is the average grain size and λ2 is the average secondary dendrite arm
spacing (SDAS).
The SDAS (λ2) is often described by the simple empirical equation [26, 27],
𝜆2 = 𝑀𝑡𝑓𝑛 [3]
where tf is the solidification time range between the liquidus and solidus, n is often between
0.33 and 0.5, and M is a fitting factor, which is dependent on the alloy elemental concentration
[26, 28, 29] and constituents [30]. Equation 3 can be modified to relate the SDAS with the pre-
solidification cooling rate, using [26]:
𝜆2 = 𝑀2−𝑛 [4]
where is the pre-solidification cooling rate (or the instantaneous cooling rate at liquidus) and
M2 is a modified fitting factor for a particular alloy.
Thermal analysis, such as computer-aided cooling curve analysis (CA-CCA), is a common
approach to investigate the solidification behaviour of alloys [31, 32] and is used in this study
to assess the solidification behaviour of AE alloys at different cooling rates and RE
concentrations. The effect of cooling rates and RE concentrations, which determine the cast
microstructure and the solidification behaviour, were studied with a goal of understanding their
influence on microstructural features. The purpose of the present study is then to characterise
the effect of cooling rate on the microstructure of Mg-Al-RE alloys and develop a relationship
between the morphological features and mechanical properties.
Methodology
Sample preparation
The nominal compositions of the alloys investigated in this study were Mg-4Al-4La (ALa44),
Mg-4Al-4Ce (ACe44), Mg-4Al-13Ce (ACe413) and Mg-4Al-13La (ALa413) (all
compositions in weight percent unless otherwise specified). To prepare these alloys, pure
elemental magnesium (99.95 %), aluminium (99.9 %), lanthanum (99.9 %) and cerium (99.5
%) ingots were alloyed under an inert cover gas, which is a mixture of nitrogen and R134a
refrigerant gas. The alloys were stirred well after each addition, to ensure complete mixing.
The alloy was then cast into a preheated wedge mould, which consists of two parts: a permanent
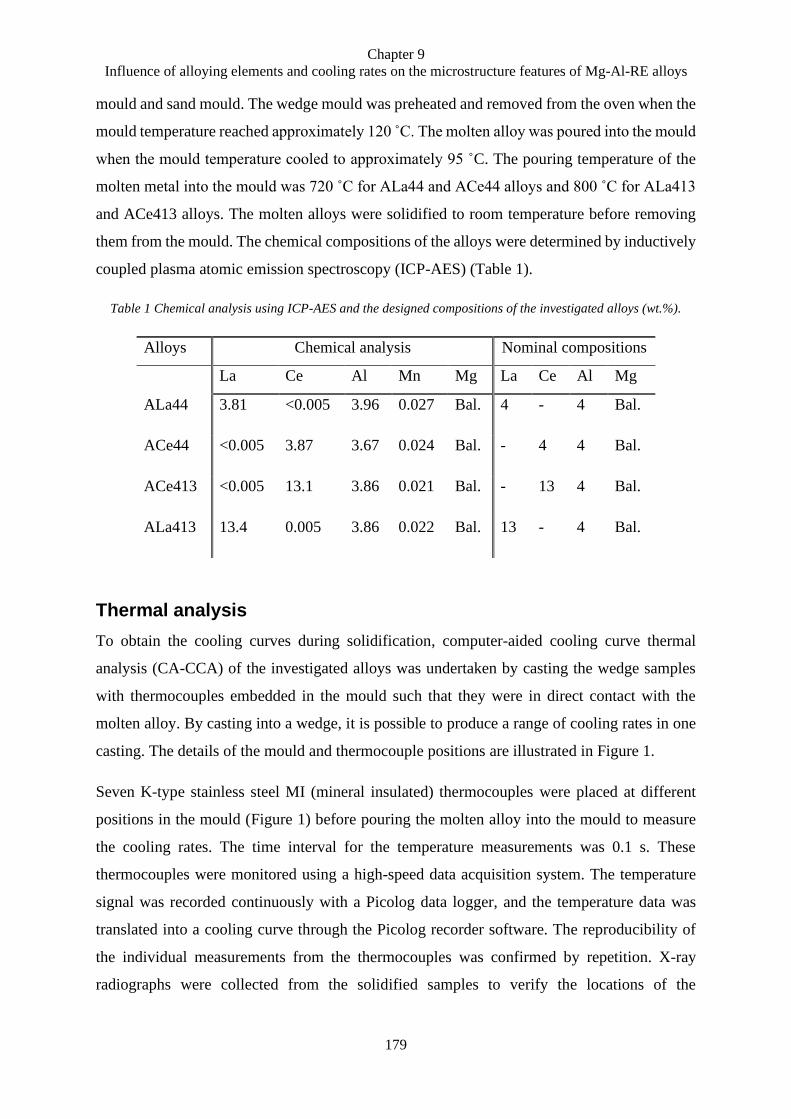
Chapter 9
Influence of alloying elements and cooling rates on the microstructure features of Mg-Al-RE alloys
179
mould and sand mould. The wedge mould was preheated and removed from the oven when the
mould temperature reached approximately 120 C. The molten alloy was poured into the mould
when the mould temperature cooled to approximately 95 ˚C. The pouring temperature of the
molten metal into the mould was 720 ˚C for ALa44 and ACe44 alloys and 800 ˚C for ALa413
and ACe413 alloys. The molten alloys were solidified to room temperature before removing
them from the mould. The chemical compositions of the alloys were determined by inductively
coupled plasma atomic emission spectroscopy (ICP-AES) (Table 1).
Table 1 Chemical analysis using ICP-AES and the designed compositions of the investigated alloys (wt.%).
Alloys Chemical analysis Nominal compositions
La Ce Al Mn Mg La Ce Al Mg
ALa44 3.81 <0.005 3.96 0.027 Bal. 4 - 4 Bal.
ACe44 <0.005 3.87 3.67 0.024 Bal. - 4 4 Bal.
ACe413 <0.005 13.1 3.86 0.021 Bal. - 13 4 Bal.
ALa413 13.4 0.005 3.86 0.022 Bal. 13 - 4 Bal.
Thermal analysis
To obtain the cooling curves during solidification, computer-aided cooling curve thermal
analysis (CA-CCA) of the investigated alloys was undertaken by casting the wedge samples
with thermocouples embedded in the mould such that they were in direct contact with the
molten alloy. By casting into a wedge, it is possible to produce a range of cooling rates in one
casting. The details of the mould and thermocouple positions are illustrated in Figure 1.
Seven K-type stainless steel MI (mineral insulated) thermocouples were placed at different
positions in the mould (Figure 1) before pouring the molten alloy into the mould to measure
the cooling rates. The time interval for the temperature measurements was 0.1 s. These
thermocouples were monitored using a high-speed data acquisition system. The temperature
signal was recorded continuously with a Picolog data logger, and the temperature data was
translated into a cooling curve through the Picolog recorder software. The reproducibility of
the individual measurements from the thermocouples was confirmed by repetition. X-ray
radiographs were collected from the solidified samples to verify the locations of the
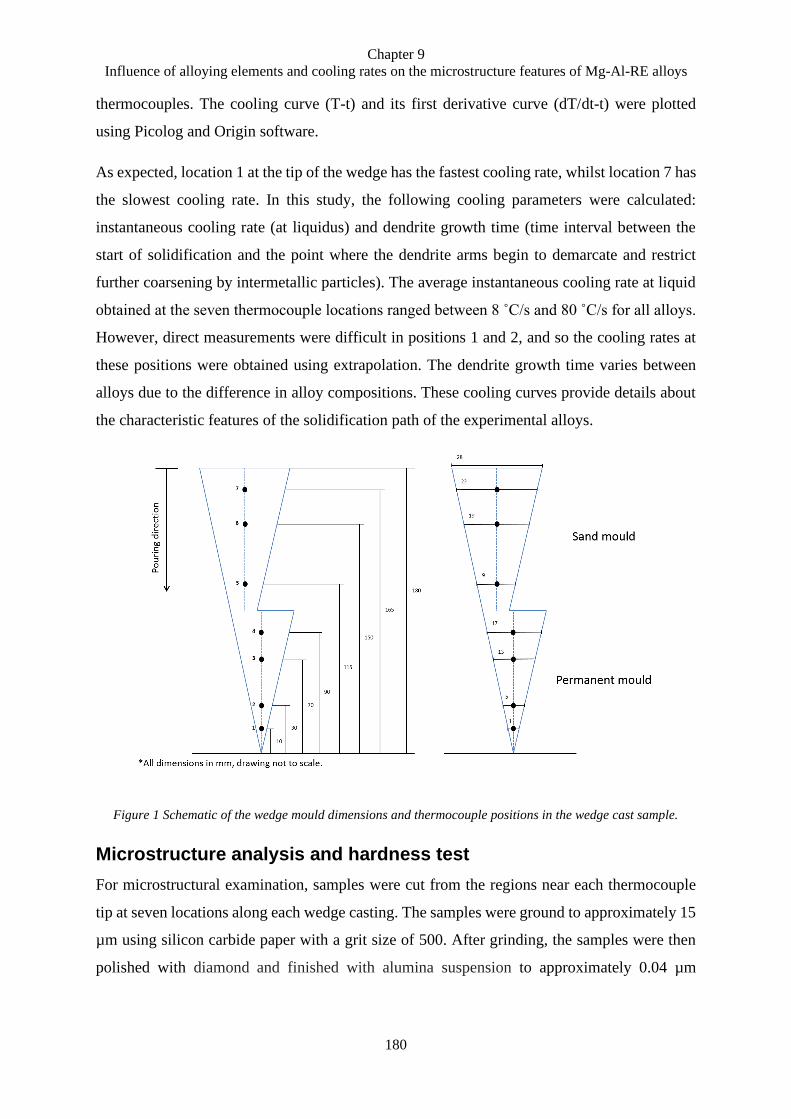
Chapter 9
Influence of alloying elements and cooling rates on the microstructure features of Mg-Al-RE alloys
180
thermocouples. The cooling curve (T-t) and its first derivative curve (dT/dt-t) were plotted
using Picolog and Origin software.
As expected, location 1 at the tip of the wedge has the fastest cooling rate, whilst location 7 has
the slowest cooling rate. In this study, the following cooling parameters were calculated:
instantaneous cooling rate (at liquidus) and dendrite growth time (time interval between the
start of solidification and the point where the dendrite arms begin to demarcate and restrict
further coarsening by intermetallic particles). The average instantaneous cooling rate at liquid
obtained at the seven thermocouple locations ranged between 8 ˚C/s and 80 ˚C/s for all alloys.
However, direct measurements were difficult in positions 1 and 2, and so the cooling rates at
these positions were obtained using extrapolation. The dendrite growth time varies between
alloys due to the difference in alloy compositions. These cooling curves provide details about
the characteristic features of the solidification path of the experimental alloys.
Figure 1 Schematic of the wedge mould dimensions and thermocouple positions in the wedge cast sample.
Microstructure analysis and hardness test
For microstructural examination, samples were cut from the regions near each thermocouple
tip at seven locations along each wedge casting. The samples were ground to approximately 15
µm using silicon carbide paper with a grit size of 500. After grinding, the samples were then
polished with diamond and finished with alumina suspension to approximately 0.04 µm
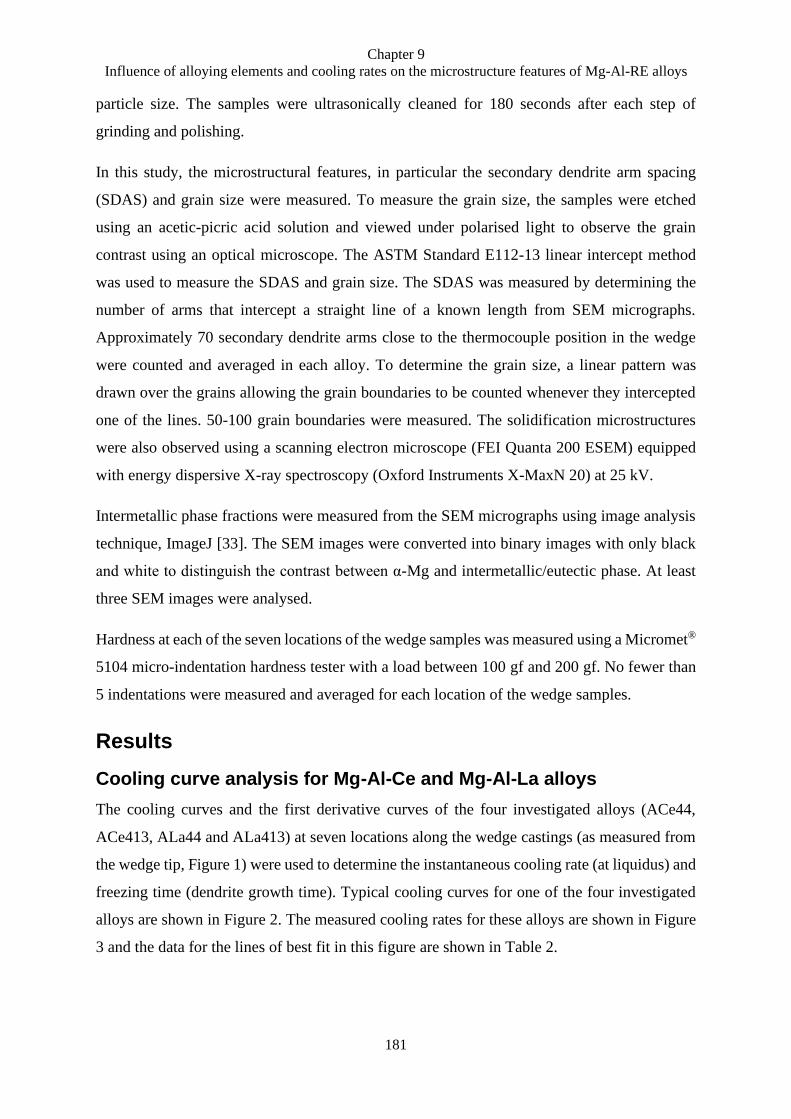
Chapter 9
Influence of alloying elements and cooling rates on the microstructure features of Mg-Al-RE alloys
181
particle size. The samples were ultrasonically cleaned for 180 seconds after each step of
grinding and polishing.
In this study, the microstructural features, in particular the secondary dendrite arm spacing
(SDAS) and grain size were measured. To measure the grain size, the samples were etched
using an acetic-picric acid solution and viewed under polarised light to observe the grain
contrast using an optical microscope. The ASTM Standard E112-13 linear intercept method
was used to measure the SDAS and grain size. The SDAS was measured by determining the
number of arms that intercept a straight line of a known length from SEM micrographs.
Approximately 70 secondary dendrite arms close to the thermocouple position in the wedge
were counted and averaged in each alloy. To determine the grain size, a linear pattern was
drawn over the grains allowing the grain boundaries to be counted whenever they intercepted
one of the lines. 50-100 grain boundaries were measured. The solidification microstructures
were also observed using a scanning electron microscope (FEI Quanta 200 ESEM) equipped
with energy dispersive X-ray spectroscopy (Oxford Instruments X-MaxN 20) at 25 kV.
Intermetallic phase fractions were measured from the SEM micrographs using image analysis
technique, ImageJ [33]. The SEM images were converted into binary images with only black
and white to distinguish the contrast between α-Mg and intermetallic/eutectic phase. At least
three SEM images were analysed.
Hardness at each of the seven locations of the wedge samples was measured using a Micromet®
5104 micro-indentation hardness tester with a load between 100 gf and 200 gf. No fewer than
5 indentations were measured and averaged for each location of the wedge samples.
Results
Cooling curve analysis for Mg-Al-Ce and Mg-Al-La alloys
The cooling curves and the first derivative curves of the four investigated alloys (ACe44,
ACe413, ALa44 and ALa413) at seven locations along the wedge castings (as measured from
the wedge tip, Figure 1) were used to determine the instantaneous cooling rate (at liquidus) and
freezing time (dendrite growth time). Typical cooling curves for one of the four investigated
alloys are shown in Figure 2. The measured cooling rates for these alloys are shown in Figure
3 and the data for the lines of best fit in this figure are shown in Table 2.
Chapter 9
Influence of alloying elements and cooling rates on the microstructure features of Mg-Al-RE alloys
182
It is worth noting that the first derivative curves improve the accuracy of determining
characteristic points of a solidification process, such as the start and end of a process that may
be difficult to observe directly from the cooling curves. Hence, the first derivatives of the
cooling curves were employed to aid with determining the cooling rates in this study.
Figure 2 Cooling curves at different locations along the wedge cast, as measured from the wedge tip, for
ALa413. Thermocouple location 1 is located at 10 mm, location 2 is at 30 mm, location 3 is at 70 mm, location
4 is at 90 mm, location 5 is at 115 mm, location 6 is at 150 mm and lastly location 7 is at 165 mm, measured
from the tip of the wedge cast.
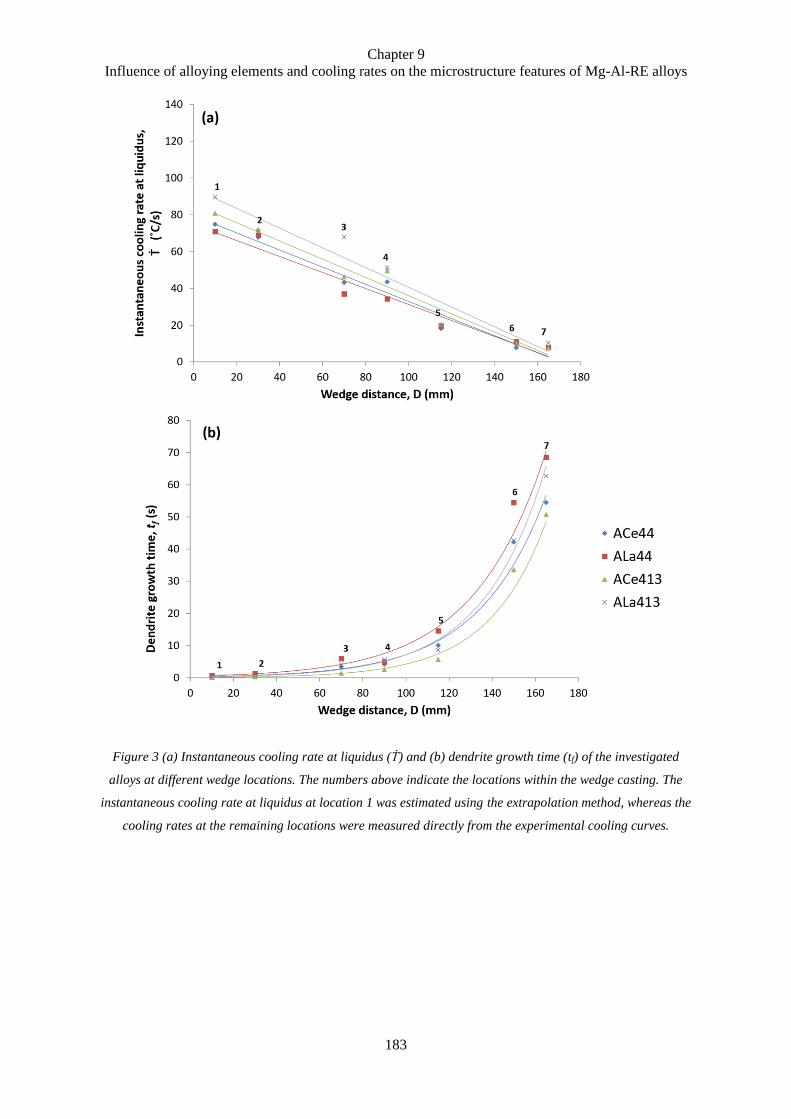
Chapter 9
Influence of alloying elements and cooling rates on the microstructure features of Mg-Al-RE alloys
183
Figure 3 (a) Instantaneous cooling rate at liquidus (Ṫ) and (b) dendrite growth time (tf) of the investigated
alloys at different wedge locations. The numbers above indicate the locations within the wedge casting. The
instantaneous cooling rate at liquidus at location 1 was estimated using the extrapolation method, whereas the
cooling rates at the remaining locations were measured directly from the experimental cooling curves.
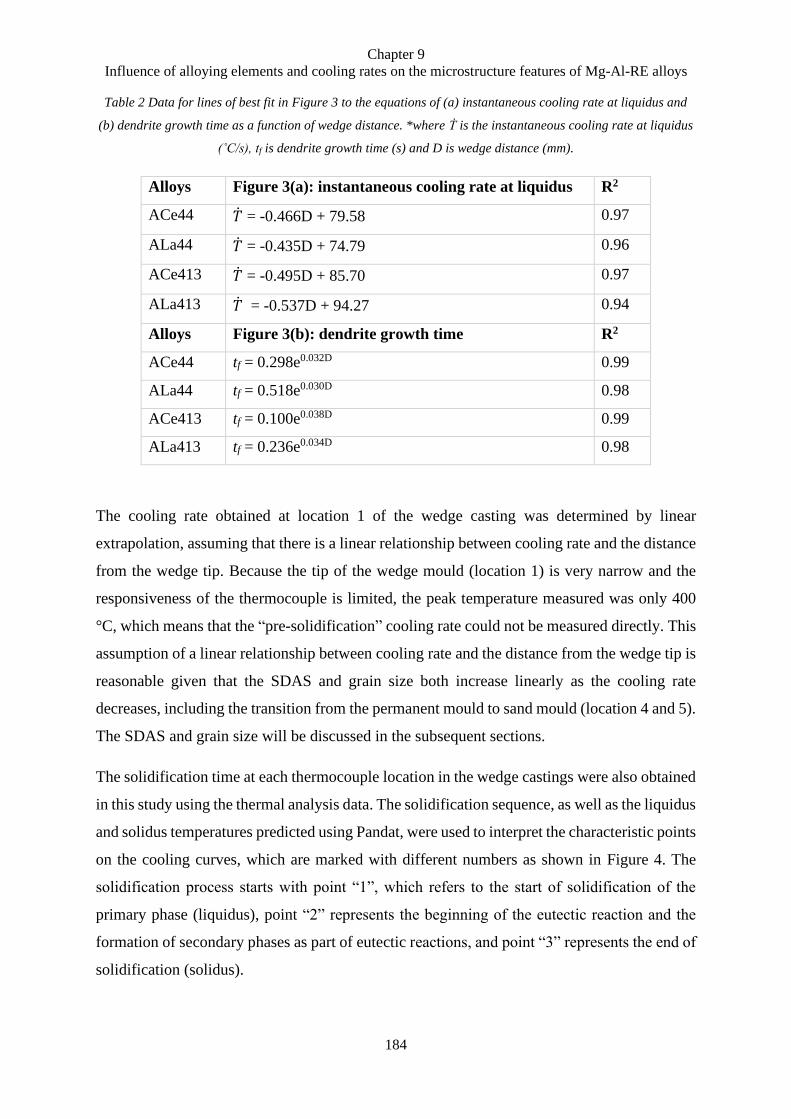
Chapter 9
Influence of alloying elements and cooling rates on the microstructure features of Mg-Al-RE alloys
184
Table 2 Data for lines of best fit in Figure 3 to the equations of (a) instantaneous cooling rate at liquidus and
(b) dendrite growth time as a function of wedge distance. *where Ṫ is the instantaneous cooling rate at liquidus
(˚C/s), tf is dendrite growth time (s) and D is wedge distance (mm).
Alloys Figure 3(a): instantaneous cooling rate at liquidus R2
ACe44 = -0.466D + 79.58 0.97
ALa44 = -0.435D + 74.79 0.96
ACe413 = -0.495D + 85.70 0.97
ALa413 = -0.537D + 94.27 0.94
Alloys Figure 3(b): dendrite growth time R2
ACe44 tf = 0.298e0.032D 0.99
ALa44 tf = 0.518e0.030D 0.98
ACe413 tf = 0.100e0.038D 0.99
ALa413 tf = 0.236e0.034D 0.98
The cooling rate obtained at location 1 of the wedge casting was determined by linear
extrapolation, assuming that there is a linear relationship between cooling rate and the distance
from the wedge tip. Because the tip of the wedge mould (location 1) is very narrow and the
responsiveness of the thermocouple is limited, the peak temperature measured was only 400
°C, which means that the “pre-solidification” cooling rate could not be measured directly. This
assumption of a linear relationship between cooling rate and the distance from the wedge tip is
reasonable given that the SDAS and grain size both increase linearly as the cooling rate
decreases, including the transition from the permanent mould to sand mould (location 4 and 5).
The SDAS and grain size will be discussed in the subsequent sections.
The solidification time at each thermocouple location in the wedge castings were also obtained
in this study using the thermal analysis data. The solidification sequence, as well as the liquidus
and solidus temperatures predicted using Pandat, were used to interpret the characteristic points
on the cooling curves, which are marked with different numbers as shown in Figure 4. The
solidification process starts with point “1”, which refers to the start of solidification of the
primary phase (liquidus), point “2” represents the beginning of the eutectic reaction and the
formation of secondary phases as part of eutectic reactions, and point “3” represents the end of
solidification (solidus).
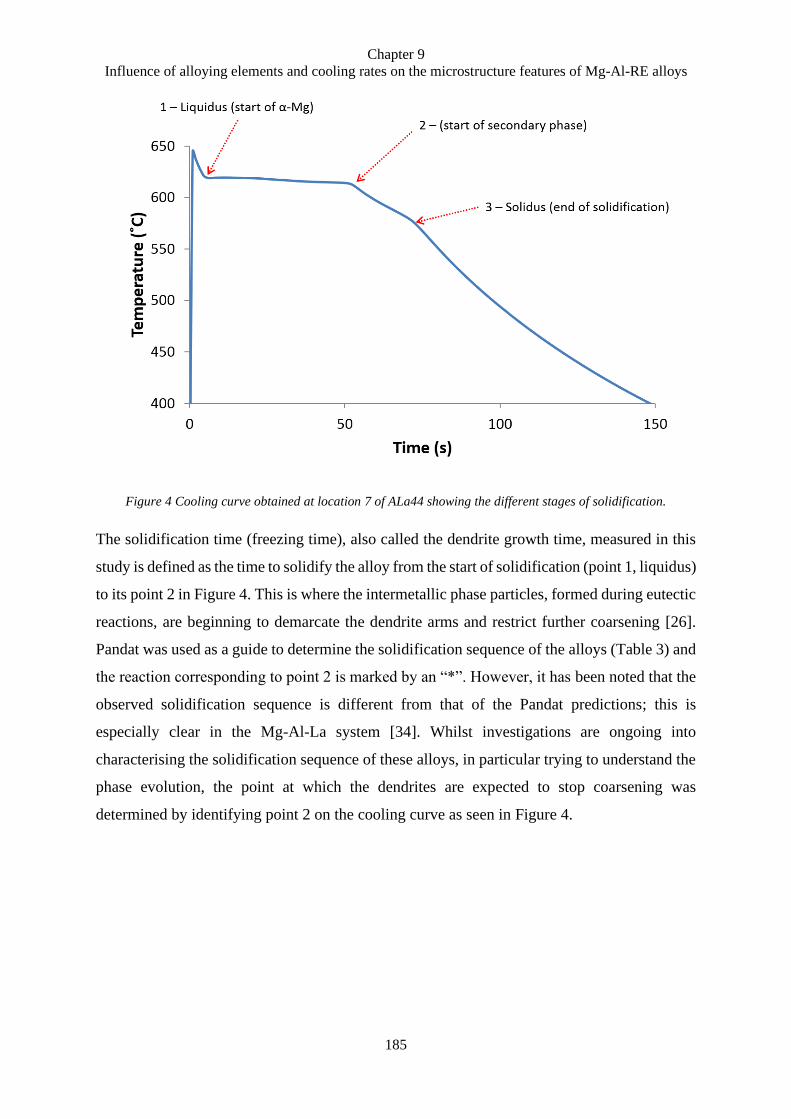
Chapter 9
Influence of alloying elements and cooling rates on the microstructure features of Mg-Al-RE alloys
185
Figure 4 Cooling curve obtained at location 7 of ALa44 showing the different stages of solidification.
The solidification time (freezing time), also called the dendrite growth time, measured in this
study is defined as the time to solidify the alloy from the start of solidification (point 1, liquidus)
to its point 2 in Figure 4. This is where the intermetallic phase particles, formed during eutectic
reactions, are beginning to demarcate the dendrite arms and restrict further coarsening [26].
Pandat was used as a guide to determine the solidification sequence of the alloys (Table 3) and
the reaction corresponding to point 2 is marked by an “*”. However, it has been noted that the
observed solidification sequence is different from that of the Pandat predictions; this is
especially clear in the Mg-Al-La system [34]. Whilst investigations are ongoing into
characterising the solidification sequence of these alloys, in particular trying to understand the
phase evolution, the point at which the dendrites are expected to stop coarsening was
determined by identifying point 2 on the cooling curve as seen in Figure 4.
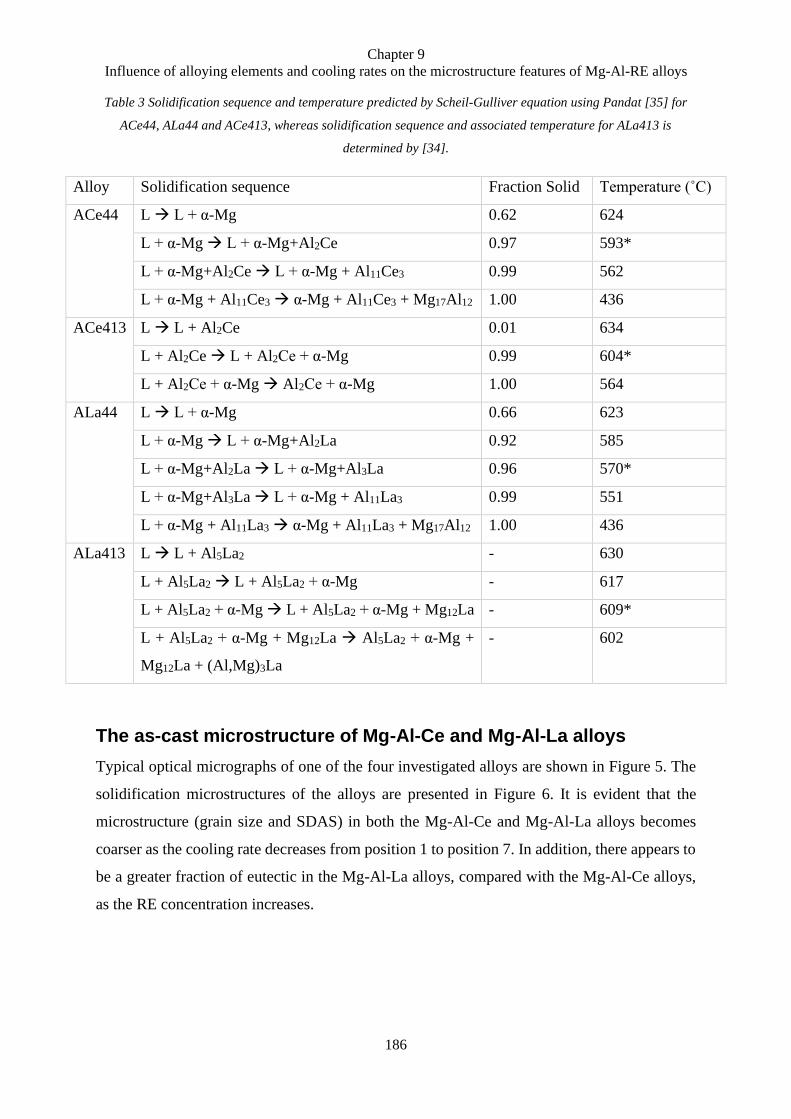
Chapter 9
Influence of alloying elements and cooling rates on the microstructure features of Mg-Al-RE alloys
186
Table 3 Solidification sequence and temperature predicted by Scheil-Gulliver equation using Pandat [35] for
ACe44, ALa44 and ACe413, whereas solidification sequence and associated temperature for ALa413 is
determined by [34].
Alloy Solidification sequence Fraction Solid Temperature (˚C)
ACe44 L → L + α-Mg 0.62 624
L + α-Mg → L + α-Mg+Al2Ce 0.97 593*
L + α-Mg+Al2Ce → L + α-Mg + Al11Ce3 0.99 562
L + α-Mg + Al11Ce3 → α-Mg + Al11Ce3 + Mg17Al12 1.00 436
ACe413 L → L + Al2Ce 0.01 634
L + Al2Ce → L + Al2Ce + α-Mg 0.99 604*
L + Al2Ce + α-Mg → Al2Ce + α-Mg 1.00 564
ALa44 L → L + α-Mg 0.66 623
L + α-Mg → L + α-Mg+Al2La 0.92 585
L + α-Mg+Al2La → L + α-Mg+Al3La 0.96 570*
L + α-Mg+Al3La → L + α-Mg + Al11La3 0.99 551
L + α-Mg + Al11La3 → α-Mg + Al11La3 + Mg17Al12 1.00 436
ALa413 L → L + Al5La2 - 630
L + Al5La2 → L + Al5La2 + α-Mg - 617
L + Al5La2 + α-Mg → L + Al5La2 + α-Mg + Mg12La - 609*
L + Al5La2 + α-Mg + Mg12La → Al5La2 + α-Mg +
Mg12La + (Al,Mg)3La
- 602
The as-cast microstructure of Mg-Al-Ce and Mg-Al-La alloys
Typical optical micrographs of one of the four investigated alloys are shown in Figure 5. The
solidification microstructures of the alloys are presented in Figure 6. It is evident that the
microstructure (grain size and SDAS) in both the Mg-Al-Ce and Mg-Al-La alloys becomes
coarser as the cooling rate decreases from position 1 to position 7. In addition, there appears to
be a greater fraction of eutectic in the Mg-Al-La alloys, compared with the Mg-Al-Ce alloys,
as the RE concentration increases.

Chapter 9
Influence of alloying elements and cooling rates on the microstructure features of Mg-Al-RE alloys
187
Figure 5 Optical images of ACe44 at location (a) 2, (b) 3, (c) 4, (d) 5, (e) 6 and (f) 7, used for grain size
measurement.
Figure 6 SEM images of (a) ACe44, (b) ACe413, (C) ALa44 and (d) ALa413 at different cooling rates along the
wedge cast sample.
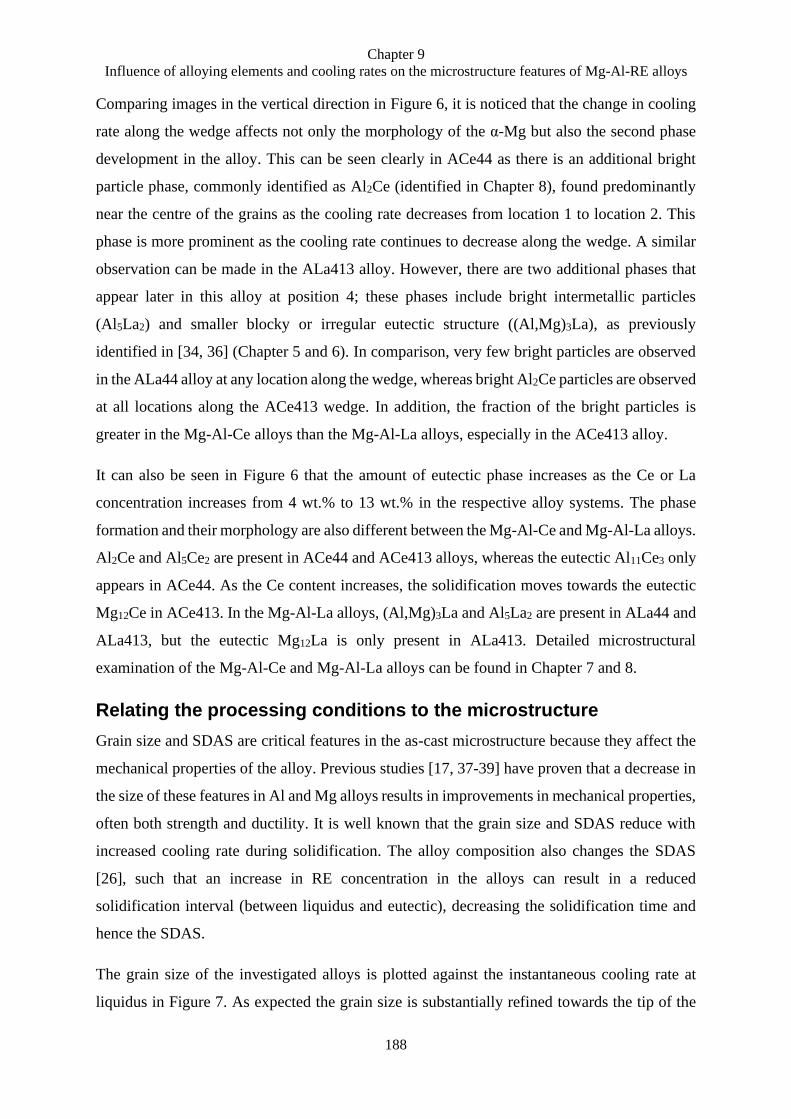
Chapter 9
Influence of alloying elements and cooling rates on the microstructure features of Mg-Al-RE alloys
188
Comparing images in the vertical direction in Figure 6, it is noticed that the change in cooling
rate along the wedge affects not only the morphology of the α-Mg but also the second phase
development in the alloy. This can be seen clearly in ACe44 as there is an additional bright
particle phase, commonly identified as Al2Ce (identified in Chapter 8), found predominantly
near the centre of the grains as the cooling rate decreases from location 1 to location 2. This
phase is more prominent as the cooling rate continues to decrease along the wedge. A similar
observation can be made in the ALa413 alloy. However, there are two additional phases that
appear later in this alloy at position 4; these phases include bright intermetallic particles
(Al5La2) and smaller blocky or irregular eutectic structure ((Al,Mg)3La), as previously
identified in [34, 36] (Chapter 5 and 6). In comparison, very few bright particles are observed
in the ALa44 alloy at any location along the wedge, whereas bright Al2Ce particles are observed
at all locations along the ACe413 wedge. In addition, the fraction of the bright particles is
greater in the Mg-Al-Ce alloys than the Mg-Al-La alloys, especially in the ACe413 alloy.
It can also be seen in Figure 6 that the amount of eutectic phase increases as the Ce or La
concentration increases from 4 wt.% to 13 wt.% in the respective alloy systems. The phase
formation and their morphology are also different between the Mg-Al-Ce and Mg-Al-La alloys.
Al2Ce and Al5Ce2 are present in ACe44 and ACe413 alloys, whereas the eutectic Al11Ce3 only
appears in ACe44. As the Ce content increases, the solidification moves towards the eutectic
Mg12Ce in ACe413. In the Mg-Al-La alloys, (Al,Mg)3La and Al5La2 are present in ALa44 and
ALa413, but the eutectic Mg12La is only present in ALa413. Detailed microstructural
examination of the Mg-Al-Ce and Mg-Al-La alloys can be found in Chapter 7 and 8.
Relating the processing conditions to the microstructure
Grain size and SDAS are critical features in the as-cast microstructure because they affect the
mechanical properties of the alloy. Previous studies [17, 37-39] have proven that a decrease in
the size of these features in Al and Mg alloys results in improvements in mechanical properties,
often both strength and ductility. It is well known that the grain size and SDAS reduce with
increased cooling rate during solidification. The alloy composition also changes the SDAS
[26], such that an increase in RE concentration in the alloys can result in a reduced
solidification interval (between liquidus and eutectic), decreasing the solidification time and
hence the SDAS.
The grain size of the investigated alloys is plotted against the instantaneous cooling rate at
liquidus in Figure 7. As expected the grain size is substantially refined towards the tip of the
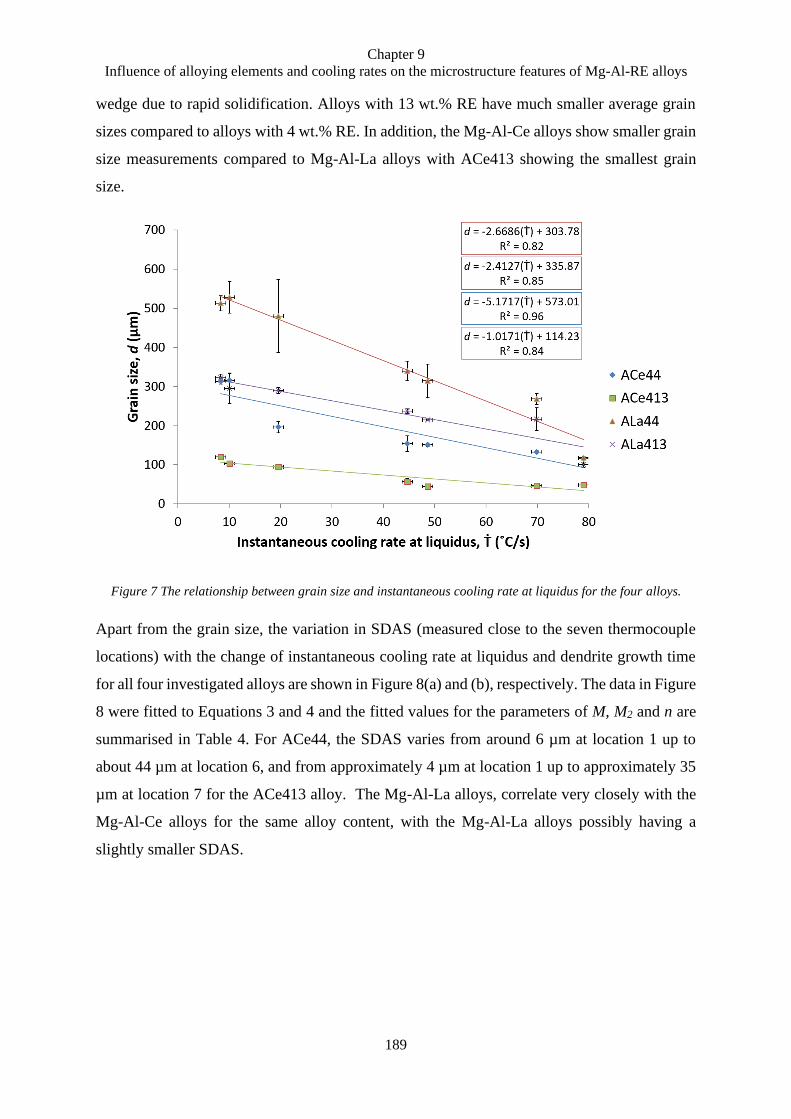
Chapter 9
Influence of alloying elements and cooling rates on the microstructure features of Mg-Al-RE alloys
189
wedge due to rapid solidification. Alloys with 13 wt.% RE have much smaller average grain
sizes compared to alloys with 4 wt.% RE. In addition, the Mg-Al-Ce alloys show smaller grain
size measurements compared to Mg-Al-La alloys with ACe413 showing the smallest grain
size.
Figure 7 The relationship between grain size and instantaneous cooling rate at liquidus for the four alloys.
Apart from the grain size, the variation in SDAS (measured close to the seven thermocouple
locations) with the change of instantaneous cooling rate at liquidus and dendrite growth time
for all four investigated alloys are shown in Figure 8(a) and (b), respectively. The data in Figure
8 were fitted to Equations 3 and 4 and the fitted values for the parameters of M, M2 and n are
summarised in Table 4. For ACe44, the SDAS varies from around 6 µm at location 1 up to
about 44 µm at location 6, and from approximately 4 µm at location 1 up to approximately 35
µm at location 7 for the ACe413 alloy. The Mg-Al-La alloys, correlate very closely with the
Mg-Al-Ce alloys for the same alloy content, with the Mg-Al-La alloys possibly having a
slightly smaller SDAS.
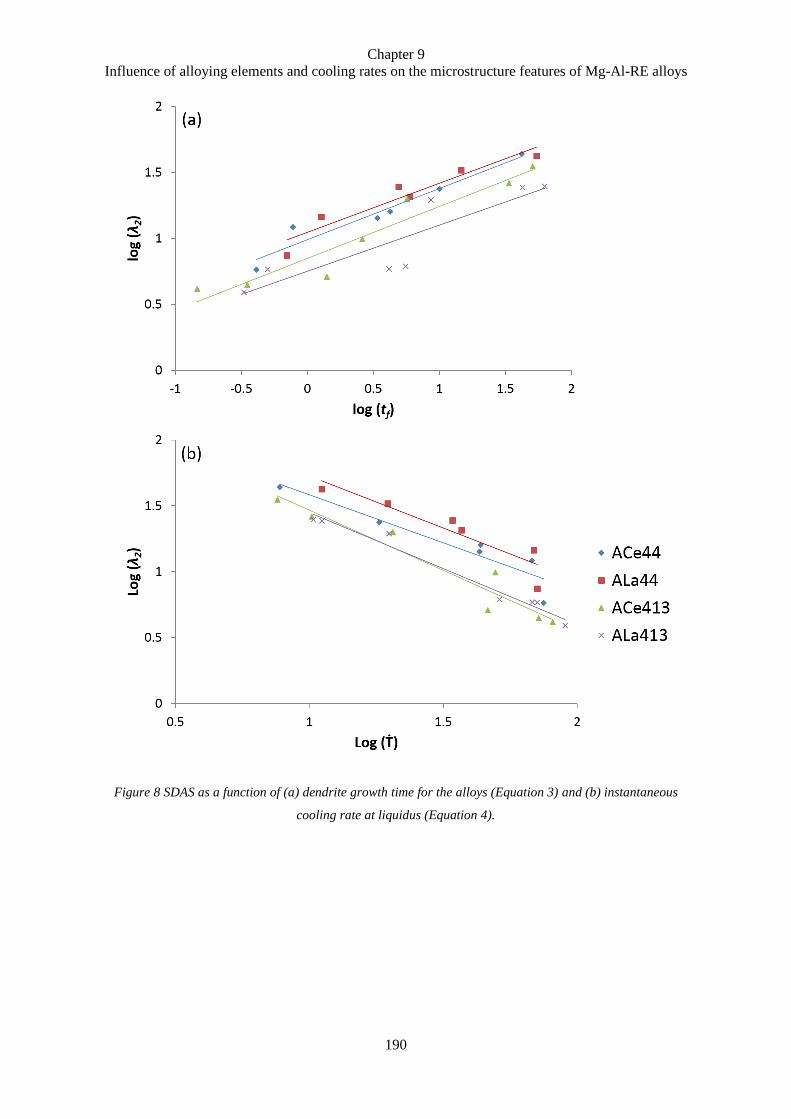
Chapter 9
Influence of alloying elements and cooling rates on the microstructure features of Mg-Al-RE alloys
190
Figure 8 SDAS as a function of (a) dendrite growth time for the alloys (Equation 3) and (b) instantaneous
cooling rate at liquidus (Equation 4).
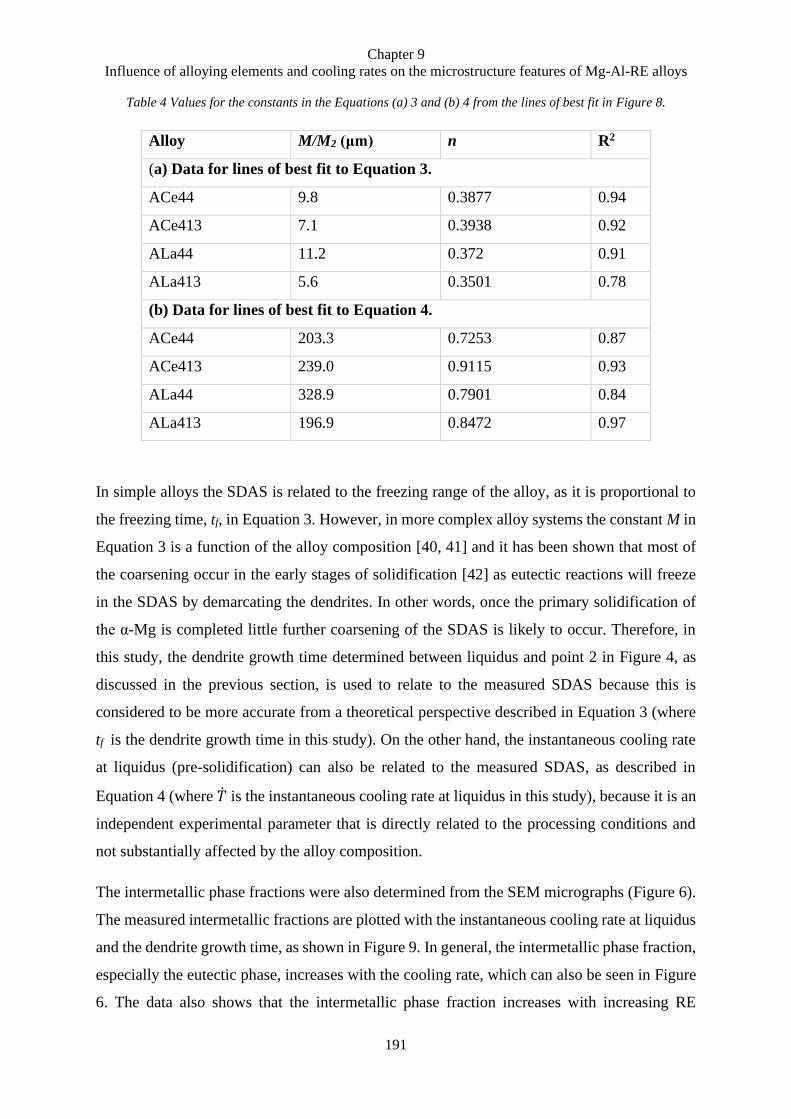
Chapter 9
Influence of alloying elements and cooling rates on the microstructure features of Mg-Al-RE alloys
191
Table 4 Values for the constants in the Equations (a) 3 and (b) 4 from the lines of best fit in Figure 8.
Alloy M/M2 (μm) n R2
(a) Data for lines of best fit to Equation 3.
ACe44 9.8 0.3877 0.94
ACe413 7.1 0.3938 0.92
ALa44 11.2 0.372 0.91
ALa413 5.6 0.3501 0.78
(b) Data for lines of best fit to Equation 4.
ACe44 203.3 0.7253 0.87
ACe413 239.0 0.9115 0.93
ALa44 328.9 0.7901 0.84
ALa413 196.9 0.8472 0.97
In simple alloys the SDAS is related to the freezing range of the alloy, as it is proportional to
the freezing time, tf, in Equation 3. However, in more complex alloy systems the constant M in
Equation 3 is a function of the alloy composition [40, 41] and it has been shown that most of
the coarsening occur in the early stages of solidification [42] as eutectic reactions will freeze
in the SDAS by demarcating the dendrites. In other words, once the primary solidification of
the α-Mg is completed little further coarsening of the SDAS is likely to occur. Therefore, in
this study, the dendrite growth time determined between liquidus and point 2 in Figure 4, as
discussed in the previous section, is used to relate to the measured SDAS because this is
considered to be more accurate from a theoretical perspective described in Equation 3 (where
tf is the dendrite growth time in this study). On the other hand, the instantaneous cooling rate
at liquidus (pre-solidification) can also be related to the measured SDAS, as described in
Equation 4 (where is the instantaneous cooling rate at liquidus in this study), because it is an
independent experimental parameter that is directly related to the processing conditions and
not substantially affected by the alloy composition.
The intermetallic phase fractions were also determined from the SEM micrographs (Figure 6).
The measured intermetallic fractions are plotted with the instantaneous cooling rate at liquidus
and the dendrite growth time, as shown in Figure 9. In general, the intermetallic phase fraction,
especially the eutectic phase, increases with the cooling rate, which can also be seen in Figure
6. The data also shows that the intermetallic phase fraction increases with increasing RE
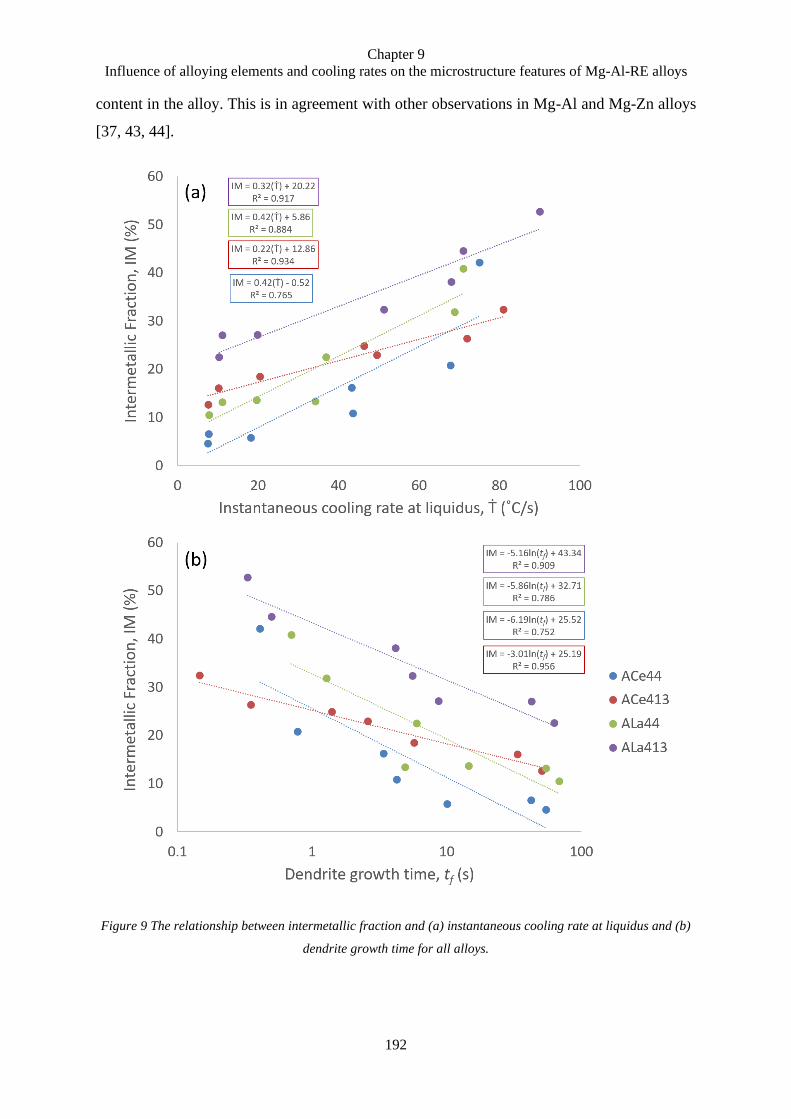
Chapter 9
Influence of alloying elements and cooling rates on the microstructure features of Mg-Al-RE alloys
192
content in the alloy. This is in agreement with other observations in Mg-Al and Mg-Zn alloys
[37, 43, 44].
Figure 9 The relationship between intermetallic fraction and (a) instantaneous cooling rate at liquidus and (b)
dendrite growth time for all alloys.
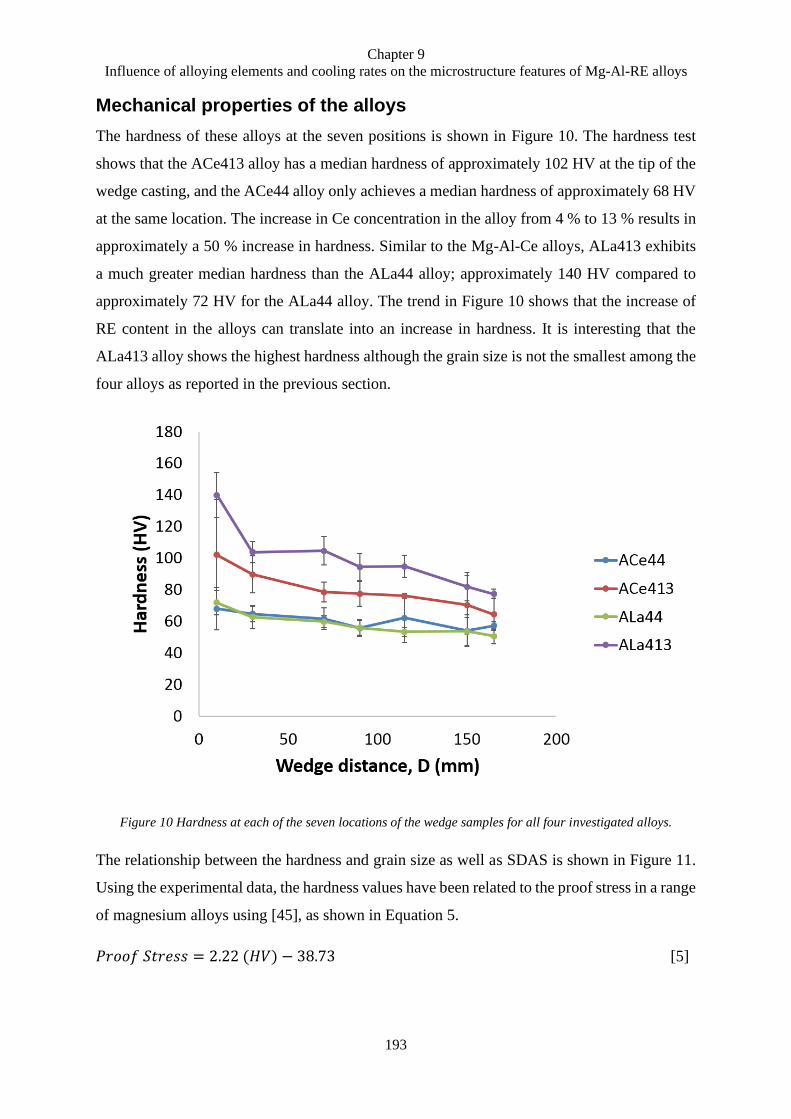
Chapter 9
Influence of alloying elements and cooling rates on the microstructure features of Mg-Al-RE alloys
193
Mechanical properties of the alloys
The hardness of these alloys at the seven positions is shown in Figure 10. The hardness test
shows that the ACe413 alloy has a median hardness of approximately 102 HV at the tip of the
wedge casting, and the ACe44 alloy only achieves a median hardness of approximately 68 HV
at the same location. The increase in Ce concentration in the alloy from 4 % to 13 % results in
approximately a 50 % increase in hardness. Similar to the Mg-Al-Ce alloys, ALa413 exhibits
a much greater median hardness than the ALa44 alloy; approximately 140 HV compared to
approximately 72 HV for the ALa44 alloy. The trend in Figure 10 shows that the increase of
RE content in the alloys can translate into an increase in hardness. It is interesting that the
ALa413 alloy shows the highest hardness although the grain size is not the smallest among the
four alloys as reported in the previous section.
Figure 10 Hardness at each of the seven locations of the wedge samples for all four investigated alloys.
The relationship between the hardness and grain size as well as SDAS is shown in Figure 11.
Using the experimental data, the hardness values have been related to the proof stress in a range
of magnesium alloys using [45], as shown in Equation 5.
𝑃𝑟𝑜𝑜𝑓 𝑆𝑡𝑟𝑒𝑠𝑠 = 2.22 (𝐻𝑉) − 38.73 [5]
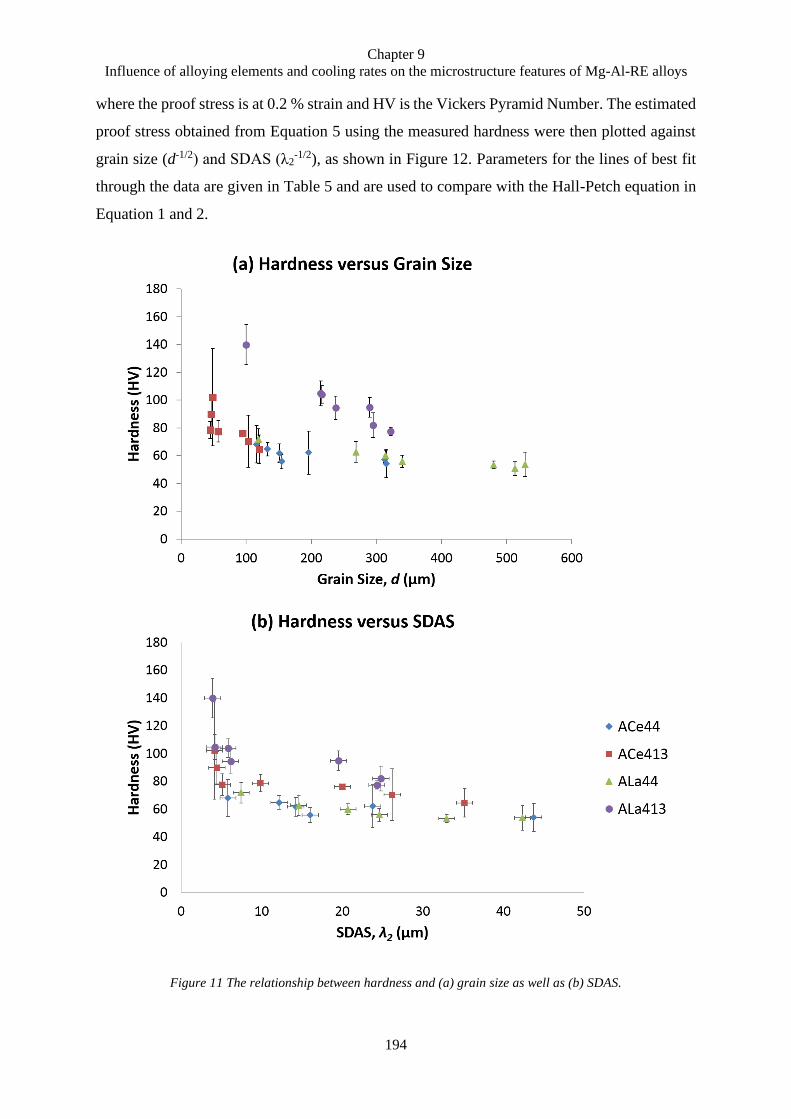
Chapter 9
Influence of alloying elements and cooling rates on the microstructure features of Mg-Al-RE alloys
194
where the proof stress is at 0.2 % strain and HV is the Vickers Pyramid Number. The estimated
proof stress obtained from Equation 5 using the measured hardness were then plotted against
grain size (d-1/2) and SDAS (λ2-1/2), as shown in Figure 12. Parameters for the lines of best fit
through the data are given in Table 5 and are used to compare with the Hall-Petch equation in
Equation 1 and 2.
Figure 11 The relationship between hardness and (a) grain size as well as (b) SDAS.
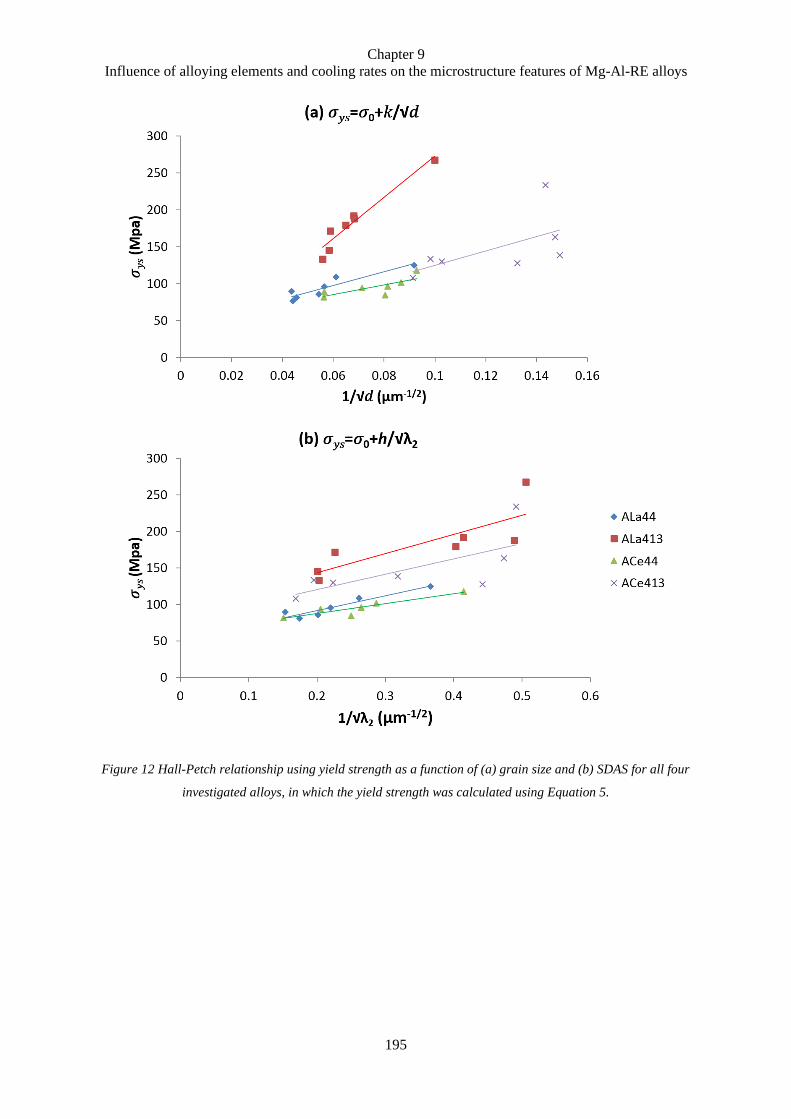
Chapter 9
Influence of alloying elements and cooling rates on the microstructure features of Mg-Al-RE alloys
195
Figure 12 Hall-Petch relationship using yield strength as a function of (a) grain size and (b) SDAS for all four
investigated alloys, in which the yield strength was calculated using Equation 5.
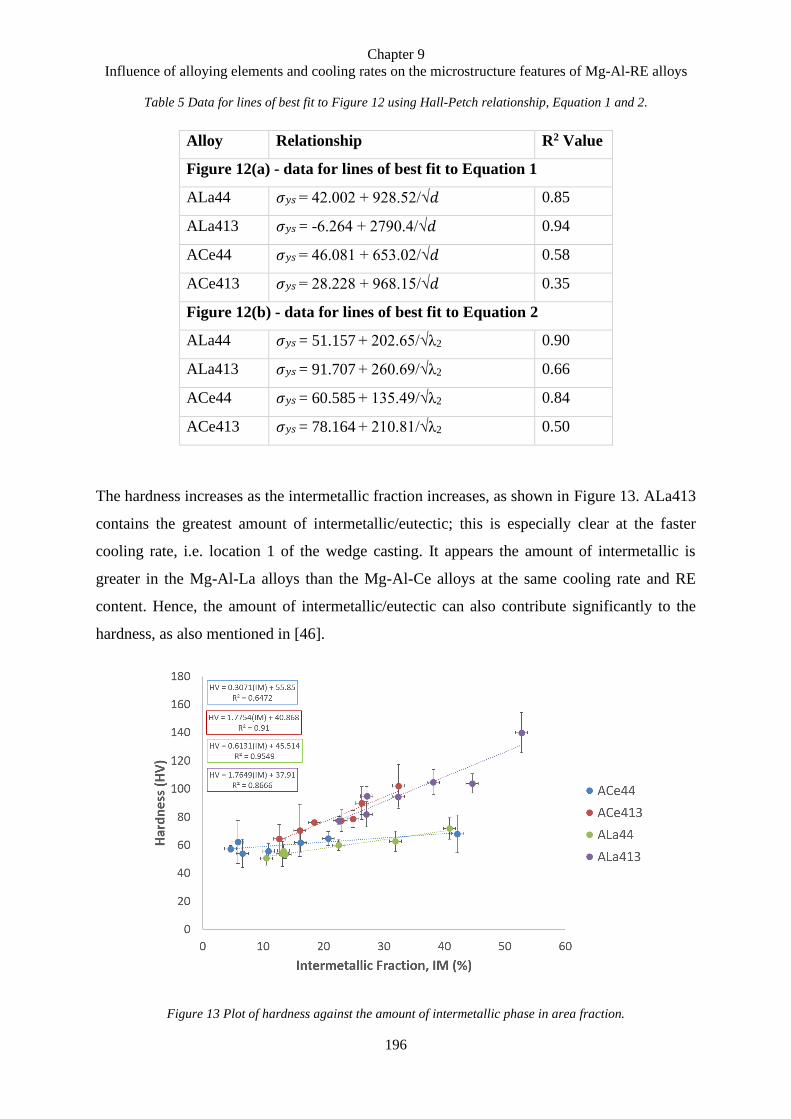
Chapter 9
Influence of alloying elements and cooling rates on the microstructure features of Mg-Al-RE alloys
196
Table 5 Data for lines of best fit to Figure 12 using Hall-Petch relationship, Equation 1 and 2.
Alloy Relationship R2 Value
Figure 12(a) - data for lines of best fit to Equation 1
ALa44 𝜎𝑦𝑠 = 42.002 + 928.52/√𝑑 0.85
ALa413 𝜎𝑦𝑠 = -6.264 + 2790.4/√𝑑 0.94
ACe44 𝜎𝑦𝑠 = 46.081 + 653.02/√𝑑 0.58
ACe413 𝜎𝑦𝑠 = 28.228 + 968.15/√𝑑 0.35
Figure 12(b) - data for lines of best fit to Equation 2
ALa44 𝜎𝑦𝑠 = 51.157 + 202.65/√λ2 0.90
ALa413 𝜎𝑦𝑠 = 91.707 + 260.69/√λ2 0.66
ACe44 𝜎𝑦𝑠 = 60.585 + 135.49/√λ2 0.84
ACe413 𝜎𝑦𝑠 = 78.164 + 210.81/√λ2 0.50
The hardness increases as the intermetallic fraction increases, as shown in Figure 13. ALa413
contains the greatest amount of intermetallic/eutectic; this is especially clear at the faster
cooling rate, i.e. location 1 of the wedge casting. It appears the amount of intermetallic is
greater in the Mg-Al-La alloys than the Mg-Al-Ce alloys at the same cooling rate and RE
content. Hence, the amount of intermetallic/eutectic can also contribute significantly to the
hardness, as also mentioned in [46].
Figure 13 Plot of hardness against the amount of intermetallic phase in area fraction.
Chapter 9
Influence of alloying elements and cooling rates on the microstructure features of Mg-Al-RE alloys
197
Discussion
Effect of alloying content and cooling rate on the microstructure
The microstructure features, in particular the grain size and SDAS, vary significantly with the
change in cooling rate and alloying concentration. The grain size at the same position is smaller
for the Ce-containing alloys than the La-containing alloys. This is likely to be related to the
nucleant potency of the polyhedral intermetallic particles, often identified as Al2Ce in the Mg-
Al-Ce alloys and Al5La2 in the Mg-Al-La alloys [34]. Al2Ce particles have been identified as
potent nucleants for magnesium grains previously [18, 47, 48], whereas the Al5La2 particles
are less potent for magnesium grains [34]. Hence the grain size in the Mg-Al-Ce alloys is
comparatively finer than that observed in Mg-Al-La alloys under similar solidification
conditions [34].
The liquidus and solidus temperatures reduce as the cooling rate increases due to the kinetics
of diffusion in both the liquid and solid [49, 50]. This facilitates an increased number density
of intermetallic particles, such as Al2Ce, with increasing cooling rate [51]. This can be seen in
Figure 5 and Figure 6, with ACe413 clearly showing a high number density of bright Al2Ce
particles. As these particles act as active nucleants for magnesium grains, the grain size
decreases as a result of the increasing number of active nucleants at high cooling rates.
The observations in this study also indicate that the SDAS is not affected much by the selection
of individual RE alloying elements for the same cooling rate; however the SDAS is finer when
the RE alloying content increases from 4 wt.% to 13 wt.%. This is because the high RE content
alloys (ACe413 and ALa413) are hyper-eutectic as discussed in Chapters 4 [47], 6 [34] and 8,
the freezing range for the formation of α-Mg for these alloys is reduced, reducing the time for
SDAS coarsening.
On the other hand, the refinement of SDAS at higher cooling rates is evident in this study.
SDAS is often influenced by coarsening phenomena, which is controlled by the constitutional
supercooling and diffusion time [26]. The increase in constitutional supercooling due to high
cooling rates generates more secondary dendrite arms [52]. Furthermore at high cooling rates,
the solid-liquid interface moves faster [52, 53]. Hence, the coarsening of SDAS can be
restricted earlier by the enrichment of solute [26], during the solidification process. In addition,
the diffusion rate reduces as the cooling rate increases. This means the rate of solute segregation
is dependent on cooling rates. During the growth process, the composition at the dendritic
surface varies, which results in solute diffusion from high solubility to low solubility. This
Chapter 9
Influence of alloying elements and cooling rates on the microstructure features of Mg-Al-RE alloys
198
process also causes dissolution of finer dendritic arms and coarsens other dendritic arms.
During rapid cooling, diffusion is limited and hence SDAS is refined.
The relationship between SDAS and processing parameters, such as freezing time (dendrite
growth time) and the instantaneous cooling rate at liquidus for these alloys can be developed
using Equation 3 and 4. These equations in the logarithmic form are used to determine the M
and n values for these alloys. The n values obtained from Equation 3 using dendrite growth
time (Table 4(a)) falls within the expected range of 0.33 and 0.5 [26, 27]. However, the n values
obtained from Equation 4 using the instantaneous cooling rate at liquidus (Table 4(b)) are
above the expected range. Given that the n values are within the expected range using the
dendrite growth time, the relationship between the SDAS and dendrite growth time developed
in this study can be used as guidance for SDAS predictions for these alloys if the cooling
parameters are known. A summary of these equations is listed in Table 6.
Table 6 A summary of the relationship between SDAS and dendrite growth time (Equation 3) as well as the
instantaneous cooling rate at liquidus (Equation 4) for all alloys.
Type of alloys λ2 = Mtfn λ2 = M2Ṫ
-n
ACe44 λ2 = 9.8tf0.39 λ2 = 203.2-0.73
ACe413 λ2 = 7.1tf0.39 λ2 = 238.8-0.91
ALa44 λ2 = 11.2tf0.37 λ2 = 328.9-0.79
ALa413 λ2 = 5.6tf0.35 λ2 = 196.8-0.85
Effect of microstructure on alloy properties
It is concluded that the hardness at the tip of the wedge cast (location 1) is at its highest when
compared to any other part of the sample for the same RE composition. This is due to the fast
solidification rate at the tip of the wedge cast, leading to smaller average grain size and SDAS
as well as higher intermetallic fraction.
Previously, it has been mentioned that the Hall-Petch relationship is effective at predicting
yield stress, using both the SDAS and grain size for Mg alloys [54], this is in agreement with
this study given that the σ0, k and h values are positive as shown in Figure 12 and Table 5,
except the σ0 value obtained in the Hall-Petch relationship using the grain size in ALa413
results in a negative value, as shown in Figure 12(a). Hence, the Hall-Petch relationship
Chapter 9
Influence of alloying elements and cooling rates on the microstructure features of Mg-Al-RE alloys
199
developed in this study can be used as guidance in yield stress predictions specifically for these
alloys. A summary of the relationship equations is listed in Table 7.
Table 7 A summary of the Hall-Petch relationship between yield stress and (a) grain size, and (b) SDAS.
Alloys (a) 𝜎 = 𝜎0 + 𝑘𝑑−1/2 (b) 𝜎 = 𝜎0 + ℎ𝜆2−1/2
ACe44 𝜎 = 46.081 + 653.02𝑑−1/2 𝜎 = 60.585 + 135.49𝜆2−1/2
ACe413 𝜎 = 28.228 + 968.15𝑑−1/2 𝜎 = 78.164 + 210.81𝜆2−1/2
ALa44 𝜎 = 42.002 + 928.52𝑑−1/2 𝜎 = 51.157 + 202.65𝜆2−1/2
ALa413 𝜎 = −6.264 + 2790.4𝑑−1/2 𝜎 = 91.707 + 260.69𝜆2−1/2
The yield stress obtained using the microstructure-property relationships in Table 7(a) for
ACe44 and ALa44 at the tip of the wedge (location 1) are 107 MPa and 127 MPa, respectively.
Whereas, the yield stress obtained from the equations in Table 7(b) for ACe44 and ALa44 at
the tip of the wedge are 117 MPa and 125 MPa, respectively. These calculated values are
compared with [55], in which the HPDC ACe44 has a yield strength of 129 MPa and HPDC
ALa44 has a yield strength of 134 MPa. Because the microstructure from HPDC is similar to
those at the tip of the wedge gravity casting, location 1 is considered to be the more accurate
position for comparison. Compared to the yield strength in [55], the estimated yield stress using
the equations developed in this study is within 20 % for the ACe44 and 10 % for the ALa44.
Although the grain size in ACe413 is smaller than that in the ALa413 alloy, as mentioned in
the results section, it is interesting that the ALa413 alloy has the highest hardness among the
four alloys as observed in Figure 12. The Hall-Petch relationship can predict the strength of
ALa44, ACe44 and ACe413 alloys in which smaller grain size leads to higher hardness and
yield stress. However, ALa413 alloy does not follow this trend given in that it does not have
the smallest grain size, but it has the highest hardness among the four alloys.
This observation can be explained by a large amount of eutectic in ALa413 (Figure 9). In
addition, the area fractions of grains available in this alloy are relatively lower than other alloys
due to the high volume of the eutectic. The high volume of eutectic, smaller eutectic spacing
and lower number of grains in the ALa413 alloy can all be factors that are impacting on the
hardness. In this study, it is believed that the grain size is the main influence on the hardness
for ACe44, ACe413 and ALa44 alloys, although there are other factors, such as the SDAS,
eutectic volume fraction and eutectic spacing, involved. However, the observation of the
Chapter 9
Influence of alloying elements and cooling rates on the microstructure features of Mg-Al-RE alloys
200
microstructure and the hardness in ALa413 alloy could further support the fact that the
intermetallic fraction and SDAS have greater contributions to the hardness in this alloy.
Other than the mentioned possibilities, the k value in the Hall-Petch relationship (Equation 1)
is also influenced by many other factors, which in turn impact on the yield stress and hardness
properties. These factors include processing conditions and loading direction, which is
ultimately related to deformation modes in Mg alloys [56]. The value of k is also affected by
other boundary parameters [57] including temperature, but there is little work done on this.
Conclusions
The effects of RE alloying and cooling rate on microstructure features and mechanical
properties of the ALa44, ALa413, ACe44 and ACe413 alloys were investigated. The results
are summarised as follows:
• The cooling rate has a significant effect on the grain size, SDAS and intermetallic
fraction, hence affecting the hardness and yield strength of the alloys. As expected, it
was found that the hardness increases as the grain size and SDAS decreases, and
intermetallic fraction increases at the higher cooling rate.
• The yield strength of the ACe44, ACe413 and ALa44 alloys behave in a manner
consistent with the Hall-Petch relationship, in which a smaller grain size leads to higher
hardness and yield strength. Whereas, ALa413 alloy behaved differently. The ALa413
alloy has the highest hardness, but the grain size is not the finest among all the
investigated alloys. It was found that the hardness in this alloy is mainly dominated by
the SDAS and intermetallic fraction given that this alloy has the lowest SDAS and the
highest amount of intermetallic.
• Processing-microstructure-property relationships are developed for the investigated
alloys. In particular,
a. The relationship between dendrite growth time and SDAS using the commonly
used empirical equation for SDAS.
b. The relationship between the instantaneous cooling rate at liquidus and SDAS
modified from the commonly used empirical equation for SDAS.
c. Hall-Petch relationship between yield stress and grain size.
d. Hall-Petch relationship between yield stress and SDAS.

Chapter 9
Influence of alloying elements and cooling rates on the microstructure features of Mg-Al-RE alloys
201
Using the relationships developed in this study, microstructure features and yield stress at a
given cooling rate for the ACe44, ACe413, ALa44 and ALa413 alloys can be predicted.
Acknowledgement
This study was supported by an ARC linkage project with grant number LP130100828. The
authors would like to thank RMMF and CSIRO for the sample preparation facilities used in a
series of experiments presented in this paper. In addition, the authors wish to acknowledge Dr.
Aaron Seeber, Mr. Andrew Yob and Mr. Gary Savage for their time in providing useful advice
and information.
Chapter 9
Influence of alloying elements and cooling rates on the microstructure features of Mg-Al-RE alloys
202
References
1. A. Boby, U. Pillai, B. Pillai and B. Pai, Developments in magnesium alloys for transport
applications — an overview. Indian Foundry Journal, 2011. 57(1): p. 30.
2. R.S. Beals et al., Magnesium global development: outcomes from the TMS 2007 annual
meeting. The Journal of The Minerals & Materials Society (TMS), 2007. 59(8): p. 39-
42.
3. A.A. Luo, Recent magnesium alloy development for elevated temperature applications.
International Materials Reviews, 2004. 49(1): p. 13-30.
4. M. Easton et al., The application of magnesium alloys to the lightweighting of
automotive structures, in Sustainable automotive technologies 2012: proceedings of the
4th international conference. 2012, Springer Berlin Heidelberg: Berlin, Heidelberg. p.
17-23.
5. K.N. Braszczyńska-Malik and E. Przełożyńska, Microstructure of Mg–Al–RE-type
exerimental magnesium alloy gravity cast into sand mould. Archives of Foundry
Engineering, 2016. 16(2): p. 115-118.
6. M.S. Dargusch, S.M. Zhu, J.F. Nie and G.L. Dunlop, Microstructural analysis of the
improved creep resistance of a die-cast magnesium–aluminium–rare earth alloy by
strontium additions. Scripta Materialia, 2009. 60(2): p. 116-119.
7. J.H. Zhang, M. Zhang, J. Meng, R. Wu and D.X. Tang, Microstructures and mechanical
properties of heat-resistant high-pressure die-cast Mg–4Al–xLa–0.3 Mn (x= 1, 2, 4, 6)
alloys. Materials Science and Engineering: A, 2010. 527(10): p. 2527-2537.
8. A. Żydek, J. Kamieniak and K.N. Braszczyńska-Malik, Evolution of Mg-5Al-0.4 Mn
microstructure after rare earth elements addition. Archives of Foundry Engineering,
2011. 11(2): p. 157-160.
Chapter 9
Influence of alloying elements and cooling rates on the microstructure features of Mg-Al-RE alloys
203
9. M. Pekguleryuz and M. Celikin, Creep resistance in magnesium alloys. International
Materials Reviews, 2010. 55(4): p. 197-217.
10. T. Abbott, Development of new magnesium die casting alloys. World Magnesium
Conference 2017, 2017.
11. J.H. Zhang et al., Microstructure, tensile properties, and creep behavior of high-pressure
die-cast Mg–4Al–4RE–0.4 Mn (RE= La, Ce) alloys. Journal of Materials Science,
2009. 44(8): p. 2046-2054.
12. J.H. Zhang et al., Microstructures and mechanical properties of heat-resistant HPDC
Mg–4Al-based alloys containing cheap misch metal. Materials Science and
Engineering: A, 2011. 528(6): p. 2670-2677.
13. J.H. Zhang, Z. Leng, M. Zhang, J. Meng and R. Wu, Effect of Ce on microstructure,
mechanical properties and corrosion behavior of high-pressure die-cast Mg–4Al-based
alloy. Journal of Alloys and Compounds, 2011. 509(3): p. 1069-1078.
14. A.A. Luo, Magnesium casting technology for structural applications. Journal of
Magnesium and Alloys, 2013. 1(1): p. 2-22.
15. B. Pourbahari, H. Mirzadeh and M. Emamy, Toward unraveling the effects of
intermetallic compounds on the microstructure and mechanical properties of Mg–Gd–
Al–Zn magnesium alloys in the as-cast, homogenized, and extruded conditions.
Materials Science and Engineering: A, 2017. 680: p. 39-46.
16. S. Pang et al., Effect of cooling rate on the microstructure and mechanical properties of
sand-casting Mg–10Gd–3Y–0.5 Zr magnesium alloy. Materials Science and
Engineering: A, 2013. 562: p. 152-160.
17. M. Paliwal and I.H. Jung, The evolution of the growth morphology in Mg–Al alloys
depending on the cooling rate during solidification. Acta Materialia, 2013. 61(13): p.
4848-4860.
Chapter 9
Influence of alloying elements and cooling rates on the microstructure features of Mg-Al-RE alloys
204
18. Z.T. Jiang, B. Jiang, Y. Zeng, J.H. Dai and F.S. Pan, Role of Al modification on the
microstructure and mechanical properties of as-cast Mg–6Ce alloys. Materials Science
and Engineering: A, 2015. 645: p. 57-64.
19. C.H. Caceres, C.J. Davidson, J.R. Griffiths and C.L. Newton, Effects of solidification
rate and ageing on the microstructure and mechanical properties of AZ91 alloy.
Materials Science and Engineering: A, 2002. 325(1): p. 344-355.
20. A. Jain, O. Duygulu, D.W. Brown, C.N. Tomé and S.R. Agnew, Grain size effects on
the tensile properties and deformation mechanisms of a magnesium alloy, AZ31B,
sheet. Materials Science and Engineering: A, 2008. 486(1-2): p. 545-555.
21. J.C. Dai et al., Effects of cooling rate and solute content on the grain refinement of Mg-
Gd-Y alloys by aluminum. Metallurgical and Materials Transactions A, 2014. 45(10):
p. 4665-4678.
22. M.A. Easton and D.H. StJohn, Improved prediction of the grain size of aluminum alloys
that includes the effect of cooling rate. Materials Science and Engineering: A, 2008.
486(1–2): p. 8-13.
23. N.J. Petch, The cleavage strength of polycrystals. Journal of the Iron and Steel Institute,
1953. 174: p. 25-28.
24. C. Do Lee and K.S. Shin, Effects of precipitate and dendrite arm spacing on tensile
properties and fracture behavior of As-Cast magnesium-aluminum alloys. Metals and
Materials International, 2003. 9(1): p. 21-27.
25. E. Ghassemali, M. Riestra, T. Bogdanoff, B.S. Kumar and S. Seifeddine, Hall-Petch
equation in a hypoeutectic Al-Si cast alloy: grain size vs. secondary dendrite arm
spacing. Procedia Engineering, 2017. 207: p. 19-24.
26. M. Easton, C. Davidson and D. St John, Effect of alloy composition on the dendrite arm
spacing of multicomponent aluminum alloys. Metallurgical and Materials Transactions
A, 2010. 41(6): p. 1528-1538.
Chapter 9
Influence of alloying elements and cooling rates on the microstructure features of Mg-Al-RE alloys
205
27. K. Fisher and W. Kurz, Fundamentals of solidification. Trans Tech Publications, 1986.
28. M. Bamberger, B.Z. Weiss and M.M. Stupel, Heat flow and dendritic arm spacing in
chill-cast Al–Si alloys. Materials Science and Technology, 1987. 3(1): p. 49-56.
29. K.P. Young and D.H. Kerkwood, The dendrite arm spacings of aluminum-copper alloys
solidified under steady-state conditions. Metallurgical Transactions A, 1975. 6(1): p.
197-205.
30. L. Backenrud, E. Krol and J. Tamminem, Solidification characteristics of aluminium
alloys. 1986, Wrought Alloys.
31. S.M. Liang, R.S. Chen, J.J. Blandin, M. Suery and E.H. Han, Thermal analysis and
solidification pathways of Mg–Al–Ca system alloys. Materials Science and
Engineering: A, 2008. 480(1-2): p. 365-372.
32. D. Emadi, L.V. Whiting, S. Nafisi and R. Ghomashchi, Applications of thermal analysis
in quality control of solidification processes. Journal of Thermal Analysis and
Calorimetry, 2005. 81(1): p. 235-242.
33. M.D. Abràmoff, P.J. Magalhães and S.J. Ram, Image processing with ImageJ.
Biophotonics International, 2004. 11(7): p. 36-42.
34. C. Wong et al., Solidification path and microstructure evolution of Mg-3Al-14La alloy:
Implications for the Mg-rich corner of the Mg-Al-La phase diagram. Journal of Alloys
and Compounds, 2019.
35. CompuTherm, Pandat software and PanMagnesium 2018 thermodynamic database,
Madison, Editor.
36. C. Wong et al., (Al, Mg)3La: a new phase in the Mg–Al–La system. Acta
Crystallographica Section B: Structural Science, Crystal Engineering and Materials,
2018. 74(4): p. 370-375.
Chapter 9
Influence of alloying elements and cooling rates on the microstructure features of Mg-Al-RE alloys
206
37. M. Paliwal and I.H. Jung, Microstructural evolution in Mg–Zn alloys during
solidification: an experimental and simulation study. Journal of Crystal Growth, 2014.
394: p. 28-38.
38. M. Paliwal, D.H. Kang, E. Essadiqi and I.H. Jung, The evolution of as-cast
microstructure of ternary Mg-Al-Zn alloys: an experimental and modeling study.
Metallurgical and Materials Transactions A, 2014. 45(8): p. 3596-3608.
39. D.H. StJohn, M. Qian, M.A. Easton, P. Cao and Z. Hildebrand, Grain refinement of
magnesium alloys. Metallurgical and Materials Transactions A, 2005. 36(7): p. 1669-
1679.
40. M. Rappaz, A. Jacot and W.J. Boettinger, Last-stage solidification of alloys: theoretical
model of dendrite-arm and grain coalescence. Metallurgical and Materials Transactions
A, 2003. 34(3): p. 467-479.
41. M. Rappaz and W.J. Boettinger, On dendritic solidification of multicomponent alloys
with unequal liquid diffusion coefficients. Acta Materialia, 1999. 47(11): p. 3205-3219.
42. M. Easton, C. Davidson and D. StJohn, Grain morphology of as-cast wrought
aluminium alloys. Materials Transactions, 2011. 52(5): p. 842-847.
43. M. Paliwal, D.H. Kang, E. Essadiqi and I.H. Jung, Variations of microsegregation and
second phase fraction of binary Mg-Al alloys with solidification parameters.
Metallurgical and Materials Transactions A, 2014. 45(8): p. 3308-3320.
44. A. Dev and M. Paliwal, Influence of solute elements (Sn and Al) on microstructure
evolution of Mg alloys: an experimental and simulation study. Journal of Crystal
Growth, 2018. 503: p. 28-35.
45. T. Abbott, Heat Treating of magnesium alloys, in Heat Treating of Nonferrous Alloys,
G.E. Totten, Editor. 2016, ASM International.
Chapter 9
Influence of alloying elements and cooling rates on the microstructure features of Mg-Al-RE alloys
207
46. T.L. Chia et al., The effect of alloy composition on the microstructure and tensile
properties of binary Mg-rare earth alloys. Journal of Intermetallics, 2009. 17(7): p. 481-
490.
47. C. Wong et al. Experimental study of the solidification microstructure in the Mg-rich
corner of Mg–Al–Ce system. in TMS Annual Meeting & Exhibition. 2018. Springer.
48. D. Qiu and M.X. Zhang, The nucleation crystallography and wettability of Mg grains
on active Al2Y inoculants in an Mg–10 wt% Y alloy. Journal of Alloys and
Compounds, 2014. 586: p. 39-44.
49. M.H. Ghoncheh, S.G. Shabestari and M.H. Abbasi, Effect of cooling rate on the
microstructure and solidification characteristics of Al2024 alloy using computer-aided
thermal analysis technique. Journal of Thermal Analysis and Calorimetry, 2014.
117(3): p. 1253-1261.
50. S. Gowri and F.H. Samuel, Effect of cooling rate on the solidification. Metallurgical
Transactions A, 1992. 23(1): p. 3369-3376.
51. E. Guo, L. Wang, Y.C. Feng, L.P. Wang and Y.H. Chen, Effect of cooling rate on the
microstructure and solidification parameters of Mg–3Al–3Nd alloy. Journal of Thermal
Analysis and Calorimetry, 2019. 135(4): p. 2001-2008.
52. V.A. Hosseini, S.G. Shabestari and R. Gholizadeh, Study on the effect of cooling rate
on the solidification parameters, microstructure, and mechanical properties of LM13
alloy using cooling curve thermal analysis technique. Materials & Design, 2013. 50: p.
7-14.
53. S.G. Shabestari and M. Malekan, Thermal analysis study of the effect of the cooling
rate on the microstructure and solidification parameters of 319 aluminum alloy.
Canadian Metallurgical Quarterly, 2005. 44(3): p. 305-312.
54. P. Sharifi, Structure-property relationships of magnesium alloys. 2012, The University
of Western Ontario.
Chapter 9
Influence of alloying elements and cooling rates on the microstructure features of Mg-Al-RE alloys
208
55. S. Zhu, M.A. Easton, T.B. Abbott, M.A. Gibson and J.F. Nie, The influence of
individual rare earth elements (La, Ce, or Nd) on creep resistance of die‐cast magnesium
alloy AE44. Advanced Engineering Materials, 2016. 18(6): p. 932-937.
56. H.H. Yu, Y.C. Xin, M.Y. Wang and Q. Liu, Hall-Petch relationship in Mg alloys: a
review. Journal of Materials Science & Technology, 2018. 34(2): p. 248-256.
57. J.W. Wyrzykowski and M.W. Grabski, The Hall–Petch relation in aluminium and its
dependence on the grain boundary structure. Philosophical Magazine A, 1986. 53(4):
p. 505-520.

Chapter 10 Conclusions
209
Chapter 10
Conclusions and Recommendations
Chapter 10 Conclusions
210
10 Chapter 10: Conclusions
10.1 Concluding remarks
Magnesium alloys have become increasingly attractive for use in transport applications due to
their low density and high specific strength [1, 2]. This is especially beneficial for vehicle
weight reductions and hence improved fuel efficiency. The commonly used magnesium alloys,
such as AZ91, AM60 and AM50, tend to suffer from poor creep resistance, which limits their
use in high-temperature applications. In comparison, AE alloys are found to have improved
creep resistance properties [3, 4], however, the associated knowledge of the microstructure
formation and how this affects properties is limited. This can hinder the design and optimisation
of AE alloys for commercial applications. Therefore, this research was motivated by the
increasing interest in magnesium alloys, especially AE alloys for use in elevated temperature
applications in the automotive industry.
Although the AE series of alloys have been the subject of several previous studies, the majority
of microstructural investigations have assumed that most RE elements in the mischmetal (i.e.
Ce, La, Nd and Pr) behave similarly, producing the same set of intermetallic phases. An
example of this is that the thermodynamic database for the Mg-Al-Ce and Mg-Al-La systems
draws extensively on the same information. Furthermore, the prediction and control of
microstructure formation under non-equilibrium solidification conditions remains a challenge
in alloy design. This study set out to understand the microstructure development and
solidification behaviour in AE alloys through investigating the effects of different ternary rare
earth alloying additions (i.e. La or Ce) and cooling rates during the solidification process, using
both experimental and thermodynamic calculation techniques. The key points of investigation
in this thesis can be summarised as below.
• Identification of the intermetallic phases that are present in Mg-Al-Ce and Mg-Al-La
alloys, in particular the identification of phases which have not been reported
previously. In addition, whether or not the intermetallic phases are the same in Mg-Al-
Ce and Mg-Al-La alloys has also been investigated. (Chapters 5, 7 and 8)
• Greater understanding of the solidification sequence of the alloys, including the
formation of primary phases, and the determination of whether the alloys are hypo- or
hyper-eutectic. The current experimental data is also compared and contrasted to that
of the most recent thermodynamic predictions. (Chapters 4 and 6)
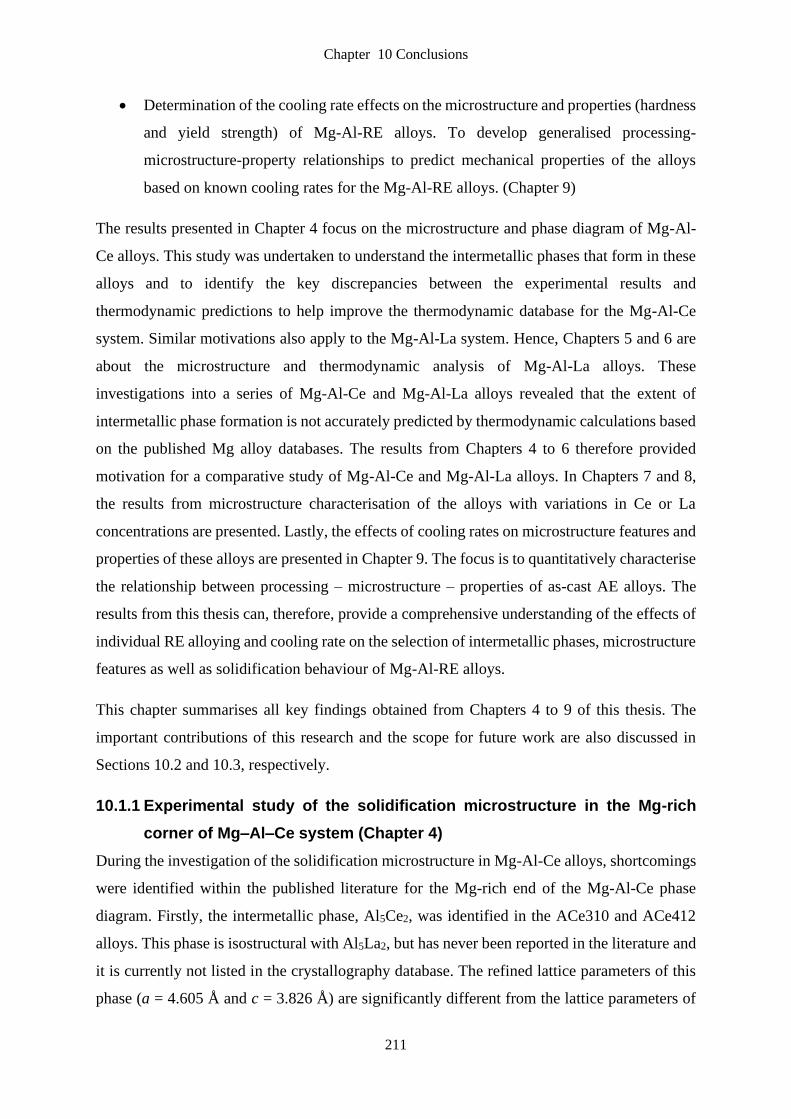
Chapter 10 Conclusions
211
• Determination of the cooling rate effects on the microstructure and properties (hardness
and yield strength) of Mg-Al-RE alloys. To develop generalised processing-
microstructure-property relationships to predict mechanical properties of the alloys
based on known cooling rates for the Mg-Al-RE alloys. (Chapter 9)
The results presented in Chapter 4 focus on the microstructure and phase diagram of Mg-Al-
Ce alloys. This study was undertaken to understand the intermetallic phases that form in these
alloys and to identify the key discrepancies between the experimental results and
thermodynamic predictions to help improve the thermodynamic database for the Mg-Al-Ce
system. Similar motivations also apply to the Mg-Al-La system. Hence, Chapters 5 and 6 are
about the microstructure and thermodynamic analysis of Mg-Al-La alloys. These
investigations into a series of Mg-Al-Ce and Mg-Al-La alloys revealed that the extent of
intermetallic phase formation is not accurately predicted by thermodynamic calculations based
on the published Mg alloy databases. The results from Chapters 4 to 6 therefore provided
motivation for a comparative study of Mg-Al-Ce and Mg-Al-La alloys. In Chapters 7 and 8,
the results from microstructure characterisation of the alloys with variations in Ce or La
concentrations are presented. Lastly, the effects of cooling rates on microstructure features and
properties of these alloys are presented in Chapter 9. The focus is to quantitatively characterise
the relationship between processing – microstructure – properties of as-cast AE alloys. The
results from this thesis can, therefore, provide a comprehensive understanding of the effects of
individual RE alloying and cooling rate on the selection of intermetallic phases, microstructure
features as well as solidification behaviour of Mg-Al-RE alloys.
This chapter summarises all key findings obtained from Chapters 4 to 9 of this thesis. The
important contributions of this research and the scope for future work are also discussed in
Sections 10.2 and 10.3, respectively.
10.1.1 Experimental study of the solidification microstructure in the Mg-rich
corner of Mg–Al–Ce system (Chapter 4)
During the investigation of the solidification microstructure in Mg-Al-Ce alloys, shortcomings
were identified within the published literature for the Mg-rich end of the Mg-Al-Ce phase
diagram. Firstly, the intermetallic phase, Al5Ce2, was identified in the ACe310 and ACe412
alloys. This phase is isostructural with Al5La2, but has never been reported in the literature and
it is currently not listed in the crystallography database. The refined lattice parameters of this
phase (a = 4.605 Å and c = 3.826 Å) are significantly different from the lattice parameters of
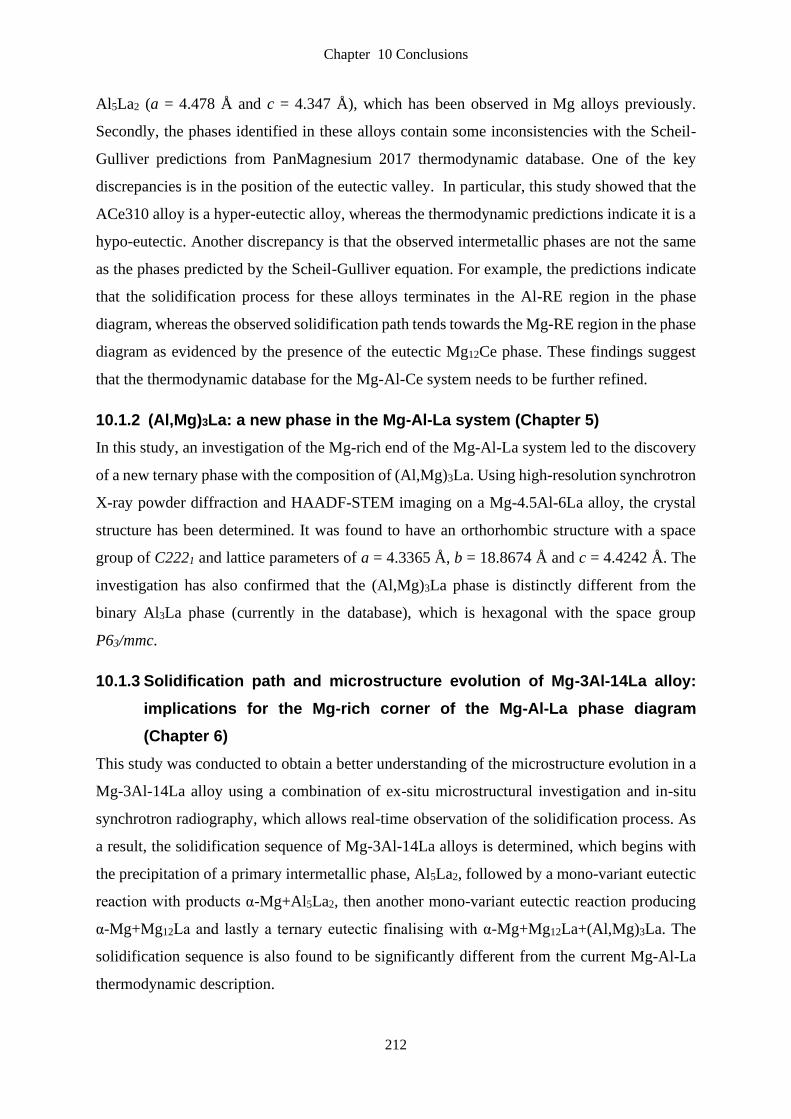
Chapter 10 Conclusions
212
Al5La2 (a = 4.478 Å and c = 4.347 Å), which has been observed in Mg alloys previously.
Secondly, the phases identified in these alloys contain some inconsistencies with the Scheil-
Gulliver predictions from PanMagnesium 2017 thermodynamic database. One of the key
discrepancies is in the position of the eutectic valley. In particular, this study showed that the
ACe310 alloy is a hyper-eutectic alloy, whereas the thermodynamic predictions indicate it is a
hypo-eutectic. Another discrepancy is that the observed intermetallic phases are not the same
as the phases predicted by the Scheil-Gulliver equation. For example, the predictions indicate
that the solidification process for these alloys terminates in the Al-RE region in the phase
diagram, whereas the observed solidification path tends towards the Mg-RE region in the phase
diagram as evidenced by the presence of the eutectic Mg12Ce phase. These findings suggest
that the thermodynamic database for the Mg-Al-Ce system needs to be further refined.
10.1.2 (Al,Mg)3La: a new phase in the Mg-Al-La system (Chapter 5)
In this study, an investigation of the Mg-rich end of the Mg-Al-La system led to the discovery
of a new ternary phase with the composition of (Al,Mg)3La. Using high-resolution synchrotron
X-ray powder diffraction and HAADF-STEM imaging on a Mg-4.5Al-6La alloy, the crystal
structure has been determined. It was found to have an orthorhombic structure with a space
group of C2221 and lattice parameters of a = 4.3365 Å, b = 18.8674 Å and c = 4.4242 Å. The
investigation has also confirmed that the (Al,Mg)3La phase is distinctly different from the
binary Al3La phase (currently in the database), which is hexagonal with the space group
P63/mmc.
10.1.3 Solidification path and microstructure evolution of Mg-3Al-14La alloy:
implications for the Mg-rich corner of the Mg-Al-La phase diagram
(Chapter 6)
This study was conducted to obtain a better understanding of the microstructure evolution in a
Mg-3Al-14La alloy using a combination of ex-situ microstructural investigation and in-situ
synchrotron radiography, which allows real-time observation of the solidification process. As
a result, the solidification sequence of Mg-3Al-14La alloys is determined, which begins with
the precipitation of a primary intermetallic phase, Al5La2, followed by a mono-variant eutectic
reaction with products α-Mg+Al5La2, then another mono-variant eutectic reaction producing
α-Mg+Mg12La and lastly a ternary eutectic finalising with α-Mg+Mg12La+(Al,Mg)3La. The
solidification sequence is also found to be significantly different from the current Mg-Al-La
thermodynamic description.
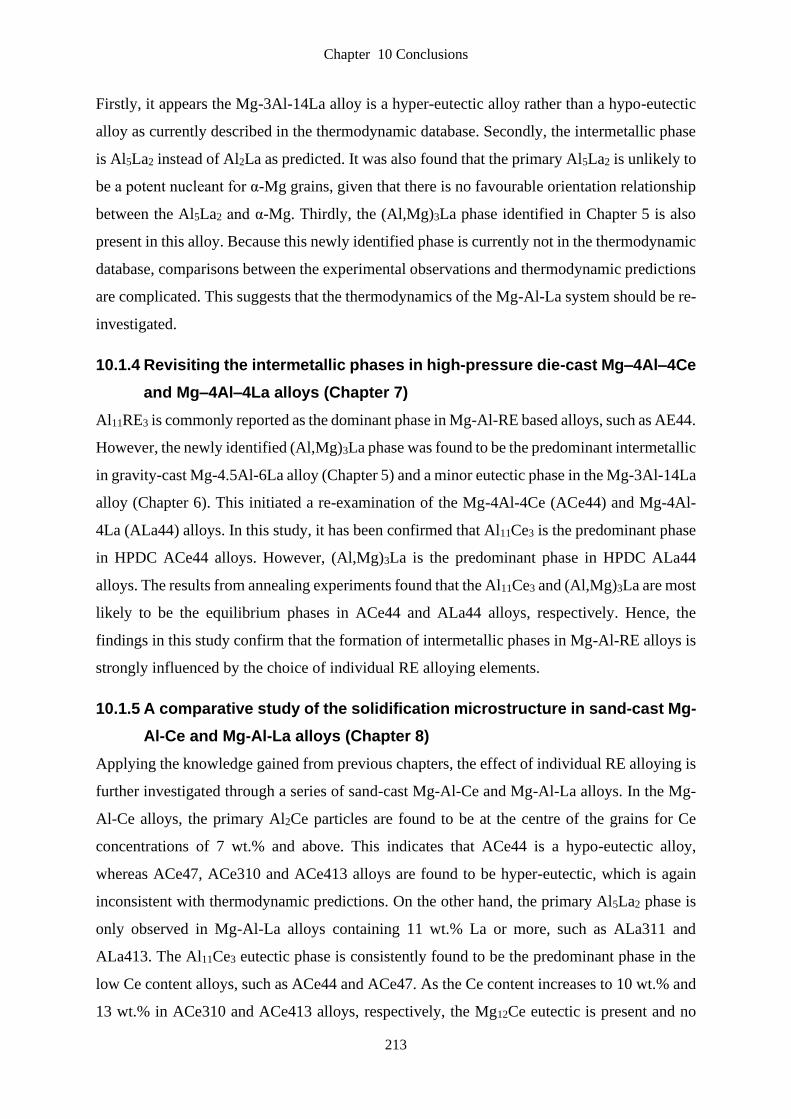
Chapter 10 Conclusions
213
Firstly, it appears the Mg-3Al-14La alloy is a hyper-eutectic alloy rather than a hypo-eutectic
alloy as currently described in the thermodynamic database. Secondly, the intermetallic phase
is Al5La2 instead of Al2La as predicted. It was also found that the primary Al5La2 is unlikely to
be a potent nucleant for α-Mg grains, given that there is no favourable orientation relationship
between the Al5La2 and α-Mg. Thirdly, the (Al,Mg)3La phase identified in Chapter 5 is also
present in this alloy. Because this newly identified phase is currently not in the thermodynamic
database, comparisons between the experimental observations and thermodynamic predictions
are complicated. This suggests that the thermodynamics of the Mg-Al-La system should be re-
investigated.
10.1.4 Revisiting the intermetallic phases in high-pressure die-cast Mg–4Al–4Ce
and Mg–4Al–4La alloys (Chapter 7)
Al11RE3 is commonly reported as the dominant phase in Mg-Al-RE based alloys, such as AE44.
However, the newly identified (Al,Mg)3La phase was found to be the predominant intermetallic
in gravity-cast Mg-4.5Al-6La alloy (Chapter 5) and a minor eutectic phase in the Mg-3Al-14La
alloy (Chapter 6). This initiated a re-examination of the Mg-4Al-4Ce (ACe44) and Mg-4Al-
4La (ALa44) alloys. In this study, it has been confirmed that Al11Ce3 is the predominant phase
in HPDC ACe44 alloys. However, (Al,Mg)3La is the predominant phase in HPDC ALa44
alloys. The results from annealing experiments found that the Al11Ce3 and (Al,Mg)3La are most
likely to be the equilibrium phases in ACe44 and ALa44 alloys, respectively. Hence, the
findings in this study confirm that the formation of intermetallic phases in Mg-Al-RE alloys is
strongly influenced by the choice of individual RE alloying elements.
10.1.5 A comparative study of the solidification microstructure in sand-cast Mg-
Al-Ce and Mg-Al-La alloys (Chapter 8)
Applying the knowledge gained from previous chapters, the effect of individual RE alloying is
further investigated through a series of sand-cast Mg-Al-Ce and Mg-Al-La alloys. In the Mg-
Al-Ce alloys, the primary Al2Ce particles are found to be at the centre of the grains for Ce
concentrations of 7 wt.% and above. This indicates that ACe44 is a hypo-eutectic alloy,
whereas ACe47, ACe310 and ACe413 alloys are found to be hyper-eutectic, which is again
inconsistent with thermodynamic predictions. On the other hand, the primary Al5La2 phase is
only observed in Mg-Al-La alloys containing 11 wt.% La or more, such as ALa311 and
ALa413. The Al11Ce3 eutectic phase is consistently found to be the predominant phase in the
low Ce content alloys, such as ACe44 and ACe47. As the Ce content increases to 10 wt.% and
13 wt.% in ACe310 and ACe413 alloys, respectively, the Mg12Ce eutectic is present and no
Chapter 10 Conclusions
214
evidence of Al11Ce3 is found in these alloys. In comparison, (Al,Mg)3La and Al5La2 eutectic
phases are extensively observed, regardless of the La concentration, in the Mg-Al-La alloys.
However, as the La concentration continues to increase, the Mg12La eutectic phase is also found
in ALa37, ALa311 and ALa413. In addition, a small amount of MgLa is found in the ALa413
alloy. There is no evidence of either Al11La3 or Al2La in these sand-cast Mg-Al-La alloys.
Mg17Al12 is observed in ACe44 and ALa44 only, and not in higher RE-containing alloys.
Again, the findings from this study have proven the intermetallic phase selection in the Mg-
Al-RE alloys is strongly affected by the choice of individual RE alloying elements.
10.1.6 Influence of alloying elements and cooling rates on the microstructure
features of Mg-Al-RE alloys (Chapter 9)
In this chapter, the effects of cooling rate on the solidification microstructure of Mg-Al-Ce and
Mg-Al-La alloys were investigated using a series of wedge-cast alloys. One of the key findings
in this study is that the secondary dendrite arms spacing (SDAS) and the grain size decreases
with increases in the RE content of the alloys. Secondly, although various microstructure
features affect the properties of the alloys, the yield strength of ACe44, ACe413 and ALa44
alloys are predominantly influenced by grain size as described using the Hall-Petch equation.
On the other hand, the yield strength of ALa413 is predominantly influenced by SDAS and
intermetallic phase fraction. Lastly, processing – microstructure – property relationships for
the investigated alloys have been developed, which can be used to predict microstructure
features and yield strength at a given cooling rate for these alloys. The following relationships
have been developed,
• The relationship between freezing time and SDAS using the commonly used empirical
equation for SDAS.
• The relationship between the pre-solidification cooling rate and SDAS modified from
the commonly used empirical equation for SDAS.
• Hall-Petch relationship between yield stress and grain size.
• Hall-Petch relationship between yield stress and SDAS.
10.2 Contributions to knowledge
The interdependence between processing conditions and microstructure is important because
it has a direct influence on the properties of the alloys. ICME tools, such as Pandat®, using the
CALPHAD method, are powerful in alloy design and optimisation. However, these tools will
only be useful if the predictions are accurate, which depends on a consistent thermodynamic
Chapter 10 Conclusions
215
database. In this research, a comprehensive experimental study combined with thermodynamic
calculations for high potential ternary Mg-Al-Ce and Mg-Al-La systems shows that the
thermodynamic database was found to be inconsistent between the actual observations and
predictions. First of all, the α-Mg phase field in the Mg-rich corner of the phase diagram was
found to be smaller than what is currently predicted in these systems. This influences the
solidification sequence of phases during the cooling process, especially in castings. In Mg-Al-
Ce system, it was found that the Al2Ce phase field is closer to the Mg-rich corner of the phase
diagram (Figure 10.1(a)). Whereas, the Al5La2 phase was found to be a stable phase within a
certain range of lanthanum concentrations, after which it becomes a metastable phase (this
phase can be viewed in the liquidus projection by suppressing the thermally stable Al2La phase
as shown in Figure 10.1(b) and (c)), and that the phase field of this phase is also closer to the
Mg-rich corner in the Mg-Al-La system (Figure 10.1(c)). In addition, a new (Al,Mg)3La phase
was found to be a thermally stable phase when annealed at 500 ˚C for 100 hours in the ALa44
alloy. This phase is currently not in the thermodynamic database, which will have a great effect
on the accuracy of thermodynamic predictions.
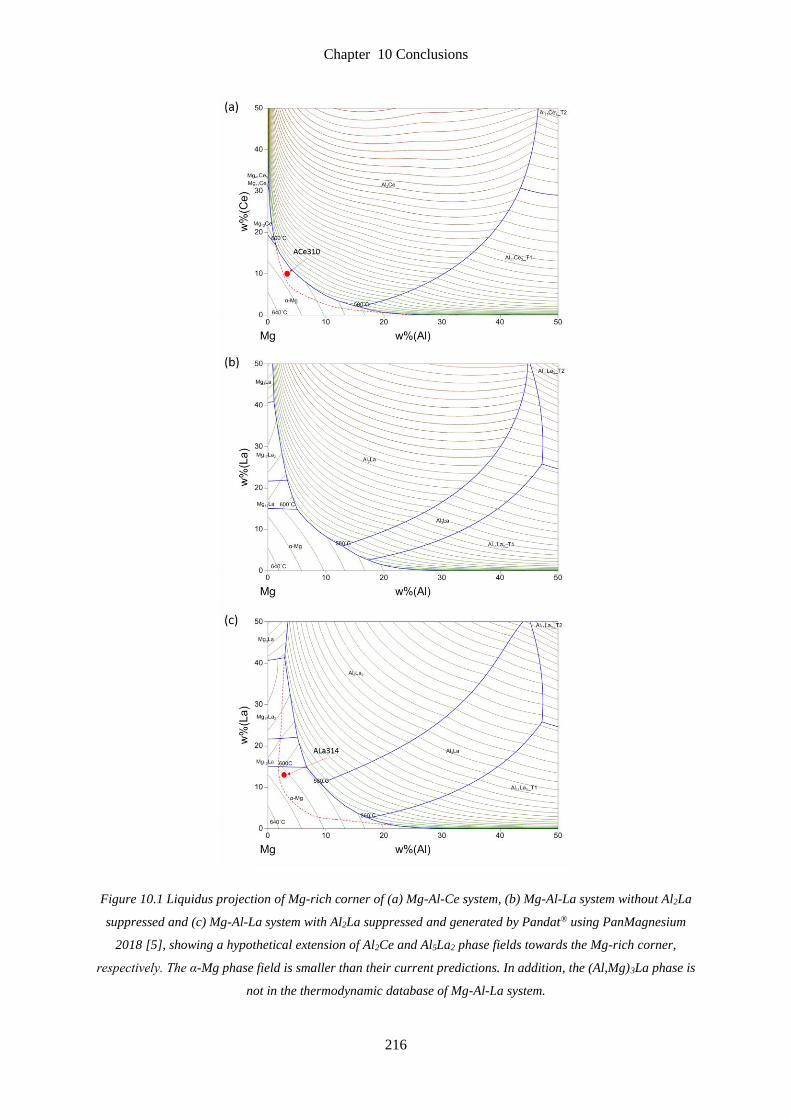
Chapter 10 Conclusions
216
Figure 10.1 Liquidus projection of Mg-rich corner of (a) Mg-Al-Ce system, (b) Mg-Al-La system without Al2La
suppressed and (c) Mg-Al-La system with Al2La suppressed and generated by Pandat® using PanMagnesium
2018 [5], showing a hypothetical extension of Al2Ce and Al5La2 phase fields towards the Mg-rich corner,
respectively. The α-Mg phase field is smaller than their current predictions. In addition, the (Al,Mg)3La phase is
not in the thermodynamic database of Mg-Al-La system.
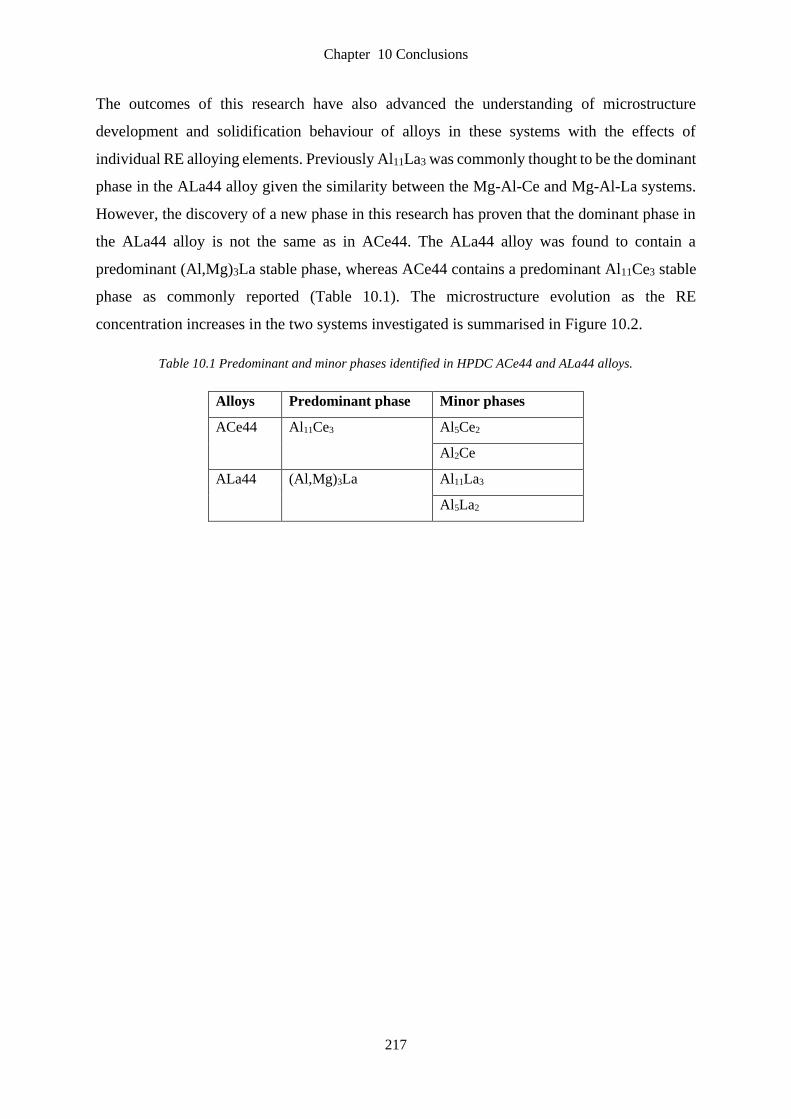
Chapter 10 Conclusions
217
The outcomes of this research have also advanced the understanding of microstructure
development and solidification behaviour of alloys in these systems with the effects of
individual RE alloying elements. Previously Al11La3 was commonly thought to be the dominant
phase in the ALa44 alloy given the similarity between the Mg-Al-Ce and Mg-Al-La systems.
However, the discovery of a new phase in this research has proven that the dominant phase in
the ALa44 alloy is not the same as in ACe44. The ALa44 alloy was found to contain a
predominant (Al,Mg)3La stable phase, whereas ACe44 contains a predominant Al11Ce3 stable
phase as commonly reported (Table 10.1). The microstructure evolution as the RE
concentration increases in the two systems investigated is summarised in Figure 10.2.
Table 10.1 Predominant and minor phases identified in HPDC ACe44 and ALa44 alloys.
Alloys Predominant phase Minor phases
ACe44 Al11Ce3 Al5Ce2
Al2Ce
ALa44 (Al,Mg)3La Al11La3
Al5La2
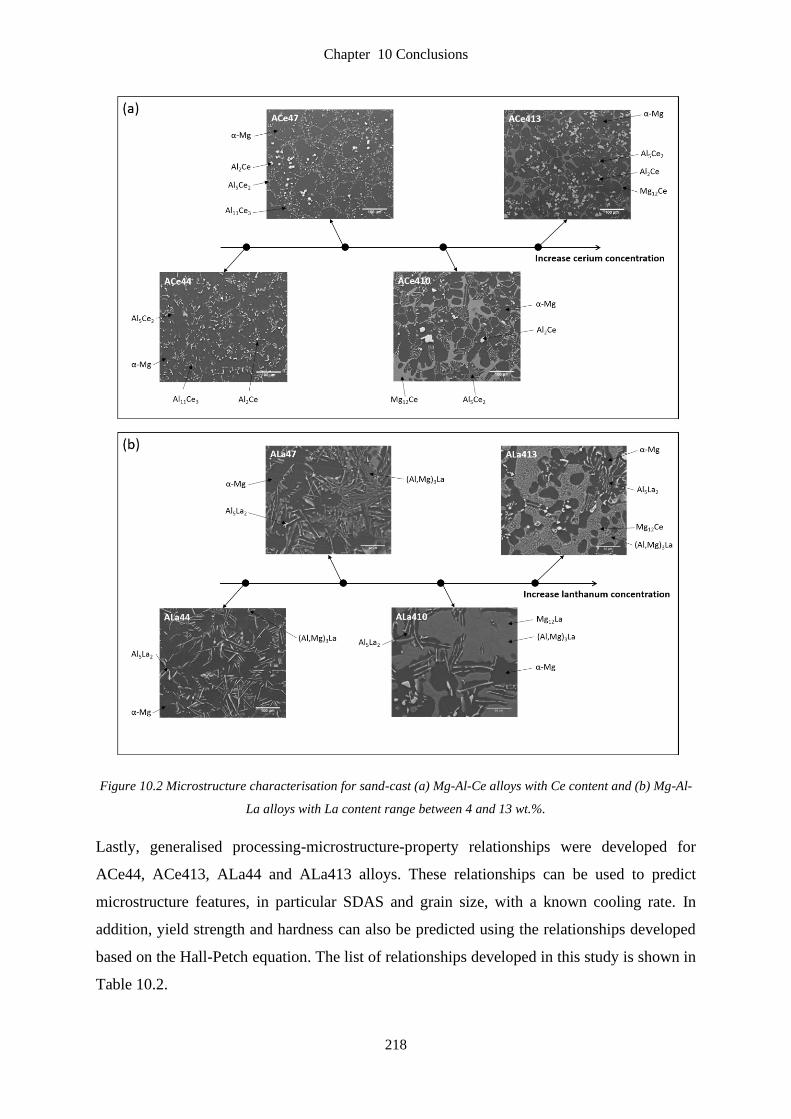
Chapter 10 Conclusions
218
Figure 10.2 Microstructure characterisation for sand-cast (a) Mg-Al-Ce alloys with Ce content and (b) Mg-Al-
La alloys with La content range between 4 and 13 wt.%.
Lastly, generalised processing-microstructure-property relationships were developed for
ACe44, ACe413, ALa44 and ALa413 alloys. These relationships can be used to predict
microstructure features, in particular SDAS and grain size, with a known cooling rate. In
addition, yield strength and hardness can also be predicted using the relationships developed
based on the Hall-Petch equation. The list of relationships developed in this study is shown in
Table 10.2.
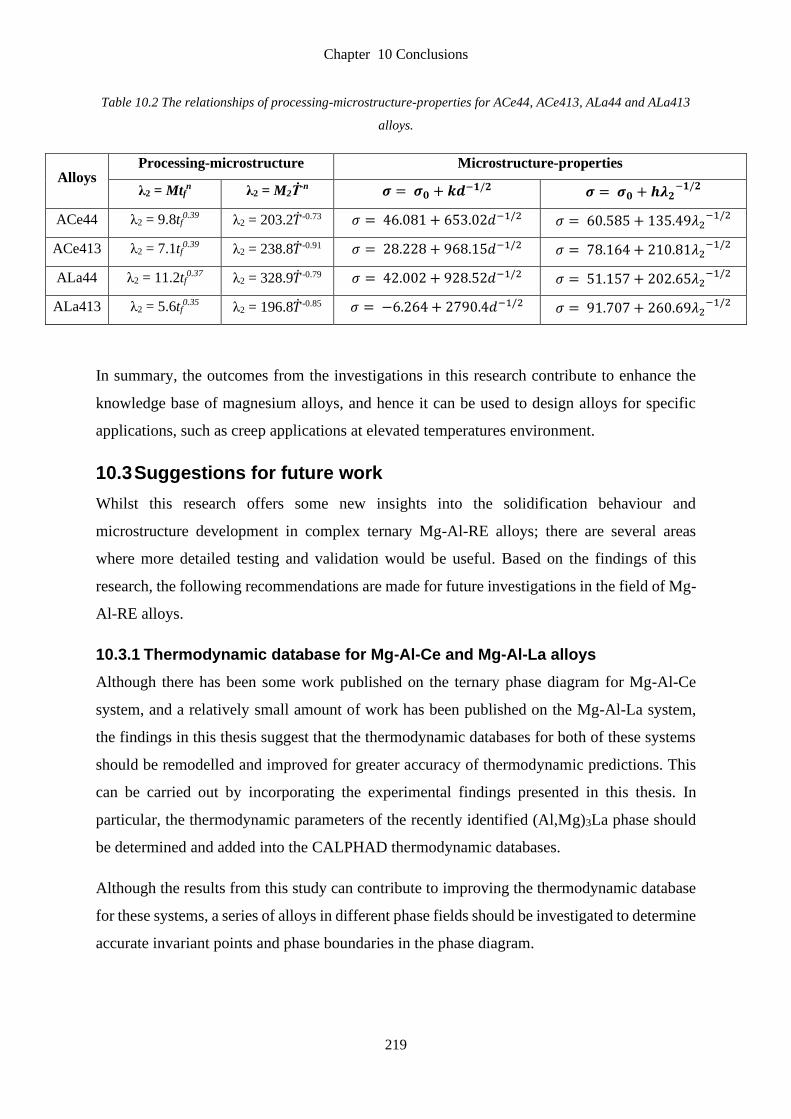
Chapter 10 Conclusions
219
Table 10.2 The relationships of processing-microstructure-properties for ACe44, ACe413, ALa44 and ALa413
alloys.
Alloys Processing-microstructure Microstructure-properties
λ2 = Mtfn λ2 = M2Ṫ
-n 𝝈 = 𝝈𝟎 + 𝒌𝒅−𝟏/𝟐 𝝈 = 𝝈𝟎 + 𝒉𝝀𝟐−𝟏/𝟐
ACe44 λ2 = 9.8tf0.39 λ2 = 203.2-0.73 𝜎 = 46.081 + 653.02𝑑−1/2 𝜎 = 60.585 + 135.49𝜆2
−1/2
ACe413 λ2 = 7.1tf0.39 λ2 = 238.8-0.91 𝜎 = 28.228 + 968.15𝑑−1/2 𝜎 = 78.164 + 210.81𝜆2
−1/2
ALa44 λ2 = 11.2tf0.37 λ2 = 328.9-0.79 𝜎 = 42.002 + 928.52𝑑−1/2 𝜎 = 51.157 + 202.65𝜆2
−1/2
ALa413 λ2 = 5.6tf0.35 λ2 = 196.8-0.85 𝜎 = −6.264 + 2790.4𝑑−1/2 𝜎 = 91.707 + 260.69𝜆2
−1/2
In summary, the outcomes from the investigations in this research contribute to enhance the
knowledge base of magnesium alloys, and hence it can be used to design alloys for specific
applications, such as creep applications at elevated temperatures environment.
10.3 Suggestions for future work
Whilst this research offers some new insights into the solidification behaviour and
microstructure development in complex ternary Mg-Al-RE alloys; there are several areas
where more detailed testing and validation would be useful. Based on the findings of this
research, the following recommendations are made for future investigations in the field of Mg-
Al-RE alloys.
10.3.1 Thermodynamic database for Mg-Al-Ce and Mg-Al-La alloys
Although there has been some work published on the ternary phase diagram for Mg-Al-Ce
system, and a relatively small amount of work has been published on the Mg-Al-La system,
the findings in this thesis suggest that the thermodynamic databases for both of these systems
should be remodelled and improved for greater accuracy of thermodynamic predictions. This
can be carried out by incorporating the experimental findings presented in this thesis. In
particular, the thermodynamic parameters of the recently identified (Al,Mg)3La phase should
be determined and added into the CALPHAD thermodynamic databases.
Although the results from this study can contribute to improving the thermodynamic database
for these systems, a series of alloys in different phase fields should be investigated to determine
accurate invariant points and phase boundaries in the phase diagram.
Chapter 10 Conclusions
220
10.3.2 Magnesium fraction in (Al,Mg)3La phase
Although the chemical composition and crystal structure of the newly identified (Al,Mg)3La
phase have been determined in this thesis, it is difficult to quantify the Mg fraction precisely.
Therefore, a further experimental study is needed to quantify the solubility limits for Al and
Mg in this phase. Key experiments can be conducted by selecting a series of samples near to
the composition of this new phase, to identify the effect of magnesium on the structure of this
phase. In addition, the first-principles approach, such as density functional theory (DFT) for
phase stability and solubility, can also be used to determine the solubility limits for Al and Mg
in this phase.
10.3.3 Thermal stability of intermetallic phases
This thesis presents the intermetallic phases in the Mg-Al-RE alloys with Al11Ce3 and
(Al,Mg)3La being the thermally stable phases in the ACe44 and ALa44 alloys, respectively.
The findings in this thesis also show that the Al11La3 phase is present in HPDC ALa44 but not
in gravity-cast alloys. This indicates that the Al11La3 phase can be a metastable phase. Both
stable and metastable phases influence the resultant microstructure during the solidification
process. Hence, it is worth further investigations into the thermal stability of intermetallic
phases in these alloys. Further investigation of phase thermal stability and the kinetics of the
decomposition of intermetallic phases can be examined using a time series of aged samples.
10.3.4 Implement a heat transfer model to enhance the processing –
microstructure relationships
In Chapter 9, the cooling rate obtained at the tip of the wedge-casting (thermocouple position
1) was determined using the extrapolation method, assuming the linear trend of the wedge
cooling remains applicable. The assumption made in this study was employed to simplify a
complex problem of solidification, which involves multi-phase changes. Therefore, a heat
transfer model can be used to enhance the predictions and hence the processing –
microstructure relationships. The phase-specific thermal properties could be used in the heat
transfer model to further improve the accuracy of predictions. The alloying concentration and
segregation during solidification can also be considered in a more sophisticated heat transfer
model.
In addition, the processing-microstructure-property relationship developed in this study was
based on four alloys in the Mg-Al-Ce and Mg-Al-La alloys. These relationships can be

Chapter 10 Conclusions
221
improved if additional experimental data can be obtained. Hence, a through process model can
be developed to relate the processing conditions to microstructure and properties.
Chapter 10 Conclusions
222
10.4 References
1. A.A. Luo and M.O. Pekguleryuz, Cast magnesium alloys for elevated temperature
applications. Journal of Materials Science, 1994. 29(20): p. 5259-5271.
2. A.A. Luo, Magnesium casting technology for structural applications. Journal of
Magnesium and Alloys, 2013. 1(1): p. 2-22.
3. T.K. Aune and T.J. Ruden, High temperature properties of magnesium die casting
alloys. 1992, SAE Technical Paper.
4. P. Bakke, et al., Magnesium technology 2005. Proceedings of the Minerals, Metals &
Materials Society (TMS), 2005: p. 291.
5. CompuTherm, Pandat software and PanMagnesium 2018 thermodynamic database,
Madison, Editor.

Appendix A Copyrights Permission
223
Appendix A
Copyrights Permission
Permission has been granted by Springer to reproduce the published article in full in this
thesis.
3/28/2019 RightsLink Printable License
https://s100.copyright.com/AppDispatchServlet 1/3
SPRINGER NATURE LICENSE TERMS AND CONDITIONS
Mar 27, 2019
This Agreement between RMIT University -- Charlotte Wong ("You") and Springer Nature("Springer Nature") consists of your license details and the terms and conditions provided bySpringer Nature and Copyright Clearance Center.
License Number 4557360854598
License date Mar 27, 2019
Licensed Content Publisher Springer Nature
Licensed Content Publication Springer eBook
Licensed Content Title Experimental Study of the Solidification Microstructure in the Mg-Rich Corner of Mg–Al–Ce System
Licensed Content Author Charlotte Wong, Mark J. Styles, Suming Zhu et al
Licensed Content Date Jan 1, 2018
Type of Use Thesis/Dissertation
Requestor type academic/university or research institute
Format print and electronic
Portion full article/chapter
Will you be translating? no
Circulation/distribution <501
Author of this SpringerNature content
yes
Title Solidification Behaviour and Microstructure Development of Mg-Al-RE (Ce and La) Alloys
Institution name RMIT University
Expected presentation date Jun 2019
Requestor Location RMIT University 11 Elland Road
Clyde North, Victoria 3978
Australia Attn: Charltote Wong
Total 0.00 AUD
Terms and Conditions
Springer Nature Terms and Conditions for RightsLink PermissionsSpringer Nature Customer Service Centre GmbH (the Licensor) hereby grants you anon-exclusive, world-wide licence to reproduce the material and for the purpose andrequirements specified in the attached copy of your order form, and for no other use, subjectto the conditions below:
1. The Licensor warrants that it has, to the best of its knowledge, the rights to license reuseof this material. However, you should ensure that the material you are requesting isoriginal to the Licensor and does not carry the copyright of another entity (as credited inthe published version).
If the credit line on any part of the material you have requested indicates that it wasreprinted or adapted with permission from another source, then you should also seekpermission from that source to reuse the material.
3/28/2019 RightsLink Printable License
https://s100.copyright.com/AppDispatchServlet 2/3
2. Where print only permission has been granted for a fee, separate permission must beobtained for any additional electronic re-use.
3. Permission granted free of charge for material in print is also usually granted for any
electronic version of that work, provided that the material is incidental to your work as awhole and that the electronic version is essentially equivalent to, or substitutes for, theprint version.
4. A licence for 'post on a website' is valid for 12 months from the licence date. This licence
does not cover use of full text articles on websites.
5. Where 'reuse in a dissertation/thesis' has been selected the following terms apply:Print rights of the final author's accepted manuscript (for clarity, NOT the publishedversion) for up to 100 copies, electronic rights for use only on a personal website orinstitutional repository as defined by the Sherpa guideline (www.sherpa.ac.uk/romeo/).
6. Permission granted for books and journals is granted for the lifetime of the first edition and
does not apply to second and subsequent editions (except where the first editionpermission was granted free of charge or for signatories to the STM Permissions Guidelineshttp://www.stm-assoc.org/copyright-legal-affairs/permissions/permissions-guidelines/),and does not apply for editions in other languages unless additional translation rights havebeen granted separately in the licence.
7. Rights for additional components such as custom editions and derivatives require additional
permission and may be subject to an additional fee. Please apply [email protected]/[email protected] for theserights.
8. The Licensor's permission must be acknowledged next to the licensed material in print. In
electronic form, this acknowledgement must be visible at the same time as thefigures/tables/illustrations or abstract, and must be hyperlinked to the journal/book'shomepage. Our required acknowledgement format is in the Appendix below.
9. Use of the material for incidental promotional use, minor editing privileges (this does not
include cropping, adapting, omitting material or any other changes that affect the meaning,intention or moral rights of the author) and copies for the disabled are permitted under thislicence.
10. Minor adaptations of single figures (changes of format, colour and style) do not require the
Licensor's approval. However, the adaptation should be credited as shown in Appendixbelow.
Appendix — Acknowledgements:
For Journal Content:
Reprinted by permission from [the Licensor]: [Journal Publisher (e.g.Nature/Springer/Palgrave)] [JOURNAL NAME] [REFERENCE CITATION(Article name, Author(s) Name), [COPYRIGHT] (year of publication)
For Advance Online Publication papers:
Reprinted by permission from [the Licensor]: [Journal Publisher (e.g.Nature/Springer/Palgrave)] [JOURNAL NAME] [REFERENCE CITATION(Article name, Author(s) Name), [COPYRIGHT] (year of publication), advanceonline publication, day month year (doi: 10.1038/sj.[JOURNAL ACRONYM].)
For Adaptations/Translations: Adapted/Translated by permission from [the Licensor]: [Journal Publisher (e.g.
Nature/Springer/Palgrave)] [JOURNAL NAME] [REFERENCE CITATION(Article name, Author(s) Name), [COPYRIGHT] (year of publication)
Note: For any republication from the British Journal of Cancer, the followingcredit line style applies:

3/28/2019 RightsLink Printable License
https://s100.copyright.com/AppDispatchServlet 3/3
Reprinted/adapted/translated by permission from [the Licensor]: on behalf of CancerResearch UK: : [Journal Publisher (e.g. Nature/Springer/Palgrave)] [JOURNALNAME] [REFERENCE CITATION (Article name, Author(s) Name),[COPYRIGHT] (year of publication)
For Advance Online Publication papers: Reprinted by permission from The [the Licensor]: on behalf of Cancer Research UK:
[Journal Publisher (e.g. Nature/Springer/Palgrave)] [JOURNAL NAME][REFERENCE CITATION (Article name, Author(s) Name), [COPYRIGHT] (yearof publication), advance online publication, day month year (doi: 10.1038/sj.[JOURNAL ACRONYM])
For Book content: Reprinted/adapted by permission from [the Licensor]: [Book Publisher (e.g.
Palgrave Macmillan, Springer etc) [Book Title] by [Book author(s)][COPYRIGHT] (year of publication)
Other Conditions: Version 1.1Questions? [email protected] or +1-855-239-3415 (toll free in the US) or+1-978-646-2777.
Copyright © 2022 FDOKUMEN