
Microstructure and defect chemistry of yttrium ... - Pure
182
Microstructure and defect chemistry of yttrium aluminium garnet ceramics Citation for published version (APA): Schuh, L. H. (1989). Microstructure and defect chemistry of yttrium aluminium garnet ceramics. Technische Universiteit Eindhoven. https://doi.org/10.6100/IR316596 DOI: 10.6100/IR316596 Document status and date: Published: 01/01/1989 Document Version: Publisher’s PDF, also known as Version of Record (includes final page, issue and volume numbers) Please check the document version of this publication: • A submitted manuscript is the version of the article upon submission and before peer-review. There can be important differences between the submitted version and the official published version of record. People interested in the research are advised to contact the author for the final version of the publication, or visit the DOI to the publisher's website. • The final author version and the galley proof are versions of the publication after peer review. • The final published version features the final layout of the paper including the volume, issue and page numbers. Link to publication General rights Copyright and moral rights for the publications made accessible in the public portal are retained by the authors and/or other copyright owners and it is a condition of accessing publications that users recognise and abide by the legal requirements associated with these rights. • Users may download and print one copy of any publication from the public portal for the purpose of private study or research. • You may not further distribute the material or use it for any profit-making activity or commercial gain • You may freely distribute the URL identifying the publication in the public portal. If the publication is distributed under the terms of Article 25fa of the Dutch Copyright Act, indicated by the “Taverne” license above, please follow below link for the End User Agreement: www.tue.nl/taverne Take down policy If you believe that this document breaches copyright please contact us at: [email protected] providing details and we will investigate your claim. Download date: 09. Jan. 2022
-
Upload
khangminh22 -
Category
Documents
-
view
0 -
download
0
Transcript of Microstructure and defect chemistry of yttrium ... - Pure

Microstructure and defect chemistry of yttrium aluminiumgarnet ceramicsCitation for published version (APA):Schuh, L. H. (1989). Microstructure and defect chemistry of yttrium aluminium garnet ceramics. TechnischeUniversiteit Eindhoven. https://doi.org/10.6100/IR316596
DOI:10.6100/IR316596
Document status and date:Published: 01/01/1989
Document Version:Publisher’s PDF, also known as Version of Record (includes final page, issue and volume numbers)
Please check the document version of this publication:
• A submitted manuscript is the version of the article upon submission and before peer-review. There can beimportant differences between the submitted version and the official published version of record. Peopleinterested in the research are advised to contact the author for the final version of the publication, or visit theDOI to the publisher's website.• The final author version and the galley proof are versions of the publication after peer review.• The final published version features the final layout of the paper including the volume, issue and pagenumbers.Link to publication
General rightsCopyright and moral rights for the publications made accessible in the public portal are retained by the authors and/or other copyright ownersand it is a condition of accessing publications that users recognise and abide by the legal requirements associated with these rights.
• Users may download and print one copy of any publication from the public portal for the purpose of private study or research. • You may not further distribute the material or use it for any profit-making activity or commercial gain • You may freely distribute the URL identifying the publication in the public portal.
If the publication is distributed under the terms of Article 25fa of the Dutch Copyright Act, indicated by the “Taverne” license above, pleasefollow below link for the End User Agreement:www.tue.nl/taverne
Take down policyIf you believe that this document breaches copyright please contact us at:[email protected] details and we will investigate your claim.
Download date: 09. Jan. 2022

MICROSTRUCTURE AND DEFECT CHEMISTRY
OF
YTTRIUM ALUMINIUM GARNET CERAMICS
IV lllb 1 Ilia 1 11
~~~~~--~~--~----~~~~~74 ell 0
t ~:-v--V
v.- -- I I :A. l,4 I
_A---__,...-
LOTHAR H. SCHUH
-log p~

Cover: The Defect Diagram Of ea-Doped YAG
MICROSTRUCTURE AND DEFECT CHEMISTRY
OF
YTTRIUM ALUMINIUM GARNET CERAMICS

MICROSTRUCTURE AND DEFECT CHEMISTRY OF YTTRIUM
ALUMINIUM GARNET CERAMICS
PROEFSCHRIFT
ter verkriJ&inl van de eraad van doctor aan de Technische Universiteit Eindhoven, op rezar van de rector ma1nificus, prof. 1r. H. Tels, voor een commissie aangewezen door het college van dekanen in het openbaar te verdedigen op vriJdag 25 aurustus 1989 te 16.00 uur.
door
LOTHAR HDBBRT SCHUH
1eboren te Hermulheim (West -Dui tsland) ·

D1t proefscbr1ft 1s coedeekeurd door de promotoren
Prof.dr. R. Hetselaar en
Prof.dr. G. de W1th

t INTROOOOTic:N. .....•......... , ... , , , .••.•.•.•.•.•.•...... , ••. 1
2 Tttf: GAIINfT STRIJ&TIJRf ..•.•. , .....•..•...•.•.•.•.••.•.•.•.•... 4
3 LITfR4TIJRf RfYifW: Ofrf&T PROP£RTifS ~ ~TS •..•.•...•.•. 7 3. 1 IRON GARN!i:TS •••••••••••••••••••• , , , , , , , , , , , , , , , • , • , , , • 7
3. 1. 1 Oxyten diffusion in YIG ••• , •••••••••••••••••••••••••. 8 3, 1. 2. Cation diffusion in YIG ••••••••••••••••••••••••••••• 10 3. 1. 3 Direct determination of oxyten vacancies in YIG., •• , 12 3. 1. 4 Electrical conductivity and thermo-electric
power in YIG •••••••••••••• , •••••••••• , ••••••••••••.• 13 3. 1. 5 Other iron tarnets ••.•.••••••••••.••••••••••••••.•.• 15
3. 2 YTTRIUM ALUMINIUM AND OTHER GARNETS ••••••• ,,,,,,, .••• 15 3. 2. 1 oxyten diffusion in YAG ............................. 16 3.2.2 Electrical conductivity in YAG and other non iron
tarnets ••••••.•••••••••••••••••••••••••••••••••••••• 17 3. 3 SITE EXCHANGE EFFECTS IN GARNETS ••.•.•••••••••••••••• 19
4 LITfR4TIJRf RfYifW: &OL~IJR &fNTRfS AND P~-~TI& orrf&TS IN 64RNfTS •.•• ,,,,,,,,,,,,,,,,,,,,,,,,,,, ,,,, 23
4. 1 COLOUR CEHTRES ••••••••••• , ••••••••••••••••••••••••••• 2 3 4. 2 PARAMAGHETIC DEFECTS •••••••• , •••• , ••• ,., ••• , ••••••••• 26
5 SAMPLE PRfPARATieN AND fKPfRIMENTAL SfT IJ~ •.••.••••.•...•• 32 5. 1 SIIMPLE PREPARATION •••.••••••••••• , • , ••••• , •••• , ••• , • , , 32 5. 2 SINTERING OF THE POWDERS ••••••.••••••••••••••••••••••• 32
5. 2. 1 Evaporation effects durint sinterint ••••.•.•••.••••• 33 5. 3 SOLUBILITY OF Ca, Mt, Zr AND Hf IN YAG •••••••••••••••• 36 5. 4 ELECTRICAL Mli:ASUREMENTS., , . , • , .•••••••••••••••• , •• , ..• 37
5. ~ 1 Electrodes and electrode effects ••••••••••••••.••••. 40
6 AN4LYTI&AL Tf&HNI~IJfS ANO RfSULTS .•..•.•.•.•.•..•.•.•.•••.. 47 6. 1 ELEMii:NT ANALYSIS ••• ,,,.,.,.,,, .• , ••••••.•••••••••••••• 47 6. 2 AUGER ANALYSES •••••.••••••• , • , • , • , • , •• , .•.••••••••.••• 47
l AL -R I&H IN&LIJS 10"15. , .. , .......... , ...•...•. , • , .. , , ... , ..... 50 7.1 CHEMICAL COMPOSITION OF THE INCLUSIONS ••.•••••••••..•• 51 7. 2 THE SHAPE OF THE AI-RICH INCLUSIONS ••••• ••••• ,,,,, .••. 52 7. 3 THERMAL STABILITY OF THE INCLUSIONS ••••.•••••••••..••• 54
8 BRAIN BDIJNDARifS IN YAG INYfSTIOATfD BY TfM .......•....•.. 58 8. 1 EXPERIM!i:NTAL., .••••••••.•.•.•••.••••••••• , ••.• , •.••••• 58 8. 2 RESULTS AND DISCUSSION •. , ••• ,, •• ,,,,, •.• , •••.•.•.••••. 59 8. 3 TEM-STUDIES DESCRIBED IN LITERATURE ••••••.•• ,,,, .•.•.. 62
9 MI&ROSTROOTURf ANO MI&ROSTRUtTIJRAL &~fS INYfSTI-6ATfD BY A&-DISPfRSIYf MfASIJRfMfNTS ..•........•....•....... 63
9. 1 INTRODUCTION ••.•.••.•.••• , • , , •• , ••••••• , , •.•••.•.•.• , . 63 9. 2 AC-DISPERSIVE DETECTION OF GRAIN BOUNDARY PHASES IN
YAG-CERAHICS., •••••••••••••••••• , ••••••••••••• ,,.,., •. 66

9. 2. 1 Experiments and discussion ••••••••.••••••••••••.•••• 66 9. 3 NON-LINEAR LEAST SQUARES FIT (NLLSF) OF
IMPEDANCE DATA ••••••••••••••••••••••••••••••• , •.• , , , • '70 9. 4 TEMPERATURE DEPENDENCE OF GRAIN BOUNDARY AND
BULK CONDUCTIVITY •••••••• , , , , •••••• , •• , , • , ••••••• , • , • , '74 9. 4. 1 Experiments and di.scusston •••••••••••••••••••••••••• '74
9. 5 A 240 HOURS ANNEAL EXPERIMENT •••••••••••••••••••••••• , '76 9. 5. 1 Experiments and discussion •••••••••••••.••••••••••.• '7'7
9. 6 PROPERTIES OF YAG CERAMIC QUENCHED FROM 2020 K TO ROOM TEMPERATURE •••••.••• , • , • , ••• , ••.••••••••••••••••• 81
9. 6. 1 Experiments and discussion •••••••.•••••••••••.•••••• 82
tO Dfrf~T ~~ISTRY or ~A- AND Me·DOPfO YAO .•..••............ 8'7 10. 1 SAMPLE CHARACTERISATION ••••• , ••• ,, •• , ••• , •••..•••••••• 8'7 10. 2 DISPERSED PARTICLES IN A CONDUCTING MATRIX:
10. 3 10. 4 10. 5
VAGNERS MODEL •••.• , , , • , ••••• , ••••..••.•. , .•.•.....•••. 88 RESULTS AND DISCUSSION ••• , ••••••••••••••••.••••••••••• 90 THE TEMPERATURE DEPENDENCE OF CONDUCTIVITY ••••.••.••• 100 CONCLUSION •• , ••• , , • , , , . , ••. , , •..•••••••••••••.•••••• 102
11 Dfrf~T ~H~ISTRY or ZR·DOPfD YAO ..•.......•............•. 103 11. 1 SAMPLE CHARACTERISATION., ••.••••••.•.•••••••••••.•••• 104 11. 2 RESULTS AND DISCUSSION.,, •••••• , ••••..•••.••.•••. ,.,. 105
11. 2. 1 The defect mode 1 for Zr-doped YAG ••••••.•••••••••• 106 11.3 TME TEMPERATURE DEPENDENCE OF TME CONDUCTIVITY •.••••• 109 11. 5 CONCLUSION ••••••••••••••••••••••••.•••••••••••••••••• 110
12 UMDOPfD POLY~RYSTALLINE YAO .•.•••.••..............•...... l12 12. 1 SAMPLE CHARACTERISATION ••• ,., ••• ,.,,, •• ,, •••••••••••• 112 12.2 RESULTS AND DISCUSSION., ••• , •• , .••.•••.•••••••••••••• 112 12. 3 CONCLUSION ••••.•••••••••••••••••••••••••••••••••••••• 115
13 UND()PfD SINeLf ~RYSTALLII'« YAO .••....•..•..........•...•. 115 13. 1 SAMPLE CHARACTER I SAT ION •••••• , ••••••••••••••••••••••. 115 13. 2 EXPERIMENT AND DISCUSSION.,,,, ••••.• ,,, •••••• ,, .•• ,,, 116 13. 3 CONCLUSION. , •...••. , •••••••••• , ••••••••••••••••.••••• 116
14 INTf~TIU'ol or YAO WITH HYDRClOfN CU'o!TAININe ATMClSPHfRfS .. , ....... , .• , , ....•• , ..................... , 119
14. 1 INTRODUCTION ••• , • , , • , • , •• , , •• , ••••••••••••••••• , •• , , , 119 14.2 INFRARED BANDS IN ANNEALED SINGLE CRYSTALLINE YAG •••• 120 14. 3 ELECTRICAL TRANSPORT PROPERTIES OF YAG IN A H2/H20
AMBIENT ••••••••.•.• , •• ,,, •••••.•.••••.•••••••.•.•.•.• 122 14. 3.1 The activation enerties for a in YAG:Zr
tn H2;H2o ......................................... 123 14. 3. 2 The activation enerties for a in undoped YAG
1n H2;H2o ••••••••••.••••••••••••.•.•••••••••.•.••• 124 14. 3.4 The complex impedance behaviour of polycrysta111ne
YAG in a H2;H2o-atmosphere ••.•.•••••••••.••••••••• 126 14. 4 CONCLUSION. •••• ,,,,, ••• , ••• ,.,.,, •••••••••••••••• , ••• 127
t5 SINTfR ADDITIVfS AND MICR()STRDCTURf •..•.................. 129 15. 1 EXPEJUMENTS ••.•• , •••.•••.•••.•••••.•.••••••••••.•.••• 129 15. 2 RESULTS AND DISCUSSION., •••.... , •••••.•••••••••.•••• , 130 15.3 EXAMPLE OF EXAGGERATED GRAIN GROWTH ••••••.••••••••••• 133

16. 4 CONCLUSION ..•..•.........•.•...•...........•.....•..... 136
16 &OMPUTfR SIMULATION or IONI& PfrfCTS •..•...•........•...... 136 16.1 THEORY OF DEFECT CALCULATIONS-A SKETCH ...............•. 136 16.! THE PERFECT LATTICE PROPERTIES OF YAG .....•••...•..•... 138 16.3 THE BASIC POINT DEFECT FORMATION ENERGIES ••.••......... 140 16.4 FOREIGN CATIONS IN YIG AND YAG .•....•........•........• 141 16.5 OXIDATION/REDUCTION PROCESSES IN YAG AND YIG ..•...•..•• 142 16. 6 THE DISSOLUTION OF CaO IN YAG .•.•.•.•.•.........•••..•. 146
16. 6. 1 The ener11y for sub.tt1tut1nll Y by ea ...••••••....••. 146 16. 6. z The solution enthalpy of cao in YAG .•.•.•••••..•... 147 1L L 3 Cluster1n8 effects ••••..•••.•.••...•••••••.•....••. 149
16. 7 THE DISSOLUTION OF MIIO IN YAG., .•.•.•...•.•••• ,., .. , •.. 149 16. 8 SADDLE POINT ENERGIES .••.•......•.•.•.•.•.........•.... 160
16. a. 1 OXYI!en jumps .... , ....... , ...•.•.•.•.......•. , .• , .•. 150 16. a. z The .spatial dependence of the saddle point
ener11 1 es .•.•...•.•....•.•••••.•.....•••.•..•.•••••. 153 16. a. 3 Al uminlum jumps ••••.....•••••.....••••••••.••.•••.• 155
16. 9 CONCLUSION. , .............••.•.........•. , ........... , .. 155
APPfNOIX t ••••........•.•.....••.•••....•.•.•....•...•..•...• 157
APPfl'll) I X 2 •••• , , ••••••••••••••..••••• , •••.•••••• , •••••• , • • • • • 1 6 5
S~Y ••••• •••••••••••••• , •••••••••••••••••••••••••••••••••• 166
SJ'IIMfNVATT I NO .••............•••••........•.•.•......• , . • • • . • • • 1 6 8
&IJRR lf:IILIM V ITAf .•.•..•.••.•..... , •.....• , .. , .....•.• , .•••... 169

INTRCDVCTI~
This thesis 1s centered around the synthetic garnets, a class of materials with the same crystallographic structure as the naturally occurring garnet minerals. For the last thirty years there has been a considerable technological and scientific interest in the synthetic garnets (to be correct, they should be termed as complex oxides with the garnet structure).
Yttrium iron garnet (Y3Fe 5o 12 = YIG) first attracted attention in 1956 after its masnetic properties had been discovered [1-4] and after it was shown that the low line-width makes YIG technicallY useful as a microwave device material [5, 6).
The physical properties of oxides with the garnet structure can be adjusted over a Wide range by introducing different ions into the lattice. From the beginning YIG and the iron garnets provided an inexhaustible reservoir of compounds for basic studies, such as ferromatnetic resonance [7], Faraday rotation [6], magneto-acoustic behaviour [9], photoinduced changes of the magnetic properties [101 and others. In the seventies YIG-based crystal films became the leading magnetic bubble domain device material (11).
Besides the class of magnetic garnets the isomorphic non-magnetic garnets became an important material. Primarily they were developed and investigated to get baste data about the garnet structure, about energy levels of incorporated foreign ions, about optical properties etc .. With the advent of the solid state laser yttrium aluminium garnet IY3Al5012 = YAGI was soon found to be an excellent solid state laser host material (e. g. the Nd: YAG laser) [12, 13). The demand of high quality laser crystals spurred an extensive study on YAG. Much work has concentrated on the correlation between lattice imperfections of the YAG host lattice and the laser light emitting properties [14].
In 1973 hot-pressed YAG ceramics first nave been mentioned as a posSibly useful optical material [15] by Gazza and Dutta. They succeeded in not-pressing powders to translucency. Translucency can be obtained in sintered materials if the volume of pores and inclusions 1s approximately zero. For translucent materials a high tot a 1 liSht transmus ion extsts, but due to substantia I scattering there u only a low in-line transmiSsion. Materials with a high 1n-11ne transmiSsion and a neglillble scattering, so that bodies lying beyond are entirely visible, are called transparent; in many cases translucent materials are wronslY called transparent. Until now several materials nave been sintered to trans-lucency, for example Y;:03 [16),MgA1204 [17),BeO (16), MgO [19], Al;:03 [20). AIN [21 1, AlON [22], beta-s ial on [2 31 and others.
Properties which are relevant for translucent ceramics can be arranged into three groups: optical, mechanical and chemical behaviour. The factors Which influence the optical properties

can be devided into intrinsic ones (refractive index, b1refrineence and absorption coefficient) and extrinsic ones (presence and nature of pores, impurities and inc Ius ions). Of primarilY interest is that the material has a low absorption coefficient in a certain ranee of wavelengths. A tow value of refractive index is also important to minimize reflection losses. The birefrineence, as the third important intrinsic property, should be low to minimize (back-)scattering of light in the polycrystal. However, the extrinsic parameters determine to a large extent the transmittance of a rea 1 mater 1a t. These properties could be opt1m1zed in many cases by an appropriate process technology: by find1nt powders with •good" properties (concerning grain size, grain size distribution and dopantsl and by chosint a •good" sintering procedure (concerning sintering atmosphere, sinterlng-cycle, -temperature and -time). Fracture toughness, thermal shock resistance, hardness, corrosion resistance and thermal stability are the limiting factors which determine if a translucent material is feasible under given conditions. The most familiar translucent ceramic is alumina cLucalox), first reported bY Coble [201 in 1962. Alumina iS the only matertal that is used in lamp envelopes in commercial high pressure sodium discharge lamps. Such a tube is filled with Ha (acting as the actual light source), Hg (for starting the lamp) and noble gas (for stabiliZing the plasma). In the burning lamp the sodium vapour pressure is about 10 kPa: the maximum wall temperature is about 1530 l. From these conditions it ts clear that the alumlna has to withstand rather extreme conditions. The main disadvantage of translucent alumina is that sodium slowly penetrates along the grain boundaries (=corrosion). ThiS is accompanied by a decrease of the sodium concentration inside the lamp resulting in an alteration of the Na:Hg relation. As the result of these processes the efficiency of the lamp decreases slowly.
After it had turned out that YAG powders can be sintered to translucency [24-26), further experiments showed the optical properties of YAG to be better than those of alumina. Moreover YAG exhibits a better high temperature corrosion resistance against hot sodiUm vapour than alumtna [27]. The penetration depth of sodium along the grain boundaries of pure YAG is very 1 ow. The main di ff icu 1 ty ts that YAG is a line compound. This means that stoichiometry has to be controlled very carefully in order to obtain a single phase material. Sinterins stoichiometricallY TAG-powders in vacuum, leads -to a two phase microstructure: a YAG matrix withAl-rich incluSions. Sintertng in He/H20 leads to a reduction of the inclusions: this shows that the sinterinl atmosphere plays an important role. At the present time it is still a problem to maKe sintle Phase YAG ceramics.
When dealing with high temperature materials under extreme conditions ionic and electronic transport properties play an essential role. Full optim1Sation of the characteriStics of YAG is probablY attainable wtth a comprehensive understanding of the defect chemistry. In this thesis we have investigated the interrelation between the transport properties and the type of sinter-
2

additive. we propose defect models based on experimental results and, as far as possible, grounded on the outcome of computer stmulations.
LITfRATURf
[1} R. Pauthenet, c. R. Acad. scL, ~ (1956) 1895. [2] R. Pauthenet, Thesu, Grenoble, 1957. [3] R. Pauthenet, J. Appl. Phys., U 11958) 253. £41 L. G. van Uitert, F. V. swanekamp, J. Appl. Phys., L1 (1957)
1513. [5] E. G. spencer, R. c. LeCraw, F. Reuu, Proc. IRE, ll (19561 790. (61 F.J. D1llon Jr., Phys. Rev., 1.Q.i (1957) 759. (7] R. v. Jones, G. P. RodrUue, w. p, Wolf, J. Appl. Pnys., ll
( 1956) 434. [8] F.J. D1llonJr., J. Appl. Phys., ll (1956) 539. [9] R,C. LeCraw, E.G. Spencer, c. s. Porter, Phys. Rev., ii2
(1958) 1311. (10] R. w. Teale, D. W. Temple, Phys. Rev. Lett., J..2. (1967) 904. [11] A.H. Bobeck, Bell Syst. Tech. J., .!!.§. (1967) 1901. [12] J.E. Geustc, H.~ Marcos, L.G. van U1tert, Appl. Phys. Lett.,
:;, (1961l) 182. [131 w. JCoechner, Rev. Se 1. Instrum., ll (1970 1 1699. (till Ta-Lin Hsu, "A Nd-YAG Laser Bibliography", MaterialS Research
Center, Allied Chem. Corp., Morristown, New Jersey, 1971. [151 a& Gazza, &L Dutta, US Patent 376 77 ll5 (1973). [16] W. H. Rhodes, J. Am. Ceram Soc., H ( 1981) 13. [17) P. Hing, J. Mater. Sci., ll (19761 1919. [16] D. T. L1vey in "High Temperature OXides", .a_, ~ Alper ed. 1970. [19] T.G. Langdon, J.A. Pask in "High Temperature Oxides", ~.
~ Alper ed., 1970, Hew York. [20] R. L. Cob le, u. S. Patent 302 62 10 (1962) [21] N. JCuramoto, H. Tanaguch1, J. Mater. Set. Lett., ~ (1981l} ll71. (22 J J. w. Me eau I ey, N. Cobln, J. Am. Ceram. Soc. , ~ ( 1979) 47 6. [231 M. Mutomo, Y. Mor1yosh1, T. SaKat, T. Ohsaka, M. Kobayashl,
J, Mater. Sci. Lett., .1. (1982) 25. [21l] G. de With, H.J.A. v. DijK, Mater. Res. Bull., J..2. (198.1!) 1669. [25] G. de With, H. J, A. v. DiJK, Brit. Patent 213 68 02 (1986 I [26) F. J. c. Toolenaar, G. de With, Proc. Brit. Ceram. Soc., .1..ll
( 1986) 241. [27] G. de With, Phtlips J. Res., ll (19671 119.
3

2 THE GARNET STRUCTURE Any study of garnets must begin with a thorough understanding of its crystal stucture. The determination of this structure was first made on natural garnets nearly fifty years ago by Menzer {1,2]. Structural refinements were carried out on synthetic yttrium iron garnet by Geller and Gilleo [3], Batt and Post {41 and by Euler and Bruce [5]. The most probable space-group of the garnet structure 1s Ia3d. Its Bravais lattice is body-centred cubic.
Garnets have the general formula !C3J[Ael CD3 >0 1z, where 0 denotes oxygen and the different brackets !l. [] and () symbo 11 ze cat ions on tne dodecahedra!, octahedral and tetrahedral sites respectively:
1. tetrahedral sites: each tetrahedral or d-slte is surrounded by 4 h-sltes to form a tetrahedron. There are 24 d-sites in each unit cell. Each d-site has the point symmetry 4
2. octahedral sites: each octahedral or a-site is surrounded by 6 h-sltes to form an octahedron. There are 16 a-sites in the unit cell of the garnet. Each a-site has the point group symmetry 3
3. dodecahedra/ sites: each dodecahedral or c-site is surrounded by 8 h-sites to form a trian1ular dodecahedron (twelve faces with each face a triangle. There are e4 c-sites in each unit cell of the 1arnet. Each c-site has the point group symmetry ue.
There are 96 h sites with a point symmetry I which are occupied by oxygen ions. They form the different coordination polyhedra as shown in fig. 2. 1. The unit cell of the cubic garnet structure contains 8 formula units (:160 ions}.
The oxygen parameters for YAG were given by Euler and Bruce [5) as:
X o. 0306 y o. 0512 z o. 6500.
All 96 oxygen positions are derived from

eq. -a. 1 (Wlth a the lattice constant and 1. J. it the vector coefficients along x-,y- and x-axts)
by 46 symmetry operations of the space group Ia3d.
The primary considerations of the occupancy of the three different polyhedral sites by cations ts the ionic radius. In yttrium aluminium garnet Al-tons occupy both the d- and the a-sites, while Y occupies the c-utes: !Y3 J [Al 2 J (A1 3 )o12. Tolksdorf and Wolfmeier (9] as well as Yang [101 give the tonic radii and the site occupancies of ions for most of the known garnets.
Fig. 2. 1 shows a typical structural unit in the garnet lattice. Besides the polyhedron-arrangement the tntertonic distances and bond angles are given for YAG. Geller and Gtlleo found that the edge-lengths of the three polyhedra in the garnet structure are not regular with respect to their edge-length [3].
Good drawings of the garnet structure are gtven by Novak and Gibbs [61. Gibbs and Smith [7], Prandl [6} aM Tolksdorf and Wolfmeter [9). A very comprehensive description of the structure, the properties and the application of garnets was given by Wang [10] and IChattak [11]. The crystal chemiStry of garnets was reviewed bY Geller [12].
DISTANCES;
Cell edge length
cation-anion d-h (tetr. ) a-h (octa. ) e-h (dodeca)
distance d4 d6
1 l d 8 21 <1 80
anion-anion distance tetr. dodeca. d4s octL dodeca. d6s dodeca. dodeca. dss
tetra. octa. dodeca.
1. 2000 nm
o. 1761 o. 1937 0. 2432 o. 2303
o. 2696 o. 2656 o. 2837
0. 2961 0. 2818 0.2917
5
BOND AHGLES;
a-h-d a-h-(dsol-c a-h-(dal-c d-h-ldsol-c d-h-lds)-c d-h-ldel-c
130. 1 [deg] 104. 2
99. 7 94. 2
121. 6 101.7

[010]
..
Fig. 2./ The garnet structure as a network of tetrahedra, octahedra and dodecahedra. The data given above belong to TAG (from [9}).
ll TfRATliRf
[11 G. Menzer, centralbl. Min. (A), (19251 344. [2] G. Menzer z. Kristal!ogr., Kristallgeometrie, Kristallphys.,
Kr1Stallchem., ll (1926) 157. [3) s. Geiier, M.A. Gilleo, J. Phys. Chem. Solids, ~ (1957)
30. [41 A. Batt, B. Post, Acta Crystallogr., ll (1962) 1268. [5J F. Euler, J.A. Bruce, Acta crystallogr., ll !1965) 971. [6] G. A. Nowak, G. V. Gibbs, Amer. Mineral. ll {1971 J 791. [7) G. V. Gibbs, J.v. Smith, Amer. Mineral., ~ (1965) 1!023. [8] w. Prandl. z. Kr1Stallo1r., .1.ll (1966) 81. [9] w. Tolksdorf, u. Volfmeier, Landhold-Bornstetn (neue serle)
Bd. III/12a, K. -H. Hellwege editor, Berlin, 1978. [10] ~ F.Y. Wang, •physical and Chemical Properties of Garnets"
Treatise on Material Science and Technology II, ed. H. Herman, Academic Press, 1973.
[11] c.~ Khattak, ~ ~ ~ Wang, •Perovsk1tes and Garnets", Brookhaven National Laboratory, 1976.
[12) s. Getter, z. Krtstallogr., .1.ll (1967) 1.

3 LITERATVRE REVIEW: DEfECT PROPERTIES Of ~ETS The presence of poin~ defects in garnets strongly influences optical, electrical and magnetic properties of single crystals and ceramics, as well as the s1nterab111ty of powders. Basle questions concerning with defects in a crystalline solid that have to be considered are:
a) type of defects b) actual concentratJon of defects c) relation between aefect concentration and temperature, ambient
gas atmosphere, etc. (JJ mobility of the defects
The most intensely studied garnet material from the defect chemical point of view, is yttrium iron garnet tY3Fe 5o 12• abbrevia-ted as YIG ). In this section we will review the papers describing defect properties of YAG (Y3Al5012) and YIG and some other garnets, from which we can learn about the preferred defects tn this sort of complex materials. Several basic physico-chemical parameters are the same for crystals having the garnet structure (e. g. the relation between the mobilitY of cation- and anion-defects, or preferred defect species). So from experimental results for one garnet conclusions can be drawn concerning the defect properties of another garnet. In this section we consider the defect chemis-try of YIG and some other garnets as detailed as necessary to understand our own experimental results on YAG.
3.t IR~ OARNfTS
A very comprehensive study of the electrical properties of YIG has been performed by P.K. Larsen and R. Metselaar in the seventies. This and many other research and development proJects were launched at that time,because it had been shown that YIG exhibits a strong photomagnetic effect. A short time later it became clear that epttaxially grown YIG films can serve as magnetic bubble memory devices. The data storage densitY of such memory devices reaches the capability of the modern •megab1tch1P"· In 1979 the YIG bubble memory was commercialized, but it turned out that the costs associated with an entire new technology were higher than expected. In addition there have been unexpectedly rapid developments in capacity and price of siliconbased storage devices. But at the present time modified YIG 1S gaining more and more commercial interest agatn, because the magneto-optical effect maKes YIG an interesting material for
7

optical switching in ftber-optics telecommunication systems [1]. Now technoloay is taktna advantage from the scientific work which was performed in the seventies.
The study of the transport properties of YIG were started in 1957 bY van Uitert and swanekamp [2). Larsen and Metselaar have developed a defect model for YIG based on their electrical conductivitY - , photomagnetic -, thermograv1metr1c - and lattice parameter measurements [3-tOJ. To be consiStent with previous ideas [11) a model based upon the presence of doublY ionized oxygen vacancies (V0 ' • l to explain several phenomena was postulated$. We will now look at diffusion and electrical measurements in YIG in some more detail.
3.t.t ~xyaen diffusion In YIG
The first diffusion experiment to18_tracer) in YIG was reported in 1964 by Paladino and coworkers [12). Their experiments were carried out with stngle crystals and polycrystall1ne material under constant partial pressure of oxygen. Due to the large ratio of the cation- to anion radii the probabilitY of oxyten interstitials is very low. The diffusion of the tracer-atoms in YIG can therefore only be achieved by Jumps via vacant oxyten sites [3]. The temperature dependence of the diffusion coefficient reported bY Paladtno et a I. [12] is represented by
eq-3. 1 D
The diffusion data are tiven in form of the usual diffusion equation D = D0 •exp (-Ea/kT], in which D0 is often termed the frequency factor; Ea the activation eneray of the diffusion process, here riven in ev. T is the temperature in E and k is the Boltzmann constant in ev;r:..
The activation enersy of 2. 84 ev prevails in a temperature rante from 1370 to 1670 I. The diffusion coefficient is the same
$ In this thesis we use the Iroger-Vink notation.
6

for single crystal and polycrystalline YIG. This is in a marked contrast to the results found for alumina, in Which diffusion rates in stntered AJ 2o 3 are two orders of magnitude greater than in single crystals (13] due to a grain boundary effect. Later Metselaar and Larsen reported [3] measurements of the oxygen diffusion coefficient in polycrystalline YJG. The method they applied was the "dynamic conductivity measurement•, in which the time evolution of the electrical conductivitY as a response to small po 2 -changes was analysed. Their diffusion coefficient between 1170 and 1570 K ts represented by
eq-3. 2 D
The activation energy Of Z. 9 eV reported in this study is the same as that found by Paladino. The difference in the preexponential factors D0 in eq-1. 1 and eq-1. 2 is due to the different method used to determine the diffusion coefficients (tracer-diffusion- or chemical diffusion methods).
Metselaar and coworkers came to the conclusion [3,4, 6] that there is a reversible temperature-dependent loss and gain of oxygen. In ref. [3) the following oxygen exchange reactions are considered to be alternatively responsible for the variation of a after changing pOz:
eq-3. 3
and
eq-3. 4
Equations 3. 3 and 3. 4 reveal that donor-centres in YIG principallY can be anion-vacancies (eq-3. 3) or catlon-tnterstltials (eq-3. 4). The empty b-sltes in the structure of YIG can accommodate only interstitial ions with rad11 less than o. 8 A. ConsequentlY the probability of interstitial Y-ions 1s very low; after ref. [3, 4) such defects may be excluded. All theoretical and experimental work indicates that oxygen vacancies are the most preferred defect species in YIG. In this thesis we confirm this opinion e. g. by calculating the reaction energies for tne proceses comparable to eqs-3. 3 and 3. 4 in YAG and YIG. on the basiS of
9

the CASCADE computer code (see section 16) it was shown that a vacancy forming reaction according to equation 3. 3 needs 6. 1 eV, while the interstitial mechanism would consume an energy as high as 13.8 eV (in the first approximation). So the activation energies derived in diffusion experiments are due to oxygen migration via a vacancy mechanism.
In 1981! Kilner et al., using the o18_tracer/SJMS-technique, have determined a somewhat higher activation energy of 3. 7 eV [1ll,, 15] for the oxygen diffusion in YIG. The authors found that their single crystalline YIG material was dominated by imperfections; this fact together problems com tng surface charges on the sample due to the ion-bombardement should be responsible for discrepancies between conventional andSIMS technique applied by Kilner and colleagues to analyse tracer diffusion profiles.
R. c. Le Craw et a/. [Hi] reported a rapid oxygen diffusion at low temperatures between room temperature and 520 K in YlG films with an uncompensated ea-addition of 0.1 o. 23 atoms per formula unit. The authors found an oxygen diffusion distance of about 500 ~m within 25 hours at 520 K by observing a colour zone. A model based on the dependence of the diffusion on oxygen vacancy concentration was proposed. This is in consistency with the fact that the diffusion coefficient of oxygen 1n YIG increases with decreasing p0 2 in the ambient gas atmosphere as stated by Wolfmeter (26). Additional conductivity data on substituted YIGfilms are reported e. g. by Hibiya [17].
Reviewing their earlier work Metselaar et al. [3] gave a correction of their oxygen diffusion coefficient given in [~]. The former was based on the assumption that only doublY ionized oxygen vacanc 1es (V0 • • J were present. From [ll] it became c tear that also a small concentration of doubly positive V0 · has to be taken into consideration. The corrected diffusion coefficient is
eq-3. 5 D o. 1• exp [-2. 7 eV/kTJ m2;s.
Besides oxygen diffusion one paper describes the diffusion of F--ions in YIG [23}.
'3. I .2 ~atlon diffusion in YIG
Cation diffusion In YIG was measured by Lyashevich and eoworkers (24, 25] bY radioactive tracer technique (Fe59, y90, y91 ). According to Wolfmeier [26] their data were doubtful because of the
10

relatively wide scatter of results obtained by applying different analytical methods (absorption- and section-method; this should be conceived as an inaccuracy in measurements. Using the same methods in spinets, Schmalzried et .aJ. found a 20 r. scatter of results [27], while the diffusion data reported in [24, 251 differ for about more than one order of magnitude. we give here the activation energies for the yttrium-, iron- and oxygen- diffusion in YIG, as collected from literature:
Tab. !J.t Self-diffusion data for YIG
Do ION m2;s Ea[eV] remark ref
------------------------------------------------------------------y3+ 34 5. 2 s [24] 2.t·to-4 3. 64 p [24} t·to-3 4. 6 s [26]
Fe3+ 2. 3·10-2 4. 1 s [25} 6. 6·10-4 3. 75 s [25] 1•10-5 2. 56 p [25] 4·10-5 3. 2 p [2 5} 1·10-3 3.7 p [36]
oz- 4·10-5 2. 64 s+p [12] 6. 4 ·to-t 2. 9 p [3]
s = single crystal p = polycrystal
Based on above data and their interpretation given in the thesis of Wolfmeier [26] we can extract for the diffusion coeffl cients of the ions in YIG '
eq-3. 6 Do > DFe > Dy
This result is contrary to several classes of materials like splnels (for example CozTiO.q.l where oxygen is the slowest diffusing ion at low pOz (Wagner mechanum [Z91 ),
Reliable data about the interdiffusion of Y,Fe,Ga and Gd in the diffusion couples GGG-YIG, GGG-GIG and GIG-YIG are given 1n [30] (GGG = gado 1 inium ga Ilium garnet, GIG = gado lin1Um iron gar-
11

net),
The mobility of the iron ions in the d- and a-sites of the garnet structure is considered 1n [611 bY using radioactive re59, In this study two similar polycrystalline iron-containing sarnets were investigated: one material with Fe exclusively In the tetrahedral and another material with iron exclusively in the octahedral coordlnatio~ By determining the self-diffusion coefficients (see tab. 3. 2) transport-parameters of iron were obtained: the mobility of Fe via the octahedral sites is preferred and the diffusion along the grain boundaries was found to be easier than through the bulk (in ca3Fe 2Ge3o 12 - Fe in a-position and in YCa2Zr2Fe3012 - Fe in <!-position). The data for the diffusion processes are given below.
Tab. 3.2 Diffusion data for octahedral and tetrahedral iron ions along the grain boundaries and through the bulk of garnets (Fe59 tracer diffusion) {61]
ca3Fe 2Ge3o 12 bulk gb
Yca 2zrzFe 3o12 bulk gb
6.97·10-6 6. 4 • 1o-10
1. 51· 1o-2 2. 39·1o-2
Ea [eV]
o. 50 o. 36
o. 97 0. 92
A comparable result was obtained for the tetrahedral and octahedral sites in a spinet (ZnFe 2o4 ) using radioactive Fe and Zn Isotopes [62).
Proton diffusion in YIG was Investigated by Wood [16, 19} and M11an1 [201 to get baste data of about the interaction of the crystal lattice with H2• From an appl1cat1onal point of view, e. g. suran [211 and Milan! [22} used ion-implantated YIG-films as a new sort of H2 -sensor.
3. t.3 Oirect determination of oxyaen vacancies In 110
Metselaar et al. In ref. (4) stated that until the mid-seventies a direct quantitative determination of the oxygen vacancy concentration as a function of po2 is still lacking. Therefore
12

a study of the reversible oxygen loss in pure and ea-doped YIG by means of a tnermobalance was presented [4]. Thermogravlmetrlc analyses were performed as f(T, pOz} with T ranging from 12:2:0 K to 1540 K and pOz varyinc between 105 and 1 Pa (at lower pOz's YIG decomposes into YFeo3 and Fe2o3 [31] ). From the weicht changes the concentrations of oxysen vacancies were derived. In pure oxygen at 1670 K the oxygen-loss a in Y3Fe50ta-a 1S about 0. 002:. The maximum concentration of empty oxygen-sites which can be accommodated bY the YIG-lattice is o. 01 per formula unit, which is approximately one V0 per unit cell.
The total oxygen vacancy concentration largely depends upon the concentration of uncompensated donors or acceptors. For the eadoped sample denoted "sample 1" in ref. [4) the authors found for T:1370 K and pOz:1o4 Pa tnat (V0 }:2:. a to19 cm-3, which gives a~o.0016 in Y3Fe501a-a·
vorob'ev and coworkers [63) determined the departure from oxygen stoichiometry between 1010 and 1670 K at from 105 to to-15 Pa. The non-stoichiometry or reduction of both sarnet compounds is presented as a the lattice constant. The values of a in RE 3Fe50tz-a these data are very much higher than those presented rare earth). For example there is given a value of GdiG at -lg p0z:6. 2:5 and T:1370 K.
of YIG and GdiG pOz's ranging degree of function of derived from in [4] (RE: a:o, 714 in
A direct IR spectroscopic identification of [V0 J in GGG was presented by Andlauer and Tolksdorf [32].
Wolfmeier (2:6) from his ESR-measurements on GGG concludes, that the oxygen-vacancies are mainly doubly ionized (V0 • • ), which 1S in accordance with other results.
3.t.'l ~tectrtcal condUctivitY and thermo-electric power In Yl6
Larsen and Metselaar nave performed several measurements of the electrical conductivity to check their hypothesiS [7, 6, 10]. The first paper dealing With this item gives high temperature current-voltage and ac-conductivity data as well as the low temperature high and low frequency permittivity for polycrystall1ne YIG. The results are interpreted in terms of a two-layer model: well conducting grains are separated by poorly conducting grain boundaries. This is in contrast to other ceramic materials like yttria or zirconia in which good conducting grain boundaries are surrounding poorly conducting grains [e. g 33].
13

De-measurements of the resistance tn (Gd,YlaFe 5o12 were also recently published by Kuanr and colleagues [34]. They come to the conclusion that the Gd-substttution in YIG does not affect the grain boundary potential barrier height.
In another paper (6} the influence of extrinsic impurities (acceptor Pb2+ and donor st4+ simultaneously) on electrical conductivity and optical absorption of YIG is investigated. The resistivity of the sample has a maximum when the concentration difference ts
eq- 3. 7
From Seebeck measurements it became clear that the sample at the point of maximum resistivity changes from n-type to p-type conductivity as [Pb2+J increases.
The same paper [61 also gtves the band gap energy determined by electrical measurements as 3. 15 eV for the hopping model and 2. 85 ev for band conduction. The latter is in good agreement with the optical measurements giving a band gap of 2. a - z. 9 ev [64].
Reference [71 gtves the po2-dependence of a (pOz ranging from to5 to 1 Pa) at four temperatures between 1487 and 1707 K. The sample was polycrystalline YIG containing o.oz Mg per formula unit. The a-po2 isotherms snow a distinct minimum at the transition from p-type to n-type conductivit~ This result is interpreted on the basis of electronic defects alone without paying attention to possible tonic conduction in the po2-independent a-regime.
Moreover, paper [8) presents a combination of the thermoelectric power a and conductivity a.Asatn a conversion from n-type to p-type conductivity was observed. The temperature dependence of a and a are the same within the experimental error. This result and the interpretation of the Jonker's pear lead the authors to the conclusion a large polaron model is in best agreement with experimental results. Jonker [65] has shown that it 1s often useful to combine the expressions for a and a into an equation. From that it follows that the shape and dimension of an a vs. ln(a/~minl plot depends only on the transport coefficients and the bandeap enera~ Using such plots one ts able to compare data obtained from different samples.
In 1966 Petrov et al. [35) published a paper ask1na what is the nature of electrotransport in •pure' YIG. Starttna from oxide powders as pure as possible they stntered 'balanced' samples (containing I: o. 011 wt. Y. donors and I: o. 010 wt. Y. acceptors). Petrov and coworkers measured the conductivity a as f(pOz,Tl and the thermopower a as f(p02, T). They come to the conclusion
14

tnat tne properties of their samples nave to be explained on the basu of a small polaron model. Concerning tne problem of the conduction mechanism (small- vs. large polaron model) it has to be remarked tnat the interpretation of experimental results is difficult; a final decision cannot be made for YIG. The conclusions may be valid rather for the individual YIG samples than for the YIG in general. There is only a single paper [36] which gives a very short hint about the ionic transport properties of YIG, revealing that the YIG sample under test was a pure electronic conductor (note that there is no information on the impuritY content of the sample nor the po2 at which the transport measurement was performed).
The apparent discrepancies found for electrical transport properties of iron garnets can be ascribed to various causes, which are analysed in Vinkler's book "Magnetic Garnets" [31]. He states that the preperation and analysis of well defined samples is difficult, that the conductivity 1S relatively small due to small mob1l1ties of the cnarce carriers and that the ionic nature of the material leads to different points of view concerninc the interpretation of experimental results (see ref. [31), p. 311)
3.t.5 Other Iron 6arnets
Lal and coworkers [37-39) report electrical conductivity measurements made on several iron garnets with Gd, Dy, Ho, Er or Yb in the dodecahedra! c-site. The conductivity was investigated by an ac-voltage as a function of temperature and frequency and the thermopower is civen as a function of temperature. Ref. [391 lives tne values of the mob111t1es v of the charge carriers in six different iron garnets. In ref. [37-391 1t 1S argued, that the electrical conduction in these materials is extrinsic and related to tne presence of impurities. Lal and coworkers suggest a 'thermallY activated hopping' model as a suitable explanation for their experimental results.
3.2 YTTRIUM ALIJMINIIJM - ANI> OTHfR N(JN-IRO"' O~TS
Besides YIG some other garnets nave found applications 1n technology. Doped yttrium aluminium garnet (Y3AI 5o12 l became a widely used laser host material [40]. Also gadolinium scandium gallium garnet (Gd3Sc 1. aGa3. zOtz I [411 has attracted recent interest as a potential host for ions in solid state laser technology, as well as CALGAR (Ca3AieGe301zl [42] which was tested at HIT not long ago.
15
Gadolinium gallium garnet serves as a substrate in the iron garnet thin film technology and can, as Hakuruku et al. [431 demonstrated, be used as a refrigerator in low temperature physics (magnetic cooling).
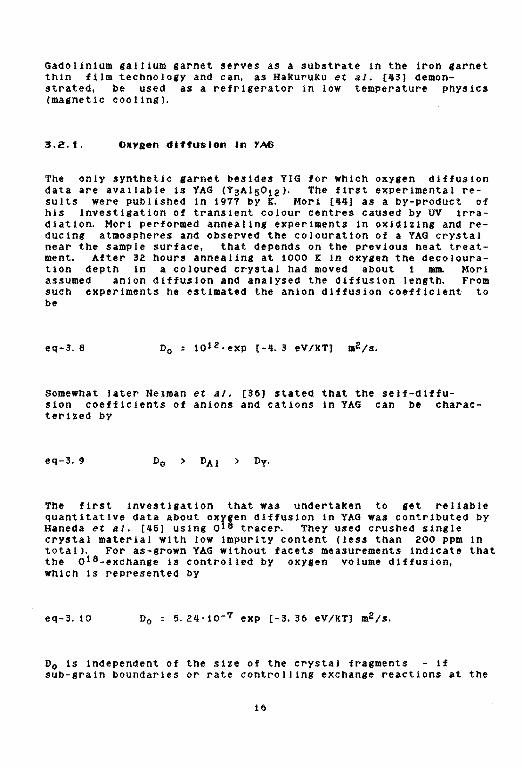
3.2. t. ~~yaen diffusion In YAG
The only synthetic garnet besides YIG for which oxygen diffusion data are available is YAG (Y3Al50t 2 l. The first experimental results were publ1shed in 1977 by K. Mori (441 as a by-product of his investigation of transient colour centres caused bY UV irradiation. Mori performed annealing experiments in oxidiZing and reducing atmospheres and observed the colouratton of a YAG crystal near the sample surface, that depends on the previous heat treatment. After 32 hours annealing at 1000 K in oxygen the decolouration depth in a coloured crystal had moved about 1 DL Mori assumed anion diffusion and analysed the diffusion length. From such experiments he estimated the anion diffusion coefficient to be
eq-3. 6
somewhat later Neiman et aJ. [36) stated that the self-dlffusion coefficients of anions and cations in YAG can be characterized by
eq-3. 9
The first investigation that was undertaken to get reliable quantitative data about oxrgen diffUsion in YAG was contributed by Haneda et al. [45] uung o 8 tracer. They used crushed Single crystal material with low impurity content (less than 200 ppm in total). For as-grown YAG without facets measurements indicate that the o18-exchange is controlled by oxygen volume diffusion, which is represented by
eq-3. 10 5. 24·to-7 exp [-3. 36 eV/kTJ m2/s.
D0 is independent of the size of the crystal fragments - if sub-grain boundaries or rate controlling exchange reactions at the
16

surface occur, the diffusion coefficient should depend on the particle radius [46]. In a second experiment YAG was heat treated in Al-vapour (as done earlier by Mori [44] ). The resultant crystal was dark coloured (F-centre formation [44] ). o18 diffusion experiments revealed that now the oxygen exchange was not independent of the extent of the surface area. The diffusion coefficient is represented by
eq-3. 11 D 8. 3-to-7 exp [-3. 07 eV/kTJ m2;s.
In both cases (oxidized and reduced YAG) the activation energy of the diffusing species is nearly the same; so Haneda et al. concluded that the transport mechanism of oxygen is the same in both cases. The diffusion coefficient on the other hand, differs one order of magnitude, which led the authors to the conclusion that the oxygen defects are extrinsic in nature. Moreover, Haneda and coworkers considered the question whether oxygen ions diffuse via an interstitial or a vacancy mechanism; following ref. [45] the most probable defects in YAG are oxygen vacancies. So the electrical conduction at elevated temperature can be interpretated in terms of anion diffusion.
Masumoto and Kuwano [47] in 1985 give a deeper insight in the P02-dependence (after a high temperature anneal at a certain pOzl of the optical absorption of YAG. The interpretation of their data support Mori's model [44], in which transient absorption is due to V0 '-centres -a conduction electron captured by an oxygen vacancy; again the predominant role of the oxygen vacancies was confirmed.
3.2.2. ~lectrlcal conductivity In YAO and other non-Iron aarnets
One of the first papers dealing with the high temperature electrical conductivity in non-iron garnets was the work presented by La! and Jhans [48] in 1978. The authors measured o as f(T) in single crystal gadolinium gallium garnet (GGG) in air, Nz, Ar and vacuum. The conductivity was influenced by the gas atmosphere, so Lal and Jhans claimed that ionic diffusion may contribute to total conductivity.
Neiman and coworkers [36] performed ionic transference - thermopower - and conductivity measurements on YAG, YIG and GGG under
17

oxidizing conditions. It was concluded that YAG is a mixed ionicelectronic conductor. The ionic transference number ti was determined to be
eq-3. 12 O. 25(at 1070 K) o. 55 (at 1670 K)•
Following [36} the most disturbed sublattices in YAG are the oxygen - and the aluminium-sublattice; moreover, it is stated that YAG can exiSt with a small Al203-def1cit [36, 49]. The ionic charge carriers are described to be intrinsic VAI''' and V0 • • defects; Heiman does not consider the possibility of inadvertent donors and acceptors.
Bates and Garnier [501 performed conductivity measurements on YAG in 02 and oxygen-inert gas mixtures as f(T). Their single crystal sample had an impurity content of 300 ppm Ha and several other tons in a lower concentration. They found an activation energy of the conduction process of 3. 4 ev between 1220 and 1540 K. This value is the same as that reported later by Haneda et al. [45} describing their diffusion experiments. Contrary to Haneda et al. Bates and Garnier assume a conduction process which is related to the diffusion of Al-ions.
In 1964 a paper about the electrical conductivity in GGG was presented by Hartmann and coworkers [51]. It was pointed out that, due to the large Dand gap and a relatively small activation energy of u, electronic charge carriers could not De 1enerated thermallY across the band gap ( however, nothing is said whether the measured conductivity 1S iontc or electronic, e. g. by measuring til· Hartmann et al. assume that p-type conductivitY is attributed to extrinsic 0 0 ' centres.
A detailed investigation of gadolinium scandium gallium garnet (Gd3Sc1. 5Ga3, zOtzl was contributed bY Schwartz and Duba (52) in 1965. This paper gives a study of ac-conduct1vtty and thermopower of single- crystal material as f(p0 2 l between 1332 and 1622 K. The measurements could only be performed at po2 •s ranging from to5 to 10 Pa because the compound decomposes at lower oxygen pressures. Depending on the temperature a as f(POzl changes with a slope ranging from -1/16 Cat 1352 KJ to -3/32 (at 1622 K). This situation was assumed to be associated with the creation of oxygen vacancies, a sltuatlon that can be controlled by the neutrality-equation [e' 1 = 2 [V0 • • ). An Ionic contribution tQ the conductivity could explain the very shallow slope of lg t:1 vs. Ig pOz-plot. The activation energy of the conduction process ts 2. 4 ev.
16

Furthermore the thermopower is not independent of T as would be expected for an electron hopping (small polaronl model with a fixed number of charse carriers [53]; such a situation was found for ca3MnzGe3o12 [54].
Until 1985 no work on the defect chemistry of YAG was presented, besides the paper contributed by Hetman [36] and a short note published by Andreev et al. [55) susgestinB that electrical transport in YAG may be associated with a recombination o.f electronic charse carriers with oxygen vacancies. Rotman et aJ. [56, 57, 58, 59] presented an extensive study of the high temperature properties of YAG. The first of the three papers presents electrical conductivity data of Ce-doped YAG including both t 1 as f(p02 l and the ionic and electronic contribution to total conductivity. ThiS study on YAG:Ce has shown it to be a mixed ionic-electronic conductor. Measurements are consistent with a defect model dominated bY doublY ionized oxygen vacancies fixed in number bY background impurities. The vacancies were found to move with an effective migration energy of 2. 3 eV. A strong n~type component dominated at lower p02's, while a ptype component becomes evident at the most oxidizing conditions.
An analysis of the conductivitY resulted in a value for the thermal band gap of 6. 1 ev and a redox energy of 7. a ev for the reaction o0 x ~ V0 • • + 2 e' + 1/2 o2 .
This work was followed by two papers [58, 59) considering the influence of Hi- and Zr-dopants on electrical and optical properties of YAG. Electrical conductivity measurements of Hi-doped material exhibit results consiStent with a defect model in which the concentration of doubly ionized vacancies is controlled by background acceptors and the p02-dependent concentration of <Uvalent Hi ([Hiltotal : [Ht2+J + [Ni3+Jl. An activation energy of 2 - 2. 2 ev was found for the moving tonic charge carriers and the ionisation energy of N1Alx--+ H1Al' was found to be t. 6 ev.
The data on YAG ~oped with Hi + Zr showed a marke~ ~ecrease in ionic conductivity while p-type conduction increases at low pOz. No ev1~ence of a cnange of the valence state of the .dopant ion Hi was observed, indicating that Zr fixes the Hi into the NtZ+ state even under oxidixing conditions.
3.3 SITf fXC~f frffCTS I~ OARNfTS
The redistribution rate of cations between the d-, a- and c-sites of garnets has been elucidated by Roschmann [60] in quasibinary
19

mixed yttrium iron gallium and iron aluminium garnet single crystals between 773 and 1523 K. The frozen-in cation distributions of quenched or slowly cooled samples were derived from magnetization measurements and bY a phenomenologtcal kinetic equation. The activation energies derived for a thermallY activated inter-sublattice Id-site +--~ a-site) redistribution ranee from 1. 3 to 4 ev and are related to the concentration of anion vacancies. The barrier heights for the considered inter -and intra-sublattice site exchange effects are stronclY reduced by anion vacancies surrounding the cation-defect. The statistical Jumps of the vacancies due to thermal fluctuations at elevated temperatures thus provide a mechanism for observed enhancement of cation redistribution rates in mixed garnets e. g. yt tr lum iron ga 111 um garnet. It 1 s inferred that •premeltinB' or local melting of defect centres play an important role in solid state ionic migration. For a perfect (zerodefect) garnet the intrinsic inter-sublatttce a~ d barrier 1S 4. 5 ev. As will be discussed in chapter 16 our computer si mutation work comes to the conclusion that a Jump of anAl-ion from an a- to a d-site needs an enersy not lower than 3. 5 ev
Roschmann further derived, that the c ~c barrier he1tht, 1. e. the energy for a Jump of a c-site ion from one dodecahedra! site to another, 1s 5. 4 ev. Apparently the c-c bonds form the stronsest binding scaffold of the garnet structure.
LITfRATtiRf
[t) P.Hansen, B. Hill, v. Tolksdorf, Phi lips Teen. Rev., !U. (1963/64) 33.
[2] L.G. van U1tert, F. V. swanekamp, J. Appl. Phys., ~ (1967) 1513.
{3) R. Metselaar, P. E:. Larsen, J. Phys. Chem. So lids,, ll ( 1976) 599.
[4) R. Metselaar, RA.H. Huyberts, J. Solid State Chem. ~ {1977) 309.
{5} P.K. Larsen, R. Metselaar, Phys. Rev., 11.§. (1973) 2016. [6] P. E:. Larsen, R. Metselaar, J. Solid State Chem., ll {1975)
253. [7) R. Metselaar, P. K. Larsen, Solid State Comm., ll (1974)
291. [6] P. K. Larsen, R. Metselaar, Phys. Rev., .IU.! (1976) 2520. [9] R. Metselaar, M.A.H. Huyberts, J. Phys. Chem. Solids, 1!
(1976) 2257. [10) P. X:. Larsen, R. Metselaar, Mater. Res. Bull., .§. {1973)
663. [ 11) H. J. van Hook, J. Am. Ceram. Soc. , .!a ( 1961 I 206. (12) A.E. Paladino, E.A. Magu1re, L.G. Rubln, J. Am. cera~ Soc.
ll (1964} 260. [13} Y. H. 01sl'l1, v. D. Kingery, J, Cl'lem. Phys., ll (1960) 460.
20

R. E. MiStier, R. C. Coble, J. Am. Ceram. Soc., ll (1971) 60. (14} J.A. K1lner, Mat. Scl. Forum, 1 (1966) 205. [15] J.A. Kllner, B.C. Steele, L. IJkov, Solid State Ionics, ll
(1964) 69. (16] R. c. LeCraw, E. M. Gyorgy, p, D. Pierce, J. w. Nielson, s. L.
Blank, D. c. Miller, R. Wolfe, APPl. Pllys. Lett., ll ( 1977 l 243.
[171 T. Hiblya, Y. Htdaka, IC. suzuu, J. Appl. Phys., .!2 (1976) 2765.
[16] D. L. Wood, E. D. Kolb, J. P. Remeika, J. Appl. Phys., ll (1966) 1136.
[191 D. L. Wood, J. P. Remeika, J. Appl. Phys., ll (1967) 1036. [20) E. M11an1, P. Parol!, J. Appl. Phys., ll (1964) 2173. [21] G. Suran, H. Iouve, P. Gerarc:t, J, Appl. Phys., ll (1963)
2006. [22) E. Mllanl, P. Paroli, B. Anton1n1, APPL Phys. Lett., ll
(1963) 1074. [231 B. Antonini, P. Parol1, Phys. Rev., ~ (1983) 3422. [24] A. S. Lyashevich, a E. Shimanivich, I. F. Kanonyuk, ~B. Kos
myna, Russ. J, Phys. cnem. , .lU. ( 1977) 1413. [25) A. s. Lyashev1ch, N. E. Shlmanovlch, I. F. Kanonyuk, ~B. Kos
myna, Russ. J, Phys. Cbem., .lU. (1977) 1584. [26) U.H. Wolfmeter, Ph. D. Thesis, Hamburg (1960) {27] Morkel, H. Schmalzried, z. Phys. Chem. N. F., .U. {1962)
76. [28) J. Rabier, Ph. D. ThesiS, L' Universite de Poitiers (Nr.
305), (1979) [291 H. scnmaizrted, "Festkorperreaktlonen" Verlag Chemte, Wein
heim, 1971, p. 100 [30) v.v. Pankov, L.A. Bashkirov, J. Solid State Chem., 2Q
(1965) 123. [31] G. 111nkler, "Magnetic Garnets", Vleweg & Sohn, 1961 [32) B. Andlauer, 11. Tolksdorf, J. Appl. Pllys., M (1979) 7986. (33) M. Miyayama. H. Inoue, H. Yanagtda, J. Am. Ceram. Soc., C-164
( 1983 ). [ 341 M. Kuanr, J, A pp 1. Phys. .ill ( 1977) 1679. [35] A.N. Petrov, G.V. Denlsov, V.M. Zhukovsk11, Izv. Akad. Hauk.
SSSR, Neorg. Mat., l4 (1966) 663. [36] A.Yu. Neiman, E.V. Tkachenko, V.M. Zhukovsk11, Dokl. Akad.
Nauk. SSSR, Z!W_ (1976) 676. (37) V. R. Yadev, H. B. Lal. Jap. J. Appl. Phys., ll (1979) 2229. [36) V.R. Yadev, H.B. Lal. Can. J. Phys., ll (1979) 1204. [39) H. B. Lal, B. X. Verma, V.R. Yadev, J. Mater. Sci., 12
(1982) 3317. [40] A.A. Kam1nski1, "Lasernu Kr1stally", Izd Nauke, Moskow
1975, translated "Laser Crystals", Springer Verlag, 1963. (41) ~ Pruss, G. Huber, ~ Betmovski, ~v. Leptov, I.A.
Sherbakov, Yu. v. Zhar1kov, Appl. Phys., ~ (1982) 355. (~2] s. R. Rotman, H.L. Tulle!', M. Roth, A. Linz, J. APPI. Phys.
ll ( 1965) 5320. [43] Y. Hakuraku, H. Ogata, Jap. J. APPL Phys. ll (1986) 140. [441 K. Mori, phys. stat. sol. (a), !la (1977) 375. [45] H. Haneda, Y. Miyazawa, s. Sh1rasak1, J. Cryst. Growth, ~
(1964) 581. [46} s. ShirasaKi, I. Shido, H. Haneda, M. osawa, K Manaoe, Chem.
21

Phys. Let t. .2.Q ( 1977) 459. [47] T. Masumoto, Y. Kuwano, Jap. J. Appl. Phys., ll (1985) 546. [46] K. La!. H. K. Jhans, Indian J, Phys., .2,U (1976) 433. [49} V. V. Osiko et al. " Spectroscopic Investigations of Defect
Structures in ionic Crystals" in Crystal: Growth, Properties and Applications, Vol. 10 (Growth and Defect Structure), Springer Verlag, 1965, p, 36.
[50} J. L. Bates, J. E. Garnier, J. Am. Ceram. Soc., (1981) C-136. [51] E. Hartmann, L. Kovacs, J. Plaitz, phys. stat sol. (a),
ll (1964) 401. [52] K.B. Schwarze, A.G. Duba, J. Phys. Chem. Solid., !l.§.
(1965) 957. [53] H.L. TUIIer, A.S. Nowick, J. Phys. Chem. Solid., ll (1977)
659. [54] G. OversluiZen, T.H.J.M. Kuijper, R. Metselaar, Phys. Rev.,
Hi ( 1984) 4540. [55] A. P. Andreev, s. F. Akhmetov, G. L. Akhmetova, s.v. Davydchen
ko, B. N. Kolodiev, s. V. Kolodieva, M. I. Samolilovich, Acta Cryst., A !lQ., Suppl, (1964) C-330.
[56} & & Rotman, P~ ~ Thesis, MIT 1985. [57} S. R. Rotman, R. P. Tandon, H. L. TUIIer, J. Appl. Phys., ll
(1985) 1951. [56] s. R. Rotman, H. L. Tuller, Mater. Res. Soc. Symp. Proc. M
(1966) 413. [59) S. R. Rotman, H. L. TU I I er, J, Appl. Phys., ll ( 1987) 1305. [60] P. Roschmann, J. Phys. Chem. Solid., R (1981) 337. [61] v. M. Zhukovski, T. G. Veselovskaya, A. Ya. Neiman, Russ. J.
Phys. Chem., ll (1981) 145. [62] F. Lindner, Acta Chem. Scand., .§. ( 1952) 456. [63] Yu. ~ Voro'bev, ~I. Dragoshanskaya, & ~ Matskevich, A.~
Men, Izv. Akad. Nauk. SSSR, Neorg. Mater. 1.§. (1980) 1083. [64] & Wittekoek, ~~A. Popma, J.M. Robertson, AlP Conf. Proc.,
ll (1974) 944. [65] G.H. Jonker, Philips Res. Repts. u. (1966), 131
zz

4 LITERATURE REVIEW : COLOUR CENTRES AND PARAMAGNETIC DEfECTS I~ GARNETS
1.t COLOUR CfNTRfS
Many papers dealing with colour centres in YAG nave been pub-1 iShed in the past. These centres, crystal defects in nature, are analyticallY detected by absorption bands between zoo and 600 nm wavelength Cor as ESR-active paramagnetic centres). On the whole they are similar to tnose in alkali hal1des {1]. On laser applications the absorption of the pump radiation bY these colour centres contributes to tne heating and subsequent deterioration of the effectiveness of the crystal as a laser.
In view of the large amount of papers dealing with this subJect a restricted review pointing out the most important aspects for thiS thesiS is given.
In 1967 Bass and Paladino [2] published a first paper describing the properties of absorption bands in YAG evoked by radiation with a Xe-flashlamp. The same absorption bands were detected in N<l-doped YGG grown from a non-stoichiometric melt. In the same paper [2] the authors demonstrate<! tnat radiation induced <lefects in YGG heal in time at temperatures below 370 K, wnile for the same process in YAG a considerably higher temperature is required. No suggestion about the structure of the observed colour centres was given Bass and Paladino.
Later in 1966 Arsen'ev and coworkers [3] reported the formation of colour centres in Eu- or Yb-doped YAG during the annealing in vacuum (low oxygen pressure) or as a result of gamma-irradiation. The centres formed in vacuum were attributed to ionized complexes consisting of activator ions (Eu or Yb) and oxygen vacancies, while those formed during irradiation were interpreted as 00 ' or 0 0 ''-centres.
In spite of the fact that nothint is said explicltely about the structure of colour centres in YAG in ref. [2, 3] it iS evident, that defects in the oxygen sub-lattice play a crucial role. The concept of the formation of 00 -centres 1n YAG as proposed in [3] is the logic generalisation of early experiences gained with Alz03-crystals by Maruyama et al. [4] and Bertram et al. [5).
Batygov and coworkers [6] tried to trace back the colouration of YAG after gamma-irradiation at room-temperature to rare earth
23

impurities. They found Pr and Tb to increase the absorption between 300 and 500 nm after irradiation. This is considered to be associated with the oxidation of Pr3+_ and Tb3+-ions to the 11+-state. So these ions act as hole traps. The elements Eu and Yb are reduced during irradiation to Eu2+ and Yb2+• which should act as electron traps.
Kvapil and colleagues [6) investigated both the reversible colour change as a function of the annealing atmosphere and several doping elements (Be, Mg, ea, Sr, Ba as well as Ni, Fe, Ti, V, Mn, er, eo). YAG crystals doped with iron group ions in a higher valency state (11+) can be coloured yellow-brown by annealing in oxygen; when exposed to UV-radiation the colouration is deepened. The crystals containing iron group ions in a lower valency state (2+), Mg2+ or ea2+, can be coloured yellow-brown to a less extent by an anneal in oxygen. Annealing in H2 fullY eliminates the colour in all samples, with the exception of YAG:Ni, which becomes greenish-black. The colour change induced by a treatment in oxygen begins at 1170 - 1270 K. Kvapil and eo-workers interpreted the nature of these absorption centres in terms of a foreign ion induced compression of o2--ions in the first coordination sphere. This and the requirement of electro-neutrality leads to the formation of 0 0 '-defects.
Such 0 0 '-centres have in particular been observed in alumina as an absorption band [16) at nearly the same energy as in YAG. Other papers published by Kvap11 and coworkers dealing with the influence of various annealing conditions and dopings on the crystal colouration are given in ref. [9-10).
A detailed study of non-stoichiometric defects appearing as colour centres in YAG was given bY Kvapil and coworkers in 1965 [11). They found brown colour centres termed "durable" because they do not bleach out easilY by annealing in crystals grown from slightly non-stoichiometric melts. Centres having a brown colour were introduced by growing YAG from a melt having a small surplus of v2o 3 (3. 005:5 < Y:Al < 3. 01: 5). crystalS grown from a melt containing a small surplus of Al 2o3 (Y:Al < 2. 99: 5) show a blue coloration. The colour intensity depends on the H2/ H20 ratio in the protective atmosphere in the growth apparatus. Kvapil assumes that the brown colour is caused by the introduction of a certain amount of YA 1X-defects during the crystal growth. Subsequent cooling causes a compression of the substitutional Y by the oxygen-polyhedron, followed by a release of an electron forming a hole or a bound polaron according to Bernhardt [1~].
Bernhardt standing Following (Si02: Al)
was the first who took of the structure of. results obtained for obtained bY Schirmer
pains of gaining a deeper under-00·-centres in YAG [12-16). crystal-defects in smoky quartz et a/., [17) Bernhardt
* Eu3+ is the rare earth ion with the greatest electron affinity, followed by Yb3+ and sm3+ {7].
211

applied the "bound polaron model". By performing model calculations [16] of colouration bands in YAG:Mn he verified the polaron character of the centres. Holes have less the character of simple o0 · ("self trapped holes") than Qf (000 0 )'-centres, which is a defect electron fixed between two oxygen ions. A further refinement of thiS model leads to the conclusion that the oscillator o2-. ·hole· ·o2-must be stabilized by an additional coulomb-potential that acts perpendicular to the vibration direction. This stabilizing potent1al should be an impurity ion (see fig. 4. 1)
The polaron model proposed by Bernhardt was later confirmed by Cermak [19].
Fig. 4.1
~x
'· q ~ ..--•,x·O e+' ~, - / .
R/ /
/ / o-a
Model of a linear harmonic osc1 JJator stabilized by an additional Coulomb potential (from [16])
Mori [20] performed optical absorption and ESR measurements in pure and re-Si - doped YAG. He found a correlation between the bleaching of the absorption bands and the disappearence of the isotropic ESR-line. From the g-values found in the ESR-spectra Mori concluded that in YAG:Fe, Si electrons are trapped at the iron-ions (a hole-like centre) while in pure YAG electrons are captured at anion vacancies, which act as colour centres.
The russian group around Karaseva and Gromov published a series of papers concerning colour centres in YAG [16, 21-24), proposing a "multi defect model".
25

1.2 P~TI~ Dfff~TS
Several paramagnetic defect centres caused by foreign cations in YAG have been investigated in the past. However, many more papers dealing with paramagnetic centres in alum1na have been published in the recent years. One of the pioneering publications describing electron spin resonance studies in acceptor-doped a-Alz03 w,as presented by Cox (251 1n 1971. crystalS containing Me+Ti, LI+Ti {in a compensating molar ratio) were gamma-irradiated, which turned the previously colourless crystals to a darK brown colour. Subsequently recorded ESH-spectra were interpreted in terms of single holes trapped bY the negatively charged defects MgAI'• LiAl"and VAt"' , Which form MiAIX• LiAl' and VAl" respectively. The primary product of the irradiation are electronhole pairs. The electrons may be trapped by positively charged defects {e. g. TiAI. ), but these were not detected in [25]. The brown colour was attributed to the paramagnetic defect-bound hole in a concentration of about to18 per cm3.
The structure of the trapped hole defect in alumina has first been discussed in a theoretical paper by Bertram [5). He used a model of a hole localized on just one o2- in the nearest neiehborhood of the substitutional defect. Cox interpreted his results on the basis of that model
In a following paper Cox [26] investigated At 2o3 doped with Me. Annealing in a reducing atmosphere produces colourless and ESR inactive samples containing the closed shell defect MiAI'• which is compensated by intrinsic or extrinsic donors. Annealing such a crystal in oxygen results in a paramagnetic, purple-grey sample. ESH spectra can be attributed to a hole trapped by MgZ+, that is to the neutral defect MaA 1x. The hole is located on an oxygen ion next to the impurity (• (00 • MgAl' Jx. These defects are perfectly stable. Later Kroger, Cox and colleagues [271 annealed Mg-doped alumina at different oxygen partial pressures and performed ESH measurements. It was evaluated, that the concentration of the paramagnetic centres decreases successively with the oxygen pressure. Based on that fact a defect model of Me-doped alumina including a POz-dependent hole-release mechanism was proposed.
The defect model of alumina described above is of interest for us because comparable po2-dependent ESR-data are not available for YAG.
Mori (26] performed ESR and optical absorption measurements on undoped YAG after a h1th temperature treatment ln an At-vapour. After this reduction the crystals had a dark blue colour. The ESH spectrum associated with this colour had a a-value Which was slightly smaller than that of a free electron. So Mori concludes that the ESR-date indicate an electron {trapped at an oxygen vacancy) rather than a hole, resonating in a defect. The ESR-signal disappeared simultaneously with the decolouration of
26

the crystal. BY investigating the moving colour zone while oxidising a reduced sample Mori [26] evaluated in a clear way, that this process is connected with anion diffusion. After irrad1at1nl an undoped YAG crystal with UV-lilht the same author detected ESRsignals with g-vatues which were assumed to be due to hole-centres of the o·-type.
Mort [26) suggested that the luminescence peaK occurring at an energy of 2. 6 ev (460 nm) is connected with the release of electrons from oxygen vacancies which recombine with holes.
Referring to thiS suggestion Hayes et al. [29) presents own experiments and a reinterpretation of Mori's data [26]. Hayes et al. bring into discussion the idea of self-trapped excl-tons or holes near cation-vacancies (for simple oxides there 1s evidence for holes trapped near cat1on vacancies [301 ). This theory's maJor problem iS that while it is true that holes tend to be located at negatively charged cation vacancies, both the number of holes and the number of cation vacancies should decrease when the crystal is annealed in atmospheres of decreasing po2. Instead the emission data show an increase in 300 nm emission with decreasini oxycen pressure (31]. Robbins resolved thiS dilemma bY postulating a second defect which competes with the luminescent one at 300 nm [32-35]. Based on this he developes a model which can explain the experimental data, as summarUed in [31).
In 1966 Asatryan and coworkers presented ESR-measurements performed on zr-doped YAG [37]. such crystals, crown under hydrogen, showed a red colour, which was not observed when charge compensating tons (Ca or Mg) are present. x-ray measurements performed on ceramic samples revealed that the lattice constant a0 decreases with lncreasinc Zr-concentratton.
ESR-spectra of Zr-doped YAG snow the presence of paramagnetic centres localized in the dodecahedra! sates. These centres are associated with zr3+ ions 14<11, s.: 1/Z). Other oxidation states of Zr are not ESR-actlve, and are not expected to be present in a considerable concentration 1n reduced YAG. In another experiment Asatryan and coworkers snowed that there is a direct correlation between the ESR-intens1ty and the intensity of the optical absorption (brown colour) an Zr-doped YAG. The colour centres and the paramagnetic centres are assumed to be the same in nature (see fig. 4. 2 ).
Z7

as
0 as
Correlation of ESR and optical Jntensities {17).
several ESR-experiments were performed to find out how the different crystallographic sites in the garnet structure are occupied substitutionally by foreign cations (mainly transition elements). ESR measurements are described for YAG containing e. g. Fe3+ [43), cr3+ [431, Gd 3+ [43}, vZ+/4+ [44, 45), zr3+/4+ [371, co2+ [36], Mo3+ [46], Mn2+ [47}.
Although the aim of this short review is not to give detailed information about site occupancy, nevertheless it should be mentioned that there 1s one paper describing not a substttuttonal metal ion in YAG but an interstitial co2+ [38]. This should be look-ed upon in some more detail. Experiments made with eo-doped yttrium gallium garnet (YGGJ [39-421 gave no indication that cobalt occupies interstitial lattice sites. However, Yosida and colleagues [38} took ESR-spectra of YAG doped wtth 1 at.x eo and tried to interpret their data assuming substitutional cobalt-ions. The angular dependence of the spectra showed that the lines do not come from substttuttonal co2+ or co3+ spins alone. So 1/3 of the eo-ions having the charge 2+ are located on interstitial sites to charge-compensate 2/3 eo3+ positioned on substitu-tional sites - sofar the model proposed by Yosida. In a second step the authors identified 24 magneticallY inequivatent interstitial positions and one of then was chosen to be the most appropriate: the 46 g-pos1t1on (see fig. 4. 3). ThiS is the first clear evidence of interstitial ions in YAG.
28

FJg. IJ.3
LITfRATURf
0 Octahordrat (16)
e Tetrohedrat (24)
0 Dodtcahtdral(24)
~ lntHStitial (48)
crystal structure of YAG. oxygen ions are not snown. The interstltial site occupied by eo is given by a hatched circle [38}.
[ 1 J F. Se 1 tz, Rev. Mod. Phys. ll ( 1954 J 7. (2] M. Bass, A. E. Paladino, J. Appl. Phys., ll (1967) 2.706. [3] ~~ Arsen•ev, ~~ Kustov, ~ Li, M.~ Chukichev, Krlstallo
srafiya, ll (19681 740. [4] T. Maruyama, Y. Matsuda, J. Phys. Soc. Japan, 1.2.. (1964}, 1096 [5] R.H. Bertram, c. E. svenbers, J. T. Fournter, Pnys. Rev., ~
(1965) A 941. [6] S.Kh. Batysov, Yu.K. Voron'kov, B. I. Denker, A. A. Maier, V. V.
Oslko, ~ s. Radyukhln, M. I. Timoshechkl~ soviet Physics -SOlid State, ll (1972) 839.
[71 s. Kh. Batysov, "Spectroscopy of CrystalS", Nauka, Moskow, 1970 p, 167.
[8] J. Kvapil, Jo. Kvap11. B. Perner, B. Manek, Krlst. Tecnnol., .1..Q. (1975) 529.
[9) J. Kvapil, Jo. Kvapil, B. Perner, Krist. Technol., .1..Q. (1975) 161.
[10) J. Kvap11, Jo. Kvapil, B. Perner, B. Manek, Kr1st. Technol. .1..Q. ( 1975) 1051.
29

[11) J. Kvapi 1, Jo. &:vapi 1. B. Perner, B. MAnek, I. Blazek, z. Hendrlch, cryst. Res. Tech .• .aQ (1985 l 11:73.
(12) H. J. Bernhardt, Phys. Stat. So 1. (a), ll ( 1975) 365. (131 (a), ll (1976) 211. [141 !a), ll (1976) 463. [151 (a), ll (19761 11:11:5. [ 16] (b). ll ( 197 6) Z13. [17) o. F. Sch1rmer, R. Schnadt, Solid State commun. ,ll (1976)
t 311:5. {18) N.Y. &:onstanttnov, L. G. Karaseva, v.v. Gromov, Proc. Acad.
Se 1. USSR, Phys. Chem. Sec., .all (1960 I 653. [19) I. Cermak, Phys, Stat. Sol. (a), M (1961) 1::37. [20] K. Mort, Phys. Stat. Sol. (a), H. (17771 375. [21] L.G. Karaseva, E. I. Saunin, v.v. Gromov, N.A. Anisimov, Hlgh
Energy Chem., ~ (1975) 29. [22] v. v. Gromov, L. G. Karaseva, E. I. Saunin, Russ. J. Phys.
Chem .• ~ (1976) 1617, [23) v.v. Gromov, L.G. r.:araseva, E. I. Saunin, Russ. J. Phys.
Chem., ll (1977) 145. [211:] A.G. Rozno, v.v, Gromov, A.V. Romanov, A.A. An1s1mov, sov.
Phys. SOlid State, ll (1976) 1430. [251 R. T. cox, Solid state commun. ~. (1971 1, 1989 [261 R. T. cox, J, de Physique, !a (1973) 333. [271 H. A. wang, c. H. Lee, F. A. &:roger, R. T. cox, Phys. Rev. B,
ll (1963) 3621. [261 JC. Mort, Phys. Stat. Sol. (a), H. (19771 375. [291 w. Hayes, M. Yamaga, D. J. Robb1ns, B. cockayne, J. Phys. c:
Solid State Phys., ~ (1980) L1085. [30) A.E. Hughes, B. Henderson, "Point Defects in Solids" Vol. I
Ed. H.J. Crawford Jr. and L.M. Sl1fk1n, Plenum Press, New York, 1972.
[31] & ~ Rotma~ P~ ~ Thesis, Mass. Institute of Technolog~ 1985. [32] D.J. Robbins, B. cocKayne, B. Lent, C.N. DucKworth, F. Mans
field, In " Proceedings of the 12. th Rare Earth Research Conference • 1976, ~ 100~
(33} D.J. Robbins, B. Cockayne, B. Lent, C.N. Duckworth, J.L. Glasper, Phys. Rev., i. li (1979) 1254.
[34) ~~ Bobbins, & Cockayne, ~~ Glasper, & Lent, J. Electrochem. Soc., ill (1979) 1213.
{35) ~~ Robblns, & Cockayne, ~ ~ Glasper, & Lent, J. Electrochem. Soc., ill (1979) 1221.
[301 ~~ Robblns, & cockayne, J. L. Glasper, & Lent, ~ Electrocnem. Soc. , ill ( 1979) 1556.
{37) H. R. Asatryan, A. s. JCuzayan, A. G. Petrosyan, A. JC. Petrosyan, E. G. Sharoyan, Phys. Stat. Solid. (b), .1:ll (1966) 343.
[36] T. Yosida, Y. Chiba, M. Date, J. Magnetism Magnetic Mater., .il=-ll ( 1963) 669.
[391 J. R. cnamber lain, R. V. cooper, Proc. Phys. Soc. , ll ( 1906) 967.
[~01 M. D. sturge, F. R. Merr1tt, J. P. Remelka, Appl. Phys. Lett. ~ (1966) 63.
(11:1] M. D. sturge, F. R. Merritt, J.C. Hensel, J. P. Remelka, Phys. Rev., ~ (1969) 402.
[ 421 D. L. Wood, J. P. Re me ika, J. Chem. Phys. , ~ C 1967) 3595. (431 R. A. serway, F. H. Tang, s. A. Marshal 1, Pnys. Stat.
30
Sol. (b), .11.2 (19761 267. [441 I. I. Karpov, B.~ Grecnushnikov, ~ ~ Koryagl~ ~M.
Kevorkov, Pnam Za Ngi, Dokl. Akad. Nauk. SSSR ~ (19791 74.
[451 I. I. Karpov, B. N. GI'echustm1kov, V. F. Koryag1n, A. M. Kevorkov, Pham Za Ng1, Dokl. Akad. Nauk. SSSR, ~ (1976) 330.
[45] G. R. Asatryan, A. s. Kuzanayan, A. G. Petrosyan, E. G. Sharoyan, G.o. Sh1r1nyan, sov. Phys. Solid State, ll {1967) 335.
[461 J. A. Hodges, J. Pnys. cnem. so lids, ll (1974 J 1365.
31

5 SAMPLE PREPARATI~ AND EXPERIMEmAL SET UP
5.t POWDfR PRfPARATICN
Several papers describing preparation methods for YAG ceramic powders nave been published in the past. The classic route for oxide ceramics is the so-called mixed oxide method [1} in which mixed oxide powders react at elevated temperature to the proper compound. More advanced methods for YAG powder synthesis such as freeze-drying [ZJ, hydrothermal growth [3), sol-gel techniques [q) or spray-drying (5,6] lead to much better powders than the mixed oxide method.
The samples investigated here were prepared by spray-drying sulphate solution (modified sulphate process) [5): Alz(SOqlz was solved in HzS04 (pH:3) to which a proper amount of of Yz03 was added while the pH was Kept constant by addition of HzS04. After spray drying the solution calcination was done at 1600 K. Subsequent ball milling in iso-propanol and sievtng gave a powder with an average grain size of • 1 vm [5].
Controlled doping with altovalent cations such as ea, Mg or Zr was done following two different routes:
a) by addition of a proper amount of an ethanolic solution of ea-. Mg- or zr-nitrate to the powder and subsequent heating to vaporize the alcohol
b) by immersing presintered pellets (1820 K, 2 h in air (see section 5. 2) with a porosity of 20-30 x In methanolic solutions of zr- or Hf-acetylacetonate for 12 hours. It was assumed that the rest-porosity is open porosity, so from the penetrated volume of solution (assuming that all pores are completely filled) the dopant concentration could be estimated. This method did not lead to homogentous samples: only a surface layer contains an appropriate dopant concentration.
5.2 SINTfRING (If' THf: POWDfRS
Two grams of pure or doped powder were pressed uniaxiallY with 40 MPa (densitY=1. 6 gtcm3=35~ relative density) and presintered on an alumina holder for e h at 18eO K in air, the samples were not sintered in a powder-bed.

Afterwards the pres1ntered samples were placed in a Mo-holder and s1ntered in an Astro-furnace tn a H2/H20-atmosphere !H2 saturated with water at 293 K) with the fo11owtns temperature program:
60 K/ mJn 5 K/m1n room temperature ------7 1170 K > 2070 K
sinter time 120 min at 2070 K
to K/min 100 K/min 2070 K 1170 K -----·;;> room temperature
5.2.1 Evaporation effects durtna sinterina
Sintertns at hlih temperature and, in the case of YAG, in a strongly reducing atmosphere, involves a considerable evaporation of material. The drastic loss of MSO sinter-dope has already been rea1Ued in the first s1nter experiments; a YAG powder doped with 500 ppm MgO for example contains 50 ppm MgO after final sinterins at 2070 K. To a lesser extent also an evaporation of Al 2o3 has to be taken into consideration. Auger-analyses of sintered surfaces of ea-doped YAG showed that also cao tends to vaporize, but to a much smaller extent than MgO; the entire ea-concentration in a sample decreases insisniflcantly (for evaporation of ceramic mater1als see also [29) ).
The effect of a severe wetghtloss of oxides heated in reducing atmospheres is treated Heuer by and colleagues in [30] giving several volatllity- and E1lingham-d1agrams. Fig. 5.1 gives a volatility diagram for MgO in Hz/H2o- and co;co2-atmospheres for different temperatures.
From fis. 5. 1 1t can be derived for example that if the H2o;H2 ratio changes from 0. 01 to 0. 001 at 1900 K, PMg increases from 30 to 300 Pa. It is a role of thumb that weightloss due to evaporation from a high temperature ceramic material is important only if the vapour pressure 1s higher the o.oot Pa- following this susses-
33

tion MgO is a h1Shly volatile matter [30].
Fl/1. 5.1
5
'ii ~
0 .
0 .. :1
Q.
CO !l
1500K -5
-15 -10 -5 log Po
IOOIPi<,o'PH,I 2
0 Pa
log IPco,IJ>col
Volatility dJa11ram for M/10 in different reducinl atmospheres ( the dotted line is constructed for n2o/Hz: to-2J£90J
When we apply these diasrams for pure oxides we have to bear 1n mind that we are not deatlng with Single phases, but with solid solutions (dopants) or with dispersed particles (in the case of Al-rich inclusions, which will be discussed later). But nevertheless, such diasrams give a quite useful impression about solid state-gas phase reactions in the system we are considering.

1 7 6 6 s s 4
• 3 3
l § J ..
R
Fig. 5.2
Fig. 5.3
log IPco,'Pcol -~L -3.!: -2.!: -z log IPHp/PH,l 1-s '-4 /_3
Al-0 1 7 6 6
5 ~ 5 4 • 3 3
7.N 0 u
0 a. "' J J )(
0
" Q.
Cl g
-10 -20 -15 -10 -5 0 5
logpo2 cs c• ;-3 log (PH,oJPH,l
z.. /_3 '-2 /_1 log IPco,'Pcol
Volatility diagram tor the AJ-0 system (30}.
IV 5Q.
~-0.
0
i -5 0
!2
-10 ~-----,~s-----_+.,o.----_~s----~o~--~5
l<>oPo, Pa
Comparison of volatility for AJ-0 and Mg-o systems at 1900 K {30}.
35

For Al203 the volatility diagram 1S shown in fig. 5. 2. Th'e Al-0 species with the highest tendency to evaporate is Alo2. Asssuming a H2o;H2 ratio of o. 003 and T=2100 K the vapour pressure of AIOz can be estimated as o. 1 Pa. Relying on this result the vapour pressure of alumina under reducing conditions is not negl1i1ble.
For the diagrams 1900 K.
sake of comparison fig. 5. 3 shows the volatility for both the Al-0 and the Mg-0 system in one plot at
There is one paper known to us giving data about the evaporation rate of - as suggested by the authors - YAG from a melt !T=2~00 -2500 K) [31]. ThiS paper considers a progresSini weight loss, without asking 1f the melt changes In stoichiometry, e. g. due to volatiltsatton of AlOz. Extrapolating the plots given 1n [31] to our sinter temperature leads to following evaporation rates:
a) i:!070 K in air:
b) 2070 K in Hz/HzO:
o. 75·10-3 8/Cmi:!h
o. 5 · to-i:! g;cm2h
For a YAG pellet with 1. 6 cm 1n diameter it can be estimated that o. 05 g material != 2. 5 Y.) will evaporate wh1le sintertng 2h tn a Hz/HzO-atmosphere.
5.3 S~LVBILITY Vf ~a, Ma, Zr AMD Hf IN YAO
We found that ea has a low solubility tn the YAG lattice [7]. Significant ea-rich precipitattons were detected by SEM/EDX in samples containing ea-concentrations as low as 500 pp~ It was found that Zr has a much higher solubility in the YAG lattice;700- 600 ppm were so 1 ved w 1 thout forming second phases. We checked the solubility of Hf and found that 1000 ppm are soluble without forming precipitates. The solubility of Mg ts not investigated due to the high volatility (see also section 16 where solution enthalpies are estimated based on computer simulations).
36

5.1 flf~TRI~AL ~ASVRf~NTS
To get an insight into the defect chemical properties and some microstructural features the electrical conductivity as a function of T and po2 was investigated at high temperature. The theory of defects in ionic crystals and their practical determination was worked out and properly described by Brouwer [6), Kroger (9), van Gool [10] and Brook [11), experimental methods for high temperature conductivity measurements were worked out and described by Peters [12), Brook [13), Ozkan [14], Blumenthal [15], Schmalzried [16), Kltazawa [171 Etsell [25] and others. The interrelationshiP between ceramic microstructure and ac-frequency dispersion or dielectric relaxation has been considered by Jonscher [16], Macdonald [19, 20], Bauerle [211. Armstrong [221 and several other workers in the mentioned papers.
The conductivitY cell we used was a spring loaded alumina cell, (see fig. 5. 4), comparable to that described in [23]. This cell was placed in an alumina tube wrapped with Pt-foil to shield disturbing fields caused by the furnace. We used a de-driven SiC tube furnace with a maximum temperature of 1670 I.
ConductivitY measurements were performed with a Solartron 1174 frequency response analyser (1 MHz o. 0001 Hz) interfaced to a HP-66 computer. Samples equiped with painted or sputtered Ptelectrodes were connected to the Solartron as shown in fig. 5. 4 B. The data were analyzed and presented in the impedance or admittance mode by choice or as a 3-dimensional z• vs. z· •vs. frequency plot.
For measuring the pOz dependence of the conductivity different oxygen pressures were maintained by mixing o2;N2, co;co2 or H2/H20. The pressures were controlled with a zro2-cell which could measure the gas entering or leaving the cell alternatively to control the tightness of the equipment.
37

A
B
Fig. 5.11
Watercooled gas outlet metal flanges
f Al2<htube
gas inlet
Al2~ capiftary tube Pt blocks with
internal thermocouples
leads for conduction ond temp. measurements
AJ The high-temperature cell for conductivity measurements
BJ Connection of the Solartron to the sample {261
Ionic transport numbers were determined by measuring the EMF develope4 across a disKshaped sample whose surfaces are exposed to different pOz's [26); EMF and ionic transport number t 1 are related by [13):
RT p02 (I I) eq. -5. 1 ln
4F p02 (I)
in which R is the gas-constant, T the temperature, F the Faraday constant, t 1 the ionic transport number and p02(l) and p02(II) the oxygen partial pressures on each side of the sample. The exper 1menta 1 set-up is shown in f 11. 5. 5 . The very sma 11 EMF-ce 11 was placed in a special Pt-wound mini- furnace with 110 mm tube-1 ength and 20 mm tube-d 1 ameter (max. temperature 2020 K ). The ce 11 configuration was Pt pOz(Il 1 TAG I Pt p02 (IIJ.
38

, ..
A I"'
I I I 11 I! I I I I
Kcithley 195 11-t-1
B
Fig. 5.5
Kt' i th lt•y
64Z
I Electromt.'ter
Pt r r {\ ~t /.?,,, [ •'" \) 11 l't
Oat a -Pt lilt Rh 1.....- Precision
8ZOO Voltage Calibrator
A) Arrangement f or measuring the EMF using a cylindrical volume -guard {28]
B) The electrical set - up
The apparatus shown in fig. 5. 5 also allows us to determine the sign of the Seebeck-coefficient [2~] . Because a stable temperature gradien t could not be mai n t a i ned along a block - like shaped piece of YAG, due to the low conductivity, a thermo - pulse led t o the si gn of the Se eb ec k - coefficient or thermo - electric power. This thermo pulse was generated by bl owi ng a stream of a ir on one face of the sample, while the directi o n of the change in the EMK was recorded. This change was attributed to a thermoelectric power superposing the EMF. So it was possible to detect the sign of the predominant c harge c arrier.
39

5 .... 1 [lectrodes and electrode-effects
In all solid state electrical measurements we used platinum electrodes because of their excellent high temperature stability in reducing CO/C02 atmospheres as well as in oxidizing ambient. It was shown that Pt-electrodes have a low electrode-resistance and a high oxygen permeabi 11ty [32, 33].
We used painted (Demetron Pt-paste, usually fired 2 hat 1470 Kl and sputtered Pt-electrodes (painted over with Pt-paste to counteract a reduction of electrode area by evaporation). Impedance spectrometry is a very sensitive tool to check if the electrodes are blocking or approximately !deal, particularly because the Solartron reaches frequencies as low as 1o-4 Hz. An !deal impedance diagram with a distinct bulk-, grain boundary-and electrode effect ls shown ln f !g. 5. 6. The electrode arc ls due to the double layer capacity at the electrode-electrolyte interface.
As a by-product of the investigation of our samples two questions have been be answered
1) how does the electrode preparation (painting or sputtering) influence the electrode resistance ?
2) how does an anneal at 1600-1900 K influence the electrode resistance ?
Referring to question 1 we have to state that painted Pt-electrodes in many cases give rise to a wide arc in the complex impedance plane , while sputtered electrodes behave ideally as shown in f !g. 5. 6 .
40

1.21
::E :I: 0 ~
{lroin bomdary . 0.60 0 ......
. N
0.00
0.00 0.85 1.70
Z' [1 0'5 OHM]
10.00
::E :I: 6.67 0 ~ . 0 ......
3.3 3 . N
0.00
0.00 4.67 9.33 14.00
Z' [10'5 OHM]
F ig. 5.6 Complex 1mpedance plot for po/ycrystalllne YAG show1ng an obvious difference in the electrode benavJour : top : pa1nted P t - e l ectrodes, burnt 1170 K bottom : sputtered Pt - e l ectrodes (frequency rang e 1 MHz - 0.01 Hz) .
'!1

PaintPd electrodes exhibit a wide frequency dispersion arc due to a high capacity (several hundred ~F/c m2, fig. 5. 6 top), while sputtered ones cause no capacity at the interfa c e (fig. 5. 6 bottom). SEM-ptctures of a painted electrode show that the contact with the electrolyte is rather bad (fig. 5. 7). The cavities act as capacitors causing the observed electrode effect; the de-resistance represents the sum of sample and electrode resistanc e . Sputtered Pt-electrode s behave Ideal, which means that the deresistance i s the sample re s istance. Consequently direct current conductivity measurements, which are often reported in literature, can be used but have to be considered with caution.
Fi g. 5 .7
ELECTRODE (Pt)
VOID ELECTROLYTE (YAG )
SEM- picture showing the electrode-electrol yt e int er f ace a ft er a conduct 1vity measurement (about 20 h at 1600 K 1n variable po2 • sJ
Co ncern1n g qu~ stio n 2 we fo und a r at her i mpress ive depend e nce of the e l ectrode re s i stance on t he therma l hi s tory. A s put t ered Pt

electrode (overpainted with a protective Pt-layer) was annealed 2 h at 1300 K. The impedance spectrum given in flg. 5. 8 A elucidates that there i s no electrode effect. Afterwards the electroded sample was annealed for 15 minutes at about 1900 K in air (cooling rate about 100 K/min) and an impedance spectrum was recorded under the same circumstances as before (fig. 5. 8 B). One wide low frequency dispersion-arc is seen, from which a capacity of 1000 ~F
(!) for the electrode-electrolyte interfa c e can be de P ived (ele c trode area smaller than 1 cm2); a well separated electrolyte - arc is no longer detectible. Next the electrodes were removed by a careful polishing procedure and new ones were sputtered; then again an impedance spectrum was recorded under the same conditions as before (see fig. 5. 8 C) - the difference between Impedance spectrum B and c is substantial. The resistance of the sample has drastically decreased by a factor of 15. Analyzlng the position of the frequencies revealed that the 1 kHz-impedance (a frequency where electrolyte impedance usually intersects the real-axis) has not changed, so the properties of the electrolyte did no t c hange markedly while annealing the sample; consequently the phenomenon is due to a change of the electrode-electrolyte interface.
l 0.00
2 A
::r: 6.61 0
'l"' . Q ......
3.33
~ 0.00
0.00 4.67 9.33 14.00
Z' [I 0'5 OHM]
43

~ = 0
-
1('1
Q ......
Fig. 5.8
10.00
B
6.67 13Hz
3.33
0.00._ ______ ~--------~----~ 0.00 4.67 9.33 14.00
z• [1 0'5 OHM]
10.00
c
6.67
3.33
1kHz
0.00'~ 0.00 4.67 9.3 3 14.00
Z' [1 0'5 OHM)
AJ Non-blocking sputtered Pt-electrode at 1300 K, sample as received
BJ The same sample annealed 15 min at 1900 K in air measured at 1300 K
CJ The same sample after the electrodes were renewed by sputtering.
(note t h at the Z'-axis ha s the same scale in all three plots)

This experiment has clearly shown in which way disturbing electrode-effects can influence a measurement. Again we have to state that de-data, particularly those obtained at very high temperatures (measurements on alumina were often performed at 1800 -1900 K, e. g. ref. [31i, 35)) may be falsified by massive electro<1e effects.
LITt:lu\TURf
[1) B. Bogdanov, I. Comacov, J. Iljev, Silikattechn., ll ( 1986) 221i.
[2) M. F. Yan, T. c . D. Huo, H. c . Ling, J. Electrochem. Soc., .u.!i ( 1987) 'i93.
[3) T. Takamorl. L.D. Davi<1, Am. Ceram. Soc . Bull., ll (1986) 1282.
['i) G. Gowda, ceramic Process Research Lab. HIT Res. Rept. R9 ( 1986 ).
[5) G. de With, H.J.A. vanDiJk, Mater. Res. Bull.,1..2. (1981i) 1669.
[6) G. de With, Phi lips J. Res . , .iZ. (1987) 119. [7) L. Schuh, unpublished results. [8) G. Brouwer, Philips Res. Rept., .2 (1951il 366. [9) F . A. Kroeger, "The Chemistry of Imperfect crystals", North
Holland, Amsterdam, 1973. [101 w. van Gool, "Principles of Defect Chemistry of Crystalline
so li<1s" , Aca<1emic Press, 1963. [11) R. J . Brook in "Electrical Conduction in ceramics and Glass",
ed. by N.M. Tallan, Marcel Dekker, New York, 1971i. [12) D.W. Peters, L.F. Feinstein, C. Peltzer, J. Chem Phys.,.iZ_
(1961i) 231i5. [ 13) R. J. Brook, J. Yee, F. A. Kroger, J. Am. Ceram. Soc. , ll
(1971) lilili . [11il o. T. ozKan, A. J . Moulson, Brit. J . Appl. Phys . , ll (1970)
983. [15) R. V. Blumenthal, M. A. Seitz in "Electrical Condu c tion in
Ceramics and Glasses" ed. bY N. M. Tall en, Marcel Dekker, New YorK, 1971i.
[16) H. Schmalzrie<1, Z. Phys. Chem., Neue Folge, ll (1963) 87. [17) K. Kltazawa, R. L. Coble, J. Am. Ceram. Soc . , TI (1971il 21i5. [181 A. K. Jonscher, "Dielectric Relaxation in Solids", Chelsea
Dielectrics Press, London, 1983. [19) J. R. Macdonal<1 , J. Chem. Phys ., ll (1971il 3977. [20) J. R. Macdonald (ed. ), "Impedance Spectrometry", J. Wiley &
Sons, 1967. [21) J . Bauer le, J . Phys. Chem. Solids, ]Q (1969) 2657.
[22) R. D. Armstrong, R. Mason, J. Electroanal. Chem., ll (1973) 2 31.
[23) R. Metselaar, P. K. (1976) 599.
Larsen, J. Phys. Chem. Solids, ll
[241 R. R. Heikes in "Thermoelectricity", (ed. llY R. R. Heikes and R. w. Ure), Interscience, New York, 1961.
[25) T.H. Etsell, S.N. Flengas, Chem. Rev., 1.Q (1970) 3'H. [27) c. T. Morse, J. Phys., El. (1974) 657. [26) A. M. Hoefsloot, P. H. F. Thijssen, R. Metselaar, Silicates
Ind., ~ (1965) 35. [29) W. B. Hillig, Genera I Electric, Techn. Inform. Ser., 65CRD152
( 1965 ). [30) V. L. K. Lou, T. E. Mi tche 11, A. H. Heuer, J. Am. ceram. Soc.,
.u. (1985) 49. [31) L.A. Oganesyan, V. Ya. Khaimov-Mal'kov, sov. Phys. Crystallogr.
ll (1980) 510. [32) ~ ~ Blumenthal, M. A. Seitz, "Electrical Conductivity in
Ceramics and Glasses " , ed. lly N. L. Ta 11 an, Marce I Dekker, 1974.
[33) Da Yu Wang, A. S. Nowick, J. Electrochem. Soc., .1.ll ( 1979) 1156.
[341 S.K. Mohapatra, F.A. Kroger, J. Am. Ceram. Soc., li (1977) 381.
[35) J. sea Chen, F. A. Kroger, J. Mater. Sci., .aQ (1965) 3191.

6 ANALYTICAl J[CHNIQUfS AND RfSULTS
6.t flfMfNT ANALYSIS
The impurity and dopant content of all powders and sintered samples were ana!yzed by optical emission spectroscopy (OES) and Xray fluorescence. For the samples doped by the immersion technique (see sect ion 5. 1) the depth profile of the do pant concentration was determined by laser microprobe analysis (LMA). The results of LMA showed that only a 200 ~m thick surface layer was homogeneous I y doped, White the centre is free of do pant. This result makes clear that doping of presintered porous samples by immersing in a solution is not practicable (due to c losed porosity) . So electrical measurements were performed with samples made from doped powders.
Dopant or characteristic impurity concentrations are given in the following chapters together with the experimental results.
6.2 AUVfR ANALYSfS
The compositions of as-fired and fractured surfaces were investigated by Auger scanning microprobe (SAMJ. The analYtical information depth was o. 5-2 . o nm. To get analytical data from deeper areas the sample was sputtered with Ar+ ions (2kV/62~ ~A cm-2) for 1 min resulting in a sputter depth of approximately 8. 5 nm.
Ye ana!yzed surfaces of sintered YAG samples doped with 100 ppm ea fired at 2020 and 2070 K respectively. E~perimental results indicate that a) ea concentrates at the surface and b) the higher the s1nter temperature the lower is the ea-concentration in the surface layer (see tab. 6. 1)

Tab. 6.1 Auger analysis depth profile of YAG: 100 ea sintered at C!OC!O and 2070 K
surface
idem sputtered#
surface
idem sputtered#
Sintertemperature
2020 K
2070 K
# sputter depth = 8. 5 nm
ea-concentration in at. z
7. 4
8. 5
1. 8
3. 0
Measurements were performed at the analytical laboratory at the Philips Lighting Division (CALL).
The ea-concentration in fractured surfaces was investigated by the same method. But due to the fact that YAG breaks transgranular (fig. 6. 1 ) no controlled information about a segregated film on the surface of the grains can be derived (an ultra high vacuum/high temperature fracture-setup was not disposable). Nevertheless we found fresh surface areas containing 1. 5-2 at . r. ea which reduces below the detection limit (0. 5 at. r.) after sputtering away a 8. 5 nm thick surface layer. This indicates that ea segregates forming an intergranular film. That is in agreement with our other experimental results.
48

Fig. 6.1 A typical transgranuJar fracture surface (note the crack through the grain marked with an arrow, which indicates high cohesive strength of the grains) . (bar = 10 "m).
49

7. AI-RifH INCLUSIONS IN YA~
The first examinations of dense slntered YAG-powder revealed that small spots (fig. 7.1 l are present where the Al-concentratlon IS higher than 1n the YAG-matr1x, 1n spite of the fact that the powder was wel~hed out stoichiometrically. Mulder and de With [1] investigated these inhomogeneities, which are present in volume fractions varying between 0. 5 and 15 x, by transmi s sion electron mi c ros c opy. It wa s detected tha t the inclu s ions Induce a strain In the garnet matrix (due to different thermal expansion coeff le lents ).
The diameter of the inclusions In the samples we lnvestl~ated
(about 20 samples from different sources, doped with different sinter - additives) ranged from o. 5 to 1. 5 wm.
Several attemps were made to prepare inc lusion-free YAG c era mi cs. I t was a s sumed, that sintering In H2; H2o results in h omo geneous material [2]; however, although the concentration of inclusions is lowered when compared with samples sintered in vacuum, they are still present.
Fi~'· 7.1 Typi c al sphere-shaped AJ 2o3 -1nc1usions in s 1n t ered YAG (bar= 1 /.101) . (Wlt/J c ourtesy by P/JlllPS Laboratories, Eindh ovenJ
50
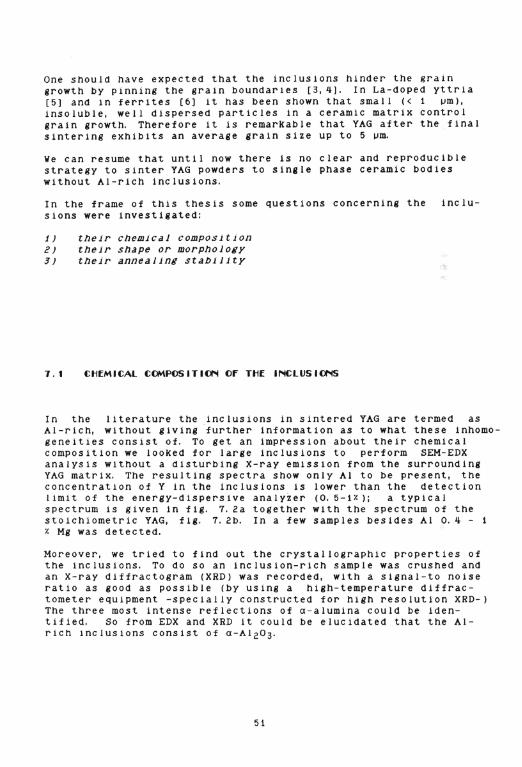
One should nave expected that the inclusions hinder the grain growth by p1nning the grain boundaries [3, 4]. In La-doped yttria [5) and in ferrites [6) it has been shown that small (< 1 ~m),
insoluble, well dispersed particles in a ceramic matr1x control grain growth. Therefore it is remarkable that YAG after the final sintering exhibits an average grain size up to 5 ~m.
We can resume that until now there is no clear and reproducible strategy to sinter YAG powders to single phase ceramic bodies without Al-rich inclusions.
In the frame of this thesis some questions concerning the inclusions were investigated:
t) their chemical composition 2) their shape or morphology 3) their annealing stabilitY
7.t CHEMICAL CVMPOSITIVN OF THE INCLUSIVNS
In the literature the inclusions in sintered YAG are termed as Al-rich, without giving further information as to what these inhomogeneities consist of. To get an impression about their chemical composition we looKed for large inclusions to perform SEM-EDX analysis without a disturbing X-ray emission from the surrounding YAG matrix. The resulting spectra snow only Al to be present, the concentration of Y in the inclusions is lower than the detection limit of the energy-dispersive analyzer (0. 5-iY. ); a typical spectrum is given in fig. 7. 2a together with the spectrum of the stoichiometric YAG, fig . 7. 2b. In a few samples besides AI 0 . 4 -x Mg was detected.
Moreover, we tried to find out the crystallographic properties of the inclusions. To do so an inclusion-rich sample was crushed and an X-ray diffractogram (XRD) was recorded, with a signal-to noise ratio as good as possible (by using a high- temperature diffractometer equipment -specially constructed for high resolution XRD-) The three most intense reflections of a-alumina could be identified. so from EDX and XRD it could be elucidated that the Atrich inclusions consist of a-A1 203.
51

FJ({. 7 . t?
1.Z
1a AI y
1b AI
EDX-spectra of an inclusion ( J.bJ and the YAG matrix (J.a),
T~[ SHAP[ VF T~[ AI-RI~~ INCLVSIOMS
The inclusions can be observed on fractured or polished surfaces in the scanning electron microscope or in YAG-foils in the trans mission electron microscope as darK structures (due to the high Al-content). Three characteristic shapes of alumina-inclusions can be distinguished:
a) perfectly formed spheres with a diameter ranging from 0. 5-1 um. in some cases up to 1. 5 urn; this homogeneously distributed form is the mos t abundant (fig. 7. 3a)
b) rand omly formed or "cloudliKe" inc lusions having an extension
52

of some urn Wlth a certa1n or1entat1on (flg. show1ng the tendency to accumulate
7. 3b)
cl crysta!llte-llke 1nclus1ons with well formed crystal mostly having the shape of a block (flg. 7. 3c ).
and
faces ,
The Inclusions are located at the grain boundar1es and in the inter1or of the gra1ns.
7.3a
73 b
5 3

Fig. 7.3
~c
The three typical shapes of Al - r1ch 1nclusions 1n sintered YAG 7.3a spheres (bar=JOO vmJ 7.3b "cloudlike" inclusions (bar=JOO vmJ 7.3c crystallite-like inclusions (taken from [J]J
(bar=20 nm)
7.3 T~E~l STABILITY Of T~E INCLUSI~S
At the present moment it is not clear if Al 2o 3 segregates from the matrix at the s1nter1ng temperature or whil e the sample coo ls slowly down.
A long time annealing experiment showed that the alumina inclusions are not drastically changed after a 200 h heat-treatment at 1670 K in air. Checking a polished cross-section before and after annealing s howed alterations in the shape of the inclusions only near the sample sur fa ce. the interior of the sample stays complete ly unchanged.
Fig. 7 . 4 s hows the detailed morpholog y of the inc 1u s 1o ns near
54

the sample surface after a long time anneal. The tnc lustons have spread out and cover the gratns. EDX analysts of the darK regions revealed that they are sttll Al-rtch, but also a considerable concentratton of yttrtum ts detectible.
Until now it is 1n no way clear if and how the alumina-tnclustons impair the properties of YAG as a high temperature mate r ial. With a vtew to the slow alteratton of the tnclustons near the surface duringa long time hlgh temperature treatment we have to taKe into consideration that also the defect chemical situation alters progresstvely. The fact that the inclusions at the surface are altered first may tndtcate that an evaporation process or an tnfluence of the p02 of the surrounding is causattve.
Al y
38. 16 wt 6 1. 8'0 wt x
Al y
~7. 27 wt 52 . 7 3 wt x
Al - rlch 1ncJusions near the surface have spread out due to an annea 11ng for 200 h at 1670 K; the compos 1t1on of different spots is g1ven .
55

Concerning the gra1n boundaries it 1s possible that Al-rich phases form a phase around the gra1ns (as 1nd1cated in SEM-plctures. f1g. 7 . '!), With preferred grain boundary diffusion. ThiS suggestion 1s in accordance w1th the 59Fe self-diffusion experiments performed on ceramic garnet samples by Zhukovskii and colleagues (7]. They came to the conclusion that the transport of Fe along the grain boundaries in Ca3Fe2Ge3012 and YCa2Zr2Fe30i2 is clearly preferred.
Fig. 7. 5 shows an often observed phenomenon 1n sintered as well as in annealed YAG: a 10 - 60 ~m thiCk surface layer is absolutely inclusion free, while the rest of the material contains the well known alumina-inclusions. Thus the defect chemistry of "inner bulk" and the "near surface bulk" should be different. This effect s hould not affect our measurements. because we always polished the s ample surfaces properly before fixing the electrodes.
Fi;:.". 7.5
SURFACE
A phenomenon that was o ften obse rv ed in sintered YAG: a l a yer near the s urface i s 1nc !usion free.
56

L ITfRATURf
[1] C. A.M. Mulder, G. de With, Solid State Ionics, .1.2. (1985) 81.
[2] F.J.C. Toolenaar, G. de lilth, Proc. Brit. Ceram. Soc. 11. (1986) 21!1.
[3] G. de With, Phillps J. Res. ll (1987) 119. [I!] M. P. Harmer, H. M. Chan, D. M. Smyth, Mat. Res. Soc. Symp.
Proc. ,M (1987) 125. [5] li.H. Rhodes, J. Am. Cerarn. Soc., M (1981) 13. [6] M.F. Yan, D.li . Johnson Jr., Mater.Sci.Res., 1..1 (1978)
39 3. [7] V. M. Zhukovsk11, T, G. Veselovskaya, A. S. Zhukovskaya, A. Ya.
Ne iman, Rus s . J. Phys. Chem. , 2,2 ( 19 81 ) 11!5.
57

8 6RAI~ BVU~DARIES I~ YA6 I~VESTI6ATED BY TEM
In polycrystalline materials boundaries between the grains dominate many of the technologicallY important properties. For example, the electrical properties of semiconductors [1] and ceramics [2] are strongly influenced by intergranular interfaces. Also the high temperature loss in strength of silicon nitride, for instance, has been attributed to the presence of a thin intergranular glassy film. Creep, sintering and corrosion are generallY dominated by the presence of grain boundaries.
The resistance to corrosion from alKali metals is an inportant property to examine for further application of YAG ceramics. Clairns and Murie [3] reported a corrosion rate of 1~ ~m per year for liquid lithium corrosion at ~46 K. Under the same conditions alumina has a corrosion rate of 12 mm per year. To confirm corrosion resistance de With and coworKers [4] immersed YAG ceramics in Na in a Mo-container for 300 h at i170 K and investigated the samples afterwards by SEM/EDX. YAG doped with Si02 had a corrosion layer of only 3 ~m. YAG doped with MgO exhibited very similar results. In contrast, CaO-doped YAG has a much lower resistance against the attacK of hot sodium _vapour [5] . De With ahd coworKers have shown by TEM that Sio2 as well at MgO have no tendency to form segregation layers at the grain boundaries in the material they tested [~].
We performed TEM studies on ea-doped YAG in order to see whether or not there is a difference between the grain boundary structure in the CaO-doped material and the MgO-doped material tested by de With and coworKers. [~). A marKed segregation layer at the grain boundaries of Ca0-conta1ning YAG could explain the poor corrosion resistance of that material.
8. t I:XPI:RIMENTAL
For observations in the transmission electron microscope (TEMJ the specimen must be transparent for electrons; so sample-foils have to be prepared. YAG discs, 3 mm in diameter and some tenths of a mm thi c K were obtained from the bulK material. The samples were thinned with the aid of a dimple grinder. A subsequent ion-milling procedure (GATAN dual ion mill model 6000) with Ar-ions (3 kV, 100 angle of incidence) was carried out until perforation occurred. The TEM investigation was done with a JEOL JEM 2000 FX transmission electron microscope working at 200 KV. The study was done with YAG doped with 500 ppm cao.
56

8.2 RfSULTS AND DISCUSSION
F1g. 8. 1 shows the boundaries between three gra1ns, which are v1sible as almost straight bright 11nes. The angle between the boundar1es 1s 120 · . No segregated phase at the triple po1nts is detectible. If the plane of the interfaces is not pre c isely parallel to the incident electron beam (inc lined boundary), so-called thicKness fringes are observed at the grain boundaries. In such a case structures may be observed at "clean" boundaries, which appear simi Jar to real segregated phases (7] . In order to c hecK lf real second phases are present in YAG: 500 ea two grains were adjusted s o that Moire-fringes were seen 1n ~ grains. This situation is shown in fig. 8. 2 (due to the photo-mechanically copying procedure the fringes in the upper grain are hardly visible). In fig . 8. 2 a diStinct intergranular phase about 2 nm thick is seen. Thi s thi c kness determined by TEM 1s c ompara ble with the values ob tained by Impedance spectrometry (4 - 7 nm), see se c t1on 9.
59

F 1g. 8.1 A triple po1nt 1n YAG : 500 ea. no tr1p!e p o int pnase 1s present.
60

Fig. 8.2 Moire - fringes in two adjacent grains . An intergranular segregation phase 1s clearly visible. The upper r1ght part of the p1cture shows amorphisation due to ion mllling.
61

8.3 TEM-STUDIES OF YA() DESU~IBED IN LITEPATUPE
In sp1te of the fact that YAG has gained techno logically importance in recent years, only very few TEM-studies on single crystals are available. As already mentioned Mulder and de With [6] investigate d grain bound a ries in polycrystalline YAG. They found n o segregation of se co nd phases at the grain boundar1es in YAG doped with 500 wt. ppm MgO. Our experimental re s ults show that in ea-doped YAG a segregation taKes place. ZaKharov and colleagues [8] present more fundamental high resolution many-beam images of YAG. They give experimental and calculated density distributions of lattice images up to a resolution of 0. '1- nm. Ashbee and Thomas [9] in an early TEM-study fr o m 1968 investigated dislocations and tw1nning phenomena in YAG crys tals .
LITEPATUPE
[1] C.R.M. Grovener, J . Phys. C: Solid State Ph y s., £1. (1985) 1!09 7 .
[ 2 ] [ 3 ] ['I-]
L. M. Le v i n so n (e d . ) , Adv. Cer am., .1 (1 985 ) 1 2 7 . E. J . Cla irns, R.A. Murie, J . E lect r oc h e m. Soc . .1£1., G. d e With, P. J. Vru g h t , A. J. M. van d e Yen, J. Mater. (1985), 1 2 15.
[5] unpublished
( 197'1- )' 3 Sc i. . 2 0 ,
[f>] C.A.M. Mulder, G. de With, S o lid State Ionics. 11>. (1985) 81.
(7] D. R. Clarke , Ultramicrosc o p y , !! (1979) 33. [ 8 ] N. D. Za Kh a rov, W. Neumann, R. Hi ll eb r a ndt, V. N. Ros han s ki i ,
P h ys . Stat u s So l idi (a) , 22, (1 979 ) 5 7 3 . (9 ] K. H. G. As h b ee, G. Th omas, J . Ap p l. P h ys ., 1..2. (19 68) 3778.
62

9 MICR{)SIRUClURE ~D MICR{)STRUCTURAL CliNf3fS INVESTIGAUD BY
At-DISPERSIVE MfASUREMENTS
The main feature of this chapter is the microstructure of YAG-ceramics investigated by impedance spectroscop~ The following topics are treated:
1. Second phase segregation and grain boundary thickness in doped YAG samples
2. Temperature dependence of grain boundary - and bulk conductivity
3. Changes of grain boundaries caused by a long time anneal
4. Changes of the grain boundaries caused by quenching.
9.t INTRODV~TION
Impedance spectroscopy has proved to be a useful technique in the investigation of the microstructure and microstructural changes of composite materials having grains, pores, grain boundaries, segregated and dispersed phases. Interesting systems from the scientific point of view are for instance the ordered precipitate phases (Suzuki-phases, NaCl/CdC12) [1, 2]. However, highly ion-conductive oxides are investigated to a much greater extent because of theit technological importance. Most work has concentrated around zirconia [e. g. ref. 3], ceria [4, 5] and 13-alumtna [6,7]. A good introduction into the topic of impedance spectroscopy gives the book "Impedance Spectroscopy• edited bY J. R. Macdonald [15].
Bauerle [6}, in his pioneering work, studied high purity and 'impure• poiycrystalline zirconiL For this distinct ion-conductor he found that the presence of a second phase at the grain boundaries led to the introduction of a second time constant into the equivalent circuit, which was absent in high purity material. Bauerle interpreted his results in terms of a low conductivity second phase introducing a constriction in the area of contact between the grains. The so-called Bauerle equivalent circuit is given in fig. 9. 1 (B).
63
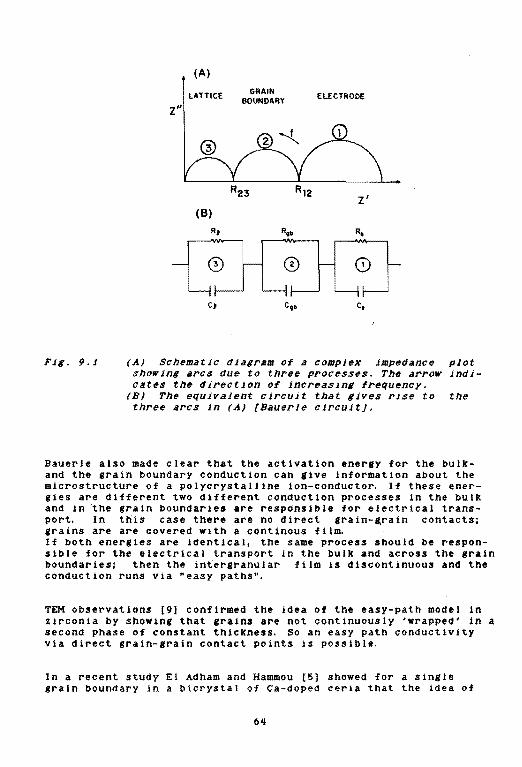
Fig. 9.1
(A)
LATTICE
z"
(B)
GRAIN BOUNDARY ELECTRODE
(AJ Schematic diagram of a complex impedance plot showing arcs due to three processes. The arrow indicates the direction of increasing frequency.
(B) The equivalent circuit that gives rise to the three arcs in (AJ (BauerJe circuit}.
Bauerle also made clear that the activation energy for the bulkand the grain boundary conduction can give information about the microstructure of a polycrystalline ion-conductor. lf these energies are different two different conduction processes in the bulk and in the grain boundaries are responsible for electrical transport. In this case there are no direct grain-~rain contacts; grains are are covered with a continous fit~ If both energies are identical, the same process should be responsible for the electrical transport in the bulk and across the grain boundaries; then the intergranular film is discontinuous and the conduction runs via "easy pathsu.
TEM observations [9] confirmed the idea of the easy-path model in zirconia by showing that grains are not continuously 'wrapped' in a second phase of constant thickness. So an easy path conductivity via direct grain-grain contact points is possible.
In a recent study El Adham and Hammou {5] showed for a single grain boundary in a bicrystal of ea-doped ceria that the idea of
64

the nigh resistivity interphase is valid; two arcs are seen in the impedance spectrum of a bicrystal, while a single crystal gives a single arc.
A
Fill. 9.e
B
SKetch showing how a second phase at the grain boundaries of an electrolyte gives rise to the observed electrolyte dispersion phenomena (A) actual situation, (BJ idealized situation (from [8]).
For p-alumina the interpretation of the impedance spectra is more complicated because of the high anisotropy of a (ac : to15 ua [10)) and the specific structure of the graln boundaries [6). The equivalent circuit describing the impedance behaviour of polycrystalline P-alumina is neither a series (Bauerle circuit) nor a parallel circuit. De Jonghe [6] proposed a random combination of more than 100 RC-circuits; but the problem 1s still unsolved.
Impedance spectroscopy allows to estimate the capacity of a grain boundary layer by applying the simple relationship
eq-9. 1 21fV Cgb R
Cgb is the capacity of the grain boundaries, v iS the frequency at the top of the semi-circle and R the resistance where the low frequency part of the arc intersects the Z'-axis. Koops [11] developed a brick layer model to explain the impedance behaviour of semiconducting nickel-zink ferrite in 1951. The brick layer model for ion-conductors, suggested by Beekmans and Heyne [12) and worked out by van D1Jk and Burggraaf [13) and Verkerk et al. [13] allows to calculate the thickness of the grain boundary on the basiS of the the capacity c derived by using eq-9. 1. For zirconia Badwal and coworkers [14) have demonstrated that TEM studies and impedance measurements come to approximately the same boundary thickness (1. 8-2 nm by impedance and 0. 8 nm by TEM).
65

Before the experiments with poJycrystalline YAG will be described and discussed, we have to point out that YAG is not directly comparable to the ceramic materials mentioned above. Zirconia, ;ceria, ~-alumina are excellent ion-conductors - already at low temperature (300 - 700 K). YAG on the contrary is a highly insulating material up to very high temperatures - so we had to perform impedance measurements between 1200 and 1670 K, where the chance of disturbing temperature effects has to be taken into consideration. In the literature nothing can be found about measurement of the frequency dispersion under such conditions.
9.2 At-DISPfRSIVf DfTf~TION or ORAIN BOUNDARY PHASfS
In this section we describe some characteristics of the grain boundaries in differently doped YAG samples (capacity and thickness of intergranular phases in doped YAG and their dependence on the dopant).
For Al203 a lot of work concerning grain boundaries has been performed in the past - especially for ea- and Mg-doped material in relation to the fracture properties of the ceramics. ea has a high tendency to segregate in alumina, and the material tends to break intergranular when ea is present [16, 17). Auger analyses of fractured surfaces in alumina are given e. g. in ref. [18-21}. For Ca in alumina all investigators come to the conclusion that a strong segregation even at low doping levels takes place during sintering. cook and Schrott [201 in their recent study found the grains continuously covered with a ea-film on a lateral scale of 10 nm (for A1 22o3 + 200 ppm ea). For Mg such a strong segregation effect was not observed in alumina.
9.2.1 !:><pertments and discussion
The following three samples were investigated : ~ YAG doped with 100 ppm ea (YAG: 100 Ca), ~ YAG doped with 500 ppm Ca

(YAG: 500 ea), and~ YAG doped with 50 ppm Zr (YAG: 50 Zr). Fig. 9. 3 shows the impedance behaviour for both ea-doped samples, ea 100 and ea 500, recorded at 1200 and 670 K respectively. Distinct, well established arcs are seen, which can be attributed to bulk- and grain boundary effects according to frequency dispersion theory. From the intersection of the arcs with the real axis the resistances of the grain interior and the grain boundaries can be derived, provided the electrical equivalent circuit modelling the frequency dispersion is Known. As will be shown later by a nonlinear least-squares fit procedure the Bauerle circuit is suitable to describe the behaviour of the samples. Referring to fill. 9.1 A we use the follow1n8 relations: Rb= R23• Rgb' R12 - R23 and c8 b= 1/2nv(R1z-R23 l with R8 and Rgb denotin8 the grain- and grain boundary resistance. The activation energies for grain- and 1rain boundary conductivity differ Si8nificantly (see sect. 9. 4), so the grains should be covered by a continuously film.
i =.:: 0 ,. c:> ... N I
Fig. 9.3
3.50 A' i
so 8
=.:: 0
1.75 <et
25 . c:> -..... ~
0.00 I 0 0.00 1.7S 3.50 0 25 so
z· [10•4 OHM] z· [10•4 OHM)
Complex impedance diagrams of (A) YAG: 100 ea (at 1170 K) and (B) YAG: 500 Ca (at 870 K). Both samples were sintered at 2070 K, the spectra were recorded in Oe (frequency: O.OJ Hz - 1 MHz).
Analyses of several Z'-Z'' plots of both samples· led to the average capacitance of the grain boundaries: YAG: tOO ea = 2200 -3500 pF and YAG: 500 ea = 240 -300 pF (checked at 5 different temperatures). From SEM pictures the averaged grain sizes for both s amp 1 es
67

were derived to be about 1 ~m. Applying the brick layer model the thickness of the intergranular layer can be estimated by
eq-9. 2 Eo € gb d
egb {L/A)
agb is the thickness of the grain boundary, Egb denotes the permittivity and Cgb the capacity of the grain boundary (€gb 1s set equal 5). A and L are area of the electrode and the thicKness of the sample respectively and d = d'•O. 607 where d' is the average grain size for a sphere shaped grain (1~m) [22). In a real solid agb and d' are randomly distributed. For the sake of simplicitY we take average quantities. Vernicke [23), by computer simulation, has shown that such a simple 'brick layer' model is reasonable descriptive of ceramic microstructures. The result of such a calculation is given in tab. 9. 1
Tab. 9.1 Results of a brick layer calculation for YAG: 100 ea and YAG: 500 ea based on complex impedance spectra.
SAMPLE DOPING LEVEL d' [ vmJ
YAG: 100 Ca 100 ppm ea 3000
YAG: 500 ea 500 ppm ea 1 270
* Cgb is averaged over 10 measurements at slightly different temperatures.
agb [nm]
o. 4 - o. 6
4 - 7
Tab. 9. 1 c !early shows that the thickness of the &rain boundary layer increases with increasing ea-level. By TEM investigations we performed on YAG: 500 ea evidence of intergranular phases being 2-3 nm thick was found (see Ug. 6. 2). This thickness is in a good agreement with impedance data.
Zr is known to have a quite good solubility in YAG. Consequently less segregation should occur in YAG: Zr. The sample we investiBated contained 50 ppm Zr. Fig, 9. 4 gives a Z'-Z'' plot showing a
66

single bulk arc with the high frequency branch intersecting the real axis at zero resistance. The absence of a space charge polarisation at the grain boundaries indicates that no intergranular film came into existance.
Fig. 9.4
2.10
1.05
.. N I 0.00
0.00 1.05 2.10
Complex impedance diagram of YAG: Zr 50 recorded at 1450 K in o2 .
The equivalent circuit representing the impedance behaviour shown in fig. 9. 4 is a single RC parallel circuit, from Which a capacity of 5-25 pF (the geometrical capacity) can be derived. For the sample geometry with an electrode diameter of 6•1o-3 m and a sample thickness of o. 7•1o-3 m a dielectric constant EyAG of about 40 can be calculated for the temperature of measurement (EYAG(lit. l= 12 l
Relying on impedance data we conclude that the poorly soluble dopant ea forms an intergranular phase, even at concentrations as low as 100 ppn The thicKness of the film increases with increasing doping level. Additives with a good solubility, such as Zr do not form detectible interphases. Z'-Z'' plots of such material gives a single bulk arc, as for a single crystal. The experimental data are interpreted in terms of a Bauerle circuit.
69

9.3 NON-LINfAR LfAST-SQVARfS fiT (NLLSf) Of IMPfDANCf DATA
In order to prove our proposed equivalent circuit model experimental data were analysed by a NLLSF procedure in the 3-dimensional Z'-Z"-frequency space. Kleitz and Kennedy have developed a special computer program for fitting two depressed interfer-ring semi-circles in the impedance plane [25]. Tsai and Whitmore [261 have described a procedure for fitting a specific equivalent circuit to immittance data. Macdonald and Schoonman [27, 28] have demonstrated the power of a more general NLLSF progra~ The NLLSF procedure we applied here was worked out by B.Boukamp from the University Twente (Enschede, The Netherlands) [29).
The equivalent circuit shown in fig. 9. 5 was chosen to be representative for the impedance behaviour measured in YAG: 500 ea.
Y (CPE) = ( iW )n
Fig. 9.5 The equivalent circuit to which experimental dat4 were fitted in a NLLS procedure (CPE=constant phase element).
The parameters are given in tab. 9. 2
Fig. 9. 6 gives the experimental frequency dispersion data in a 3-D representation (Z' vs. Z" vs. freq. 1 together with the projections on the three planes (Z'-Z", Z'-freq. and Z"-freq.) showing 6~ measured and calculated points. The experimental and calculated data are in a quite good coincidence. The 'chi-square' factor, representing the quality of the fit of experimental data to the equivalent circuit, is as small as 5. 16w to-5, meaning that the f 1t iS very good.
70

c ...., 0 c •rl
.~ ...., ('(I ..... ~ H a a ......
:< ('(I <J) u
IJ 0 :<
&
&
N ~ I
Experimental (o) and calculated (X) Z'' vs. Z' plot
71

':' ~ t4 ...... ......
~ 0 0 ..
Ul Ul .. ..... 0 • I
N : • • tit tit • :.4 0 !
()
~ :
ll> • ...... • ,_. ()
00 c o; • ,_. ~· tit ll> • [ ;::! • f't • • • •
· .. J i • • • • ..... • 0
! N
• : • • z • • • • • • • • • • • • • l8 .l
~ e • e • • •• • • • • • • • •• • w • l8 : >E> ......
:e • • • • tit • l • ..... • tit 0 0\
':' ~ Cf
~ N .. ..... ..... .....
0 0 OUl Ul Ul
Experimental (o) and calculated (x) Z' vs. freq. plot

freq.
Fig. 9.6
Tab. 9.2
Z"
········· ..... · ..
•······· ...
\ Z'
Three dimensional representation of complex impedance measurement (sample YAG: 500 Ca,the same spectrum as fig. 9.3(BJJ together with the three projections on the planes Z'' vs. Z', Z' vs. freq. and Z'' vs. freq .. The open circles (o) are experimental and the cross bars (+J are calculated data.
(frequency-range: J MYz - 0.01 HzJ.
Circuit-parameters - calculated by NLLSF and obtained by graphical estimation from the Z"-Z'-plot
NLLS-FIT ESTIMATED GRAPHICALLY
BULK-RESISTANCE 37. 5 KQ 37. 9 KQ
CPE (Y0 in "mho") Y0 :1. 725-11, n:O, 9055
GB-RESISTANCE aeo. 3 Kn 381. 5 kn
·cPE <Yo in "mho")
The Constant Phase Element (CPE) is characterized by Y(w)=Y0 (jw)n; if n:l the CPE is a pure capacity.
73

Based on above considerations the proposed model of the equivalent circuit representing bulk and grain boundary effects is assumed to be valid. The experimental points are simulated with small error by the circuit shown in fig. 9. 5. The above result iS taken as representative for the other samples which were investigated.
9.4 TEMPfRATVRf DfPfNDfNCf OF GRAIN eDVNDARY
AND BVL~ ~ONDUCTIVITY
Bauerle [8] was the first to suggest that a temperature dependence of the grain boundary and bulk conductivity is interpretable in terms of microstructural characteristics. He introduced the easy-path model to explain the very similar activation energies Ea for grain boundary (Ea(gb) and bulk conductivity (Ea(b)in zirconia. This was briefly discussed in section 9. 1. Measurements were carried out to investigate Ea(gb) and Ea(b) in YAG.
9.4.t
The temperature dependence of o was measured for YAG: 100 ea between 1030 and 1660 K in oxygen and a CO/COz mixture maintaining a pOz = to-9 Pa (the T-dependence of pOz in a CO/COz-mixture was taken into consideration). Analysing the Z'-Z''-plots graphically gave the temperature dependence of o as shown in flg. 9. 7,, From the defect model the electrical conduction at pOz = 105 Pa has to be attributed to hole conductivity, while mixed ionic-electronic conductivity dominates at low pOz.
, I The Ea of the grain boundary conductivity is 17X larger than Ea of the bulk conductivity, which is a representative result for ea-doped YAG samples. Bonanos, Steele and colleagues in ref. [3] report for tetragonal zirconia <ZrOz: 3 molY. Yz03) an activation energy Ea of 0. 9Z and 1. 09 eV for the bulk and the grain bounda-

ries respectively (note the difference of about iOX). Partially stabilized zirconia (ZrOe: 6 molX Ye03l exhibits nearly the same Ea's 1. 07 and 1. 12 eV, as expected for non-discrete grain boundary phases. The different structure of the intergranular interphases in tetragonal and partially stabilized zirconia was confirmed by TEM [9}. l.
0.00 dot>> 2.46 eV
,..... a ......
fl.) -'C -2.50
tiO 0 -
-5.00
FJg. 9.'1
0.50 0.60 0.70 0.80 0.90
1000 KIT
Arrhenius plots of the 1rain interior and grain boundary conductivities for YAG: ea JOO.
1.00
Tab. 9. 3 gives more activation energies for the grain boundary and bulk conductivies in YAG-samples.
Relying on the brick layer and the easy path model it can be concluded from above conductivity data that the grains in ea-doped YAG ceramics are covered by a continuous intergranular film.
75

Tab. 9.3 Activation energies for the gb and b conductivity for several YAG samples.
Do pant concentration
ea 11:0 ppm# ea 25 pp m# undoped #
ea 100 ppm* ea 100 ppm*
ea 600 ea*
Ea [eV] grain boundary
3. 00 3. 00 3. 25
2. 11:7 2. 36
2. 07
Ea [eV] bulk
1. 76 1.6 2. 7
2. 16 1. 99
1. 07
# Prepared from a powder with a relatively high impurity content (Mg,Na); samples made by M.~ Dedding at PHILIPS LIGHTING DIVISION
*Prepared by~~ Ijzendoorn from sourcepowders as pure as possible at PHILIPS LIGHTING DIVISION
YAG as Ha-lamp envelope or as another high temperature material undergoes thermal eye I ing (e. g. switching a lamp on and off). We used ea-doped YAG to investigate two baste processes: long-time annealing at high temperature and quenching from high temperature (see following section). By means of conductivity and impedance measurements alterations in the grain boundary behaviour were detected, rev ea ling that po l ycrysta !line YAG undergoes changes on the long time scale at temperatures between 1570 1670 IC. A I ong-t ime high temperature ann ea ling experiment was performed in order to get an impression how the electrical behaviour of YAG is altered within the first 200-300 hours. Calcium is expected to segregate at the grain boundaries. An alteration of the gb-phase is detectible by impedance spectroscopy. ea iS considered as a sort of 'model marker' elucidating that segregation at a certain tempe~ature occurs. Moreover a change in detect chemical parameters is followed by recording ~gb and ~b as f(p02 ) simultaneously. To our knowledge such a determination of the po2-dependence of ~gb was performed the first time.
76

9.5.1 fxperiments and discussion
We used a sample with a small fraction of At-rich inclusions (0. 1-0. 5 vol.;:) doped with about 100 PPfll Ca. The starting powder contained a small surplus of yttrium, which resulted in a decrease of the content of alumina-inclusions. This material is denoted by the abbreviation YAG: Ca(Y).
The pOz-dependence of a for YAG: Ca(Y) was measured for the as received sample (fig, 9. 6, curve I). a changes with a po2 3/16-dependence, which is consistent with our defect model which will be developed later. Two complex impedance plots at high and at low pOz shown in fig. 9. 9 indicate a gb-conductivity that is independent of oxygen pressure.
...... s ..... riJ .........
b
• -
Fig. 9.8
-3
-4
-s -12 -6 0
lg p02 6
(Pa)
Utotal as f(pOeJ for YAG: Ca(Y) as received (1) and after annealing 240 hat 1670 K (11).
77

t.SO
0< 1 MH2 ... =
- 0.7S "1'
gb
0.00
0.00 0.7S I. SO 2.2S 3.00
Z' [1042]
2 11
0< .... =
- l -"1'
0
0 1 2 3 4
Z' [1052]
FJ8. 9.9 Z'-Z'' plots of the sample 'as received' recorded at pOz=Jo5 Pa (1) and p02 :Jo-JO Pa (IIJ.
Afterwards the electrodes were removed and the sample was annealed 240 hours at 1670 K in air. The po 2-dependence of the conductivity was determined again (see fig. 9. 8, curve II ). The curve is now flat and uncharacteristic and not interpretable by classical defect chemiStry for a homogeneous sample. Fig. 9. 10 gives impedance spectra recorded at a low (1o-10 Pa) and a high oxygen pressure (105 Pa). Now agb has an obvious oxygen pressure dependence. By analysing the whole set of Z'-Z'' plots the p02 dependence of agb and ab were separated. Fig. 9. 11 gives the whole plot obtained for an annealed sample. The 3/16-slope of abulk is again measured, so the defect chemistry of the grain interior is not altered. For the grain boundaries a distinct ntype conduction behaviour was detected. Ve assume that a ea-a 1 uminate has formed at .the intergranu 1 ar 1 nterface, because ea is already enriched at the boundaries and Al, which is more mobile in YAG than Y, can diffuse to form such a compound. Electrical measurements published by Metselaar and Hoefsloot [30) reveal that for instance unintentionally doped eaAl204 shows extrinsic n-type behaviour. For the activation energy for n-type conduction in ea-
78
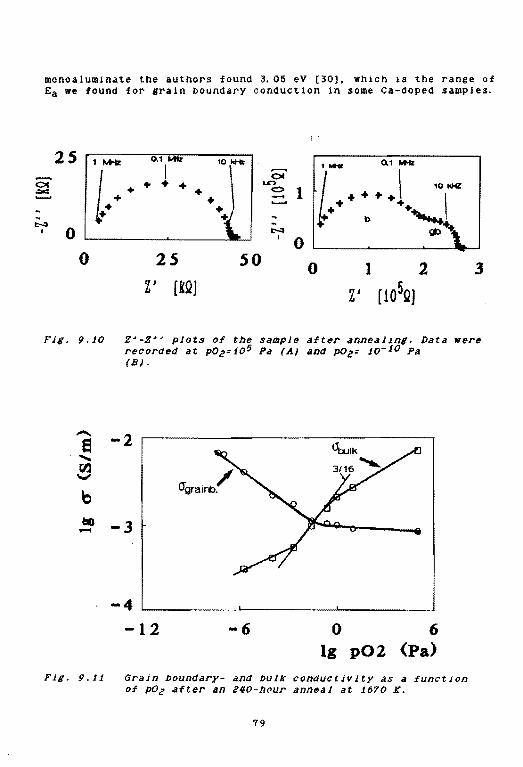
monoaluminate the authors found 3. 05 eV [30), which is the range of Ea we found for grain boundary conduction in some ea-doped samples.
25
0 0
Fig. 9.10
b tl8 -
Fie. 9.11
0.1 Mtr
I + + + +
10kHZ
+ +
\. 25 so
z~ (k2J
r:-:.1
' 0
I.
3
Z'-Z'' plots of the sample after annealine. Data were recorded at po2 :to5 Pa (AJ and pa2 : to-10 Pa (B).
-2
-3
-4 -12 -6 0 6
lg p02 (Pa)
Grain boundary- and bulK conductivity as a function of P0e after an 240-hour anneal at 1670 K.
79

Analysing the Z'-Z''-plots by applying the brick layer model an averaged thickness of the grain boundaries was estimated (see tab. 9. 4}. The fact that grain boundaries were found to be thicker in annealed material supports the suggestion that an intergranular layer is gradually formed at annealing temperatures considerably below the sintering temperature.
Tab. 9.4 Grain boundary thickness 81b before and after annealing YAG:Y:Ca estimated from Z'-Z'' plots.
Capacity before anneal# (sample as sintered)
Capacity after anneal# (240 ~ 1670 K)
agb (before anneal)*
agb (after anneal)*
1w10-9 F (1000 pF)
6w1o- 11 F (60 pF)
~ 1 nm
~ 11 nm
# averaged * estimated by the brick layer model.
The brick-layer model gives only a very rough estimation of the layer thickness, but the result shows clearly that a segregation took place. own TEM observations reveal that boundary layers of about 2-3 nm are present in sintered YAG: 500 ea (see section 6). We have to bear in mind that electron-optical and ac-dispersive techniques detect a boundary thickness on the basis of different properties of the matter.
Remark: Several papers giving de- or single frequency ac conductivity data of polycrystalline alumina etc. have been published in the past. The experiments were often performed at high temperatures (up to 1670 Kl with long equilibration times. The interpretation of conductivity-da~a on the basis of classical defect chemistry underlying single phase material often failed; flat a vs. p02 -curves were interpretated as ionic conductivit~ Not one single case is known to us where the pOz-dependence of agb was determined over a wide regime.
80

PROR~RTI~S or YAO C~RAMIC ~UfNCH~D rROM 2020 ~
TO ROOM T~P~RATVRf
steele and coworkers [31] recently described a novel approach to decreasing the grain boundary resistivity in yttria-zirconia ceramics by a modification of the firing cycle. The authors prepared two sorts of zirconia samples - one sort quenched from sintering temperature (1770 K) and the other slowly cooled down with 5 K/m1n. Impedance spectra revealed that the coolinS rate does not affect the bulk resistivity.
In contrast, the resistivity of the grain boundary reeion has been decreased by quenching the pellets (fig. 9. 12 ), ThiS effect is most marked in less pure yttria samples. TEM-microanalysis of the grain boundary phase, in all cases glasses in the system Si-Al-Y-0, showed that there is a variation in composition with cooling rate. The authors (31) expect for quenched samples that there is a high temperature grain boundary structure preserved, whereas in the slowly cooled samples some equilibration of the structure may be anticipated during cooling until the atomic diffusion rates become too slow.
lal 3oo•c
. . . . " . . . . . .
.·. ··v·· Ob-----~--~~--~~--~-----4 ob)
"' . . . . . . . . .. . .... .. """.. ·· .. v ...
50 100 150 200 p'lkn cm)
.
(A) A.c. impedance plot from Y-stabilized zirconia fired at 1'1'10 K and cooled at 5 K/min
(B) impedance plot for a similar sample quenched from 1'1'10 K (from [31].
81

The following experiment describes how the impedance properties of the grain boundaries and the bulk depend upon the cooling rate in YAG ceramics.
9.6.t fxperlments and discussion
Quenching experiments were performed with two different samples containing ea as dominanat impurity: sample I with 100 ppm ea made by the Philips Lighting Division (sintered 2 hat 2070 K in HztH2o) and sample II with 60 ppm ea prepared by the Phillps Research Laboratories (sintered 4 h at 2020 K in vacuum). Both samples were cooled down from the sintering temperature at a rate of 2 K/min.
Impedance spectra (fig. 9. 13) of samples I and II were recorded after annealing 2 hat 1970 K in air and cooling them slowly (2 K/min). Afterwards the electrodes were removed and the samples were annealed at 1970 K in air: sample I for 15 and sample II for 120 minutes. Quenching was done bY pulling the pellets out of the furnace; no thermo-shock cracking was observed. The YAG showed a red-brown colour after the quenching treatment, because colour centres were formed, presumably holes trapped on oxygen ions near the acceptor centres (see chapter 4).
Fig. 9. 13 gives the Z'-Z'' plots of the as received and the quenched samples I and II.
82

'i = ()
"' -<:::> ..... -. N I
Fig. 9.13
EALARGENENT I +
+
4.95 +
A
3.30 + + + slowly cooled + +
""'+ + +
+ 1.65 + +
+ + -f-1 ~
0.00 quenched
0.00 2.25 4.50 6.75 9.00
Z' [1 0'5 OHM]
1.25 B
slowly cooled
""" + + + + +
0.63 + + + +
+ + + +
+ -~:tt+-+ + + + +
+
0.00 0.00 1.25 2.50
Z' [1 0'5 OHM]
(A) Complex impedance plot of sample I(JOO ppm Ca) at 1020 K and
(B) sample 11 (60 ppm Ca) at 1150 K for the as received and the quenched sample in Oz.

The cooling rate has a dramatic influence on the total resistance Rtot of the samples; in quenched YAG Rtot is about 4 times smaller than in a slowly cooled material. Grain boundary as well as grain interior loose resistance to a comparable degree; in contradiction to the result found in ref. [31), where the authors stated that ab does not depend on the coo ling eye le.
Explanation for the decrease of Rgb :
The thickness of an intergranular film increases when during cooling the solubility of foreign tons declines. Slowly cooling a sample gives the foreign ions time to diffuse to the grain boundaries while quenching preserves the high temperatur-e grain boundary structure. If this is a relevant process the boundary layer should be thicker and have a higher resistance in slowly cooled samples. Fig. 9. 13 shows that this is indeed the case Rgb for sample I is 7 times smaller in the quenched than in the slowly cooled material. In sample II with the lower ea-content this effect is less marked (Rgb decreases by a factor of Z-3). Explanation for the change in Rb:
A remaining question is why the bulk resistance depends upon the thermal history of the sample. Steele [31) found Rbulk to be equal in quenched and slowly cooled zirconia. His material contained a high concentration of foreign cations: 0. 1 - o. 3 wt x impurities (Si, AI} besides 5Y. Y2o3 (0. 3Y. SiOz =3•10'2.0 Si cm3 }. Our YAG with 60 and 100 ppm ea was much purer which means a concentration of about to16 ea ions cm-3. YAG: ea has an averaged •rain size of 1 pm, so the internal grain boundary surface is high. A rough estimation reveals that for the formation of an o. 2-0.4 nm thick intergranular CaAlz04-film about 100 ppm ea are necessary. So it has to be taken into account that [Ca] in the grain interior decreases at the expense of the intergranular film to such a low concentration that the bulk resistivity behaves as we observed it. This suggestion is supported by the result that Rb changes one order of magnitude when the ea-doping level increases from 15 to 100 ppm (fig. 9. 14).
84

1 .!!
" • 0 -
(Cal in ppm
Bulk resistance of YAG-ceramic as a function of the concentration of Ca-dopant.
65

LITfRATtiRf
[1] A. Guerro, E. P. Butler, P. L. Pratt, J. Phys. Coli., z C6 {1979) 363.
[2) H. Bonanos, E. Lilley, J. Phys. Chem. Solids, H (1981) 943.
[ 3 J H. Bonanos et a I. in 'Impedance Spectroscopy', ed. by J. R. Macdonald, J. Wi tey & Sons, 1967 {p. 215 ).
[4) R. Gerhardt, A. s. Howick, J. Am. Ceram. Soc.,.§.!! (1966) 641 and 647.
(5] K. El Adham, A. Hammou, Solid State Ionics, ll.!Q {1983) 905.
[6} L.C. de Jonghe, J. Mater. Sci., ll (1979) 33. [7] J. R. Macdonald, G. R. Cook, J. Electroanal. Chem., ~
{1984) 355. [8] J. E. Bauerle, J. Phys. Chem. Sol1ds, J.Q (1969) 2657. (9] E. P. But !er, H. Bonanos, Mater. Se 1. Eng., ll ( t 965) 49. [10) J. T. Kummer, Prog. Solid State Chem., z (1972) l'U. (11) e.G. Koops, Phys. Rev., M (1951) 121. [12) N. M. Beekmans, L. Heyne, Electrochim. Acta, ll (1976) 303. [13] T.V.Dijk, A.J.Bururaaf, Phys.Stat.Sol. (a), ll (1961) 229.
M.J. Verkerk, B.J. Middelhuis, A.J. Burggraaf, Solid State Ionics, .§. ( 1962) 159.
[14] S.P.S. Badwal, J. Drennan, J, Mater. Sci., U (1967) 3231. [15) 'Impedance Spectrometry', ed. by J. R. Macdonald, John Wiley
& Sons, New York, 1967 [16) A. w. Funkenbusch, P. w. Smith, Metall. Trans. A, M ( 19751
2299. [17] S. Sinharoy, L.L. Levinson, W.L. Ballard, Am. Ceram. Soc.
Bull., ll (1978) 231. [18] w. c. Johnson, D. F. Stein, J. Am. Ceram. Soc., ll ( 1975 l 465. [19] J, R. Tay tor, J. P. Coad, A. E. Hughes, J. Am. Ceram. Soc., ~
{1976) 374. {20] R. F. Cook, A. G. Schrott, J, Am. Ceram. Soc., ll (1986) 50. [21) s. Baik, J. Am. Ceram. Soc., ll (1986) C-101. [22] R.L. Fullman, J. Metals AIME Trans. ~ (1953) 447, {2:3] R. Wernicke, "Advances in Ceramics", Vol. 1 ed. by L. M.
Levinson, p. 272. [24] L. J, v. Ijzendoorn, unpublished. [2:5] K Kleitz, ~H. Kenned~ "Fast Ion Transport in Solids" ed.
by P. Vashishta, J.a Mundy, G.K. Shenoy 1979 (North Holland Amsterdam), p. 165.
[26) Y.T. Tsai, D.H. Whitmore, Solid State Ionics, z (1982) 129. [27] J. R. Macdonald, A. Hooper, A. P. Lehnen, Solid State Ionics,
.§. ( 1962) 65. [26] I. R. Macdonald, J. Schoonman, A. P. Lehnen, J. Electroanal.
Chem . ..tll {1982) 77. [29] B.A. Boukamp, Solid State Ionics, l..Q (1986) 31. [30] R. Metselaar, A.M. Hoefsloot, Solid State Ionics, ll (1987)
305. [31] C.A. Leach, P. Tanev, B.H.C. Steele, J. Mater. Sc1. Lett •• ~
{1986) 693. [32] L. D. Hou, S.l. Tiku, H. A. Wan1, F. A. Kro1er, J, Mater. Sci.
14 (1979) 1877. [33] K. Kitazawa, R. C. Coble, J, Am. Ceram. Soc., ll (1974) 2:45.
66
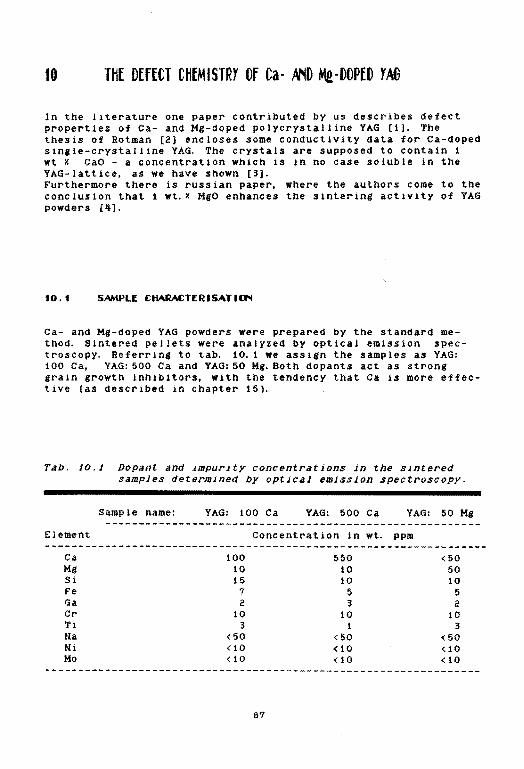
10 THE DEfECT CHEMISTRY Of Ca- AND Me-DOPED YA6
In the literature one paper contributed by us describes defect properties of ea- and Mg-doped polycrystalline YAG (1]. The thesis of Rotman [2) encloses some conductivity data for ea-doped single-crystalline YAG. The crystals are supposed to contain 1 wt r. eao - a concentration which is in no case soluble in the YAG-Iattice, as we have shown [3). Furthermore there is russian paper, where the authors come to the conclusion that 1 wt.r. MgO enhances the sintering activity of YAG powders [4].
10.1 SAMPLf CHARA£TfRISATIVN
ea- and Mg-doped YAG powders were prepared by the standard method. Sintered pe I lets were analyzed by optical emission spectroscopy. Referring to tab. 10. 1 we assign the samples as YAG: 100 ea, YAG: 500 ea and YAG: 50 Ma.Both dopants act as strona grain growth inhibitors, with the tendency that ea is more effective (as described in chapter 15).
Tab. 10.1 Dopant and impurity concentrations in the sintered samples determined by optical emission spectroscopy.
Samp I e name:
Element
ea Mg Si Fe Ga er Ti Na Ni Mo
YAG: 100 ea YAG: 500 Ca YAG: 50 Mg
Concentration in wt. ppm
100 10 15
7 2
10 3
<50 <10 <10
87
550 10 10
5 3
10 1
<50 <10 <10
<50 50 10
5 2
10 3
<50 <10 <10

On the basis of crystal-chemical considerations it is assumed that ea enters the dodecahedra! site and substitutes for Y; Mgtons should enter the dodecahedra! as well as the octahedral sites [5, 6]; this was shown by computer simulation (see section 16 ).
t0.2 DISPfRSfD P~TIClfS IN A CVMDVCTINO MATRIX: WAO'olfR'S MODfl
A number of observations have been reported wherein the presence of a dispersed second phase changes the transport properties of the matrix which cannot be accounted for by classical defect chemical arguments (eg. Lil(Alz03) [7] TiOz(SiO,e) [8], CuCl (Al203) [9] ). Classical approaches did in fact not consider the effect of an electrical double layer at the interface between the dispersoid and the matrix.
According to the model of Wagner and coworkers the ratio of the conductivity in the double layer near the dispersoid interface, udupersion• to that of the bulk matrix, ubulk• in a two phase system can be approximated by (6]:
eq-10. i 11d1spersion
1 + 0. 63 g JZI Vv LD/r2
where g = factor depending on the surface potential = 20 Z = effective charge of the defects created Vv = volume fraction of dispersoid LD = Debye-length r = radius of the dispersoid
Eq-10. 1 states that the conductivity due to the electrical double layer increases as the inverse square of the radius of the dispersoid and is directly proportional to the volume fraction of the dispersoid and the Debye-length. Jn general, the largest Debye-lengths are in those compounds which exhibit the lowest intrinsic lattice defect concentration. In other words, the effect of a dispersed second phase will be most pronounced with smaller concentrations of point defects and consequently the effect will be larger at lower temperatures. Applying eq-10. t two exemplary situations will be considered. The extention of the Debye-Jayer Lo at an interface depends upon
68

the concentration n 1 of defects:
eq-tO. 2 (
Assuming a dielectric constant E = 10 and taKing for the defect concentration to18 and to14 cm-3 respectively, the Debye-length can be calculated as 1. 2wto-9 and t.Zwto-7 m {for T=1570 K). With the empirical equation 10. 1 the relation of o-duperston to o-bulK can be estimated.
Tab. 10.2
DEFECT CONC. [cm- 3 J
to14
Influence of dispersed second phase particles on conductivity calculated from eq.-10.1.
LD [nm)
r {l!m)
o. 5 0. 1 o. 01
o. 5 o. 1 o. 1 o. 01
Vv
o. 01 0. 01 o. 3
o. 01 0. 01 o. 3 o. 3
O"disperston
abulK
1. 0004 1. 002 1.6
1. 04 1.2 6 61
LD: Debye-length, Vv: volume fraction of dispersoid r: radius of dispersoid
From this rough estimation it follows that an enhancement of a in YAG containing about 1-5 vol.~ dispersed Al-rich inclusions {r:O. 5 11ml by the Wagner-mechanism iS negligible. To detect such an effect much more dispersed particles with a smaller radius have to be present.
89

10.3 RfSVLTS AND DISCUSSI~
Figs. 10. 1a, b and c show the isotherms log u vs. log po2 for YAG: 100 ea, YAG: 500 ea and YAG: 50 Mg. The ionic transport numbers for a! I three samples are given in fig. 10. 2.
-1.50 1470K
....... -2.00 e ......
m -2.50 -
t) -3.00
a -3.50
-4.00 -12 -6 0 6
lg p02 [Pa)
Fig, 10. 1 a YAG: 50 Mg
0 1470K
-a ...... fi.J - -2 b 110 ~ - ~n
-4 -15 -8 -1 6
Fig. 10. 1 b YAG: 100 ea lg p02 (Pa)
90

~
a ..... CIJ
b till -
Fig. 10, lC
Fill. JO.J
-1
-2 1100 K
-3 -19 -14 -9 -4 1 6
ta p02 (Pa] YAG: 500 ea
po2 -dependence of the conductivity for 10.1a} YAG: 50 Hg JO.Jb) YAG: 100 ea JO.Jc) YAG: 500 ea
Ja and Jc llive besides the total conductivity (<rtotJ, the ionic- and the hole conductivity 17Jon•<rhoJe)·
Using the relations <rton = at 0~t 1 and ael = Utorl1-ttl allows us toto separate ionic from electronic conductivity. The fact that ae 1 increases with pOz indicates that we are dealing with holes: ael = aholel furthermore the sign of the Seebeck coefficient at high oxygen pressure was positive, which indicate that holes are the conducting species. Ionic and hole conductivity for YAG: tOO ea and YAG: 50 Mg are drawn In figs. 10. la and le. In heavily acceptor-doped YAG: 500 ea we detected ionic conductivity over nearly the entire pOz-regi me. t 1 was found. to decrease with increasing temperature.
91

... LOO 0 D 1470 K SJ a 0.75 • 1670 K ::I c= .... 0.50 ... 0 Cl. 11.1 0.25 c= «< ... .... 0.00
-10 -5 0 5
lg p02 [Pa]
YAG: 50 Mg
... LOO 0 0 1670 K SJ a 0.75 • 1470 K
::I c= .... 0.50 "" 0 Cl. 11.1 0.25 c= «< ... .... 0.00
-10 -5 0 5
lg p02 [Pal
YAG: 100 Ca
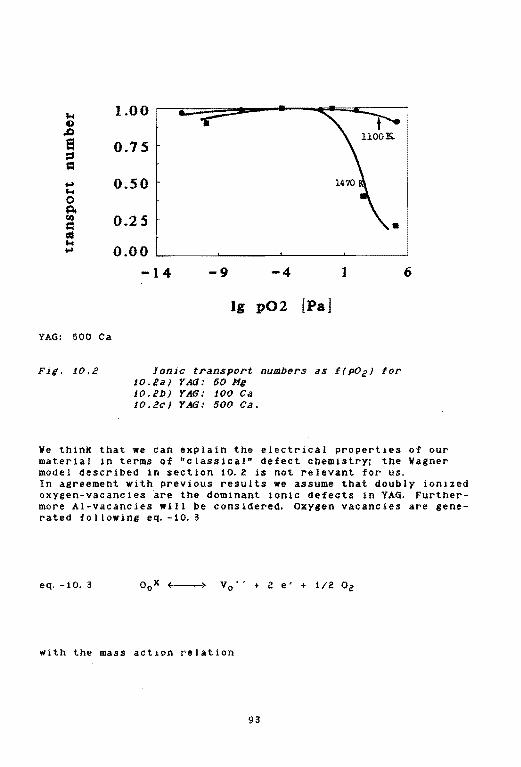
'"' 0 ,J:J
a ::s = ,.... '"' 0 Q. rl.l
= Clll
'"' ,....
YAG: 500 Ca
FJ.g. 1.0.2
1.00
0.15
0.50
0.25
0.00
-14 -9 -4 1
lg p02 [Pa]
Ionic transport numbers as f(p02 J for J0.2a) YAG: 50 Mg J0.2b) YAG: 100 ea J0.2c) YAG: 500 ea.
6
We think that we can explain the electrical properties of our material in terms of "classical" defect chemistry; the Wagner model described in section 10.2 is not relevant for us. In agreement with previous results we assume that doubly ionized oxygen-vacancies are the dominant ionic defects in YAG. Furthermore At-vacancies will be considered. Oxygen vacancies are generated fo I towing eq. -10. 3
eq. -10. 3
with the mass action relation
93

eq. -10. 4 K4 exp(-E4/kTJ po 2-t/2
The generation and recombination of electrons and holes can be expressed as
eq. -10. 5 null ~ e' + h'
with
eq. -10. 6 [e'J[h'J
where E 1 is the thermal band gap.
The Alz03 inclusions are taken into consideration by introducing the activity of alumtna aA1203 into the defect chemical model:
eq. -10. 7
with the mass action relation
eq. -10. 8
(aAJ201 denotes the ~ctivity of Al203J
We observed that acceptor-doped sintered YAG annealed at 1870 K in oxygen and quenched to room temperature has a red-brown colour; performing the quench after an anneal in a reducing atmosphere does not lead to a coloured sample. The same was found in single crystalline YAG [10] as well as in alumina [11-13]. By ESR measurements Cox [ 11, 12 J and Kroger and coworkers [ 131 made clear that the brown color centers in Mg-doped Alz03, which are present after a quench in oxygen, are paramagnetic. Their concentration decreases with decreasing pOz of the annealing environment •. According to ref. 13 these paramagnetic color centers are trapped
94

holes near MgAI' defect centres. The on an o2--ion forming an 0 0 ·-centre. described by
eq. -10. 9
and
eq. -10. 10
holes are localized This process can be
Based on optical absorption and ESR-measurements the presence of 0 0 ·-centres has been proved in YAG [14, 15]. We assume a pOzdependent hole-trapping +---> hole-releasing process to be highly probable. In our calculations for ea- and Mg-doped YAG the association reaction will not be taken into account. Instead we use the normal ionisation reaction:
eq. -10.11
with
eq.-10.12
CayX ~ Cay' + h·
(Cay'l [h')
[CayX] Ktz exp[-Etz/kTJ.
(an analogous process can be formulated for YAG: Mg)
The interstitial defects Alt" ·, Y1"' and o 1" are not considered, because they are highly lmprobable, as we revealed by computer simulation techniques [16]. The formation-energy for a Frenkeldefect is much higher than for a SchottKy-defect. The eqs. -10. 13, 10. ill, and 10. 15 give the appropriate FrenKel- and Schottkydefect formation reactions and their energ1es are listed in tab. 10. 3; this is discussed in chapter 16.
95

eq. -10. 13
eq. -10. 14 y 1. . . + Vy' ''
eq.-10.15
Tab. 10.3 Defect formation energies calculated by computersimulation applying the CASCADE-code [16}.
Equation: 1 o. 13 10. 14 10. 15
Defect forming energy in eV per single defect = a ev 11 10 ev 111 5 eV
Ot'' are not considered to be possible because the largest interstitial site (the empty b-site) can not accommodate the o2-with its large radius. So we are dealing with V0 ", VAt'" ,Cay', e'and h· as possible charged defect species in YAG.
The condition that requires that the crystal remains electricallY neutral is satisfied by
eq. -10. 16 [e') + [Cay') + 3 [VAt'"] [h'] + e [V0 "l
(an analogous relation introducing [H8AJ'l for the Hg-doped sample can be written)
The total concentration of the intentionally added acceptor ions
96
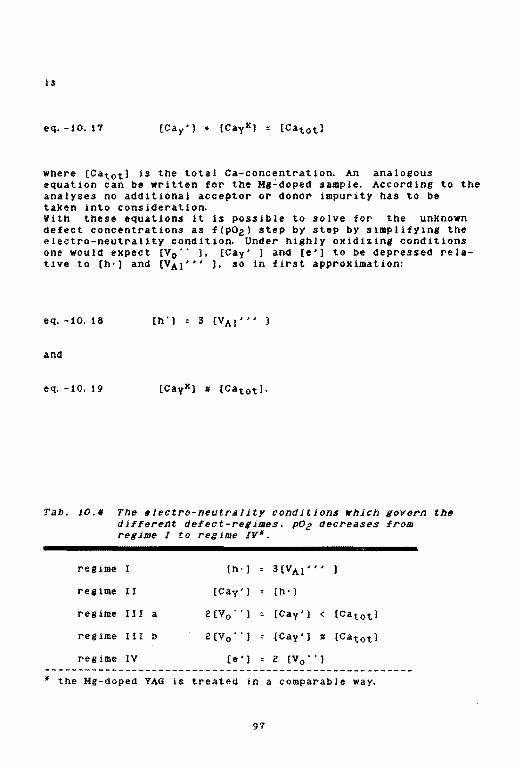
is
eq. -10. 17
where [Catotl is the total ea-concentration. An analogous equation can be written for the Mg-doped sample. According to the analyses no additional acceptor or donor impurity has to be taken into consideration. With these equations it is possible to solve for the unknown defect concentrations as f(pOz) step by step by simplifying the electro-neutrality condition. Under highly oxidizing conditions one would expect [V0 '' ), [Cay' 1 and [e') to be depressed relative to [h•) and [VAt'" ), so in first approximation:
eq.-10.18 [h ']
and
eq. -10. 19 [Cayx1 ll [Catot1·
Tab. JO.JJ The electro-neutrality conditions which govern the different defect-regimes. p02 decreases from regime 1 to regime IV*.
regime [h. 1 3[VAt"'
regime II [Cay' 1 [h•]
regime III a 2 [V0 · • 1 [Cay' 1 < [Catotl
regime III b 2 [V0 • • 1 [Cay' 1 ll [Catot 1
regime IV [e • 1 2 [Vo .. )
* the Mg-doped YAG is treated in a comparable way.
97

Applying the relations given above one can find the elektroneutrality conditions (tab. 10. 4) and the exponents n in the expression for the pOz-dependence of the defect-concentration: [defect] a: po2n (see tab. 10. 5 ). The actual widths of the defect regimes depend upon the concentration of acceptors in the crystal and the equilibrium constant of the appropriate defect-re I at ion. When [Cay'} or [Mgy'] increase the plateau of a po2-tndependent defect concentration in regime II gets more extended. The complete defect diagram on the basis of our theory is gtven in fig. 10. 3. Taking into account that electronic charge carriers have a much higher mobility than ions we can qualitatively derive the conductivity isotherm as a function of the oxygen pressure (fig. 10. 4).
Tab. 10.5
regime
Vo ..
e'
h'
VAt'"
Cay'
CayX ______ ...... __
Exponents n in [defect} « pOzn assuming a p02-dependent concentration of acceptors.
<----- hole released hole trapped ----->
2 [V()J = [ e'] (Cay) =2 [VQ'l [Cay) = [ti] [ti]:3[V..\j I
IV II Ib Ilia 11
-1/6 0 -1/6 -1/2 -1/8
-1/6 -1/4 -1/6 0 -3/16
1/6 1/4 1/6 0 3/16
1/4 0 1/4 3/4 3/16
0 0 -1/6 0 0
0 1/4 0 0 0
----------------------------------------~---------
98

IV lllb Ilia 11
- log P<l.2
FJg. 10.1 Defect diagram for ea-doped YAG. The roman letters denote the neutrality-regimes defined in tab. 10.4.
t log!]
F18. 10.4
LOW DOPING-LEVEL HIGH DOPING-LEVEL
-The expected pOe-dependence of u for samples doped at a low and a hiKh level of acceptors.
99

Referring to our experimental results we find well defined p02 -regimes. At high oxygen pressure Al-vacancies VAl''' are balanced by holes. Al-vacancies are liberated while the formation of Al20a-1nclusions progresses under sintering conditions. The ptype conductivity was measured to change proportional po 2 3/16 for YAG: 100 ea as well as for YAG: 50 Mg. This process is characterized by an activation energy Ea of 1. 9-2. 2 eV (see tab. 10. 6); Rotman reported for single crystalline, acceptor dominated YAG Ea = 2. 2 eV for p-type conductivity [17).
The pOz-independent intermediate regime II is governed by acceptors balancing electron-holes; with increasing doping level we find an increasing extension of regime II in the p02 domain, as it is expected on the basis of our proposed defect-model. With further decreasing oxygen-pressure we find a to decrease again following a po 2 1/4 dependence. This behaviour can be explained assuming a pOz-dependent hole release <--> hole trapping process following eq. -10.11. This suggestion is supported by the fact that quenching of samples in an oxidizing ambient creates color centers, which means that at high pOz a part of the holes get trapped at acceptor centres generating neutral defects. By checking several samples it was confirmed that the slope of the p02 dependence in the concerned regime IIIb is 1/4. Figs. 10. 1. a and 1. c show that for the lowest oxygen pressure the conductivity passes through a mintmua In accordance with the defect model an increase of a at very low p02's has to be attributed to n-type electronic conduction.
Fig. 10. 1 gives together with the total conductivity the ionicand electronic conductioa From .literature it is known that the mobility of oxygen-vacancies in garnets is higher than the mobility of cation-vacancies [UI, 19]. At hiih oxyeen pressure our defect model suggests that (V0 ' 'J changes with oxygen pressure following a po2 -1/8 dependence. This was experimentally confirmed for YAG: 100 ea as well as for YAG: 50 Me by analyzing the conductivity and ionic transport data, as shown for the a1on in figs. 10. la and le.
t0.4 THf TfMPfRATURf DfPfNDfNCf C~ C~DU~TIVITY
Fig. 10.5 illustrates a as f(T) measured in a pure oxygen atmosphere or at p0 2 :to-9 Pa; the results are given in tab. 10. 6.
100

0
-1 -a -2 ..... fiJ -c -3
-4 -s
s.oo 7.67 10.33 13.00
1 0000/T [1/K]
Fig. 10.5 Temperature dependence of the conductivities of YAG: 100 ea, YAG: 500 ea and YAG: 50 Mg. The numbers denoting the JJnes are specified in tab. 10 .. 6.
Tab. 10.6 The activation energies for conduction processes in different acceptor-doped YAG ceramics (the numbers are referring to the lines in fig.J0.5).
LINE
1 2 3 4 5
SAMPLE
YAG: 100 ea
YAG: 500 ea YAG: 50 Mll
POz (Pa] SPECIFICATION
to5 to5 1o-9 105 105
bulk (p-type) grain boundary bulk (ionic) bulk (p-type) bulk (p-type)
Ea [eVJ
2. 0 2. '! 2. '! 1.'7 2.. 2
Ea in oxygen is about 2 ev for bulk conductivity for all three samples. The grain boundary conductivity has a considerably higher activation energy, 2. '! ev was a typical value we found in our samples. This difference may indicate that the 11rains are covered by a continuous 1ntergranular fil~ For the conductivity at a pOz as low as to-9 Pa the activation energy was 2. 7 eV.
101

10.5 (;O'ol(;lUSit:N
High temperature measurements of the ionic and electronic conductivity of YAG doped with the acceptor-ions ea and Mg are interpreted assuming V0 '', VAt''', Cay' (Mgy'), CayX (MgyK), h' and e• defects. Alz03-precipitations observed in the ceramic !paterial are of major importance. Their influence on the defect situation is interpreted on the basis of nclassical" defect chemistry, The inclusions are responsible for the formation of At-vacancies: in this way the po2 3/16-depencence of a can be explained. VAt''' are balancing the holes at high oxygen pressure. Acceptor centres act as traps for holes at high p02, so that a p02-dependent hole release mechanism from 0 0 -centres has to be considered. The pI at eau in the C1 vs. pOz curve depends on the concentration of acceptor ions in the crystal lattice.
liTfRATURf
[11 L. Schuh, R. Metselaar, G. de With, submitted to J. Appl. Phys.
[2} S. R. Rotman, Ph. D. thesis, "Defect Structure Of Luminescent Garnets" Massachusetts Institute of Techno 1 ogy, 1965.
[3} this thesiS, chapter 6 and 9 [4] E. S.Lukin, L. P. Kiryukhina, T.V.Efimovskaya, Tr. Mosk.
Khim. -Tekhnol. Inst. ,.l.Q.Q., (1976), 20 [5] S. Geller, z. Kristallogr. ill (1967) L [6} V. Tolksdorf, U. H. Wolfmeier, Landoldt Bornstein 12/III a,
(Neue Serie), Berlin 1978. [7) c. c. Liang, J. E I ectrochem. Soc. .1l.Q ( 1973 l 1269. [8} G.M. Crosby, J. Solid State Chem. ll (1978) 367. [9] T. Jow and J.B. Wagner Jr., J. Electrochem. Soc. ~
(1979) 1963. {10] J. Xvapil, Jo. Kvapil, B. Perner and B. Manek, Xrist. Technol.
1.Q. ( 1975) 529. [11} R. T. Cox, Solid State Comm. .2. (1971) 1989. [12] R. T. Cox, J, de Phys. Colloq. C9 .1J...::..1.g, (1973) C9-333. [13] H. A. Wang, C. H. Lee, F. A. Kroger and R. T. Cox, Phys. Rev. B
l:L (1963) 3621. [14] HJ. Bernhardt, Phys. Stat. Sol., (a) ll (1976) 445. [15] X. Mori, Phys. Stat. Sol. (a) ll (1977) 375. [16] L Schu~ c.~~ Catlow, ~ Metsetaar, to be published. [17] R. Rotman, R. P. Tandon and H. L. Tuller, J, Appl. Phys. 21
(1985) 1951. [18] A. Yu. Neiman, E.V. Tkachenko and V.M. Zhukovskii, Dokl. Akad.
Nauk. SSSR Z,!2 (1976) 876. [19) J. L. Bates and J.E. Garnier, J. Am. Cera~ Soc. Comm. ~
C-138 (1961 ).
102

11. THf DfffCT CH~ISTRY Of Zr·DOPfD YAO
There are some reports known to us which deal with the physicochemical properties of Zr-doped YAG [1-4}. IJlendoorn [t) stated that Zr has a considerably better solubility in the YAG-lattice than ea; he found about 700 ppm zro2 to be completely soluble in YAG. Furthermore it was sue8ested that Zr occupies the octahedral and/or the dodecahedra! position in the 8arnet lattice (1). After sintering in Hz/HzO the zr-doped samples bad a red colour. Two possibilities for this colouration were discussed initially: a reduction of zr4+ to zr2+ or a crystal field splittina of the 4d-orb1tals.
Asatryan and coworkers [2] reported ESR and optical data for Zrdoped single - and polycrystalline YAG treated in H2/H20 atmospheres at hith temperature. Parama8netic centres were found to be present in reduced YAG: Zr. A red colour of the reduced samples was detected a8a1n. ESR spectra in combination with optical measurements revealed that the concentrations of paramagnetic centres and colour centres change simultaneously. It was established that both centres are the same in nature: zrS+-tons (S= 1/2) on c-sites (dodecahedra! sites) of the 8arnet structure substituting for yttriua
Asatryan further reported that no colouration is observed in YAG: Zr when charge compensating ions (Mg2+ or ca2+) are introduced. Moreover the lattice-constant a0 was found to decreaae with increasin8 Zr-content for ceramic powders reduced in a H2/HzOatmosphere (a0 =t2.004 1 for pure YAG and a0 = 11.998 1 for reduced YAG: zr with 1. 5 wtx Zr), while a0 in oxidised YAG: zr does not change with the amount of Zr introduced into the lattice. This was tested for Zr-concentrations up to 2 wt.x.
A paper contributed by us gives the electrical conductivity and the ionic transport number as a function of the oxyeen partial pressure in ceramic YAG: Zr [S). Tbe defect situation in this material was found to be 1overned by donors. The oxy1en-pressure dependence of the conductivity was found to be proportional to po2n with nl-1/5 in then-type re1ime. It was su1gested that V0 ·• and V0 • (sinilY or doubly ionised oxy1en vacancies) are the doainatinl ionic defects.
In a recent paper Rotman and Tuller [4, 5) present hilh temperature conductivity data of single-crystalline YAG doped with Zr and H1 simultaneously (about 1 mol.X of each) [4). The aaterial exhibited ionic conductivity under highly oxidizing and n-type electronic conductivity under reduclnl conditions with a po21/4-dependence. Following Rotman this behaviour is characterized by the neutrality condition 2[V0 ··] ~ [Ritot'l + [A'J (A' : acceptors). The activation ener1y of the ionic conductivity (oxidizing conditions) aion and n-type conductivity (reducing conditions) were 3 eV and 3. 8 ev respectively. Simultanous dopinl with an acceptor and
103
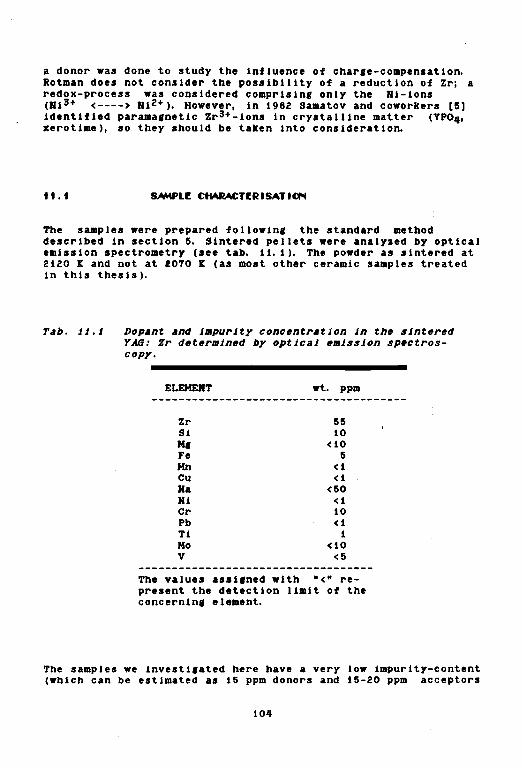
a donor was done to study the influence of charte-compensation. Rotman does not consider the possibility of a reduction of Zr; a redox-process was considered comprisin8 only the Hi-ions (Hi3+ <----> Hi2+), However, in 1982 Samatov and coworkers [5) identified parama1netic zr3+-ions in crystalline matter (YP04, xerotime ), so they should be taken into consideration.
tt. t SAMPLE Ctf..o\RACTI!RISATia-1
The samples were prepared followin8 the standard method described in section 5. Sintered pellets were analysed by optical emission spectrometry (see tab. 1i. 1). The powder as sintered at 2120 K and not at 2070 K (as most other ceramic samples treated in this thesis).
Tab. JJ.t Dopant and impurity concentration in the sintered YAG: Zr determined by optical emission spectroscopy.
ELEMENT
Zr Si Mt Fe Mn cu Ha Hi er Pb Ti Mo V
wt. ppm
55 10
<10 5
<1 <1
<50 <1 10 <1
1 <10
<5
The values asSilned with "<" represent the detection limit of the concernint element.
The samples we 1nvest1tated here have a very low impurity-content (which can be estimated as 15 ppm donors and 15-20 ppm acceptors
104

compensatins each other routhly). 55 ppm Zr are considered as the effective donor concentration.
Measurements of the frequency-dispersion, which are discribed in section 9. 2, revealed that no remarkable intertranular film is detectible ln YAG: Zr.
tt.2 RfSULTS AND DISCUSSIGH
Fit. 11. 1 shows the experimental isotherms lt a vs. le p02 for YAG: Zr at three different. temperatures. The p02 rantes from to5 to to-10 Pa. For the same sample the transport number ti as f(p02 ) is tiven in fiJ. 11.2. Under the most ox1d1zint conditions the material exhibits mixed ionic-electronic conductivity with ti ~ o. 4. At oxyten pressures lower than 1 Pa n-type electronic conductivity iS predominatint. In this re11me CTel increases proportional to po2n with n between -1/4. 5 and -1/5. 5. At the lowest oxycenpressure the curve flattens, and presumably becomes po2-tndependent.
eo -
FJg, 11.1
-3 16.30K-
-4 14501< /
-s
-6
-7
-s -18
6 o;ON
11450 Kl
-6
p02 (Pa)
6
Oxygen pressure dependence of the electrical conductivity in YAG: Zr at three different temperatures. uion is 8ivenfor the Jorest temperature.
105

.a
log~ [Pa]
Fil. 11.2 Ionic transport number ti for YAG: 50 Zr as t(p02 J
tt.2.t The defect medel tor Zr-doped YAO
The donor-centres Zry' govern the defect chemistry of YAG: Zr. Zr has a 4+-charge under oxidizing and a 3+-charae under reducing conditions. We set the electro-neutrality condition for TAG: Zr
eq. -11. 1 3 [VAl"'l + [e') : 2[V0 ' ') + [Zry') + [h'],
Under the most oxidizing conditions Al-vacancies are balancinl the electron-holes: S[VAI'''l : [h'J. With succesively decreasint p02 the the equilibrium conditions are glven in tab. 11. 2.
106

Tab. u.e
re11me
re11me
re11me
re11me
The neutrality conditions which 1overn the different defect re1Jmes. p02 decreases from relime I to re1ime Ill.
I HVAJ"'] = [h')
IIa (Zry' l = 3[VAJ"') and [Zry'J=[Zrltot
lib [Zry') " 3[VA1' .. ) and [ZryX] • [Zrltot
III [Zry '] = [e • J ----------------------------------------------------------------
The donor concentration decreases with decreaainl p02 due to reduction (rettme IIa ---> retime lib):
eq, -11. 2 Zry' + e• ~ ZryX
TaKint into account the formation of alumina-inclusions as treated in section 10 to1etner with the consideration made above, the pOzdependence of the defect concentrations can be calculated (see tab. 11. 3), The appropriate defect-dtatram is liVen tn f18, 11.3.
Tab. 11.11
reatme
VAl''' h' e• Vo'. Zry ZryX
Exponents n in (defect] • p02n assuminl • reduction of the donor c•ntres.
[e']=[Zry]
Ill
3/4 0 0
-1/2 0
0
IIb
3/16 3/16
-3/16 -1/6 3/16 0
IIa
1/4 1/4
-t/4 0
0 -1/4
3 [V_Ai) = [ti)
I
3/16 3/16
-3/16 -1/8
0 0
At high oxycen pressure the conductivity is po2-tndependent and the ionic transport number was found to increase. Following the defect model Jiven in fiJ. 11.4 this is due to an increasing
10'1

VAt'''-concentration; the ionic transport number increases with 1ncreas1nt POe. Retime I is not reached in our material. Vith decreasinl pOz the electronic conductivity increases with a slope of -o. 2, which is nearly -3/16 (=-0. 19), rec1me lib. Zirconium cban1es the valency from 4+ to 3+ at intermediate oxycen pressure. The observed -3/16 dependence of the electrical conductivity ls only possible when Zr is reduced, oxidized Zr would 1overn the defect chemistry to live a -t/4 p02-dependence of the conductivity. At the lowest oxycen pressure u atatn becomes po2-tndependent. This is explained by the model assum1n1 the neutrality condition [e'J=[Zry'J, The complete defect diaaram is liven in fit. u. 3'.
t Ill llb lla
.... ~~---=~----~~~-----=~~~~~~~~==~~~
Defect dialr•m for Zr-doped YAG. The roman letters denote the neutrality re1Jmes defined in tab. tt.2.
Under our experimental conditions retime I is never reached. In a more simple consideration of the defect chemistry it is sufficient to take two neutrality ret1mes. At hither POe [Zry'J=3lVAl'''l and [ZryXJ=[ZrJtot over the whole re1ime. If the oxy1en pressure is very low the neutrality condition is [e'):{Zry') and the slope of the electronic conduction is zero; re11me III. There ts finally a retime which is 10verned by the neutrality condition {e'):2[V0 '')1 this re11me is not reached under our experimental conclltions.
108

lt.3 T~f TfMPfRAT~Rf Of~f or T~f COMO~CTIVITY
The activation enerctes for the conduction processes under oxidizint and under reducinl conditions are presented in tab. 11.4 for YAG doped with 50 and 500 ppm Zr.
f'ab. U.IJ Activation ener1ie8 for the conduction proce&8 In YAS doped rith 50 and 500 ppm zr at different p0e'8 at 1570-1670 r.
to5 Pa so-15 so-9
Ea (50 ppm Zr)
3.0 eV 3, 4 3. 6
Ea (1500 ppm Zr)
2. 8 ev 2. T 3. 8
The activation ener1y tn the most oxidizinl atmosphere is the same for both samples within the experimental ranee of error, indicatinl that the conductinl species are the same (2. 8- 3.0 eV). According to the defect model proposed in fit. tt. 4 mixed tonic-electronic conductivity dominates this retime. The activation enertY in the most reducint ambient is stcnificantly hi8her (3. 6-3. 8 eV); n-type conduction is toverninl this retime. The dopant-ion Zr is reduced under these conditions. At an intermediate p02 the activation enertY lies between the values for the most oxidizinl and the most reducinl conditions. The Zr-1ons are supposed to chante their valency state from 4+ to 3+ in this intermediate pressure retime (reatme IIa -+ lib in Ut. 11. 3) followina eq. -u. 2.
The difference in Ea at high and low oxyfen pressure can be analyzed in terms of different processes by considerinl the defect reaction eq. -11.2 totether with
eq. -11. 3
and
eq. -u. 4
By combining the complete mass action relations for these reactions eq•s 11.5 -tt.T leads to the enertetics of the conduction process.
109

eq. -11. 5
eq. -u. 6
eq. -11. 1
Ezr• Et and EA1203 are the enerttes for reduction of Zr, the thermal band-gap and the formine enercy of the A1 2o3 inclusions respectively. Working out the relations leads to the activation enertr
eq. -11. 8 Ea : 3/8 Et - 1/8 EA1203 + 1/4 Ezr
for retime Ilb and
eq. -11. 9 Ea : t/2 Et - l/6 EAI203
for ret1me IIa. Rotman [6] reports the redox enertr £ 1 to be 1. 8 eV; this value and the activation enertr in retime Ila <• 3eV) leads via eq. -1 t. 9 to a EAJ203 of 5-6 ev. Insert 1nl this value into eq. -11.8 totether with the measured activation enerfy of 3.1 eV fives a redox-enertr Ezr of 6-1 eV. This is in a probable order of marnttude: Rotman [1] reports E=ll. 8 ev for the reduction of Fe3•-ions in YAG and Er6ter and Mohapatra (8J found £=4.215 eV for the reaction Tt4+ ~ Ti3+ in alumtna. We expect the redox enertr for Zr to be hilher than for Fe or T1; this assumption is confirmed by our estimation.
"·" eGCUISUl'lj
Zr-doped TAG behaves as a mixed tonic electronic conductor. At low po2 a increases with decreasing oxrten pressure (n-type conductivity). The slope of the curve can be interpreted assumtnt Al-vacancies as dominatint tonic defects. From the temperature dependence of a the redox-enerfr of the Zr-ions in the garnet lattice can be estimated to be 6-T eV.
110

LITfRAniRf
[1) L. J. v. IJ:zendoorn, private collllllunicatlon. [!] H. R. Asatrayan, A.S. Xuzanyan, A. G. Petrosyan, ~K. Pertos
yan, E. G. Shatoyan, Phys. Stat. So 1. (b), J..ll (1986) 343. [3] r... Schuh, R. Metselaar, G. de With, Set. Ceram., .li (1988)
973. [4) s. R. Rotman. H. L. Tuller, J. Appl. Phys. H (198'7) 1305. [5) M. v. Samatov, s. L. VotyaiCov, A.~ l:rasnobaev, Izv. Akad.
Haul SSSR, Heor(. Mater., !A (1982) 1866. [6] S. R. Rotman, & P. Tandon, M.L. Tuller, J. Appl. Phys. ~
(1985) 1951. [7] S.R. Rotman, Ph.D. Thesis, "Defect Structure of Luminescent
Garnets•, Massachusetts Institute of Technolo(y, 1985. [8] s. X. Mohapatra, F.~ l:ro(er, J. Am. Ceram. Soc.,~ (197'7)
381.
111

12 UNDOPED POLYCRYSTALLINf YA6
12.1 SAMFlf ~H4RA£TfRISATION
Undoped TAG-samples were sintered from the pure source powders applyinl the standard method. The level of impurities was determined by emission spectroscopy,
Tab. 12.1
12.2
Impurity cont~nt ol a pur~ YAG •Jnt~r body.
Element
Si MI Fe Mn Cu Ha Hi er Pb Zr T1 Mo V
wt. ppm
15 10
7 < 1 < 1
< 50 < 1
10 < 1 < 5 < 3
< tO < 8
The "<"-siln means that the concentration 11 below the detection limit.
RfSULTS AND OISeUSSION
Fif. 12. 1 lives the electrical conductivity as a function of the oxyten partial pressure for two different temperatures.
The ionic transport number determined for the same temperatures ts shown in fl~ 12. 2 totether with the separated tonic and electronic contribution to the total conductivity for 1670 K.
112

-1.50~------------~~------------~ 7';:· -2.00
-2.50
-3.00
- 3.5 0 .__....___.___,____.____,__,___,_____..__,
Fil· 12.1
-10 -5 0
lg p02 (Pa)
p02-dependence of the total conductivity for undoped YAG .at 1670 and 16'10 .c.
5
The conductivity at hiaher oxy1en partial pressures was found to be electronic tn nature (t 1 • 0). The dominat1nl mobile charfe carriers are expected to be electron holes. With decreasinl po2 a decreases with a 3/16-depencence. At low pOz the conductivity becomes independent of oxy1en pressure - which is due to mixed ionic-electronic conduction. This leads us to the conclusion that the material is dominated by the presence of Al-vacanciel (see fif. 11.4}. Furthermore, acceptors 1overn the conductivity of undoped, which means in fact unintentionally doped, polycrystalline TAG; presumably Hi and Ha. So we can take over the defect model developed in chapter 10, with re1ime I and II (see ta~ 1~ 4) beinl predominant.
113

.... 1.00 A 0
,/::1 o fi/Ttl K
a 0.7 5 ::I + IIIJ'tl K
c: ..... 0.50 .... 0 Pc tl.l 0.25 c:
"' .... 0.00 ....
-15 -to -5 0
log p02
-1.10 B 16711 K , . , , , - -2.00 .cl
a , .....
~---·-~--~~ 11.) - -2.10 'b
IilO - -3.00
~ • -3.50 • ••
-10 -s 0 5
lg p02 (Pa)
Fil· 12.2 Ionic transport number m•a•ured for undoped polycrystalline YAG (A) and the ionic and electronic conductivity at T=l670 X derived herefrom (B),
114

t2.3 ~ONtLUSICN
The defect chemistry of the undoped polycrystalline TAG we investicated is dominated by Al-vacancies. ACain we found a po23/16 oxyaen pressure dependence of the p-type conductivity at hiCher pOz'a, Which can be explained by the presence of VAt'''• Chemical analysis of the material did not show a considerable amount of impurities, which could be responsible for the behaviour at h1Cher pressures. So the At-rich inclusions play an important role in the defect chemistry of undoped TAG ceramics. At low pOz At-vacancies are balanced by the few ppm of unintentionallY present acceptor ions.
13 UNDDPfD SINGLf·tRYSTALLINf YAG
Several papers dealint with the defect chemistry of sinale crystalline TAG invest11ated by conductivity measurements were contributed by Rotman and coworkers [1-4]. The conduction mechanism in cerium-doped YAG is considered to be an acceptor-controlled onei cerium-ions in the TAG lattice are not treated as defect species controllinl the hilh temperature electrical conductivity. Mixed 1onic/n-type conductivity was found in such crystals, a simple mechanism based on aliovalent acceptor impurities was proposed to explain the poz-1/4 -dependence [2). The other work concernint the defect chemistry of YAG [1,3,41 considers Fe-, N1- and Zr-doped material.
t3.t SAML~ ~HARACTERISATION
Our measurements were done with Verneu11-1rown crystals. The result of a chemical analysis of the material is tiven in tab. 13. 1.
115

Tab. JS.J Spectrochemical analysts of sinlle crystalline YAG
Element
Mg Si Ga Fe
wt. ppm
., 9 6
10
No data about the ea-content in our samples are available; followint the results of Rotman this impurity would be expected in the crystals [2). Furthermore protons are present in the crystal lattice (introduced by the crystal 1rowth in a H2;o2 -f lame).
13.2 f"Pf:RIMfNT AND OISeVSSIOOI
F11. 13. 1 shows three isotherms of lot a va. lot P02 for undoped sintle crystalline TAG. At hith oxyten partial pressure the conductivity is po2-independent and under more reducint conditions a chanfes with a partial pressure dependence of approximately po2- /4,
0.00
ITIJIJ K /
-1.67
tl8 -3.33 --s.oo
-to -s 0 s
lg p02 (Pa) The conductivity isotherms as a function of p02·
116

Measurements of the ionic transport number (fif. 13. 2) allowed us to calculate the ionic and electronic conductivity as tiven in fit. 13. 3. The flat retime at hiib oxyten pressure is due to ionic conductio~ while electronic conduction is predominant at oxyten pressures lower than 1 Pa. The ionic and n-type conduction exhibit activation enerties of 2. 09 and 3.7 ev respectively. Rotman found 2.2 and 3.9 eV [2] for these retimes in s1n11e crystalline Ce-doped YAG. Totether with the fact that n-type conduction in his material chances proportional po2-1/4 we have to assume that our material and the crystals tnvestitated in ref. [2] are comparable in their defect chemistry. so we take over the defect model presented in ref. [2). Followinl this model doubly ionized oxycen vacancies [Vo''] fixed by a certain concentration of backtround acceptor impurities (2[V0 ''1=[A'J with A' the acceptors) can explain the conductivity curve.
1-1 1.00 0 + 1117() K
,J:J
a 0.75 0 17111 K =:I = ... 0.50 1-1 0 c. I'll 0.25 = ellS 1-1
0.00 .... -6 -2 2 6
loa p02 (Pa)
Fil. JlJ.2 Ionic transference numbers t 1 as a :function o:f POe·
In doped and undoped polycrystalline YAG we found in most cases conductivity isotherms proportional to po23/16, which is explained by the presence of At-vacancies. These vacancies come from the Alz03 inclusions which form durlni the sinterini process. Single crystal YAG is homoteneous and no considerable concentration of VAt''' is present in the material; so the defect chemistry is aoverned by v 0 ·· and A' exclusively,
117

--
-1.00
-2.67
-4.33 Cb 0 0 0
L b
-6.00
-ts -8 -1 6
lg p02 (Pa)
conductivity isoth•rms s•parated into n-tYP* and ionic compon•nts as a ~unction o~ p02.
The h18h temperature measurement of the transport properties of sinele crystalline YAG has shown it to be a mixed ionic-electronic conductor. The pOz-dependent conductivity and the ionic transport number measurements are consistent with a defect model dominated by doubly ionized oxy1en vacancies fixed in number by backlround acceptor impurities.
L ITfRATtiRf
[1) s. B. Rotman, Ph. D. Thesis, •Defect Stucture Of Luminescent Garnets", HIT, 1985.
[2) S.R. Rotman, R. P. Tandon, H.L. Tuller, J. Appl. Phys., ~ (1985) 1951.
[3) S.R. Rotman, H.L. Tuller, Mater. Res. Soc. Symp. Proc., ~ ( 1986) 413.
[4) s. R. Rotman, H. L. Tuller, J. Appl. Phys., H (1986) 1305.
118

t4.'
Tlif INTfRAtTI~ Cf Y!IJ WIT~ HYDROOfNt~AINING AT~PHfRfS
I NTROOOOT I 0'1
YAG is usually sintered in a Hz/HzO-atmosphere, consequently it is of teneral interest to know how the tarnet lattice interacts with hydroten and how the transport properties are influenced.
The effect of hydroten on the electrical conductivity in hilh temperature oxidic materials received limited attention in the literature. Hill (1] described the interaction of TiOz with Hz at temperatures above 770 ~. His experiments indicate interstitial protons beina compensated by electrons; the conductivity increases with increasint activity of Hz. Proton concentrations fixed by substitutionally dissolved cations have been found in Verneuilarown TiOz crystals [1) and in SrCeOs [2).
Vatner and coworkers have civen a theoretical discussion and some experimental data about hydroten defects in transition metal oxides and in zirconia [4, 5)
The defect structure of yttria equilibrated at hiah temperature in a hydroaen containint atmosphere was investitated by Horby and ~ofstad [!). They consider two different lattice defects with protons: the interstitial proton and the interstitial hydroxyion. An interstitial proton is a proton interactini from an interstitial site with a neithbourin& oxyten ion on a recular site. When the proton moves throueh the lattice it probably moves as a free proton from one oxyten to another [6]. An interstitial hydroxide ion may be thouaht as a proton bonded to an interstitial oxyaen ton. Such a structure is favoured in a crystal structure as found in YzOs, with larte interstitial sites.
From crystal chemical considerations we can conclude that interstitial hydroxide ions are improbable in tarnets, because this structure cannot accommodate 0 1.
Mohapatra, Tiku and Kroser [7] made conductivity measurements on hi&h purity sapphire. The material showed in the betinnina a donor dominated behaviour. With 1ncreasint annealine time (at Tm1870 ~ in oxyten and CO/COz mixtures) the material chantes over to acceptor dominated conductivity. MohaPatra and colleaaues interpreted this as beint caused by a loss of protons. Protons have a h18h mobility and Lee et al. [81 demonstrated that alumtna crystals loose protons even at 1620 K.
IR-studies of OH-troups in alumina are described by Ei&enmann [9),
119

Enastrom (10] and others.
Hydroaen activity influence, or an indication of such, has been reported for Laeo3 [11), BaTi03 [12, 13], Mao [14), TAG (15], YIG [161 and others.
The experimental results for sarnets will be shortly described below. Basic work for YIG was contributed by Wood and eoworkers (16]. They investiaated the hydroaen uptake in YIG by means of IR-spectrometry and conductivity measurements. This reaction beains at temperatures as low as 520 K. OH-aroups enter the crystal and the defect charae is compensated by a reduction of Fe3+ to Fe2+, TIG equilibrated in hydroaen at 670 ~ contains about 100 ppm OH-aroups. The behaviour of TAG in :a H2-contain1nt ambient at temperatures above 1720 K was investiaated by Devor and colleaaues (15]. IR-spectrometry revealed that protons entering the lattice occupy interstitial positions; they are located between two oxyaen ions forminl a O····H····O arou~ Typical IR-absorption peaks were detected at 3340 and 3374 cm-1, To derive a compensation mechanism Devor et al. consider natural aarnet Ca3Al2Si3012 (trossularite); the synthetic aarnet is formed with T3+ in the dodecahedral ca2+ position and At3+ in the tetrahedral Si4+ position. Followina their results the proton is localized around the T- and octahedral Al-sites in TAG. The substitution of At3+ for st4+ (in the hypothetical tran-sition from arossularite to YAG) makes the tetrahedral Al-site look more neaattve. Followinl Devor and others, a~ compensation mitht be expected by an electron. Moreover, impurities can play an important role as charse compensatint species in TAG. The interstitial proton can leave the position between the two oxyaen ions and move free throuth the lattice at elevated temperature.
Ve performed IR absorption mesurements in pure sintle crystalline TAG and hith temperature electrical measurements on polycrystal· line and sinale crystal TAG.
14.2 INFRARfD BANDS IN ANNfALfO SINGLf CRfSTALLINf fAG
In [15] the authors have shown that hydroten causes IR-absorption peaks at 3340 cm-1 (strontl and at 3374 cm-1 (weak). Due to the relatively low absolute concentration of protons in TAG, even after annealint in a H2-contalnin1 ambient, the samples must be sufficiently thick; Devor et al. used samples about 125 mm (I) thick to obtain the IR-spectra presented in their paper (the number of scans ts not mentioned).
Ve made annea11n1 experiments usint sintle crystalline TAG-bars (20•5•1. 5 mm) of Verneuil-grown material (Hz/HeO-flame); so the as received crystals contain hydrogen. Samples were treated
120

for 12 h at 1670 K in H2tH2o and IR-spectra were taken. Our spectra were recorded at room-temperature with a BRUKER FT-IR spectrometer; resolution: 2 cm-1, 2000 scans. In a subsequent step the samples were annealed for 12 h at 1670 K in oxyeen. Fie. 14. 1 eives the IR-spectra for both samples showine OH-peaks at 3331 and 3366 cm-1, which are approximately the same wavenumbers as reported in [15]. Nakamoto and coworkers [17] eave an IR-frequency vs.d (inter-ionic distance) curve for molecules. Applyin& this relationship we can derive the oxy1en-oxyeen distance in the O····H····O confiluration; for the stretchinl frequencies 3331 and 3366 cm-1 the distances are o. 2805 and o. 2842 nm respectively. Crystallolraphic data [20] showed o2--o2- distances of d61 :o, 2818 and d88=0. 2837 nm (see fil, 2. 1 ). These values indicate respec-tive H-bonds between unshared oxy1en pairs in the octahedral Al-coordination, and also between pairs shared in coordination of adjacent dodecahedra! Y-sites, the Al- as well as the Y-site may partly be occupied by impurity cations. (Balmer et al. [18] tested the Nakamoto relationship for H-bonds in a-alumina and they concluded that the rule works with 1ood accuracy).
The intensity of the OH-peak is decreased after a 12-hour heat treatment in oxy1en at 1670 K due to an outeas process, but nevertheless a residual absorption is still present after such an annealinl treatment.
0.05
0.0
CIJ .0 CO
Fil. J4.J
a
(T) (T) (T)
I
0.0~
b (T) (T)
OH-bond absorption after (a) annealinl J2 h in o2 (T:J670 K) and (b) annealinl J2 h in Hz/HzO (T:J670 K). Len1th of the sample 20 mm.
121

t4.3 flfCTRICAL TRANSPORT PROPfRTI!S or
Ve measured the activation enertY of the conduction process for undoped sinlle crystal and for Zr-doped polycrystalline YAG in CO/COz and in Hz/HzO mixtures havinl approximately the same po2. In both cases the activation enerty in a hydro1en-contain1n1 atmosphere was much lower (tab. 14. t) than in a co;co2 ambient.
Tab. lf.J Activation ~n•riY Ea for the conduction process for different YAG samples in CO/COe and He~eo atmospher~s at hilh temperature.
SAMPLE ATMOSPHERE POz [Pa]
TAG: 5o zr# CO/COz to-11 (polycryst. )
Hz/HzO to-14
TAG• CO/COz 1o-to (sinlle
to-t4 cryst. ) He/Ha
# impurity content see tab. 11. 1 • impurity content see tab. 13. 1
Ea [eV)
3. 54
t. 91
3.'1
1. 46
The fact that the activation enertY in Hz/HeO is considerably lower than in a CO/COz ambient with nearly the same oxyten partial pressure indicates that different processes are responsible for the experimentally determined Ea's. Oxyten vacancies do not play a dominant role in ~ cases, their concentration should be comparable due to comparable poz•s in both tas mixtures. In a Ha/HzO atmosphere, protons are expected to play a dominant role in the defect chemistry. Furthermore the aliovalent dop1nt element Zr, which chan&es the valency from 4+ to 3+ at low pOz, 1overns the conduction process in YAG: Zr.
In the follow1nt. we analyze the defect reactions which are expected to occur and expressions for the activation ener1ies are derived.
122

14.3.1 The activation enerales tor a In YAO:Zr tn H2/H20
As a probable reaction we consider the followinl
eq. -14. 1 112 H2 <1l Hi' + e'
with the mass action relation
eq. -14. 2
E92 represents the eneriY to produce an interstitial proton and an electron and XH2 is the equilibrium constant.
In YAG: Zr the zr4+-ion acts as a donor. The concentration of these donors decreases with decreasinl p02 because zr4+ reduces to zr3+, Colour centres are formed. The reaction reads
eq. -14. 3 Zryx +----+ Zry' + e'
with the mass action relation
eq. -14. 4 [Zry·) [e')
[ZryX]
The neutrality condition is
eq. -14. 5 [Zry') + [Ht'l
Xzr exp [-Ezr/kT)
[ e' l
123

and we set the zirconium concentration
eq. -14. 6 [ZryXJ + (Zry') = [Zrltot·
In a CO/C02-atmosphere zirconium is reduced and eq. -14. 6 reads then [ZryX]:[Zrltot and the electroneutrality condition is [Zry'):[e'). ApplyinC the eq. -14.2 totether with the neutrality condition we find for the activation eneray for electronic conduction
eq. -14. '7 Ea(electronic) = l/2 Ezr
The activation eneray Ea(electronic) in Zr-doped YAG in a CO/C02-atmosphere is 3,54 eV (see tab. 14. 1), so we find that a redox eneray Ezr=T. 1 eV. This is approximately the same value which was derived in section 11. 4 (6-7 eV). If the Zr-concentration would be toverned by [Zry•J:[tr]tot the activation enercy for the electronic conduction should then be zero, which is not the case.
Jn a Hz/HzO-atmosphere we found a much lower activation energy (1.91 eV). The electroneutrality is set equal [Hi'J:[e'). Assumint that protons are coverning the conductivity the activation eneray should be
eq. -14. 8 Ea(hydroaen) = Ea(electronic) = 1/2 EH2
From eq. -14. 8 we see that the EH2 is 3. 8 eV.
t4.3.2 The actlvatl.on enerates for !7 in undoped rAG in f\!/"20
In undoped YAG we found the activation enerties 3,7 eV in CO/COz and 1.46 eV in Hz/H2o. Donor centres are not present tn the startint material - we consider the material as acceptor dominated (see section 13). The basic defect reaction in CO/COz is the formation of oxyaen vacancies (eq. -14. 9) and the uptake of protons.
124

eq. -14. 9
The mass action relation is
eq. -14. 10 Xox exp(-Eox/kT)
with X0 x the equilibrium constant and Eox the enerir for the redox process. If 2 [V0 • • J =[A •) (A' =acceptors) we f lnd for the redox-enercy
eq. -14. 11 Ea(electron1c) = 1/2 Eox
which leads to a redox ener1y of 7. 6 eV, which is comparable to the value found by Rotman and c:oworkers (21) and somewhat hiiher than the value of 6. 1 eV which we derived by computer simulation (see chapter l6 ). If we assume YAG-sample to be pure ([e'):2[V0 ''J) the activation ener1r and the redox process are related by
eq. -14. 13 Ea (electronic) 1/3 Eox·
In a hydro1en conta1n1n1 atmosphere the defect situation la 1overned by the presence of protons. The electroneutraltty relation in this case is [H1 '] = (e'), This lives for the activation ener1r in a H2/H20-atmoJphere
eq. -14. 12
Followinl this equation the ener1y Eae la 2. 9 eV. In the previous chapter we found Ea2 in Zr-ctoped polycrstalline to be 3. 8 ev, which is somewhat hither than the result discussed here.
t25

t4.3.3 The eomplex Impedance behaviour of polyerystalllne
YAO equilibrated in a l%!/ft2'>-atlll0sphere
If polycrystalline YAG is treated at h11h temperature in a He/ H2o atmosphere it is interestinl to know if the 1ra1n boundaries are affected by protons. Polycrystalline YAG samples doped with 50 ppm Zr were invest11ated [19) in different atmospheres (He/02, CO/C02, H2/H20) by impedance spectroscopy. In a previous section we came to the conclusion that in Zr-doped YAG no considerable second phase secrecation at the train boundaries was detectible. Fit. 14.2 tives two Z'-Z''plots for zr-doped YAG recorded in He/ReO (to-14 Pa) and CO/C02 (to-11 Pa) respectively. A bulk- and a poorly resolved 1rain boundary effect indlcatinl a polarisation are seen in both cases.
..... ~ = 0 "'f'
Q -.. .. N
I
4 1 M-!z
\ 100kHz
2 t:. ~I:. t:.t:.,.~~
0 4
1 ld-IZ
\ t:. 100kHZ
2 .I t:.
t:.
0 l:.~t:.li'
0 2 4 ' 8 10
z• [10 4 OHM)
(AJ Impedance plot at pe2: to-t~ Pa : H2/YeO-mixture for YAG: Zr (T:l520 KJ
(BJ The impedance behaviour of the same sample in a CO/C02 -mixture maintaininl a pe2: to-ll Pa (T::I520 K).
126

As it is expected for the n-type conductinl Zr-doped YAG q of the bulK decreases (the resistance increasesl with increasinl p02: RbuJk=37KQ at POa=to- 14 Pa and u. 5kQ at so- 1 Pa uu. 14. 2 ). Additionally it has to be taken into account that the conductivity in a H21H20 mixture is hither than in a CO/C02 atmosphere. The train boundary resistance for the sample in both cases, at low and hlfh po2, can be estimated from the impedance plots to be about 10 kQ. The frequency dispersion (see the 100 kHz points in fit. 14. 2) nearly .ts the same, in spite of the fact that one spectrum was recorded in CO/C02 and the other in Hz/H20.
From the experimental results tiven above we can conclude that protons which enter the lattice bave no substantial influence on the electrical properties of the 1rain boundaries. Tbe effects we observed are bulk effects.
t4.4 ~OMCLUSION
When YAG ia equilibrated in a hydroten containint atmosphere protons enter the lattice. OH-croups are detectable by IR-spectroscopy. Electrical transport properties are also altered by the presence of protons, as seen from the marked difference in the activation enerties for a in CO/C02 and Ha/HaO atmospheres. Impedance measurements made clear that mobile protons are alterinl the bulk- but not the crain boundary properties.
L ITfRATUR~
[1) G. J. Hill, Br. J. Appl. Phys. Ser. !, J. (1968) 1151. [2) H. Iwahara, H. Uchida, J. Eondo, J. Appl. Electrochem. ,
ll (1983) 366. [3] c. L wacner, Ber. Bun•ences. Phys. Chem., ll (1968) 778. [4J s. Stotz, c. JC. Watner, Ber. Bunsen1es. Phyl!. Chem. , IQ
(1966) 781. [6) T. Norby, P Xofstad, J. Am. Ceram. Soc. , n (1984) 786. (6) idem in J. Am. Ceram Soc., J.1 (1986) 784. [7) s. 1:. Mohapatra, P. T1ku, F. A. 1Cr61er, J. Am. Ceram. Soc. ,
H (1979) 50. [8) X. H. Lee, G. E. Holmbert, J.H. Crawford Jr., Phys. Stat.
127

So lld 1 A, ll ( 197'7) 669. [9) ~. Ei1enmann, X. Xurtz, H.H. GOnthardt, Helv. Phys. Acta,
.!.§. ( 19'72) 462. [10] H. Entstrom, J. B. Bates, J. C. Vang, M. M. Abraham. Phys.
Rev. B, Ll. (1980) l520. [11) P.& Mehrotra, G. V. Cbandrachekar, c. H. R. Rao, E. C. Subbarao
Trans. Faraday Soc., ~ (1966) 3586. [12) J. M. Pope, G. S1mkov1ch, Mater. Res. Bull., .2 (1974) 1111. [13) R. Vaser, Ber, Bunsen1es. Phys. Cbem, ~ 1987 2343. [141 H. Xathrein, F. Freund, J. Phys. Che& Solids, ~ (1982)
177. [16] D. P .. Devor, R. c. Pastor, L. G. DeShazer, J. Chem. Phys., ll
(1984) 4104. [16] D.L. Vood, E. D. ~oib, J. ~ Remelka, J, Appl. Phys., ll
(1968) 1139. [17] X. HaKamoto, M. Mar8oshes, R.E. Rundle, J. Am. Che& Soc.,
n C195&> nao. [18) P. Balmer, H. Blum, M. Forster, ~ Schwa11er, H.H. GOnthard,
J. Phys. C: Solid State Phys., .ll (1980) 51'7. [19] L. Schuh, R. Metselaar, G. de Vtth, sc.1. Cer., ll (1988)
9'73. [20) see fi~ 2, 1 and references 11ven in chapter 2 [21) S.R. Rotman, R.P. Tandon, H. L. Tuller, J. Appl. Phys., 11
(1985) 1951.
128

t5 SINTfR ADDITIYfS AND MltROSTRUCTURf
Sinter dopes are widely used in ceramic technolOIY to control crain crowth and to achieve a hilh densiftcation rate. For the sinter1n8 of oxides aliovalent ions are used. So lattice defects are introduced into the syste~ which affect lattice-, arain boun~ary-, surface-diffusion, 1rain boundary mobility and other processes. Furthermore the se1re1ation of second phases at the inter1ranular interfaces controls the 1rain 1rowtb. Concerninl the role of additives in sintertnt, alumina ts the best described material in ceramic 11 terature (e. I· [1) ).
For ternary compounds as T3Al5012• many more hilh temperature processes have to be considered than in the case of binary compounds as A1 2o 3• Harmer and coworkers [2) state that for BaTto3, for example, it is possible to assume some 36 possible rate controllinJ mecbanums.
Hothinl about the controllinl effect of s1nter-add1tives in TAG has been published until now. Ve invest11ated how the arain size distribution depends on the presence of the aliovalent additives MIO, CaO, ZrOz and HfOz.
t5. t fXPfR IME:NTS
All samples were prepared applyinl the standard preparation method which was described earlier. As reference material we consider pure TAG-powders with an impurity content < 30 ppm (donors and acceptors nearly compensate each other). Samples containinl followinl concentrations of sinter additives were prepared and compared with the undoped material:
Tab. 15. J Samples for 1rain size analysis.
TAG 50 ppm CaO YAG 50 ppm MiO* TAG 50 ppm HfOz TAG 200 ppm Hf02 TAG 420 ppm HfOz TAG 750 ppm HfOz YAG 150 ppm ZrOz TAG 300 ppm ZrOz
* 500 ppm MIO were added to the startinl powder, the the final material contained 50 ppm MIO, due to evaporation.
129

The train size distribution was determined by anatyUnt SEM-pictures from representative areas of the sample surface. The analyztna procedure was done semi-automaticallY by applyina the intersection method [3] (equipment and and computer pro1rams were developed bY Mr. Corb1Jn from the Phi lips Research Labs., Dept. Inoraantc Materials). Results of the particle Size analysis are represented in the form of frequency vs. 11 arain size and probability vs. 11 1ra1n sue.
t5.2 RESULTS AND DISCUSSION
Fif. 15. 1 shows a microstructure of undoped TAG; a somewhat d1scont1nous 1rain 1rowth is obvious. Accordinl to the Hillert [11) criterion, grain trowth is exa11erated when grains are present with a arain size two times 1ar1er than the averate train size. A wide grain size distribution ranun• from 1 llm to 20 llm is typical. Analyzinl the 1ra1n size distribution shows a clear bimodal mode with a mean train size (for the area shown in f1f. 15. 1) of 3. 3 ~~~ The complete results of particle size analyses for all samples listed tn tab. 15. 1 are liVen in tab. 15, 2.
Even small concentrations of the stnter additives Mao and cao have a strona grain trowth inhibi una tnf luence on YAG (see fig, 15.2). The train size distribution is narrow, no discontinuous 1rain arowth is detectable. A bimodal mode ts found aaain. TAG doped with 50 ppm MIO has a mean aratn size of 1. 6 pm and YAG with 50 ppm cao exhibits a mean arain size of o. 8 pm (which ts similar to the arain stze of the startinl powders). All samples investiaated bere are translucent and have a densitY of more than 99 x of theory.
The dopants zro2 and Hf02 also suppress discontinuous train arowth (fif. i5. 3), but in comparison to Mao- and CaO-doped material the mean grain size is shifted to hither values, e.,. 2.4 pm for TAG:200 Hf. Again the particle size distribution was bimodal.
130

Fig. 15.1 SEM-photograph of undoped YAG
Fig. 15.2 SEM-photograph of YAG: 50 Hg
111

Fig. 15.3 SEN-photograph of YAG: 750 Hf
A plot of the grain size distribution for YAG doped with qzo and 750 ppm HfOz respectively is presented in fig. 15. q . With increasing Hf-content the mean grain size is significantly shifted to higher values, while the shape of the grain size distribution broadens.
Fig . 15. 4
30
42 0 pp m 20
750 ppm
10 0
0 2 4 6 8 pm 10
Grain s i ze distribution for YAG doped with 420 and 750 ppm Hf 0 2.
132

The frequency vs. arain sue and probability vs. arain size plots for all samples are iiven in the appendix.
Tab. 15.2 The lr!iin size distribution in pure and doped Y.AG
Sample pure 50 ea 50 Mi .200 ~.20 750 150 300 Hf Hf Hf Zr Zr
Grain size All Samples showed a bimodal arain size distribution distr.
Class J of the bimodal distribution ---------------------------------------Size from o. 81Jm 0. 21Jm o. ~IJm o. 81Jm o. 7~o~m 1. ~IJm 1. 3~o~m 0. 91Jm
to 3. 2 o. 6 o. 9 .2. 9 .2. 1 3. 6 3 . .2 3. 1
Fraction o. 6 0. 3 o. 1 o. 7 o. ~ o. ~ o. 3 0. 5
D(50X) .2 . 1 o. ~ o. 7 1.9 1.6 .2 . 6 2. 5 2. 2
Class 2 of the bimodal distribution ---------------------------------------Size from 3. 21Jm o. 71Jm 1 ~o~m 2. 91Jm 2. 51Jm 3. 6~o~m 3. 2~o~m 3. 61Jm
to 10. 6 1.9 ~. 0 5. 5 5. 3 6. ~ 7 . .2 6. ~
Fraction 0. ~ o. 5 o. 8 o. 3 o. 5 o. 5 o. 6 0. ~
D(50X) ~. 6 o. 9 1.6 3. ~ 3. 1 ~. 6 ~. 6 ~. ~
Mean arain 3. 3~o~m o. 8~o~m 1. 61Jm 2. 5~o~m 2. 51Jm 3. 91Jm ~. 3~o~m 3. 31Jm size
t!5. 3 fXAMPlf or f~fRATfD ORAIN OROWTH
Several papers about so called exaaterated train arowth in metals and ceramic materials have been published in the past, for in stance for YIG [~) or for alumina [5). An excellent short description of normal and abnormal train arowth is tiven by Burke in ref .
133

[6). Various explanations for exaggerated grain growth are given in literature. So it was shown by Beck and coworkers [7) that the phenomenon can be associated with the disappearance of inclusions by solution. Kooy [4) assumes that the effect in TIG should be due to the presence of a liquid phase at the grain boundaries. The rate of exaggerated grain growth is then determined by a solution and precipitation process rather than by grain boundary migration.
In one of our YAG samples doped with 750 ppm Zro2 grains of some iOO IJm were observed as shown in fig. 15. 5. This effect should be caused by impurities, unintentionally present in the green body; the forming of a liquid grain boundary phase, which was found in YIG to be responsible for exaggerated train growth, cannot be excluded. The model proposed by Beck et al. [7), which associates abnormal grain growth with the disappearance of inclusions (or pores), seems not to be an appropriate one. Our ace !dental finding in YAG demonstrates that controlling the impurity and dopant content in the starting powder and the green body is essential to obtain a homogeneous microstructure.
Fil. 15.5 Exaggerated grain growth in YAG sintered under standard conditions.
134

t5.1 CONCLUSION
CaO and MgO are effective 1ratn 1rowth inhibitors, with cao beinl more effective. Hto2 and ZrOz promote 1rain srowth with the stron1 tendency to suppress exa11erated train trowth, which is observed in undoped YAG ceramics. ea and probably also MC control the 1rain boundary by forminc a second phase at the train boundaries.
LITfRATliRr
[1] R.J. Brook, Proc. Brit. Ceraa Soc., ~ (1982) 7. [I!] M. P. Harmer, H. M. Chan, D. M. Smyth, Mater. Res. Soc. Symp.
Proc., M (1986) SU. [3) H. E. Exner, z. Metallkde., ll (1966) 7511. [4) c. X:ooy, Sci. Cer. ,,1 (1965) u. [5) R. L. Coble, J. Appl. Phys., ~ (1961) 787. [6) J.E. Burke in "Ceramic Microstructures- Their Analysis, S18-
n1ficance and Production•, Ed. by R.W. Fulrath and J.~ Pask J. Wiley A Sons, 1968, p. 681.
[7] P.~ Beck, KC. Holsworth, P. Sperry, Trans. AIME, ~ (1949) 163.
(8) x:. ~ Berry, M. Lynch, unpubliShed work mentioned in ref. [2). [9) Y. Sakabe, J. Appleby, Y.H. Han, ~ Wintercrass, ~M. smyth
86th Annual Meetinc of the American Ceramic Society, paper number 1!3-E-84, 1984.
[10) C.A.M. Mulder, G. de Vith, Solid State Ionics, ll (1985) 81.
[ 11 J M. Hi llert, Acta Metall. , il (1965) 21!7.
135

t6 tCMPUTfR SIMULATION Of DffftTS IN eARNfTS In the recent years computer modellint of perfect and defective solids has become 1ncreasinllY interestinf. Experiments are sometimes supplemented by a computer simulation in order to support or dismiss a proposed model. On the other hand such simulation• can be used to obtain basic data which may be difficult to determine by experiments (e. I· the formation eneray for Schottky and Frenkel defects 1n an ionic crystal). Defect calculations have been very extensively appl1ed in studies of ionic oxides and halldes. There are several papers and review articles dealinl with the potential and limitation of computer simulation of bulK solids and surfaces [e. I· 3-6). In most cases calculated data, liKe lattice enercies or dielectric constants, are in aood acreement with experimental results [1,2]. In the future simulation techniques of solids may become a predictive tool in materials science which can lead to a development of improved materials with •tailored" properties.
Ve used the computer simulation of solids to cet basic defect formation enerties and more complex data (e.a. redox ener11es, activation enercies of diffusion processes etc. ),
t8. t Ttfi!CIRY or DfrfeT I)AlCIJLATf(Hi - A Sf(fTI)H
The crucial questions of defect chemistry are atomist1c questions. First of all - what are the diffuslnl species; are they vacancies or interstitials or both; what is their charce: are they associated or free? Second, bow are they formed; are they extrinsic or intrinsic; if intrinsic are they formed by oxidation or reduction;. if extrinsic, what are the impurities responsible? Third, what are the mechanisms of mtcratton? These mechanisms depend on the nature of the diffusinl species. For a tiven defect, however, there can be more than one mechanism, e. I· as in alkaline earth fluorides [7).
For tonic materials the theory of lattice defects is largely concerned with two main problems:
1) the derivation of suitable interatomic potentials (in stronllY ionic materials two body potent1als)
2) the treatment of the lattice relaxation around a lattice defect.
For the first problem, the derivation of appropriate interatomlc potenttals; there are two essentiallY different approaches. The first, which was based on the work of Fumi and Tost [8), inv,olves the use of Born-Mayer - or BucKingham - potent1als which are parametertzed empirically by fittinl the calculated perfect 'lattice properties as closely as possible to experimental values. The perfect lattice properties to which data are fitted are usually latt'ice para-
136

meter, lattice eneray, elastic and dielectric constants [9]. The BucKlntham potential is fiven by
eq. -16. 1 V(r) = A exp(-r/8)-cr-6
The parameters A, a and c must be asaitned for each ton-ion interaction and r is the distance between a tiven pair of ions. By this procedure emoirical short rante potential& are obtained. Such potentials are used here. An alternative approach is to calculate interatomic potential&, e.f for metals, with the the electron-tas methods [10). These non-empirical potential& are seldomly used at present, however.
An essential point in the computer simulation of defective solids is the introduction of the ionic polarisation. Despite its simplicity the shell model introduced by DicK and Overhauser [11) to calculate the dielectric properties of alKali haltdes remains the most effective way of doinl this.
The second question, ttte lattice relaxation around a defect, in recent calculations is mainly discussed in terms of a model developed by L1d1ard and Noreett (12] and Noreett [13). The basic idea behind this model is a minimisation of the total enerey of the crystal by relaxation of the positions of the ions around the defect. This relaxation decreases fairly rapidly for increasinl distances away from the defect. To treat this mathematically, the retion around a defect 11 partitioned into two concentric spheres as shown in fie. 16. 1
D• defect
00
Fil. 16.1 Spherical zones around a de#ect.
137

In the central ret1on the forces exerted by the defect on the surroundint lattice are stront and the relaxation in this retton is handled by an explicit eneriY minimisation. In that procedure the positions of all atoms (considered oritinally to be on perfect lattice positions) are adjusted under the action of 1nteratomic potentials until they are in equilibriua The ions are allowed to polarue. In contrast to this explicit treatment of the inner relion a more approximate approach is used for the outer retion. Due to the treater distance the perturbint effect of a defect is relatively weak. The procedure applied therefore is the Mott-Littleton approximation describint the polarisation of a continuum of solids [i]:
eq. -16. 2 p Vqri
r3
P is the polarisation in the outer ration (ration II, see fil. 16. 1), V is the unit cell volume, q is the charte of the defect, ri is the distance for which P is calculsted, E0 is the dielectric constant and, finall~ r ts the distance of the particle~ Eq. -16.2 is only valid for electrically isotropic materials.
A detailed discusuon of the simulation procedures is five" by Catlow and Mackrodt [1] and by Catlow [14]. There is now a number of computer codes for undertakint such calculations. The or1t1nal HADES-code (Harwell Automatic Defect Evaluation Pro1ram System) developed by Hor1ett [15] could be applied ohly to cubic materials. A further developed HADES-code (HADES III) allows to study non-cubic systems [1). The code applied in this 1nves11atton is the CASCADE-code (Cray Automatic System for the Calculation of Defect Enerties) developed by Leslie [16), This protram was created to exploit the vector processint facilit.ies of Cray-computers. CASCADE is a combination of HADES III and the perfect lattice simulation protram PLUTO (Perfect Lattice Unrestricted Testtnt Operation) developed by Catlow and Hortett [17]. PLUTO calculates by enerty minimisation lattice enerties, elastic and dielectric constants for perfect crystals with the restriction that a static lattice la simulated (no thermal motion). Despite this restriction the results of CASCADE stmulatlons (e. •· detect formation enerties) are appropriate to predict properties several hundred de1rees below meltinl point; the defect formlnt ener11es do not not chan1e with temperature to a treat extent.
t8.2 THf PfRff~T LATTI~f PROPfRTifS ~ YAe
It is commonly assumed that the parameters introduced tnto the
138

Buckintham potential are constant for ions in different crystallotraphic surroundints. The quality of the parametertsatton is usually checked by comparlnl the hilh frequency- and static dielectric constant and the elastic constants known from experiment with those calculated by PLUTO. Due to the fact that no reliable yttrium potential was available a potential was derived from sro - sr2+, is tsoelectrontc with T3+, Yttrium (strontium) and oxy1en cores and shells were introduced into perfect lattice calculations, while the small Al-ion was assumed to be unpolarizable [18]. Besides TAG we also simulated defect properties of TIG. Both tarnets have completely different physical and chemical properties (see section 3). The input parameters for TAG and TIG are liven in tab. 16. t.
Tab. 16.1 lnput-par&meters for the perftu:t lattice simulation
IOH A(eV) au, T+ C I e I ) 1:+ (eva-2) ci(eva&)
----------------------------------------------------------------o2- 22'164. 0 o. 149 o. 8481 n. 92038 2'1. 88 y3+ 1345. 1 o. 3491 -o. nt 71. 10000 0.0 At3+ 1469. 3 o. 29912 3. 0 o. 0 Fe3+ 1102.4 o. 3299 -1. 91 304.7000 o. 0 zr4+ 1453. 8 o. 3500 3. 0 o.o ca2+ 1090.4 o. 3437 -1. 135 110. 2000 o. 0 Ml2.+ 1280. 1 o. 3177 2. 0 0.0 Hd'3+ 1379. 9 o. 3600'7 -3. 26 145.0000 o.o
A = short ran1e potential between cation and anion in the Buckinl-ham model
a : parameter in the Buckintham model Y+= chart• of the core in the shell model 1:+= core-shell sprint constant 1n the shell model c6: attractive contribution in the suckintham model Al3+-parameters were taken from [3), the others from [18).
The dielectric and elastic constants derived by PLUTO are atven in tab. 16.2 totether with experimental values.
Tab. 16.2
COHSTAHT
Eo Ea>
cu Ctz C44
E1au(eV)
TAG calc.
8. 1 2. 9 39. 5 13. 5 u. 7
-602. 6
exp.
11.0 3. 5
33. 3 11. 3 11. 5
YIG calc.
to. 6 !. 9
33 • ., 1!. 0 11. 1
-5'18. 7
Ctt•Ctz and c 44 are 11ven !n the units to11 dynjcm2. Experimental values were taKen from [19-21).
139
exp.
27.0 u. 0 7.8
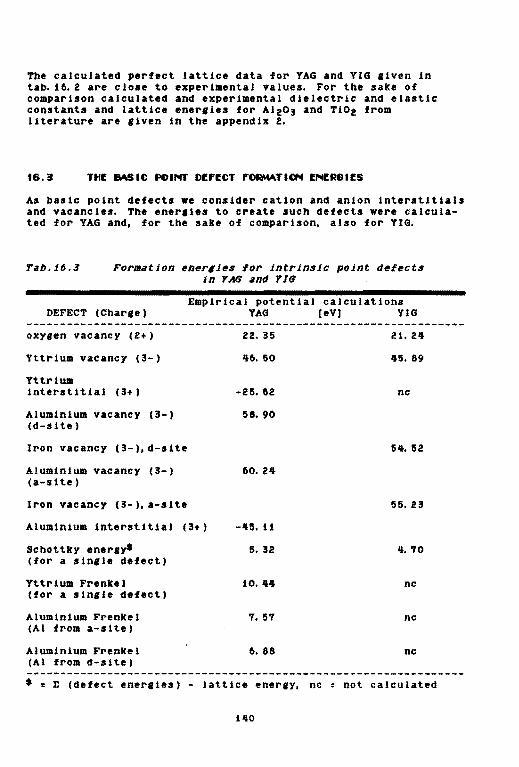
The calculated perfect lattice data for TAG and YIG given in tab. 16. 2 are close to experimental values. For the sake of comparison calculated and experimental dielectric and elastic constants and lattice energies for Ale03 and TiOe from literature are given in the appendix 2.
As basic point defects we consider cation and anion tnterstitials and vacancies. The enerr1es to create such defects were calculated for TAG and, for the sake of comparison, also for YIG.
Tab.16.3 Formation ener1iea for intrinsic point defects in Y.AG and YIG
Empirical potential calculations DEFECT (Charge)
oxygen vacancy (2+)
Yttrium vacancy (3-)
Yttrium interstitial (3+)
Aluminium vacancy (3-) (d-site)
Iron vacancy (3-),d-site
Aluminium vacancy (3-) (a-site)
Iron vacancy (3-),a-stte
Aluminium interstitial (3+)
Schottky energy$ (for a sinrle defect)
Yttrium Frenlel (for a sinrle defect)
Aluminium Frenkel (AI from a-site)
Aluminium Frenkel {Al from d-site)
TAG [eV) YIG
21. 24
46. 50 45. 89
-25. 62 ne
58. 90
54. 52
60.24
55. 23
-45. t t
5. 32 4. '10
10.44 ne
'1. 57 ne
6.88 ne
$ = E (defect ener11es) - lattice energy, ne : not calculated
140

The vacancy formation ener•y is the ener8Y required to remove an ion from a lattice site to infinity aJJowtnc, the rematninC lattice to relax around the char8ed vacancy. The formation eneriY for an interstitial involves the movement of an ion from infinity to an interstitial lattice site. The combination the formation ener8Y for an interstitial and a vacancy of an ion 8ives the Frenkel defect ener8Yi both defects are supposed to be independent from each other. Due to the fact that there are two different At-sites, two different Frenkel ener,ies (for the d- and the a-site) can be derived (see tab. 16. 3). The radius of Y-ions is rather tar8e to form interstitials in the carnet lattice, so Y-Frenkel defect formation ener11es are considerably lar8er than the Al-frenkel ener8ies.
From our vacancy formation ener81es the Schottky ener1y is calculated as 106. 3 eV for a complete Schottky multiplett, which lives 5. 3 eV per sin8le defect in YAG. This ener1y is lower than the Frenkel ener81es (6. 9-7. 6 eV). So it can be concluded that that Schottky vacancies are the favoured intrinsic defects. Derivin8 s1n8le SchottKy- or Frenkel-defect ener8ies by dividin8 the ener8Y of the defect multipletts by the number of defects does lead to avera•e values. But Catlow, Mackrodt and others [2, 3,5,6) introduced this simplification and it became the most common way to derive such ener81es from simulation data.
t6.4 fC>RIEifll'!l I:ATIOOIS IN YA8 ANI> YIG
The properties of ceramic materials are strontlY influenced by intentionally and unintentionally present impurities. These ions are expected to occupy specific sites dependin8 on their radius and char1e. The radii [22) we used are 8iven in tab. 16.4 to8ether with the lattice site they will occupy [23, 24]. The reason why Hd as a foreitn ion was treated as a subst1tut1onal defect will become clear later.
Tab. tti. JJ Ionic radii and substitution sites Jn the YAG lattice
Specle.s
Mg (2+) Zr (4+)
ea (2+) Hd (3+)
Radiu.s [.\] 11
o. 89 0.'12 0.78 1. 12 1. 12
Substitution .site¥
c-.site (Y) a-site (Al) d-site (All c-.site (Y) c-s1te (Yl
•taken from [22], $ taken from [23, 24]
141

The energies for introducing the tons into the YAG lattice by substitution are given in tab. 16.5. Potentlals and other parameters necessary for the CASCADE procedure are given in tab. 16. 1 (taken from [18) ).
7'ab.16.5
YAG
YIG
Calculat~d ~n~rli~s lor substitutions/ d~lects in YM
Defect type Ener8Y [eV]
May• 18.3
ZrAl (d-site) -19. 33
(a-site) -20.76
Zry . -33. 16
zryx 1.2
Cay' 23.0
CaAI' 36. 7
Bdyx 3. 1
Cay• 23.07
The oxidation of TAG can be written for the infinite dilution limit (no defect-defect interaction) as
eq. -16. 3
We assume that the holes form small polarons. In a separate CASCADE simulation the enerey of an o- on an o2- position was esti-mated to be 18.6 eV (=Eo-)• To derive the hole formation eneriY
142

followinl the reaction o0 X + h"--> 0 0 " we have to combine E0 - with the second electron affinity of oxy1en. Eox can be calculated by applyinl the relation
eq. -16. 4
Evo EDiss E12 En
Eox -Evo + 1/2 EDiss - E12 + 2 Eh
= = =
-22. 36 + L 16/2 + ~ 28 + 2·9. 85
= 7. 2 eV (695 kJ/Mol)
oxy1en vacancy formation eneray dissociation eneray for 02 (taken from [32]) first electron affinity for o 2 (taken from [32]) hole formation ener1y <= Eo- - E2 =
18. 6 - 8. 75 = 9. 85 ev, Ez (second electron affinity) was taken from [32])
In doped YAG a clusterint of defects can occur. eonsiderint the interaction of o 0 • with substitutional ea-ions we calculated that the cluster (eay•-o0 • )X is stabilized by o. 31 ev. so the ener1y for the redox process is reduced. Per reaction liven in eq. -16. 3 two holes must be taken into account. This noninfinite diluted ea-doped system has a redox ener1y of 6. 58 ev, which is in fact a relatively hith hole formation eneriY·
Another possible redox process that may occur in YAG is the follow-1nl
eq. -16. 5
In the defect calculation we assume that the electrons are located on Al3+-tons forminl AlAl' defects with a eneray EA12+ of 31.6 eV (small polaron). We ut the polaron formation eneriY by combinint EA12+ with the third ionisation potential of Al. The ener1y associated with the reaction liven in eq. -16. 5 is
143

eq. -16. 6 Eox Evo - 1/2 EDtss + E12 - 2Ee
6. 36 ev (614 kJ/Mol ).
Ee = ener1y for small polaron AlAl' ( = EAH!+ - E3, ionU : = 31.6- z~ 53= LOT ev E3. 1on1s taken from [28} )
Rotman and coworkers [21) by measurinl the temperature dependence of the electrical conductivity found for the redox ener1y uven in eq. -16. 5 a value of 1. 8 eV. Their material was acceptor dominated sinlle crystalline TAG.
In ea-doped TAG oxy1en vacancies can interact with the substitutional ea-ions. This process raises the redox ener1y for the reaction liVen in eq. -16.3 and the redox energy for eq.-16. 5 is lowered.
We look at the ener1etics of the dimer [CaT'-Vo'')' and trimer [CaT'-V0 ''-eaT'lx formation. Dimers and trimers are associated with an ener1y of 1 eV and 1.1 eV respectively. This effect reduces the energy for the reaction liven in eq. -16. 5 to 5. 36 ev 1f dimera are formed. For the case of heavily ea-doped TAG the re-dox energy is 4. 66 ev, when trimers may for~ If holes are formed in ea-doped TAG followinl eq. -16.3 the eneriY for this reaction Will be 8. 2 eV when dimers and 8.9 eV if trimers are present.
In a body centered cubic lattice containinl 500 ppm foreiln ions the statistical probability to find two of them in adjacent lattice sites is o. 053; so the probability that trimers CaT'-Vo' ·-caT' are formed in TAG: 500 ea can not considered to be zero.
These calculations clearly show that an association of defects cannot be 11nored. Comparable or even greater defect-defect interaction ener11es were, for instance, reported for TiAl ·-V AI"' in a 1 umtna [25) and for Scce • -V0 .. in ceria (26].
Followinl our discussion of redox energies in oxides it should be mentioned that Maekrodt reports the enercies for processes equivalent to eq. -16. 3 and 16. 5 in alumina to be 4. 4 and 9. 1 eV respectively [1!), for the case of infinite defect dilution. This means that in alumina the hole formation enercy (4.4 eV) is relatively low. Accordint to our result we expect that ionic conductivity dominates in acceptor doped YAG, due to the high hole formation
144

eneriY· Actually we find the ionic transport number t=i in the entire po2-re11me in YAG containinl 500 ppm CaO. F11. 10. 2 shows the ionic transport number for TAG: 500 ppm cao at two temperatures. At 1100 K the conductivity is ionic, at 1470 K a considerable ptype electronic conductivity at hilh pOz iS obvious. With increasint temperature the electronic conductivity becomes more and more dominant. Our simulation results are in accordance with this experimental fact. In alumina doped with much hilher acceptor dopinl levels there is always a distinct hole conductivity, even at lower temperatures. This fact can be explained by the lower hole formation ener1y in Al203.
Several papers show that redox reactions in YIG are much easier than in YAG. ThiS can be explained by the nature of the iron ions. A difference between TAG and YIG 1& the presence of an ion with a variable valency in the latter. The ener1y for the reduction of Fe3+ to Fe2+ in YIG was calculated to obtain an impression about the difference in the redox behaviour of YAG and YIG on an atomic scale. In the CASCADE procedure Fe3+ was replaced by Fe2+, which was considered as a small polaron. The energy connected with this small polaron was calculated without paying attention to ligand field effects. Since ligand field effects are ignored here, we should correct the formation ener1y for the ligand field splittint of the iron in the oxyaen environment. The litand field splittinl ener1y Etil for a-Fez03 is given as [6,31]
-2/5 · 174 kJ/MOl = - 69. 6 KJ/Mol -o. 72 ev.
The energy for creatina a FeFe' was calculated to be 26. 9 eV. A reaction involving the reduction of iron-ions in YIG is
eq, -16. 7
The energy is calculated as
145

eq. -16. 8 E
= 21. 24 - 5. 16/2 - 7. 28 - 1. 5 - o. 72
= 3. 16 ev (= 305 kJ/Mol)
Eye IP(Fe(2+) - Fe(3+)) - E(Feye') = 30. 651 - 26. 1 = 3. 751 eV
IP = ionisation potential (from [28] )
The eneray for a reaction followint eq. -16.7 1nvolvint a reduction of iron-ions is relatively low, 3. 16 e~ So it is the low eneray for the redox reactions in YIG that allows processes which are hilhly disadvantaaeous in TAG. e. •· a considerably hither reversible loss of oxyaen in YIG (see section 3).
t6.6 Ttl£ OISSC>LlJT 1004 ()f' t:aC> IN YAG
t6.6. t The eneray for substltutlna Y by t:a
In this section we investitate ea-ions in TAG from the atomic point of view. In the TAG-lattice ea can only occupy the 'T-sites, because ea has a larae radius (12X laraer than y3+). The low solubility reap. the hilh searetat1on can be considered in terms of
J. ~ siz~ effect; the c~-1on is •too bil• for the Y-site ~nd th~ Jor solubility ~nd the 1r~in boundary s~1re1ation is caused by a •misfit strain".
2. a char1~ ~ff~ct b~c~us~ a 9+ ion is substituted by a 2+ ion. 9. a combination of i. and 2.
In order to decide which of these effects dominates we calculated the ener1y for the substitution of T3+ by an ion with the same radius as ea but with a 3+-charae, so that the effect we find is the "misfit strain". Nd3+ has the same radius as ca2+, The eneray for replacint T- by Nd-ions was calculated usint a complete set of CASCADE input parameters, which is tiven in tab. 16. 1.
146

The formation of Hdyx needs 3. 1 ev. Replactna Y by ea formtna a eay• needs 23 ev. The difference between both defect ener-ties is mainly caused by the difference in the ionic charae. When such a charaed defect is created a charte compensattna defect has to be taken into consideration. In YIG the solubility of ea reaches several hundred ppm because the charae is compensated by a valence chance of iron tons. Such a mechanism is not possible in YAG. The eneraettcs of a process comprtstna the formation of oxyaen vacancies and a simultanous reduction of Fe is considered later.
t&.6.2 The selut.len eathalpy et Ca() In YAD
A simple approach to estimate the solubility of eao in YAG is to derive the mixint enthalpy underlyina calculated defect enerates. We have to consider the eneray for a ea-ton on a Y-site toaether with an appropriate charae compensation mechanism by anion vacancies or by cation 1nterstit1als. Another compensation mode is a self-compensation in Which ea-substttutionals are compensated by Ca-interst1tials. Self-compensation is not advantaaeous because the formation eneray of ea-1nterst1tials ts very hith. Hence we consider only the vacancy and the interstitial compensatio~ The vacancy compensation reads
eq. -16, 9
Within the model the displaced Y-ions form yttriumoxide at the surface; so, besidea the point defect eneraies we need the lattice eneray of cao and YzOs. The lattice eneray of eao has been derived earlier by a perfect lattice simulation procedure applyinl the same potential& we use in our calculation of the point defect enerates [6); the calculated and the experimental values are the same (36 eV). For Y2o3 no appropriate calculated values were available, so we performed a PLUTO-calculat1on Uvint a lattice eneray of 135.4 ev. The experimental value 1s 131.5 ev {28). The eneray for the vacancy compensated process is calculated by eq. -16. to usint the eneraies a1ven in tab. 16. 6.
147
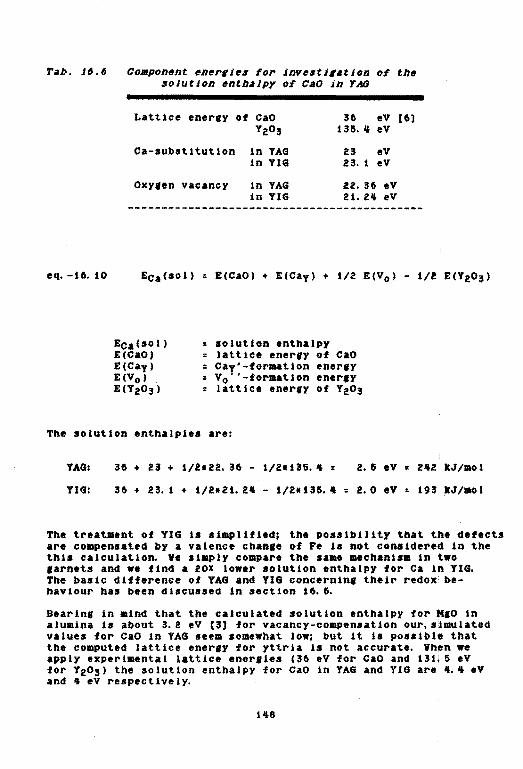
eq. -16. 10
Component ener1Jes for JnvestilatJon of the solution enthalpy of CaO Jn YAG
Lattice energy of cao u ev [6) T203 135.4 ev
ea-substitution in TAG 23 ev ln YlG 23. 1 ev
oxyaen vacancy in TAG 22. 36 eV in YIG 21. 24 eV
--------------------------------------------
Eca{SOI)
Eca<sol) E{CaO) E{CaT) E(V0 )
E(T20 3 )
E(CaO) + £(CaT) + l/2 E{V0 ) - 1/! E{Tt03)
solution enthalpy lattice eneriY of cao caT•-formation energy
• V0 ''-foraatJon enertr • lattice ener1y of T203
The solution enthalpies are:
TAG: 36 + 23 + 112122.36- 1/21136.4 • 2.6 ev = 242 tJ/mol
TIG: 36 + 23.1 + l/2•21.24- l/21136.4: 2.0 eV • 193 kJ/mol
The treatment of TIG is simplified; the possibility that tne defects are compensated by a valence chante of Fe is not considered in the this calculatto~ Ye simply compare the same mechanism in two tarnets and we find a 20X lower solution enthalpy for ea in TIG. The basic difference of TAG and TIG concerntnt their redox behaviour has been discussed Jn section 16.6.
Bearin« in mind that the calculated solution enthalpy for MIO in alumtna is about 3.2 eV [3) for vacancy-compensation our,stmulated values for cao in TAG seem somewhat low; but it is possible that the computed lattice eneray for yttria is not accurate. When we apply experimental lattice enerates (36 eV for cao and 131; 6 ev for T2o 3 ) the solution enthatpy for cao in TAG and TIG are 4. 4 ev and 4 eV respectively.
148

As we mentioned at the begin of this section, charge compensation can alternatively be achieved by an interstitial mechanism following eq. -16. U
eq. -16. u
For this reaction the calculated eneray is &. 34 eV usinl simulated lattice eneraies, applyinl the experimental values an energy of 6. 64 eV is found. An interstitial charae compensation mechanism consumes 2-3 times more eneray than the vacancy compensation. so we can conclude that vacancy compensation dominatu in YAG.
16.6.3
This effect has already been mentioned in chapter 16. 5. lf we simulate a defective tonic solid we have to take into account that defects with an opposite charae attract each other. This effect becomes more pronounced when the concentration of the defects is hilher. So positively cbaraed oxyaen-vacancies and neaatlvely charaed ea-tons on Y-sttes can form associates or clusters. The association enercy for [Cay'-Vo'')' was found to be 1 eV and the eneriY that comes free when the neutral cluster [Cay•-v0 ''-Cay') is formed is 1.1 ev. James [25) calculated the association ener&ies for [M&Al'-V0 ''-M&At'l in a1um1na and found 1. a eV; so our values correspond rather well. In principle the solution enercy is reduced by clusterin&-effects. The tonic oxy1en vacancy conductivity is expected to be reduced due to a clusterinl of V0 '' and cay', because the concentration of free V0 '' is lowered by the amount which is bound to ca-subatitutionals. The concentration of oxycen vacancies increases with decreaain& pOz, so the concentration of the clusters should increase with decreaatna oxy1en partial pressure. In the low conductivity material we 1nveat1aated we found no concrete experimental indication of ctustertna. But for aood ton-conductor ZrOz such effects are well known uu.
t6.l T~ SOLUTIO'ol Of" MaO IN Y.o\8
Applytna the appropriate defect formation and lattice enerties it possible to calculate the solution entbalpy for MtO in TAG. Ve assume aaain a vacancy compensation to be moat probable. The lattice enertY for M&O of 40.74 ev ts ctven by Catlow [6). Writing an equation comparable to eq. -16. 10 the solution enthalpy
149

is found to be 2. 5 ev. This enercy as well as the solution enthalpy for CaO in TAG are smaller than we expected. But we have to bear in mind, that, firstly, the perfect lattice simulation of the complex carnet structure is not as cood as for more simple structures; there is still a discrepancy between experimental and calculated dielectric and elastic constants. Secondly there is a marked difference between the calculated and experimental lattice enercy for yttria; so we cannot decide finally which is the correct one. And last but not least, we have used an y3+-potent1al, which is in fact the potential of the tsoelectronic sr2+,
t&.8
1&.8. t
Usinc the CASCADE-code we determined the mtcration enercies for movtnc tons. The crucial feature in this procedure is, as already mentioned, that the complete relaxation of all ions around the movtnc species is taken into consideration. By movine the ion step by step along its path the potential surface for the mitratlnl ion and hence the saddle point eneray 11 obtained.
Ve consider a mi1ratin1 oxy1en ion. This species is thoUiht to Jump from a re1u1ar lattice-site to an adJacent vacant oxy1en site. This process is an elementary diffusion step. The activation enercy for such a process is the difference in enercy between the initial state and the top of the transition site (see 111. 16. 2)
tl-E-tt I T F
I E
0 VACANCY
Q MIGRATING ION
Fllf.JIL2. Schtusatlc dlalfr.tl/11 for a v11cancy lllilfNitlon
160

In CASCADE we created oxyaen-vacanctes at the start and the final positions and located an interstitial half way between both positions. CASCADE calculates the saddle point eneray, which ts in most cases not the lowest eneray path; we come back to this point later.
By applyinl the polyhedron model of tarnets it becomes clear that several oxyten jumps in the lattice have to be considered. The four different elementary Jumps are shown in fil. 16. 3.
FU. 16.3
Tab • .t6.'l
Four possible different elementary Jumps of oxy1en-1ons 1n the 1arnet 1tructure.
Saddle point ener11es of movinl oxy1en .tons. NJ1ration paths #tltl 111. 16.3.
Millration path
1 2 3 4
151
Saddle point enertY [eV)
2.09 1. 50 3. 34 1. 84

Simple half-way saddle point ener11es were calculated for the four diffusion paths shown in fif. 16. 3. The values are liven in tab. 16.1. Jump 2 and 4 are sufficient to find a continuous path for m1tratinl oxr1en ions. A projection of a part of the unit cell with the elementary jumps 1s shown in f11. 16.4. Followint this model Jump 4 with t. 84 ev is the hilhest barrier for a movinl oxr1en ton - the hilhest calculated saddle point enertY in a continuous oxy1en path is comparable to the activation enertY for Ionic conductivity reap. the activation ener1r for oxrten diffusion. Tab. 16. 8 tlvea the activation enerties ionic conduction and diffusion processes in TAG.
Projection ol a quarter ol the 1arnet unit cell on the y,z-plane. Different Jumps are marked.
152

rab.J6.8 Activation ~n~rli~s Eafor conductivity and diffusion proc~ss~s in YAG compar~d with caJcuJat~d saddJ~ point ~n~rli~s.
Ea for V() diffusion [eVJ
3. 36 (Z9)
Ea for ionic conductivity (eV)
2. 3 [30, H, J t. 9-2. 5 #
# results by CASCADE-calculation
Saddle point eneray (eV)
1. 6 -3. n I
t6.8.2 The spatial dependence of the saddle point enerales
Recently it was mentioned [29,30) that the favourable transition state of a jumpina ion can have larae displacements out of the plane (up to half a unit cell) of the adjacent lattice sites. In order to aet an impression about the saddle point displacement for jumptna oxyaen ions we calculated the spatial variation of the activation eneray for a jump of an oxyaen ion from a hsite to an empty h-stte on the same tetrahedron. A coordinate system was placed in the tetrahedron, as shown in fia. 16. 5, with its oriain half way between the start and the end positions.
Tab.J6.9 Coordinat~s of the four o-atoms forminl a t~trah~dron.
X
0.76415 o. 28285 o. 46715 o. 28285
y
-0.0501 0.09665
o. 0501 -0.09665
o. 15335 o. 19985 o. 34666 o. 30015
153
X
z
Fi1.16.5 Jumpinl 1eom~try on a t~trahedron

The saddle point of the movtna ion was shifted step by step from the initial position alona the x-, y- and s-d1rection as indicated in fil. to. 5. The maximum displacement in x-, y- and z-direction was o. 5 &, 0.90 & and o. 78 A respectively. A distinct eneriY minimum was found, showinl that the most favoured transition state is shifted o. z A in x-direction and about o. 3 A tn y-direction, as shown in fig. 16. 6. The activation eneriY in the minimum is 0. 5 ev (:Z5X) tower than at the position between the oxy1en sites.
Th~ dJIIusJnl oxr1•n Jon do•s not move aJon1 a straJiht JJne connectJnl start and •nd position ol the Jump. The path ol minimal ener1r is displaced 0.2 i above the plane ol tro adjacent sites. The ener1r barrier lor this path Js 0.5 eV Jorer than for strailht jump.
This result shows that the minimal ener1y path for a diffusinl oxy1en ion has a distinct curvature; the enertr for the elementary Jumps is in this case reduced by about Z5X. So the ener1ri for elementary diffusion steps should be lower than values we calculated by considering simple half-way saddle points.
154
t6.8.3
The possible Jumps of Al-ions are more difficult to study than oxylen-Jumps, because the cation-cation distances are much 1ar1er than the anion-anion distances. The 0-0 -distance on a tetrahedron is about 2.7 !, while two Al-1ons on ad-site and an a-site are separated by about 3. 4 A and two Al on dsttes are separated by about 3.7 !. Vhen Al-ions move they have to pass alont two or more oxyten ions, so the potential surface for a mitratlnl Al-ion has more than one maximWL
Ve investilated the case of an Al-ion movinl from a tetrahedral to an octahedral position. Tbe eneriY of a movinl interstitial Al, the mi1rattn1 species, was checked systematically at 20 points between start- and end position (in x-,y- and sdtrection). The lowest ener1y for a movinl interstitial Al-ion was 3. 5 ev. ThiS means that such ~a muration has a saddle point eneriY not lower than 3. 5 eV per Jump - for the case of a jump from a tetrahedral to an octahedral site. The Al-ions have relatively hilh saddle point enerties. Tbis result supports the view that oxyten tons are the most mobile ionic species in YAG.
t6.9 C«NLIIS lOt
Oxyaen vacancies are the most favoured ionic point defects in YAG and YIG. The eneraettcs of a continuous oxyaen diffusion path was derived from the saddle point ener11es for elementary ion-Jumps. From this we see that the saddle point eneray is somewhat smaller than the activation enerfy derived from tracer diffusion and conductivity experiments. Mtaratina Al-ions have a much hilher saddle point eneriY than oxy1en ions.
Due to the hilh hole formation ener1y their contribution to the conductivity should be relatively low at lower temperatures and tonic conductivity is expected to dominate the transport properties. Vith increasinl temperature an tncreasinl contribution of electronic conductivity 1s expected; our experiments on YAG: ea show that this is the case,
Moreover, relyinl on the simulat1ons, Schottky defects are easier to form than Frenkel defects. So vacancies are more probable in YAG than interst1t1als.
The dissolution enerfies of CaO and Mao were derived appyinl computer simulation data; cao has a hilher solution enthalpy than Mao. These enercies can le lowered by defect clustertnc. Clusterinl effects are expected to influence the enereetics of redox processes as well.
155

LITfRATUR£
[1] C. R.A.Catlow, V.C.Mactrodt, Computer Simulation Of Solids, eds. c.~A. Catlow, v.c. Mackrodt, Sprincer, Berlin, 1982.
[2) V.C.Mactrodt, Solid State tonics, ll (1984) 116. UJ c. R. A. Cat tow, ~ James, V. c. Mackrodt, R. F. Stewart,
Phys. Rev. B, ll ( 1982) 1006. [4) C.R.A.Catlow, C.M.Freeman, M.S.Islam, R.A.Jackson, M.Lesl1e
S.M.Tom11nson, Phil. Mac. A, J..l (1988) tu. [5) V.C.Macltrodt, Adv. Cer., .1.2. (1983) 62, ed. by
the American Ceramic Soctet~ [6] c. ~A.Catlow, J.Corish, J.Hennessy, V.C.Mackrodt, J. AJL
Ceram. Soc. ll (1988) 42. [7) see ref. [1), p • .275. [8) F.G.Fumi, M. P.Tosi, J, Phys. Chem. Solids, ll (1965)
31. [9) see ref. [1 J p. 3 and p, 97. [10) R. G. Gordon, Y. s. l:im, J, Chem. Phys., H (1962) 3122. [11) B. G. Dick, H. V. Overhauser, Phys. Rev., .l.1L (1958) 90. [12) A.B.Lidiard, M.J.Norcett, in Computational Solid State
Physics, eds. H.Herman, v. V.Dalton, T. R.Eoeler (Plenum Press, N. Y. , 1972.
[13) M.J.Nor1ett, AERE-Report: AERE-R, 7015 (unpublished), 19'12.
[14} C.R.A.Catlow, Ann. Rev. Mater. Set., .U (1986) 517. [151 M. J. Noraett, ux:AEA-Report, AERE-R 7650, 1974. [16] M.Leslie, SERC Daresbury Lab. Report 1982, DL-SCI-TM31T. [17) C.R.A.Catlow, M.J.Nor1ett, AERE Report 2763, 1976 (un-
published), [18) G.V.Lewis Ph. D. Thesis (London), 1983. [19] A.P.Andreev, S.F. Alhmetov, A.G.Davydchenko, Sov. Physi
Solid State, .l7.. (1985) 963. [20] V.F.I:1taeva, E.v.zarikov, I.L.Chisty, Phys. stat. Solid.
n u 985 1 475. [21] Landholdt-Bornsteln, Bd. u, III/12a, neue serie, Berlin, 1978. [221 R.D.Shannon, c.T.Prewitt, Acta Cryst., ILl (1969) 925. [23] F.Y.Y.Vanl, Treatise on Material Science and Technoloay II,
ed. H. Herman, Academic Press. 1973. [24) s. Geller, z. Eristallo1r., J..U. (1967) 1. [25) ~James, Ph. D. Thesis, London, 1979. [26] A. N. Cormack, c. R. A. Cat low, A. s. Nowt et, J. Phys. Chem. Solids,
1.0. (1 989) 177. [27) s. R. Rotman, R.P.Tandon, H.L. Tuller, J,Appl. Phys., 11
(1985) 191H. [28] Handbook of Chemistry and Physics, CRC-Press, 1979. [29) F.Gverin, A.Laforaue, J.Physlque, ~ (1976) 379. [30) C.R.A.Catlow, J.Corish, I:.M.D111er, P.M.V.Jacobs, M.J.,
Noraett, AERE-Report TP 713, 1977. [31) L.F.orael. An Introduction Into Transition Metal Chemistry:
Ltcand Field Theory, Methuen, London, 1960. [32] M. s. Islam, M. Leslie, s. M. Tomlinson, c. R. A. Catlow, J. Phys. C,
.U. (1988) L 109. [33) J. F. Baumard, P. Abelard, Adv. Ceram., ll (1984) 555
ed. by N.Claussen, M. Ruhle and A.H.Heuer
156

APPfNIHX 1
YAO pure
1111.1111
1111.9
0
1111 1111
95
110 ., 8 E 50
I 20
10 FIT RESlLTS
5 Cl-R.p 1 - 8 8- 14
2 Staf,_ Q.79 3.20 1 to 3.20 10.58
Fraotion Q.82 Q.38 F...t. b 651.53 887.95
Q.1 D (501)' 2.13 4.58 Stpo' 1.311 1.48
0.01 Q.5 2 5 10 20
SIZE <u.>
157

YJW:50 ea
99.99
99.9
99 98
95
90
80
8 >-I-- so _, i ~ a: a..
20
10
5
2 I
0 0
0.1
o. 01 0.1 0.2 0.5
PARTICLE SIZE ANALYSIS PHILIPS RESEARCH LABORATORIES EINDHOVEN
INORGANIC MATERIALS
0
FIT RESULTS
Cl .... Ronge 10 - 17 3 - 9 Size fro~~~ 0.66 0.23
to 1.90 0.57 Fraction 0.54 0.27 Froot. Sum 442.92 113.30 0 <SO%>' 0.93 0.44 Si!J"'O • I. 40 I. 44
2
SIZE Cum)
158
5

99.99
99.9 0
99 98
95
90
80
8 )-
::: 50 ...J
j g:
20
10 FIT RESULTS
5
2 Cion Rang. 8- 18 1 - 7 Siz•fro~~ 0. 99 0.37
to 4.05 0.86 FI"'otion 0. 77 0.13 F I"'Ot. Suo. 743.40 61.15
0.1 0 (50%). 1.63 0. 70 Si9"'o' I. 46 1.39
0.01 0.2 0.5 2 5
SIZE <um>
159

YM:200 Hf
99.99
99.9 0
0 0
99 98
95
90
80
8 >-t: 50 ..J a; < lXI
~ 20
10 0 FIT RESlLTS
5 Cloea Rang. I - 14 14 - 20
2 0 Size f'I'OIII 0. 75 2.92 to 2.92 $46
Fraotion 0. 70 0.28 Fraot. Sum 1011.46 805.08
0.1 D GO%>' 1.94 3. 43 Si!JIIO' I. 47 I. 24
0.01 0.5 2 5 10
SIZE (um)
160

YA&:420 tlf
99.99
99.9
99 98
95
90
80
8 .... 1-
I 50
20
10 FIT RESULTS 5
Cl.,.. Range 11 - 16 3 - 10 2 Siu fro. 2.50 0. 74 1 to 5. 34 2.14
Fraot.ion 0.47 0.37 0 Fraot.. Su. 1065.39 431.61
0. I 0 (501)' 3.13 1.64 Si!J'"G' 1.29 1.39
0.01 0.5 2 5 10
SIZE (UM)
161

YAG:750 tlf
99.99
99.9
99 0
98 0
95
90
80
8 >-1-::; 50 iii 03 0 0:: 0..
20
ID 0 FIT RESULTS
5 Cl ... Range 3-11 11 - 16
2 Size froor 1.43 3. 61
0 to 3.61 6. 44 0 FI"'Otion 0. 42 0. 51
FI"'Ot. Sum 326.62 675.55 0. I 0 <SOX>' 2.62 4.57
Stgmo' 1.36 1.22 0.01
2 5 10
SIZE (UIII)
162

fAG: taG Zr
99.99
99.9
99 0
98 0
95 90
- 80
8 r= 50 .....
I 20
10 FIT RESil. TS 5
2 et- Rons- 4 - 10 10 - 15 0 Size f,... 1.25 3.24
I 0 to 3.24 7.17 0
Froot.ion 0.28 0.63
0.1 Froot. Su. 168.05 656.11 D (50%)' 2.50 4.57 Stg.o' I. 35 1. 30
0.01 0.5 1 2 5 10 20
SIZE <...>
163

YM:300 Zr
99.99
99.9
0
99 98
95
90
eo 8 ~ - so ...1 -I
2D
10
5 et- Rang- 2- 11 12 - 16 2 Size fi"'OII 0.88 3.62 1 to 3.14 8.36
0 Fraot.ion 0.51 0.35 F I"QQt. Su. 622.97 894.63
0.1 D <SO%)' 2.20 4.43 Si!JIIG' 1.39 1.22
0.01 0.5 2 5 10
SIZE (....,)
164

APPEND I X 2
Experimental and calculated crystal properties for Alz03 and Ti02, taken from {1 J.
Property
Lattice enertr (eV)
Elastic constants
Cu (1011 dyn/cm2) cu cu en c14 c ...... c66
D1electr1c constants
Eo11 Eo33
Ew11 Ew33
calc.
160.21
42.96 15. 48 12.72 50. 32 -2. 99 16. 16 13.10
9. 38 11. 52
2.08 2.02
exp.
160.4
49. 69 16. 36 11. 09 49. 80 -2. 36 14. 74 16. 66
9. 34 u. 54
3. 1
T102
ea le.
109.9
26.33 17.80 20. 90 71.92
9. 22 22. 12
94.76 151. 33
6.28 7.99
[1) C. R.~ Catlow, R. James, V. C. Mackrodt, R,F. Steward Pbys. Rev. B, La,, (1982 ), 1006.
165
exp.
126
20.01 17. 66 14. 80 48. 19
12. 39 19.3
86.0 110. 0
6. 83 8. 43
This thesis describes basic aspects concernint the defect chemistry and the microstructure of yttrium aluminium tarnet ceramics. We have divided the work into three parts: a literature stUdY. an experimental part and a section tivint computer simulation data of defects.
Sintered TAG bodies contain Al 2o3-inclusions with a hlth thermal stability. These inclusions have a marked influence on the defect chemisty of TAG, because they act as a •source' of Al-vacanc1es. The influence of the inclusions on the hith temperature electrical properties is interpreted in terms of classical defect chemistry The pOz-dependencies of the conductivity - and the ionic transport isotherms led us to defect models for the acceptor- and donor-doped samples: TAG doped with lOO ppm cao (acceptor) is a mixed ionic-electronic p-type conductor with the conductivity q chantint proportional to pOz3110, Al-vacancies are the dominant ionic defects. Further-more we found evidence that at hith pOz electron holes are trapped by oxycen ions formint 00 '-centres; with decreasint oxyten pressure this concentration decreases. TAG containint 600 ppm cao ts an ionic conductor over nearly the entire pOz-rettme we investitated, the tonic transport number is smaller than l only at the h1Chest po2• This can be explained by the larte hole formation enertY as we revealed by computer simulation. The properties of Mt-doped material are comparable.TAG doped with 50 ppm zro2 (donor) ts a mixed ionic n-type electronic conductor with a chantinl proportional po2-3/16, At hith pOz Al-vacanctes are dominant. Vith decreasint pOz Zr chantes the valency from 4+ to 3+; colour centres are formed.Tbe redoxenerty for Zr was derived from the temperature dependence of o to be 6-7 eV. At low oxyten pressure electronic conduction is dominant.
Annealint TAG in a Hz/HzO-atmosphere leads to the incor-poration of protons. This was shown by IR-spectroscop~ From the enercr of the absorption bands the location of the protons in the complex carnet lattice was derived. The low activation enertr of the hitb temperature conduction process in a Hz/HtO-ambient indicates that protons tovern the defect chemistry under these circumstances. Impedance spectroscpy revealed that the train boundaries are not affected by the presence of protons.
Measurements of the frequency dispersion of the Mao-, cao- and zro2-doped material revealed that ea has a very stront tendency to form an tntertranular second phase, While Ml and Zr have much weaker tendencies to secretate. The intertranular phase in ea-doped YAG was observed by transmission electron microscopy; the thickness of the layer in material contatnlnt 500 wt. -ppm cao was determined to be approximately 2 mL By analysint complex impedance plots the thickness of the layer was determined to be in the same order of matnitude. Such , films have a lower conductivity than the bull; they act as ia blocklnt layer.
Annealint a ea-doped sample for 240 b at 1670 E led to a radical
166

chance in the oxycen pressure dependence of the total conductivity. The value of the total conductivity decreases due to this treatment. Analyzine the complex impedance behaviour (Z'-Z''-plots) made clear that, firstly, the thicKness of the erain boundary layer increases by a factor of 10 while annealinl 240 h at 1670 K due to dopant and impurity seerecation and, secondly, that the crain boundary conductivity becomes p02-dependent. This causes the radical chanee in the oxyeen pressure dependence of the total conductivit~ Quenchine a ea-doped sample from hilh temperature down to room temperature leads to a drastic decrease of the total conducttvit~ So it is clear that electrical and microstructural properties of the material depend on the thermal history of the sample.
Hon-linear least squares fit procedures showed that experimental z•-z·•-ptots can be characterized accurately bY simple combinations of HC-circuits. So the model of trains separated by blockine layers of second phases (•crain boundary capacitors•) describes reality quite well.
A typical microstructural feature of undoped TAG is the exaece-rated train erowth (dmean=3. 3 p~dmax=tO. 6 ~m). Even 50 ppm cao cause • drastic reduction 1n maximum- and mean train size (dmean=O. 8 pm, dmax=1.9 pm). This is explained by the stront setrecation tendency of ea. Mao does also reduce the erain boundary mobility (dmean=1. 6 pm1 dmax=~ 1 ~m for a sample containinl 50 ppm MIO). The effect of MtO is not as drastic as for Ca~ Donor dopants such as Zr or Hf promote erain trowth, but inhibit exateerated craln 1rowtn; the microstructure of such samples is very reeular with a relatively larte mean crain size (e.,. 4mean=4. 3 pm and dmax=lO. 2 ~m for TAG: 150 Zr02)· The 1rain sise di•tributton wa• found to be bimodal in all case• we 1nvest1eated.
A series of computer simulations apply1nt the CASCADE-code showed that Sc::bottky defects are more favoured in TAG than Frenkel defects. Oxy1en vacancies are the mo•t favoured point defects in pure TAG. By calculatine saddle point eneretes of several po••tble oxycen jump• in the tarnet lattice we found a continuous diffusion path with an activation enercy of 1. 5 eV, which is •omewbat lower than experimental activation enerties for self diffusion (3.4 eV, from literature) and ionic conductivity (1.9-2.4 eV). The saddle point eneriY for At-jumps was calculated to be 3. 5 ev which is relatively hifh. A possible effect in doped YAG is a defect association (clusterinl); the clusterint of oxyeen vacancies and ca-substitutionals can in- or decrease the enercy for defect reactions (dependint on the type of reaction), if the defect concentration reaches some hundred pp~ From point defect formation enerctes the solution ener1y for CaO in TAG was estimated to be 242 kJ/mol. This can explain the low solubility and the h1th secretation rate of cao in TAG.
167

SNCN\'ATT 11'18
Dit proefschrlft bescbr1Jft een ondersoek naar de defect chemie en de microstructuur van yttrium aluminium cranaat keramtek. Het werk bevat drie delen: een ltteratuur studie, het experimeriteel cedeelte en een computer Simulatie van defecten in bet TAG-rooster.
Gesinterd YAG bevat Al203 tnsluttsels met een hoce tbermiscbe stab111te1t. Dese lijn van trote tnvloed op de defect cbemie van het YAG, omdat se een soort •bron voor Al-vacatures• 11Jn. De 1nvloed van de 1nslu1tsels op de elektrtsche cele1d1nc biJ hoce temperatuur is verklaard op basis van de klassieke defect chemu. Ye hebben uitcaande van de p02 afhankel1Jkheid van de cete1d1nl en het tonen transport tetal defect modellen ontwikkeld voor acceptor en donor ledoteerd materiaal:
YAG cedoteerd met 100 ppm CaO (acceptor) vertoont 1emen1de ionische p-type elektronische leleidinc; de lele1dbaarhe1d varlirt evenredil met poz3/16, Belan1riJke tonocene defecten in het kristal sijn Al-vacatures. TAG ledoteerd met een concentrat1e van &oo ppm cao vertoont ionocene celeidinl in b1Jna het hele pOz-lebted van to5 tot to-10 Pa; t 1 is alleen biJ de boo1ste suurstof drulken wat minder dan 1. Dit hole tonen celeldtncsver•ocen kan worden verklaard door de bole enercte die nodil is om etektronen 1aten te vormen (onderlocht ab.v. computer stmulatte).De eiten-scbappen van YAG 1edoteerd met MIO s1Jn in wesen verlel1Jkbaar met YAG:CaO.
TAG met 50 ppm Zr02 (donor) vertoont 1emen1de 1on1scbe n-type eleKtrontscbe celeidint; de n-type leleidint var1iert evenredll met po2-3/16, Met afnemende po2 nee•t de concentratle van zr•• af, terw1Jl de concentratte van zr3+ toeneemt (reductie); IUeur centra worden ••vormd. De enerc.te voor de reductie van zr4+ naar zr3+ lilt b1J 6-7 ev per ion.
*Annealinl" van YAG:Ca blJ oce te•peratuur in een watertwateratofat.mosfeer leidt tot de opname van pr-otonen. Dit werd aantetoont ab.v. IR-spectrometrte. De activerinls enercte voor bet cele1!11ncs proces u, verceleken met de activerlnts enercte in een suuratof atmosfeer, heel Jaa,, omdat de protonen een ' dominerend invloed hebben op het leleidints mechantsme.
cao in YAG heeft een sterke ne111n1 tot secrecatie naar- de lorrel crenzen (tweede fase vormlnll· Dese tweede fase werd bekeken a b.v. transmissie electronen microscopie. De dikte van so•n laac in TAG 1edoteerd met 500 ppm cao is 2 na De bepalinl van de laatdlkte ab.v. comptexe impedantte metinten leidt tot verteliJkbare reauJtaten. De korre11rens fasen in YAG:CaO bebben een 1a1ere teleidinl dan de bull (train interior).
Het verhttten van •as-sintered" TAG:cao cedurende 240 u b1J
168

1670 K in lucht leidt tot een drastische verandertn& van de zuurstofdruk afhankeliJkheid van a, verder neemt de totale aeleidtna at. Votaens de Z'-Z''-plots wordt de searetatie taaa tussen de korrels dikker: de laaa heeft een dikte van 1-2 nm v66r en 11 na na de •annea11nt• procedure. Dit is het cevolt van een seareeatte van de sinter-toevoeainl. De analyse van z•-z•• plots opaenomen blJ verschittende partiile zuurstof drukken (tuasen to6 en 1o-10 Pa) toont verder aan, dat de korrelarens aeleidtnc na het •annealtne• een tunctte van P02 is (een ae-vola van de toenemende dikte van de se1re1at1e laaa). Dit leidt tot bet waartenomen verschil tussen •as-sintered• en •annealed• mater1aal.
om te zten of bet vooraestelde Re-model aeschikt is om de Z'-Z'' plots te verklaren sijn RLLS-fit procedures u1t&evoerd aan temeten impedantie plots; bet aekosen model simuleert de rea11teit vr1J toed.
De relatie tussen sinter toevoetinlen en de microstruktuur werd bekeken ~ b.v. een semt-automatische korrelcroote analyse. overmatite korre11roe1 (exalterated train trowtb) 1s typiach voor niet-tedoteerd TAG (dmean=3. 3 p~ dmax=10.6 pm). Een toevoetint van alecbts 50 ppm CaO teidt tot een drastische verlatint van de korrelarena mobilitelt (dmean=O. 8 P~ dmax=1.9 pm) Dtt wordt verklaard door de aterke searetatie van ea naar de korre11ren1en; de invloed van HIO is minder (dmean•1. 6 ~m, dmax=4. 1 pm voor TAG met 50 ppm HIO). Donor sinter-toevoelinten, soals Zr02 en Hfo2, onderdrukken overmatlte korreltroe1, maar de korrelarens mob111te1t in bet altemeen bl1Jft rede11Jk hooa (b.v. dmean=~ 3 ~m en dmax=10.2 ~m voor TAG met 160 ppm Zr02)· In al de tevatlen waar wtJ de korrelarootte hebben eeanalyseerd was de korre11rootte verde11nt bimodaal.
De resultaten van computer simulaties met het pro,ramma CASCADE laten lien dat Schottky fouten (rooster vacatures) preterent z 1Jn teaenover Frenke I defecten (1nterst1 tiee le tonen en vacatures ). Zuurstof vacatures hebben de laaeste vormtn• enthalpie tn zutver YAG. De d1ffusie van zuuratof werd kwantitatlef bekeken door bet berekenen van zoeenaamde "saddle point eneretes". Deze enertlin (rond 1. 6-2 eV) z1Jn lets 1a1er dan de act1ver1n•• ener11e voor de lelf-diffusie (3.4 eV) uit de llteratuur en het elektr1sch 8ele1d1ntsprocea (1.9-2.4 eV). De sprona van een Al-lon van 66n posttie naar een andere heeft een relattef ho•e •saddle point ener11" van 3.5 eV. Verder hebben w1J de enerate voor cluster vormint (defect assoc1at1e) berekend. Vanaf een bepaalde defect concentratie kunnen derlelijke processen de defect vorminl enert1e verho1en of ver1a1en (afhankel1Jk van de spectfteke reaktte ).
ViJ hebben met de CASCADE s1mulat1e een ener,ie van 242 kJ/mol berekend voor het oplossen van Cao In TAG. Dele enerate is relat1ef hoo1 en kan de 1a1e oplosbaarheld en sterke se1re1at1e verklaren.
169

The author was born in Hermulhetm (Vest-Germany) on 16.7 1956. He 1raduated from the "Gymnasium der Gemeinde Hurth•, which is located near Co1o1ne in 1977. Then he entered the University of Colo1ne from which he received his "Vordiplom• (Bachelor of Science delree) in 1981 and a •Diplom" (Master of Science defree) in chemistry in 198~ In 1986 he moved to the Eindhoven University of TecbnolOIY and be1an the work on his thesis at the 1roup of Prof. Dr. B. Metselaar. In 1988 and 1989 he worked some weeks as a 1uest at ~eele University (United Kinldom) under the supervision on Prof.C.R.~ Catlow. He accepted a position at the Asea Brown Boveri Corporate Research Centre in Heidelbert in January 1989.
170

The work presented in this thesis was done at the Eindhoven University of TechnolOIY in collaboration with the Ph11ipa Litbtint Division (Eindboven), the Philipa lesearch Labs. (Eindhoven) and the University of Keele (United ~inldom).
171

ST!i:LI. I H<31i:H
1. ~ opin~on that sinterinr of solid particl~a 1s a ~ ~ process at room tempe~ature hardly <lescr.lbe:!l rl!lall tf.
S.~.ftao "S~£ace Phenomen~•, Hutchinson Kducational Ltd., (19'1'2) 1 p.'I'O
2. The autors concludl!l that n1rn ~at we*tern dlet ~nhances the excr~tion of tne trace ~lement Hn; they <l1d not pay attention to tne fact that several components of this dlet contain relatively b1Jh amounts o~ this trace element, Furthermore, testine only 14 men and women does not lead to reliable results.
J.H.Johnaon, C.Eies, H.H.Foi, Hutr. Rep. lntern .• ~. 091lll), 121151
3. "YAG-laser: abbreviation for fttrlum-arJon-Jaaer• - th1S statement 111 not t);'l,l ...
Pacbyre~el Ellnlsches W6rterbucn, p. i627, 2115.Auflale 1986, W. de Gruyter. Serlin
4. Tne authors riv .. the temperature dependence 0~ the dielectric from temperature for 92~ pure al~na, conclUdinQ tnat tnls 1s the loss of alununa itself, Tbey do not t~e Into consideration tnat liquid phasea are presumably responsl~le for loss in hiJhly impure materials.
H. FUkushima, T.YamanaKe, H. Matsui, Mat.Res.Soc.Symp,Proc., _lll, (l91l8)' 2117
6. ~ extracts of Cap1scum Annuum (chile pods), Which was proved to serve as a HH~-sen51tive coat1nr fO~ a ple2o-crystal detecto~ ls ln no way characte~ized. The speculation that vitam1n~ C pJ~ya an important rolft is ls aoUDt~ul.
L. M. 'w'O!bb.,r, G. G. GU1l~aul t, Anal, Chem., !§, ( i97&), eeJ!'l,
6. Jeh and Sacks repo~t that they have a1ntered fine trained al~na pow<lers to 99.~r. d"ns~ty at lte.o•c Ylth avera1e 1rain siz" of 0.25 ~m after 2h sinterinl time. Microstructural anaJyaia was done on samples wn1cn were tnermallY etched at 1i50"c for lj, n. So they 1nve5t1rate4 5&mPl&ll ~ich WO!r~ aintered in fact 6 h.
T. S. Yen, H. D. Sack11, J, AID. Ceram. Soc., 1.1, j t9aa), all-4
'1'. Di" Autonomie, die aie (di" runat) erlanrte, paqhdcm, ale ibl'e kultische Funhtion und dessen Hachbilder &bschUttelte, zenrt von aer Idee aer HUmanltAt - Tneoaor w. Adorno, "Asth"t~schO! ~eorte•, S~kamp Verlar, 1977,

In this staee in the development Of arts in human society it is commerctalisation and not numanity Which acts aa a "fertilizer•.
e. Sinterin~ nenavlour of an alum!na powder with a maxlmwM part1G~~ diam~t~r of o. a ~~ is compared with the unclassified powder. Ho parttcle si~e distribution ot tne unclassi£i"d powa.er is fiven.
't!. R. Gattuso, H. J:. 8ow~n, Adv. Cer. ,.l.Q, (198'T}, 64'1-
9. The electrical conductivity of AlH containing various oxide additives was investi,atea. by dG~~thods. No frequencY di~persion is glvt!n. Due to the fact that AlN-grains are covered by a hlihlY insulatlni al~na-fil~ these results are doubtful.
H, Zuft!lqtlar, A. J:u,~~~ar, J. Hater, Sci., .i!Z., (1987), 4056
10. It i:!t not plausible that the miJtfit strain of a ca<'+-lQP. on a Al3+_posltlon ln Al 2o 3 is about 1. 5 eV/atom as stated by Coo~ and Schrott. lt roust be much higher because the defect CaAL' has a cn~ge.
R. F. Coo~. h. {3. Schrot t, J, h.m. C~ram. Soe. , ll, ( 1988 I , 50
11. cook and Schrott considere4 tn@ s~greratlon of ca to 1ra1n boun4arles in alumina; they conelua.e that the misfit stra1n is the drivine 1orce 1or this process. Tne autnors shoulO. better consid~r the solution enthalpy of GaO in alumina as well as the differ~nc~ ln energy for Ca~o.t' (bulk) ana. CaAl' (grain boundary)
R. F. Cook, A, o. Schrott, J, Am- Ceram. Soc. , 11. (1906), 50
12. Rotman and Tull~r do not consider the possibility that at low oxyg~n p~essure Zr4 + i:!t reduced.
s. ~-RotMan, H.L.Tuller, Hat. R@:!t. Soc. s~. Proc. ~. (19661 413
1a. ~e diffusion in MgSi03 is considerea. at a 3750 ~ (I) and 37 aPa; a perfect lattice simulation may not lead to ac-cu:r'ate re.sul t'+
B. Kapusta, M.Guillope, Phil. Mae. A~. (1968) 609
14. The ~act that Ahmed et i!l.l. fQW>d slieht ly different transition temperatur@s of 90 and 93 ~ for CQnventionally and microwave s1ntered 1-2~3 superconductors is far from being sieniflcant.
l.~d, G.T.Ghandl@r, D,E.Ciark, Mat. ~es. soc. Symp. Proc • .1.i.i. ( 1988). 2 ~9-