Microstructure and defect chemistry of yttrium aluminium ...
181
INIS-mf—12558 NL89C1183 MICROSTRUCTURE AND DEFECT CHEMISTRY OF YTTRIUM ALUMINIUM GARNET CERAMICS IV I I H b | Ilia efc • j — log pO, c _ LOTHAR H. SCHUH r
-
Upload
khangminh22 -
Category
Documents
-
view
0 -
download
0
Transcript of Microstructure and defect chemistry of yttrium aluminium ...

INIS-mf—12558NL89C1183
MICROSTRUCTURE AND DEFECT CHEMISTRY
OF
YTTRIUM ALUMINIUM GARNET CERAMICS
IV I I H b | Ilia
efc
• j
— log pO,
c _ LOTHAR H. SCHUH
r

\*
Cover: The Defect Diagram Of Ca-Doped YAG

MICROSTRUCTURE AND DEFECT CHEMISTRY
OF
YTTRIUM ALUMINIUM GARNET CERAMICS

»•#i-*»
MICROSTRUCTURE AND DEFECTCHEMISTRY OF YTTRIUM
ALUMINIUM GARNET CERAMICS
PROEFSCHRIFT
ter verkrijging van de graad van doctor aan deTechnische Universiteit Eindhoven, op gezag vande rector magnificus, prof. ir. H. Tels, vooreen commissie aangewezen door het college vandekanen in het openbaar te verdedigen op vrijdag25 augustus 1909 te 16.00 uur.
door
LOTHAR HKRBSBT SCHUH
geboren t e Hermülhelm(West-Duitsland)

Dlt proefachrlit la goadfakaurd doorda proaotoren
Prof. dr. R. Hataelaar•n
Prof. dr. a. de With

CONTENT
1 INTRODUCTION. i
2 THE GARNET STRUCTURE 4
3 LITERATURE REVIEW: OErECT PROPERTIES OF OARNETS 73. 1 IRON GARNETS 73. 1. l Oxygen diffusion in YIG 83. 1. 2. Cation diffusion In YIG 103. 1. 3 Direct determination of oxygen vacancies in YIG 123. 1. 4 Electrical conductivity and thermo-electric
power in YIG 133. 1. 5 Other iron garnets 153. 2 YTTRIUM ALUMINIUM AND OTHER GARNETS 153. 2. 1 Oxygen diffusion in YAG 163. 2. 2 Electrical conductivity in YAG and other non iron
garnets 173. 3 SITE EXCHANGE EFFECTS IN GARNETS 19
4 LITERATURE REVIEW: COLOUR CENTRES AND PARAMAG-NETIC DErECTS IN OARNETS 234. 1 COLOUR CENTRES 234. 2 PARAMAGNETIC DEFECTS 26
5 SAMPLE PREPARATION AND EXPERIMENTAL SET UP. 325. 1 SAMPLE PREPARATION. 325. 2 SINTERING OF THE POWDERS 325. 2. 1 Evaporation effects during sintering 335. 3 SOLUBILITY OF Ca, Hg, Zr AND Hf IN YAG 365. 4 ELECTRICAL MEASUREMENTS 375. 4. 1 Electrodes and electrode effects 40
6 ANALYTICAL TECHNIQUES AND RESULTS 476. 1 ELEMENT ANALYSIS 476. 2 AUGER ANALYSES 47
7 AL-RICH INCLUSIONS 507. 1 CHEMICAL COMPOSITION OF THE INCLUSIONS 517. 2 THE SHAPE OF THE Al-RICH INCLUSIONS 527. 3 THERMAL STABILITY OF THE INCLUSIONS 54
8 6RAIN BOUNDARIES IN TAB INVESTIOATED BY TEM. 568. 1 EXPERIMENTAL 586. 2 RESULTS AND DISCUSSION 596. 3 TEM-STUDIES DESCRIBED IN LITERATURE 62
9 MICROSTRUCTURE AND MICROSTRUCTURAL CIMNBES INVEST I-SATED BX AC-DISPERSIVE MEASUREMENTS 639. 1 INTRODUCTION. 639. 2 AC-DISPERSIVE DETECTION OF 6RAIH BOUNDARY PHASES IN
YAG-CERAMICS 66
If

9. 2. 1 Experiments and discussion 669.3 NON-LINEAR LEAST SQUARES FIT (NLLSF) OF
IMPEDANCE DATA 709. 4 TEMPERATURE DEPENDENCE OF GRAIN BOUNDARY AND
BULK CONDUCTIVITY 749. 4. l Experiments and discussion 749. 5 A 240 HOURS ANNEAL EXPERIMENT 769. 5. 1 Experiments and discussion 77
9. A PROPERTIES OF YAG CERAMIC QUENCHED FROM 2 0 2 0 K TOROOM TEMPERATURE 81
9. 6. 1 Experiments and discussion 82
10 DCrCCT CHEMISTRr OT CA- AND MS-DOPED XAB 8710. 1 SAMPLE CHARACTERISATION. 8710. 2 DISPERSED PARTICLES IN A CONDUCTING MATRIX:
WAGNERS MODEL 8810. 3 RESULTS AND DISCUSSION 9010. 4 THE TEMPERATURE DEPENDENCE OF CONDUCTIVITY 10010. 5 CONCLUSION 102
It DEFECT CHEMISTRr ©T ZR-DOPED XAB 10311. 1 SAMPLE CHARACTERISATION 10411. 2 RESULTS AND DISCUSSION 10511. 2. 1 The defect model for Zr-doped YAG 106
11. 3 THE TEMPERATURE DEPENDENCE OF THE CONDUCTIVITY 10911. 5 CONCLUSION. 110
12 UNDOPCD POLrCRySTAtL INC TAB 11212. 1 SAMPLE CHARACTERISATION 11212. 2 RESULTS AND DISCUSSION 11212. 3 CONCLUSION 115
13 VNDOPED SINBLE CRYSTALLINE TAB 11513. 1 SAMPLE CHARACTER I SAT I ON 11513. 2 EXPERIMENT AND DISCUSSION 1161 3. 3 CONCLUSION. 118
14 INTERACTION ©T TAB WITH HTDROBEN CONTAININBATMOSPHERES 119
14. 1 INTRODUCTION. 11914. 2 INFRARED BANDS IN ANNEALED SINGLE CRYSTALLINE YAG 12014. 3 ELECTRICAL TRANSPORT PROPERTIES OF YAG IN A Hs/HpO
AMBIENT 12214.3. 1 The activation energies for a in YAG: Zr
in H2/H20 12314. 3. 2 The activation energies for o in undoped YAG
in H2/H20 1241 4 . 3 . 4 The complex impedance behaviour of p o l y c r y s t a l 1 lne
YAG in a H2 /H2O-atmosphere 12614. 4 CONCLUSION. 127
15 SINTER ADDITIVES MMD MICROSTRUCTURE 12915. 1 EXPERIMENTS 12915. 2 RESULTS AND DISCUSSION 13015. 3 EXAMPLE OF EXAGGERATED GRAIN GROWTH 133

v tti: tt > ̂
15. 4 CONCLUSION 135
16 COMPUTER SIMULATION Of IONIC DEFECTS 13616. 1 THEORY OF DEFECT CALCULATIONS-A SKETCH 13616. 2 THE PERFECT LATTICE PROPERTIES OF YAG 13816. 3 THE BASIC POINT DEFECT FORMATION ENERGIES 14016. 4 FOREIGN CATIONS IN YIG AND YAG 14116. 5 OXIDATION/REDUCTION PROCESSES IN YAG AND YIG 14216. 6 THE DISSOLUTION OF CaO IN YAG 14616. 6. 1 The energy for substituting Y by Ca 14616. 6. 2 The solution enthalpy of CaO In YAG 14716. 6. 3 Clustering effects 149
16. 7 THE DISSOLUTION OF MgO IN YAG 1491 6. 0 SADDLE POINT ENERGIES 16016. 8. 1 Oxygen juaps 15016. 8. 2 The spatial dependence of the saddle point
energies 15316. 8. 3 AlumlnluB Jumps 155
16. 9 CONCLUSION 155
APPENDIX 1 167
APPENDIX 2 165
SUMHART 166
SAMENVATTINB 168
CURRICULUM VITAE 169

STELLIHGEH
1. The opinion that sintering of solid particles is avary alow process at room temperature hardlydescribes reality.
S.R.Rao "Surface Phenomena", Hutchinson Educational Ltd.,(1972), p. 70
2. The autors conclude that high meat western diet enhances theexcretion of the trace element Hn; they did not pay attentionto the fact that several components of this diet contain re-latively high amounts of this trace element. Furthermore, tes-ting only 14 men and women does not lead to reliable results.
J. H. Johnson, d i e s , H. M. Fox, Hutr. Rep. Intern, ,3ft,(1966), 1299
3. "YAG-laser: abbreviation for yttrlum-argon-laser" - thisstatement is not true.
Pschyrembel Kllnlsches wbrterbuch, p. 1827, 255. Auflage 1985,W. de Qruyter, Berlin
4. The authors give the temperature dependence of the di-electric from temperature for 92X pure alumina, con-cluding that this is the loss of alumina Itself. They donot take into consideration that liquid phases are presum-ably responsible for loss in highly Impure materials.
H. FuKushlma, T. Tamanake, H. Hatsul, Hat. Res. Soc. Symp. Proc. ,121, (1966), 267
5. The extracts of Caplscum Annuum (chile pods), which was provedto serve as a D^-sensltlve coating for a piezo-crystal de-tector is in no way characterized. The speculation that vita-mine c plays an important role is is doubtful.
L. H. Webber, a a. Oul 1 baul t, Anal. Cham. , 4ft, (1976). 2244
6. Jeh and Sacks report that they have sintered fine grainedalumina powders to 99.5Z density at 1160°C with average grainsize of 0.25 pm after 2h sintering time. Hlcrostructural analysiswas done on samples which were thermally etched at 116O°C for4 h. So they investigated samples which were sintered In fact6 h.
T. S. Yeh, H. D. Sacks, J. Am. Ceram. Soc. , H , (1966), 644
7. Die Autonomle, die sle (die Kunst) erlangte, nachitem. slelhre kultlsche Funktlon und dessen Hachbllder abschilttelte,zehrt von der Idee der Humanltat - Theodor V. Adorno, "Asthe-tlsche Theorle", Suhrkamp Verlag, 1977.

In this stage In the development of arts In Hunan societyIt Is commercialisation and not humanity which acts as a"fertilizer".
8. Sintering behaviour of an alumina powder with a maximumparticle diameter of 0. 2 pm is compared with the unclassi-fied powder. Ho particle size distribution of the unclassi-fied powder Is given.
T. R. Gattuso, H. E. Bowen, Adv. Cer. , 1£, (1987), 644
9. The electrical conductivity of AlB containing various oxideadditives was investigated by dc-methods. Ho frequency dis-persion is given. Due to the fact that AlH-gralns are coveredby a highly insulating alumlna-fllm, these results are doubt-ful.
H. Zufelquar, A. Kumar, J. Hater. Scl. ,££, (1967), 4056
10. It is not plausible that the misfit strain of a Ca2+-lonon a Al3*-position in AI2O3 Is about 1.5 eV/atom asstated by Cook and Schrott. It must be much higher becausethe defect Ca^t/ has a charge.
R. F. Cook. A. Q. Schrott, J. Am. Ceram. Soc. . H , (1966), SO
11. C00K and Schrott considered the segregation of Ca to grainboundaries In alumina; they conclude that the misfit strainIs the driving force for this process. The authors shouldbetter consider the solution enthalpy of CaO In aluminaas well as the difference In energy for CaA]'(bulk) and CaAJ(grain boundary)
R. P. Cook, A. fl. Schrott, J. Am. Ceram. Soc. , 2i, (1966). 50
12. Rotman and Tuller do not consider the possibility that atlow oxygen pressure Zr** is reduced.
S. R. Rotman, H« L. Tul ler, Hat. Res. Soc. Symp. Proc. £0_, (1966)413
13. The diffusion In KgSiO3 Is considered at a 3750 K (I)and 37 QPa; a perfect lattice simulation may not lead toaccurate results.
B. Kapusta, H. (Millope, Phil. Hag. A 3ft, (1966) 6O9
14. The fact that Ahmed et al. found slightly different trans-ition temperatures of 90 and 93 I for conventionally andmicrowave sintered 1-2-3 superconductors is far from beingsignificant.
1. Ahmed, <3. T. Chandler, D,B. Clark, Hat. Res. Soc. Symp. Proc.124. (1986), 239.

INTRODUCTION
Tills thesis is centered around the synthetic garnets, a class ofmaterials with the same crystallographic structure as the natu-rally occurring garnet minerals. For the last thirty years therehas been a considerable technological and scientific interest inthe synthetic garnets (to be correct, they should be termed ascomplex oxides with the garnet structure).
Yttrium iron garnet (YsFegOu = YIG) first attracted atten-tion in 1956 after Its magnetic properties had been discovered[1-4] and after it was shown that the low line-width makes YIGtechnically useful as a microwave device material [5,6).
The physical properties of oxides with the garnet structure canbe adjusted over a wide range by introducing different ions intothe lattice. From the beginning YIG and the iron garnetsprovided an inexhaustible reservoir of compounds for basicstudies, such as ferromagnetic resonance [7], Faraday rotation[8], magneto-acoustic behaviour [9], photolnduced changes of themagnetic properties [10] and others. In the seventies YlG-basedcrystal films became the leading magnetic bubble domain devicematerial [11].
Besides the class of magnetic garnets the lsomorphlc non-magneticgarnets became an important material. Primarily they were deve-loped and Investigated to get basic data about the garnet struc-ture, about energy levels of incorporated foreign ions, about op-tical properties etc.. With the advent of the solid state laseryttrium aluminium garnet (Y3A15O12
r YAG) was soon found to bean excellent solid state laser host material (e.g. the Nd: YAGlaser) [12,13]. The demand of high quality laser crystals spurredan extensive study on YAG. Much work has concentrated on the corre-lation between lattice imperfections of the YAG host lattice andthe laser light emitting properties [14].
In 1973 hot-pressed YAG ceramics first have been mentioned as apossibly useful optical material [15] by Gazza and Dutta. Theysucceeded in hot-pressing powders to translucency. Translucency canbe obtained in sintered materials if the volume of pores and in-clusions is approximately zero. For translucent materials a hightotal light transmission exists, but due to substantial scatteringthere is only a low in-line transmission. Materials with a highin-line transmission and a negligible scattering, so that bodieslying beyond are entirely visible, are called transparent; inmany cases translucent materials are wrongly called transparent.Until now several materials have been sintered to trans-lucency, for example Y 2O 3 [i6],MgAl2O4 [17],BeO [16], MgO [19],A12O3 [20], AIM [21], A1ON [22], beta-sialon [23] and others.
Properties which are relevant for translucent ceramics can bearranged into three groups: optical, mechanical and chemicalbehaviour. The factors which influence the optical properties

t •-••>. Ytf > ,'
can be devlded into intrinsic ones (refractive index, birefrin-gence and absorption coefficient) and extrinsic ones (presenceand nature of pores, impurities and inclusions). Of primarilyinterest is that the material has a low absorption coefficientin a certain range of wavelengths. A low value of refractiveindex is also important to minimize reflection losses. Thebirefringence,as the third important intrinsic property, shouldbe low to minimize (bicK-(scattering of light in the polycrystal.However, the extrinsic parameters determine to a large extentthe transmlttance of a real material. These properties couldbe optimized in many cases by an appropriate process technology:by finding powders with "good" properties (concerning grainsize, grain size distribution and dopants) and by choslnga "good" sintering procedure (concerning sintering atmosphere,sinterlng-cycle, -temperature and -time).
Fracture toughness, thermal shock resistance,hardness, corrosionresistance and thermal stability are the limiting factors whichdetermine if a translucent material is feasible under givenconditions.The most familiar translucent ceramic is alumina (Lucalox),first reported by Coble [ZO] In 1962. Alumina is the only mater-ial that is used in lamp envelopes In commercial high pressuresodium discharge lamps. Such a tube is filled with Ha (acting asthe actual light source), Hg (for starting the lamp) and noble gas(for stabilizing the plasma). In the burning lamp the sodium .vapour pressure is about 10 KPa; the maximum wall temperature is 'about 1530 K. From these conditions it is clear that the aluminahas to withstand rather extreme conditions. The main disadvantage ?of translucent alumina is that sodium slowly penetrates along the ?grain boundaries (^corrosion). This is accompanied by a de- jcrease of the sodium concentration inside the lamp resulting J>in an alteration of the Ha:Hg relation. As the result of these fprocesses the efficiency of the lamp decreases slowly. j
After it had turned out that YAG powders can be sintered totranslucency [24-26], further experiments showed the opticalproperties of YAG to be better than those of alumina. MoreoverYAG exhibits a better high temperature corrosion resistanceagainst hot sodium vapour than alumina [27]. The penetrationdepth of sodium along the grain boundaries of pure YAG is verylow. The main difficulty is that YAG Is a line compound. Thismeans that stolchlometry has to be controlled very carefully inorder to obtain a single phase material. Sintering stolchlometrl-caliy YAG-powders in vacuum, leads to a two phase mlcrostructure:a YAG matrix with Al-rlch Inclusions. Sintering in H2/H2O leads toa reduction of the Inclusions; this shows that the sinteringatmosphere plays an important role. At the present time it Isstill a problem to make single phase YAG ceramics.
When dealing with high temperature materials under extreme condi-tions ionic and electronic transport properties play anessential role. Full optimisation of the characteristics of YAGis probably attainable with a comprehensive understanding of thedefect chemistry. In this thesis we have Investigated the inter-relation between the transport properties and the type of sinter-

additive. We propose defect mode's based on experimental resultsand, as far as possible, grounded on the outcome of computer simu-lations.
LITERATURE
[1][23[3][4]
[5][6]
mCO)[9]
[10][11][12]
[13][14]
[15][16][17][18][19]
[20][21][22][23]
[24][25][26]
[27]
R. Pauthenet, C. R. Acad. Sci. , £Jk£ (1956) 1895.R. Pauthenet, Thesis, Grenoble. 1957.R. Pauthenet, J. Appl. Phys. . £2 (1958) 253.
F. V. Swanekamp, J. Appl. Phys.L. G. van Uitert, F. V. Swanekamp, J. Appl. Phys., £_& (1957)1513.E.G. Spencer , R. C. LeCraw, F. R e g g l a , P roc . IRE, M ( 1956) 790.F. J . D i l l o n J r . , Phys. Rev . , lfig. ( 1 9 5 7 ) 759.
Rodrlgue , V. P. Vol f , J. Appl. P h y s . , £9.G. P.R. V. Jones,(1958) 434.F. J. Dillon Jr. ,R, c. LeCraw, E. G(1958) 1311.R. V. Teale,A. H. Bobeck,J. E. Geusic,
J. Appl. Phys.Spencer, C. S.
2£ (1958) 539.Porter, Phys. Rev. 114
904.
ed.2.
1970.
D. V. Temple, Phys. Rev. Lett., 1£ (1967)Bell Syst. Tech. J. , £& (1967) 1901.H. M. Marcos, L. G. van uitert, Appl. Phys. Lett.,
H (1964) 182.V. Koechner, Rev. Scl. Instrum. , 4J. (1970) 1699.Ta-Lin Hsu, "A Nd-YAG Laser Bibliography", Materials ResearchCenter, Allied Chem. Corp., Morristown, New Jersey, 1971.G. E. Gazza. S. E. Dutta, US Patent 376 77 45 (1973).V. H. Rhodes, J. Am. Ceram Soc. , M (1981) 13.P. Hing, J. Mate-. Scl., H (1976) 1919.D. T. Llvey in "High Temperature Oxides", 2, M. AlperT. G. Langdon, J. A. Pask in "High Temperature Oxides"M. Alper ed. , 1970, New York.R. L. Coble, U.S. Patent 302 62 10 (1962)N. Kuramoto, H. Tanaguchl, J. Mater. Scl. Lett.,J. W. McCauley, N. Cobln, J. Am. Ceram. Soc. , ££.
Mutomo, Y. Moriyoshl, T. Sakal, T. Ohsaka, M.Mater. Scl. Lett., 1 (1982) 25.de With, H. J. A. v. Dljk, Mater. Res. Bull.,de With, H. J. A. v. Dljk, Brit. Patent 213 88
F. J. c. Toolenaar, G. de With, Proc. Brit. Ceram.(1986) 241.G. de With, Philips j. Res., !tl (1987) 119.
M.J.G.G.
2 (1984) 471.(1979) 476.Kobayashl,
£ (1984) 1669.02 (1986)Soc., 137
t#
.••=»**•.••
THE GARNET STRUCTUREAn/ study of garnets must begin with a thorough understanding ofIts crystal stucture. The determination of this structure was firstmade on natural garnets nearly fifty years ago by Henzer [1,2).Structural refinements were carried out on synthetic yttriumIron garnet by Seller and Gllleo [3], Batt and Post [4] and byEuler and Bruce [5]. The most probable space-group of the garnetstructure is Ia3d. Its Bravals lattice is body-centred cubic.
Garnets have the general formula |C3)[Ag](D3JOJJ, where O denotesoxygen and the different brackets (), [] and () symbol lie cationson the dodecahedral, octahedral and tetrahedral sites respectively:
1. tetrahedral sites: each tetrahedral or d-site is surroundedby 4 h-sltes to form a tetrahedron. There are 24 d^sites ineach unit cell. Each d-slte has the point symmetry 4
2. octahedral sites: each octahedral or a-site is surrounded by6 h-sltes to form an octahedron. There are It a-sites in theunit cell of the garnet. Each a-site has the point group sym-metry 3
3. dodecahedral sites: each dodecahedral or c-site is surroundedby 0 h-sites to form a triangular dodecahedron (twelve faceswith each face a triangle. There are 24 c-sltes in each unitcell of the garnet. Each c-slte has the point group symmetry222.
There are 96 h sites with a point symmetry 1 which are occupied byoxygen ions. They form the different coordination polyhedra as shownin fig.2.1. The unit cell of the cubic garnet structure contains 6formula units ( = 160 ions).
The oxygen parameters for TAG were given by Euler and Bruce [5) as:
X = 0. 0306 y - 0. 05)12 2 : 0 . 6500.
All 96 oxygen positions are derived from
r

v <*
eq. -2. 1 a (x-1 + y-J + z-K) (with a the lattice constantand T.T, T? the vector coeffi-cients along x-.y- and x-axls)
by 46 symmetry operations of the space group Ia3d.
The primary considerations of the occupancy of the three differentpolyhedral sites by cations is the Ionic radius. In yttrium alu-minium garnet Al-lons occupy both the d- and the a-sltes, whileY occupies the c-sltes: JY3l[Al2](Al3)O12. Tolksdorf and Volfmeler(9) as well as Vang [10] give the ionic radii and the site occu-pancies of ions for most of the Known garnets.
Fig. 2. l shows a typical structural unit In the garnet lattice.Besides the polyhedron-arrangement the interlonlc distances andbond angles are given for YAG. Seller and Gllleo found that theedge-lengths of the three polynedra in the garnet structure arenot regular with respect to their edge-length [3].
Good drawings of the garnet structure are given by Novak andGlbbs [6], Glbbs and smith [7], Prandl [8] and TolKsdorf and Volf-meier [9). A very comprehensive description of the structure, theproperties and the application of garnets was given by Vang[10] and KhattaK [11]. The crystal chemistry of garnets was re-viewed by Geller [12].
DISTANCES:
Cell edge length 1,2000 nm
catlon-anion distanced-h (tetr. ) d4 0. 1761a-h (octa. ) d6 0. 1937c-h (dodeca) l) da 0.2432
2) d a o 0. 2303
BOHD ANGLES:
a-h-da-h-(dao)-ca-h-(da)-cd-h-(dao)-cd-h-(da)-cd-h-(da)-c
130. 1104. 2
99. 794. 2
121. 6101. 7
[deg]
anion-anion distancetetr. dodeca. dijaocta. dodeca. d 6 S
dodeca. dodeca. daa
tetra.octa.dodeca. OBI
0. 26960. 26580. 2837
0. 29610. 28180. 2917

Fig. B.I The garnet structure as a network of tetrahedra,octahedra and dodecahedra. The data given above be-long to YAG (from [9]).
LITERATURE
[I] G. Menzer. Centralist. Hln. (A), (1925) 344.[2] G. Menzer Z. Krlstal logr. , Krlstallgeometrle, KrlstalIphys. ,
Krlstallchem. , U (1926) 157.[3] S. Geller. H. A. Gllleo, J. Ptiys. Chem. Solids, 1 (1957)
30.[4] A. Batt, B. Post, Acta Crystallogr. , 15. (1962) 1266.[5] F. Euler, J. A. Bruce, Acta Crystal logr. , 12 (1965) 971.[6] G. A. Nowak, G. V. Glbbs, Amer. Mineral. 5_6. (1971) 791.[7] G. V. Glbbs, J. V. Smith, Amer. Mineral., J£fl (1965) 2023.[8] V. Prandl, Z. Krlstal logr. , ±£3. (1966) 81.[9] V. Tolksdorf, U. Volfmeier, Landhold-Bornsteln (neue Serie)
Bd. Ill/iea, K.-H. Hellwege editor. Berlin, 1978.[10} F. F. Y. Vang, "Physical and Chemical Properties of Garnets"
Treatise on Material Science and Technology II, ed. H. Her-man, Academic Press, 1973.
[II] C. F. Khattak, F. F. Y. Wang, "Perovskltes and Garnets", Brook-haven Hatlonal Laboratory, 1976.
[12] S. Geller, Z. Krlstal logr. , 1££ (1967) l.
t

LITERATURE REVIEW: DEFECT PROPERTIES Of GARNETS
The presence of point defects in garnets strongly influencesoptical, e lectr ical and magnetic properties of single crysta lsand Ceramics, as welt*as-the s in terabl l i ty of powders. Basicquestions concerning with defects in a crystal l ine sol id thathave to be considered are:
a) type of defectsb) actual concentration of defectsc) relation between defect concentration and temperature,
gas atmosphere, etc.d) mobility of the defects
ambient
The most intensely studied garnet material from the defectchemical point of view, is yttrium iron garnet (T^FesO^. abbrevia-ted as YI6). In this section we will review the papers describing de-fect properties of YAG (Y3A!5O12) and YIG and some other garnets,from which we can learn about the preferred defects in this sortof complex materials. Several basic physico-chemical parametersare the same for crystals having the garnet structure (e. g. therelation between the mobility of cation- and anlon-defects, orpreferred defect species). So from experimental results for onegarnet conclusions can be drawn concerning the defect propertiesof another garnet. In this section we consider the defect chemis-try of YIG and some other garnets as detailed as necessary tounderstand our own experimental results on YAG.
3.1 IRON CASKETS
A very comprehensive study of the electrical properties of YIGhas been performed by P. K. Larsen and R. Hetselaar in the seven-ties. This and many other research and development projectswere launched at that time,because it had been shown thatYIG exhibits a strong photomagnetlc effect. A short time later itbecame clear that epitaxially grown YIG films can serve as magne-tic bubble memory devices. The data storage density of suchmemory devices reaches the capability of the modern "megabit-chip", in 1979 the YIG bubble memory was commercialised, but itturned out that the costs associated with an entire new technologywere higher than expected, in addition there have beenunexpectedly rapid developments in capacity and price of silicon-based storage devices. But at the present time modified YIG isgaining more and more commercial interest again, because themagneto-optical effect makes YIG an interesting material for
w.

optical switching in fiber-optics telecommunication systems [1].Now technology is taking advantage from the scientific work whichwas performed in the seventies.
The study of the transport properties of TIG were started in 1957by van Ultert and Swanekamp [2). Larsen and Hetselaar havedeveloped a defect model for TIG based on their electrical con-ductivity - , photomagnetlc -. thermogravlmetrlc - and latticeparameter measurements [3-10]. To be consistent with previous Ideas[11] a model based upon the presence of doubly ionized oxygenvacancies ( V o
f ) to explain several phenomena was postulated*.Ve will now look at diffusion and electrical measurements in TIGin some more detail.
3.1.1 diffusion In XI©
The first diffusion experiment (Olfl-tracer) in TIG was reported in1964 by Paladlno and coworkers [12]. Their experiments were carriedout with single crystals and polycrystalIine material under con-stant partial pressure of oxygen. Due to the large ratio of thecation- to anlon radii the probability of oxygen interstitialsis very low. The diffusion of the tracer-atoms in TIG cantherefore only be achieved by Jumps via vacant oxygen sites [3].The temperature dependence of the diffusion coefficient reportedby Paladino et al. [12] Is represented by
eq-3. 1 D r 4-iO-5exp [-2.8* eV/kT) mz/s.
The diffusion data are given in form of the usual diffusionequation D •- Do»exp [-Ea/KT], in which Do is often termedthe frequency factor; E a the activation energy of the diffusionprocess, here given In eV. T is the temperature In t and k is theBoltzmann constant in eV/K.
The activation energy of 2.84 eV prevails in a temperaturerange from 1370 to 1670 C. The diffusion coefficient is the same
• in this thesis we use the Kroger-Vlnk notation.

for single crystal and polycrystal1ine YIG. This is in a markedcontrast to the results found for alumina, in which diffusionrates in sintered AI2O3 are two orders of magnitude greaterthan in single crystals [13] due to a grain boundary effect.Later Metselaar and Larsen reported [3] measurements of theoxygen diffusion coefficient in polycrystalline YIG. The methodthey applied was the "dynamic conductivity measurement", inwhich the time evolution of the electrical conductivity asa response to small pOg-changes was analysed. Their diffusioncoefficient between 1170 and 1570 K is represented by
eq-3. 2 D : 0. 84-exp [-2. 9 eV/KT] me/s.
The activation energy of 2. 9 eV reported in this study is thesame as that found by Paladlno. The difference in the preexponen-tlal factors Do in eq-i. 1 and eq-l. 2 is due to the differentmethod used to determine the diffusion coefficients (tracer-diffu-sion - or chemical diffusion methods).
Metselaar and coworkers came to the conclusion [3,4.6] thatthere is a reversible temperature-dependent loss and gain of oxy-gen. In ref. [3] the following oxygen exchange reactions areconsidered to be alternatively responsible for the variation of oafter changing pO£:
eq-3. 3 Vom> • m-e' • 1/2 O2
and
eq-3. 4 12 0 o* 3YJ 1' + 5 Fti" * 24 e' • 6 O 2
Equations 3. 3 and 3. 4 reveal that donor-centres in YIGprincipally can be anion-vacancies (eq-3. 3) or cation-interstitial!(eq-3. 4). The empty b-sltes in the structure of YIG can accommodateonly interstitial ions with radii less than 0.6 1. Consequentlythe probability of Interstitial Y-lons Is very low; after ref.[3.4] such defects may be excluded. All theoretical andexperimental work indicates that oxygen vacancies are the mostpreferred defect species in TIG. In this thesis we confirm thisopinion e.g. by calculating the reaction energies for the proces-es comparable to eqs-3. 3 and 3.4 in YA6 and YIG. On the basis of

• -M «• v •*
the CASCADE computer code (see section 16) it was shown that a va-cancy forming reaction according to equation 3.3 needs 6. 1 eV,while the interstitial mechanism would consume an energy as highas 13.8 eV (in the first approximation). So the activation ener-gies derived in diffusion experiments are due to oxygen migrationvia a vacancy mechanism.
In 1984 Kilner et Jl., using the O16-tracer/SIMS-technique, havedetermined a somewhat higher activation energy of 3.7 eV [14, 15Jfor the oxygen diffusion in YIG. The authors found that theirsingle crystalline YIG material was dominated by imperfections;this fact together problems com ing surface charges on the sampledue to the ion-bombardement should be responsible for discrepanciesbetween conventional andSIMS technique applied by Kilner andcolleagues to analyse tracer diffusion profiles.
R. c. Le Craw et al. [16] reported a rapid oxygen diffusion atlow temperatures between room temperature and 520 K in YIG filmswith an uncompensated Ca-additlon of 0. 1 - 0. 23 atoms per formulaunit. The authors found an oxygen diffusion distance of about 500um within 25 hours at 520 E by observing a colour zone.A model based on the dependence of the diffusion on oxygen vacan-cy concentration was proposed. This is in consistency with thefact that the diffusion coefficient of oxygen in YIG increaseswith decreasing pO2 in the ambient gas atmosphere as statedby Wolfmeier [26]. Additional conductivity data on substituted YIG-films are reported e.g. by Hiblya [17].
Reviewing their earlier work Hetselaar et al. [3] gave a correctionof their oxygen diffusion coefficient given in [4]. The formerwas based on the assumption that only doubly ionized oxygen va-cancies (Vo••) were present. From [4] it became clear that also asmall concentration of doubly positive Vo• has to be taken intoconsideration. The corrected diffusion coefficient is
eq-3. 5 D : 0. i-exp [-2.7 eV/KTJ B»2/s.
Besides oxygen diffusion one paper describes the diffusion ofF"-ions in YIG [23].
3.1.2 Cation diffusion In TIC \\
Cation diffusion in YIG was measured by Lyashevich and co- '|- worRers [24.251 by radioactive tracer technique (Fe59, Y90, Y 9 1 ). Ac- j
cording to Wolfmeier [26] their data were doubtful because of the
t 10

V * .« > !*
relatively wide scatter of results obtained by applying differentanalytical methods (absorption- and section-method; this shouldbe conceived as an inaccuracy in measurements, using the samemethods in spinels, SchmaUrled et al. found a 20 x scatterof results [27], while the diffusion data reported in [24,25]differ for about more than one order of magnitude. Ve give herethe activation energies for the yttrium-, Iron- and oxygen- dif-fusion in YIG, as collected from literature:
Tab. 3.1 Self-diffusion data for YIG
I OH E a[eV] remark ref
Fe 3*
s -
3 42.1-
2.6.1-4 -1-
4 -8.
ng
1 • 10"*10-3
310-26-10"*10-510-510-3
10-5410-1
le crystal
5. 23. 644. 6
4. 13. 752. 563. 23. 7
2. 842. 9
P
SPs
ssppp
S*Pp
: polycrystal
[24][24][26]
[25][25][25][25][36]
[12][ 3 ]
Based on above data and their interpretation given in thethesis of Volfmeler [26] we can extract for the diffusion coeffi-cients of the ions In TIG
eq-3. 6 I>Fe
This result is contrary to several classes of materials likespinels (for example Co 2TlO 4) where oxygen is the slowest diffusingion at low pO 2 (Vagner mechanism [29] ).
i
Sellable data about the lnterdlffusion of Y, Fe, Ga and Gd in thediffusion couples GGG-YIG, GGG-GIG and QIG-YIG are given in[30] (GGG ; gadolinium gallium garnet, GIG = gadolinium iron gar-
11
r

net).
The mobility of the iron ions in the d- and a-sltes of the garnetstructure is considered in [61] by using radioactive Fe59.In this study two similar polycrystalline iron-containing gar-nets were Investigated; one material with Fe exclusively In thetetrahedral and another material with iron exclusively in theoctahedral coordination. By determining the self-diffusion coef-ficients (see tab. 3.2) transport-parameters of iron were obtained:the mobility of Fe via the octahedral sites is preferred and thediffusion along the grain boundaries was found to be easier thanthrough the bulk (in Ca 3Fe 2Ge 30 1 2 - Fe in a-positlon and inYCa 2Zr 2Fe 30 1 2 - Fe In d-posltlon). The data for the diffusionprocesses are given below.
Tab. 3.S Diffusion data for octahedral and tetrahedral ironions along the grain boundaries and through the bulkof garnets (Fe59 tracer diffusion) [61]
Do [m2/s] [eV)
Ca3Fe2Ge30i2 bulkgb
YCa 2Zr 2Fe 30 I 2 bulkgb
8. 97 10~ 8
6. 4 • 10~ 1 0
1. 51 10-22. 39-10"2
0. 500. 36
0. 970. 92
A comparable result was obtained for the tetrahedral and octahe-dral sites In a spinel (ZnFe2O4) using radioactive Feand Zn isotopes (62).
Proton diffusion in YIG was investigated by Vood [18. 19] andHllani [20] to get basic data of about the interaction of thecrystal lattice with H2. From an appllcatlonal point of view,e.g. Suran [Si] and Milan! [22] used ion-implantated YlG-filmsas a new sort of H2-sensor.
3.1.3 Direct determination of oxvten vacancies In TIC
Metselaar et al. in ref. [»] stated that until the mid-seven-ties a direct quantitative determination of the oxygen vacancyconcentration as a function of po2 is still lacking. Therefore
12

a study of tne reversible oxygen loss in pure and Ca-doped Y1G bymeans of a thermobalance was presented [4]. Thermogravimetric ana-lyses were performed as f(T,pO2) with T ranging from 1220 K to 1540 Kand po2 varying between 10s and l Pa (at lower pOg's YIG decomposesinto YFeO3 and Fe2O3 [31]). From the weight changes the concentra-tions of oxygen vacancies were derived. In pure oxygen at 1670 Kthe oxygen-loss a in Y3Fes012-a
ls a b 0 U t 0.002. The maximum concen-tration of empty oxygen-sites which can be accommodated by theYlG-lattlce is 0.01 per formula unit, which ls approximately oneVo per unit cell.
The total oxygen vacancy concentration largely depends upon theconcsntration of uncompensated donors or acceptors. For the Ca-doped sample denoted "sample l" in ref. [4] the authors found for
1 1 9 iT=1370 K and p02=10* Pa that [Vo]=2. 2 101
daO. 0016 in Y 3Fe 50 1 2_ d.cm"
3, which gives
Vorob'ev and coworkers [63] determined the departure of YIG and GdIGfrom oxygen stolchlometry between 1070 and 1670 K at pO2's rangingfrom io5 t0 io"15 Pa. The non-stolchiometry or degree ofreduction of both garnet compounds ls presented as a function ofthe lattice constant. The values of a in HE3Fe5Oig_g derived fromthese data are very much higher than those presented in [4] (RE:rare earth). For example there is given a value of d = 0. 714 inGdIG at -lg pO2 = 6. 25 and T;1370 E.
A direct IR spectroscopic identification of [Vo]presented by Andlauer and TolKsdorf [32].
in GGG was
Volfmeler [26] from his ESR-measurements on GGG concludes, that theoxygen-vacancies are mainly doubly ionized (Vo-• ), which is in accor-dance with other results.
3.1.4 Electrical conductivity and thermo-electric power In
Larsen and Hetselaar have performed several measurements of theelectrical conductivity to check their hypothesis [7, a, io]. The firstpaper dealing with this item gives high temperature current-voltageand ac-conductivity data as well as the low temperature high and lowfrequency permittivity for polycrystalline YIG. The results areinterpreted in terms of a two-layer model: well conducting grainsare separated by poorly conducting grain boundaries. This ls incontrast to other ceramic materials like yttrla or zlrconla In whichgood conducting grain boundaries are surrounding poorly conductinggrains [e.g 33].
k 13

DC-measurements of the resistance In (Gd, Y^FejOjg were also re-cently published by Kuanr and colleagues [34]. They come to theconclusion that the Gd-substltutlon in YIG does not affect thegrain boundary potential barrier height.
In another paper [6] the influence of extrinsic impurities (ac-ceptor Pb2+ and donor Si 4 4 simultaneously) on electrical conduc-tivity and optical absorption of YIG is investigated. The resis-tivity of the sample has a maximum when the concentration differen-ce is
eq-3. 7 [Pb2+) - [Sl*+] s 0. 06.
From Seebeck measurements it became clear that the sample at thepoint of maximum resistivity changes from n-type to p-type con-ductivity as [Pb^+j increases.
The same paper [6] also gives the band gap energy determined byelectrical measurements as 3. 15 eV for the hopping model and 2.85eV for band conduction. The latter is in good agreement with theoptical measurements giving a band gap of 2. 8 - 2. 9 eV [64].
Reference [7] gives trse pOg-dependence of a (pO2 rangingfrom 105 to 1 Pa) at four temperatures between 1487 and 1707 K.The sample was polycrystalllne YIG containing 0.02 Hg per formulaunit. The a-pO2 isotiierras show a distinct minimum at thetransition from p-type to n-type conductivity. This result isInterpreted on the ba-si:* of electronic defects alone withoutpaying attention to possible Ionic conduction in theindependent o-reglme.
Moreover, paper [6] presents a combination of the thermoelec-tric power a and conductivity a. Again a conversion from n-typeto p-type conductivity was ^served. The temperature dependenceof a and a are the same within the experimental error. Thisresult and the interpretation of the Jonker's pear lead theauthors to the conclusion a large polaron model is in bestagreement with experimental results. Jonker [65] has shown thatit is often useful to combine the expressions for a and a intoan equation. From that it follows that the shape and dimensionof an a vs. \n(a/omin) plot depends only on the transport coef-ficients and the bandgap energy. Using such plots one is able tocompare data obtained from different samples.
In 1966 Petrov et al. [35] published a paper asking what is thenature of electrotransport in 'pure' YIG. Starting from oxidepowders as pure as possible they sintered 'balanced' samples(containing t 0. Oil wt. x donors and E 0. 010 wt. x acceptors).Petrov and coworkers measured the conductivity o as f(pOg, T)and the thermopower a as f(pO2, T). They come to the conclusion
14

that the properties of their samples have to be explained onthe basis of a small polaron model. Concerning the problem of theconduction mechanism (small- vs. large polaron model) it has tobe remarked that the interpretation of experimental results isdifficult; a final decision cannot be made for YI6. The conclu-sions may be valid rather for the individual YIG samples thanfor the YIG in general.There is only a single paper [36] which gives a very short hintabout the ionic transport properties of YIG, revealing that theYIG sample under test was a pure electronic conductor (note thatthere is no information on the impurity content of the samplenor the pO2 at which the transport measurement was performed).
The apparent discrepancies found for electrical transport proper-ties of iron garnets can be ascribed to various causes, which areanalysed in WlnKler's book "Magnetic Garnets" [31]. He states thatthe preperatlon and analysis of well defined samples is difficult,that the conductivity is relatively small due to small mobilitiesof the charge carriers and that the ionic nature of the materialleads to different points of view concerning the interpretationof experimental results (see ref. [31], p. 311)
3.1.5 Other Iron Garnets
Lai and coworkers [37-39] report electrical conductivity measure-ments made on several iron garnets with Gd, Dy, Ho, Er or Yb inthe dodecahedral c-slte. The conductivity was investigated by anac-voltage as a function of temperature and frequency and thethermopower is given as a function of temperature. Ref. [39] givesthe values of the mobilities u of the charge carriers in sixdifferent iron garnets. In ref. [37-39] it is argued, that theelectrical conduction in these materials is extrinsic and relatedto the presence of impurities. Lai and coworkers suggest a'thermally activated hopping' model as a suitable explanationfor their experimental results.
3.2 TTTRIUM ALUMINIUM - AMD OTHER NON-IRON GARNETS
Besides YIG some other garnets have found applications in technolo-gy. Doped yttrium aluminium garnet (Y3Al50i2) became a widelyused laser host material [40]. Also gadolinium scandium galliumgarnet (Gd3Sci. sGa3, 2°ia) [41] has attracted recent interest asa potential host for ions in solid state laser technology, as wellas CALGAR (Ca3Al2Ge3o12) [42] which was tested at MIT not long ago.
1 5
Jt

Gadolinium sal Hum garnet serves as a substrate In the iron garnetthin film technology and can, as Hakuruku et al. [43] demon-strated, be used as a refrigerator in low temperature physics(magnetic cooling).
3.2.1. Oxygen diffusion in XAG
The only synthetic garnet besides YIG for which oxygen diffusiondata are available is YAG (YgAlgO^)- The first experimental re-sults were published in 1977 by K. Mori [44] as a by-product ofhis investigation of transient colour centres caused by UV irra-diation. Mori performed anneMlng experiments in oxidizing and re-ducing atmospheres and observed the colouration of a YAG crystalnear the sample surface, that depends on the previous heat treat-ment. After 32 hours annealing at 1000 K in oxygen the decoloura-tion depth in a coloured crystal had moved about l mm. Moriassumed anion diffusion and analysed the diffusion length. Fromsuch experiments he estimated the anlon diffusion coefficient tobe
eq-3. 8 = 1012-exp [-4. 3 eV/KT] B.2/S.
Somewhat later Nelman et al. [36] stated that the self-diffu-sion coefficients of anlons and cations In YAG can be charac-terized by
eq-3. 9 DY.
The first investigation that was undertaken to get reliablequantitative data about oxygen diffusion in YAG was contributed byHaneda et al. [45] using O 1 8 tracer. They used crushed singlecrystal material with low impurity content (less than 200 ppm intotal). For as-grown YAG without facets measurements indicate thatthe Ols-exchange is controlled by oxygen volume diffusion,which is represented by
eq-3. 10 Do - 5. 2 4 1 0 " 7 exp [-3.36 eV/kT] m2/s.
Do is independent of the size of the crystal fragments - ifsub-grain boundaries or rate controlling exchange reactions at the
16

aa * v
surface occur, the diffusion coefficient should depend on the par-ticle radius [46]. In a second experiment YAG was neat treated InAl-vapour (as done earlier by Horl [44]). The resultant crystalwas dark coloured (F-centre formation [44]). O 1 8 diffusionexperiments revealed that now the oxygen exchange was not inde-pendent of the extent of the surface area- The diffusioncoefficient is represented by
eq-3. 11 D = a. 3-10"7 exp [-3.07 eV/KT] ma/s.
In both cases (oxidized and reduced YAG) the activationenergy of the diffusing species Is nearly the same; so Hanedaet al. concluded that the transport mechanism of oxygen isthe same in both cases. The diffusion coefficient on the otherhand, differs one order of magnitude, which led the authors to theconclusion that the oxygen defects are extrinsic In nature. More-over, Haneda and coworkers considered the question whether oxygenions diffuse via an interstitial or a vacancy mechanism; followingref. [45] the most probable defects in YAG are oxygen vacancies.So the electrical conduction at elevated temperature can belnterpretated in terms of anlon diffusion.
Masumoto and Kuwano [47] In 1965 give a deeper Insight in thepO2-dependence (after a high temperature anneal at a certain pOg)of the optical absorption of YAG. The interpretation of their datasupport Mori's model [44], in which transient absorption is dueto v0'-centres - a conduction electron captured by an oxygenvacancy; again the predominant role of the oxygen vacancies wasconfirmed.
3.2.2. Electrical conductivity in XAO and other non-iron garnets
one of the first papers dealing with the high temperatureelectrical conductivity in non-iron garnets was the work presen-ted by Lai and Jhans [46] in 1976. The authors measured a as f(T)in single crystal gadolinium gallium garnet (GGG) In air, N2, Arand vacuum. The conductivity was influenced by the gas atmosphere,so Lai and Jhans claimed that ionic diffusion may contribute tototal conductivity.
Helman and coworkers [36] performed ionic transference -, thermo-power - and conductivity measurements on YAG, YIG and GGG under
17

oxidizing conditions. It was concluded that TAG is a mixed lonic-electronlc conductor. The ionic transference number tj wasdetermined to be
eq-3. 12 °- 25(at 1070 K) 0. 55 { a t 1 6 7 0
Following [36] the most disturbed sublattlces in YAG are the oxy-gen - and the alumlnium-sublattlce; moreover, it Is stated thatYAG can exist with a small Al2O3-deflclt [36,49]. The ioniccharge carriers are described to be Intrinsic V Aj''' and v0-•defects; Nelman does not consider the possibility of inadvertentdonors and acceptors.
Bates and Gamier [50] performed conductivity measurements on YAGin 0 2 and oxygen-inert gas mixtures as f(T). Their singlecrystal sample had an impurity content of 300 ppm Na and severalother ions in a lower concentration. They found an activationenergy of the conduction process of 3. 4 eV between 1220 and 1540K. This value is the same as that reported later by Haneda et al,[45] describing their diffusion experiments. Contrary to Hanedaet al. Bates and Gamier assume a conduction process which is re-lated to the diffusion of Al-ions.
In 1984 a paper about the electrical conductivity In GGG waspresented by Hartmann and coworkers [51]. It was pointed outthat, due to the large band gap and a relatively small activationenergy of a, electronic charge carriers could not be generatedthermally across the band gap ( however, nothing is said whetherthe measured conductivity is ionic or electronic, e.g. by measu-ring tj). Hartmann et al. assume that p-type conductivity is attri-buted to extrinsic 00* centres.
A detailed investigation of gadolinium scandium gallium garnet(Gd3Sc1, a
Qa3.2°ia) w a s contributed by Schwartz and Duba [52] in1985. This paper gives a study of ac-conductlvity and thermopower ofsingle- crystal material as f(pO2) between 1332 and 1622 K.The measurements could only be performed at pOg's ranging from10s to 10 Pa because the compound decomposes at lower oxygen pres-sures. Depending on the temperature a as f(pO2) changes with aslope ranging from -1/16 (at 1332 K) to -3/32 (at 1622 K). Thissituation was assumed to be associated with the creation of oxy-gen vacancies, a situation that can be controlled by the neutra-lity-equation [e'J = 2[V0--]. An ionic contribution to the conducti-vity could explain the very shallow slope of lg a vs. lg pO2-plot.The activation energy of the conduction process is 2. 4 eV.
18

Furthermore the thermopower is not Independent of T as would be ex-pected for an electron hopping (small polaron) model with a fixednumber of charge carriers [53]; such a situation was found forCa 3Mn 2Ge 30 1 2 [54],
Until 1985 no worK on the defect chemistry of YAG was presented,besides the paper contributed by Neiman [36] and a short notepublished by Andreev et aJ. [55] suggesting that electricaltransport in YAG may be associated with a recombination ofelectronic charge carriers with oxygen vacancies.Rot man et al. [56,57,58,59] presented an extensive study ofthe high temperature properties of YAG. The first of the threepapers presents electrical conductivity data of Ce-doped YAG in-cluding both ti as f(pO2) and the ionic and electroniccontribution to total conductivity. This study on YAG:ce has shownit to be a mixed ionic-electronic conductor. Measurements areconsistent with a defect model dominated by doubly ionized oxygenvacancies fixed in number by background impurities. The vacancieswere found to move with an effective migration energy of 2. 3 eV. Astrong n-type component dominated at lower pO2's, while a p-type component becomes evident at the most oxidizing conditions.
An ar. ..''/sis of the conductivity resulted in a value for thethere. - .i:i>i gap of 6. l eV and a redox energy of 7. 8 eV for thereaci :.•„* < > V o " + 2 e' • 1/2 02.
This worK was followed by two papers [58,59] considering theinfluence of Nl- and Zr-dopants on electrical and optical proper-ties of YAG. Electrical conductivity measurements of Nl-dopedmaterial exhibit results consistent with a defect model in whichthe concentration of doubly ionized vacancies is controlled bybackground acceptors and the pO2-dependent concentration ofdivalent Nl ([Nl] t o t a l = [Hi2*] • [Hl3+]). An activation energy of2 - 2. 2 eV was found for the moving ionic charge carriers and theionisatlon energy of N i A 1
x — > Hi^i' was found to be 1.6 eV.
The data on YAG doped with Ni + Zr showed a marked decrease inionic conductivity while p-type conduction increases at lowpo2. No evidence of a change of the valence state of the do-pant ion Nl was observed, indicating that Zr fixes the Ni intothe Ni2* state even under oxidlxlng conditions.
3.3 SITE EXCIWHBE EfFECTS IN GARNETS
The redistribution rate of cations between the d-, a- and c-sitesof garnets has been elucidated by Roschmann [60] in quasiblnary
19

mixed yttrium iron gallium and iron aluminium garnet singlecrystals between 773 and 1533 K. The frozen-ln cation distribu-tions of quenched or slowly cooled samples were derived frommagnetization measurements and by a phenomenological Kineticequation. The activation energies derived for a thermallyactivated lnter-sublattice (d-site < — > a-slte) redistributionrange from l. 3 to 4 eV and are related to the concentration ofanlon vacancies. The barrier heights for the considered inter -and intra-sublattlce site exchange effects are strongly reducedby anlon vacancies surrounding the cation-defect.The statistical jumps of the vacancies due to thermal fluctu-ations at elevated temperatures thus provide a mechanism forobserved enhancement of cation redistribution rates in mixedgarnets e.g. yttrium iron gallium garnet. It is inferred that'premeltlng' or local melting of defect centres play an impor-tant role in solid state ionic migration. For a perfect (zero-defect) garnet the Intrinsic lnter-sublattice a < — > d barrierIs 4. 5 eV. As will be discussed in chapter 16 our computer si-mulation work comes to the conclusion that a Jump of an Al-lonfrom an a- to a d-slte needs an energy not lower than 3. 5 eV
Roschmann further derived, that the c <—>c barrier height, 1. e.the energy for a Jump of a c-slte ion from one dodecahedral site toanother, is 5. 4 eV. Apparently the c-c bonds form the strongestbinding scaffold of the garnet structure.
LITERATURE
[I] P. Hansen, B. Hill, V. TolKsdorf, Philips Tech. Rev.,ill (1963/64) 33.
[2] L. G. van Ultert, F. V. Swanekamp, J. Appl. Phys. . ££(1957) 1513.
[3} R. Hetselaar, P. K. Larsen. J. Phys. Chem. Solids., 12(1976) 599.
[4] R. Hetselaar, H. A. H. Huyberts, J. Solid state Chem. ££ (1977)309.
[5) P. K. Larsen, R. Metselaar, Phys. Rev., fift (1973) 2016.[6] P. K. Larsen, R. Hetselaar, J. Solid State Chem., 1£ (1975)
253.[7] R. Hetselaar, P. E. Larsen, Solid State comm. . 15. (1974)
291.[8] P. K. Larsen, R. Hetselaar, Phys. Rev., fill (1976) 2520.[9] R. Hetselaar. M. A. H. Huyberts, J. Phys. Chem. Solids, 14
(1976) 2257.[10] P. K. Larsen, R. Hetselaar, Mater. Res. Bull.. &. (1973)
663.[II] H. J. van Hook, J. Am. ceram. Soc. , M (1961) 206.[12] A. E. Paladino, E. A. Hagulre, L. G. Rubin, J. Am. Ceram. Soc.
4JL (1964) 280.[13] Y. H. Olshl, V. D. Elngery, J. Chem. Phys., 21 (1960) 460.
l 20
:

•4: »e \ J
R. E. Mistier, R.C. Coble, J. Am. Ceram. Soc. , SJL (1971) 60.[14] J. A. Kilner. Mat. Sei. Forum, 1 (1966) 205.[15] J. A. Kilner, B.C. Steele, L. IlKov, Solid State Ionics, !_£.
(1984) 69. ![16] H.C. Lecraw, E.M. Gyorgy, P.D. Pierce, J.W. Nielson, S. L.
Blank, D.C. Miller, R. Wolfe, Appi. Phys. Lett., H (1977) ».243. M
[17] T. Hiblya, Y. Hidaka, K. SuiuKl, J. Appl. Phys., !kl (1976) <j2765. \\
[16] D. L. Wood, E. D. Kolb, J. P. RemeiKa, J. Appl. Phys., M. >{(1968) 1138. if
[19] D. L. Vood. J. P. Remelka, J. Appl. Phys., 1Ä (1967) 1038. '[20] E. Milani, P. Paroli. J. Appl. Phys., £5. (1984) 2173. '[21] G. Suran, H. louve, P. Gerard, J. Appl. Phys., M (1983) '
2006.[22] E. Milani, P. Paroli, B. Antoninl, Appl. Phys. Lett., M j
(1983) 1074. ;[23] B. Antoninl, P. Paroll, Phys. Rev., £££ (1963) 3422.[24] A. s. Lyashevich, N. E. Shlmanlvich, I. F. Kanonyuk, M. B. Kos-
myna, Russ. J. Phys. Chem. , 51 (1977) 1413.[25] A. S. Lyashevich. N. E. Shlmanovich, I. F. KanonyuK, M. B. Kos-
myna, Russ. J. Phys. Chem., 51 (1977) 1584.[26] U. H. Wo If me 1er, Ph. D. Thesis, Hamburg (1980)[27] Morke). H. Schmalzried, Z. Phys. Chem. H. F. , i£. (1962) ,
76. '[28] J. Rabier, Ph. D. Thesis, L' Université de Poitiers (Nr.
305), (1979)[29] H. Schmalzried, "FestkörperreaKtlonen" Verlag Chemie, Wein-
heim, 1971, p. 100[30] V. V. PanKov, L. A. Bashklrov, J. so l id State Chem., ££ !
(1985) 123.[31] G. WlnKler, "Magnetic Garnets", Vieweg & Sohn, 1981[32] B. And lauer, V. Tolksdorf, J. Appl. Phys., £0. (1979) 7986.[33] M. Miyayama, H. Inoue, H. Yanaglda, J. Am. Ceram. Soc. , C-164 j
(1983). ![34] M. Kuanr, J. Appl. Phys. Ifi (1977) 1679. I[35] A. H. Petrov, G. V. Denlsov, V.M. Zhukovskli, Izv. AKad. HauK.
SSSR, Neorg. Hat.. £2. (1986) 663.[36] A. Yu. Hei man, E.V. TKachenko. V.M. Zhukovskil, Dokl. AKad.
Nauk. SSSB, 2JÛ (1978) 676.[37] V.R. Yadev, H. B. Lal, Jap. J. Appl. Phys., ü (1979) 2229. I[36] V.R. Yadev, H. B. Lai. Can. J. Phys., 41 (1979) 1204.[39] H. B. Lal. B. K. Ver ma, V.R. Yadev, J. Mater. Sei., il
(1982) 3317.[40] A.A. Kaalnskll. "Lasernle Kristally", Izd Hauke, MosKow
1975, translated 'Laser Crystals", Springer Verlag, 1983.[41] D. Pruss, G. Huber, A. Beiaovski, v. V. Leptov, I.A.
Sherbakov, Yu. V. ZharlKov, Appl. Phys., B2.fi (1982) 355.[42] S. R. Rotman, H. L. Tu 11 er, M. Roth, A. Linz, J. Appl. Phys.
52. (1985) 5320.[43] Y. Hakuraku, H. Ogata, Jap. J. Appl. Phys. ££ (1986) 140.[44] K. Mon, phys. s t a t . so l . (a) , Jki. (1977) 375.[45] H. Haneda, Y. Mlyazawa, S. ShirasaKi, J. Cryst. Growth, &B.
(1984) 581.[46] S. ShirasaKi, I. Shido, H. Haneda, M. Ogawa, K Manabe, Chem.
'i
21

[47][46][49]
[50][51]
[52]
[53]
[54]
[55]
[56][57]
[58]
[591[60][61]
[62][63]
[64]
[65]
Phys. Lett. 5_fl (1977) 459.T. Masumoto. Y. Euwano. Jap. J. Appl. Phys., £4. (1965) 546.K. Lai. H. K. Jhans, Indian J. Phys.. 5J2A (1976) 433.V. V. Oslko et al. " Spectroscopic Investigations of DefectStructures in ionic Crystals" inCrystal: Growth, Properties and Applications, Vol. 10(Growth and Defect Structure), Springer Verlag, 1985, p. 36.J. L. Bates, J. E. Garnler, J. Am. Ceram. Soc. . (1981) C-136.E. Hartmann, L. Kovacs, J. Plaltz, phys. stat sol. (a),M (1984) 401.r. B. Schwarze, A. G. Duba. J. Phys. Chen. Solid., &&(1985) 957.H. L. Tuller, A. S. Nowick, J. Phys. Chem. Solid., _3_fl (1977)859.G. Overs lulzen, T. H. J. M. Kuljper, R. Hetselaar, Phys. Rev.,B29 (1964) 4540.A. P. Andreev, s. F. Akhmetov, G. L. Akhmetova, S. V. Davydchen-ko, B. K. Colodlev, s. V. Colodieva, H I . Samol llovich. Act aCryst. , A. ilfl, Suppl, (1984) C-330.S. R. Rot man, Ph. D. Thesis, MIT 1965.
R. P. Tandon, H. L. Tuller, J. Appl. Phys.S. R. Rot man,(1965) 1951.S. R. Rotman,(1966) 413.S. R. Rotman,P. Roschmann, J.V. M. Zhukovskl,Phys. Chem., £5.
52
H. L. Tuller, Hater. Res. Soc. Symp. Proc. fifl
H. L. Tuller, J. Appl. Phys.Phys. Chem. Solid., 12.
T. G. Veselovskaya, A. Ya.(1961) 145.
, &£. (1987) 1305.(1981) 337.Nelraan, Russ. J.
F. Lindner, Acta Chem. Scand. , £ (1952) 456.Yu. P. Voro'bev, T.I. DragoshansKaya, S. L. Matskevich, A. N.Men, Izv. Akad. Hauk. SSSR, Neorg. Hater. 1£ (1980) 1063.S. Vittekoek, T. J. A. Popma, J. H. Robertson, AIP Conf. Proc. ,JLft (1974) 944.G. H. Jonker, Philips Res. Repts. 22, (1968), 131
»1 »
22

LITERATURE REVIEW : COLOUR CENTRES AND PAR/WtiNETICDEFECTS IN GARNETS
COLOUR CENTRES
Many papers dealing with colour centres in YAG have been pub-lished in the past. These centres, crystal defects in nature,are analytically detected by absorption bands between 200 and800 nm wavelength (or as ESR-actlve paramagnetic centres). On thewhole they are similar to those in alkali halides [1]. On laserapplications the absorption of the pump radiation by these colourcentres contributes to the heating and subsequent deteriorationof the effectiveness of the crystal as a laser.
In view of the large amount of papers dealing with this subject arestricted review pointing out the most important aspects forthis thesis is given.
in 1967 Bass and Paladlno [2] published a first paper describingthe properties of absorption bands in YAG evoked by radiationwith a xe-flash lamp. The same absorption bands were detected inNd-doped YGG grown from a non-stolchlometrlc melt. In the samepaper [2] the authors demonstrated that radiation induced defectsin YGG heal In time at temperatures below 370 E, while for thesame process in YAG a considerably higher temperature is required.Ho suggestion about the structure of the observed colour centreswas given Bass and Paladlno.
Later in 1968 Arsen'ev and coworkers [3] reported the formationof colour centres in Eu- or Yb-doped YAG during the annealing invacuum (low oxygen pressure) or as a result of gamma-irradiation.The centres formed in vacuum were attributed to ionized com-plexes consisting of activator ions (Eu or Yb) and oxygen vacan-cies, while those formed during irradiation were interpreted asOo" or Oo"'-centres.
In spite of the fact that nothing is said expllcltely about thestructure of colour centres in YAG in ref. [2,3] it Is evident,that defects in the oxygen sub-lattice play a crucial r-;e. Theconcept of the formation of Oj -centres in YAG as proposed in[3] is the logic generalisation of early experiences gained withAl2o3-crystals by Maruyama et ai. [4] and Bertram et »i. [6],
Batygov and coworkers [6] tried to trace back the colouration ofYAG after gamma-irradiation at room-temperature to rare earth
23

IVt *
Impurities. They found Pr and Tb to increase the absorption 'between 300 and 500 nm after Irradiation. This Is considered tobe associated with the oxidation of Pr3*- and Tb3+-ions to the4+-state. So these ions act as hole traps. The elements Eu and Ybare reduced during irradiation to Eu2* and Yb2*" which shouldact as electron traps.
Kvapll and colleagues [8] investigated both the reversible colour ',change as a function of the annealing atmosphere and several 'doping elements (Be, Mg, Ca, Sr, Ba as well as Nl, Fe, Tl, v, \\Mn, Cr, Co). YAG crystals doped with Iron group ions in a highervalency state (*+) can be coloured yellow-brown by annealing inoxygen; when exposed to UV-radlatlon the colouration Is deepened.The crystals containing iron group ions in a lower valency state(2+). Mg2* or Ca2*, can be coloured yellow-brown to a less extentby an anneal in oxygen. Annealing In H 2 fully eliminates thecolour in all samples, with the exception of YAG:Ni, which be-comes greenish-black. The colour change induced by a treatment inoxygen begins at 1170 - 1870 K. Kvapll and co-workers interpretedthe nature of these absorption centres In terms of a foreign ionInduced compression of O2~-lons in the first coordination sphere.This and the requirement of electro-neutrality leads to the for-mation of 00'-defects.
Such 00"-centres have in particular been observed In aluminaas an absorption band [18] at nearly the same energy as in YAG.Other papers published by Kvapll and ctfworKers dealing with theinfluence of various annealing conditions and doplngs on thecrystal colouration are given In ref. [9-10],
A detailed study of non-stoichlometrlc defects appearing ascolour centres in YAG was given by Kvapll and coworkers In 1985(11). They found brown colour centres termed "durable" becausethey do not bleach out easily by annealing in crystals grown fromslightly non-stolchlometrlc melts. Centres having a brown colourwere introduced by growing YAG from a melt having a smallsurplus of Y2O3 (3.005:5 < Y:A1 < 3.01:5). Crystals grown from amelt containing a small surplus of AI2O3 (Y:A1 < 2.99:5) show ablue coloration. The colour intensity depends on the H e/ H20 ra-tio in the protective atmosphere in the growth apparatus. Kvapilassumes that the brown colour is caused by the introduction of acertain amount of YA)
x-defects during the crystal growth. Subse-quent cooling causes a compression of the substitutlonal Y by theoxygen-polyhedron, followed by a release of an electron forming ahole or a bound poiaron according to Bernhardt [16].
Bernhardt was the first who took pains of gaining a deeper under-standing of the structure of 00--centres in YAG [12-16].Following results obtained for crystal-defects in smoky quartz(S1O2:A1) obtained by schirmer et al.. [17] Bernhardt
' Eu3* is the rare earth ton with the greatest electronaffinity, followed by Yb3* and Sm3* [7].
24

applied the "bound polaron model". By performing model calcula-tions [16] of colouration bands in YAG: Mn he verified the polaroncharacter of the centres. Holes have less the character of simple00' ("self trapped holes") than of (0o0o)'-centres, which is a defectelectron fixed between two oxygen ions. A further refinement of thismodel leads to the conclusion that the oscillator o2"••hole• O2"must be stabilized by an additional Coulomb-potential that actsperpendicular to the vibration direction. This stabilizing poten-tial should be an impurity ion (see fig. 4. l)
The polaron model proposed by Bernhardt was laterCermak [19].
confirmed by
Fig. 4.1 Model of a linear harmonic osci1lator stabi1 lied byan additional Coulomb potential (from [16])
Mori [20] performed optical absorption and ESH measurements inpure and Fe-Sl - doped YAG. He found a correlation between thebleaching of the absorption bands and the dlsappearence of theisotroplc ESR-llne. From the g-values found In the ESR-spectraMori concluded that in YAG: Fe, Si electrons are trapped at theiron-ions (a hole-like centre) while in pure YAG electrons arecaptured at anlon vacancies, which act as colour centres.
The russian group around Karaseva and Gromov published a seriesof papers concerning colour centres in YAG [16, 21-24], proposing a"•ultl defect model".
I25

;ia at
.a PARAMACPffTIC DEFECTS
Several paramagnetic defect centres caused by foreign cations inTAG have been investigated in the past. However, many more papersdealing with paramagnetic centres In alumina have been publishedin the recent years. One of the pioneering publications descri-bing electron spin resonance studies In acceptor-doped a-AI2O3 waspresented by Cox [25} In 1971. Crystals containing Mg+Ti, Li+Tl(in a compensating molar ratio) were gamma-irradiated, whichturned the previously colourless crystals to a dark brown colour.Subsequently recorded ESR-spectra were interpreted In terms ofsingle holes trapped by the negatively charged defects MgA1',Ll A 1"and v A i " ' , which form MgAi*. Li A 1' and v A 1 "respectively. The primary product of the irradiation are electron-hole pairs. The electrons may be trapped by positively chargeddefects (e. g. TlAi'), but these were not detected in [25]. Thebrown colour was attributed to the paramagnetic defect-bound holein a concentration of about 10 1 8 per cm3.
The structure of the trapped hole defect in alumina has firstbeen discussed In a theoretical paper by Bertram [5). He used amodel of a hole localized on Just one O2~ in the nearestneighborhood of the substitutional defect. Cox interpreted hisresults on the basis of that model
In a following paper Cox [26] investigated A12O3 doped with Hg.Annealing in a reducing atmosphere produces colourless and ESRinactive samples containing the closed shell defect MgAj'. whichis compensated by intrinsic or extrinsic donors. Annealing sucha crystal in oxygen results In a paramagnetic, purple-grey sample.ESR spectra can be attributed to a hole trapped by Mg2*, that isto the neutral defect HgAi
x. The hole is located on an oxygenion next to the impurity (= (Oo* Mg Ai')
x. These defects areperfectly stable. Later Kroger, Cox and colleagues [27] annealedMg-doped alumina at different oxygen partial pressures and per-formed ESR measurements. It was evaluated, that the concentrationof the paramagnetic centres decreases successively withthe oxygen pressure. Based on that fact a defect model of Mg-dopedalumina including a pOg-dependent hole-release mechanism was pro-posed.
The defect model of alumina described above is of interest forus because comparable pO2-dependent ESR-data are not available forYAG.
Mori [26] performed ESR and optical absorption measurements onundoped YAG after a high temperature treatment in an Al-vapour.After this reduction the crystals had a dark blue colour. The ESRspectrum associated with this colour had a g-value which wasslightly smaller than that of a free electron. So Horl con-cludes that the ESR-date indicate an electron (trapped at anoxygen vacancy) rather than a hole, resonating in a defect. TheESS-slgnal disappeared simultaneously with the decolouration of
26

• ft•• j>
the crystal. By investigating the moving colour zone while oxidi-sing a reduced sample Horl [28] evaluated in a clear way, thatthis process is connected with anlon diffusion. After irradiatingan undoped YAG crystal with UV-light the same author detected ESR-signals with g-values which were assumed to be due to hole-centresof the O'-type.
Horl [28] suggested that the luminescence peak occurring at anenergy of 2.6 eV (480 run) Is connected with the release ofelectrons from oxygen vacancies which recomblne with holes.
Referring to this suggestion Hayes et *l. [29] presents ownexperiments and a reinterpretatlon of Mori's data [28]. Hayeset al. bring into discussion the idea of self-trapped exci-tons or holes near cation-vacancies (for simple oxides there isevidence for holes trapped near cation vacancies [30) ). Thistheory's major problem is that while it is true that holes tendto be located at negatively charged cation vacancies, both thenumber of holes and the number of cation vacancies should decreasewhen the crystal is annealed in atmospheres of decreasingpo2. instead the emission data show an increase in 300 nmemission with decreasing oxygen pressure [31]. Bobbins resolvedthis dilemma by postulating a second defect which competes withthe luminescent one at 300 nm [32-35]. Based on this he deve-lopes a model which can explain the experimental data, as summa-rized in [31].
In 1986 Asatryan and coworkers presented ESB-measurements perfor-med on Zr-doped YAG [37]. Such crystals, grown under hydrogen,showed a red colour, which was not observed when charge compensa-ting ions (ca or Hg) are present. X-ray measurements performed onceramic samples revealed that the lattice constant a0 decreaseswith increasing Zr-concentratlon.
ESR-spectra of Zr-doped YAG show the presence of paramagneticcentres localized in the dodecahedral sites. These centres areassociated with Zr3* ions (4d1, S - 1/2). Other oxidation statesof Zr are not ESH-active, and are not expected to be present ina considerable concentration in reduced YAG. In another experi-ment Asatryan and coworkers showed that there is a directcorrelation between the ESR-lntenslty and the intensity of theoptical absorption (brown colour) in Zr-doped YAG. The colourcentres and the paramagnetic centres are assumed to be the samein nature (see fig. 4. 2).
3I 27

Fig.4.2 Correlation of ESS and optical intensities [37].
Several ESK-experlments were performed to find out how thedifferent crystallographlc sites in the garnet structure areoccupied substitutionally by foreign cations (mainly transitionelements). ESS measurements are described for TAG containing e.g.Fe3+ [43], Cr3+ [43], Gd 3 + [43], V2+/*+ [44,45], Zr3+'** [37],Co2 + [38], MO3* [46], Mn 2 + [47].
Although the aim of this short review is not to give detailed in-formation about site occupancy, nevertheless it should be mentionedthat there is one paper describing not a substltutlonal metalion in YAG but an interstitial Co2* [38}. This should be look-ed upon in some more detail. Experiments made with co-doped yttriumgallium garnet (YGG) [39-42] gave no indication that cobaltoccupies interstitial lattice sites. However, Yoslda and collea-gues [36] took ESR-spectra of TAG doped with 1 at. x Co andtried to interpret their data assuming substitutional cobalt-ions.The angular dependence of the spectra showed that the lines donot come from substitutional Co2* or Co 3 + spins alone. So1/3 of the Co-lons having the charge 2+ are located on interstitialsites to charge-compensate a/3 Co3+ positioned on substltu-tlonal sites - sofar the model proposed by Yoslda. In a secondstep the authors Identified 24 magnet leal ly lnequlvalent inter-stitial positions and one of then was chosen to be the most appro-priate: the 48 g-posltlon (see fig. 4.3). This is the first clearevidence of interstitial ions in YAG.
1

-...•a. &
O Octahedral (16)
• Tctrahtdrol (24)
O DodKOhcdral(24)
Interstitial (48)
Fig. 4.3 Crystal structure of YAG. Oxygen ions are not shown.The interstitial site occupied by Co is given by ahatched circle (38).
LITERATURE
[l] F. Selta, Bev. Hod. Phys. z& (1954) 7.[2] M. Bass, A. E. Palad 1no, J. Appl. Phys., Afl (1967)[3] P. A. Arsen'ev, E. F. Kuslov, L. Li, M. V. Chuklchev
graflya, & (1968) 7«o.[4] T. Maruyama, Y. Hatsuda, J. Phys. Soc. Japan, 12,[5] R. H. Bertram, C. E. Svenberg, J. T. Fournler, Phys.
(1965) A 941.[6] S. Kh. Batygov, Yu. K. Voron'kov,
Osiko, v. S. RadyuKhln, M. I. TinSolid State, 14 (1972) 839.
[7] s. Kti. Batygov, "Spectroscopy , ip. 167.
[8] J. Kvapil, Jo. Kvapll, B. Perner, B. Nanek, Krlst(1975) 529.
[91 J. Kvapil, Jo. Kvapll, B. Perner, Krlst. Techno 1.(1975) 161.
[10] j. Kvapil, Jo. Kvapil, B. Perner, B. Manek, Krlst(1975) 1051.
!. Denker, A. A.< hkln, Soviet
,• stals", Nauka,
2706.K r i s t a l l o -
(1964), 1096Rev. , 119.
Maler, V. V.Physics -
Moskow, 1970
Techno 1. , 1£
Techno 1. 12
29

[11]
[12][13]
[15][16][17]
[18]
[19][20][21]
[22]
[23]
[24]
[25][26][27]
[28][29]
[30]
[31][32]
[33]
[34]
[35]
[36]
[37]
[38]
[39]
[10]
[41]
[42][43]
J. Kvapll, Jo. Kvapll, B.Hendrich, Cryst. Res. Tech.H. J. Bernhardt, Phys. stat. Sol.
Perner, B. Hànek,£fi (1985) 473.
O. F.1345.N. Y.SCI.
Schlrmer, R. Schnadt, Solid
Konstantlnov, L. G. Karaseva,USSR, Phys. Chem. Sec. , 2 ü
(a),(a),(a).(a),(b),State
11ii14II
(1975)(1976)(1976)(1976)(1978)
Commun.
V. V. Gromov,(1980) 653.
K. BlazeK, Z.
365.211.483.445.
213.la. (1976)
Proc. Acad.
CermaK, Phys, Stat. Sol. (a), && (1981) K37.K.K. Morl, Phys.L. G. Karaseva, E. I. Saunln,Energy Chem., 9_ (1975) 29.V. V. Gromov, L. G. Karaseva,Chem. ,lfl (1976) 1617.
Gromov, L. G. Karaseva,, 51 (1977) 145.Rozno, V. V, Gromov, A. V.Solid State, Ifi (1976)
Cox, Solid State Commun.Cox, J. de Physique, ££
Stat. Sol. (a), 42. (1777) 375.E. I. Saunln, V. V. Gromov, N. A. Anlslmov, High
V. V.Chem.A. G.Phys.R. T.R. T.H. A.
E. I. Saunln, Russ. J. Phys.
E. I. Saunln, Russ. J. Phys.
Romanov, A.A. Anlslmov, Sov.1430.2, (1971), 1989(1973) 333.
Vang, C. H. Lee,H (1983) 3821.K. Morl, Phys. Stat.V. Hayes, M. Yamaga,Solid State Phys. , jA. E.Ed.
F. A. Kroger, R. T. Cox, Phys. Rev. B,
Sol. (a), 42. (1977) 375.D. J. Robb ins, B. cocKayne, J. Phys. C:. (1980) L1O85.
Hughes, B. Henderson, "Point Defects in Solids" Vol. IH. J. Crawford Jr. and L. M. Sllfkin, Plenum Press, Hew
Mass. Institute of Technology, 1965.B. Lent, c. H. Duckworth, F. Mans-the 12. th Rare Earth Research
Rev. , B_ üB. CocKayne, J. L., 1 Ü (1979) 1213.B. CocKayne,, 1££ (1979)B. CocKayne,, lit (1979)
A. S.Phys.
B. Lent, C. H.(1979) 1254.
Glasper, 8.
DucKworth, J. L.
Lent, J. Elec-
J. L.1221.J. L.1556.
Kuzayan, A. G.stat. Solid.
Glasper, B. Lent, J. Elec-
YorK, 1972.S. R. Rotman, Ph. D. Thesis,D. J. Robb ins, B. CocKayne,field, in " Proceedings ofConference " 1976, p. 1004.D. J. Robblns, B. CocKayne,Glasper, Phys.D. J. Robblns,trochem. Soc.D. J. Robblns,trochem. Soc.D. J. Robblns,trochem. Soc. ,H. R. Asatryan,E, G. Sharoyan,T. Yoslda, Y.31-34 (1983) 689.J. R. Chamberlain, R. W. Cooper, Proc. Phys. Soc. , H (1966)967.M. D. Sturge. F. R. Merritt,2 (1966) 63.M. D. S t u r g e , F. R. M e r r i t t ,Rev. , J_flfl ( 1 9 6 9 ) 402.D. L. Wood. J. P. RemeiKa, J. Chem. Phys.. 46 (1967) 3595.R. A. Serway, F. H. Yang. S.A. Marshall, Phys. stat.
Chiba, M. Date. J.
Glasper, B. Lent, J. Elec-
Petrosyan, A. K. Petrosyan,(b), U S (1986) 343.Magnetism Magnetic Mater. ,
J. P. RemeiKa, Appl. Phys. Lett.
J. c. Hensel, J. P. RemeiKa. Phys.
30
1:

SOI. (b). M (1978) 867.[44] I.I. Karpov, B.N. Qrechushnlkov, V.F. Koryagln, A.M.
Kevorkov, Pham Za Ngl, Dokl. AKad. NauK. SSSS £4JL (1979)74.
(45) I.I. Karpov, B. N. GrechushMKov, V. F. Koryagln, A. M.Kevopkov, Pham Za N«l. Dokl. Akad. Nauk. SSSR, £4J. (1976)330.
[45] G. R. Asatryan, A. S. Kuzanayan, A. 6. Petrosyan, E. G. Sharoyan,G. O. Shirlnyan, Sov. Phys. Solid State, ££ (1967) 335.
[46] j. A. Hodges, J. Phys. Chem. Solids, 15. (1974) 1365.
31

t'Miti \ J
SMPLE PREPARATION AND EXPERIMENTAL SET (IP
5.1 POWDER PREPARATION
Several papers describing preparation methods for YAG ceramicpowders have been published in the past. The classic route foroxide ceramics is the so-called mixed oxide method [1] in whichmixed oxide powders react at elevated temperature to the propercompound. More advanced methods for YAG powder synthesis such »sfreeze-drying [2J, hydrothermal growth [3], sol-gel techniques[41 or spray-drying [5,6] lead to much better powders than themixed oxide method.
The samples investigated here were prepared by spray-dryingsulphate solution (modified sulphate process) [5]: AlgCSOji)? wassolved In H2SO4 (pH=3) to which a proper amount of of Y2O3 wasadded while the pH was Kept constant by addition of H2SO4. Afterspray drying the solution calcination was done at 1600 K. Subse-quent ball milling in lso-propanol and sieving gave a powder withan average grain size of 1 l in [5].
Controlled doping with aliovalent cations such as Ca, Hg or Zrwas done following two different routes:
a) by addition of a proper amount of an ethanollc solution ofCa-, Mg- or Zr-nitrate to the powder and subsequent heatingto vaporize the alcohol
b) by Immersing preslntered pellets (1620 E, 2 b In air (seesection 5.2) with a porosity of 20-30 x in methanolicsolutions of Zr- or Hf-acetylacetonate for 12 hours. It wasassumed that the rest-porosity is open porosity, so from thepenetrated volume of solution (assuming that all pores arecompletely filled) the dopant concentration could be estimated.This method did not lead to homogenious samples; only asurface layer contains an appropriate dopant concentration.
5.2 SINTERINC OF THE POWDERS
T.
i
Two grams of pure or doped powder were pressed unlaxlally with 40MPa (density:!. 6 g/cm3=35x relative density) and preslnteredon an alumina holder for 2 h at 1820 K in air, the samples werenot sintered in a powder-bed.
Jr.

Afterwards the preslntered samples were placed in a Mo-nolder andsintered in an Astro-furnace in a Hj/HaO-atmosphere (Hg saturatedwith water at 293 K) with the following temperature program:
60 K/ min S K/minroom temperature > 1170 K > 2070 K
sinter time 120 min at 2070 K
to K/min 100 K/min2070 X > 1170 K * room temperature
5.2.1 Evaporation effects during sintering
1f
Sintering at high temperature and, in the case of YAG, in a strong-ly reducing atmosphere, involves a considerable evaporation ofmaterial. The drastic loss of MgO sinter-dope has already beenrealized in the first sinter experiments; a YAG powder doped with500 ppm MgO for example contains 50 ppm MgO after final sinter-ing at 2070 K. To a lesser extent also an evaporation of A1 2O 3
has to be taKen into consideration. Auger-analyses of sinteredsurfaces of Ca-doped TAG showed that also CaO tends to vaporize,but to a much smaller extent than MgO; the entire Ca-concentra-tion in a sample decreases insignificantly (for evaporation ofceramic materials see also [29] ).
The effect of a severe weightloss of oxides heated in reducingatmospheres is treated Heuer by and colleagues In [30] givingseveral volatility- and Ellingham-dlagrams. Fig. 5.1 gives a vo-latility diagram for MgO in H2/H20- and CO/CO2-atmospheres fordifferent temperatures.
From fig. 5.l it can be derived for example that if the H 2O/H 2
ratio changes from 0. 01 to o. 001 at 1900 K, p M. increases from 30to 300 Pa. It is a role of thumb that weightloss due to evapora-tion from a high temperature ceramic material is important only Ifthe vapour pressure is higher the 0.001 Pa - following this sugges-
33

- *l> v -A
tion MgO is a highly volatile matter (30).
IOfltPCO,<PCOl
' - 1 0
Pa
0 / log I0co,1>col
Fig. 5.1 Volatility diagram tor MgO in different reducingatmospneres ( the dotted line is constructed forH20/Ha = l*
When we apply these diagrams for pure oxides we have to bearIn mind that we are not dealing with single phases, but withsolid solutions (dopants) or with dispersed particles (in thecase of Al-rlch Inclusions, which will be discussed later).But nevertheless, such diagrams give a quite useful impres-sion about solid state-gas phase reactions In the system weare considering.
t

>oolPco,'Pco> -v -v
- -10
log (Pco,'Pco>
Volatility diagram for the Al-O system [30],
noon
Fit- 5.3 Comparison of volatility for Al-0 ana Mg-0 systemsat 1900 K [30].
li-ft
35

For A1 2O 3 the volatility diagram is shown in fig. 5.2. The Al-0species with the highest tendency to evaporate is A1O2. Asssuminga H2O/H2 ratio of 0. 003 and T=2100 K the vapour pressure of AIO2
can be estimated as 0. 1 Pa. Relying on this result the vapourpressure of alumina under reducing conditions is not negligible.
For the sake of comparison fig. 5.3 shows the volatilitydiagrams for both the Al-0 and the Mg-O system in one plot at1900 K.
There is one paper Known to us giving data about the evaporationrate of - as suggested by the authors - YAG from a melt (T:Z400 -2500 K) [31]. This paper considers a progressing weight loss, with-out asking if the melt changes in stoichlometry, e. g. due to vo-latilisation of A102. Extrapolating the plots given in [31]to our sinter temperature leads to following evaporation rates:
a) 3070 K in air: 0. 75-10"3 g/cm2h
b) 2070 K in H2/Hg0: 0. 5'10~2 g/cm2h
For a YAG pellet with l. 6 cm in diameter it can be estimated that0.05 g material i- 2.5 %) will evaporate while sintering 2h in aHg/HgO-atmosphere.
5.3 SOLUBILITY Of C», Mft. Zr AMD tiff Iff XAO
Ve found that Ca has a low solubility in the YAG lattice [7]. Sig-nificant Ca-rlch precipitations were detected by SEH/EDX In sam-ples containing Ca-concentratlons as low as 500 ppm. It was foundthat Zr has a much higher solubility in the YAG lattice; 700 - aooppm were solved without forming second phases. Ve checked the so-lubility of Hf and found that 1000 ppm are soluble without formingprecipitates. The solubility of Hg is not investigated due to thehigh volatility (see also section 16 where solution enthalpies areestimated based on computer simulations).
I

5.4 CLCCTRICAL MEASUREMENTS
To get an insight into the defect chemical properties and somemlcrostructural features the electrical conductivity as a functionof T and pO2 was investigated at high temperature. The theory ofdefects In ionic crystals and their practical determination wasworked out and properly described by Brouwer [8), Kroger [9], vanGool [10] and Brook [11], experimental methods for high tempera-ture conductivity measurements were worked out and described byPeters [12], Brook [13], Ozkan [14], Blumenthal [15], schmalzried[16], Kltazawa [17] Etsell [25] and others. The interrelation-ship between ceramic inlcrostructure and ac-frequency dispersionor dielectric relaxation has been considered by Jonscher [16],Macdona id [19.20], Bauerle [21], Armstrong [22] and severalother workers in the mentioned papers.
The conductivity cell we used was a spring loaded alumina cell,(see fig. 5.4), comparable to that described in [23]. This cellwas placed in an alumina tube wrapped with Pt-foll to shield dis-turbing fields caused by the furnace. We used a dc-driven Sictube furnace with a maximum temperature of 1670 K.
Conductivity measurements were performed with a Solartron 1174frequency response analyser (l MHz - 0.0001 Hz) interfaced to aHP-B6 computer. Samples equlped with painted or sputtered Pt-electrodes were connected to the Solartron as shown in fig. 5.4 B.The data were analyzed and presented in the impedance or admit-tance mode by choice or as a 3-dimenslonal Z' vs. Z"vs. frequen-cy plot.
For measuring the pO2 dependence of the conductivity differentoxygen pressures were maintained by mixing O2/N2, CO/CO2 orH2/H2O. The pressures were controlled with a ZrO2-cell whichcould measure the gas entering or leaving the cell alternativelyto control the tightness of the equipment.
37

a... Wbtercooledgostoutlet m e t a | f , a n g e s
AljCbtubesample
tube
internal thermocouplesgas inlet
Leads for conduction and temp, measurements
B
Fig. 5.4 A) The high-temperature celt for conductivitymeasurements
B) Connection of the Solartron to the sample [26]
Ionic transport numbers were determined by measuring the EMF de-veloped across a diskshaped sample whose surfaces are exposedto different pOg's [26]; EMF and ionic transport number tt are re-lated by [13]:
eq. -5. 1RT pO2(II)
EMF r tA in4F pO2 (I)
in which H is the gas-constant, T the temperature, F the Faradayconstant, tt the ionic transport number and pO2(I) and pO3(U)the oxygen partial pressures on each side of the sample. The ex-perimental set-up Is shown in fig. 5. 5 . The very small EMF-cellwas placed in a special Pt-wound mini- furnace with 170 mm tube-length and 20 mm tube-diameter (max. temperature 2020 K). The cellconfiguration was Pt pO2(I) / YAG / Pt pO2 (II).
36

o o n n n n n o n n o nYr//// / . • / • - , , / / / . . , / / / • • / . • / / ,
, Pi
(PI Mitt)
777//////////// //////////s //////////
KcithlvyI9S
nw1
Pt
^^^ fiflS 1
|
1| - P t 10* Rh
KeithIcy
642
Electrcnetcr
v r
\ 4
8as II n
B
Data
8200VoltaCalibV
rator
A) Arrangement for measuring the EMF using a cylin-drical volume-guard [SB]
B) The electrical set-up
The apparatus shown in fi«. 5.5 also allows us to determine thesign of the seebecK-coefflclent [24). Because a stable temperaturegradient could not be maintained along a blocK-Uke shaped piece ofYAG, due to the low conductivity, a thermo-puise led to the signof the Seebeck-coefflcient or thermo-electric power. This thermo-pulse was generated by blowing a stream of air on one face of thesample, while the direction of the change in the EMK was recorded.This change was attributed to a thermoelectric power superposingthe EMF. So it was possible to detect the sign of the predominantcharge carrier.
39

5.4.1 Electrodes and electrode-effects
In all solid state electrical measurements we used platinum elec-trodes because of their excellent M g h temperature stability inreducing CO/COg atmospheres as well as in oxidizing ambient. Itwas shown that Pt-electrodes have a low electrode-resistance anda high oxygen permeability [32,33].
Ve used painted (Demetron Pt-paste, usually fired 2 h at 1470 K)and sputtered Pt-electrodes (painted over with Pt-paste tocounteract a reduction of electrode area by evaporation). Impe-dance spectrometry is a very sensitive tool to check if theelectrodes are blocking or approximately ideal, particularlybecause the Solartron reaches frequencies as low as 10~4 Hz. Anideal impedance diagram with a distinct bulk-, grain boundary-and electrode effect is shown In fig. 5.6. The electrode arc isdue to the double layer capacity at the electrode-electrolyteinterface.
As a by-product of the Investigation of our samples two questionshave been be answered
1) how does the electrode preparation (painting or sputtering)influence the electrode resistance ?
2) how does an anneal at 1800-1900 K influence the electrode re- tsistance ? I
tReferring to question 1 we have to state that painted Pt-electro- 'des in many cases give rise to a wide arc in the complex lmpe- 'dance plane, while sputtered electrodes behave ideally as shown in \fig. 5. 6. i

1.21
Xo
0.60
0.00
0.00 0.85 1.70
T [10*5 OHM]
10.00
- 3.33
N
0.00
0.00 4.67 9.33
Z' [10'5 OHM]
14.00
I
5.6 Complex impedance plot for polycrystal1 me YAGshowing an obvious difference in the electrode be-haviour:top: painted Pt-electrodes, burnt 1470 Kbottom: sputtered Pt-electrodes(frequency range 1 MHz - 0.01 Hi).

Painted electrodes exhibit a wide frequency dispersion arc due toa high capacity (several hundred uF/cm2, fig. 5.6 top), whilesputtered ones cause no capacity at the interface (fig. 5. 6 bot-tom). SEM-plctures of a painted electrode show that the contact withthe electrolyte is rather bad (fig. 5. 7). The cavities act ascapacitors causing the observed electrode effect; the dc-resis-tance represents the sum of sample and electrode resistance.Sputtered Ft-electrodes behave ideal, which means that the dc-resistance is the sample resistance. Consequently direct currentconductivity measurements, which are often reported in litera-ture, can be used but have to be considered with caution.
ELECTRODE(Pt )
VOID ELECTROLYTE(YAG)
Fig. 5.7 SEM-picture showing the electrode-electrolyte inter-face after a conductivity measurement (about £0 h at1600 K m variable pO2's)
Concerning question Z we found a rather impressive dependence ofthe electrode resistance on the thermal history. A sputtered Pt

electrode (overpainted with a protective Pt-layer) was annealed2 h at 1300 K. The impedance spectrum given in fig. 5. 8 A elucidatesthat there is no electrode effect. Afterwards the electrodedsample was annealed for 15 minutes at about 1900 K in air (coolingrate about 100 K/min) and an impedance spectrum was recorded underthe same circumstances as before (fig. 5. 8 B). One wide low fre-quency dispersion-arc vs seen, from which a capacity of 1000 uF(!) for the electrode-electrolyte interface can be derived (elec-trode area smaller than 1 cm2); a well separated electroJyte-arcis no longer detectible. Next the electrodes were removed by acareful polishing procedure and new ones were sputtered; thenagain an impedance spectrum was recorded under the same conditionsAS before (see fig. 5. 6 C) - the difference between impedancespectrum B and C is substantial. The resistance of tne sample hasdrastically decreased by a factor of 15. Analyzing the positionof the frequencies revealed that the l kHz-impedance (a frequencywhere electrolyte impedance usually intersects the real-axis) hasnot changed, so the properties of the electrolyte did not changemarkedly while annealing the sample; consequently the phenomenonis due to a change of the electrode-electrolyte interface.
3ovte
N
10.00
6.67
4.67 9.33
Z' [10'S OHM)
14.00

k*Jta»* >.*•
2
N
10.00
6.67
— 3.33
0.000.00 4.67 9.33
Z* [10*5 OHM]
14.00
i
2O
N
10.00
6.67
— 3.33
0.000.00 4.67 9.33
Z' [10'5 OHM]
14.00
Fig. 5.8 A) Non-blocking sputtered Ft-electrode at 1300 K,sample as recejved
Bl The same sample annealed 15 nun at 1900 K in airmeasured at 1300 K
C) The same sample after the electrodes wererenewed by sputtering.
( n o t e t h a t t h e Z ' - a x i s h a s t h e s a m e s c a l e i n a l lt h r e e p l o t s )

This experiment Has clearly shown in which way disturbingelectrode-effects can influence a measurement. Again we have tostate that dc-data, particularly those obtained at very high tem-peratures (measurements on alumina were often performed at 1800 -1900 K, e.g. ref. [34.35] ) may be falsified by massive elec-trode effects.
LITERATURE
[I] B. Bogdanov, I. Comacov, J. I l j ev , Si l ikattechn. , H(1986) 224.
[2] M. F. Van, T. C. D. Huo, H. C. Ling, J. Electrochem. Soc. . LZJk(1987) 493.
[3] T. Takamori. L. D. David, Am. Ceram. Soc. Bull., ££ (1986)1282.
[4] G. Gowda, Ceramic Process Research Lab. MIT Res. Kept. R9(1986).
[5] G. de With, H. J. A. van D1JK, Mater. Res. Bull., 12. (1984)1669.
[6] G. de With. Philips J. Res., JL& (1987) 119.[7] L. Schuh, unpublished results.[8] G. Brouwer, Philips Res. Rept. , 2 (1954) 366.[9] F. A. Kroeger, "The Chemistry of Imperfect Crystals", North
Holland, Amsterdam, 1973.[10] V. van Gool, "Principles of Defect Chemistry of Crystalline
Solids", Academic Press,1963.[II] R. J. Brook in "Electrical Conduction in Ceramics and Glass",
ed. by N. M. Tall an, Marcel DekKer, Hew York, 1974.[12] D. V. Peters, L. F. Felnsteln. c. Peltzer, J. Chem Phys. , Jtf.
(1964) 2345.[13] R. J. Brook, J. Yee, F. A. Kroger, J. Am. Ceram. Soc., 5Jt
(1971 ) 444.[14] 0. T. ozkan, A. J. Moulson, Brit. J. Appl. Phys., £1 (1970)
983.[15] R. V. Blumenthal, M. A. seltz in "Electrical Conduction in
ceramics and Glasses" ed. by N. M. Tall en, Marcel Oekker, NewYork, 1974.
[16] H. Schmalzried, Z. Phys. Chem., Neue Folge, l£ (1963) 87.[17] K. Eltazawa, R. L. Coble, J. Am. Ceram. Soc. , 52 (1974) 245.[18] A. K. Jonscher, "Dielectric Relaxation in Solids", Chelsea
Dielectrics Press, London, 1983.[19] J. R. Macdonald, J. Chem. Phys., £1 (1974) 3977.[20] J. R. Macdonald (ed. ), "Impedance Spectrometry", J. Viley &
Sons, 1987.[21] J. Bauerle, J. Phys. Chem. Solids, 10. (1969) 2657.
45

f
I
[22] R. D. Armstrong, R. Mason, J. Electroanal. Chem. , 4J. (1973)231.
[23] R. Metselaar, P. K. Larsen, J. Phys. Chem. Solids, 32(1976) 599.
[24] R. R. Heikes in "Thermoelectricity", (ed. by R. R. Heikes andR.W. Ure), Interscience, New York, 1961.
[25] T. H. Etsell, S. N. Flengas, Chem. Rev., 7_fi (1970) 341.[27] c. T. Morse, J. Phys., El (1974) 657.[26] A. M. Hoefsloot, P. H. F. Tnljssen, R. Metselaar, Silicates
Ind. , î^Jk (1965) 35.[29] W. B. Hllllg, General Electric, Techn. Inform. Ser. , 65CRD152
(1985).[30] V. h. K. Lou, T. E. Mitchell, A.H. Heuer, J. Am. Ceram. Soc. ,
M (19B5) 49.[31] L. A. Oganesyan, V. Ya. Khaimov-Mal'kov, Sov. Phys. crystal logr.
2_5> (1960) 510.[32] R. N. Blumenthal, M. A. Seltz, "Electrical Conductivity in
Ceramics and Glasses", ed. by H. L. Ta)Jan, Marcel Dekker,1974.
[33] Da Yu Vang, A. S. Nowlck, J. Electrochem. Soc, 126 (1979)1156.
[34] S. K. Mohapatra, F. A. Kroger, J. Am. Ceram. Soc, M (1977)361.
[35] J. Sea Chen, F. A. Kroger, J. Mater. Sel., 2_G (1965) 3191.
46

/VSALXTICAL TEWWIWES >VSD RESULTS
ftI
6.1 ELEMENT ANALYSIS
The impurity and dopant content of all powders and sintered samp-les were analyzed by optical emission spectroscopy (OES) and X-ray fluorescence. For the samples doped by the immersion tech-nique (see section 5. l) the depth profile of the dopant concen-tration was determined by laser mlcroprobe analysis (LMA). Theresults of LMA showed that only a 200 ym thick surface layer washomogeneously doped, while the centre Is free of dopant. This re-sult makes clear that doping of preslntered porous samples byimmersing in a solution is not practicable (due to closed poro-sity). So electrical measurements were performed with samples madefrom doped powders.
Dopant or characteristic Impurity concentrations are given in thefollowing chapters together with the experimental results.
6.2 AUGER
The compositions of as-fired and fractured surfaces were inves-tigated by Auger scanning mlcroprobe (SAM). The analytical infor-mation depth was 0. 5-2. 0 nm. To get analytical data from deeperareas the sample was sputtered with Ar+ ions (2kV/624 pA car2)for 1 mln resulting in a sputter depth of approximately 8. 5 nm.
Ve analyzed surfaces of sintered YAG samples doped with 100 ppmCa fired at 2020 and 2070 K respectively. Experimental resultsindicate that a) Ca concentrates at the surface and b) thehigher the sinter temperature the lower is the ca-concentrationin the surface layer (see tab. 6. 1)

Tab. 6.} Auger analysis depth profile ofYAG: too Ca sinter eel at 2020 and 2070 K
Sinter-temperature
Ca-concentra-tlon in at. v-
surface 2020 E
idem sputtered*
7. 4
8. 5
surface 2070 K
idem sputtered*
1. 8
3. 0
# sputter depth = e. 5 nmMeasurements were performed at the analyticallaboratory at the Philips Lighting Division (CALL).
The Ca-concentration in fractured surfaces was investigatedby the same method. But due to the fact that YAG breaks trans-granular (fig. 6.1 ) no controlled Information about a segregatedfilm on the surface of the grains can be derived (an ultra highvacuum/high temperature fracture-setup was not disposable).Nevertheless we found fresh surface areas containing 1.5-2 at. xCa which reduces below the detection limit (0.5 at. x ) after sput-tering away a 8. 5 nm thick surface layer. This indicates that Casegregates forming an lntergranular film. That is in agreementwith our other experimental results.
48
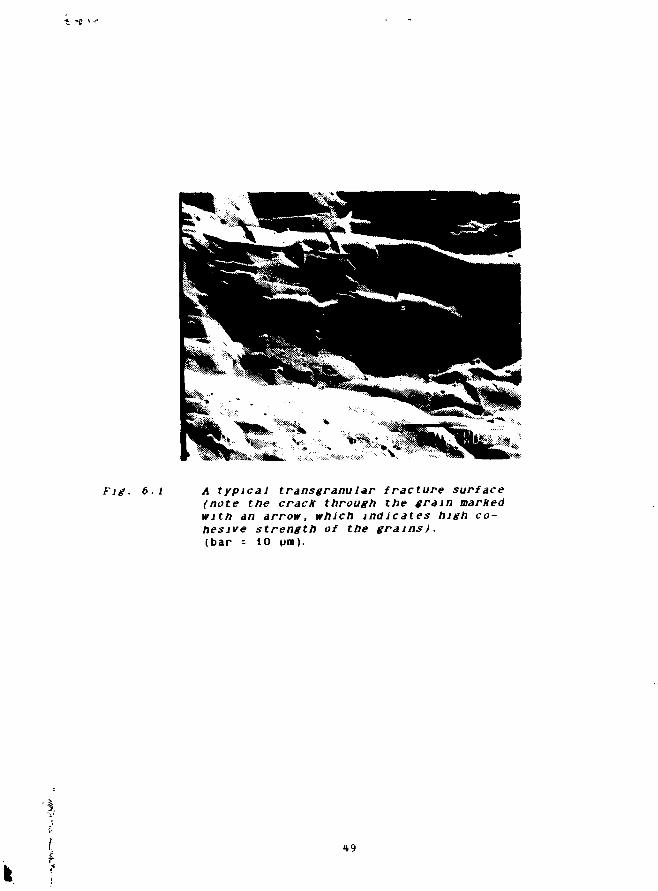
Fig. 6.1 A typical transgranular fracture surface(note the crack through the gram markedwith an arrow, which indicates high co-hesive strength of the grains/.(bar = 10 pm).

\. •'% Ml V -
7. Al RICH INCLUSIONS IN yA6
The first examinations of dense sintered YAG-powder revealedthat small spots (fig.7.1) are present where the Al-concentra-tion is higher than in the YAG-matrix. in spite of the fact thatthe powder was weighed out stoichlometrical ly. Mulder and deWith [1] investigated these inhomogeneitles, which are present involume fractions varying between 0. 5 and 15 x, by transmissionelectron microscopy. It was detected that the inclusions induce astrain in the garnet matrix (due to different thermal expansioncoef f IC lents ).
The diameter of the Inclusions in the samples we investigated(about 20 samples from different sources, doped with differentsinter-add I tives) ranged from 0. 5 to 1. 5 um.
Several attemps were made to prepare inclusion-free YAG cera-mics. It was assumed, that sintering in H2/H2O results in homo-geneous material [2]: however, although the concentration ofinclusions is lowered when compared with samples sintered invacuum, they are still present.
Fig. 7.1 Typical sphere-shaped Al2Oj-inclusions insintered YAG (bar- 1 urn), (with courtesy byPhilips Laboratories, Eindhoven)
50

One should have expected that the inclusions hinder the graingrowth by pinning the grain boundaries [3,4]. In La-doped yttrla[5] and in ferrltes (6) it has been shown that small (< l Mm),insoluble, well dispersed particles in a ceramic matrix controlgrain growth. Therefore it Is remarkable that YAG after the finalsintering exhibits an average grain size up to 5 urn.
Ve can resume that until now there is no clear and reproduciblestrategy to sinter YAG powders to single phase ceramic bodieswithout Al-rich inclusions.
In the frame of this thesis some questions concerning the inclu-sions were Investigated:
1) their chemical composition2) their shape or morphology3) their annealing stability
7.1 CHEMICAL COMPOS IT ION OF THE INCLUSIONS
In the literature the inclusions in sintered YAG are termed asAl-rich, without giving further information as to what these lnhomo-geneities consist of. To get an impression about their chemicalcomposition we looked for large inclusions to perform SEM-EDXanalysis without a disturbing x-ray emission from the surroundingYAG matrix. The resulting spectra show only Al to be present, theconcentration of Y in the inclusions is lower than the detectionlimit of the energy-dispersive analyzer (0.5-1"); a typicalspectrum is given in fig. 7. 2a together with the spectrum of thestolchlometric YAG, fig. 7.2b. In a few samples besides Al 0. 4 - lx Hg was detected.
Moreover, we tried to find out the crystallographic properties ofthe inclusions. To do so an inclusion-rich sample was crushed andan X-ray dlffractogram (XSD) was recorded, with a signal-to noiseratio as good as possible (by using a high-temperature dlffrac-tometer equipment -specially constructed for high resolution XRD-)The tl»ree most Intense reflections of a-alumlna could be iden-tified. So from EDX and XRD it could be elucidated that the Al-rlch inclusions consist of a-Al2O3.
51

Fig. 7.2 EDX-spectra of an inclusion (l.b) ana tlte 7A6matrix (la).
7.2 THE SHAPE OF THE AI-RICH INCLUSIONS
The inclusions can be observed on fractured or polished surfacesin the scanning electron microscope or in YAG-folls in the trans-mission electron microscope as dark structures (due to the highAl-content). Three characteristic shapes of alumina-inclusionscan be distinguished:
a) perfectly formed spheres with a diameter ranging from 0.5-1urn, in some cases up to l. 5 um; this homogeneously distributedform is the most abundant (fig. 7. 3a)
b) randomly formed or "cioudllke" Inclusions having an extension
5
1

• f •some urn with a certain orientation (fig. 7. 3b)showing the tendency to accumulate
and
>: I crystal 1 ite-l iice inclusions with well formed crystal faces,mostly having the shape of a block (fig. 7.3c).
The inclusions are located at the grain boundaries and in theinterior of the grains.
73 a
'•: . . . ''''."-''•$&&••'.
73b

73 c
7.3 The three typical shapes of Al-rich melusions insintered YAG7.3a spheres (barztoo um)7.3b "cloudlike" inclusions (bar-lOO pm)7.3c crystal 1ite-1 ike inclusions (taken from [1])
(bar-SO nm)
7. 3 THERMAL STABILITY Of THE INCLUSIONS
At the present moment it is not clear if A 1 2 O 3 segregates from thematrix at the sintering temperature or while the sample cools slowlydown.
A long time annealing experiment showed that the alumina inclu-sions are not drastically changed after a 200 h heat-treatment at1670 K in air. Checking a polished cross-section before and afterannealing showed alterations in the shape of the inclusions onlynear the sample surface, the interior of the sample stays complete-ly unchanged.
Fig. 7. * shows the detailed morphology of the inclusions near

•'0 ':., i :
t lie sample surface after a long time anneal. The inclusions havespread out and cover the grains. EDX analysis of the dark regionsrevealed that they are still Al-rich. but also a considerableconcentration of yttrium is detectible.
Until now it is in no way clear if and how the alumina-inclusionsimpair the properties of YAG as a high temperature material. Witha view to the slow alteration of the inclusions near the surfaced u n n g a long time high temperature treatment we have to take intoconsideration that also the defect chemical situation alters pro-gressively. The fact that the inclusions at the surface arealtered first may indicate that an evaporation process or aninfluence of the pO£ of the surrounding is causative.
l
r I
3 8. 16 Wt /•
61. 84 Wt •'•
Al : 47. 27 wt '•Y : 53. 73 wt /•
Fig. 7.t Al-nch inc lus ions near the surface have spreadout due to an anneal ing for 200 h at 1670 K;the compos it ton of different spots is given.
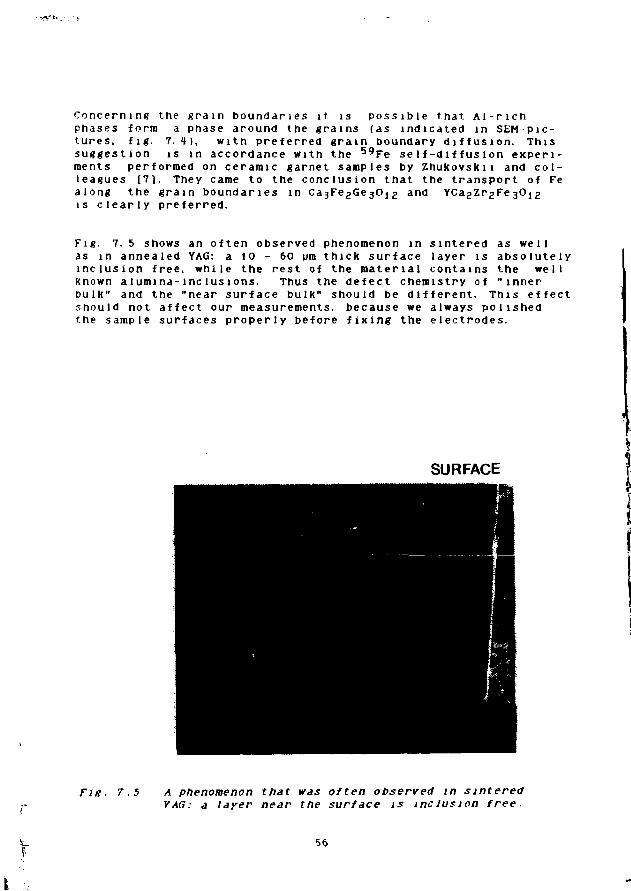
• • X V ' * ' . - . •
Concerning the grain boundaries it is possible that A i - n c hphases form a phase around the grains (as indicated in SEM-pic-t.ures, fig. 7.4), with preferred grain boundary diffusion. Thissuggestion is in accordance with the 5 9 F e se If-diffus ion experi-ments performed on ceramic garnet samples by Zhukovskii and col-leagues [71. They came to the conclusion that the transport of Fealong the grain boundaries in C a 3 F e 2 G e 3 O 1 2 and Y C a 2 Z r 2 F e 3 0 1 2
is clearly preferred.
Fig. 7.5 shows an often observed phenomenon in sintered as wellas in annealed YAG: a 10 - 60 urn thick surface layer is absolutelyinclusion free, while the rest of the material contains the wellKnown alumina-inclusions. Thus the defect chemistry of "innerDulR" and the "near surface bulK" should be different. This effectshould not affect our measurements, because we always polishedthe sample surfaces properly before fixing the electrodes.
SURFACE
Fig. 7.5 A phenomenon that was often observed m sinteredYAG: d layer near the surface is inclusion free.

v -v
LITERATURE
[l] c. A. M. Mulder, G. de With, Solid state Ionics, 14(1965) 81.
[2] F. J. c. Toolenaar, G. de With, Proc. Brit. Ceram. Soc. H(1966) 241.
[3] G. de With, Philips J. Res. ££. (1987) 119.[4] M. P. Harmer, H. H. Chan, D. M. Smyth, Mat. Res. Soc. Symp.
Proc. , M (1987) 135.[5] V. H. Rhodes, J. Am. Ceram. Soc. , bJL (1981) 13.[6] M. F. Yan, D. V. Johnson Jr., Hater. Sci. Res. , H (1978)
393.[7] V. M. Zhukovskll, T, G. Veselovskaya, A. s. ZhuKovskaya, A. Ya.
Helman, Russ. J. Phys. Chem. , ££ (1961) 145.
57

8 GRAIN BOUNDARIES IN TAG INVESTIGATED BT TEM
In polycrystalline materials boundaries between the grains domi-nate many of the technologically important properties. For ex-ample, the electrical properties of semiconductors [1] and cera-mics [2] are strongly Influenced by lntergranular interfaces. Alsothe high temperature loss In strength of silicon nitride, for in-stance, has been attributed to the presence of a thin lntergra-nular glassy film. Creep, sintering and corrosion are generallydominated by the presence of grain boundaries.
The resistance to corrosion from alkali metals is an lnportantproperty to examine for further application of YAG ceramics.Claims and Hurle [3] reported a corrosion rate of 16 urn per yearfor liquid lithium corrosion at 648 E. Under the same condi-tions alumina has a corrosion rate of 12 mm per year. To confirmcorrosion resistance de with and coworkers [4] immersed YAG cera-mics in Na In a Mo-contalner for 300 h at 1170 K and investigatedthe samples afterwards by SEM/EDX. YAG doped with S1O2 had acorrosion layer of only 3 pm. YAG doped with HgO exhibited verysimilar results. In contrast, CaO-doped YAG has a much lowerresistance against the attack of hot sodium vapour [5]. De With andcoworkers have shown by TEH that S102 as well at HgO have notendency to form segregation layers at the grain boundaries in thematerial they tested [6].
We performed TEH studies on Ca-doped YAG in order to see whetheror not there is a difference between the grain boundary structurein the CaO-doped material and the HgO-doped material tested by deWith and coworkers. [6]. A marked segregation layer at the grain (
boundaries of CaO-contalnlng YAG could explain the poor corrosion iresistance of that material. •
8,1 EXPERIMENTAL
For observations in the transmission electron microscope (TEH) thespecimen must be transparent for electrons; so sample-foils haveto be prepared. YAG discs, 3 mm in diameter* and some tenths of amm thick were obtained from the bulk material. The samples werethinned with the aid of a dimple grinder. A subsequent ion-mil lingprocedure (GATAN dual lcn mill model 6000) with Ar-lons (3 KV, io«angle of incidence) was carried out until perforation occurred. TheTEH investigation was done with a JEOL JEH 2000 FX transmissionelectron microscope working at 200 kV. The study was done with YAGdoped with 500 ppm CaO.

" • « • • • . 1
8 2 RESULTS AND DISCUSS K M
Fig. 6.1 shows the boundaries between three grains, which arevisible as almost straight bright lines. The angle between theboundaries is 120 •. No segregated phase at the triple points isdetectible. If the plane of the interfaces is not preciselyparallel to the incident electron beam (inclined boundary),so-called thickness fringes are observed at the grain boundaries.In such a case structures may be observed at "clean" boundaries,which appear similar to real segregated phases [7]. In order tocheck if real second phases are present in YAG: 500 ca two grainswere adjusted so that Moire-fringes were seen in both grains.This situation is shown in fig. 8. 2 (due to the photo-mechanicallycopying procedure the fringes in the upper grain are hardly visible).In fig. 8. 2 a distinct intergranular phase about 2 nm thick is seen.This thickness determined by TEM is comparable with the values ob-tained by impedance spectrometry (4-7 nm), see section 9.
59

Fig. 8.1 A triple point in YAG: 500 Ca. no triple point phaseis present .

Fig. Moire-fringes m two adjacent grains. An intergranuiarsegregation phase is clearly visible. The upper rightpart of the picture shows amorphisat ion due to ion-milling.
61

8.3 TEM STUDIES OF XAC DESCRIBED IN LITERATURE
In spite of the fact that YAG has gained technologically impor-tance in recent years, only very -few TEM-studies on singlecrystals are available. As already mentioned Mulder and de With[6] investigated grain boundaries in polycrystal1ine YAG. Theyfound no segregation of second phases at the grain boundaries inYAG doped with 500 wt. ppm MgO. Our experimental results show thatin Ca-doped YAG a segregation takes place.Zakharov and colleagues [8] present more fundamental highresolution many-beam images of YAG. They give experimental andcalculated density distributions of lattice images up to a resolu-tion of 0. 4 nm. Ashbee and Thomas [9) in an early TEM-study from1966 investigated dislocations and twinning phenomena in YAGcrystals.
LITERATURE
[1] C. R. M. Grovener, J. Phys. C: Solir! State Phys. , 2J_ (1965)4097.
[Z] L. M. Levinson (ed. ), Adv. Ceram. , i (1985) 127.[3] E. J. Claims, R. A. Hurie, J. Electrochem. Soc. , 121. (1974), 3[4] G. de With, P. J. Vrught. A. J. H. van de Ven, J. Mater. Sci. , 20.,
(1985), 1215.[5] unpublished[6] C. A. M. Mulder, G. de With, Solid State Ionics, 16 (1985)
81.[7) D. R. Clarke. Uitramicroscopy, 4. (1979) 33.T8] N. D. Zakharov, W. Neumann, R. Hillebrandt, V. H. RoshansKn,
Phys. Status Solidi (a), 15. (1979) 573.[9] K. H. G. Ashbee, G. Thomas, J. Appl. Phys., 12 (1968) 3778.

9 MICROSTRDCTURE AND MICROSTRUCTURAL CHANGESINVESTIGATED hi
AC DISPERSIVE MEASUREMENTS
The main feature of this chapter is the microstructure of YAG-ce-ramics investigated by impedance spectroscopy. The followingtopics are treated:
1. Second phase segregation and grain boundary thickness indoped YAG samples
2. Temperature dependence of grain boundary - and bulk conduc-tivity
3. Changes of grain boundaries caused by a long time anneal
4. Changes of the grain boundaries caused by quenching.
9.1 INTRODUCTION
Impedance spectroscopy has proved to be a useful technique inthe investigation of the microstructure and microstructuralchanges of composite materials having grains,pores, grain bounda-ries, segregated and dispersed phases. Interesting systems fromthe scientific point of view are for instance the ordered preci-pitate phases (Suzuki-phases, HaCl/CdCl2) [1,2]. However, highlyion-conductive oxides are investigated to a much greater extentbecause of their technological importance. Host work has concen-trated around zirconia (e.g. ref. 3), ceria [4,5] and B-alumina[6,7]. A good introduction into the topic of impedance spectro-scopy gives the book "Impedance Spectroscopy" edited by J. R.Hacdonald [15].
Bauerle [6], in his pioneering work, studied high purity and 'im-pure' polycrystalline zirconia. For this distinct ion-conductorhe found that the presence of a second phase at the grain bounda-ries led to the introduction of a second time constant into theequivalent circuit, which was absent in high purity material.Bauerle interpreted his results in terms of a low conductivitysecond phase introducing a constriction in the area of contactbetween the grains. The so-called Bauerle equivalent circuit isgiven in fig. 9. 1 (B).
63

GRAIN ELECTRODE
Fig. 9.1 (A) Schematic diagram of a complex impedance plotshowing arcs due to three processes. The arrow indi-cates the direction of increasing frequency.(B) The equivalent circuit that gives rise to thethree arcs in (A) [Bauerle circuit).
Bauerle also made clear that the activation energy for the bulk-and the grain boundary conduction can give information about themicrostructure of a poiycrystalline ion-conductor. If these ener-gies are different two different conduction processes in the bulkand in the grain boundaries are responsible for electrical trans-port. In this case there are no direct grain-grain contacts;grains are are covered with a continous film.If both energies are identical, the same process should be respon-sible for the electrical transport in the bulk and across the grainboundaries; then the intergranular film is discontinuous and theconduction runs via "easy paths".
TEM observations [9] confirmed the idea of the easy-path model inzlrconia by showing that grains are not continuously 'wrapped' in asecond phase of constant thickness. So an easy path conductivityvia direct grain-grain contact points is possible.
In a recent study El Adham and Hammou [5] showed for a singlegrain boundary in a bicrystal of Ca-doped ceria that the idea of
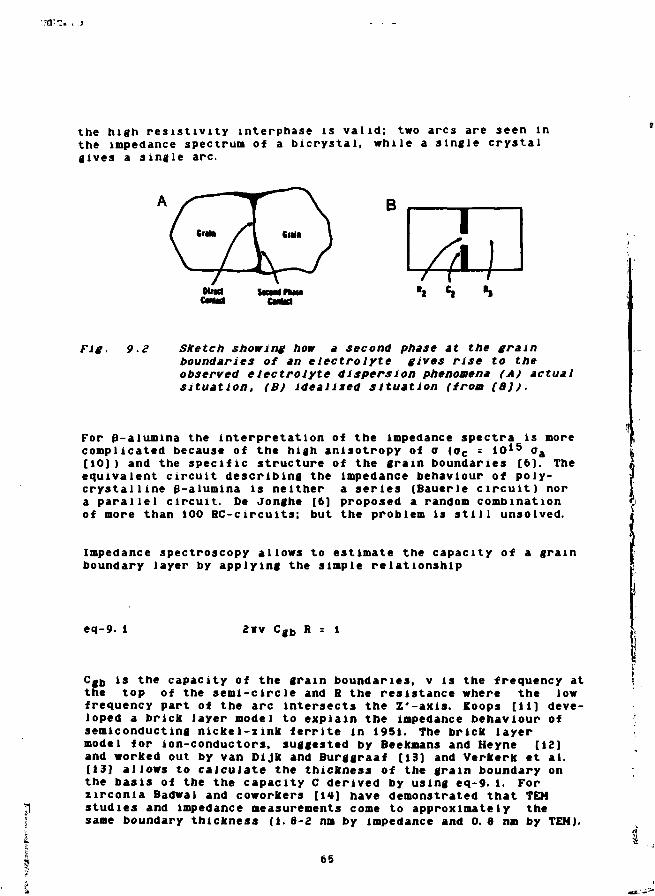
the high resistivity interphase is valid; two arcs are seen inthe impedance spectrum of a bicrystal, while a single crystalgives a single arc.
B
Fig. 9.2 Sketch showing how a second phase at the grainboundaries of an electrolyte gives rise to theobserved electrolyte dispersion phenomena (A) actualsituation, (B) idealized situation (from (B)).
For 0-alumina the interpretation of the impedance spectra is morecomplicated because of the high anisotropy of o* (o~c - 1O15 aa[10]) and the specific structure of the grain boundaries [6). Theequivalent circuit describing the impedance behaviour of poly-crystalline p-alumina is neither a series (Bauerle c ircui t ) nora parallel circuit. De Jonghe [6] proposed a random combinationof more than 100 RC-circuits; but the problem is s t i l l unsolved.
Impedance spectroscopy allows to estimate the capacity of a grainboundary layer by applying the simple relationship
eq-9. 1 2nv Cgb R =
Cgb is the capacity of the grain boundaries, v is the frequency atthe top of the semi-circle and R the resistance where the lowfrequency part of the arc intersects the Z'-axls. Koops [11] deve-loped a brick layer model to explain the impedance behaviour ofsemiconducting nickel-zink ferrite in 1951. The brick layermodel for ion-conductors, suggested by Beekmans and Heyne [12]and worked out by van Dijk and Burggraaf [13] and Verkerk et al.[13] allows to calculate the thickness of the grain boundary onthe basis of the the capacity C derived by using eq-9. 1. Forzirconia Badwal and coworkers [14] have demonstrated that TENstudies and impedance measurements come to approximately thesame boundary thickness (1.8-2 nm by impedance and 0. 8 no by TEN).
65

•TO1':. ,
Before the experiments with polycrystal1ine YAG will be describedand discussed, we have to point out that YAG is not directly com-parable to the ceramic materials mentioned above. Zirconia, ceria,p-alumlna are excellent ion-conductors - already at low temperatu-re (300 - 700 K). YAG on the contrary is a highly Insulating ma-terial up to very high temperatures - so we had to perform impe-dance measurements between 1200 and 1670 K, where the chance ofdisturbing temperature effects has to be taken into conside-ration. In the literature nothing can be found about measurementof the frequency dispersion under such conditions.
9.2 AC-DISPERSIVE DETECTION Or GRAIN BOMSDART PHASES
IN r AC-CERAMICS
In this section we describe some characteristics of the grainboundaries in differently doped YAG samples (capacity andthickness of intergranular phases in doped YAG and theirdependence on the dopant).
For AI2O3 a lot of work concerning grain boundaries has beenperformed in the past - especially for Ca- and Hg-doped materialin relation to the fracture properties of the ceramics. Ca has ahigh tendency to segregate in alumina, and the material tends tobreak intergranular when Ca is present [16,17]. Auger analysesof fractured surfaces in alumina are given e. g. In ref. [18-21].For Ca in alumina all investigators come to the conclusion that astrong segregation even at low doping levels takes place duringsintering. Cook and Schrott [20] in their recent study found thegrains continuously covered with a Ca-film on a lateral scaleof 10 nm (for A122O3 + 200 ppm Ca). For Hg such a strongsegregation effect was not observed in alumina.
9.2.1 Experiments and discussion
The following three samples were investigated : .L_ YAG dopedwith 100 ppm Ca (YAG: 100 Ca), £̂ _ YAG doped with 500 ppm Ca
66

(YAG: 500 Ca), and i_ YAG doped with 50 ppm Zr (YAG: 50 Zr).Fig. 9- 3 shows the impedance behaviour for both Ca-doped samples,Ca 100 and Ca 500, recorded at 1800 and 870 K respectively.Distinct, well established arcs are seen, which can be attributedto bulk- and grain boundary effects according to frequency dis-persion theory. From the intersection of the arcs with the realaxis the resistances of the grain interior and the grain bound-aries can be derived, provided the electrical equivalent circuitmodelling the frequency dispersion is known. As will be shownlater by a nonlinear least-squares fit procedure the Bauerle cir-cuit is suitable to describe the behaviour of the samples. Refer-ring to fig.9.1 A we use the following relations: Rb = S23, RBb-B12 ~ R2 3 * n d cgb : l/2nv(R12-Rgj) with Rg and R>t> denoting thegrain- and grain boundary resistance. The activation energies forgrain- and grain boundary conductivity differ significantly (seesect. 9.4), so the grains should be covered by a continuously film.
- 3.50
It 1.75
Ni 0.00
2aso
0.00 1.7 5 3.50
Z* [10*4 OHM]
0 25 50
V [10*4 OHM]
Fig. 9.3 Complex impedance diagrams of (A) YAG: 100 Ca (at 1170t) and (B) YAO: 500 Ca (at 870 K).Both samples were sintered at 2070 K, the spectra wererecorded in O^ (frequency: 0.01 Hi - 1 MHz).
Analyses of several Z'-Z" plots of both samples led to theaverage capacitance of the grain boundaries: YAG: 100 Ca s 2200 -3500PF and YAG: 500 Ca = 240 -300 pF (checked at 5 different tempera-tures). From SEN pictures the averaged grain sizes for both samples
67

were derived to be about 1 pm. Applying the brick layer model thethickness of the intergranular layer can be estimated by
eq-9. 2(L/A)
dgb is the thickness of the grain boundary, €gb denotes the per-mittivity and Cgb the capacity of the grain boundary (€8b is setequal 5). A and L are area of the electrode and the thickness ofthe sample respectively and d = d'»0. 807 where d' is the averagegrain size for a sphere shaped grain (lpm) [22). In a real soliddgb and d' are randomly distributed. For the sake of simplicitywe take average quantities. Vernicke [23], by computer simulation,has shown that such a simple 'brick layer' model is reasonable de-scriptive of ceramic mlcrostructures. The result of such a cal-culation is given in tab. 9.1
Tab. 9.1 Results of a brick layer calculation tor YAS: 100
Ca and YAS: SOO Ca based on complex impedance spectra.
SAMPLE DOPING LEVEL d'[pm] Cgb" [pF] dgb [nm]
YAG: 100 Ca 100 ppm Ca 1 3000 0. 4 - 0. 6
YAG: 500 Ca 500 ppm Ca 1 270 4 - 7* Cgb is averaged over 10 measurements at slightly
different temperatures.
Tab. 9.1 clearly shows that the thickness of the grain boundarylayer increases with increasing Ca-level. By TEH investigationswe performed on YAG: 500 Ca evidence of intergranular phasesbeing 2-3 nm thick was found (see fig. 8.2). This thickness is ina good agreement with Impedance data.
Zr is known to have a quite good solubility in YAG. Consequentlyless segregation should occur in YAG: Zr. The sample we investiga-ted contained 50 ppm Zr. Fig. 9.4 gives a Z'-Z" plot showing a
68

single bulk arc with the high frequency branch intersecting thereal axis at zero resistance. The absence of a space chargepolarisation at the grain boundaries indicates that no mtergra-nular film came into existance.
_ 2.10
Xo
1.0 5
N0.00
0.00 1.05 2.10
Z* [10*6 OHM]
Fig. 9.4 Complex impedance diagram of YAS: Zr 50 recorded at1450 K in 02.
The equivalent circuit representing the impedance behaviour shownin fig. 9.4 is a single BC parallel circuit, from which a capacityof 5-25 pF (the geometrical capacity) can be derived. For the sam-ple geometry with an electrode diameter of 6«10~3 m and a samplethickness of 0. 7»1O"3 m a dielectric constant CyAG °* about 40can be calculated for the temperature of measurement (CYAG' 1 1*- >:
12)
Relying on Impedance data we conclude that the poorly solubledopant Ca forms an lntergranular phase, even at concentrations aslow as 100 ppm. The thickness of the film increases with increa-sing doping level. Additives with a good solubility, such as Zr donot form detectible lnterphases. Z'-Z'' plots of such materialgives a single bulk arc, as for a single crystal. The experimentaldata are interpreted in terms of a Bauerle circuit.
69

9 3 NON-LINEAR LEAST-SOI/ARCS FIT (NLLSr) OF IMPEDANCE DATA
In order to prove our proposed equivalent circuit model expe-rimental data were analysed by a NLLSF procedure in the 3-di-mensional Z'-Z''-frequency space. Rleitz and Kennedy have deve-loped a special computer program for fitting two depressed inter-ferring semi-circles in the impedance plane [25]. Tsai and Vhit-more [86] have described a procedure for fitting a specific equi-valent circuit to immittance data. Macdonald and Schoonman [27,26] have demonstrated the power of a more general NLLSF program.The NLLSF procedure we applied here was worked out by B. Boufcampfrom the University Twente (Enschede, The Netherlands) [29].
The equivalent circuit shown in fig. 9. 5 was chosen to berepresentative for the impedance behaviour measured in YAG: 500Ca.
CPE 1 1
Bcb
IcPE 2
CPE 3
Fig. 9.5
Y (CPE) = ( iu )
The equivalent circuit to which experimental data werefitted in a NLLS procedure (CPE=constant phase element).
The parameters are given in tab. 9.2
Fig. 9. 6 gives the experimental frequency dispersion data in a 3-D representation (Z' vs. Z " vs. freq. ) together with theprojections on the three planes (Z'-Z", Z'-freq. and Z"-freq. )showing 64 measured and calculated points. The experimental andcalculated data are in a quite good coincidence. The 'chi-square'factor, representing the quality of the fit of experimental data tothe equivalent circuit, is as small as 5.16*10~5, meaning that thefit is very good.
70

expe
rim
ent
o
• i i
calc
ulat
ion
t
• e
•
1 i i i
* * -
&
_
-
-
-
| i
. i
i
i 1 i i i i
U1
o
NI
o*—I
inO
tnO
Experimental (o) and calculated (x) Z " vs. Z' plot
71

•'<v. *>•.-•. • •
o
°o
N
A 1
%
9
-1 llllll
1 1
II
z
1 1
* 9
9
I I I I I
•
a-
<
1
X
calcu
lated
c
experim
ent
1 1
1 1
9
$
. . . . . ,
11
, . .
1 1
*
*
1 •
f\
J
4i4444144
4
;
t
LF
•
. I .
O
Experimental (o) and calculated (x) Z' vs. freq. plot
72
I:

freq.
Fig. 9.6 Three dimensional representation of complex impe-dance measurement (sample YAS: 500 Ca.the same spec-trum as fig. 9.3(B)) together with the three projec-tions on the planes Z" vs. Z', Z' vs. freq. andZ'' vs. freq.. The open circles (o) are experimentaland the cross bars (*) are calculated data.
(frequency-range: 1 MHi - 0.01 Hx).
Tab. 9-2 Circuit-parameters - calculated by NLLSF and obtainedby graphical estimation from the Z"-Z'-plot
NLLS-FIT ESTIMATED GRAPHICALLY
BULK-RESISTANCE 37. 5 KQ
CPE (Yo i n "mho") Y 0 = l . 7 2 5 " 1 1 , n = O. 9065
G6-RFSISTANCE 380. 3 KQ
CPE (Yo in "mho") Y 0 = 4. 293"10, n = 0. 9C04
37. 9 KQ
361. 5 KQ
The Constant Phase Element (CPE) is characterized byY(w)=Y0(jw)
n; if n=l the CPE is a pure capacity.
73

Based on above considerations the proposed model of the equi-valent circuit representing bulk and grain boundary effects isassumed to be valid. The experimental points are simulated withsmall error by the circuit shown in fig. 9.5. The above result istaken as representative for the other samples which were inves-tigated.
9.4 TEMPERATURE DEPENDENCE OF GRAIN BOUNDARY
AND BULK CONDUCTIVITY
Bauerle [6] was the first to suggest that a temperature depen-dence of the grain boundary and bulk conductivity is lnterpret-able in terms of microstructural characteristics. He Introduced Jthe easy-path model to explain the very similar activation Senergies E a for grain boundary (Ea(gb) and bulk conductivity j(Ea(b)in zirconia. This was briefly discussed In section 9.1. {Measurements were carried out to investigate Ea(gb) and Ea(b) inYAG. ,
9.4.1 Experiments and discussion
The temperature dependence of 9 was measured for YAG: 100 Ca be-tween 1030 and 1660 K In oxygen and a CO/COg mixture maintaining apO2 = 10~9 pa (the T-dependence of pO2 in a CO/COg-mlxture wastaken into consideration). Analyzing the Z'-Z"-plots graphicallygave the temperature dependence of a as shown in fig. 9. 7. Fromthe defect model the electrical conduction at pOg = to5 Pa has tobe attributed to hole conductivity, while mixed Ionic-electronicconductivity dominates at low pOg.
The E a of the grain boundary conductivity is 17x larger than Ea
of the bulk conductivity, which is a representative result forCa-doped YAG samples. Bonanos, Steele and colleagues in ref. [3]report for tetragonal zirconia (ZrOg: 3 mol* YgO3) an activationenergy E a of 0. 92 and 1. 09 eV for the bulk and the grain bounda-
74

V -VaWI >r
ries respectively (note the difference of about 10*). Partiallystabilized zirconia (ZrO2: 6 moix Y 2O 3) exhibits nearly the sameEa's 1.07 and 1.12 eV, as expected for non-discrete grain boundaryphases. The different structure of the lntergranular lnterphasesin tetragonal and partially stabilized zirconia was confirmed byTEH [9).
0.00
I-2.50
-5.00
0.50 0.60 0.70 0.80 0.90 1.00
1000 K/T
Fig. 9.7 Arrhenius plots of the grain interior and grainboundary conductivities for YAG: Ca 100.
Tab. 9. 3 gives more activation energies for the grain boundary andbulK conductivies in YAG-samples.
Relying on the brick layer and the easy path model it can be con-cluded from above conductivity data that the grains in Ca-dopedYAG ceramics are covered by a continuous lntergranular film.
75
I

Tab. 9.3 Activation energies for the gb and bconductivity for several YAG samples.
Dopantconcentration
Ca 40 ppm*Ca 25 ppm*undoped #
Ca 100 ppm*Ca 100 ppm*
Ca 500 Ca*
E a teV)grain boundary
3. 003. 003. 25
2. 472. 35
2. 07
E a teV]bulk
1. 781. 8a. 7
2. 151. 99
1. 07
Prepared from a powder with a relativelyhigh impurity content (Mg.Na); samples made byM. M. Dedding at PHILIPS LIGHTING DIVISION
Prepared by L. v. Ijzendoorn from source-powders as pure as possible at PHILIPSLIGHTING DIVISION
9.5 A 840 HOURS >VfiEAL EXPERIMENT
YAG as Na-lamp envelope or as another high temperature materialundergoes thermal cycling (e.g. switching a lamp on and off). Weused Ca-doped YAG to investigate two basic processes: long-time annealing at high temperature and quenching from hightemperature (see following section). By means of conductivity andimpedance measurements alterations In the grain boundary behaviourwere detected, revealing that polycrystal1ine YAG undergoeschanges on the long time scale at temperatures between 15701670 K. A long-time high temperature annealing experiment wasperformed in order to get an Impression how the electrical beha-viour of YAG is altered within the first 200-300 hours. Calciumis expected to segregate at the grain boundaries. An alterationof the gb-phase is detectible by Impedance spectroscopy. Ca isconsidered as a sort of 'model marker' elucidating that segrega-tion at a certain temperature occurs. Moreover a change indefect chemical parameters is followed by recording o-gu and obas f(pOg) simultaneously. To our Knowledge such a determinationof the pOg-dependence of Og^ was performed the first time.

» f
95. 1 Experiments and discussion
Ve used a sample with a small fraction of Al-rich inclusions(0.1-0.5 vol. z) doped with about 100 ppm Ca. The starting powdercontained a small surplus of yttrium, which resulted in a decreaseof the content of alumina-inclusions. This material is denoted bythe abbreviation YAG: Ca(Y).
The pOg-dependence of o for YAG: Ca(Y) was measured for the as re-ceived sample (fig. 9. 6, curve I), o changes with a pO2
3/16-depen-dence, which is consistent with our defect model which will bedeveloped later. Two complex impedance plots at high and at lowpO2 shown in fig. 9. 9 indicate a gb-conductivity that is in-dependent of oxygen pressure.
a -3
-4
-5-12 -6 0 6
1* PO2 (Pa)
Fig. 9.8 "total as f(POe) for YAG: Ca(Y) as received (I)ami after annealing 240 h at 1670 K (II).
77

1.50
0.75
0.00
0.00 0.75 l.SO 2.25 3.00
V [104Q]
V [105Q]
Fig. 9.9 Z'-Z" plots of the sample "as received' recorded atpO2-l0
5 Pa (I) and pOs=10~10 Pa (II).
Afterwards the electrodes were removed and the sample was an-nealed 3*0 hours at 1670 K in air. The pOg-dependence of the con-ductivity was determined again (see fig. 9. 8. curve II). The curveis now flat and uncharacteristic and not interpretable by clas-sical defect chemistry for a homogeneous sample. Fig. 9. 10 givesimpedance spectra recorded at a low (1O"10 Pa) and a high oxye*npressure (10s Pa). Now crgb has an obvious oxygen pressuredependence. By analysing the whole set of Z'-Z" plots the pOe
dependence of vgb and ob were separated. Fig. 9. 11 givesthe whole plot obtained for an annealed sample. The 3/16-slope°* "bulk i s again measured, so the defect chemistry of the graininterior is not altered. For the grain boundaries a distinct n-type conduction behaviour was detected. Ve assume that a Ca-alumlnate has formed at the lntergrahular interface, because Cais already enriched at the boundaries and Al, which Is more mobilein YAG than Y, can diffuse to form such a compound. Electricalmeasurements published* by Hetselaar and Hoefsloot [30] reveal thatfor instance unintentionally doped CaAl2O4 shows extrinsic n-typebehaviour. For the activation energy for n-type conduction in Ca-
78
I. I
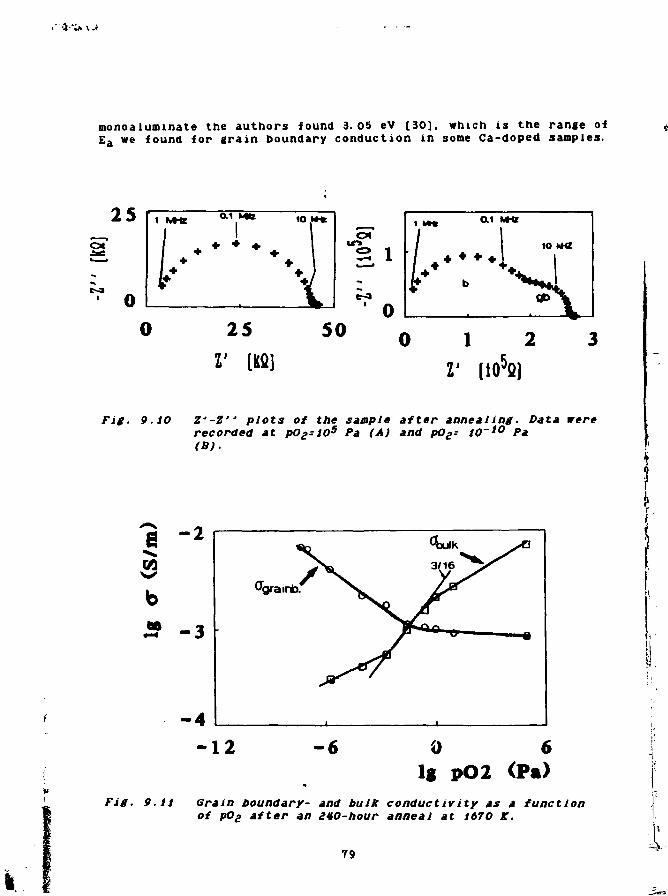
monoaluminate the authors found 3.05 eV [30], which is the range ofEa we found for train boundary conduction in some Ca-doped samples.
0.1 MHZ
1O hHZ
Fig. 9.10 Z'-2" plots of the sample after annealing. Data wererecorded at pO£:l0
5 Pa (A) and pOs: 10~w Pa(B).
a -2
-4-12 -6
lg pO2 <Pft)
Fig. 9.11 Grain boundary- and bulk conductivity as a functionof pOg after an 240-hour anneal at 1670 K.
79

1
Analysing the Z'-Z"-plots by applying the brick layer model anaveraged thickness of the grain boundaries was estimated (see tab.9.4). The fact that grain boundaries were found to be thicker inannealed material supports the suggestion that an intergranularlayer is gradually formed at annealing temperatures considerablybelow the sintering temperature.
Tab. 9.4 Grain boundary thickness dgb before and after an-nealing YAG:Y:Ca estimated from Z'-Z" plots.
Capacity before anneal* i»io~' F (1000 pF)(sample as sintered)
Capacity after anneal* e»io~11 F <60 PF>(240 h, 1670 K)
dgb (before anneal)" s l nm
dgb (after anneal)* s 11 nm
# averaged * estimated by the brick layer model.
The brick-layer model gives only a very rough estimation of thelayer thickness, but the result shows clearly that a segregationtook place. Own TEM observations reveal that boundary layers ofabout 2-3 nm are present in sintered YAG: 500 Ca (see section 8).Ve have to bear in mind that electron-optical and ac-dispersivetechniques detect a boundary thickness on the basis of dif-ferent properties of the matter.
Remark: Several papers giving dc- or single frequency ac conduc-tivity data of polycrystal1ine alumina etc. have been published inthe past. The experiments were often performed at high tempera-tures (up to 1870 K) with long equilibration times. The interpre-tation of conductivity-data on the basis of classical defectchemistry underlying single phase material often failed; flat avs. pOg-curves were lnterpretated as Ionic conductivity. Hot onesingle case is known to us where the pOg-dependence of ffgb wasdetermined over a wide regime.
80

i •H: «* \ **
PRORERTIES OF TAB CERAMIC QUENCHED fROM 2O2O K
TO ROOM TEMPERATURE
Steele and coworKera [31] recently described a novel approach todecreasing the grain boundary resistivity in yttrla-zirconia ce-ramics by a modification of the firing cycle. The authors prepa-red two sorts of zirconla samples - one sort quenched from sin-tering temperature (1770 E) and the other slowly cooled down with5 K/min. Impedance spectra revealed that the cooling rate doesnot affect the bulk resistivity.
In contrast, the resistivity of the grain boundary region has beendecreased by quenching the pellets (fig. 9.12). This effect ismost marked in less pure yttria samples. TEM-microanalysls of thegrain boundary phase, in all cases glasses in the system Si-Al-Y-O,showed that there is a variation in composition with cooling rate.The authors [31] expect for quenched samples that there is a hightemperature grain boundary structure preserved, whereas in theslowly cooled samples some equilibration of the structure may beanticipated during cooling until the atomic diffusion rate: becometoo slow.
so 100 ISO 200pM knot)
Fig. 9.12 {A) A.c. impedance plot from Y-stabiUsed sirconiafired at 1770 K and cooled at 5 X/min
IB) impedance plot for a similar sample quenchedfrom 1770 K (from [31].
61
I.
The following experiment describes how the impedance propertiesof the grain boundaries and the bulK depend upon the cooling ratein YAG ceramics.
9.6.t Experiments and discussion
Quenching experiments were performed with two different samples )containing ca as dominanat impurity: sample I with 100 ppm camade by the Philips Lighting Division (sintered 2 h at 2070 K inH2/H2O) and sample II with 60 ppm Ca prepared by the Philips Re-search Laboratories (sintered 4 h at 2020 K in vacuum). Both sam-ples were cooled down from the sintering temperature at a rate of2 K/min.
Impedance spectra (fig. 9. 13) of samples I and II were recordedafter annealing 2 h at 1970 K in air and cooling them slowly(2 K/min). Afterwards the electrodes were removed and the sampleswere annealed at 1970 K in air: sample I for IS and sample II for120 minutes. Quenching was done by pulling the pellets out of thefurnace; no thermo-shock cracking was observed. The YAG showeda red-brown colour after the quenching treatment, because colourcentres were formed, presumably holes trapped on oxygen ions nearthe acceptor centres (see chapter 4).
Fig. 9. 13 gives the Z'-Z" plots of the as received and thequenched samples I and II.

Wo. \J>
4.95
ECO 3.30
©- 165
N 0.00
slowly cooled + +
quenched
0.00 2.25 4.50 6.75 9.00
T [10'S OHM]
\
NI
1.25
0.63
0.000.00 1.25 * 2.50
T [10*5 OHM]
Fig. 9.S3 (A) Complex impedance plot of sample 1(100 ppm Ca)at toao K and
(B) sample IJ (60 ppm Ca) at I ISO Kfor the as received and the quenched sample in
83

x ->
The cooling rate has a dramatic influence on the totalresistance t?tot oi t n e samples; in quenched YAG Rtot i s about 4times smaller than in a slowly cooled material. Grain boundaryas well as grain interior loose resistance to a comparabledegree; in contradiction to the result found in ref. [31],where the authors stated that a^ does not depend on thecooling cycle.
Explanation for the decrease of
The thickness of an intergranular film increases when duringcooling the solubility of foreign ions declines. Slowly coolinga sample gives the foreign ions time to diffuse to the grainboundaries while quenching preserves the high temperature grainboundary structure. If this is a relevant process the boundarylayer should be thicker and have a higher resistance in slowlycooled samples. Fig. 9. 13 shows that this is indeed the case -Rgb for sample I is 7 times smaller in the quenched than in theslowly cooled material. In sample II with the lower Ca-contentthis effect is less marked (Rgt> decreases by a factor of 2-3).Explanation for the change in Kp:
A remaining question is why the bulk resistance depends upon thethermal history of the sample. Steele [31] found Rbulk t 0 b e
equal in quenched and slowly cooled zirconia. His material con-tained a high concentration of foreign cations: 0. 1 - 0. 3 wt ximpurities (Si.Al) besides Sx Y 2o 3 (0.3* SiO2 s3«10 w Si cm3).Our YAG with 60 and 100 ppm Ca was much purer which mean? aconcentration of about 10 1 8 Ca ions cm"3. YAG: Ca has anaveraged grain size of 1 urn, so the internal grain boundarysurface is high. A rough estimation reveals that for the forma-tion of an 0.2-0.4 nm thick intergranular CaAlgO^-film about100 ppm Ca are necessary.So it has to be taken into account that [Ca] in the grain in-terior decreases at the expense of the intergranular film to sucha low concentration that the bulk resistivity behaves as we ob-served it. This suggestion is supported by the result that Rb
changes one order of magnitude when the Ca-doping level in-creases from 15 to 100 ppm (fig. 9. 14).
£• 84

-4.50
I-5.50
-6.50
110
Fig. 9.14 Bulk resistance of Y AS-ceramic as afunction of the concentration of Ca-dopant
65

LITERATURE
[I] A. Guerro, E. P. Butler, P. L. Pratt, J. Phys. Coll., 7 C6(1979) 363.
[2] N. Bonanos, E. Lit ley, J. Phys. Chem. Solids, 1£ (1981)943.
[3] N. Bonanos et al. In 'Impedance Spectroscopy', ed. by J. R.Hacdonald, J. Wiley & Sons, 1967 (p. 215).
[4] R. Gerhardt, A. S. Nowick, J. Am. Ceram. Soc. , 64. (1988) 641and 647.
[5] K. El Ad ham, A. Hammou, Solid State Ionics, 9&10 (1963)905.
[6] L. C. de Jonghe, J. Hater. Sci. , lft (1979) 33.[7] J. R. Macdonald, G. R. Cook, J. E lec troanal . Chem. , 168
(1984) 355.[8] J. E. Bauerle, J. Phys. Cheo. Solids, 1£ (1969) 2657.[9] E. P. Butler, N. Bonanos, Mater. Sci. Eng. , li (1985) 49.[10] J. T. Rummer, Prog. Solid State Chem., 2 (1972) 141.[II] C. G. Koops, Phys. Rev., fi5_ (1951) 121.[12] N. M. Beekmans, L. Heyne, Electrochlm. Acta, 2J. (1976) 303.[13] T. V. DiJK, A. J. Burggraaf, Phys. Stat. Sol. (a), 41 (1981) 229.
H. J. Verkerk, B. J. Middelhuls, A. J. Burggraaf, Solid StateIonics, & (1982) 159.
[14] S. P. S. Badwal, J. Drennan, J. Mater. Sci., 2_£ (1987) 3231.[15] 'Impedance Spectrometry', ed. by J. R. Macdonald, John Viley
& Sons, New York, 1987 .[16] A. W. Funkenbusch, P. V. Smith, Metal 1. Trans. A, £A (1975)
2299.[17] S. Sinharoy, L. L. Levinson, V. L. BallarO, Am. Ceram. Soc.
Bull. . 51 (1978) 231.[18] V. c. Johnson, D. F. Stein, J. Am. Ceram. Soc. , 51 (1975) 485.[19] J. R. Taylor, J. P. Coad, A. E. Hughes, J. Am. Ceram. Soc., 19.
(1976) 374.[20] R. F. Cook, A. G. Schrott , J. Am. Ceram. Soc. , l i (1988) 50.[21] S. Baik, J. Am. Ceram. Soc. , &9_ (1986) C-101.[22] R. L. Full man, J. Metals AIME Trans. £. (1953) 447.[23] R. Vernicke, "Advances in Ceramics", Vol.1 ed. by L. M.
Levinson, p. 272.[24] L. J. v. Ijzendoorn, unpublished.[25] M. Kleitz, J. H. Kennedy, "Fast Ion Transport in Solids" ed.
by P. Vashlshta, J. M. Mundy, G. K. Shenoy 1979 (North HollandAmsterdam), p. 185.
[26] Y. T. Tsai, D. H. Vhltmore, Solid State Ionics, 2 (1982) 129.[27] J. R. Macdonald, A. Hooper, A. P. Lehnen, Solid State Ionics,
St. (1982) 65.[28] I. R. Macdonald, J. Schoonman, A. P. Lehnen, J. Electroanal.
Chem. lit (1982) 77.[29] B. A. Boukamp, Solid State Ionics, ££ (1986) 31.[30] R. Metselaar, A.M. Hoefsloot, Solid State Ionics, S3. (1987)
305.[31] C. A. Leach, P. Tanev, B. H. C. Steele, J. Mater. Sci. Lett. , 5.
(1986) 893.[32] L. D. Hou, S. K. Tlku, H. A. Vang, F. A. Kroger, J. Mater. Sci.
It (1979) 1877.[33] K. Kitazawa, R. C. Coble, J. Am. Ceram. Soc., 51 (1974) 245.
86

10 THE DETECT CtiEMISTW Of Ca- AND Me-DOPED XAC
In the literature one paper contributed by us describes defectproperties of Ca- and Ms-doped polycrystal1ine YAG [l]. Thethesis of Rotman [2] encloses some conductivity data for Ca-dopedsingle-crystalline YAG. The crystals are supposed to contain 1wt x CaO - a concentration which is in no case soluble in theYAG-lattice, as we have shown [3).Furthermore there is russian paper, where the authors come to theconclusion that 1 wt. * MgO enhances the sintering activity of YAGpowders [4].
1O.1 SAMPLE CHARACTERISATICN
Ca- and Hg-doped YAG powders were prepared by the standard me-thod. Sintered pellets were analysed by optical emission spec-troscopy. Referring to tab. 10. l we assign the samples as YAG:100 Ca, YAG: 500 Ca and YAG:50 Hg. Both dopants act as stronggrain growth inhibitors, with the tendency that Ca is more effec-tive (as described in chapter 15).
Tab. 10.1 Dopant and impurity concentrations in the sinteredsamples determined by optical emission spectroscopy.
Sample name:
Element
CaHgSiFeGaCrTiHaNlHo
YAG: 100 Ca YAG: 500 Ca
Concentration in wt.
100101572103
<50<10<10
550101053101
<50<10<1O
YAG:
ppm
50 Hg
<50501052103
<50<1O<10
87

On the basis of crystal-chemical considerations it is assumedthat Ca enters the dodecahedral site and substitutes for Y; Mg-lons should enter the dodecahedral as well as the octahedralsites [5,6]; this was shown by computer simulation (see section16).
10.2 DISPERSED PARTICLES IIS A CONDUCTING MATRIX:WAGNER'S MODEL
A number of observations have been reported wherein the presenceof a dispersed second phase changes the transport properties ofthe matrix which cannot be accounted for by classical defectchemical arguments (eg. LiI(Al2O3) [7] TiO2(SiO2) [8], CuCl(A12O3) [9]). Classical approaches did in fact not consider theeffect of an electrical double layer at the Interface between thedispersoid and the matrix.
According to the model of Vagner and coworKers the ratio of theconductivity in the double layer near the dispersoid interface,"dispersion- t 0 that of the bulK matrix, o-buIK, in a two phasesystem can be approximated by [8]:
eq-10.l"dispersion
"bulk
1 + 0. 83 g |Z| Vv LD/r2
where g - factor depending on the surface potential s 20Z = effective charge of the defects createdv v = volume fraction of dispersoidL D = Debye-lengthr = radius of the dispersoid
Eq-10. 1 states that the conductivity due to the electrical doublelayer increases as the Inverse square of the radius of the dis-persoid and is directly proportional to the volume fraction ofthe dispersoid and the Debye-length. In general, the largest De-bye- lengths are in those compounds which exhibit the lowestintrinsic lattice defect concentration, in other words, the effectof a dispersed second phase will be most pronounced with smallerconcentrations of point defects and consequently the effect willbe larger at lower temperatures.Applying eq-10. l two exemplary situations will be considered. Theextent ion of the Debye-layer L D at an interface depends upon
88

the concentration of defects:
€€0KT
8*
1/2
Assuming a dielectric constant € = 10 and tiKing for the defectconcentration 10 1 8 and 10 1* cm"3 respectively, the Debye-lengthcan be calculated as l. 2»iO~9 and 1. 2H10"7 m (for T-1570 K). Withthe empirical equation 10. 1 the relation of ^dispersion t 0 abulKcan be estimated.
Tab. 10.a Influence of dispersed second phase particles on con-ductivity calculated from eq.-iO.i.
DEFECTCOHC.[cm"3] £nm]
r[ym]
"dispersion
'bulk
1014 1.2 10-7
0. 50. 10. 01
0. 50. 10. 10. 01
0.0.0.
0.0.0.0.
01013
0 10133
1. 0021. 6
1.041. 2661
LD: Debye-length, Vv: volume fraction of dispersoidr: radius of dispersoid
From this rough estimation it follows that an enhancement of a inYAG containing about 1-5 vol.* dispersed Al-rich inclusions(r=0. 5 pm) by the Wagner-mechanism is negligible. To detect suchan effect much more dispersed particles with a smaller radiushave to be present.

10.3 RESULTS AMD DISCUSSICN
Figs . 10. l a . b and c show t h e i so therms log a vs. log pOg fo rYAG: 100 Ca. YAG: 500 Ca and YAG: 50 Mg. The Ionic t r a n s p o r tnumbers fo r a l l t h r e e samples are g iven i n f i g . 10.2.
ICO
la PO2 [Pa]
Fig. 10. l a - YAG: 50 Hg
Fig. 10. 1 b - YAG: 100 Ca
90

a
-19 -14 -9 -4
Fig. 10. lc - YAG: 500 Ca
Fig. IO.I pOg-dependence of the conductivity for10.la) YAS: SO Hg10.1b) YAS: 100 Ca10.1c) YAS: 500 Ca
la and lc give besides the total conductivity(<rtot)t *Ae ionic- and the hole conductivity
Using the relations ffjon = otot-ti and aej - fftoft1'1!) i l l o M u s
toto separate ionic from electronic conductivity. The fact that o~eincreases with pO2 indicates that we are dealing with holes: o~el -a n o I e; furthermore the sign of the SeebecK coefficient at highoxygen pressure was positive, which indicate that holes are the coducting species. Ionic and hole conductivity for TAG: 100 Ca and T.50 Mg are drawn in figs. 10. la and lc. In heavily acceptor-doped Y500 Ca we detected ionic conductivity over nearly the entire pOe-rme. tj was found to decrease with increasing temperature.
91

TA
G:
100 (
\ J
traniport
0.00
0.50
0.25
number
1.00
0.75
O
transport number
© »-
Iu«
I
I e

.2ao
ansp
oi
1.00
0.75
0.50
0.25
0.00
-14
YAG: 500 Ca
Fig. 10.2 Ionic transport numbers as f(pO£) for10.2a) YAG: 50 Hg10.2b) YAG: 100 Ca10.2c) YAG: 500 Ca.
We think that we can explain the electrical properties of ourmaterial in terms of "classical" defect chemistry; the Vagnermodel described in section 10.2 is not relevant for us.In agreement with previous results we assume that doubly ionizedoxygen-vacancies are the dominant ionic defects in TAG. Further-more Al-vacancies will be considered. Oxygen vacancies are gene-rated following eq. -10. 3
eq. -10. 3 + 2 e' • 1/2 O2
with the mass action relation
93

eq. -10. 4 [V0-][e'l2 = K4 exp[-E4/KT]
The generation and recombination of electrons and holes can beexpressed as
eq.-10. 5 null < * eJ • h"
with
eq. -10. 6 [e'][h] =
where E 4 is the thermal band gap.
The A1 2O 3 inclusions are taken into consideration by introducingthe activity of alumina aAj2o3
l n t 0 t n e defect chemical model:
eq. -10. 7 2 A1 A 1X + 3 O o* * > 2 V A 1 ' " + 3 Vo' ' + A1 2O 3
with the mass action relation
eq. -10. 8 [Vo • ] ' [ V A 1 " « ]2 aA12O3 = *8 exp[-E8/RT]
(*A12O3 denotes the activity of
Ve observed that acceptor-doped sintered YAG annealed at 1870 K inoxygen and quenched to room temperature has a red-brown colour;performing the quench after an anneal in a reducing atmospheredoes not lead to a coloured sample. The same was found In singlecrystalline YAG [10] as well as in alumina [11-13]. By ESR measure-ments Cox [11,12] and Kroger and coworkers [13] made clear thatthe brown color centers in Mg-doped AlzOj, which are presentafter a quench In oxygen, are paramagnetic. Their concentrationdecreases with decreasing pO2 of the annealing environment.According to ref. 13 these paramagnetic color centers are trapped
94
holes near Mg A J' defect centres. The holes are localizedon an O2~-ion forming an Oo--centre. This process can bedescribed by
eq. -10. 9 O ox + h
and
eq. -10. 10 00- • M« Aj' * > (M8 AlO o)x
Based on optical absorption and ESR-measurements the presenceof 00•-centres has been proved in YAG [14, 15}. Ve assume a pO2-dependent hole-trapping « > hole-releasing process to behighly probable. In our calculations for Ca- and Hg-doped YAGthe association reaction will not be taken into account.Instead we use the normal ionisation reaction:
eq. -10. 11 Cayx « » Cay'
with
[CaY'l t h ]eq. -10. 12 -- K l E
[CaYx]
(an analogous process can be formulated for YAG: Mg)
The interstitial defects Al^'", Yj""" and Ot'' are not considered,because they are highly improbable, as we revealed by computersimulation techniques [16]. The formation-energy for a FrenKel-defect is much higher than for a Schottky-defect. The eqs. -10.13,10. 14, and 10. 15 give the appropriate FrenKel- and schottky-def ect formation reactions and their energies are listed in tab.10. 3; this is discussed in chapter 16.
95

eq. -10. 13
eq. -10. 14
A I T "
Y i ' - " V Y
eq. - 1 0 . 15
3 Ty • 5 A 1 A | + 12 0 0 3 VY' 5 V A 1 ' " + 12 V o - • Y 3 A 1 5 O 1 2
Tab. 10.3 Defect formation energies calculated by computer-simulation applying the CASCADE-code 116).
Equation: 10. 13 10. 14 10. 15
Defect forming energyin eV per single defect s 8 eV s 10 eV s 5 eV
0±'' are not considered to be possible because the largestinterstitial site (the empty b-slte) can not accommodate the O2
with its large radius. So we are dealing with V o", V A ] " ' ,e'and h- as possible charged defect species in YAG.
The condition that requires that the crystal remains electri-cally neutral is satisfied by
eq. -10. 16 [e'l + [Cay') + 3 [VA1"'J = [IT] + 2 [V o-J
(an analogous relation introducing lMgAl'] for the Mg-dopedsample can be written}
The total concentration of the intentionally added acceptor ions

IS
eq.-10.17 [Cay'l + tCaYx] = [Catot]
where [Catot] is the total Ca-concentration. An analogousequation can be written for the Mg-doped sample. According to theanalyses no additional acceptor or donor impurity has to betaken into consideration.With these equations it is possible to solve for the unknowndefect concentrations as f(pOg) step by step by simplifying theelectro-neutrality condition. Under highly oxidizing conditionsone would expect [Vo'" ], [CaY
J ] and [e'J to be depressed rela-tive to [h-] and [VAi''' ], so in first approximation:
eq. -10. 16 [h'] -. 3 [V A 1'" ]
and
eq. -10. 19 [CaYx] » [ C a t o t ] .
Tab. 10.4 The electro-neutrality conditions which govern thedifferent defect-regimes. pO£ decreases fromregime I to regime IV".
regime I [ h ) = 3 [ V A 1 ' " ]
regime II [CaY'l = [>»•]
regime III a 2 [ V o • • ] = [CaY*] < t c a t o t ]
regime III b 2 [ V 0 " ] = [CaYJ] s [Ca totl
regime IV [ e ' ] = 2 [Vo' )
* the Hg-doped YAG i s t rea ted in a comparable way.
97

Applying the re *• s * -en above one can find the eleKtro-neutrality condition' :*.il>. 10.4) and the exponents n in the ex-pression -for the pOg-dependence of the defect-concentration:[defect) <c pO 2
n (see tab. 10.5). The actual widths ofthe defect regimes depend upon the concentration of acceptorsin the crystal and the equilibrium constant of the appropriatedefect-relation. When [Cay'] or [Mgy'l increase the plateau of apOg-independent defect concentration in regime II gets more ex-tended. The complete defect diagram on the basis of our theory isgiven in fig. 10. 3. Taking into account that electronic chargecarriers have a much higher mobility than ions we can qualita-tively derive the conductivity isotherm as a function of theoxygen pressure (fig. 10.4).
Tab. 10.5 Exponents n In [defectJ <r pOgn assuming a pO2-dependent concentration of acceptors.
hole released hole trapped >
0) = te] [Ca^]=2[V0) [Cay] = [h] [h]=3[VA"j
IV Illb Ilia II Iregime
e'
h"
VA1'"
Cay'
Cay*
-1/6
-1/6
1/6
1/4
0
0
0
-1/4
1/4
0
0
1/4
-1/6
-1/6
1/6
1/4
-1/6
0
-1/2
0
0
3/4
0
0
-1/8
-3/16
3/16
3/16
0
0

— log
10.3 Defect diagram for Ca-doped YAG. The roman letters denotthe neutrality-regimes defined in tab. 10.t.
log 113 / 1 6 ^
LOW DOPING-LEVEL
>
HIGH DOPIN&-LEVEL
Fig. 10.4 The expected pOg-dependence of a for samples dopedat a low and a high level of acceptors.
99
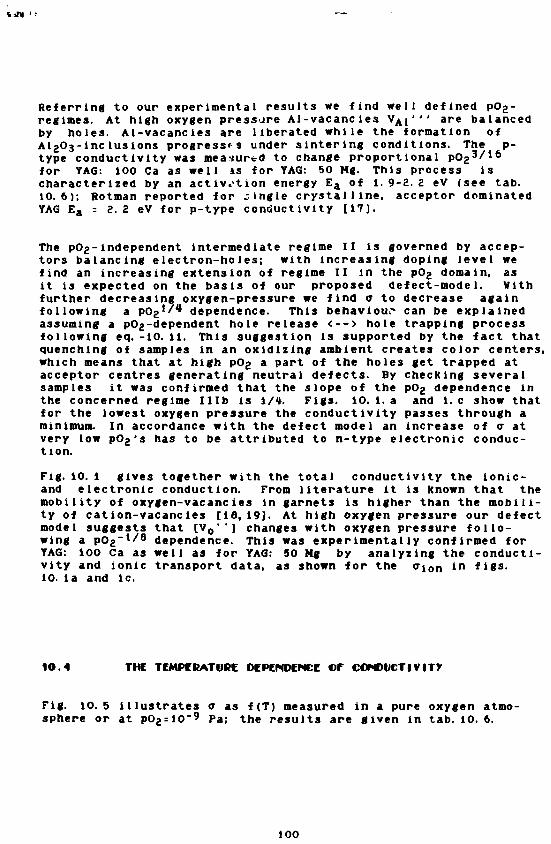
Referring to our experimental results we find well defined pOg-regimes. At high oxygen pressure Al-vacancies V A j ' " are balancedby holes. Al-vacancies are liberated while the formation ofA12C»3-inc lusions progresses under sintering conditions. The p-type conductivity was measured to change proportional pOg 3/ 1 6
for YAG: 100 Ca as well is for YAG: 50 Mg. This process ischaracterized by an activation energy E a of 1. 9-2. 2 eV (see tab.10.6); Rotman reported for single crystalline, acceptor dominatedYAG E a = 2. 2 eV for p-type conductivity [17].
The pOg-independent intermediate regime II is governed by accep-tors balancing electron-holes; with increasing doping level wefind an increasing extension of regime II in the pOg domain, asit is expected on the basis of our proposed defect-model. Withfurther decreasing oxygen-pressure we find a to decrease againfollowing a pOg'/4 dependence. This behaviour can be explainedassuming a pOg-dependent hole release <--> hole trapping processfollowing eq. -10. 11. This suggestion Is supported by the fact thatquenching of samples in an oxidizing ambient creates color centers,which means that at high pOg a part of the holes get trapped atacceptor centres generating neutral defects. By checking severalsamples it was confirmed that the slope of the pOg dependence inthe concerned regime Illb is 1/4. Figs. 10. 1. a and 1. c show thatfor the lowest oxygen pressure the conductivity passes through aminimum. In accordance with the defect model an increase of a atvery low pOg's has to be attributed to n-type electronic conduc-tion.
Fig. 10. l gives together with the total conductivity the ionic-and electronic conduction. From literature it is Known that themobility of oxygen-vacancies in garnets is higher than the mobili-ty of cation-vacancies [16, 19}. At high oxygen pressure our defectmodel suggests that [Vo"
-] changes with oxygen pressure follo-wing a pOg"1/8 dependence. This was experimentally confirmed forYAG: 100 Ca as well as for YAG: 50 Mg by analyzing the conducti-vity and ionic transport data, as shown for the trlon in figs.10. la and lc.
1O.4 THE TEMPERATURE DEPENDENCE Or CCNDtCTIVIT7
Fig. 10.5 illustrates a as f(T) measured in a pure oxygen atmo-sphere or at pOgrlO"9 Pa; the results are given in tab. 10. 6.
100

eVI
- 55.00 7.67 10.33 13.00
10000/T [l/K]
Fig. 10.5 Temperature dependence of the conductivities of YAG:100 Ca, YAG: 500 Ca and YAG: 50 Mg. The numbersdenoting the lines are specified in tab. 10.6.
Tab. 10.6 The activation energies for conduction processes indifferent acceptor-doped YAG ceramics (the numbers arereferring to the lines in fig.10.5).
LINE
12345
SAMPLE
YAG:
YAG:YAG:
100 Catt
m
500 Ca50 Mg
poe [Pa]
105
10510-9105105
SPECIFICATION
bulk (p-type)grain boundarybulk (Ionic)bulk (p-type)bulk (p-type)
E a [eVJ
2. 02. 42. 71. 72. 2
E a in oxygen is about 2 eV for bulk conductivity for all threesamples. The grain boundary conductivity has a considerablyhigher activation energy, 2.4 eV was a typical value we found inour samples. This difference may indicate that the grains are coverby a continuous intergranular film. For the conductivity at a pO 2
as low as 1O~9 Pa the activation energy was 2.7 eV.
101

1O.5 CONCLUSION
temperature measurements of the ionic and electronic conduc-t iv i ty of YAG doped with the acceptor-ions Ca and Mg are inter-preted assuming Vo", V A i " \ CaY' (MgY'). CaY
x (MgYx).
h" and e' defects. Al2O3-precipitations observed in theceramic material are of major importance. Their influence on thedefect situation is Interpreted on the basis of "classical" defectchemistry. The inclusions are responsible for the formation ofAl-vacancies; in this way the pOj'^'^-depencence of a can beexplained. V A 1 "' are balancing the holes at high oxygen pres-sure. Acceptor centres act as traps for holes at high pOg,so that a pO2-dependent hole release mechanism from Oo-centres has to be considered. The plateau in the a vs. pO2curve depends on the concentration of acceptor ions in the crystallattice.
LITERATURE
[ i ] L. Schuh, R. H e t s e l a a r , G. de With, submit ted to J. Appl.Phys.
[2] S. R. Rotman, Ph. D. t h e s i s , "Defect S t r u c t u r e Of LuminescentGarnets" Massachusetts Institute of Technology. 1985.
[3] this thesis, chapter 6 and 9[4] E. S. LuKin, L. P. KiryuKhina, T. V. Ef Imovskaya, Tr. HosK.
Shim.-TeKhnol. Inst. ,12ft, (1978), 20[5] S. Geller, Z. Erlstallogr. 1£5_ (1967) 1.[6] V. TolKsdorf, U. H. Volfmeier, Landoldt Bornstein 12/111 a,
(Heue Serie), Berlin 1978.(7) c. C. Liang, J. Electrochem. Soc. X3SL (1973) 1289.[8] G. M. Crosby, J. Solid State Chem. ££ (1978) 367.[9] T. Jow and J. B. Wagner Jr., J. Electrochem. Soc. 126
(1979) 1963.[10] J. Kvapil, Jo. Kvapil, B. Perner and B. Manek, Krlst. Techno 1
IP. (1975) 529.[11] R. T. Cox, Solid State Comm. £ (1971) 1989.[12] R. T. Cox, J. de Phys. Colloq. C9 11-12 (1973) C9-333.[13] H. A. Vang, C. H. Lee, F. A. Kroger and R. T. Cox, Phys. Rev. B
21 (1983) 3821.[14] HJ. Bernhardt, Phys. Stat. Sol., (a) 11 (1976) 445.[15] K. Mori, Phys. Stat. Sol. (a) jUL (1977) 375.[16] L. Schuh, C. R. A. Cat low, R. Metselaar, to be published.[17] R. Rotman, R. P. Tandon and H. L. Tuller, J. Appl. Phys. 51
(1985) 1951.[18] A. Tu. Neiman, E. V. TkachenKo and V. M. ZhuKovskii, Dokl. Aka<
Nauk. SSSR 240 (1978) 876.[19] J. L. Bates and J. E. Gamier, J. Am. Ceram. Soc. Comm. 6JH
C-138 (1981).
102

11 TIf DEFECT CKMISTRT Cf ZrMfED
There are some report* Known to us which deal with the physico-chemical properties of Zr-doped TAG [1-*). IJiendoorn [1] statedthat Zr has a considerably better solubility in the TAG-latticethan Ca; he found about 700 ppm ZrOg to be completely solublein TAG. Furthermore It was suggested that Zr occupies the octahe-dral and/or the dodecahedral position In the garnet lattice [11.After sintering In Hg/HgO the Zr-doped samples had a redcolour. Two possibilities for this colouration were discussedinitially: a reduction of Zr4* to Zr2* or a crystal fieldsplitting of the «d-orbltals.
Asatryan and coworkers [2] reported ESB and optical data for Zr-doped single - and polycrystalllne TAG treated in Hc/HgOatmospheres at high temperature. Paramagnetic centres were foundto be present in reduced TAG: Zr. A red colour of the reducedsamples was detected again. ESB spectra In combination with opti-cal measurements revealed that the concentrations of paramagne-tic centres and colour centres change simultaneously. It wasestablished that both centres are the same in nature: Zr3*-lons(S= 1/2) on c-sltea (dodecahedral sites) of the garnet structuresubstituting for yttrium.
Asatryan further reported that no colouration is observed In TAG:Zr when charge compensating Ions (Hg2* or Ca2*) are Introduced.Moreover the lattice-constant a0 was found to decrease with in-creasing Zr-content for ceramic powders reduced in a Hg/H2O-atmosphere (*0-it. 00* 1 for pure TAG and ao= it.998 1 for reducedTAG: Zr with 1.5 wt* Zr), while a0 in oxidised TAG: Zr does notchange with the amount of Zr introduced into the lattice. Thiswas tested for Zr-concentratlons up to 2 wt. x.
A paper contributed by us gives the electrical conductivity andthe ionic transport number as a function of the oxygen partialpressure in ceramic TAG: Zr [3]. The defect situation in thismaterial was found to be governed by donors. The oxygen-pressuredependence of the conductivity was found to be proportional to pO2
n
with ns-i/5 in the n-type regime. It was suggested that vo•• andv0- (singly or doubly ionised oxygen vacancies) are the domina-ting ionic defects.
In a recent paper Botman and Tuller £•• 6) present high temperatureconductivity data of single-crystalline TAG doped with Zr and Hisimultaneously (about l mol. * of each) £4.1. The material exhi-bited ionic conductivity under highly oxidising and n-type elec-tronic conductivity under reducing conditions with a pOg*/•-de-pendence. Following Botman this behaviour is characterlied by theneutrality condition 2(Vo-•) = [Ultot'l * (*') <A* = acceptors).The activation energy of the ionic conductivity (oxidising condi-tions) oion *n* n-type conductivity (reducing conditions) were 9•V and 3. a eV respectively. Simultanous doping with an acceptor ai
103

a donor was dons to study the Influence of charge-compensation.Rotaan does not consider the possibility of a reduction of Zr; aredox-process was considered comprising only the Hi-ions(Hi3* < > HI2*). However, in 1982 Saaatov and coworkers [S]identified paramagnetic Zr3+-lons in crystalline aatter (TPO4,xerotlae), so they should be taken Into consideration.
ft.1 SAMPLC CHARACTERISATICN
The saaples were prepared following the standard aethoddescribed In section 5. Sintered pellets were analysed by opticaleaisslon spectroaetry (see tab. 11.1). The powder as sintered at8120 C and not at 2070 K (as aost other ceraalc saaples treatedin this thesis).
Tab. tl.i Dopant and impurity concentration in the sintered7AS: Zr determined by optical emission spectros-eopy.
ELQtEMT wt. ppa
Zr SSSi 10Mg <10Fe SMn <!CU <t•a <S0Nl <1Cr 10Pb <1Ti lHe <10V <5
The values assigned with "<" re-present the detection Halt of theconcerning eleaent.
The saaples we investigated here have a very low lapurlty-content(which can be estlaated as IS ppa donors and 15-20 ppa acceptors
104
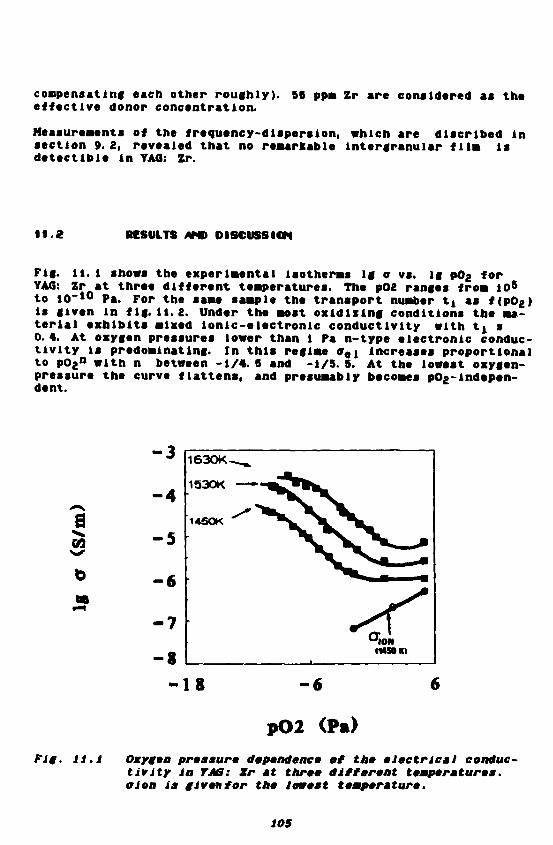
compensating each other roughly),effective donor concentration.
56 ppm Zr are considered as the
Measurements of the frequency-dispersion, which are dlscrlbed insection 9. 2, revealed that no remarkable lntergranular fllsi isdetectlble in YAG: Zr.
ft.2 RESULTS DISCUSSION
Fig. 11. l shows the experimental isotherms Ig a vs. Ig pO2 forTAG: Zr at three different temperatures. The pO2 ranges from 10s
to 10" 1 0 Pa. For the same sample the transport number tj as f(pOg)Is given in fig.ll. 2. under the most oxidizing conditions the ma-terial exhibits mixed lonlc-electronlc conductivity with t4 a0. *. At oxygen pressures lower than 1 Pa n-type electronic conduc-tivity is predominating. In this regime aei increases proportionalto po 2
n with n between -1/4. 5 and -1/5. 5. At the lowest oxygen-pressure the curve flattens, and presumably becomes pO?-indepen-dent.
-7
-8-18 -6
pO2 (P*>
Fig. ii.i Oxygen pressure dependence of the eiectricai conduc-tivity in TAB: Xr at three different temperatures,oion is given for the lowest temperature.
109

4 - 3 - 2 - 1 0 I 2 3 4 5
t:
Fig. ll.S Ionic transport number tj for TAG: SO Zr as t(pOs)
11.2.f Tlw defect Mdtel far Zr-dtaawel YMb
Th« donor-ctntrca ZrT* <ov*rn tht defect chemistry of TAG; Zr.Zr has a 4«~char«* under oxldli lng and a 3>-char«e under reducingconditions. Ve set the e lectro-neutral i ty condition for TAG: Zr
eq. -11. 1 3 [VA i"'J • le'J r 2[V0'*J • t*rT-] • |h"J.
Under the aost oxldlilnf conditions Al-vacancies are balancing theelectron-holes: 3tVA1'") = (h). With succeslvely decreasing pO» 1the equlllbrlua conditions are given In tab. 11.2.
106
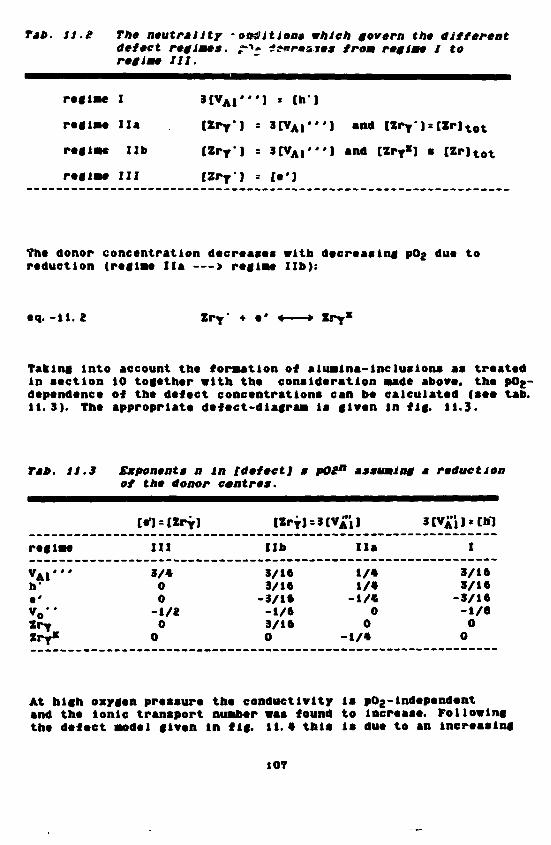
Tab. ii.a The neutrality -onditions which govern the differentdetect regimes. ^- izereaios from regime I toregime III.
regime I 3lVAi'"] s [h]
MUM I la . (Zry-J = 3 ( V A I ' " 1 and (ZrT ' )s(Zrl t o t
regla* lib lZrY'l » 3tVA i '"l and [ZrT*l a [Zr ) t o t
recta* III IZrT ) = (e')
The donor concentration decreases with decreasing pO2 due toreduction (regiae Ila — > reglae lib):
eq. -11. 2 Zry* • •' < > Zry*
Taking into account the foraation of alualna-inclusions as treatedin section 10 together with the consideration aade above, the pOg-dependence of the defect concentrations can be calculated fsee tab.11.3). The appropriate defect-dlagraa is given In fig. 11.3.
Tab. it.3 Exponents n in [detectJ m pOl" assuming a reductionof the donor centres.
reglae
v A l ' "h*e'"o
ZrT*
{el = [ZryJ
III
3/400-1/200
[ZrTl
lib
3/163/16
-3/16-1/63/160
= 3[VA'il
Ila
1/41/4-1/4
00
-1/4
3tVA"il = t«
I
3/163/16
-3/16-1/800
At high oxygen pressure the conductivity Is pO2-independentand the ionic transport nuaber was found to increase. Followingthe defect aodel given in fig. 11.4 this is due to an increasing
10T
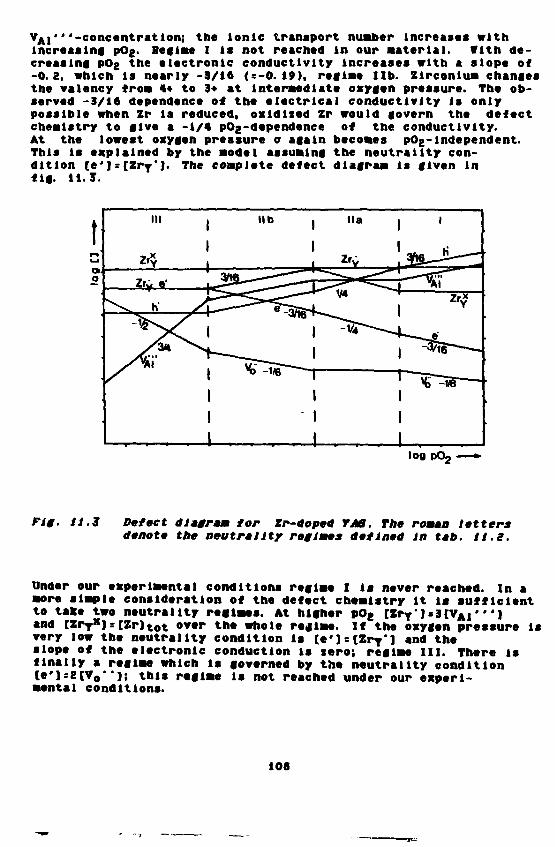
VA|'"-concentration; the Ionic transport number Increases withIncreasing pO2. Regime I is not reached In our Material. Vlth de-creasing pOg the electronic conductivity Increases with a slope of-0. 2, which Is nearly -3/16 (s-o. 19). regime lib. Zirconium changesthe valency fro* «• to 3* at Intermediate oxygen pressure. The ob-served -3/16 dependence of the electrical conductivity is onlypossible when Zr la reduced, oxidised Zr would govern the defectchemistry to give a -1/4 pOg-dependence of the conductivity.At the lowest oxygen pressure a again becomes pOg-independent.This Is explained by the model assuming the neutrality con-dition [e']:(Zry']. The complete defect diagram is given infig. 11. J.
Ill
Zfy 0'
N . h
111
I>—
I11
lib |
1
-?><-—1
^___^_^ 1
11
l.a ,
1Zfy ,
V4 1
1
i
| *~ ^
Z rY
log pO2 — -
Fig. it.3 Detect diagram tor Zr-Hope* TAB. The roman lettersdenote the neutrality regimes defined in tab. it.a.
Under our experimental conditions regime I 1* never reached. In amore simple consideration of the defect chemistry it is sufficientto take two neutrality regimes. At higher pO2 [ZrT') = 3[VA|"')and [ZrT
x]:{Zr]tot o v« r tn« whole regime. If the oxygen pressure is
very low the neutrality condition is [e']s[ZrY*l and theslope of the electronic eonductlon is tero; regime III. There isfinally a regime which is governed by the neutrality conditionIe']sZ(Vo"]; this regime is not reached under our experi-mental conditions.
108

11.3 THt TCMKRATURC M M N D H t t E Of THE CONDUCTIVII?
The activation energies for the conduction processes under oxidi-zing and under reducing conditions are presented in tab. 11.4 forTAG doped with BO and BOO ppm Zr.
Tab. 11.4 Activation energies for the conduction process InTAG doped with BO and SOO ppm Zr at different pOg'sat 1570-1670 K.
pOg E a (60 ppm Zr) E a (BOO ppm Zr)
10* Pa 3. o eV 2. 8 ev10"* 3. » 2. 710-9 3. 5 3, a
The activation energy In the most oxidising atmosphere Is the s a wfor both samples within the experimental range of arror, indicatingthat the conducting species are the same (2.8 - 3. it eV). Accordingto the defect model proposed In fig. 11.* mixed iwm-electronicconductivity dominates this regime. The activation energy in themost reducing ambient Is significantly higher (3.6-3,3 eV); n-typeconduction is governing this regime. The dopant-ion Zs* is reducedunder these conditions. At an intermediate pOg the activationenergy lies between the values for the most oxldltinc and themost reducing conditions. The Zr-ions are supposed to changetheir valency state from «• to 3+ in this intermediate pressureregime (regime Ila * lib in fig. 11.3) following eq. -ll. 2.
The difference in E a at high and low oxygen pressure can beanalysed in terms of different processes by considering the defectreaction eq.-11. 2 together with
eq. -11. 3 0 0 * < * V o' ' • 2e' • 1/2 Og
and
eq. -11. « 2A1 A !* • 30 0» « > 2 V A i ' " + 3VO'' • A12O3.
By combining the complete mass action relations for these reac-tions eq's 11.6 -11. T leads to the energetics of the conductionprocess.
109

eq. -11. 5 [Zry'l"1 [e']~*[ZrTx] s xZr exp[-EZr/KT]
eq. -11. 6 [Vo"•][•']* = PO2"1/ 8 K4 exp[-Ei/KTl
eq. -11. 7 [V A,'"j2tV 0-]3 »A12O3 s *A12O3
EZr» El a n d EA12O3 * r e t h e •"•«*gies for reduction of Zr, the ther-mal band-gap and the forming energy of the A1 2O 3 Inclusionsrespectively. VorKlng out the relations leads to the activationenergy
eq.-11.8 E a s 3/8 Et - 1/8 E A 1 2 O 3 • 1/4 E Z r
for regime lib and
eq.-11. 9 E 4 = 1/2 Et - I/ft E A I 2 O 3
for regime Ila. Botman [ft] reports the redox energy Et to be 7.8eV; this value and the activation energy In regime Ila (« 3eV)leads via eq.-11. 9 to a B A I & 0 3 °* '"* *v> Inserting this valueInto eq.-11. 8 together with the measured activation energy of 3.7eV gives a redox-energy E j r of 0-7 eV. This Is In a probableorder of magnitude: Rotman [7] reports E=8. 8 eV for the reduc-tion of Fe3*-lons In TAG and Kroger and Mohapatra [8] foundE:4. 25 eV for the reaction Tl*+ < > Tl 3 + in alumina. Veexpect the redox energy for Zr to be higher than for Fe or Tl;this assumption Is confirmed by our estimation.
11.4 COHCLUSICN
Zr-doped TAG behaves as a mixed Ionic electronic conductor. At lowpO2 o increases with decreasing oxygen pressure (n-type conducti-vity). The slope of the curve can be Interpreted assuming Al-va-cancies as dominating Ionic defects. From the temperature depen-dence of a the redox-energy of the Zr-lons In the garnet latticecan be estimated to be ft-7 eV.
110

LITCRATURr
[l] L. J. v. IJzendoorn, private coaaunlcatlon.[2] H. 8. Asatrayan, A. S. Euianyan, A. €. Petrosyan, A. K. Pertos-
yan, E.G. Shatoyan, Phya. Stat. Sol. (b), 1££ (1966) 343.[3] L. Schuil, R. Metselaar, G. de Vlth, Scl. Ceraa.,14 (l9Bf)
973.[4) S. R. Rotman. H. L. Tut 1er, J. Appl. Phya. &£. (1967) 13OS.[5] M.V. Saaatov, s. L. VotyaKov, A.A. Crasnobaev. Iiv. AKad.
HauK SSSR, Neor«. Hater., IA (1982) 1866.[6] S. B. Rotaan, K.P. Tandon, H. L. Tul 1er, J. Appl. Ptiys. 51
(1985) 1951.[7] S.R. Rotaan, Ph.D. Thesis, "Defect Structure of Luminescent
Garnets", Massachusetts Institute of Technology, 1966.[8] S. K. Hohapatra. P.A. Kroger, J. An. Ceraa. Soc. , Äft (1977)
361.
Ill

12 UNWED POMRySTAUIff TAB
•2.1 SAMPLE CHARACTERISATION
Undoped TAG-saaples were sintered from the pure source powdersapplying the standard Method. The level of impurities was deter-mined by emission spectroscopy.
T»b. te.l impurity content of * pure TAB sinter body.
Element wt. ppm
Si 15Hg 10Fe 7Hn < 1Cu < 1Ha < SOHi < 1Cr 10Pb < 1Zr < 5Ti < 3Ho < 10V < 6
The "<"-slgn means that the concentra-tion is below the detection limit.
12.2 RESULTS A*D DISCUSSION
Fig. 12. l gives the electrical conductivity as a function of theoxygen partial pressure for two different temperatures.
The ionic transport number determined for the same temperaturesis shown In fig. 12.2 together with the separated ionic and elec-tronic contribution to the total conductivity for 1670 E.
112

,0
a
oPiUS
e
1.00
0.75
0.50
0.25
0.00
- 1 5
D t€70 K
•+- 1070 K
6GO
tow
-1.60
-2.00
-2.80
-91.00
-9.00
Fig. 12.e Ionic transport number measured for undoped poly-crystalline TAB (A) and the ionic and electronicconductivity at T=i670 Z derived herefrom (B).
114

12.3 CONCLUSION
The defect chemistry of the undoped polycrystalline TAG weInvestigated Is dominated by Al-vacancles. Again we found apO2
3^lD oxygen pressure dependence of the p-type conductivityat higher pop's, which can be explained by the presence of VA1'".Chemical analysis of the material did not chow a considerableamount of impurities, which could be responsible for the be-haviour at higher pressures. 80 the Al-rlch inclusions play anImportant role In the defect chemistry of undoped TAG ceramics.At low pO2 Al-vacancles are balanced by the few ppm of uninten-tionally present acceptor ions.
13 (NOTED SINBlt CRTSTAILIME TA6
Several papers dealing with the defect chemistry of singlecrystalline TAG investigated by conductivity measurements werecontributed by Rotman and coworkers [1-4J. The conduction mecha-nism in cerium-doped TAG Is considered to be an acceptor-control-led one; cerium-ions in the TAG lattice are not treated as de-fect species controlling the high temperature electrical conducti-vity. Hixed lonic/n-type conductivity was found in such crystals,a simple mechanism based on allovalent acceptor impurities wasproposed to explain the pO8~*'* -dependence [£]. The other workconcerning the defect chemistry of TAG [1. 3,«) considers Fe-,•1- and Zr-doped material.
13. f SAMLE MMRACTCBISATICN
Our measurements were done with Verneu11-grown crystals. Theresult of a chemical analysis of the material is given In tab. 13. 1
115

Tab. 13.1 Spectrochemical analysis ofsingle crystalline YAS
Element wt. ppm
SIGaFe
79610
Ho data about the Ca-content in our samples are available;following the results of Rotman this Impurity would be expectedin the crystals [£]. Furthermore protons are present in thecrystal lattice (introduced by the crystal growth In a H2/Og-flaae).
13.2 CXPCRIMTNT DISCUSS Iff*
Fig. 13. l shows three Isotherms of log o* vs. log pOj for undopedsingle crystalline TAQ. At high oxygen partial pressure the con-ductivity Is pOg-independent and under more reducing conditions achanges with a partial pressure dependence of approximately
a09
0.00
-1.67
-3.33
-5.00
1t40 K 1700 K
1STO
-10 - 5 0
lg pO2 <Pa)Fig. i3.t The conductivity isotherms as * function of pO2.
116
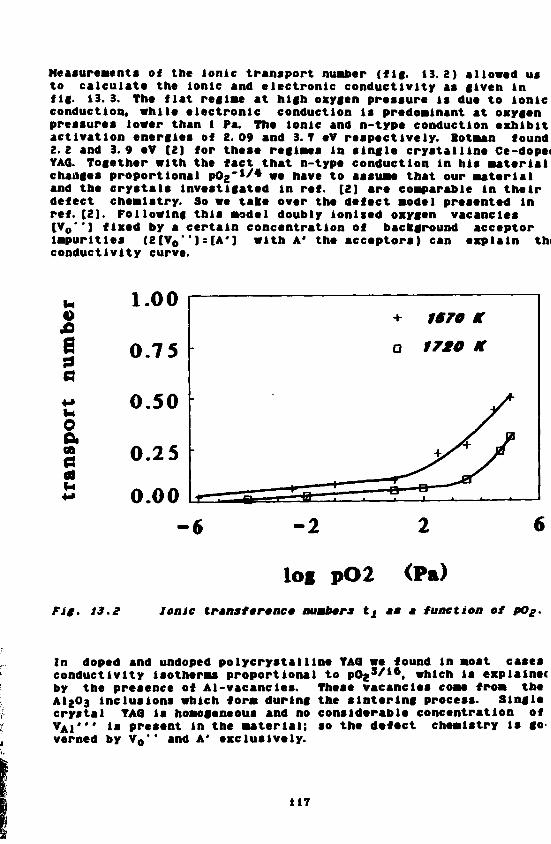
Measurements of the Ionic transport number (fig. 13.2) allowed usto calculate the Ionic and electronic conductivity as given Infig. 13.3. The flat regime at high oxygen pressure is due to Ionicconduction, while electronic conduction Is predominant at oxygenpressures tower than l Pa. The Ionic and n-type conduction exhibitactivation energies of 2.09 and 3.7 eV respectively. Rotman found2.2 and 3.9 eV [2] for these regimes in single crystalline Ce-dope<TAG. Together with the fact that n-type conduction In his materialchanges proportional pO2~
J/* we have to assume that our materialand the crystals investigated in ref. [2) are comparable in theirdefect chemistry. So we take over the defect model presented Inref. [2]. Following this model doubly ionised oxygen vacancies[Vo"] fixed by a certain concentration of background acceptorimpurities (2[V0" )=[A'J with A' the acceptors) can explain tluconductivity curve.
a
uO«aa)u
0.25
0.00
-6 -2
log pO2 (Pa)
Fig. 13,2 Ionic traasf*r»ae» numbers tt MM M function of pOg.
In doped and undoped polycrystalllne TAG we found in most casesconductivity isotherms proportional to pOg3/16. which is explainerby the presence of Al-vacancles. These vacancies come from theAI2O3 inclusions which form during the sintering process. Singlecrystal TAG is homogeneous and no considerable concentration ofvAl'" iM Present in the material; so the defect chemistry is go-verned by Vo'* and A' exclusively.
117

a
-1.00
-2.67
-4.33
-6.00-15 -S - 1
I f pO2
Fig. tS.S Conductivity isotherms separated into n-type andionic components as a function of pOg.
13.3 CONCLUSIONS
The high teaperature aeaaureaent of the tranaport properties ofsingle crystalline TAG has shown it to be a alxed lonlc-electronlcconductor. The pOg-dependent conductivity and the ionic trans-port nuaber aeaaureaents are consistent with a defect aodel doal-nated by doubly ionised oxygen vacancies fixed in nuaber by back-ground acceptor lapurltles.
LITERATURE
[1] S. B. Botaan, Ph. D. Thesis, "Defect Stucture Of LualnescentGarnets", HIT, 1985.
[2] S. B. Botaan. B. P. Tandon, H. C. Tuller, J. Appl. Phys. , 57(1985) 1951.
[9) S. B. Botaan, H. L. Tuller, Hater. Res. Soc. Syap. Proc. , 40(198*) %13.
[4] S. B. Botman, EL. Tuller, J. Appl. Phys., H. (1986) 1305.
118

14 TIf INTCMOTION Of ?A6 VITN HXDKOGfN-CCOTAININ6 ATMOSPtf RES
14.1 INTMMWCTION
YAG Is usually sintered in a H2/H2O-atmosphere, consequently itis of general Interest to Know how the garnet lattice Interactswith hydrogen and how the transport properties are Influenced.
The effect of hydrogen on the electrical conductivity in high tempe-rature oxldlc materials received Halted attention in the literature.Hill [1] described the interaction of TIO2 with H 2 at tem-peratures above 770 I. His experiments indicate Interstitial pro-tons being compensated by electrons; the conductivity increaseswith increasing activity of H2. Proton concentrations fixed bysubstltutionally dissolved cations have been found In Verneull-grown T102 crystals [1) and in SrCe<>3 [2).
Vagner and coworKers have given a theoretical discussion and someexperimental data about hydrogen defects in transition metaloxides and in zlrconla [4,5]
The defect structure of yttrla equilibrated at high temperaturein a hydrogen containing atmosphere was investigated by Horbyand Kofstad [3]. They consider two different lattice defects withprotons: the interstitial proton and the interstitial hydroxy-ion. An interstitial proton is a proton interacting from aninterstitial site with a neighbouring oxygen ion on a regularsite. When the proton moves through the lattice It probably movesas a free proton from one oxygen to another [ft). An interstitialhydroxide ion may be thought as a proton bonded to an intersti-tial oxygen ion. Such a structure is favoured in a crystalstructure as found in T2O3, with large interstitial sites.
From crystal chemical considerations we can conclude that inter-stitial hydroxide Ions are Improbable In garnets, because thisstructure cannot accommodate 0\.
Mohapatra, TIKu and Kroger [7] made conductivity measurements onhigh purity sapphire. The material showed in the beginning a donordominated behaviour. With increasing annealing time (at T B I S T OK in oxygen and CO/CO2 mixtures) the material changes over toacceptor dominated conductivity. Mohapatra and colleagues inter-preted this as being caused by a loss of protons. Protons have ahigh mobility and Lee et al. [6] demonstrated that aluminacrystals loose protons even at 1620 C.
IB-studies of OH-groups in alumina are described by Eigenmann [91,
119

Engstrom (10) and others.
Hydrogen activity Influence, or an Indication of such, has beenreported for LaeO3 [11], BaT103 [18,13], MgO [14], TAG [15],TIG [lft] and others.
The experimental results for garnets will be shortly describedbelow. Basic work for Y1G was contributed by Wood and co-workers [16]. They Investigated the hydrogen uptake In YIG by•eans of IB-spectrometry and conductivity measurements. Thisreaction begins at temperatures as low as 620 K. OH-groupsenter the crystal and the defect charge is compensated by a re-duction of Fe3+ to Fe2+. TIG equilibrated in hydrogen at 670 Econtains about 100 ppm OH-groups. The behaviour of TAG in a H2-contalnlng ambient at temperatures above 1720 K was Investigatedby Devor and colleagues [15]. IR-spectrometry revealed that pro-tons entering the lattice occupy Interstitial positions; they arelocated between two oxygen Ions forming a 0----H----0 group.Typical iR-absorptlon peaks were detected at 3340 and 3374 cm'1.To derive a compensation mechanism Devor et al. consider naturalgarnet CajAlgSljOfg (grossularlte); the synthetic garnet Isformed with T3+ In the dodecahedral ca2* position and Al3+
In the tetrahedral Si** position. Following their results theproton la localised around the T- and octahedral Al-sltes In TAG.The substitution of Al34 for SI** (In the hypothetical tran-sition from grossularlte to TAG) makes the tetrahedral Al-slte lootmore negative. Following Devor and others, a H* compensationmight be expected by an electron. Horeover, Impurities can play anImportant role as charge compensating species in TAG. The intersti-tial proton can leave the position between the two oxygen Ions andmove free through the lattice at elevated temperature.
Ve performed II absorption mesurements In pure single crystallineTAG and high temperature electrical measurements on polycrystal-Une and single crystal TAG.
14.2 INTKABCD BANDS IN AtHtALlO SINM.C CRYSTALLINE XAS
In [IS] the authors have shown that hydrogen causes IK-absorp-tion peaks at 3340 cm'1 (strong) and at 3374 cm'1 (weak). Due tothe relatively low absolute concentration of protons in TAG, evenafter annealing in a Hg-contalnlng ambient, the samples must besufficiently thick; Devor et al. used samples about 125 mm (()thick to obtain the IB-spectra presented In their paper (thenumber of scans is not mentioned).
Ve made annealing experiments using single crystalline TAG-bars(2O«9«l. 9 mm) of Verneu11-grown material (H2/H20-flame); sothe a* received crystals contain hydrogen. Samples were treated
120

for 12 n at 1670 K in H2/H2O and IB-spcctra were taKen. Ourspectra were recorded at room-temperature with a BBUEEB FT-IBspectrometer; resolution: 2 cm"1, 2000 scans. In a subsequentstep the samples were annealed for 12 h at 1670 K In oxygen. Fig.14. 1 elves the IR-spectra for both samples showing OH-peaks at 3331and 3366 «•>, which are approximately the same wavenumbers asreported In [15). Nakamoto and coworkera [17) gave an IB-frequencyvs. d (Inter-Ionic distance) curve for molecules. Applying thisrelationship we can derive the oxygen-oxygen distance In the0 H O configuration; for the stretching frequencies 3331 and3366 cm-l the distances are 0.2805 and 0. 2642 nm respectively.Crystallographlc data [20] showed O*--o*- distances of dol:O.2Sieand dO0=O. 2037 nm (see fig. 2.1). These values indicate respec-tive H-bonds between unshared oxygen pairs in the octahedralAl-coordlnatlon, and also between pairs shared in coordination ofadjacent dodecahedral T-sites, the Al- as well as the T-site maypartly be occupied by lapurlty cations. (Balaer et al. [IS] testedthe Hakaaoto relationship for H-bonds in a-alualna and they con-cluded that the rule works with good accuracy).
The Intensity of the OH-peak is decreased after a 12-hour heattreatment in oxygen at 1670 C due to an outgas process, butnevertheless a residual absorption Is still present after such anannealing treatment.
0.0s
0.0
0.04
3300 3350MflVENUMBEHS CM-1
-0.0013300
MflVENUMBERS CM-13*00
Fig. i4.1 OH-bond absorption after (a) annealing tZ b in O2(T-1670 t) and (b) annealing iZ b in Hg/HgO (T~t6T0*). Length of the sample SO am.
121

14.3 CUECTRICAL TR/VHSPORT PRCPCRTItS Of
IN A
Ve Measured the activation energy of the conduction proceas forundoped single crystal and for Zr-doped polycrystalline YAG InCO/CO2 and in H2/H2O Mixtures having approximately the same pO2.In both cases the activation energy in a hydrogen-containingatmosphsre was much lower (tab. 14.1) than In a CO/CO2 ambient.
Tab. 14.1 Activation energy Ea for the conduction processfor different TAB samples in CO/COs and Hg/MgOatmospheres at high temperature.
SAMPLE ATMOSPHERE PO2 (Pa) E a [eV]
TAG: 50 Zr# CO/COg lO'11 3.54(polycryst. )
H2/H2O iO"1* i. 91
iO~ *° 3.7
10" 1* 1. 4ft
* impurity content see tab. 11. 1" impurity content see tab. 13. 1
The fact that the activation energy In Hg/H20 is considerablylower than In a CO/CO2 ambient with nearly the sasw oxygen partialpressure indicates that different processes are responsible forthe experimentally determined Ea's. Oxygen vacancies do not playa dominant role in b££Ji cases, their concentration should be com-parable due to comparable pO2's in both gas mixtures. In a H 2/H 20atmosphere, protons are expected to play a dominant role in thedefect chemistry. Furthermore the allovalent doping element Zr, whchanges the valency from 4+ to 3+ at low pO2, governs the conductlprocess In TAG: Zr.
In the following, we analyse the defect reactions which are expectto occur and expressions for the activation energies are derived.
122
TAG*(singlecryst. )
CO/CO2
Hg/Hg
14.3.1 The activation energies fer a in rAB:Zr In
As a probable reaction we consider the following
eq.-14. 1 1/2 H2(g) 4 > h y • e'
with the aass action relation
[Hi-He')eq.-14. 2 — - — » K H 2 exp [-EH2/KT]
H » / 2
EH2 represents the energy to produce an interstitial protonand an electron and Kjjg Is the equilibrium constant.
In TAG: Zr the Zr**-ion acts as a donor. Tfce concentration ofthese donors decreases with decreasing pO2 because Zr**reduces to Zr3+. Colour centres are foraed. The reaction reads
eq. -14. 3 Zr yx * *• ZrY' + e*
with the mass action relation
[ZrT-)[e')eq. -14. 4 s Kir exp [-BZr/ltTJ
2«
The neutrality condition is
eq. -14. 5 IZrT*) + [H4"] = [e'J
123

and we aet the lirconlum concentration
eq.-14. 6 [ZrTx] • [ Z r Y ] = [Zr)tot-
In a CO/COg-atmosphere zirconium Is reduced and eq. -14. 6 readsthen [Zr Y
x]=[Zr] t o t and the electroneutrallty conditionIs [Zry'] = [e']- Applying the eq.-14. 2 together with the neutralitycondition we find for the activation energy for electronic con-duction
eq.-14. 7 Ea(electronlc) : 1/2 E Z r
The activation energy Ea(electronic) in Zr-doped TAG in aCO/CO2-atmosphere is 3,54 eV (see tab. 14. 1), so we find thata redox energy EZr=7. 1 eV. This is approximately the same valuewhich was derived In section 11.4 (6-7 eV). If the Zr-concentra-tlon would be governed by IZry'l = tZr)tJ>t t n e activationenergy for the electronic conduction should then be zero, which isnot the case.
In a Hg/HgO-atnosphere we found a much lower activation energy(1.91 eV). The electroneutrallty is set equal [Hi']=[e']- Assu-ming that protons are governing the conductivity the activationenergy should be
eq.-14. 8 Ea(hydrogen) = Ea(electronic) = 1/2 Ef|g
From eq. -14. 8 we see that the Bug Is 3. 8 eV.
M.3.2 The actIvatl«4i •ncrtles far v In untfapwtf YAB In
In undoped TAG we found the activation energies 3. 7 eV In CO/COgand 1.46 eV in Hg/HgO. Donor centres are not present in the star-ting material - we consider the material as acceptor dominated (sesection 13). The basic defect reaction in CO/COg is the formationoxygen vacancies (eq.-14. 9) and the uptake of protons.
124

eq.-14. 9 0 0 « > Vo • + 2 e' + 1/2 o 2
The mass action relation Is
eq.-14. 10 [Vo'lte'lSpOa1/2 z Kox exPf-E0X/KT]
with K o x the equilibrium constant and E o x the energy for theredox process. If 2[V0*')=[A'l (A'^acceptors) we find for theredox-energy
eq.-14. 11 Et(electronic ) = 1/2 E o x
which leads to a redox energy of 7. 6 eV, which is comparable tothe value found by Sotman and coworkers [21] and somewhat higherthan the value of 6. 1 eV which we derived by computer simulation(see chapter 16).If we assume YAG-sample to be pure ([e']=2[V0" ] ) the acti-vation energy and the redox process are related by
eq. -14. 13 Ea(electronic) - 1/3 E o x.
In a hydrogen containing atmosphere the defect situation isgoverned by the presence of protons. The electroneutrallty rela-tion in this case is [H^Jite'J. This gives for the activationenergy in a Hg/HgO-atmosphere
eq. -14. 12 E a = 1/2 E H 2.
Following this equation the energy Ejjg is 2.9 eV. In the previouschapter we found E]j2 In Zr-doped polycrstal line to be 3. a eV,which is somewhat higher than the result discussed here.
125
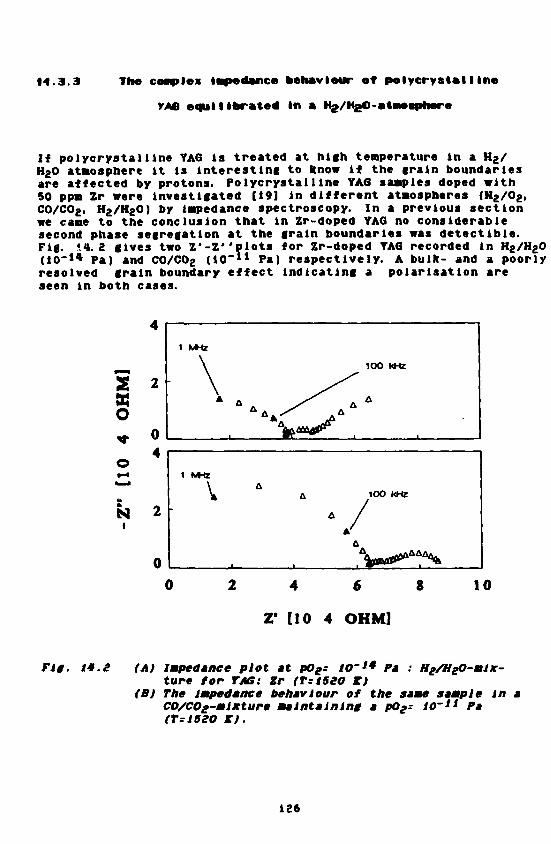
14.3.3 The complex Impedance behaviour of polycrystal I Ine
TAB equilibrated In a Hs/HgO-ataosptiere
If pol/crystalline TAG Is treated at high temperature In a Hg/HgO atmosphere It Is interesting to know if the grain boundariesare affected by protons. Polycrystalline YAG samples doped with50 ppm Zr were investigated [19] in different atmospheres (Ng/Og,CO/COg, Hg/HgO) by Impedance spectroscopy. In a previous sectionwe came to the conclusion that in Zr-doped TAG no considerablesecond phase segregation at the grain boundaries was detectible.Fig. S4. 2 gives two Z'-Z"plots for Zr-doped TAG recorded in Hg/HgO(10~14 Pa) and CO/COg (10"*1 Pa) respectively. A bulk- and a poorlyresolved grain boundary effect indicating a polarisation areseen in both cases.
S 2Xo* °
4
N 2
1 fcHz
1OO MHz
1 M-tZ
V A 1OO KHz
A /
2 4 6 8
Z' [10 4 OHM]
10
Fig. 14.a (A) Impedance plot *t pOg= 10'** Pa : Hs/HgO-mix-ture for TAG: Zr (TztSSO Z)
(B) The impedance behaviour of the same sample inCO/COg-mlxture maintaining a pOg: io~ii Pa(T=iSSO K).
126

As It Is expected for the n-type conducting Zr-doped YAG a ofthe bulk decreases (the resistance increases) with increasing pQ2:H b u l K = 37KQ at p02 = 10-
1 4 Pa and 63. SKfi at 1O"*1 Pa (fig. 14. 2).Additionally it has to be taken into account that the conducti-vity in a Hg/HgO mixture is higher than in a CO/COg atmosphere.The grain boundary resistance for the sample in both cases, atlow and high pO2, can be estimated from the impedance plotsto be about 10 kfi. The frequency dispersion (see the 100 kHzpoints in fig, 14.2) nearly Is the same, in spite of the factthat one spectrum was recorded in CO/CO2 and the other InH2/H2O.
From the experimental results given above we can conclude thatprotons which enter the lattice have no substantial Influence onthe electrical properties of the grain boundaries. The effects weobserved are bulk effects.
14.4 CONCLUSION
When YAG is equilibrated in a hydrogen containing atmosphere pro-tons enter the lattice. OH-groups are detectable by IB-spec-troscopy. Electrical transport properties are also altered by thepresence of protons, as seen from the marked difference in theactivation energies for a in CO/CO2 and H2/H2O atmospheres. Im-pedance measurements made clear that mobile protons are alteringthe bulk- but not the grain boundary properties.
LITfRATURC
[1] 6. J. Hill, Br. J. Appl. Phys. Ser. 2, 1 (1966) 1151.[2] H. Iwahara, H. Uchlda, J. Eondo, J. Appl. Electrochea. ,
H (1963) 365.[3) C. E. Vagner, Ber. Bunsenges. Phys. Chem., 12. (1966) 776.[4] S. Stotz, C. t. Vagner, Ber. Bunsenges. Phys. Chem. , 2ft
(1966) 781.[5] T. Norby, P Kofstad, J. Am. Ceram. Soc. , §1 (1984) 786.[6] idem in J. Am. Ceram Soc. , £& (1966) 784.[7] S. E. Mohapatra, P. Tlku, F. A. Eroger, J. Am. Ceram. Soc. ,
££ (1979) 50.[8] E. H. Lee, 6. E. Holmberg, J. H. Crawford Jr. , Phys. Stat.
127

Solldl A. 12 (1977) 669.[9] t. Eigenmann, K. Kurts, H.H. Günthardt, Helv. Phys. Acta,
45. (1972) 452.(10) H. Engstrom, J. B. Bates, J.C. Van«, H.H. Abraham. Phys.
Rev. B, £1 (1980) 1520.[11] P. H. Mehrotra, 6. V. Chandrachekar, C. H. R. Bao, E. C. Subbarao
Trans. Faraday Soc. , £_£. (1966) 3566.[12] J.KPope, G. Slmkovlch, Hater. Ses. Bull., £ (1974) m i .[13] 8. Vaser, Ber, Bunsenges. Phys. Chem, £2. 1967 2343.[14] H. Kathreln, F. Freund, J. Phys. Chem. Solids, 44 (1962)
177.[15] O.P. Devor, 8. C. Pastor, L. G. DeShaser, J. Chea. Phys., 6J.
(1964) 4104.[16] D. L. Vood, E. D. Eolb, J. P. Bemelka, J. Appl. Phys., H
(1966) 1139.[17] K. Nakamoto, H Hargoshes, 8. E. Bundle, J. AB. Chem. Soc. ,
7_Z (1955) 6460.[16] P. Balmer, H. Blum, H Forster, A. Schwaiger, H.H. Gûnthard,
J. Phys. C: Solid State Phys., XI (I960) 517.[19] L. Schuh, 8. Metselaar, G. de Vlth, Sel. Cer. , 14 (1968)
973.[20] see flg. 2, l and references given In chapter 2[21] S. B. Botman, B. P. Tandon, H. L. Tul 1er, J. Appl. Phys., 51
(1985) 1951.
126
15 SINTER ADDITIVES AND MICMSTfiUCTVBE
Sinter dopes are widely used In ceramic technology to controlgrain growth and to achieve a high denslflcatlon rate. For thesintering of oxides allovalent ions *rt used. So lattice defectsare introduced Into the system, which affect lattice-, grainboundary-, surface-diffusion, grain boundary nobility and otherprocesses. Furthermore the segregation of second phases at thelntergranular Interfaces controls the grain growth. Concerningthe role of additives in sintering, alumina Is the best describedmaterial in ceramic literature (e.g. [1]).
For ternary compounds as Y3AI5O12, many more high temperature pro-cesses have to be considered than in the case of binary compoundsas AI2O3. Harmer and coworkers [2] state that for BaTlOj, for ex-ample, it is possible to assume some 36 possible rate control-ling mechanisms.
Hothlng about the controlling effect of sinter-additives in TAGhas been published until now. Ve investigated how the grain sizedistribution depends on the presence of the allovalent additivesMgO, CaO, ZrO2 and HfO2.
15.t EXPERIMENTS
All samples were prepared applying the standard preparation methodwhich was described earlier. As reference material we considerpure YAG-powders with an impurity content < 30 ppm (donors andacceptors nearly compensate each other). Samples containingfollowing concentrations of sinter additives were prepared andcompared with the undoped material:
Tab. 15.1 Samples for grain site analysis.
TAGYAGYAGYAGYAGYAGYAGYAG
5060SO
200420T50150300
ppmPPmPPmPpmppmPPmPPBPpa
CaOHgO"HfO2
HfO2
HfOgHfO2ZrO2
ZrOg
1 SOO ppm HgO were added to the starting powder, thethe final material contained 50 ppm HgO, due to evaporation.
129

The grain size distribution was determined by analyzing SEM-pic-tures from representative areas of the sample surface. The analysingprocedure was done semi-automatically by applying the intersectionmethod [3] (equipment and and computer programs were developed byMr. corbljn from the Philips Research Labs., Dept. InorganicMaterials). Results of the particle slse analysis are representedin the form of frequency vs. lg grain sue and probability vs. lggrain size.
15.2 RESULTS AH> DISCUSSION
Fig.IS.l shows a mlcrostructure of undoped TAG; a somewhat dlscon-tlnous grain growth Is obvious. According to the Hlllert [11]criterion, grain growth is exaggerated when grains are present witha grain slse two times larger than the average grain slse. A widegrain size distribution ranging from 1 pm to 20 pm is typical.Analysing the grain size distribution shows a clear blmodal modewith a mean grain slse (for the area shown in fig. 15.l) of3.3 pm. The complete results of particle size analyses for allsamples listed in tab. 15. l are given in tab. 15. 2.
Even small concentrations of the sinter additives Mgo and CaOhave a strong grain growth inhibiting influence on TAG (see fig.15.2). The grain size distribution is narrow, no discontinuousgrain growth is detectable. A blmodal mode is found again. TAGdoped with 50 ppm Mgo has a mean grain slse of l. 6 pm and TAGwith 50 ppm CaO exhibits a mean grain slse of 0. 8 pm (which issimilar to the grain slse of the starting powders). All samplesinvestigated here are translucent and have a density of more than99 x of theory.
The dopants ZrOg a n d HfO2 also suppress discontinuous graingrowth (fig.15. 3), but In comparison to MgO- and CaO-dopedmaterial the mean grain slse Is shifted to higher values, e.g.2.1 pm for TAG:200 Hf. Again the particle slse distribution wasblmodal.
130
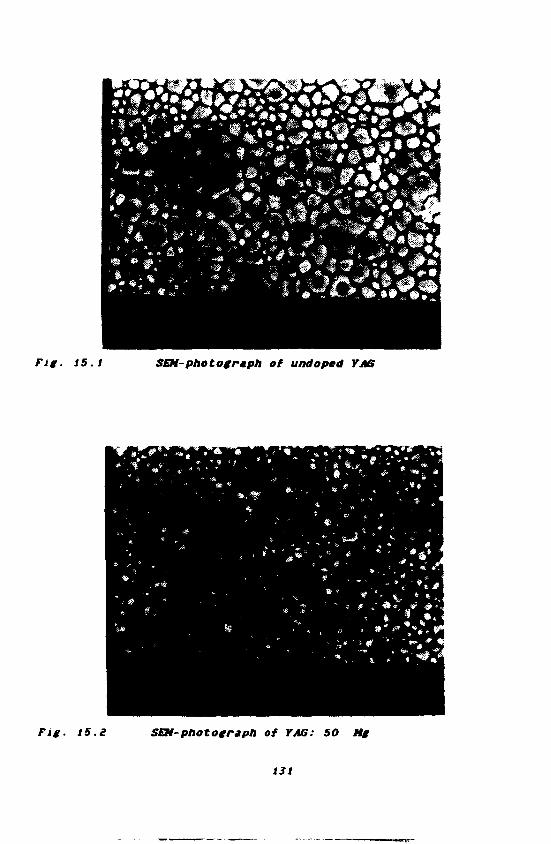
%'/ * • *
SEM-photograph of undoped TAB
Fig. 15. SOI-photograph of YAG: SO Mg
131

Fig. SS.3 SEH-photograph of TAB: 750 Hf
A plot of the grain size distribution for TAG doped with 480 and750 ppm HfOg respectively is presented in fif. 15. 4. With increa-sing Hf-content the mean grain size is significantly shifted tohigher values, while the shape of the grain size distributionbroadens.
30
0
Hf O,
420 ppm
750 ppm
0 8 10Fig. 15.4 Grain site distribution for YAG doped with 420 and
750 ppm HfOz.
132
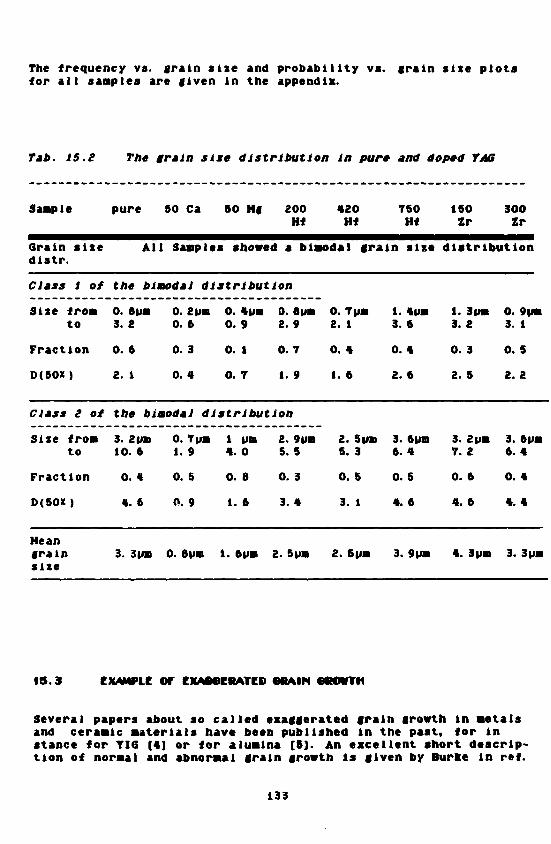
The frequency vs. train site and probability vs. grain slse plotsfor all saaples are given in the appendix.
Tab. 15.£ The grain siie distribution in pure and doped TAB
Saaple
Grain sitedistr.
Class i of
Slse froato
Fraction
D(5OX)
Class 2 of
Size froato
Fraction
D(5OX)
Meangrainsize
pure 50 Ca 50 Hg 200Hf
420Hf
750Hf
All Saaples showed a blaodal g r a m sis*
the bimodal distribution
0. Spa3. 2
0. 6
2. 1
0. 2 pa0. 6
0. 3
0. 4
0. 4pa0. 9
0. 1
0. 7
0. 8pa2. 9
0. 7
1. 9
the bimodal distribution
3. 2 pa10. 6
0. 4
4. 6
3. 3pa
0. 7 pa1. 9
0. 5
0. 9
0. 8 pa
1 pa4. 0
0. 8
1. 6
1. 6pa
2. 9pa5. 5
0. 3
3.4
2. Spa
0. 7 pa2. 1
0. 4
1. 6
2. 5 pa5. 3
0. 5
3. 1
2. 6pa
1. 4MB3. 6
0. 4
2. 6
3. 6pa6. 4
0. 5
4. 6
3. 9pa
150Zr
300Zr
distribution
1. 3 M B3. 2
0. 3
2. 5
3. 2pa7. 2
0. 6
4. 6
4. 3 pa
0. 9 pa3. 1
0. 5
2. 2
3. 6pa6.4
0. 4
4. 4
3. 3pB
15.3 OUMV>LE OF CXAMCRATCD W A I N 6B0WTH
Several papers about so called exaggerated grain growth in aetalsand ceraalc aaterlals have been published In the past, for instance for TIG [4] or for aluaina [5). An excellent short descrip-tion of noraal and abnoraal grain growth is given by Burke in ref.
133

[ft]. Various explanations for exaggerated grain growth are givenin literature. So It was shown by Beck and coworkers [1] that thephenomenon can be associated with the disappearance of Inclu-sions by solution. Kooy [4) assumes that the effect in TIGshould be due to the presence of a liquid phase at the grainboundaries. The rate of exaggerated grain growth is then deter-mined by a solution and precipitation process rather than bygrain boundary migration.
In one of our TAG samples doped with T50 ppm ZrOg grains of some100 pm were observed as shown in fig. 15. 5. This effect should becaused by impurities, unintentionally present in the green body;the forming of a liquid grain boundary phase, which was found inTIG to be responsible for exaggerated grain growth, cannot beexcluded. The model proposed by Beck et al. [7], which associatesabnormal grain growth with the disappearance of Inclusions (orpores), seems not to be an appropriate one. Our accidentalfinding In TAG demonstrates that controlling the Impurity anddopant content in the starting powder and the green body is essen-tial to obtain a homogeneous microstructure.
Fig. tS.S Exaggerated grain growth in TAG sintered under stan-dard conditions.
134

IS. i CONCLUSION
CaO and MgO are effective grain growth inhibitors, with CaO being•ore effective. HfOg and ZrOg proaote grain growth with thestrong tendency to suppress exaggerated grain growth, which isobserved in undoped TAG ceraalcs. Ca and probably also Mg controlthe grain boundary by foralng a second phase at the grain bounda-ries.
LITERATURE
[I] S. J. Brook, Proc. Brit. Ceraa. Soc. , S£ (1982) T.[2] H. P. Haraer. H. M. Chan, D. M. Sayth, Hater. Bes. Soc. Syap.
Proc. , M (1906) 125.[3] H. E. Exner, Z. NetallKde. , £1 (I960) 755.[4] C. Kooy, Scl. Cer. ,1 (1965) 21.[5] H. L. Coble, J. Appl. Phys. , 1£ (1961) 787.[6] J. E. Burke in "Ceraalc Mlcrostructures - Their Analysis, Sig-
nificance and Production", Ed. by B. V. Fulrath and J. A. PaskJ. Wiley t Sons, 1968, p. 661.
[7] P. A. Beck, H.C. Holsworth, P. Sperry, Trans. AIME, lOO(1949) 163.
[8] K. A. Berry, M. Lynch, unpublished work aentloned in ref. [2).[9] T. Sakabe, J. Appleby, Y. H. Han, D. Vintergrass, D. M. Sayth
86th Annual Meeting of the Aaerican Ceraalc Society, papernumber 123-E-84. 1984.
[10] C. A. M. Mulder, G. de With, Solid State Ionics, 1& (1965)81.
[II] M. Hillert, ActaHetall., H (1965) 227.
135

16 COMPUTER SIMULATim Of DEFECTS IN MMETSIn the recent years computer modelling of perfect and defectivesolids has become Increasingly Interesting. Experiments are aone-times supplemented by a computer simulation In order to support ordismiss a proposed model. On the other hand such simulations can beused to obtain basic data which may be difficult to determine byexperiments (e.g. the formation energy for Schottky and Frenkeldefects In an ionic crystal). Defect calculations have been veryextensively applied In studies of ionic oxides and halldes. Thereare several papers and review articles dealing with the potentialand limitation of computer simulation of bulk solids and surfaces[e.g. 3-6]. In most cases calculated data, like lattice energiesor dielectric constants, are in good agreement with experimentalresults [1,2]. In the future simulation techniques of solids maybecome a predictive tool in materials science which can lead toa development of improved materials with "tailored" properties.
Ve used the computer simulation of solids to get basic defectformation energies and more complex data (e. g. redox energies,activation energies of diffusion processes etc. ).
i 6 . i Tracer or ocrecT CALCULATIONS - A SKETCH
The crucial questions of defect chemistry are atomistic questions.First of all - what are the diffusing species; are they vacanciesor lnterstltlals or both; what Is their charge; are they associatedor free? Second, how are they formed; are they extrinsic or intrin-sic; if intrinsic are they formed by oxidation or reduction; if ex-trinsic, what are the impurities responsible? Third, what are themechanisms of migration? These mechanisms depend on the nature ofthe diffusing species. For a given defect, however, there can bemore than one mechanism, e.g. as In alkaline earth fluorides [7].
For Ionic materials the theory of lattice defects is largely con-cerned with two main problems:
1) the derivation of suitable interatomic potentials(in strongly ionic materials two body potentials)
2) the treatment of the lattice relaxation around a latticedefect.
For the first problem, the derivation of appropriate interatomicpotentials, there are two essentially different approaches. Thefirst, which was based on the work of Fuml and Tosl [8], involvesthe use of Born-Mayer - or Buckingham - potentials which areparameterised empirically by fitting the calculated perfect latticeproperties as closely as possible to experimental values. The perfectlattice properties to which data are fitted are usually lattice para-
136

meter, lattice energy, elastic and dielectric constants [9).The Buckingham potential Is given by
eq. -16. 1 V(r) = A exp(-r/d)-Cr"°
The parameters A, d and C must be assigned for each Ion-ioninteraction and r is the distance between a given pair of ions.By this procedure foiricai short range potentials are ob-tained. Such potentials are used here. An alternative approachis to calculate interatomic potentials, e. g for metals, with thethe electron-gas Methods [10). These non-empirical potentialsare seldomly used at present, however.
An essential point In the computer simulation of defective solidsis the introduction of the ionic polarisation. Despite Itssimplicity the shell model introduced by Dick and Overhauser [11]to calculate the dielectric properties of alkali halldes remainsthe most effective way of doing this.
The second question, the lattice relaxation around a defect.In recent calculations is mainly discussed in terms of a modeldeveloped by Lldlard and Horgett [12] and Horgett [13). The basicidea behind this model Is a minimisation of the total energy ofthe crystal by relaxation of the positions of the ions around thedefect. This relaxation decreases fairly rapidly for increasingdistances away from the defect. To treat this mathematically, theregion around a defect is partitioned Into two concentric spheresas shown in fig. 16. l
D - defect
Fig. 16.1 Spherical tones around a defect,
137

In the central region the forces exerted by the defect on the sur-rounding lattice are strong and the relaxation in this region Ishandled by an explicit energy minimisation. In that procedure thepositions of all atoms (considered originally to be on perfectlattice positions) are adjusted under the action of interatomicpotentials until they are In equilibrium. The ions are allowed topolarize. In contrast to this explicit treatment of the inner re-gion a more approximate approach Is used for the outer region.Due to the greater distance the perturbing effect of a defectis relatively weak. The procedure applied therefore is theHott-Llttleton approximation describing the polarisation of acontinuum of solids [1]:
eq. -16. 2 P :
P Is the polarisation in the outer region (region II, see fig.lft. 1), V is the unit cell volume, q is the charge of the defect,rj is the distance for which P is calculated, € 0 is the dielec-tric constant and, finally, r is the distance of the particles.Eq.-16. 2 is only valid for electrically lsotroplc materials.
A detailed discussion of the simulation procedures is givenby Catlow and Hackrodt [1] and by Cat low [14). There is now anumber of computer codes for undertaking such calculations.The original HADES-code (Harwell Automatic Defect EvaluationProgram System) developed by Horgett [15] could be applied onlyto cubic materials. A further developed HADES-code (HADES III)allows to study non-cubic systems [1). The code applied in thisinveslgatlon Is the CASCADE-code (Cray Automatic System for theCalculation of Defect Energies) developed by Leslie [16). Thisprogram was created to exploit the vector processing facilitiesof Cray-computers. CASCADE Is a combination of HADES III and theperfect lattice simulation program PLUTO (Perfect Lattice Unre-stricted Testing Operation) developed by Catlow and Horgett [17].PLUTO calculates by energy minimisation lattice energies, elasticand dielectric constants for perfect crystals with the restrictionthat a static lattice Is simulated (no thermal motion). Despitethis restriction the results of CASCADE simulations (e.g. defectformation energies) are appropriate to predict properties severalhundred degrees below melting point; the defect forming energiesdo not not change with temperature to a great extent.
lt>.2 THE PERFECT LATTICE PROPERTIES €T
It is commonly assumed that the parameters Introduced into the
138

Buckingham potential are constant for ions in different crys-tal lographic surroundings. The quality of the parameterisation Isusually checked by comparing the high frequency- and static di-electric constant and the elastic constants Known frosi experimentwith those calculated by PLUTO. Due to the fact that no reliableyttrium potential was available a potential was derived fromSrO - Sr 2 + is lsoelectronlc with T3*. Yttrium (strontium) andoxygen cores and shells were introduced into perfect lattice cal-culations, while the small Al-lon was assumed to be unpolarlxable[18]. Besides TAG we also simulated defect properties of YIG. Bothgarnets have completely different physical and chemical properties(see section 3). The input parameters for YAG and YIG are given Intab. 16. 1.
Tab. 16,1 Input-parameters for the perfect lattice simulation
I OH A(eV) d(A) f* del) C°(eV*»)
Mgl*Nd3*
22764. 01345. 11469. 31102. 41453. 81090. 41280. 11379. 9
0. 1490. 34910. 299120. 32990. 35000. 34370. 31770. 36007
0. 8481-0. 2613. 0
-1. 973.0
-1. 1352. 0
-3. 25
74. 9203871. 70000
-304. 7000
-110. 2000
-145. 0000
27. 880. O0.0O. 00. O0. 00.00. 0
A = short range potential between cation and anlon in the Bucking-ham model
9 - parameter in the Buckingham modelY+- charge of the core in the shell modelK+= core-shell spring constant in the shell modelC°= attractive contribution in the Buckingham modelAI3*-parameters were taken from [3], the others from [18).
The dielectric and elastic constants derived by PLUTO are given intab. 16. 2 together with experimental values.
Tab. 16.2 Calculated anil experimental constants
CONSTANT
€o
Cj j
c12C44
YAGcalc.
8. 12. 939. 513. 511. 7
-602. 6
exp.
11. 03. 5
33. 311. 311. 5
YIGcalc.
10. 62.9
33. 712. 011. 1
-578. 7
exp.
27.It.7.
006
C11> C12 *n<1 C44 * r e ftiven in the units 10 1 1 dyn/cm2.Experimental values were taken from [19-21].
139

The calculated perfect lattice data for YAG and TIG given Intab. 16. 2 are close to experimental values. For the sake ofcomparison calculated and experimental dielectric and elasticconstants and lattice energies for AI2O3 and TiOg fromliterature are given In the appendix 2.
16.3 THE BASIC POINT DtrCCT rOBMATICN CNTROItS
As basic point defects we consider cation and anlon lnterstltlalsand vacancies. The energies to create such defects were calcula-ted for YAG and, for the sake of comparison, also for YIG.
Tab.16.S Formation energies for intrinsic point defectsin TAB and YIG
Empirical potential calculationsDEFECT (Charge) YAG [eV] YIG
21. 24
45. 89
nc
Iron vacancy (3-),d-slte 54.52
Aluminium vacancy (3-) 60,24(a-slte)
Iron vacancy (3-), a-slte 55.23
Aluminium interstitial (3+) -45.11
Schottky energy* 5. 32 4. 70
(for a single defect)
Yttrium Frenkel 10.44 nc(for a single defect)
Aluminium Frenkel 7. 57 nc(AI from a-slte)
Aluminium Frenkel 6. 88 nc(Al from d-slte)
• = E (defect energies) - lattice energy, nc - not calculated
140
oxygen vacancy (2+)
Yttrium vacancy (3-)
Yttriuminterstitial (3+)
Aluminium vacancy (3-)(d-slte)
£2.
46.
-25.
58.
35
50
62
90

The vacancy formation energy is the energy required to remove anion from a lattice site to infinity allowing, the regaininglattice to relax around the charged vacancy. The formation energyfor an interstitial involves the Movement o< an ion frominfinity to an interstitial lattice site. The combination theformation energy for an interstitial and a vacancy of an iongives the FrenKel defect energy; both defects are supposed to beindependent from each other. Due to the fact that there are twodifferent Al-sites, two different Frenkel energies (for the d- andthe a-slte) can be derived (see tab. 16.3). The radius of Y-lonsis rather large to form interstltlals in the garnet lattice, soY-FrenKel defect formation energies are considerably larger thanthe Al-frenkel energies.
From our vacancy formation energies the Schottky energy is calcu-lated as 106. 3 eV for a complete Schottky multlplett, which gives9. 3 eV per single defect in YAQ. This energy is tower than theFrenkel energies (6.9-7.6 eV). So It can be concluded that thatSchottky vacancies are the favoured intrinsic defects. Derivingsingle Schottky- or Frenkel-defect energies by dividing the energyof the defect multipletts by the number of defects does lead toaverage values. But Catlow, Hackrodt and others [2,3,5,61 intro-duced this simplification and it became the most common way toderive such energies from simulation data.
16.4 rOKtten CATIONS IN YAB /*M> XI©
The properties of ceramic materials are strongly influenced byintentionally and unintentionally present impurities. These ionsare expected to occupy specific sites depending on their radiusand charge. The radii [22] we used are given in tab. 16. 4 togetherwith the lattice site they will occupy [23,24). The reason why Hdas a foreign ion was treated as a substitutlonal defect will becomeclear later.
Tab. 16.4 Ionic radii ami substitution sites in the YASlattice
Species
Kg (2+)Zr (4+)
Ca (2*)Nd (34)
Radius la]"
0. 690. 720. 761. 121. 12
Substitution site*
c-site (Y)a-slte (Al)d-slte (Al)c-site (Y)c-site (Y)
"taken from [22], * taken from [23,24]
141

The energies for Introducing the ions into the YAG lattice bysubstitution are given in tab. 16. 5. Potentials and other para-meters necessary for the CASCADE procedure are given In tab.16. 1 (taken fron (18) ).
Tab.16.5 Calculated energies tor substitution*!detects in YAS
YAG
Y16
Defect
Mgy'
«rAr
ZrT '
Zryx
Cay'
c * A l '
Hdyx
Cay'
type
(d-slte)
(a-site)
Energy [eV]
18. 3
-19. 33
-20. 76
-33. 16
1. 2
23. 0
36. 7
3. 1
23.07
16.3 OXIDATION/REDUCTION PROCESSES IN YA0 AND TIC
The oxidation of YA6 can be written for the infinite dilutionUnit (no defect-defect interaction) as
eq. -16. 3 V o " • 1/2 O2 < » Oo* + 2h'
Ve assuae that the holes fora small polarons. In a separate CASCADEsimulation the energy of an O~ on an O2~ position was esti-mated to be 18.6 eV (=E0-)- To derive the hole formation energy
142

following the reaction o ox + h'—> 00* we have
to combine E o- with the second electron affinity o< oxygen.E o x can be calculated by applying the relation
eq. -16. « E o x - -E V o • I/* E D l g a - E 1 2 • 2 E n
: -22. 36 • 6. 16/2 • 7. 28 • t 9. 86
= 7. 2 eV (696 KJ/Hol)
= oxygen vacancy formation energyEDlss = dissociation energy for Og (taken froa [32])E 1 2 : first electron affinity for O 2 (taken froa [32])E n = hole formation energy ( = EQ- - Eg =
18.6 - 6.76 : 9.65 eV, Eg (second electronaffinity) was taken froa [32])
In doped YA6 a clustering of defects can occur. Consideringthe interaction of Oo* with substitutlonal Ca-lons we calculat-ed that the cluster (Cay'-OO')
K is stabilised by 0.31 eV.So the energy for the redox process is reduced. Per reactiongiven in eq. -16. 3 two holes must be taken into account. This non-infinite diluted Ca-doped systea has a redox energy of 6.66 eV,which is in fact a relatively high hole foraatlon energy.
Another possible redox process that aay occur in TAG is the follow-ing
eq.-16. 5 O o* « > V o' " + 1/2 Oe • 2 •'
In the defect calculation we assume that the electrons are locatedon Al3+-lons foralng A1 A|' defects with a energy EA12+of 31.6 eV (saall polaron). We get the polaron foraatlon energy bycombining E A u + with the third lonlsation potential of At. Theenergy associated with the reaction given in eq.-16. 6 Is
143

eq. -16. 6 E o x = E V o - */« E D l s s + E 1 2 - 2Ee
= 6. 36 eV (614 KJ/Mol).
energy for snail polaron A1 A]'<s EA12+ " E3. lonis == 31. 6 - 28. 53 s 3. OT eVE3. lonls t*«»n from [28])
Rotman and coworkers [27] by measuring the temperature dependenceof the electrical conductivity found for the redox energy given Ineq. -16. S a value of 7. 8 eV. Their material was acceptor dominatedsingle crystalline TAG.
In Ca-doped TAG oxygen vacancies can Interact with the substl-tutlonal Ca-lons. This process raises the redox energy for thereaction given In eq. -16. 3 and the redox energy for eq. -16. 5 islowered.
We look at the energetics of the dlmer [Cay'-Vo'')' and trimer[CaT'-V0''-Cay']
x formation. Dlmers and trimers are associated withan energy of 1 eV and 1.7 eV respectively. This effect reducesthe energy for the reaction given In eq. -16. 5 to 5. 36 eV ifdlmers are formed. For the case of heavily Ca-doped TAG the re-dox energy is «. 66 eV, when trlmera may form. If holes areformed In Ca-doped TAG following eq.-16. 3 the energy for thisreaction will be 6.2 eV when dimera and 8.9 eV if trimers arepresent.
In a body centered cubic lattice containing 500 ppm foreign Ionsthe statistical probability to find two of them In adjacent lat-tice sites is 0.053; so the probability that trimersCay'-V0'"-Cay' are formed In TAG: 500 Ca can not considered tobe sero.
These calculations clearly show that an association of defectscannot be ignored. Comparable or even greater defect-defectInteraction energies were, for Instance, reported forT 1 A r - v A l ' " l n alumina [25] and for Sc Ce'-
vo" l n cerla [26].
Following our discussion of redox energies in oxides it should bementioned that Mackrodt reports the energies for processes equi-valent to eq. -16. 3 and 16. 5 ln alumina to be 4. 4 and 9. 1 eV respec-tively [2], for the case of infinite defect dilution. This meansthat ln alumina the hole formation energy (4.4 eV) is relativelylow. According to our result we expect that ionic conductivitydominates ln acceptor doped TAG, due to the high hole formation
144

energy. Actually we find the ionic transport number t=l in theentire pOg-regime in TAG containing S00 ppm CaO. Fig. iO. 2 showsthe ionic transport mmber for TAG: 600 ppm CaO at two temperatures.At ilOO K the conductivity is ionic, at 1470 K a considerable p-type electronic conductivity at high pO2 is obvious. Withincreasing temperature the electronic conductivity becomes soreand sore dominant. Our simulation results are in accordance withthis experimental fact, in alumina doped with much higher acceptordoping levels there Is always a distinct hole conductivity, evenat lower temperatures. This fact can be explained by the lowerhole formation energy in
Several papers show that redox reactions in TIG are much easierthan In TAG. This can be explained by the nature of the iron ions.A difference between TAG and TIG is the presence of an ion witha variable valency in the latter. The energy for the reductionof Fe3* to Fe2* in TIG was calculated to obtain an impressionabout the difference In the redox behaviour of TAG and TIG on anatomic scale. In the CASCADE procedure Fe 3 + was replaced by Fe2*,which was considered as a small polaron. The energy connected withthis small polaron was calculated without paying attention to 11-gand field effects. Since llgand field effects are ignored here,we should correct the formation energy for the ligand field split-ting of the iron In the oxygen environment. The llgand field split-ting energy tug for a-Fe2O3 is given as [6,31]
-2/5 174 KJ/Mol -- -69.6 KJ/Mol = -0.72 eV.
The energy for creating a Fepe' was calculated to be 26. 9 eV.A reaction involving the reduction of iron-ions in TIG is
eq. -16. 7 2 Fe F e* • 0 0* < > Vo-- • t/2 O 2 • 2 FeFe*
The energy is calculated as
145

eq.-16. 8 E = E V o - »/* Edlss + E 1 2 • 2 E F e - E l l g
= 81. 24 - 5. 16/2 - 7. 28 - T. 5 - 0. 72
= 3. 16 eV (= 305 kJ/Mol)
E F e = IP(Fe(2*J - F«(3*)) " E(Fe F e'= 30. 651 - 26. 1 = 3. 751 eV
IP : lonlsatlon potential(from [281)
The energy for a reaction following eq.-16. 7 involving a re-duction of iron-ions is relatively low, 3. 16 eV. So It Is the lowenergy for the redox reactions in TIG that allows processes whichare highly disadvantageous in TAG. e. g. a considerably higher re-versible loss of oxygen in TIG (see section 3).
16.6 THE DISSOLUTION ©T Ca© IN YMB
16.6.1 The energjy far substituting V by Ca
In this section we investigate Ca-lons in TAG from the atomicpoint of view. In the TAG-lattice Ca can only occupy the T-sites,because Ca has a large radius (12* larger than Y 3 + ) . The lowsolubility resp. the high segregation can be considered in termsof
1. a sine effect; the Cm-ion is 'too big" for the T-siteand the low solubility ana the grain boundary segregation iscaused by a "misfit strain".
2. a charge effect because a 3+ ion is substituted by a 2* ion.3. a combination of t. and 2.
In order to decide which of these effects dominates we calculatedthe energy for the substitution of T 3 + by an ion with the sameradius as Ca but with a 3+-charge, so that the effect we findis the "misfit strain". Nd3+ has the same radius as Ca2*.The energy for replacing T- by Nd-lons was calculated using a conplete set of CASCADE input parameters, which is given in tab. 16.1.
146

The formation of Ndyx needs 3.l eV. Replacing T by Ca forminga Cay' needs 23 eV. The difference between both defect ener-gies is mainly caused by the difference in the ionic charge. Whensuch a charged defect is created a charge compensating defect hasto be taken into consideration. In YIG the solubility of Ca reachesseveral hundred ppm because the charge is compensated by a valencechange of iron ions. Such a mechanism is not possible in TAG. Theenergetics of a process comprising the formation of oxygen vacan-cies and a slmultanous reduction of Fe Is considered later.
16.6.2 The s«lutl«n •nthalpy *f CaO In YM
A simple approach to estimate the solubility of CaO in TAG Is toderive the mixing enthalpy underlying calculated defect ener-gies. Ve have to consider the energy for a Ca-ion on a T-aitetogether with an appropriate charge compensation mechanism byanion vacancies or by cation interstltlals. Another compensationmode is a self-compensation in which Ca-substitutlonals arecompensated by Ca-interstitials. Self-compensation is not ad-vantageous because the formation energy of Ca-interstltlals isvery high. Hence we consider only the vacancy and the Inter-stitial compensation. The vacancy compensation reads
eq. -16. 9 CaO • Ty* • i/2 O o* < > Cay' • 1/2 V o " • 1/2 T 2O 3
Vlthln the model the displaced T-ions form yttriumoxlde at thesurface; so, besides the point defect energies we need the latticeenergy of CaO and T2O3. The lattice energy of CaO has beenderived earlier by a perfect lattice simulation procedure applyingthe same potentials we use in our calculation of the point defectenergies [6]; the calculated and the experimental values are thesame (36 eV). For Y 2O 3 no appropriate calculated values wereavailable, so we performed a PLUTO-calculatlon giving a latticeenergy of 136.4 eV. The experimental value is 131.6 eV [26]. Theenergy for the vacancy compensated process Is calculated byeq. -16. 10 using the energies given in tab. 16. 6.
147

Tab. 16.6 Component energies tor Investigation of thesolution enthalpy of CaO in YAB
Lattice energy of
Ca-substltutlon
Oxygen vacancy
CaOT8O3
In TAGin TIG
in TAGin TIG
36136.
23S3.
22.21.
eV 1614 eV
eV1 eV
36 eV24 eV
eq. -16. 10 ECa(sol) z E(CaO) • E(Cay) • 1/2 E(V0) - 1/2 E(T2O3)
ECa(sol) = solution enthalpyE(CaO) : lattice energy of CaOE(Cay) = Cay'-formation energyE(V0) : v0"'-formation energyE(T2O3) - lattice energy of TgO3
The solution enthalpies are:
TAG: 36 • 23 + l/£*22. 36 - 1/2*135.4 = 2. « eV s 242 HJ/mol
TIG: 36 + 23. 1 • 1/2»21. 24 - 1/2«13S. 4 = 2. 0 eV = 193 RJ/mol
The treatment of TIG Is simplified; the possibility that the defectsare compensated by a valence change of Fe is not considered In thethis calculation. We simply compare the same mechanism in twogarnets and we find a 20* lower solution enthalpy for Ca In TIG.The basic difference of TAG and TIG concerning their redox be-haviour has been discussed In section 16. 6.
Bearing in mind that the calculated solution enthalpy for HgO inalumina 1* about 3. 2 eV [3} for vacancy-compensation our,simulatedvalues for CaO in TAG seem somewhat low; but it is possible thatthe computed lattice energy for yttria is not accurate. When weapply experimental lattice energies (36 eV for CaO and 131. S eVfor T 2O 3) the solution enthalpy for CaO In TAG and TIG are 4.4 eVand 4 eV respectively.
148

As we mentioned at the begin of thla section, charge compensationcan alternatively be achieved by an interstitial mechanism follow-ing eq. -16. 11
eq. -16. 11 CaO • Yy* •—> Cay' • 1/3 Yt#"" + 1/3 Y 2O 3
For this reaction the calculated energy Is 5. 34 eV using simula-ted lattice energies, applying the experimental values an ener-gy of 6. 64 eV is found. An interstitial charge compensationmechanism consumes 2-3 times more energy than the vacancy com-pensation. So we can conclude that vacancy compensation domina-tes in YA6.
16.6.3 Clustering effects
This effect has already been mentioned in chapter 16. 5.If we simulate a defective ionic solid we have to take intoaccount that defects with an opposite charge attract each other.This effect becomes more pronounced when the concentration of thedefects is higher. So positively charged oxygen-vacancies andnegatively charged Ca-ions on Y-sltes can form associates or clus-ters. The association energy for [Cay'-V0*']' was found to be1 eV and the energy that comes free when the neutral cluster[Cay'-Vo*'-Cay'] is formed Is 1.7 eV. James [25] calculated theassociation energies for [HjAj'-Vo' -Mg^i'] In alumina and found1.3 eV; so our values correspond rather well. In principle thesolution energy is reduced by clustering-effects. The ionic oxygenvacancy conductivity is expected to be reduced due to a clusteringof v0'* and Cay', because the concentration of free V o " islowered by the amount which Is bound to Ca-substitutlonals. Theconcentration of oxygen vacancies increases with decreasing po2,so the concentration of the clusters should Increase with decrea-sing oxygen partial pressure. In the low conductivity material weinvestigated we found no concrete experimental indication of clus-tering. But for good ion-conductor ZrOg such effects are wellknown [33].
16.7 THE SOLUTION ©T M«C IN XA6
Applying the appropriate defect formation and lattice energiesIt possible to calculate the solution enthalpy for MgO In TAG.Ve assume again a vacancy compensation to be most probable. Thelattice energy for MgO of 40.74 eV is given by Catlow [6].Writing an equation comparable to eq. -16. 10 the solution enthalpy
149

Is found to be 2.5 eV. This energy as well as the solution en-thalpy for CaO in TAG are smaller than we expected. But we haveto bear in Bind, that, firstly, the perfect lattice simulation ofthe complex garnet structure Is not as good as for more simplestructures; there Is stilt a discrepancy between experimental andcalculated dielectric and elastic constants. Secondly there is amarked difference between the calculated and experimental latticeenergy for yttria; so we cannot decide finally which is the correctone. And last but not least, we have used an Y3+-potential, whichis in fact the potential of the lsoelectronlc Sr2+.
16. B SADDLE POINT ENERGIES
16.8.1
Using the CASCADE-code we determined the migration energies formoving ions. The crucial feature in this procedure is, as alreadymentioned, that the complete relaxation of all ions around themoving species Is taken Into consideration. By moving the ion stepby step along its path the potential surface for the migrating ionand hence the saddle point energy is obtained.
We consider a migrating oxygen ion. This species Is thought tojump from a regular lattice-site to an adjacent vacant oxygensite. This process is an elementary diffusion step. The activa-tion energy for such a process is the difference In energybetween the initial state and the top of the transition site(see fig. 16. 2)
D VACANCY
O MIGRATING ION
Fig.10.2. Schematic diagram tor a vacancy migration
150

In CASCADE we created oxygen-vacancies at the start and thefinal positions and located an Interstitial half way betweenboth positions. CASCADE calculates the saddle point energy,which is in most cases not the lowest energy path; we cone backto this point later.
By applying the polyhedron model of garnets it becomes clear thatseveral oxygen Jumps in the lattice have to be considered. Thefour different elementary Jumps are shown in fig. 16. 3.
Fig. 16.3 Four possible different eiementary Jumps ofoxygen-ions in the garnet structure.
Tab.16.7 Saddle point energies of movingoxygen ions. Migration pathssee fig. 16.3.
Higratlonpath
1234
Saddle pointenergy [eV]
2. 091. 503. 341. 84
151

Simple ha 1*-way saddle point energies were calculated for thefour diffusion paths shown In fig. 16. 3. The values are givenin tab. 16.7. Jump 2 and 4 are sufficient to find a continuouspath for migrating oxygen Ions. A projection of a part of theunit cell with the elementary Jumps Is shown In fig. 16. 4. Follo-wing this model Jump 4 with 1. 84 eV Is the highest barrier for amoving oxygen ion - the highest calculated saddle point energyin a continuous oxygen path is comparable to the activationenergy for ionic conductivity reap, the activation energy foroxygen diffusion. Tab. 16. B gives the activation energies ionicconduction and diffusion processes In TAG.
Fig. 16.4 Projection of a quarter of the garnet unit cell onthe y.s-plane. Different Jumps are marked.
152

Tab.16.8 Activation energies Eafor conductivity anddiffusion processes in YAG compared with calcu-lated saddle point energies.
E a for Vo"diffusion [eVJ
E a for ionicconductivity [eV]
Saddle pointenergy [eV)
2. 3 [30. 31, )1. 9-2. 6 *
3. 36 [29]
results by CASCADE-calculation
1. B -3. 34
16.8.2 TIM spatial dependence of the saddle point trierstes
Recently it was mentioned [29, 30] that the favourable transitionstate of a Jumping ion can have large displacements out of theplane (up to half a unit cell) of the adjacent lattice sites.In order to get an impression about the saddle point displace-ment for Jumping oxygen ions we calculated the spatial variationof the activation energy for a Jump of an oxygen ion from a h-slte to an empty h-slte cs the same tetrahedron. A coordinate sys-tem was placed in the tetrahedron, as shown In fig.16. 5, with itsorigin half way between the start and the end positions.
Tab.16.9 Coordinates of thefour O-atoms forminga tetrahedron.
1 0.764152 0. 262853 0.467154 0. 28285
-0. 05010. 096650. 0501
-0.09665
0. 15335O. 199650. 346650. 30015
Fig.16.5 Jumping geometry ona tetrahedron
153

The saddle point of the moving ion was shifted step by step fromthe initial position aiong the x-, y- and s-direction as indica-ted in fig. 16.5. The maximum displacement In x-, y- and 2-dlrec-tlon was 0.5 A, 0.96 A and 0.78 A respectively. A distinctenergy minimum was found, showing that the most favoured tran-sition state is shifted 0. 2 A in x-dlrection and about 0. 3 Ain y-directlon, as shown in fig. 16. 6. The activation energy Inthe minimum Is 0.5 eV ( = 25X ) lower than at the position betweenthe oxygen aites.
EA= 1.5 eVEA= 2.09 eV
Fig. 16.0 The diffusing oxygen ion does not move along a straightline connecting start and end position of the Jump. Thepath of minimal energy is displaced 0.2 A above the planeof two adjacent sites. The energy barrier for this path is0.5 eV lower than for straight jump.
This result shows that the minimal energy path for a diffusingoxygen Ion has a distinct curvature; the energy for the elementaryJumps is In this case reduced by about 25X. So the energy forelementary diffusion steps should be lower than values we calcu-lated by considering simple half-way saddle points.
154

«6.a.3 Aluminium JUMPS
The possible Jumps of Al-ions are more difficult to study thanoxygen-Jumps, because the cation-cation distances are muchlarger than the anion-anlon distances. The O-O -distanceon a tetrahedron is about 2.7 A, while two Al-ions on a d-siteand an a-slte are separated by about 3. 4 A and two Al on d-sites are separated by about 3.7 A. When Al-lons move theyhave to pass along two or more oxygen ions, so the potentialsurface for a migrating Al-lon has more than one maximum.
Ve Investigated the case of an Al-ion moving from a tetrahe-dral to an octahedral position. The energy of a moving inter-stitial Al, the migrating species, was checked systematicallyat 20 points between start- and end position (in x-, y- and z-dlrectlon). The lowest energy for a moving interstitial Al-ionwas 3. 5 eV. This means that such a migration has a saddle pointenergy not lower than 3. 5 eV per Jump - for the case of a Jumpfrom a tetrahedral to an octahedral site.The Al-lons have relatively high saddle point energies. Thisresult supports the view that oxygen ions are the most mobileionic species in YAG.
16.9 CONCLUSION
Oxygen vacancies are the most favoured ionic point defects inYAG and YIG. The energetics of a continuous oxygen diffusionpath was derived from the saddle point energies for elementaryion-Jumps. From this we see that the saddle point energy issomewhat smaller than the activation energy derived from tracer-diffusion and conductivity experiments. Migrating Al-lons havea much higher saddle point energy than oxygen ions.
Due to the high hole formation energy their contribution tothe conductivity should be relatively low at lower tempera-tures and ionic conductivity Is expected to dominate the trans-port properties. Vlth Increasing temperature an increasing con-tribution of electronic conductivity is expected; our ex-periments on YAG: Ca show that this Is the case.
Moreover, relying on the simulations, Schottky defects areeasier to form than Frenkel defects. So vacancies are moreprobable in YAG than lnterstltlals.
The dissolution energies of CaO and MgO were derived appyingcomputer simulation data; CaO has a higher solution enthalpythan MgO. These energies can le lowered by defect clustering.Clustering effects are expected to influence the energeticsof redox processes as well.
155

LITERATURE
[I] C. R. A. Cat low, V. C. MacKrodt, Computer simulation OfSolids, eds. C. R. A. Cat low, V. C. MacKrodt, Springer,Berlin, 1962.
[2J V. C. HacKrodt, Solid State Ionics, i£ (1984) 175.[3] C. R. A. Cat low, R.James, V. C. MacKrodt, R. F. Stewart,
Phys. Rev. B, £& (1962) 1006.[4] C. R. A. Catlow, C M . Freeman, M. S. Islam, R. A. JacKson, M. Leslie
S. M. Tomlinson, Phil. Mag. A, M (1988) 123.[5] V. C. MacKrodt, Adv. Cer. , 1£, (1983) 62, ed. by
the American Ceramic Society.[6] C. R. A. Catlow, J. Corish. J. Hennessy, ¥. C. MacRrodt, J. Am.
Cer am. Soc. 11 (1988) 42.[7] see ref. [1], p. 276.[8] F. G. Fumi, M.P. Tosi, J. Phys. Chem. Solids, ££. (1965)
31.[9] see ref. [1] p. 3 and p. 97.[10] R.G.Gordon, Y.S.Kim, J. Chem. Phys., £& (1962) 3122.[II] B. G. DicR, H. V. Overhauser, Phys. Rev., H £ (1958) 90.[12] A. B. Lid lard, H. J. Norgett, in Computational Solid State
Physics, eds. H.Herman, V. V. Dalton, T. R. Koeler (PlenumPress, H. Y. , 1972.
[13] M. J. Norgett, AERE-Report: AERE-R, 7015 (unpublished),1972.
[14] C. R. A. Catlow, Ann. Rev. Mater. Sci. , 1£ (1986) 517.[15] H. J. Horgett, UKAEA-Report, AERE-R 7660, 1974.[16] M. Leslie, SERC Daresbury Lab. Report 1982, DL-SCI-TM31T.[17] C. R. A. Catlow, M. J. Horgett, AERE Report 2763, 1976 (un-
publ lshed).[18] G.V.Lewis Ph. D. Thesis (London), 1983.[19] A. P. Andreev, S. F. Akhmetov, A. G. DavydchenKo, Sov. Phys.
Solid State, H (1985) 963.[20] V. F. Eltaeva, E. V. ZarlKov, I. L. Chlsty, Phys. Stat. Solid.
32. (1985) 475.[21] Landholdt-Bornsteln, Bd. 12,III/12a, neue Serle, Berlin, 1978.[22] R. D. Shannon, C. T. Prewitt, Acta Cryst. , B2JL (1969) 926.[23] F. Y. Y.Vang, Treatise on Material Science and Technology II,
ed. H. Herman, Academic Press. 1973.[24] S. Geller, Z. Crlstal logr. , i££ (1967) 1.[25] R. James, Ph.D. Thesis, London, 1979.[26] A. H. Cormack, C. R. A. Catlow, A. S. NowicK, J. Phys. Chem. Solids,
£p_ (1989) 177.[27] S. R. Rotman, R. P. Tandon, H. L. Tuller, J. Appl. Phys. , £1
(1985) 1961.[28] Handbook of Chemistry and Physics, CRC-Press, 1979.[29] F. Gverln, A. Laforgue, J. Physique, £1 (1976) 379.[30] c. R. A. Catlow, J. Corish, CHOI Her, P. M. V. Jacobs. M. J.
Norgett, AERE-Report TP 713, 1977.[31] L. F. Orgel. An Introduction Into Transition Metal Chemistry:
Ligand Field Theory, Methuen, London, 1960.[32] M. s. Islam, M. Lesl ie . S. M. Tomllnson, C. R. A. Catlow, J. Phys. C,
11 (1988) L 109.[33] J. F. Baumard, P. Abelard, Adv. Ceram. , 12, (1964) 555
ed. by N. Claussen, M. Ruhle and A. H. Heuer
156

t v-
APPENDIX 1Probability vs. srainstie plots corre
YAB pure
tna to tab. 15.2.
88.8
8808
85
80
80
8
I SO
' 20
10
5
21
0.1
a oi
1 • • • 1 1 . • 1
-
/ Fn RESULTS
/ CUw Rang./ Siw fraa
/ to/ FtxMtian
o / Fnaai. Su-0 (SOD1
S i s - '. . . . i i . . i
i
1 - 80.783.20a K
851.53i l 31.38
. . . . i
o
-
8 - 1 43.20 -
lass •0.38
887.854. SB -1.48
as 10
SI2E ium>
157

TAB:SO Ca
99.99
99.9
PARTICLE SIZE ANALYSISPHILIPS RESEARCH LABORATORIES EINDHOVEN
INORGANIC MATERIALS
"T T
99
98
95
90
80
g
2 50
"" 20
10
5
2
1
0.1
0.01
FIT RESULTS
Clow Rang.
Six* from
toFraotlon
Froot. Sua
0 (50XVSigns'
. . . I
10 - 17
0.661.90
0.54
442.92
0.93
1.40I
3-90.23
0.57
0.27
113.30
0.44
1.44
0.1 0.2 0.5
SIZE Cum)
156

SO Mft
99.99
99.9
g
95
90
80
j 50!i
' 20
10
5
21
0.1
0.010.2
SIZE (i»)
159

YMD.SOO tit
99.99
99.9
9998
95
90
80M
>-
5 50I°" 20
10
5
21
0.1
0.01
FIT RESULTS
Clooo Rang*Siz« from
toFrootionFroot. SumD (50XV
1 - 140.752.920.70
1011.461.941.47I
14 - 202.925.460.28
805.083.431.24
10
SIZE
too

Hf
99.99
99.9
9998
95
90
80
2:3 50
20
10
5
21
0.1
0.01
3 - 1 00.742.140.37
431.611.641.39
10
161

99.99
99.9
9998
95
90
80
3 50
' 20
10
5
21
0.1
0.01
FIT RESULTS
Clow Rang.Stz» fro.
toFrootionFroot. So«D (SOZ)'Signo'
3-111.433.610.42
326.622.621.36
11 - 163.616.440.51
675.554.571.22
10
SIZE (u>)

YAB.tOO Zr
99.99
99.9
9998
95
90
*' BO
s5 so
* 20
10
5
21
ai
a oi0.5
FIT RESULTS
ClawRaig*Six* (rim
toFraotlanFroot. Sum0 (50»'Stg-o-
4 - 1 01.253.24a 28
168.052.501.35
10- 153.247.17a 63
656.114.571.30
10 20
SIZE <«•)
163

MB: Zr
99.9
9998
95
90
80
2 50
20
10
5
21
0.1
a oi0.5
FIT RESULTS
C I O M Rang*Six* from
toFractionFront. SumD (50»*Sig-a'
2-11a 883.14
a si622.872.201.39
-
12 - 16 "3.62-6.36-a35
894.634.43"1.22
10
SIZE (ua>
1*4

AfWNDIX 2
Experimental and calculated crystal properties for A12O3and T1O2, taken from [1].
a-Al2O3
calc. exp.
T1O2
Property calc. exp.
Lattice energy (eV) 160. 21 160. 4 109. 9 126
Elastic constants
Cli
c 1 2Cl3C33
C44°66
42. 9615. 4812. 7250. 32-2. 9916. 1613. 70
49. 6916. 3611. 0949. 60-2. 3614. 7416. 66
25. 3317. 8020. 9077. 92
-9.2222. 12
20. 0117. 6614. 8048. 19
-12. 3919. 3
Dielectric constants
9. 3611. 52
2. 062. oa
9.11
3
34. 64
. 1—
94. 76157. 33
6. 287. 99
86. 0170. 0
tt. 838. 43
[l] C. B. A. Cat low, B. James, W. C. Mackrodt, B, F. StewardPhys. Bev. B, ££. (1982), 1006.

SUMMftST
This thesis describes basic aspects concerning the defect chemis-try and the mlcrostructure of yttrium aluminium garnet ceramics.Ve have divided the work Into three parts: a literature study,an experimental part and a section giving computer simulationdata of defects.
Sintered YAG bodies contain AlgO3-lncluslons with a high thermalstability. These Inclusions have a marked Influence on the defectchemlsty of YAG, because they act as a 'source' of Al-vacancies.The Influence of the inclusions on the high temperature electricalproperties Is Interpreted in terms of classical defect chemistryThe pOg-dependencles of the conductivity - and the Ionictransport Isotherms led us to defect models for the acceptor- anddonor-doped samples:TAG doped with 100 ppm CaO (acceptor) is a mixed lonlc-electronlcp-type conductor with the conductivity a changing proportional topOg3'lD. Al-vacancies are the dominant ionic defects. Further-more we found evidence that at high pOg electron holes are trappedby oxygen ions forming Oo*-centres; with decreasing oxygen pressurethis concentration decreases. TAG containing 500 ppm CaO is an ionicconductor over nearly the entire pOg-reglme we investigated,the Ionic transport number is smaller than 1 only at the highest pO2.This can be explained by the large hole formation energy as we re-vealed by computer simulation. The properties of Hg-doped materialare comparable. YAG doped with SO ppm ZrOg (donor) Is a mixed Ionicn-type electronic conductor with a changing proportional pOg"3/16.At high pOg Al-vacancies are dominant, with decreasing pOg Zr changethe valency from 4+ to 3+; colour centres are formed. The redox-energy for Zr was derived from the temperature dependence of a tobe 6-7 eV. At low oxygen pressure electronic conduction is dominant.
Annealing YAG In a Hg/HgO-atmosphere leads to the incor-poration of protons. This was shown by IR-spectroscopy. From theenergy of the absorption bands the location of the protons in thecomplex garnet lattice was derived. The low activation energy ofthe high temperature conduction process in a Hg/HgO-ambientindicates that protons govern the defect chemistry under thesecircumstances. Impedance spectroscpy revealed that the grainboundaries are not affected by the presence of protons.
Measurements of the frequency dispersion of the MgO-, CaO- andZrOg-doped material revealed that Ca has a very strong ten-dency to form an lntergranular second phase, while Mg and Zrhave much weaker tendencies to segregate. The Intergranularphase In Ca-doped YAG was observed by transmission electronmicroscopy; the thickness of the layer in material containing500 wt. -ppm CaO was determined to be approximately 2 nm. Byanalysing complex Impedance plots the thickness of the layerwas determined to be In the same order of magnitude. Suchfilms have a lower conductivity than the bulk; they act as ablocking layer.
Annealing a Ca-doped sample for 240 h at 1670 K led to a radical
16ft

change in the oxygen pressure dependence of the total conductivity.The value of the total conductivity decreases due to this treatment.Analyzing the complex Impedance behaviour (Z'-Z''-plots) made clearthat, firstly, the thickness of the grain boundary layer Increases bya factor of 10 while annealing 240 h at 1670 K due to dopant andimpurity segregation and, secondly, that the grain boundary conduc-tivity becomes pO2-dependent. This causes the radical change inthe oxygen pressure dependence of the total conductivity. Quenchinga Ca-doped sample from high temperature down to room temperatureleads to a drastic decrease of the total conductivity. So it isclear that electrical and mlcrostructural properties of the materialdepend on the thermal history of the sample.
Non-linear least squares fit procedures showed that experimentalZ'-Z''-plots can be characterised accurately by simple combinationsof SC-clrcults. So the model of grains separated by blocking layersof second phases ("grain boundary capacitors") describes realityquite well.
A typical mlcrostructural feature of undoped TAG is the exagge-rated grain growth (dmean-3-3 Pm,dnax:10. 6 pa). Even 50 ppm CaO causedrastic reduction In maximum- and mean grain slse (dBean=0. 8 urn,dmax=l. 9 pm). This is explained by the strong segregation tendencyof Ca. HgO does also reduce the grain boundary mobility (d u a n=l. 6 usdmax=4. 1 pm for a sample containing 50 ppm HgO). The effect ofHgO is not as drastic as for CaO. Donor dopants such as Zr or Hfpromote grain growth, but inhibit exaggerated grain growth; themicrostructure of such samples is very regular with a relativelylarge mean grain size (e.g. d B e a n:4. 3 pm and dBax:10. 2 pm forYAG: 150 ZrOg). The grain slse distribution was found to be bimodalIn all cases we investigated.
A series of computer simulations applying the CASCADE-code showedthat Schottky defects are more favoured in TAG than FrenKel de-fects. Oxygen vacancies are the most favoured point defects inpure YAG. By calculating saddle point energies of several possibleoxygen Jumps In the garnet lattice we found a continuous diffusionpath with an activation energy of 1. 5 eV, which is somewhat lowerthan experimental activation energies for self diffusion (3 4 eV,from literature) and Ionic conductivity (l. 9-2. 4 eV). The saddlepoint energy for Al-Jumps was calculated to be 3=5 eV which is re-latively high. A possible effect in doped YAG is a dafect associ-ation (clustering); the clustering of oxygen vacancies and Ca-sub-stltutlonals can in- or decrease the energy for defect reactions(depending on the type of reaction), If the defect concentrationreaches some hundred ppm. From point defect formation energies thesolution energy for CaO in YAG was estimated to be 242 kJ/mol. Thiscan explain the low solubility and the high segregation rate of CaOin YAG.
167

S**eNVATT ING
Dit proefschrift beschrijft een onderzoek naar de defect chemie ende microstructuur van yttrium aluminium granaat keramiek. Hetwerk bevat drie delen: een literatuur studie, het experimenteelgedeelte en een computer simulatie van defecten In het YAG-rooster.
Gesinterd TAG bevat A1 2O 3 lnslultsels met een hoge thermischestabiliteit. Deze zijn van grote Invloed op de defect chemie vanhet YAG, omdat ie een soort "bron voor Al-vacatures" lijn. DeInvloed van de lnslultsels op de elektrische geleiding bij hogetemperatuur is verklaard op basis van de klassieke defect chemie.Ve hebben uitgaande van de pO2 afhankelijkheid van de geleidingen het lonen transport getal defect modellen ontwikkeld voor accepteen donor gedoteerd materiaal:
YAG gedoteerd met 100 ppm CaO (acceptor) vertoont gemengde Ionischep-type elektronische geleiding; de geleidbaarheid varlért evenrediimet pO23/i6. Belangrijke lonogene defecten In het kristal xljnAl-vacatures. YAG gedoteerd met een concentratie van 600 ppm CaOvertoont lonogene geleiding In bijna het hele pO2-gebied van10s tot 10~ 1 0 Pa; ti Is alleen bij de hoogste zuurstof drukkenwat minder dan 1. Dit hoge lonen geleldlngsvermogen kan wordenverklaard door de hoge energie die nodig is om elektronen gatente vormen (onderzocht m. b. v. computer simulatie). De eigen-schappen van YAG gedoteerd met MgO zijn In wezen vergelijkbaar metYAG: CaO.
YAG met 50 ppm ZrO2 (donor) vertoont gemengde Ionische n-typeelektronische geleiding; de n-type geleiding varieert evenredigmet pOg"3/16. Het afnemende pOg neemt de concentratievan Zr*+ af, terwijl de concentratie van Zr3* toeneemt(reductie); kleur centra worden gevormd. De energie voor dereductie van Zr*+ naar Zr 3 + ligt bij 6-7 eV per ion.
"Annealing" van YAG: Ca bij oge temperatuur in een water/water-stof atmosfeer leidt tot de opname van protonen. Dit werd aango-toont m. b. v. IR-spectrometrie. De activerings energie voor hetgeleldlngs proces is, vergeleken met de activerings energie Ineen zuurstof atmosfeer, heel laag, omdat de protonen eendominerend invloed hebben op het geleidings mechanisme.
CaO in YAG heeft een sterke neiging tot segregatie naar dekorrel grenzen (tweede fase vorming). Deze tweede fase werd be-keken m. b. v. transmissie electronen microscopic De dikte vanzo'n laag in YA6 gedoteerd met 500 ppm CaO is 2 nm. Debepaling van de laagdikte m. b. v. complexe Impedantie metingenleidt tot vergelijkbare resultaten. De korrelgrens fasen inYAG: CaO hebben een lagere geleiding dan de bulk (graininterior).
Het verhitten van "as-sintered" YAG: Ca.O gedurende 640 u bij
166

1670 K in lucht leidt tot een drastische verandering van dezuurstof druk afhankelijkheid van o~, verder neemt de totalegeleiding af. Volgens de Z'-Z''-plots wordt de segregatielaag tussen de korrels dikker: de laag heeft een dikt« van 1-2nm voor en 11 ran na de "annealing" procedure. Dit is het gevolgvan een segregatie van de sinter-toevoeging. De analyse van Z'-Z"plots opgenomen bij verschillende partiële suurstof drukken (tus-sen 1O6 en 10~ 1 0 Pa) toont verder aan, dat de korrelgrensgeleiding na het "annealing" een functie van pO2 is (een ge-volg van de toenemende dikte van de segregatie laag). Dit leidttot het waargenomen verschil tussen "as-sintered" en "annealed"materiaal.
Om te sien of het voorgestelde KC-model geschikt is om de Z'-Z''plots te verklaren zijn NLLS-flt procedures uitgevoerd aan gemetenimpedantie plots; het gekozen model simuleert de realiteit vrij goed.
De relatie tussen sinter toevoegingen en de mlcrostruktuur werdbekeken m. b. v. een seml-automatische korrelgroote analyse.Overmatige korrelgroel (exaggerated grain growth) is typischvoor nlet-gedoteerd YA6 (dmean=3. 3 urn, dBax=10. 6 um). Eentoevoeging van slechts 50 ppm CaO leidt tot een drastische ver-laging van de korrelgrens mobiliteit (dmean:0. 8 pm, dmax=l. 9 pm)Dit wordt verklaard door de sterke segregatie van Ca naar dekorrelgrenzen; de invloed van MgO is minder (dBean=l. 6 urn,dmax:*- * I"* voor TAG met 50 ppm MgO). Donor sinter-toevoegingen,zoals ZrOg en HfOg, onderdrukken overmatige korrelgroel,maar de korrelgrens mobiliteit in het algemeen blijft redelijkhoog (b. v. d n e a n:4. 3 pm en dBax=10. 2 pm voor TAG met 150ppm ZrOg). In al de gevallen waar wij de korrelgrootte hebbengeanalyzeerd was de korrelgrootte verdeling bimodaal.
De resultaten van computer simulaties met het programma CASCADElaten zien dat Schottky fouten (rooster vacatures) preferentzijn tegenover Frenkel defecten (Interstltleele lonen en vacatures).Zuurstof vacatures hebben de laagste vorming enthalple in zuiverYAG. De diffusie van zuurstof werd kwantitatief bekeken door hetberekenen van zogenaamde "saddle point energies". Deze energlên(rond 1. 6-2 eV) zijn iets lager dan de activering« energie voorde zelf-dlffusle (3.« eV) uit de literatuur en het elektrischgeleldlngsproces (1.9-2.4 «V). De sprong van een Al-ion vanéén positie naar een andere heeft een relatief hoge "saddlepoint energy" van 3. 5 eV. Verder hebben wij de energie voorcluster vorming (defect associatie) berekend. Vanaf een bepaaldedefect concentratie kunnen dergelijke processen de defect vormingenergie verhogen of verlagen (afhankelijk van de specifiekereaktle).
Vlj hebben met de CASCADE simulatie een energie van 242 kJ/molberekend voor het oplossen van CaO in YAG. Deze energie is relatiefhoog en kan de lage oplosbaarheid en sterke segregatie verklaren.
169
CURRICULUM VITAC
The author was born In Heraulhela (Vest-Oeraany) on 16. 7 1956.He graduated from the "Gymnasium der Gemelnde Hurth", which Islocated near Cologne in 1977. Then he entered the University ofCologne from which he received his "Vordiplom" (Bachelor ofScience degree) In 1981 and a "Diplorn" (Master of Science de-gree) In chemistry In 1984. In 1985 he moved to the EindhovenUniversity of Technology and began the worK on his thesis atthe group of Prof. Dr. B. Metselaar. In 1988 and 1989 he workedsome weeks as a guest at Keele University (United Kingdom)under the supervision on Prof. C. R. A. Cat low. He accepted aposition at the Asea Brown Boverl Corporate Research Centre inHeidelberg in January 1989.
170

The work presented in this thesis was done at the EindhovenUniversity of Technology in collaboration with the PhilipsLighting Division (Eindhoven), the Philips Research Labs.(Elndr.oven) and the University of Keele (United Kingdom).
171