Immobilization of Saccharomyces cerevisiae on Apple Pieces ...
Crystallization of an Yttrium Aluminosilicate Glass for Nuclear Waste Immobilization
Diana Carolina Lago1, 2, Diana Garcés2 Miguel Oscar Prado1, 2, 3
1Consejo Nacional de Investigaciones Científicas y Técnicas. 2Centro Atómico Bariloche - Comisión Nacional de Energía Atómica. 3Instituto Balseiro. Universidad Nacional de Cuyo. Av. Ezequiel Bustillo Km. 9.5, (8400) San Carlos de Bariloche, Pcia. Río Negro – Argentina. ABSTRACT
The SiO2-Al 2O3-Y2O3 glass system exhibits high glass transition temperatures, water corrosion resistance and good mechanical properties. These properties suggest that yttrium aluminosilicate glasses could potentially replace the borosilicate glasses usually used for immobilization of nuclear wastes. At the same time, yttrium can be used to simulate actinides.
During waste immobilization, crystallization of the glassy matrix must be avoided or at least controlled, thus, the understanding of glass crystallization kinetics is essential.
We found by XRD that the crystalline phases present are yttrium disilicate and Sillimanite/Mullite. Morphologically we could only identify highly yttrium enriched crystals which we associate with yttrium disilicate crystals.
In this paper we measure the surface density of nucleation sites Ns in as obtained splat cooled pieces obtaining values of about 1,5 · 1011 (nucleus · m-2). Crystal growth rate U in the temperature range 1000-1040 oC varies in the range 8-13 µm · h-1. These data is useful for designing sintering or melting thermal paths of YAS glasses in order to control its microstructure. We show the effect of particle size on DTA results: crystallization peaks moves towards left for smaller particle size, which confirms that mainly surface nucleation is taking place on heating.
Mechanical properties are also evaluated through Vickers indentation. Microhardness as well as Weibull statistics on glass and vitroceramic samples are shown. These first results are encouraging in considering yttrium aluminosilicate glasses for wastes immobilization. INTRODUCTION
Yttrium aluminosilicate glasses can be formed over a wide compositional range and exhibit interesting chemical and physical properties such as high glass transition temperature [1-3], hardness, elastic modulus [4] and excellent chemical durability [5-7]. These glasses have a wide range of technological applications as a host material in laser applications, for bonding of silicon nitride ceramics, as microspheres for radiotherapy of hepatic cancer and for matrices to storage long-lived actinides. In particular, our work is concerned with the application of these glasses as a matrix for nuclear wastes immobilization.
Although the inclusion of wastes in a proportion of the order of 20 %w, most probably gives place to new phases to appear, in this work we are interested in the knowledge of the matrix behavior by itself, as a first step towards a possible use of this glass as a host of nuclear wastes.

The determination of nucleation and crystal growth rates as a function of the temperature is important to understand the stability of glasses on heating or cooling from high temperatures. A clear example is the case of waste immobilization where the formation of the nuclei and subsequent crystal growth must be avoided [8-10]. These rates are also critical for the preparation of glass-ceramics with a desired microstructure through controlled nucleation and crystallization [11].
An initial characterization of the kinetics of crystallization of glass powders can be achieved from differential thermal analysis (DTA) experiments. However, the results obtained for the same material strongly depend on the powder particle size distribution, if crystals mainly grow from the surface of the particles.
In 1988 Müller [12] developed a model to study the overall crystallization of glassy particles by DTA tests, taking into account the size of the particles. Concluding that as the grain size increases, the crystallization temperature shifts to higher temperatures.
In this paper, we study nucleation and crystal growth of a YAS glass obtained by splat-cooling. Isothermal heat treatments on glass samples were performed at 1000, 1020, 1040 °C for different periods, and afterwards surface crystalline nucleation sites density or crystal size were measured. DTA experiments on powders and optical microscopy observations of crystallized blocks were conducted to evaluate the presence of volume or surface crystal nucleation. Crystalline phases were partially identified by XRD analysis. Mechanical properties of YAS glass and YAS glass ceramic were tested using Vickers indentations and Weibull statistics.
EXPERIMENTAL DETAILS Glass samples were prepared with composition: 35 % SiO2, 20 % Al2O3 and 45 % Y2O3 (wt %). High-purity oxide precursor powders were homogenized in a rotating mill and melted in a platinum crucible for three hours at 1600 °C. The melt was poured on a stainless steel plate and immediately splat-cooled with a second steel plate. A fraction of the glass was separated and identified as fraction 1. The rest of the glass was milled and sieved to obtain three different powder size samples: particles greater than 50 microns (fraction 2), particle size less than 25 microns (fraction 3) and particles size less than 10 microns (fraction 4). The last sample was obtained by taking the supernatant particles in suspension of fraction 3 after decantation of the larger particles in alcohol. Differential thermal analysis experiments were performed on the different particle size fractions obtained (fractions 1, 2, 3 and 4). The analysis was carried out over a temperature range 20°C to 1300 °C at a heating rate of 10 °C · min-1. The glass transition temperature Tg, crystallization beginning temperature Tc, and peak maximum temperature Tx were determined from the measurements. The sintering kinetics, as well as crystallization, is appreciable only at temperatures above Tg, moreover one should heat the sample between Tg and Tc for viscous flow to take place, minimizing crystallization. To determine the surface density of nucleation sites, Ns, heat treatments were performed on a YAS glass sample (obtained by splat cooling) in furnace during 1, 2, 4, 6, 10 and 15 hours at 1000, 1020 and 1040 ± 2 °C. After each heat treatment, the number of crystals per unit area was determined, using optical microscopy in those cases were crystals were not impinging among them (1 and 2 hours of heat treatment). Surface density of nucleation sites was determined assigning a nucleus to each glass surface. On all samples the growth rate of

600 700 800 900 1000 1100 1200 1300 1400
-0.05
0.00
0.05
0.10
DT
A (
µV
)
Temperature (°C)
Tc=1185 °C Tx=1283 °CTc=1100 °C Tx=1160 °CTc=1075 °C Tx=1140 °CTc=1000 °C Tx=1110 °C
Tc Tx
Vitreous Plate
Fraction > 50 µm
Fraction < 25 µm
Fraction < 10 µm
crystalline phases present was measured after polishing and etching the cross section surfaces of each glass sample. For heat treatments larger than 2 hours, crystal size was measured as the surface crystal layer width. Scanning electron microscopy (SEM), energy dispersive spectroscopy (EDS) and X-ray diffraction (XRD) was used to partially characterize the crystalline phases present in the samples and the various stages of growth. Some mechanical properties of YAS glass and glass-ceramic were studied through Vickers indentations, applying a force of 25, 50, 100, 250, 500, and 1000 gf during 15 seconds. Microhardness in each case was determined in Kg · mm-2 of the pyramidal imprint. The fracture probability was studied using Weibull statistics on the number of cracks appearing at the imprints diagonals on samples that were previously exposed to different heat treatments: splat cooled glass (SC), crystallized, polished annealed glass and unpolished. The fracture probability Pr was measured as the quotient of the number of cracks generated on the corners of the indentations over the total number of possible cracks (4 times the number of indentations) [13]. Accordingly the survival probability Ps, was calculated as Ps = 1-Pr. RESULTS AND DISCUSSION Glass-transition Temperature (Tg) and Crystallization Temperature (Tx) Figure 1 shows the DTA results obtained for a solid slab and the 3 powder fractions of YAS glass. The value of Tg for fractions 2, 3 and 4 were, (904 ± 10) °C (915 ± 10) °C (905 ± 10) °C. We can also see there, that the crystallization peak shifts to higher temperatures as the particle size increases, clearly indicating that the nucleation of crystalline phases is occurs mainly on the surface which is consistent with observations made using optical microscopy, Figure 2. These results are also in accordance with Müller’s model of surface crystallization. Table I shows the temperature values corresponding to the crystallization peaks obtained for each DTA measurement.
Table I. Crystallization temperatures for different size fractions.
Sample Tx (°C) Fraction 1 1283 ± 10 Fraction 2 1160 ± 7 Fraction 3 1140 ± 7 Fraction 4 1110 ± 8
Figure 1. Tg and Tx determined by DTA for different grain sizes It is observed that as the grain size increases, the peak maximum shifts to higher temperatures.

c)
From the results we determined that for the smaller particle size sample (fraction 4) the crystallization peak starts at temperature of Tc = (1000 ± 8) °C. This occurs because smaller sized particles have larger specific surface area and therefore higher surface crystal nucleation sites density per unit mass and thus the crystallization enthalpy is detected first.
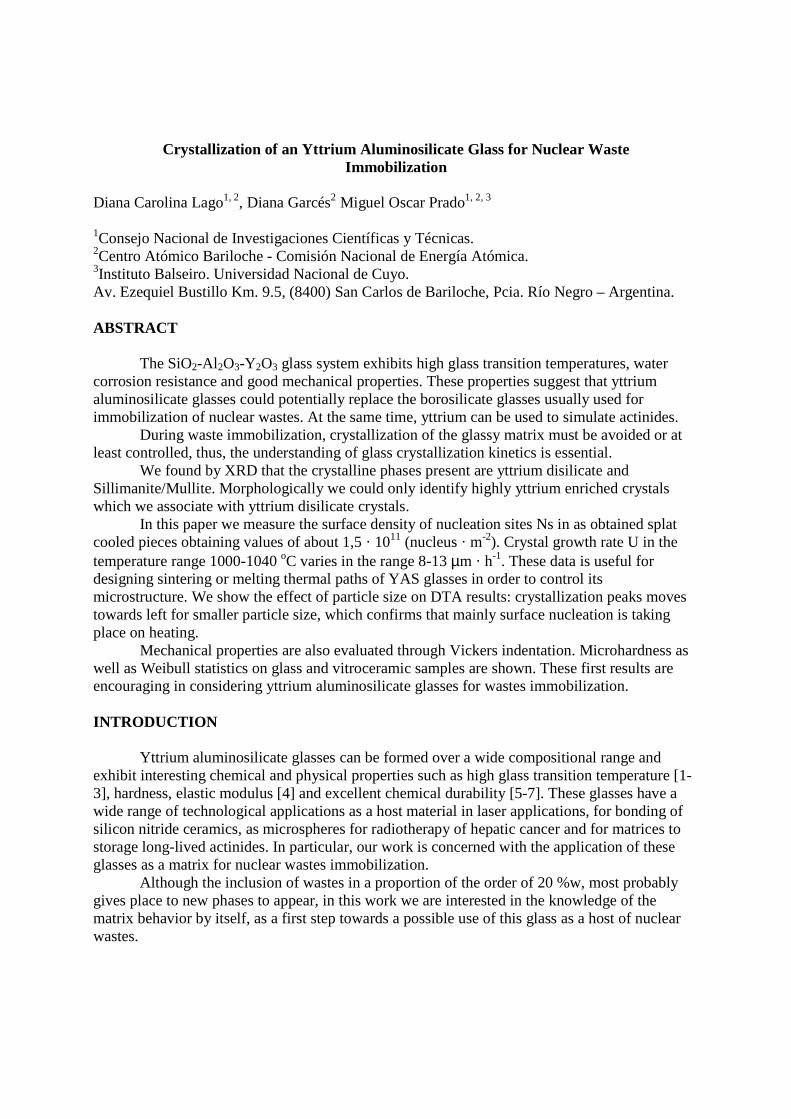
Figure 2. Images obtained by scanning electron microscopy of YAS samples heat-treated for 1, 2, 6, 15 h (columns) at 1000, 1020, 1040 ºC (rows). a) Show heat treated surface and b) cross section. After the heat treatments carried out to determine the surface nucleation density on the glass plates, images were taken using optical microscopy and analyzed (Figure 2). The values of surface density of nucleation sites obtained for 1000 and 1020 °C heat treatment (1 hour) were: 1,202 · 1011 ± 0,01 (nucleus · m-2), 1,696 · 1011 ± 0,16 (nucleus · m-2), respectively. Crystal Growth Rate To determine the crystal growth rate, different blocks of YAS glass were subjected to heat treatments at 1000, 1020 and 1040 °C for 1, 2, 4, 6, 10 and 15 hours. Cross sections of the samples were cut, polished up to 3 micron diamond paste and etched with a 2 % HF, water solution for 60 seconds. The thickness of the crystalline layer observed on the glass cross section resulting from the crystallization heat treatment was measured, the results are shown in Figure 3 a). Subsequently, the crystal growth rate was determined and the values obtained were: (8,21 ± 0,06) µm · h-1, (8,05 ± 0,07) µm · h-1 and (13,1 ± 0,04) µm · h-1 at 1000, 1020 and 1040 ± 2 °C, respectively. To identify the crystalline phases that appeared, different heat treatments were performed in the temperature range 1000-1040oC, and always found the same results. Figure 3 b) show the XRD diffraction pattern of YAS glass powder < 25 µm, subjected 18 hours to 1020 oC heat.
a) b)

a) 0 2 4 6 8 10 12 14 16
0
20
40
60
80
100
120
140
160
180
200 Crystal 1000 °C Crystalline layer 1000 °C Crystal 1020 °C Crystalline layer 1020 °C Crystal 1040 °C Crystalline layer 1040 °C
Cry
sta
l Siz
e (µ
m)
Time (hs)
15 20 25 30 35 40 45 50 55 600
50
100
Rel
ativ
e In
ten
sity
2θ
YAS
Al2Si2O7 - Mullite
Al2Si2O5 - Sillimanite
50
100
50
100Y2Si2O7 - Yttrium disilicate
25
50
75
100
b)
Comparison with standard diffractograms indicate the presence of yttrium disilicate (Y2Si2O7), Mullite (Al2O3 2SiO2) and/or Sillimanite (Al2SiO5). Figure 3. a) Crystalline layer thickness versus time, b) YAS diffractogram of the sample heat treated in air at 1000 °C for 18 h. We also show with reference standards diffraction lines. By SEM and EDS analysis we could only identify Y2Si2O7 crystals. As shown in Figure 4 and Table II, crystals growing inwards a pore are highly enriched in yttrium, and the relationship Y/Si is very close to that of yttrium disilicate.
Table II. Chemical analysis of the crystals shown in Figure 4.
Chemical Analysis (wt %) Al Si Y
9,92 23,51 66,57 8,40 21,96 69,64
Figure 4. Yttrium disilicate crystals. Chemical analysis confirms yttrium disilicate, the remaining glass can form either Mullite or Sillimanite, agreeing with literature data [3]. Thus, the crystallization rates would need of atomic diffusion to fit to the required phases compositions and accordingly the glass viscosity will change at a large extent during surface crystallization, affecting eventually the sintering kinetics. Actually, after all possible quantity of yttrium disilicate, the remaining material is also in crystalline state, since no glassy XRD hallo is observed (Figure 3 b).

Mechanical tests: Vickers hardness and Weibull Statistics Figure 5 a) shows the values of Vickers hardness as a function of the applied load for four different samples: SC, crystallized, polished annealed and unpolished annealed. It is apparent from the results that the value of hardness remains constant within the error in the case of the glass-ceramics and annealed glass but not for the SC sample. This happens because during splat cooling the surface of the melt cools at a faster rate than the rest of the material. The uneven cooling causes tensions throughout the volume and the resulting glass presents compressive forces on its surface.
Figure 5. a) Vickers hardness as a function of the applied load. b) Probability of survival as a function of applied load. From the Vickers hardness test results it can be concluded that annealing the glass reduces the stress distribution throughout the volume and that is why lower hardness values are obtained for the annealed glass sample in comparison to the SC glass. From the results that were obtained it can be concluded that the YAS glass has high resistance to mechanical deformation. With regards to the study of fracture probability using Weibull statistics [14], the load values obtained for the probability of failure = 0,5 was: 150, 400 and 900 gf in 4), 2) and 3) experiments respectively. Polishing reduces the likelihood of failure because it generates surface tensions that prevent the formation of cracks [11]. Figure 5 b) shows that the theoretical curves fit very well with the experimental curves.
CONCLUSIONS We characterized the surface nucleation and crystal growth rate at the temperature range 1000-1040oC.
The study of different particle size of YAS glass by DTA, using for the first time in this system the methodology proposed by Müller, it was determined that the crystallization temperature shifts to higher temperatures for parts of larger particle size, clearly indicating that the mechanism primary nucleation is superficial. We determined the glass transition temperature of the matrix YAS. The values for the various size fractions (> 50 µm, < 25 µm and < 10 µm) were (904 ± 10) °C (915 ± 10) °C (905 ± 10) °C, respectively.
a) b) 0,0 0,1 0,2 0,3 0,4 0,5 0,6 0,7 0,8 0,9 1,0 1,10,0
0,1
0,2
0,3
0,4
0,5
0,6
0,7
0,8
0,9
1,0
1,1
1,2
Pro
bab
ility
of s
urvi
val
Load [kgf]
Splat cooling Theorical splat cooling Polished annealed glass Theorical polished annealed glass Unpolished annealed glass Theorical unpolished annealed glass
0,0 0,1 0,2 0,3 0,4 0,5 0,6 0,7 0,8 0,9 1,0 1,1600
650
700
750
800
850
900
950
1000
1050
1100
1150
Splat cooling Crystallized glass Polished annealed glass Unpolished annealed glass
Vic
kers
Har
dne
ss [k
gf/m
m2 ]
Load [kgf]

The values of surface density of crystallization sites, for splat cooled surfaces, obtained after 1 hour 1000 and 1020 °C heat treatment were: 1,202 · 1011 ± 0,01 (nucleus · m-2), 1,696 · 1011 ± 0,16 (nucleus · m-2), respectively. The crystal growth rate was determined and the values obtained are: (8,21 ± 0,6) µm · h-1, (8,05 ± 0,07) µm · h-1 and (13,1 ± 0,04) µm · h-1 at 1000, 1020 and 1040 ± 2 °C, respectively. The crystalline phases identified are yttrium disilicate, and Mullite or Sillimanite. Yttrium disilicate was confirmed by analyzing the crystallized surface layer by SEM and EDS.
With this information available, the crystallization microstructure of a YAS glass can be designed.
The mechanical tests clearly show the effects of: a) crystallization, b) heat treatment c) mechanical polishing surface on the hardness and fracture probability of YAS glass. Annealing the glass sample reduces the compressive forces on the surface and therefore the surface hardness. However, there is an increase of fracture probability and this is reflected in lower values of Vickers hardness.
The YAS glass used in this work show better mechanical properties that other borosilicate glasses used for nuclear waste immobilization. REFERENCES 1. J. T. Kohli, J. E. Shelby, Phys. Chem. Glass 32 (1991) 67. 2. A. Aronne, S. Esposito, P. Pernice, Mater. Chem. Phys. 51 (1997) 163. 3. N. Sadiki, Jean Coutures, Catherine Fillet, Jean Dussossoy, , J. Nuc. Mat. 348 (2006) 70–78. 4. M. J. Hyatt, D. E. Day, J. Am. Ceram. Soc. 70 (1987) C283. 5. L. Bois, N. Barré, M. J. Guittet, S. Guillopé, P. Trocellier, M. Gautier, P. Verdier, Y. Laurent, J. Non-Cryst. Soc. 300 (2002) 141. 6. A. Makishima, Y. Tamura, T. Sakaino, J. Am. Ceram. Soc., 61 [5-6] 247-49 (1978). 7. E. Erbe, D. Day, J. Am. Ceram. Soc., 73 [9] 2708-13 (1990). 8. M. O. Prado, C. Fredericci, E. D. Zanotto, J. Non Cryst. Sol., 331/1-3, (2003) 145-156. 9. M. O. Prado, C. Fredericci, E. D. Zanotto, J. Non Cryst. Sol., 331/1-3 (2003) 157-167. 10. M. O. Prado, E. D. Zanotto, Comptes Rendus Chimie 5 (11): 773-786 NOV 2002. 11. McColm, I J. (1990). Ceramic Hardness. New York: Plenum Press. 12. Müller, R.. Journal of Thermal Analysis, Vol 35, pp 823-835. (1989). 13. Esposito L., R. Dal Maschio, E.H.Toscano Proc.2nd International Workshop on Indentation Techniques, Bologna Italia,Diciembre 13-16,1988, EUR 12799 EN, Eur. Applied Research Reports-Nuclear Science Technol.,Vol 7(1990), pp 1427-1439. 14. Ashby, M F; Jones, D R H. (1986). Engineering Materials 2: An Introduction to Microstructures, Processing and Design. Gran Bretaña: BPC Wheaton Ltd, Exeter.
Copyright © 2022 FDOKUMEN