Limb Immobilization Induces a Coordinate Down- Regulation ...
13
Limb Immobilization Induces a Coordinate Down- Regulation of Mitochondrial and Other Metabolic Pathways in Men and Women Arkan Abadi 1 , Elisa I. Glover 1 , Robert J. Isfort 2 , Sandeep Raha 1 , Adeel Safdar 1 , Nobuo Yasuda 3 , Jan J. Kaczor 4 , Simon Melov 5 , Alan Hubbard 6 , Xiaoyan Qu 2 , Stuart M. Phillips 7 , Mark Tarnopolsky 1 * 1 Department of Pediatrics & Medicine, McMaster University, Hamilton, Ontario, Canada, 2 Procter & Gamble Company, Mason, Ohio, United States of America, 3 Graduate School of Medicine, Juntendo University, Inba, Japan, 4 School of Medicine, Debinki 1, Gdansk, Poland, 5 Buck Institute for Age Research, Novato, California, United States of America, 6 School of Public Health, University of California, Berkeley, California, United States of America, 7 Department of Kinesiology, McMaster University, Hamilton, Ontario, Canada Abstract Advancements in animal models and cell culture techniques have been invaluable in the elucidation of the molecular mechanisms that regulate muscle atrophy. However, few studies have examined muscle atrophy in humans using modern experimental techniques. The purpose of this study was to examine changes in global gene transcription during immobilization-induced muscle atrophy in humans and then explore the effects of the most prominent transcriptional alterations on protein expression and function. Healthy men and women (N= 24) were subjected to two weeks of unilateral limb immobilization, with muscle biopsies obtained before, after 48 hours (48 H) and 14 days (14 D) of immobilization. Muscle cross sectional area (,5%) and strength (10–20%) were significantly reduced in men and women (,5% and 10–20%, respectively) after 14 D of immobilization. Micro-array analyses of total RNA extracted from biopsy samples at 48 H and 14 D uncovered 575 and 3,128 probes, respectively, which were significantly altered during immobilization. As a group, genes involved in mitochondrial bioenergetics and carbohydrate metabolism were predominant features at both 48 H and 14 D, with genes involved in protein synthesis and degradation significantly down-regulated and up-regulated, respectively, at 14 D of muscle atrophy. There was also a significant decrease in the protein content of mitochondrial cytochrome c oxidase, and the enzyme activity of cytochrome c oxidase and citrate synthase after 14 D of immobilization. Furthermore, protein ubiquitination was significantly increased at 48 H but not 14 D of immobilization. These results suggest that transcriptional and post-transcriptional suppression of mitochondrial processes is sustained throughout 14 D of immobilization, while protein ubiquitination plays an early but transient role in muscle atrophy following short-term immobilization in humans. Citation: Abadi A, Glover EI, Isfort RJ, Raha S, Safdar A, et al. (2009) Limb Immobilization Induces a Coordinate Down-Regulation of Mitochondrial and Other Metabolic Pathways in Men and Women. PLoS ONE 4(8): e6518. doi:10.1371/journal.pone.0006518 Editor: Rodolfo Aramayo, Texas A&M University, United States of America Received January 14, 2009; Accepted May 21, 2009; Published August 5, 2009 Copyright: ß 2009 Abadi et al. This is an open-access article distributed under the terms of the Creative Commons Attribution License, which permits unrestricted use, distribution, and reproduction in any medium, provided the original author and source are credited. Funding: Funding for the current project was primarily from a grant-in aid from Proctor and Gamble to MAT and from NSERC (MAT). Dr. Tarnopolsky is partially supported through an Endowed Chair from the Children’s Hospital Celebration and Michael DeGroote. E.I. Glover was supported by a Canadian Institutes of Health Research Doctoral Research Award. A. Abadi is sponsored by a post-doctoral fellowship from Mr. Warren Lammert and Kathy Corkins. Infrastructure support was provided from grants and donations from the Canadian Foundation for Innovation, Mr. Warren Lammert and Kathy Corkins, and Giant Tiger Stores. The funders had no role in study design, data collection and analysis, decision to publish, or preparation of the manuscript. Competing Interests: The authors have declared that no competing interests exist. * E-mail: [email protected] Introduction Skeletal muscle atrophy is associated with bed rest, corticoste- roid use, denervation, chronic renal failure, limb immobilization, neuromuscular disorders, sarcopenia of aging, and arthritis [1–8]. Irrespective of the underlying cause of atrophy, reduced muscle activation/contractile activity (hypodynamia) is an invariant feature. Recently, strong interest has focused on characterizing the fundamental molecular mechanism(s) underlying muscle atrophy and numerous cellular processes are known to coalesce into the overall atrophy phenotype. These alterations include decreased protein synthesis, increased protein degradation, and suppression of bioenergetic pathways associated with mitochon- drial function, and increased oxidative stress [9,10]. Upstream triggers that initiate atrophy are poorly understood and may vary depending on the pathological context; however, animal data suggests that disparate atrophic stimuli converge on the activation of protein degradation, particularly the ubiquitin (Ub)-26S proteasomal pathway [1,11–14]. Two novel Ub-protein ligases, atrogin-1 (muscle atrophy F-box protein) and muscle ring- finger protein (MuRF-1), are consistently up-regulated in murine models of muscle atrophy, and are thought to ubiquitinate both regulatory (e.g. calcineurin and MyoD) and structural (e.g. myosin and troponin I) proteins, thus directing the specific degradation of proteins during muscle atrophy [1,12,13,15–21]. While much progress has been made towards delineating the underlying functional alterations and signaling pathways that mediate muscle atrophy in animal models, few studies have examined muscle atrophy in humans. Early reports concerning protein turnover in humans demonstrated that mixed muscle protein synthesis rates decline during muscle atrophy while protein degradation rates appear unchanged [22–25]. This was confirmed in a recent study PLoS ONE | www.plosone.org 1 August 2009 | Volume 4 | Issue 8 | e6518
-
Upload
khangminh22 -
Category
Documents
-
view
8 -
download
0
Transcript of Limb Immobilization Induces a Coordinate Down- Regulation ...

Limb Immobilization Induces a Coordinate Down-Regulation of Mitochondrial and Other MetabolicPathways in Men and WomenArkan Abadi1, Elisa I. Glover1, Robert J. Isfort2, Sandeep Raha1, Adeel Safdar1, Nobuo Yasuda3, Jan J.
Kaczor4, Simon Melov5, Alan Hubbard6, Xiaoyan Qu2, Stuart M. Phillips7, Mark Tarnopolsky1*
1 Department of Pediatrics & Medicine, McMaster University, Hamilton, Ontario, Canada, 2 Procter & Gamble Company, Mason, Ohio, United States of America, 3 Graduate
School of Medicine, Juntendo University, Inba, Japan, 4 School of Medicine, Debinki 1, Gdansk, Poland, 5 Buck Institute for Age Research, Novato, California, United States
of America, 6 School of Public Health, University of California, Berkeley, California, United States of America, 7 Department of Kinesiology, McMaster University, Hamilton,
Ontario, Canada
Abstract
Advancements in animal models and cell culture techniques have been invaluable in the elucidation of the molecularmechanisms that regulate muscle atrophy. However, few studies have examined muscle atrophy in humans using modernexperimental techniques. The purpose of this study was to examine changes in global gene transcription duringimmobilization-induced muscle atrophy in humans and then explore the effects of the most prominent transcriptionalalterations on protein expression and function. Healthy men and women (N = 24) were subjected to two weeks of unilaterallimb immobilization, with muscle biopsies obtained before, after 48 hours (48 H) and 14 days (14 D) of immobilization. Musclecross sectional area (,5%) and strength (10–20%) were significantly reduced in men and women (,5% and 10–20%,respectively) after 14 D of immobilization. Micro-array analyses of total RNA extracted from biopsy samples at 48 H and 14 Duncovered 575 and 3,128 probes, respectively, which were significantly altered during immobilization. As a group, genesinvolved in mitochondrial bioenergetics and carbohydrate metabolism were predominant features at both 48 H and 14 D,with genes involved in protein synthesis and degradation significantly down-regulated and up-regulated, respectively, at 14 Dof muscle atrophy. There was also a significant decrease in the protein content of mitochondrial cytochrome c oxidase, and theenzyme activity of cytochrome c oxidase and citrate synthase after 14 D of immobilization. Furthermore, proteinubiquitination was significantly increased at 48 H but not 14 D of immobilization. These results suggest that transcriptionaland post-transcriptional suppression of mitochondrial processes is sustained throughout 14 D of immobilization, while proteinubiquitination plays an early but transient role in muscle atrophy following short-term immobilization in humans.
Citation: Abadi A, Glover EI, Isfort RJ, Raha S, Safdar A, et al. (2009) Limb Immobilization Induces a Coordinate Down-Regulation of Mitochondrial and OtherMetabolic Pathways in Men and Women. PLoS ONE 4(8): e6518. doi:10.1371/journal.pone.0006518
Editor: Rodolfo Aramayo, Texas A&M University, United States of America
Received January 14, 2009; Accepted May 21, 2009; Published August 5, 2009
Copyright: � 2009 Abadi et al. This is an open-access article distributed under the terms of the Creative Commons Attribution License, which permitsunrestricted use, distribution, and reproduction in any medium, provided the original author and source are credited.
Funding: Funding for the current project was primarily from a grant-in aid from Proctor and Gamble to MAT and from NSERC (MAT). Dr. Tarnopolsky is partiallysupported through an Endowed Chair from the Children’s Hospital Celebration and Michael DeGroote. E.I. Glover was supported by a Canadian Institutes ofHealth Research Doctoral Research Award. A. Abadi is sponsored by a post-doctoral fellowship from Mr. Warren Lammert and Kathy Corkins. Infrastructuresupport was provided from grants and donations from the Canadian Foundation for Innovation, Mr. Warren Lammert and Kathy Corkins, and Giant Tiger Stores.The funders had no role in study design, data collection and analysis, decision to publish, or preparation of the manuscript.
Competing Interests: The authors have declared that no competing interests exist.
* E-mail: [email protected]
Introduction
Skeletal muscle atrophy is associated with bed rest, corticoste-
roid use, denervation, chronic renal failure, limb immobilization,
neuromuscular disorders, sarcopenia of aging, and arthritis [1–8].
Irrespective of the underlying cause of atrophy, reduced muscle
activation/contractile activity (hypodynamia) is an invariant
feature. Recently, strong interest has focused on characterizing
the fundamental molecular mechanism(s) underlying muscle
atrophy and numerous cellular processes are known to coalesce
into the overall atrophy phenotype. These alterations include
decreased protein synthesis, increased protein degradation, and
suppression of bioenergetic pathways associated with mitochon-
drial function, and increased oxidative stress [9,10].
Upstream triggers that initiate atrophy are poorly understood
and may vary depending on the pathological context; however,
animal data suggests that disparate atrophic stimuli converge on
the activation of protein degradation, particularly the ubiquitin
(Ub)-26S proteasomal pathway [1,11–14]. Two novel Ub-protein
ligases, atrogin-1 (muscle atrophy F-box protein) and muscle ring-
finger protein (MuRF-1), are consistently up-regulated in murine
models of muscle atrophy, and are thought to ubiquitinate both
regulatory (e.g. calcineurin and MyoD) and structural (e.g. myosin
and troponin I) proteins, thus directing the specific degradation of
proteins during muscle atrophy [1,12,13,15–21]. While much
progress has been made towards delineating the underlying
functional alterations and signaling pathways that mediate muscle
atrophy in animal models, few studies have examined muscle
atrophy in humans. Early reports concerning protein turnover in
humans demonstrated that mixed muscle protein synthesis rates
decline during muscle atrophy while protein degradation rates
appear unchanged [22–25]. This was confirmed in a recent study
PLoS ONE | www.plosone.org 1 August 2009 | Volume 4 | Issue 8 | e6518

in which the rate of myofibrillar protein synthesis decreased by
,50% following 10 d of unilateral limb suspension (ULS) in human
subjects [26]. These studies have emphasized the suppression of
protein synthesis during atrophy in human muscle, which contrasts
with studies in murine models that point primarily towards
increased protein degradation [12–14]. However, one recent study
found that myofibrillar protein degradation was increased in
humans as early as 72 h following ULS [27]. In addition, the
expression of atrogin-1 and MuRF-1 during muscle atrophy in
humans is contentious, with some studies showing increased
atrogin-1 and MuRF-1 mRNA, but not others [26,28–31].
Global micro-array analysis has emerged as a powerful
experimental tool to investigate multiple cellular pathways
simultaneously; however, the relatively large sample size cost
needed to reach the full potential of this technique has limited its
application to the study of human muscle atrophy. The purpose of
this study was to examine changes in global gene transcription
during immobilization-induced muscle atrophy in humans and
then explore the effects of the most prominent transcriptional
alterations on protein expression and function in a relatively large
cohort of men and women. Overall, the transcriptional suppres-
sion of bioenergetic and mitochondrial genes dominated the
immobilization-induced transcriptome and was evident as early as
48 hours (48 H) following immobilization. These transcriptional
changes were accompanied by declines in both the protein level
and enzymatic activity of several mitochondrial proteins following
14 days (14 D) of immobilization. In addition, atrogin-1 and
MuRF-1 mRNA was significantly up-regulated early during the
progression of muscle atrophy and protein ubiquitination was
increased following 48 H of immobilization but not 14 D. Lastly,
mTOR phosphorylation decreased significantly following 48 H of
immobilization but not 14 D.
Methods
This data was collected during an immobilization study where
the subject characteristics and design were described previously
[32]. Muscle sufficient for the gene microarray, RT-PCR, protein,
and enzyme activity measurements were available for a total of 12
men and 12 women.
SubjectsRecreationally active, non-smoking, healthy men (N = 12) and
women (N = 12) participated in the trial. Demographics included: age
(men = 20.561.7; women = 21.162.7 y), height (men = 178.465.4;
women = 164.365.5 cm), and body mass index (men = 24.363.5;
women = 22.862.2) (Table 1). All of the women were eumenorrheic
and ,50% were tested in each phase of the menstrual cycle. The
study was approved by McMaster University and the Research Ethics
Board of the Hamilton Health Sciences. The study was explained in
detail to all subjects and they provided written informed consent
before participation.
Experimental procedureSubjects had a randomly assigned leg immobilized using a knee
brace (epX Knee Control Plus, Smith Orthopedics, Topeka, KS)
and were provided with walking crutches such that there was no
weight bearing on the immobilized leg. The study consisted of
three testing sessions termed; PRE (5 d before immobilization),
48 H (48 hours after immobilization) and 14 D (14 days after
immobilization). The subjects did not exercise for at least 3 d
before the first testing session or immobilization. All testing
sessions were identical and occurred in the morning following an
overnight fast, with consumption of a defined formula diet
(500 mL; BoostH, Novartis Medical Health, Inc., NY) 2 h prior
to the muscle biopsy. Testing included dual X-ray absorptiometry
(DEXA), magnetic resonance imaging (MRI), muscle strength,
muscle biopsy and blood sampling, with full details described
previously [32–36]. MRI was completed in a 1.5 Tesla scanner
with superconducting magnets (Symphony Quantum, Siemens,
Erlangen, Germany) to determine the cross-sectional area (CSA) of
the vastus muscles (vastus lateralis, vastus intermedius and vastus medialis)
and rectus femoris [32].
Muscle biopsies were obtained from the vastus lateralis muscle of
the immobilized leg under local anesthesia (2% lidocaine) with a
Table 1. Subject Characteristics.
Men (n = 12) Women (n = 12)
PRE 48 H 14 D PRE 48 H 14 D
Subject Characteristics
Age (y) 20.862.0 21.162.7
Height (cm) 177.967.7 164.365.5*
Body Mass (kg) 76.1611.0 76.8611.3 76.6611.8 61.869.1* 61.969.3* 61.669.5*
Lean Body Mass (kg) 62.067.6 61.867.7 62.068.0 44.865.3* 44.565.5* 44.665.5*
Hormones
Total Testosterone (nmolNl21) 14.162.4 14.063.1 14.164.1 0.860.3* 0.760.4* 0.760.2*
Estradiol (pmolNl21) 105623 103631 101630 1536186 1596153 115682
Cortisol (nmolNl21) 5986164 5016184 4666131 7326223 6566144*{ 6406240*{
Muscle Characteristics
CSA Total Quadriceps Femoris (cm2) 81.9612.0 N/A 76.9611.56{ 57.367.4* N/A 54.069.0*{
Concentric Slow Knee Ext. (Nm) 218636 204629 194628{ 146634* 129631* 115629*{
Isometric Knee Strength (Nm) 253636 248637 232633 159640* 139641* 123642*{
Notes: CSA = cross sectional area. Cortisol was analyzed using men n = 11 and women n = 9, and total testosterone was analyzed using women n = 11. Values are means 6 SD.*indicates a difference between women and men with a p value ,0.05.{indicates a change over time with a p value of ,0.05.doi:10.1371/journal.pone.0006518.t001
Metabolism and Immobilization
PLoS ONE | www.plosone.org 2 August 2009 | Volume 4 | Issue 8 | e6518

modified Bergstrom biopsy needle with manual suction. Incisions
were made at randomly chosen proximal, distal or mid (15 cm
proximal to lateral joint space) sites of the vastus lateralis separated
by ,3 cm. There were 7 d between biopsies from PRE to 48 H
and 12 d from 48 H to 14 D. Each sample was immediately
dissected of fat and connective tissue. Samples were divided into
three separate pieces, placed into RNAase free tubes, plunged into
liquid nitrogen, and stored at 280uC. If there was sufficient
muscle tissue remaining after the three primary allocations, we
embedded the muscle in optimal cutting temperature medium and
plunged it in to N-methylbutane chilled in liquid nitrogen for
histological fiber analysis using ATPase staining as previously
described by our group [32]. Muscle strength testing was
conducted at each session using a dynamometer (Biodex-System
3, Biodex Medical Systems Inc., New York) to evaluate the relative
changes in maximal force generating capacity over the time course
of immobilization.
RNA extractionTotal RNA was extracted from muscle using TRIzolH Reagent
(Invitrogen Canada) following the manufacturer’s instructions.
The concentration and purity of the RNA was spectrophotomet-
rically determined by measuring the absorbance at 260 (OD260)
and 280 (OD280) with an OD260/OD280 ratio of ,1.8 indicating
high quality RNA. The integrity of RNA samples were assessed by
RNA agarose-formaldehyde gel electrophoresis and evaluating the
ratio of 28S to 18S rRNA bands.
Gene Expression AnalysisGlobal changes in gene expression were examined using the HG
U133 plus gene micro-array (Affymetrix, Santa Clara, CA)
containing 54,675 human probe sequences. The background
correction, normalization and derivation of expression measures
were based on the Affymetrix signal (MAS 5.0 algorithm). Data
quality and outliers were checked using exploratory statistical
tools, such as summary statistics, pair plots, and Principal
Component Analysis. The micro-array data discussed in this
publication have been deposited in NCBI’s Gene Expression
Omnibus [37] and are accessible through GEO Series accession
number GSE14901 (http://www.ncbi.nlm.nih.gov/geo/query/
acc.cgi?acc = GSE14901).
Gene filtering was performed using standard multiple testing
procedures and clustering, based on packages available in
Bioconductor (www.bioconductor.org). First, expression of genes
at 48 H and 14 D after immobilization was compared to baseline
(PRE) using standard paired t-tests to define the early and late
transcriptional response to immobilization, respectively. For each
of these sets, we choose ‘‘significantly’’ differentially expressed
genes based on a false discovery rate (FDR) q-value ,0.05. 576
genes and 3,128 genes had significantly altered expression levels
(FDR q-value ,0.05) at 48 H and 14 D, respectively (Table 2). To
ascertain which transcriptional changes were specifically associat-
ed with muscle atrophy, a trend test (using simple linear regression
of Log2 expression versus change in cross sectional area (CSA)) was
conducted as the criterion for differentially expressed genes. Only
239 genes were found to have an FDR q-value ,0.05, in the
analysis of atrophy-associated genes.
Public resources as well as commercially available tools were used
to annotate the expressed genes, including Netaffx (http://www.
affymetrix.com/index.affx) and GeneCards (Weizmann Institute of
Science & Crown Human Genome Center, URL: http://bioinfo.weizmann.
ac.il). For those uncharacterized transcriptional probes or ESTs,
BLAST searches against NCBI non-redundant databases were
conducted. Gene Ontology (http://www.geneontology.org) was
coupled to comprehensive literature research to organize genes into
18 broad functional groups which include; mitochondria (oxidative
phosphorylation, tricarboxylic acid cycle, fatty acid metabolism,
regulatory, transport, and metabolism), carbohydrate metabolism,
metabolic (referring to non-bioenergetic metabolic pathways),
signaling and transcription factors, oxidative stress, redox, chaper-
ones, metallothioneins, secreted factors, biosynthesis, RNA synthesis
and maturation, protein synthesis, DNA regulation (including repair
enzymes and chromatin organization factors), protein degradation,
cytoskeleton, extracellular matrix, cell surface (receptors, markers,
channels and transporters), and organelle (referring to non-
mitochondrial organelles and including vesicle trafficking, Golgi
apparatus, endoplasmic reticulum, lysosomes). Once genes were
organized into functional categories, x2 analyses were conducted in
which the actual number of up- and down-regulated genes within
each functional category was compared to the expected number of
up- and down-regulated genes. The expected number of up- and
down-regulated genes was calculated by dividing the total number of
genes within each category by the total number of up- and down-
regulated genes, respectively. Functional categories with P#0.05
were considered to be significantly over- or under-represented
during immobilization.
In addition, genes that had an FDR q-value ,0.05 were
processed using the hierarchical clustering method (HOPACH)
[38] to find groups of similarly expressed genes across arrays and
examine the ordered distance matrices returned by this clustering
algorithm. In the analysis of late transcriptional changes following
immobilization (PRE versus 14 D), genes with an FDR q-value
,0.05 were ranked by FDR and only the top 1000 genes were
considered in the HOPACH cluster analysis. The gene content of
clusters varied considerably making an assessment of gene cluster
and function relationships not immediately obvious. To examine
the relationship between gene clustering and gene function,
clusters were grouped directionally (i.e. up-regulated clusters and
down-regulated clusters were separated) and the distribution of
genes within a given functional category across clusters were
examined using x2 analyses. Thus the actual gene content of
individual clusters within each functional category was compared
to the expected number of genes within said cluster and category.
The expected gene content of a cluster within a category was
Table 2. Summary of micro-array analyses.
Analysis Up-regulated genes Down-regulated genes Total Unknown
Early (48 H) genes 243 332 575 26%
Late (14 D) genes 1,514 1,614 3128 30%
Atrophy-associated genes 86 153 239 26%
Notes: Listed are the number of probes in each micro-array analysis which were significantly (FDR q-value ,0.05) altered by immobilization in human muscle.doi:10.1371/journal.pone.0006518.t002
Metabolism and Immobilization
PLoS ONE | www.plosone.org 3 August 2009 | Volume 4 | Issue 8 | e6518

calculated as the product of the total number of genes within the
cluster and the proportion of genes within that functional category
(i.e. total number of up-/down-regulated genes within the category
divided by the total number of up-/down-regulated genes).
Functional categories in which genes were unevenly distributed
over clusters (P#0.05) were considered to show significant
clustering along functional lines. Note that because some clusters
contained very few genes within a given functional category, only
functional categories that contained a total number of genes (N)
greater than the total number of clusters (NC) plus 2 (i.e. N.NC
+2) were considered for partitioning analysis (x2).
qRT-PCR. 1 mg of RNA, DNase treated (DNA-freeTM,
Ambion Inc, Austin TX) was converted to cDNA using the 1st
Strand cDNA Synthesis Kit for RT-PCR (AMV) (Roche Applied
Science, Laval PQ). Briefly, the reaction volume of 20 mL for RT
contained: 1x reaction buffer, 5 mM MgCl2, 1 mM dNTP
mixture, 3.2 mg of random primer p(dN)6, 50 U of RNase
inhibitor, 0.8 mL of AMV reverse transcriptase, and 1 mg of
DNA-free RNA. RT was performed in a thermal cycler (Applied
Biosystems, Foster City, CA): 25uC for 10 min, 42uC for 60 min,
99uC for 5 min, and 4uC for 5 min. All RNA samples were
converted to cDNA together to minimize technical variability.
Negative controls (no RNA or no reverse transcriptase enzyme)
were run simultaneously with samples to control for RNA and
genomic DNA contamination.
The primers for real-time PCR were designed using Primer3
software (http://frodo.wi.mit.edu/, Whitehead Institute for Bio-
medical Research) and their thermodynamic specificity was
determined using BLAST sequence alignments (NCBI) and Oligo
analyzer software (Integrated DNA Technologies, Coralville IA).
Real-time PCR was performed using an iCyclerH real-time PCR
system (Bio-Rad Laboratories, CA) using SYBRH Green 1
chemistry (iQ SYBRH Green Supermix, Bio-Rad Laboratories,
CA) according to the manufacturer’s instructions. Briefly, the
reaction volume of 25 mL for PCR contained: 1x iQ SYBRHGreen Supermix, forward and reverse primers, 10 ng cDNA
template. The application was performed for 1 cycle (50uC for
2 min, 95uC 10 for min) followed by 40 cycles (95uC for 15 s,
60uC for 60 s) and the b2-microglobulin signal was used as a
housekeeping gene to normalize CT values. All samples were run
in duplicate simultaneously with RNA- and RT-negative controls.
In addition, the melting point dissociation curve generated by the
instrument was also used to confirm the specificity of the amplified
product.
Protein contentThe level of phospho-mTOR, mTOR, Ub, CS, COX subunit
II (mitochondrial encoded) and COX subunit IV (nuclear
encoded) were quantified using Western blotting, as previously
reported by our group [39]. Briefly, 10 mg of 600 g muscle
homogenate was separated using 7–12.5% PAGE. Phospho-
mTOR, mTOR (rabbit monoclonal, Cell Signaling, Danvers,
MA), Ub (rabbit polyclonal, Biomol, Plymouth Meeting, PA), CS
(rabbit polyclonal, a kind gift from Dr. Brian Robinson, Hospital
for Sick Children, Toronto ON), COX subunit II, and COX
subunit IV (mouse monoclonal, Mitosciences, Eugene OR)
antibodies were used to probe proteins transferred onto PVDF
or nitrocellulose membranes, which were then developed and
quantified using the ImageJ software package (NIH, Bethesda,
MA, USA).
Enzyme analysisWe measured the maximal rate of enzyme activity for citrate
synthase (CS) and cytochrome c oxidase (COX) using a Cary BIO
300 spectrophotometer (Varian Canada, Toronto) at 30uC, as
previously described by our group [39]. Briefly, CS activity was
measured by adding 10 mL of supernatant to a medium containing
50 mM Tris-HCl buffer +5 mM EDTA at pH 8.1 with 0.1%
Triton X-100, 0.1 mM dithionitrobenzoic acid (DTNB) and
0.1 mM acetyl CoA, The enzyme reaction was started with
addition of 0.5 mM oxaloacetate. Absorbance was recorded at
412 nm for 3 min. All of the samples were analyzed in duplicate
and expressed as nmol/min/mg protein. COX activity was
determined as previously described by our group [39,40] with
minor modifications. Stock cytochrome c (oxidized) was reduced
with sodium ascorbate in 10 mM phosphate buffer at pH 7.0.
10 mL of a 600 g supernatant was added to 970 ml of 50 mM
phosphate buffer at 7.4. The reaction was initiated with 20 mL of
reduced cytochrome c and monitored at 550 nm for 3 min. The
protein content of the 600 g supernatant fraction was determined
according to Lowry et al [41]. All of the samples were analyzed in
duplicate and the COX activity was expressed as nmol of
cytochrome c oxidized/min/mg total protein using a molar
extinction coefficient of 18.9 mM21cm21. The intra-assay coeffi-
cient of variance for the enzyme activity assays was less than 10%.
Statistical Analysis for non-micro-array studiesAn independent t-test was applied to assess significant sex-
specific demographic differences. A two-way (gender and time)
analysis of variance (ANOVA) with mixed design was performed
to test for significant differences in muscle strength and muscle
CSA using a computerized statistical package (Statistica V5.1,
Statsoft, Tulsa, OK). Unpaired Student t-tests were used to test for
differences between groups in all other dependent variables
(Statistica 5.0, Statsoft, Tulsa, OK). Linear regression analysis
was used to correlate the mRNA transcript abundance levels
between the gene micro-array and the qRT-PCR analyses.
Statistical significance was established at P#0.05. Data are
presented as the means 6 standard deviation (SD).
Results
Muscle strength and CSA of quadricepsBoth men and women showed significant decreases in absolute
peak torque (Nm) following 14 D (men, 6.364.4%, P,0.001;
women, 23.066.1%, P,0.01), with women showing greater
strength loss as compared to men (P,0.05) (Table 1). Men and
women showed significant and nearly identical decreases in total
muscle CSA after 14 D of immobilization (men = 5.361.4%;
women = 6.261.5%, P,0.05), with men showing a larger CSA of
total quadriceps femoris (P,0.001) compared to women at all
times (Table 1). In addition, men (N = 8) and women (N = 6)
showed significant (P,0.05) decreases in type-I muscle fiber CSA
following 14 D of immobilization, but only women showed a
significant (P,0.05) decrease in type-IIa fiber CSA, and no
significant changes in type-IIx fiber CSA were detected in either
sex.
Global gene array analysisTotal RNA was obtained from 24 subjects at three time points
(N = non-pooled 72 samples) and examined using gene micro-
arrays (Affymetrix HG U133plus). Simple two-time point
comparisons in Log2 expression between PRE versus 48 H, and
PRE versus 14 D were conducted to define the early and late
transcriptional response to immobilization, respectively. In
addition, an analysis was conducted to examine probes whose
signal alteration was significantly associated with muscle atrophy.
To this end, a linear regression of change in Log2 expression
Metabolism and Immobilization
PLoS ONE | www.plosone.org 4 August 2009 | Volume 4 | Issue 8 | e6518

versus change in muscle CSA was used in a trend test to identify
atrophy-associated genes. Table 2 describes the micro-array
analyses and Table S1 contains the full list of significantly (FDR
q-value ,0.05) of altered probes. The genes corresponding to
these probes were organized into functional categories, and the
number of up-regulated and down-regulated genes within each
functional category was then compared to determine whether
categories were generally up- or down-regulated during muscle
atrophy (Figure 1 and S1). Importantly, all transcriptome changes
were identical in both men and women, and an analysis of
transcriptional alterations that were associated with strength
decline did not yield any significantly altered probes.
The salient feature of all the bioinformatic analyses was the
transcriptional suppression of genes involved in cellular bioener-
getics. Gene categories representing carbohydrate metabolism and
mitochondrial function; including oxidative phosphorylation, b-
oxidation, and mitochondrial regulation; were consistently down-
regulated (Figures 1 and S1). 73% of all mRNA species that
showed significant transcriptional changes by 48 H were also
significantly altered at 14 D. Only 155 probes were altered by
48 H but not at 14 D (Table S2). Thus, many of the mRNA
changes were initiated by 48 H progressed through to 14 D of
immobilization. Of note, functional categories representing
protein synthesis and protein degradation were only significantly
altered by 14 D of immobilization (down- and up-regulated,
respectively). Other functional groups were also significantly up-
regulated or down-regulated in specific analyses but only the
bioenergetics gene category was significantly down-regulated in all
micro-array analyses (Figures 1 and S1). These findings suggest
that the transcriptional suppression of bioenergetics is initiated
early during the progression of immobilization-induced muscle
atrophy and maintained for the duration of the immobilization
period, while transcriptional activation of protein degradation and
the suppression of protein synthesis occur later (14 D) (Figures 1).
To further explore patterns in the immobilization-induced
transcriptome, probes were organized into clusters (HOPACH)
according to commonalities in their transcriptional profiles. To
examine the relationship between gene clusters and gene function,
the distribution of HOPACH clusters into functional categories
was evaluated. Typically genes that were significantly enriched
within individual clusters partitioned unevenly across different
functional categories (Figure S2, S3 and S4). Thus gene categories
corresponding to components of bioenergetics, mitochondria, and
the cytoskeleton segregated into separate clusters in all micro-array
analyses, while protein synthesis and protein degradation segre-
gated into separate clusters only at 14 D (Figure S2, S3 and S4).
This robust relationship between gene clusters and gene functions
indicates a coordinate regulation of cellular pathways at the
transcriptional level. Interestingly, PGC-1a, the master regulator
of mitochondrial biogenesis, was down-regulated at both 48 H and
14 D along with dozens of downstream PGC-1a targets,
particularly at 14 D (Table S1, Figure 1).
Surprisingly, genes involved in protein degradation as a group
were not a prominent feature of the transcriptional profile of
immobilization-induced muscle atrophy despite their putatively
essential role in muscle atrophy in animal models [15–17]. Protein
degradation genes, as a category, were only significantly up-
regulated following 14 D of immobilization (Figure 1B). An
examination of the genes contained within this category revealed a
mix of Ub-conjugases, Ub-peptidases, 26S proteasome subunits,
non-Ub proteases, and SUMOlating genes (Table S1). Impor-
tantly, atrogin-1 and MuRF-1, two Ub-conjugating enzymes that
appear to have a crucial role in muscle atrophy [1,13–17], were
not among the genes in this category in any of the micro-array
analyses. This suggests that protein degradation, as a category, is
not a major aspect of the transcriptional program of human
muscle atrophy and is only transcriptionally up-regulated during
later stages of immobilization-induced atrophy.
Validation of micro-array results using RT-PCR, westernblotting and functional assays
In order to validate and extend the relationship between the
atrophic transcriptome and functional alterations associated with
atrophy, several different experimental approaches were applied.
First, the mRNA level of selected genes was quantified using real
time RT-PCR (qRT-PCR) (Figure S5). Significant changes in
mRNA species encoding selected genes including PGC-1a, ATP
synthase d subunit, succinate dehydrogenase, hexokinase 2, and
heme oxygenase-1 corroborated the results of the micro-array
analyses (Figure S5). mRNA measurements using qRT-PCR were
highly correlated (r2 = 0.996) with measurements obtained using
gene micro-arrays over a large range of differential gene
expression (20%–400%) (see Figure S5, inset frame). This indicates
that the micro-array analyses provided highly sensitive and
accurate, directional and quantitative measurements of changes
in specific mRNA species.
Next, changes in mRNA abundance were evaluated at the
protein level although limited sample prohibited the comprehen-
sive evaluation of many of the transcriptional alterations. Thus a
select group of proteins were examined to represent the primary
theme that emerged regarding mitochondrial dysfunction (Table
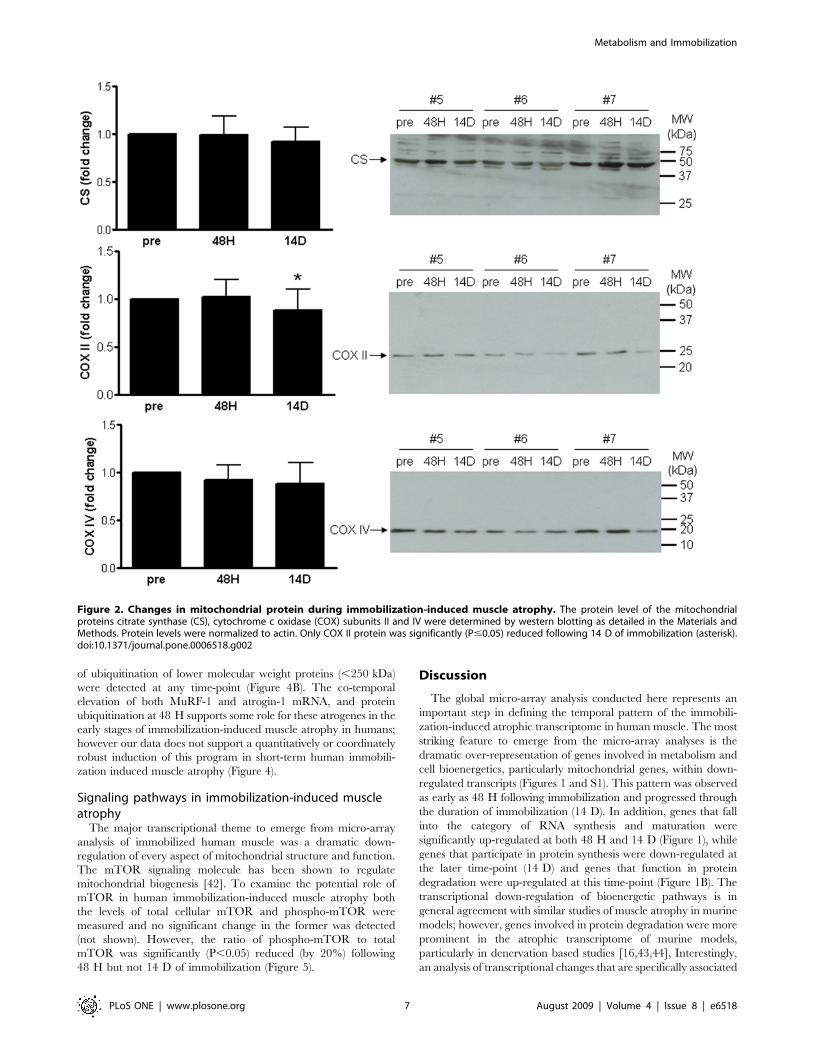
S1, Figures 1 and S5). The protein level of CS, an enzyme of the
tricarboxylic acid (TCA) cycle usually taken to indicate total
mitochondrial mass was not significantly reduced during the
course of this study (Figure 2). The protein level of the electron
transport chain (ETC) protein, COX subunit II (mitochondrial
DNA encoded), was significantly decreased following 14 D of
immobilization (P,0.01), while COX subunit IV (nuclear DNA-
encoded) appeared to be similarly reduced but not significantly
(Figure 2). Importantly, the maximal enzyme activity of both CS
(P,0.005) and COX (P,0.01) decreased significantly by 14 D of
immobilization (Figure 3). The extent of the decrease in COX
subunit II protein corresponded closely to the decline in COX
enzyme activity (both decreased by 18%). Thus, transcriptional
down-regulation of several components of the TCA cycle and
ETC by 14 D of immobilization is closely mirrored at the level of
enzymatic function and is consistent with a general attenuation of
mitochondrial bioenergetic function.
Due to the importance ascribed to atrogin-1 and MuRF-1 in
muscle atrophy, the mRNA levels of these genes were targetted
using qRT-PCR in spite of them not being identified as significantly
changed by the micro-array bioinformatics approach. Figure 4A
shows that the mRNA of both atrogin-1 and MuRF-1 increased
(,60%) significantly (P,0.05) following 48 H of immobilization.
Although the mRNA of both these genes appeared elevated
following 14 D of immobilization relative to pre-immobilization
measures, this difference was not significant. To assess the
implications of these findings at a functional level, overall protein
ubiquitination was measured using Western blotting. To this end,
muscle lysates were probed with an anti-Ub antibody and, as shown
in Figure 4B, Ub-positive proteins were distributed over a large
range of molecular weights with the most Ub dense signal appearing
above 250 kDa. Individual lanes were divided into two groups
(proteins weighing more or less than 250 kDa) and the Ub signal
from each group was quantified using densitometry. A moderate
(.20%), but significant (P,0.001) increase in the ubiquitination of
high MW proteins was detected at 48 H following immobilization
but not at 14 D (Figure 4B). No significant differences in the extent
Metabolism and Immobilization
PLoS ONE | www.plosone.org 5 August 2009 | Volume 4 | Issue 8 | e6518

Figure 1. Early (A) and late (B) transcriptional changes during immobilization-induced muscle atrophy. (A) Two-time pointcomparisons of Log2 probe signal between the PRE and 48 H time points were conducted and significant differences were assessed using standardpaired T-Tests. Genes with FDR q-value ,0.05 were considered to be significantly altered. Genes were then organized along functional lines and thenumber of genes in each category was plotted. x2 analyses comparing actual versus expected number of genes within each category (as detailed inthe Materials and Methods) were conducted to determine whether gene categories were significantly (P#0.05) up- or down-regulated at the early(48 H) time-point following immobilization. (B) Two-time point comparisons between PRE and 14 D probe signals were conducted as in (A) toidentify gene categories that were up- or down-regulated as part of the late (14 D) transcriptional response to immobilization. Red bars are down-regulated genes whereas green bars are up-regulated genes. Arrowheads indicate gene categories that were significantly up- or down-regulated.Gene categories representing fatty acid and carbohydrate metabolism, and mitochondrial function, including oxidative phosphorylation, b-oxidation,and mitochondrial regulation, were significantly down-regulated at both 48 H and 14 D of immobilization. In addition, the gene categoryrepresenting mRNA synthesis and maturation (e.g. splicing, polyadenelation, 59 cap binding proteins) was significantly up-regulated at both 48 H and14 D. The gene category representing metallothioneins was up-regulated at 48 H but not 14 D, while gene categories representing proteases andDNA regulation (e.g. repair enzymes and chromatin remodeling proteins) were up-regulated at 14 D but not 48 H. Lastly, the gene categoryrepresenting protein synthesis was down-regulated at 14 D but not at 48 H. ECM: extracellular matrix; Prot. Degradation: protein degradation; DNA.Reg.: DNA regulatory factors; RNA Synth.: RNA synthesis and maturation; Ox. Stress: oxidative stress; Carb. Metabolism: carbohydrate metabolism.doi:10.1371/journal.pone.0006518.g001
Metabolism and Immobilization
PLoS ONE | www.plosone.org 6 August 2009 | Volume 4 | Issue 8 | e6518
of ubiquitination of lower molecular weight proteins (,250 kDa)
were detected at any time-point (Figure 4B). The co-temporal
elevation of both MuRF-1 and atrogin-1 mRNA, and protein
ubiquitination at 48 H supports some role for these atrogenes in the
early stages of immobilization-induced muscle atrophy in humans;
however our data does not support a quantitatively or coordinately
robust induction of this program in short-term human immobili-
zation induced muscle atrophy (Figure 4).
Signaling pathways in immobilization-induced muscleatrophy
The major transcriptional theme to emerge from micro-array
analysis of immobilized human muscle was a dramatic down-
regulation of every aspect of mitochondrial structure and function.
The mTOR signaling molecule has been shown to regulate
mitochondrial biogenesis [42]. To examine the potential role of
mTOR in human immobilization-induced muscle atrophy both
the levels of total cellular mTOR and phospho-mTOR were
measured and no significant change in the former was detected
(not shown). However, the ratio of phospho-mTOR to total
mTOR was significantly (P,0.05) reduced (by 20%) following
48 H but not 14 D of immobilization (Figure 5).
Discussion
The global micro-array analysis conducted here represents an
important step in defining the temporal pattern of the immobili-
zation-induced atrophic transcriptome in human muscle. The most
striking feature to emerge from the micro-array analyses is the
dramatic over-representation of genes involved in metabolism and
cell bioenergetics, particularly mitochondrial genes, within down-
regulated transcripts (Figures 1 and S1). This pattern was observed
as early as 48 H following immobilization and progressed through
the duration of immobilization (14 D). In addition, genes that fall
into the category of RNA synthesis and maturation were
significantly up-regulated at both 48 H and 14 D (Figure 1), while
genes that participate in protein synthesis were down-regulated at
the later time-point (14 D) and genes that function in protein
degradation were up-regulated at this time-point (Figure 1B). The
transcriptional down-regulation of bioenergetic pathways is in
general agreement with similar studies of muscle atrophy in murine
models; however, genes involved in protein degradation were more
prominent in the atrophic transcriptome of murine models,
particularly in denervation based studies [16,43,44], Interestingly,
an analysis of transcriptional changes that are specifically associated
Figure 2. Changes in mitochondrial protein during immobilization-induced muscle atrophy. The protein level of the mitochondrialproteins citrate synthase (CS), cytochrome c oxidase (COX) subunits II and IV were determined by western blotting as detailed in the Materials andMethods. Protein levels were normalized to actin. Only COX II protein was significantly (P#0.05) reduced following 14 D of immobilization (asterisk).doi:10.1371/journal.pone.0006518.g002
Metabolism and Immobilization
PLoS ONE | www.plosone.org 7 August 2009 | Volume 4 | Issue 8 | e6518

with the observed decline in muscle strength during immobilization
did not yield any statistically significant genes (FDR q-value ,0.05).
This suggests that the decline in muscle strength is not mediated by
changes in gene transcription within muscle itself, but may be
mediated post-transcriptionally or by neuronal and/or hormonal
adaptations to immobilization. Further work is needed to elucidate
the underlying mechanisms that regulate changes in muscle
strength following short-term immobilization, particularly, given
the fact that women lost similar muscle mass and had an identical
transcriptome response as compared to men, but had nearly twice
the strength loss (Table 1) [32].
Bioenergetics and metabolismVirtually all facets of mitochondrial function including, oxidative
phosphorylation, TCA cycle, fatty acid metabolism, mitochondrial
transcription and translation, and solute and protein transport, were
coordinately down-regulated (,30% by 14 D, Table S1) at the
transcriptional level by immobilization. These transcriptional
changes were initiated very early during (48 H) the course of the
transcriptional response to immobilization, indicating that mito-
chondrial bioenergetic pathways are rapidly targeted for transcrip-
tional down-regulation following immobilization.
To examine the impact of the transcriptional suppression of
mitochondrial genes, the protein levels and enzymatic activities of
a subset of mitochondrial bioenergetic proteins were measured.
Specifically, micro-array analysis revealed that CS mRNA was
significantly down-regulated (,20%) at 14 D and in association
with atrophy (Table S1), and this was confirmed by qRT-PCR
(PRE vs. 14 D) (Figure S5). Although CS protein expression was
reduced over the course of immobilization, this reduction was not
statistically significant (Figure 2). Similarly COX subunit IV
(nuclear encoded) mRNA was significantly decreased (,20%) at
14 D (micro-array and qRT-PCR, Table S1 and Figure S5), COX
subunit IV protein levels were reduced at 14 D but not
significantly (Figure 2). However, the enzyme activity of both CS
and COX was significantly decreased by 14 D of immobilization
(Figure 3). The concordance between mRNA and enzyme activity
measures but not protein levels is likely a reflection of the higher
variability of Western blotting compared to qRT-PCR and
enzyme activity assays. In addition, COX subunit II (mitochon-
drial encoded) protein levels were significantly decreased (,20%)
following 14 D of immobilization indicating that the suppression
of mitochondrial regulatory components (e.g. transcription/
translation pathways) results in a detectable reduction in the
expression of the COX subunit II mitochondrial protein.
Although other studies have reported decreases in the
transcriptional and enzyme activity levels of specific components
of muscle bioenergetic/mitochondrial systems after 1–6 weeks of
unloading [45–48], few studies have examined global transcrip-
tional patterns during muscle atrophy in humans [28,30,31], and
only one has reported the large-scale suppression of mitochondrial
genes during immobilization in humans [30]. However, only a
small cohort (N = 4) was utilized and RNA samples were pooled
from different subjects undergoing different periods of immobili-
zation (4–11 d). Interestingly, the other study examined global
transcriptional changes in humans following spinal cord injury and
showed marked changes in the mRNA of protein degradation
pathways [28]. This suggests that different transcriptional patterns
are induced following denervation (spinal cord injury) and
immobilization (casting/bracing).
This is the first report to show that the transcriptional down-
regulation of mitochondrial genes comprises the predominant
transcriptional feature of the atrophic transcriptome produced
during short-term immobilization in humans. In addition, the
large cohort used in this study enabled us to map out both early
and late transcriptional patterns in human muscle during
immobilization. The down-regulation of mitochondrial genes
commenced as early as 48 H following immobilization. This
pattern persisted over 14 D of immobilization and 73% of all
significantly altered probes at 48 H were also altered at 14 D.
Furthermore, this is the first study to demonstrate that the
transcriptional suppression of mitochondrial genes is associated
with reduced expression of mitochondrial proteins and decreased
mitochondrial enzyme activity.
The evidence surrounding the involvement of mitochondrial
dysfunction in muscle atrophy (induced by immobilization or
denervation in animal models) has primarily focused on the
contribution of mitochondrial dysfunction to increased oxidative
stress and the induction of apoptosis [30,49–51]. Results presented
here indicate that mitochondria may participate in the atrophic
response through their bioenergetic function. Direct support for
this proposition comes from the observation that over-expression
of PGC-1a in mouse skeletal muscle confers marked resistance to
muscle atrophy following hindlimb unweighting [52,53]. At
present it is unclear how mitochondrial bioenergetics regulates
muscle atrophy; however, alterations in mitochondrial bioener-
getics are likely to influence other cellular pathways that are
regulated by mitochondria, such as apoptosis, oxidative stress, and
calcium signaling along with other ATP-dependent processes.
Figure 3. Changes in mitochondrial enzyme activity duringimmobilization-induced muscle atrophy. The enzyme activity of CSand COX was determined spectrophotometrically as detailed in theMaterials and Methods. The enzymatic activity of both CS and COX weresignificantly (P#0.05) reduced following 14 D of immobilization (asterisk).doi:10.1371/journal.pone.0006518.g003
Metabolism and Immobilization
PLoS ONE | www.plosone.org 8 August 2009 | Volume 4 | Issue 8 | e6518

Protein Synthesis and DegradationBoth protein synthesis and protein degradation are altered to
varying degrees and at different time-points during human muscle
atrophy. While animal studies have emphasized the importance of
muscle protein degradation during muscle atrophy [1,11,13–17],
the relative contribution of these processes to human muscle
atrophy remains unclear. Early studies into the mechanism of
muscle atrophy in humans concluded that the loss of muscle mass
during bed rest was primarily due to the suppression of protein
synthesis as muscle protein degradation was found not to change
[23–25,54]. Furthermore, the rate of myofibrillar protein synthesis
was ,50% lower in human muscle biopsy samples taken after 10
and 21 d of cast immobilization [26]. One study to date has
measured the interstitial 3-methylhistidine (3-MH) concentration
during immobilization-induced muscle atrophy in humans and
demonstrated increased concentrations, presumably reflective of
accelerated myofibrillar protein degradation at 72 h following
ULS [27].
Results using micro-array analysis obtained here support a role
for decreased protein synthesis in the later stages of human
immobilization-induced muscle atrophy as genes encoding
ribosomal subunits, translation initiation and elongation factors,
and tRNA synthesizing enzymes were significantly down-regulated
in the late (14 D) time-point of immobilization (Table S1,
Figure 1B). Similarly, the micro-array analyses presented here
indicate that protein degradation, as a functional category, is
significantly up-regulated at a later (14 D) stage of immobilization-
induced atrophy. This gene category is primarily comprised of
components of the Ub-26S proteasome pathway, including Ub-
conjugases, Ub-peptidases, subunits of the 26S proteasome, and
SUMO-lating enzymes (Table S1). Surprisingly, neither atrogin-1
nor MuRF-1 were significantly altered in of the any micro-array
analysis conducted despite being represented on the HU 133+gene chips (Affymetrix). By contrast, atrogin-1 and MuRF-1
mRNAs were found to increase significantly at 48 H but not 14 D
post-immobilization using qRT-PCR (Figure 4A). This discrep-
Figure 4. Transcriptional status of atrogin-1 and MuRF-1 and global protein ubiquitination during immobilization-induced muscleatrophy. (A) The mRNA level of both atrogin-1 and MuRF-1 was determined using qRT-PCR and significant (P#0.05) increases in both genes weredetected following 48 H of immobilization but not at 14 D. (B) Overall protein ubiquitination was examined using Western blotting and numerousubiquitin-positive protein bands were detected (left). The most ubiquitin-dense proteins were greater than 250 kDa in MW. Thus lanes were dividedinto high MW (.250 kDa) and low MW (,250 kDa) sections and quantified using densitometry. A significant (P#0.05) increase in proteinubiquitination of high MW proteins was detected following 48 H of immobilization (right, asterisk) but not 14 D. No significant changes in lowmolecular weight (,250 kDa) protein ubiquitination were detected at any time-point.doi:10.1371/journal.pone.0006518.g004
Metabolism and Immobilization
PLoS ONE | www.plosone.org 9 August 2009 | Volume 4 | Issue 8 | e6518

ancy might be attributed to the high variance in the mRNA levels
of these genes, which precluded their achieving statistical
significance in the micro-array analyses. Importantly, a recent
study indicated that increases in the mRNA levels of atrogin-1 and
MuRF-1 was not accompanied by increased protein levels of these
genes during denervation-induced muscle atrophy in humans [28].
That protein ubiquitination does play some role in the early phases
of human muscle atrophy during immobilization is supported by
the finding of a significant increase (,20%) in the level of
ubiquitination of high MW proteins (.250 kDa) at 48 H but not
at 14 D (Figure 4B). While the specific identity of these
ubiquitinated high MW proteins was not determined, MuRF-1
has previously been shown to participate in the ubiquitination of
large cytoskeletal elements, including myosin heavy chain [12,19],
which are likely candidates for the high MW ubiquitinated
proteins observed here. However, we were unable to detect
atrogin-1 and MuRF protein using commercial antibodies
(Abcam) and limited quantities of sample precluded direct
measurements of Ub-proteasome activity. Thus, further work is
needed before the increased protein ubiquitination observed here
is attributed to MuRF-1 and/or atrogin-1 as well as to precisely
define the role of proteasomal pathways in human immobilization-
induced muscle atrophy.
Signaling factorsA large number of signaling molecules and transcription factors
were transcriptionally altered in all the micro-array analyses
conducted (Table S1). However, categorical analysis of such
factors is not useful because unlike components of metabolic
pathways (e.g. oxidative phosphorylation), regulatory factors have
highly context specific functions. In addition, the transcriptional
regulation of such factors may nominally impact their functional
status as other modes of regulation such as protein stability,
phosphorylation status, binding partners, and sub-cellular locali-
zation can be more important determinants of functional activity.
While the transcriptional status of such regulatory proteins cannot
be used to ascertain their functional status, important clues can still
be derived from the transcriptional status of down-stream
functional genes. In particular, cluster analysis indicated that
mitochondrial and bioenergetic genes cluster together which
suggests that they are transcriptionally co-regulated. The results
presented here indicate that PGC-1a mRNA is significantly down-
regulated during both the early and late phases of immobilization-
induced muscle atrophy (Table S1, Figure S5). In muscle, PGC-1afunctions as a transcriptional co-activator that controls the
expression of a large number of mitochondrial and metabolic
genes [55–57]. Decreased PGC-1a mRNA along with the
suppression of mitochondrial and metabolic genes may denote
decreased PGC-1a activity during immobilization [57]. Although
total PGC-1a protein content was not significantly altered by
immobilization (not shown), PGC-1a protein level alone does not
represent its functional status since phosphorylation, acetylation,
and localization determine overall PGC-1a activity [52,58].
Several cell signaling pathways have been implicated in muscle
remodeling and mitochondrial biogenesis including Akt, NF-kB,
and Ca2+-mediated signaling; however, the Akt signaling pathway
is the best characterized regulator of both muscle hypertrophy and
atrophy [59-69]. In the context of muscle atrophy, lower Akt
activity decreases the activation of mammalian target of
rapamycin (mTOR), leading to decreased protein synthesis and
ribosomal biogenesis, as well as decreased mitochondrial biogen-
esis and function, as mTOR has been shown to regulate
mitochondrial gene expression through the regulation of YY1/
PGC-1a complex formation [42,59,60,70–73]. In addition, lower
Akt activity initiates signaling pathways that culminate in the
induction of both atrogin-1 and MuRF-1 [14,73,74]. Phosphor-
ylation of components of the Akt pathway was recently shown to
decrease following 48 h of immobilization in humans [31].
Another study, however, failed to detect any significant changes
in the phosphorylation of Akt, mTOR, p70S6K, eEF2, eIF4E, and
TSC2 in men following 10 and 21 d of ULS [26]. Our
examination found that while the ratio of phospho-Akt:Akt was
not significantly altered following 48 H and 14 D of immobiliza-
tion (not shown), the ratio of phospho-mTOR:mTOR decreased
significantly following 48 H of immobilization but not 14 D of
immobilization (Figure 5). Together, these findings suggest that
signaling through mTOR may decline transiently during the early
response of human muscle to immobilization and may contribute
to decreased mitochondrial gene expression, possibly through
interactions with PGC-1a [42].
In summary, the micro-array analyses presented here represent
the most comprehensive evaluation of transcriptional changes
during immobilization-induced muscle atrophy in humans. Our
results highlight the importance of mitochondrial down-regulation,
decreased mTOR phosphorylation, and increased protein ubiqui-
tination during the early phases of the muscular response to
immobilization in humans. The transcriptional profile during later
phases of immobilization also show the coordinate down-
regulation of every bioenergetic pathway, but are also marked
by a reduction in protein synthesis pathways and an increase in
some components of proteolytic systems. Much remains unclear
with regard to the signaling mechanisms that precipitate the
atrophic transcriptome in humans. Future work aimed at
uncovering these mechanisms, beginning with an examination of
the subcellular localization, post-translational modifications, and
protein interactions of PGC-1a during muscle atrophy, could
produce novel therapeutic strategies to combat pervasive patho-
Figure 5. Changes in mTOR phosphorylation during immobi-lization-induced muscle atrophy. The protein level of phospho-mTOR was measured in muscle samples undergoing immobilization-induced muscle atrophy using Western blotting. Blots were thenstripped and re-probed for total mTOR. Protein levels were normalizedto tubulin. No significant differences in total mTOR protein levels weredetected at any time-points (not shown), however the ratio of phospho-mTOR to mTOR decreased significantly (P#0.05) at the 48 H time-point(asterisk) indicating decreased mTOR protein phosphorylation duringthe early phase of immobilization-induced muscle atrophy.doi:10.1371/journal.pone.0006518.g005
Metabolism and Immobilization
PLoS ONE | www.plosone.org 10 August 2009 | Volume 4 | Issue 8 | e6518

logical conditions associated with muscle atrophy in patients. In
addition, future experiments focused on evaluating cellular
proteasomal pathways by directly measuring the activity of Ub-
proteasome, calpains, and caspases are vital to understanding the
role of these systems in human muscle atrophy following
immobilization.
Supporting Information
Figure S1 Transcriptional changes associated with atrophy
following immobilization. Simple linear regression trend tests of
Log2 probe signal versus change in CSA were conducted to define
transcriptional changes specifically associated with muscle atro-
phy. As in Figure 1, genes with an FDR q-value ,0.05 were
considered to be significantly associated with atrophy. Genes were
then organized along functional lines and the number of genes in
each category was plotted. X2 analyses were conducted on gene
categories as in Figure 1 to determine whether gene categories
were significantly (P#0.05) up- or down-regulated in association
with atrophy. Red bars are down-regulated genes whereas green
bars are up-regulated genes. Arrowheads indicate gene categories
that were significantly up- or down-regulated. Gene categories
representing cellular bioenergetics, including fatty acid and
carbohydrate metabolism and in particular mitochondrial func-
tion, were significantly down-regulated. Gene categories repre-
senting cytoskeletal components and regulators, oxidative stress,
and metallothioneins were significantly up-regulated in association
with atrophy. Significant alterations in the former two categories
were unique to the analysis of atrophy-associated genes and were
not significantly altered (as categories) in either the early (48H) or
late (14D) analyses.
Found at: doi:10.1371/journal.pone.0006518.s001 (0.01 MB
PDF)
Figure S2 Cluster analysis of transcriptionally altered genes
during the early (48H) phase of muscle atrophy. Genes whose
transcription was significantly altered (FDR q-value ,0.05) in two-
time point comparisons early (48H) during the progression of
immobilization-induced muscle atrophy were ordered into hier-
archical clusters using HOPACH. HOPACH analysis produced 5
clusters, two of which (E1-1 and E1-2) represented up-regulated
genes (A) and the remaining three (E2-1, E2-2, and E2-3)
represented down-regulated genes (B). To determine the relation-
ship between gene clusters and gene function, the distribution of
genes (gene number) across the up-regulated and down-regulated
clusters was plotted within each functional category. X2 analysis
was employed to expose significant deviations between the actual
number of genes within individual clusters in each functional
category and the expected number of genes therein (detailed in the
Materials and Methods). Asterisk indicates significant differences
(P#0.05) between the observed and expected partitioning of genes
within clusters and functional categories.
Found at: doi:10.1371/journal.pone.0006518.s002 (0.02 MB
PDF)
Figure S3 Cluster analysis of transcriptionally altered genes
during the late (14D) phase of muscle atrophy. Genes whose
transcription was significantly altered (FDR q-value ,0.05) in two-
time point comparisons proximally (14D) during the progression of
immobilization-induced muscle atrophy were ordered into hierar-
chical clusters using HOPACH. HOPACH analysis produced 11
clusters, six of which (L3-0, L4-1, L4-2, L4-3, L4-4, L4-5 and L4-6)
represented up-regulated genes (A) and the remaining five (L1-0, L2-
1, L2-2, L2-5, and L2-6) represented down-regulated genes (B). To
determine the relationship between gene clusters and gene function,
the distribution of genes (gene number) across the up-regulated and
down-regulated clusters was plotted within each functional category.
X2 analysis was employed to expose significant deviations between
the actual number of genes within individual clusters in each
functional category and the expected number of genes therein
(detailed in the Materials and Methods). Asterisk indicates significant
differences (P#0.05) between the observed and expected partition-
ing of genes within clusters and functional categories.
Found at: doi:10.1371/journal.pone.0006518.s003 (0.02 MB
PDF)
Figure S4 Cluster analysis of atrophy-associated genes altered
genes during immobilization-induced muscle atrophy. Genes whose
transcription was significantly altered (FDR q-value ,0.05) in trend
tests of atrophy-associated genes (Log2 versus change in CSA)
during immobilization-induced muscle atrophy were ordered into
hierarchical clusters using HOPACH. HOPACH analysis produced
6 clusters, two of which (A1 and A2) represented up-regulated genes
(A) and the remaining four (A3, A4, A5, and A6) represented down-
regulated genes (B). To determine the relationship between gene
clusters and gene function, the distribution of genes (gene number)
across the up-regulated and down-regulated clusters was plotted
within each functional category. X2 analysis was employed to
expose significant deviations between the actual number of genes
within individual clusters in each functional category and the
expected number of genes therein (detailed in the Materials and
Methods). Asterisk indicates significant differences (P#0.05)
between the observed and expected partitioning of genes within
clusters and functional categories.
Found at: doi:10.1371/journal.pone.0006518.s004 (0.02 MB
PDF)
Figure S5 Quantitative real-time RT-PCR of selected genes at
48H (A) and 14D (B). The mRNA level of indicated genes was
determined using quantitative real-time RT-PCR analyses (open
bars) and compared directly to results from gene micro-array
analyses (filled bars). Results obtained using both measures are
plotted in the inset panels and the correlation coefficient was
determined using linear regression. The high degree of correlation
(R = 0.99) between mRNA measures obtained using two indepen-
dent techniques (micro-array and RT-PCR) indicates the high
accuracy of the micro-array analyses.
Found at: doi:10.1371/journal.pone.0006518.s005 (0.02 MB
PDF)
Table S1 Complete list of significantly altered genes from all
analyses, organized by gene category.
Found at: doi:10.1371/journal.pone.0006518.s006 (1.05 MB
XLS)
Table S2 Genes altered by 48H but not following 14D of
immobilization.
Found at: doi:10.1371/journal.pone.0006518.s007 (0.04 MB
XLS)
Acknowledgments
We would like to thank all of the participants in this study for their time
and efforts as well as acknowledge their essential contribution to this
research. We would also like to thank Mr. Dan Ogborn and Mr. Justin
Crane for their critical review of this manuscript.
Author Contributions
Conceived and designed the experiments: MAT. Performed the experi-
ments: AA EIG SR AS NY JJK. Analyzed the data: AA EIG RJI SR AS
NY JJK SM AH XAQ SP. Contributed reagents/materials/analysis tools:
MAT. Wrote the paper: AA MAT.
Metabolism and Immobilization
PLoS ONE | www.plosone.org 11 August 2009 | Volume 4 | Issue 8 | e6518

References
1. Lecker SH, Jagoe RT, Gilbert A, Gomes M, Baracos V, et al. (2004) Multiple
types of skeletal muscle atrophy involve a common program of changes in geneexpression. FASEB J 18: 39–51.
2. Booth FW, Nicholson WF, Watson PA (1982) Influence of muscle use on protein
synthesis and degradation. Exerc Sport Sci Rev 10: 27–48.
3. Zinna EM, Yarasheski KE (2003) Exercise treatment to counteract protein
wasting of chronic diseases. Curr Opin Clin Nutr Metab Care 6: 87–93.
4. Mansoor O, Bazin JE, Beaufrere B, Schoeffler P (1998) [Catabolic aspects ofcranial trauma]. Ann Fr Anesth Reanim 17: 180–185.
5. Baracos VE (2001) Management of muscle wasting in cancer-associated
cachexia: understanding gained from experimental studies. Cancer 92:1669–1677.
6. Fitts RH, Riley DR, Widrick JJ (2000) Physiology of a microgravity environmentinvited review: microgravity and skeletal muscle. J Appl Physiol 89: 823–839.
7. Krasnoff J, Painter P (1999) The physiological consequences of bed rest and
inactivity. Adv Ren Replace Ther 6: 124–132.
8. Rajan VR, Mitch WE (2008) Muscle wasting in chronic kidney disease: the roleof the ubiquitin proteasome system and its clinical impact. Pediatr Nephrol 23:
527–535.
9. Kandarian SC, Jackman RW (2006) Intracellular signaling during skeletal
muscle atrophy. Muscle Nerve 33: 155–165.
10. Jankala H, Harjola VP, Petersen NE, Harkonen M (1997) Myosin heavy chainmRNA transform to faster isoforms in immobilized skeletal muscle: a
quantitative PCR study. J Appl Physiol 82: 977–982.
11. Sacheck JM, Hyatt JP, Raffaello A, Jagoe RT, Roy RR, et al. (2007) Rapiddisuse and denervation atrophy involve transcriptional changes similar to those
of muscle wasting during systemic diseases. FASEB J 21: 140–155.
12. Clarke BA, Drujan D, Willis MS, Murphy LO, Corpina RA, et al. (2007) The
E3 Ligase MuRF1 degrades myosin heavy chain protein in dexamethasone-treated skeletal muscle. Cell Metab 6: 376–385.
13. Gomes MD, Lecker SH, Jagoe RT, Navon A, Goldberg AL (2001) Atrogin-1, a
muscle-specific F-box protein highly expressed during muscle atrophy. Proc NatlAcad Sci U S A 98: 14440–14445.
14. Sandri M, Sandri C, Gilbert A, Skurk C, Calabria E, et al. (2004) Foxotranscription factors induce the atrophy-related ubiquitin ligase atrogin-1 and
cause skeletal muscle atrophy. Cell 117: 399–412.
15. Krawiec BJ, Frost RA, Vary TC, Jefferson LS, Lang CH (2005) Hindlimbcasting decreases muscle mass in part by proteasome-dependent proteolysis but
independent of protein synthesis. Am J Physiol Endocrinol Metab 289:E969–980.
16. Stevenson EJ, Giresi PG, Koncarevic A, Kandarian SC (2003) Global analysis ofgene expression patterns during disuse atrophy in rat skeletal muscle. J Physiol
551: 33–48.
17. Bodine SC, Latres E, Baumhueter S, Lai VK, Nunez L, et al. (2001)Identification of ubiquitin ligases required for skeletal muscle atrophy. Science
294: 1704–1708.
18. Kedar V, McDonough H, Arya R, Li HH, Rockman HA, et al. (2004) Muscle-
specific RING finger 1 is a bona fide ubiquitin ligase that degrades cardiactroponin I. Proc Natl Acad Sci U S A 101: 18135–18140.
19. Centner T, Yano J, Kimura E, McElhinny AS, Pelin K, et al. (2001)
Identification of muscle specific ring finger proteins as potential regulators of thetitin kinase domain. J Mol Biol 306: 717–726.
20. Li HH, Kedar V, Zhang C, McDonough H, Arya R, et al. (2004) Atrogin-1/
muscle atrophy F-box inhibits calcineurin-dependent cardiac hypertrophy by
participating in an SCF ubiquitin ligase complex. J Clin Invest 114: 1058–1071.
21. Tintignac LA, Lagirand J, Batonnet S, Sirri V, Leibovitch MP, et al. (2005)Degradation of MyoD mediated by the SCF (MAFbx) ubiquitin ligase. J Biol
Chem 280: 2847–2856.
22. de Grey AD (2006) Foreseeable pharmaceutical repair of age-relatedextracellular damage. Curr Drug Targets 7: 1469–1477.
23. Ferrando AA, Lane HW, Stuart CA, Davis-Street J, Wolfe RR (1996) Prolonged
bed rest decreases skeletal muscle and whole body protein synthesis. Am J Physiol
270: E627–633.
24. Gibson JN, Halliday D, Morrison WL, Stoward PJ, Hornsby GA, et al. (1987)Decrease in human quadriceps muscle protein turnover consequent upon leg
immobilization. Clin Sci (Lond) 72: 503–509.
25. Shangraw RE, Stuart CA, Prince MJ, Peters EJ, Wolfe RR (1988) Insulinresponsiveness of protein metabolism in vivo following bedrest in humans.
Am J Physiol 255: E548–558.
26. de Boer MD, Selby A, Atherton P, Smith K, Seynnes OR, et al. (2007) The
temporal responses of protein synthesis, gene expression and cell signalling inhuman quadriceps muscle and patellar tendon to disuse. J Physiol 585: 241–251.
27. Tesch PA, von Walden F, Gustafsson T, Linnehan RM, Trappe TA (2008)
Skeletal muscle proteolysis in response to short-term unloading in humans. J ApplPhysiol.
28. Urso ML, Chen YW, Scrimgeour AG, Lee PC, Lee KF, et al. (2007) Alterationsin mRNA expression and protein products following spinal cord injury in
humans. J Physiol 579: 877–892.
29. Jones SW, Hill RJ, Krasney PA, O’Conner B, Peirce N, et al. (2004) Disuseatrophy and exercise rehabilitation in humans profoundly affects the expression
of genes associated with the regulation of skeletal muscle mass. FASEB J 18:1025–1027.
30. Chen YW, Gregory CM, Scarborough MT, Shi R, Walter GA, et al. (2007)
Transcriptional pathways associated with skeletal muscle disuse atrophy inhumans. Physiol Genomics 31: 510–520.
31. Urso ML, Scrimgeour AG, Chen YW, Thompson PD, Clarkson PM (2006)Analysis of human skeletal muscle after 48 h immobilization reveals alterations
in mRNA and protein for extracellular matrix components. J Appl Physiol 101:1136–1148.
32. Yasuda N, Glover EI, Phillips SM, Isfort RJ, Tarnopolsky MA (2005) Sex-baseddifferences in skeletal muscle function and morphology with short-term limb
immobilization. J Appl Physiol 99: 1085–1092.
33. Beaton LJ, Allan DA, Tarnopolsky MA, Tiidus PM, Phillips SM (2002)
Contraction-induced muscle damage is unaffected by vitamin E supplementa-tion. Med Sci Sports Exerc 34: 798–805.
34. Mihic S, MacDonald JR, McKenzie S, Tarnopolsky MA (2000) Acute creatine
loading increases fat-free mass, but does not affect blood pressure, plasma
creatinine, or CK activity in men and women. Med Sci Sports Exerc 32:291–296.
35. Sale DG, MacDougall JD, Alway SE, Sutton JR (1987) Voluntary strength and
muscle characteristics in untrained men and women and male bodybuilders.
J Appl Physiol 62: 1786–1793.
36. Schantz P, Randall-Fox E, Hutchison W, Tyden A, Astrand PO (1983) Musclefibre type distribution, muscle cross-sectional area and maximal voluntary
strength in humans. Acta Physiol Scand 117: 219–226.
37. Edgar R, Domrachev M, Lash AE (2002) Gene Expression Omnibus: NCBI
gene expression and hybridization array data repository. Nucleic Acids Res 30:207–210.
38. van der Laan MJ, Pollard KS (2003) A new algorithm for hybrid hierchicalclustering with visualization and the bootstrap. Journal of Statistical Planning
and Inference 117: 275–303.
39. Gibala MJ, Little JP, van Essen M, Wilkin GP, Burgomaster KA, et al. (2006)
Short-term sprint interval versus traditional endurance training: similar initialadaptations in human skeletal muscle and exercise performance. J Physiol 575:
901–911.
40. Parise G, Brose AN, Tarnopolsky MA (2005) Resistance exercise training
decreases oxidative damage to DNA and increases cytochrome oxidase activityin older adults. Exp Gerontol 40: 173–180.
41. Lowry OH, Rosebrough NJ, Farr AL, Randall RJ (1951) Protein measurement
with the Folin phenol reagent. J Biol Chem 193: 265–275.
42. Cunningham JT, Rodgers JT, Arlow DH, Vazquez F, Mootha VK, et al. (2007)
mTOR controls mitochondrial oxidative function through a YY1-PGC-1alphatranscriptional complex. Nature 450: 736–740.
43. Raffaello A, Laveder P, Romualdi C, Bean C, Toniolo L, et al. (2006)Denervation in murine fast-twitch muscle: short-term physiological changes and
temporal expression profiling. Physiol Genomics 25: 60–74.
44. DeRuisseau KC, Shanely RA, Akunuri N, Hamilton MT, Van Gammeren D, et
al. (2005) Diaphragm unloading via controlled mechanical ventilation alters thegene expression profile. Am J Respir Crit Care Med 172: 1267–1275.
45. Timmons JA, Norrbom J, Scheele C, Thonberg H, Wahlestedt C, et al. (2006)
Expression profiling following local muscle inactivity in humans provides new
perspective on diabetes-related genes. Genomics 87: 165–172.
46. Richter EA, Kiens B, Mizuno M, Strange S (1989) Insulin action in humanthighs after one-legged immobilization. J Appl Physiol 67: 19–23.
47. Jansson E, Sylven C, Arvidsson I, Eriksson E (1988) Increase in myoglobincontent and decrease in oxidative enzyme activities by leg muscle immobilization
in man. Acta Physiol Scand 132: 515–517.
48. Blakemore SJ, Rickhuss PK, Watt PW, Rennie MJ, Hundal HS (1996) Effects of
limb immobilization on cytochrome c oxidase activity and GLUT4 and GLUT5protein expression in human skeletal muscle. Clin Sci (Lond) 91: 591–599.
49. Ferreira R, Neuparth MJ, Vitorino R, Appell HJ, Amado F, et al. (2007)
Evidences of apoptosis during the early phases of soleus muscle atrophy in
hindlimb suspended mice. Physiol Res.
50. Muller FL, Song W, Jang YC, Liu Y, Sabia M, et al. (2007) Denervation-induced skeletal muscle atrophy is associated with increased mitochondrial ROS
production. Am J Physiol Regul Integr Comp Physiol 293: R1159–1168.
51. Siu PM, Alway SE (2005) Mitochondria-associated apoptotic signalling in
denervated rat skeletal muscle. J Physiol 565: 309–323.
52. Lin J, Wu H, Tarr PT, Zhang CY, Wu Z, et al. (2002) Transcriptional co-
activator PGC-1 alpha drives the formation of slow-twitch muscle fibres. Nature418: 797–801.
53. Sandri M, Lin J, Handschin C, Yang W, Arany ZP, et al. (2006) PGC-1alpha
protects skeletal muscle from atrophy by suppressing FoxO3 action and atrophy-
specific gene transcription. Proc Natl Acad Sci U S A 103: 16260–16265.
54. Paddon-Jones D, Sheffield-Moore M, Cree MG, Hewlings SJ, Aarsland A, et al.(2006) Atrophy and impaired muscle protein synthesis during prolonged
inactivity and stress. J Clin Endocrinol Metab 91: 4836–4841.
55. Czubryt MP, McAnally J, Fishman GI, Olson EN (2003) Regulation of
peroxisome proliferator-activated receptor gamma coactivator 1 alpha (PGC-1alpha) and mitochondrial function by MEF2 and HDAC5. Proc Natl Acad
Sci U S A 100: 1711–1716.
56. Handschin C, Chin S, Li P, Liu F, Maratos-Flier E, et al. (2007) Skeletal muscle
fiber-type switching, exercise intolerance, and myopathy in PGC-1alpha muscle-specific knock-out animals. J Biol Chem 282: 30014–30021.
Metabolism and Immobilization
PLoS ONE | www.plosone.org 12 August 2009 | Volume 4 | Issue 8 | e6518

57. Handschin C, Rhee J, Lin J, Tarr PT, Spiegelman BM (2003) An autoregulatory
loop controls peroxisome proliferator-activated receptor gamma coactivator
1alpha expression in muscle. Proc Natl Acad Sci U S A 100: 7111–7116.
58. Feige JN, Auwerx J (2007) Transcriptional coregulators in the control of energy
homeostasis. Trends Cell Biol 17: 292–301.
59. Jefferson LS, Fabian JR, Kimball SR (1999) Glycogen synthase kinase-3 is the
predominant insulin-regulated eukaryotic initiation factor 2B kinase in skeletal
muscle. Int J Biochem Cell Biol 31: 191–200.
60. Wang X, Proud CG (2006) The mTOR pathway in the control of protein
synthesis. Physiology (Bethesda) 21: 362–369.
61. Hunter RB, Stevenson E, Koncarevic A, Mitchell-Felton H, Essig DA, et al.
(2002) Activation of an alternative NF-kappaB pathway in skeletal muscle during
disuse atrophy. FASEB J 16: 529–538.
62. Hunter RB, Kandarian SC (2004) Disruption of either the Nfkb1 or the Bcl3
gene inhibits skeletal muscle atrophy. J Clin Invest 114: 1504–1511.
63. Judge AR, Koncarevic A, Hunter RB, Liou HC, Jackman RW, et al. (2007) Role
for IkappaBalpha, but not c-Rel, in skeletal muscle atrophy. Am J Physiol Cell
Physiol 292: C372–382.
64. Costelli P, Reffo P, Penna F, Autelli R, Bonelli G, et al. (2005) Ca(2+)-dependent
proteolysis in muscle wasting. Int J Biochem Cell Biol 37: 2134–2146.
65. Taillandier D, Aurousseau E, Meynial-Denis D, Bechet D, Ferrara M, et al.
(1996) Coordinate activation of lysosomal, Ca 2+-activated and ATP-ubiquitin-
dependent proteinases in the unweighted rat soleus muscle. Biochem J 316 (Pt 1):
65–72.
66. Soares JM, Duarte JA, Carvalho J, Appell HJ (1993) The possible role of
intracellular Ca2+ accumulation for the development of immobilization atrophy.Int J Sports Med 14: 437–439.
67. Ingalls CP, Warren GL, Armstrong RB (1999) Intracellular Ca2+ transients in
mouse soleus muscle after hindlimb unloading and reloading. J Appl Physiol 87:386–390.
68. Ingalls CP, Wenke JC, Armstrong RB (2001) Time course changes in [Ca2+]i,force, and protein content in hindlimb-suspended mouse soleus muscles. Aviat
Space Environ Med 72: 471–476.
69. Enns DL, Raastad T, Ugelstad I, Belcastro AN (2007) Calpain/calpastatinactivities and substrate depletion patterns during hindlimb unweighting and
reweighting in skeletal muscle. Eur J Appl Physiol 100: 445–455.70. Zhang P, Chen X, Fan M (2007) Signaling mechanisms involved in disuse
muscle atrophy. Med Hypotheses 69: 310–321.71. Reynolds THt, Bodine SC, Lawrence JC Jr (2002) Control of Ser2448
phosphorylation in the mammalian target of rapamycin by insulin and skeletal
muscle load. J Biol Chem 277: 17657–17662.72. Pallafacchina G, Calabria E, Serrano AL, Kalhovde JM, Schiaffino S (2002) A
protein kinase B-dependent and rapamycin-sensitive pathway controls skeletalmuscle growth but not fiber type specification. Proc Natl Acad Sci U S A 99:
9213–9218.
73. Bodine SC, Stitt TN, Gonzalez M, Kline WO, Stover GL, et al. (2001) Akt/mTOR pathway is a crucial regulator of skeletal muscle hypertrophy and can
prevent muscle atrophy in vivo. Nat Cell Biol 3: 1014–1019.74. Huang H, Tindall DJ (2007) Dynamic FoxO transcription factors. J Cell Sci 120:
2479–2487.
Metabolism and Immobilization
PLoS ONE | www.plosone.org 13 August 2009 | Volume 4 | Issue 8 | e6518