Analysis on insulator–metal transition in yttrium doped LSMO from electron density distribution
12
Bull. Mater. Sci., Vol. 35, No. 1, February 2012, pp. 111–122. c Indian Academy of Sciences. Analysis on insulator–metal transition in yttrium doped LSMO from electron density distribution S ISRAEL ∗ , S SARAVANA KUMAR, R RENURETSON, R A J R SHEEBA † and R SARAVANAN † Department of Physics, The American College, Madurai 625 002, India † Department of Physics, The Madura College, Madurai 625 011, India MS received 21 August 2010; revised 12 July 2011 Abstract. Yttrium doped LSMO (La 1−x Sr x MnO 3 ) was prepared using sol–gel technique and analysed for the insulator–metal transition from charge density variation in the unit cell with respect to different stoichiometric inclu- sion of yttrium. X-ray powder diffraction profiles of the samples were obtained and the well known Rietveld method and a versatile tool called maximum entropy method (MEM) were used for structural and profile refinement. The charge density in the unit cell was constructed using refined structure factors and was analysed. The charge order- ing taking place in the insulator–metal transition was investigated and quantified. The insulator–metal transition was found to occur when 20% of La/Sr atoms were replaced by yttrium. The changes in the charge environment have also been analysed. Keywords. LSMO; X-ray diffraction; MEM; charge density; insulator – metal transition. 1. Introduction Rare-earth manganites doped with alkaline-earth metals are important materials of fundamental and technological inter- ests (Yakel 1955; Saitoh et al 1995; Urushibara et al 1995; Lyu et al 1998; Alexandrov and Bratkovsky 1999; Tokura and Tomioka 1999). These materials exhibit colossal mag- netoresistance (CMR), which has a great potential in mag- netic devices. The colossal magnetoresistive manganites are among the most studied materials in condensed mat- ter physics (Tokura 2000). Most of the extensive research work carried out on the manganites having the general for- mula, R 1−x A x MnO 3 (R, rare earth trivalent cation, A, diva- lent cation), exhibits dual novel properties such as negative colossal magneto resistance and the metal–insulator (M–I) transition in the vicinity of magnetic transition. These have been explained in terms of correlation between spin, charge and orbital degrees of freedom (Vachhani et al 2007). The anti ferromagnetic LaMnO 3 is known as an insulator at low temperature. Alkali earth metals like Sr or Ca doped LaMnO 3 i.e. La 1−x Sr x MnO 3 and La 1−x Ca x MnO 3 with a large x , are anti-ferromagnetic. They have a decreasing resis- tivity ρ with T . So it is also described as an insulator despite the fact that the decrease of ρ is not exponential and ρ has an order of only 10 2 -cm when T → 0 (Tsai et al Private Communication; Arima et al 1993; Krishnan and Ju 1999; Xiong et al 1999). With x less than about 0·50 it exhibits ferromagnetic properties at low temperature and has an ∗ Author for correspondence ([email protected]) increasing resistivity ρ with T , so that these manganites are described as ferromagnetic metals, though the ρ of these manganites has an order between 1 and 10 −3 -cm. This is much larger than the typical ρ of metals of an order of 10 −6 -cm at room temperature. This kind of half meta- llic electric behaviour makes the manganites more interest- ing and motivates one to study its behaviour in terms of correlations between charge and spin. The half metallic properties of La 1−x Sr x MnO 3 (LSMO) are of great importance in application in spintronics. The electronic properties of LSMO, as described by the band the- ory are nearly half-metallic (Picket and Singh 1997; Livesay et al 1999) reflecting the so-called transport half-metallic behaviour (Nadgorny et al 2001). However, the fascinat- ing electronic and magnetic properties of LSMO, includ- ing colossal magneto resistance, indicate that the electronic structure is more complex than the standard band theory pic- ture (Tokura and Tamioka 1999). Banach et al discussed on the self-interaction corrected local spin density approxima- tion calculation leading to the presence of half metallic state in LSMO. Gaur and Varma (2006) worked on nano phasic LSMO prepared using sol–gel method and sintered at different temperatures ranging from 600 to 1000 ◦ C. It was shown that the transport and magneto resistive properties of LSMO samples strongly depend on the sintering temperature. A sub- stantial decrease in the insulator–metal transition tempera- ture (T IM ) and an enhancement in resistivity are found on lowering the sintering temperature. Furthermore, a reduc- tion in magnetization and a slight decrease in paramagnetic– ferromagnetic (PM–FM) transition temperature (T c ) has been observed as the sintering temperature decreases. The 111
-
Upload
independent -
Category
Documents
-
view
1 -
download
0
Transcript of Analysis on insulator–metal transition in yttrium doped LSMO from electron density distribution
Bull. Mater. Sci., Vol. 35, No. 1, February 2012, pp. 111–122. c© Indian Academy of Sciences.
Analysis on insulator–metal transition in yttrium doped LSMOfrom electron density distribution
S ISRAEL∗, S SARAVANA KUMAR, R RENURETSON, R A J R SHEEBA† and R SARAVANAN†
Department of Physics, The American College, Madurai 625 002, India†Department of Physics, The Madura College, Madurai 625 011, India
MS received 21 August 2010; revised 12 July 2011
Abstract. Yttrium doped LSMO (La1−xSrxMnO3) was prepared using sol–gel technique and analysed for theinsulator–metal transition from charge density variation in the unit cell with respect to different stoichiometric inclu-sion of yttrium. X-ray powder diffraction profiles of the samples were obtained and the well known Rietveld methodand a versatile tool called maximum entropy method (MEM) were used for structural and profile refinement. Thecharge density in the unit cell was constructed using refined structure factors and was analysed. The charge order-ing taking place in the insulator–metal transition was investigated and quantified. The insulator–metal transitionwas found to occur when 20% of La/Sr atoms were replaced by yttrium. The changes in the charge environmenthave also been analysed.
Keywords. LSMO; X-ray diffraction; MEM; charge density; insulator – metal transition.
1. Introduction
Rare-earth manganites doped with alkaline-earth metals areimportant materials of fundamental and technological inter-ests (Yakel 1955; Saitoh et al 1995; Urushibara et al 1995;Lyu et al 1998; Alexandrov and Bratkovsky 1999; Tokuraand Tomioka 1999). These materials exhibit colossal mag-netoresistance (CMR), which has a great potential in mag-netic devices. The colossal magnetoresistive manganitesare among the most studied materials in condensed mat-ter physics (Tokura 2000). Most of the extensive researchwork carried out on the manganites having the general for-mula, R1−x Ax MnO3(R, rare earth trivalent cation, A, diva-lent cation), exhibits dual novel properties such as negativecolossal magneto resistance and the metal–insulator (M–I)transition in the vicinity of magnetic transition. These havebeen explained in terms of correlation between spin, chargeand orbital degrees of freedom (Vachhani et al 2007).
The anti ferromagnetic LaMnO3 is known as an insulatorat low temperature. Alkali earth metals like Sr or Ca dopedLaMnO3 i.e. La1−x Srx MnO3 and La1−x Cax MnO3 with alarge x , are anti-ferromagnetic. They have a decreasing resis-tivity ρ with T . So it is also described as an insulator despitethe fact that the decrease of ρ is not exponential and ρ hasan order of only 102 �-cm when T → 0 (Tsai et al PrivateCommunication; Arima et al 1993; Krishnan and Ju 1999;Xiong et al 1999). With x less than about 0·50 it exhibitsferromagnetic properties at low temperature and has an
∗Author for correspondence ([email protected])
increasing resistivity ρ with T , so that these manganites aredescribed as ferromagnetic metals, though the ρ of thesemanganites has an order between 1 and 10−3 �-cm. Thisis much larger than the typical ρ of metals of an order of10−6 �-cm at room temperature. This kind of half meta-llic electric behaviour makes the manganites more interest-ing and motivates one to study its behaviour in terms ofcorrelations between charge and spin.
The half metallic properties of La1−x Srx MnO3 (LSMO)are of great importance in application in spintronics. Theelectronic properties of LSMO, as described by the band the-ory are nearly half-metallic (Picket and Singh 1997; Livesayet al 1999) reflecting the so-called transport half-metallicbehaviour (Nadgorny et al 2001). However, the fascinat-ing electronic and magnetic properties of LSMO, includ-ing colossal magneto resistance, indicate that the electronicstructure is more complex than the standard band theory pic-ture (Tokura and Tamioka 1999). Banach et al discussed onthe self-interaction corrected local spin density approxima-tion calculation leading to the presence of half metallic statein LSMO.
Gaur and Varma (2006) worked on nano phasic LSMOprepared using sol–gel method and sintered at differenttemperatures ranging from 600 to 1000◦C. It was shownthat the transport and magneto resistive properties of LSMOsamples strongly depend on the sintering temperature. A sub-stantial decrease in the insulator–metal transition tempera-ture (TIM) and an enhancement in resistivity are found onlowering the sintering temperature. Furthermore, a reduc-tion in magnetization and a slight decrease in paramagnetic–ferromagnetic (PM–FM) transition temperature (Tc) hasbeen observed as the sintering temperature decreases. The
111

112 S Israel et al
magneto resistance (MR) at T < Tc increases on decreasingthe sintering temperature and increasing the applied mag-netic field. The enhancement in MR on decreasing the sin-tering temperature is explained by enhanced spin-polarizedtunneling by assuming an increase of the grain boundarycontribution.
The La1−x Srx MnO3 (LSMO) compound with x = 0·2–0·4 are interesting materials that exhibit consecutive phasetransition from paramagnetic (PM) state to ferromagnetic(FM) state and then to charge-ordered (CO) state accom-panied by a sharp drop in resistivity (Janker and vanSanten 1950; van Santen and Janker 1950). Thus, LSMO isa good material that can be used in the investigation of thelattice strain effect in the PM, FM and CO states, respectively(Zheng et al 2007). The inclusion of transition metal elementlike yttrium(Y) at the La/Sr site of LSMO induces insulator–metal transition and this behaviour depends on the stoichio-metric composition of Y in LSMO. This behaviour was stu-died on Yx La1−x−ySryMnO3 with y = 0·3 by Renuretson(2007) and they have investigated also on its electrical andmagnetic transport characteristics and their dependence onthe stoichiometric inclusion of yttrium. They have foundthat zero field resistivity in the material increases as the do-ping concentration of Y increases. Also, it was found that theinsulator–metal transition temperature decreases from 185 to170 K when the concentration of Y increases from x = 0 to0·2 and then the same increases to 175 K when x increasesto 0·3. At the same time the magneto resistance measuredat room temperature shows the trend of weakening of theferromagnetic order and increasing of magnetic disorder asthe doping concentration increases. These behaviours dependvery much on the ordering of charges in the lattice and arealso influenced by the inclusion of Y at the lattice site ofLa/Sr. A chemically driven insulator–metal transition in non-stoichiometric and amorphous gallium oxide was reportedby Nagarajan (2008). They have demonstrated through expe-rimental studies and density-functional theory calculationsthat the conductivity jump takes place at a critical galliumconcentration and it is induced by crystallization of stoichio-metric Ga2O3 within the metastable oxide matrix in chemicalterms by a disproportionation.
So far, none of these works have yielded any informationon the arrangement of charges that reveals reported mag-netic or electric behaviour of the materials. And hence, itwas proposed that the charge density analysis in the unitcell of title material Yx La1−x−ySryMnO3 may give intricatedetails on how the charge is distributed and on changes dueto the variation in concentration of dopant material Y thatwould have implication on the observed electric and mag-netic ordering/disordering. This has motivated us to estimatethe charge and to map it along the lattice in order to see howthe charge actually behaves and distributes itself in contribut-ing to ferromagnetic ordering and insulator–metal transition.Thus this work concentrates on charge density in the unitcell of the chosen material, and for that purpose, the X-raydiffraction pattern was utilized, refined and analysed usingRietveld refinement and MEM analysis.
2. Sample preparation
Samples of Yx La1−x−ySryMnO3(y = 0·3 and x = 0, 0·1,0·2, 0·3) were synthesized via sol–gel method. The requiredamounts of high purity nitrates of La, Sr and Mn were dis-solved in double distilled water to form an aqueous solution.An equal amount of ethylene glycol was added to this solu-tion with continuous stirring. This solution was then heatedon a hot plate at a temperature of 40–80◦C until a dry quickbrown sol was formed. This was further decomposed in anoven at 200◦C to obtain a dry fluffy material. The polymericprecursor thus obtained was calcined at 600◦C for 12 h. Theresulting powder was ground well and pressed into pelletsand sintered at 700◦C for 15 h for each composition. Thesamples (for x = 0, 0·1, 0·2, 0·3) are hereafter referred to asS1, S2, S3 and S4, respectively.
The prepared samples were analysed for the content ofindividual constituent in the material from EDAX analysisthat shows the atomic weight percentage of the constituentsin the sample. The resultant composition presented in table 1confirms inclusion of yttrium in the stoichiometrically pre-pared samples, thus obeying the desired molecular formula.SEM micrographs of the prepared samples are presented infigure 1. These figures show grain structure of the preparedsamples and the analysis of the grain size of the particlesshows that for S1–S4, the size ranges from 7·8 to 10·2 nm.
3. XRD analysis
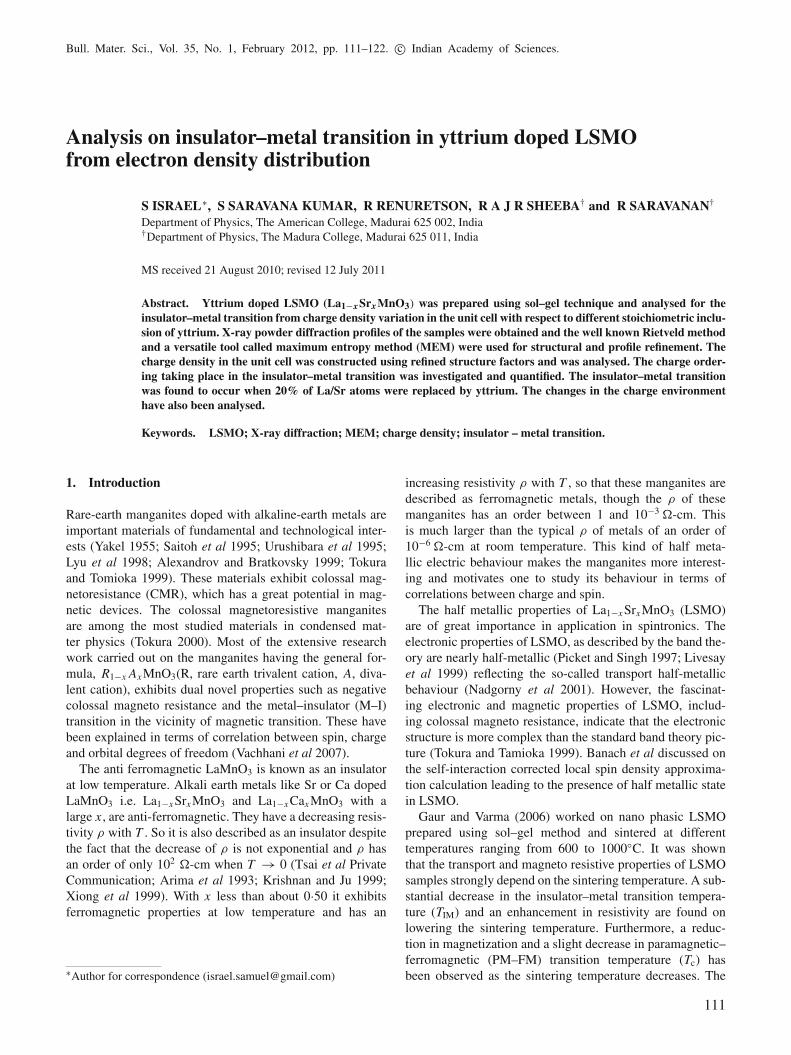
The powder X-ray data were collected for all the sam-ples using X-PERT PRO (Philips, The Netherlands) X-raydiffractometer with a monochromatic incident beam, whichoffers pure CuKα1 radiation. The 2θ range of X-ray intensitydata is from 5◦ to 75◦. The raw profile of the powder diffrac-tion pattern for yttrium doped LSMO is presented in figure 2.The X-ray diffraction data of the samples were refined fortheir structural and stoichiometric parameters using the wellknown Rietveld technique.
The Rietveld (1969) method was used for refining struc-tural parameters (fractional coordinates, atomic displace-ment parameters, occupation factors and lattice parameters)using the software Jana2006 (Petricek et al 2000) directlyfrom whole powder diffraction patterns. In this method, theobserved profiles were matched with the profiles constructedsimilarly by using pseudo-voigt (Wertheim et al 1974) profileshape function of Thompson et al (1987). It was modified,to some extent, to accommodate various Gaussian FWHM
Table 1. EDAX analysis of the prepared samples.
Sample x La Sr Y Mn O
S1 0·0 11·96 6·93 3·56 18·72 45·28S2 0·1 10·84 7·03 3·72 19·97 43·31S3 0·2 8·99 9·02 4·64 19·45 38·10S4 0·3 8·46 11·04 4·84 22·70 42·66
Insulator–metal transition in Y doped LSMO 113
S1 S2
S3 S4
Figure 1. SEM micrographs of grown sample.
Figure 2. Raw powder profile for yttrium doped LSMO.
parameters and Scherrer coefficient, P, for Gaussian broaden-ing. The profile asymmetry was also introduced by employ-ing multi-term Simpson rule integration devised by Howard(1982). It incorporates symmetric profile shape function withdifferent coefficients for weights and peak shift. Jana2006also employs the correction for the preferred orientationwhich is independent of diffraction geometry according tothe March–Dollase function (Israel et al 2003, 2004). The
Table 2. Refined structural parameters.
Sample x a(Å) b(Å) c(Å) α β γ V(Å3)
S1 0·0 5·4913 5·4913 13·1373 90 90 120 343·0778S2 0·1 5·5021 5·5021 13·0958 90 90 120 343·3463S3 0·2 5·5029 5·5029 13·3420 90 90 120 349·9036S4 0·3 5·3639 5·3639 12·1617 90 90 120 303·0365
calculated profiles thus evolved were compared with theobserved ones. During the refinement, the trial cell parame-ters were introduced as a = b = 5·503 Å and c = 13·342 Åfor all the samples. The position of the atoms for La, Sr and Ywas taken as (0, 0, 0·25) with relevant stoichiometric compo-sitions and for oxygen (0·4592, 0, 0·25) whereas Mn atomswere placed at the origin. The symmetric group of R–3c wasused for positioning the atoms in the unit cell. The raw inten-sities thus refined have yielded structural parameters, struc-ture factors and the reliability indices that are presented intables 2, 3 and 4, respectively. The refined cell parametersshow inconsistent and slight variation in the size of unit cellin all three dimensions and they are found to decrease in �aand �b directions as the concentration (x) of yttrium increasesfrom 0 to 0·2 and then decreases to 0·3. In �c direction the celllength decreases for S1 and S2 and increases for S2 and againdecreases from thereon. The list of refined structure factors(table 3) is considered to be very accurate as evidenced fromthe R-factors presented in table 4. Successful refinement has

114 S Israel et al
Table 3. Comparison of observed and calculated structure factors.
S1 S2 S3 S4
h k l Fo Fc Fo Fc Fo Fc Fo Fc
1 −1 2 95·5572 96·3961 86·6512 87·0058 77·8699 77·9434 68·3951 68·37382 −1 0 295·328 295·013 285·560 286·677 278·737 278·649 267·482 267·5021 0 4 297·418 296·976 287·144 288·249 282·005 281·905 264·702 264·6802 −1 3 28·2633 28·2628 28·1630 28·2642 28·4125 28·4047 27·2161 27·20162 0 2 182·862 182·130 174·415 175·053 168·447 168·330 157·268 157·2740 0 6 185·414 186·134 177·916 178·543 174·290 174·141 154·874 155·0132 −2 4 326·526 325·907 317·875 319·008 314·345 314·412 293·373 294·1913 −1 1 19·5249 19·4502 19·4206 19·4898 19·5152 19·5027 18·7830 18·78563 −2 2 75·5782 75·3550 68·8895 69·1350 63·1662 63·1185 56·0730 56·07862 −1 6 70·1936 69·9832 63·4575 63·6837 58·0163 58·0251 50·0972 50·13973 0 0 211·748 211·670 205·364 206·096 200·578 200·575 189·542 189·6653 −1 4 204·156 204·031 197·504 198·208 193·604 193·571 179·850 179·7071 −1 8 198·941 198·648 191·517 192·200 190·201 190·126 167·482 167·5153 −2 5 14·6794 14·6628 14·6096 14·661 14·8003 14·8137 13·6154 13·62314 −2 0 214·601 214·723 209·407 210·154 204·792 205·476 193·485 193·4382 0 8 216·475 216·201 209·925 210·673 209·351 209·910 184·017 183·9734 −3 1 22·5998 22·6081 22·5967 22·6772 22·7204 22·6919 21·5309 21·52924 −2 3 1·5746 1·5752 1·5732 1·5788 1·5863 1·5843 1·4870 1·48633 −1 7 11·4185 11·4350 11·3746 11·4152 1·6280 11·6205 10·2974 10·31414 −1 2 54·8408 54·9391 50·1553 50·3341 45·8521 45·8632 40·3267 40·36902 −1 9 12·0419 12·0602 11·9590 12·0017 12·3588 12·3563 10·5008 10·50583 0 6 62·9367 63·0213 58·2374 58·4450 54·3628 54·4375 47·2866 47·36133 −3 6 62·9367 63·0213 58·2374 58·4450 54·3628 54·4375 47·2866 47·36131 0 10 56·2390 56·4029 51·5207 51·7044 48·1100 48·2084 39·8383 39·91414 −3 4 144·025 143·709 138·947 139·442 135·594 135·839 124·442 124·5633 −2 8 145·425 145·272 140·118 140·617 138·280 138·726 121·325 121·4414 −1 5 18·0292 18·0646 18·0224 18·0867 18·2807 18·2399 16·6113 16·69764 −4 2 79·9734 80·0271 76·0547 76·3240 72·8263 72·6623 65·5644 65·87344 −2 6 81·4756 81·4257 77·3363 77·6072 74·7161 74·5585 65·4907 65·67412 −2 10 84·2207 84·4012 80·0429 80·3266 78·6561 78·6057 64·9800 65·32514 0 4 151·976 151·592 147·519 148·044 145·131 145·093 132·224 132·6540 0 12 153·769 153·674 148·457 148·958 150·881 150·930 121·712 121·8565 −2 1 6·2839 6·2724 6·2743 6·2955 6·2953 6·2996 5·9092 5·91774 −3 7 14·7651 14·7481 14·6962 14·7439 14·9548 14·9643 13·2727 13·30475 −3 2 52·0971 52·1265 48·6049 48·7626 45·4483 45·4576 40·3050 40·32643 −1 10 45·3467 45·7055 42·0398 42·1610 39·5644 39·6056 32·4068 32·46765 −1 0 110·637 110·846 107·523 107·772 104·350 104·610 96·1356 96·24375 −2 4 114·441 114·647 111·277 111·502 108·527 108·773 98·4834 98·69044 −1 8 105·568 105·778 102·144 102·321 100·448 100·665 87·2640 87·33802 −1 12 103·615 104·110 100·067 100·223 100·273 100·422 79·6385 81·11795 −4 3 10·7475 10·8279 10·8444 10·8638 10·8652 10·8947 10·0968 10·10565 −1 3 10·7475 10·8279 10·8444 10·8638 10·8652 10·8947 10·0968 10·10565 −3 5 5·1611 5·2023 5·2063 5·2131 5·2353 5·2509 4·7739 4·78834 −2 9 0·8512 0·8542 0·8507 0·8524 0·8702 0·8717 0·7385 0·74983 −2 11 6·2899 6·2288 6·1903 6·1970 6·3937 6·4058 5·1980 5·29034 −4 8 110·117 111·064 108·061 108·117 107·089 107·015 90·6055 92·66185 −2 7 4·3710 4·3757 4·3791 4·3789 4·4067 4·4357 3·9145 3·94195 0 2 43·8468 43·8146 41·2971 41·3065 38·6118 38·8085 33·8864 34·23355 −4 6 36·9237 37·0150 34·3686 34·3925 31·9058 32·0588 27·0787 27·25345 −1 6 36·9237 37·0150 34·3686 34·3925 31·9058 32·0588 27·0787 27·25344 −3 10 34·0192 34·1100 31·3905 31·4003 29·2404 29·4186 23·5978 23·69721 −1 14 34·5234 34·5481 31·7058 31·7523 30·2643 30·4237 − −6 −3 0 80·3822 80·4326 78·0268 78·0845 75·0460 75·6357 68·3584 68·65175 −5 4 89·4474 89·4923 86·9918 87·1434 84·3891 85·0433 76·0025 76·35125 −3 8 85·4306 85·4650 82·7942 82·8835 80·9747 81·6455 − −
Insulator–metal transition in Y doped LSMO 115
Table 3. (continued.)
S1 S2 S3 S4
h k l Fo Fc Fo Fc Fo Fc Fo Fc
3 −3 12 82·0722 82·1059 79·1405 79·1891 78·7130 79·3163 − −3 0 12 82·0722 82·1059 79·1406 79·1891 78·7130 79·3163 − −6 −4 1 1·7452 1·7465 1·7541 1·7542 1·7423 1·7553 − −6 −3 3 12·0192 12·0364 12·0812 12·0828 12·0207 12·1140 − −6 −2 2 43·3766 43·4030 41·2220 41·2683 − − − −
Table 4. List of reliability indices (%) after final Rietveldrefinement.
R-factors S1 S2 S3 S4
Robs (%) 0·20 0·30 0·19 0·23w Robs(%) 0·32 0·29 0·32 0·39Rall(%) 0·20 0·30 0·19 0·23w Rall(%) 0·32 0·29 0·32 0·39Rp(%) 7·29 8·49 4·24 4·13w Rp(%) 9·83 11·61 5·65 6·03
yielded low R-factors. This determines the accuracy of thedata and their utility in calculating accurate charge density inthe unit cell.
It has been proved that there is interplay between elec-tronic and structural transition in LSMO system by Binduet al (2008) who have investigated on the evolution of dis-tortion in the lattice of La0·2Sr0·8MnO3 using Mn k-edgeextended X-ray absorption fine structure (EXAFS). Theyhave found that a remarkable evolution of distortion takesplace across phase transition while the system is treatedbetween 12 K and 300 K. The results show the fluctuationin Mn 3d orbital occupancy during the phase transition andits implication on the electronic property of the system, theorbital and spin ordering. It is known (Bindu et al 2008) thatin a system like La1−x Srx MnO3 (x < 0·5) when Mn–O–Mn angle becomes close to 180◦, the Mn-eg orbitals becomealmost degenerate (Maezono et al 1998; van den Brink et al2009). This degeneracy strongly depends on the local struc-ture of MnO6 octahedra. Any distortion in this octahedrahas an implication on the electronic properties and hence thecharge and the spin ordering of the chosen material (Binduet al 2008). When the octahedra is compressed along theapical direction, the d-orbital (dx2−y2 ) corresponding to theplane having Mn–O bond length will be more populatedcompared to the perpendicular one. Also, the strong influ-ence of disorder in Mn–O shorter bond length that leads tohybrids in the electronic states was found to be a reasonfor the insulating transport in addition to the formation ofzener polaron wherein a conduction electron gets trappedin between two Mn sites leading to a polaronic distortion.These observations indicate the relationship between theelectronic properties and a change in the Mn–O bond lengththat leads to a significant fluctuation in the occupancy of Mneg-orbitals.
In the present work also, we have attempted to find arelationship between the structural distortion and the elec-tronic properties. Beforehand, the structural investigation onthe bond length in our system Yx La1−x−ySryMnO3(y = 0·3)shows that Mn–O bond length has become shorter as x isincreased from 0 to 0·3. An analysis on bond length showsthat La/Sr/Y–O bonds are of three types whereas O–O hastwo bond lengths of which one is similar to La–O. In allthe cases, the bond lengths have decreased as the composi-tion Y in the system increases which may be attributed tothe smaller size of replacement metal Y whose ri = 1·02 Åcompared to ri (La) = 1·16 Å and ri (Sr) = 1·26 Å. Also, theangle between La–O–La is found to be sharply decreasingfrom 180◦ when x = 0 till x = 0·3 except for the systemx = 0·2 for which the angular distortion is more than that forthe systems when x = 0·1 or 0·3. Similar type of distortionhas been observed in the arrangement of MnO6 octahedrawhere Mn–O–Mn angle shows a decreasing behaviour start-ing from x = 0 till x = 0·3 except for the system x = 0·2(see figures 3 and 4). Thus, the distortion in x = 0·2 is uniqueand therefore, it is expected that the interplay between thestructural distortion at x = 0·2 and the electronic propertyof this stoichiometric composition is an important one to beinvestigated.
4. Charge density determination using MEM
The structure factors extracted from the refinement were fur-ther utilized to calculate the accurate charge density in theunit cell using maximum entropy method (MEM). MEMis a very good tool for the estimation of accurate chargedensity and is a statistical approach proposed by Collins(1982). MEM method depends heavily on the observed infor-mation and when the information is accurate, it can beused for the reconstruction of charge density accurately andhence is known to be highly unbiased. MEM gives positivecharge density everywhere and hence it gives the true chargedensity that can be directly analysed for any charge relatedproperties.
In the MEM refinement, for the construction of chargedensity, the unit cell was divided into 54×54×144 pixelsand each pixel was filled with prior density equal to F000/V .The prior density was initially used for the construction ofstructure factors, which would then be compared with theobserved structure factors. The error in the difference in

116 S Israel et al
0.00 0.05 0.10 0.15 0.20 0.25 0.30Concentration of Y
1.80
2.00
2.20
2.40
2.60
2.80
3.00
3.20
3.40
3.60
3.80
4.00
Bo
nd
Len
gth
(Å
)La -O(1)
Mn - O
Mn - Mn
La - O(3)
O - O (1)
La - O (2)
Figure 3. Graph drawn between bond length and concentration of Y.
0.00 0.05 0.10 0.15 0.20 0.25 0.30Concentration of Y
165
167
169
171
173
175
177
179
181
Bo
nd
an
gle
(d
eg)
La - O - La
Mn - O - Mn
Figure 4. Graph drawn between bond angle and concentration of Y.
the structure factors was again added to the calculated onesand thus the entropy was increased. The process of increas-ing the entropy in the structure factors as well as in thecharge density was done iteratively. The iteration would stopwhen the soft criterion ‘C’ became 1. At this situation, theobserved structure and MEM refined structure would match.The charge density constructed at this juncture using thestructure factors was called the desired MEM charge density.The unique feature of this charge density is that it is real andpositive. This charge density gives an accurate picture of thedistribution of charges in the unit cell, which is then analysedfor bonding and charge related properties of the material. The
detailed methodology adopted here and the definition of thecriterion used is presented in detail by Syed Ali et al (2006).
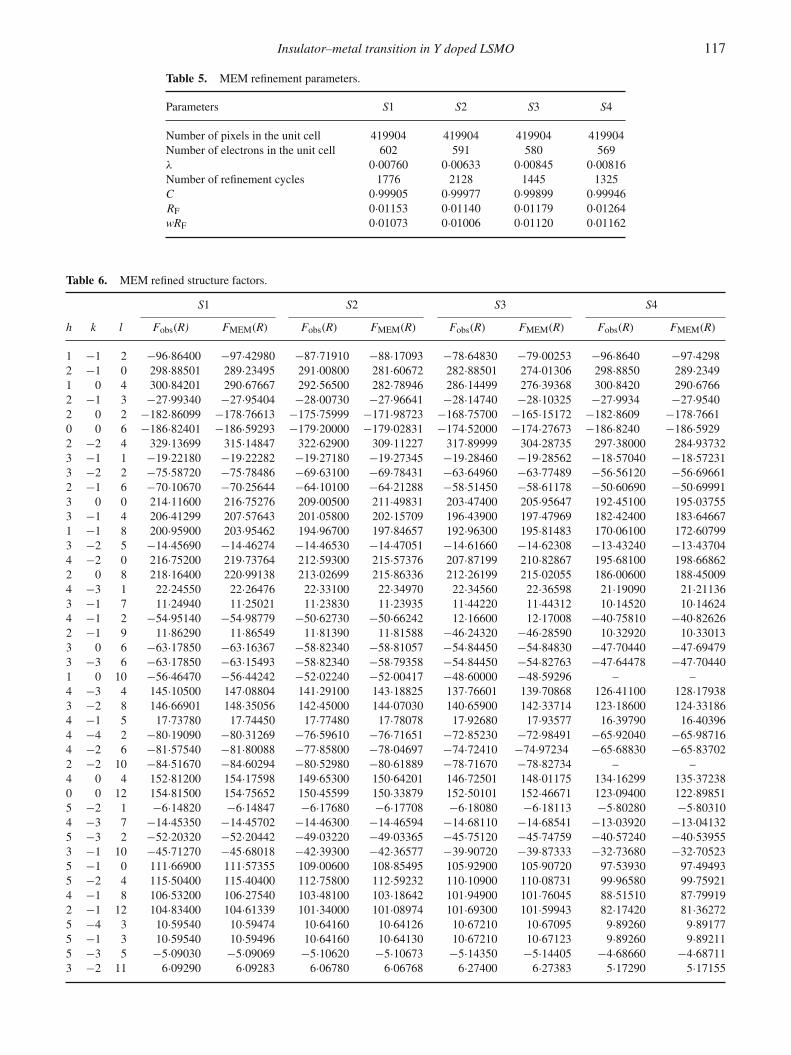
In the present work, MEM refined structure factors wereelucidated using the software called PRIMA (Izumi andDilanian 2002; Ruben and Fujio 2004) (A FORTRAN pro-gram to determine electron density by MEM from X-raydata). The parameters used in this refinement and the reli-ability indices were tabulated in table 5. The phase factorsevaluated by MEM and listed in table 6 were then used in theconstruction of the charge density in the unit cell and thenvisualized with the help of the visualization software calledVESTA (Momma and Izumi 2008).
Insulator–metal transition in Y doped LSMO 117
Table 5. MEM refinement parameters.
Parameters S1 S2 S3 S4
Number of pixels in the unit cell 419904 419904 419904 419904Number of electrons in the unit cell 602 591 580 569λ 0·00760 0·00633 0·00845 0·00816Number of refinement cycles 1776 2128 1445 1325C 0·99905 0·99977 0·99899 0·99946RF 0·01153 0·01140 0·01179 0·01264wRF 0·01073 0·01006 0·01120 0·01162
Table 6. MEM refined structure factors.
S1 S2 S3 S4
h k l Fobs(R) FMEM(R) Fobs(R) FMEM(R) Fobs(R) FMEM(R) Fobs(R) FMEM(R)
1 −1 2 −96·86400 −97·42980 −87·71910 −88·17093 −78·64830 −79·00253 −96·8640 −97·42982 −1 0 298·88501 289·23495 291·00800 281·60672 282·88501 274·01306 298·8850 289·23491 0 4 300·84201 290·67667 292·56500 282·78946 286·14499 276·39368 300·8420 290·67662 −1 3 −27·99340 −27·95404 −28·00730 −27·96641 −28·14740 −28·10325 −27·9934 −27·95402 0 2 −182·86099 −178·76613 −175·75999 −171·98723 −168·75700 −165·15172 −182·8609 −178·76610 0 6 −186·82401 −186·59293 −179·20000 −179·02831 −174·52000 −174·27673 −186·8240 −186·59292 −2 4 329·13699 315·14847 322·62900 309·11227 317·89999 304·28735 297·38000 284·937323 −1 1 −19·22180 −19·22282 −19·27180 −19·27345 −19·28460 −19·28562 −18·57040 −18·572313 −2 2 −75·58720 −75·78486 −69·63100 −69·78431 −63·64960 −63·77489 −56·56120 −56·696612 −1 6 −70·10670 −70·25644 −64·10100 −64·21288 −58·51450 −58·61178 −50·60690 −50·699913 0 0 214·11600 216·75276 209·00500 211·49831 203·47400 205·95647 192·45100 195·037553 −1 4 206·41299 207·57643 201·05800 202·15709 196·43900 197·47969 182·42400 183·646671 −1 8 200·95900 203·95462 194·96700 197·84657 192·96300 195·81483 170·06100 172·607993 −2 5 −14·45690 −14·46274 −14·46530 −14·47051 −14·61660 −14·62308 −13·43240 −13·437044 −2 0 216·75200 219·73764 212·59300 215·57376 207·87199 210·82867 195·68100 198·668622 0 8 218·16400 220·99138 213·02699 215·86336 212·26199 215·02055 186·00600 188·450094 −3 1 22·24550 22·26476 22·33100 22·34970 22·34560 22·36598 21·19090 21·211363 −1 7 11·24940 11·25021 11·23830 11·23935 11·44220 11·44312 10·14520 10·146244 −1 2 −54·95140 −54·98779 −50·62730 −50·66242 12·16600 12·17008 −40·75810 −40·826262 −1 9 11·86290 11·86549 11·81390 11·81588 −46·24320 −46·28590 10·32920 10·330133 0 6 −63·17850 −63·16367 −58·82340 −58·81057 −54·84450 −54·84830 −47·70440 −47·694793 −3 6 −63·17850 −63·15493 −58·82340 −58·79358 −54·84450 −54·82763 −47·64478 −47·704401 0 10 −56·46470 −56·44242 −52·02240 −52·00417 −48·60000 −48·59296 – –4 −3 4 145·10500 147·08804 141·29100 143·18825 137·76601 139·70868 126·41100 128·179383 −2 8 146·66901 148·35056 142·45000 144·07030 140·65900 142·33714 123·18600 124·331864 −1 5 17·73780 17·74450 17·77480 17·78078 17·92680 17·93577 16·39790 16·403964 −4 2 −80·19090 −80·31269 −76·59610 −76·71651 −72·85230 −72·98491 −65·92040 −65·987164 −2 6 −81·57540 −81·80088 −77·85800 −78·04697 −74·72410 −74·97234 −65·68830 −65·837022 −2 10 −84·51670 −84·60294 −80·52980 −80·61889 −78·71670 −78·82734 – –4 0 4 152·81200 154·17598 149·65300 150·64201 146·72501 148·01175 134·16299 135·372380 0 12 154·81500 154·75652 150·45599 150·33879 152·50101 152·46671 123·09400 122·898515 −2 1 −6·14820 −6·14847 −6·17680 −6·17708 −6·18080 −6·18113 −5·80280 −5·803104 −3 7 −14·45350 −14·45702 −14·46300 −14·46594 −14·68110 −14·68541 −13·03920 −13·041325 −3 2 −52·20320 −52·20442 −49·03220 −49·03365 −45·75120 −45·74759 −40·57240 −40·539553 −1 10 −45·71270 −45·68018 −42·39300 −42·36577 −39·90720 −39·87333 −32·73680 −32·705235 −1 0 111·66900 111·57355 109·00600 108·85495 105·92900 105·90720 97·53930 97·494935 −2 4 115·50400 115·40400 112·75800 112·59232 110·10900 110·08731 99·96580 99·759214 −1 8 106·53200 106·27540 103·48100 103·18642 101·94900 101·76045 88·51510 87·799192 −1 12 104·83400 104·61339 101·34000 101·08974 101·69300 101·59943 82·17420 81·362725 −4 3 10·59540 10·59474 10·64160 10·64126 10·67210 10·67095 9·89260 9·891775 −1 3 10·59540 10·59496 10·64160 10·64130 10·67210 10·67123 9·89260 9·892115 −3 5 −5·09030 −5·09069 −5·10620 −5·10673 −5·14350 −5·14405 −4·68660 −4·687113 −2 11 6·09290 6·09283 6·06780 6·06768 6·27400 6·27383 5·17290 5·17155

118 S Israel et al
Table 6. (continued.)
S1 S2 S3 S4
h k l Fobs(R) FMEM(R) Fobs(R) FMEM(R) Fobs(R) FMEM(R) Fobs(R) FMEM(R)
4 −4 8 111·74100 111·62278 109·14400 108·94328 108·11100 107·86006 93·62620 93·232785 −2 7 4·27480 4·27440 4·28260 4·28244 4·33860 4·33807 3·85180 3·851355 0 2 −43·82500 −43·82561 −41·47720 −41·47675 −38·99490 −38·99964 −34·37440 −34·357645 −4 6 −36·96990 −36·93555 −34·55060 −34·52811 −32·28200 −32·24652 −27·46640 −27·436815 −1 6 −36·96990 −36·99049 −34·55060 −34·56697 −32·28200 −32·29472 −27·46640 −27·473664 −3 10 −34·02210 −34·00004 −31·53300 −31·51783 −29·64120 −29·61264 −23·91730 −23·920121 −1 14 −34·47770 −34·47681 −31·88820 −31·88782 −30·64360 −30·63927 – –6 −3 0 80·78130 80·46512 78·81040 78·57000 76·47470 75·88114 69·50410 69·069665 −5 4 89·95310 89·71677 87·95710 87·79597 85·94180 85·50450 77·21370 76·825595 −3 8 85·88150 85·42356 83·65330 83·29661 82·52440 81·93040 – –3 −3 12 82·47800 82·39244 79·90820 79·86161 80·17340 79·95887 – –3 0 12 82·47800 82·22469 79·90820 79·73746 80·17340 79·59299 – –6 −3 3 −11·74420 −11·74210 −11·80330 −11·80133 −11·83410 −11·82994 – –6 −2 2 −43·38010 −43·32754 −41·37450 −41·33142 −39·21420 −39·12542 – –
S1 S2
S3 S4
La/Sr/Y
Mn
O
Figure 5. Three dimensional charge density in unit cell.
The charge density in the unit cell is drawn in 3-dimensionfor all the four samples in ball and stick model of struc-ture and is presented in figure 5. Two dimensional millerplanes are also mapped for the understanding of the bond-ing behaviour between Mn–O, La–O and O–O atoms andare presented in figures 6–8. One dimensional charge densityprofiles between the atoms are drawn to quantify the bondingcharacter and are presented in figure 9.
The three dimensional picture of charge density with iso-surface level, 0·5 e/Å3, for all the samples presented in figure5 shows the arrangement of charges and their variations withrespect to the concentration of dopant material yttrium at the
lattice site of La. These pictures show that the inclusion ofY reduces the size of charge sphere of La and is primarilydue to the fact that the ionic radius of Y (ri = 1·02 Å) issmaller than that of La (ri = 1·16 Å). The reduction in thesize of the charge sphere due to the inclusion of Y does notreflect on the global change in the lattice parameters whilethe angles La–O–La have been largely modified and also theMnO6 octahedra has been rearranged to include changes dueto distortion. Indeed, the change in the cell dimensions canactually be attributed to the change in the electronic proper-ties of the material particularly on a system with x = 0·2.While including Y in the lattice it has primarily rearranged

Insulator–metal transition in Y doped LSMO 119
S1 S2 S4 S3
Mn O
1.5
1.35
1.2
1.05
0.9
0.75
0.6
0.45
0.3
0.15
0
Figure 6. Two dimensional miller map showing Mn–O bond in (1 0 4) plane. Contour lines are also drawn between0 to 1·5 e/Å3 with 0·1 e/Å3 interval.
0.1
0
0.8
0.2
0.3
0.4
0.5
0.6
0.7
0.9
1.0 S1
S3 S4
S2
O
La
Figure 7. Two dimensional miller map showing La–O bond in (0 0 4) plane. Contour lines are also drawn between 0to 1 e/Å3 with 0·06 e/Å3 interval.
the charge density distribution such that the changes in thecell dimensions are small. Thus figure 5 explains the changein cell dimensions as found in table 2 and also evidences theinclusion of Y in the samples.
5. Insulator–metal transition
Metal–insulator transition is a transition characterized by asudden change in electrical transport properties (conductivity)due to a reversible change from localized to itinerantbehaviour of the electrons. Doping a material can change
its internal electronic structure, giving rise to or eliminatingbandgaps. Materials in which a bandgap prohibits electronicconductivity are called bandgap insulators. Electron–electroninteraction can also lead to the opening of an interaction-induced gap, the so-called Mott–Hubbard gap. Disorder inthe material composition can lead to Anderson localiza-tion which prohibits conductivity. This is a disorder-inducedmetal–insulator transition even without any bandgap.
A metal–insulator transition is primarily characterized bythe localization of the charge carriers, which prevent themfrom transporting electric current. The two basic mecha-nisms that cause electron localization are the correlations

120 S Israel et al
0.15
1.5
0.6
0.45
0.75
0.9
1.05
1.2
1.35
0.3
0
S3 S4S2 S1
O
O
Figure 8. Two dimensional miller map showing O–O bond in (2 2 1) plane. Contour lines are also drawn between 0to 1·5 e/Å3 with 0·1 e/Å3 interval.
0.9 1.0 1.1 1.2 1.3 1.4 1.5 1.6 1.7Distance (Å) (b)
0.4
0.5
0.6
0.7S1S2S3S4
0.7 0.8 0.9 1.0 1.1 1.2 1.3 1.4
Distance (Å) (a)
0.5
0.6
0.7
0.8
0.9
1.0
1.1
1.2
1.3
1.4
1.5
Ele
ctro
n D
ensi
ty (
e/Å
3 )
Ele
ctro
n D
ensi
ty (
e/Å
3 )
S1S2S3S4
0.5 0.7 0.9 1.1 1.3 1.5 1.7 1.9 2.1 2.3 2.5
Distance in A (c)
0.0
0.1
0.2
0.3
0.4
0.5
0.6
0.7
0.8
0.9
1.0
Ele
ctro
n d
ensi
ty in
e/A
3
S1S2S3S4
o
o
Figure 9. One dimensional electron density profile along (a) Mn–O bond, (b) La–O bond and (c) O–O bond.
among the electrons and the disorder present in the sample.Mott demonstrated that electron–electron interactions canproduce a metal–insulator transition even in a system with-out disorder (Mott 1974). Anderson discovered that a dis-order, such as strong spatial fluctuations in the electrostaticpotential caused by impurities, can drive a metal insulatortransition in a system of non-interacting electrons (Anderson1958). The theoretical description of the situation, when botheffects are present is a central unsolved problem, especiallywhen the electron–electron interactions are strong.
The occurrence of insulator–metal transition and then ametal–insulator transition due to the inclusion of dopantmaterial (Y) in the stoichiometrically synthesized LSMO isa very interesting phenomenon that should be analysed withexperimental tools. The electrical transport property of thematerial has pronounced that the insulator–metal–insulatortransition happens at the composition ratio x = 0·2 for thechosen material and this can be investigated in the chargedensity route. The charge density mapping is bound to giveminute details about the localization and delocalization of
Insulator–metal transition in Y doped LSMO 121
the charges between the atoms when bonded. Also the effectof spatial distribution of charges from neighbouring atomscan affect the environment which leads to a change in thebehaviour of localizing the charges. Thus it is expected thatthe presence of Y in some of the lattice sites of La/Sr caninduce the transition from metal/insulator to insulator/metal.The investigation of charge localization/delocalization can bedone on mapping the charges in the valence region prefe-rably in the bonding directions. It is known that the estima-tion of charges in the closed shell interaction (ionic) will havecharges to have a perfect saddle at the mid-bond positionand is low compared to the shared shell interaction (meta-llic/covalent) for which the mid bond will be enacted bya flattened localized charge distribution with a high chargedensity. This is the prime indicator that will lead to thefinding of the ionic to metal transition which is otherwisecalled insulator–metal transition. The necessary tools forthese investigations are accurate 2-D and 1-D charge densityprofiles.
To understand the Mn–O bonding and the charge locali-zation between them (1 0 4) plane is drawn on the unit cellwith contour levels between 0 and 1·5 e/Å3 at an interval of0·1 e/Å3 and is presented in figure 6. Figure 6 shows bondingbetween Mn–O being predominantly ionic with partial cova-lent character and hence a large localized charge density ofabout 0·8 e/Å3 is found to be present at the mid bond posi-tion. But strength of the ionicity is found to vary with respectto the charge environment at the lattice site of La. The diffe-rence in the electro negativity between Mn–O induces ioni-city in the bond with a partial covalent character and this isenhanced more due to the inclusion of Y in the lattice site ofLa. The effect of dopant material (Y) on the MnO6 polyhe-dra is felt in the lattice between Mn–O and thus effectivelyreducing the ionicity while increasing the localized chargein the middle as the concentration of Y increases. Thoughthe inclusion of Y in the lattice site of La does not alter thebonding nature between Mn and O, it affects strength of thebond. The magnitude of the intermediate charge between Mnand O is found to vary alternatively for different stoichiomet-ric compositions showing different strengths of the bond dueto the doping effect (see table 7).
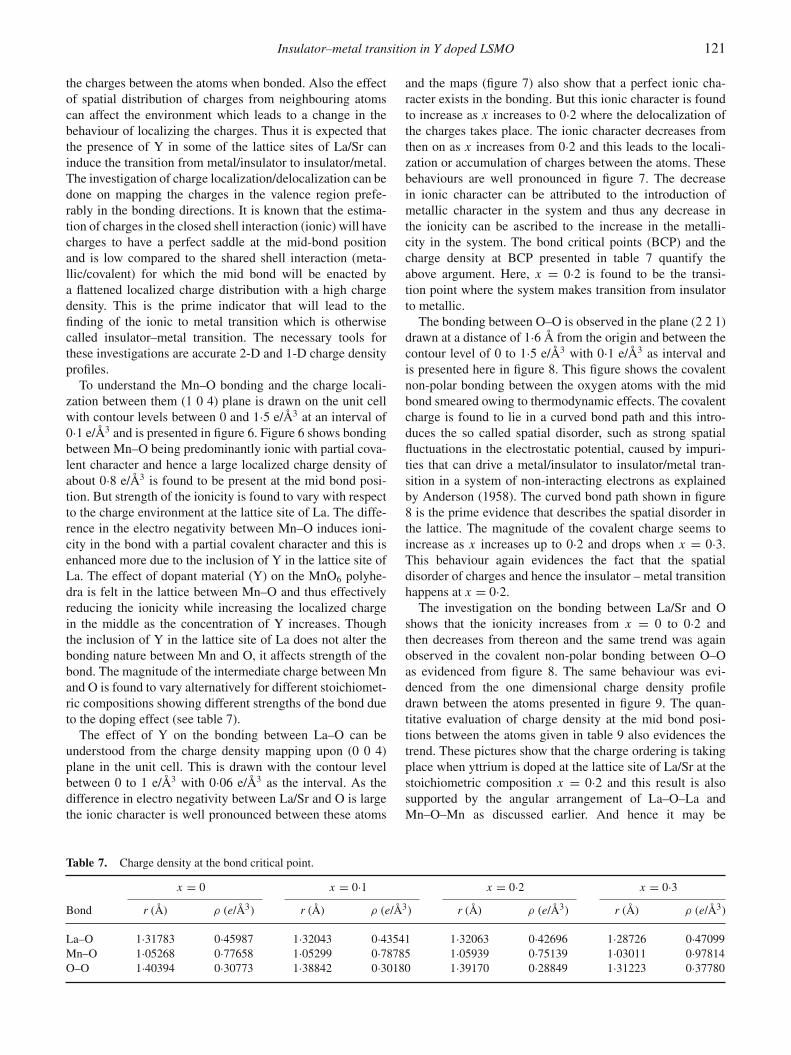
The effect of Y on the bonding between La–O can beunderstood from the charge density mapping upon (0 0 4)plane in the unit cell. This is drawn with the contour levelbetween 0 to 1 e/Å3 with 0·06 e/Å3 as the interval. As thedifference in electro negativity between La/Sr and O is largethe ionic character is well pronounced between these atoms
and the maps (figure 7) also show that a perfect ionic cha-racter exists in the bonding. But this ionic character is foundto increase as x increases to 0·2 where the delocalization ofthe charges takes place. The ionic character decreases fromthen on as x increases from 0·2 and this leads to the locali-zation or accumulation of charges between the atoms. Thesebehaviours are well pronounced in figure 7. The decreasein ionic character can be attributed to the introduction ofmetallic character in the system and thus any decrease inthe ionicity can be ascribed to the increase in the metalli-city in the system. The bond critical points (BCP) and thecharge density at BCP presented in table 7 quantify theabove argument. Here, x = 0·2 is found to be the transi-tion point where the system makes transition from insulatorto metallic.
The bonding between O–O is observed in the plane (2 2 1)drawn at a distance of 1·6 Å from the origin and between thecontour level of 0 to 1·5 e/Å3 with 0·1 e/Å3 as interval andis presented here in figure 8. This figure shows the covalentnon-polar bonding between the oxygen atoms with the midbond smeared owing to thermodynamic effects. The covalentcharge is found to lie in a curved bond path and this intro-duces the so called spatial disorder, such as strong spatialfluctuations in the electrostatic potential, caused by impuri-ties that can drive a metal/insulator to insulator/metal tran-sition in a system of non-interacting electrons as explainedby Anderson (1958). The curved bond path shown in figure8 is the prime evidence that describes the spatial disorder inthe lattice. The magnitude of the covalent charge seems toincrease as x increases up to 0·2 and drops when x = 0·3.This behaviour again evidences the fact that the spatialdisorder of charges and hence the insulator – metal transitionhappens at x = 0·2.
The investigation on the bonding between La/Sr and Oshows that the ionicity increases from x = 0 to 0·2 andthen decreases from thereon and the same trend was againobserved in the covalent non-polar bonding between O–Oas evidenced from figure 8. The same behaviour was evi-denced from the one dimensional charge density profiledrawn between the atoms presented in figure 9. The quan-titative evaluation of charge density at the mid bond posi-tions between the atoms given in table 9 also evidences thetrend. These pictures show that the charge ordering is takingplace when yttrium is doped at the lattice site of La/Sr at thestoichiometric composition x = 0·2 and this result is alsosupported by the angular arrangement of La–O–La andMn–O–Mn as discussed earlier. And hence it may be
Table 7. Charge density at the bond critical point.
x = 0 x = 0·1 x = 0·2 x = 0·3Bond r (Å) ρ (e/Å3) r (Å) ρ (e/Å3) r (Å) ρ (e/Å3) r (Å) ρ (e/Å3)
La–O 1·31783 0·45987 1·32043 0·43541 1·32063 0·42696 1·28726 0·47099Mn–O 1·05268 0·77658 1·05299 0·78785 1·05939 0·75139 1·03011 0·97814O–O 1·40394 0·30773 1·38842 0·30180 1·39170 0·28849 1·31223 0·37780

122 S Israel et al
assumed that material goes from insulator to metal state atx = 0·2. This may also be the reason for the weakening of theferromagnetic order and increasing of the magnetic disorderowing to the presence of yttrium. Thus it is understood thatthe Y doping imposes charge delocalization and it reflectsalso on the weakening of the ferromagnetic order and theinsulator–metal transition. Thus charge density determina-tion can give minute details on the localization/delocalizationof charges in the materials that results in the change in theirphysical and chemical properties.
6. Conclusions
Yttrium doped LSMO prepared using sol–gel techniqueis analysed for the effect of stoichiometric inclusion ofdopant in the charge density distribution in the unit cellusing Rietveld and MEM technique. The bonding betweenthe atoms is analysed quantitatively and qualitatively. Thisresults in insulator–metal transition at x = 0·2 that have beenstudied through charge density distribution analysis for thefirst time. Such studies can be done to understand the chargeordering behaviour in materials that behave differentlywhen different dopants are included in different magneticmaterials.
References
Alexandrov A S and Bratkovsky A M 1999 Phys. Rev. Lett. 82 141Anderson P W 1958 Phys. Rev. 109 1498Arima T, Tokura Y and Torrance J B 1993 Phys. Rev. B48 17006Banach G, Tyer R and Temmerman W M 2004 J. Magn. Magn.
Mater 272–276 1963Bindu R, Maiti Kalobaran, Rawat R and Khalid S 2008 Appl. Phys.
Lett. 92 121906Collins D M 1982 Nature 49 298Gaur Anurag and Varma G D 2006 J. Phys. Condens. Matter 18
8837Howard C J 1982 J. Appl. Crystallogr. 15 615Israel S, Saravanan R, Srinivasan N and Rajaram R K 2003 J. Phys.
Chem. Solids 64 43Israel S, Saravanan R and Rajaram R K 2004 Physica B349 390Izumi F and Dilanian R A 2002 Recent research developments in
physics, Part II (Trivandrum: Transworld Research Network) 3pp 699–726
Janker G H and van Santen J H 1950 Physica 16 337Krishnan K M and Ju H L 1999 Phys. Rev. B60 14793Livesay E A et al 1999 J. Phys. Condensed Matter 11 L2711Lyu P, Xing D Y and Dong J 1998 Phys. Rev. B58 54Maezono R, Ishihara S and Nagaosa N 1998 Phys. Rev. B58 11583Momma K and Izumi F 2008 J. Appl. Crystallogr. 41 653Mott N F 1974 Metal–insulator transitions (London: Taylor and
Francis)Nadgorny B et al 2001 Phys. Rev. B63 184433Nagarajan 2008 Nature Mater. 7 391Petrıcek V, Dusek M and Palatinus L JANA 2000 The crystal-
lographic computing system, Institute of Physics, Academy ofSciences of the Czech Republic, Praha
Picket W E and Singh D J 1997 J. Magn. Magn. Mater. 172 237Renuretson R 2007 Preparation and characterization of yttrium
doped LSMO, M. Phil. Thesis, The American College, MaduraiKamaraj University, Madurai
Rietveld H M 1969 J. Appl. Crystallogr. 2 65Ruben A D and Fujio I 2004 Super-fast program PRIMA for
maximum-entropy method (Ibaraki, Japan: National Institute forMaterials Science) p. 305
Saitoh T, Bocquet A E, Mizokawa T, Namatame H, FujimoriA, Abbate M, Takeda Y and Takano M 1995 Phys. Rev. B5113942
Syed Ali K S, Saravanan R, Israel S and Rajaram R K 2006 Bull.Mater. Sci. 29 107
Thompson P, Cox D E and Hastings J B 1987 J. Appl. Crystallogr.20 79
Tokura Y (ed.) 2000 Colossal magnetoresistive oxides (New York,USA: Gordon and Breach Science Publishers)
Tokura Y and Tomioka Y 1999 J. Magn. Magn. Mater. 200 1Tsai M-H, Tang Y-H, Chou H and Wu W T Private publication
submitted to National Science Council of TaiwanUrushibara A, Moritomo Y, Arima T, Asamitsu A, Kido G and
Tokura Y 1995 Phys. Rev. B51 14103Vachhani P S, Solanki P S, Markna J H, Parmar R N, Bhalodia J A
and Kuberkar D G 2007 Indian J. Eng. & Mater. Sci. 14 163van den Brink J, Khaliullin G and Khomskii D 1999 Phys. Rev. Lett.
83 5118van Santen J H and Janker G H 1950 Physica 16 599Wertheim G K, Butler M A, West K W and Buchanan D N E 1974
Rev. Sci. Instrum. 45 1369Xiong X, Dabrowski B, Chmaissem O, Bukowski Z, Kolesnik S,
Dybzinski R, Kimball C W and Jorgensen J D 1999 Phys. Rev.B60 10186
Yakel H L 1955 Acta Crystallogr. 8 394Zheng R K, Wang Y, Chan H L W, Choy C L and Luo H S 2007
Appl. Phys. 90 152904