
Finite Element Analysis of Disc Insulator Type and Corona Ring Effect on Electric Field Distribution...
13
International Journal of Engineering and Technology, 1 (4) (2012) 407-419 ©Science Publishing Corporation www.sciencepubco.com/index.php/IJET Finite Element Analysis of Disc Insulator Type and Corona Ring Effect on Electric Field Distribution over 230-kV Insulator Strings 1 E. Akbari, 2 M. Mirzaie, 3 A. Rahimnejad and 4 M.B. Asadpoor Department of ECE, Babol University of Technology, Babol, Iran E-mail: 1 [email protected], 2 [email protected], 3 [email protected], 4 [email protected] Abstract Insulator strings are widely used in power systems for the dual task of mechanically supporting and electrically isolating the live phase conductors from the support tower. However, the electric field and voltage distribution of insulator string is uneven which may easily lead to corona, insulators’ surface deterioration and even flashover. So the calculation of the electric field and voltage distribution along them is a very important factor in the operation time. Besides, despite the variety of insulator material and profiles, no remarkable endeavor regarding their impacts upon electric field distribution has been made so far. In this paper, three-dimensional Finite Element Method (3-D FEM) software–Maxwell is employed to simulate several 230-kV insulator strings with various types of porcelain and glass disc insulators and the electric field along them were compared, to investigate the effect of insulator types on electric field distribution. Keywords: Electric Field Distribution, Finite Element Method, Porcelain and Glass Insulator Strings 1 Introduction Insulator strings are widely used in power systems for the dual task of mechanically supporting and electrically isolating the live phase conductors from
-
Upload
independent -
Category
Documents
-
view
0 -
download
0
Transcript of Finite Element Analysis of Disc Insulator Type and Corona Ring Effect on Electric Field Distribution...

International Journal of Engineering and Technology, 1 (4) (2012) 407-419
©Science Publishing Corporation
www.sciencepubco.com/index.php/IJET
Finite Element Analysis of Disc Insulator Type and
Corona Ring Effect on Electric Field Distribution
over 230-kV Insulator Strings
1E. Akbari,
2M. Mirzaie,
3A. Rahimnejad and
4M.B. Asadpoor
Department of ECE, Babol University of Technology, Babol, Iran
E-mail: [email protected],
Abstract
Insulator strings are widely used in power systems for the dual task
of mechanically supporting and electrically isolating the live phase
conductors from the support tower. However, the electric field and
voltage distribution of insulator string is uneven which may easily lead
to corona, insulators’ surface deterioration and even flashover. So the
calculation of the electric field and voltage distribution along them is a
very important factor in the operation time. Besides, despite the variety
of insulator material and profiles, no remarkable endeavor regarding
their impacts upon electric field distribution has been made so far. In
this paper, three-dimensional Finite Element Method (3-D FEM)
software–Maxwell is employed to simulate several 230-kV insulator
strings with various types of porcelain and glass disc insulators and the
electric field along them were compared, to investigate the effect of
insulator types on electric field distribution.
Keywords: Electric Field Distribution, Finite Element Method, Porcelain and Glass Insulator Strings
1 Introduction
Insulator strings are widely used in power systems for the dual task of
mechanically supporting and electrically isolating the live phase conductors from

408 Ebrahim Akbari et al.
the support tower. This is due to their high mechanical strength, easy installation
and operation, and low cost.
Due to the coupling capacitance between disc insulators and conductors around
them, the potential distribution of insulator string is uneven greatly. The voltage
and electric field on the insulators near conductors is three to five times greater
than others (without corona ring), which may easily lead to corona, insulators’
surface deterioration and even flashover. And these problems will seriously affect
the operation safety of transmission lines [1]. So the calculation of the electric
field and voltage distribution in and around high voltage insulators is a very
important factor in the operation condition. The excessive electric stress on the
disc insulators near to energized conductor leads to insulator ageing and surface
discharges. Furthermore, the knowledge of the electric field is useful for the
detection of defects in insulators [2].
Many publications can be found in the calculation of the E-field and potential
distribution for high voltage insulators.
Methods based on field theoretical approach were reviewed in [3], which
indicated its advantages in the analysis of electrical insulation problems.
However, the electric field evaluation of a practical insulator is so complex that an
analytical method is very difficult, if not possible, to compute the exact solutions.
Numerical methods are thus often adopted in engineering applications to derive
acceptable solutions.
Wei et al. [4] applied charge simulation method (CSM) to calculate potential and
electric field distribution along insulator strings, but they simplified the problem
which could not include the influence of conductors or towers.
A finite difference method (FDM) to calculate the electric field in and around
polluted insulators with asymmetric boundary conditions has been proposed by
Morales et al. [5].
Zhao et al. [6] applied boundary element method (BEM) in calculating the
potential and electric field distribution along insulators. Their method considered
the effects of conductors, grading devices and transmission towers. But
computational requirements were high.
Finite element method (FEM) was applied in calculating potential and/or electric
field distribution along insulators.
A two-dimensional finite element model for potential and electrical field
calculation along an ice-covered ceramic string insulator and composite insulator
is presented in [7] and insulators compared with each other. Their calculation
results show that the presence of the ice layer and the icicles has significantly
influenced on the electric field distribution along the ice-covered composite
insulator; and also the maximum electric field along the water films and dry band
increases with decreasing the dry-band length.
Electric Field Distribution of Insulator Strings 409
In [8] a two-dimensional (2-D) FEM was used for simulation of electric field
distribution on ceramic insulators. The voltage applied on insulator has mean
effect on electric field; as the voltage value increase the electric field increase.
The highest electric field for the insulator exits near the HV end of the insulator.
The electric field distribution of a high voltage suspension insulator has been
measured by Kontargyri et al. [9]. In addition, the electric field and potential
distribution around and inside the insulator using 3-D FEM model simulated in
software OPERA. A very good agreement has been ascertained, by comparing the
experimental results with the results from simulation. Reddy et al. [10] used FEM-
based software to study the potential and electric field distribution of different
types of porcelain disc insulators; but their method was 2-D and could not
consider the supporting structures, conductors and other accessories.
Rahimnejad et al. [11] used 3-D FEM for the selection of best corona ring based
on their effect on the electric field and voltage distribution of insulator strings.
In this paper several insulator strings with different disc insulators were simulated
using a three-dimensional (3-D) electric field program based on finite element
method. The electric field and potential distributions along insulators were
calculated and compared for different insulator types. The effects of tower and
conductor existence were considered. Also the effect of corona ring, for reduction
of maximum electric field and improving voltage distribution, was investigated.
2 The Modeling and Simulation Method
The finite element method, a numerical calculation method developed rapidly
with the development of computer, is applied in electromagnetic field analysis as
an important instrument.
2.1 Main Steps of FEM Implementation
The main idea of finite element method is “divide and combine", to divide is for
the element analyze and to combine is for the sake of synthetically analysis of the
integral structure. According to the finite element method, the process of electric-
field distribution modeling and calculation are as following:
- Discretization is applied to the calculation model and then nodes and
elements are generated. All elements are connected together by the nodes
to form the original model.
- Based on the different characteristics of various materials attached to the
model, corresponding parameters of electrical characteristics will be
defined to each element.

410 Ebrahim Akbari et al.
- Maxwell equations and boundary conditions are used to connect all
elements together according to their original structure by proper
simplifying and then finite element equations are formed.
- According to the specific feature, proper calculation method is chosen to
solve the field physical quantity of unknown nodes. Different solution
matrix, which is formed in response to different method, can be solved by
iterative method.
In this paper, the surfaces of insulators are clean and dry. Thus, we can solve the
case studies by the electrostatic solution.
2.2 Equations for Electric Field Calculation
A Simple way for calculation of E-field distribution is calculating of electric
potential distribution. Then, E-field distribution is calculated by minus gradient of
electric potential distribution. Due to electrostatic field distribution, E-field
distribution can be written as follows [12]:
E V (1)
From Maxwell’s equation:
Eρ
ε (2)
where ρ is resistivity Ω/m and ε is dielectric constant of dielectric material (ε =ε0εr
). ε0 is air or space dielectric constant (8.854×10⁻¹² F/m), εr is relative dielectric
constant of dielectric material. Placing (1) in (2) would give Poisson’s equation.
Vε ρ (3)
Without space charge (ρ = 0), Poisson’s equation becomes Laplace’s equation.
0Vε (4)
And finally expansion of (4) for homogeneous media in Cartesian coordinates is:
2 2 2
2 2 20
V V V
x y z
(5)
Further details can be achieved in [12].
Electric Field Distribution of Insulator Strings 411
3 Simulation Parameters
In this work, porcelain and insulator strings, tower, conductor and corona ring are
simulated by Maxwell-Software based on three-dimensional FEM. Insulators and
other apparatus characteristics are as follow:
3.1 Parameters of Insulators, Grading Ring, Tower and
Conductors
The investigations were carried out on three types of porcelain disc insulators and
three types of glass disc insulators, which were denominated by type-A to type-F,
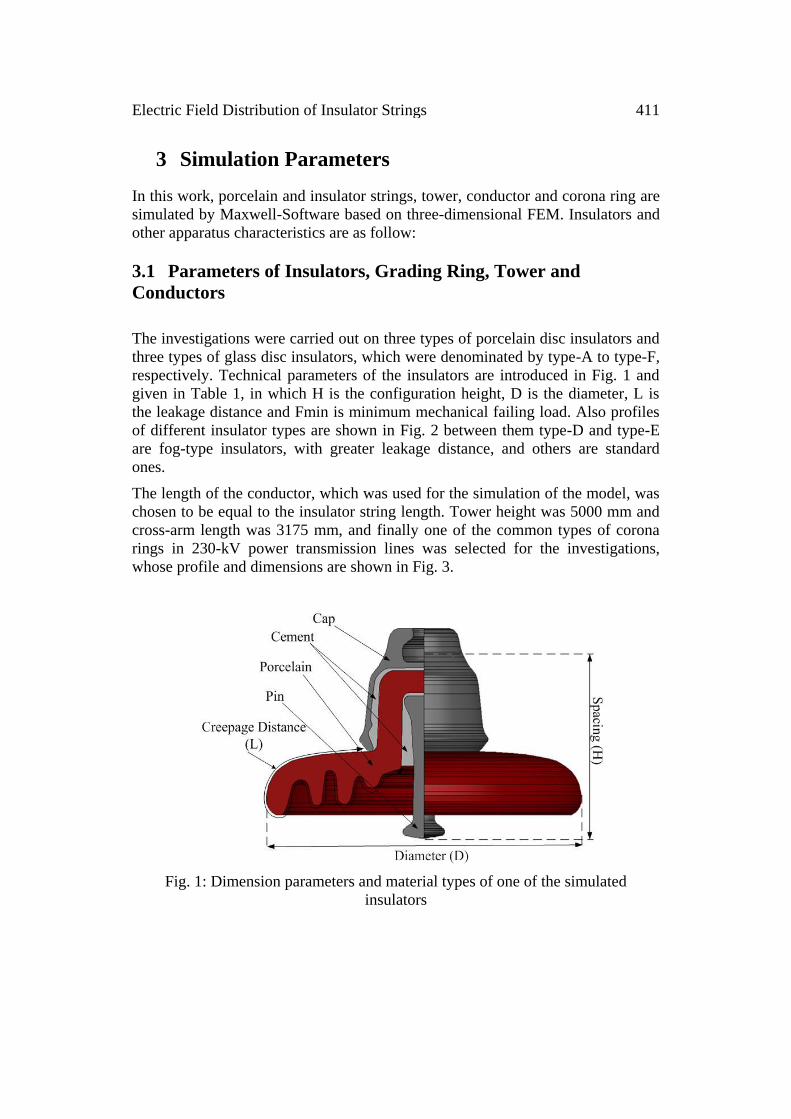
respectively. Technical parameters of the insulators are introduced in Fig. 1 and
given in Table 1, in which H is the configuration height, D is the diameter, L is
the leakage distance and Fmin is minimum mechanical failing load. Also profiles
of different insulator types are shown in Fig. 2 between them type-D and type-E
are fog-type insulators, with greater leakage distance, and others are standard
ones.
The length of the conductor, which was used for the simulation of the model, was
chosen to be equal to the insulator string length. Tower height was 5000 mm and
cross-arm length was 3175 mm, and finally one of the common types of corona
rings in 230-kV power transmission lines was selected for the investigations,
whose profile and dimensions are shown in Fig. 3.
Fig. 1: Dimension parameters and material types of one of the simulated
insulators

412 Ebrahim Akbari et al.
Type-A Type-B Type-C
Type-D Type-E Type-F
Fig. 2: Profiles of the simulated insulators
Table 1: Technical parameters of the simulated insulator
No. Type Material H (mm) D (mm) L (mm) Fmin (kN) Manufacturer
A 0207 Porcelain 146 255 295 120 Iran Insulator Co.
B 0215 Porcelain 146 255 440 120 Iran Insulator Co.
C 0206 Porcelain 170 280 370 160 Iran Insulator Co.
D U120B Glass 146 255 320 120 Pars Maghareh Co.
E U120BP Glass 146 280 442 120 Pars Maghareh Co.
F U160BL Glass 170 280 370 160 Pars Maghareh Co.

Electric Field Distribution of Insulator Strings 413
(a) (b)
Fig. 3: Schema of simulated corona ring (a) profile and dimensions (b) installation
configuration
3.2 Simulated Model
The 3-D model simulated in FEM, which consists of the insulator string, corona
ring, the transmission line and also simplified tower, is shown in Fig. 4.
Fig. 4: The model of tower, conductor, and insulator string used for simulation

414 Ebrahim Akbari et al.
4 Simulation Results
To investigate the effect of insulator type and profile on electric field, simulation
of insulator strings in different conditions has been carried out by software based
on FEM and results were presented.
4.1 Presentation of the results
Because of the large number of simulations carried out, only some results of type-
A and type-D insulator string were extracted from FEM software and is presented
here as a sample. Results of other insulator types are discussed through
appropriate figures. The electric field distribution on YZ plane for type-A and
type-D insulator strings without and with corona ring are presented in Fig. 5 and
6, respectively. It is obvious from these figures that the triple junctions (pin-
cement, cement-porcelain) are critical areas where electric field stress is
maximum and damage and consequent breakdown may occur, especially for the
bottom insulator disc.
In order to study the distribution of electric field in and about insulator string three
lines are considered and electric field distribution along them is calculated and
presented here.
Line 1: the line that passes the center of the insulators, the string axis
Line 2: the line which is parallel to line 1 and touches the insulator surface
(located in x=0 and y=D/2)
Line3: the line which is parallel to line 1 and is 3*D/2 mm away from it
(located in x=0 and y=3*D/2).
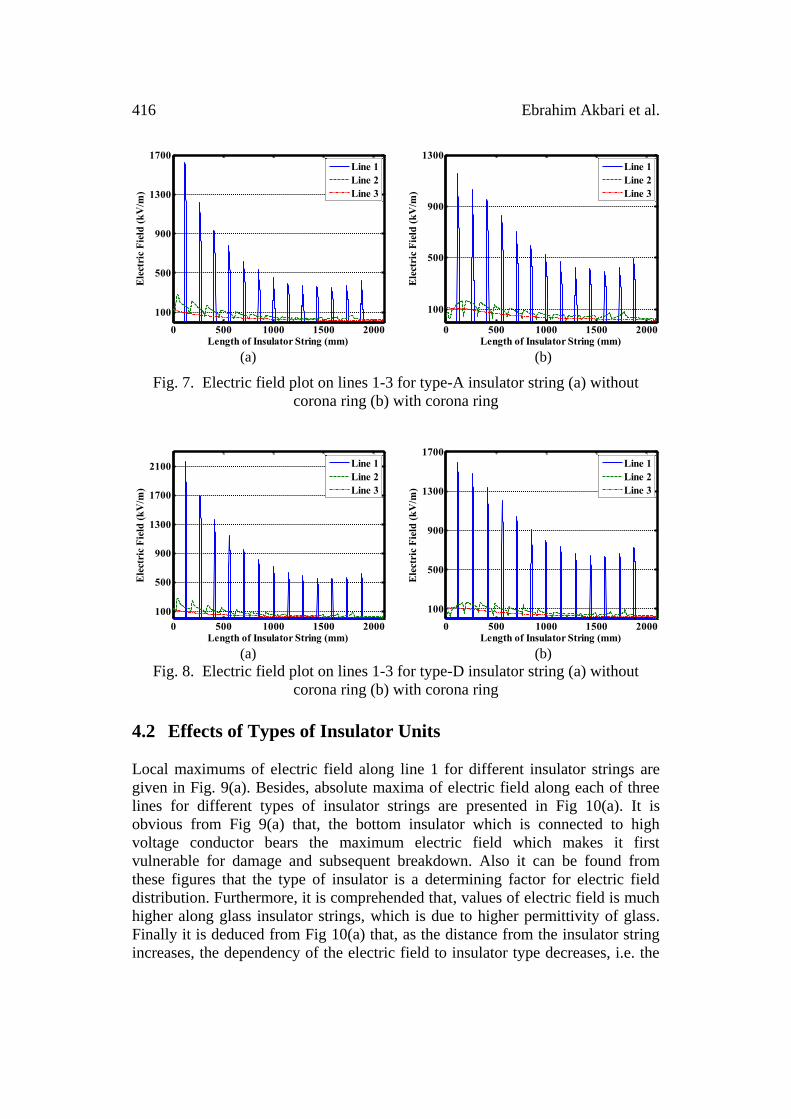
The electric field plot along lines 1-3 for type-A and type-D insulator string
without and with corona ring are shown in Fig. 7 and 8, respectively. In these
figures, the electric field along line 1, within metal parts (cap and pin) is zero and
sharp local maximums represent the areas where the line passes through cement
and porcelain. Along line 2, local maximums of electric field occur in points
which the line touches insulator surface. Finally, electric field along line 3, which
is completely located in the air, constantly reduces from high voltage terminal
side to ground terminal.

Electric Field Distribution of Insulator Strings 415
(a) (b)
Fig. 5: Electric field distribution on YZ plane for type-A insulator string (a)
without corona ring (b) with corona ring
(a) (b)
Fig. 6: Electric field distribution on YZ plane for type-D insulator string (a)
without corona ring (b) with corona ring
416 Ebrahim Akbari et al.
0 500 1000 1500 2000
100
500
900
1300
1700
Length of Insulator String (mm)
Ele
ctri
c F
ield
(k
V/m
)
Line 1
Line 2
Line 3
0 500 1000 1500 2000
100
500
900
1300
Length of Insulator String (mm)
Ele
ctri
c F
ield
(k
V/m
)
Line 1
Line 2
Line 3
(a) (b)
Fig. 7. Electric field plot on lines 1-3 for type-A insulator string (a) without
corona ring (b) with corona ring
0 500 1000 1500 2000
100
500
900
1300
1700
2100
Length of Insulator String (mm)
Ele
ctri
c F
ield
(k
V/m
)
Line 1
Line 2
Line 3
0 500 1000 1500 2000
100
500
900
1300
1700
Length of Insulator String (mm)
Ele
ctri
c F
ield
(k
V/m
)
Line 1
Line 2
Line 3
(a) (b)
Fig. 8. Electric field plot on lines 1-3 for type-D insulator string (a) without
corona ring (b) with corona ring
4.2 Effects of Types of Insulator Units
Local maximums of electric field along line 1 for different insulator strings are
given in Fig. 9(a). Besides, absolute maxima of electric field along each of three
lines for different types of insulator strings are presented in Fig 10(a). It is
obvious from Fig 9(a) that, the bottom insulator which is connected to high
voltage conductor bears the maximum electric field which makes it first
vulnerable for damage and subsequent breakdown. Also it can be found from
these figures that the type of insulator is a determining factor for electric field
distribution. Furthermore, it is comprehended that, values of electric field is much
higher along glass insulator strings, which is due to higher permittivity of glass.
Finally it is deduced from Fig 10(a) that, as the distance from the insulator string
increases, the dependency of the electric field to insulator type decreases, i.e. the

Electric Field Distribution of Insulator Strings 417
electric field value near insulator string is related to insulator material and
profiles, but at farther distances it is not.
4.3 Effects of Corona Ring
To investigate the effects of corona ring existence on electric field distribution,
the introduced corona ring was added in all of the simulations of the previous
section and new results were given in Fig. 9(b) and 10(b), respectively.
Comparing these figures with previous ones, it is comprehended that the
maximum value of electric field along an insulator string significantly decreases
using this apparatus. Furthermore, comparing field values for strings without and
with corona ring, and considering dimensions and materials of insulators from
Table 1, it can be deduced that the degree of reduction of maximum electric field
using corona ring depends on insulator material and profile, as well as the corona
ring configuration parameters. Finally, as deduced in previous section, the more
distance from insulator string, the less relevant is electric field to insulator type.
1 3 5 7 9 11 13
200
500
800
1100
1400
1700
2000
2300
Disc Insulator Number in the String
Ele
ctri
c F
ield
(k
V/m
)
Type A
Type B
Type C
Type D
Type E
Type F
1 3 5 7 9 11 13
200
500
800
1100
1400
1700
Disc Insulator Number in the String
Ele
ctri
c F
ield
(k
V/m
)
Type A
Type B
Type C
Type D
Type E
Type F
(a) (b)
Fig. 9. Local maximums of electric field along line 1 for different insulator strings (a)
without corona ring (b) with corona ring
A B C D E F
100
500
900
1300
1700
2100
Types of Insulators
Ele
ctri
c F
ield
(k
V/m
)
Line 1
Line 2
Line 3
A B C D E F
100
500
900
1300
1700
Types of Insulators
Ele
ctri
c F
ield
(k
V/m
)
Line 1
Line 2
Line 3
(a) (b)
Fig. 10. Maximum values of electric field along lines 1-3 for all types of insulator strings
(a) without corona ring (b) with corona ring
418 Ebrahim Akbari et al.
5 Conclusions and Discussions
An attempt was done to understand the effect of disc insulator type and corona
ring on the electric field distribution of 230-kV insulator strings. 3-D simulations
were carried out using software based on FEM and the effects of nonsymmetrical
components such as tower and conductor is taken into account.
Calculations of electric field are useful in identification of vulnerable areas of
insulator units where damage and consequent breakdown may occur. From the
results presented it is found that one of the most critical areas of electric field
stress is triple junction (pin-cement, cement-porcelain/glass) of the bottom disc
insulator unit.
According to the results, distribution of electric field over insulator strings without
corona ring depends on insulator material and profile, as well as the corona ring
configuration parameters. Hence for each particular type of insulator, corona ring
parameters should be optimized to give the maximum reduction in the electric
field.
Also it was concluded that, as the distance from insulator string increases, the
dependency of electric field to insulator material and profile decreases.
All of insulators simulated in this work are common in power system; hence it is
believed that the results can be very useful for the manufacturers and utilities.
Acknowledgements
The authors gratefully acknowledge Iran Insulator Co. and Pars Maghareh Co. for
presenting the technical parameters of disc insulators.
References
[1] B. Wang, ZR. Peng, “A Finite Element Method for the Calculation of the
Voltage Distribution along the 500kV Line Insulators”, Insulators and Surge
Arresters, No.1, (2003), pp.13-15.
[2] V.T. Kontargyri, I.F. Gonos, I.A. Stathopulos, A.M. Michaelides,
“Measurement and verification of the voltage distribution on high-voltage
insulators”, Proceedings of the 12th Biennial IEEE Conference on
Electromagnetic Field Computation (CEFC 2006), Maimi, FL.
[3] W. McAllister, “Electric fields and electrical insulation”, IEEE Transactions
on Dielectrics and Electrical Insulation, Vol. 9, No. 5, (2002), pp. 672-696.
[4] H. Wei, Y. Fan, W. Jingang, Y. Hao, C. Minyou, and Y. Degui, “Inverse
application of charge simulation method in detecting faulty ceramic
Electric Field Distribution of Insulator Strings 419
insulators and processing influence from tower”, IEEE Transactions on
Magnetics, Vol. 42, No. 4, (2006), pp. 723-726.
[5] N. Morales, E. Asenj, and A. Valdenegro, “Field solution in polluted
insulators with non-symmetric boundary conditions”, IEEE Transactions on
Dielectrics and Electrical Insulation, Vol. 8, No. 2, (2001), pp. 168-172.
[6] T. Zhao, and M. G. Comber, “Calculation of electric field and potential
distribution along nonceramic insulators considering the effects of
conductors and transmission towers”, IEEE Transactions on Power Delivery,
Vol. 15, No. 1, (2000), pp. 313-318.
[7] W. Sima, Q. Yang, C. Sun and F.Guo, “Potential and Electric-Field
Calculation along an Ice-Covered Composite Insulator with Finite-Element
Method”, IEE Proceedings of Generation, Transmission and Distribution,
Vol. 153, no. 3, (2006), pp. 343–349.
[8] Sh. M. Faisal, “Simulation of Electric Field Distribution on Ceramic
Insulator Using Finite Element Method”, European Journal of Scientific
Research, Vol.52, No.1, (2011), pp.52-60.
[9] Vassiliki T. Kontargyri, Ioannis F. Gonos and Ioannis A. Stathopulos,
“Measurement and simulation of the electric field of high voltage suspension
insulators”, European Transactions on Electrical Power, Vol. 19, No 3,
(2009), pp. 509–517.
[10] B. S. Reddy, N. A. Sultan, P. M. Monika, B. Pooja, O. Salma and K. V.
Ravishankar, “Simulation of potential and electric field for high voltage
ceramic disc insulators”, International Conference on Industrial and
Information Systems (ICIIS), Indian Institute of Science, Bangalore, India,
(2010), pp. 526–531.
[11] A. Rahimnejad, M. Mirzaie, “Optimal Corona Ring Selection for 230 kV
Ceramic I-string Insulator using 3D Simulation”, International Journal of
Scientific & Engineering Research, Vol. 3, Issue 7, (2012), pp. 1–6
[12] Haddad and D.F. Warne, Advances in High Voltage Engineering, IET Power
and Energy Series 40, The Institution of Engineering and Technology,
(2007).