Electronic and optical properties of the Mg2-xFexSiO4 spinel:From band insulator to Mott insulator
10
Electronic and optical properties of the Mg 2-x Fe x SiO 4 spinel: From band insulator to Mott insulator Kamil Tokár, Przemyslaw Piekarz, Mariana Derzsi,* Pawel T. Jochym, Jan Lażewski, Malgorzata Sternik, Andrzej M. Oleś, and Krzysztof Parlinski Institute of Nuclear Physics, Polish Academy of Sciences, Radzikowskiego 152, 31-342 Kraków, Poland Received 4 August 2010; revised manuscript received 4 October 2010; published 11 November 2010 The crystal properties and electronic structure of Mg 2-x Fe x SiO 4 spinel have been studied using the density- functional theory including the local Hubbard interaction U within the generalized gradient approximation. The lattice constant depends linearly on increasing iron concentration x in agreement with the Vegard’s law. The contributions of the Fet 2g and Fee g orbitals to the electronic density of states have been determined and their crucial role in the band-gap formation has been elucidated. We explain the decrease in the insulating gap with increasing iron concentration on the basis of the Mott-Hubbard picture of correlated insulators. Thus, it was revealed that the electronic structure of Mg 2-x Fe x SiO 4 evolves from the band insulator found in Mg 2 SiO 4 to the Mott insulator with increasing iron concentration. We present also the absorption spectra derived from the complex dielectric tensor, which are in good qualitative agreement with the previously reported experi- mental data for a wide range of energies. DOI: 10.1103/PhysRevB.82.195116 PACS numbers: 71.30.h, 71.38.k, 75.50.Gg I. INTRODUCTION The major components of the Earth’s upper mantle and transition zone are magnesium-iron orthosilicates Mg 2-x Fe x SiO 4 , the most common and the oldest minerals in the solar system. 1 A variable concentration of Fe ions strongly influences the complexity of phase relations be- tween magnesium-silicate forms and elastic properties of these minerals. 2 Detailed knowledge of these relations is im- portant for modeling of geophysical processes in the Earth’s interior and interpretation of the seismic data. 3,4 Having par- tially filled d-states, Fe ions significantly modify magnetic and optical properties of minerals, and increase substantially electric conductivity and heat transfer in the rock-forming materials. 5 Mg 2-x Fe x SiO 4 compounds exist in three crystallographic phases: -orthorhombic olivine, -orthorhombic modified spinel, and -cubic spinel. 6 Olivines are stable at pressures below p 15 GPa and this upper limit decreases with Fe concentration, phase exists only at small Fe concentration in the pressure range 13–20 GPa, and spinels are stable in the entire range of Fe concentration above 20 GPa. 7 The mag- netic properties of olivines change from diamagnetic in -Mg 2 SiO 4 forsterite to antiferromagnetic AFM ones in -Fe 2 SiO 4 fayalite. The latter exhibits two phase transi- tions: first from a paramagnetic to AFM phase at the Néel temperature T N = 65 K and second associated with a change from a collinear to canted AFM state at lower temperature T t 23 K. 8 As found recently, the Néel temperature de- creases significantly for lower concentration of Fe atoms. 9 -Fe 2 SiO 4 is a paramagnet at room temperature in a wide pressure range 10 and in comparison to olivines shows a phase transition to the AFM state at much lower temperature T N =11 K. 11,12 Optical properties of minerals affect considerably the heat transfer in the Earth’s interior. For instance, the optical ab- sorption in a wide range of wavelengths, from the far infra- red IR to the ultraviolet UV determines the radiative com- ponent of the thermal conductivity. At low Fe concentration, the optical spectra consist of a strong absorption edge in UV 4 eV and a series of overlapping bands at near IR 1–1.5 eV. 13,14 The low-energy absorption originates from electronic transitions within Fe 2+ ions and their posi- tions depend mainly on the crystal-field splitting of the 3d states in the octahedral symmetry. 15–17 The absorption edge corresponds to intensive charge-transfer Laporte allowed dominated by the Fe-O transitions. With increasing Fe con- centration, the absorption edge shifts to lower energies indi- cating a pronounced contribution of the 3d states in the op- tical processes. 18 In and phases of Fe 2 SiO 4 , Mao and Bell observed a strong shift of the absorption edge and a dramatic increase of a few orders of magnitude in the electric conductivity at pressures above 20 GPa. 19 This spectacular effect has not been fully explained so far. Most theoretical studies have been focused on the pure magnesium compound Mg 2 SiO 4 , having much simpler elec- tronic structure than either Fe 2 SiO 4 or Mg 2-x Fe x SiO 4 com- pounds. This is an ionic insulator with a large band gap, transparent in a wide spectral range. Within the density- functional theory DFT, the basic structural, elastic, and dy- namic properties of the known crystallographic phases of Mg 2 SiO 4 were investigated. 20–26 The first-principles data were used to construct the phase diagram of Mg 2 SiO 4 within the quasiharmonic approximation. 27,28 The Fe-doped com- pounds are much more challenging materials due to strong electron interactions within the 3d states. As demonstrated by the DFT studies, the insulating state in pure iron com- pound Fe 2 SiO 4 is induced by a strong local Hubbard inter- action U so this mineral can be classified as a Mott insulator. 29–31 This local Coulomb interaction modifies not only electronic structure of Fe 2 SiO 4 but also its structural and elastic properties. 32 In this respect, Fe 2 SiO 4 belongs to a wide class of strongly correlated transition-metal minerals. 33–36 In this study, we focus on the electronic properties of -Mg 2-x Fe x SiO 4 in a wide range of Fe concentrations. Since PHYSICAL REVIEW B 82, 195116 2010 1098-0121/2010/8219/19511610 ©2010 The American Physical Society 195116-1
Transcript of Electronic and optical properties of the Mg2-xFexSiO4 spinel:From band insulator to Mott insulator
Electronic and optical properties of the Mg2−xFexSiO4 spinel:From band insulator to Mott insulator
Kamil Tokár, Przemysław Piekarz, Mariana Derzsi,* Paweł T. Jochym, Jan Łażewski, Małgorzata Sternik,Andrzej M. Oleś, and Krzysztof Parlinski
Institute of Nuclear Physics, Polish Academy of Sciences, Radzikowskiego 152, 31-342 Kraków, Poland�Received 4 August 2010; revised manuscript received 4 October 2010; published 11 November 2010�
The crystal properties and electronic structure of Mg2−xFexSiO4 spinel have been studied using the density-functional theory including the local Hubbard interaction U within the generalized gradient approximation. Thelattice constant depends linearly on increasing iron concentration x in agreement with the Vegard’s law. Thecontributions of the Fe�t2g� and Fe�eg� orbitals to the electronic density of states have been determined andtheir crucial role in the band-gap formation has been elucidated. We explain the decrease in the insulating gapwith increasing iron concentration on the basis of the Mott-Hubbard picture of correlated insulators. Thus, itwas revealed that the electronic structure of Mg2−xFexSiO4 evolves from the band insulator found in Mg2SiO4
to the Mott insulator with increasing iron concentration. We present also the absorption spectra derived fromthe complex dielectric tensor, which are in good qualitative agreement with the previously reported experi-mental data for a wide range of energies.
DOI: 10.1103/PhysRevB.82.195116 PACS number�s�: 71.30.�h, 71.38.�k, 75.50.Gg
I. INTRODUCTION
The major components of the Earth’s upper mantle andtransition zone are magnesium-iron orthosilicatesMg2−xFexSiO4, the most common and the oldest minerals inthe solar system.1 A variable concentration of Fe ionsstrongly influences the complexity of phase relations be-tween magnesium-silicate forms and elastic properties ofthese minerals.2 Detailed knowledge of these relations is im-portant for modeling of geophysical processes in the Earth’sinterior and interpretation of the seismic data.3,4 Having par-tially filled d-states, Fe ions significantly modify magneticand optical properties of minerals, and increase substantiallyelectric conductivity and heat transfer in the rock-formingmaterials.5
Mg2−xFexSiO4 compounds exist in three crystallographicphases: �-orthorhombic olivine, �-orthorhombic modifiedspinel, and �-cubic spinel.6 Olivines are stable at pressuresbelow p�15 GPa and this upper limit decreases with Feconcentration, � phase exists only at small Fe concentrationin the pressure range 13–20 GPa, and spinels are stable in theentire range of Fe concentration above 20 GPa.7 The mag-netic properties of olivines change from diamagnetic in�-Mg2SiO4 �forsterite� to antiferromagnetic �AFM� ones in�-Fe2SiO4 �fayalite�. The latter exhibits two phase transi-tions: first from a paramagnetic to AFM phase at the Néeltemperature TN=65 K and second associated with a changefrom a collinear to canted AFM state at lower temperatureTt�23 K.8 As found recently, the Néel temperature de-creases significantly for lower concentration of Fe atoms.9
�-Fe2SiO4 is a paramagnet at room temperature in a widepressure range10 and in comparison to olivines shows a phasetransition to the AFM state at much lower temperatureTN=11 K.11,12
Optical properties of minerals affect considerably the heattransfer in the Earth’s interior. For instance, the optical ab-sorption in a wide range of wavelengths, from the far infra-red �IR� to the ultraviolet �UV� determines the radiative com-
ponent of the thermal conductivity. At low Fe concentration,the optical spectra consist of a strong absorption edge in UV��4 eV� and a series of overlapping bands at near IR��1–1.5 eV�.13,14 The low-energy absorption originatesfrom electronic transitions within Fe2+ ions and their posi-tions depend mainly on the crystal-field splitting of the 3dstates in the octahedral symmetry.15–17 The absorption edgecorresponds to intensive charge-transfer �Laporte allowed�dominated by the Fe-O transitions. With increasing Fe con-centration, the absorption edge shifts to lower energies indi-cating a pronounced contribution of the 3d states in the op-tical processes.18 In � and � phases of Fe2SiO4, Mao andBell observed a strong shift of the absorption edge and adramatic increase of a few orders of magnitude in the electricconductivity at pressures above 20 GPa.19 This spectaculareffect has not been fully explained so far.
Most theoretical studies have been focused on the puremagnesium compound Mg2SiO4, having much simpler elec-tronic structure than either Fe2SiO4 or Mg2−xFexSiO4 com-pounds. This is an ionic insulator with a large band gap,transparent in a wide spectral range. Within the density-functional theory �DFT�, the basic structural, elastic, and dy-namic properties of the known crystallographic phases ofMg2SiO4 were investigated.20–26 The first-principles datawere used to construct the phase diagram of Mg2SiO4 withinthe quasiharmonic approximation.27,28 The Fe-doped com-pounds are much more challenging materials due to strongelectron interactions within the 3d states. As demonstratedby the DFT studies, the insulating state in pure iron com-pound Fe2SiO4 is induced by a strong local Hubbard inter-action U so this mineral can be classified as a Mottinsulator.29–31 This local Coulomb interaction modifies notonly electronic structure of Fe2SiO4 but also its structuraland elastic properties.32 In this respect, Fe2SiO4 belongs to awide class of strongly correlated transition-metalminerals.33–36
In this study, we focus on the electronic properties of�-Mg2−xFexSiO4 in a wide range of Fe concentrations. Since
PHYSICAL REVIEW B 82, 195116 �2010�
1098-0121/2010/82�19�/195116�10� ©2010 The American Physical Society195116-1

the Mg- and Fe-end members belong to different classes ofinsulators—Mg2SiO4 is a band insulator while Fe2SiO4 is aMott insulator—this material provides a unique possibility tostudy the transition between these two regimes. The mainaim of this study is to determine how the detail featuresfound in the electronic structure and optical properties ofMg2−xFexSiO4-spinel change with increasing Fe concentra-tion.
The paper is organized as follows. Details of computa-tional procedures and the overview of calculation methodsused in this work are described in Sec. II. Dependence of thecrystal structure properties and magnetization of Fe ions onthe composition of Mg2−xFexSiO4 compounds is presented inSec. III. This dependence is related to the particular proper-ties of the electronic structure and to the mechanism of in-sulating gap in the electronic structure with increasing Feconcentration x in Sec. IV, where the above systematicchanges found in this paper with increasing Fe content areanalyzed. In Sec. V we present the absorption spectra. Fi-nally, the results are summarized in Sec. VI, where also ourmain conclusions are presented.
II. CALCULATION DETAILS
A. Structure optimization
The crystal parameters and electronic structure of�-Mg2−xFexSiO4 have been optimized using the full-potentialprojector augmented-wave method,37 implemented in theVASP program.38 For the exchange-correlation functional thegeneralized gradient approximation �GGA� approach hasbeen used.39 The valence electron configurations used in thecalculations are: Mg�3s2�, Si�3s23p2�, O�2s22p4�, andFe�4s23d6�. The k-point space has been sampled by the4�4�4 Monkhorst-Pack mesh40 with 21 irreducible k vec-tors, and the energy cutoff for the plane-waves expansion hasbeen set to 500 eV. To check the convergence of the latticeparameters and the electronic structure, larger number ofk-points �6�6�6 grid� was used. We have found that thedifferences in the obtained lattice constant and the enthalpyper one atom for these two samplings were less than0.001 Å and 1 meV, respectively. The calculations were per-formed in the 1�1�1 cubic supercell containing 56 atoms�see Fig. 1� with the imposed periodic boundary conditions.All presented results, if not explicitly written otherwise, wereobtained at the external pressure of 20 GPa, for which thecubic phase is known to be stable in the whole range of Feconcentrations.7
The crystal optimization was performed in two steps.First, the lattice constant of the cubic cell was optimizedusing the conjugate gradient technique. Then, the atomic po-sitions were fully relaxed with the quasi-Newton procedure,which gives the residual forces less than 10−3 meV /Å. Foreach concentration x, atomic configurations were generatedeither by random substituting of the Fe atoms into the octa-hedral Mg positions or by choosing the high symmetry ar-rangement of the Fe atoms. For each configuration, the lat-tice parameters, total enthalpy, magnetic moments on the Feions, and the electronic structure were determined.
As 3d electrons are missing in Mg2SiO4, this compound isnonmagnetic �NM�. In all the other cases local moments atFe ions will order in the ground state and we assumed theferromagnetic �FM� orientation of Fe spins. In addition, fortwo concentrations x=1 and x=2 we also considered forcomparison the AFM order of magnetic moments. For x=1,we assumed the symmetric arrangement of the Fe atoms,with the opposite orientations of spins located in two parallel�001� planes separated by the distance 1
2a. For x=2, the mag-netic moments with the antiparallel directions are separatedby the 1
4a distance and have the same direction within the�001� planes. The same AFM configuration of Fe2SiO4 wasused in Ref. 31.
B. Local Coulomb interactions
The local electron interactions in the 3d states on ironwere included within the GGA+U method. The total energycan be written in the form
Etot = EDFT + EUHF − Edc, �1�
where EDFT is the energy of the system obtained within theGGA functional �at U=J=0�, EU
HF is the Hartree-Fock �HF�contribution arising from the on-site Coulomb interactionswith the local Coulomb interaction U, and Edc is the correc-tion term which removes double counting of the interactionenergy. The two latter terms are derived as follows.
The local electron interactions are described by the on-siteterms41
Hint = U0�i�
ni�↑ni�↓ + �U −1
2J� �
i,���,���
ni��ni���
− 2J �i,���
S� i� · S� i� + J �i,���
di�↑† di�↓
† di�↓di�↑, �2�
where di��† is electron creation operator at site i in orbital �
with spin �= ↑ ,↓ ��̄=−�� and ni��=di��† di�� is the corre-
sponding electron number operator. The spin operators S� i�= �Si�
x ,Si�y ,Si�
z � are related to the fermion operators in thestandard way. The elements U and J stand for the on-siteinterorbital Coulomb and Hund’s exchange interaction, re-spectively. The rotational invariance of on-site Coulomb in-
FIG. 1. �Color online� The crystal structure of Mg2−xFexSiO4.The dark �green� balls representing the Mg or Fe atoms and theSiO4 tetrahedra are shown in �a�. In �b� the metal ions are presentedin corners of tetrahedra as dark �green� balls. The oxygen atoms areshown here as light �yellow� balls and form octahedra around themetal ions.
TOKÁR et al. PHYSICAL REVIEW B 82, 195116 �2010�
195116-2

teractions in the orbital space implies that U0=U+2J.41
When the HF approximation is used,42 the last “pair-hopping” term does not contribute and the local spin inter-actions S� i� ·S� i� contribute only with the Ising part given byelectron density operators as Si�
z 12 �ni�↑−ni�↓�, i.e., one may
write
− 2JS� i� · S� i� J
2 �i,���,�
ni��ni��̄ −J
2 �i,���,�
ni��ni��. �3�
In this case local electron interactions Eq. �2� are defined byelectron densities �ni��� that are obtained here by the projec-tion of the wave function onto the spherical harmonics. Fol-lowing the usual practice in the local density approximationincluding local Coulomb interactions �LDA+U� method,43
in what follows we derive the Coulomb energy EU at Fe ionsfrom an approximate expression,
Hint U �i,���,�
ni��ni��̄ + �U − J� �i,���,�
ni��ni��. �4�
The first term in Eq. �4� describes the Coulomb interactionbetween electrons with antiparallel spins. This approxima-tion violates the rotational invariance of local Coulombinteractions41 as the intraorbital interaction is also given bythe element U. Nevertheless, it is sufficient for the descrip-tion of a spin-polarized ground state, where one uses theCoulomb energy for electrons of the same spin polarized byHund’s exchange, and the only present interaction term�U−J� is faithfully reproduced.
The form given in Eq. �4� is sufficient since all the HFterms usually included arise from it.42 One finds that
HintHF = U �
i,���,��ni���ni��̄� + �ni���ni��̄�
+ �U − J� �i,���,�
�ni���ni��� + �ni���ni��� . �5�
The energy EUHF�Hint
HF� obtained in the HF approximation isthen
EUHF = 2U �
i,���,��ni����ni��̄� + 2�U − J� �
i,���,��ni����ni���
�6�
and Edc 12 �Hint
HF� is the double-counting correction termwhich removes the double counting of the interaction energy,i.e., factors of 2 in Eq. �6�, and equals to the average energyof the electron-electron interaction already included in theGGA. More details on the implementation of local Coulombinteractions within the GGA scheme may be found in Ref.43.
For the actual calculations the value of the Coulomb pa-rameter at Fe ions was chosen to be U=4.5 eV, as derivedfor fayalite in Ref. 29, and Hund’s exchange J=0.9 eV wasobtained using the Racah parameters for Fe ions.44 The sameparameters were used before for studying the electronicproperties of Fe2SiO4 spinel.31 Alternatively, the local elec-tron interactions in this material could be studied using thehybrid-functional method,45 which has been successfully ap-plied to Mott insulators.46
C. Optical properties
The optical properties are studied within the independentelectron approach taking into account only the direct transi-tions between the occupied and unoccupied states. We calcu-lated the energy-dependent complex dielectric tensor
��� � = ���1�� � + i��
�2�� � , �7�
where the imaginary part is given by
���2�� � =
4�2e2
Vlimq→0
1
q2 �c,v,k
2wk���ck − �vk − �
� �uck+e�q uvk��uck+e�q uvk��, �8�
where c and v denote the conduction and valence states,respectively, V is the cell volume, e� are unit vectors for thethree Cartesian directions, wk are k-point weights, and uck isthe cell periodic part of the wave function at the point k. Thereal part of the dielectric tensor is obtained by the Kramers-Kronig transformation
���1�� � = 1 +
2
�P�
0
�
d ���
�2�� �� �
�2 − 2 + i�, �9�
where P denotes the principal value and ��0 is a constantimaginary shift. The linear absorption coefficients are givenby the relation
���� � = �2 ������1�� ��2 + ���
�2�� ��2 − ���1�� ��1/2.
�10�
In the cubic system all diagonal components of the absorp-tion matrix are equal �xx=�yy =�zz and will be denoted by �.
III. CRYSTAL PROPERTIES AND MAGNETICMOMENTS
The crystal structure of Mg2−xFexSiO4 spinel having the
space group symmetry Fd3̄m is shown in Fig. 1. The metalions are organized into corner-sharing tetrahedra alignedalong the unit cell diagonals. They are additionally coordi-nated by oxygen atoms, forming edge-sharing XO6 octahe-dra. The Si atoms are coordinated by O atoms into isolatedSiO4 tetrahedra. In Table I, the optimized lattice constantsand calculated enthalpies and magnetic moments are pre-sented for all considered Fe concentrations: x=0, 0.125,0.25, 0.50, 1.0, 1.5, and 2.0, accessible for the unit cell ofFig. 1. For Mg2SiO4, the obtained lattice constant agreeswell with those determined in the previous high-pressurestudies.22,24
In the cubic symmetry, all octahedral positions of Mg at-oms are equivalent, therefore, there is only one nonequiva-lent configuration with one Mg atom replaced by a Fe atomin the supercell consisting of 56 atoms which contains 16 Mgatoms, see Fig. 1. This change corresponds to Fe concentra-tion x=0.125. The Fe doping slightly increases the latticeconstant and lowers the total enthalpy of the system. For twoFe atoms in the supercell of Fig. 1 �x=0.25�, there are threenonequivalent configurations and all of them were taken into
ELECTRONIC AND OPTICAL PROPERTIES OF THE Mg… PHYSICAL REVIEW B 82, 195116 �2010�
195116-3

account in our calculations. Very small differences inthe lattice constants ��0.002 � and enthalpies��1 meV /atom� for a given concentration indicate a weakdependence of the basic characteristics of the system on aparticular arrangement of Fe atoms. For the concentration x=0.5 �four Fe atoms�, we have studied three configurations:one symmetric with Fe atoms located at the same �001� planeand two with random distributions. Also for this concentra-tion, the calculated lattice constants, enthalpies, and mag-netic moments depend very weakly on a particular atomicarrangement. Three more concentrations included in ourstudies consist of eight �x=1�, 12 �x=1.5�, and 16 Fe atoms�x=2� within the supercell of Fig. 1. The last compositioncorresponds to Fe2SiO4.
The values of magnetic moments presented in Table Idepend on the chosen parameters U and J. For one doped Featom in the unit cell, i.e., at the lowest Fe concentration x=0.125, the magnetic moment changes from m=3.52 �B forU=J=0 to m=3.65 �B for U=4.5 eV and J=0.9 eV. Wehave found that on average the local electron interactionsincrease magnetic moments by about 4% with respect to theU=0 case. The lattice constants, enthalpies, and magneticmoments obtained for two AFM configurations with x=1 andx=2 are very close to the corresponding values obtained forthe FM orientation. Slightly lower values of enthalpies indi-cate that the magnetic ground state has the AFM character.As it was found in Ref. 31, the AFM configuration in�-Fe2SiO4 induces a tetragonal distortion of the cubic sym-metry that additionally lowers the ground-state energy andremoves the geometrical frustration of magnetic interactions.Since such distortion affects the electronic structure onlyvery weakly, we do not consider it in the present studies.
The lattice constants, enthalpies, and magnetic momentsas functions of concentration are plotted in Fig. 2. The lattice
constant increases linearly with concentration in agreementwith the Vegard’s law,47,48 which is an approximate empiricalrule for crystal lattice parameters at constant temperature.Vegard’s law describes the linear relation between the latticeconstant a and concentration x of the constituent elements
TABLE I. Lattice constants a, entalphies H, and average magnetic moments m at Fe atoms obtained forrepresentative Mg2−xFexSiO4 compounds using the GGA+U method. Magnetic configuration �NM, FM, andAFM� used for the numerical calculations is indicated in each case.
Fe atoms x Configurationa
��H
�eV/atom�m
��B�
0 0.000 NM 7.879 −5.6846 0
1 0.125 FM 7.890 −5.7144 3.653
2 0.250 FM 7.901 −5.7437 3.678
2 0.250 FM 7.901 −5.7437 3.678
2 0.250 FM 7.903 −5.7442 3.656
4 0.500 FM 7.924 −5.8014 3.682
4 0.500 FM 7.923 −5.8018 3.681
4 0.500 FM 7.923 −5.8021 3.682
8 1.000 FM 7.965 −5.9144 3.689
8 1.000 FM 7.966 −5.9155 3.689
8 1.000 AFM 7.963 −5.9168 3.684
12 1.500 FM 8.007 −6.0182 3.702
12 1.500 FM 8.006 −6.0288 3.698
16 2.000 FM 8.047 −6.1378 3.699
16 2.000 AFM 8.042 −6.1429 3.691
7.90
7.95
8.00
8.05
a(Å
)
-6.2
-6.0
-5.8
-5.6
H(e
V/a
tom
)
0 0.25 0.5 0.75 1 1.25 1.5 1.75 2x
3.66
3.68
3.70
m(µ
B)
FIG. 2. �Color online� Lattice constant, enthalpy, and averagemagnetic moment as functions of Fe concentration x. Triangles andsquares represent the values obtained for the FM and AFM configu-rations, respectively. Solid lines were obtained by the linear regres-sion of the calculated data.
TOKÁR et al. PHYSICAL REVIEW B 82, 195116 �2010�
195116-4
a�x� =1
2��2 − x�aMg + xaFe� , �11�
where aMg and aFe correspond to the lattice constants ofstructure at Fe concentration x=0 and x=2, respectively. Pa-rameters determined by the linear regression of calculatedlattice constants are aMg=7.880 Å and aFe=8.049 Å. Thesevalues are in a very good agreement with those directly cal-culated for pure magnesium compound, a�0�=7.879 Å, andfor full iron substitution, a�2�=8.047 Å. Moreover, the co-efficient of the linear dependence equal to 0.085 Å corre-sponds very well to the experimental value obtained from themolar volume measurements.7 The total enthalpy of the sys-tem H also changes linearly with x, decreasing in this casewith increasing x. This result shows that the Fe doping sta-bilizes the spinel structure at a considered pressure. The val-ues of lattice constants and enthalpies for the AFM configu-rations were also included in Fig. 2, and they perfectly matchthe linear dependencies of the FM ones.
We have also analyzed the changes in interatomic dis-tances and bond angles induced by the Fe doping. Because ofthe shorter ionic radius of Mg2+ ion �0.86 Å� in comparisonto the high-spin Fe2+ �0.92 Å�, the Mg-O distances are ingeneral shorter than the Fe-O ones by 0.06 Å.49 Therefore,in the solid solution �Mg,Fe�SiO4, the structural distortionsin the adjacent FeO6 and MgO6 octahedra are very small.Indeed, our theoretical results for the pure Mg and Fe phasesare in good agreement with this tabulated values; at 20 GPa:d�Mg-O�=2.01 Å and d�Fe-O�=2.059 /2.098 Å. Thechange in Mg-O distances induced by exchange of one Mgion by Fe one is less then 0.005 Å. Further cation exchangeenforces additional bond variations. However, the changes inthe Mg-O distances are within 0.03 Å for all consideredcases and such small bond variations induce only very smallchanges in the bond angles ��1°�. The same applies to theFeO6 octahedra, and the SiO4 tetrahedra are even less af-fected. Finally, the exchange of the cations does not enforceany considerable changes in the octahedra and tetrahedra aswell as in relative orientations of the respective units.
In the bottom panel of Fig. 2, we plot the magnetic mo-ment, averaged over different configurations, as a function ofx. It exhibits a monotonous increase with increasing Fe con-centration x showing, however, nonlinear behavior. It hasstronger dependence at small doping, weaker dependence forintermediate values of x and becomes saturated for x�1.5.The magnetic moments obtained for the AFM configurationsare slightly lower than for the FM ones. This observation canbe explained by weak reduction in the moments in the AFMcase due to hybridization effects. Furthermore, comparingmagnetic moments for small and high doping, we see that itsvalue increases only by 1.2%. This small increase is associ-ated with enhanced localization of the 3d electrons on Featoms due to larger crystal volume.
IV. ELECTRONIC STRUCTURE
A. Dependence on Fe concentration
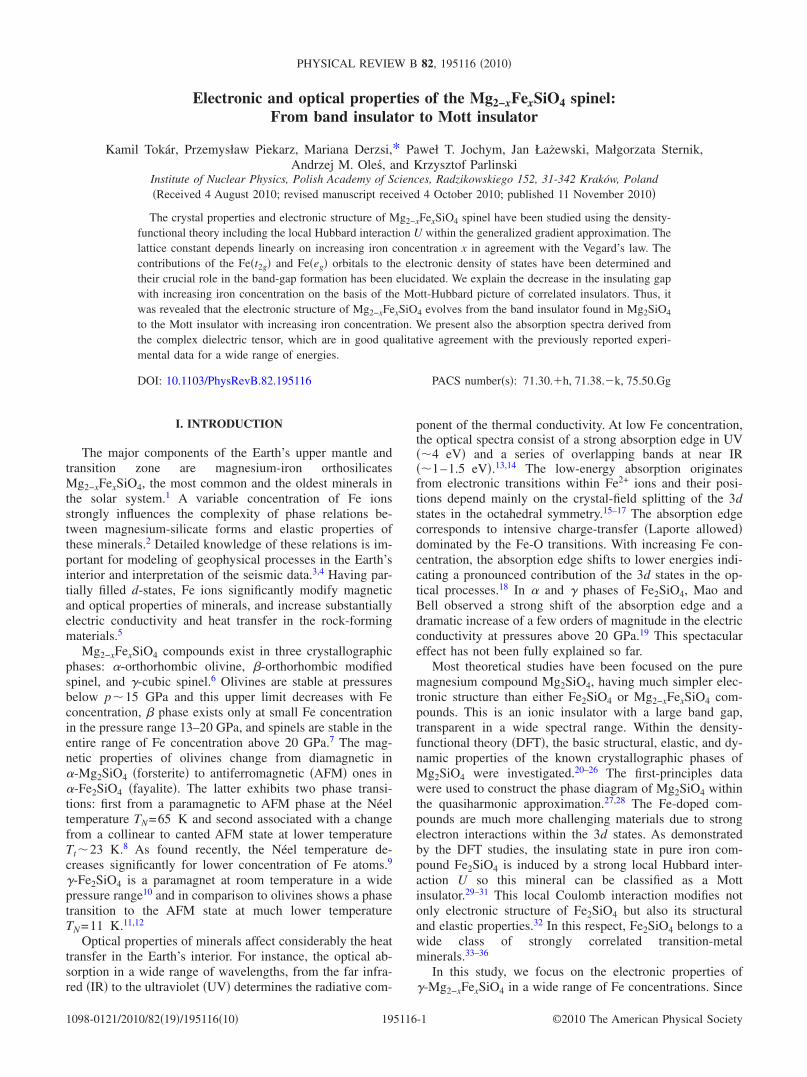
The starting point of our analysis is the electronic densityof states �EDOS� of Mg2SiO4 plotted in Fig. 3�a�. The va-
lence bands consist mainly of p states, separated from theunoccupied states by a large insulating gap Eg=5.8 eV. Thecontribution of s electrons to the valence bands is very small.Figure 3�b� presents the EDOS for the system doped withone Fe atom in the supercell of Fig. 1 �x=0.125�, obtainedfor U=J=0. The main effect of doping is the appearance ofthe 3d states within the insulating gap. Due to a small Feconcentration, these additional states have localized charac-ter and do not form bands. As expected, the states with thet2g and eg symmetries are split by the crystal field. Accordingto the Hund’s rule all up-spin t2g and eg states are occupiedand only one down-spin t2g state is filled. In addition, thedown-spin states are shifted with respect to up-spin states tohigher energies due to the exchange coupling. The highestoccupied state is marked by the vertical dashed line.
The effect of the local electron interactions on the EDOSis visible in Fig. 3�c�. It induces the change in position of all3d states: the occupied states are shifted to lower energiesand the empty ones move to higher energies. Thus, effec-tively the Hubbard interaction increases splitting between theoccupied and empty down-spin states. This rather strong in-crease is due to the contribution of the intraorbital Coulombinteraction U to the exchange splitting, which is neglected inthe standard electronic structure calculations,50 performedusing either the local density approximation or the GGA.When this correction is included in GGA+U, the exchangesplittings increase. They are not the same for each pair ofup-spin and down-spin orbital states, see Fig. 3�b�, but de-pend individually on the orbital type as seen in Fig. 3�c�. Thelarge splittings between up-spin and down-spin orbital states
-40
-20
0
20
40
Mg1.875
Fe0.125
SiO4
U = 0
(a)
sp
-40
-20
0
20
N(s
tate
s/eV
) eg
(b)
-8 -6 -4 -2 0 2 4 6 8 10 12E (eV)
-40
-20
0
20(c)
Mg2SiO
4
Mg1.875
Fe0.125
SiO4
U = 4.5 eV
t2g
t2g
eg
t2g
eg
t2g
t2g
t2g
eg
FIG. 3. �Color online� Comparison of the spin-projected EDOSof Mg2SiO4 �a� with the one obtained for Mg1.875Fe0.125SiO4
�x=0.125�, i.e., for one Fe atom in the supercell shown in Fig. 1:�b� U=0, and �c� U=4.5 eV. The energy E=0 corresponds to thehighest occupied p-state in Mg2SiO4.
ELECTRONIC AND OPTICAL PROPERTIES OF THE Mg… PHYSICAL REVIEW B 82, 195116 �2010�
195116-5
follow from the local Coulomb interaction U which is thelargest parameter here. While electrons are locally polarizedby Hund’s exchange and local moments form at Fe ions,50
such splittings are realistic and would be observed in photo-emission.
Interestingly, the lowest up-spin t2g state is shifted to theregion occupied by the p states �below E=0�, and due to thed-p hybridization acquires a band-like character. The 3dstates located above E=0 do not overlap with the p states,therefore, the electronic structure at small x clearly separatesinto two subsystems: the p bands �with small s contribution�and the 3d states localized inside the insulating gap. How-ever, when a more careful consideration is made, this simplepicture evolves into more complicated structure.
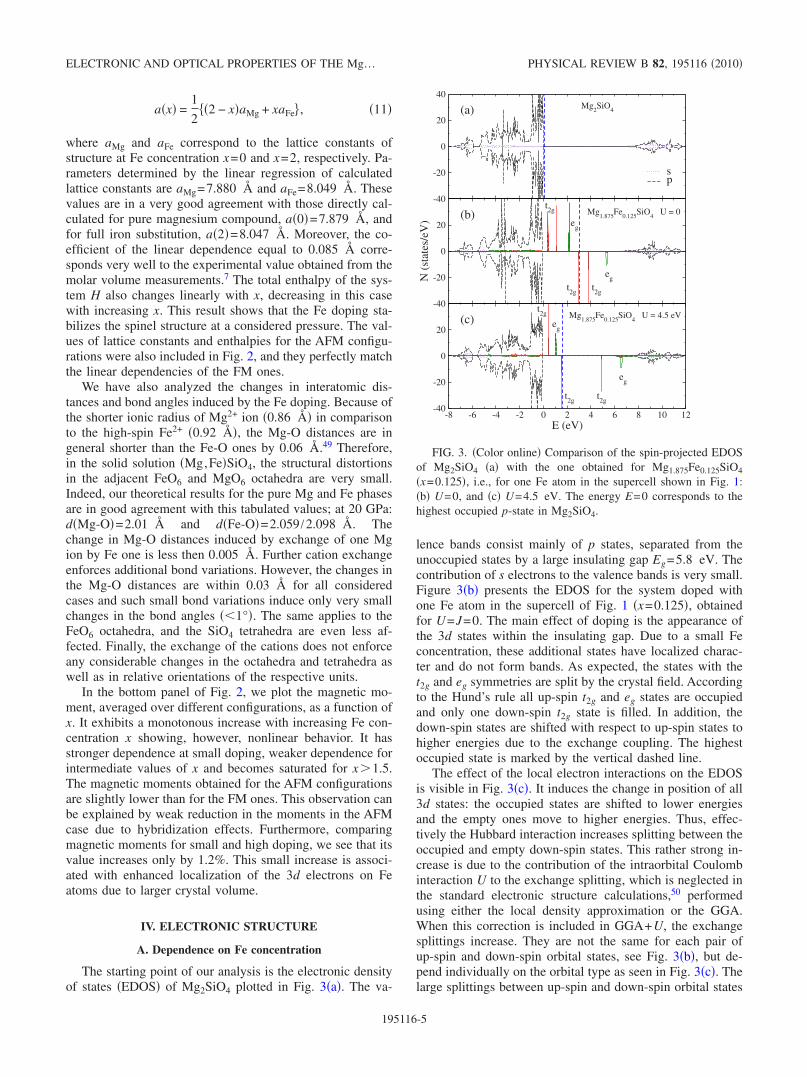
The comparison of electronic structures for several Feconcentrations obtained for U=4.5 eV and J=0.9 eV is pre-sented in a series of graphs in Fig. 4. Since the character ofthe electronic structure weakly depends on the particularatomic arrangement, for each concentration, we have chosenonly one representative configuration. With increasing num-ber of Fe ions, the contribution of the t2g and eg states intothe EDOS for both spin components becomes more pro-nounced. Due to the reduced average Fe-Fe distance theoverlap between the 3d states increases and the sharp peakstransforms into the bands. The occupied t2g states are sepa-
rated from the empty ones, so, a new insulating gap developsinside the wider p-band gap. This new d-band gap is muchsmaller than the p-band gap, and its magnitude decreasesmonotonically with the Fe doping.
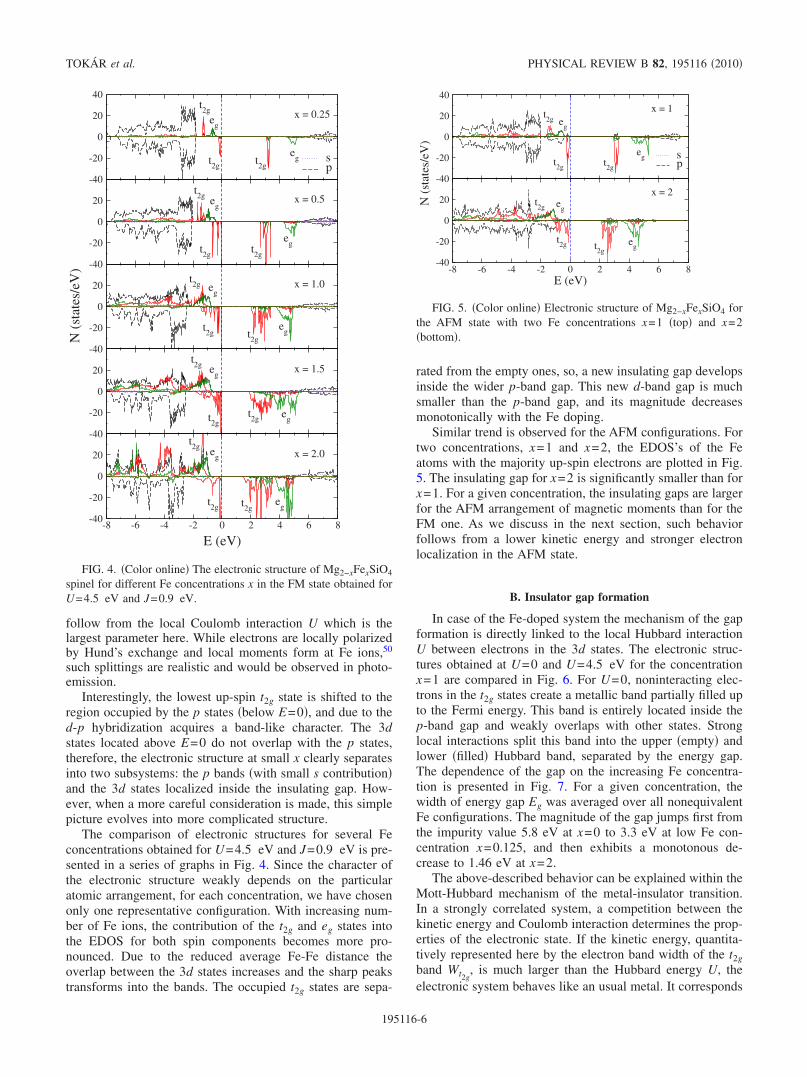
Similar trend is observed for the AFM configurations. Fortwo concentrations, x=1 and x=2, the EDOS’s of the Featoms with the majority up-spin electrons are plotted in Fig.5. The insulating gap for x=2 is significantly smaller than forx=1. For a given concentration, the insulating gaps are largerfor the AFM arrangement of magnetic moments than for theFM one. As we discuss in the next section, such behaviorfollows from a lower kinetic energy and stronger electronlocalization in the AFM state.
B. Insulator gap formation
In case of the Fe-doped system the mechanism of the gapformation is directly linked to the local Hubbard interactionU between electrons in the 3d states. The electronic struc-tures obtained at U=0 and U=4.5 eV for the concentrationx=1 are compared in Fig. 6. For U=0, noninteracting elec-trons in the t2g states create a metallic band partially filled upto the Fermi energy. This band is entirely located inside thep-band gap and weakly overlaps with other states. Stronglocal interactions split this band into the upper �empty� andlower �filled� Hubbard band, separated by the energy gap.The dependence of the gap on the increasing Fe concentra-tion is presented in Fig. 7. For a given concentration, thewidth of energy gap Eg was averaged over all nonequivalentFe configurations. The magnitude of the gap jumps first fromthe impurity value 5.8 eV at x=0 to 3.3 eV at low Fe con-centration x=0.125, and then exhibits a monotonous de-crease to 1.46 eV at x=2.
The above-described behavior can be explained within theMott-Hubbard mechanism of the metal-insulator transition.In a strongly correlated system, a competition between thekinetic energy and Coulomb interaction determines the prop-erties of the electronic state. If the kinetic energy, quantita-tively represented here by the electron band width of the t2gband Wt2g
, is much larger than the Hubbard energy U, theelectronic system behaves like an usual metal. It corresponds
-40
-20
0
20
40
x = 0.25
sp
-40
-20
0
20 x = 0.5
-40
-20
0
20 x = 1.0
-40
-20
0
20 x = 1.5
-8 -6 -4 -2 0 2 4 6 8
E (eV)
-40
-20
0
20 x = 2.0
N(s
tate
s/eV
)
t2g
t2g
t2g
eg
eg
t2g
t2g
t2g
eg
eg
t2g e
g
t2g t
2g
eg
t2g e
g
t2g
t2g e
g
t2g e
g
t2g t
2ge
g
FIG. 4. �Color online� The electronic structure of Mg2−xFexSiO4
spinel for different Fe concentrations x in the FM state obtained forU=4.5 eV and J=0.9 eV.
-40
-20
0
20
40
sp
-8 -6 -4 -2 0 2 4 6 8E (eV)
-40
-20
0
20
x = 1
x = 2
N(s
tate
s/eV
)
t2g
t2g t
2g
eg
eg
t2g e
g
t2g t
2ge
g
FIG. 5. �Color online� Electronic structure of Mg2−xFexSiO4 forthe AFM state with two Fe concentrations x=1 �top� and x=2�bottom�.
TOKÁR et al. PHYSICAL REVIEW B 82, 195116 �2010�
195116-6

to the situation depicted in Fig. 6�a�, where U=0 and theelectronic structure is dominated by the kinetic energy of t2gelectrons. In this case the metallic band consists of only thedown-spin states. When the local Coulomb energy dominatesover the kinetic energy �U�Wt2g
�, the electron system be-comes an insulator, see Fig. 6�b�. In the most common case,the insulating gap Eg depends on two parameters U and bandwidth W. In the considered system, we have to include inaddition the Hund’s coupling for parallel spins and to replacethe parameter U by its effective value UeffU−J, while therelevant band width is given by t2g electrons, WWt2g
.Within this approach the insulating gap can be evaluated as afunction of x using the following formula:
Eg�x� = Ueff −1
2Wt2g
�x� = U − J −1
2Wt2g
�x� , �12�
where Wt2g�x� is the width of the down-spin t2g band calcu-
lated for the metallic state at U=0 for a given x. It followsfrom Eq. �12� that the insulating gap is formed provided thatUeff�
12Wt2g
.In our calculations, we assumed that both parameters U
and J do not depend on x, hence the decrease of Eg withdoping is associated only with the increase in the band widthWt2g
�x� with doping. This effect can be easily understoodusing simple arguments. In the tight-binding approximationused in the Hubbard model, the band width is proportional tothe effective overlap �hopping� integral t between the elec-tron 3d orbitals at neighboring sites W=2zt, where z is thecoordination number. With doping, the average Fe-Fe dis-tance decreases, and the hopping t is gradually enhanced. Incontrast, due to stronger localization of electrons in the AFMstates, the hopping is then smaller, resulting in a reducedband width and larger band gap �see Fig. 5�.
The insulating gaps obtained from direct calculations andfrom Eq. �12� are compared in Fig. 7. For the FM configu-rations, the average values �connected by the lines� showsimilar monotonic dependence on x. A much better agree-ment was found for small values of Fe concentrations �x�1�. For larger x, the insulating gaps obtained from Eq. �12�are larger than the values derived from the electronic struc-ture. In Fig. 7, we included also the insulating gaps of twoAFM configurations obtained for x=1 and x=2. For x=2, thedirect gap equals to 2.17 eV and compares very well with thevalue estimated from Eq. �12�, Eg=2.08 eV. We can con-clude that for larger Fe concentration �x�1�, the formulagiven in Eq. �12� describes much better the insulating gap inthe AFM state with strong localization of t2g electrons thanthe one in the FM state.
Finally, we investigate the effect of crystal compressionon the magnitude of band gap considering pressures of 0, 10,20, and 30 GPa. Since the observed effects under compres-sion are more pronounced at higher Fe concentration,19 we
0 5 10 15 20 25 30p (GPa)
1.2
1.4
1.6
1.8
2.0
2.2
2.4
2.6
Eg
(eV
)
AFFM
FIG. 8. �Color online� Dependence of the energy band gap Eg onpressure p, as obtained for Fe2SiO4 for the AFM �solid line� andFM �dashed line� configuration.
-40
-20
0
20
40
Wt2g
N(s
tate
s/eV
)
t2g
t2g
eg
eg
t2g e
g
eg
t2g t
2g
sp
-10 -8 -6 -4 -2 0 2 4 6 8 10
E (eV)
-40
-20
0
20
MgFeSiO4
U = 0
U = 4.5 eV
(a)
(b)
FIG. 6. �Color online� Comparison of the EDOS for MgFeSiO4
�x=1� obtained in: �a� the GGA, i.e., neglecting local Coulombinteractions �U=0� and �b� for realistic local Coulomb interactionswith U=4.5 eV.
0.00 0.25 0.50 0.75 1.00 1.25 1.50 1.75 2.00
x
1
2
3
4
5
6
Eg
(eV
)
FMFM [Eq. (12)]FM averageFM average [Eq. (12)]AFMAFM [Eq. (12)]
FIG. 7. �Color online� Dependence of the energy gap on the Feconcentration. Triangles up and down are the values of the gap forthe FM state obtained directly from EDOS and calculated from Eq.�12�, respectively. Squares and circles represent the insulating gapsfor the AFM configuration obtained from EDOS and from Eq. �12�,respectively. The lines connecting the average values of the gap areguides to the eye.
ELECTRONIC AND OPTICAL PROPERTIES OF THE Mg… PHYSICAL REVIEW B 82, 195116 �2010�
195116-7

have performed calculations only for Fe2SiO4. AlthoughFe2SiO4 spinel is stable only at high pressures �above 20GPa�, it can exist in metastable states also at ambient condi-tions. One finds that the energy gap Eg decreases with in-creasing pressure both for the FM and AFM configuration,see Fig. 8. The mechanism is similar to that explaining thedoping dependence of the gap. Higher pressure reduces in-teratomic distances, thus enhances the overlap of the 3dstates and increases the band width Wt2g
. Consequently, asfollows from Eq. �12�, the energy gap decreases with pres-sure. This effect is stronger for the FM configuration, whichis characterized by the larger band width and its strongerpressure dependence. In addition, weaker localization ofelectrons in the FM configuration results in the lower valuesof the gap than in the AFM one.
V. ABSORPTION SPECTRA
In this section, we study the absorption spectra ofMg2−xFexSiO4 as a function of increasing Fe concentration.Since the crystal is cubic and the magnetic state does notbreak this symmetry, the absorption in all main directions isthe same, and we present only one diagonal component ofthe absorption coefficient calculated by Eq. �10�. The off-diagonal components, which result from the broken cubicsymmetry in the doped system, are much smaller and willnot be discussed here.
First we consider the absorption spectrum ofMg1.875Fe0.125SiO4. The absorption intensity � exhibits abroad maximum due to the excitations to the unoccupied pstates in a wide range of energies �0–30 eV�, see Fig. 9�a�.This main spectral weight, connected with the absorptionedge in the UV, starts to grow fast above 6 eV, in goodagreement with the experimental observations.17
The intensity arising from the 3d states below the bandgap is low, both due to low doping x=0.125 and due to lowkinetic energy of strongly correlated 3d electrons. It is inter-esting to analyze in more detail the low-energy bands, shown
in Fig. 9�b�. They correspond to d-d transitions between thecrystal-field split states, or could arise from the excitations toHubbard subbands in a strongly correlated oxide.51 Herethese excitations occur in the low doping regime, and couldbe thus interpreted as local transitions between the crystal-field split states. We recognize two maxima, one close to 1.8eV, and the other one close to 3.5 eV. The energy of thelower two-peak structure, which we associate as arising fromtwo t2g→eg transitions, depends on the Hubbard interactionU. Comparing with the experimental values 1.12 and 1.73eV,17 denoted in Fig. 9�b� by the dashed lines, we remark thatthe obtained energies at 1.57 and 1.98 eV for U=4.5 eV, areshifted upward by 40% and 14%, respectively. These energyshifts result from the overestimation of the crystal field eg
− t2g splitting. In contrast, the obtained splitting of the t2g
states �0.41 eV� is smaller than the experimental value �0.61eV�, indicating a smaller octahedral distortion. Additionally,we found a peak around 3.5 eV, which likely corresponds toa t2g→ t2g transition. For U=0, one finds the two-peak struc-ture at energy close to 3 eV which occurs at higher energybut resembles the excitation found with U=4.5 eV. Forcomparison, we included in Fig. 9�b� the absorption spec-trum of Mg2SiO4. Since no low-energy transitions exist inthis case, the main spectral weight appears above the energygap at �6.0 eV.
In Fig. 10, we present the dependence of the absorptionspectra on Fe concentration. The most visible changes hap-pen at low energies, where the transitions between the dstates dominate. The intensity of the characteristic two-peakband increases with increasing Fe concentration x and thisstructure becomes much broader. These changes correspondwell to experimentally observed increase in absorption in-duced by Fe atoms.18 For larger x, the absorption edgeslightly shifts to low energies, although its position is athigher energy than the experimental value ��4 eV�. As sug-gested in Ref. 30, the observed discrepancy between thetheory and experiment may be connected with the excitonictransitions not properly included in the calculations.
0 2 4 6 8 10 12 14 16 18 20 22 24 26 28 30
E (eV)
0
10
20
30
40
50
60α
(arb
.uni
ts)
(a)
0 1 2 3 4 5 6 7 8
E (eV)
0
1
2
3
4
5
α(a
rb.u
nits
)
U = 0U = 4.5 eVMg
2SiO
4
(b)
FIG. 9. Absorption intensity � for Mg1.875Fe0.125SiO4 as obtained: �a� for U=4.5 eV in a wide energy range and �b� at low energies forU=0 �dashed line� and U=4.5 eV �solid line�. The band gap given by p states in Mg2SiO4 is indicated by the onset of absorption at�6.0 eV, as shown in �b� by dotted line. The two vertical lines in �b� denote the positions of the experimental peaks given in Ref. 17.
TOKÁR et al. PHYSICAL REVIEW B 82, 195116 �2010�
195116-8

VI. SUMMARY AND CONCLUSIONS
In summary, we have studied the structural and electronicproperties of the spinel phase of Mg2−xFexSiO4 at high pres-sure, using the DFT approach. We have found that the latticeconstant and enthalpy depend linearly on Fe concentration x.In contrast, magnetic moments in both the FM and AFMstates of Mg2−xFexSiO4 increase with x faster at low concen-tration and next saturate for x�1.5. However, the changes inthe moments are small as expected in presence of large Cou-lomb interactions which almost localize 3d electrons.
By calculating and analyzing the electronic structure forvariable Fe concentration, we have established an interestingexample of the evolution of the gap from the band p gap forthe insulating state in Mg2SiO4 to the correlated Mott-Hubbard gap in Fe2SiO4. The energy gap decreases monoto-nously from 5.8 to 1.5 eV with increasing Fe concentration
from x=0 to x=2, with a rapid decreases at low values of xwhere the gap between 3d states takes over. At small doping,the 3d Fe states are strongly localized and have energieswithin the band p gap—thus they do not overlap with theother states. With increasing doping, however, effective d-dtransitions between neighboring Fe ions become possible andthe above localized states transform into the t2g and eg bands.
Due to strong electron interactions, a new insulating gapemerges inside the larger band gap given by p states. It sepa-rates the occupied and empty t2g states. The decrease in thisinsulting d-gap at larger Fe concentration is caused by theenhanced electron mobility and the increasing width of t2gband when Fe concentration increases. As our calculationsshow, the same effect is induced by external pressure, and itmay explain, at least partially, a strong increase in the elec-trical conductivity observed in the compressed Fe2SiO4.19
Finally, the calculated absorption spectra at low Fe con-centration show a good qualitative agreement with the avail-able experimental data. Furthermore, a systematic enhance-ment of spectral intensity at low energies with increasing xvery well corresponds to changes observed in the opticalabsorption. However, one should realize that the independentparticle approximation used in the present calculations doesnot describe properly the many-body effects, such as thoseleading to intersite d-d excitations discussed in Ref. 51.These excitations will also contribute to the absorption in thelow-energy range and their role could be established by fu-ture experiments.
ACKNOWLEDGMENTS
This research was supported by Marie Curie Research andTraining Network under Contract No. MRTN-CT-2006-035957 project c2c �crust to core� and Polish Ministry ofScience and Education under Grant No. 541/6.PR UE/2008/7. A.M.O. acknowledges support by the Foundation forPolish Science �FNP� and by the Polish Ministry of Scienceand Higher Education under Project No. N202 104138.
*Present address: University of Warsaw, Interdisciplinary Centrefor Mathematical and Computational Modeling, Pawinskiego 5a,02-106 Warsaw, Poland.1 R. M. Hazen, D. Papineau, W. Bleeker, R. T. Downs, J. M.
Ferry, T. J. McCoy, D. A. Sverjensky, and H. Yang, Am. Min-eral. 93, 1693 �2008�.
2 J. R. Smyth and T. Kawamoto, Earth Planet. Sci. Lett. 146, E9�1997�.
3 A. M. Dziewonski, A. L. Hales, and E. R. Lapwood, Phys. EarthPlanet. Inter. 10, 12 �1975�.
4 D. L. Anderson, Theory of the Earth �Blackwell Scientific, Bos-ton, 1989�.
5 A. F. Goncharov, V. V. Struzhkin, and S. D. Jacobsen, Science312, 1205 �2006�.
6 A. M. Dziewonski and D. L. Anderson, Phys. Earth Planet. Inter.25, 297 �1981�.
7 M. Akaogi, E. Ito, and A. Navrotsky, J. Geophys. Res. 94,15,671 �1989�; T. Katsura and E. Ito, ibid. 94, 15,663 �1989�; E.
Ito and E. Takahashi, ibid. 94, 10,637 �1989�.8 R. P. Santoro, R. E. Newnham, and S. Nomura, J. Phys. Chem.
Solids 27, 655 �1966�; R. A. Robie, C. B. Finch, and B. S.Hemingway, Am. Mineral. 67, 463 �1982�; Q. Williams, E.Knittle, R. Reichlin, S. Martin, and R. Jeanloz, J. Geophys. Res.95, 21549 �1990�.
9 F. Belley, E. C. Ferré, F. Martín-Hernández, M. J. Jackson, M.Darby Dyar, and E. J. Catlos, Earth Planet. Sci. Lett. 284, 516�2009�.
10 I. Choe, R. Ingalls, J. M. Brown, and Y. Sato-Sorensen, Phys.Chem. Miner. 19, 236 �1992�.
11 K. Suito, Y. Tsutsui, S. Nasu, A. Onodera, and F. E. Fujita,Mater. Res. Soc. Symp. Proc. 22, 295 �1984�.
12 W. Yong, E. Dachs, and A. C. Withers, Phys. Chem. Miner. 34,121 �2007�.
13 R. G. Burns, Am. Mineral. 55, 1608 �1970�.14 W. A. Runciman, D. Sengupta, and J. T. Gourley, Am. Mineral.
58, 451 �1973�.
0 1 2 3 4 5 6 7 8 9 10 11 12
E (eV)
0
2
4
6
8
10
12
14
16
18
20
22
24
α(a
rb.u
nits
)
x = 2.0x = 1.0x = 0.5x = 0.25x = 0.125
FIG. 10. �Color online� Absorption intensity � as obtained forMg2−xFexSiO4 with different Fe concentration x=2.0, 1.0, 0.5, 0.25,and 0.125, from top to bottom.
ELECTRONIC AND OPTICAL PROPERTIES OF THE Mg… PHYSICAL REVIEW B 82, 195116 �2010�
195116-9

15 G. Smith and K. Langer, Am. Mineral. 67, 343 �1982�.16 M. N. Taran and K. Langer, Phys. Chem. Miner. 28, 199 �2001�.17 H. Keppler and J. R. Smyth, Am. Mineral. 90, 1209 �2005�.18 M. N. Taran, M. Koch-Muller, R. Wirth, I. Abs-Wurmbach, D.
Rhede, and A. Greshake, Phys. Chem. Miner. 36, 217 �2009�.19 H. K. Mao and P. M. Bell, Science 176, 403 �1972�.20 B. Kiefer, L. Stixrude, and R. M. Wentzcovitch, Geophys. Res.
Lett. 24, 2841 �1997�.21 J. Łażewski, P. T. Jochym, K. Parlinski, and P. Piekarz, J. Mol.
Struct. 596, 3 �2001�.22 P. Piekarz, P. T. Jochym, K. Parlinski, and J. Łażewski, J. Chem.
Phys. 117, 3340 �2002�.23 P. T. Jochym, K. Parlinski, and P. Krzywiec, Comput. Mater. Sci.
29, 414 �2004�.24 Y. G. Yu and R. M. Wentzcovitch, J. Geophys. Res. 111, B12202
�2006�.25 Z. Wu and R. M. Wentzcovitch, J. Geophys. Res. 112, B12202
�2007�.26 K. Tokár, P. T. Jochym, K. Parlinski, J. Łażewski, P. Piekarz, and
M. Sternik, J. Phys.: Condens. Matter 22, 145402 �2010�.27 Y. G. Yu, Z. Wu, and R. M. Wentzcovitch, Earth Planet. Sci. Lett.
273, 115 �2008�.28 G. Ottonello, B. Civalleri, J. Ganguly, M. Vetuschi Zuccolini,
and Y. Noel, Phys. Chem. Miner. 36, 87 �2009�.29 M. Cococcioni, A. Dal Corso, and S. de Gironcoli, Phys. Rev. B
67, 094106 �2003�.30 X. Jiang and G. Y. Guo, Phys. Rev. B 69, 155108 �2004�.31 M. Derzsi, P. Piekarz, P. T. Jochym, J. Łażewski, M. Sternik, A.
M. Oleś, and K. Parlinski, Phys. Rev. B 79, 205105 �2009�.32 S. Stackhouse, L. Stixrude, and B. B. Karki, Earth Planet. Sci.
Lett. 289, 449 �2010�.33 P. Piekarz, K. Parlinski, and A. M. Oleś, Phys. Rev. Lett. 97,
156402 �2006�; Phys. Rev. B 76, 165124 �2007�.34 P. Piekarz, A. M. Oleś, and K. Parlinski, Acta Phys. Pol. A 118,
307 �2010�.
35 A. J. Devey, R. Grau-Crespo, and N. H. de Leeuw, Phys. Rev. B79, 195126 �2009�.
36 S. H. Lee, H. Takagi, D. Louca, M. Matsuda, S. Ji, H. Ueda, T.Katsufuji, J.-H. Chung, S. Park, S.-W. Cheong, and C. Broholm,J. Phys. Soc. Jpn. 79, 011004 �2010�.
37 P. E. Blöchl, Phys. Rev. B 50, 17953 �1994�; G. Kresse and D.Joubert, ibid. 59, 1758 �1999�.
38 G. Kresse and J. Furthmüller, Software VASP, Vienna �1999�;Phys. Rev. B 54, 11169 �1996�; Comput. Mater. Sci. 6, 15�1996�.
39 J. P. Perdew, K. Burke, and M. Ernzerhof, Phys. Rev. Lett. 77,3865 �1996�.
40 H. J. Monkhorst and J. D. Pack, Phys. Rev. B 13, 5188 �1976�.41 A. M. Oleś, Phys. Rev. B 28, 327 �1983�.42 M. Fleck, A. M. Oleś, and L. Hedin, Phys. Rev. B 56, 3159
�1997�.43 V. I. Anisimov, J. Zaanen, and O. K. Andersen, Phys. Rev. B 44,
943 �1991�; A. I. Liechtenstein, V. I. Anisimov, and J. Zaanen,ibid. 52, R5467 �1995�.
44 J. Zaanen and G. A. Sawatzky, J. Solid State Chem. 88, 8�1990�.
45 A. D. Becke, J. Chem. Phys. 98, 5648 �1993�.46 I. de P. R. Moreira, F. Illas, and R. L. Martin, Phys. Rev. B 65,
155102 �2002�; M. Alfredsson, G. D. Price, C. R. A. Catlow, S.C. Parker, R. Orlando, and J. P. Brodholt, ibid. 70, 165111�2004�.
47 L. Vegard, Z. Kristallogr. 67, 238 �1928�.48 A. R. Denton and N. W. Ashcroft, Phys. Rev. A 43, 3161 �1991�.49 See homepage: http://www.webelements.com50 G. Stollhoff, A. M. Oleś, and V. Heine, Phys. Rev. B 41, 7028
�1990�; Phys. Rev. Lett. 76, 855 �1996�.51 G. Khaliullin, P. Horsch, and A. M. Oleś, Phys. Rev. B 70,
195103 �2004�; A. M. Oleś, G. Khaliullin, P. Horsch, and L. F.Feiner, ibid. 72, 214431 �2005�.
TOKÁR et al. PHYSICAL REVIEW B 82, 195116 �2010�
195116-10