Barrier crossing driven by Lévy noise: Universality and the role of noise intensity
Upload
khangminh22Category
view
0download
0
1
Universality of the Mott-Ioffe-Regel limit in metals
N. E. Hussey1, K. Takenaka2 and H. Takagi2,3
1H. H. Wills Physics Laboratory, University of Bristol, Tyndall Avenue, Bristol, BS8 1TL, U. K. 2RIKEN (Institute of Physical and Chemical Research), Wako-shi, Saitama 351-0198, Japan.
3Department of Advanced Materials Science, Graduate School of Frontier Sciences,
University of Tokyo, Kashiwa-no-ha 5-1-5, Kashiwa-shi, Chiba 277-8651, Japan.
The absence of resistivity saturation in many strongly correlated metals, including the high-
temperature superconductors, is critically examined from the viewpoint of optical conductivity
measurements. Coherent quasiparticle conductivity, in the form of a Drude peak centred at
zero frequency, is found to disappear as the mean free path (at ω = 0) becomes comparable
to the interatomic spacing. This basic loss of coherence at the so-called Mott-Ioffe-Regel
(MIR) limit suggests that the universality of the MIR criterion is preserved even in the
presence of strong electron correlations. We argue that the shedding of spectral weight at low
frequencies, induced by strong correlation effects, is the primary origin of the extended
positive slope of the resistivity to high temperatures observed in all so-called ‘bad metals’.
Moreover, in common with those metals which exhibit resistivity saturation at high
temperatures, the scattering rate itself, as extracted from optical spectra, saturates at a value
consistent with the MIR limit. We consider possible implications that this ceiling in the
scattering rate may have for our understanding of transport within a wide variety of bad
metals and suggest a better method for analysing their optical response.
1. INTRODUCTION
Our most basic definition of a metal is a material whose resistivity ρ increases with
temperature T. Within the quasiparticle concept, this is equivalent to saying that the mean-
free-path , i.e. the average distance a quasiparticle travels between collisions, becomes
progressively shorter as the number of thermally-induced scattering events grows. In ordinary
metals, phonons are the dominant scatterer at high temperatures and accordingly, ρ(T) is
found to increase linearly with T above some typical phonon energy. In considering the
problem of low mobilities in certain semiconductors, Ioffe and Regel (1960) realized that a
metallic state cannot survive this reduction in indefinitely. They argued that can never
become shorter than the interatomic spacing a, since at that point the concept of carrier
velocity is lost and all coherent quasiparticle motion vanishes. Similar arguments were later
expressed by Mott (1972) and the notion of a minimum metallic conductivity compatible with a
minimum mean free path min = a [Gurvitch 1981] became known as the Mott-Ioffe-Regel
(MIR) limit. The precise numerical definition of the limit is not generally agreed upon; criteria
ranging from kFmin ~ 1 through min ~ a to kFmin ~ 2π have all been employed (here kF is the
Fermi wave vector), but for the purposes of this paper we assume it to be min ~ a.

2
Perhaps the most striking manifestation of the MIR criterion (i.e. > a) is the phenomenon of
resistivity saturation. In certain highly-resistive elements, alloys and intermetallic compounds,
ρ(T) deviates from linearity at high T, its T-dependence becoming progressively weaker as
ρ(T) approaches a constant value in the region 100 – 200 µΩcm consistent with min ~ a
[Mooij 1973, Fisk and Webb 1976]. In many compounds, this approach to saturation is found
to follow a simple parallel-resistor formula (PRF) [Wiesmann et al. 1977],
( ) ( ) satideal
111ρρρ
+=TT
(1)
Here, ρideal is the ideal resistivity that would be expected in the absence of saturation, e.g.
from Boltzmann transport theory, and ρsat the maximum resistivity corresponding to min = a.
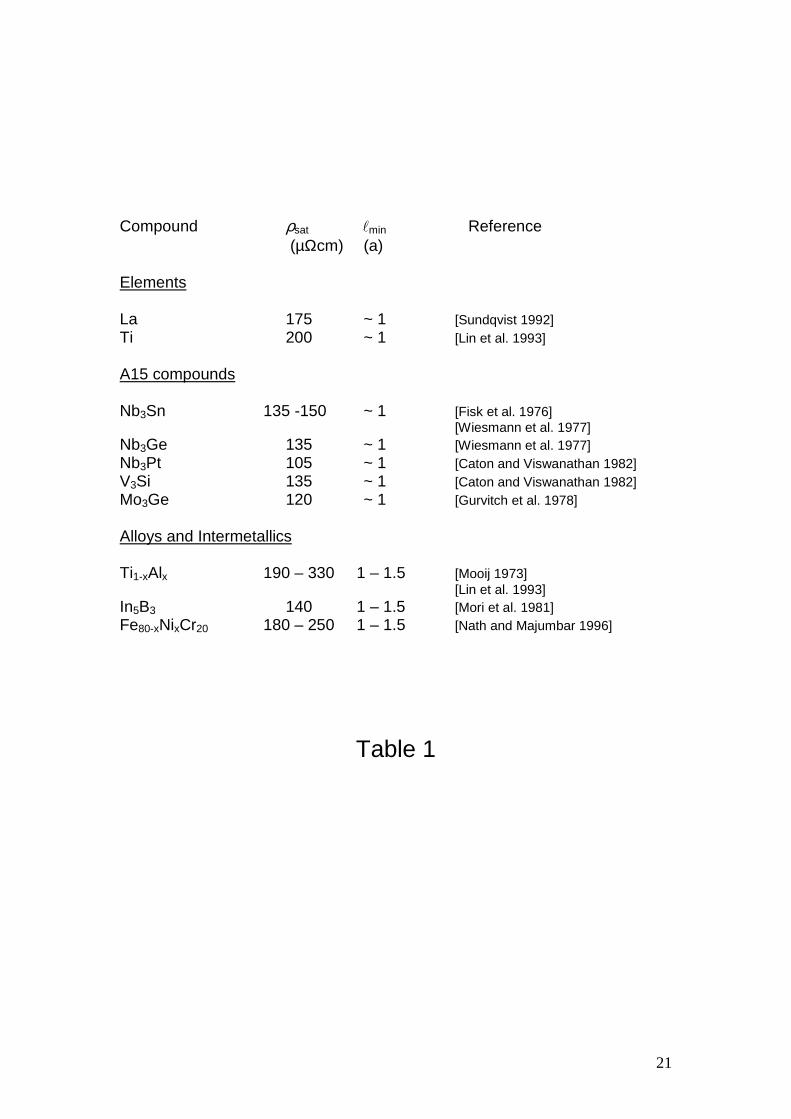
Table I contains a selection of elements and compounds for which equation (1) has been
applied (in each case successfully) to describe the functional form of ρ(T) in its approach to
saturation. The second and third columns give respectively the corresponding values of ρsat
and min (in units of a). The list is by no means exhaustive and while there have been
numerous attempts to explain the origin of the PRF (for an excellent critique of the exisitng
theoretical literature, see Allen (1980), Gurvitch (1983) and Gunnarsson et al. (2003)), its
ability to describe the approach to the MIR limit does not appear in doubt. Indeed, in his
review of resistivity saturation, Allen (1980) remarked that both the PRF and resistivity
saturation (at the MIR limit) should be universal properties of all metals, irrespective of the
strength of coupling to the scattering entities. In good metals of course, >> a at all
experimentally accessible temperatures (right up to the melting point Tm). Hence, ρideal is
never more than a fraction of ρsat and the full resistivity curve can be adequately described by
a conventional Boltzmann-type approach. Even in good metals however there are instances
where the electron temperature has been elevated above Tm, e.g. in Al using pulsed lasers
[Milchberg 1988], and ρ(T) once again is found to saturate at a value consistent with min ~ a.
While at the time Allen’s conjecture appeared genuine, the physical significance of the PRF
with its apparent second conduction channel remained controversial. The original arguments
of Mott, Ioffe and Regel had been developed for elastic scattering in disordered materials. It
was not immediately obvious why a high scattering rate caused by strong inelastic scattering
at high temperatures would have a similar effect. Moreover, around the same time as the
experiment of Milchberg et al. (1988) on Al, a new form of metallicity was emerging that
seemed to challenge all previous reasoning. In the then newly discovered high temperature
superconductors, ρ(T) was found to grow approximately linearly with T up to Tm ~ 1000 K
without any sign of saturation. In the process, ρ(T) attained values between 1 and 10 mΩcm,
more than one order of magnitude higher than ρsat of typical metals, corresponding to << a

3
[Gurvitch and Fiory 1987]. Since this clearly invalidated conventional Boltzmann theory, the
absence of resistivity saturation was swiftly acknowledged as a possible signature of novel
non-Fermi liquid (non-FL) behaviour.
Such non-saturating ρ(T) has since been registered in a wide range of strongly correlated
systems, both inorganic and organic. Collectively, they have come to be referred to as ‘bad
metals’ [Emery and Kivelson 1995]. Their anomalous behaviour has reinvigorated the debate
on resistivity saturation and new theoretical ideas have begun to emerge. Most recently, the
inclusion of strong correlation effects, both within dynamical mean-field theory (DMFT)
[Merino and McKenzie 2000] and the t-J model [Calandra and Gunnarsson 2003], have been
demonstrated to yield resistivities beyond the MIR limit. In the process, the importance of
extending the analysis into the frequency (optical) domain, that covers a much wider range of
(photon) energies up to and beyond the bandwidth W >> kBTm, has been recognised
[Rozenberg et al. 1995, Merino and McKenzie 2000, Calandra and Gunnarsson 2003].
In this paper we explore further the issue of resistivity saturation from the perspective of
optical conductivity data. We argue that whilst the DMFT and t-J models can explain several
aspects of the evolution of σ(T,ω) spectra in bad metals, the key feature of their optical
response is in fact a suppression of low-frequency spectral weight that sets in well before ρ(T)
shows any sign of saturation [Kostic et al. 1998, Takenaka et al. 2002a, b]. An empirical
relation between the loss of coherence and a critical value of σ(T,0) is established [Takenaka
et al. 2002a, b], making the MIR criterion relevant to the transport dynamics of all metals,
even those with strong electron correlations. As we shall show, the term ‘bad metal’ turns out
to be something of a misnomer. In the search for a possible explanation for this loss of
coherence, we consider the various energy scales and scattering processes which distinguish
those metals that exhibit resistivity saturation and those that do not. Finally, we examine
extending the PRF-style analysis into the optical domain, in both saturating and non-
saturating metals, and discuss what implications saturation in the (ω-dependent) scattering
rate Γ(T,ω) has on our understanding of the intrinsic nature of Γ(T,ω) in high-Tc cuprates.
The paper is organised as follows: In section 2, we broaden our discussion of resistivity
saturation to encompass the heavy-fermion (HF) metals for which σ(T,ω) data are available
over a broad range of temperatures and frequencies. The observation of conductivity
saturation (at the MIR limit) in HF systems is particularly significant, as will become apparent
in section 3 where we investigate the ‘violation’ of the MIR criterion in other strongly
correlated metals. In section 4, we analyse the relative importance of different factors that
can lead to bad metallic behaviour and extend the PRF analysis into the realm of finite
frequencies. Our concluding remarks are presented in section 5.

4
2. HEAVY FERMION METALS
The optical conductivity of a metal can be decomposed into a collection of Lorentz harmonic
oscillators plus a Drude peak to low ω. The former contributions arise from absorption at finite
frequency, e.g. due to vibrational infrared active modes (phonons) and/or to electronic
interband transitions. The Drude term describes the coherent quasiparticle contribution to the
electrodynamic response. The peak is centred at ω = 0 but extends out to frequencies of
order the carrier containing bandwidth W from which point interband transitions dominate σ(ω).
In a conventional metal, the Drude peak broadens with increasing T, with a width at half-
maximum equal to the mean scattering rate Γ, but crucially, persists for all T < Tm. The issue
of what happens to the Drude term as one approaches the MIR limit, i.e. in the regime where
Γ becomes of order W, has received little attention, largely due to the fact that in typical
saturating metals, the saturation regime appears well above the temperature limit for
conventional optical spectrometers. Indeed, complementary optical measurements have yet
to be performed on any of those systems listed in table 1. There is one family of compounds
however, namely the HF metals, where ρ(T) does saturate well below room temperature and
therefore whose optical response can be studied in the saturation limit. Being strongly
correlated systems themselves, the HF metals also form a unique bridge between metals that
show resistivity saturation and the bad metals, to be discussed in section 3, that do not.
At high T, HF metals behave as a weakly interacting ensemble of localized f-electrons and
mobile d-electrons of moderate bandwidth and effective mass. As T is lowered below a
certain coherence temperature Tcoh, the f-electron spins become strongly coupled to the
conduction electrons and to one another via exchange spin-flip. This coupling leads to the
development of an extremely sharp resonance in the density of states at the Fermi level εF
and strong upward renormalization of the conduction-electron effective mass m* by as much
as three orders of magnitude [Fisk et al. 1988].
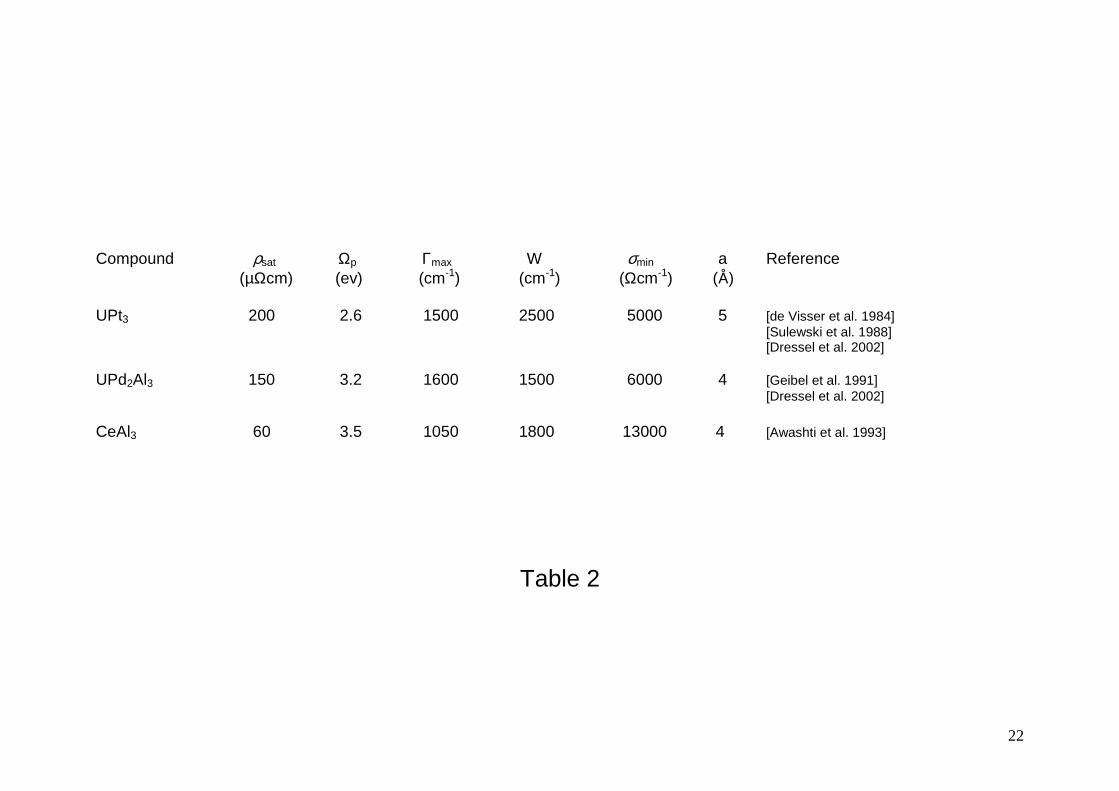
Table 2 lists various parameters extracted from ρ(T) and σ(T,ω) measurements on three
representative HF compounds, the 5f compounds UPt3 and UPd2Al3 and 4f CeAl3. The
electrical resistivities of these compounds show the generic behaviour of HF metals; a
surprisingly low residual resistivity ρ0, a large T2 coefficient at low T and a saturation that sets
in well below 300 K with ρsat values (60 - 200 µΩcm) comparable to those seen in other
saturating metals (see table 1). In some cases, the resistivity also shows a broad maximum
around T = Tcoh, presumably due to competing T-dependencies in n, m* and Γ around Tcoh.
Optical conductivity measurements carried out on these systems reveal intriguing signatures
of conductivity saturation in the frequency domain. In UPt3 and UPd2Al3 for example, σ(T,ω) at
300K is characterized by a flat, essentially featureless spectrum that extends all the way up to
W ~ 0.3 eV [Sulewski et al. 1988]. The magnitude of the conductivity there is ~ 5000 and

5
6000 (Ωcm)-1 respectively, in good agreement with the observed dc ρsat. Whilst in CeAl3,
optical conductivity data have only been taken up to Tcoh = 10K [Geibel et al. 1991], ρ(T) at
this temperature is approaching already the saturation limit and the 10K spectra show many
features qualitatively similar to those seen in the 300K spectra of UPt3 and UPd2Al3.
In analyzing such spectra, it has become increasingly common practice to employ the so-
called generalized or extended Drude analysis which introduces a ω-dependent scattering
rate Γ(ω) [Allen and Mikkelsen 1977]. For HF metals, Γ(ω) ~ ω 2 at low T and low ω, mirroring
the T2 form of the resistivity. At high ω, Γ(ω) is found to saturate at a value Γmax where W/2 <
Γmax < W (see table 2). As T increases, Γ(ω) merges into Γmax though Γmax itself does not
change appreciably with temperature. This latter observation is particularly significant as it
implies that Γmax represents some fundamental ceiling in the scattering rate of such saturating
metals. The flat spectrum at high T can thus be viewed as direct evidence for Γ becoming
comparable (though not exceeding) W.
The essence of the optical response of HF metals was captured in a seminal work by Millis
and Lee (1987) in which they considered a band of nearly free electrons hybridizing with a
highly correlated band of f-electrons within a lattice Anderson Hamiltonian in the Kondo limit
(see Degiorgi (1999) for a review). At low T and ω, where impurity scattering dominates,
( ) ( ) ( )2
2
222
2
*1
***1 ωτ
ττω
τωσ+
=+
=mne
mmmne
bb
(2)
where mb is the bare optical mass and 1/τ* = 1/τ (mb/m*) is the renormalized scattering rate in
the highly-correlated coherent state that gives rise to the narrow Drude response.
At larger ω, the coupling of itinerant (heavy) electrons to the spin-fluctuation spectrum leads
first to a strong ω2-dependence in the scattering rate and ultimately to a frequency-
independent (i.e. saturated) conductivity of the form
( ) ( ) Wmne
mmNmne
bFbb
2
*
2
~*1
~ε
ωσ (at low T). (3)
Here N is the orbital degeneracy of the f state and εF* the renormalized Fermi energy of order
the Kondo temperature TK. Note that this form for the conductivity corresponds to a flat
spectrum of width W, consistent with a scattering rate Γmax ~ W (i.e. the MIR limit). This is also
precisely the dc resistivity at high temperatures.

6
Whilst the strongly T-dependent quasiparticle renormalization in HF metals restricts the
applicability of the PRF to these systems, they nevertheless represent a particularly extreme
and revealing example of resistivity (conductivity) saturation whose significance has
previously been overlooked. Firstly, both the dc and optical data confirm the MIR limit as
being the relevant threshold in HF systems. Secondly, as T increases, the Drude tail simply
broadens with T until eventually it evolves into a ‘plateau’ of width ω ~ W. Once saturation
has been reached, σ(T,ω) shows no further qualitative change in behaviour with increasing T
(provided T < W). In essence this is the ultimate manifestation of conductivity saturation.
What is more, the height and width of the σ(ω) plateau appear consistent with a complete
preservation of the intraband spectral weight. As will be shown in the following section, this is
the key difference between the optical response of HF systems and what is seen in bad or
non-saturating metals.
3. NON-SATURATING METALS
3.1 Resistivity
As stated in the Introduction, a growing number of metallic compounds are found to show
resistivity behaviour that is markedly distinct from that seen in the A15s or the HF metals.
They include the high-Tc cuprates, the manganites and vanadates, the ruthenate family and
the organic salts. They often lie in close proximity to a charge-ordered or magnetically-
ordered ground state and as a result, are associated with many of the more interesting
phenomena in current solid state research, including unconventional superconductivity,
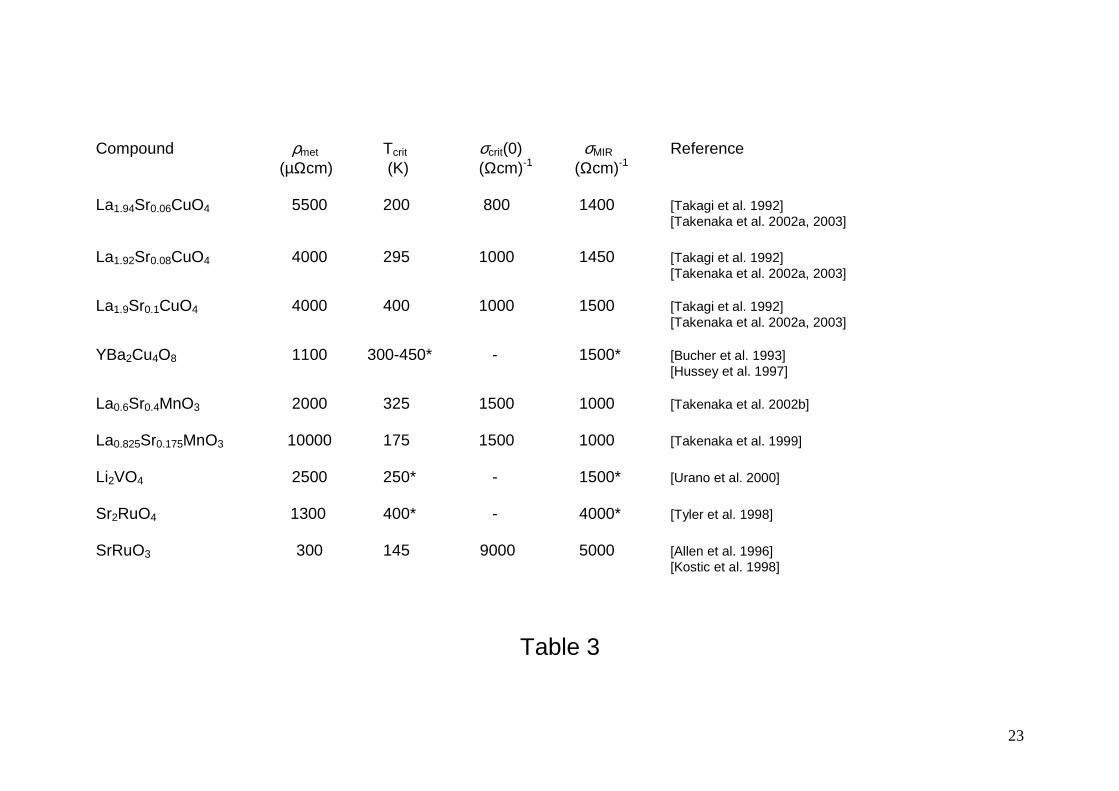
colossal magnetoresistance and non-FL behaviour. Table 3 lists a sample of these non-
saturating metals, together with estimates of the maximum resistivity ρmet at which ‘metallic’
behaviour has been observed. (For the sake of our discussion, we define a non-saturating
metal here as one in which no qualitative change in ρ(T) is observed as it crosses the
threshold corresponding to the MIR criterion. Thus, whilst saturation of sorts (i.e. a change in
slope) is observed in both the high-Tc cuprates [Takagi et al. 1992] and the manganites
[Takenaka et al. 2002b], it occurs at such high values of resistivity, that we consider it to be of
different origin to the type of resistivity saturation described in sections 1 and 2). A quick
inspection of tables 1 and 3 reveals that ρmet can be more than one order of magnitude larger
than ρsat of typical saturating metals.
Whilst the high-T resistive behaviour of these bad metals may appear compatible with our
original definition of a metal, the sub-Angstrom mean-free-paths one extracts from ρ(T) render
physically meaningless any conventional picture of Bloch waves propagating coherently
through a periodic potential commensurate with the underlying crystal lattice. Moreover, given
the rather smooth T-dependence of ρ(T) across the MIR threshold, it has been claimed that
the absence of resistivity saturation in bad metals must be a direct manifestation of their non-
7
FL ground state at 0K [Emery and Kivelson 1995]. At first sight, this point of view appears
rather compelling. Significantly however, quantum oscillatory phenomena of the FL form have
now been observed both in organic salts [Wosnitza et al. 1996] and two members of the
ruthenate family, SrRuO3 [Mackenzie et al. 1998] and Sr2RuO4 [Mackenzie et al. 1996],
proving that a well-defined FL ground state is formed in (at least some of) these systems at
low T. Evidence for a coherent, three-dimensional FL ground state has also been reported
recently for highly doped cuprates [Proust et al. 2003, Hussey et al. 2003, Nakamae et al.
2003]. Hence, the automatic association of a non-saturating ρ(T) with a non-FL ground state
is inappropriate and some other physical explanation for the high-T resistivity is required.
3.2 Optical conductivity
Optical conductivity data extending to temperatures up to and beyond 300K have by now
been collected on most of the compounds listed in table 3 and a generic and rather striking
behaviour seems to be emerging. This is illustrated in figure 1 where σ(ω) data for
underdoped La1.9Sr0.1CuO4 are reproduced (without the phonon peaks) from Takenaka et al.
(2003). At low T, σ(ω) is dominated by a large Drude-like peak characterized by an
anomalous frequency dependence ~ ω-γ, (0.5 < γ < 1). As T increases, the low-frequency
feature initially broadens and σ(0) drops, thereby signalling an increase in the quasiparticle
scattering rate plus in some cases, a redistribution of the spectral weight.
At a critical temperature Tcrit (~ 400K for La1.9Sr0.1CuO4) a subtle but fundamental change in
the charge dynamics is heralded by the flattening out of σ(ω) in the low frequency limit at a
corresponding value σcrit(0). Above Tcrit, the plateau in σ(ω) evolves into a dip in the far-
infrared limit, the low-frequency spectral weight being transferred to energies ω > W (~ 1 eV)
and the optical sum-rule is only fulfilled at much higher energies of 2 - 3 eV [Takenaka et al.
2003]. Note that whilst this low-ω response is evolving, the spectra at high ω (viz. ω > W/3)
remain largely T-independent. The same overall behaviour has now been observed in La2-
xSrxCuO4, Bi2Sr2CuO6 [Tsvetkov et al. 1997], SrRuO3 [Kostic et al. 1998], La1-xSrxMnO3
[Takenaka et al. 2002b], NiS1-xSex (Miyasaka et al., unpublished data) and the organic
compounds κ-(ET)2Cu[N(CN)2]Br [Eldridge et al. 1991] and β’’-(ET)2SF5CH2CF2SO3 [Dong et
al. 1999]. In some of the organics, the zero-frequency Drude peak is never actually realized
since Tcrit turns out to be lower than the minimum temperature at which experiments have
been performed [Dong et al. 1999]. In all instances however, the position of the dip, created
through this transfer of low-frequency weight, is found to shift to higher ω as T continues to
rise and further weight is redistributed from ω ~ 0 to ω > W. This behaviour is in marked
contrast to that seen in HF metals where spectral weight remains below some cut-off of order
W at all temperatures. It is this loss of low-frequency weight above Tcrit therefore that is driving
the dc resistivity beyond the MIR limit in non-saturating metals.

8
For the crystal shown in figure 1 σcrit(0) ~ 1000 (Ωcm)-1. This value lies between the two limits
min = a (σmin = 1500 (Ωcm)-1) and kF = 1 (σmin = 600 (Ωcm)-1) for the 2D Fermi surface
predicted for La1.9Sr0.1CuO4. As the doping level is decreased, Tcrit decreases but significantly,
σcrit(0) remains constant to within experimental resolution (see table 3) [Takenaka et al. 2003].
This striking result suggests that the onset of spectral weight loss is inextricably linked with
the approach to the MIR limit. As shown in the inset to figure 1, these marked changes in
σ(T,ω) are not reflected in ρ(T); ρ(T) simply maintains its ‘metallic’ climb across either
coherent/incoherent boundary, implying that the crossover from Boltzmann to diffusive
transport beyond the MIR limit is a gradual one [Nikolic and Allen 2001, Calandra and
Gunnarsson 2002]. Note that this is not always the case however; in V2O3 [Rozenberg et al.
1995], NiS1-xSex [Miyasaka et al., unpublished data), the manganites [Takenaka et al. 2002b]
and some of the organics [Limelette et al. 2003], ρ(T) is found to increase sharply beyond the
MIR limit once the zero-frequency Drude peak is lost.
3.3 Comparison with Theory
There are three key features of this generic behaviour that need to be taken into account in
any successful theory of bad metallic conductivity; (i) the development of the low-frequency
dip and its extension to higher frequencies as T increases, (ii) the relatively T-independent
σ(ω) spectra at high frequencies and (iii) the values of Tcrit and σcrit(0). In DMFT [Rozenberg et
al. 1995, Merino and McKenzie 2000, Limelette et al. 2003], it is the strong T-dependence of
the spectral density that drives the system from coherent (FL-like) to incoherent behaviour
above a certain crossover temperature T0. This crossover is marked by complete suppression
of the Drude peak at ω = 0, a shift of this spectral weight out to higher frequencies, a change
in the T-dependence of ρ(T) around T0 and ultimately resistivity saturation at values far
beyond the MIR limit. Significantly however, the disappearance of the Drude peak at T ~ T0 in
DMFT calculations is correlated with the onset of resistivity saturation, in contrast with
experiment. Indeed, comparison of figures 3 and 9 in Merino and McKenzie (2000) confirms
that the Drude peak is expected to survive even for resistivities much larger than the MIR limit.
Gunnarsson and Calandra (2002, 2003) have considered a scenario based on the t-J model
to account for the high resistivities found in underdoped cuprates. In their approach, the
average kinetic energy of charge carriers is reduced due to the strong Coulomb repulsion on
the Cu-O sublattice by a factor x(1-x), where x is the (small) percentage of doped holes in the
CuO2 planes. σ(ω) is assumed to evolve at high T into a flat, incoherent spectrum (rather like
the one seen in HF metals) of width W and a height σmin (<< σmin(MIR)) that is consistent with
the resistivity ceiling for each particular doping. As T is lowered, a Drude tail emerges from
this constant background, leading to an increase in σ(0) and a concomitant drop in ρ(T). As
with the DMFT, a metallic ρ(T) is synonymous with a finite Drude peak at ω = 0.

9
Table 3 lists values of σcrit(0) for those compounds where it has been measured, along with
estimates of σMIR, the conductivity corresponding to min = a. (In cases where it has yet to be
measured, an asterix marks the predicted value.) Given the experimental uncertainties, the
perceived correlation between σcrit and σMIR ought not to be taken too literally at this stage
(though further quantitative comparisons are strongly encouraged.) What is clear however is
the striking difference between σcrit(0) and σmet(0) = 1/ρmet. The important point here is that a
fundamental crossover in the charge dynamics of bad metals occurs well before any
saturation threshold; σ(0) continues to drop with increasing T due to the gradual removal of
spectral weight at low frequencies; the positive slope of ρ(T) in bad metals beyond the MIR
limit is thus deceptive and should in no way be taken as a continuation of the standard
metallic state that is observed at lower temperatures.
4. DISCUSSION
4.1 Possible Origins of Bad Metallic Behaviour
Having established the phenomenology, we now turn to consider which parameters
distinguish bad metals from saturating metals, without being specific to any one system, and
to explore the various possible origins for bad metallic behaviour itself. As discussed in the
previous section, the observation of quantum oscillations in both organic salts [Wosnitza et al.
1996] and the ruthenates [Mackenzie 1996, 1998] makes the association of bad metallic
behaviour with a non-FL ground state insupportable. Whilst bad metals are believed to be
characterized by narrow conduction bands (W < 1eV), this is always not the case. In the
manganites, for example, the reflectivity edge can extend out to 2 eV [Takenaka et al. 2002b].
Conversely, both the A15s and the HF metals have relatively narrow (high-temperature)
bandwidths of order 0.5 eV. The development of the low-frequency dip in σ(T,ω) at high T
also rules out both thermal expansion (thought to be significant in the organics and fullerenes,
for example, but less so in transition metal oxides) and lattice anharmonicity as explanations
for the ‘excess resistivity’ in bad metals. The lack of resistivity saturation in the cubic
perovskite SrRuO3 [Allen et al. 1996] and the spinel LiV2O4 [Urano et al. 2000] further
excludes low dimensionality as a determining factor. Moreover, since resistivity escalation is
observed both in single-band metals, like the cuprates and organics, and in multi-sheeted
Sr2RuO4, band degeneracy, or the absence of interband scattering, does not seem to be
playing a significant role. Finally, the small Fermi surface arguments used to explain the
elevated ρsat values found in some underdoped cuprates [Takagi et al. 1992] are not
applicable to Sr2RuO4 for example.
Indeed, the only truly universal feature of bad metals is their proximity to a Mott insulating
state and the corresponding dominance of electron-electron correlations in their transport
behaviour. This is manifest in their large T2 resistivities (at low T) extending in many cases

10
over several decades in temperature [Crusellas et al. 1991, Kobayashi et al. 1993, Hussey et
al. 1998, Mackenzie et al. 1998, Miyasaka et al. 2000, Okuda et al. 2000, Urano et al. 2000,
McBrien et al. 2002]. (Whilst a large T2 resistivity is only clearly noticeable in electron-doped
cuprates [Crusellas et al. 1991] or hole-doped cuprates with doping levels beyond the
superconducting dome [Nakamae et al. 2003], manifestations of strong electron-electron
scattering in optimally doped cuprates are seen, for example, in the dramatic rise of the infra-
red and thermal conductivities below Tc [Yu et al. 1992, Bonn et al. 1993].) In saturating
metals by contrast, resistivity is dominated by scattering off (bosonic) excitations that are
independent of the conduction electrons. In the HF metals of course, this is only true at high T
(i.e. in the saturation limit) where the dominant scattering is believed to be from spin
fluctuations off localized f-electron moments [Fisk et al. 1988]. In elemental metals and the
A15s, the bosons in question are phonons whilst in the Fe alloy γ-Fe80-xNixCr20, electron-
magnon scattering appears to be dominant [Nath and Majumbar 1996].
It was noted [Kostic et al. 1998, Takenaka et al. 2002a, b] that the behaviour of σ(ω) in bad
metals at high T is intriguingly similar to that seen in disordered materials at low T, where a
similar finite-energy edge develops and shifts to higher frequencies with decreasing
temperature as σ(0) is driven down by Anderson localization [Gold et al. 1982]. Of course,
Anderson localization is not expected to occur at high T since Anderson localization is a
quantum interference phenomenon that is disturbed by strong inelastic scattering. A more
appropriate description of this suppression of low-frequency spectral weight is in terms of the
destruction of the quasiparticle itself, as championed by DMFT [Georges et al. 1996, Merino
and McKenzie 2000,]. The correlation between σcrit(0) and σMIR highlighted here however
implies that it is the level of scattering, rather than temperature, that primarily heralds the
collapse of the quasiparticle pole, though the two energy scales may of course be closely
correlated. In DMFT for example, the coherence temperature T0 is associated with the same
renormalized Fermi temperature εF* that appears in the enhanced prefactor of the T2
resistivity [Georges et al. 2003]. As we approach the MIR limit with increasing temperature,
strong correlation effects drive the system across the coherent/incoherent boundary. The
presence of a large on-site Coulomb repulsion U pulls spectral weight from low energies up to
energies beyond the bandwidth, i.e. into the upper Hubbard band, and as a result the dc
conductivity passes below the MIR limit. In this sense, the lack of resistivity saturation ought
now to be viewed as direct evidence for proximity of the system to a Mott transition.
4.2 Application of PRF Analysis to Optical Data
The observation of some fundamental ceiling in Γ(ω) in the optical response of HF metals (at
the MIR limit) suggests that it is the saturation of the scattering rate Γ at Γmax (= 1/τmin) which
is responsible for saturation of the dc resistivity, rather than any thermally-induced changes in
n and/or the plasma frequency Ωp. Support for this approach comes from disorder studies of

11
resistivity saturation, particularly those where additional scattering has been induced through
irradiation [Gurvitch et al. 1978, Caton and Viswanathan 1982], a process that has negligible
effect upon n. For each level of irradiation, the PRF form to ρ(T) is found to hold. More
importantly both ρsat and the T-dependent part of ρideal(T) remain unchanged to within
experimental accuracy, even for ρ0 values close to ρsat.
Intriguingly, the same phenomenon is also observed in bad metals. Extended Drude analysis
carried out on various cuprates up to high frequencies for example have revealed a Γ(T,ω)
that saturates too at a value 3000 - 4000 cm-1 ~ W/2 comparable with the MIR limit [Jehl et al.
1992, Quijada et al. 1999, van der Marel et al. 2003]. This observation is particularly intriguing
in cuprates where ρ(T) is seen to attain values significantly higher than one would expect for
such maximal levels of scattering. It also hints that the notion of a minimum scattering time
(maximum scattering rate) is indeed universal.
These empirical observations, coupled with the success of the PRF in describing ρ(T) in
saturating metals, lead us to consider whether a PRF-style analysis can also be applied to the
optical response. Before proceeding however, we reiterate that any analysis based on two
conducting channels is inappropriate and the term ‘parallel-resistor formula’ is actually rather
misleading. In what follows therefore, we adopt the more relevant term ‘scattering rate
saturation’ or SRS for short. We start by incorporating the MIR criterion into the electron
scattering probability distribution, as proposed originally by Gurvitch (1981). Rather than
thinking in terms of a single mean scattering time τ for all quasiparticles, Gurvitch considered
the probability dP of an individual quasiparticle to scatter in a time interval (t, t + dt) as given
by
teP t d1
d ττ
−= (4)
Then, by invoking the MIR limit, Gurvitch argued that no scattering event can take place
before a charge carrier has moved a distance comparable to the lattice spacing. This then
introduces the concept of a minimum time τmin into the probability distribution,
( )
≥
<=′ −−
min
min
,d1
,0d
min ττ
τττ tte
tP t (5)
The inclusion of this ‘forbidden zone’ for scattering creates an additional term in the (Drude)
expression for drift velocity (and hence conductivity) proportional to τmin and therefore
consistent with the MIR limit. Upon inverting this expression, the PRF for resistivity saturation
is naturally obtained. Unfortunately, such a purely classical approach (5) does not lend itself
12
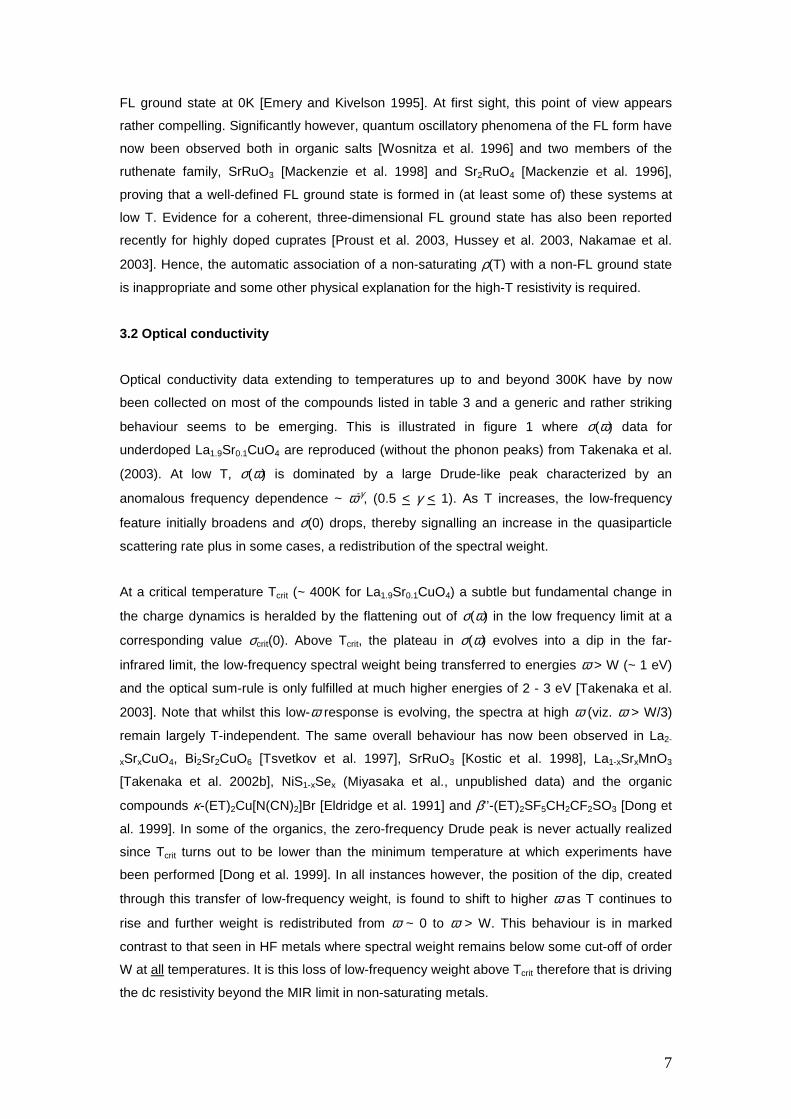
to extension into the frequency domain, especially for frequencies smaller than 1/τmin [T. W.
Silk and A. J. Schofield, private communication]. A more physically realistic scenario is one in
which scattering at arbitrarily small times is allowed but where the mean time has an offset
equivalent to τmin, i.e.
( ) tedP t d1
min
min
ττττ
+−+
= (6)
Hence the mean scattering time has a minimum imposed by the presence of the lattice. This
particular distribution clearly leads to the PRF at zero frequency, but in contrast with the
staggered distribution of Gurvitch (1981), it can also be extended into the frequency realm. Its
implementation is actually rather trivial; we simply insert τmin (Γmax) into the extended Drude
expression for σ(T,ω) [Allen and Mikkelsen 1977], i.e.
( ) ( ) ( )[ ]( )ωλωωε
ωσ,1,
,eff
20
TiTT p
+−ΓΩ
= (7)
where λ(T,ω) is the temperature- and frequency-dependent coupling constant, obtained from
Γeff(T,ω) via a Kramers-Kronig analysis and Γeff(T,ω) is the effective scattering rate given by
( ) ( ) maxidealeff
1,
1,
1Γ
+Γ
=Γ ωω TT
(8)
For a standard metal, Γideal(T,ω) = Γ0 + Γe-ph(T,ω), with Γe-ph(T,ω) given by the standard theory
[Allen 1975], whilst for metals dominated by e-e scattering, Γideal(T,ω) = Γ0 + Γe-e(T,ω) and Γe-
e(T,ω) ~ ((πT)2 + ω2). We stress once again that there is no second conducting channel here;
it is the scattering rates that effectively add in parallel here, not the conductivities.
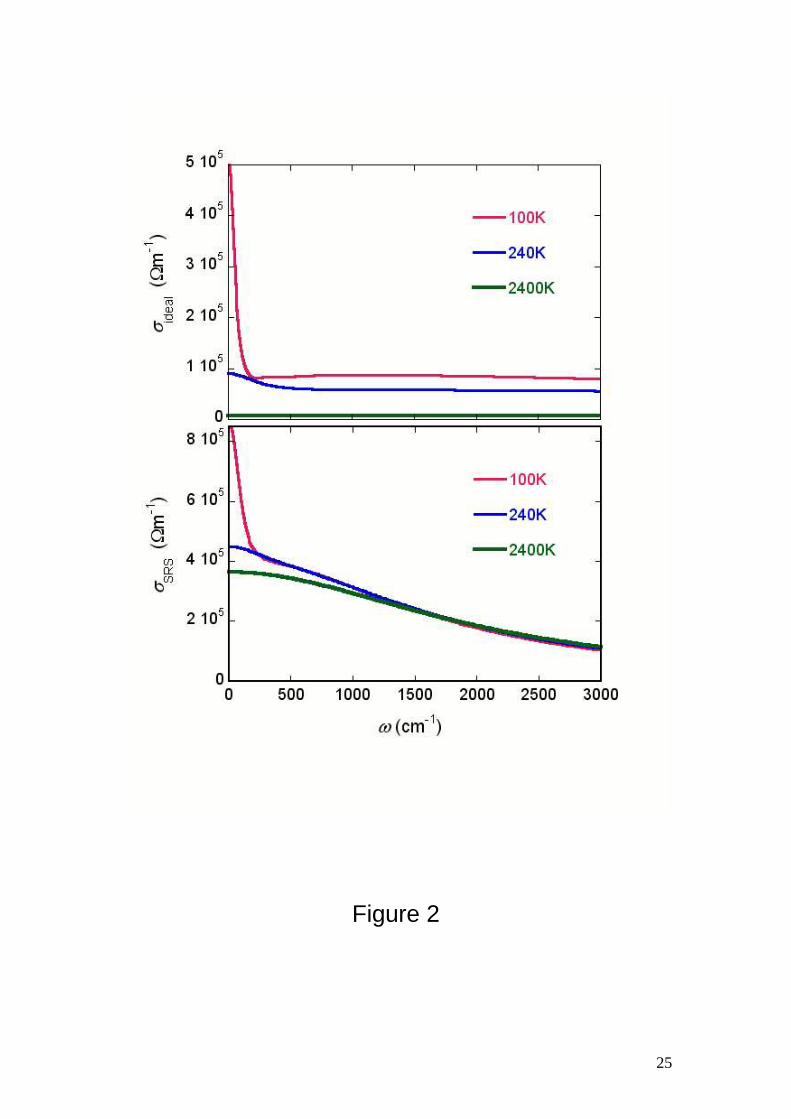
The effect of invoking a saturating rate ceiling on the optical response is illustrated in figure 2.
Figure 2a shows σideal(T,ω), the ideal conductivity spectra (i.e. with Γ(T,ω) = Γideal(T,ω) = Γ0 +
Γe-ph(T,ω)) for three representative temperatures; one on the coherent side (T = 100K, ρideal(T)
< ρsat), one at the coherent/incoherent boundary (T = 240K, ρideal(T) ~ ρsat) and one for ρideal(T)
>> ρsat (T = 2400K). It is immediately clear from this figure that the high-T σideal curve does not
represent the experimental situation. The corresponding SRS spectra σSRS(T,ω) are given in
figure 2b. The parameters used in these simulations are given in the figure caption. (Similar
curves are also obtained using Γideal(T,ω) = Γ0 + Γe-e(T,ω) though are not shown here). As we
might expect, the influence of Γmax on σSRS(T,ω) grows as T is increased. Note that since Γ is
13
of order W at high T and ω, an ever increasing fraction of the optical spectra is shifted to ω >
W, thus violating the optical f-sum rule [Wooten 1972].
( )2
20
01
pW
dΩ
=πε
ωωσ (9)
This violation is obviously more severe for σideal(T,ω) than for σSRS(T,ω) since Γideal(T,ω) >
Γ(T,ω) at all T and ω. In bad metals, the f-sum rule is clearly not conserved below ω = W. The
coherent/incoherent crossover around T = Tcrit is heralded by a flattening of the Drude
response at low frequencies, followed by the development of a dip whose position shifts to
higher ω with increasing T. The missing low-frequency spectral weight is transferred to
energies beyond the bandwidth. For the HF metals (and presumably other saturating metals
too), W is the highest energy scale in the problem and consequently, spectral weight
redistribution is confined to frequencies below ω = W (provided T < W) leaving the f-sum rule
intact. Neither of these evolving spectra can be reproduced by our simple model and clearly
one would need a much more sophisticated treatment to account for the redistribution of
spectral weight in both cases in a self-consistent fashion. Nevertheless, several features of
the plots derived from the SRS analysis are consistent with the experimental data, including
the overlapping of spectra taken at different temperatures beyond ω ~ W/3.
Taking our lead from HF metals, we summize that the Drude response in saturating metals
must transform itself, if only asymptotically, into a flat spectrum of height σMIR = ε0Ωp2/Γmax
extending all the way out to ω ~ W [Calandra and Gunnarsson 2002]. For such a case, we
can invoke the f-sum rule (9) again to find an alternative expression for Γmax, namely
πW2
max ≈Γ (10)
This particular definition of the MIR limit is rather general, is independent of dimensionality
and does not involve the Fermi velocity vF whose absolute value in general is difficult to
quantify. It is also consistent with the values found in high-Tc cuprates [van der Marel et al.
2003] and those listed in table 2 for HF metals.
One implication of the above analysis is that ρ(T) is going to deviate from ρideal(T) at
temperatures well below saturation. This low-T deviation from ρideal(T) implies that the charge
carriers are somehow ‘aware’ of the lattice-imposed resistivity ceiling even in the fully
coherent region where > 10a, i.e. where Boltzmann theory still is a valid framework. We can
understand this by noting that while there is a distribution of scattering times, with mean τ, the
presence of τmin will be felt at all finite temperatures irrespective of the value of τ itself. Of

14
course, for good metals such as copper, ρideal(T) is always much smaller than ρsat so any
departure from ρideal(T) will be negligible at relevant temperatures.
In bad metals where scattering is much stronger, the ceiling in Γ(T,ω) should influence the
transport data over a very wide temperature (and frequency) range, thus masking the intrinsic
T-(ω-)dependence of the scattering rate, i.e. Γideal(T, ω). In high-Tc cuprates, for example, it is
widely believed that the observation of a T-linear resistivity, up to T = 1000K in some cases
[Gurvitch and Fiory 1987, Takagi et al. 1992], is evidence of some non-FL T-linear scattering
rate induced by proximity to a quantum critical point [Varma et al. 1989]. In this paper, we
have demonstrated how this association of a T-linear resistivity with a T-linear scattering rate
is no longer appropriate, not only for resistivity values beyond the MIR limit, but also for those
in its vicinity. Intriguingly, a recent phenomenological treatment for the cuprates that uses
equation (8) with a Γideal(T) that is quadratic in temperature (and anisotropic within the ab-
plane) has been shown to generate both a T-linear resistivity and an inverse Hall angle
cot θH(T) ~ A + BT2 in optimally doped cuprates [Hussey 2003]. Since this issue is
fundamental to unravelling the physics of high-Tc cuprates, it will be explored in more detail in
a forthcoming publication.
5. CONCLUSIONS
In this paper, we have tried to demystify bad metallic behaviour by adopting a broad empirical
approach. In the process, we have uncovered a means of classifying saturating and non-
saturating metals in terms of their optical response. We have found surprising parallels
between bad metals and saturating metals which suggest that the original arguments of Mott,
Ioffe and Regel may in fact be wholly inclusive. Bad metallic behaviour is associated largely
with the absence of a zero-frequency collective mode. The development of the low-frequency
dip above Tcrit indicates a clear breakdown of the simple Drude picture. It implies that the
continuation of the positive ρ(T) slope into the incoherent regime has nothing to do with an
unbounded escalation of the scattering rate, or in terms of the self-energy Σ, an ever-
broadening spectral function. This conclusion is supported by the observation of saturation of
Γ(T,ω) at high frequencies at a value Γmax ~ W. Thus, a description of bad metallic behaviour
in terms of exotic scattering is no longer deemed appropriate. The definition of true metallic
behaviour has to be confined, in semiclassical language, to charge carriers which move an
average distance greater than the lattice spacing between collisions, or in quantum-
mechanical language, to self-energies smaller than the bandwidth. It would be instructive in
this regard to learn whether spectroscopic probes such as photoemission can detect such
saturation in the quasiparticle self-energies of bad metals in future studies.
The crucial difference between saturating and non-saturating metals appears to lie in the
preservation (or loss thereof) of spectral weight within a cut-off associated with the conduction

15
bandwidth. In saturating metals, as exemplified by the HF metals, the total spectral weight is
preserved and at temperatures in the saturation limit, σ(T,ω) is characterized by a flat,
featureless spectrum extending all the way out to ω ~ W. In bad metals, the optical sum rule
is violated beyond Tcrit with the missing low-frequency spectral weight becoming redistributed
to energies beyond ω = W, as described in DMFT. Evidence suggests however that this
coherent/incoherent crossover in the optical response is governed by the same MIR criterion
for dc conductivity as found in saturating metals.
We have tried to adapt Gurvitch’s original ideas, linking resistivity saturation to saturation of
the scattering rate at the MIR limit, to the frequency domain. Whilst such SRS analysis
explains some features of the data, e.g. the weak T-dependence of the spectra beyond ω ~
W/3, the modelling clearly requires greater sophistication (e.g. to incorporate the spectral
weight redistribution) before it can be applied more meaningfully to the full energy range. We
do believe however that scattering rate analysis of the type presented here must now be
incorporated in any detailed theory of the optical response of strongly scattering metals. As
mentioned previously, one important implication of the SRS analysis is that ρ(T) will deviate
from ρideal(T) at temperatures well below Tcrit. It is therefore very likely that in many bad metals,
the presence of Γmax will influence the transport data over a very wide temperature (and
frequency) scale. The impact of this on our current understanding of the intrinsic behaviour of
Γ(T,ω) in bad metals in general, and cuprates in particular, is potentially far-reaching.
ACKNOWLEDGEMENTS
The authors would like to acknowledge fruitful discussions with N. Bontemps, A. J. Schofield,
T. W. Silk, T. Timusk, D. van der Marel, J. A. Wilson, Y. Yanase and J. Zaanen. We also
thank J. Alexander for preparing figure 2 and J. A. Wilson for his critical reading of the
manuscript.
APPENDIX
Resistivity Saturation in Carbon Fullerenes
In the alkali-doped fullerenes, the issue of resistivity saturation has received significant
attention. On the theoretical side, it has been suggested that the fullerenes are rather a
unique case, in which strong coupling to intramolecular vibrations leads to a lack of resistivity
saturation with mean-free-paths well below the MIR limit [Gunnarsson and Han 2000]. Since
electron-phonon scattering is believed to be the dominant scattering mechanism here, this
result would appear to contradict our proposed phenomenology. The experimental situation,
however, remains controversial with several experimental issues still awaiting resolution.
Firstly, whilst some reports show resistivity data extending to values up to 6 mΩcm without

16
saturation [Hebard et al. 1993], others show the onset of resistivity saturation (and PRF
scaling) but with a small min ~ 1 << a [Hou et al. 1995]. Secondly, it has been notoriously
difficult to determine the absolute value of the resistivity in these compounds. Indeed,
resistivity values reported in the literature [Gunnarsson 1997] differ by one order of magnitude.
Thirdly, knowledge of the intrinsic T-dependence of ρ(T) in fullerenes is complicated by
thermal expansion effects and a T-dependent density of states. Finally, optical data by
Degiorgi et al. (1994) show a small but sharp Drude peak appearing below 100 cm1 (at low T),
suggesting that the high resistivity values may be due to a low concentration of mobile
carriers. If this is the case, the minimum conductivity (maximum resistivity) would be much
lower (higher) than originally thought. Contrasting data by Iwasa and Kaneyasu (1995)
suggest a much larger and broader Drude response with an anomalously high Γ ~ 1 eV. It is
noteworthy however that the Iwasa measurements stop at 100 cm-1, precisely the point at
which Degiorgi et al. observe the sharp (Drude) upturn. Further measurements of the optical
response of fullerenes, especially to higher temperatures, and independent estimates of the
carrier density, e.g. via complementary Hall effect measurements, would be very welcome.
We therefore reserve to make a definitive statement about the alkali-doped fullerenes to a
later date, but acknowledge that their reported behaviour is not at present consistent with our
classification scheme.
17
REFERENCES
Allen, P. B., 1975, Phys. Rev. B 11, 2693.
Allen, P. B., 1980, Superconductivity in d- and f-band Metals, edited by H. Suhl and M. B. Maple
(Academic, New York), pp 291 - 304.
Allen, P. B., Berger, H., Chauvet, O., Forro, L., Jarlborg, T., Junod, A., Revaz, B., and Santi, G., 1996,
Phys. Rev. B, 53, 4394.
Allen, J. W., and Mikkelsen, J. C., 1977, Phys. Rev. B, 15, 2952.
Awasthi, A. M., Degiorgi, L., Grüner, G., Dalichaouch, Y., and Maple, M. B., 1993, Phys. Rev. B, 48,
10692.
Bonn, D. A., Kamal, S., Zhang, K., Liang, R., Baar, D. J., Klein, E., and Hardy, W. N., 1993, Phys. Rev.
B, 50, 4051.
Bucher, B., Steiner, P., Karpinski, J., Kaldis, E., and Wachter, P., 1993, Phys. Rev. Lett., 70, 2012.
Calandra, M., and Gunnarsson, O., 2002, Phys. Rev. B, 66, 205105. Note that in this model, the PRF is
expressed in terms of conductivities, i.e. σDrude(T,ω) + σmin, rather than here, where it applies to the
scattering rates (2).
Calandra, M., and Gunnarsson, O., 2003, Euro. Phys. Lett., 61, 88.
Caton, R., and Viswanathan, R. 1992, Phys. Rev. B, 25, 179.
Crusellas, M. A., Fontcuberta, J., Pinol, S., Grenet, T., and Beille, J., 1991, Physica, 180C, 313.
Degiorgi, L., Nicol, E. J., Klein, O., Grüner, G., Wachter, P., Huang, S.-M., Wiley, J., and Kaner, R. B.,
1994, Phys. Rev. B, 49, 7012.
Degiorgi, L., 1999, Rev. Mod. Phys., 71, 687.
de Visser, A., Franse, J. J. M., and Menovsky, A., 1984, J. Mag. Mag. Mater., 43, 43.
Dong, J., Musfeldt, J. L., Schlueter, J. A., Williams, J. M., Nixon, P. G., Winter, R. W., and Gard, G. L.,
1999, Phys. Rev. B, 60, 4342.
Dressel, M., Kasper, N., Petukhov, K., Gorshunov, B., Grüner, G., Huth, M., and Adrian, H., 2002, Phys.
Rev. Lett., 88, 186404.
Eldridge, J. E., Kornelsen, K., Wang, H. H., Williams, J. M., Crouch, A. V. S., and Watkins, D. M., 1991,
Solid State Commun., 79, 583.
Emery, V. J., and Kivelson, S. A., 1995, Phys. Rev. Lett., 74, 3253.
Fisk, Z., and Webb, G. W., 1976, Phys. Rev. Lett., 36, 1084.
Fisk, Z., Hess, D. W., Pethick, C. J., Pines, D., Smith, J. L., Thompson, J. D., and Willis, J. O., 1988,
Science, 239, 33.
Geibel, C., Schank, C., Thies, S., Kitazawa, H., Bredl, C. D., Boehm, A., Rau, M., Grauel, A., Caspary,
R., Helfrich, R., Ahl-heim, U., Weber, G., and Steglich, F., 1991, Z. Phys. B, 84, 1.
Georges, A., Kotliar, G., Krauth, W., and Rozenberg, M. J., 1996, Rev. Mod. Phys., 68. 13.
Georges, A., Florens, S. and Costi, T. A., 2003, condmat/0311520.
Gold, A., Allen, S. J., Wilson, B. A., and Tsui, D. C., 1982, Phys. Rev. B, 25, 3519.
Gunnarsson, O., 1997, Rev. Mod. Phys., 69, 575.
Gunnarsson, O., and Han, J. E., 2000, Nature, 405, 1027.
Gunnarsson, O., Calandra, M., and Han, J. E., 2003, Rev. Mod. Phys., 75, 1085.
Gurvitch, M., Ghosh, A. K., Gyorffy, B. L., Lutz, H., Kammerer, O. F., Rosner, J. S., and Strongin, M.,
1978, Phys. Rev. Lett., 41, 1616.
Gurvitch, M., 1981, Phys. Rev. B, 24, 7404.
Gurvitch, M., 1983, Phys. Rev. B, 28, 544.

18
Gurvitch, M., and Fiory, A.T., 1987, Phys. Rev. Lett., 59, 1337.
Hebard, A. F., Palstra, T. T. M., Haddon, R. C., and Fleming, R. M., 1993, Phys. Rev. B, 48, 9945.
Hou, J. G., Lu, L., Crespi, V. H., Xiang, X.-D., Zettl, A., and Cohen, M. L., 1995, Solid State Commun.,
93, 973.
Hussey, N. E., Nozawa, K., Takagi, H., Adachi, S., and Tanabe, K., 1997, Phys. Rev. B, 56, R11423.
Hussey, N. E., Mackenzie, A. P., Cooper, J. R., Maeno, Y., NishiZaki, S., and Fujita, T., 1998, Phys.
Rev. B, 57, 5505.
Hussey, N. E., 2003, Eur. Phys. J. B, 31, 495.
Hussey, N. E., Abdel-Jawad, M., Carrington, A., Mackenzie, A. P., and Balicas, L., 2003, Nature, 425,
814.
Ioffe, A. F., and Regel, A. R., 1960, Prog. Semicond., 4, 237.
Iwasa, Y., and Kaneyasu, T., 1995, Phys. Rev. B, 51, 3678.
Jehl, G., Zetterer, T., Otto, H. H., Schützmann, J., Shulga, S., and Renk, K. F., 1992, Europhys. Lett., 17
255.
Kobayashi, H., Miyamoto, A., Kato, R., Sakai, F., Kobayashi, A., Yamakita, Y., Furukawa, Y., Tasumi,
M., and Watanabe, T., 1993, Phys. Rev. B, 49, 3500.
Kostic, P., Okada, Y., Schlesinger, Z., Reiner, J. W., Klein, L., Kapitulnik, A., Geballe, T. H., and Beasley,
M. R., 1998, Phys. Rev. Lett., 81, 2498.
Limelette, P., Wzietek, P., Florens, S. , Georges, A., Costi, T. A., Pasquier, C., Jerome, D., Meziere, C.,
and Batail, P., 2003, Phys. Rev. Lett., 85, 5420.
Lin, J. J., Yu, C., and Yao, Y. D., 1993, Phys. Rev. B, 48, 4864.
Mackenzie, A. P., Julian, S. R., Diver, A. J., McMullan, G. J., Ray, M. P., Lonzarich, G. G., Maeno, Y.,
NishiZaki, S., and Fujita, T., 1996, Phys. Rev. Lett., 76, 3786.
Mackenzie, A. P., Reiner, J. W., Tyler, A. W., Galvin, L. M., Julian, S. R., Beasley, M. R., Geballe, T. H.,
and Kapitulnik, A., 1998, Phys. Rev. B, 58, R13318.
McBrien, M. N., Hussey, N. E., Meeson, P. J., and Horii, S., 2002, J. Phys. Soc. Japan, 71 701.
Merino, J., and McKenzie, R. H., 2000, Phys. Rev. B, 61, 7996.
Milchberg, H. M., Freeman, R. R., Davey, S. C., and More, R. M., 1988, Phys. Rev. Lett., 61, 2364.
Millis, A. J., and Lee, P. A., 1987, Phys. Rev. B, 35, 3394.
Miyasaka, S., Takagi, H., Sekine, Y., Takahashi, H., Mori, N., and Cava, R. J., 2000, J. Phys. Soc.
Japan, 69 3166.
Mooij, J. H., 1973, Phys. Stat. Solidi A 17, 521.
Mori, K., Tamura, N., and Saito, Y., 1981, J. Phys. Soc. Japan, 50, 1275.
Mott, N. F., 1972, Philos. Mag., 26, 1015.
Nakamae, S., Behnia, K., Mangkorntong, N., Nohara, M., Takagi, H., Yates, S. J. C., and Hussey, N. E.,
2003, Phys. Rev. B, 68, 100502(R).
Nath, T. K., and Majumdar, A. K., 1996, Phys. Rev. B, 53, 12148.
Nikolic, B. K., and Allen, P. B., 2001, Phys. Rev. B, 63, 020201(R).
Okuda, T., Tomioka, Y., Asamitsu, A., and Tokura, Y., 2000, Phys. Rev. B, 61, 8009.
Proust, C., Boaknin, E., Hill, R. W., Taillefer, L., and Mackenzie, A. P. 2002, Phys. Rev. Lett. 89, 147003.
Quijada, M. A., Tanner, D. B., Kelley, R. J., Onellion, M., Berger, H., and Margaritondo, G., 1999, Phys.
Rev. B, 60, 14917.
Rozenberg, M. J., Kotliar, G., Kajueter, H., Thomas, G. A., Rapkine, D. H., Honig, J. M., and Metcalf, P.,
1995, Phys. Rev. Lett., 75, 105.
Sanborn, B. A., Allen, P. B., and Papaconstantopoulos, D. A., 1989, Phys. Rev. B, 40, 6037.

19
Sulewski, P. E., Sievers, A. J., Maple, M. B., Torikachvili, M. S., Smith, J. L., and Fisk, Z., 1988, Phys.
Rev. B, 38, 5338.
Sundqvist, B., 1992, Phys. Rev. Lett., 69, 2693.
Takagi, H., Batlogg, B., Kao, H. L., Kwo, J., Cava, R. J., Krajewski, J. J., and Peck Jnr., W. F., 1992,
Phys. Rev. Lett., 69, 2975.
Takenaka, K., Sawaki, Y., and Sugai, S., 1999, Phys. Rev. B, 60, 13011.
Takenaka, K., Shiozaki, R., Okuyama, S., Nohara, J., Osuka, A., Takayanagi, Y., and Sugai, S., 2002,
Phys. Rev. B, 65, 092405.
Takenaka, K., Shiozaki, R., and Sugai, S., 2002, Phys. Rev. B, 65, 184436.
Takenaka, K., Nohara, J., Shiozaki, R., and Sugai, S., 2003, Phys. Rev. B, 68, 134501.
Tsvetkov, A. A., Schützmann, J., Gorina, J. I., Kaljushnaia, G. A., and van der Marel, D., 1997, Phys.
Rev. B, 55, 14152.
Tyler, A. W., Mackenzie, A. P., NishiZaki, S., and Maeno, Y., 1998, Phys. Rev. B, 58, R10107.
Urano, C., Nohara, M., Kondo, S., Sakai, F., Takagi, H., Shiraki, T., and Okubo, T., 2000, Phys. Rev.
Lett., 85, 1052.
van der Marel, D., Molegraaf, H. J. A., Zaanen, J., Nussinov, Z., Carbone, F., Damascelli, A., Eisaki, H.,
Greven, M., Kes, P. H., and Li, M., 2003, Nature, 425, 271.
Varma, C. M., Littlewood, P. B., Schmitt-Rink, S., Abrahams, E., and Ruckenstein, A. E., 1989, Phys.
Rev. Lett., 63, 1996.
Wiesmann, H., Gurvitch, M., Lutz, H., Ghosh, A. K., Schwarz, B., Strongin, M., Allen, P. B., and Halley, J.
W., 1977, Phys. Rev. Lett., 38, 782.
Wooten, F., 1972, Optical Properties of Solids (Academic Press, New York). Strictly speaking, this is a
partial sum rule, crossing over to the total sum rule for W ∞→ .
Wosnitza, J., Golf, G., Beckmann, D., Wanka, S., Schweitzer, D., and Strunz, W., 1996, J. Phys. I
France, 6, 1597.
Yu, R. C., Salamon, M. B., Lu, J. P., and Lee, W. C., 1992, Phys. Rev. Lett., 69, 1431.

20
FIGURE CAPTIONS
Figure 1: Temperature-dependent in-plane optical conductivity spectra σab(T,ω) for
La1.9Sr0.1CuO4 at specified temperatures. Inset: In-plane resistivity data for La1.9Sr0.1CuO4 up
to 1000K [Taken from Takenaka et al. (2003)].
Figure 2(a): Simulation of the ideal optical conductivity σideal(T,ω) at 100K (red), 240 K (blue)
and 2400K (green) assuming Γideal(T,ω) = Γ0 + Γe-ph(T,ω), with Γ0 = 300K and Γe-ph(T,ω) given
by the standard expression [Allen 1965]. In this example, θD = 400K and the electron-phonon
spectral function α2F(ν) = 5 x 10⁻⁹ ν4. 2(b): Simulation of σSRS(T,ω) using equation (8) with Γmax
= 3000K. Ωp is assumed to be ω-independent and has been given an arbitrarily small value (=
4000K) in order to exaggerate the effects of Γmax on σSRS(T,ω).
TABLE CAPTIONS
Table 1: Selection of metallic elements and alloys for which the parallel resistor formula (eqn
(1)) has been successfully applied, together with corresponding values of ρsat and min (in units
of a). As shown by Gurvitch (1981), the range of ρsat values can be accounted for largely by
variations in the carrier density n.
Table 2: Resistivity and optical conductivity parameters derived from experiments in three
heavy-fermion metals, UPt3, UPd2Al3 and CeAl3. In cases where the resistivity is anisotropic,
an average value for the three crystal axes is shown. The W values were estimated from the
mid-point in the tail-off of the high-frequency intra-band conductivity. Note that these values
may be subject to large uncertainty due to emerging contributions from inter-band transitions.
Table 3: Selection of bad metals with corresponding parameters obtained from resistivity and
optical conductivity measurements, as explained in the text. Note that for La2-xSrxCuO4, σcrit(0)
remains largely independent of x. The asterix symbols refer to predicted values.
21
Compound ρsat min Reference (µΩcm) (a) Elements La 175 ~ 1 [Sundqvist 1992] Ti 200 ~ 1 [Lin et al. 1993] A15 compounds Nb3Sn 135 -150 ~ 1 [Fisk et al. 1976]
[Wiesmann et al. 1977] Nb3Ge 135 ~ 1 [Wiesmann et al. 1977] Nb3Pt 105 ~ 1 [Caton and Viswanathan 1982] V3Si 135 ~ 1 [Caton and Viswanathan 1982] Mo3Ge 120 ~ 1 [Gurvitch et al. 1978] Alloys and Intermetallics Ti1-xAlx 190 – 330 1 – 1.5 [Mooij 1973]
[Lin et al. 1993] In5B3 140 1 – 1.5 [Mori et al. 1981] Fe80-xNixCr20 180 – 250 1 – 1.5 [Nath and Majumbar 1996]
Table 1
22
Compound ρsat Ωp Γmax W σmin a Reference
(µΩcm) (ev) (cm-1) (cm-1) (Ωcm-1) () UPt3 200 2.6 1500 2500 5000 5 [de Visser et al. 1984]
[Sulewski et al. 1988] [Dressel et al. 2002]
UPd2Al3 150 3.2 1600 1500 6000 4 [Geibel et al. 1991]
[Dressel et al. 2002] CeAl3 60 3.5 1050 1800 13000 4 [Awashti et al. 1993]
Table 2
23
Compound ρmet Tcrit σcrit(0) σMIR Reference
(µΩcm) (K) (Ωcm)-1 (Ωcm)-1 La1.94Sr0.06CuO4 5500 200 800 1400 [Takagi et al. 1992]
[Takenaka et al. 2002a, 2003] La1.92Sr0.08CuO4 4000 295 1000 1450 [Takagi et al. 1992]
[Takenaka et al. 2002a, 2003]
La1.9Sr0.1CuO4 4000 400 1000 1500 [Takagi et al. 1992] [Takenaka et al. 2002a, 2003]
YBa2Cu4O8 1100 300-450* - 1500* [Bucher et al. 1993] [Hussey et al. 1997]
La0.6Sr0.4MnO3 2000 325 1500 1000 [Takenaka et al. 2002b] La0.825Sr0.175MnO3 10000 175 1500 1000 [Takenaka et al. 1999] Li2VO4 2500 250* - 1500* [Urano et al. 2000] Sr2RuO4 1300 400* - 4000* [Tyler et al. 1998] SrRuO3 300 145 9000 5000 [Allen et al. 1996]
[Kostic et al. 1998]
Table 3

24
Figure 1
25
Figure 2
Copyright © 2022 FDOKUMEN