Renormalization of the Mott gap by lattice entropy
6
PHYSICAL REVIEW RESEARCH 2, 023064 (2020) Renormalization of the Mott gap by lattice entropy: The case of 1T-TaS 2 Li Cheng , 1, 2 Shunhong Zhang , 3 Shuang Qiao, 4 Xiaofeng Wang, 1 Lizhao Liu , 1, 5, * and Zheng Liu 2, 6, † 1 School of Mathematical and Physical Sciences, Dalian University of Technology, Panjin 124221, China 2 Institute for Advanced Study, Tsinghua University, Beijing 100084, China 3 International Center for Quantum Design of Functional Materials, Hefei National Laboratory for Physical Sciences at the Microscale, and CAS Center For Excellence in Quantum Information and Quantum Physics, University of Science and Technology of China, Hefei, Anhui 230026, China 4 Beijing Computational Science Research Center, Beijing 100193, China 5 Key Laboratory of Materials Modification by Laser, Ion and Electron Beams, Dalian University of Technology, Ministry of Education, Dalian 116024, China 6 State Key Laboratory of Low-Dimensional Quantum Physics, Department of Physics, Tsinghua University, Beijing 100084, China (Received 15 August 2019; revised manuscript received 19 February 2020; accepted 25 March 2020; published 21 April 2020) In many transition-metal oxides and dichalcogenides, the electronic and lattice degrees of freedom are strongly coupled, giving rise to remarkable phenomena such as the metal-insulator transition (MIT) and charge-density wave (CDW) order. We study this interplay by tracing the instant electronic structure under ab initio molecular dynamics. Applying this method to a 1T-TaS 2 layer, we show that the CDW-triggered Mott gap undergoes a continuous reduction as the lattice temperature rises, despite a nearly constant CDW amplitude. Before the CDW order undergoes a sharp first-order transition around the room temperature, the dynamical CDW fluctuation shrinks the Mott gap size by half. The gap size reduction is one order of magnitude larger than the lattice temperature variation. Our calculation not only provides an important clue to understanding the thermodynamic behavior in 1T-TaS 2 , but also demonstrates a general approach to quantify the lattice entropy effect in the MIT. DOI: 10.1103/PhysRevResearch.2.023064 I. INTRODUCTION 1T-TaS 2 has perhaps the richest electronic phase diagram of all transition-metal dichalcogenides because of the inter- twined lattice, charge, orbital, and spin degrees of freedom [1]. While the low-temperature commensurate charge-density wave (CCDW) order and the accompanying metal-to-insulator transition (MIT) have been investigated for a long time by diffraction [2], transport [3], scanning tunneling microscopy (STM) [4–6], and angle-resolved photoemission [7–9], the absence of magnetic susceptibility of the insulating phase remains puzzling [10]. The possibility of a quantum spin liquid state due to the lattice frustration was proposed recently [11], which revived theoretical interest and stimulated a series of recent experiments [12–16]. The general consensus [17] is that below 200 ± 20 K (T CCDW ), the √ 13 × √ 13 CCDW order is fully established [Figs. 1(a) and 1(b)]. The Ta atoms are grouped into 13-atom clusters with a Star of David (SD) arrangement. It is widely perceived that such a two-dimensional (2D) layer can be * [email protected] † [email protected] Published by the American Physical Society under the terms of the Creative Commons Attribution 4.0 International license. Further distribution of this work must maintain attribution to the author(s) and the published article’s title, journal citation, and DOI. viewed as a cluster Mott insulator; each SD acts effectively as a correlated site with an odd number of electrons and the SDs form a triangular superlattice. Above T CCDW to around 350 K (T NC ), the so-called nearly CCDW phase emerges, consisting of a mixture of the SDs and discommensurate areas. Above T NC , the SD clusters completely disappear, leaving a weak incommensurate charge-density wave (CDW) order. The Mott phase in 1T-TaS 2 features (i) geometry frustra- tion, (ii) a soft gap of the order of 10 2 meV [18–20], and (iii) the accompanying lattice distortion. Current investigations largely concentrate on the first two aspects. The first aspect serves as a basis to discuss quantum spin liquid physics [11–16] and the second renders various ways to control the MIT, e.g., via pressurization [1], doping [21–25], ionic liquid gating [26], voltage pulsing [26,27], and likely layer stacking [28]. This article aims to highlight the significance of the last aspect. The strong coupling between the electron and lattice degrees of freedom underlies many useful applications of transition-metal oxides. For these systems, it has been shown that both lattice energy [29,30] and entropy [31,32] have novel consequences. Similarly, it is reasonable to expect that lattice dynamics also plays an important role in 1T-TaS 2 . By performing ab initio molecular dynamics (MD) simulation, we first show that the first-order CCDW transition and the associated MIT can be reasonably reproduced as a function of the lattice temperature. Furthermore, we show that below the transition temperature, a continuous variation of the electronic band gap persists. 2643-1564/2020/2(2)/023064(6) 023064-1 Published by the American Physical Society
-
Upload
khangminh22 -
Category
Documents
-
view
3 -
download
0
Transcript of Renormalization of the Mott gap by lattice entropy
PHYSICAL REVIEW RESEARCH 2, 023064 (2020)
Renormalization of the Mott gap by lattice entropy: The case of 1T-TaS2
Li Cheng ,1,2 Shunhong Zhang ,3 Shuang Qiao,4 Xiaofeng Wang,1 Lizhao Liu ,1,5,* and Zheng Liu 2,6,†1School of Mathematical and Physical Sciences, Dalian University of Technology, Panjin 124221, China
2Institute for Advanced Study, Tsinghua University, Beijing 100084, China3International Center for Quantum Design of Functional Materials, Hefei National Laboratory for PhysicalSciences at the Microscale, and CAS Center For Excellence in Quantum Information and Quantum Physics,
University of Science and Technology of China, Hefei, Anhui 230026, China4Beijing Computational Science Research Center, Beijing 100193, China
5Key Laboratory of Materials Modification by Laser, Ion and Electron Beams, Dalian University of Technology,Ministry of Education, Dalian 116024, China
6State Key Laboratory of Low-Dimensional Quantum Physics, Department of Physics, Tsinghua University, Beijing 100084, China
(Received 15 August 2019; revised manuscript received 19 February 2020; accepted 25 March 2020;published 21 April 2020)
In many transition-metal oxides and dichalcogenides, the electronic and lattice degrees of freedom are stronglycoupled, giving rise to remarkable phenomena such as the metal-insulator transition (MIT) and charge-densitywave (CDW) order. We study this interplay by tracing the instant electronic structure under ab initio moleculardynamics. Applying this method to a 1T-TaS2 layer, we show that the CDW-triggered Mott gap undergoes acontinuous reduction as the lattice temperature rises, despite a nearly constant CDW amplitude. Before the CDWorder undergoes a sharp first-order transition around the room temperature, the dynamical CDW fluctuationshrinks the Mott gap size by half. The gap size reduction is one order of magnitude larger than the latticetemperature variation. Our calculation not only provides an important clue to understanding the thermodynamicbehavior in 1T-TaS2, but also demonstrates a general approach to quantify the lattice entropy effect in the MIT.
DOI: 10.1103/PhysRevResearch.2.023064
I. INTRODUCTION
1T-TaS2 has perhaps the richest electronic phase diagramof all transition-metal dichalcogenides because of the inter-twined lattice, charge, orbital, and spin degrees of freedom[1]. While the low-temperature commensurate charge-densitywave (CCDW) order and the accompanying metal-to-insulatortransition (MIT) have been investigated for a long time bydiffraction [2], transport [3], scanning tunneling microscopy(STM) [4–6], and angle-resolved photoemission [7–9], theabsence of magnetic susceptibility of the insulating phaseremains puzzling [10]. The possibility of a quantum spinliquid state due to the lattice frustration was proposed recently[11], which revived theoretical interest and stimulated a seriesof recent experiments [12–16].
The general consensus [17] is that below 200 ± 20 K(TCCDW ), the
√13 × √
13 CCDW order is fully established[Figs. 1(a) and 1(b)]. The Ta atoms are grouped into 13-atomclusters with a Star of David (SD) arrangement. It is widelyperceived that such a two-dimensional (2D) layer can be
*[email protected]†[email protected]
Published by the American Physical Society under the terms of theCreative Commons Attribution 4.0 International license. Furtherdistribution of this work must maintain attribution to the author(s)and the published article’s title, journal citation, and DOI.
viewed as a cluster Mott insulator; each SD acts effectively asa correlated site with an odd number of electrons and the SDsform a triangular superlattice. Above TCCDW to around 350 K(TNC), the so-called nearly CCDW phase emerges, consistingof a mixture of the SDs and discommensurate areas. AboveTNC , the SD clusters completely disappear, leaving a weakincommensurate charge-density wave (CDW) order.
The Mott phase in 1T-TaS2 features (i) geometry frustra-tion, (ii) a soft gap of the order of 102 meV [18–20], and (iii)the accompanying lattice distortion. Current investigationslargely concentrate on the first two aspects. The first aspectserves as a basis to discuss quantum spin liquid physics[11–16] and the second renders various ways to control theMIT, e.g., via pressurization [1], doping [21–25], ionic liquidgating [26], voltage pulsing [26,27], and likely layer stacking[28].
This article aims to highlight the significance of the lastaspect. The strong coupling between the electron and latticedegrees of freedom underlies many useful applications oftransition-metal oxides. For these systems, it has been shownthat both lattice energy [29,30] and entropy [31,32] havenovel consequences. Similarly, it is reasonable to expect thatlattice dynamics also plays an important role in 1T-TaS2. Byperforming ab initio molecular dynamics (MD) simulation,we first show that the first-order CCDW transition and theassociated MIT can be reasonably reproduced as a function ofthe lattice temperature. Furthermore, we show that below thetransition temperature, a continuous variation of the electronicband gap persists.
2643-1564/2020/2(2)/023064(6) 023064-1 Published by the American Physical Society
CHENG, ZHANG, QIAO, WANG, LIU, AND LIU PHYSICAL REVIEW RESEARCH 2, 023064 (2020)
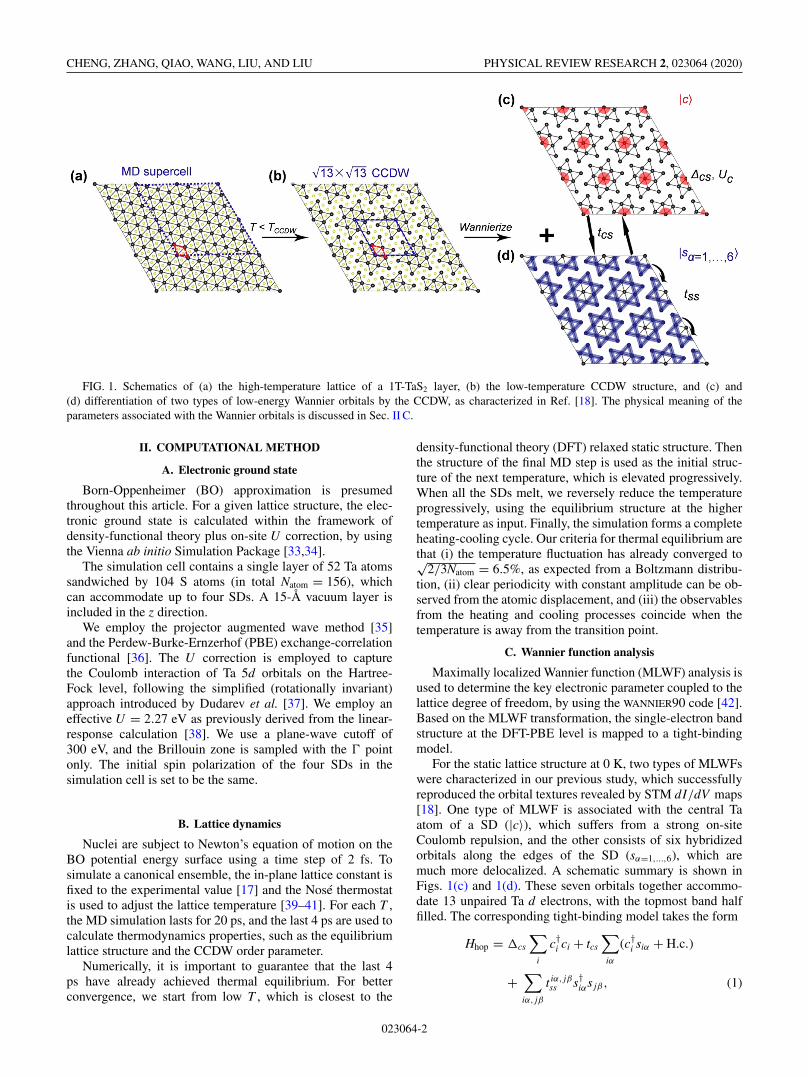
FIG. 1. Schematics of (a) the high-temperature lattice of a 1T-TaS2 layer, (b) the low-temperature CCDW structure, and (c) and(d) differentiation of two types of low-energy Wannier orbitals by the CCDW, as characterized in Ref. [18]. The physical meaning of theparameters associated with the Wannier orbitals is discussed in Sec. II C.
II. COMPUTATIONAL METHOD
A. Electronic ground state
Born-Oppenheimer (BO) approximation is presumedthroughout this article. For a given lattice structure, the elec-tronic ground state is calculated within the framework ofdensity-functional theory plus on-site U correction, by usingthe Vienna ab initio Simulation Package [33,34].
The simulation cell contains a single layer of 52 Ta atomssandwiched by 104 S atoms (in total Natom = 156), whichcan accommodate up to four SDs. A 15-Å vacuum layer isincluded in the z direction.
We employ the projector augmented wave method [35]and the Perdew-Burke-Ernzerhof (PBE) exchange-correlationfunctional [36]. The U correction is employed to capturethe Coulomb interaction of Ta 5d orbitals on the Hartree-Fock level, following the simplified (rotationally invariant)approach introduced by Dudarev et al. [37]. We employ aneffective U = 2.27 eV as previously derived from the linear-response calculation [38]. We use a plane-wave cutoff of300 eV, and the Brillouin zone is sampled with the � pointonly. The initial spin polarization of the four SDs in thesimulation cell is set to be the same.
B. Lattice dynamics
Nuclei are subject to Newton’s equation of motion on theBO potential energy surface using a time step of 2 fs. Tosimulate a canonical ensemble, the in-plane lattice constant isfixed to the experimental value [17] and the Nosé thermostatis used to adjust the lattice temperature [39–41]. For each T ,the MD simulation lasts for 20 ps, and the last 4 ps are used tocalculate thermodynamics properties, such as the equilibriumlattice structure and the CCDW order parameter.
Numerically, it is important to guarantee that the last 4ps have already achieved thermal equilibrium. For betterconvergence, we start from low T , which is closest to the
density-functional theory (DFT) relaxed static structure. Thenthe structure of the final MD step is used as the initial struc-ture of the next temperature, which is elevated progressively.When all the SDs melt, we reversely reduce the temperatureprogressively, using the equilibrium structure at the highertemperature as input. Finally, the simulation forms a completeheating-cooling cycle. Our criteria for thermal equilibrium arethat (i) the temperature fluctuation has already converged to√
2/3Natom = 6.5%, as expected from a Boltzmann distribu-tion, (ii) clear periodicity with constant amplitude can be ob-served from the atomic displacement, and (iii) the observablesfrom the heating and cooling processes coincide when thetemperature is away from the transition point.
C. Wannier function analysis
Maximally localized Wannier function (MLWF) analysis isused to determine the key electronic parameter coupled to thelattice degree of freedom, by using the WANNIER90 code [42].Based on the MLWF transformation, the single-electron bandstructure at the DFT-PBE level is mapped to a tight-bindingmodel.
For the static lattice structure at 0 K, two types of MLWFswere characterized in our previous study, which successfullyreproduced the orbital textures revealed by STM dI/dV maps[18]. One type of MLWF is associated with the central Taatom of a SD (|c〉), which suffers from a strong on-siteCoulomb repulsion, and the other consists of six hybridizedorbitals along the edges of the SD (sα=1,...,6), which aremuch more delocalized. A schematic summary is shown inFigs. 1(c) and 1(d). These seven orbitals together accommo-date 13 unpaired Ta d electrons, with the topmost band halffilled. The corresponding tight-binding model takes the form
Hhop = �cs
∑
i
c†i ci + tcs
∑
iα
(c†i siα + H.c.)
+∑
iα, jβ
t iα, jβss s†iαs jβ, (1)
023064-2
RENORMALIZATION OF THE MOTT GAP BY LATTICE … PHYSICAL REVIEW RESEARCH 2, 023064 (2020)
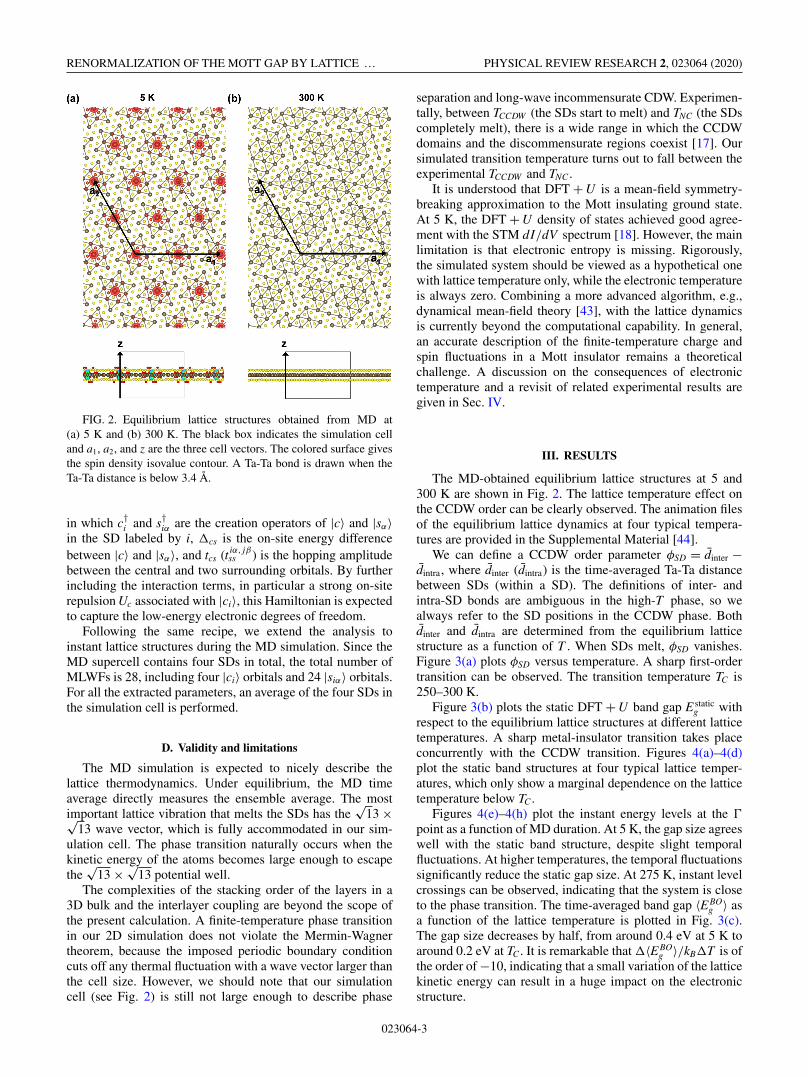
FIG. 2. Equilibrium lattice structures obtained from MD at(a) 5 K and (b) 300 K. The black box indicates the simulation celland a1, a2, and z are the three cell vectors. The colored surface givesthe spin density isovalue contour. A Ta-Ta bond is drawn when theTa-Ta distance is below 3.4 Å.
in which c†i and s†iα are the creation operators of |c〉 and |sα〉in the SD labeled by i, �cs is the on-site energy differencebetween |c〉 and |sα〉, and tcs (t iα, jβ
ss ) is the hopping amplitudebetween the central and two surrounding orbitals. By furtherincluding the interaction terms, in particular a strong on-siterepulsion Uc associated with |ci〉, this Hamiltonian is expectedto capture the low-energy electronic degrees of freedom.
Following the same recipe, we extend the analysis toinstant lattice structures during the MD simulation. Since theMD supercell contains four SDs in total, the total number ofMLWFs is 28, including four |ci〉 orbitals and 24 |siα〉 orbitals.For all the extracted parameters, an average of the four SDs inthe simulation cell is performed.
D. Validity and limitations
The MD simulation is expected to nicely describe thelattice thermodynamics. Under equilibrium, the MD timeaverage directly measures the ensemble average. The mostimportant lattice vibration that melts the SDs has the
√13 ×√
13 wave vector, which is fully accommodated in our sim-ulation cell. The phase transition naturally occurs when thekinetic energy of the atoms becomes large enough to escapethe
√13 × √
13 potential well.The complexities of the stacking order of the layers in a
3D bulk and the interlayer coupling are beyond the scope ofthe present calculation. A finite-temperature phase transitionin our 2D simulation does not violate the Mermin-Wagnertheorem, because the imposed periodic boundary conditioncuts off any thermal fluctuation with a wave vector larger thanthe cell size. However, we should note that our simulationcell (see Fig. 2) is still not large enough to describe phase
separation and long-wave incommensurate CDW. Experimen-tally, between TCCDW (the SDs start to melt) and TNC (the SDscompletely melt), there is a wide range in which the CCDWdomains and the discommensurate regions coexist [17]. Oursimulated transition temperature turns out to fall between theexperimental TCCDW and TNC .
It is understood that DFT + U is a mean-field symmetry-breaking approximation to the Mott insulating ground state.At 5 K, the DFT + U density of states achieved good agree-ment with the STM dI/dV spectrum [18]. However, the mainlimitation is that electronic entropy is missing. Rigorously,the simulated system should be viewed as a hypothetical onewith lattice temperature only, while the electronic temperatureis always zero. Combining a more advanced algorithm, e.g.,dynamical mean-field theory [43], with the lattice dynamicsis currently beyond the computational capability. In general,an accurate description of the finite-temperature charge andspin fluctuations in a Mott insulator remains a theoreticalchallenge. A discussion on the consequences of electronictemperature and a revisit of related experimental results aregiven in Sec. IV.
III. RESULTS
The MD-obtained equilibrium lattice structures at 5 and300 K are shown in Fig. 2. The lattice temperature effect onthe CCDW order can be clearly observed. The animation filesof the equilibrium lattice dynamics at four typical tempera-tures are provided in the Supplemental Material [44].
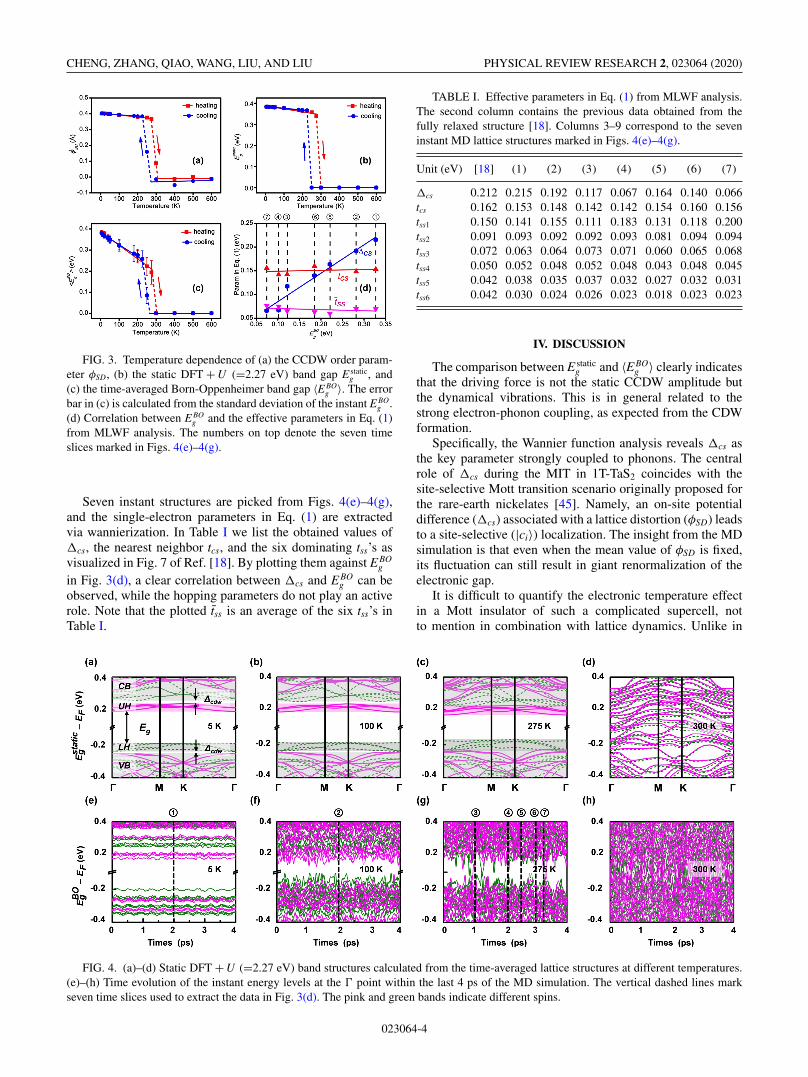
We can define a CCDW order parameter φSD = dinter −dintra, where dinter (dintra) is the time-averaged Ta-Ta distancebetween SDs (within a SD). The definitions of inter- andintra-SD bonds are ambiguous in the high-T phase, so wealways refer to the SD positions in the CCDW phase. Bothdinter and dintra are determined from the equilibrium latticestructure as a function of T . When SDs melt, φSD vanishes.Figure 3(a) plots φSD versus temperature. A sharp first-ordertransition can be observed. The transition temperature TC is250–300 K.
Figure 3(b) plots the static DFT + U band gap E staticg with
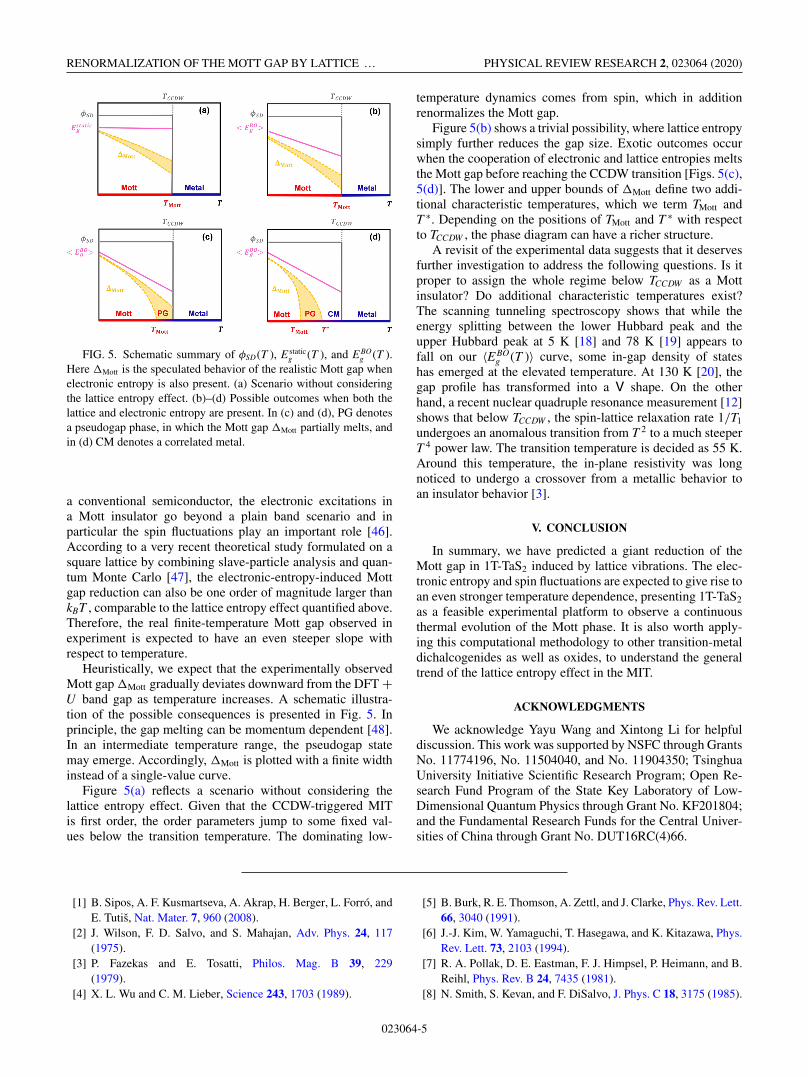
respect to the equilibrium lattice structures at different latticetemperatures. A sharp metal-insulator transition takes placeconcurrently with the CCDW transition. Figures 4(a)–4(d)plot the static band structures at four typical lattice temper-atures, which only show a marginal dependence on the latticetemperature below TC .
Figures 4(e)–4(h) plot the instant energy levels at the �
point as a function of MD duration. At 5 K, the gap size agreeswell with the static band structure, despite slight temporalfluctuations. At higher temperatures, the temporal fluctuationssignificantly reduce the static gap size. At 275 K, instant levelcrossings can be observed, indicating that the system is closeto the phase transition. The time-averaged band gap 〈EBO
g 〉 asa function of the lattice temperature is plotted in Fig. 3(c).The gap size decreases by half, from around 0.4 eV at 5 K toaround 0.2 eV at TC . It is remarkable that �〈EBO
g 〉/kB�T is ofthe order of −10, indicating that a small variation of the latticekinetic energy can result in a huge impact on the electronicstructure.
023064-3
CHENG, ZHANG, QIAO, WANG, LIU, AND LIU PHYSICAL REVIEW RESEARCH 2, 023064 (2020)
FIG. 3. Temperature dependence of (a) the CCDW order param-eter φSD, (b) the static DFT + U (=2.27 eV) band gap E static
g , and(c) the time-averaged Born-Oppenheimer band gap 〈EBO
g 〉. The errorbar in (c) is calculated from the standard deviation of the instant EBO
g .(d) Correlation between EBO
g and the effective parameters in Eq. (1)from MLWF analysis. The numbers on top denote the seven timeslices marked in Figs. 4(e)–4(g).
Seven instant structures are picked from Figs. 4(e)–4(g),and the single-electron parameters in Eq. (1) are extractedvia wannierization. In Table I we list the obtained values of�cs, the nearest neighbor tcs, and the six dominating tss’s asvisualized in Fig. 7 of Ref. [18]. By plotting them against EBO
g
in Fig. 3(d), a clear correlation between �cs and EBOg can be
observed, while the hopping parameters do not play an activerole. Note that the plotted tss is an average of the six tss’s inTable I.
TABLE I. Effective parameters in Eq. (1) from MLWF analysis.The second column contains the previous data obtained from thefully relaxed structure [18]. Columns 3–9 correspond to the seveninstant MD lattice structures marked in Figs. 4(e)–4(g).
Unit (eV) [18] (1) (2) (3) (4) (5) (6) (7)
�cs 0.212 0.215 0.192 0.117 0.067 0.164 0.140 0.066tcs 0.162 0.153 0.148 0.142 0.142 0.154 0.160 0.156tss1 0.150 0.141 0.155 0.111 0.183 0.131 0.118 0.200tss2 0.091 0.093 0.092 0.092 0.093 0.081 0.094 0.094tss3 0.072 0.063 0.064 0.073 0.071 0.060 0.065 0.068tss4 0.050 0.052 0.048 0.052 0.048 0.043 0.048 0.045tss5 0.042 0.038 0.035 0.037 0.032 0.027 0.032 0.031tss6 0.042 0.030 0.024 0.026 0.023 0.018 0.023 0.023
IV. DISCUSSION
The comparison between E staticg and 〈EBO
g 〉 clearly indicatesthat the driving force is not the static CCDW amplitude butthe dynamical vibrations. This is in general related to thestrong electron-phonon coupling, as expected from the CDWformation.
Specifically, the Wannier function analysis reveals �cs asthe key parameter strongly coupled to phonons. The centralrole of �cs during the MIT in 1T-TaS2 coincides with thesite-selective Mott transition scenario originally proposed forthe rare-earth nickelates [45]. Namely, an on-site potentialdifference (�cs) associated with a lattice distortion (φSD) leadsto a site-selective (|ci〉) localization. The insight from the MDsimulation is that even when the mean value of φSD is fixed,its fluctuation can still result in giant renormalization of theelectronic gap.
It is difficult to quantify the electronic temperature effectin a Mott insulator of such a complicated supercell, notto mention in combination with lattice dynamics. Unlike in
FIG. 4. (a)–(d) Static DFT + U (=2.27 eV) band structures calculated from the time-averaged lattice structures at different temperatures.(e)–(h) Time evolution of the instant energy levels at the � point within the last 4 ps of the MD simulation. The vertical dashed lines markseven time slices used to extract the data in Fig. 3(d). The pink and green bands indicate different spins.
023064-4
RENORMALIZATION OF THE MOTT GAP BY LATTICE … PHYSICAL REVIEW RESEARCH 2, 023064 (2020)
FIG. 5. Schematic summary of φSD(T ), E staticg (T ), and EBO
g (T ).Here �Mott is the speculated behavior of the realistic Mott gap whenelectronic entropy is also present. (a) Scenario without consideringthe lattice entropy effect. (b)–(d) Possible outcomes when both thelattice and electronic entropy are present. In (c) and (d), PG denotesa pseudogap phase, in which the Mott gap �Mott partially melts, andin (d) CM denotes a correlated metal.
a conventional semiconductor, the electronic excitations ina Mott insulator go beyond a plain band scenario and inparticular the spin fluctuations play an important role [46].According to a very recent theoretical study formulated on asquare lattice by combining slave-particle analysis and quan-tum Monte Carlo [47], the electronic-entropy-induced Mottgap reduction can also be one order of magnitude larger thankBT , comparable to the lattice entropy effect quantified above.Therefore, the real finite-temperature Mott gap observed inexperiment is expected to have an even steeper slope withrespect to temperature.
Heuristically, we expect that the experimentally observedMott gap �Mott gradually deviates downward from the DFT +U band gap as temperature increases. A schematic illustra-tion of the possible consequences is presented in Fig. 5. Inprinciple, the gap melting can be momentum dependent [48].In an intermediate temperature range, the pseudogap statemay emerge. Accordingly, �Mott is plotted with a finite widthinstead of a single-value curve.
Figure 5(a) reflects a scenario without considering thelattice entropy effect. Given that the CCDW-triggered MITis first order, the order parameters jump to some fixed val-ues below the transition temperature. The dominating low-
temperature dynamics comes from spin, which in additionrenormalizes the Mott gap.
Figure 5(b) shows a trivial possibility, where lattice entropysimply further reduces the gap size. Exotic outcomes occurwhen the cooperation of electronic and lattice entropies meltsthe Mott gap before reaching the CCDW transition [Figs. 5(c),5(d)]. The lower and upper bounds of �Mott define two addi-tional characteristic temperatures, which we term TMott andT ∗. Depending on the positions of TMott and T ∗ with respectto TCCDW , the phase diagram can have a richer structure.
A revisit of the experimental data suggests that it deservesfurther investigation to address the following questions. Is itproper to assign the whole regime below TCCDW as a Mottinsulator? Do additional characteristic temperatures exist?The scanning tunneling spectroscopy shows that while theenergy splitting between the lower Hubbard peak and theupper Hubbard peak at 5 K [18] and 78 K [19] appears tofall on our 〈EBO
g (T )〉 curve, some in-gap density of stateshas emerged at the elevated temperature. At 130 K [20], thegap profile has transformed into a V shape. On the otherhand, a recent nuclear quadruple resonance measurement [12]shows that below TCCDW , the spin-lattice relaxation rate 1/T1
undergoes an anomalous transition from T 2 to a much steeperT 4 power law. The transition temperature is decided as 55 K.Around this temperature, the in-plane resistivity was longnoticed to undergo a crossover from a metallic behavior toan insulator behavior [3].
V. CONCLUSION
In summary, we have predicted a giant reduction of theMott gap in 1T-TaS2 induced by lattice vibrations. The elec-tronic entropy and spin fluctuations are expected to give rise toan even stronger temperature dependence, presenting 1T-TaS2
as a feasible experimental platform to observe a continuousthermal evolution of the Mott phase. It is also worth apply-ing this computational methodology to other transition-metaldichalcogenides as well as oxides, to understand the generaltrend of the lattice entropy effect in the MIT.
ACKNOWLEDGMENTS
We acknowledge Yayu Wang and Xintong Li for helpfuldiscussion. This work was supported by NSFC through GrantsNo. 11774196, No. 11504040, and No. 11904350; TsinghuaUniversity Initiative Scientific Research Program; Open Re-search Fund Program of the State Key Laboratory of Low-Dimensional Quantum Physics through Grant No. KF201804;and the Fundamental Research Funds for the Central Univer-sities of China through Grant No. DUT16RC(4)66.
[1] B. Sipos, A. F. Kusmartseva, A. Akrap, H. Berger, L. Forró, andE. Tutiš, Nat. Mater. 7, 960 (2008).
[2] J. Wilson, F. D. Salvo, and S. Mahajan, Adv. Phys. 24, 117(1975).
[3] P. Fazekas and E. Tosatti, Philos. Mag. B 39, 229(1979).
[4] X. L. Wu and C. M. Lieber, Science 243, 1703 (1989).
[5] B. Burk, R. E. Thomson, A. Zettl, and J. Clarke, Phys. Rev. Lett.66, 3040 (1991).
[6] J.-J. Kim, W. Yamaguchi, T. Hasegawa, and K. Kitazawa, Phys.Rev. Lett. 73, 2103 (1994).
[7] R. A. Pollak, D. E. Eastman, F. J. Himpsel, P. Heimann, and B.Reihl, Phys. Rev. B 24, 7435 (1981).
[8] N. Smith, S. Kevan, and F. DiSalvo, J. Phys. C 18, 3175 (1985).
023064-5
CHENG, ZHANG, QIAO, WANG, LIU, AND LIU PHYSICAL REVIEW RESEARCH 2, 023064 (2020)
[9] R. Manzke, O. Anderson, and M. Skibowski, J. Phys. C 21,2399 (1988).
[10] R. Manzke, T. Buslaps, B. Pfalzgraf, M. Skibowski, and O.Anderson, Europhys. Lett. 8, 195 (1989).
[11] K. Law and P. A. Lee, Proc. Natl. Acad. Sci. USA 114, 6996(2017).
[12] M. Klanjšek, A. Zorko, R. Žitko, J. Mravlje, Z. Jaglicic, P. K.Biswas, P. Prelovšek, D. Mihailovic, and D. Arcon, Nat. Phys.13, 1130 (2017).
[13] M. Kratochvilova, A. D. Hillier, A. R. Wildes, L. Wang, S.-W.Cheong, and J.-G. Park, npj Quantum Mater. 2, 42 (2017).
[14] A. Ribak, I. Silber, C. Baines, K. Chashka, Z. Salman, Y.Dagan, and A. Kanigel, Phys. Rev. B 96, 195131 (2017).
[15] A. S. Ngankeu, S. K. Mahatha, K. Guilloy, M. Bianchi, C. E.Sanders, K. Hanff, K. Rossnagel, J. A. Miwa, C. B. Nielsen, M.Bremholm, and P. Hofmann, Phys. Rev. B 96, 195147 (2017).
[16] J. Ravnik, I. Vaskivskyi, T. Mertelj, and D. Mihailovic, Phys.Rev. B 97, 075304 (2018).
[17] K. Rossnagel, J. Phys.: Condens. Matter 23, 213001 (2011).[18] S. Qiao, X. Li, N. Wang, W. Ruan, C. Ye, P. Cai, Z. Hao, H.
Yao, X. Chen, J. Wu et al., Phys. Rev. X 7, 041054 (2017).[19] D. Cho, Y.-H. Cho, S.-W. Cheong, K.-S. Kim, and H. W. Yeom,
Phys. Rev. B 92, 085132 (2015).[20] I. Lutsyk, M. Rogala, P. Dabrowski, P. Krukowski, P. J.
Kowalczyk, A. Busiakiewicz, D. A. Kowalczyk, E. Lacinska,J. Binder, N. Olszowska et al., Phys. Rev. B 98, 195425(2018).
[21] F. Zwick, H. Berger, I. Vobornik, G. Margaritondo, L. Forró, C.Beeli, M. Onellion, G. Panaccione, A. Taleb-Ibrahimi, and M.Grioni, Phys. Rev. Lett. 81, 1058 (1998).
[22] D. F. Shao, R. C. Xiao, W. J. Lu, H. Y. Lv, J. Y. Li, X. B. Zhu,and Y. P. Sun, Phys. Rev. B 94, 125126 (2016).
[23] R. Ang, Y. Tanaka, E. Ieki, K. Nakayama, T. Sato, L. J. Li, W. J.Lu, Y. P. Sun, and T. Takahashi, Phys. Rev. Lett. 109, 176403(2012).
[24] L. Li, W. Lu, X. Zhu, L. Ling, Z. Qu, and Y. Sun, Europhys.Lett. 97, 67005 (2012).
[25] Y. Liu, R. Ang, W. Lu, W. Song, L. Li, and Y. Sun, Appl. Phys.Lett. 102, 192602 (2013).
[26] Y. Yu, F. Yang, X. F. Lu, Y. J. Yan, Y.-H. Cho, L. Ma, X. Niu,S. Kim, Y.-W. Son, D. Feng, S. Li, S.-W. Cheong, X. H. Chen,and Y. Zhang, Nat. Nanotechnol. 10, 270 (2015).
[27] D. Cho, S. Cheon, K.-S. Kim, S.-H. Lee, Y.-H. Cho, S.-W.Cheong, and H. W. Yeom, Nat. Commun. 7, 10453 (2016).
[28] T. Ritschel, J. Trinckauf, K. Koepernik, B. Büchner, M. v.Zimmermann, H. Berger, Y. I. Joe, P. Abbamonte, and J. Geck,Nat. Phys. 11, 328 (2015).
[29] Q. Han and A. Millis, Phys. Rev. Lett. 121, 067601 (2018).[30] A. B. Georgescu, O. E. Peil, A. S. Disa, A. Georges, and A. J.
Millis, Proc. Natl. Acad. Sci. USA 116, 14434 (2019).[31] J. D. Budai, J. Hong, M. E. Manley, E. D. Specht, C. W. Li, J. Z.
Tischler, D. L. Abernathy, A. H. Said, B. M. Leu, L. A. Boatneret al., Nature (London) 515, 535 (2014).
[32] G. G. Guzmán-Verri, R. T. Brierley, and P. B. Littlewood,Nature (London) 576, 429 (2019).
[33] G. Kresse and J. Furthmüller, Comput. Mater. Sci. 6, 15 (1996).[34] G. Kresse and J. Furthmüller, Phys. Rev. B 54, 11169 (1996).[35] G. Kresse and D. Joubert, Phys. Rev. B 59, 1758 (1999).[36] J. P. Perdew, K. Burke, and M. Ernzerhof, Phys. Rev. Lett. 77,
3865 (1996).[37] S. L. Dudarev, G. A. Botton, S. Y. Savrasov, C. J. Humphreys,
and A. P. Sutton, Phys. Rev. B 57, 1505 (1998).[38] P. Darancet, A. J. Millis, and C. A. Marianetti, Phys. Rev. B 90,
045134 (2014).[39] S. Nosé, Mol. Phys. 52, 255 (1984).[40] S. Nosé, J. Chem. Phys. 81, 511 (1984).[41] D. M. Bylander and L. Kleinman, Phys. Rev. B 46, 13756
(1992).[42] A. A. Mostofi, J. R. Yates, Y.-S. Lee, I. Souza, D. Vanderbilt,
and N. Marzari, Comput. Phys. Commun. 178, 685 (2008).[43] G. Kotliar, S. Y. Savrasov, K. Haule, V. S. Oudovenko, O.
Parcollet, and C. A. Marianetti, Rev. Mod. Phys. 78, 865 (2006).[44] See Supplemental Material at http://link.aps.org/supplemental/
10.1103/PhysRevResearch.2.023064 for the equilibrium latticedynamics of 1T-TaS2 at 5, 100, 275, and 300 K.
[45] H. Park, A. J. Millis, and C. A. Marianetti, Phys. Rev. Lett. 109,156402 (2012).
[46] P. A. Lee, N. Nagaosa, and X.-G. Wen, Rev. Mod. Phys. 78, 17(2006).
[47] X.-J. Han, C. Chen, J. Chen, H.-D. Xie, R.-Z. Huang, H.-J.Liao, B. Normand, Z. Y. Meng, and T. Xiang, Phys. Rev. B 99,245150 (2019).
[48] T. Maier, M. Jarrell, T. Pruschke, and M. H. Hettler, Rev. Mod.Phys. 77, 1027 (2005).
023064-6