The Effect of Paddle Stroke Variables Measured by ... - MDPI
Upload
khangminh22Category
view
0download
0
The insulator-metal phase transitionin VO2 measured at
nanometer length scales andfemtosecond time scales
by
Luciana Vidas
Thesis supervisor:Dr. Simon Wall
A thesis submitted in fulfilment of the requirementsfor the degree of Doctor of Philosophy
in
Ultrafast Dynamics of Quantum Solids
ICFO – Institut de Ciències FotòniquesUPC – Universitat Politècnica de Catalunya
Barcelona, February 2019


Thesis committee:
Dr. Roman Bertoni (Institut de Physique de Rennes, France)Prof. Dr. Kai Rossnagel (DESY – Deutsches Elektronen-Synchrotron, Ger-many)Prof. Dr. Adrian Bachtold (ICFO – Institut de Ciències Fotòniques, Spain)


Abstract
The physics of transition-metal oxides presents a challenge to our current un-derstanding of condensed matter physics. The main difficulty arises from acompetition between electron-electron and electron-phonon interactions to dic-tate the properties of these complex materials. This issue is particularly appar-ent in vanadium dioxide, which undergoes an electronic and structural phasetransition close to room temperature. Despite more than 50 years of research,the origin of the transformation is still actively debated, with contradictoryinterpretations often reported.
The main goal of this thesis is to re-evaluate the phase transition in VO2with a combination of new experimental techniques, ranging from the mid-infrared to hard x-rays, that can probe the transformation at nanometer lengthscales and femtosecond time-scales. This allows to disentangle the roles ofphase separation, laser-induced heat, and electron and phonon dynamics tothe insulator-metal transition. The results from these experiments providea unified and new picture of the nature of this process, both in and out ofequilibrium, in which the electron-phonon interactions are the main drivingmechanism.
Furthermore, the new techniques and analysis presented here for VO2 canbe applied to the study of other controversial complex materials that exhibitremarkable properties, and answer thereby some of the key outstanding ques-tions in condensed matter physics.
v


Resumen
La física de los óxidos de metales de transición constituye un gran desafío anuestra comprensión actual de la materia condensada. El mayor obstáculosurge de la competición entre las interacciones electrón-electrón y electrón-fonón para dictar las propiedades de tales materiales complejos. Este problemaes particularmente evidente en el dióxido de vanadio, el cual experimenta unatransición de fase tanto electrónica como estructural a una temperatura liger-amente superior a la ambiente. A pesar de más de 50 años de investigaciones,el origen de la transformación sigue siendo motivo de debate, con multitud deinterpretaciones a menudo contradictorias.
El objetivo principal de esta tesis es reevaluar la transición aislante-metalde VO2 empleando una combinación de técnicas experimentales nuevas, desdela región del infrarrojo medio a los rayos X duros, que permiten el estudio dela transición de fase a escalas nanométricas y en tiempos de femtosegundos.Esto facilita el esclarecimiento de los roles que desempeñan aspectos como laseparación de fases, el calor inducido por láser y las dinámicas de electrones yfonones en la transición de fase de VO2. Los resultados de estos experimentosofrecen una visión unificada sobre la naturaleza de este fenómeno, tanto enequilibrio como fuera de él, en la que la interacción de los electrones con fononesson el principal mecanismo responsable de impulsar la transición.
Asimismo, los análisis y técnicas nuevos presentados en esta tesis parael estudio de VO2 pueden ser empleados para la investigación de otros mate-riales complejos que también exhiben propiedades extraordinarias y cuyo en-tendimiento presenta serias controversias. De esta manera, se daría respuesta aalgunas de las preguntas clave pendientes de la física de la materia condensada.
vii


Contents
Abstract v
Resumen vii
Introduction 3
1 An overview on VO2 91.1 The physics of VO2 . . . . . . . . . . . . . . . . . . . . . . . . . 10
1.1.1 Goodenough model . . . . . . . . . . . . . . . . . . . . . 111.1.2 Mott scenario . . . . . . . . . . . . . . . . . . . . . . . . 141.1.3 The phase diagram of VO2 . . . . . . . . . . . . . . . . 17
1.2 Evidence for a monoclinic metallic phase . . . . . . . . . . . . . 211.3 Phase-transition dynamics . . . . . . . . . . . . . . . . . . . . . 24
2 Phase separation 292.1 Introduction . . . . . . . . . . . . . . . . . . . . . . . . . . . . . 302.2 Lensless X-ray spectro-holography . . . . . . . . . . . . . . . . 32
2.2.1 Coherent imaging fundamentals . . . . . . . . . . . . . . 322.2.2 Soft X-ray absorption spectroscopy . . . . . . . . . . . . 37
2.3 Resonant holography on VO2 . . . . . . . . . . . . . . . . . . . 412.3.1 Mask-sample fabrication . . . . . . . . . . . . . . . . . . 412.3.2 Samples characterization . . . . . . . . . . . . . . . . . . 422.3.3 Experimental details . . . . . . . . . . . . . . . . . . . . 44
2.4 Nanoscale phase separation during the IMT of VO2 . . . . . . . 482.4.1 Metallic domain growth . . . . . . . . . . . . . . . . . . 482.4.2 The role of phase coexistence in the IMT . . . . . . . . 502.4.3 Discussion . . . . . . . . . . . . . . . . . . . . . . . . . . 56
2.5 Conclusions . . . . . . . . . . . . . . . . . . . . . . . . . . . . . 58
3 The role of heat in the phase transition of VO2 613.1 Introduction . . . . . . . . . . . . . . . . . . . . . . . . . . . . . 62
ix

Contents
3.2 The recovery dynamics of a thin film of VO2 . . . . . . . . . . 673.2.1 Threshold fluences comparison . . . . . . . . . . . . . . 773.2.2 Thermal model . . . . . . . . . . . . . . . . . . . . . . . 793.2.3 Quantitative results of the recovery dynamics of VO2 . 813.2.4 Pump spot-size effect . . . . . . . . . . . . . . . . . . . 863.2.5 Discussion . . . . . . . . . . . . . . . . . . . . . . . . . . 88
3.3 Threshold-fluence measurements in the visible-MIR regime . . 903.4 Conclusions . . . . . . . . . . . . . . . . . . . . . . . . . . . . . 93
4 Structural dynamics across the phase transition 974.1 Introduction . . . . . . . . . . . . . . . . . . . . . . . . . . . . . 984.2 Time-resolved X-ray absorption spectroscopy . . . . . . . . . . 102
4.2.1 Experimental details . . . . . . . . . . . . . . . . . . . . 1034.2.2 Transient XAS spectra . . . . . . . . . . . . . . . . . . . 1054.2.3 Heat effects in the structural transition . . . . . . . . . 1104.2.4 Transient optical response under equivalent conditions . 1114.2.5 The photo-excited metallic state . . . . . . . . . . . . . 1144.2.6 Discussion . . . . . . . . . . . . . . . . . . . . . . . . . . 118
4.3 Time-resolved hard X-ray diffuse scattering of VO2 . . . . . . . 1194.3.1 Ultrafast disordering of vanadium dimers . . . . . . . . 1214.3.2 Fluence dependence of the structural transition . . . . . 1264.3.3 Discussion . . . . . . . . . . . . . . . . . . . . . . . . . . 129
4.4 Conclusions . . . . . . . . . . . . . . . . . . . . . . . . . . . . . 131
5 Conclusions and outlook 135
A Towards time-resolved holography 141
Abbreviations 147
Publications 149
Bibliography 163
Acknowledgements 165
x

List of Figures
1 The Mott vs Peierls competition. . . . . . . . . . . . . . . . . . 5
1.1 Crystallographic structures of VO2. . . . . . . . . . . . . . . . . 101.2 Schematic energy levels of the d-orbitals in a transition-metal ion. 121.3 Schematic of the band structures proposed by Goodenough. . . 131.4 Electronic band structures in a Mott phase transition. . . . . . 161.5 Schematic hysteresis curves of single crystals and thin films. . . 181.6 Phase diagram of VO2. . . . . . . . . . . . . . . . . . . . . . . . 19
2.1 Coherent diffraction imaging setup. . . . . . . . . . . . . . . . . 332.2 X-ray transmission spectra of VO2 at the O K -edge. . . . . . . 392.3 Polarization-dependent X-ray transmission spectra of VO2 at
the O K -edge. . . . . . . . . . . . . . . . . . . . . . . . . . . . . 402.4 Holography mask. . . . . . . . . . . . . . . . . . . . . . . . . . 412.5 Temperature-dependent optical transmission of the employed
thin-film sample of VO2. . . . . . . . . . . . . . . . . . . . . . . 422.6 Raman spectrum of the employed thin-film sample of VO2. . . 432.7 VO2 X-ray transmission spectra across the V L- and O K -edges. 432.8 Schematic Fourier-transform holography setup. . . . . . . . . . 442.9 Comparison of SEM with holography images. . . . . . . . . . . 482.10 Metallic domain thermal growth. . . . . . . . . . . . . . . . . . 492.11 Nanoscale relative spectrum of a metallic domain. . . . . . . . 502.12 SEM of the VO2 sample used for phase-identification analysis. . 512.13 Polarization-resolved imaging in VO2. . . . . . . . . . . . . . . 522.14 RGB colour-encoded images. . . . . . . . . . . . . . . . . . . . 532.15 Threshold images of domain growth in VO2. . . . . . . . . . . . 542.16 Temperature-dependent growth of two phases in VO2. . . . . . 552.17 Local transition pathways within the phase diagram of VO2. . . 56
3.1 Fluence-dependent optical/X-ray response during the photo-inducedphase transition of VO2. . . . . . . . . . . . . . . . . . . . . . . 62
xi

List of Figures
3.2 Optical pump-probe experimental setup. . . . . . . . . . . . . . 683.3 Time traces at 50Hz repetition rate, room temperature, atmo-
spheric pressure. . . . . . . . . . . . . . . . . . . . . . . . . . . 693.4 Time traces at 50Hz repetition rate, room temperature, in vac-
uum. . . . . . . . . . . . . . . . . . . . . . . . . . . . . . . . . . 713.5 Time traces at 50Hz repetition rate, 90K, in vacuum. . . . . . 733.6 Time traces at 500Hz repetition rate, room temperature, at
atmospheric pressure. . . . . . . . . . . . . . . . . . . . . . . . 753.7 Time traces at 500Hz repetition rate, 90K, in vacuum. . . . . 773.8 Fluence-dependent transmission change at 1µs for Cases 1-4. . 783.9 Simulated dynamic response to photo-excitation via a tempera-
ture model. . . . . . . . . . . . . . . . . . . . . . . . . . . . . . 803.10 Simulated dynamic response to photoexcitation at 50Hz, room
temperature, and atmospheric pressure. . . . . . . . . . . . . . 823.11 Thermal model parameters for the dynamic response at 50Hz,
room temperature, and atmospheric pressure. . . . . . . . . . . 833.12 Simulated dynamic response to photoexcitation at 50Hz, 90K,
and vacuum conditions. . . . . . . . . . . . . . . . . . . . . . . 843.13 Thermal model parameters for the dynamic response at 50Hz,
90K, and vacuum conditions. . . . . . . . . . . . . . . . . . . . 853.14 Comparison of the fluence-dependent transmission change at
1 µs after excitation with pump pulses of different spot-sizes. . 863.15 Comparison of the thermal model parameters for excitations
with different pump spot-sizes. . . . . . . . . . . . . . . . . . . 873.16 MIR pump-probe experimental setup. . . . . . . . . . . . . . . 913.17 Fluence-dependent transmission change at 1 ps in the visible-
MIR regime. . . . . . . . . . . . . . . . . . . . . . . . . . . . . . 92
4.1 Transition mechanisms between the M1 and R phases. . . . . . 994.2 X-ray transmission spectra of VO2 at the O K -edge. . . . . . . 1044.3 Timings of the pumped and unpumped probe signals. . . . . . . 1044.4 Fluence dependent XAS spectra of VO2. . . . . . . . . . . . . . 1064.5 Fluence dependence of the π∗ and d‖ states. . . . . . . . . . . . 1074.6 Comparison of transient and static spectra. . . . . . . . . . . . 1084.7 Time delay scans at 529 eV and 530.5 eV. . . . . . . . . . . . . . 1094.8 Transient XAS spectra of the insulating and metallic states. . . 1104.9 Transmission as a function of fluence in the pumped and un-
pumped channels. . . . . . . . . . . . . . . . . . . . . . . . . . . 1114.10 White-light generation pump-probe experimental setup. . . . . 1124.11 Transient optical response at 600 nm. . . . . . . . . . . . . . . . 114
xii

List of Figures
4.12 Photoexcited metallic-state model. . . . . . . . . . . . . . . . . 1174.13 Total X-ray scattering for displacive and order-disorder transitions.1214.14 Scheme of the experimental setup for time-resolved XDS. . . . 1224.15 Total X-ray scattering patterns of the low- and high-temperature
structures. . . . . . . . . . . . . . . . . . . . . . . . . . . . . . . 1234.16 Time dependence of the Bragg peaks and diffuse scattering. . . 1244.17 Lattice potentials and V-V bonding upon photo-excitation. . . 1264.18 Pump fluence dependence of the diffuse scattering and an M1
Bragg peak. . . . . . . . . . . . . . . . . . . . . . . . . . . . . . 1274.19 Below- and above-threshold dynamics of a M1 Bragg peak. . . 1284.20 Pump fluence dependence of the optical response. . . . . . . . . 129
A.1 Comparison of the SEM with the holographic image obtained atLCLS. . . . . . . . . . . . . . . . . . . . . . . . . . . . . . . . . 142
A.2 SEM image of a thin sample used for time-resolved holography. 143
xiii


Introduction
Transition-metal oxides (TMOs) exhibit some of the most intriguing phenom-ena observed in condensed matter, which arise from the complex interplay ofelectron and lattice degrees of freedom. In the last few decades, several ma-terials have been discovered with remarkable exotic properties, such as high-temperature superconductivity, colossal magneto-resistance, charge and orbitalordering, or insulator-metal transitions. These extraordinary phenomena havethe potential to revolutionize both the technology of the future, as well as ourapproach to condensed matter physics. However, such properties cannot becurrently harnessed for the design of novel solid-state devices due to the lackof a proper theoretical framework that explains the behaviour of these complexmaterials.
Band-structure theory successfully predicts the properties of materials inwhich one basic physical interaction is clearly dominant over all the others. Forinstance, insulators and metals are considered systems with weakly interactinglocalized and delocalized wave-functions, respectively, in which the bands areset by the symmetry of the lattice, but otherwise fixed. Thus, their insulatingor metallic nature is simply the result of the position of the Fermi energywithin the band structure. The simple application of band theory does notdescribe correctly the properties of TMOs, for which often a metallic state ispredicted when the material is actually an insulator. Furthermore, in this typeof systems, changes in doping and/or temperature can lead to phase transitions.This occurs due to multiple degrees of freedom interacting on similar energyscales that strongly affect the physical properties of these materials.
Traditionally, the missing component for the theoretical models to workwas believed to be related to electronic correlations. This has given rise to theconcept of strongly correlated materials. The well-known Mott insulators be-long to this group. These are materials predicted to be metals by conventionalband theory due to the non consideration of electron-electron interactions, butshow an insulating behaviour. However, besides these neglected interactions,
3

Introduction
it is also worth considering the fact that in order to make band-theory calcu-lations mathematically tractable, approximations on phonon interactions arealso needed. This simplification could also explain the observed deviations ofexperiments from theory without the need of adding electronic-correlations-related components.
One of the key challenges in condensed matter physics is to determinethe relative contributions of electron-electron and electron-phonon interactions,typified by two simplified theoretical models that capture the basic concepts ofthese physical interactions. This is known as the Mott vs Peierls competition.While in the former, strong Coulomb interactions between electrons stand asthe cause of the observed properties, in the latter scenario the crystallographicdistortion and electron-phonon interactions are responsible for determining thespecific behaviour of the material (see Fig. 1).
One of the first materials in which the Mott vs Peierls competition wasstudied is vanadium dioxide (VO2). VO2 is a transition-metal oxide that un-dergoes an insulator-metal phase transition (IMT) at approximately 340K.This effect was first discovered by Morin in 1959 [1], and shortly after, in 1961,it was shown that the system also undergoes a structural change [2]. For morethan 50 years, an enormous amount of experimental and theoretical researchhas been devoted to determining the relative contributions of the electronic andstructural degrees of freedom to this phase transition. In 1971, Goodenoughwas the first to propose a Peierls-like lattice distortion as the origin of thephenomenon [3], in which the dimerization, or pairing, of the vanadium atomsacts as the driving force for the phase transition. Nonetheless, some years later,in 1975, Zylbersztejn and Mott suggested that electronic correlations are themain responsible for opening the insulator band-gap, as in a typical Mott in-sulator, and proposed a Mott-Hubbard model for the description of the phasetransition of VO2 [4].
From the experimental side, results pointing to both scenarios have beenreported. Driven by the discovery in 1971 that the insulator-metal transitionin VO2 can be induced by light pulses in an ultrafast way [5], a new approachwas adopted for studying the phase transition. Probing the process out ofequilibrium has enabled the separate examination of the electronic and lat-tice contributions, as the respective responses can be disentangled in the timedomain.
VO2 has in fact represented a key material for the development of ultrafastmethods. However, the results provided by subsequent time-resolved studiesof the phase transition have presented several discrepancies, and nowadays, a
4

Introduction
unified description of this phenomenon still lacks. The aim of this thesis isto address the key challenges involved when examining the phase transition inVO2, such as phase separation and coexistence, heat-related issues, and phonondynamics. To this end, a broad range of techniques are applied to probe thedifferent aspects of the material and build thereby a complete comprehensionof the phase transition.
Fig. 1: The Mott vs Peierls competition. Mott: (a) In themetallic phase, large screening leads to delocalized bands with largebandwidths, B1 and B2, and weak repulsion U . (b) Screening reduc-tion gives rise to a high Coulomb interaction, which localizes electronsand leads to the insulating phase. Peierls: (c) In the metallic state,the electron states are filled up to the Fermi energy, and the latticeis a periodic array of atoms with lattice constant a. (d) When low-ering the temperature, the system gains energy by pairing the atoms,changing thereby the periodicity of the atomic chain. This effectivedoubling of the unit cell leads to the formation of band-gaps at halfthe original Brillouin zone.
5

Introduction
Thesis outline
The structure of this thesis is organized as follows:
• Chapter 1 gives an introduction on the physics of VO2 and the insulator-metal phase transition, together with the current state of the research.The specific challenges needed to be overcome for studying this phe-nomenon are described in detailed, as well as the methods proposed todo so.
• Chapter 2 presents the phenomena of phase separation and coexistence,which hinder the interpretation of measurements conducted on VO2. Asoft X-ray holographic imaging technique is successfully applied for thefirst time on VO2 to address this issue.
• Chapter 3 focuses on the measurements of the threshold fluences re-quired to drive the photo-induced phase transition, with the contribu-tion of laser-induced heat issues. A pump-probe-measurement approachis employed over long time-scales to study heat dissipation dynamics, ofparticular importance in ultrafast experiments.
• Chapter 4 studies the dynamics of phonon interactions during the phasetransition by means of time-resolved soft X-ray absorption spectroscopy,and ultrafast hard X-ray total scattering.
• Finally, chapter 5 summarizes the main achievements of the present the-sis, along with a prospect of future experiments to be performed.
6


1 | An overview on VO2
This chapter presents a summary of the extensive research performedon vanadium dioxide up to the present day. It involves more than50 years of measurements, from which only the most relevant for thepresent work are mentioned. Section 1.1 is focused on the descrip-tion of the physical properties of VO2, as well as the theoretical modelsproposed for understanding the insulator-metal phase transition. Thesequence of measurements and theoretical calculations points towardsthe importance of two different aspects regarding the phase transitionthat need careful consideration in order to understand the physical ori-gin of the IMT: the existence of a transient monoclinic metallic phase,covered in Section 1.2, and the ultrafast dynamics of the photo-inducedphase transition, introduced in Section 1.3.
9

Chapter 1 An overview on VO2
1.1 The physics of VO2
Vanadium dioxide is a correlated transition-metal oxide that exhibits an elec-tronic and structural phase transition as a function of temperature. At approx-imately 340K [1], VO2 undergoes a first-order reversible phase transition froma low-temperature monoclinic M1 phase to a high-temperature rutile R phase.Concurrently, an increase of up to five orders of magnitude of the conductivityoccurs, switching the material from an insulator to a metal. The correspondingcrystallographic structures for temperatures below and above Tc are displayedin Fig. 1.1, and the lattice parameters of each phase are summarized in Ta-ble 1.1. These values were obtained from X-ray diffraction experiments on VO2in the rutile [6, 7] and in the monoclinic phase [7, 8].
2.8
5 Å
a
bc
a b
c
3.1
6 Å
2.6
2 Å
Ru�le (T > Tc) Monoclinic (T < Tc)
Fig. 1.1: Crystallographic structures of VO2. Vanadium atomsare represented by the red balls, while the oxygen atoms are in blue.For temperatures above Tc, the material has a rutile structure (left),which transforms into a monoclinic lattice (right) when lowering thetemperature below Tc. The unit cell is indicated by the dashed line.
Lattice a (Å) b (Å) c (Å)M1 5.75 4.53 5.38R 4.55 = a 2.85
Table 1.1: Lattice parameters of the monoclinic and rutile phases ofVO2 obtained by X-ray diffraction experiments [6, 8].
10

1.1 The physics of VO2
As in many transition-metal compounds, metal ions (vanadium in thiscase) are surrounded by oxygen anions (or ligands) forming an octahedral struc-ture. At high temperature, the metallic phase has a rutile crystal structure,with each unit cell containing two vanadium and four oxygen atoms (Fig. 1.1).When the temperature is decreased below Tc, the vanadium atoms dimerizeforming V-V pairs along the rutile c-axis with two different V-V bond lengths:a short intra-dimer length of 2.62Å and a longer inter-dimer length of 3.16Å,in contrast to the equally spaced V-V bonds from the rutile phase. This leadsto the doubling of the unit cell, which now contains four vanadium and eightoxygen atoms. Dimerization is accompanied by a slight tilt of the dimers awayfrom the c-axis in a zigzag-like pattern, resulting in one of the V-O separationsshorter than the rest. As opposed to the vanadium ions, the oxygen atoms areonly slightly disturbed across the phase transition. In the low-temperature M1phase, an insulating gap of ≈ 0.6 eV has been measured [9, 10]. Altogether,the crystallographic change from a monoclinic to a rutile structure constitutesan increase of symmetry and a volume change of ∼ 0.044 % [11, 12], as well asa transition from an insulating to a metallic electronic structure.
Whereas the crystal structures of VO2 could be easily determined by X-ray diffraction measurements, the electronic configurations have been muchmore elusive, and different theoretical models have been proposed to describethem and the mechanism that drives the transformation from one phase to theother. A first description of the electronic structure in both phases was givenby Goodenough based on crystal-field theory and the lattice distortion [3].Later on, due in principle to the inability of this model to reproduce the rightmagnitude of the band-gap in the insulating phase, Mott and Zylbersztejnargued that electronic correlations must be included in the calculations [4].The models proposed by Goodenough and Mott, which gave rise to the so-called Peierls vs Mott competition, are described in detail in the following.
1.1.1 Goodenough model
In order to understand the band-theory model proposed by Goodenough, abrief introduction to crystal-field theory is required. Vanadium, as a transition-metal ion, has five d orbitals: dxy, dyz, dxz, dx2−y2 , and dz2 . When isolated orsurrounded by a field with spherical symmetry, these five orbitals have the sameenergy, i.e., they are degenerate. However, in the presence of an octahedralcrystal field, as the one formed by the oxygen atoms in VO2 (Fig. 1.1), thisdegeneracy is lifted due to the charge interactions of the metal cation and theligands, in which the d-electrons closer to the ligands have a higher energy than
11

Chapter 1 An overview on VO2
those further away. The V 3d orbitals are then split in energy into threefold-degenerate t2g states, built from the dx2−y2 , dxz, and dyz orbitals, and twofold-degenerate eg states, comprising the dxy and dz2 orbitals, as illustrated inFig. 1.2. The latter have higher energy, as these orbitals are closer to theligands and experience therefore more Coulomb repulsion.
x
yzx y
z
eg
t2g
Spherical field Octahedral field VO2 Ru�le structure
d-orbitals
(a) (b) (c)
σ*}3dxy3dz2
3dx2-y2
3dxz 3dyzπ*dǁ
}}
Fig. 1.2: Schematic energy levels of the d-orbitals in atransition-metal ion. (a) The five d-orbitals of the ion placed ina crystal field with spherical symmetry are degenerate. (b) Whenthe ion is located within an octahedral crystal field, the d-orbitals aresplit into twofold-degenerate eg orbitals and threefold-degenerate t2gorbitals. (c) A distortion of the octahedron along the z-axis, as in thecase of the rutile phase of VO2, the orbitals degeneracies are furtherlifted. The crystal structure corresponds to the rutile unit cell withthe c-axis along x, with the angular part of the d‖ = dx2−y2 orbitalrepresented. Adapted from [13].
According to Goodenough’s model [3], schematically illustrated in Fig. 1.3,because of the orthorhombic component of the crystal field, the t2g states arefurther split into two π∗ states, formed by the 3dxz and 3dyz orbitals, whichpoint in between the ligands and have a component along the z-axis, and one d‖state, formed by the relatively non-bonding 3dx2−y2 orbitals, which are parallelto the rutile c-axis and mediate hence the V-V bonds. On the other hand, the3dz2 and 3dxy orbitals, that point towards the ligands, constitute the σ∗ states,which, given their σ-bonding nature, present the strongest p-d overlap and the
12

1.1 The physics of VO2
largest energy difference between the bonding and antibonding orbitals.
During the insulator-metal transition, the vanadium atoms dimerize alongthe rutile c-axis, leading to the splitting of the d‖ band into filled bonding andempty antibonding states. In addition, the tilting of the dimers in the zigzagpattern aforementioned increases the p-d bonding and leads to the lift in en-ergy of the π∗ states above the Fermi level (see Fig. 1.3(b)). This shift hasbeen found to be of ≈ 0.5 eV, with the π∗ band located at the lower edge ofthe conduction band, well below the antibonding d‖ band [10, 13]. In addition,a change in the width of the π∗ band is also found, narrowing from 2.5 eVin the rutile phase to 2 eV in the monoclinic phase. Therefore, the insulatorstate is regarded as the result of the vanadium zigzag distortion with the assis-tance of dimerization, and strong electron-phonon interactions as the drivingmechanism for the phase transition.
R M1
π*d||
σ*
σ
π
d||*
d||
π*
σ
π
σ*
EF
(a) (b)
Fig. 1.3: Schematic of the band structures proposed by Good-enough above and below the phase transition. (a) In the rutilestructure, VO2 exhibits a metallic behaviour due to the location ofthe π∗ and d‖ states, crossing the Fermi level. (b) At temperaturesbelow Tc, VO2 has a monoclinic structure, in which the dimerizationand tilting of the vanadium ions lead to the division of the d‖ bandand the upwards shift of the π∗ states that result in the opening of aninsulating band-gap.
It is worth mentioning that this model and later theoretical calculationsbuilt upon it [13, 14] are benefited from the very small mixing of these states,with the exception of the hybridization of the V 3d and O 2p orbitals that giverise to the π∗ states. In fact, the d‖ and π∗ bands can be regarded as nearlyindependent, with a one-dimensional d‖ band embedded in a three-dimensionalbackground of π∗ states, resulting in a proper scenario for a structural Peierlsdistortion. This, together with the fact that in d1 compounds the energy gain
13

Chapter 1 An overview on VO2
from lowering the occupied electronic states is larger than the energy cost ofthe lattice distortion, and the absence of magnetic properties in the insulatingphase, makes VO2 a suitable Peierls insulator. In materials that present sucha Peierls instability, electron-phonon interactions act as the main force for thedimerization and resulting change in periodicity of the one-dimensional atomschain [15, 16], as previously seen in Fig. 1.
Nonetheless, in the early days, these theoretical models within a band-structure framework were unable to explain both phases of VO2 at the sametime. Calculations based on density functional theory (DFT) within the localdensity approximation (LDA), despite yielding correct crystallographic struc-tures and describing a significant distortion of the energy bands around theFermi level [14], dramatically failed to reproduce a finite band-gap in the mon-oclinic structure required for the insulating behaviour observed [13, 14]. Thisfact led to the belief that the energy gain obtained via the lattice distortionwas not enough to account for the opening of the band-gap, but calculationsmust include a parameter U associated to electronic interactions.
1.1.2 Mott scenario
In 1975, shortly after Goodenough’s publication, Zylbersztejn and Mott pro-posed a Mott-Hubbard model to describe the phase transition in VO2 [4]. Whilein single-electron band theory it is assumed that interactions between electronscan be represented by an average effective periodic potential, and that no dy-namical interactions occur (which is actually the basis for DFT methods), thetheoretical work presented by Mott placed electronic correlations as the pri-mary force driving the phase transition in VO2, with the lattice distortion onlyas a side effect [4].
In this scenario, VO2 is described as a Mott insulator, in which the on-siteCoulomb repulsion between electrons become comparable to the single-electronbandwidth, which makes necessary the addition of this term into the model.Therefore, the description of the system is based on a Hubbard’s model for asystem with interacting particles [17], represented by a two-terms Hamiltonian,which includes the tunnelling of electrons between sites of the lattice t, andthe on-site Coulomb interaction U :
H = −t∑
(i,j),σ
(c†i,σcj,σ + c†j,σci,σ
)+ U
∑i
ni↑ni↓ (1.1)
14

1.1 The physics of VO2
In this equation, t is the transfer integral that represents the kinetic energyof electrons hopping between atoms, (i, j) stands for the summation over allnearest-neighbour lattice sites, c†i,σ and ci,σ are the creation and annihilationoperators for electrons of spin σ at site i, and ni,σ = c†i,σci,σ gives the numberoperator that represents the density of electrons at site i with spin σ.
In the non-interacting limit, the first term leads to a metallic behaviourwhen the system is half filled, and is simply the Hamiltonian in regular bandtheory. On the other hand, in the strongly interacting limit, the second termfavours charge localization and hence an insulating behaviour. For the case ofVO2, the opening of a band-gap can be regarded then as a competition betweenthe U Coulomb interactions of vanadium 3d electrons and the transfer integralt of the 3d electrons tunnelling to neighbouring atoms.
Zylbersztejn and Mott attributed the electronic correlations that lead tothe opening of the band-gap in VO2 to the strong electron-electron interac-tions occurring in the d‖ band. In the metallic state, though, these Coulombinteractions are well screened by the π∗ states. When lowering the tempera-ture of the system, the charge density is reduced and so is the screening, untilthe Coulomb potential gets high enough to support bound states, localizingelectrons away from the conduction band causing the splitting of the d‖ band,as already seen in in Fig. 1.
The band-gap opened in such a system was first formulated by Mott inthe form:
Egap = U − 12 (B1 +B2) , (1.2)
where U is the Hubbard intra-atomic correlation energy (Coulomb repulsion),and B1 and B2 are the bandwidths of the upper (empty) and lower (occupied)Hubbard bands. In this scenario, the M1 phase transforms to the R phase onlywhen the free electron density reaches a certain threshold sufficient to screenthe strong Coulomb interactions.
The inclusion of the U term in DFT calculations led to a different concep-tion of the phase transition, in which the electronic and structural transitionsare no longer concomitant, with only a causal relation between them. This de-coupling results in the existence of an intermediate state between the IMT andthe structural transition that presents a monoclinic lattice exhibiting metallicproperties. The electronic band structure at each phase for such a material isillustrated in Fig. 1.4. The intermediate monoclinic metallic phase, depicted in
15

Chapter 1 An overview on VO2
purple, consists of a split d‖ band as in the M1 phase, together with π∗ statesoverlapping with the Fermi level, as in the R phase.
EF
R metal
π*d||
σ*
σ
π
(a)M1 insulator
d||*
d||
π*
σ
π
σ*
(c)
d||*d||
π*
σ
π
σ*
M1* metal(b)
Fig. 1.4: Electronic band structure in a Mott phase transition.(a) In the metallic phase with the rutile structure, both the π∗ andd‖ states overlap with the Fermi level. (b) In the intermediate phase,the d‖ band is split due to a reduction of screening and the structurechanges into monoclinic. However, the metallic behaviour remains asthe π∗ states barely shift. (c) In the insulating monoclinic phase,Coulomb interactions lead to an increase separation of the π∗ bondingand antibonding states, and the band-gap is further enlarged.
Such DFT+U method has been applied by several theoretical studies todescribe the physics leading to the phase transition in VO2 [18, 19]. However,despite yielding the right opening of the insulating band-gap in the monoclinicphase, the description of the system has not been perfect, as it failed to predictthe magnetic ground state of VO2 [20]. Fortunately, theoretical models andcalculation methods have evolved in the last years and led to more consistentresults. It has been demonstrated that band-theory based on DFT calculationsis capable of describing the insulator-metal transition in VO2 and all the in-volved phases, provided that the appropriate hybrid functionals are used [21],without the need of introducing any other interaction parameters.
The obvious contradictions between the theoretical models suggested byGoodenough and Mott have been translated into the experimental domain aswell. Several experiments have reported conflicting results on VO2, some sup-porting the electronic correlations scenario, while others point towards electron-phonon interactions as the driving mechanism. In order to reveal the true roleof electronic correlations in the phase transition, these studies have been fo-cused on two key aspects. Firstly, the observation of the intermediate statepredicted by Mott with a monoclinic structure and metallic properties would
16

1.1 The physics of VO2
provide unambiguous evidence for the electronic nature of the phase transi-tion, as its existence would mean that if electron-electron interactions could bescreened, the M1 phase would be metallic. Secondly, studying the phase transi-tion in the time domain would reveal the true nature of the process, given thatelectrons have been traditionally considered to act on much faster time scales(typically of a few femtoseconds) than phonons (of hundreds of femtoseconds– picoseconds) [22].
However, one of the main reasons for the current discrepancies betweendifferent experiments is that the interpretation of results have been generallyhindered by the phenomenon of phase separation, common to many correlatedmaterials and directly related to the strain and type of sample, and the exis-tence of more than one insulating phase in VO2. Therefore, before addressingthe methods for distinguishing between an electron- or phonon-driven transi-tion, the physics of VO2 should be discussed beyond the M1-R transition.
1.1.3 The phase diagram of VO2
In VO2, as in many correlated materials, the specific characteristics of thephase transition, such as the transition temperature and sharpness, are stronglydependent on the strain within the sample measured. In fact, by measuring thetemperature-dependent hysteresis curves of VO2 across the phase transition,useful information about the strain within the sample, and thereby its quality,can be obtained, directly related to the transition temperature and hysteresiswidth.
Several studies of the correlation between crystal structure and hysteresiscurves have been performed, arriving to the conclusions that large transitionwidths in films can be attributed to local differences related to the presenceof grains with different sizes, defects densities and strain interactions [7, 23,24]. Samples grown by diverse methods present different hysteresis curvesdue to their particular insulator-metal domain structure. Figure 1.5 displaysa schematic comparison of the resistivity hysteresis curves as a function oftemperature followed by a high-quality single crystal, where single-domain be-haviour is expected, and a thin film, in which multiple domains coexist duringthe transition. Experimentally, it has been observed that, while transitions insingle crystals can be very sharp and occur within 0.01K [7], even the highest-quality thin films can show broadened transition widths that span several de-grees in temperature [25], which result from different regions of the sampleswitching at different temperatures. This variation indicates the presence ofdefects that locally modify the transition temperature.
17

Chapter 1 An overview on VO2
Fig. 1.5: Schematic hysteresis curves. Resistance as a functionof temperature of a single crystal (a) and a thin film (b)
Measurements on VO2 were originally conducted on single crystals, whichprovide a more pure response on the behaviour of the material. However, thelattice distortion and the derived volume change that occur across the phasetransition are enough for bulk single crystals to break when subjected to ther-mal cycling, i.e., repeated heating and cooling cycles across TC [26]. Therefore,the majority of the experiments have been conducted on polycrystalline thinfilms of VO2, which can withstand the strain arising from the lattice distortions.More recently, a type of sample has been developed that unites both desiredqualities, namely, high quality together with an ability to accommodate strain:single-crystals nanobeams [27–36]. These free-standing nanomaterials can besubjected to tunable uniaxial strain and, due to their lack of extended struc-tural defects, can resist much higher strain (> 3 %) than their bulk counterpart(< 0.2 %) without fracturing [35, 36]. These properties enable the investigationof strained states otherwise inaccessible and, thereby, the stress-temperaturephase diagram of VO2, which involves other phases than the already mentionedM1 and R.
Indeed, the application of Cr-doping [37] or uniaxial strain along the rutilec-axis [38] on VO2 samples led to the discovery already in the early days, thatVO2 can exist in two other insulating states, besides the monoclinic M1 [37, 38]:a second monoclinic structure, M2, and a triclinic structure, T. As depicted inFig. 1.6(a), while in the M1 phase, the pairing and zigzag displacements areobserved in each chain of V atoms, in the M2 phase there are two differenttypes of chains, displaying either dimerization or the zigzag pattern, but notboth. On the other hand, T is an intermediate structure, in which those chainsthat are dimerized in the M2 phase start to tilt, and those tilted start to pair,until both distortions are the same as in the M1 phase. The boundaries of eachstate in the phase diagram of VO2 were roughly determined in 2010 via thestudy of bent nanobeams [36].
It was not until recently, though, that the solid-state triple point compris-
18

1.1 The physics of VO2
ing the M1, M2 and R phases was exactly located, and the phase diagram ofVO2 mapped out with unprecedented precision through the study of individualsingle-crystal nanobeams [39]. Before that, the general consideration was thata sample with no strain at all presented a direct transition from M1 to R atTc. The mentioned work found this assignment not true, and revealed thatthe triple point is precisely at the zero-stress point, which matches thus Tc(see Fig. 1.6(b)). This fact is consistent with early thoughts regarding the freeenergies of M1 and M2, believed to lie very close around Tc, being thereforethe reason for the difficulty in the stabilization of pure M2 [38].
Ten
sile
str
ess
(GPa
)
T
M2
RM1
Temperature ( C)
0.6
0 0
4
60
Ttr=Tc=65 0.1 C
70 8050
Strain (x1
0-3)
R
M1 M2T
cR
(a) (b)
Fig. 1.6: Phase diagram of VO2. (a) Arrangement of vanadiumatoms chains along the rutile c-axis in the different phases of VO2. Thethree insulating phases present different dimerization degrees and/ortilting. (b) The schematic stress-temperature phase diagram indicatesthe boundaries of each phase and the location of the solid-state triplepoint, which matches that of the transition temperature at zero stressand leads to phase competition near the IMT. The system can takedifferent paths when transforming from M1 to R, involving the othertwo insulating phases: M2 and T.
According to this phase diagram, the insulator-metal transition in VO2can be complicated by high strain values or high doping, which can inducethe presence of the M2 phase [13, 30, 31, 38, 40]. Also, given the locationof the triple point, VO2 exhibits an extreme sensitivity to external factors.The phase transition is thus harder to interpret, as the transition pathway caneasily involve other phases beyond the generally considered M1 and R phases.
Nonetheless, as mentioned before, the studies on VO2 intended for re-vealing the true nature of the phase transition have focused on the search ofa monoclinic metallic phase and the dynamics of the transformation, often
19

Chapter 1 An overview on VO2
neglecting, though, the issue of phase separation and the existence of otherphases. This is discussed in the following sections.
20

1.2 Evidence for a monoclinic metallic phase
1.2 Evidence for a monoclinic metallic phase
The simultaneous measurement of the electronic and structural properties ofVO2 during the insulator-metal phase transition is no simple task, which com-plicates the potential observation of a metal-like monoclinic phase. Further-more, the transient nature of such a phase makes the measurement of its elec-tronic states more of a challenge. Several experiments employing various tech-niques have attempted to achieve this over the years. In 2007, Arcangelettiet al. claimed decoupled insulator-metal and M1-R transitions at high pres-sure by measuring the mid infrared (MIR) reflectivity and Raman spectra asa function of applied pressure [41]. The former probes the optical band-gap,while the latter provides information about the lattice. Applying pressure tothe sample compresses the lattice, increasing orbital overlap and electronicbandwidth. This way, they aimed to monitor independently the electronic andstructural transitions, which were found to occur at different pressures. How-ever, although the conductivity increased, it was not shown whether the systemswitched into a truly metallic phase.
Later, in 2010, Yao et al. attempted as well to perform such a simul-taneous measurement, in which they tracked the electrical resistivity and thetwisting angle of the vanadium dimers by temperature-dependent in situ X-rayabsorption fine structure (XAFS), in combination with DFT calculations [42].They observed stabilization of the metallic state caused by the melting of V-Vdimers before the rutile symmetry was adopted, that is, before the twistingangle was completely vanished. In this range, an intermediate monoclinic-like structure with metallic character was detected. With further developmentof in situ observation techniques, a breakthrough regarding this subject in2014, when Laverock et al. reported a direct observation of decoupled struc-tural and electronic components of the insulator-metal transition in VO2 [43].By comparing electron microscopy images of VO2 thin films, which probedtheir crystallographic structure, with photoemission spectroscopy to explorethe electronic properties of each phase at selected temperatures across thephase transition, they discovered that within 60–80 ◦C the fraction of metallicphase predicted by photoemission spectroscopy was much larger than the totalamount of metallic domains observed in the microscopy images. Therefore,they concluded that within this temperature range the sample is formed bya mixture of rutile metallic and monoclinic metallic phases, with the latterascribed to a possible weakening of the bonds that constitute the V-V dimers,as predicted by Zylbersztejn and Mott [4].
The phenomenon of electronic and structural transitions occurring at dif-
21

Chapter 1 An overview on VO2
ferent temperatures was also observed in 2016 by Gray et al. via X-ray ab-sorption spectroscopy on thin films of VO2. In this experiment, by assigningdifferent XAS features to the electronic correlations and to the structural dis-tortion, and measuring their temperature dependence, they suggested thatcorrelations within the V-V dimers weaken some temperature degrees beforethe crystallographic transition takes place. In this three-step scenario, similarto [43], several degrees below the IMT, in the monoclinic-insulating phase, thetwo 3d1 electrons of the dimerized V atoms form a strongly correlated singletstate, which start to soften with increasing temperature until they become weakenough for the band-gap to collapse. In the final step, the crystal structuregets distorted as a consequence.
In conclusion, the experiments that report evidence on a monoclinic-likemetallic phase suggest that vanadium dimers play an important role in thephase transition, in which the softening and loss of the strong correlationswithin them lead to the formation of the intermediate transient correlatedphase. The constitution of strongly correlated vanadium singlet pairs result-ing from the strong dimerization is supported as well by electronic-structurecalculations based on cluster dynamical mean-field theory (CDMFT) [44].
However, the above-listed results share two common aspects that are worthmentioning. Firstly, the assumption of spatially homogeneous insulator-metalphase transitions in the employed VO2 thin films. Despite claiming high-qualitysamples, thin films are not comparable to high-quality single-domain crystals,which is evidenced by the transition sharpness and hysteresis curves they dis-play. Moreover, many of the samples employed are epitaxial thin films, grownon substrates such as Al2O3, which present an aggravating aspect regardingbiaxial strain that results from the lattice mismatch between both films. There-fore, the premise based on homogeneous probing may not be fully correct andthe system response might be more complex to interpret than a simple M1-to-Rtransition. Secondly, the evidence provided for the existence of an intermedi-ate monoclinic-metallic phase is rather indirect, in the sense that at least twoseparated experiments employing different techniques need to be performed inorder to measure the electronic and structural aspects of the phase transition.Given the extreme sensitivity of these thin films to external parameters, itwould be no surprise that different experimental conditions lead to differentresults.
Moreover, despite the volume fraction across the phase transition beingstudied in [43], this was not directly measured. Proper direct information onthe volume fraction of the constituents of the phase transition in VO2 is re-quired in order to understand the true evolution of it. To date, no technique
22

1.2 Evidence for a monoclinic metallic phase
has been able to directly probe the electronic and structural components si-multaneously with sufficient spatial resolution to ensure homogeneous probing.As a consequence, the question regarding the existence of a monoclinic metallicphase and, if so, the position of it within the phase diagram of VO2 (Fig. 1.6),remains unanswered.
The large controversy with respect to the so-called Mott vs Peierls com-petition is due to a large extent to a poor comprehension of the near-thresholdbehaviour of VO2, hindered by domain formation and phase separation prevent-ing the direct measurement of the intrinsic electronic and structural propertiesof the material. Therefore, techniques able to probe with nanoscale spatialresolution are imperative for a full understanding of the insulator-metal phasetransition in VO2.
23

Chapter 1 An overview on VO2
1.3 Phase-transition dynamics
The reported experiments so far rely on static techniques to study the phasetransition in VO2, such as Raman spectroscopy [40, 41], electron diffraction [6,8], and photoemission spectroscopy [10, 43]. While these are suitable for cap-turing the properties of the monoclinic-insulating and rutile-metallic phases ofVO2, they lack the ability to unambiguously determine cause-effect relation-ships in a material in which more than one degree of freedom are changingsimultaneously, such as electron and lattice contributions. Therefore, in orderto access the characteristic short time scales of these competing interactionsand disentangle their responses in real time, ultrafast time-resolved studies arean ideal approach.
Such measurements make use of the so-called pump-probe technique, inwhich the material is excited by a strong laser pulse generating a non-equilibriumstate that is subsequently tracked by a weaker pulse of either laser light, X-rays or electrons. The time delay between both pulses can be controlled in away that enables the monitoring in real time of the redistribution of energyamong different degrees of freedom of the system. In fact, the electronic andcrystallographic phase transition in VO2 can be induced and probed in such amanner, paving the way for revealing the nature of its driving mechanism.
The main focus of ultrafast experiments has been the determination ofthe time scales necessary for the phase transformation completion after pho-toexcitation. These values have shown a tendency to decrease over the yearsas advances in the techniques employed have provided improved temporal res-olutions. The first time-resolved experiments on VO2, conducted by Cavalleriet al. in 2001, that probed the electronic and structural dynamics by meansof femtosecond visible-light and X-ray pulses, reported a subpicosecond struc-tural transition in VO2 when excited by sufficiently high laser fluences [45].A later experiment with superior temporal resolution measured the transientreflectivity and transmission, which showed the existence of a limiting timescale for the completion of the phase transformation [46]. No faster transitionthan 80 fs was observed, even when exciting with pump pulses with a timeduration as short as 15 fs. This time delay between photoexcitation and thephase transition occurrence was attributed to a structural bottleneck related toan optical phonon period that connects the initial and final structures. Thisresult pointed towards a Peierls-driven phase transition in VO2.
These initial experiments inspired many subsequent reports of the photo-induced phase transition in VO2, and further efforts have been made for disen-
24
1.3 Phase-transition dynamics
tangling the electronic and structural contributions. A large amount of thesestudies have claimed a temporal decoupling of the electronic and crystallo-graphic transitions. In 2006, Kim et al. conducted the first simultaneous anal-ysis of both transitions by means of an optical pump-probe experiment, whichconcluded in the existence of a transient monoclinic and correlated metal [19].The observation of a time delay between electron rearrangement and the struc-tural transition has also been reported by measurements of the time-dependentoptical and electrical properties [47–49], and by ultrafast electron diffraction(UED) experiments [50, 51].
The emergence of such a transient monoclinic metallic phase implies thatthe time scales necessary for closing the band-gap are shorter than those re-quired for making changes in the lattice structure. This sequence has beengenerally attributed to the generation of holes at the top of the valence bandby photo-excitation, as proposed by the static observations of the monoclinicmetal [52, 53], which strongly enhances the screening of the Coulomb interac-tions through free carriers, leading to the collapse of the band-gap. An instan-taneous band-gap collapse after photo-excitation was indeed suggested frommeasurements by Wegkamp et al. by means of time-resolved photoemissionspectroscopy [54].
As a consequence of the ultrafast onset of the phase transition, whichrules out the presence of a structural bottleneck, together with the evolution ofthe electronic and structural transformations over multiple time scales, time-resolved ultrafast measurements have in general tended for a Mott-physics-mediated phase transition in VO2. The general assumption has been thatthe temporal dynamics of the phase transition provides information about thenature of the driving mechanism and hence enables to distinguish between atransformation dictated by Mott physics or by a Peierls distortion. Withinthis picture, if driven by electronic correlations, the transition should occurin a prompt manner, as photoexcitation originates suddenly a charge redistri-bution and a consequent change in screening. On the other hand, if drivenby electron-phonon interactions, the lattice needs to change before the band-gap can be closed, so that the time scales for the transition are set by atomicmotion, resulting in a slower transformation. However, in a non-equilibriumsituation, the lattice potential, which determines the phonon spectrum of thesolid, may respond in shorter time scales than the atomic motion towards theirnew equilibrium positions. In fact, the lattice response out of equilibriumhas not been as extensively studied as electron dynamics, and therefore a fullcomprehension of phonon dynamics across the phase transition is still missing.
Attempts on studying the lattice evolution across the phase transition in
25

Chapter 1 An overview on VO2
VO2 have been made by means of ultrafast elastic X-ray [45, 55] and electron-diffraction [50, 51, 56] experiments. These techniques make use of the Braggpeaks recorded to obtain information about the ionic positions, the disturbanceof which after photo-excitation is translated into changes in the correspondingBragg peaks. Electron-diffraction experiments performed this way by Baumet al. in 2007 [56], by Tao et al. [50] in 2012, and Morrison et al. [51] in2014, in combination with optical techniques, led to the conclusions that thestructural and electronic transitions are temporally decoupled and a photo-induced metal-like phase of monoclinic VO2 exists in between them, just asthe ultrafast optical measurements previously mentioned.
A problem emerges, though, with the fact that Bragg peaks probe theequilibrium position of the ions, but not the dynamics of the lattice potential,which sets the driving force for the atomic motion and may not be concomitantin a non-equilibrium situation. As an approach to overcome this limitation,Wall et al. suggested that changes in the lattice symmetry can be measuredthrough the evolution of the phonon spectrum across the phase transition bythe optical transient reflectivity of VO2, with sub-50-fs time resolution [57].This way, they observed a dramatic phonon collapse occurring immediatelyafter photoexcitation before ionic rearrangement could take place, suggestingthat energy transfer from electrons to the lattice proceeds faster than usuallyexpected. The “fast”-electrons vs “slow”-phonons scenario is then stronglychallenged, with a lattice-mediated phase transition now compatible with thereported ultrafast photo-induced phase transition. An extensive analysis of therole of lattice vibrations during the out-of-equilibrium insulator-metal phasetransition in VO2 is hence necessary in order to clarify the observed discrep-ancies and elucidate the true driving mechanism. Furthermore, whether theultrafast phase transition is fundamentally different from the equilibrium ther-mal behaviour is a question that remains still open.
26


2 | Phase separation
This chapter introduces one of the major challenges when studyingthe insulator-metal phase transition in VO2: phase coexistence on thenanoscale. This property, overlooked in VO2 and correlated materialsin general, makes it necessary to employ techniques with the abilityto spatially resolve the response of the material at nanometer lengthscales. In Section 2.1, an introduction to the phase-coexistence phe-nomenon is presented, followed in Section 2.2 by a description of theemployed technique in this thesis to approach the problem: resonantsoft X-ray holographic imaging. The performed experiment is describedin Section 2.3 while the results achieved on imaging the insulator-metalphase transition in VO2 are presented in 2.4. The chapter ends withconclusions in Section 2.5.
29

Chapter 2 Phase separation
2.1 Introduction
Correlated materials are known for their sensitivity to external parameters,such as strain, magnetic fields and chemical doping. Small variations in theseparameters can drive the system into different phases with widely diverse,and often contradictory, properties, such as magnetism, superconductivity, orinsulating-metallic states. The domains of such phases can coexist, leadingto the so-called phase separation [58]. In manganites, for instance, phase co-existence on the nanoscale is believed to be key for understanding the colos-sal magneto-resistance effect [59], while superconductivity and charge-density-wave order coexist in the cuprates [60–62] and pnictides [63, 64]. As a result,inhomogeneity may play an important role in a wide range of correlated ma-terials.
As explained in Section 1.1.3, recent research on this topic has in factdemonstrated that VO2 sits close to a solid-state triple point close to roomtemperature [39]. As a result, the material exhibits an extreme sensitivity toexternal factors, so that small changes in parameters such as temperature orstress can drive the system into different phases beyond the generally consid-ered M1 and R phases. Due to the strong first-order nature of the phase tran-sition in VO2, these phases can coexist in spatially separated regions reachingsizes of several micrometers. Such a phase competition is strongly dependent onthe sample type [65]. Thin films are much more defective than single crystals,which, together with strain inhomogeneity arising from the substrate, makethe former more sensitive to external parameters, modifying the transforma-tion kinetics and causing the transition from M1 to R to be more complex tointerpret.
The small length-scales of this phase separation and the lack of contrastmechanisms make it extremely challenging to measure real-space images ofthe coexisting phases with high spatial resolution. Yet, these images are vitalfor understanding how this phenomenon, and the consequent domain bound-aries, dictate the material properties. Recent experiments have employed var-ious imaging techniques to visualize the formation of domains of the differentphases during the insulator-metal transition in VO2. Infrared near-field spec-troscopy [65] and nanoscale X-ray-diffraction measurements [66] have shownhow, close to the transition temperature, phase separation occurs and localdefects and strain can cause different regions of the sample to switch at differ-ent temperatures. On the other hand, optical microscopy on single-crystallinenanobeams have demonstrated the effect of strain in the formation of alternat-ing nanoscale insulator-metal domains in a striped pattern [27, 32].
30

2.1 Introduction
As discussed in Section 1.2, several investigations have reported evidencefor decoupled electronic and structural transitions, in which an additional phaseis observed with a monoclinic structure but metallic properties. But so far, theemployed methods have provided indirect evidence of such transient phase,as the probes average over large sample areas or require multiple techniquesto probe the different phases. Hence, no real-space image of the monoclinicmetallic phase has yet been measured.
In order to assess the existence of each phase and the role they play duringthe phase transition, a method that can image with nanometer spatial reso-lution and is sensitive to both electronic and structural degrees of freedom isnecessary. Resonant soft X-ray holography is an ideal tool to overcome thischallenge, as it exploits the power of element and polarization specificity ofsoft X-ray absorption spectroscopy (XAS) as the source for imaging contrast,and it has also the potential to be extended to the time-domain, enabling thecapture of the spatial growth of transient states in the near future.
31

Chapter 2 Phase separation
2.2 Lensless X-ray spectro-holography
X-ray holography belongs to a group of techniques named as Coherent Diffrac-tion Imaging (CDI) that have drawn great attention in the past decade asa new and much-simpler form of aberration-free microscopy with a resolutiononly limited, in principle, by the X-rays wavelength. Conventional microscopesrely on the use of imaging optics, such as lenses, to form the magnified imageof a certain object. However, the difficulty in fabricating high-resolution lensesfor X-rays in the early days stimulated the interest in a lensless imaging ap-proach, where the optics were replaced by numerical computations. In thebasic scheme, a detector records the distribution of the diffracted X-rays fromthe object of interest obtained by illuminating it with coherent X-rays, andthis pattern is afterwards digitally reconstructed to obtain a real-space imageof the object.
Although nowadays high-resolution X-ray optics, like zone-plates, are muchmore available, their experimental constraints, such as low transmission andthe wavelength-dependent alignment, represent a major drawback with respectto the simpler CDI setup. Specifically, full field transmission X-ray microscopy(TXM) is capable of forming a 2D image in a matter of seconds. However, theneed of using two zone-plates results in the requirement of a great interferomet-ric stability, and also, given the low efficiency of the objective optics, the samplelocated before it receives a high dose of X-rays, making radiation damage abig problem. These issues are overcome by scanning X-ray transmission mi-croscopy (STXM), which employs only one objective zone-plate placed beforethe sample [67, 68]. The disadvantage, though, comes with the longer timesrequired for the large field scanning, which makes this approach unsuitable fortime-resolved measurements. Lensless CDI, on the other hand, is free fromthese experimental disadvantages, and provides a full-field imaging approachthat can be implemented in ultrafast measurements.
2.2.1 Coherent imaging fundamentals
A typical experimental setup for lensless coherent diffraction imaging is formedby three basic elements: coherent X-rays, sample and detector, as schemati-cally illustrated in Fig. 2.1. Note that here diffraction is not related to Braggscattering, but just to the propagation of a wave when it encounters an objectwith a spatial dependent refractive index. In this transmission geometry, theX-rays impinge upon the sample and the diffracted waves propagate a distancez, where they reach the detector. According to the laws of electromagnetic
32

2.2 Lensless X-ray spectro-holography
waves propagation, the far-field diffraction distribution formed at the detectorplane is given by the Fraunhofer approximation in the form:
Ψ(X,Y ) = eikzeik
2z (X2+Y 2)iλz
∞∫∫−∞
ψ(x, y)e−i2πλz
(xX+yY ) dx dy, (2.1)
where ψ(x, y) is the exit wave at the sample plane and the variables are definedin Fig. 2.1. By comparing this expression with the two-dimensional Fouriertransform in space and spatial frequency, i.e.,
F [g(x, y)] = G(u, v) =∞∫∫−∞
g(x, y)e−i2π(ux+vy) dx dy, (2.2)
where u and v are the frequencies in reciprocal space [69], it is evidenced how,aside from multiplicative factors, the diffracted wave recorded at the detector isnothing but the Fourier transform of ψ(x, y) evaluated at the spatial frequenciesu = X/λz and v = Y/λz.
However, detectors are only able to measure intensity(I = |Ψ(X,Y )|2
),
with the phase information being inevitable lost. This is known as the phaseproblem, as a real-space image of the object cannot be obtained with the waveamplitude information alone. The problem of CDI is then reduced to recon-structing ψ(x, y) from I = |Ψ(X,Y )|2.
Fig. 2.1: Coherent diffraction imaging setup. The X-rays beamof wavelength λ impinge on the sample, and the diffracted light isrecorded by a detector in the far field.
33

Chapter 2 Phase separation
Generally, under this imaging approach, the maximum pixel resolution andfield of view achievable are set by the distance between sample and detector inthe following way:
δ = λD
Nω, (2.3)
where δ is the size of the resolution element, or pixel size, λ is the chosen X-rayswavelength, D the distance between sample and camera, and N and ω are thedetector parameters, namely, the number N of pixels of size ω. The field ofview is given then by:
Nδ = λD
ω. (2.4)
As a result, the pixel resolution and field of view are competing quantities.However, in reality, the final object size and resolution are decided by the exactexperimental conditions, as will be discussed later for the particular imagingmethod adopted here.
With the aim of obtaining the reconstructed real-space image ψ(x, y),phase-retrieval numerical algorithms were greatly developed [70, 71], which,together with the increased coherent photon flux delivered by 3rd-generationsynchrotron sources [72, 73], made it possible to achieve the first experimen-tal demonstration of such a technique in a non-crystalline object in 1999 byMiao et al. [74]. Yet, iterative phase-retrieval algorithms require an a prioriknowledge of the object of interest that defines strong real-space constraintsfor the calculations to converge to a solution, which increases in complexitywhen imaging non-binary objects.
X-ray holography fundamentals
In this thesis, a different approach is used to solve the phase problem, based onrecording the phase information of the wave front by encoding it in intensitymodulations, rather than retrieving it by numerical algorithms. This idea,built upon Young’s double-slit interferometer, was first proposed in 1948 byGabor et al. [75], who suggested that by introducing a reference source asidefrom the object, the interference pattern created by both waves would havethe phase information embedded in the form of fringes. This pattern is theso-called hologram, which can deliver the real-space image of the object by
34

2.2 Lensless X-ray spectro-holography
Fourier inversion. A thorough historical review of X-ray holography can befound in [76].
In lensless holography, an additional source is located at the sample planethat generates the reference wave intended to interfere with the wave scatteredfrom the object. Following the notation used in Eq. 2.1, the wave transmittedby the ensemble of object and reference can be written as the superposition ofthe object and reference waves:
ψ(x, y) = o(x, y) + r(x, y), (2.5)
where each of the waves is given by the product of the incoming wave ψ0 withthe transmittance functions, tr(x, y) and to(x, y). Note that o(x, y) and to(x, y)are centred at (0, 0), while r(x, y) and tr(x, y) are centred at d = (dx, dy), all ofthem having a finite size at these areas. According to the Fraunhofer approx-imation, the propagated wave in the far field is then the Fourier transform ofthe transmitted wave:
Ψ(X,Y ) = F {ψ(x, y)} = F {o(x, y)}+ F {r(x, y)}
= O(X,Y ) +R(X,Y ),(2.6)
with capital letters indicating Fourier transforms, and the recorded intensity:
I(X,Y ) = |Ψ(X,Y )|2 = |O|2 + |R|2
= OO∗ +RR∗ +OR∗ +RO∗(2.7)
This sum constitutes what is known as Fourier transform hologram, whichgives the name to the imaging method, Fourier Transform Holography (FTH).Fourier inverting the term corresponding to the object independently is notpossible, but it becomes necessary to calculate the inversion of the full hologramto get the real-space image of interest,
F−1 {I(X,Y )} = F−1{|O|2
}+ F−1
{|R|2
}+ F−1 {OR∗}+ F−1 {RO∗}
= o ? o+ r ? r + o ? r + r ? o
(2.8)
35

Chapter 2 Phase separation
The first two terms are the autocorrelations of the object and reference aper-tures alone, and the last two are the cross-correlation terms derived from theinterference of the waves coming from both apertures. Assuming the referenceis a real function, the cross-correlation term o?r can be considered as a convo-lution, which results in a blurred image of o(x, y). However, if the reference is apoint source small enough to be described by a delta function, and consideringthe convolution with a two-dimensional Dirac distribution results as
f(x, y) ∗ δ(x−X, y − Y ) = f(x−X, y − Y ), (2.9)
the reconstructed wave-field is then given by:
F−1 {I(X,Y )} = o ? o+ δ(x, y)
+ o(x− dx, y − dy)
+ o∗(−x− dx,−y − dy),
(2.10)
where d = (dx, dy) is the distance between object aperture and reference pointsource. Note that the third term is in fact the real-space image of the objectdisplaced a distance d from the center of the reconstructed hologram, and thefourth term represents the inverted conjugate localized in a symmetric oppositeposition. On the other hand, the first two terms, resulting from the autocor-relations of the two apertures, appear centred at the origin of coordinates andrequire extra methods for retrieving useful information out of them.
These equations result in certain constraints for the design of the object-reference ensemble. It should be noticed that the size of the o ? o term is twicethat of the real sample, therefore, the distance between the apertures shouldbe at least twice the sample size to avoid overlap in the reconstruction. Yet,this distance is ultimately limited by the X-rays transverse coherence length.
In Fourier transform holography, the spatial resolution is not limited by thepixel size of the detector, as seen for CDI in Eq. 2.3. Instead, it is dictated bythe spatial bandwidth of the hologram, that is, a higher resolution is achievedin the reconstruction when the hologram captures scattering with a highermomentum transfer. In reality, though, the reference source is not a perfectdelta function, but its finite extent does blur the image and this stands asthe final limitation of the spatial resolution achieved in the reconstruction.However, as tempting as it could be to have the smallest hole achievable, in
36

2.2 Lensless X-ray spectro-holography
doing so, a higher spatial resolution is achieved at the expense of the imagequality, as having less photons going through the reference hole results in adrop of interference recorded. An adequate size needs to be chosen so thata good compromise is achieved between spatial-resolution and signal-to-noiseratio (SNR).
The major technical drawback of Fourier transform holography was there-fore to create a small enough reference source, so that the spatial resolutionachieved would exceed that obtained with an optical microscope. McNulty etal. [77] were the first to accomplish this by using a Fresnel zone plate to cre-ate the bright point reference. The current lensless version of this techniquewas finally accomplished in experiments by Eisebitt et al. [78] and Schlotter etal. [79], who replaced the last lens with a gold mask that contained the micron-sized aperture that defined the object field of view and a sub-100-nm hole asthe off-axis holographic reference. Furthermore, Eisebitt et al. demonstratedthe use of resonantly tuned soft X-rays as the source for contrast in the Fouriertransform hologram, while Schlotter et al. showed how the SNR can be greatlyenhanced by having multiple reference holes in the holography mask withoutincreasing the X-ray dose in the sample. The arrangement of the apertureshad to fulfil the condition that, when translating the object around the mask,it did not overlap with more than one reference hole at a time [80]. These twofeatures constitute the basics of the imaging measurement performed in thisthesis.
2.2.2 Soft X-ray absorption spectroscopy
In this work, X-ray holography is employed to study the insulator-metal phasetransition of VO2. The combination of this imaging technique with soft X-raysthat can be tuned to the vanadium and oxygen resonances stands as an idealapproach. In fact, soft X-ray absorption spectroscopy (XAS) not only provideselement specificity, but is also sensitive to changes in the electronic structurenear the Fermi level, as well as in the crystal field [25, 52, 53, 81–84], whichare important for imaging phase transitions.
XAS is a local process in which the core electrons of the studied mate-rial are promoted to higher, unoccupied states [85]. These core electrons arestrongly localized and have very specific binding energies. The absorption prob-ability of an X-ray photon in such a process is described by the cross-sectiongiven by Fermi’s Golden Rule that states the transition probability between asystem in its initial state Ei and its final state Ef by absorbing an incident
37

Chapter 2 Phase separation
photon with energy hν:
σ ∼ 2π~|〈ψm |H|ψn〉|2 δ (Ef − Ei − hν) , (2.11)
where H is the interaction Hamiltonian, the first and dominant term of whichdescribes the electric dipole transition of the form:
Hdip = e
mcp ·E, (2.12)
with p the electron momentum and E the photon electric field. This innerproduct implies how, in XAS, the polarization of the X-rays provides orbitalsensitivity.
In particular, in soft X-ray absorption, the photon is absorbed by a shal-low core electron and excited to unoccupied levels above the Fermi level [81].Within this energy range, comprised between 300 eV and 1000 eV, the K andL-edges of transition-metal oxides can be investigated. Specifically, in VO2 themain edges are the oxygen K -edge (or 1s) and the vanadium L-edge (or 2p),which have been extensively studied both experimentally and theoretically [86].Because dipole selection rules apply, electrons from an s-orbital can only gointo unoccupied p-orbitals and electrons from p-orbitals can only get excitedinto either unoccupied s- or d-states. In VO2, this means that the O K -edgeprobes 1s→ 2p transitions, and the V L-edge probes 2p→ 3d transitions. How-ever, due to the strong interactions between core holes and valence electronscomparable to the band-width in the vanadium edge, the oxygen edge is easierto interpret, as the spectra resemble the oxygen p unoccupied density of states(DOS) in a first-order approximation [81]. Also, because of the strong covalenthybridization between the O 2p and V 3d orbitals resulting from the crystal-lographic structure of VO2, XAS spectra at the oxygen K -edge also probe the3d orbitals of the vanadium ions. Therefore, many studies on VO2, as well asthe work presented in this thesis, are focused on the oxygen K -edge.
VO2 XAS spectra
Transmission spectra at the oxygen K -edge of a 75-nm-thick VO2 sample areshown in Fig. 2.2. The XAS features (labelled in the graph) are well describedby the crystal-field model, first proposed by Goodenough [3] and presented inSection 1.1.1, that results from the octahedral environment and the consequenthybridization of the O 2p orbitals with the V 3d ones. The first peak in the
38

2.2 Lensless X-ray spectro-holography
spectrum at 529 eV corresponds to transitions into the π∗ states, which shows asmall red shift on entering the metallic phase as the band crosses the Fermi leveland lower-energy transitions can be probed. The second main peak, found at532 eV, is assigned to the σ∗ states, which are higher in energy above the Fermilevel due to a stronger p-d overlap. These states do not show any significantchange across the insulator-metal transition. Between these two peaks there is athird one at 530.5 eV, only observable in the insulating phase, as it correspondsto the unoccupied d‖ band that is split due to the structural distortion in thelow-temperature phase [13, 83, 87]. The insulator-metal transition can then betracked through changes in the π∗ and d‖ states. According to this theoretical
Fig. 2.2: X-ray transmission spectra of VO2 at the O K-edgemeasured at low and high temperatures in the UE52-SGM beamlineat BESSY II.
model, the d‖ bands are derived from the dx2−y2 orbitals parallel to the rutilec-axis that mediate the V-V bonds. Therefore, these states can only be probedwhen the polarization of the X-rays electric-field vector is parallel to the c-axis.As a result, this polarization-sensitive d‖ peak allows the measurement of boththe structural transformation as well as the orientation of the sample c-axis.Figure 2.3 shows the normalized spectra of the insulating phase measured withX-rays parallel and perpendicular to the rutile c-axis, where the d‖ peak is nolonger observable.
Noteworthy, there is an extra polarization-dependent feature noticeablearound 529 eV, labelled as dc‖ in Fig. 2.3, which is not consistent with the π∗
states, as they are isotropic according to the crystal-field model [3]. This small,polarization-dependent shift to lower energies, has been previously observedby other researchers and ascribed to effects resulting from electronic correla-
39

Chapter 2 Phase separation
tions [25, 83], as predicted by CDMFT calculations [44], where electronic cor-relations were shown to provide an additional contribution from the d‖ statesto the bottom of the conduction band due to the formation of a correlatedvanadium singlet-state in the M1 phase. In the metallic phase, this dichroismis lost as the singlets are no longer present in the rutile crystallographic struc-ture. As a result from this interpretation of the spectral features, while the
Fig. 2.3: Polarization-dependent X-ray transmission spec-tra of VO2 at the O K-edge measured at room temperature inBOREAS beamline at the ALBA synchrotron light source.
insulator-metal transition can be tracked through changes in real-space imagesrecorded at the π∗ and d‖ states, the electronic correlation variations can bemeasured via images at the dc‖ state.
40

2.3 Resonant holography on VO2
2.3 Resonant holography on VO2
2.3.1 Mask-sample fabrication
The correct fabrication of the mask-sample ensemble represents a key elementfor the proper functioning of this holography experiment and a few require-ments must be fulfilled. Figure 2.4 illustrates the sample-mask design. VO2thin-film samples were fabricated by collaborators in Richard Haglund, Jr.’sresearch group at Vanderbilt University, to be afterwards processed into a suit-able mask by collaborators from Stefan Eisebitt’s research group at TechnischeUniversität in Berlin.
The 75-nm-thick samples were deposited using Pulsed Laser Deposition(PLD) onto Si3N4 membranes on a silicon support frame featuring a 1.2-µm-thick Cr(5 nm)/Au(55 nm) multilayer on the reverse side. Unlike the Si3N4membrane, the gold multilayer is opaque for the soft X-rays within the energyrange used in this experiment and was used to define the holography mask.A focused ion beam (FIB) was used to mill a circular aperture of diameter2 µm through the gold film, down to the Si3N4 membrane, which defines theobject beam through the sample. Next to this aperture, at a center-to-centerdistance of 4–5 µm, three reference holes with exit diameters of 50–90 nm weredrilled by a FIB through the entire mask-sample arrangement: gold multilayer,Si3N4 membrane, and VO2 sample (see Fig. 2.4(b)). These aperture diameters(object and references) ratio is adequate for the relative sample and referencebeam intensities.
Fig. 2.4: Holography mask. (a) SEM of the mask-sample ensem-ble. The object aperture is in the center of the mask surrounded bythe three reference holes. (b) Drawing from the side of the holographymask.
41

Chapter 2 Phase separation
2.3.2 Samples characterization
Initial characterization of the samples was made by means of optical mea-surements. Knowing the phase-transition temperature of the sample is vitalfor imaging phase coexistence. The optical transmission was measured on awitness sample (without the gold mask used for holography) with white-lightfrom a tungsten-halogen lamp (300–2600 nm) and detected with an amplifiedInGaAs PIN. The hysteresis curves obtained (see Fig. 2.5) are typical of high-quality VO2 films.
!!
"!
#!
$!
%&'(
)*+,-./
0')12(
+22+&1/3)'45/657
89!8:!88!8;!
<-(=-')06'-/3>7
?-)0+1@
/A&&*+1@
Fig. 2.5: Temperature-dependent optical transmission of theemployed thin-film sample of VO2. The hysteretic behaviourshows a width of ∼ 6 K. Courtesy of Kent A. Hallman.
Additionally, given the phase-diagram of VO2 (see Section 1.1) and theconsequent possibility that the initial phase of the sample at room temperatureis other than the generally considered M1 phase, it is crucial to verify the stateof the sample for the correct interpretation of the results obtained. This canbe done by means of a Raman scattering measurement. The correspondingspectrum is shown in Fig. 2.6, which exhibits the characteristic peaks of themonoclinic M1 phase [88].
Finally, before imaging the sample, X-ray absorption spectra were mea-sured in order to find the relevant photon energies. XAS spectra across thevanadium and oxygen L- and K -edges, respectively, were measured via trans-mission of the thin film through the areas not covered by the gold mask, withthe incident X-ray beam parallel to the sample normal. Full spectra at temper-atures below and above the phase-transition temperature are shown in Fig. 2.7,
42

2.3 Resonant holography on VO2
!!!
"!!!
#!!!
$%&'%()&*+,-./.0
1!!! !!"!!#!!2!!
3-4-%+56)7&+,84910
:1+,;%+5)0
Fig. 2.6: Raman spectrum of the employed thin-film sampleof VO2 at room temperature. The observed peaks manifest themonoclinic M1 structure. The two low-frequency modes at ∼ 190 and∼ 220 cm−1 are ascribed to V motion, while the peak at ∼ 620 cm−1
is believed to correspond to the oxygen ions connecting the V chainsalong the c-axis [88, 89]. The saturated peak at ∼ 500 cm−1 arisesfrom the silicon of the substrate. Courtesy of Kent A. Hallman.
while the full discussion regarding the XAS features assignment can be found inSection 2.2.2. According to the differential spectrum, the maximum contrastbetween the insulator and metallic phases can be measured with a photonenergy of 530.5 eV, the energy that probes the splitting of the d‖ band.
!"#
!"$
$"#
$"$
%&'
()*
+))+
,(-.'"/
"0
#1##1$#2##2$#!##!$
34,5,(-6(6&78-.690
$"!
$"$
-:+;;"-%
&'()*
+))+,(-.'
"/"0
-<!-=4')6
->-=4')6
-:+;;"-> <!
Fig. 2.7: VO2 X-ray transmission spectra across the V L-and O K-edges. The differential spectrum (purple trace) shows themaximum contrast between the M1 and R phases at 530.5 eV, thephoton energy that probes the splitting of the d‖ band.
43

Chapter 2 Phase separation
2.3.3 Experimental details
The majority of the holography experiments on VO2 were realized at theUE52-SGM undulator beamline of the BESSY II synchrotron radiation sourceof the Helmholtz-Zentrum Berlin using the ALICE X-ray scattering instru-ment [90]. This beamline provides a coherent soft X-rays beam with a fluxof ∼ 1012 photons with a spectral resolution of 0.1 eV, focused down into a60 µm spot size. Photon energy is variable by means of a monochromator. Byplacing the sample 40 cm downstream of the focus, the beam illuminating theholography mask is approximately 200µm (vertically) x 1mm (horizontally).
The ALICE instrument is equipped with a cryostat and resistive heatersthat allow for the control of the sample temperature below and above Tc witha stability of 0.1K. The detector, a charge-coupled device (CCD), is locatedapproximately 40 cm away from the sample, resulting in an angular acceptanceof 2◦. This geometry corresponds to a maximum detectable in-plane momen-tum transfer of ∼ 90 µm−1 and a maximum spatial resolution, i.e., diffraction-limited, of 35 nm.
Fig. 2.8: Schematic Fourier-transform holography setup. Thecoherent X-rays beam is diffracted by the object and reference aper-tures, the interference pattern of which is recorded in the far field.After Fourier inverting the measured hologram, the real-space imagesof the sample can be obtained.
Fourier-transform holograms were recorded in transmission geometry. Theexperimental setup, illustrated in Fig 2.8, follows the lines of the CDI schemepresented in Fig. 2.1, with the additional holography mask that contains theobject and reference apertures within the same plane. A central black shadowcan be seen in the recorded hologram due to the beamblock located in frontof the CCD that stops the highly intense direct beam from impinging onto thedetector. This beamblock is needed due to the fact that most detectors are not
44

2.3 Resonant holography on VO2
capable of imaging the high dynamic range encountered at low spatial frequen-cies. As a consequence, the information close to zero momentum transfer islost. Details about the effects introduced by the beamblock can be found laterin this section. It is worth mentioning however, that even when no beamblockis used, the scattering data close to q = 0 is still not reliable, as the forwardscattering gets overlapped by direct transmission from the sample. A typicalexposure time of ∼ 5 s per frame was required to record high-angle scattering,which saturates the first Fraunhofer ring (or Airy disk) outside the beamblock.Ten frames were accumulated at each photon energy to improve the countingstatistics in the images.
The recorded hologram in Fig. 2.8 stands as an example of the diffrac-tion measured from the sample. The shadow of the beamblock in the centeris surrounded by the Airy rings that originate from the sample aperture with2 µm diameter. Speckles created from the structure of the sample are visiblethroughout the hologram, in addition to the fringes arising from the object-reference interferences, as observed in the zoomed pattern. In order to recon-struct the images, the hologram is Fourier inverted by means of computationalFast Fourier Transformation (FFT), after first applying a Gaussian high-passfilter to remove effects arising from the abrupt change in intensity caused by thebeamblock. This process results in the reconstruction shown in Fig. 2.8. Thefour terms of Eq. 2.10 are present in this reconstruction: the object-object andreference-reference autocorrelations form the undistinguishable pattern in thecenter of the image, while the six surrounding images are the object-referencecross-correlations from the three reference holes and their complex conjugates.The three object images are independent and identical apart from noise. Av-eraging them improves the image quality, and, since they have the exact sameorientation, this can be done by mere translation of the images.
Beamblock effects
As a consequence from the limited dynamic range of the CCDs used, a beam-block needs to be placed in front of the detector in order to acquire good statis-tics from the high-angle scattering information. The size of the beamblock ischosen appropriately for the optimized acquisition of useful information. Whenthe diameter is too small, the highly intense beam at q = 0 saturates the detec-tor limiting the data quality at higher q range, which results in reconstructedimages with a poor SNR. On the other hand, using a beamblock too large startsblocking the information of relevant q’s, with the consequent loss of data onthe sample structure and domains. The optimum diameter is found to be the
45
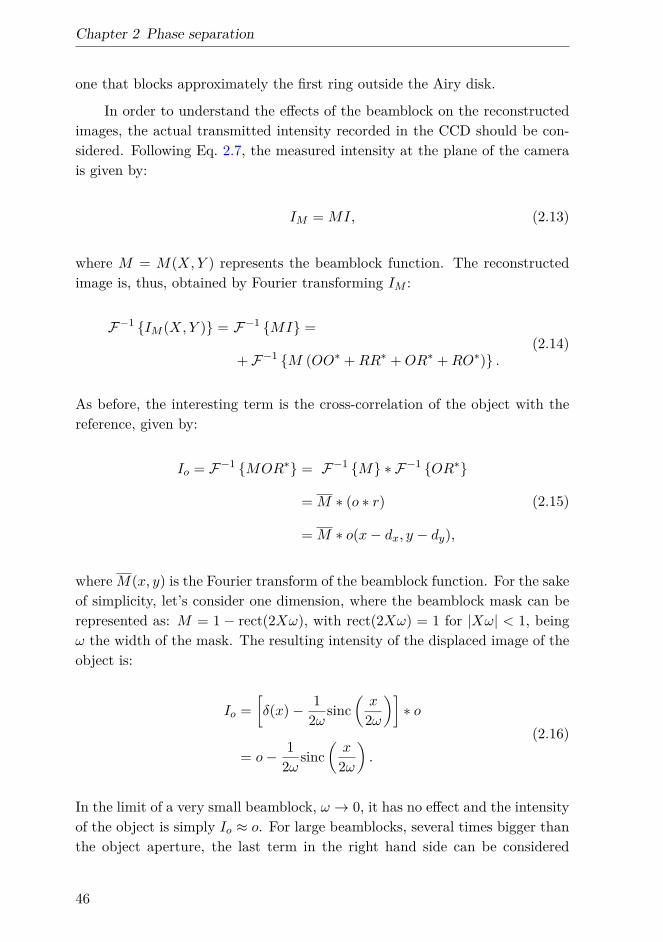
Chapter 2 Phase separation
one that blocks approximately the first ring outside the Airy disk.
In order to understand the effects of the beamblock on the reconstructedimages, the actual transmitted intensity recorded in the CCD should be con-sidered. Following Eq. 2.7, the measured intensity at the plane of the camerais given by:
IM = MI, (2.13)
where M = M(X,Y ) represents the beamblock function. The reconstructedimage is, thus, obtained by Fourier transforming IM :
F−1 {IM (X,Y )} = F−1 {MI} =
+ F−1 {M (OO∗ +RR∗ +OR∗ +RO∗)} .(2.14)
As before, the interesting term is the cross-correlation of the object with thereference, given by:
Io = F−1 {MOR∗} = F−1 {M} ∗ F−1 {OR∗}
= M ∗ (o ∗ r)
= M ∗ o(x− dx, y − dy),
(2.15)
whereM(x, y) is the Fourier transform of the beamblock function. For the sakeof simplicity, let’s consider one dimension, where the beamblock mask can berepresented as: M = 1 − rect(2Xω), with rect(2Xω) = 1 for |Xω| < 1, beingω the width of the mask. The resulting intensity of the displaced image of theobject is:
Io =[δ(x)− 1
2ω sinc(x
2ω
)]∗ o
= o− 12ω sinc
(x
2ω
).
(2.16)
In the limit of a very small beamblock, ω → 0, it has no effect and the intensityof the object is simply Io ≈ o. For large beamblocks, several times bigger thanthe object aperture, the last term in the right hand side can be considered
46

2.3 Resonant holography on VO2
nearly spatially independent, and effectively acts as a low-pass Gaussian filterthat gives the average intensity of the object. Therefore, in the reconstructedimage, the intensity obtained of each pixel is that of the real object subtractedby the average response of the sample.
As a result from the complete loss of q = 0, the central beamblock canbe regarded as a high-pass filter on the reconstructed image that subtractsthe average transmission of the entire sample and enhances the edges of thestructure. The immediate consequence of this effect for the current experimentis the loss of the absolute values of the transmission of VO2, directly relatedto the absorption coefficient of the material. However, it is important to no-tice that relative spectra can still be obtained, as the last right-hand term inEq. 2.16 cancel out when subtracting the intensities of two different pixels inthe image, as given by:
Io(x1)− Io(x2) ≈ o(x1)− o(x2). (2.17)
The absolute values of intensity recorded for each phase depend thus on theaverage phase of the whole sample, which changes with temperature as thephase fractions grow. However, the contrast between phases remains, whichallows the imaging of different phases when they are coexisting in the sample.
47

Chapter 2 Phase separation
2.4 Nanoscale phase separation during the IMT ofVO2
Holographic imaging was performed on two different samples, both fabricatedas explained in Section 2.3.2. As a first verification of the technique employed,the comparison of the scanning electron microscopy (SEM) images of the sam-ples with the ones measured holographically is shown in Fig. 2.9. An excellentagreement is found between the two techniques, demonstrating the adequatespatial resolution of holography. Although the substrate of the films is amor-phous, there are regions of the samples where micron-sized single crystals areformed among nanoscale crystallites. On the perimeter of these single crystals(indicated by the dotted white line), several defects can be observed, with fea-tures as small as 50 nm (indicated by arrows). The comparison of the spatialresolution of the holography image with that obtained by SEM is depicted inFig. 2.9(b), where the line-cuts of the same feature show a comparable reso-lution. A sub-50-nm spatial resolution is achieved with holography, consistentwith the size of the reference holes.
Fig. 2.9: Comparison of SEM with holography images. (a)Comparison of the images obtained at room temperature with thetwo techniques. The real-space image corresponds to the real part ofthe complex reconstruction measured at a photon energy of 530.5 eV.The field of view is 2 µm. (b) Line-cuts of one of the defects thatdemonstrate the adequate resolution of holography for the employedsamples.
2.4.1 Metallic domain growth
According to the hysteresis curve seen in Fig. 2.5, 330K marks the onset of thephase transformation. Heating the sample to this temperature and imaging
48

2.4 Nanoscale phase separation during the IMT of VO2
with X-rays tuned to the d‖, should allow for the observation of the metallicphase growth. Indeed, in the images shown in Fig. 2.10, bright stripes appearacross the crystals. These stripes are metallic domains observed due to thehigher transmissivity of VO2 in the metallic phase at 530.5 eV, as a result fromthe loss of the d‖ absorption peak. Interestingly, these domains, while long,can be as narrow as 50 nm. From the domains evolution with temperature, it isclear that the nanoscale defects (pointed by arrows) nucleate the metallic phase,which grow with increasing temperature between such defects and spanningthe single crystals. This demonstrates the role local strain plays in locallylowering the transition temperature. In addition, thermally cycling the sampleproved that these domains are pinned, given their repeated growth in the samelocations.
300 K 330 K 338 K
360 K342 K
Fig. 2.10: Metallic domain thermal growth. The dotted whiteline indicates the perimeter of a single crystal, while some of the defectson the edges of the crystal are pointed out by arrows. The brighterstripes, corresponding to metallic domains, grow with increasing tem-perature spanning the single crystal, until the entire sample becomesmetallic.
A further increase of the temperature results in the growth of the metallicfilaments until the whole sample becomes metallic at 360K. Given that defectsappear as dark features in the SEM image and bright in the holography images,indicating high transmission, they can be associated with grain boundariesbetween VO2 crystallites. In fact, nucleation sites at VO2 grain boundaries areconsistent with previous work that showed how oxygen vacancies created bystrain at such locations present a decreased phase-transition energy [91].
49

Chapter 2 Phase separation
2.4.2 The role of phase coexistence in the IMT
The investigation of coexisting M1 and R phases during the insulator-metaltransition in VO2, as well as the potential presence of other phases, can giveinsight into the role played by phase separation and electronic correlations inthe IMT. With this aim, spectrally resolved imaging at multiple X-ray wave-lengths is performed. Ideally, extracting XAS spectra of each point in theimages would allow to identify the state of the system. However, this is notpossible due to the loss of information close to q = 0 caused by the presenceof the beamblock. In fact, when looking at Fig. 2.10, the images measured atthe initial and final states at 300K and 360K, that correspond to the mon-oclinic M1 and R phases, respectively, show no significant differences neitherin structure nor in absolute intensity values between each other. However,provided the sample is within the temperature range where it is not fully M1nor R and phases coexist, the contrast between them remains and the differentstates of VO2 can be thus imaged and studied. As demonstration, Fig. 2.11shows the comparison of the differential spectrum of those measured at thelow-temperature insulating phase and high-temperature metallic phase (shownin Fig. 2.7) with that obtained by subtracting the intensities of pixels fromthe insulating and metallic domains in Fig. 2.10. A very good agreement canbe observed between them, which proves that relative transmitted intensitiesfrom different phases on the nanoscale can be obtained by this technique.
!"#
#$ %
&'(
&)"
'* +
,-.
$ /
$0
123141143
567'7& (&(-8* +(90
!"##$ :"7:( );(<'-,
!"##$ ;"=(>)
Fig. 2.11: Nanoscale relative spectrum of a metallic domain.The solid line corresponds to the difference of the metallic and insulat-ing spectra shown in Fig. 2.7, obtained by measuring the transmissionon a diode. The markers correspond to the relative spectrum of twoselected regions of a few pixels wide within the insulating and metallicnanoscale domains shown in Fig. 2.10. The observed deviations fromone another arise from the different background drifts between the twodata sets.
50

2.4 Nanoscale phase separation during the IMT of VO2
The selection of the photon energies for imaging is not arbitrary, though.Recalling the interpretation of the XAS features in Section 2.2.2, images of theVO2 sample are recorded at 530.5 eV, resonant to transitions into the d‖ states,and at 529 eV, sensitive to the π∗ and dc
‖ states. Additionally, a photon energyon the vanadium L2-edge of 518 eV is selected, since it is sensitive to the d‖states as well [52].
Given the dichroism of the d‖ and dc‖ states in the insulating phase of VO2,
the orientation of the sample with respect to the X-rays electric field needs tobe determined. For that purpose, images were recorded at the d‖ peak at roomtemperature with different X-ray polarizations. This part of the experimentwas performed using a different sample (Fig. 2.12) in a different setup: theMaReS end-station at BOREAS beamline [92] of the ALBA synchrotron lightsource. The geometry of the setup was held the same as the one employed atBESSY II. The X-ray polarization vector was rotated by 180◦ in 5◦ steps, andthe differential images were studied at each angle in order to find the maximumdichroic signal (see Fig. 2.13). When the X-rays are parallel/perpendicular tothe crystals rutile c-axis, the contrast is maximum due to the anisotropy of thed‖ peak. This difference is lost when each polarization is rotated by 45◦ withrespect to the c-axis.
Fig. 2.12: SEM of the VO2 sample used for phase-identification analysis. Again, both the SEM and holographic im-ages are in good agreement. As with the previous sample shown, smallcrystals can be found among smaller crystallites.
Once the sample orientation is known, imaging with the photon energiesselected and the X-rays polarized along the rutile c-axis can be performed.Images were recorded at intermediate temperatures between the M1 phase andthe complete transformation into the R phase. An RGB (red, green, blue)colour encoding is used to create a false-colour image to investigate therebythe changes of the above-mentioned states across the IMT. Images recorded
51

Chapter 2 Phase separation
Fig. 2.13: Polarization-resolved imaging in VO2. X-ray dichroicimages of VO2 measured at the d‖ peak at room temperature. Thetendency of the observed crystals is to grow along the rutile c-axis,giving rise to the existence of defined axes within the field of view.The dichroic images in the top row display brightest/darkest regionsfor those that have the c-axis aligned mostly along/perpendicular tothe X-rays polarization. The contrast is gone when the X-rays arerotated by 45◦/−45◦ with respect to the predominant c-axis.
at 518 eV, 530.5 eV, and 529 eV are used to encode the red, green, and bluechannels of this composite image, respectively. In this spectral fingerprint-ing approach, it is easier to observe changes occurring in different regions ofthe sample and at different temperatures. For instance, according to Gray etal. [25], a weakening of electronic correlations precedes the structural transi-tion. Thus, this would result in the blue channel (dc
‖) changing before the greenone (d‖), and giving rise to a change of colour in the composite image.
The resulting RGB images at four selected temperatures are shown inFig. 2.14. The nanoscale domains nucleate at the defects of the sample and spanthe single crystals, the same behaviour as observed in Fig. 2.10. However, withthis colour encoding it now becomes evident that different regions of the samplechange in a different way with increasing temperature. At 330K, the start ofthe phase transition, there is an increase in intensity of the green channel.However, as the sample is heated further, the blue channel also changes butin different zones of the sample. As a result, at 334K, at least three distinctphases can be observed: the initial M1 phase and two new phases. One showsa change in the dc
‖ state (blue channel), while the second presents the greater
52

2.4 Nanoscale phase separation during the IMT of VO2
change at the d‖ state (green channel).
51
8 e
V5
29
eV
53
0 e
V
R
M2
M1
300 K 330 K
334 K 338 K
Fig. 2.14: RGB colour-encoded images formed by spectrallyresolved images at the V and O edges. The images measured at518 eV, 530.5 eV, and 529 eV are used to encode the three colour chan-nels of an RGB false-colour image, respectively. New phases, depictedby different colours, nucleate and grow with increasing temperature.The dashed line delimits the selected ROI for further analysis.
To understand the growth of these three phases, a finer temperature scanis performed and the analysis is focused on the small single crystal indicatedby a dashed line in Fig. 2.14, the new region of interest (ROI). To amplifythe changes, an additional threshold is applied to each colour channel. Dueto the loss of the absolute intensity values of each phase and the effectivesubtraction of the average intensity of the sample caused by the presence of thebeamblock, when the temperature is increased and the metallic phase fractiongrows, a manual adjustment of the threshold is required to ensure the contrastis not lost for each temperature. An upper threshold is also applied to eachcolour channel in order to move the white regions (corresponding to defectsand boundaries of the crystals in Fig. 2.14) into the red channel of the newRGB composites formed by the binary images.
53

Chapter 2 Phase separation
300 K 330 K 332 K
334 K 335 K
337 K 338 K 339 K
340 K 346 K 360 K
333 K
500 nm
Fig. 2.15: Threshold images of domain growth in VO2 of thesingle crystal outlined in Fig. 2.14. Growth starts from defects(red) and the striped phase formed by the M2 and R phases is seenat ∼ 334 K. The diamond and cross markers are the ROIs used inFig. 2.16.
.
The resulting images at some key temperatures are presented in Fig. 2.15.Initially, at room temperature, the sample is predominantly black within thiscolour-coding scheme, indicating that the crystal is in the M1 phase, whereasthe red spots correspond to defects. As the sample is heated, the new phases(green and blue) nucleate at the boundaries and defects of the single crystal.At 334K, a striped pattern is formed by the green and blue channels, whichis already visible in Fig. 2.14, before the green channel dominates the regionat higher temperatures. This phase growth is captured in Fig. 2.16(a), whichdisplays the volume fraction of the blue and green regions as a function of tem-perature within the ROI. Both phases start to nucleate at similar temperaturesand grow, before the green area dominates.
54

2.4 Nanoscale phase separation during the IMT of VO2
Fig. 2.16: Temperature-dependent growth of two phases inVO2. (a) The volume fraction of the M2 phase peaks at ∼ 335 Kbefore the whole sample becomes metallic. As indicated by the dashedline, the growth of the R phase is in good agreement with the opticaltransmission shown in Fig. 2.5. (b) Temperature dependence of thelocal transition pathway of the two regions marked in Fig. 2.15. Thearea marked with the cross shows a direct transition from M1 to R,while that marked with a diamond transitions via the M2 phase at aslightly higher temperature.
.
The green regions, which probe changes in the d‖ states, can be easilyidentified as the metallic R domains, the one that dominates at high temper-atures. If, as discussed in Section 2.2.2, the dc
‖ states are probing electroniccorrelations, and changes in these precede the structural transition, all thegreen regions should first turn blue. However, this is not the case, as mostregions present a direct transition from the initial M1 to R, without any in-termediate changes. Only in some spatially distinct areas, the intermediateblue domains are observed. This is highlighted in Fig. 2.16(b), which showsthe phase of two selected nanoscale areas (∼ 50 nm, depicted with symbols inFig. 2.15) as a function of temperature. The region marked with the crossfollows a direct M1-to-R transition, while the one marked with the diamondgoes through an intermediate phase.
This behaviour suggests that the loss of correlations is not the drivingmechanism for the insulator-metal phase transition. In the light of these newresults, the two different transition temperatures reported by Gray et al. [25]for the electronic and structural transitions correspond instead to regions ofthe sample taking different pathways towards the metallic phase.
As strain appears responsible for nucleating the phase transition, and con-sidering VO2’s phase diagram, the blue regions can be assigned to the mono-
55

Chapter 2 Phase separation
Fig. 2.17: Local transition pathways within the phase diagramof VO2 of two different nanoscale regions of the sample. Areasin the sample that support higher strain transforms from the insulat-ing M1 to the metallic R phase by going through the intermediateinsulating M2 phase.
.
clinic M2 phase, which is frequently observed in macroscopically strained sam-ples. This interpretation, in which regions of the sample follow different localpathways from the M1 to the R phase, is schematically depicted in Fig. 2.17.This assignment is further justified by recent DFT calculations of the M2 den-sity of states, which show anisotropic changes in the dxz and dyz orbitals [93],the ones that form the π∗ states. This results in polarization-sensitive changesin the vicinity of the d‖ XAS feature. However, the triclinic insulating phasecannot be excluded.
2.4.3 Discussion
The presented spatially resolved measurements suggest a new interpretationof the insulator-metal phase transition in VO2 thin films. Nanoscale defectsexisting in the sample modify the strain environment, locally reducing thephase-transition temperature for the M1-to-R transformation. Due to the largevolume difference of the rutile phase, a new strain field is generated that canin turn also nucleate the M2 phase. Both phases, M2 and R, continue to growand form a striped-phase pattern due to the interaction of the strain field. Thisphenomenon has also been observed in larger nanobeam single crystals [27, 40,65, 94]. As the temperature is further raised, a complete transformation of theM2 to the R phase occurs. The temperature separation observed in Fig. 2.16(b)between the formation of M2 and R domains, of ∼ 5 K, is in good agreementwith the shift in temperature observed by Gray et al. [25].
56

2.4 Nanoscale phase separation during the IMT of VO2
In some respects, observation of the M2 phase is unexpected, as the sam-ples used have no epitaxial strain arising from the substrate to move the mate-rial away from typical M1-to-R pathway. However, this is explained by the rolenanoscale defects play in locally modifying the strain environment, which candramatically modify the phase transition in VO2 and in correlated materialsin general.
This interpretation can also account for previously reported XAS observa-tions, in which irreversible changes in the vicinity of dc
‖ were reported duringthermal cycling the sample [82], as a stabilization of the M2 phase at room tem-perature due to a change in the local strain field. Nevertheless, the transitiontemperatures and growth patterns will depend on the local distribution, whichis sample specific. In the measurements reported here, the observed domainpatterns were repeatable after thermal cycling the samples, again suggestingthat strain derived from extrinsic defects is the dominant mechanism, pinningdomain walls and giving rise to the observed structure [95].
57

Chapter 2 Phase separation
2.5 Conclusions
The reported imaging experiment during the insulator-metal phase transitionin VO2 presents no evidence for decoupled electronic and structural transitions,where the weakening of electronic correlations gives rise to the existence of amonoclinic metallic phase. Instead, these results demonstrate that the phasetransition can be explained in terms of phase separation into the known phasesof VO2 and the different transition pathways among them.
This work shows that soft X-ray resonant holographic imaging can be usedto image domain growth on the nanoscale, providing polarization- and energy-resolved measurements of samples that have a heterogeneous response. Asphase separation is a common property of correlated materials, this techniquewill be vital in understanding the role played by defects in the electronic andstructural properties of them. Furthermore, the main advantage becomes ap-parent when combining holography with ultra-short X-ray pulses generated byfree-electron lasers as the light source. The first attempts of imaging domaingrowth on the nanoscale over a wide field of view in VO2 with femtosecondtime resolution are described in Appendix A.
58


3 | The role of heat in the phasetransition of VO2
This chapter describes the effect laser-induced heating and the recoverydynamics of VO2 may have on the photo-induced phase transition. Sec-tion 3.1 provides an introduction about the threshold-like behaviour ofVO2, which can be affected by the recovery dynamics. These are stud-ied in Section 3.2 under different experimental conditions, followed bya measurement of the threshold fluence required to drive the ultrafasttransition when probed with different optical wavelengths in Section 3.3.The conclusions of the chapter are discussed in Section 3.4.
61

Chapter 3 The role of heat in the phase transition of VO2
3.1 Introduction
Many materials that exhibit a light-induced phase transformation do so whenthe energy density of the employed pump laser exceeds a specific threshold [96,97]. In VO2, threshold fluences in the range of 4.6–7mJ cm−2 have been re-ported for the photo-induced transition with 800-nm laser light at room tem-perature [45, 47–49, 54, 56]. In the linear absorption regime, this excitationdensity corresponds to 10% of the vanadium atoms.
In VO2, there are generally three different regimes in the photo-inducedphase transition as a function of pump fluence, as depicted in Fig. 3.1, whichcan be observed in optical as well as in X-ray experiments. For fluences belowthe threshold, the response is linear with fluence. Above threshold, a sharpchange occurs, which results in a significantly larger dependence of the ma-terials properties on increasing fluence. Finally, above the saturation fluence,the response exhibits a weak dependence on excitation density. The below-threshold regime can be interpreted as the sample in the insulating phase,where the pump fluence values are not sufficient to induce the phase transi-tion. Just above threshold, but below the saturation regime, the response ismixed, with both fast and slow dynamics observed. Most likely, this resultsfrom only a small part of the probed volume transforming instantly into themetallic phase. Thermal diffusion of heat then results in nucleation and growthof metallic domains [98]. Increasing the pump fluence leads to a more rapidtransition, until saturation is reached, where the whole probed volume has beentransformed and optical or X-ray-probed properties do not further change.
Fig. 3.1: Fluence-dependent optical/X-ray response duringthe photo-induced phase transition of VO2. The three regimesobserved are characterized by the values of FTH and FS, which are thethreshold and saturation fluences, respectively.
62

3.1 Introduction
Recently, the threshold fluence values for triggering the phase transition inVO2 have been employed as evidence for the existence of a transient metal-likemonoclinic phase. Through ultrafast electron diffraction experiments, Morri-son et al. provided evidence for the existence of not one, but two thresholdfluences for the phase transition [51]. Above 2mJ cm−2, they observed slow(1.6± 0.2 ps) dynamics of the measured diffraction peaks intensity, which sug-gested a valence charge density reorganization within the monoclinic struc-ture. The fast melting (310± 160 fs) of the V-V dimerization, and hence thestructural phase transition, was found to occur above a threshold fluence of9mJ cm−2. The authors complemented these results with fluence-dependenttime-resolved IR transmittance measurements that showed a metal-like re-sponse for fluences below the required 9mJ cm−2 for the crystallographic tran-sition. As a result, they suggested the presence of an intermediate monoclinicphase with metallic properties existing in the intermediate fluence regime be-tween the two thresholds reported.
The observation of different thresholds through pump-fluence dependentstudies for the onset of the metallic state and the structural distortion standsas evidence for supporting the decoupled nature of the phase transition in VO2,as well as the existence of an intermediate monoclinic metallic state. Whilestructure-sensitive probes, such as electron [50, 51, 56] and X-ray [45] diffrac-tion, have provided fluence threshold values within the range 4–8mJ cm−2,metallic-like behaviours have been measured by exciting the sample with flu-ences as low as in the 1–2mJ cm−2 range [51, 99, 100].
However, determining the absolute excitation strength necessary for driv-ing the transition is a challenging task which has been approached by severaldifferent techniques in the past. The difficulty of experimentally measuringaccurate fluence values, together with variations arising from different types ofVO2 samples and technique-dependent probed volumes, causes the comparisonof threshold fluences to have a limited validity.
The high sensitivity of threshold fluences on external parameters was al-ready observed in the early pump-probe measurement conducted by Cavalleriand co-workers in 2001 [45], where the pump threshold fluence in VO2 wasfound to strongly depend on the initial base temperature of the sample. Thiseffect was subsequently reported by the group of Leitenstorfer et al. [48, 49]through multi-THz probe pulses. They measured a decrease of the thresholdfluence and a longer-lived photo-induced conductivity upon raising the sampletemperature towards TC. Furthermore, the energy required to drive the tran-sition optically was found to be the same as the energy difference between themetallic and the insulating phase at a given initial temperature, that is, the
63

Chapter 3 The role of heat in the phase transition of VO2
energy necessary to thermally drive the transition, in agreement with previousexperiments [56].
While the coincidence of the thermal and photo-induced phase transitionthresholds seems to suggest a common pathway for both processes, some re-search groups claim that this is not the case. Instead, they attributed thiseffect not to a thermal nature of the phase transition, but to a softening of theinsulating phase near threshold caused by the existence of metallic precursorsat temperatures closer to TC that facilitate the metallic phase growth [47]. Ad-ditionally, other experiments based on time-resolved THz spectroscopy [101],which compared a phase transition triggered by laser-induced heating to ther-mal predictions, found that, although these coincide near room temperature,there is a strong divergence of the observed thresholds from thermal predic-tions at low temperature. They measured a metallic-like conductivity whenexciting the sample with fluences below those necessary to thermally drive thetransition.
The temperature dependence of the threshold fluence in [47–50, 56] wasobserved by deliberately heating the sample in situ. Threshold fluences arenormally determined by scanning the response of the material to increasingpump fluences. However, in these experiments, which assume the sample al-ways recovers back to its ground state, the initial temperature of the sampleis assumed to be always the same. Yet, due to the repetitive nature of pump-probe measurements, this premise results not necessarily true. Laser-inducedheating can in fact lead to heat accumulation when the repetition rate of thelaser pulses is too high for the material to fully recover back to the groundstate before the next pulse arrives. When this is the case, the system maybe driven towards a new quasi-equilibrium temperature that is higher thanthe initial one and depends on the fluence with which the sample is excited.Consequently, the responses at different fluence values cannot be compared toeach other, as these are relative to different base temperatures.
The recovery of VO2 samples in pump-probe measurements has been dis-cussed by a few experiments. In the femtosecond electron diffraction experi-ments conducted in 2007 by Baum et al., the repetition rate of 1 kHz was foundsufficient for a single crystal of VO2 held at room temperature to completelyrecover to the initial monoclinic phase [56]. Nonetheless, in the later UED mea-surements led by Morrison et al. in 2014 on free-standing thin-film samples,a repetition rate of 50Hz between pump pulses was necessary for the samplesto relax back to the ground state [51]. More recently, in a femtosecond XUVtransient absorption spectroscopy study of 2017, Jager et al. had to take anextra measure to avoid heat accumulation, as the minimum feasible repetition
64

3.1 Introduction
rate of 100Hz in their experimental setup was comparable to the inverse timefor heat dissipation in the thin-film samples employed. With that aim, thesample mount was rapidly rotated normal to its surface, so that subsequentpump pulses did not impinge on the same region of the film. In 2018, the samegroup provided theoretical simulations for estimating the rate of heat buildupbetween laser pulses in particularly heat-sensitive VO2 samples under vacuumconditions. They showed how, even at low repetition rates of 100Hz, after thefirst six pulses the temperature of the material had already raised above TC.As a result, all subsequent probe pulses measured the response of the metallicinstead of the insulating phase.
In order to understand the different recovery time scales found for singlecrystals and thin films it should be noted that the time scales for heat dis-sipation are set by the temperature gradient generated in the sample by thelaser pulses. In absorbing samples, the penetration depth of laser light is gen-erally of a few hundred nanometers, leading to temperature gradients on theselength scales for thick samples, such as single crystals. This results in recoverytimes on the nanosecond time-scales for thermal diffusivities of 10−5 m2s−1.However, for free-standing thin-films, which are thinner than the absorptionlength, there is no thermal gradient into the depth of the material. Therefore,heat transport can only occur in the transverse direction. The thermal gradi-ent on this plane is set by the pump spot-size, of the order of a few hundreds ofmicrons in X-ray and electron diffraction experiments such as those mentionedabove. This results in recovery times that are six orders of magnitude longer,within the millisecond regime. Ideally, all measurements would be performedon single crystals to avoid heat accumulation issues. This is not always possi-ble, though, as the extremely short penetration depths of electron and X-raysmakes necessary the use of free-standing samples for this type of experiments.
Despite the interplay between temperature and optical excitation beingacknowledged by the few above-mentioned experiments, the precise relation-ship between them remains still mostly unknown, and the distinction betweenthermal and non-thermal transitions results hindered by the high tempera-tures at which the experiments are generally performed. Understanding thetime scales required for the samples to recover is crucial for the correct execu-tion of time-resolved pump-probe measurements. Unfortunately, laser-inducedheat buildup and the consequent fluence-threshold sensitivity to external pa-rameters have been mostly neglected, which may have result in apparentlycontradictory results over the course of the past 50 years of studies of theinsulator-metal phase transition of VO2.
In order to give insight into the influence of laser-induced heating on driv-
65

Chapter 3 The role of heat in the phase transition of VO2
ing the insulator-metal phase transition, a thorough study is presented in thefollowing sections of the different experimental parameters that affect the phasetransition threshold by means of long-delay time-resolved optical experimentson thin film samples. These measurements are complemented by the fluence-dependent change in transmission of the sample in femtosecond time scalesprobed with different wavelengths, to determine the existence of decoupledthresholds within the phase transition.
66

3.2 The recovery dynamics of a thin film of VO2
3.2 The recovery dynamics of a thin film of VO2
As previously explained, according to literature, the type of free-standing thinfilms of VO2, as those employed for the work of this thesis, exhibit total re-covery times of the order of tens of milliseconds. The aim of this work is tomeasure the exact times required for the samples to relax back to their initialstate. Typically, pump-probe setups involve the use of mechanical delay stagesfor controlling the arrival times of the pump and probe pulses to the sample.However, using stages longer than several nanoseconds becomes impractical,as the required lengths are too large. As a result, a different approach needs tobe adopted for the measurement of recovery times in the millisecond regime.
Here, a combination of ultrashort-laser pulses with a CW light source wasemployed for the measurement of long dynamics. The experimental setup,which follows a typical pump-probe configuration, is schematically depicted inFig. 3.2. The pump pulses have a time duration of approximately 40 fs cen-tred at a wavelength of 800 nm, the repetition rate of which can be varied byinteger division of the highest 5 kHz. The probe is a continuous-wave helium-neon (HeNe) laser with a central wavelength of 632.8 nm used to monitor thetransmission of the sample after photo-excitation. The transmitted light isrecorded by a high-bandwidth silicon balanced amplified photodetector con-nected to a LeCroy oscilloscope that provides a maximum bandwidth of 4GHzand 40GS s−1 sampling rate. This way, a long-range time-resolved signal canbe measured, limited by the electronics of the employed detector and oscillo-scope. The ultimate temporal resolution is limited though by the RF outputbandwidth of the photodetector of 1MHz. The HeNe probe is split into twobeams that follow different paths before impinging on the detector. One mea-sures the transmitted light from the sample while the other acts as a reference.The sample is held inside a liquid-nitrogen cryostat that allows measurementsat lower temperatures at pressures in the order of 10−6–10−8 mbar.
Given the long time scales dynamics measured here, the contributionsto the response of the system can be considered mostly thermal, as in themicrosecond regime, electrons have already transferred their energy to the lat-tice. Therefore, as demonstrated throughout the next sections, the dynamicsmeasured with this experimental setup can be understood in terms of heattransport within the sample and temperature differences. In the followingsection, the time traces measured under different experimental conditions arepresented.
67

Chapter 3 The role of heat in the phase transition of VO2
Fig. 3.2: Optical pump-probe experimental setup. The trans-mitted intensity from the sample is recorded by a balanced photo-diode, the output of which is the difference between the transmissionand the reference source.
Case 1: 50Hz, room temperature, air
As a first step, the recovery of a thin-film sample is studied at atmosphericpressure and room temperature when excited by pump pulses at a repetitionrate of 50Hz, as 20ms has been reported enough time for the sample to re-cover [51]. A total time range of 50ms was recorded with the oscilloscope ata sampling rate of 1MSs−1, which provides a temporal resolution in the mi-crosecond regime. The photodetector was balanced to a zero amplitude forthe transmission of the sample without excitation. The resulting time tracesobtained by exciting with different fluences are shown in Fig. 3.3(a), where itcan be seen how the sample is excited every 20ms and recovers back to theground state before the next pump pulse arrives.
By looking into a shorter time range, the detailed traces can be studied,as displayed in Fig. 3.3(b). Three pump fluence regimes can be extracted fromthese measurements. At low fluences and below the phase transition threshold(Fig. 3.3(c)), the transmission is reduced immediately after photo-excitation,followed by an exponential recovery. The starting of the photo-induced phasetransition can be clearly seen, when the sample is excited with higher fluences,by the emergence of an increase in transmission (Fig. 3.3(d)). Further increas-ing the excitation density leads to a saturation regime, where the amplitude ofthe signal no longer increases as the whole probed sample volume has alreadytransformed into the metallic phase (Fig. 3.3(e)). As expected, the elapsedtime between photo-excitation and full recovery gets elongated as the pumpfluence is increased. However, under the present conditions, the repetition rateof 50Hz appears to be sufficient for the sample to recover between pulses, atleast up to the damage threshold of the sample.
68

3.2 The recovery dynamics of a thin film of VO2
Fig. 3.3: Time traces at 50Hz repetition rate, room temper-ature, atmospheric pressure. (a) Total temporal range measured.(b) Zoomed-in temporal window of 2ms, where it can be appreci-ated how the response changes for increasing fluences. Time tracesmeasured after pump excitation in the below-threshold regime ((c)),above the threshold fluence in (d), and in the saturation regime in(e).
69

Chapter 3 The role of heat in the phase transition of VO2
Case 2: 50Hz, room temperature, vacuum
Interestingly, when analysing the response of the sample to photo-excitationunder identical pump-probe conditions but with the material held at 10× 10−7 mbar,as opposed to the atmospheric pressure of the previous case, the behaviour isquite different. Figure 3.4(a) shows the time traces measured over the entiretime range of 20ms. It can be easily observed how, as the pump fluence isincreased, the response of the sample has not enough time to recover withinthe employed repetition rate. Figures 3.3(c) and 3.4(b) were measured withthe same excitation of 4.1mJ cm−2, however, in the latter, the response am-plitude is about the same, but the recovery time is significantly longer (notethe different time range) due to the lack of thermal transport between the airand the sample in vacuum conditions. Also, the threshold fluence appears tobe lower than 6.5mJ cm−2, as in Fig. 3.4(c), after an excitation of 5.1mJ cm−2
the sample has already started to switch into the metallic phase. From thesetime traces, the threshold fluence is found at ≈ FTH = 4.5 mJ cm−2. It shouldbe noted that, even at these low fluences, the transmission is non-zero at neg-ative time delays, and becomes positive above ≈ FTH = 10.5 mJ cm−2. Thissuggests, as observed in Fig. 3.4(d), that the sample is still in the metallicphase when the next pump pulse arrives.
70

3.2 The recovery dynamics of a thin film of VO2
Fig. 3.4: Time traces at 50Hz repetition rate, room temper-ature, in vacuum. (a) Fluence-dependent recovery of the samplewithin the 20ms between pump pulses. Time traces measured af-ter pump excitation in the below-threshold regime in (b), above thethreshold fluence in (c), and in the saturation regime in (d).
71

Chapter 3 The role of heat in the phase transition of VO2
Case 3: 50Hz, 90K, vacuum
As reported in literature [47–49, 56], the threshold fluence depends on the basetemperature of the sample. This is tested now by keeping the same pump-probeconditions from the previous case, but lowering the temperature of the sampleto 90K. As shown in Fig. 3.5, the resulting behaviour is quite different, andheat accumulation effects are not as dramatic, if present. Figure 3.5 displaysagain the time trace corresponding to a low excitation density of 4.1mJ cm−2,which shows a recovery time of the same order as that exhibited in Fig. 3.4.The amplitude of the signal is slightly larger in this case, which could be duethat at this fluence, when the sample was held at a base temperature of 294K,some small fractions of the probed volume have already transformed into themetallic phase. Fig. 3.5(c) shows the response just after the start of the phasetransition, which appears to occur at ≈ FTH = 15.5 mJ cm−2, a much highervalue than in the previous cases. Also, at 20.8mJ cm−2 (Fig. 3.5(d)), thesaturation regime has not been reached yet, as opposed to the previous cases.
72

3.2 The recovery dynamics of a thin film of VO2
Fig. 3.5: Time traces at 50Hz repetition rate, 90K, in vac-uum. (a) Fluence-dependent recovery of the sample within the 20msbetween pump pulses. Time traces measured after pump excitation inthe below-threshold regime in (b), above the threshold fluence in (c),and in the saturation regime in (d) .
73

Chapter 3 The role of heat in the phase transition of VO2
Case 4: 500Hz, room temperature, air
From the three cases presented before, it can be concluded that the opti-mum conditions for performing pump-probe measurements on free-standingthin films is with a laser pump repetition rate of 50Hz and the sample heldin air. Nonetheless, these conditions are not always feasible, especially whenworking at external facilities, such as synchrotrons and FELs, where the samplechamber and laser settings are not tunable. Many of the experiments conductedon VO2, both within this thesis (see Chapters 4 and A) and reported in liter-ature, are in fact carried out in this type of facilities, where the sample needsto be maintained under vacuum conditions, or there exists a lower limit forthe laser repetition rates due to experimental constraints, for instance. There-fore, it is worth considering the consequences of these possible scenarios for thethermal recovery of the films employed.
Figure 3.6 presents the temporal response of the sample held at atmo-spheric pressure, but excited with a repetition rate of 500Hz. For this fre-quency, a total time range of 5ms was recorded at a sampling rate of 10MS/s.At low fluences (Fig. 3.6(a)), the recovery rate seems to be of the same order asin Case 1, in air conditions. The start of the phase transition, though, is foundat ≈ FTH = 5.2 mJ cm−2, slightly lower, which stands as an indication for someDC heating. This is evidenced by the fact that above ≈ FTH = 21 mJ cm−2,fractions of the sample are still in the metallic phase when the next pump pulsearrives (Fig. 3.6(d)). The fluence range in which the insulator-metal transitioncan be probed is quite large, though.
74

3.2 The recovery dynamics of a thin film of VO2
Fig. 3.6: Time traces at 500Hz repetition rate, room temper-ature, at atmospheric pressure. (a) Fluence-dependent recoveryof the sample within the 2ms between pump pulses. Time tracesmeasured after pump excitation in the below-threshold regime in (b),above the threshold fluence in (c), and in the saturation regime in(d).
75

Chapter 3 The role of heat in the phase transition of VO2
Case 5: 500Hz, 90K, vacuum
An alternative scenario corresponds to the situation where the sample needsto be maintained in vacuum. Not surprisingly, in the light of results from Case2, it is not possible to measure the photo-induced insulator-metal transition invacuum at room temperature, as laser-induced heating at this repetition ratepermanently switches the sample into the metallic phase already at very lowfluences. This can be partially overcome by lowering the base temperature, sothat the induced heat is not sufficient to induce the transition.
The response of the sample held in vacuum at 90K and excited with afrequency of 500Hz is displayed in Fig. 3.7(a), where a quite different behaviourcan be immediately appreciated. The heat build-up appears already at lowfluences, as shown in Fig. 3.7(b), identifiable by the linear-like behaviour withinthe repetition rate employed, consequence of the short time range allowed forthe exponential to grow. Because of this heat effect, the phase transition isinduced at a fluence threshold of ≈ FTH = 4.7 mJ cm−2 and not at a highervalue than in case 4, as it would be expected for a lower base temperature.When the initial temperature of the sample is above TC, excitation leads to afurther growth of the metallic volume, as seen in Fig. 3.7(d).
These two last cases represent a possibility for measuring the photo-induced insulator-metal dynamics when the experimental setups do not allowworking under optimum conditions, namely, low repetition rates and atmo-spheric pressure. Despite the presence of heat accumulation, the phase transi-tion can still be probed within a limited fluence range.
76

3.2 The recovery dynamics of a thin film of VO2
Fig. 3.7: Time traces at 500Hz repetition rate, 90K, in vac-uum. (a) Fluence-dependent recovery of the sample within the 2msbetween pump pulses. Time traces measured after pump excitation inthe below-threshold regime in (b), above the threshold fluence in (c),and in the saturation regime in (d).
3.2.1 Threshold fluences comparison
Traditionally, in ultrafast measurements, the threshold fluence for the phasetransition in VO2 has been defined as the value at which the amplitude of thesystem response at an arbitrary time delay of 1 ps starts to become nonlinearwith fluence [48, 54, 56]. Here, an analogous analysis is performed of thefluence-dependent change in transmission to determine the threshold value forthe phase transition. In these long-dynamics measurements, the response inthe picosecond time scales is not available, though, and is evaluated instead at1 µs after photoexcitation.
In Fig. 3.8, the response amplitude at 1 µs time delay is displayed as afunction of fluence for Cases 1-4 from the previous section. The four traces
77

Chapter 3 The role of heat in the phase transition of VO2
share a common behaviour consisting of a linear dependence at low fluenceswith negative slope, followed by a nonlinear regime where the signal switchesto a positive change in transmission. The dashed traces correspond to linearfits of the responses below and above threshold, the intersection of which isdefined as the starting point for the phase transition. The values for the flu-ence thresholds obtained by this method are listed in Table 3.1. Noteworthy,there is a difference of more than 10mJ cm−2 between the measurements per-formed in vacuum, with a difference in the base sample temperature of 200K.Interestingly, while above threshold the rate of increase in transmission perfluence unit is of the same order for all the cases, below threshold two differenttrends can be distinguished. The rate of decrease in transmission per mJ cm−2
in the measurements performed at atmospheric pressure is faster than thoseconducted under vacuum. This points towards different cooling rates for eachambient conditions, and will be further detailed in the following sections.
!
"
#
$
%&'()*+,-$.#/01)*2)3
#4#$-4-$4$
5(26786*+&9*8&.#3
4$*:;<*#="*><*/?0
4$*:;<*#="*><*@/822&
4$*:;<*=$*><*@/822&
4$$:;<*#="><*/?0
Fig. 3.8: Fluence-dependent transmission change at 1 µs forCases 1-4.
78

3.2 The recovery dynamics of a thin film of VO2
Case Below FTH FTH Above FTH∆I/F (x10−2) (mJ cm−2) ∆I/F (x10−2)
50Hz, 294K, air -0.026 ± 0.001 6.6 1.52 ± 0.0350Hz, 294K, vac. -0.04 ± 0.02 5.1 2.5 ± 0.150Hz, 90K, vac. -0.042 ± 0.001 15.3 1.7 ± 0.1500Hz, 294K, air -0.022 ± 0.005 6.2 1.72 ± 0.08
Table 3.1: Fit results from the fluence dependent change intransmission.
3.2.2 Thermal model
As mentioned before, the long time scales dynamics and the experimental re-sults presented above point towards thermal contributions as the main aspectsfor understanding the observed behaviours. Therefore, with the aim of havinga quantitative understanding of the recovery dynamics observed under dif-ferent experimental conditions, the transmission of the sample upon differentexcitation densities can be simulated via a temperature-dependent model.
In order to simulate the sample response, the dependence of transmis-sion upon time after photoexcitation is required. As already known and mea-sured, the transmission of VO2 follows a hysteresis curve with temperature(see Fig. 2.5), which can be mathematically modelled as an error function cen-tred at TC. On the other hand, the temperature of the system is assumedto follow Newton’s law of cooling, in which the temperature rate of change isproportional to the difference between the temperature of the system and itssurrounding. This way the dependency of transmission upon time can be cal-culated. The equation for simulating the change in transmission as a functionof temperature is the following:
I(T ) = A+BT + C12
[erf(T − TCTw
)], (3.1)
where the 1/2 factor corresponds to the normalization of the error function ofwidth Tw, the term A+ BT accounts for the effect of carrier dynamics in thelow-fluence response, that is, at low temperatures before entering the hysteresisloop. The equation for the temperature rate of change as a function of time issplit into two regimes that correspond to the insulating and metallic phases,which are assumed to change at TC − 2Tw (reached at time t′0), the pointwhere the two hysteresis branches are separated as portions of the sample are
79

Chapter 3 The role of heat in the phase transition of VO2
transformed into the metallic phase. The equation for the sample temperatureas a function of time results as:
T (t) =
Ti + 12
(1 + erf
(t−t′0tr
))∆T ′e
t−t0τ1 , for t > t′0
Ti + 12
(1 + erf
(t−t0tr
))∆Te
t−t0τ2 , for t0 < t < t′0,
(3.2)
where Ti is the initial temperature, ∆T is the increase of temperature inducedby the pump excitation (from Ti to Tf ) at t0, ∆T ′ = TC − 2Tw − Ti at t′0,the normalized error function is used to model the rising edge of width tr,and τ1, τ2 are the time constants of the cooling rates in the insulating andmetallic phases, respectively (the model parameters can be seen in Fig. 3.9).Combining these equations, I(t) can be obtained. Moreover, this model allowsthe calculation of the temperature rise at negative times delays arising fromheat accumulation, if any, when the sample does not fully recover back to theinitial temperature.
Fig. 3.9: Simulated dynamic response to photo-excitation viaa temperature model (a) Simulated transmission as a function oftemperature as described by Eq. 3.1. (b) Sample temperature as afunction of time according to Eq. 3.2. (c) Resulting time-dependenttransmission through combination of (a) and (b).
80

3.2 The recovery dynamics of a thin film of VO2
As an example, I(T ), T (t), and the resulting I(t) are simulated in Fig. 3.9for excitation just above the threshold fluence. Figure 3.9(a) represents thedependence of change in transmission upon temperature described by Eq. 3.1.The values of TC = 340K and Tw = 4.6 are extracted from the sample char-acterization shown in Fig. 2.5. Figure 3.9(b) displays the temperature as afunction of time as interpreted in Eq. 3.2 for an initial increase in temperatureof 42K. And the resulting transmitted intensity as a function of time is rep-resented in Fig. 3.9(c), where the distinct feature observed at t′0 is consideredas the time it takes for the system to re-enter into the insulating phase afterit has been excited into the metallic phase.
3.2.3 Quantitative results of the recovery dynamics of VO2
Atmospheric pressure conditions
Figure 3.10 shows the results obtained from the application of the temperature-based recovery model to the temporal response of the sample measured witha repetition rate of 50Hz at room temperature and atmospheric pressure. Anexcellent agreement can be found between theoretical and experimental traces.According to this model, the measured threshold fluence of 10.5mJ cm−2 cor-responds to excitation of the sample to a temperature of 334.5K. The largestdiscrepancies can be found at higher pump fluences, specifically in the tempo-ral width of the response at times t > t′0. The main origin for this lies mostlyin the fact that this model does not account for the different paths followed bythe sample when heating and cooling caused by the hysteretic nature of VO2.
The calculated parameters are shown in Fig. 3.11. The temperaturereached by the sample presents a linear dependence with fluence at low ex-citations, up to TC − 2Tw, point at which increasing fractions of the probedvolume are transformed into the metallic phase. The temperature increasewith fluence is slowed down in this region as part of the absorbed energy ac-counts for the latent heat of VO2. The linear behaviour is expected to be backabove TC + 2Tw, which lies just at the limit of Fig. 3.11(a). On the otherhand, the initial temperature (Ti) remains constant at 295K, which stands asa clear indication for the complete recovery of the sample for each fluence. InFig. 3.11(b), the characteristic times of the dynamics are shown. The time con-stant for the cooling rate for the insulating phase (τ1) is found to be of 0.61ms.However, both the onset of the insulating phase, defined as t′0 in the previoussection, and the characteristic time of the recovery rate of the above-thresholddynamics (τ2) are found to increase with higher fluences. This is not surprising
81

Chapter 3 The role of heat in the phase transition of VO2
Fig. 3.10: Simulated dynamic response to photoexcitation at50Hz, room temperature, and atmospheric pressure. (a) Ex-perimental time traces obtained by increasing pump-fluence excita-tion. (b) Theoretical time traces obtained by application of the ther-mal model. Measured (coloured lines) and simulated (black dashedlines) in the below-threshold regime in (c), above the threshold flu-ence in (d), and in the saturation regime in (e).
as, within this temperature range, the sample is expected to be formed by amixture of insulating and metallic domains. At temperatures above Tc + 2Tw,τ2 is stabilized to a value of ≈ 2.5ms. t′0, on the other hand, keeps growingwith increasing fluence, as expected for recovering from higher temperatures.
82

3.2 The recovery dynamics of a thin film of VO2
Fig. 3.11: Thermal model parameters for the dynamic re-sponse at 50Hz, room temperature, and atmospheric pres-sure. (a) The maximum attained temperature by the sample uponphotoexcitation (Tf ) grows with increasing fluence, while the initialtemperature (Ti) remains constant at room temperature. (b) Char-acteristic times of the recovery rates in the insulating phase (τ1), of0.61ms, and in the metallic phase (τ2), stabilized to a value of 2.5ms.The time it takes for the system to relax back into the insulating phase(t′0) increases with fluence above the threshold.
83

Chapter 3 The role of heat in the phase transition of VO2
Vacuum conditions
An analogous analysis is performed for the dynamics measured with a repe-tition rate also of 50Hz, but with the sample held under vacuum conditionsat a base temperature of 90K (Case 3 in Section 3.2). The calculated tracesare displayed in Fig. 3.12. Again, a very good agreement between the simula-tions (dashed lines) and the experimental results is observed, and the thresholdfluence measured under these conditions, of 15.3mJ cm−2, corresponds to ex-citation to a temperature of 334.5K, as in the previous case.
Fig. 3.12: Simulated dynamic response to photoexcitation at50Hz, 90K, and vacuum conditions. (a) Calculated time tracesobtained by application of the thermal model. Measured (colouredlines) and simulated (black dashed lines) in the below-threshold regimein (b), above the threshold fluence in (c), and in the saturation regimein (d) .
84

3.2 The recovery dynamics of a thin film of VO2
Figure 3.13 shows how ambient conditions lead to significant different re-sults. Whereas the final temperature achieved by the sample at each excitationfluence follows a similar behaviour than in the previous case measured in air,with a linear increase followed by a slower growth above the fluence threshold,the initial temperature does not stay constant at the base 90K set by the cryo-stat. As shown in Fig. 3.13, the time constant for relaxation in the insulatingphase (τ1) is found to be of 6ms, a factor of ≈ 10 slower than at atmosphericpressure conditions, while τ2 stabilizes to a value of 22ms in the metallic phase.Such long recovery times within this 20ms period lead to heat accumulationthat results in an increasing temperature rise. Noteworthy, this phenomenonwas not apparent when first looking at the measured traces in Fig. 3.5, ascompared with the obvious case in Fig. 3.4. However, a careful analysis of thedata demonstrates that ultrashort laser pulses can induce a static temperatureincrease of up to 100K for an excitation fluence of 24mJ cm−2.
It is worth noticing that, in a typical pump-probe measurement underthese experimental conditions, where the differential signal between the pumpedand unpumped sample is measured, this heating effect could be easily over-looked for intermediate fluences, when a partial volume has permanently switchedinto the metallic phase, as it is only reflected in a decrease in amplitude of thesignal.
Fig. 3.13: Thermal model parameters for the dynamic re-sponse at 50Hz, 90K, and vacuum conditions. (a) Both themaximum attained temperature by the sample upon photo-excitation(Tf ) and the initial temperature (Ti) grow with increasing fluence. (b)Characteristic times of the recovery rates in the insulating phase (τ1),of 6ms, and in the metallic phase (τ2), stabilized to a value of 22ms.The time it takes for the system to relax back into the insulating phase(t′0) increases linearly with fluence above threshold.
85

Chapter 3 The role of heat in the phase transition of VO2
3.2.4 Pump spot-size effect
The measurements presented in cases 1-5 were performed under identical laserconditions, with the exception of the specified changes. It has been shown howdifferent pump repetition rates, ambient pressure conditions and initial temper-ature, can result in the VO2 thin film providing a significantly different responsefor the same excitation density. This is directly related to the heat transfervelocity within the material after a certain amount of energy is deposited bythe pump laser pulse. Now, the effect of modifying the pump spot-size areaon the resulting temperature change rates is investigated. With that aim, thetransmission of the sample is probed immediately after photoexcitation, at atime delay of 1µs, with Gaussian-shaped pump beams of different area sizeson the film. Both cases shown in Fig. 3.14, at room temperature and 90K,were measured with two different pump spot-sizes: 93.4 µm× 85.1 µm and289.2 µm× 261.9 µm, which result in excited areas on the sample of 0.006mmand 0.059mm, respectively. This factor of ≈ 9.5 is reflected in the fluence de-pendence of the transmission change after photoexcitation. In Figs. 3.14(a)
Fig. 3.14: Comparison of the fluence-dependent transmissionchange at 1 µs after excitation with pump pulses of differentspot-sizes. Both under atmospheric pressure (a) and vacuum condi-tions (b), for a smaller pump spot-size, higher fluences are requiredfor triggering the phase transition.
and 3.14(b), it can be seen how the threshold is shifted towards higher fluencesfor the smaller pump spots, with a value of 10.5mJ cm−2 and 26.4mJ cm−2
for air and vacuum conditions, respectively. This effect can be understood byconsidering that cooling rates in the sample are dictated by the temperaturegradient generated in the film upon photoexcitation. Given the sub-100-nmsample thickness, heat transport can only occur in the transverse direction.Therefore, larger spot-sizes lead to smaller temperature gradients and longer
86
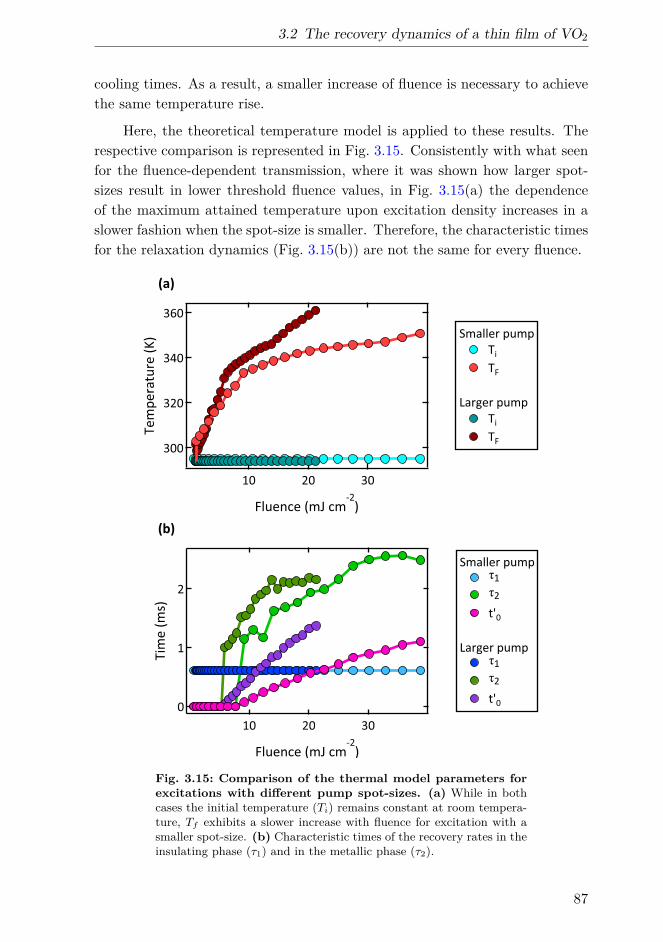
3.2 The recovery dynamics of a thin film of VO2
cooling times. As a result, a smaller increase of fluence is necessary to achievethe same temperature rise.
Here, the theoretical temperature model is applied to these results. Therespective comparison is represented in Fig. 3.15. Consistently with what seenfor the fluence-dependent transmission, where it was shown how larger spot-sizes result in lower threshold fluence values, in Fig. 3.15(a) the dependenceof the maximum attained temperature upon excitation density increases in aslower fashion when the spot-size is smaller. Therefore, the characteristic timesfor the relaxation dynamics (Fig. 3.15(b)) are not the same for every fluence.
Fig. 3.15: Comparison of the thermal model parameters forexcitations with different pump spot-sizes. (a) While in bothcases the initial temperature (Ti) remains constant at room tempera-ture, Tf exhibits a slower increase with fluence for excitation with asmaller spot-size. (b) Characteristic times of the recovery rates in theinsulating phase (τ1) and in the metallic phase (τ2).
87

Chapter 3 The role of heat in the phase transition of VO2
Case FTH TTH τ1(mJ cm−2) (K) (ms)
50Hz, 294K, air 6.6 334 0.6550Hz, 294K, vac. 5.1 335 650Hz, 90K, vac. 15.3 334.5 6500Hz, 294K, air 6.2 - -50Hz, 295K, air 10.5 334.5 0.61(9x smaller pump)
Table 3.2: Correspondence of threshold fluence and temper-ature. While the required fluences are not the same for triggering thephase transition under different experimental conditions, the thresholdtemperature do coincide.
3.2.5 Discussion
Table 3.2 summarizes the threshold fluences measured within the different ex-perimental cases. As it can be seen, they strongly depend on experimentalfactors, such as the ambient conditions (atmospheric pressure or vacuum),pump laser repetition rate, base temperature, and even the pump spot-sizeon the sample. Nonetheless, when simulating the dynamics with a simpletemperature-based model, it is encountered that all the values correspond toexcitation to a temperature in the range of 334–335K. This value is lower thanthe defined TC (of 340K for this sample), but it corresponds to the beginning ofthe hysteresis behaviour of the transmission upon temperature, where the heat-ing and cooling branches have split and fractions of the sample have alreadystarted to switch into the metallic phase. On the other hand, in a high-qualitysingle crystal with a characteristic sharper transition, the threshold fluence isexpected to coincide with TC.
The results presented here display a good agreement between the recoverydynamics of the photo-induced phase transition in VO2 and those simulated bya solely thermal model. This way, the temperature-dependent fluence thresholdis merely the consequence of requiring a larger amount of energy to be absorbedfor reaching the temperature of ≈ 334K, rather than for achieving a criticalcarrier density for collapsing the band-gap, as hole photodoping should notdepend on the base temperature of the material. Furthermore, in view ofthese new results, the divergence from thermal predictions reported at lowtemperatures in [101], in which the transition could be triggered by lowerfluences than the corresponding to the difference in thermodynamic energies,may have a simpler explanation. Considering this experiment was conducted
88

3.2 The recovery dynamics of a thin film of VO2
on a thin film under vacuum conditions, the observed effect could arise fromheat-accumulation that had already raised the temperature of the sample fromits initial base.
The thermodynamic energy required for inducing the phase transition inVO2 is given by the expression ETH = Cv∆T + HL, where Cv and HL arethe heat capacity and latent heat, respectively. Assuming that in the photo-induced phase transition all the absorbed pump-pulse energy is transformedinto heat, the minimum incident fluence for thermally inducing the metallicstate can be calculated with FTH = ETHd/(1 − R), where d is the samplethickness (since it is thinner than the penetration depth), and R, the reflec-tivity of VO2 at 800 nm (of 0.28). With a latent heat of 235 J cm−3 [102] andintegrating the heat capacity over the desired temperature range [102], the op-tical thresholds for inducing the transition are calculated to be ≈ 4mJ cm−2
and ≈ 8.5mJ cm−2, for base temperatures of 295K and 90K, respectively.
The values measured here for the photo-induced transition are somewhathigher than these, an effect that might be related to superheating phenomenafound to occur in many first-order phase transitions. It should be noted as well,though, that the thresholds measured at microsecond time-scales are expectedto be generally higher than those obtained when measuring the response ofVO2 to photo-excitation within the picosecond regime, as volume expansionprocesses have an effect on the dynamics. This simple calculation represents alower limit for the energy required for driving the transition, as many factorsare neglected, in particular those specific to the employed sample. However,in none of the cases measured here the transition is photo-induced by excitingthe sample with a lower fluence than that required by thermodynamics.
The strong dependency of the threshold fluence on experimental parame-ters hinders the utility this value can have for characterizing the phase transi-tion process. It is important to notice that, despite these measurements beingcarried out in the millisecond regime, the fact that the system does not re-cover fast enough has a major effect also on femtosecond time-scales as a resultfrom the repetitive nature of pump-probe measurements. As a final step inthe investigation of threshold fluences, motivated by the claim that probingthe photo-induced phase transition with different wavelengths leads to dis-tinct thresholds, the fluence-dependent transmission of a thin film of VO2 ismeasured after photoexcitation employing photon energies in the visible andmid-infrared regime.
89

Chapter 3 The role of heat in the phase transition of VO2
3.3 Threshold-fluence measurements in thevisible-MIR regime
In the experiments performed by Morrison et al. mentioned at the beginningof this chapter, 5-µm-wavelength laser pulses were employed to probe the elec-tronic band-gap, which was found to collapse without the need of a structuraldistortion [51]. This claim was based on the fact that the threshold value forthe closing of the band-gap was lower than that found by means of the struc-tural probe provided by electron diffraction. Nonetheless, in light of the newinformation presented so far regarding the dependence of threshold fluences onso many external parameters, such important claim is now tested.
The photo-induced phase transition is probed here with a selection of pho-ton energies that lie both below and above the band-gap of VO2 (≈ 0.6 eV).Whereas the shorter wavelengths are mainly sensitive to changes in the den-sity of states above the insulating gap, and the regime around 800 nm has beenshown to probe the structure through phonons measurements, the signal pro-vided by energies well below the band-gap, such as 5µm, are expected to probethe emergence of metallic-like conductivity from the intragap electronic states.The observed suppression of transmission at these lower photon energies im-mediately after strong photo-excitation has been taken as indication for theclosure of the band-gap and the onset of a Drude-like response of free electronsin metallic VO2 [48, 51, 100].
The pump-probe measurements presented here were performed by excitingthe thin film of VO2 with an 800 nm pump laser at a repetition rate of 100Hzand probed with laser pulses of different wavelengths ranging from the visibleto the mid infrared regime generated by difference frequency generation fromthe signal and idler beams of an IR optical parametric amplifier (OPA) (seeFig. 3.16). The sample was held at room temperature under atmosphericpressure conditions. The transmitted intensity was recorded by a photo-diodeconnected to the same oscilloscope as in the previous experiment. Additionally,the response of the sample was tested under these experimental conditions tocheck for a complete recovery between laser pulses.
It is worth mentioning that fluence determination is always accompaniedby experimental uncertainties, mostly arising from small errors in spot-sizemeasurements, losses in absorption/reflection at different angles of incidence,and sample inhomogeneities. Moreover, as seen in previous sections, experi-mental parameters may have major effects on the thresholds observed for thephase transition. Therefore, the importance of these results does not focus
90

3.3 Threshold-fluence measurements in the visible-MIR regime
Fig. 3.16: MIR pump-probe experimental setup. The sampleis excited with 800 nm pump pulses at 100Hz and probed with wave-lengths generated by an OPA, in the mid infrared and visible regime.
on the absolute values obtained, but on the relative differences between fourmeasurements performed in the same experimental setup under the same con-ditions. Additional measures were taken to ensure that every probe depositedthe minimum and equal power on the sample, as due to the nature of thefrequency conversion processes, its efficiency is highly wavelength dependent,which results in different wavelengths having different intensities. This step isvital, as probe pulses can also act as a heating source in the same way the pumpdoes, especially since they are typically focused to a much smaller spot-size.
Figure 3.17 displays the fluence-dependent differential transmission mea-sured at 1 ps after photo-excitation employing the following wavelengths: 680 nm(1.82 eV), 1.375µm (0.90 eV), 1.890 µm (0.66 eV), and 5 µm (0.25 eV). As per-formed for the fluence scans displayed in Fig. 3.8, the threshold values aredefined as the intersection of the linear fits represented by the dashed lines foreach wavelength. The results are collected in Table 3.3. As observed, all thevalues obtained lie within the range of 4.0–4.6mJ cm−2.
No significant differences can be observed neither in the fluence-dependenttransmission behaviour, nor in the obtained threshold fluences. No evidence forthe emergence of a metallic state at lower fluences can be extracted from theseresults and hence the claim for decoupled electronic and structural transitionshave no support from this experiment. Instead, a single threshold value is foundto describe the photo-induced phase transition in VO2, which is assigned tothe M1-R transition.
91

Chapter 3 The role of heat in the phase transition of VO2
Fig. 3.17: Fluence-dependent transmission change at 1 ps inthe visible-MIR regime. .
λ (µm) FTH
0.680 4.61.375 4.51.890 4.05 4.4
Table 3.3: Threshold fluences in the visible-MIR regime. Val-ues of the threshold fluence of the photo-induced phase transition ob-tained by probing with different wavelengths.
92

3.4 Conclusions
3.4 Conclusions
This chapter has shown that the slow recovery dynamics of VO2 are vitalfor the correct interpretation of threshold measurements, not only on the longtime-scales measured here, but also on the femtosecond regime, as a result fromthe repetitive nature of pump-probe measurements. Heat buildup effects areof particular importance in experiments performed on free-standing thin films,where the lack of material that can act as a heat sink limits the rate of thermaldiffusion. It is important to note, though, that the experimentally crucialquantities, such as the time it takes for the system to return to equilibriumconditions after excitation, are connected to the extrinsic properties of theexperiment, rather than to intrinsic properties of VO2. As a result, the recoverytimes of the investigated material should always be verified before conductingthe final measurements.
On the other hand, from the physics perspective, this study has demon-strated that a simple thermal model is able to accurately reproduce the experi-mental observations on the recovery dynamics of VO2. The agreement betweenexperimental results and simulations is striking considering that the behaviourwithin the hysteresis region, which is non-trivial, is not included in the model.This further reinforces the existence of a common pathway for the thermal andphoto-induced phase transitions.
The strong dependency of the threshold energy densities on experimentalparameters and ambient conditions makes difficult the comparison of thresh-old values obtained from different measurements. Despite being reported inliterature, laser-induced heating has mostly been neglected. While several ex-periments have considered heat buildup from the use of high laser repetitionrates, the effect of pump spot-sizes, or working under vacuum or atmosphericpressure conditions has been generally ignored. As a result, it is highly proba-ble that the reported discrepancies on VO2 from the past years arise from suchwrong practice when interpreting the threshold values of the transition. More-over, in this chapter it has been shown that when performing pump-probe mea-surements employing different probe wavelengths but with a maximum controlover external parameters, the differences between thresholds are vanished.
Interestingly, the results obtained by Morrison et al., in which they claimthe existence of a monoclinic metallic state, were based on the comparisonof threshold fluences measured with ultrafast electron diffraction, sensitive tostructural changes, and with a 5µm probe, sensitive to the band-gap. However,UED was conducted in vacuum while the IR experiment was carried out at
93

Chapter 3 The role of heat in the phase transition of VO2
atmospheric conditions. The work presented in this chapter demonstrates,though, that changing the ambient conditions of the experiment can lead tosignificant different results due to the 10 times lower recovery rate for thethin-film samples under vacuum. As a result, despite not being obvious in themeasured dynamics, heat buildup and the consequent temperature rise canbe significant high, making seriously difficult the direct comparison of fluencevalues from both data sets.
As a natural conclusion from the results presented in this chapter, themeasurement of threshold values should not be employed as evidence for claimson the nature of the phase transition in VO2, or any materials presenting afirst-order photo-induced transformation. While these concerns are particularlysignificant for free-standing thin films, they are minor for single crystals, inwhich their bulky nature is expected to provide a sufficient heat sink. Yet, therecovery of thin films on substrates should still be considered, as thermal flowbetween sample and substrate may limit heat dissipation.
94


4 | Structural dynamics across thephase transition
This chapter presents time-resolved measurements of the insulator-metal phase transition of VO2 in the soft and hard X-ray regimes withthe aim of studying the role played by phonon dynamics in the transfor-mation. Section 4.1 summarizes the key results published in literatureon the structural transition of VO2. Sections 4.2 and 4.3 present theresults obtained by means of time-resolved soft X-ray absorption spec-troscopy and ultrafast X-ray total scattering, respectively. The insighton lattice dynamics across the IMT obtained from both techniques pro-vide a new description of the phase transition. The chapter ends withconclusions in Section 4.4.
97

Chapter 4 Structural dynamics across the phase transition
4.1 Introduction
The exact role played by lattice dynamics in the ultrafast insulator-metal phasetransition in VO2 is currently still under debate. On one hand, phonon inter-actions are regarded as the main force that drives the transformation in aPeierls-mediated scenario. On the other hand, the lattice distortion is con-ceived as a side effect, consequence of the charge redistribution resulting fromstrong Coulomb forces acting within a Mott-physics picture. The main respon-sible mechanism may be reflected in discernible differences in the dynamics ofthe phase transition. In this regard, Cavalleri and co-workers suggested thatby watching the transition directly, the nature of the driving mechanism couldbe revealed [46].
Generally, solid-solid crystallographic transitions where the system un-dergoes a symmetry change are characterized by a more symmetric high-temperature phase with respect to the low-temperature phase. Furthermore,the low-symmetry phase can be obtained from the high-symmetry phase bydistorting the crystal structure along specific phonon coordinates at a partic-ular wavevector. Such is the case in VO2, with the rutile phase displaying agreater symmetry than the M1 structure, and the phase transition expressed bymodes at the R-point of the rutile structure [103]. To date, the ultrafast phasetransition has been assumed to be displacive along this specific phonon coordi-nate. However, more recently, an alternative transformation pathway, resultingfrom disorder, has been suggested based on equilibrium measurements [104].Understanding the type of transformation followed represents a key factor forthe complete comprehension of the properties exhibited by the material, andopens up new directions for the efficient control of them.
In a displacive phase transition, the frequency of a specific phonon modecontinuously decreases as the phase transition is approached, known as phononsoftening, until the frequency reaches a zero value at Tc. A zero-frequencyphonon implies an unstable lattice structure. A new mode hardens again belowthe phase transition as the system finds the new, displaced, equilibrium posi-tions of the lower-symmetry phase. During this process, the atoms are shiftedin a coherent motion following the soft vibrational mode that links the low-and high-symmetry structures. In contrast, in an order-disorder transition,the atoms move from one structure to the other in an incoherent way withno well-defined wave vector to conduct the transformation. Instead, diversepathways can be followed by the atoms, to arrive to the same final destination.In this case, no phonon softening at any wavevector characterizes the phasetransition. Notably, in both processes the average atomic positions may follow
98

4.1 Introduction
a trajectory along the same coordinate between both symmetries, as illustratedin Fig. 4.1.
Fig. 4.1: Transition mechanisms between the M1 and Rphases of VO2 upon photoexcitation. In a coherent displacivetransition, the V ions collaboratively reshuffle their positions alongthe reaction coordinate towards the rutile structure. The disorder-ing mechanism has no well-defined wavevector, and the V ions movetowards the high-symmetry structure in a spatially incoherent fashion.
Initial symmetry analysis of the metallic rutile phase of VO2 suggested thatthe crystallographic phase transition could be explained in terms of a phononat the Brillouin-zone boundary, specifically at the rutile R-point, that softenson cooling towards the phase transition within a displacive process [103, 105,106]. Rutile zone-boundary R-points are equivalent to zone-center Γ-points ofthe monoclinic phase. Therefore, the modes relevant to the structural tran-sition belong to a low-energy optical branch of the M1 phase that becomes atransverse acoustic branch in the rutile structure. Specifically, the phononsof the insulating phase often ascribed to the dimerization and rotation of thevanadium atoms are Ag modes at ∼ 5.9THz and ∼ 6.7THz, which soften signif-icantly, in the high-temperature phase, to frequencies in the 2–4THz range [46].In order to measure the modes away from the Brillouin-zone center, probes withfinite momentum are necessary.
Traditionally, the most powerful method for this has been inelastic neutronscattering (INS), which allows the study of lattice dynamics through phonondispersion in several crystals. However, due to the extremely large incoherentcross-section of neutron scattering for vanadium, large single-crystals are re-quired. The difficulty in growing sufficiently wide crystals, together with thetendency of such crystals to fracture across the phase transition, has madeof INS a very challenging technique for studying VO2. As a result, for manyyears the comprehension of lattice dynamics has relied mainly on Raman spec-troscopy [107, 108], together with other indirect approaches able to probe
99

Chapter 4 Structural dynamics across the phase transition
the evolution of phonons across the IMT, such as acoustic waves measure-ments [109]. These early measurements reported very different spectra for themonoclinic and rutile structures of VO2. While the low-temperature phaseappears to be characterized by sharp peaks at distinct phonon frequencies,the high-temperature phase consists of a broad frequency band [107, 108, 110].This broadening stands as a signature of the heavy damping of phonons, whichwas attributed to strong electron-phonon coupling in the metallic phase thatreduces phonon lifetime [107].
To overcome the limitations of Raman measurements and optical probesin general, only sensitive to modes at the Γ-point, a different approach wasadopted, which exploited the larger penetration depth and higher photon mo-mentum of hard X-rays to measure thermal diffuse scattering (TDS) [110].The presumed softening of the R-point rutile phonon modes should give rise toan enhanced diffuse scattering across the corresponding regions of reciprocal-space. This experiment provided the first experimental observations compati-ble with such a phonon softening. The evidence was, though, hindered by thepoor data quality from that time.
As a result, the VO2 phase transition, as well as most ultrafast solid-solidtransitions, has been generally considered as a chemical reaction, in whichthe system evolves along a reaction coordinate that links the two structures,corresponding to the wavevector of the rutile soft phonons. More recently,time-resolved studies of the structural transition based on ultrafast electronand X-ray diffraction gave support to the displacive description of the phasetransition [45, 51, 56]. The coordinated atomic motion along a well-definedwavevector was found to limit the speed of the photo-induced transition leadingto the so-called structural bottleneck [46], introduced in Section 1.3.
Until recently, mapping the entire phonon dispersions across the Brillouinzone had remained an unsolved challenge. But in 2014 a new experimentconducted by Budai et al. shed light into this issue. By combining inelas-tic X-ray and neutron scattering on small single-crystals and powder samples,respectively, they achieved the first detailed picture of the lattice dynamicsover a wide q-region across the phase transition in VO2, supported by first-principles DFT-based phonon simulations [104]. This study showed how thestructural transition is accompanied by large changes in the phonon spectrumover extended regions of the q-space. In particular, the modes of the mono-clinic optical branches appear to soften abruptly when transforming into therutile acoustic branches, with an energy drop from ∼ 25meV to ∼ 12meV. Thelattice potential in the high-temperature phase was found to be largely anhar-monic, leading to a great increase of phonon entropy in the metallic phase.
100

4.1 Introduction
Calculations concluded that phonons account for approximately two thirds ofthe total entropy raise across the transition from M1 to R that eventually sta-bilizes the metallic phase. Notably, no zero-frequency modes were found atthe R-point across the phase transition, disproving previous suggestions of asoft-mode transition at this wavevector [106, 110].
These recent results confirm early proposals about high phonon entropyresponsible for stabilizing the metallic phase [111]. Considering phase stabilityas achieved by minimizing the Gibbs free energy, within this thermodynamicdescription, the phase transition results from the competition between mini-mizing the electronic energy in M1 by V-V dimerization, and maximizing theentropy arising from soft anharmonic phonons in the metallic phase. Further-more, the absence of phonon condensation close to Tc and the abrupt softeningpoint towards an order-disorder type of transition, rather than a displaciveprocess as generally believed.
As well as changing the existing view of the equilibrium phase transition,this work also challenges the current interpretation of the ultrafast transition.If there is not one specific mode responsible for the phase transition, it is hardto argue that it should proceed at a defined structural bottleneck time scale.However, it is also not obviously clear what limits the time scales when thetransition is driven by disorder. Therefore, the fast electronic time scales re-ported by some previous studies could still be the result from lattice dynamics.
In order to shed light on the role played by phonon dynamics in the photo-induced insulator-metal phase transition in VO2, the lattice evolution acrossthe IMT is probed employing different methods. First, changes in the crys-tal field upon photoexcitation within the monoclinic and rutile structures arestudied by means of time-resolved soft X-ray absorption spectroscopy withinpicosecond time scales. For deeper insight into the dynamics, these results arecombined with femtosecond optical spectroscopy and coherent phonon genera-tion, capable of probing phonons response near the Brillouin-zone centre withsub-50-fs temporal resolution. Finally, through an ultrafast hard X-ray diffusescattering technique, femtosecond phonon dynamics over extended q-regionsof reciprocal space are investigated, providing the first measurements on themomentum-dependent phonon spectrum changes across the phase transition.
101

Chapter 4 Structural dynamics across the phase transition
4.2 Time-resolved X-ray absorption spectroscopy
As presented in Section 2.2.2, XAS is a particularly useful technique for study-ing the insulator-metal phase transition in VO2, as it is both sensitive to elec-tronic and structural degrees of freedom, and is element specific. Extendingthis technique to the time domain can thus give insight into the evolution ofthese features across the IMT. Specifically, the XAS signal results from tran-sitions from localized core states (initial states) into unoccupied levels of theconduction band (final states). In general, a time-resolved XAS signal can re-sult from transient changes in either the initial or the final states, or both. Yet,in the soft X-ray region, where this work is carried out, the picture is simplifiedby the existence of large screening in the core states, so that changes in theseinitial states caused by photo-excitation or phase transitions are minimal, andany measured signal can be attributed to modifications of the final states alone.This is not the case, though, for measurements performed with lower-energyphotons, such as XUV and optical frequencies, which gives soft XAS a distinctadvantage over other techniques.
With regard to the final states, two phenomena can drive changes in them.Firstly, a redistribution of the electronic population within an unmodified bandstructure may block transitions into previously unoccupied states, or allowtransitions into previously occupied ones. In the XAS signal, this results inchanges predominantly affecting the spectral region that probes states near theFermi energy. Alternatively, final states can be altered by changes in the bandstructure or crystal field, which can modify the distribution and density of theunoccupied states. This may not result in localized spectral changes in theXAS signal, but in broader modifications. Therefore, XAS spectra can probeboth electron and state dynamics.
The first time-resolved XAS experiments on VO2 were conducted by Caval-leri et al., first on the picosecond [98] and later on femtosecond time scales [112],along the vanadium L- and oxygen K -edges with approximately 4 eV spectralresolution. The range of probed photon energies was therefore limited, which isof particular concern given that the relevant XAS features, that show changesacross the IMT, are typically 1 eV wide. To date, further time-resolved studiesin this important spectral region have not been performed.
The aim of this study is to probe the evolution of these XAS features acrossthe photo-induced insulator-metal phase transition. The work is focused on theabsorption features at the oxygen K -edge, as these have been proven essentialfor obtaining information about various aspects of the phase transition of VO2,
102

4.2 Time-resolved X-ray absorption spectroscopy
such as the role of electronic correlations [44, 83], the existence of a monoclinicmetallic state [25], the presence of other insulating phases [93], and to imagephase separation with high spatial resolution, as performed in Chapter 2.
4.2.1 Experimental details
The time-resolved XAS measurements were carried out at the FemtoSpeX facil-ity (UE56/1 ZPM beamline) of the BESSY II synchrotron radiation source [113,114]. The employed samples, 75-nm-thick polycrystalline VO2 thin films de-posited onto 150-nm-thick free-standing Si3N4 membranes by PLD, have thesame characteristics as those utilized in the holography experiments presentedin Chapter 2 (see 2.3.2). During the experiments, the films were maintainedunder ultra-high vacuum conditions. Laser pulses of 50 fs duration and 800 nmcentral wavelength excited the sample, and soft X-rays from the isolated hybridbunch in the normal multi-bunch pattern were gated to probe the response ofthe sample in transmission. The achieved temporal and spectral resolutionwere of ∼ 75 ps and ∼ 1 eV, respectively. At this beamline, the monochromatoris optimized for the best compromise between flux and resolution of the X-raypulses, hence the high spectral bandwidth.
High-resolution spectra measured at low and high temperatures obtainedat the UE52-SGM beamline are displayed in Fig. 4.2(a). The relevant XASfeatures are clearly visible, with the small red-shift in the metallic phase ofthe π∗ states probed at 529 eV, and the presence of an extra peak at 530.5 eVdue to the split of the d‖ band (detailed description of the XAS features canbe found in Section 2.2.2). Such features are washed out in the spectra mea-sured at the FemtoSpex beamline due to the lower spectral resolution, as seenin the dashed trace in Fig. 4.2(b). A good agreement between both measure-ments can be found when comparing the low-resolution with the high-resolutionspectra after convolution with a Gaussian function of 1 eV width. The smalldiscrepancies observed are related to the fact that the FemtoSpeX facility isnot optimized for static spectral measurements and can be more affected bybackground drifts. Despite the relatively low energy resolution, the two majorabsorption peaks can still be distinguished, and these spectra represent a factorof four improvement over previous time-resolved XAS [98, 112].
As shown in Chapter 3, heat accumulation can become significant whenmeasuring free-standing thin-films under vacuum conditions, as the recoveryof the sample between pump laser pulses is severely limited. Therefore, it isnot possible to work at the usual repetition rate of 3 kHz of the FemtoSpeXfacility. According to results presented in 3.2.3, an ideal measurement setup
103

Chapter 4 Structural dynamics across the phase transition
(a) (b)
π* dǁ
σ*
Fig. 4.2: X-ray transmission spectra of VO2 at the O K-edge.(a) The high spectral resolution of 0.1 eV of the spectra obtained atbeamline UE52-SGM allow for the clear distinction of the π∗, d‖, andσ∗ states. (b) The low-temperature spectrum with 1 eV resolutionmeasured at the FemtoSpeX beamline is in good agreement with theM1 trace in (a) after convolution with a 1-eV-width Gaussian function.
would require laser repetition rates of less than 50Hz for a complete recovery ofthe sample at room temperature under vacuum conditions. However, this wasnot feasible at the FemtoSpeX facility because low repetition-rates have a verystrong impact on the signal-to-noise ratio of the experiment, and the activebeam stabilization of the pump laser required a minimum repetition rate of600Hz. Therefore, as a compromise, the pump laser repetition-rate was set toRL = 600Hz, with the additional cooling down of the sample to a temperatureof 90K, which limits the induced temperature rise.
Fig. 4.3: Timings of the pumped and unpumped probe signals.While all the X-ray pulses from the bunch pattern impinge on thesample, only those labelled as IP and IU are detected within the pump-probe measurements to be afterwards compared to each other.
At this reduced pump frequency, the collected data suffers from muchlower statistics. With the aim of improving the signal-to-noise ratio of theexperiment by reducing noise from slow drifts and fluctuations in the detection,
104

4.2 Time-resolved X-ray absorption spectroscopy
extra measures were taken in the data acquisition process. Two X-ray pulsesfrom the pulse train were used to probe the sample, giving rise to the pumpedand unpumped signals. At this beamline, the pump laser is synchronized to afraction of the repetition-rate of the synchrotron light source, which is RS =1.25MHz. In the following, the pumped signal, IP, corresponds to the X-raypulses that are timed with respect to the laser pulse, in the sense that thepump arrives to the sample at a controllable temporal delay within a windowof ± 1 ns of the X-ray probe (see Fig. 4.3). On the other hand, the unpumpedsignal, IU, corresponds to the detected X-ray pulse that arrives at a time1/RL − 1/RS ' 1.666ms after the previous pump pulse, or 800 ns before thenext. The transmission from these two X-ray pulses, IP and IU, is recordedby means of gated detection. 1.666ms corresponds, then, to the maximumpossible delay between pump and probe, which, in the ideal case, results inthe unpumped channel probing the same state as that found when the laseris blocked. By doing so, any long-lived effects that could exist in the sample,in particular as a consequence of heat, are probed by the unpumped channel,which detects the new steady state of the sample immediately prior to the nextexcitation pulse.
4.2.2 Transient XAS spectra
Different transient signals were observed in the XAS spectra when exciting thesample with increasing pump fluences. In the following, the spectra are dis-played in the differential form of transmission, i.e., ∆T/T = (IP − IU)/IU, tobetter reflect the change in the sample before and after excitation. Figure 4.4shows the transient differential spectra measured within a pump fluence rangeof 1–18mJ cm−2. It can be seen that the largest changes occur at two differentphoton energies: 529 eV and 530.5 eV, with negative and positive changes, re-spectively, in comparison to the ground unpumped state. Recalling Chapter 2,these energies probe transitions into the π∗ and d‖ bands. The dependencyof these states upon pump excitation is displayed in Fig. 4.5, where it is clearhow both states start to change concomitantly above a threshold fluence of3mJ cm−2, and the signals increase in amplitude up to 4.4mJ cm−2. Afterthis point, they begin to decrease until no transient change is observed at5mJ cm−2. Interestingly, raising the pump excitation above this level resultsin a different change of the XAS spectra, which show a signal at 530.5 eVthat gradually increases in amplitude with opposite sign with respect to thelow-fluence signal.
105

Chapter 4 Structural dynamics across the phase transition
Fig. 4.4: Fluence dependent XAS spectra of VO2 measuredat +400 ps. The amplitude of the changes in transmission increasesup to a pump fluence of 4.4mJ cm−2, where it reaches its maximumbefore decreasing until no transient change is observed at 5mJ cm−2.The traces are offset for clarity.
106

4.2 Time-resolved X-ray absorption spectroscopy
!
"
!
#$%$
&'(
)
*+*"+
,-./01/&'23&12 !
)
#4&5&67""&89
&+:";+&/<
&+!=&/<
Fig. 4.5: Fluence dependence of the π∗ and d‖ states. Abovea threshold of 3mJ cm−2, the amplitude of the change of both statesstart increase with fluence. After reaching 4.4mJ cm−2, they are re-duced and there is no significant change already at 5mJ cm−2. Forhigher fluence, at 530.5 eV a signal with opposite sign with respect tothe low-fluence signal is visible.
In order to understand this fluence-dependent behaviour, the full differen-tial transient spectra at two crucial pump excitations are compared in Fig. 4.6with the static differential spectrum. For a better comparison in terms of spec-tral resolution, the latter is calculated from the convolved static insulating andmetallic spectra. A very good agreement is found between the static and tran-sient spectra measured at 4.4mJ cm−2. A decrease of the d‖ and an increaseof the π∗ states can be observed, which correspond to a transition from theinsulating M1 to the metallic R phase. Thus, from this it can be inferred thatexciting with low fluences above a threshold of 3mJ cm−2 induces the IMT.The discrepancy at the edges of the spectra coincide with those found betweenthe equilibrium spectra in Fig. 4.2.
In Fig. 4.5, below 3mJ cm−2, no dynamics are observed above the level ofsignal-to-noise. At such low fluences, no structural transition is driven, henceno changes in the band structure and state dynamics are expected. Still, elec-tron dynamics in the form of charge redistribution may be present after photo-excitation. This should primarily affect the conduction-band edge, probed withphoton energies around 529 eV. The fact that no changes are observed in thepresent data suggests that either the carriers have already scattered their en-ergy to the lattice on a much faster time-scale than the current resolution, orthat the sensitivity of the experiment is not sufficient to probe such signal.
107

Chapter 4 Structural dynamics across the phase transition
Fig. 4.6: Comparison of transient and static spectra. Thedifferential transient transmission spectra measured at +400 ps atthe oxygen K -edge display a different behaviour when excited by4.4mJ cm−2 (red trace) and by 18mJ cm−2 (purple trace). The light-red trace corresponds to the calculated differential spectrum of thestatic spectra in Fig. 4.2(a) convolved with a spectral resolution of1 eV.
On the contrary, when exciting with 18mJ cm−2 (purple trace in Fig. 4.6),the transient spectrum displays a negative change in transmission with respectto the unpumped channel, that peaks around 530 eV, suggesting a differentstate is induced. Recalling the results presented in Chapter 3, the conditionsunder which this experiment was performed are not ideal for a complete recov-ery of the sample at high fluences to the ground state between pump pulses,so the sample remains above TC. Therefore, above a fluence of 6mJ cm−2,the transient XAS signal is lost because the insulator-metal phase transitioncannot be induced once the material is already in the metallic phase. And thesignal that emerges above 18mJ cm−2 corresponds to photo-excitation of themetallic phase. Further proof of the nature of the high-fluence data will bediscussed in Section 4.2.3.
The temporal evolution of these observed changes is presented in Fig. 4.7,which represents three typical resolution-limited transient signals. The increasein transmission after photo-excitation at 530.5 eV and decrease at 529 eV areexpected for the insulator-metal phase transition. The initial responses areresolution-limited, but, in the hundreds of picoseconds measured, they showno subsequent evolution, suggesting that the whole sample volume has trans-formed with no further growth of the metallic phase or thermal diffusion. Thesame can be said about the time scan measured with 18mJ cm−2 in terms oftemporal resolution, although this signal cannot be reconciled with the IMT,
108

4.2 Time-resolved X-ray absorption spectroscopy
!
"
#$%$&'()
*!!!+!!!
$,-.&/.012&'34)
&+ 5&.6&"&78+&-9&:-"
&+;!8+&.6&"&78+&-9&:-"
&+;!8+&.6&"&*<8!&-9&:-"
Fig. 4.7: Time delay scans at 529 eV and 530.5 eV. The timetraces of the changes in the d‖ and π∗ states display the correspondingpositive and negative responses when pumped with low fluence. At530.5 eV there is a change of sign of the photo-induced changes intransmission.
but with the photo-excited rutile phase.
In view of the presented data, it is worth considering whether these spectracan represent an intermediate monoclinic metallic phase that emerges betweenthe M1 and R phases. The spectrum of such a state would result in an absorp-tion peak at 530.5 eV due to the split d‖ band characteristic of the monoclinicstructure, and an energy shift of the π∗ states, as they account for the metallicbehaviour by crossing the Fermi level. Therefore, the differential XAS signalwould display spectral shifts at 529 eV, with no changes in the 530.5 eV fea-tures [25]. However, by observing Fig. 4.5, both spectral features appear tochange at the same fluence, strongly suggesting that the electronic and struc-tural transitions are occurring concomitantly. Nonetheless, the possibility forthe monoclinic metallic phase originating at an intermediate fluence within therange ∼3.4–3.6mJ cm−2 and/or having a shorter life than the temporal reso-lution reported here, as suggested by previous ultrafast experiments [48, 51],cannot be completely excluded.
Summarizing, three fluence regimes can be defined in this experiment. Forfluences below 3.4mJ cm−2,the sample is initially in the insulating phase andthe photo-excited M1 is probed. For fluences within the range 3.4–4.4mJ cm−2,the phase transition is induced, and hence the M1-to-R transition probed.Finally, above 4.4mJ cm−2, the photoexcited R phase is measured.
109

Chapter 4 Structural dynamics across the phase transition
4.2.3 Heat effects in the structural transition
In order to determine the role played by laser-induced heat in the phase tran-sition, the pumped and unpumped channels are analysed independently. Asmentioned before, in ideal experimental conditions, the unpumped channelshould probe the same state as if the laser was blocked, so it should neverchange regardless the excitation power. Moreover, this state should coincidewith that probed by the pumped channels at negative time delays. This isnot the case, though, in this experiment. Figure 4.8 shows the transient XASspectra as measured by the pumped and unpumped probes separately. Thisway it can be observed how the trace pumped with 4.4mJ cm−2, correspond-ing to the transient metallic phase, matches that of the unpumped channelwhen the sample is excited by 18mJ cm−2. This proves that the differentialsignal found at this pump fluence reported in the previous section results fromphoto-excitation of the metallic phase.
!""
!"
! #
$%&'()
*((*+',-&!.!/
01201301 034
56+7+',8'8%9:,-8;/
,5.)<8=,>,2!2,)?,@)>3
,A'<.)<8=,>,2!2,)?,@)>3
,A'<.)<8=,>,"4! ,)?,@)>3
Fig. 4.8: Transient XAS spectra of the insulating and metallicstates. For a pump fluence of 4.4mJ cm−2 the phase transition isinduced, with the unpumped channel probing the M1 and the pumpedchannel probing the R phase. For a higher fluence of 18mJ cm−2, theunpumped channel matches the spectrum of the metallic phase.
The transmitted intensities as a function of fluence of both channels, mea-sured at positive and negative time delays, are plotted in Fig. 4.9. Figure 4.9(a)shows that at positive delay time, the pumped channel shows a decrease intransmission at 3.3mJ cm−2, corresponding, as already seen before, to the IMTprobed at 529 eV. However, the unpumped channel shows an abrupt change aswell for a higher pump fluence, of 4.4mJ cm−2. On the other hand, at negativetime delays for the pumped signal, both channels decrease at once at the samefluence of 4.4mJ cm−2. This variation of the unpumped channel can thus ac-
110

4.2 Time-resolved X-ray absorption spectroscopy
count for the reduced differential signal above 4.4mJ cm−2 in Figures 4.4 and4.5.
This demonstrates that, above such threshold, the steady-state propertiesof the material have changed due to laser-induced heat. As a result, for fluencesabove this value, at a repetition-rate of 600Hz, the average temperature ofthe sample has been raised from 90K by almost 300 degrees to lie above theinsulator-metal transition temperature.
(a) (b)
Fig. 4.9: Transmission as a function of fluence in the pumpedand unpumped channels. (a) At positive time delays, a transientsignal is observed in the pumped channel for fluences above 3mJ cm−2.From 4.4mJ cm−2 on, the differential signal is reduced as the un-pumped transmission changes as well. (b) At negative time delays,no differential signal is observed, but both channels change at the samefluence of 4.4mJ cm−2.
4.2.4 Transient optical response under equivalent conditions
In order to show that under these experimental conditions the material is trulyin a long-lived metallic state for high pump fluences, complementary opticalpump-probe measurements are performed under equivalent experimental con-ditions. However, measuring a real lattice-related response by means of opticalmeasurements is a challenging approach. Whereas soft X-rays are capable ofdirectly probing the crystal field, optical approaches are mainly sensitive tothe overall density of valence states. Therefore, the results are always ambigu-ous in the sense that they can only probe the band structure in an indirectway through the dielectric function measurement. This hinders the separationof a metal-like signature resulting from a truly metallic response consequenceof a band-gap collapse, and that arising from the presence of free carriers in
111

Chapter 4 Structural dynamics across the phase transition
the conduction band due to photo-excitation but within an insulating bandstructure.
A method to overcome this difficulty and probe the structural changesassociated to the IMT with an optical pump-probe measurement lies on probingthe lattice potential through the generation of coherent optical phonons. Thisexperiment was conducted in the optical laboratory at ICFO, employing thewhite-light generation setup shown in Fig. 4.10. The sample was maintainedat 90K in a cryostat under high-vacuum and the laser repetition-rate was setto 500Hz. Note that the standard repetition-rate of 5 kHz of the optical lasercan only be lowered by integer numbers, hence the speed discrepancy betweenthe X-ray and optical measurements.
Fig. 4.10: White-light generation pump-probe optical setup.The sample, held in a cryostat, is excited with 800-nm pump laserpulses and probed by white-light pulses generated through a sapphirecrystal. The transmitted intensity is recorded by a CCD camera insidea spectrometer.
Coherent phonon generation
In an absorbing material, photons from the pump pulse in the near-UV, vis-ible, and near-IR regime couple to valence electrons, photoexciting them intopreviously unoccupied states. Such electronic charge redistribution within thesolid generates a force onto the lattice. The restoring forces experienced by theions upon their perturbation are dictated by the superposition of the phononmodes of the lattice potential. When the force is generated by an impulse-likeexcitation, with a duration shorter than the period of the phonons, coherentmotions of the lattice are induced. Given that phonons modulate the dielectric
112

4.2 Time-resolved X-ray absorption spectroscopy
function of the material, these vibrations can be measured in the time domainthrough the transient reflection or transmission of the solid. When the sym-metry of the system changes, as it happens upon a structural transition, thenumber and frequencies of the modes also typically change. This way, phononmodes can be employed as a signature of the current phase of the system.
In 2012, Wall et al. demonstrated how this process can be exploited tomeasure the temporal evolution of the phonon spectrum during the insulator-metal phase transition of VO2 [57]. They found how, by exciting the ma-terial with sufficiently intense pump pulses, the phonon modes characteristicof the monoclinic M1 phase dramatically collapse, an indication of the ultra-fast modification of the entire lattice potential symmetry. This also suggeststhat, whereas in equilibrium the changes in ionic positions and in the phononspectrum are concomitant processes, out-of-equilibrium the lattice potentialmay change before the ions have time to reach their new equilibrium positions.Thus, such a strong perturbation of the lattice potential may become enoughfor driving the system into the rutile phase. This way, the state of the systemcan be probed in a non-equilibrium situation.
The transient response of the sample at 600 nm is shown in Fig. 4.11(a).When the VO2 film is excited by low fluences (2.2mJ cm−2, light-red trace), theions in the M1 symmetry vibrate around their equilibrium positions, giving riseto the observed coherent phonons oscillations. Increasing the pump excitationto 5.8mJ cm−2 (red trace) causes a strong suppression of the phonon modes,indicative of the change in the lattice potential symmetry and the subsequentinsulator-metal phase transition [57, 115]. At even higher fluences (dark-redtrace), the optical response changes dramatically in two manners. Firstly, anoffset is present at negative time delays, which indicates that the system isnot in the equilibrium ground state when the pump pulse arrives. Secondly,the transient response follows a spike-like behaviour near zero time delay, acharacteristic response of the metallic phase of VO2. This can be confirmed bylooking at the high-temperature pump-probe trace presented in Fig. 4.11(b).For this measurement, the cryostat temperature was maintained at 360K, wellabove TC, keeping the sample in the equilibrium metallic phase. The excitedrutile phase shows the same spike-like response.
Noteworthy, an excellent agreement exists between the fluence regimes ofthe XAS and the optical measurements. At low fluences, there is no observ-able XAS signal in Fig. 4.5, as the lattice structure has not changed, and M1modes can be seen in the optical traces. In the intermediate fluence regime,the phonons suppression coincides with the changes in the π∗ and d‖ states,which are all signatures of the insulator-metal and structural transition. At
113

Chapter 4 Structural dynamics across the phase transition
Fig. 4.11: Transient optical response at 600 nm. (a) Pump-probe traces measured with 800 nm pump-600 nm probe under similarexperimental conditions as the time-resolved XAS. For low pump flu-ences (2.2mJ cm−2), the oscillations of the M1 modes can be observed,which are suppressed when the sample is excited by higher fluences(5.8mJ cm−2), as expected for the M1-R transition. Above 8mJ cm−2,the trace shows an offset at negative time delays and the transient re-sponse of the excited metallic state, indicating the sample has beenheated above TC. (b) Transient response of the equilibrium metallicphase, obtained by maintaining the sample at 360K, well above TC.
high fluences, the optical response shows an excited metallic behaviour, whichconfirms the previously presented interpretation of heat as the responsible forchanging the steady-state properties of VO2, raising the temperature of thesample above TC. The excited rutile phase in the soft X-ray data appears as achange close to 530 eV, and will be further discussed in the following section.The small variations in threshold fluences between the two data sets arise fromthe different laser repetition-rates, slightly lower for the optical measurements,as already explained. This provides some more time for the sample to recoverbetween pulses, and, therefore, a reduced temperature rise for the same fluence.
4.2.5 The photo-excited metallic state
Having established that at high excitation densities the pump-probe signaloriginates from the metallic phase, the reported transient absorption of thephotoexcited metallic phase constitutes the first observation ever of such asignal in the soft X-ray regime.
In the metallic phase, the d‖ band, located in the same energy region asthe π∗ states, is no longer split. Therefore, given the spectral position of thephoto-excited rutile-phase signal, the system is treated as if only consisted of
114

4.2 Time-resolved X-ray absorption spectroscopy
the π∗ states for simplicity. For a better comprehension, Figure 4.12 schemat-ically depicts the band structure formed by the π∗ states, probed with photonenergies close to 529 eV, and the corresponding XAS signal that results fromit, along different states of VO2. Panels 4.12(a) and 4.12(b) illustrate the in-sulating M1 and metallic R phases, respectively. In the former, the π∗ statesconstitute the minimum of the conduction band, which lies just above theFermi energy, and gives rise to the lower edge of the first absorption peak inthe XAS spectrum. Upon transformation into the metallic phase, the π∗ statesmove below the Fermi energy, leading to a red-shift of the absorption edge.This provides the existence of new states in the insulating gap, which resultsin an increase in absorption, or a decrease in transmission, close to 529 eV, asobserved both statically and dynamically in Fig. 4.6. Notably, this change isnot related to carrier dynamics, but a consequence of a modification of theband structure, as it occurs both in and out of equilibrium.
A reasonable question arises, though, about whether the signal observedin the transient excited metallic phase is due to a change in charge distribution,or, on the contrary, to a change in the density of states (DOS) and band struc-ture. The first scenario is illustrated in Fig. 4.12(c), with a purely electronicresponse in which an increase of the electronic temperature leads to the de-population of previously occupied states below the Fermi energy, while statesabove it become partially filled. Such a process is translated into a bipolarXAS feature close to 529 eV, as these photon energies probe states close to theFermi energy. Specifically, below the initial edge, absorption increases (trans-mission decreases), given that X-rays can now probe lower-energy states thatare less populated than they were before photoexcitation. Likewise, a smallregion above the Fermi level decreases in absorption (transmission increases),because previously empty states become now populated. These XAS featuresare not observed, however, in the transient spectra measured in the metallicphase in Fig. 4.6, but only an increase in absorption is observed at these photonenergies.
The alternative scenario is represented in Fig. 4.12(d), with a change inthe bandwidth of the π∗ states. Such a process is consistent with the significantbroadening of this band that occurs across the insulator-metal transition [13,21]. A π∗ band broadening results in an increase in absorption (decrease intransmission) above the Fermi energy, as new states at the top of the con-duction band become available. This process might result counter-intuitiveconsidering that thermal disorder and expansion reduces orbital overlap and,hence, bandwidths. However, this interpretation is in agreement with the re-cent experiment by Budai et al. [104] explained in Section 4.1, which showed
115

Chapter 4 Structural dynamics across the phase transition
how the phonon anharmonicity of the rutile phase is decreased when increasingfurther the temperature away from the phase transition. Thus, phonon modesstiffen on heating, which actually reduces vibrational disorder. Interestingly,spectral weight is not conserved in this spectral region during such process,which also implies a change in hybridization with oxygen 2p or with othervanadium 3d levels, such as the d‖ states. Further theoretical calculations arerequired for a definitive conclusion on this matter, which still represent a chal-lenge nowadays. Yet, recent demonstrations that the properties of VO2 canbe captured through DFT in equilibrium [21] suggest that such studies mightbecome available in the near future, even for complex materials as VO2.
116

4.2 Time-resolved X-ray absorption spectroscopy
Ru�le phaseM1 phase
DOS
EF
hν (eV)
SXR
529
Abs. (a.u.)
EF
529
hν (eV)
DOS Abs. (a.u.)
SXR
Electronic hea�ng
DOS
EF
hν (eV)
SXR
Diff. Abs. DOS
EF
hν (eV)
SXR
529
Diff. Abs.
π*-band broadening
(a)
(d)(c)
(b)
529
hν (eV)
hν (eV)
hν (eV)
hν (eV)
0 0
Fig. 4.12: Photoexcited metallic-state model. The scheme rep-resents the density of states (DOS) probed by soft X-rays (SXR)through different states of VO2 (for simplicity, only the π∗ band isconsidered). (a) In the monoclinic insulating phase, absorption firstoccurs into the unoccupied states, separated from the Fermi level bythe band-gap. (b) In the rutile metallic phase, the π∗ states movebelow the Fermi level and XAS absorption occurs for lower energiesthan in the M1 case. (c) A hot electronic state in the photo-excitedmetallic phase reduces occupation below the Fermi level and enhancesit above, resulting in an increase in absorption at low photon energiesand a decrease at higher ones. (c) Band broadening of the photo-excited metallic phase enables more absorption at higher photon en-ergies without shifting the start of the absorption process.
117

Chapter 4 Structural dynamics across the phase transition
4.2.6 Discussion
The results obtained here by means of time-resolved XAS are not in generalagreement with those reported by Cavalleri and co-workers [98, 112]. However,it is important to notice that the samples employed for this work are of similarthickness than those used by Cavalleri et al. Therefore, the issue of the limitedrecovery of free-standing thin-film samples between pump pulses might havealso affected those initial measurements. Those experiments were conductedat room temperature, with a repetition rate of 1 kHz and laser fluences of25mJ cm−2, which are significantly higher than those reported here. As aresult, it appears highly probable that the pioneering measurements of theinsulator-metal phase transition in VO2 by time-resolved XAS were in factconducted on the photoexcited metallic state, and did not, thus, reflect thedynamics of the IMT.
This work also presents the transient state of the metallic rutile phase uponphoto-excitation in the soft X-ray regime for the first time. The results remarkthe major difference existing between the nature of this phase and the insulatingone, which does not show any transient response at these time scales andphoton energies. Moreover, the response of the rutile phase to photoexcitationagrees with the thermal response, which shows stiffening of the acoustic phononbranches when heating the system [104]. Such lattice hardening is a reflection ofthe reduced phonon anharmonicity and, thus, entropy in the material, whichmay lead to an increase in the states overlap and hybridization, causing anincrease in absorption in the π∗ states. However, the temporal resolution inthe picosecond time-scales of this experiment is not sufficient to investigate thedynamics immediately after photo-excitation. In the following section, hardX-rays are employed to probe the lattice evolution across the phase transitionwith femtosecond temporal resolution.
118

4.3 Time-resolved hard X-ray diffuse scattering of VO2
4.3 Time-resolved hard X-ray diffuse scattering ofVO2
As discussed in the introduction of this chapter, lattice disorder plays an es-sential role in the equilibrium phase transition of VO2. Yet, the importance ofdisorder in the ultrafast transition remains still unexplored. The main reasonfor this is that the techniques that can probe disorder on the ultrafast timescales have only recently been developed.
Current methods to probe the lattice have focused on Bragg scattering,which is a technique widely applied for the study of crystallographic structures.However, the advent of FELs has allowed in recent years to move beyond this,and measure not only Bragg peaks, but the total X-ray scattering arising fromthe sample, that is, including diffuse scattering. Non-equilibrium lattice dy-namics can be investigated thereby within a typical pump-probe experimentalsetup in which X-ray pulses of sub-100-fs duration act as the probe. In orderto understand the benefit from measuring this total X-ray scattering, a briefintroduction of the concepts involved in the technique is given now.
When a monochromatic X-ray beam is diffracted from a periodic struc-ture, such as a crystal, the constructive interference of the scattered beamsfrom atomic planes gives rise to the so-called Bragg peaks. However, whendensity fluctuations are present within the lattice, the amplitude of such peaksis reduced, and the ‘lost’ intensity is redistributed into the inter-peaks back-ground in the form of diffuse scattering. In that sense, diffuse scattering arisesby departures from perfectly periodic arrays of atoms, the causes of which arewide, ranging from defects to thermal motion. The latter generates the so-called thermal diffuse scattering (TDS), which results from the population ofphonon branches caused by the jittering of atoms around their equilibrium po-sitions at non-zero temperatures. Larger displacements lead to more scatteredX-rays. It is important to notice that, although the presence of defects alsoresults in diffuse intensity, these scatter light elastically, while phonons do itinelastically. Whereas elastic Bragg scattering techniques measure the averageatomic positions, providing thereby information on the long-range order, in-elastic diffuse scattering is capable of probing the short-range structural orderthrough the disorder of the system.
The total X-ray scattering approach adopted here exploits both features:discrete Bragg peaks and the diffuse scattering among them, allowing therebythe measurement of dynamics involved in the structural phase transition at alllength scales. Such a technique is suitable for distinguishing between the two
119

Chapter 4 Structural dynamics across the phase transition
types of structural transitions presented at the beginning of this chapter. Dis-placive and order-disorder processes give rise to different total X-ray scatteringpatterns, as schematically illustrated in Fig. 4.13. If increasing the temperatureabove TC induces a displacive process, the vanadium atoms arranged in dimerscollectively change their positions driven by spatially coherent vibrations ofphonons with wavevector at the rutile R-point. At low temperatures, definedBragg peaks, corresponding to the M1 structure, can be observed. When thetemperature is increased towards TC, the diffraction peaks decrease in intensityas the V ions move away from their original positions until no M1 peaks arevisible above TC. This ‘lost’ intensity is transferred among peaks, that is, whilethe amplitudes of the M1 peaks get weaker, those of the R peaks get stronger.
Alternatively, in an order-disorder transition (Fig. 4.13(b)), the atomsmove from the low- to the high-symmetry structure in an uncorrelated manner,with no defined wavevector. The intensity of the Bragg peaks also decreasein intensity when warming towards TC, but, whereas in the displacive case apeak at a particular Bragg angle disappears because the atoms have reshuffledtheir positions, in this type of transition, the peak vanishes due to a lack ofconstructive interference at this wavevector. In this case, the ‘lost’ intensity istransferred both to the R peaks and the diffuse scattering, which results in theformer not getting quite as intense as they would be in a displacive process.Additionally, the uncorrelated disorder leads to large-amplitude motions of thevanadium ions that still scatter the impinging X-rays, giving rise to extendeddiffuse scattering across reciprocal space. Distinguishing these two scenariosby means of Bragg scattering alone can be considered a nearly impossible task,as to do so, an extremely large number of Bragg peaks needs to be measuredwith good signal-to-noise ratio.
120

4.3 Time-resolved hard X-ray diffuse scattering of VO2
Fig. 4.13: Total X-ray scattering for displacive and order-disorder transitions. (a) In a displacive transition, diffraction peaksdecrease in intensity as the phase transition is approached due to thecooperative motion of the V ions towards their new positions in therutile structure (red crosses). Above TC, no intensity is recorded atthat particular wavevector, as the V ions have shifted into their newrutile positions. (b) In an order-disorder transition, the lack of co-herence motion of the V ions when approaching the phase transitionleads to a reduced Bragg peak amplitude, but X-rays are still reflectedincoherently into a diffuse background. Above TC, the positions of theV ions can be found at any point within the red circles.
4.3.1 Ultrafast disordering of vanadium dimers
Time-resolved XDS measurements were carried out at the XPP end-station [116]at the Linac Coherent Light Source (LCLS) X-ray FEL, using 1.5 eV pumppulses and 9.5 keV probe pulses on high-quality single crystals of VO2. Com-plementary measurements were performed at beamline BL3 of SACLA FELunder the same conditions. The laser repetition rate was set to 120Hz and thesample was held in air, although enclosed in a helium purge box to reduce airscattering of the X-rays, which can be of similar magnitude as the diffuse in-tensity. A sketch of the experimental setup is illustrated in Fig. 4.14. In orderto match the penetration depth of the optical pump and X-rays probe beams,a grazing-incidence geometry was adopted. The X-rays impinged on the sam-ple at an angle of 0.5° and the pump laser was incident at 2.3°. ScatteredX-rays were recorded with a large-area detector, a Cornell-SLAC Pixel ArrayDetector (CSPAD), which allowed for the measurement of extended q-regionsof reciprocal space.
121

Chapter 4 Structural dynamics across the phase transition
Fig. 4.14: Scheme of the experimental setup for time-resolvedXDS. The sample was mounted at grazing incidence to match thepump and probe penetration depths. Rotations around the samplenormal enabled the measurement of different regions of the total scat-tering pattern. A zero ϕ angle corresponds to the beam incident alongthe rutile c-axis. The upper left insert shows a polarized-light mi-croscopy image of the VO2 single crystal used in the experiment. Thelight and dark patches correspond to M1 twin domains.
The sample mount was connected to a heating stage to measure the totalX-ray scattering patterns of the insulating and metallic equilibrium phases ofVO2. Figure 4.15(a) shows the static TDS patterns for the monoclinic struc-ture measured at room temperature, characterized by the presence of Braggpeaks at defined wavevectors. When heating the sample above TC, the scatter-ing dramatically changes, as can be seen in false-colour plot of the differentialTDS between the 353K pattern and the M1 displayed in Fig. 4.15(b). This isdominated by the suppression of Bragg peaks of the M1 phase (blue negativespots) and the emergence of a strong rectangular-shaped diffuse feature. Simu-lations of the change in total scattering based on the equilibrium force constantsobtained via DFT calculations are capable of reproducing these TDS patterns,and indicate that the rise of diffuse scattering originates from the soft trans-verse acoustic phonons of the rutile phase that correspond to the vanadium ionsthat dimerize in the monoclinic phase [104]. The calculated thermal difference(panel (c)) is in excellent agreement with the measurements, reproducing theloss of M1 peaks and the diffuse scattering enhancement. More interestingly,when photo-exciting the sample in the saturation regime, the X-ray scattering
122

4.3 Time-resolved hard X-ray diffuse scattering of VO2
recorded after 350 fs, displayed in 4.15(c), shows a strong resemblance to thethermal changes in 4.15(b). Notably, the regions where the diffuse intensity isstrongly enhanced are confined to those expected for the equilibrium metallicphase. This shows that, on this rapid time scales, not only has the long-rangesymmetry of the crystal changed, as indicated by the fast suppression of theM1 peaks, but also the vanadium atoms have already adopted a rutile-likedisplacement distribution.
Fig. 4.15: Total X-ray scattering patterns of the low- andhigh-temperature structures. (a) In the thermal M1 phase, thescattering pattern is dominated by the tails of three Bragg peaks. Thesmall amount of diffuse scattering is an indication that the vanadiumdimers are tightly bound, with only small-amplitude oscillations of thebond lengths and angles. (b) In the thermal difference R-M1 TDS,Bragg peaks are lost and there is a large increase of diffuse scatter-ing with a box-like shape. (c) The scattering pattern recorded 350 fsafter photo-excitation with 20mJ cm−2 shows a dramatic suppressionof the M1 peaks and a strong increase of diffuse scattering. Remark-ably, this is enhanced in the same regions as those in the equilibriummetallic pattern. (d) The simulated differential pattern obtained withthe equilibrium force constants extracted from DFT calculations is inexcellent agreement with (b).
123

Chapter 4 Structural dynamics across the phase transition
Notably, observing the temporal evolution of the Bragg peaks and themomentum-dependent diffuse scattering intensities displayed in Fig. 4.16, itbecomes apparent that the decrease of the former and the increase of the lat-ter occur on the same time scales, as soon as 50 fs after photo-excitation, theexperimental time resolution. This proves that local disorder happens as fastas the loss of the long-range M1 symmetry, which indicates that the transitionis dominated by disordering of the vanadium ions rather than by a coherentatomic motion along a single wavevector. The resemblance to the diffuse distri-bution of the equilibrium rutile phase is found to be achieved at 150 fs, showinglittle subsequent changes after this point. Remarkably, the time scales for thestructural transition appear to be at least twice as fast as previously reportedtransition velocities from ultrafast X-ray diffraction measurements [51, 56].
Fig. 4.16: Time dependence of the Bragg peaks and diffusescattering. Data from the Bragg peaks is normalized to the pre-time zero amplitude for both experiments and calculations with nofurther scale factors. The traces are in excellent agreement with AIMDsimulations (solid lines). The diffuse scattering data is obtained fromintegration over the boxed area in Fig. 4.15(c), and compared to thevariance of the V positions extracted from AIMD simulations.
124

4.3 Time-resolved hard X-ray diffuse scattering of VO2
Ab initio molecular dynamics (AIMD) simulations of the photo-inducedphase transition were performed to gain better insight into the dynamics ob-served. With this aim, the effect of laser photoexcitation is modelled as aprompt increase in the electronic temperature of the system within 1 fs. Thestructural transition fromM1 to R was found to show a threshold-like behaviourwith Tel, above which the V dimerization is lost, as well as the twisting angleof the V atoms. This provides the electronic temperature value required todrive the phase transition, and hence to be included in the AIMD simulations.To simulate the effect of the laser pulse, at each time step of 1 fs, the chargeredistribution resulting from the temperature jump is used to calculate theforce constants on the atoms by means of DFT calculations (same method asin [104]). From the ionic positions extracted, both the time-dependent Braggand diffuse scattering intensities were calculated, represented by the solid linesin Fig. 4.16. An excellent agreement can be observed in terms of the time scaledynamics and the amplitude changes.
The effect of changing the electronic temperature by photoexcitation isalso simulated on the change in V-V bond lengths, schematically representedin Fig. 4.17(a). At negative time delays, the monoclinic dimerization patternis represented by the bimodal initial distribution formed by the short dimer-ized bonds (2.50Å) and the long bonds (3.16Å) along the rutile c-axis. Afterthe abrupt transition, both distances merge into the same value, leading tothe equidistant configuration expected for the rutile structure. Interestingly,similar dynamics are observed for the twisting angle, suggesting that changesin bond lengths and angle occur concomitantly and within less than 300 fs, asopposed to previous results based on Bragg scattering analysis alone [56], andother reported scenarios in which the V-V melting was claimed to be decoupledfrom the vanishing of the twisting angle, leading to an intermediate monoclinicmetallic phase [42]. As a result from AIMD simulations, the bonding dynam-ics change on very fast time scales consistent with those found for the diffusescattering rise.
Contrary to displacive processes, in which the normal frequencies of thedriving phonons limit the speed of the transition, here the vanadium atomsadopt a rutile-like displacement distribution faster than the oscillation periodof any of the relevant modes, and much faster than the time required for acooperative unit cell rearrangement. This implies that the energy from thelaser pulses is transferred extremely rapid to the lattice, which can only occurif the system finds itself beyond the harmonic motion regime. The AIMDsimulations show, in fact, that the interatomic potential induced by photo-excitation is strongly anharmonic and flat, allowing for the vanadium atoms
125

Chapter 4 Structural dynamics across the phase transition
to adopt large displacements about their average positions in the rutile phase,as illustrated in Fig. 4.17(b). This uncorrelated motion stands actually as theorigin of the high phonon entropy of the equilibrium metallic phase previouslyreported [104, 111].
Fig. 4.17: Lattice potentials and V-V bonding upon photo-excitation. (a) At negative time delays, the V bond lengths aredivided in short and long distances, corresponding to the M1 dimer-ization. After photo-excitation, they quickly collapse to one distancecorresponding to the rutile chains of equidistant V atoms. (b) Lo-cal potentials along the reaction coordinate dramatically change af-ter photo-excitation. The M1 phase is characterized by a double-wellpotential that corresponds to the V-V dimers. The large-amplitudevibrations induced by above-threshold fluences lead to a sudden lift-ing of the two minima, stabilizing the rutile flat anharmonic potential.(The actual simulations can be found in [117].)
These measurements, confirmed by simulations, demonstrate that thephoto-induced phase transition in VO2 is of the order-disorder type, driven byan ultrafast change of the lattice potential that suddenly disorders the vana-dium dimers and yields large-amplitude rutile-like uncorrelated motions of theV ions. The flat dispersiveless transverse acoustic phonon branches in whichthis results proves that the transformation does not follow a single well-definedwavevector, but proceeds without spatial coherence.
4.3.2 Fluence dependence of the structural transition
As mentioned above, the AIMD simulations predict a threshold-like behaviourof the M1 structure when varying the electronic temperature of the system.Namely, above ∼2900K, the short and long V-V bonds abruptly collapse tothe same value, while the twisting angles become 180°, resulting in a rutile-likestructure. This is consistent with the first-order nature of the phase transi-
126

4.3 Time-resolved hard X-ray diffuse scattering of VO2
tion, and hence, with the existence of a laser fluence threshold for triggeringthe process. Experimentally, the intensity of both the Bragg peaks and thediffuse scattering show a threshold-like behaviour with pump fluence, chang-ing abruptly above ∼ 5mJ cm−2, as displayed in Fig. 4.18. The Bragg peakdecreases linearly in intensity with absorbed fluence below the threshold, afterwhich the change is more rapid until saturation. In fact, the dynamics areclearly different below and above threshold, as shown in Fig. 4.19. At lowfluences, the response of the Bragg peak’s intensity is modulated by coherentoscillations of the 5.7THz phonon mode of the M1 phase, which are lost by in-creasing the fluence above threshold, in agreement with optical measurementsin Fig 4.11 and in [57]. On the other hand, the prompt rise of diffuse scatteringabove ∼ 5mJ cm−2 indicates that the vanadium ions only adopt the rutile-likedistribution above a critical fluence, which is the same for the loss of long-rangeorder.
Fig. 4.18: Pump fluence dependence of the diffuse scatteringand an M1 Bragg peak. (a) The (-1, 2, 0) M1 peak amplitude,visible in Fig. 4.15(a), presents a linear decrease in intensity for flu-ences below a threshold ∼ 5mJ cm−2, after which the change is rapiduntil saturation. (b) The mean diffuse scattering, integrated over thesquared box in Fig. 4.15(c), shows an abrupt rise above a similar valueof ∼ 5mJ cm−2. The grey dots represent the background, taken as themean intensity measured at low scattering angles.
127

Chapter 4 Structural dynamics across the phase transition
Fig. 4.19: Below- and above-threshold dynamics of a M1Bragg peak. Coherent phonon oscillations can be observed for lowfluences, which are well fitted by a 5.7THz phonon mode. At higherfluences, the Bragg intensity is strongly suppressed and the oscillationis lost.
As explained in Chapter 3, the existence of different threshold fluencesfor changes in the optical and structural probes has been provided as evidencefor the existence of a transient metallic monoclinic state. From the results ofChapter 3, though, it was concluded that the threshold for different wavelengthprobes is the same, at least within the optical regime. Here it has been demon-strated that scattered X-rays directly probe the evolution of the lattice acrossthe phase transition. Therefore, if the threshold measured for the structuraltransition were higher than that encountered with optical probes sensitive tofree carriers, this could be proof for the metal-like monoclinic phase. Withthis aim, the fluence thresholds for the structural transition of the same typeof single crystal as that employed in the XDS experiment is also measuredand is shown in Fig. 4.20. The optical measurements were conducted witha 800 nm probe at a pump repetition rate of 1 kHz, with the sample held atroom temperature and atmospheric pressure. The threshold is found to beof ∼ 6.3mJ cm−2. This value is in good agreement with the threshold foundby means of hard X-rays considering the different experimental conditions. Inparticular, the XDS measurements were performed in a grazing configuration,where the large angle of incidence requires additional reflectivity factors to ac-count for the absorbed fluence. This may result in extra discrepancies betweenthe measurements in the two experimental setups.
As a result, no decoupling of the change in optical and structural proper-ties can be determined from these results. Instead, the insulator-metal phasetransition is characterized by a single fluence threshold, above which the elec-tronic and structural properties change abruptly due to the rapid disorder of
128

4.3 Time-resolved hard X-ray diffuse scattering of VO2
Fig. 4.20: Pump fluence dependence of the optical response.A VO2 single crystal, probed with 800 nm, gives a threshold fluenceof ∼ 6.3mJ cm−2.
the vanadium ions. Such pump laser threshold appears to be directly relatedto the electronic temperature of the system, which is transferred to the latticein less than 100 fs, leading to a dramatic change of the potential symmetry.
4.3.3 Discussion
These results lead to a new description of the photo-induced phase transitionin VO2, in disagreement with several previous reports. Traditional symmetryconsiderations and analysis based on Bragg scattering data alone have led tothe general conception of a conventional soft-mode transition driven coherentlyby phonons of well-defined wavevector that limit the speed of the transition,without considering the role played by fluctuations and entropy. As a result,the ultrafast community attempted to solve the “Mott vs Peierls” competitionby separating the two types of transitions in the time domain, considering thatelectronic correlations should act faster. The results presented in this the-sis strongly challenge this rather simple interpretation, as the instantaneouschange of the lattice potential induced by photoexcitation causes the V ions toquickly vibrate as if they were in the rutile phase within at most 50 fs. This isreflected in the prompt emergence of the diffuse scattering signal characteristicof the flat anharmonic rutile potential, which, considering that it is dominatedby low-energy acoustic phonons, means that such “slow” modes are respond-ing in a non-equilibrium situation in much shorter time scales than those setby their equilibrium frequencies. Therefore, a photo-induced phase transitiondriven in an ultrafast fashion is no longer necessarily an electronic-driven pro-cess.
129

Chapter 4 Structural dynamics across the phase transition
Still, the rapid excitation of vanadium ions into the rutile potential ob-served here is faster than other disorder-driven transformations [97, 118]. Thenon-equilibrium order-disorder transition time scales are dictated by the timerequired for the ions displacements to become uncorrelated and reach a quasi-equilibrium distribution. The dynamics observed in this experiment are fastdue to the relatively short distances between the V positions in the M1 andthe R structures, found to be of 0.24Å. The average vanadium velocity atroom temperature is 3.8Åps−1, which means that they could traverse suchdistance in approximately 60 fs. The speed of the transition is, thus, mainlylimited by the initial velocity distribution of the ions. The broader the initialthermal distribution, the less it takes for the vibrations to reach the final largeamplitudes.
The rapid disordering and evolution to the quasi-equilibrium rutile struc-ture is enabled by the strongly anharmonic lattice, which leads to a greatphonon entropy that ultimately stabilizes the metallic phase. These observa-tions of the ultrafast phase transition are interestingly in accordance with thethermal transition described by Budai et al. [104]. Remarkably, the inducedlattice potential of both the thermal and ultrafast transition can be describedby a hot-electron distribution within the DFT framework, without the need ofadditional strong Hubbard electronic correlations parameters. As a result, thein- and out-of-equilibrium transformations appear to follow the same pathwaytowards the high-temperature metallic phase.
130
4.4 Conclusions
4.4 Conclusions
The results presented in this chapter obtained by probing the structural re-sponse of VO2 across the insulator-metal phase transition demonstrate thatthe conventional conception of this extensively studied phenomenon needs tobe re-addressed.
On one hand, the XAS experiment presented here stands as the first time-resolved measurement of the phase transition of VO2 in the soft X-ray regime,as the pioneering results of Cavalleri et al. were most likely conducted onthe metallic state of VO2 due to heat-accumulation-related issues. Here it isshown how simple steps can be taken for measuring the insulator-metal phasetransition at reasonable repetition rates, which should be considered in futuresimilar experiments performed on thin films samples with lack of a heat sink.Extending these measurements to the femtosecond time domain will enablethe study of charge dynamics immediately after photoexcitation within the π∗
and d‖ states. This could be achievable at FELs, which would also benefit themeasurements due to their lower operating repetition rate.
On the other hand, the ultrafast total X-ray scattering measurements re-veal that the traditional idea of the molecular movie, in which informationabout the atomic positions as a function of time is obtained through elasticBragg scattering, provides an incomplete picture of the microscopic physics. Inorder to obtain insight into the forces that drive atomic motion, the inelasticcomponents of the scattering signal are also essential, shedding light on theentropy of the system. Yet, the high photon momenta together with the fem-tosecond temporal resolution required for studying such lattice dynamics arecurrently only achievable in X-ray FELs. As a secondary outcome, thus, thiswork also reflects the importance of large-scale facilities development for inves-tigating these complex materials, in which entropy and lattice anharmonicityare believed to play a major role.
From the theoretical perspective, the missing component of DFT calcu-lations for understanding the properties of transition metal oxides like VO2has traditionally been considered to be related to electronic correlations. Yet,most models of the so-called correlated materials do not include anharmonicphonon interactions either. Works by Eyert [21] and Budai and coworkers [104]have recently demonstrated that DFT can effectively reproduce the physics ofVO2 provided the right hybrid functionals are employed, without the need ofadding strong Hubbard electronic correlations. AIMD simulations within theDFT framework are capable of accounting for anharmonic effects and ade-
131

Chapter 4 Structural dynamics across the phase transition
quately describe the properties of VO2 in a non-equilibrium situation as well.As a result, lattice anharmonicity may be the missing component for a completeunderstanding of complex materials that present such strong electron-phononcoupling. The development of these theoretical approaches may result, in thenear future, in a complete description of XAS transient spectra and a definitiveassessment of the physics behind the observed photoexcited metallic state.
The two experiments presented here provide results in good agreementwith each other. The rapid energy transfer within 100 fs from electrons to thelattice when photoexciting VO2 above threshold supports the interpretationgiven for the transient XAS features observed of the photoexcited insulatingand metallic phases based on changes in the crystal field rather than chargedynamics, as electrons have already transferred their excess energy to the lat-tice at the longer picoseconds time scales measured. Furthermore, this strongelectron-phonon coupling, which is ultimately responsible for driving the phasetransition, is manifested in the π∗ states broadening of the photoexcited metal-lic stated probed by time-resolved XAS.
As a final remark, it is worth noting that none of the results reported heresuggest the existence of a transient monoclinic state with metallic properties,as previously reported by structural time-resolved studies [51, 56]. The rapiddynamics of changes in both Bragg peaks and diffuse scattering observed within50 fs makes it unlikely that the reason for not measuring a transient monoclinicmetallic XAS spectra is the short-lived nature of it. Moreover, the pumpfluences required for triggering the transition appear to be the same whenprobing the optical and structural properties, which disproves previous resultsattributing a lower threshold for the emergence of metallic-like properties anda higher one for the structural distortion. In conclusion, all evidence providedhere suggest instead a direct transformation from the M1 to the R phase withinan order-disorder process via the same pathway for both the ultrafast andthermal transitions.
132


5 | Conclusions and outlook
The insulator-metal phase transition of vanadium dioxide has been an activearea of research for the past 50 years. The central issue has been focusedon whether electron-electron interactions or electron-phonon coupling are re-sponsible for triggering the phase transformation. Several experimental andtheoretical studies have provided contradictory results, which challenged evenmore the understanding of the physics behind this process. One of the mainopen questions is the existence of a monoclinic metallic phase of VO2. Whethersuch a transient state emerges during the phase transition, either dynamicallyor in equilibrium, has been actively investigated over the past years. The in-terpretation of the experimental results is hindered by the use of various typesof samples (single crystals, thin films, free-standing, nanobeams), which canexhibit very different behaviours.
In an attempt to unify previous investigations in a single scenario thatexplains the inconsistencies and provides a new understanding of the phasetransition, an extensive and complete study of the phase transition of VO2 wascarried out in this thesis, both in and out of equilibrium. To do so, this thesisexploited light of wavelengths spanning an ultra-broad spectral range, from themid-IR to hard X-rays, which has enabled the examination of samples from theatomic to nanometer length scales, and from the femtosecond to microsecondtime scales.
The outcome of this research strongly suggests that when appropriate careis taken, the results obtained from different measurements can be combined ina consistent way. In doing so, the conclusions reached is that there is notransient monoclinic state with metallic properties, neither in equilibrium norout of it, and that the ultrafast phase transient transition is consistent with aphonon-mediated process, just like the thermal transition.
135

Chapter 5 Conclusions and outlook
More specifically, the achievements and findings from this extensive re-search are summarized in the following.
In Chapter 2, a holographic imaging technique that exploits the use ofresonant soft X-rays is applied for the first time to study the thermal insulator-metal phase transition. This method can track the onset and evolution of phaseseparation with increasing temperature, with a clear visualization of the growthof nano-sized domains. Thanks to the capability of the technique to resolvepolarization- and energy-dependent XAS features, the heterogeneous responseof the material can be distinguished in terms of the electronic and structuraldegrees of freedom. Defects are found to play a major role in the phase trans-formation, as they are responsible for modifying the local strain environment,leading to the formation of additional insulating phases, such as the mono-clinic M2. Nucleation of the different phases occurs at subsequent tempera-tures, which can explain the different transition temperatures found by otherstudies, which were assigned, probably due to their lack of nanoscale spatialresolution, to decoupled electronic and structural transitions. The major ad-vantage of holography is the feasibility of combining this imaging approach withultrashort X-ray pulses from FEL sources to directly visualize the nanoscaledynamics of the photo-induced phase transition in real-time with sub-100 fstemporal resolution. This experiment stands, thus, as the first step towardsdynamical imaging, and the experimental challenges needed to be overcome toachieve this are presented in Appendix A.
In analogy to the claim of different transition temperatures that trigger de-coupled electronic and structural transitions, the existence of different thresh-old fluences for the photo-induced phase transition has also been reported.Motivated by this, in Chapter 3 the effect of laser-induced heat on the phasetransition is investigated. To do so, a semi-ultrafast approach is applied, basedon the use of a continuous-wave laser source for probing the sample response af-ter photoexcitation. This way, the recovery dynamics in the millisecond regimecould be measured. The threshold fluence of the phase transition is found tobe dramatically dependent on the experimental conditions. External factors,such as the pump laser repetition rate and spot-size, holding the sample inair or vacuum, and even the probe fluence (not always negligible) can lead toneed of longer times for the sample to relax back to the ground state, resultingin heat accumulation that raises the initial temperature of the sample. In-terestingly, these long-time dynamics can be reproduced by a simple thermalmodel. Furthermore, in this chapter it has been demonstrated that, when theexperimental conditions are strictly controlled, the threshold values obtainedby probing the electronic band-gap (mid IR) and the structure (visible) are the
136

same, indicating there is only one photo-induced transition in VO2.
The sensitivity of soft X-rays within the oxygen K -edge to the structuraldistortion of VO2 observed in Chapter 2 was again exploited in Chapter 4 toprobe the evolution of the crystallographic structure during the photo-inducedphase transition on picosecond time scales. Again, in agreement with thefindings from the previous chapter, the XAS features that exhibit changesacross the phase transition do so above the same threshold fluence, displayingno decoupled processes. These time-resolved measurements of the insulator-metal phase transition of VO2 in the soft X-ray regime turned out to be the first,as previous attempts were hindered by laser-induced heat effects, now clearfrom the studies of Chapter 3. Furthermore, this experiment provides the firsttime-resolved XAS measurement of the transient state of the metallic phaseupon photoexcitation, which exhibits a lattice potential stiffening through thebroadening of the π∗ band. The phonon spectrum dynamics were measured inthe femtosecond time scales by means of ultrafast hard X-ray total scattering.This experiment demonstrated that, as it occurs in the thermal transitionin [104], the photo-induced process is also driven by the entropy of the systemprovided by a strong electron-phonon coupling. The phonon spectrum wasfound to adopt the rutile-like symmetry in less than 50 fs (resolution-limited),much faster than the time scales set by their equilibrium frequencies, leading toa new description of the phase transition in terms of an order-disorder ratherthan a displacive process.
A new physical description of the phase transition of VO2
In this new description of the insulator-metal transition, the atoms displace-ments towards their new equilibrium positions is dictated by their initial ther-mal velocity distribution. This also gives an explanation for the temperaturedependency of the threshold fluence reported in Chapter 3. For lower base tem-peratures of the sample the initial thermal distribution becomes narrower, andtherefore, more energy density is required for the ions to achieve the rutile-likelarge-amplitude oscillations that provide the entropy that stabilizes the metal-lic phase. As a result, the threshold fluence is higher at lower temperatures.
Regarding the question about the possible different mechanisms lying be-hind the thermal and ultrafast phase transitions, there is enough evidencefrom the different experiments performed in the scope of this thesis to suggesta common pathway for them:
• The recovery dynamics of the photo-induced phase transition are well
137

Chapter 5 Conclusions and outlook
described by a simple thermal model that only accounts for the differencein temperatures within the system.
• The threshold fluences measured, although different under diverse exper-imental conditions, are always higher than the thermodynamic energyrequired for thermally inducing the phase transition.
• The phonon entropy-driven phase transition found in equilibrium in [104]is perfectly compatible with the findings of the ultrafast XDS experimentin Chapter 4.
• The phonon stiffening found when heating the R phase in [104] is alsoobserved when photo-exciting the metallic state in the time-resolved XASmeasurements in Chapter 4, reflected in the broadening of the π∗ states.
Although several claims have been made for the existence of a monoclinicmetallic phase and, hence, for the electronic nature of the phase transition,the evidence provided has been mostly indirect, based on decoupled transitiontemperatures and threshold fluences. As a whole, this thesis has shown thatthe apparent decoupled transitions can be explained by experimental factors,rather than by truly intrinsic properties of VO2.
It is important to notice that the suggestion of VO2 as a typical Mottinsulator, in which electronic correlations are the main responsible for theexhibited properties, first arose due to the failure of band-theory-based DFTcalculations in correctly describing the ground state of VO2. However, this the-sis has demonstrated that with the later advances in theoretical simulations,such descriptions have become possible, both statically and out of equilibrium.This, together with the suggested transition mechanism, which challenges thesimple conception of fast processes being necessarily of electronic nature, dis-credit the foundations for electron-electron interactions as the main trigger forthe phase transition of VO2. Instead, a Peierls distortion driven by the com-petition between the lower enthalpy of the insulating phase with the higherentropy of the metallic state is perfectly compatible with the observations andnew calculations of the light- and thermally induced phase transitions.
Outlook
While this work has provided a thorough examination of the phase transition,there are still many further avenues for investigation:
• While bulk single crystals are expected to recover within the repetitionrates generally employed in pump-probe measurements, this is not the
138

case for free-standing thin films. Equivalent measurements as those con-ducted in Chapter 3 are required to study the dynamics of thin films onsubstrates.
• Whereas in Chapter 2 the reversibility of the domain landscape was estab-lished after thermally cycling the sample, the process of domain recoveryafter ultrafast photoexcitation remains still unknown. In order to includethis parameter in the thermal model of Chapter 3, a combination of softX-ray holography with a femtosecond optical laser could be employed forimaging the domain distribution before and after photo-excitation. Suchreversibility would stand as a key point for the light-control of VO2 fortechnological applications.
• Extending the time-resolved XAS experiments to the femtosecond time-scales would reveal the dynamics of the relevant states involved in thephase transition, namely, the d‖ and π∗ states, immediately after pho-toexcitation.
• Ultrafast XDS measurements with a higher temporal resolution couldreveal the fundamental time scales of phonon response. This crucialquestion is relevant not only for the understanding of VO2, but of everymaterial undergoing structural transitions in which lattice entropy playsa major role.
• The model proposed in Chapter 4 for an order-disorder phase transitionin VO2 predicts slower temporal dynamics of the transformation when thesample is held at lower base temperatures. Conducting the same ultrafastXDS measurements at ∼ 100K could easily verify this behaviour. If true,and VO2 reaches in fact a crossover point into a displacive transition, thiswould open up new options for coherent control of the phase transition,as the lower temperatures could be exploited for reducing the impactfrom disorder.
• Conducting pump-probe experiments in doped or highly strained sam-ples would enable the measurement of the M2-R phase transition, andcompare the transient dynamics with those observed in the M1-R tran-sition.
All these approaches could be implemented in a very near future. Having a fullcomprehension of the mechanism behind the insulator-metal phase transitionin VO2 will shed light into the physics behind the exotic properties of othercomplex materials, such as high-temperature superconductors. Furthermore,the techniques and concepts developed in this thesis can be used to study thetransient response of other materials in order to build a unified picture on how
139

Chapter 5 Conclusions and outlook
their properties can be controlled on demand.
140

A | Towards time-resolvedholography
The work in this thesis provides a thorough study of the properties of VO2and the insulator-metal transition. Employing such a wide range of techniquesmakes this a very complete investigation, as they enable to probe the differentdegrees of freedom interacting across the phase transition in VO2. The ultimategoal of this research has been to extend the holographic imaging technique tothe time domain in order to directly visualize the photo-induced phase transfor-mation in real time. This approach would combine all the knowledge acquiredfrom the results of previous chapters in a single experiment sensitive to elec-tronic and structural degrees of freedom, and merging high spectral, spatial,and temporal resolution.
While the experiment presented in Chapter 2 provided a description ofphase separation and domain growth during the thermal phase transition, theaim now is to determine how these phases dictate the dynamics of the ultrafastphase transition of VO2, both extrinsic, in the form of grain boundaries andinterfaces, as well as intrinsic, in the form of phase coexistence.
The extremely bright and ultrafast X-ray pulses delivered by free-electronlasers offer a unique opportunity to implement lensless imaging techniques intoa pump-probe setup. Femtosecond imaging with the use of FELs as the probesource has already been exploited for more than ten years [119–121]. Further-more, the Fourier-transform holography technique presented in Chapter 2, intransmission geometry, has also been successfully performed in the femtosec-ond time domain by collaborators of this work [122, 123]. This method isexpected to offer numerous advantages over previous time-resolved imagingexperiments on VO2 using optical techniques [124]. On one hand, the avail-able temporal resolution is higher, and, on the other hand, it will allow forthe simultaneous probing of electronic and structural features, while providingelement specificity. This chapter briefly presents the first attempts made to
141

Appendix A Towards time-resolved holography
perform time-resolved holographic imaging on VO2 together with the reasonsfor the unsuccessful results and corresponding solutions.
The measurements were carried out at the SXR end-station [125] at theLinac Coherent Light Source X-ray FEL, using 800 nm pump pulses and softX-ray probe pulses with energies across the vanadium L- and oxygen K -edgesand sub-100 fs temporal resolution. The focusing and, hence, fluence of theX-ray pulses is tunable, and the large photon flux of this beamline enables alsoto measure in the single-shot regime. The samples are free-standing thin filmsmounted on the same mask-sample ensemble described in Section 2.3.1, whichwas enclosed within a vacuum chamber and connected to a heating stage. Theimages are recorded by a CCD camera in the same geometry as in the staticexperiment, so that a spatial resolution in the sub-50-nm range over a widefield of view of 2 µm is expected. Figure A.1 shows the holography imagesobtained at this beamline, proving the feasibility of the experiment.
Fig. A.1: Comparison of the SEM with the holographic imageobtained at LCLS. (a) SEM of the sample. (b) Image of the samplemeasured at room temperature by holographic imaging.
The reason for not achieving success in imaging the femtosecond dynamicsof domain formation is twofold. Firstly, the initial attempts were carried outbefore the study in Chapter 3 of the recovery dynamics of these free-standingthin films of VO2. As a result, despite the relatively low pump-laser repetitionrate, of 120Hz, it has been demonstrated in this thesis that under vacuumconditions, a repetition rate as low as 50Hz leads to an increase of the initialtemperature of the sample. This, together with the fact that X-ray pulses weregenerally tightly focused to ensure enough photon counts on the sample area forhigh-quality images, caused the combination of the pump and probe pulses toexcite the sample with much higher fluence than that considered. As a result,the initial state of the sample was not the insulating phase, but it was mostlikely already permanently switched into the metallic state. It is important tonote that domains are only distinguishable within the coexistence region, andthis range is a relative narrow range of temperatures or, in this case, pump
142

fluences. Therefore, a strict control over the excitation densities is required forobserving the right dynamics.
On the other hand, once the heat accumulation issue was minimized, thesecond problem arose, related to sample morphology. The samples employedin the static imaging experiments, grown by pulsed laser deposition, consistof regions with micron-sized crystals among smaller nanoscale crystallites, asshown in Figs. 2.9 and 2.12. The domain growth was found indeed in theselarger crystals within the films. However, most of the samples employed forthis experiment at LCLS present a different topology. Figure A.2 shows theSEM images of some of the samples used. Image in Fig. A.2(a) correspondsto a sample grown by sputtering deposition, and Figs. A.2(b), (c), and (d) tosamples obtained by PLD processes. As it can be observed, the only film thatexhibits larger crystals, on micrometer length scales is (d), which belongs tothe same batch as those employed in the static imaging experiments. And, infact, this is the only one where metallic domains are visible. In the other sam-ples, with a more uniform polycrystalline structure and hence, much smallergrains, it is not possible to observe domain growth with this 50-nm-resolutiontechnique.
Fig. A.2: SEM image of a thin sample used for time-resolvedholography. (a) Sample grown by sputtering deposition. (b), (c),(d) Thin-film samples grown by pulsed laser deposition.
143

Appendix A Towards time-resolved holography
Although the unsuccessful attempt, negative results should also be re-garded as positive findings. Imaging domain growth with holography requiressamples that are formed by crystallites relatively large with respect to the fieldof view, so that domain sizes, which generally span the sizes of the crystals,lie above the experimental resolution provided by the holography setup. Fur-thermore, the phase transition threshold under the specific laser and vacuumconditions needs to be properly calibrated, as the fluence region in which do-mains are expected to be visible is quite narrow. Having these parametersdetermined, it will be possible to successfully image domain dynamics in realtime across the photo-induced phase transition in VO2 in a very near future.
144


Abbreviations
AIMD Ab Initio Molecular DynamicsCDMFT Cluster Dynamical Mean- Field TheoryCDI Coherent Diffraction ImagingDFT Density Functional TheoryDOS Density Of StatesFEL Free-Electron LaserFFT Fast Fourier TransformFTH Fourier Transform HolographyIMT Insulator-Metal TransitionLDA Local Density ApproximationMD Molecular DynamicsMIR Mid InfraRedOPA Optical Parametric AmplifierROI Region Of InterestSEM Scanning Electron MicroscopySXR Soft X-RayTMO Transition-Metal OxideUED Ultrafast Electron DiffractionXAFS X-ray Absorption Fine StructureXAS X-ray Absorption SpectroscopyXDS X-ray Diffuse Scattering
147


Publications
The work presented in this thesis comprises the following publications:
Chapter 2 Luciana Vidas, Christian M. Günther, Timothy A. Miller, Bastian Pfau,Daniel Perez-Salinas, Elías Martínez, Michael Schneider, Erik, Gührs,Pierluigi Gargiani, Manuel Valvidares, Robert E. Marvel, Kent A. Hall-man, Richard F. Haglund, Jr., Stefan Eisebitt, Simon Wall. Imagingnanometer phase coexistence at defects during the insulator-metal phasetransformation in VO2 thin films by resonant soft X-ray holography,Nano Lett. 18, 3449-3453 (2018).
Chapter 3 Luciana Vidas, Elías Martínez, Kent A. Hallman, Richard F. Haglund,Simon Wall. The role of heat and threshold fluences in the insulator-metal phase transition of VO2. In preparation.
Chapter 4 Luciana Vidas, Daniel Schick, Elías Martínez, Daniel Perez-Salinas, Al-berto Ramos-Álvarez, Kent A. Hallman, Richard F. Haglund, Jr., SimonWall. Transient soft X-ray absorption spectroscopy of the photo-inducedand heating effects in insulating and metallic states of VO2, Submitted.
Simon Wall, Shan Yang, Luciana Vidas, Matthieu Chollet, James M.Glownia, Michael Kozina, Tetsuo Katayama, Thoman Henighan, Ma-son Jiang, Timothy A. Miller, David A. Reis, Lynn A. Boatner, OlivierDelaire, Mariano Trigo. Ultrafast disordering of vanadium dimers inphotoexcited VO2, Science 362, 572-576 (2018).
149


Bibliography
[1] Morin, F. J. Oxides which show a metal-to-insulator transition at theneel temperature. Phys. Rev. Lett. 3, 34–36 (1959).
[2] Westman, S. Note on a phase transition in VO2. Acta Chem. Scand. 15,217 (1961).
[3] Goodenough, J. B. The two components of the crystallographic transi-tion in VO2. J. Solid State Chem. 3, 490–500 (1971).
[4] Zylbersztejn, A & Mott, N. F. Metal-insulator transition in vanadiumdioxide. Phys. Rev. B 11, 4383–4395 (1975).
[5] Roach, W. R. & Balberg, I. Optical induction and detection of fastphase transition in VO2. Solid State Commun. 9, 551–555 (1971).
[6] McWhan, D. B., Marezio, M., Remeika, J. P. & Dernier, P. D. X-raydiffraction study of metallic VO2. Phys. Rev. B 10, 490–495 (1974).
[7] Budai, J. D., Tselev, A., Tischler, J. Z., Strelcov, E., Kolmakov, A., Liu,W. J., Gupta, A. & Narayan, J. In situ X-ray microdiffraction studiesinside individual VO2 microcrystals. Acta Mater. 61, 2751–2762 (2013).
[8] Longo, J. M. & Kierkegaard, P. A refinement of the structure of VO2.Acta Chem. Scand. 24, 420–426 (1970).
[9] Verleur, Hans W., Barker, A. S., Berglund, C. N. Optical Properties ofVO2 between 0.25 and 5 eV. Phys. Rev. 172, 788–798 (1968).
[10] Shin, S., Suga, S., Taniguchi, M., Fujisawa, M., Kanzaki, H., Fujimori,A., Daimon, H., Ueda, Y., Kosuge, K. & Kachi, S. Vacuum-ultravioletreflectance and photoemission study of the metal-insulator phase tran-sitions in VO2, V6O13, and V2O3. Phys. Rev. B 41, 4993–5009 (1990).
[11] Kucharczyk, D & Niklewski, T. Accurate X-ray determination of thelattice parameters and the thermal expansion coefficients of VO2 nearthe transition temperature. J. Appl. Crystallogr. 12, 370–373 (1979).
151

BIBLIOGRAPHY
[12] Kawakubo, T. & Nakagawa, T. Phase transition in VO2. J. Phys. Soc.Jpn 19, 517–519 (1964).
[13] Eyert, V. The metal-insulator transitions of VO2: A band theoreticalapproach. Ann. der Phys. 11, 650–702 (2002).
[14] Wentzcovitch, R. M., Schulz, W. W. & Allen, P. B. VO2: Peierls orMott-Hubbard? A view from band theory. Phys. Rev. Lett. 72, 3389–3392 (1994).
[15] Kittel, C. Introduction to solid state physics 6th (John Wiley & Sons,Inc., 1986).
[16] Ashcroft, N. W. & Mermin, N. D. Solid state physics (Saunders College,1976).
[17] Hubbard, J. Electron correlations in narrow energy bands. Proc. R. Soc.London 276, 238–257 (1963).
[18] Rice, T. M., Launois, H & Pouget, J. P. Comment on "VO2: Peierls orMott-Hubbard? A view from band theory". Phys. Rev. Lett. 73, 3042(1994).
[19] Kim, H.-T., Lee, Y. W., Kim, B.-J., Chae, B.-G., Yun, S. J., Kang,K.-Y., Han, K.-J., Yee, K.-J. & Lim, Y.-S. Monoclinic and correlatedmetal phase in VO2 as evidence of the Mott transition: Coherent phononanalysis. Phys. Rev. Lett. 97, 266401 (2006).
[20] Yuan, X., Zhang, Y., Abtew, T. A., Zhang, P. & Zhang, W. VO2: Orbitalcompetition, magnetism, and phase stability. Phys. Rev. B 86, 235103(2012).
[21] Eyert, V. VO2: A novel view from band theory. Phys. Rev. Lett. 107,016401 (2011).
[22] Petek, H. & Ogawa, S. Femtosecond time-resolved two-photon photoe-mission studies of electron dynamics in metals. Prog. Surf. Sci. 56, 239–310 (1997).
[23] Suh, J. Y., Lopez, R., Feldman, L. C. & Haglund, Jr., R. F. Semicon-ductor to metal phase transition in the nucleation and growth of VO2nanoparticles and thin films. J. Appl. Phys. 96, 1209–1213 (2004).
[24] Narayan, J. & Bhosle, V. M. Phase transition and critical issues instructure-property correlations of vanadium oxide. J. Appl. Phys. 100,103524 (2006).
152

BIBLIOGRAPHY
[25] Gray, A. X., Jeong, J., Aetukuri, N. P., Granitzka, P., Chen, Z., Kukreja,R., Higley, D., Chase, T., Reid, A. H., Ohldag, H., Marcus, M. A., Scholl,A., Young, A. T., Doran, A., Jenkins, C. A., Shafer, P., Arenholz, E.,Samant, M. G., Parkin, S. S. & Dürr, H. A. Correlation-driven insulator-metal transition in near-ideal vanadium dioxide films. Phys. Rev. Lett.116, 116403 (2016).
[26] Prieur, J., Seznec, P. & Ziolkiewicz, S. Temperature variation of ultra-sonic attenuation and phase velocity in VO2 and V2O3 crystals. J. Phys.Lettres 38, 25–28 (1977).
[27] Wu, J., Gu, Q., Guiton, B. S., de Leon, N. P., Ouyang, L. & Park, H.Strain-induced self organization of metal-insulator domains in single-crystalline VO2 nanobeams. Nano Lett. 6, 2313–2317 (2006).
[28] Guo, H., Chen, K., Oh, Y., Wang, K., Dejoie, C., Syed Asif, S. A.,Warren, O. L., Shan, Z. W., Wu, J. & Minor, A. M. Mechanics anddynamics of the strain-induced M1-M2 structural phase transition inindividual VO2 nanowires. Nano Lett. 11, 3207–3213 (2011).
[29] Atkin, J. M., Berweger, S., Chavez, E. K., Raschke, M. B., Cao, J.,Fan, W. & Wu, J. Strain and temperature dependence of the insulatingphases of VO2 near the metal-insulator transition. Phys. Rev. B 85,020101 (2012).
[30] Sohn, J. I., Joo, H. J., Ahn, D., Lee, H. H., Porter, A. E., Kim, K.,Kang, D. J. & Welland, M. E. Surface-stress-induced Mott transitionand nature of associated spatial phase transition in single crystallineVO2 nanowires. Nano Lett. 9, 3392–3397 (2009).
[31] Zhang, S., Chou, J. Y. & Lauhon, L. J. Direct correlation of struc-tural domain formation with the metal insulator transition in a VO2nanobeam. Nano Lett. 9, 4527–4532 (2009).
[32] Tselev, A, Luk’yanchuk, I. A., Ivanov, I. N., Budai, J. D., Tischler, J. Z.,Strelcov, E., Kolmakov, A. & Kalinin, S. V. Symmetry relationship andstrain-induced transitions between insulating M1 and M2 and metallicR phases of vanadium dioxide. Nano Lett. 10, 4409–4416 (2010).
[33] Cao, J., Fan, W., Chen, K., Tamura, N., Kunz, M., Eyert, V. & Wu, J.Constant threshold resistivity in the metal-insulator transition of VO2.Phys. Rev. B 82, 241101 (2010).
[34] Wei, J., Wang, Z., Chen, W. & Cobden, D. H. New aspects of the metal-insulator transition in single-domain vanadium dioxide nanobeams. Nat.Nanotechnol. 4, 420–424 (2009).
153

BIBLIOGRAPHY
[35] Cao, J., Ertekin, E., Srinivasan, V., Fan, W., Huang, S., Zheng, H.,Yim, J. W., Khanal, D. R., Ogletree, D. F., Grossman, J. C. & Wu, J.Strain engineering and one-dimensional organization of metal-insulatordomains in single-crystal vanadium dioxide beams. Nat. Nanotechnol.4, 732–737 (2009).
[36] Cao, J., Gu, Y., Fan, W., Chen, L. Q., Ogletree, D. F., Chen, K.,Tamura, N., Kunz, M., Barrett, C., Seidel, J. & Wu, J. Extended map-ping and exploration of the vanadium dioxide stress-temperature phasediagram. Nano Lett. 10, 2667–2673 (2010).
[37] Marezio, M., McWhan, D. B., Remeika, J. P. & Dernier, P. D. Structuralaspects of the metal-insulator transitions in Cr-doped VO2. Phys. Rev.B 5, 2541–2551 (1972).
[38] Pouget, J. P., Launois, H., D’Haenens, J. P., Merenda, P. & Rice, T. M.Electron localization induced by uniaxial stress in pure VO2. Phys. Rev.Lett. 35, 873–875 (1975).
[39] Park, J. H., Coy, J. M., Kasirga, T. S., Huang, C., Fei, Z., Hunter,S. & Cobden, D. H. Measurement of a solid-state triple point at themetal-insulator transition in VO2. Nature 500, 431–434 (2013).
[40] Jones, A. C., Berweger, S., Wei, J., Cobden, D. & Raschke, M. B. Nano-optical investigations of the metal-insulator phase behavior of individualVO2 microcrystals. Nano Lett. 10, 1574–1581 (2010).
[41] Arcangeletti, E., Baldassarre, L., Di Castro, D., Lupi, S., Malavasi, L.,Marini, C., Perucchi, A. & Postorino, P. Evidence of a pessure-inducedmetallization process in monoclinic VO2. Phys. Rev. Lett. 98, 196406(2007).
[42] Yao, T., Zhang, X., Sun, Z., Liu, S., Huang, Y., Xie, Y., Wu, C., Yuan,X., Zhang, W., Wu, Z., Pan, G., Hu, F., Wu, L., Liu, Q. & Wei, S. Un-derstanding the nature of the kinetic process in a VO2 metal-insulatortransition. Phys. Rev. Lett. 105, 226405 (2010).
[43] Laverock, J, Kittiwatanakul, S, Zakharov, A. A., Niu, Y. R., Chen, B,Wolf, S. A., Lu, J. W. & Smith, K. E. Direct observation of decoupledstructural and electronic transitions and an ambient pressure monoclin-iclike metallic phase of VO2. Phys. Rev. Lett. 113, 216402 (2014).
[44] Biermann, S, Poteryaev, A, Lichtenstein, A. I. & Georges, A. Dynamicalsinglets and correlation-assisted Peierls transition in VO2. Phys. Rev.Lett. 94, 026404 (2005).
154

BIBLIOGRAPHY
[45] Cavalleri, A, Tóth, C., Siders, C. W., Squier, J. A., Ráksi, F, Forget,P & Kieffer, J. C. Femtosecond structural dynamics in VO2 during anultrafast solid-solid phase transition. Phys. Rev. Lett. 87, 237401 (2001).
[46] Cavalleri, A, Dekorsy, T., Chong, H. H. W., Kieffer, J. C. & Schoenlein,R. W. Evidence for a structurally-driven insulator-to-metal transitionin VO2: A view from the ultrafast timescale. Phys. Rev. B 70, 161102(2004).
[47] Hilton, D. J., Prasankumar, R. P., Fourmaux, S., Cavalleri, A., Bras-sard, D., El Khakani, M. A., Kieffer, J. C., Taylor, A. J. & Averitt, R. D.Enhanced photosusceptibility near Tc for the light-induced insulator-to-metal phase transition in vanadium dioxide. Phys. Rev. Lett. 99, 226401(2007).
[48] Kübler, C., Ehrke, H., Huber, R., Lopez, R., Halabica, A., Haglund,R. F. & Leitenstorfer, A. Coherent structural dynamics and electroniccorrelations during an ultrafast insulator-to-metal phase transition inVO2. Phys. Rev. Lett. 99, 116401 (2007).
[49] Pashkin, A., Kübler, C., Ehrke, H., Lopez, R., Halabica, A., Haglund,R. F., Huber, R. & Leitenstorfer, A. Ultrafast insulator-metal phasetransition in VO2 studied by multiterahertz spectroscopy. Phys. Rev. B83, 195120 (2011).
[50] Tao, Z., Han, T.-R., Mahanti, S., Duxbury, P., Yuan, F., Ruan, C.-Y., Wang, K. & Wu, J. Decoupling of structural and electronic phasetransitions in VO2. Phys. Rev. Lett. 109, 166406 (2012).
[51] Morrison, V. R., Chatelain, R. P., Tiwari, K. L., Hendaoui, A., Bruhacs,A., Chaker, M. & Siwick, B. J. A photoinduced metal-like phase ofmonoclinic VO2 revealed by ultrafast electron diffraction. Science 346,445–448 (2014).
[52] Haverkort, M. W., Hu, Z., Tanaka, A., Reichelt, W., Streltsov, S. V.,Korotin, M. A., Anisimov, V. I., Hsieh, H. H., Lin, H. J., Chen, C. T.,Khomskii, D. I. & Tjeng, L. H. Orbital-assisted metal-insulator transi-tion in VO2. Phys. Rev. Lett. 95, 196404 (2005).
[53] Aetukuri, N. B., Gray, A. X., Drouard, M., Cossale, M., Gao, L., Reid,A. H., Kukreja, R., Ohldag, H., Jenkins, C. A., Arenholz, E., Roche,K. P., Dürr, H. A., Samant, M. G. & Parkin, S. S. Control of themetal-insulator transition in vanadium dioxide by modifying orbital oc-cupancy. Nat. Phys. 9, 661–666 (2013).
155

BIBLIOGRAPHY
[54] Wegkamp, D., Herzog, M., Xian, L., Gatti, M., Cudazzo, P., McGahan,C. L., Marvel, R. E., Haglund, Jr, R. F., Rubio, A., Wolf, M. & Stähler,J. Instantaneous band gap collapse in photoexcited monoclinic VO2 dueto photocarrier doping. Phys. Rev. Lett. 113, 216401 (2014).
[55] Hada, M., Okimura, K. & Matsuo, J. Characterization of structuraldynamics of VO2 thin film on c-Al2O3 using in-air time-resolved x-raydiffraction. Phys. Rev. B 82, 153401 (2010).
[56] Baum, P., Yang, D.-S. & Zewail, A. H. 4D visualization of transitionalstructures in phase transformations by electron diffraction. Science 318,788–792 (2007).
[57] Wall, S, Wegkamp, D, Foglia, L, Appavoo, K, Nag, J, Haglund Jr., R. F.,Stähler, J & Wolf, M. Ultrafast changes in lattice symmetry probed bycoherent phonons. Nat. Commun. 3, 721 (2012).
[58] Cheong, S.-W, Sharma, P. A., Hur, N, Horibe, Y & Chen, C. H. Elec-tronic phase separation in complex materials. Phys. B 318, 39–51 (2002).
[59] Dagotto, E., Hotta, T. &Moreo, A. Colossal magnetoresistant materials:The key role of phase separation. Phys. Rep. 344, 1–153 (2001).
[60] Campi, G., Bianconi, A., Poccia, N., Bianconi, G., Barba, L., Arrighetti,G., Innocenti, D., Karpinski, J., Zhigadlo, N. D., Kazakov, S. M., Burgham-mer, M., Zimmermann, M. v., Sprung, M. & Ricci, A. Inhomogeneityof charge-density-wave order and quenched disorder in a high-Tc super-conductor. Nature 525, 359–362 (2015).
[61] Le Tacon, M., Bosak, A., Souliou, S. M., Dellea, G., Loew, T., Heid,R., Bohnen, K. P., Ghiringhelli, G., Krisch, M. & Keimer, B. InelasticX-ray scattering in YBa2Cu3O6.6 reveals giant phonon anomalies andelastic central peak due to charge-density-wave formation. Nat. Phys.10, 52–58 (2013).
[62] Lang, K. M., Madhavan, V., Hoffman, J. E., Hudson, E. W., Eisaki, H.,Uchida, S. & Davis, J. C. Imaging the granular structure of high-Tcsuperconductivity in underdoped Bi2Sr2CaCu2O8+δ. Nature 415, 412–416 (2002).
[63] Ricci, A., Poccia, N., Campi, G., Joseph, B., Arrighetti, G., Barba, L.,Reynolds, M., Burghammer, M., Takeya, H., Mizuguchi, Y., Takano, Y.,Colapietro, M., Saini, N. L. & Bianconi, A. Nanoscale phase separationin the iron chalcogenide superconductor K0.8Fe1.6Se2. Phys. Rev. B 84,060511 (2011).
156

BIBLIOGRAPHY
[64] Park, J. T., Inosov, D. S., Niedermayer, C., Sun, G. L., Haug, D, Chris-tensen, N. B., Dinnebier, R, Boris, A. V., Drew, A. J., Schulz, L, Shapo-val, T, Wolff, U, Neu, V, Yang, X., Lin, C. T., Keimer, B & Hinkov,V. Electronic phase separation in the slightly underdoped iron pnictidesuperconductor. Phys. Rev. Lett. 102, 117006 (2009).
[65] Liu, M., Sternbach, A. J., Wagner, M., Slusar, T. V., Kong, T., Bud ’ko,S. L., Kittiwatanakul, S., Qazilbash, M. M., Mcleod, A., Fei, Z., Abreu,E., Zhang, J., Goldflam, M., Dai, S., Ni, G.-X., Lu, J., Bechtel, H. A.,Martin, M. C., Raschke, M. B., Averitt, R. D., Wolf, S. A., Kim, H.-T.,Canfield, P. C. & Basov, D. N. Phase transition in bulk single crystalsand thin films of VO2 by nanoscale infrared spectroscopy and imaging.Phys. Rev. B 91, 245155 (2015).
[66] Qazilbash, M. M., Tripathi, A., Schafgans, A. A., Kim, B.-J., Kim, H.-T., Cai, Z., Holt, M. V., Maser, J. M., Keilmann, F., Shpyrko, O. G. &Basov, D. N. Nanoscale imaging of the electronic and structural transi-tions in vanadium dioxide. Phys. Rev. B 83, 165108 (2011).
[67] Kilcoyne, A. L., Tyliszczak, T., Steele, W. F., Fakra, S., Hitchcock,P., Franck, K., Anderson, E., Harteneck, B., Rightor, E. G., Mitchell,G. E., Hitchcock, A. P., Yang, L., Warwick, T. & Ade, H. Interferometer-controlled scanning transmission X-ray microscopes at the AdvancedLight Source. J. Synchrotron Radiat. 10, 125–136 (2003).
[68] Lu, M. Nanofabrication of Fresnel zone plates for soft X-ray imaging atcarbon edge. PhD thesis (Stony Brook University, 2006).
[69] Goodman, J. W. Introduction to Fourier optics (McGraw-Hill Compa-nies, Inc., 1968).
[70] Gerchberg, R. W. & Saxton, W. O. A practical algorithm for the de-termination of phase from image and diffraction plane pictures. Optik(Stuttg). 35, 237–246 (1972).
[71] Fienup, J. R. Phase retrieval algorithms: a comparison. Appl. Opt. 21,2758–2769 (1982).
[72] Als-Nielsen, J. & McMorrow, D. Elements of modern X-ray physics(John Wiley & Sons, Ltd., 2001).
[73] Mills, D. M. Third generation hard x-ray synchrotron radiation sources(John Wiley & Sons, Inc., 2002).
[74] Miao, J., Charalambous, P., Kirz, J. & Sayre, D. Extending the method-ology of X-ray crystallography to allow imaging of micrometre-sizednon-crystalline specimens. Nature 400, 342–344 (1999).
157

BIBLIOGRAPHY
[75] Gabor, D. A new microscopic principle. Nature 161, 777–778 (1948).
[76] McNulty, I. The future of X-ray holography. Nucl. Inst. Methods Phys.Res. A 347, 170–176 (1994).
[77] McNulty, I, Kirz, J, Jacobsen, C, Anderson, E. H., Howells, M. R. &Kern, D. P. High-resolution imaging by Fourier transform X-ray holog-raphy. Science 256, 1009–1012 (1992).
[78] Eisebitt, S, Lüning, J, Schlotter, W. F., Lörgen, M, Hellwig, O, Eber-hardt, W & Stöhr, J. Lensless imaging of magnetic nanostructures byX-ray spectro-holography. Nature 432, 885–888 (2004).
[79] Schlotter, W. F., Rick, R., Chen, K., Scherz, A., Stöhr, J., Lüning, J.,Eisebitt, S., Günther, C., Eberhardt, W., Hellwig, O. & McNulty, I.Multiple reference Fourier transform holography with soft x rays. Appl.Phys. Lett. 89, 163112 (2006).
[80] Gaskill, J. & Goodman, J. Use of multiple reference sources to increasethe effective field of view in lensless Fourier-transform holography. Proc.IEEE 57, 823–825 (1969).
[81] Abbate, M, Pen, H, Czyzyk, M. T., de Groot, F. M. F., Fuggle, J. C.,Ma, Y. J., Chen, C. T., Sette, F, Fujimori, A, Ueda, Y & Kosuge, K. SoftX-ray absorption spectroscopy of vanadium oxides. J. Electron Spectros.Relat. Phenomena 62, 185–195 (1993).
[82] Ruzmetov, D., Senanayake, S. D. & Ramanathan, S. X-ray absorptionspectroscopy of vanadium dioxide thin films across the phase-transitionboundary. Phys. Rev. B 75, 195102 (2007).
[83] Koethe, T. C., Hu, Z., Haverkort, M. W., Schüßler-Langeheine, C., Ven-turini, F., Brookes, N. B., Tjernberg, O., Reichelt, W., Hsieh, H. H., Lin,H. J., Chen, C. T., Tjeng, L. H. & Schu, C. Transfer of spectral weightand symmetry across the metal-insulator transition in VO2. Phys. Rev.Lett. 97, 116402 (2006).
[84] Weber, C., O’Regan, D. D., Hine, N. D. M., Payne, M. C., Kotliar, G.& Littlewood, P. B. Vanadium dioxide: A Peierls-Mott insulator stableagainst disorder. Phys. Rev. Lett. 108, 256402 (2012).
[85] De Groot, F. & Kotani, A. Core level spectroscopy of solids (CRC Press,2008).
[86] De Groot, F. M. F., Grioni, M., Fuggle, J. C., Ghijsen, J., Sawatzky,G. A. & Petersen, H. Oxygen 1s x-ray absorption edges of transition-metal oxides. Phys. Rev. B 40, 5715–5723 (1989).
158

BIBLIOGRAPHY
[87] Abbate, M, de Groot, F. M. F., Fuggle, J. C., Ma, Y. J., Chen, C. T.,Sette, F., Fujimori, A., Ueda, Y. & Kosuge, K. Soft-x-ray-absorptionstudies of the electronic-structure changes through the VO2 phase tran-sition. Phys. Rev. B 43, 7263–7266 (1991).
[88] Strelcov, E., Tselev, A., Ivanov, I., Budai, J. D., Zhang, J., Tischler,J. Z., Kravchenko, I., Kalinin, S. V. & Kolmakov, A. Doping-basedstabilization of the M2 phase in free-standing VO2 nanostructures atroom temperature. Nano Lett. 12, 6198–6205 (2012).
[89] Marini, C., Arcangeletti, E., Di Castro, D., Baldassare, L., Perucchi,A., Lupi, S., Malavasi, L., Boeri, L., Pomjakushina, E., Conder, K. &Postorino, P. Optical properties of V1−xCrxO2 compounds under highpressure. Phys. Rev. B 77, 235111 (2008).
[90] Abrudan, R., Brüssing, F., Salikhov, R., Meermann, J., Radu, I., Ryll,H., Radu, F. & Zabel, H. ALICE - An advanced reflectometer for staticand dynamic experiments in magnetism at synchrotron radiation facil-ities. Rev. Sci. Instrum. 86, 063902 (2015).
[91] Appavoo, K., Lei, D. Y., Sonnefraud, Y., Wang, B., Pantelides, S. T.,Maier, S. A. & Haglund, Jr, R. F. Role of defects in the phase transitionof VO2 nanoparticles probed by plasmon resonance spectroscopy. NanoLett. 12, 780–786 (2012).
[92] Barla, A., Nicolás, J., Cocco, D., Valvidares, M., Herrero-Martín, J.,Gargiani, P., Moldes, J., Ruget, C., Pellegrin, E. & Ferrer, S. Design andperformance of BOREAS, the beamline for resonant X-ray absorptionand scattering experiments at the ALBA synchrotron light source. J.Synchrotron Radiat. 23, 1507–1517 (2016).
[93] Quackenbush, N. F., Paik, H., Wahila, M. J., Sallis, S., Holtz, M. E.,Huang, X., Ganose, A., Morgan, B. J., Scanlon, D. O., Gu, Y., Xue, F.,Chen, L. Q., Sterbinsky, G. E., Schlueter, C., Lee, T. L., Woicik, J. C.,Guo, J. H., Brock, J. D., Muller, D. A., Arena, D. A., Schlom, D. G. &Piper, L. F. J. Stability of the M2 phase of vanadium dioxide inducedby coherent epitaxial strain. Phys. Rev. B 94, 085105 (2016).
[94] Liu, M., Wagner, M., Zhang, J., McLeod, A., Kittiwatanakul, S., Fei,Z., Abreu, E., Goldflam, M., Sternbach, A. J., Dai, S., West, K. G.,Lu, J., Wolf, S. A., Averitt, R. D. & Basov, D. N. Symmetry breakingand geometric confinement in VO2: Results from a three-dimensionalinfrared nano-imaging. Appl. Phys. Lett. 104, 121905 (2014).
159

BIBLIOGRAPHY
[95] O’Callahan, B. T., Jones, A. C., Hyung Park, J., Cobden, D. H., Atkin,J. M. & Raschke, M. B. Inhomogeneity of the ultrafast insulator-to-metal transition dynamics of VO2. Nat. Commun. 6, 6849 (2015).
[96] Sokolowski-Tinten, K., Bialkowski, J., Boing, M., Cavalleri, A. & vonder Linde, D. Thermal and nonthermal melting of gallium arsenide afterfemtosecond laser excitation. Phys. Rev. B 58, 805–808 (1998).
[97] Waldecker, L., Miller, T. A., Rudé, M., Bertoni, R., Osmond, J., Pruneri,V., Simpson, R. E., Ernstorfer, R. & Wall, S. Time-domain separationof optical properties from structural transitions in resonantly bondedmaterials. Nat. Mater. 14, 991–995 (2015).
[98] Cavalleri, A., Chong, H. H., Fourmaux, S., Glover, T. E., Heimann,P. A., Kieffer, J. C., Mun, B. S., Padmore, H. A. & Schoenlein, R. W. Pi-cosecond soft x-ray absorption measurement of the photoinduced insulator-to-metal transition in VO2. Phys. Rev. B 69, 153106 (2004).
[99] Rini, M., Hao, Z., Schoenlein, R. W., Giannetti, C., Parmigiani, F.,Fourmaux, S., Kieffer, J. C., Fujimori, A., Onoda, M., Wall, S. & Cav-alleri, A. Optical switching in VO2 films by below-gap excitation. Appl.Phys. Lett. 92, 181904 (2008).
[100] Mayer, B, Schmidt, C, Grupp, A, Oelmann, J, Marvel, R. E., Haglund,R. F., Oka, T, Brida, D, Leitenstorfer, A & Pashkin, A. Tunnelingbreakdown of a strongly correlated insulating state in VO2 induced byintense multiterahertz excitation. Phys. Rev. B 91, 235113 (2015).
[101] Cocker, T. L., Titova, L. V., Fourmaux, S, Holloway, G, Bandulet, H.-C., Brassard, D, Kieffer, J.-C., El Khakani, M. A. & Hegmann, F. A.Phase diagram of the ultrafast photoinduced insulator-metal transitionin vanadium dioxide. Phys. Rev. B 85, 155120 (2012).
[102] Berglund, C. N. & Guggenheim, H. J. Electronic properties of VO2 nearthe semiconductor-metal transition. Phys. Rev. 185, 1022–1033 (1969).
[103] Brews, J. R. Symmetry considerations and the vanadium dioxide phasetransition. Phys. Rev. B 1, 2557–2568 (1970).
[104] Budai, J. D., Hong, J., Manley, M. E., Specht, E. D., Li, C. W., Tischler,J. Z., Abernathy, D. L., Said, A. H., Leu, B. M., Boatner, L. a., Mc-Queeney, R. J. & Delaire, O. Metallization of vanadium dioxide drivenby large phonon entropy. Nature 515, 535–539 (2014).
[105] Gupta, M., Freeman, A. J. & Ellis, D. E. Electronic structure and latticeinstability of metallic VO2. Phys. Rev. B 16, 3338–3351 (1977).
160

BIBLIOGRAPHY
[106] Gervais, F. & Kress, W. Lattice dynamics of oxides with rutile structureand instabilities at the metal-semiconductor phase transitions of NbO2and VO2. Phys. Rev. B 31, 4809–4814 (1985).
[107] Srivastava, R. & Chase, L. L. Raman spectrum of semiconducting andmetallic VO2. Phys. Rev. Lett. 27, 727–730 (1971).
[108] Schilbe, P. Raman scattering in VO2. Phys. B 316-317, 600–602 (2002).
[109] Maurer, D., Leue, A., Heichele, R. & Müller, V. Elastic behavior nearthe metal-insulator transition of VO2. Phys. Rev. B 60, 13249–13252(1999).
[110] Terauchi, H. & Cohen, J. B. Diffuse x-ray scattering due to the latticeinstability near the metal-semiconductor transition in VO2. Phys. Rev.B 17, 2494–2496 (1978).
[111] Hearn, C. J. Phonon softening and the metal-insulator transition inVO2. J. Phys. C Solid State Phys. 5, 1317–1334 (1972).
[112] Cavalleri, A., Rini, M., Chong, H. H. W., Fourmaux, S., Glover, T. E.,Heimann, P. A., Kieffer, J. C. & Schoenlein, R. W. Band-selective mea-surements of electron dynamics in VO2 using femtosecond near-edgeX-ray absorption. Phys. Rev. Lett. 95, 067405 (2005).
[113] Holldack, K., Bahrdt, J., Balzer, A., Bovensiepen, U., Brzhezinskaya,M., Erko, A., Eschenlohr, A., Follath, R., Firsov, A., Frentrup, W., LeGuyader, L., Kachel, T., Kuske, P., Mitzner, R., Müller, R., Pontius, N.,Quast, T., Radu, I., Schmidt, J. S., Schüßler-Langeheine, C., Sperling,M., Stamm, C., Trabant, C. & Föhlisch, A. FemtoSpeX: a versatileoptical pump-soft x-ray probe facility with 100fs x-ray pulses of variablepolarization. J. Synchrotron Radiat. 21, 1090–1104 (2014).
[114] Schick, D., Le Guyader, L., Pontius, N., Radu, I., Kachel, T., Mitzner,R., Zeschke, T., Schüßler-Langeheine, C., Föhlisch, A. & Holldack, K.Analysis of the halo background in femtosecond slicing experiments. J.Synchrotron Rad. 23, 700–711 (2016).
[115] Wall, S., Foglia, L., Wegkamp, D., Appavoo, K., Nag, J., Haglund, R. F.,Stähler, J. &Wolf, M. Tracking the evolution of electronic and structuralproperties of VO2 during the ultrafast photoinduced insulator-metaltransition. Phys. Rev. B 87, 115126 (2013).
[116] Chollet, M., Alonso-mori, R., Cammarata, M., Damiani, D., Defever,J., Delor, J. T., Feng, Y., Glownia, J. M., Langton, J. B., Nelson, S.,Ramsey, K., Robert, A., Sikorski, M., Song, S., Stefanescu, D., Srini-vasan, V., Zhu, D., Lemke, H. T. & Fritz, D. M. The X-ray pump–probe
161

BIBLIOGRAPHY
instrument at the Linac Coherent Light Source. J. Synchrotron Radiat.22, 503–507 (2015).
[117] Wall, S., Yang, S., Vidas, L., Chollet, M., Glownia, M., Kozina, M.,Katayama, T., Henighan, T., Jiang, M., Miller, T. A., Reis, D. A., Boat-ner, L. A., Delaire, O. & Trigo, M. Ultrafast disordering of vanadiumdimers in photoexcited VO2. Science 362, 572–576 (2018).
[118] Lindenberg, A. M., Larsson, J, Sokolowski-Tinten, K, Gaffney, K. J.,Blome, C, Synnergren, O, Sheppard, J, Caleman, C, MacPhee, A. G.,Weinstein, D, Lowney, D. P., Allison, T. K., Matthews, T, Falcone,R. W., Cavalieri, A. L., Fritz, D. M., Lee, S. H., Bucksbaum, P. H., Reis,D. A., Rudati, J, Fuoss, P. H., Kao, C. C., Siddons, D. P., Pahl, R, Als-Nielsen, J, Duesterer, S, Ischebeck, R, Schlarb, H, Schulte-Schrepping,H, Tschentscher, T., Schneider, J, von der Linde, D, Hignette, O, Sette,F, Chapman, H. N., Lee, R. W., Hansen, T. N., Techert, S, Wark, J. S.,Bergh, M, Huldt, G, van der Spoel, D, Timneanu, N, Hajdu, J, Akre,R. A., Bong, E, Krejcik, P, Arthur, J, Brennan, S, Luening, K & Hast-ings, J. B. Atomic-scale visualization of inertial dynamics. Science 308,392–395 (2005).
[119] Chapman, H. N., Barty, A., Bogan, M. J., Boutet, S., Frank, M., Hau-Riege, S. P., Marchesini, S., Woods, B. W., Bajt, S., Benner, W. H.,London, R. a., Plönjes, E., Kuhlmann, M., Treusch, R., Düsterer, S.,Tschentscher, T., Schneider, J. R., Spiller, E., Möller, T., Bostedt, C.,Hoener, M., Shapiro, D. a., Hodgson, K. O., van der Spoel, D., Burmeis-ter, F., Bergh, M., Caleman, C., Huldt, G., Seibert, M. M., Maia,F. R.N. C., Lee, R. W., Szöke, A., Timneanu, N. & Hajdu, J. Fem-tosecond diffractive imaging with a soft-X-ray free-electron laser. Nat.Phys. 2, 839–843 (2006).
[120] Marchesini, S., Boutet, S., Sakdinawat, A. E., Bogan, M. J., Bajt, S.,Barty, A., Chapman, H. N., Frank, M., Hau-Riege, S. P., Szöke, A., Cui,C., Shapiro, D. a., Howells, M. R., Spence, J. C. H., Shaevitz, J. W., Lee,J. Y., Hajdu, J. & Seibert, M. M. Massively parallel X-ray holography.Nat. Photonics 2, 560–563 (2008).
[121] Barty, A., Boutet, S., Bogan, M. J., Hau-Riege, S., Marchesini, S.,Sokolowski-Tinten, K., Stojanovic, N., Tobey, R., Ehrke, H., Cavalleri,A., Düsterer, S., Frank, M., Bajt, S., Woods, B. W., Seibert, M. M., Ha-jdu, J., Treusch, R. & Chapman, H. N. Ultrafast single-shot diffractionimaging of nanoscale dynamics. Nat. Photonics 2, 415–419 (2008).
162

BIBLIOGRAPHY
[122] Pfau, B., Günther, C. M., Schaffert, S., Mitzner, R., Siemer, B., Roling,S., Zacharias, H., Kutz, O., Rudolph, I., Treusch, R. & Eisebitt, S.Femtosecond pulse X-ray imaging with a large field of view. New J.Phys. 12, 095006 (2010).
[123] Günther, C. M., Pfau, B, Mitzner, R, Siemer, B, Roling, S, Zacharias,H, Kutz, O, Rudolph, I, Schondelmaier, D, Treusch, R & Eisebitt, S. Se-quential femtosecond X-ray imaging. Nat. Photonics 5, 99–102 (2011).
[124] Dönges, S. A., Khatib, O., O’Callahan, B. T., Atkin, J. M., Park, J. H.,Cobden, D. & Raschke, M. B. Ultrafast Nanoimaging of the Photoin-duced Phase Transition Dynamics in VO2. Nano Lett. 16, 3029–3035(2016).
[125] Schlotter, W. F., Turner, J. J., Rowen, M., Heimann, P., Holmes, M.,Krupin, O., Messerschmidt, M., Moeller, S., Krzywinski, J., Soufli, R.,Fernndez-Perea, M., Kelez, N., Lee, S., Coffee, R., Hays, G., Beye, M.,Gerken, N., Sorgenfrei, F., Hau-Riege, S., Juha, L., Chalupsky, J., Ha-jkova, V., Mancuso, A. P., Singer, A., Yefanov, O., Vartanyants, I. A.,Cadenazzi, G., Abbey, B., Nugent, K. A., Sinn, H., Lning, J., Schaffert,S., Eisebitt, S., Lee, W. S., Scherz, A., Nilsson, A. R. & Wurth, W. Thesoft x-ray instrument for materials studies at the linac coherent lightsource x-ray free-electron laser. Rev. Sci. Instrum. 83, 043107 (2012).
163


Acknowledgements
The work and achievements accomplished in this thesis would not have beenpossible without the great support and help from several people. First, I wouldlike to thank Simon Wall for giving me the opportunity of joining his recentlyformed group for my PhD. It has been a privilege for me to be his first PhD-student and I feel lucky for having such a great support from him, both fromthe scientific as well as the personal side. My suggestions and complaints havealways been heard and considered, and I am grateful for the trust he has placedin me and my work.
This work, a major part of it being carried at large-scale facilities abroad,has benefited from the expertise and knowledge of collaborators from outsideICFO. I would like to mention here the people in Stefan Eisebitt’s group: Chris-tian Günther, Bastian Pfau, and Daniel Schick, for their vital help in the holog-raphy experiments; the guys from the BOREAS beamline at ALBA for givingme numerous opportunities to work in their beamline: Manuel Valvidares andPierluigi Gargiani; the people that worked with me at LCLS and SACLA inthe XDS beamtimes: Mariano Trigo and Olivier Delaire; the people from theBESSY slicing beamline: Daniel Schick again, Christian Schüβler-Langeheine,Torsten Kachel, and Niko Pontius for their help during the XAS beamtimes;and the guys that provided us the VO2 samples from Richard Haglund, Jr.’sgroup: Robert Marvel and Kent Hallman.
I would also like to thank all the UODS group members for making theoffice, lab and beamlines such nice and fun work environments, those who haveleft already as well as those who are still here.
Un gracias de todo corazón va a todos mis amigos, tanto los que vivenaquí como los que están fuera, por darme su apoyo y cariño y tener tanta feen mí. La mayoría no han ayudado precisamente a acelerar este trabajo, sinotodo lo contrario, pero su compañía lo merecía.
Por último, mis gracias más especiales y verdaderas son para Ángel ymi familia. Ellos, que no se han perdido ni un capítulo de esta tesis, son el
165

BIBLIOGRAPHY
verdadero pilar sobre el que se sostiene todo este trabajo.
166
Copyright © 2022 FDOKUMEN