
Synthesis, crystal structures and luminescence properties of the Eu 3+-doped yttrium...
12
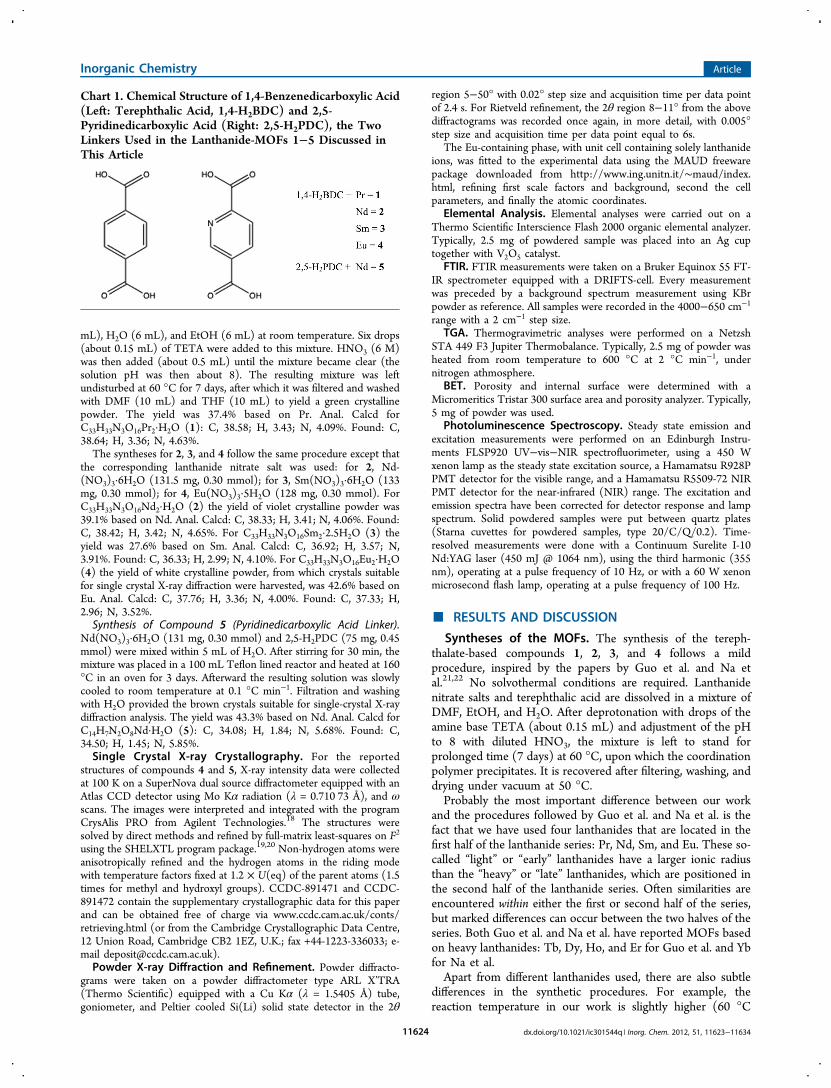
Synthesis, Crystal Structures, and Luminescence Properties of Carboxylate Based Rare-Earth Coordination Polymers Roel Decadt, † Kristof Van Hecke, † Diederik Depla, ‡ Karen Leus, † David Weinberger, † Isabel Van Driessche, † Pascal Van Der Voort, † and Rik Van Deun* ,† † Department of Inorganic and Physical Chemistry, Ghent University, Krijgslaan 281, Building S3, 9000 Gent, Belgium ‡ Department of Solid State Sciences, Ghent University, Krijgslaan 281, Building S1, 9000 Gent, Belgium * S Supporting Information ABSTRACT: Rare-earth coordination polymers or lanthanide− organic frameworks with hitherto unreported crystal structures have been obtained on the basis of the “light” lanthanides Pr, Nd, Sm, and Eu in combination with terephthalic acid and using a slightly altered literature synthesis procedure. Rietveld refinement has shown that powder XRD patterns of such compounds are largely dominated by the positions of the heavy elements, pointing to isostructural networks for all four terephthalate-based materials. An in-depth luminescence study has been performed on the reported MOFs, showing rare praseodymium and samarium emission in the visible spectrum, aside from the strong europium luminescence and the near-infrared emission from both a terephthalate and 2,5-pyridinedicarboxylate based neodymium- MOF. ■ INTRODUCTION The past decade has seen an exponential growth of reports dealing with metal−organic frameworks (MOFs) or porous coordination polymers, which are being studied for their possible application in catalysis, gas separation, gas storage, ion exchange, luminescence, magnetism, etc. 1−14 Lanthanide− organic frameworks in particular are promising materials because of the intrinsic physical properties of the trivalent lanthanide ions, such as color-pure luminescence, large paramagnetism, and the fact that the electrostatic nature of their coordination chemistry allows a large variety of symmetries and structural patterns to be obtained, whereas the well-defined tetrahedral or octahedral coordination patterns of most of the transition metal ions limit this variety to a certain extent. 15−17 Even though the symmetry of a transition metal coordination sphere limits the possible structural patterns that can be obtained in transition metal−organic frameworks, at least this symmetry could ideally allow the prediction of the main structural features of the resulting MOF. This is not at all the case for lanthanide−organic frameworks. As a result, the understanding of the mechanisms that lead from lanthanide salt and linker molecules to the resulting lanthanide clusters is still nowhere near complete. In this Article, we show that the cationic radius of the lanthanide, in combination with slight alterations to literature procedures, can lead to materials that are structurally different than the ones reported in the literature. By far the most widely studied lanthanide−organic frame- works are based on linker molecules that contain carboxylate groups as the coordinating units, among which 1,4- benzenedicarboxylate (also known as terephthalate) is most likely the most popular one. In this Article, we extend the family of terephthalate-based lanthanide−organic frameworks with 4 compounds, based on the “light” or “early” lanthanides Pr, Nd, Sm, and Eu. These compounds show structural motifs that are new and have not been reported yet. We describe their synthesis, crystal structure determination of the Eu-MOF, Rietveld refinement, and in-depth luminescence investigation. In addition, we report the synthesis, crystal structure determination, and luminescence properties of a Nd-MOF based on the 2,5-pyridinedicarboxylate linker. Both linkers used in this study, and the resulting lanthanide−organic frameworks 1−5, are shown in Chart 1. ■ EXPERIMENTAL SECTION Chemicals. Lanthanide nitrates Ln(NO 3 ) 3 ·xH 2 O, where Ln = Pr, Nd, Sm (x = 6) or Eu (x = 5), were purchased from Aldrich and used without further purification. Triethylenetetramine (TETA), 1,4- benzenedicarboxylic acid (terephthalic acid; 1,4-H 2 BDC), and 2,5- pyridinedicarboxylic acid (2,5-H 2 PDC) were purchased from Acros Organics. Solvent grade N,N-dimethylformamide (DMF), ethanol (EtOH), nitric acid (HNO 3 ), and tetrahydrofuran (THF) were purchased from Carl Roth GmbH. Syntheses. Synthesis of Compounds 1, 2, 3, and 4 (Terephthalic Acid Linker). Pr(NO 3 ) 3 ·6H 2 O (130.5 mg, 0.30 mmol) and 1,4-H 2 BDC (48 mg, 0.30 mmol) were dissolved in a solvent mixture of DMF (30 Received: July 16, 2012 Published: October 18, 2012 Article pubs.acs.org/IC © 2012 American Chemical Society 11623 dx.doi.org/10.1021/ic301544q | Inorg. Chem. 2012, 51, 11623−11634
-
Upload
independent -
Category
Documents
-
view
1 -
download
0
Transcript of Synthesis, crystal structures and luminescence properties of the Eu 3+-doped yttrium...

Synthesis, Crystal Structures, and Luminescence Properties ofCarboxylate Based Rare-Earth Coordination PolymersRoel Decadt,† Kristof Van Hecke,† Diederik Depla,‡ Karen Leus,† David Weinberger,†
Isabel Van Driessche,† Pascal Van Der Voort,† and Rik Van Deun*,†
†Department of Inorganic and Physical Chemistry, Ghent University, Krijgslaan 281, Building S3, 9000 Gent, Belgium‡Department of Solid State Sciences, Ghent University, Krijgslaan 281, Building S1, 9000 Gent, Belgium
*S Supporting Information
ABSTRACT: Rare-earth coordination polymers or lanthanide−organic frameworks with hitherto unreported crystal structureshave been obtained on the basis of the “light” lanthanides Pr, Nd,Sm, and Eu in combination with terephthalic acid and using aslightly altered literature synthesis procedure. Rietveld refinementhas shown that powder XRD patterns of such compounds arelargely dominated by the positions of the heavy elements, pointingto isostructural networks for all four terephthalate-based materials.An in-depth luminescence study has been performed on thereported MOFs, showing rare praseodymium and samariumemission in the visible spectrum, aside from the strong europiumluminescence and the near-infrared emission from both aterephthalate and 2,5-pyridinedicarboxylate based neodymium-MOF.
■ INTRODUCTION
The past decade has seen an exponential growth of reportsdealing with metal−organic frameworks (MOFs) or porouscoordination polymers, which are being studied for theirpossible application in catalysis, gas separation, gas storage, ionexchange, luminescence, magnetism, etc.1−14 Lanthanide−organic frameworks in particular are promising materialsbecause of the intrinsic physical properties of the trivalentlanthanide ions, such as color-pure luminescence, largeparamagnetism, and the fact that the electrostatic nature oftheir coordination chemistry allows a large variety ofsymmetries and structural patterns to be obtained, whereasthe well-defined tetrahedral or octahedral coordination patternsof most of the transition metal ions limit this variety to a certainextent.15−17
Even though the symmetry of a transition metal coordinationsphere limits the possible structural patterns that can beobtained in transition metal−organic frameworks, at least thissymmetry could ideally allow the prediction of the mainstructural features of the resulting MOF. This is not at all thecase for lanthanide−organic frameworks. As a result, theunderstanding of the mechanisms that lead from lanthanide saltand linker molecules to the resulting lanthanide clusters is stillnowhere near complete. In this Article, we show that thecationic radius of the lanthanide, in combination with slightalterations to literature procedures, can lead to materials thatare structurally different than the ones reported in the literature.By far the most widely studied lanthanide−organic frame-
works are based on linker molecules that contain carboxylate
groups as the coordinating units, among which 1,4-benzenedicarboxylate (also known as terephthalate) is mostlikely the most popular one. In this Article, we extend thefamily of terephthalate-based lanthanide−organic frameworkswith 4 compounds, based on the “light” or “early” lanthanidesPr, Nd, Sm, and Eu. These compounds show structural motifsthat are new and have not been reported yet. We describe theirsynthesis, crystal structure determination of the Eu-MOF,Rietveld refinement, and in-depth luminescence investigation.In addition, we report the synthesis, crystal structuredetermination, and luminescence properties of a Nd-MOFbased on the 2,5-pyridinedicarboxylate linker. Both linkers usedin this study, and the resulting lanthanide−organic frameworks1−5, are shown in Chart 1.
■ EXPERIMENTAL SECTIONChemicals. Lanthanide nitrates Ln(NO3)3·xH2O, where Ln = Pr,
Nd, Sm (x = 6) or Eu (x = 5), were purchased from Aldrich and usedwithout further purification. Triethylenetetramine (TETA), 1,4-benzenedicarboxylic acid (terephthalic acid; 1,4-H2BDC), and 2,5-pyridinedicarboxylic acid (2,5-H2PDC) were purchased from AcrosOrganics. Solvent grade N,N-dimethylformamide (DMF), ethanol(EtOH), nitric acid (HNO3), and tetrahydrofuran (THF) werepurchased from Carl Roth GmbH.
Syntheses. Synthesis of Compounds 1, 2, 3, and 4 (TerephthalicAcid Linker). Pr(NO3)3·6H2O (130.5 mg, 0.30 mmol) and 1,4-H2BDC(48 mg, 0.30 mmol) were dissolved in a solvent mixture of DMF (30
Received: July 16, 2012Published: October 18, 2012
Article
pubs.acs.org/IC
© 2012 American Chemical Society 11623 dx.doi.org/10.1021/ic301544q | Inorg. Chem. 2012, 51, 11623−11634
mL), H2O (6 mL), and EtOH (6 mL) at room temperature. Six drops(about 0.15 mL) of TETA were added to this mixture. HNO3 (6 M)was then added (about 0.5 mL) until the mixture became clear (thesolution pH was then about 8). The resulting mixture was leftundisturbed at 60 °C for 7 days, after which it was filtered and washedwith DMF (10 mL) and THF (10 mL) to yield a green crystallinepowder. The yield was 37.4% based on Pr. Anal. Calcd forC33H33N3O16Pr2·H2O (1): C, 38.58; H, 3.43; N, 4.09%. Found: C,38.64; H, 3.36; N, 4.63%.The syntheses for 2, 3, and 4 follow the same procedure except that
the corresponding lanthanide nitrate salt was used: for 2, Nd-(NO3)3·6H2O (131.5 mg, 0.30 mmol); for 3, Sm(NO3)3·6H2O (133mg, 0.30 mmol); for 4, Eu(NO3)3·5H2O (128 mg, 0.30 mmol). ForC33H33N3O16Nd2·H2O (2) the yield of violet crystalline powder was39.1% based on Nd. Anal. Calcd: C, 38.33; H, 3.41; N, 4.06%. Found:C, 38.42; H, 3.42; N, 4.65%. For C33H33N3O16Sm2·2.5H2O (3) theyield was 27.6% based on Sm. Anal. Calcd: C, 36.92; H, 3.57; N,3.91%. Found: C, 36.33; H, 2.99; N, 4.10%. For C33H33N3O16Eu2·H2O(4) the yield of white crystalline powder, from which crystals suitablefor single crystal X-ray diffraction were harvested, was 42.6% based onEu. Anal. Calcd: C, 37.76; H, 3.36; N, 4.00%. Found: C, 37.33; H,2.96; N, 3.52%.Synthesis of Compound 5 (Pyridinedicarboxylic Acid Linker).
Nd(NO3)3·6H2O (131 mg, 0.30 mmol) and 2,5-H2PDC (75 mg, 0.45mmol) were mixed within 5 mL of H2O. After stirring for 30 min, themixture was placed in a 100 mL Teflon lined reactor and heated at 160°C in an oven for 3 days. Afterward the resulting solution was slowlycooled to room temperature at 0.1 °C min−1. Filtration and washingwith H2O provided the brown crystals suitable for single-crystal X-raydiffraction analysis. The yield was 43.3% based on Nd. Anal. Calcd forC14H7N2O8Nd·H2O (5): C, 34.08; H, 1.84; N, 5.68%. Found: C,34.50; H, 1.45; N, 5.85%.Single Crystal X-ray Crystallography. For the reported
structures of compounds 4 and 5, X-ray intensity data were collectedat 100 K on a SuperNova dual source diffractometer equipped with anAtlas CCD detector using Mo Kα radiation (λ = 0.710 73 Å), and ωscans. The images were interpreted and integrated with the programCrysAlis PRO from Agilent Technologies.18 The structures weresolved by direct methods and refined by full-matrix least-squares on F2
using the SHELXTL program package.19,20 Non-hydrogen atoms wereanisotropically refined and the hydrogen atoms in the riding modewith temperature factors fixed at 1.2 × U(eq) of the parent atoms (1.5times for methyl and hydroxyl groups). CCDC-891471 and CCDC-891472 contain the supplementary crystallographic data for this paperand can be obtained free of charge via www.ccdc.cam.ac.uk/conts/retrieving.html (or from the Cambridge Crystallographic Data Centre,12 Union Road, Cambridge CB2 1EZ, U.K.; fax +44-1223-336033; e-mail [email protected]).Powder X-ray Diffraction and Refinement. Powder diffracto-
grams were taken on a powder diffractometer type ARL X’TRA(Thermo Scientific) equipped with a Cu Kα (λ = 1.5405 Å) tube,goniometer, and Peltier cooled Si(Li) solid state detector in the 2θ
region 5−50° with 0.02° step size and acquisition time per data pointof 2.4 s. For Rietveld refinement, the 2θ region 8−11° from the abovediffractograms was recorded once again, in more detail, with 0.005°step size and acquisition time per data point equal to 6s.
The Eu-containing phase, with unit cell containing solely lanthanideions, was fitted to the experimental data using the MAUD freewarepackage downloaded from http://www.ing.unitn.it/∼maud/index.html, refining first scale factors and background, second the cellparameters, and finally the atomic coordinates.
Elemental Analysis. Elemental analyses were carried out on aThermo Scientific Interscience Flash 2000 organic elemental analyzer.Typically, 2.5 mg of powdered sample was placed into an Ag cuptogether with V2O5 catalyst.
FTIR. FTIR measurements were taken on a Bruker Equinox 55 FT-IR spectrometer equipped with a DRIFTS-cell. Every measurementwas preceded by a background spectrum measurement using KBrpowder as reference. All samples were recorded in the 4000−650 cm−1
range with a 2 cm−1 step size.TGA. Thermogravimetric analyses were performed on a Netzsh
STA 449 F3 Jupiter Thermobalance. Typically, 2.5 mg of powder washeated from room temperature to 600 °C at 2 °C min−1, undernitrogen athmosphere.
BET. Porosity and internal surface were determined with aMicromeritics Tristar 300 surface area and porosity analyzer. Typically,5 mg of powder was used.
Photoluminescence Spectroscopy. Steady state emission andexcitation measurements were performed on an Edinburgh Instru-ments FLSP920 UV−vis−NIR spectrofluorimeter, using a 450 Wxenon lamp as the steady state excitation source, a Hamamatsu R928PPMT detector for the visible range, and a Hamamatsu R5509-72 NIRPMT detector for the near-infrared (NIR) range. The excitation andemission spectra have been corrected for detector response and lampspectrum. Solid powdered samples were put between quartz plates(Starna cuvettes for powdered samples, type 20/C/Q/0.2). Time-resolved measurements were done with a Continuum Surelite I-10Nd:YAG laser (450 mJ @ 1064 nm), using the third harmonic (355nm), operating at a pulse frequency of 10 Hz, or with a 60 W xenonmicrosecond flash lamp, operating at a pulse frequency of 100 Hz.
■ RESULTS AND DISCUSSION
Syntheses of the MOFs. The synthesis of the tereph-thalate-based compounds 1, 2, 3, and 4 follows a mildprocedure, inspired by the papers by Guo et al. and Na etal.21,22 No solvothermal conditions are required. Lanthanidenitrate salts and terephthalic acid are dissolved in a mixture ofDMF, EtOH, and H2O. After deprotonation with drops of theamine base TETA (about 0.15 mL) and adjustment of the pHto 8 with diluted HNO3, the mixture is left to stand forprolonged time (7 days) at 60 °C, upon which the coordinationpolymer precipitates. It is recovered after filtering, washing, anddrying under vacuum at 50 °C.Probably the most important difference between our work
and the procedures followed by Guo et al. and Na et al. is thefact that we have used four lanthanides that are located in thefirst half of the lanthanide series: Pr, Nd, Sm, and Eu. These so-called “light” or “early” lanthanides have a larger ionic radiusthan the “heavy” or “late” lanthanides, which are positioned inthe second half of the lanthanide series. Often similarities areencountered within either the first or second half of the series,but marked differences can occur between the two halves of theseries. Both Guo et al. and Na et al. have reported MOFs basedon heavy lanthanides: Tb, Dy, Ho, and Er for Guo et al. and Ybfor Na et al.Apart from different lanthanides used, there are also subtle
differences in the synthetic procedures. For example, thereaction temperature in our work is slightly higher (60 °C
Chart 1. Chemical Structure of 1,4-Benzenedicarboxylic Acid(Left: Terephthalic Acid, 1,4-H2BDC) and 2,5-Pyridinedicarboxylic Acid (Right: 2,5-H2PDC), the TwoLinkers Used in the Lanthanide-MOFs 1−5 Discussed inThis Article
Inorganic Chemistry Article
dx.doi.org/10.1021/ic301544q | Inorg. Chem. 2012, 51, 11623−1163411624

instead of 55 °C in the Guo paper). We have also used differentamounts of reagent: the Guo paper describes the use of 0.1mmol of H2BDC linker, 0.1 mmol of lanthanide salt, and a10:2:2 mL mixture of DMF:EtOH:H2O. We have tripled theseamounts. Furthermore, when working with “droplets” of a basesolution such as TETA, it is hard to compare the size of thedroplets and the speed with which they are added to thereaction medium. The same holds for the addition of HNO3 toadjust the pH again after the addition of the base. The work ofNa et al. yields an Yb structure, homologous to the structuresreported by Guo et al. However, the solvent mixture describedin the Na paper does not contain H2O. Again differentquantities of reagent have been used: only 0.06 mmol ofH2BDC linker is present and 0.1 mmol of Yb(NO3)3. Thetemperature, however, is equal to the one we also applied: 60°C. Finally, a different base (MeNH2) is used. It seems that theidentity of the metal ion, the reaction temperature, and reagentquantities are all parameters of significant importance incoordination polymer synthesis. The fact, however, that acomparable crystal structure was obtained in the papers by Guoet al. and Na et al., even though they used slightly differentsynthetic methods, suggests that the identity of the metal ion(light vs heavy lanthanide, meaning large vs small ionic radius)is of more importance than the exact reaction conditions, as thecrystal structure reported in this work (see further) issignificantly different from those reported in the Guo and Napapers.Pyridinedicarboxylate-based compound 5 is prepared
through a typical hydrothermal method in an autoclave at160 °C.23,24 Here, we used the same procedure as reported byHuang et al. and Qin et al.: after mixing the dicarboxylic acidwith the lanthanide salt in water, the mixture becomes clearupon heating. No additional deprotonating reagents arerequired. After three days, crystals precipitate and are readilyharvested after slowly cooling the mixture. The crystal structureobtained here (see further) is homologous to the ones reportedin the Huang and Qin papers.Description of Crystal Structures. The structures of
compound 4 and 5 were determined by single crystal X-raydiffraction. Table 1 summarizes the most important crystallo-graphic data.Compound 4 crystallized in the centrosymmetric triclinic
space group P1 . To the best of our knowledge, this reportedstructure is not isostructural to any other previously depositedstructure in the CSD (Cambridge Structural Database).25 Theasymmetric unit is composed of two crystallographically distinctEu(III) metal centers, three coordinating 1,4-BDC2‑ (1,4-benzenedicarboxylate) ligands, two coordinating DMF mole-cules, one coordinating water molecule, and one DMF solventmolecule.A first Eu(III) ion is octacoordinated with six oxygen atoms
from the carboxylate groups of six different monodentatelycoordinating 1,4-BDC2‑ ligands (Eu−O distances ranging from2.322(8) to 2.402(7) Å), one DMF oxygen atom (Eu−Odistance of 2.497(11) Å), and one water molecule (Eu−Odistance of 2.514(8) Å) (Figure 1). The second Eu(III) ion isoctacoordinated as well, but with seven oxygen atoms, from thecarboxylate groups of five monodentately and one bidentatetelycoordinating 1,4-BDC2‑ ligands, (Eu−O distances ranging from2.307(7) to 2.598(8) Å) and from one DMF oxygen atom(Eu−O distance of 2.397(10) Å) (Figure 2). For both Eu(III)ions, the coordination environment can be considered adistorted square antiprism.
In the packing, Eu1 is connected through four bidentately1,4-BDC2‑ ligands to its symmetry equivalent Eu1[1 − x,1 − y,1− z] (inversion center), whereas Eu2 is connected through twobridging and two bidentately 1,4-BDC2‑ ligands to its symmetryequivalent Eu2[−x, −y, −z], the latter leading to an edge-sharing dimer. On their turn, these metallic dimers are linked toeach other through two bidentately 1,4-BDC2‑ ligands, leadingto 4-centered secondary building units (SBU) (Figure 3).These SBUs are further assembled into 1D chains, along the [1,1, 1] direction. These chains are cross-linked by 1,4-BDC2‑
Table 1. Crystallographic Data for Compounds 4 and 5
4 5
molecular formula C33H33Eu2N3O16 C14H7N2NdO8
fw (g mol−1) 1031.56 475.46cryst dimensions (mm3) 0.21 × 0.14 × 0.11 0.40 × 0.20 × 0.20cryst syst triclinic orthorhombicspace group P1 (No. 2) Pbcn (No. 60)a (Å) 11.0552(7) 9.9599(8)b (Å) 11.0713(6) 8.7592(8)c (Å) 17.6488(10) 15.7875(16)α (deg) 93.084(5) 90.00β (deg) 104.429(5) 90.00γ (deg) 119.032(6) 90.00V (Å3) 1789.8(2) 1377.3(2)Z 2 4ρcalcd (g cm−3) 1.914 2.2932θmax (deg) 50.70 52.72T (K) 100(2) 100(2)F(000) 1012 916measured reflns 11 627 9380unique reflns 9981 1410obsd reflns (I > 2σ(I)) 7985 1252params refined 494 115R1 0.0672 0.0208wR2 0.1891 0.0547R1 (all data) 0.0842 0.0240wR2 (all data) 0.2094 0.0577GOF 1.092 1.144μ (mm−1) 3.551 3.823CCDC entry CCDC-891471 CCDC-891472
Figure 1. Coordination environment of the first Eu(III) ion “Eu1” inthe crystal structure of compound 4, with atom labeling scheme of theasymmetric unit. Hydrogen atoms are omitted for clarity.
Inorganic Chemistry Article
dx.doi.org/10.1021/ic301544q | Inorg. Chem. 2012, 51, 11623−1163411625

ligands in the (1, −1, 0) plane and (−1, 0, 1) plane, building upa 3D network, with 11.23 Å by 11.07 Å (side lengths, measured
between the Eu atoms) rhombic channels along the [1, 1, 1]direction (Figure 4), with a void volume of 35.1% of the unitcell volume or 628.68 Å3 (DMF molecules not taken intoaccount), and with a void volume of 36.7% of the unit cellvolume of 657.72 Å3 (DMF and coordinated water moleculenot taken into account), calculated with the program MercuryCSD 2.4.26 The coordinating, as well as the solvent DMF,molecules are pointing into these channels (Figure 5).The only other structure found in the CSD, containing a
Eu(III) ion, 1,4-BDC2‑, and DMF, contains also binuclearEu(III) centers as building blocks. However, each Eu(III)-center is nonacoordinated, from three bidentately and onemonodentately coordinating 1,4-BDC2‑ ligands, one DMF, andone water molecule. The coordination is considered a distortedtricapped trigonal prism, and a 3D interpenetrating coordina-tion polymer is formed.27 Gd, Dy, Er, and Tm complexes,isostructural to the latter Eu-complex, also exist, with the Ercomplex slightly differing in the coordination of the binuclearEr clusters, which are bridged by two mono(bidentate) 1,4-BDC2‑ carboxylates and further coordinated by two bidentate1,4-BDC2‑ carboxylates, one DMF, and one water molecule in adistorted square antiprism geometry.28−30
Other, different Ln-containing coordination polymers with1,4-BDC2‑ and DMF ligands were previously reported:containing one Er(III) center, coordinated by seven O-atoms(from six monodentate 1,4-BDC2‑ and one DMF), showing onecoordination mode of 1,4-BDC2‑, and with 1,4-BDC2‑ linkingfour Er(III) atoms using its two bridging carboxylate groups.31
Another five isostructural Ln-complexes were reported, with Ln= Tb, Dy, Ho, and Er (Guo et al.)21 and Ln = Yb (Na et al.),22
showing three different coordination Ln-centers, and forming a3D network built up from discrete, as well as infinite SBUs,leading to pseudochains rather than infinite chains.Another three other isostructural Ln-complexes, with Ln =
La, Ce, and Nd, were reported, showing six crystallographicallydifferent Ln-ions, with three different types of coordinationnumbers, leading to 3D Ln-BDC MOFs.32
Figure 2. Coordination environment of the second Eu(III) ion “Eu2”in the crystal structure of compound 4, with atom labeling scheme ofthe asymmetric unit. Hydrogen atoms are omitted for clarity.
Figure 3. Four-centered secundary building unit (SBU) in thestructure of compound 4, showing coordination polyhedra and atom-labeling of the four Eu ions.
Figure 4. Packing diagram, showing the 3D framework of the structure of compound 4 down the [1, 1, 0] direction, with coordination polyhedraindicated. Only 1,4-BDC2‑ ligands, connecting the Eu(III) centers in the [0, 1, 0] direction, as well as the coordinating DMF ligands are shown.Hydrogen atoms are omitted for clarity.
Inorganic Chemistry Article
dx.doi.org/10.1021/ic301544q | Inorg. Chem. 2012, 51, 11623−1163411626

Compound 5 crystallized in the orthorhombic space groupPbcn. The asymmetric unit consists of one Nd(III) metalcenter, positioned on the 2-fold axis (occupancy = 0.5) and one2,5-PDC2‑ (2,5-pyridinedicarboxylate) ligand. The structure ishomologous to the previously reported Eu(III), Tb(III),Gd(III), and Sm(III) structures.23,24,33
The Nd(III) ion is octacoordinated with six oxygen atomsand two nitrogen atoms. The Nd(III) coordination environ-ment can be considered as a distorted square antiprism. Two2,5-PDC2‑ ligands coordinate bidentately to the Nd(III),through their pyridine nitrogen atom and one carboxylateoxygen atom, while four other 2,5-PDC2‑ ligands aremonodentately coordinating through their pyridine nitrogenatom and a carboxylate oxygen atom (Figure 6). The Nd−Nbond distance is 2.618(2) Å, while there are three differentsymmetry-related Nd−O bond distances: 2.413(2), 2.376(2),and 2.445(2) Å, respectively. Each 2,5-PDC2‑ ligand coor-dinates to three Nd(III) ions, i.e., the two oxygen atoms of thefirst carboxylate coordinate each to a Nd(III) ion (mono-bidentate), while one oxygen atom of the second carboxylatecoordinates to a third Nd(III) ion (monodendate).To satisfy the charge equilibrium of the total coordination
polymer, half of the 2,5-PDC2‑ ligands are protonated: ahydrogen atom (occupancy = 0.5) was modeled on the O4carboxylate atom of the 2,5-PDC2‑. Hence, an intermolecularhydrogen bond is formed between the carboxylate atom O4 ofa 2,5-PDC2‑ ligand and O4 of a symmetry equivalent ligand(O···O distance of 2.404(3) Å). As a matter of fact, thishydrogen atom could be located from a difference Fourierelectron density map, where an additional peak was observedon the 2-fold symmetry axis between carboxylate atom O4 andthe symmetry equivalent O4 [−x, y, −1/2 − z].The 3D framework can be considered as built up by layers of
octacoordinated Nd(III) metal centers in the (0, 0, 1) plane,linked by layers of the 2,5-PDC2‑ ligands in the [0, 0, 1]direction (Figure 7).
Powder X-ray Diffraction and Rietveld Refinement.Bragg−Brentano (θ, 2θ) XRD spectra were measured on thesynthesized powders. On the basis of the resolved crystalstructure for Eu-MOF 4, the (θ, 2θ) XRD spectrum wascalculated (see Figure 8a). The peaks at low Bragg angle are theresult of the diffraction of lattice planes containing thelanthanide atoms as shown in Figure 9, where these latticeplanes are indicated. When removing the low Z atoms (C, N,O, and H) from the structure, one notices that the overall XRDspectrum is hardly modified in the low angle range (see Figure8b), which is understandable from the structure and the factthat the atomic scattering factor for the lanthanide atoms ismuch higher as compared to the low Z atoms. On the basis of
Figure 5. Packing diagram, showing the 3D framework of the structure of compound 4, down the [1, 1, 1] direction, showing the 1D rhombicchannels, in which the coordinated DMF and water molecules, as well as the guest DMF molecules, are represented in space fill mode.
Figure 6. Coordination environment of the Nd(III) ion in the crystalstructure of compound 5, with labeling scheme of the asymmetric unit.Hydrogen atoms are omitted for clarity.
Inorganic Chemistry Article
dx.doi.org/10.1021/ic301544q | Inorg. Chem. 2012, 51, 11623−1163411627

this result, the following assumption was made to retrieve thelattice parameters for the different 1,4-BDC2‑ based MOFs byRietveld refinement: First, it was assumed that the structure ofthe 1,4-BDC2‑ based MOFs 1, 2, and 3 was similar to the Eubased material 4. This allows us to retrieve the latticeparameters based on the peak positions. However, to solvethe problem of the intensity calculation in the Rietveldrefinement, we assumed that the intensity for the low angleBragg lines was solely defined by the positions of the lanthanideatoms; i.e., the low Z elements were excluded from thecalculations. This method allows us to calculate correctly thecell parameters, without the need to solve the complete powderstructure. The XRD patterns together with the fits are shownfor the different elements in Figure 8, parts c to f. On the basisof the agreement between the fits and the experimental curves,it is clear that the unit cells are identical for each of thelanthanide-MOFs 1 to 4, pointing to a highly isostructuralrelationship between these MOFs.Figure 10 shows the trends in the lattice parameters as a
function of the increasing cation radius of the lanthanide ion.The cation radius was taken from R. D. Shannon.34 Thecorrelation between the lattice parameters and the cation radiuswas statistically tested. Only for the a-parameter was asignificant linear decrease as a function of the increasing cationradius found (Kendall rank correlation test, significance level97.5%). Also a significant decrease, although not linear, of theangle between the a and b axis, i.e., γ, is noticed as a function ofincreasing cation radius (Kendall rank correlation test,significance level 95%).IR, TGA, BET. In the IR spectrum of 4 the characteristic
symmetric and asymmetric stretching vibrations from thedeprotonated carboxylic acids are found at 1313 and 1580cm−1, respectively. A peak at 828 cm−1 corresponds to the 1,4-
benzene substitution pattern. The bands of the aromaticbenzene skeleton vibration are found at 1512 cm−1. The largepeak at 1624 cm−1 corresponds to the coordinating DMFamide carbonyl. At 3061 cm−1 the aromatic C−H stretch ispresent. The IR spectra for compounds 1, 2, and 3 areanalogous to that of compound 4 (see Figure S1 in theSupporting Information). In the IR spectrum for 5, the broadO−H stretch for H-bonded carboxylic acid hydrogen appears inthe 3500−2500 cm−1 region. The protonated and both thesymmetric and asymmetric deprotonated carboxylic acid groupstretch vibrations are visible at 1963 cm−1, and at 1594 and1293 cm−1, respectively (see Figure S2 in the SupportingInformation).The thermal stability of the compounds has been investigated
by thermogravimetric analysis (see Figure S3 in the SupportingInformation). The TGA analysis results for compound 4 arerepresentative for the other compounds 1, 2, and 3 and arediscussed here. The first weight loss for 4, amounting to 6.2%,occurs between 80 and 120 °C and implies the loss ofcoordinated and guest H2O molecules (calcd 3.43%). A secondweight loss of 8.9% is observed between 190 and 240 °C,corresponding to the removal of a guest DMF molecule (calcd6.9%). Beyond 390 °C the coordination polymer decomposes,leaving 34.6% of the initial weight remaining as Eu2O3 (calcd33.4%).The terephthalate-based MOFs were also submitted for BET
analysis. The found BET surfaces are 3.4138 m2/g for 1, 5.1376m2/g for 2, 2.6876 m2/g for 3, and 2.9818 m2/g for 4. Thesesurfaces are low, describing in essence the surface of the outerarea of the MOF structure. One therefore has to conclude thatthese MOFs 1−4 can be considered as not porous. This canindeed be seen in the crystal structure of 4, where thecoordinating DMF molecules, together with solvent (guest)
Figure 7. Packing diagram, showing the 3D framework of the structure of compound 5, down the crystallographic b-axis, with coordinationpolyhedra indicated. Hydrogen atoms are omitted for clarity.
Inorganic Chemistry Article
dx.doi.org/10.1021/ic301544q | Inorg. Chem. 2012, 51, 11623−1163411628

DMF molecules and a coordinating water molecule, in fact fillup the voids that would otherwise have been responsible for theporosity of the resulting material. The DMF guest moleculesare notoriously hard to remove, but the DMF molecules thatcoordinate to the Eu-ions are even harder to remove. Thismeans that, in practice, these MOFs cannot be considered to beporous materials, even though the void volume can becalculated, hypothetically removing the molecules that arepresent in the channels.
Luminescence Measurements. Compounds 1−5 allcontain lanthanides, so they could have interesting luminescentproperties, as the trivalent lanthanide ions are well-known fortheir linelike and color-pure emission, both in the UV−vis andthe near-infared regions of the electromagnetic spectrum.35−37
Indeed, luminescent lanthanide−organic frameworks arefrequently reported in scientific literature, often in high-impactjournals.17,38−40
Even though the majority of the reported lanthanide-MOFsare based on di- or tricarboxylate linkers, which are notnecessarily the best ligands for sensitizing the lanthanide ions’luminescence, there have already been very promising resultsnevertheless. The materials reported in this Article all show thetypical lanthanide-based luminescence too, although weak forthe neodymium-compounds 2 and 5, but reasonably strong forthe praseodymium and samarium compounds 1 and 3 andstrong enough to be seen by the naked eye under illuminationwith a standard laboratory UV-lamp for the europiumcompound 4 (see Table of Contents graphic).The combined excitation−emission spectra for compounds
1−5 are given in Figures 11−14, and the assignment of theobserved electronic transitions can be found in Table 2. Thepresence of the typical 4f−4f transitions is obvious fromlooking at the emission spectra.41,42 For europium compound4, this is not very remarkable, as this is by far the most widelystudied luminescent lanthanide ion, showing luminescence thatcan be so intense that it can be seen under sunlightillumination. It is nevertheless interesting to point out thattransitions in the excitation spectrum of 4 are identified as
Figure 8. Overview of the calculated (solid black line) andexperimental (red dots) Bragg−Brentano (θ, 2θ) XRD patterns. (a)Calculated pattern for 4 based on the crystal structure (calculationperformed using Mercury 3.0). (b) Calculated pattern for 4 based onthe crystal structure, excluding the low Z elements in the calculation(calculation performed using Mercury 3.0). (c) Experimental andsimulated pattern (using MAUD) for 4. The shift as compared to thecalculated pattern is due to the difference in temperature (100 K inpart a, RT in part c). (d) Experimental and simulated pattern (usingMAUD) for 1. (e) Experimental and simulated pattern (using MAUD)for 2. (f) Experimental and simulated pattern (using MAUD) for 3.
Figure 9. Crystal structure of 4 along the [1, 1, 1] direction, togetherwith the lattice planes containing Eu atoms which have a strongcontribution to the Bragg−Brentano (θ, 2θ) XRD spectra at lowangles.
Figure 10. Lattice parameters as a function of the cation radius of thelanthanide ion.
Inorganic Chemistry Article
dx.doi.org/10.1021/ic301544q | Inorg. Chem. 2012, 51, 11623−1163411629

coming from the 7F0 ground level, as well as from the firstexcited state 7F1. This can be explained by looking at the energylevel scheme in Figure 15: the 7F1 level is only about 360 cm
−1
above the 7F0 ground state, which means that, in accordancewith the Boltzmann distribution of a number of particles at agiven temperature, about one-third of the valence electrons inthe europium ions are in the 7F1 excited state, leaving two-thirds in the 7F0 ground state.Far less common than europium luminescence are the
spectra of samarium compound 3, as this ion is much harder topersuade to luminesce than europium or terbium, anotherwidely studied lanthanide ion. The near-infrared (NIR)emission of the trivalent neodymium ion in materials 2 and 5has also been reported before in Nd-containing MOFs, showingthe typical 1064 nm (or thereabout) line which is used in aNd:YAG laser. To the best of our knowledge, though, this isonly the second time that praseodymium luminescence isreported in a carboxylate-based Pr-containing MOF such as 1.Very recently, a paper was published by Feng et al. describing apraseodymium-containing carboxylate MOF based on depro-tonated 2-ethyl-1H-imidazole-4,5-dicarboxylic acid and oxalicacid as linkers. In this paper, a concise emission spectrum isshown, albeit less extended than ours, but the paper does notcontain an excitation spectrum.43 Trivalent praseodymium hastwo emissive electronic states: the 3P0 level, located at about 20
Figure 11. Excitation spectrum (blue, monitored at 643.5 nm) andemission spectrum (red, excited at 300 nm) of Pr-MOF 1. Forassignment of the electronic transitions labeled a−g, see Table 2.
Figure 12. Excitation spectrum (blue, monitored at 1056 nm for 2 andat 1061 nm for 5) and emission spectrum (red, excited at 300 nm forboth 2 and 5) of Nd-MOFs 2 (a) and 5 (b). For assignment of theelectronic transitions labeled a−h, see Table 2.
Figure 13. Excitation spectrum (blue, monitored at 598.1 nm) andemission spectrum (red, excited at 300 nm) of Sm-MOF 3. Forassignment of the electronic transitions labeled a-l, see Table 2.
Figure 14. Excitation spectrum (blue, monitored at 616.0 nm) andemission spectrum (red, excited at 300 nm) of Eu-MOF 4. Forassignment of the electronic transitions labeled a-l, see Table 2.
Inorganic Chemistry Article
dx.doi.org/10.1021/ic301544q | Inorg. Chem. 2012, 51, 11623−1163411630

700 cm−1, and the 1D2 level at about 16 400 cm−1 (see Figure15 for a simplified electronic energy level scheme). The factthat emission can occur from both levels can make theinterpretation of a Pr(III) emission spectrum rather cumber-some. We have nevertheless made an attempt at assigning thecorrect transitions to the observed peaks in the emissionspectrum (Table 2).The excitation spectra of compounds 2−5 all show 4f−4f
transitions as well, aside from a high-energy broad bandcentered at about 300 nm. The broad band at about 300 nmindicates that part of the excitation light is absorbed by thecarboxylate linker and subsequently transferred to thelanthanide ion, which then loses the energy by emitting lightat its typical wavelengths. As such, the carboxylate linker servesas an antenna, harvesting part of the excitation light forenhanced lanthanide emission; hence, this is called “theantenna effect”. The fact that also 4f−4f transitions are seenin the excitation spectra of 2−5, however, and the fact that
these are comparable in intensity to the broad band at 300 nm,indicates that the carboxylate linker is not a very good sensitizerfor lanthanide luminescence (otherwise the intensity of thebroad band would be several orders of magnitude larger thanthe 4f−4f transitions, which could even be indistinguishable inthe excitation spectrum). As a result, the luminescence shownby compounds 2−5 can just as well be obtained by exciting thelanthanide ion directly in its 2S+1LJ electronic energy levels,provided that these are at high enough energy to allow thetypical (longer wavelength) lanthanide emission to occur.The reason for the poor antenna properties of the
carboxylate linker can probably be found in the fact that itstriplet level is most likely at too high energy for efficient energytransfer to the emissive states of the lanthanide ions. We havenot been able to determine the triplet level of the terephthalatelinker ourselves (as our setup did not yet allow measurement oflow-temperature emission spectra), but we have been able tofind a value for this triplet energy in literature: Hilder and co-
Table 2. Assignment of Labeled Electronic Transitions shown in Figures 11 − 14 (Based on Carnall et al.)49,50
excitation emission
wavelength (nm) energy (cm−1) transition wavelength (nm) energy (cm−1) transition
Pr-MOF 1no f−f transitions observed a 483.3 20 690 3P0 →
3H4
b 525.1 19 045 3P0 →3H5
c 610.6 16 375 3P0 →3 H6
1D2 →3H4
d 643.6 15 535 3P0 →3F2
e 677.8 14 755 1D2 →3H5
f 697.2 14 345 3P0 →3F3
g 724.9 13 795 3P0 →3F4
Nd-MOF 2a 330.8 30 230 2L15/2,
4D7/2,2I13/2 ← 4I9/2 f 884.0 11 310 4F3/2 →
4I9/2b 354.4 28 220 4D3/2,
4D5/2,2I11/2,
4D1/2 g 1055.9 9470 4I11/2c 420.8 23 760 2D5/2 h 1330.8 7515 4I13/2d 430.9 23 210 2P1/2e 469.1 21 320 4G11/2,
2D3/2,2P3/2,
2G9/2,2K15/2
Sm-MOF 3a 344.8 29 000 4D7/2 ← 6H5/2 i 562.6 17 775 4G5/2 →
6H5/2
b 362.8 27 560 4D3/2,4D5/2,
6P5/2 j 598.1 16 720 6H7/2
c 376.0 26 595 6P7/2 k 645.0 15 505 6H9/2
d 390.7 25 600 4L15/2 l 702.9 14 225 6H11/2
e 403.2 24 805 6P3/2f 416.8 23 995 6P5/2,
4P5/2
g 441.2 22 665 4G9/2,4M17/2
h 472.0 21 185 4I13/2,4I11/2,
4 M15/2
Eu-MOF 4a 362.1 27 620 5D4 ← 7F0 h 579.0 17 270 5D0 →
7F0b 367.0 27 250 5D4 ← 7F1 i 592.5 16 880 7F1c 375.4 26 640 5G4 ← 7F0 j 616.0 16 235 7F2d 380.6 26 275 5G2 ← 7F0 k 652.3 15 330 7F3e 385.4 25 950 5G2 ← 7F1 l 700.0 14 285 7F4f 394.4 25 355 5L6 ← 7F0g 416.4 24 015 5D3 ← 7F1
Nd-MOF 5a not observed f 896.0 11 160 4F3/2 →
4I9/2b 356.3 28 070 4D3/2,
4D5/2,2I11/2,
4D1/2 ← 4I9/2 g 1061.3 9420 4I11/2c 418.6 23 890 2D5/2 h 1335.0 7490 4I13/2d 429.0 23 310 2P1/2e 468.5 21 345 4G11/2,
2D3/2,2P3/2,
2G9/2,2K15/2
Inorganic Chemistry Article
dx.doi.org/10.1021/ic301544q | Inorg. Chem. 2012, 51, 11623−1163411631

workers have determined it to be 23 256 cm−1 (we haveindicated the terephthalate triplet level with a green dashed linein Figure 15, labeled T1).
44 It can be seen from Figure 15 thatthe energy gap between this triplet level and the emissive levelsof Nd(III), Sm(III), and Eu(III) is large, giving nonradiativerelaxation pathways ample opportunity to channel away theenergy rather than transferring it to the Ln(III) ion.The situation for the praseodymium-MOF 1 is different.
From Figure 11, two things can be learned: first, the 4f−4ftransitions in the emission spectrum seem to be superimposedon a broad, featureless emission band, whereas this was not thecase in the emission spectra of the other compounds; second,the excitation spectrum does not contain any 4f−4f transition,but instead of that, contains a broad band located at about 375nm. These observations can be understood from looking at theenergy level diagram in Figure 15. For Pr-MOF 1, thedifference in energy between the terephthalate triplet level andthe accepting energy levels of the Pr(III) ion is now rathersmall, allowing back-energy-transfer from the Pr(III) levels tothe triplet level of the linker. As a consequence, this linker nowloses part of its energy by showing phosphorescence, which canbe seen as the broad band under the 4f−4f lines in the emissionspectrum. Thus, one has to conclude that whereas the linkertriplet level energy is too high for efficient sensitization ofNd(III), Sm(III) and Eu(III), it is too low for efficientsensitization of Pr(III).Next, a comparison can be made between the two Nd-MOFs
2 and 5 (Figure 12a,b). Whereas the emission spectra are rathersimilar (apart from a slightly higher noise level in part a), theexcitation spectra differ in the sense that the transition labeled“a” cannot be seen in the case of 5, but can be seen in the caseof 2. Instead, the broad band at short wavelengths seems to beslightly broader (or at least, shifted to longer wavelength andthus lower energies) in Figure 12b than in part a. If oneassumes that this high-energy broad band in the excitationspectra originates from ligand (linker) absorption (singlet S0 toexcited singlet S1), this would mean that the excited singletlevel S1 is at slightly lower energy in 5 than in 2. This could bean indication that also the triplet level T1 of the 2,5-PDC2‑
linker is located at slightly lower energy than that of the 1,4-BDC2‑ linker, although this is not necessarily the case. We havenot been able to find or determine a value for the 2,5-PDC2‑
triplet energy level, but it is probably a safe assumption thatsubstituting a carbon atom for a nitrogen atom in the phenylring of the linker would not have a very dramatic effect on thetriplet energy level of the resulting molecules.Further, one can have a look at one specific transition in the
emission spectrum of 4 in Figure 14: the peak(s) labeled “h”,corresponding to the 5D0 →
7F0 transition in the Eu(III) ion.This is a transition between two energy levels that are bothnondegenerate. This means that if one unique crystal site ispresent in the Eu(III)-containing material, this transitionshould be responsible for one peak only. Crystal field effectscannot split this peak into more subpeaks. This also means thatwhen more than one peak is encountered for this transition, itpoints to more than one crystallographic Eu(III) site beingpresent in the material. Close inspection of transition “h”reveals two separate peaks, which indeed corresponds to what isseen in the crystal structure (Figures 1 and 2): twocrystallographically different Eu(III) ions exist in compound 4.Finally, Table 3 lists the luminescence decay times that have
been recorded for compounds 1−5. The decay traces can be
found in the Supporting Information (Figures S4−S7). Alldecay curves could be fitted with a single exponential. Forcompound 4, this seems to contradict the fact that the twoEu(III) ions present in the crystal structure have a (slightly)different coordination environment, leading to the observationof two peaks for the 5D0 →
7F0 transition. In principle, whenthe two crystallographic environments would be sufficientlydifferent, it is assumed that each Eu(III) ion would have its owndecay profile, leading to the necessity of (at least) twoexponential terms to fit the decay curve. However, it is notunusual to have two (slightly) different sites with closely relatedtime-dependent luminescence behavior, resulting in a singleexponential term being able to fit the overall decay curve.The values of the observed decay times can be compared
with values obtained for other lanthanide complexes andMOFs; e.g., Bassett et al. find 0.46 ms for a Eu-containing bis-diketone complex, allbeit in a DMF matrix at 77 K (comparedwith our value of 0.475 ms for compound 4).45 In the samepaper, a value of 13 μs was found for the homologous Sm-complex in DMF (as compared to 11 μs for our compound 3),and a value of 1.5 μs was found for the Nd-homologue indeuterated DMF. We have published values for decay times ofNd-quinolinate complexes in the order of 0.5 μs, which alsocorrespond to the values reported here (0.43 μs for 2 and 0.32μs for 5).46 Finding luminescence decay times for apraseodymium-based coordination compound turns out notto be very easy, as most decay times have been reported for Pr-doped crystals and glasses. However, Voloshin et al. have statedthat the decay time of a series of Pr-chelates (betadiketonatesand carboxylates) in solution was shorter than the 4 μs
Figure 15. Simplified energy level diagram showing the mostimportant 2S+1LJ energy levels of Pr3+, Nd3+, Sm3+, and Eu3+ (basedon the historical work of W. T. Carnall),49,50 together with the tripletlevel T1 of the 1,4-BDC2‑ linker.44.
Table 3. Luminescence Decay Times τ for Compounds 1−5
compd Ln3+ ion linker τ/μs
1 Pr3+ 1,4-BDC2‑ 112 Nd3+ 1,4-BDC2‑ 0.433 Sm3+ 1,4-BDC2‑ 114 Eu3+ 1,4-BDC2‑ 4755 Nd3+ 2,5-PDC2‑ 0.32
Inorganic Chemistry Article
dx.doi.org/10.1021/ic301544q | Inorg. Chem. 2012, 51, 11623−1163411632

detection limit of their setup.47 Mahlik et al. reported decaytimes between 23 and 6.5 μs as a function of pressure in aGd3Ga5O12:Pr
3+ crystal.48 In that respect, our value of 11 μs forcompound 1 compares well with the reported literature values.The best way to compare the luminescence efficiency of the
coordination polymers reported in this work with other MOFsthat have been reported is to compare the quantum yields Q(other symbols that are being used for quantum yield are Φ orη). Theoretically, the quantum yield is defined as the ratio ofthe amount of emitted photons to the amount of absorbedphotons. When a rare-earth ion is directly excited in one of its2S+1LJ energy levels, this quantum yield can also be written asthe ratio between the observed luminescence decay time τ andthe radiative “natural” decay time τR of that specific lanthanideion.An excellent literature source on luminescent lanthanide-
containing MOFs is the very recent review by Cui et al.39 Inthis review, an overview is given of luminescent MOFs, amongwhich is the specific class of luminescent lanthanide MOFs.However, when looking through the references given in thisreview, it is clear that very few papers mention the quantumyield of the observed luminescence. A little more common (butstill rather rare) is the mentioning of the observedluminescence decay time τ. Most papers only report a steadystate emission spectrum, from which it is impossible tocompare intensities in a reliable way. As a result, we havelooked for published luminescence decay time values, in orderto compare these with the values obtained for our materials.(Strictly speaking, for a lanthanide complex in which the ligandsare used to harvest the excitation light, one has to take intoaccount also the efficiency of the intersystem crossing (from theligand excited singlet state S1 to excited triplet state T1), as wellas the efficiency of the triplet T1 to Ln excited state energytransfer). However, as a crude approximation, one can state thatthe longer the observed luminescence decay time is, the moreefficient the luminescent material is.In Cui’s review, no praseodymium MOFs have been
included, as the first one was only reported a few monthsago. However, this paper did not mention a luminescence decaytime. As such, we cannot compare the efficiency of ourpraseodymium MOF 1 with other luminescent praseodymiumMOFs. The review contains six references to luminescentneodymium MOFs. However, also here, none contains aquantum yield or a luminescence decay time. As such, wecannot compare the efficiency of our neodymium MOFs 2 and5 with others. The review contains only three references toluminescent samarium MOFs, but none reports a quantumyield or a decay time, so comparison of our luminescentsamarium MOF 3 is not possible either. Predictably, the reviewcontains many (25 to be exact) references to luminescenteuropium MOFs, as these have been most widely studied. Nineof these references contain luminescent decay times, rangingfrom 0.344 ms to above 2 ms. Of these nine references, threedeal with terephthalate linkers, just as in our europium MOF 4.The reported luminescence decay times range between 0.344and 0.47 ms (hydrated europium terephthalate MOFs) to 0.94ms (anhydrous europium terephthalate MOF). Thus, the decaytime value of 0.475 ms for our (hydrated) europiumterephthalate MOF 4 compares very well with earlier reportedliterature values.
■ CONCLUSIONIn conclusion, we have reported a hitherto unknown crystalstructure from a europium terephthalate MOF and threeisostructural rare-earth MOFs containing the light lanthanidespraseodymium, neodymium, and samarium. This new crystalstructure is most likely a consequence of the larger ionic radiusof these light lanthanide ions, rather than of the slightly alteredsynthesis procedure that was followed. Rietveld refinement wasused to prove that the powder XRD pattern at low 2θ values isentirely dominated by the heavy elements, and as such,evidence was gathered that the praseodymium, neodymium,and samarium MOFs based on the terephthalate linker areisostructural with the reported crystal structure of the europiumterephthalate MOF.Aside from the terephthalate-based MOFs described above, a
2,5-pyridinedicarboxylate-based neodymium MOF was alsosynthesized, which turned out to have an identical crystalstructure to that of previously reported MOFs that had beensynthesized following the same procedure.An in-depth luminescence study showed that the tereph-
thalate linker is not really a very good sensitizer of lanthanideluminescence (with possible exception of europium), butnevertheless, rare emission spectra of praseodymium andsamarium MOFs have been collected. A comparison wasmade between the luminescence behavior of the terephthalate-based and the 2,5-pyridinedicarboxylate-based neodymiumMOFs, but the observed near-infrared emission was weak inboth cases.
■ ASSOCIATED CONTENT*S Supporting InformationFT-IR spectra of compounds 1−5; TGA trace of compound 4;fitted luminescence decay curves of compounds 1−5. Thismaterial is available free of charge via the Internet at http://pubs.acs.org.
CCDC-891471 and CCDC-891472 contain the supple-mentary crystallographic data for this paper and can beobtained free of charge via www.ccdc.cam.ac.uk/conts/retrieving.html (or from the Cambridge Crystallographic DataCentre, 12 Union Road, Cambridge CB2 1EZ, U.K., fax: +44-1223-336033 or e-mail [email protected]).
■ AUTHOR INFORMATIONCorresponding Author*E-mail: [email protected]. Phone: +3292644420. Fax:+3292644983.NotesThe authors declare no competing financial interest.
■ ACKNOWLEDGMENTSR.V.D. thanks the Hercules Foundation (Project AUGE/09/024 “Advanced Luminescence Setup”) and Ghent University(BOF Project 01N01010) for financial support. P.V.D.V.acknowledges Ghent University (GOA Grant 01G00710 andBAS Grant 01B00608). R.V.D. and P.V.D.V. thank the FWO-Flanders (Research Project G.0081.10N).
■ REFERENCES(1) Eddaoudi, M.; Kim, J.; Rosi, N.; Vodak, D.; Wachter, J.; O’Keeffe,M.; Yaghi, O. M. Science 2002, 295, 469−472.(2) Rosi, N. L.; Eckert, J.; Eddaoudi, M.; Vodak, D. T.; Kim, J.;O’Keeffe, M.; Yaghi, O. M. Science 2003, 300, 1127−1129.
Inorganic Chemistry Article
dx.doi.org/10.1021/ic301544q | Inorg. Chem. 2012, 51, 11623−1163411633

(3) Ockwig, N. W.; Delgado-Friedrichs, O.; O’Keeffe, M.; Yaghi, O.M. Acc. Chem. Res. 2005, 38, 176−182.(4) Li, J. R.; Kuppler, R. J.; Zhou, H. C. Chem. Soc. Rev. 2009, 38,1477−1504.(5) Chae, H. K.; Siberio-Perez, D. Y.; Kim, J.; Go, Y.; Eddaoudi, M.;Matzger, A. J.; O’Keeffe, M.; Yaghi, O. M. Nature 2004, 427, 523−527.(6) Lee, J.; Farha, O. K.; Roberts, J.; Scheidt, K. A.; Nguyen, S. T.;Hupp, J. T. Chem. Soc. Rev. 2009, 38, 1450−1459.(7) Ferey, G. Chem. Soc. Rev. 2008, 37, 191−214.(8) Hong, D. Y.; Hwang, Y. K.; Serre, C.; Ferey, G.; Chang, J. S. Adv.Funct. Mater. 2009, 19, 1537−1552.(9) Llewellyn, P. L.; Maurin, G.; Devic, T.; Loera-Serna, S.;Rosenbach, N.; Serre, C.; Bourrelly, S.; Horcajada, P.; Filinchuk, Y.;Ferey, G. J. Am. Chem. Soc. 2008, 130, 12808−12814.(10) Fang, Q. R.; Zhu, G. S.; Xue, M.; Zhang, Q. L.; Sun, J. Y.; Guo,X. D.; Qiu, S. L.; Xu, S. T.; Wang, P.; Wang, D. J.; Wei, Y. Chem.Eur.J. 2006, 12, 3754−3758.(11) Eddaoudi, M.; Moler, D. B.; Li, H. L.; Chen, B. L.; Reineke, T.M.; O’Keeffe, M.; Yaghi, O. M. Acc. Chem. Res. 2001, 34, 319−330.(12) Tranchemontagne, D. J. L.; Ni, Z.; O’Keeffe, M.; Yaghi, O. M.Angew. Chem., Int. Ed. 2008, 47, 5136−5147.(13) Tranchemontagne, D. J.; Mendoza-Cortes, J. L.; O’Keeffe, M.;Yaghi, O. M. Chem. Soc. Rev. 2009, 38, 1257−1283.(14) Champness, N. R. Dalton Trans. 2006, 877−880.(15) Reineke, T. M.; Eddaoudi, M.; Fehr, M.; Kelley, D.; Yaghi, O.M. J. Am. Chem. Soc. 1999, 121, 1651−1657.(16) Reineke, T. M.; Eddaoudi, M.; O’Keeffe, M.; Yaghi, O. M.Angew. Chem., Int. Ed. 1999, 38, 2590−2594.(17) White, K. A.; Chengelis, D. A.; Gogick, K. A.; Stehman, J.; Rosi,N. L.; Petoud, S. J. Am. Chem. Soc. 2009, 131, 18069−18070.(18) CrysAlis PRO, Version 1.171.34.34; Agilent Technologies UKLtd.: Yarnton, U.K., 2010.(19) Sheldrick, G. M. Acta Crystallogr. 2008, A64, 112−122.(20) SHELXTL-NT, Manual Version 5.1; Bruker Analytical X-raySystems Inc.: Madison, WI, 1997.(21) Guo, X.; Zhu, G.; Sun, F.; Li, Z.; Zhao, X.; Li, X.; Wang, H.;Qiu, S. Inorg. Chem. 2006, 45, 2581−2587.(22) Na, L.; Hua, R.; Zhang, L.; Zhang, W.; Ning, G. J. Chem.Crystallogr. 2009, 39, 688−691.(23) Huang, Y.; Song, Y.-S.; Yan, B.; Shao, M. J. Solid State Chem.2008, 181, 1731−1737.(24) Qin, C.; Wang, X.-L.; Wang, E.-B; Su, Z.-M. Inorg. Chem. 2005,44, 7122−7129.(25) Allen, F. H. Acta Crystallogr. 2002, B58, 380−388.(26) Macrae, C. F.; Bruno, I. J.; Chisholm, J. A.; Edgington, P. R.;McCabe, P.; Pidcock, E.; Rodriguez-Monge, L.; Taylor, R.; van deStreek, J.; Wood, P. A. J. Appl. Crystallogr. 2008, 41, 466−470.(27) Zhang, Z.-H.; Wan, S.-Y.; Okamura, T.; Sun, W.-Y.; Ueyama, N.Z. Anorg. Allg. Chem. 2006, 632, 679−683.(28) Zhang, W.-Z. Acta Crystallogr. 2006, E62, m1600−m1602.(29) Chen, B.; Yang, Y.; Zapata, F.; Qian, G.; Luo, Y.; Zhang, J.;Lobkovsky, E. B. Inorg. Chem. 2006, 45, 8882−8886.(30) He, H.; Yuan, D.; Ma, H.; Sun, D.; Zhang, G.; Zhou, H.-C.Inorg. Chem. 2010, 49, 7605−7607.(31) Zhang, Y.; Yang, J.; Li, G.-D.; Zhang, F.; Chen, J.-S. J. Coord.Chem. 2008, 61, 945−955.(32) Han, Y.; Li, X.; Li, L.; Ma, C.; Shen, Z.; Song, Y.; You, X. Inorg.Chem. 2010, 49, 10781−10787.(33) Zhang, G.; Wang, Q.; Qian, Y.; Yan, G.; Ma, J. S. J. Mol. Struct.2006, 796, 187−194.(34) Shannon, R. D. Acta Crystallogr. 1976, A32, 751−767.(35) Bunzli, J. C. G.; Piguet, C. Chem. Soc. Rev. 2005, 34, 1048−1077.(36) Bunzli, J. C. G.; Piguet, C. Chem. Rev. 2002, 102, 1897−1928.(37) Bunzli, J. C. G. Acc. Chem. Res. 2006, 39, 53−61.(38) Allendorf, M. D.; Bauer, C. A.; Bhakta, R. K.; Houk, R. J. T.Chem. Soc. Rev. 2009, 38, 1330−1352.(39) Cui, Y. L.; Yue, Y. F.; Qian, G. D.; Chen, B. L. Chem. Rev. 2012,112, 1126−1162 and references therein.
(40) An, J. Y.; Shade, C. M.; Chengelis-Czegan, D. A.; Petoud, S.;Rosi, N. L. J. Am. Chem. Soc. 2011, 133, 1220−1223.(41) Gorller-Walrand, C.; Binnemans, K. Rationalization of Crystal-Field Parametrization. In Handbook on the Physics and Chemistry ofRare Earths; Gschneidner, K. A., Jr., Eyring, L., Eds.; Elsevier Science:Amsterdam, 1996; Vol. 23, Chapter 155, pp 121−284.(42) Gorller-Walrand, C.; Binnemans, K. Spectral Intensities of f-fTransitions. In Handbook on the Physics and Chemistry of Rare Earths;Gschneidner, K. A., Jr., Eyring, L., Eds.; Elsevier Science: Amsterdam,1998; Vol. 25, Chapter 167, pp 101−264.(43) Feng, X.; Wang, Y.-F.; Shi, Z.-Q.; Shang, J.-J.; Wang, L.-Y. Inorg.Chem. Commun. 2012, 22, 131−136.(44) Hilder, M.; Junk, P. C.; Kynast, U. H.; Lezhnina, M. M. J.Photochem. Photobiol., A 2009, 202, 10−20.(45) Bassett, A. P.; Magennis, S. W.; Glover, P. B.; Lewis, D. J.;Spencer, N.; Parsons, S.; Williams, R. M.; De Cola, L.; Pikramenou, Z.J. Am. Chem. Soc. 2004, 126, 9413−9424.(46) Van Deun, R.; Fias, P.; Nockemann, P.; Van Hecke, K.; VanMeervelt, L.; Binnemans, K. Eur. J. Inorg. Chem. 2007, 302−305.(47) Voloshin, A. I.; Shavaleev, N. M.; Kazakov, V. P. J. Lumin. 2001,93, 199−204.(48) Mahlik, S.; Malinowski, M.; Grinberg, M. Opt. Mater. 2011, 33,1525−1529.(49) Carnall, W. T.; Fields, P. R.; Rajnak, K. J. Chem. Phys. 1968, 49,4424−4442.(50) Carnall, W. T.; Fields, P. R.; Rajnak, K. J. Chem. Phys. 1968, 49,4450−4455.
Inorganic Chemistry Article
dx.doi.org/10.1021/ic301544q | Inorg. Chem. 2012, 51, 11623−1163411634


![Layered crystal structure of the trans(O 5O 6) isomer of potassium (1,3-propanediamine- N, N′-diacetato- N, N′-di-3-propionato)cobaltate(III) trihydrate, trans(O 5O 6)-K[Co(1,3-pddadp)]](https://static.fdokumen.com/doc/165x107/6324fa8f7fd2bfd0cb0338a5/layered-crystal-structure-of-the-transo-5o-6-isomer-of-potassium-13-propanediamine-.jpg)

