The role of cerium(III)/yttrium(III) nitrate hexahydrate salts on electroactive b phase nucleation...
10
The role of cerium(III)/yttrium(III) nitrate hexahydrate salts on electroactive b phase nucleation and dielectric properties of poly(vinylidene fluoride) thin films Pradip Thakur, Arpan Kool, Biswajoy Bagchi,† Nur Amin Hoque, Sukhen Das‡ * and Papiya Nandy Electroactive poly(vinylidene fluoride) (PVDF) thin films modified with Ce(NO 3 ) 3 $6H 2 O and Y(NO 3 ) 3 $6H 2 O (1–30 mass%) have been prepared via a simple solution casting method. The thermal stability and microstructures of the films were investigated using thermal gravimetric analysis techniques and field emission electron microscopy respectively. X-ray diffraction spectroscopy, Fourier transform infrared spectroscopy and differential scanning calorimetry confirmed the nucleation of the electroactive b phase in the composite films. Strong interfacial interaction i.e. ion dipole interaction via formation of hydrogen bonds between the water molecules of the salts and the polar –CF 2 dipoles of the polymer chains resulted in improved electroactive b phase nucleation and a large dielectric constant in PVDF films. 1. Introduction Recently, electroactive polymer thin lms have gained tremen- dous attention from researchers worldwide due to their excel- lent piezoelectric, pyroelectric, ferroelectric, dielectric and electro-optic properties. High exibility, simple fabrication processes and non-toxicity make these polymer lms a suitable alternate for traditional ferroelectric ceramics. 1–9 Poly(vinylidene uoride) [PVDF] and its copolymers like poly(vinylidene uoride-triuoroethylene) [P(VDF-TrFE)], poly- (vinylidene uoride-hexauoropropylene) [P(VDF-HFP)] etc. have been considered as prospective materials for versatile applications such as in sensors, actuators, non-volatile memo- ries in microelectronics, rail runs, piezoelectric nanogenerator, thin lm transistors, pulsed lasers, electric or hybrid vehicles, articial muscles, charge-storage devices due to their inspiring piezoelectric, pyroelectric, dielectric and ferroelectric properties. 1–10 Electroactive semicrystalline PVDF occurs in at least ve polymorphs like a, b, g, d and 3. But a, b and g polymorphs are most common crystalline phases of PVDF. Nonpolar a phase has TGTG 0 (T-trans, G-gauche + ,G 0 -gauche) dihedral conforma- tion which is thermodynamically stable. Electroactive or polar b and g phase have all trans (TTTT) and (TTTGTTTG 0 ) conformation respectively. 10,11 Among the polar b and g phases, mainly b phase show promising dielectric, ferroelectric, piezo- electric and pyroelectric properties. 10,11 So, improvement of the electroactive b-phase in PVDF is of great importance for the electronic and biomedical applications of this polymer. Currently, several research work have reported to improve the electroactive b phase nucleation in PVDF as well as its dielectric properties by incorporating llers like metal nanoparticles (NPs), 12–14 clays, 15–18 ceramics, 19,20 metal oxide NPs, 21 carbon black, 22 carbon nanotubes, 23,24 graphene, 25 inorganic salts, 26,27 quaternary phosphorus salt functionalized graphene, 28 ferrites, 29,30 carbon nanobers, 31–33 some other polymers 34,35 etc. However, literatures on the effect of rare earth salts on the crys- talline structures of PVDF as well as its dielectric properties are very scarce. Relatively large size and low capacity for covalent bond formation make these earth cations (R 3+ ) ions different in chemical properties from the transition metal cations like Fe 3+ , Al 3+ , Cr 3+ etc. Due to these properties, rare earth ions can form complexes via electrostatic i.e. ionic bond formation. 36,37 Previous reports have showed that the rare earth salts have a noticeable impact on the structural, optical and electrical properties of some polymers. 38–41 Recently, Hassen et al. prepared lanthanum(III) chloride (LaCl 3 ) doped PVDF lm by casting the mixture of PVDF in N,N-dimethylformamide and LaCl 3 in absolute ethanol. 42 They showed that the presence of LaCl 3 in PVDF increased the dielectric constant and alternating current (ac) conductivity. El-Sayed et al., also investigated the dielectric properties ErCl 3 or GdCl 3 (3 mass%) doped PVDF lms. However, little attention has been paid about the electroactive b phase nucleation mechanism and its direct effect on the enhancement of dielectric properties. Department of Physics, Jadavpur University, Kolkata-700032, India. E-mail: [email protected]; Tel: +91 9433091337 † Present address: Fuel Cell and Battery Division, Central Glass and Ceramic Research Institute, Kolkata-700032, India. ‡ Present address: Department of Physics, IIEST, Howrah, West Bengal-711103, India. Cite this: RSC Adv. , 2015, 5, 28487 Received 26th February 2015 Accepted 18th March 2015 DOI: 10.1039/c5ra03524d www.rsc.org/advances This journal is © The Royal Society of Chemistry 2015 RSC Adv. , 2015, 5, 28487–28496 | 28487 RSC Advances PAPER
-
Upload
independent -
Category
Documents
-
view
7 -
download
0
Transcript of The role of cerium(III)/yttrium(III) nitrate hexahydrate salts on electroactive b phase nucleation...
RSC Advances
PAPER
The role of ceriu
Department of Physics, Jadavpur Unive
[email protected]; Tel: +91 94330913
† Present address: Fuel Cell and BatteryResearch Institute, Kolkata-700032, India
‡ Present address: Department of PhysicsIndia.
Cite this: RSC Adv., 2015, 5, 28487
Received 26th February 2015Accepted 18th March 2015
DOI: 10.1039/c5ra03524d
www.rsc.org/advances
This journal is © The Royal Society of C
m(III)/yttrium(III) nitratehexahydrate salts on electroactive b phasenucleation and dielectric properties ofpoly(vinylidene fluoride) thin films
Pradip Thakur, Arpan Kool, Biswajoy Bagchi,† Nur Amin Hoque, Sukhen Das‡*and Papiya Nandy
Electroactive poly(vinylidene fluoride) (PVDF) thin films modified with Ce(NO3)3$6H2O and Y(NO3)3$6H2O
(1–30 mass%) have been prepared via a simple solution casting method. The thermal stability and
microstructures of the films were investigated using thermal gravimetric analysis techniques and field
emission electron microscopy respectively. X-ray diffraction spectroscopy, Fourier transform infrared
spectroscopy and differential scanning calorimetry confirmed the nucleation of the electroactive b phase
in the composite films. Strong interfacial interaction i.e. ion dipole interaction via formation of hydrogen
bonds between the water molecules of the salts and the polar –CF2 dipoles of the polymer chains
resulted in improved electroactive b phase nucleation and a large dielectric constant in PVDF films.
1. Introduction
Recently, electroactive polymer thin lms have gained tremen-dous attention from researchers worldwide due to their excel-lent piezoelectric, pyroelectric, ferroelectric, dielectric andelectro-optic properties. High exibility, simple fabricationprocesses and non-toxicity make these polymer lms a suitablealternate for traditional ferroelectric ceramics.1–9
Poly(vinylidene uoride) [PVDF] and its copolymers likepoly(vinylidene uoride-triuoroethylene) [P(VDF-TrFE)], poly-(vinylidene uoride-hexauoropropylene) [P(VDF-HFP)] etc.have been considered as prospective materials for versatileapplications such as in sensors, actuators, non-volatile memo-ries in microelectronics, rail runs, piezoelectric nanogenerator,thin lm transistors, pulsed lasers, electric or hybrid vehicles,articial muscles, charge-storage devices due to their inspiringpiezoelectric, pyroelectric, dielectric and ferroelectricproperties.1–10
Electroactive semicrystalline PVDF occurs in at least vepolymorphs like a, b, g, d and 3. But a, b and g polymorphs aremost common crystalline phases of PVDF. Nonpolar a phasehas TGTG0 (T-trans, G-gauche+, G0-gauche) dihedral conforma-tion which is thermodynamically stable. Electroactive or polarb and g phase have all trans (TTTT) and (TTTGTTTG0)
rsity, Kolkata-700032, India. E-mail:
37
Division, Central Glass and Ceramic.
, IIEST, Howrah, West Bengal-711103,
hemistry 2015
conformation respectively.10,11 Among the polar b and g phases,mainly b phase show promising dielectric, ferroelectric, piezo-electric and pyroelectric properties.10,11 So, improvement of theelectroactive b-phase in PVDF is of great importance for theelectronic and biomedical applications of this polymer.
Currently, several research work have reported to improve theelectroactive b phase nucleation in PVDF as well as its dielectricproperties by incorporating llers like metal nanoparticles(NPs),12–14 clays,15–18 ceramics,19,20 metal oxide NPs,21 carbonblack,22 carbon nanotubes,23,24 graphene,25 inorganic salts,26,27
quaternary phosphorus salt functionalized graphene,28
ferrites,29,30 carbon nanobers,31–33 some other polymers34,35 etc.However, literatures on the effect of rare earth salts on the crys-talline structures of PVDF as well as its dielectric properties arevery scarce. Relatively large size and low capacity for covalentbond formation make these earth cations (R3+) ions different inchemical properties from the transition metal cations like Fe3+,Al3+, Cr3+ etc. Due to these properties, rare earth ions can formcomplexes via electrostatic i.e. ionic bond formation.36,37 Previousreports have showed that the rare earth salts have a noticeableimpact on the structural, optical and electrical properties of somepolymers.38–41 Recently, Hassen et al. prepared lanthanum(III)chloride (LaCl3) doped PVDF lm by casting the mixture of PVDFin N,N-dimethylformamide and LaCl3 in absolute ethanol.42 Theyshowed that the presence of LaCl3 in PVDF increased thedielectric constant and alternating current (ac) conductivity.El-Sayed et al., also investigated the dielectric properties ErCl3 orGdCl3 (3 mass%) doped PVDF lms. However, little attention hasbeen paid about the electroactive b phase nucleationmechanismand its direct effect on the enhancement of dielectric properties.
RSC Adv., 2015, 5, 28487–28496 | 28487

RSC Advances Paper
The present work involves fabrication of cerium(III)/yttriu-m(III) nitrate hexahydrate (Ce(NO3)3$6H2O and Y(NO3)3$6H2O)(1–30mass%) doped PVDF thin lms by simple solution castingmethod. The signicant role of the rare earth salts on theimprovement of electroactive b nucleation and dielectric prop-erties of the modied PVDF thin lms have been investigatedand discussed in terms of interfacial phenomena.
2. Experimental2.1. Materials
The materials used in the study are poly(vinylidene uoride)(PVDF) pellets (Aldrich, Germany.Mw: 180 000 GPC,Mn: 71 000),cerium(III) nitrate hexahydrate (Ce(NO3)3$6H2O) (Acros Organics,India), yttrium(III) nitrate hexahydrate (Y(NO3)3$6H2O) (AcrosOrganics, India), dimethyl sulfoxide (DMSO) (Merck, India).
2.2. Fabrication of cerium/yttrium nitrate hexahydratesalt–PVDF thin lms
Initially, 0.4 g of PVDF was dissolved in 8 ml DMSO at 60 �C toform a clear solution. Then desired amount of Ce(NO3)3$6H2Oor Y(NO3)3$6H2O (1–30 mass%) was added to the PVDF solu-tion and magnetically stirred for 12 hours at 60 �C followed byultrasonication (30 min) under ambient condition. Themixture was then cast on a clean Petri dish to obtain the lmand heated at 80 �C in a dust free oven for 12 hours forcomplete evaporation of the solvent. Pure PVDF lm was alsoprepared without adding any salts under same conditions. Thethickness of the lms was in the range of 50–60 mm. Allsamples were stored in a vacuum desiccator for further char-acterization. Sample designations are tabulated as follows(Table 1).
2.3. Instrumentation
2.3.1. Thermal gravimetric analysis (TGA). Thermal gravi-metric analysis (TGA) was performed using a TGA/SDTA851e
(Mettler Toledo AG) under nitrogen atmosphere with a constantow rate of 40 ml min�1 using ceramic crucibles having 70 ml
Table 1 Sample designations showing respective compositions
Sample nameAmountof PVDF (g)
Percentageof salts(mass%)
Amountof salts (g)
Name of thesalt addedto PVDF
PVDF 0.4 0 0PCe 1 0.4 1 0.004 Ce(NO3)3$6H2OPCe 5 0.4 5 0.020PCe 10 0.4 10 0.040PCe 20 0.4 20 0.080PCe 30 0.4 30 0.120PY 1 0.4 1 0.004 Y(NO3)3$6H2OPY 5 0.4 5 0.020PY 10 0.4 10 0.040PY 20 0.4 20 0.080PY 30 0.4 30 0.120
28488 | RSC Adv., 2015, 5, 28487–28496
capacity. The samples were heated from 50 �C to 600 �C at aheating rate of 10 �C min�1.
2.3.2. Field emission scanning electron microscopy(FESEM). The morphology and microstructure of the thin lmswere observed using eld emission electron microscope(FESEM) (INSPECT F50, Netherland).
2.3.3. X-ray diffraction (XRD). The XRD patterns of thelms were recorded by X-ray diffractometer (Model-D8, BrukerAXS Inc., Madison, WI) with 2q varying from 10� to 40� and ascan speed of 0.3 s per step using nickel ltered Cu-Ka radiationoperating under a voltage of 40 kV.
2.3.4. Fourier transform infrared spectroscopy (FTIR). Thelms were further characterized using FTIR (FTIR-8400S,Shimadzu) to determine the effect of salts addition on phasenucleation. The absorbance data of the lms with thickness50–60 mm were recorded in the wavenumber range from400 cm�1 to 1000 cm�1 with a resolution of 4 cm�1. 50 scanswere performed for each sample.
The fraction of b-phase (F(b)) in samples were calculatedusing Lambert–Beer law which is,
FðbÞ ¼ Ab�Kb
Ka
�Aa þ Ab
(1)
where, Aa and Ab are the absorbance at 764 cm�1 and 840 cm�1,respectively and Kb (7.7 � 104 cm2 mol�1) and Ka
(6.1 � 104 cm2 mol�1) are the absorption coefficients at therespective wavenumber.11,15,30
2.3.5. Differential scanning calorimetry (DSC). Thecrystallization and melting behaviour of the pure PVDF andcomposite thin lms were analysed using a differential scanningcalorimeter (DSC-60, Shimadzu, Singapore). The instrument wascalibrated with an indium standard and all the studies wereperformed under N2 gas atmosphere. All the samples wereheated from 80 �C to 200 �C at the rate of 10 �C min�1. Theenthalpies (DHm) of fusion or melting enthalpies of the sampleswere obtained by calculating the areas under the endothermicpeaks of the DSC curves. Then, the degree of crystallinity (Xc) ofthe samples was evaluated using the following equation:
Xc ¼ DHm/DH100% (2)
where, DHm is the heat of melting or enthalpy of fusion andDH100% is the melting enthalpy of 100% crystalline PVDF with avalue 104.6 J g�1.11,15
2.3.6. Dielectric properties measurements. The dielectricproperties were investigated using a digital LCR meter (Agilent,E4980A). The capacitance (C) and tangent loss (tan d) wererecorded in the frequency range 20 Hz to 2 MHz at roomtemperature applying 1 V ac voltage across the two oppositesurfaces of the samples. The dielectric constant (3) and the acconductivity (sac) of the samples were calculated usingfollowing eqn (3) and (4) respectively,
3 ¼ Cd/30A (3)
sac ¼ 2pf303 tan d (4)
This journal is © The Royal Society of Chemistry 2015

Fig. 1 TGA thermographs of pure PVDF and the salts loaded PVDF thin films; (a) Ce(NO3)3$6H2O loaded PVDF thin films and (b) Y(NO3)3$6H2Oloaded PVDF thin films.
Paper RSC Advances
where, d and A are the thickness and area of the samplesrespectively and f is the frequency in Hz applied across thesamples and 30 is permittivity of free space with value 8.854 �10�12 F m�1.11,15
3. Results and discussions3.1. Thermal gravimetric analysis (TGA)
Thermal stability of pure PVDF and salts doped PVDF thin lmshave been investigated by TGA thermographs. Fig. 1 shows theTGA thermographs of pure PVDF and composite thin lms.Only one single weight loss is observed at 430 �C for pure PVDFlm. The Ce(NO3)3$6H2O modied samples showed two stagemass loss: rst one is at 195 �C and the second one in the435–460 �C range with increasing doping concentration of thesalt (Fig. 1a). Y(NO3)3$6H2O doped PVDF lms exhibited similarpattern of mass losses occurring at 230 �C and 447 �C respec-tively for all samples (Fig. 1b).
The initial weight losses at 195 �C and 230 �C in thecomposite lms are due to thermal evolution of water of crys-tallization in the Ce(NO3)3$6H2O or Y(NO3)3$6H2O salts
Fig. 2 FESEM images of pure PVDF and the Ce(NO3)3$6H2O loaded PVD
This journal is © The Royal Society of Chemistry 2015
respectively. The shiing in thermo-degradation temperaturefrom 5 �C to 30 �C with increasing Ce(NO3)3$6H2O content inPVDFmatrix and to 27 �C for Y(NO3)3$6H2Omodied lms maybe attributed to the strong interaction between the polymerchains and the salts yielding thermal stability to the polymerchains closer to the salt interface.30,44
3.2. Field emission scanning electron microscopy (FESEM)
Fig. 2 and 3 shows the surface morphology and microstructureof pure PVDF and salts modied PVDF thin lms.
Themicrograph of pure PVDF thin lm shows domains withdiameter in the range 50–70 mm. Whereas in case ofCe(NO3)3$6H2O or Y(NO3)3$6H2O doped lms, clear formationof small spherical domains or spherulites with improvedsmoothness can be observed. The diameter of the spheruliteswas found to vary from 3 mm to 5 mm (Fig. 2 and 3). Generally,a and g phase dominant PVDF domains have diameter greaterthan 10 mm.14,45 Thus the formation of smaller spherulites(diameter � 3–5 mm) in PVDF may be attributed to theformation of electroactive b phase in the salts modied PVDFthin lms.14
F thin films (PCe 1, PCe 5, PCe 10, PCe 20 and PCe 30).
RSC Adv., 2015, 5, 28487–28496 | 28489
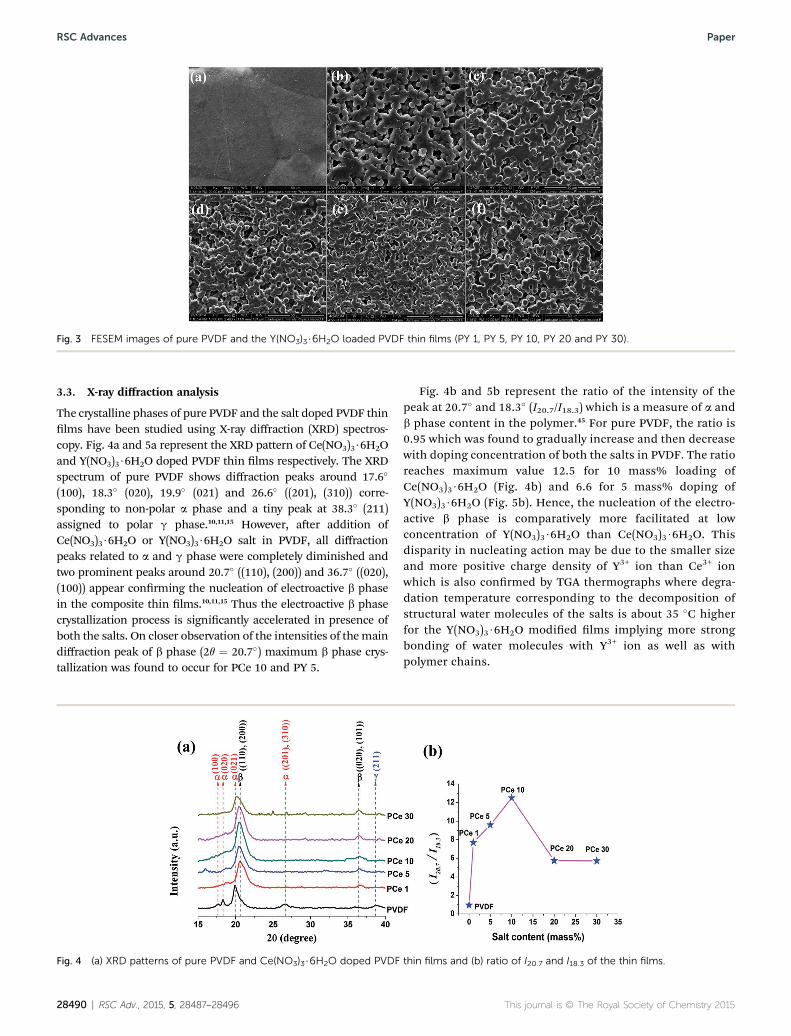
Fig. 3 FESEM images of pure PVDF and the Y(NO3)3$6H2O loaded PVDF thin films (PY 1, PY 5, PY 10, PY 20 and PY 30).
RSC Advances Paper
3.3. X-ray diffraction analysis
The crystalline phases of pure PVDF and the salt doped PVDF thinlms have been studied using X-ray diffraction (XRD) spectros-copy. Fig. 4a and 5a represent the XRD pattern of Ce(NO3)3$6H2Oand Y(NO3)3$6H2O doped PVDF thin lms respectively. The XRDspectrum of pure PVDF shows diffraction peaks around 17.6�
(100), 18.3� (020), 19.9� (021) and 26.6� ((201), (310)) corre-sponding to non-polar a phase and a tiny peak at 38.3� (211)assigned to polar g phase.10,11,15 However, aer addition ofCe(NO3)3$6H2O or Y(NO3)3$6H2O salt in PVDF, all diffractionpeaks related to a and g phase were completely diminished andtwo prominent peaks around 20.7� ((110), (200)) and 36.7� ((020),(100)) appear conrming the nucleation of electroactive b phasein the composite thin lms.10,11,15 Thus the electroactive b phasecrystallization process is signicantly accelerated in presence ofboth the salts. On closer observation of the intensities of themaindiffraction peak of b phase (2q ¼ 20.7�) maximum b phase crys-tallization was found to occur for PCe 10 and PY 5.
Fig. 4 (a) XRD patterns of pure PVDF and Ce(NO3)3$6H2O doped PVDF
28490 | RSC Adv., 2015, 5, 28487–28496
Fig. 4b and 5b represent the ratio of the intensity of thepeak at 20.7� and 18.3� (I20.7/I18.3) which is a measure of a andb phase content in the polymer.45 For pure PVDF, the ratio is0.95 which was found to gradually increase and then decreasewith doping concentration of both the salts in PVDF. The ratioreaches maximum value 12.5 for 10 mass% loading ofCe(NO3)3$6H2O (Fig. 4b) and 6.6 for 5 mass% doping ofY(NO3)3$6H2O (Fig. 5b). Hence, the nucleation of the electro-active b phase is comparatively more facilitated at lowconcentration of Y(NO3)3$6H2O than Ce(NO3)3$6H2O. Thisdisparity in nucleating action may be due to the smaller sizeand more positive charge density of Y3+ ion than Ce3+ ionwhich is also conrmed by TGA thermographs where degra-dation temperature corresponding to the decomposition ofstructural water molecules of the salts is about 35 �C higherfor the Y(NO3)3$6H2O modied lms implying more strongbonding of water molecules with Y3+ ion as well as withpolymer chains.
thin films and (b) ratio of I20.7 and I18.3 of the thin films.
This journal is © The Royal Society of Chemistry 2015

Fig. 5 (a) XRD patterns of pure PVDF and Y(NO3)3$6H2O doped PVDF thin films and (b) ratio of I20.7 and I18.3 of the thin films.
Fig. 6 (a) FTIR spectra of pure PVDF and Ce(NO3)3$6H2O doped PVDF thin films and (b) evaluation of b-phase content with increasingCe(NO3)3$6H2O content form IR spectra.
Fig. 7 (a) FTIR spectra of pure PVDF and Y(NO3)3$6H2O doped PVDF thin films and (b) evaluation of b-phase content with increasingY(NO3)3$6H2O content form IR spectra.
Paper RSC Advances
3.4. Fourier transform infrared spectroscopy
The nucleation of electroactive b phase in the lms was furtherinvestigated by Fourier transform infrared (FTIR) spectra.Fig. 6a and 7a represent the FTIR spectra of pure PVDF andCe(NO3)3$6H2O or Y(NO3)3$6H2O doped polymer. The
This journal is © The Royal Society of Chemistry 2015
absorbance spectrum of pure PVDF displays bands around488 cm�1 (CF2 waging) 532 cm�1 (CF2 bending), 614, 764 cm�1
(CF2 bending and skeletal bending) 795 and 975 cm�1
(CH2 rocking) assigned to a-phase and small band at 840 cm�1
(CH2 rocking, CF2 stretching and skeletal C–C stretching) is dueto b phase.10,11,15 Upon the addition of salt in PVDF, absorbance
RSC Adv., 2015, 5, 28487–28496 | 28491

Fig. 8 DSC thermographs of pure PVDF and the salts loaded PVDF thin films; (a) Ce(NO3)3$6H2O loaded PVDF thin films and (b) Y(NO3)3$6H2Oloaded PVDF thin films.
RSC Advances Paper
bands due to non-polar a phase almost vanished and charac-teristic absorbance bands corresponding to polar or electro-active b phase around 445 cm�1 (CF2 rocking and CH2 rocking),479 cm�1 (CF2 deformation) 510 cm�1 (CF2 stretching), 600cm�1 (CF2 wag) and 840 cm�1 (CH2 rocking, CF2 stretching andskeletal C–C stretching) started to emerge prominently.10,11,15
The intensity of electroactive b-PVDF bands notably increasedup to 10mass% doping of Ce(NO3)3$6H2O and 5mass% loadingof Y(NO3)3$6H2O in PVDF matrix respectively and then gotreduced at higher salt concentrations.
The relative fraction of b phase content (F(b)) in the saltloaded PVDF thin lms was evaluated using eqn (1) and thevariation of F(b) (%) with salt content (mass%) has beengraphically presented in Fig. 6b and 7b. The electroactive
Fig. 9 Evaluation of melting enthalpy (a, c) and degree of crystallinity (b, dfilms with increasing salts content from DSC thermographs.
28492 | RSC Adv., 2015, 5, 28487–28496
b phase content increased for all the salt concentrations. Butthe interesting fact is that 10 mass% Ce(NO3)3$6H2O is neededto reach F(b) value �82.3% (Fig. 2b) whereas only 5 mass%Y(NO3)3$6H2O was sufficient to achieve �81.8% of electroactiveb phase content in the composite lms. Thus, FTIR spectro-scopic data also conforms to the higher catalytic or nucleatingeffect of yttrium salt on the development of electroactiveb phase in the PVDF composite lms.
3.5. Differential scanning calorimetry
Differential scanning calorimetry (DSC), a complementarytechnique of XRD and FTIR was utilized for the verication ofthe different crystalline phases in PVDF. Fig. 8 represents the
) of pure PVDF and Ce(NO3)3$6H2O/Y(NO3)3$6H2Omodified PVDF thin
This journal is © The Royal Society of Chemistry 2015
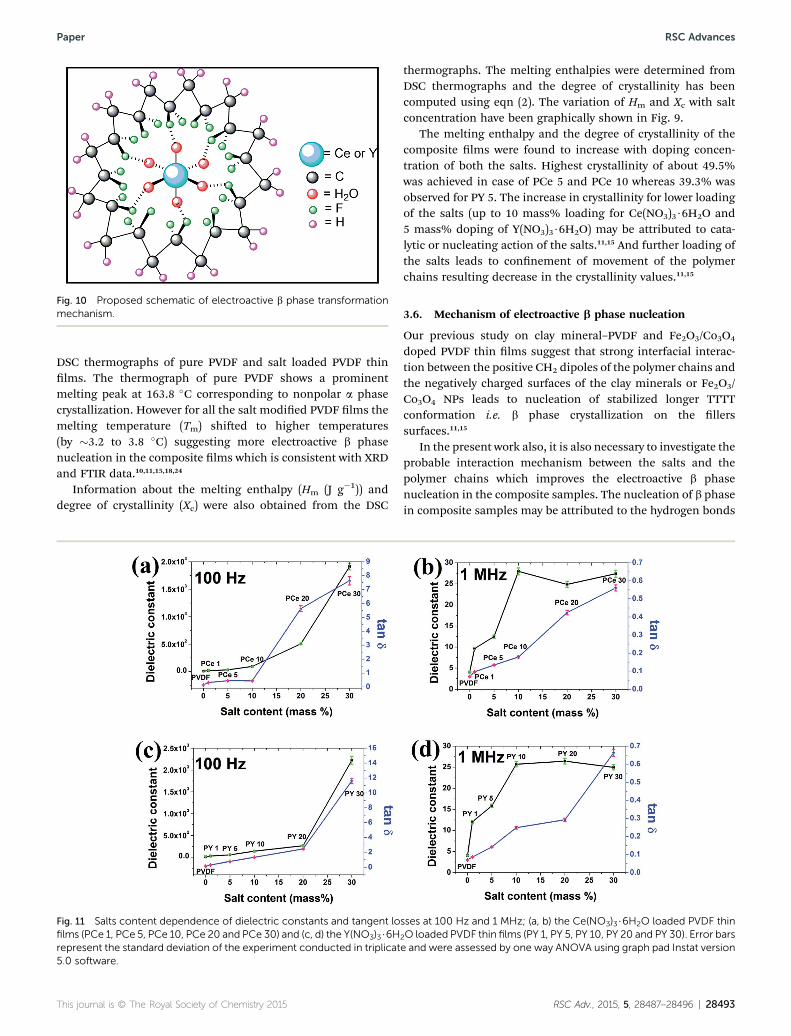
Fig. 10 Proposed schematic of electroactive b phase transformationmechanism.
Paper RSC Advances
DSC thermographs of pure PVDF and salt loaded PVDF thinlms. The thermograph of pure PVDF shows a prominentmelting peak at 163.8 �C corresponding to nonpolar a phasecrystallization. However for all the salt modied PVDF lms themelting temperature (Tm) shied to higher temperatures(by �3.2 to 3.8 �C) suggesting more electroactive b phasenucleation in the composite lms which is consistent with XRDand FTIR data.10,11,15,18,24
Information about the melting enthalpy (Hm (J g�1)) anddegree of crystallinity (Xc) were also obtained from the DSC
Fig. 11 Salts content dependence of dielectric constants and tangent lofilms (PCe 1, PCe 5, PCe 10, PCe 20 and PCe 30) and (c, d) the Y(NO3)3$6Hrepresent the standard deviation of the experiment conducted in triplicat5.0 software.
This journal is © The Royal Society of Chemistry 2015
thermographs. The melting enthalpies were determined fromDSC thermographs and the degree of crystallinity has beencomputed using eqn (2). The variation of Hm and Xc with saltconcentration have been graphically shown in Fig. 9.
The melting enthalpy and the degree of crystallinity of thecomposite lms were found to increase with doping concen-tration of both the salts. Highest crystallinity of about 49.5%was achieved in case of PCe 5 and PCe 10 whereas 39.3% wasobserved for PY 5. The increase in crystallinity for lower loadingof the salts (up to 10 mass% loading for Ce(NO3)3$6H2O and5 mass% doping of Y(NO3)3$6H2O) may be attributed to cata-lytic or nucleating action of the salts.11,15 And further loading ofthe salts leads to connement of movement of the polymerchains resulting decrease in the crystallinity values.11,15
3.6. Mechanism of electroactive b phase nucleation
Our previous study on clay mineral–PVDF and Fe2O3/Co3O4
doped PVDF thin lms suggest that strong interfacial interac-tion between the positive CH2 dipoles of the polymer chains andthe negatively charged surfaces of the clay minerals or Fe2O3/Co3O4 NPs leads to nucleation of stabilized longer TTTTconformation i.e. b phase crystallization on the llerssurfaces.11,15
In the present work also, it is also necessary to investigate theprobable interaction mechanism between the salts and thepolymer chains which improves the electroactive b phasenucleation in the composite samples. The nucleation of b phasein composite samples may be attributed to the hydrogen bonds
sses at 100 Hz and 1 MHz; (a, b) the Ce(NO3)3$6H2O loaded PVDF thin
2O loaded PVDF thin films (PY 1, PY 5, PY 10, PY 20 and PY 30). Error barse and were assessed by one way ANOVA using graph pad Instat version
RSC Adv., 2015, 5, 28487–28496 | 28493

RSC Advances Paper
formation between the water molecules of the salts and thepolar –CF2 dipoles of the polymer.27,46,47 Aer addition of salts inPVDF solution, the water molecules of the salts interact with thepolar –CF2 dipoles of PVDF. When the thin lms are formed at80 �C, the salts act as the substrate for b-phase nucleation.Thus, strong ion–dipole interaction between the polar CF2dipoles of PVDF and the water molecules of the salts promoteslonger alignment of stabilized all trans conformation i.e. elec-troactive b phase nucleation in Ce(NO3)3$6H2O orY(NO3)3$6H2O modied PVDF thin lms. The schematic forpossible b phase nucleation mechanism or interaction betweenthe salt and the polymer chains has been presented in Fig. 10.
3.7. Dielectric properties
3.7.1. Salt content dependence. Fig. 11 represents thevariation of dielectric constant and tangent loss (tan d) withincreasing salt concentration at two different frequencies:100 Hz and 1MHz. Improvement in dielectric constant with saltconcentration have been observed at 100 Hz. However, at1MHz, the dielectric constant increased up to 10mass% dopingfor both the salts and then almost stabilises at higher concen-trations. This enhancement of dielectric constant at lowerfrequency i.e. at 100 Hz may be due to the appearance of largeMaxwell–Wagner–Sillars (MWS) interfacial polarization11,15,48–51
i.e. large accumulation of space charges between the interfacesof the salts and the polymer chains at lower frequency (100 Hz)
Fig. 12 Frequency dependence of dielectric properties of pure PVDF andconstants, (b, d) tangent losses.
28494 | RSC Adv., 2015, 5, 28487–28496
shown schematically shown in Fig. 10. Upon the addition ofsalts in polymer, the salt molecules are well distributed andseparated from each other in PVDF matrix. The strong inter-action via formation of hydrogen bond between the water of saltmolecules and the polar –CF2 dipoles of polymer chains notonly improve the high dielectric b phase crystallization but alsoenhance the effective interfacial interfaces in the salts modiedpolymer samples. With increasing concentration of the saltcontent, the number of salt molecules and the interfacial areaper unit volume associated with the interface of salt moleculesand polymer chain increases while the inter-particle distancereduces. This enhances the average localized polarizationaccompanied with the salt molecules and the coupling betweenneighbouring polymer grains, which improves the dielectricconstant of the salts modied polymer lms.11,49
At higher frequency dielectric constant is mainly dominatedby dipolar polarization.11,48–51 As the variation of the electro-active b phase content (F(b)) in composite samples is small athigher concentration of the salt in polymer matrix (Fig. 6b and7b), so the number of dipoles do not vary much for thosesamples. Hence, the dielectric constant exhibits almost stablevalues for higher doping of the salt (10–30 mass%) at 1 MHz.Highest dielectric constant was found to be �2.2 � 103 and1.9� 103 at 100 Hz for 30 mass% loading of Ce(NO3)3$6H2O andY(NO3)3$6H2O in PVDF respectively. The results are quitepromising compared to previously reported dielectric constantdata by Hassen et al.42 and El-Sayed et al.43 Hassen et al.
Ce(NO3)3$6H2O/Y(NO3)3$6H2O doped PVDF thin films; (a, c) dielectric
This journal is © The Royal Society of Chemistry 2015
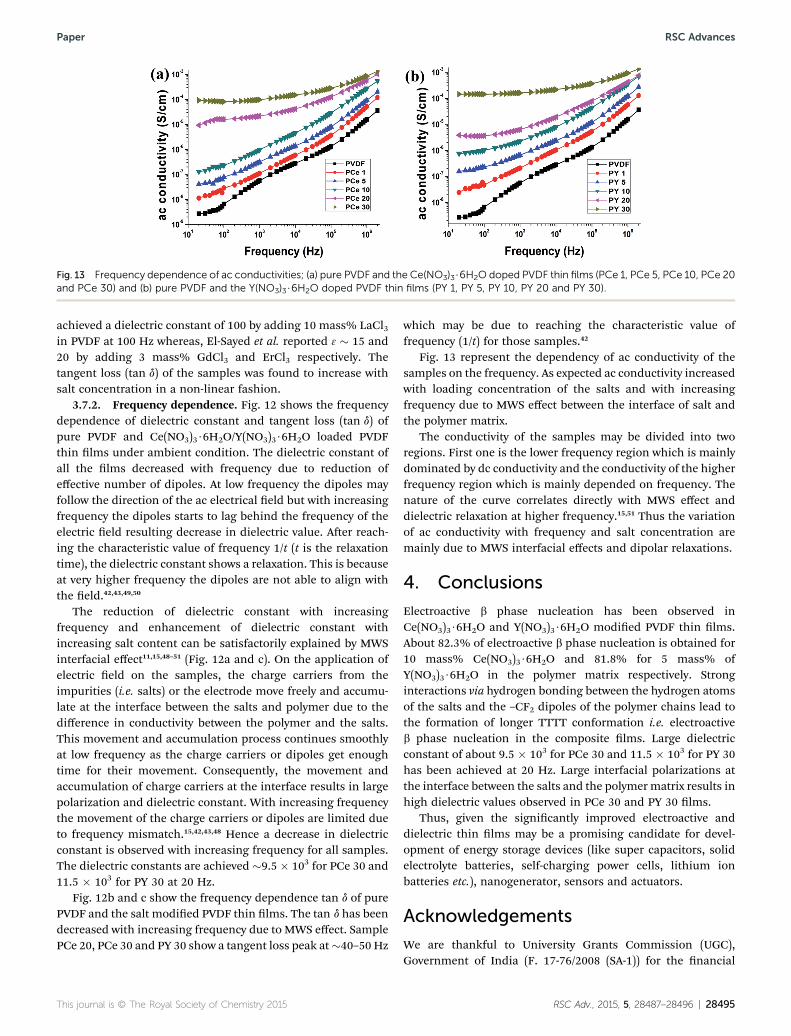
Fig. 13 Frequency dependence of ac conductivities; (a) pure PVDF and the Ce(NO3)3$6H2O doped PVDF thin films (PCe 1, PCe 5, PCe 10, PCe 20and PCe 30) and (b) pure PVDF and the Y(NO3)3$6H2O doped PVDF thin films (PY 1, PY 5, PY 10, PY 20 and PY 30).
Paper RSC Advances
achieved a dielectric constant of 100 by adding 10 mass% LaCl3in PVDF at 100 Hz whereas, El-Sayed et al. reported 3 � 15 and20 by adding 3 mass% GdCl3 and ErCl3 respectively. Thetangent loss (tan d) of the samples was found to increase withsalt concentration in a non-linear fashion.
3.7.2. Frequency dependence. Fig. 12 shows the frequencydependence of dielectric constant and tangent loss (tan d) ofpure PVDF and Ce(NO3)3$6H2O/Y(NO3)3$6H2O loaded PVDFthin lms under ambient condition. The dielectric constant ofall the lms decreased with frequency due to reduction ofeffective number of dipoles. At low frequency the dipoles mayfollow the direction of the ac electrical eld but with increasingfrequency the dipoles starts to lag behind the frequency of theelectric eld resulting decrease in dielectric value. Aer reach-ing the characteristic value of frequency 1/t (t is the relaxationtime), the dielectric constant shows a relaxation. This is becauseat very higher frequency the dipoles are not able to align withthe eld.42,43,49,50
The reduction of dielectric constant with increasingfrequency and enhancement of dielectric constant withincreasing salt content can be satisfactorily explained by MWSinterfacial effect11,15,48–51 (Fig. 12a and c). On the application ofelectric eld on the samples, the charge carriers from theimpurities (i.e. salts) or the electrode move freely and accumu-late at the interface between the salts and polymer due to thedifference in conductivity between the polymer and the salts.This movement and accumulation process continues smoothlyat low frequency as the charge carriers or dipoles get enoughtime for their movement. Consequently, the movement andaccumulation of charge carriers at the interface results in largepolarization and dielectric constant. With increasing frequencythe movement of the charge carriers or dipoles are limited dueto frequency mismatch.15,42,43,48 Hence a decrease in dielectricconstant is observed with increasing frequency for all samples.The dielectric constants are achieved �9.5 � 103 for PCe 30 and11.5 � 103 for PY 30 at 20 Hz.
Fig. 12b and c show the frequency dependence tan d of purePVDF and the salt modied PVDF thin lms. The tan d has beendecreased with increasing frequency due to MWS effect. SamplePCe 20, PCe 30 and PY 30 show a tangent loss peak at�40–50 Hz
This journal is © The Royal Society of Chemistry 2015
which may be due to reaching the characteristic value offrequency (1/t) for those samples.42
Fig. 13 represent the dependency of ac conductivity of thesamples on the frequency. As expected ac conductivity increasedwith loading concentration of the salts and with increasingfrequency due to MWS effect between the interface of salt andthe polymer matrix.
The conductivity of the samples may be divided into tworegions. First one is the lower frequency region which is mainlydominated by dc conductivity and the conductivity of the higherfrequency region which is mainly depended on frequency. Thenature of the curve correlates directly with MWS effect anddielectric relaxation at higher frequency.15,51 Thus the variationof ac conductivity with frequency and salt concentration aremainly due to MWS interfacial effects and dipolar relaxations.
4. Conclusions
Electroactive b phase nucleation has been observed inCe(NO3)3$6H2O and Y(NO3)3$6H2O modied PVDF thin lms.About 82.3% of electroactive b phase nucleation is obtained for10 mass% Ce(NO3)3$6H2O and 81.8% for 5 mass% ofY(NO3)3$6H2O in the polymer matrix respectively. Stronginteractions via hydrogen bonding between the hydrogen atomsof the salts and the –CF2 dipoles of the polymer chains lead tothe formation of longer TTTT conformation i.e. electroactiveb phase nucleation in the composite lms. Large dielectricconstant of about 9.5 � 103 for PCe 30 and 11.5 � 103 for PY 30has been achieved at 20 Hz. Large interfacial polarizations atthe interface between the salts and the polymer matrix results inhigh dielectric values observed in PCe 30 and PY 30 lms.
Thus, given the signicantly improved electroactive anddielectric thin lms may be a promising candidate for devel-opment of energy storage devices (like super capacitors, solidelectrolyte batteries, self-charging power cells, lithium ionbatteries etc.), nanogenerator, sensors and actuators.
Acknowledgements
We are thankful to University Grants Commission (UGC),Government of India (F. 17-76/2008 (SA-1)) for the nancial
RSC Adv., 2015, 5, 28487–28496 | 28495
RSC Advances Paper
assistance and Mr Nayim Sepay, Department of Chemistry,Jadavpur University for his fruitful suggestion in drawing thechemical structure of mechanism section.
References
1 T. T. Wang, J. M. Herbert and A. M. Glass, The Applications ofFerroelectric Polymers, Chapman and Hall, New York, 1988.
2 H. S. Nalwa, Ferroelectric Polymers: Chemistry, Physics andApplications, Marcel Dekker, New York, 1995.
3 A. J. Lovinger, Science, 1983, 220, 1115–1121.4 X. Zhou, B. Chu, B. Neese, M. Lin and Q. M. Zhang, IEEETrans. Dielectr. Electr. Insul., 2007, 14(5), 1133–1138.
5 Y. Lu, J. Claude, B. Neese, Q. M. Zhang and Q. Wang, J. Am.Chem. Soc., 2006, 128(25), 8120–8121.
6 N. Karawasa and W. A. Goddard III, Macromolecules, 1992,25(26), 7268–7281.
7 A. B. Silva, M. Arjmand, U. Sundararaj and R. E. S. Bretas,Polymer, 2014, 55, 226–234.
8 V. Tomer, E. Manias and C. A. Randall, J. Appl. Phys., 2011,110, 044107–044110.
9 D. Kim, S. Hong, J. Hong, Y. Y. Choi, J. Kim, M. Park, T. Sungand K. No, J. Appl. Polym. Sci., 2013, 130(6), 3842–3848.
10 P. Martins, A. C. Lopes and S. Lanceros-Mendez, Prog. Polym.Sci., 2013, 39(4), 683–706.
11 P. Thakur, A. Kool, B. Bagchi, S. Das and P. Nandy, Phys.Chem. Chem. Phys., 2015, 17, 1368–1378.
12 H. P. Xu and Z. M. Dang, Chem. Phys. Lett., 2007, 438(4–6),196–202.
13 K. S. Deepa, M. S. Gopika and J. James, Compos. Sci. Technol.,2013, 78, 18–23.
14 D. Mandal, K. Henkel and D. Schmeißer, Mater. Lett., 2012,73, 123–126.
15 P. Thakur, A. Kool, B. Bagchi, S. Das and P. Nandy, Appl. ClaySci., 2014, 99, 149–159.
16 D. Shah, P. Maiti, E. Gunn, D. Schmidt, D. D. Jiang andC. A. Batt, Adv. Mater., 2004, 16(14), 1173–1177.
17 T. U. Patro, M. V. Mhalgi, D. V. Khakhar and A. Misra,Polymer, 2008, 49(16), 3486–3499.
18 L. Priya and J. P. Jog, J. Appl. Polym. Sci., 2003, 89(8), 2036–2040.
19 P. Mishra and P. Kumar, Compos. Sci. Technol., 2013, 88, 26–32.
20 T. Zhou, J. W. Zha, R. Y. Cui, B. H. Fan, J. K. Yuan andZ. M. Dang, ACS Appl. Mater. Interfaces, 2011, 3(7), 2184–2188.
21 W. Wu, X. Huang, S. Li, P. Jiang and T. Toshikatsu, J. Phys.Chem. C, 2012, 116(47), 24887–24895.
22 Y. Konishi and M. Cakmak, Polymer, 2006, 47(15), 5371–5391.
23 S. L. Jiang, U. Yu, J. J. Xie, L. P. Wang, Y. K. Zeng and M. Fu,J. Appl. Polym. Sci., 2010, 116(2), 838–842.
24 A. Lund, C. Gustafsson, H. Bertilsson and W. Rychwalski,Compos. Sci. Technol., 2011, 71, 222–229.
25 Y. J. Li, M. Xu, J. Q. Feng and Z. M. Dang, Appl. Phys. Lett.,2006, 89(7), 072902–072905.
28496 | RSC Adv., 2015, 5, 28487–28496
26 R. Song, G. Xia, X. Xing, L. He, Q. Zhao and Z. Mad, J. ColloidInterface Sci., 2013, 401, 50–57.
27 Y. K. A. Low, L. Y. Tan, L. P. Tan, F. Y. C. Boey and K. W. Ng,J. Appl. Polym. Sci., 2013, 128(5), 2902–2910.
28 J. Wang, J. Wu, W. Xu, Q. Zhang and Q. Fu, Compos. Sci.Technol., 2014, 91, 1–7.
29 V. Sencadas, P. Martins, A. Pitaes, M. Benelmekki,J. L. G. Ribelles and S. Lanceros-Mendez, Langmuir, 2011,27(11), 7241–7249.
30 P. Martins, C. M. Costa, M. Benelmekki, G. Botelho andS. L. Mendez, CrystEngComm, 2012, 14(8), 2807–2811.
31 L. L. Sun, B. Li, Z. G. Zhang and W. H. Zhong, Eur. Polym. J.,2010, 46(11), 2112–2119.
32 L. L. Sun, B. Li, Y. Zhao, G. Mitchell and W. H. Zhong,Nanotechnology, 2010, 21(30), 305702–305710.
33 P. Costa, J. Silva, V. Sencadas, C. M. Costa, F. W. J. vanHattum and J. G. Rocha, Carbon, 2009, 47(11), 2590–2599.
34 T. U. Patro, M. V. Mhalgi, D. V. Khakhar and A. Misra,Polymer, 2008, 49, 3486–3490.
35 Y. J. Li, Y. Iwakura, L. Zhao and H. Shimizu,Macromolecules,2008, 41, 3120–3125.
36 M. Takahashi, Y. Hara, K. Aoshima, H. Kurihara,T. Oshikawa and M. Yamashita, Tetrahedron Lett., 2000, 41,8485–8488.
37 M. C. Silva, A. S. S. de Camargo, L. A. O. Nunes, R. A. Silvaand A. Marletta, J. Non-Cryst. Solids, 2008, 354, 5496–5503.
38 F. Xie and Z. Zheng, Phys. B, 2004, 349, 415–419.39 H. Suzuki, Y. Hattori, T. Lizuka, K. Yuzawa and
N. Matsumoto, Thin Solid Films, 2003, 438, 288.40 H. Huang and B. Yan,Mater. Sci. Eng., B, 2005, 117, 261–265.41 G. A. Kumar, Mater. Lett., 2002, 55, 364–369.42 A. Hassen, T. Hanafy, S. El-Sayed and A. Himanshu, J. Appl.
Phys., 2011, 110, 114119–114127.43 S. El-Sayed, T. A. Abdel-Baset and A. Hassen, AIP Adv., 2014,
4, 037114–037115.44 K. Pal, D. J. Kang, Z. X. Zhang and J. K. Kim, Langmuir, 2009,
26(5), 3609–3614.45 B. S. Ince-Gunduz, R. Alpern, D. Amare, J. Crawford,
B. Dolan, S. Jones, R. Kobylarz, M. Reveley and P. Cebe,Polymer, 2010, 51, 1485–1493.
46 B. P. Mandal, K. Vasundhara, E. Abdelhamid, G. Lawes,H. G. Salunke and A. K. Tyagi, J. Phys. Chem. C, 2014, 118,20819–20825.
47 M. Benz, W. B. Euler and O. J. Gregory,Macromolecules, 2002,35, 2682–2688.
48 Y. Li, X. Huang, Z. Hu, P. Jiang, S. Li and T. Tanaka, ACS Appl.Mater. Interfaces, 2011, 3(11), 4396–4403.
49 T. W. Dakin, IEEE Electr. Insul. Mag., 2006, 22(5), 11–28.50 A. Moliton, Applied Electromagnetism and Materials, Springer,
New York, 2007, ch. 3.51 A. C. Lopes, C. M. Costa, R. Sabater i Serra, I. C. Neves,
J. L. Gomez Ribelles and S. Lanceros-Mendez, Solid StateIonics, 2013, 235, 42–50.
This journal is © The Royal Society of Chemistry 2015