Effect of microstructure and composition on hydrogen ...
38
University of Wollongong University of Wollongong Research Online Research Online Faculty of Engineering and Information Sciences - Papers: Part A Faculty of Engineering and Information Sciences 1-1-2013 Effect of microstructure and composition on hydrogen permeation in X70 Effect of microstructure and composition on hydrogen permeation in X70 pipeline steels pipeline steels Ayesha J. Haq University Of Wollongong, [email protected] K Muzaka University of Wollongong, [email protected] D P. Dunne University of Wollongong, [email protected] A Calka University of Wollongong, [email protected] E V. Pereloma University of Wollongong, [email protected] Follow this and additional works at: https://ro.uow.edu.au/eispapers Part of the Engineering Commons, and the Science and Technology Studies Commons Recommended Citation Recommended Citation Haq, Ayesha J.; Muzaka, K; Dunne, D P.; Calka, A; and Pereloma, E V., "Effect of microstructure and composition on hydrogen permeation in X70 pipeline steels" (2013). Faculty of Engineering and Information Sciences - Papers: Part A. 527. https://ro.uow.edu.au/eispapers/527 Research Online is the open access institutional repository for the University of Wollongong. For further information contact the UOW Library: [email protected]
-
Upload
khangminh22 -
Category
Documents
-
view
1 -
download
0
Transcript of Effect of microstructure and composition on hydrogen ...

University of Wollongong University of Wollongong
Research Online Research Online
Faculty of Engineering and Information Sciences - Papers: Part A
Faculty of Engineering and Information Sciences
1-1-2013
Effect of microstructure and composition on hydrogen permeation in X70 Effect of microstructure and composition on hydrogen permeation in X70
pipeline steels pipeline steels
Ayesha J. Haq University Of Wollongong, [email protected]
K Muzaka University of Wollongong, [email protected]
D P. Dunne University of Wollongong, [email protected]
A Calka University of Wollongong, [email protected]
E V. Pereloma University of Wollongong, [email protected]
Follow this and additional works at: https://ro.uow.edu.au/eispapers
Part of the Engineering Commons, and the Science and Technology Studies Commons
Recommended Citation Recommended Citation Haq, Ayesha J.; Muzaka, K; Dunne, D P.; Calka, A; and Pereloma, E V., "Effect of microstructure and composition on hydrogen permeation in X70 pipeline steels" (2013). Faculty of Engineering and Information Sciences - Papers: Part A. 527. https://ro.uow.edu.au/eispapers/527
Research Online is the open access institutional repository for the University of Wollongong. For further information contact the UOW Library: [email protected]

Effect of microstructure and composition on hydrogen permeation in X70 Effect of microstructure and composition on hydrogen permeation in X70 pipeline steels pipeline steels
Abstract Abstract The influence of microstructure and composition on permeation of hydrogen in 1.2 and 0.5 wt.% Mn X70 pipeline steels after different processing was investigated using an electrochemical permeation technique. For 1.2 wt.% Mn (standard Mn) steel, the microstructure of normalised transfer bar was coarse equiaxed ferrite grains. This sample exhibited the highest diffusivity, followed by transfer bar, with a mixed ferriteebainitic ferrite microstructure; and hot rolled strip, with fine elongated ferrite grains. The 0.5 wt.% Mn (medium Mn) strip displayed lower diffusivity than the 1.2 wt.% Mn strip, due to hydrogen trapping by finer ferrite grains and a higher density of carbonitride precipitates. Moreover, the medium Mn strip exhibited a uniform microstructure and consequently similar diffusion coefficients for the edge and centreline regions, whereas the finer grains of the edge region of the standard Mn strip resulted in a lower diffusivity than the centreline region. Copyright © 2012, Hydrogen Energy Publications, LLC.
Keywords Keywords x70, permeation, steels, hydrogen, pipeline, composition, microstructure, effect
Disciplines Disciplines Engineering | Science and Technology Studies
Publication Details Publication Details Haq, A. J., Muzaka, K., Dunne, D. P., Calka, A. & Pereloma, E. V. (2013). Effect of microstructure and composition on hydrogen permeation in X70 pipeline steels. International Journal of Hydrogen Energy, 38 (5), 2544-2556.
This journal article is available at Research Online: https://ro.uow.edu.au/eispapers/527

1
Effect of Microstructure and Composition on Hydrogen
Permeation in X70 Pipeline Steels
Ayesha J. Haq, K. Muzaka, D.P. Dunne, A. Calka, E.V. Pereloma
School of Mechanical, Materials & Mechatronic Engineering, University of Wollongong,
Wollongong NSW 2522 Australia
Revised ManuscriptClick here to view linked References

2
Abstract
The influence of microstructure and composition on permeation of hydrogen in 1.2 and 0.5 wt.%
Mn X70 pipeline steels after different processing was investigated using an electrochemical
permeation technique.
For 1.2 wt.% Mn (standard Mn) steel, the microstructure of normalised transfer bar was coarse
equiaxed ferrite grains. This sample exhibited the highest diffusivity, followed by transfer bar,
with a mixed ferrite - bainitic ferrite microstructure; and hot rolled strip, with fine elongated
ferrite grains.
The 0.5 wt.% Mn (medium Mn) strip displayed lower diffusivity than the 1.2 wt.% Mn strip, due
to hydrogen trapping by finer ferrite grains and a higher density of carbonitride precipitates.
Moreover, the medium Mn strip exhibited a uniform microstructure and consequently similar
diffusion coefficients for the edge and centreline regions, whereas the finer grains of the edge
region of the standard Mn strip resulted in a lower diffusivity than the centreline region.
Keywords: pipeline steel, permeability, diffusion, traps, microstructure, grain size, inclusions,
precipitates, dislocations

3
Effect of Microstructure and Composition on Hydrogen Permeation in X70
Pipeline Steels
1. Introduction
X70 pipeline steels are widely used to transport petroleum and natural gas. The service life of
pipeline steels is affected not only by the fluid or gas which they transfer, but also by the
environmental conditions under which they operate. One of the main reasons for the degradation
in mechanical properties of steels is the exposure to hydrogen. For example, on exposure to a
sour gas environment, the steel surface corrodes and produces hydrogen at the surface. This
hydrogen can be absorbed in the steel and can then start diffusing to regions of stress
concentration, impairing ductility and promoting brittle behavior (hydrogen embrittlement).
Since the transport of hydrogen to a critical region is dependent on diffusion, hydrogen transport
is an important step in the process of embrittlement. Therefore, it is important to determine the
diffusion rate of hydrogen in pipeline steels in order to predict their mechanical properties and in-
service behaviour.
The diffusion of hydrogen in steels is affected by the microstructure of the steel: the phase or
phases present, grain boundaries, grain shapes, vacancies and dislocations, interfaces with non-
metallic inclusions, precipitate particles and voids [1-3]. These features can reduce the mobility
of hydrogen by acting as traps. Traps are generally classified as reversible and irreversible, based
on the strength of their bond with hydrogen atoms. Grain boundaries and dislocations and
microvoids that have low trap binding energies are considered to be reversible traps. Of these,
grain boundaries can either increase the diffusion of hydrogen by providing faster paths for
diffusion [4-6] or reduce the mobility of hydrogen by acting as reversible hydrogen trapping sites
at nodes and junction points [7-10]. As a result of these two contradictory effects, Ichimura et al.
[11] suggested that the hydrogen diffusion coefficient will be a maximum at an optimum grain
size and Yazdipour et al. [12] confirmed this by modeling as well as permeation experiments.
Irreversible traps, on the other hand are those that trap hydrogen permanently at temperatures
close to ambient and are associated with high binding energies. These traps include non-metallic
inclusions and precipitates. Several types of inclusions have been identified in pipeline steels

4
such as Al2O3, complex (Fe, Mn)S or double oxide FeO.Al2O3 inclusions, mixed compounds
containing Al-Mg-Ca-O, Si-ferric carbide and MnS [13-14]. Lee and Lee [15] considered MnS
inclusions to be strong irreversible trapping sites for hydrogen. However, Garet et al. [16]
reported that MnS particles act as reversible trapping sites since they have moderate binding
energies. They also reported that the trapping efficiency increased with sulphur content. In
addition to inclusions, precipitates of Ti, Nb and V such as TiC, TiN, NbC, VC, complex
Ti,Nb(C,N), Ti4C2S2 etc., are all considered to be irreversible traps [2, 17-24].
In the past few decades, several investigations have dealt with the influence of various parameters
on diffusion in pipeline steels [14, 25-35]. Table 1 summarises diffusion coefficients and other
parameters obtained, for pipeline steels, by different authors along with other related information
such as the solutions employed, exit side coating and method used for calculating the diffusion
coefficient. Andenna and Torella [25] studied the effect of stress on the permeability of X65
pipeline steels and reported that there was no effect for the base material with a ferrite-pearlite
microstructure, whereas the hydrogen diffusivity and flux for quenched material comprising a
bainitic microstructure with martensite-austenite islands decreases with increasing level of stress.
Park et al. [31] investigated the effect of microstructure on the trapping efficiency of X65
pipeline steel and reported that the efficiency of trapping increases in the order: degenerated
pearlite, bainite and acicular ferrite. The diffusivity of hydrogen and density of traps in X70 and
X100 steels were estimated by Dong et al. [27-28]; and for X80 by Xue et al. [14]. Kim et al.
[29] investigated the effect of environmental factors such as H2S partial pressures and pH
values on the permeation of hydrogen in high strength low alloy (HSLA) steels and found that
reversible trapping was affected by H2S rather than pH. The effect of precipitates was
investigated by Koh et al. [30] who reported that diffusion of hydrogen was related to the volume
fraction of carbonitride precipitates rather than the ferrite microstructure. Huang et al. [13]
studied the ability of microstructures and inclusions to trap hydrogen in three different X120
steels having similar amounts of Ti,Nb(C,N) precipitates and found that irreversible hydrogen
trapping efficiency increases with the volume fraction of non-metallic inclusions such as Al2O3
and MnS. Skjellerudsveen et al. [35] studied the diffusion of hydrogen in X70 pipeline steel,
simulated coarse grain heat affected zone (CGHAZ) and weld metal and found that the diffusion
coefficient decreased in the order: weld metal, X70 steel and HAZ. Further, the change in
diffusion coefficient with temperature was similar for the three materials.

5
Since pipeline steels are produced by thermo-mechanically controlled processes (TMCP), a
range of microstructures can result depending on the actual processing conditions. Consequently,
the microstructure, grain size, volume fraction of inclusions and precipitates, and dislocation
density can vary within a particular strength grade. Moreover, segregation of various elements
can occur (depending on the partitioning tendency of each element) and inclusions can be
concentrated in the slab centre, which solidifies last. Therefore, alloying elements and inclusions
tend to be concentrated in the centreline region of transfer bar (TB) and in the hot rolled strip. It
also follows that the chemical composition and microstructure of the edge differs from that in the
centreline region. Moreover, the difference in the cooling rates of the edge and centreline can also
introduce differences in grain size and dislocation density. To minimise the effects of
segregation, the trend in recent years has been to shift to lower Mn levels [36].
Therefore, the aim of this study was to investigate the effect of microstructure and composition
on hydrogen permeation in X70 pipeline steels. Permeation studies were performed on two
pipeline steels having different compositions, namely standard X70 (1.2 % Mn) and medium X70
(0.5% Mn). Samples were investigated from the transfer bar and hot rolled strip stages of
production, and from different regions (centreline and edge). The diffusion coefficients for the
different samples were estimated and the observed permeation transients were correlated with the
microstructural features present in the steel specimens.
2. Experimental
2.1 Materials and processing
Standard X70 and medium Mn X70 grade pipeline steels were used in this investigation. The
chemical compositions of the steels are listed in Table 2. Samples of size 40 mm x 40 mm and
thickness slightly greater than 1 mm were obtained by wire cutting parallel to the rolling plane of
the material as shown in Figure 1. Samples from the edge and centreline regions were taken from
the TB of standard X70 steel and hot rolled strips of both standard and medium Mn X70 grades
produced by BlueScope Steel Ltd. To eliminate the effect of residual strain and to obtain a
normalised structure with equiaxed grains, samples from the edge region of TB were normalised
in an argon atmosphere at 950C for 20 minutes. The notation used for the samples investigated
is given in Table 3.

6
2.2 Microstructural investigation
After the completion of permeability tests, the cross-sections of the samples were cut from the
region exposed to the electrolyte and prepared for optical metallography using the standard
procedures. The samples were etched with 2 % Nital solution and the microstructures were
characterized both by optical microscopy and scanning electron microscopy (SEM) using a JEOL
JSM 6490LV SEM at an excitation voltage of 20 kV. Since the transport of hydrogen was in the
normal direction, the grain size, defined in terms of the mean free path in ferrite in the normal
direction, was measured by the linear intercept technique. The hardness of the samples was
determined using an INDENTEC Vickers hardness machine at a load of 10 kg.
2.3 Electrochemical hydrogen permeation test
Hydrogen permeability measurements were performed by the electrochemical technique
developed by Devanathan and Stachurski [37]. A modified dual cell made of two polycarbonate
cells was employed. The specimen was held tightly between the two cells by using rubber gaskets
in such a way that the entire system remained leak-tight and the solutions on either side of the
specimen did not mix. The side of the membrane, at which hydrogen was to be generated, was
maintained at a cathodic potential, whereas an anodic potential was applied on the detection side
of the membrane. The equipment used for applying the required potentials was the Hyperm Mod
HM 403.
The permeability tests were carried out at room temperature. The room temperature was in the
range 21-23 C, as measured with a thermometer. Both surfaces of the specimen were abraded
with 500 grit silicon carbide paper and cleaned with methanol. After preparation the final
thickness of the sample was measured and recorded (the average of ten measurements was
calculated). No Pd coating was applied at the exit side of the samples. The cleaned sample was
placed in between the two cells and sealed by tightening the bolts. A circular area of 2.84 cm2
was exposed to the electrolyte. A platinum electrode was placed in the anodic cell and a stainless
steel electrode in the cathodic cell and the steel specimen formed the working electrode in both
cells. These electrodes were then connected to the terminals of the Hyperm unit. The anodic side
or the detection cell was filled with 0.1 N NaOH solution, and polarization was started. A
background current was observed in the amperometer. With time the background current

7
decreased. When this current decreased to a value below 3 A, it was compensated by means of
the zero shift using a null potentiostat. In effect, the background current was set to zero. Then the
cathodic cell was filled with a solution containing 0.1 N NaOH and a promoter, Na2S.9H2O in
order to accelerate the entry of hydrogen into the steel specimen. Alkaline solution was used for
the permeation tests in order to reduce the interaction of sulphide inclusions with the electrolyte
at the steel surface [38]. Initially, concentrations of 1, 10, and 100 g/L of Na2S.9H2O were used
to study the effect of promoter concentration. The data indicated that an increase in the
concentration of the promoter increased the steady state current density as well as the permeation
rate, i.e., the time taken to reach steady state permeation was reduced. The steady state
permeation current observed for 1 g/L of Na2S.9H2O was very low, close to the lower range of
the measuring instrument. On the other hand, a higher concentration of promoter, i.e., 100 g/L,
led to significant specimen corrosion. Therefore 10 g/L of promoter was selected for all the
experiments. The solutions were prepared from analar grade chemicals and milli Q water.
Hydrogen entry into the steel was then facilitated by applying a constant cathodic current of 10
mA which gave a current density of 3.52 mA/cm2. Hydrogen permeated through the specimen to
the anodic side where it was instantaneously oxidised giving rise to an equivalent current in the
exit cell which is a direct measure of the output flux of hydrogen. The Hyperm unit was
connected to a computer through a data logger to record continuous current measurements
throughout the experiment with data logging every 10 seconds.
After the application of the cathodic current on the entry side, the permeation current was initially
zero for a period of time, after which it increased till it reached a steady state value. This is
referred to as the rise transient. After reaching steady state, the entry side charging current was
interrupted and the sample was allowed to outgas completely. The current then started decreasing
and reached a low value after a period of time, giving rise to the decay transient. A second
transient was then obtained by starting the current in the entry side again. Triplicate tests were
conducted for each sample.
2.4 Analysis of permeation transients
8
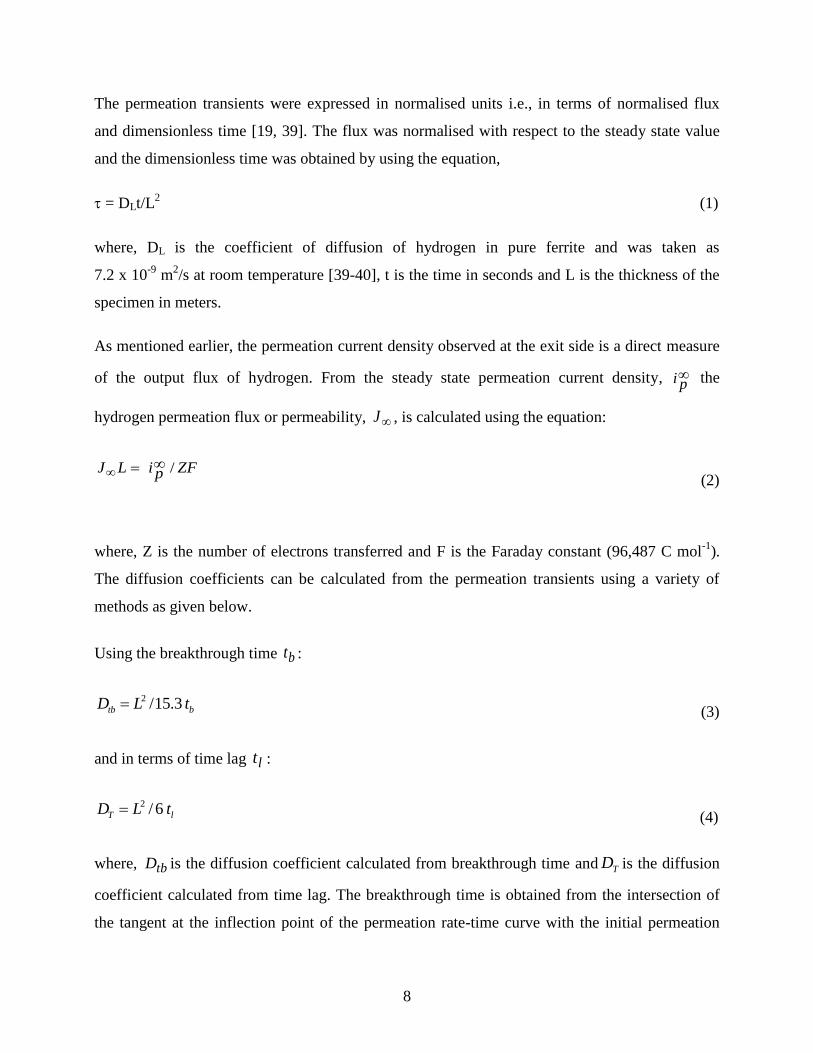
The permeation transients were expressed in normalised units i.e., in terms of normalised flux
and dimensionless time [19, 39]. The flux was normalised with respect to the steady state value
and the dimensionless time was obtained by using the equation,
= DLt/L2 (1)
where, DL is the coefficient of diffusion of hydrogen in pure ferrite and was taken as
7.2 x 10⁻⁹
m2/s at room temperature [39-40], t is the time in seconds and L is the thickness of the
specimen in meters.
As mentioned earlier, the permeation current density observed at the exit side is a direct measure
of the output flux of hydrogen. From the steady state permeation current density, pi the
hydrogen permeation flux or permeability, J , is calculated using the equation:
ZFpiLJ / (2)
where, Z is the number of electrons transferred and F is the Faraday constant (96,487 C mol-1
).
The diffusion coefficients can be calculated from the permeation transients using a variety of
methods as given below.
Using the breakthrough time bt :
btb tLD 3.15/2 (3)
and in terms of time lag lt :
lT tLD 6/2 (4)
where, tbD is the diffusion coefficient calculated from breakthrough time and TD is the diffusion
coefficient calculated from time lag. The breakthrough time is obtained from the intersection of
the tangent at the inflection point of the permeation rate-time curve with the initial permeation

9
level and the time lag is obtained from the time taken for permeation rate to reach 0.63 times the
steady state value.
The diffusion coefficient can also be calculated from the rising transient using a plot of
ppp iii /ln against t where, pi is the measured permeation current at time t and pi is the
steady state permeation rate. This plot has a slope of 1/ 0t , where, DLt 22 /0 . Therefore,
D = L2/
2t0 (5)
Another means of calculating the diffusion coefficient is based on the decay transient and
employs a plot of pp ii /ln against t. Again this plot has a slope of 1/ 0t from which D can be
calculated using equation (9).
The apparent hydrogen solubility Capp (mol H/m3) can be determined by,
Capp = LJ / D (6)
The trap density was calculated using the equation given by Dong et al. [28]
RT
E
LLT
b
eD
DNN
1 (7)
where NT is the number of hydrogen trapping sites per unit volume (m-3
), NL is the density of the
interstitial sites in the steel and Eb the hydrogen trap binding energy. The values of NL, and Eb
were taken as 7.52 x 1028
m-3
and 0.3 eV respectively [28]. The trap density in this study was
calculated using the diffusion coefficient calculated from the lag time of the first transient.
3. Results
3.1 Microstructural characterization
Figures 2 and 3 show typical microstructures of the different samples investigated. The samples
taken from the edge and centreline regions of the standard and medium Mn strips basically
revealed slightly elongated grains of ferrite-pearlite. For the standard Mn alloy, the edge
microstructure (SME) and the centreline microstructure (SMC) are shown in Figures 2 (a), (b);

10
and those for the medium Mn alloy MME and MMC are shown in Figures 2 (c) and (d). The
optical image taken from the centreline region of the standard Mn strip (Figure 2 (b)) indicates
that the ferrite grains are more uniform and generally coarser than those in the edge region
(Figure 2 (a)), which is consistent with the slower cooling rate experienced by the centreline
region during the hot rolling process, compared to the edge. A closer examination of the
microstructures indicated that the grain sizes of edge and centreline regions of the standard Mn
strip were characterized by a bimodal distribution. The edge region exhibited a larger volume
fraction of fine grains with some larger grains which were approximately 5 times the average size
of the finer grains. In contrast, the centreline region consisted of a smaller volume fraction of fine
grains and a larger fraction of coarse grains that were about 3 times the average size of the fine
grains. Furthermore, the centreline samples also exhibited regions with a banded ferrite-pearlite
microstructure. The difference in average grain size is also evident from Table 3 which lists the
grain size in terms of mean free path in the ferrite phase as well as the hardness of the various
samples. The edge (Figure 2 (c)) and centreline regions (Figure 2 (d)) of the medium Mn strip, on
the other hand, exhibited a more uniform microstructure with very similar mean grain sizes. This
observation is quantified in Table 3. Moreover, no banding of the ferrite and pearlite was evident
in the centreline region of the medium Mn strip.
The microstructure of the edge region of transfer bar (TBE) exhibited a banded structure
comprising alternate bands of bainitic ferrite, labelled 1, and polygonal and/or quasi- polygonal
ferrite, labelled 2 (Figure 3). A magnified image of TBE is shown in Figure 3 (b). The centreline
region of the transfer bar (Figure 3 (c)) exhibited a microstructure of coarser ferrite plates and
some quasi-polygonal ferrite which had formed from coarse grained austenite at a relatively slow
cooling rate. This coarse lath ferrite structure is often described as granular bainite [41]. The
microstructure of the normalised transfer bar edge sample is shown in Figure 3 (d). The
microstructure consists of equiaxed ferrite-pearlite grains.
It is also clear from Table 3 that samples taken from the edge of the standard Mn strip exhibited
a higher hardness than the samples taken from the centreline regions, whereas the medium Mn
samples showed uniform hardness values. These values correlate well with the grain sizes of the
samples. The transfer bar gave the unexpected result that the edge region was softer (170 6
HV) than the core (189 3 HV). The thickness of the transfer bar ensures a slower near-surface

11
cooling rate than for hot rolled strip, thereby accounting for the lower hardness of TBE. The
higher than expected core hardness could be due to Mn segregation that lowered the
transformation temperature and increased strengthening by solute Mn [42].
3.2 Permeation transients
Figure 4 (a) is the complete permeation curve for a typical X70 specimen which includes the first
transient, the decay and the second transient. In Figure 4(b) both the first and second transients
are superimposed. The following observations can be made from these plots:
1. The first transient current increased rapidly, reached a maximum and remained
steady for a short duration of time (< 10 minutes for the NTB samples and about
30-40 minutes for the other samples). The current then decreased continuously even
when the sample was still cathodically polarised.
2. Although the start of the second transient (the breakthrough time) appeared to be
shorter, the rise in permeation current was not as rapid (Figure 4 (b)) i.e., the time
taken to reach steady state was longer. Moreover, it did not reach the same
permeation current as the first steady state value, which indicates that the
permeation flux during the second transient is smaller than that observed in the first
transient.
These results are similar to those of Manolatos et al. [43] for a pure iron specimen using 0.1 N
NaOH in both cells. They attributed these observations to a passive oxide layer that forms on the
exit side of the specimen in the absence of Pd coating when an anodic potential is applied.
According to the authors, the passive layer formed on the exit side acts as a barrier to hydrogen
evolution and does not allow the hydrogen concentration on the exit side to stabilise. This
prevents the attainment of stationary conditions and consequently affects the steady state
permeation flux. This trend of the permeation transient decreasing with time was also observed
by Beck et al. [44], Amiot et al. [45] and Iino et al. [38] . Beck et al. [44] attributed it to void
nucleation at an aggregate of dislocations and Amiot et al. [45] attributed it to the hydrogen flux
loss through the breakage of surface blisters. However, similar to the present results for all
samples, Iino et al. [38] did not observe any blisters. Bruzzoni et al. [46] also showed that, in the

12
absence of Pd coating on the exit side, an oxide layer is formed, which reduces the permeation
flux and also increases the time taken to reach steady state. Moreover, the entry side corrodes
during the decay since no current is being applied. This alters the conditions at the hydrogen
entry surface and could result in a lower or delayed hydrogen uptake during the second transient.
Skjellerudsveen et al. [35] did not observe any significant variation in the permeation curves of
the first, second and third transients for X70 steel, coated with Pd on the exit side, at room
temperature. The values of steady state current densities were also similar for the three transients.
They also applied a positive potential to both sides during decay, contrary to the procedure used
in the current investigation.
Our results are in agreement with the conclusions of Manolatos et al. [43] and Bruzzoni et al.
[46] that, in the absence of Pd coating, the progressive formation of an oxide layer on the exit
side does not allow a steady state permeation current to be maintained for a prolonged period
during the permeation test, despite the cathodic polarisation of the sample. Hence the permeation
current decreases after a relatively short steady state period during the first permeation cycle, as
shown in Figure 4 (a). As a consequence of the film on the exit surface, the second permeation
cycle shows a lower peak permeation current, Figures 4 (a) and (b), before the permeation current
starts to fall as the barrier effect of the film increases.
The steady state permeation, in this study, did last for a short period of time, unlike the
observations by Manolatos et al. [43], and made it possible to determine normalised permeation
fluxes for carrying out comparisons. Permeation transients obtained for different samples
investigated were similar to those shown in Figure 4 (a). The most reliable comparative data
come from the first transient curve up to the time range of the steady state permeation current,
because the influence of oxide film formation over this time period remains relatively low.
Accordingly, the curves comparing the permeation characteristics of the samples tested, shown in
Figures 6 (a) to (g), are for the first transient up to the steady state period.
3.3 Diffusion coefficients
Table 4 compares the diffusion coefficients calculated for the 1st and 2
nd transients using the
measured breakthrough times and lag times, and also from the rising first transient and decay

13
transient for the different samples investigated in this study. There is a spread in the values of the
diffusion coefficients obtained from the first transient due to the different calculation methods, as
reported also by Turnbull et al. [39] and Charbonnier et al. [47]. The diffusion coefficients
calculated from breakthrough times are the largest, whereas the diffusion coefficients calculated
from lag times and rising first transients are quite similar and lower than the values calculated
from the breakthrough times. Values calculated from the decay transient are significantly lower,
consistent with the significantly longer times taken for the decay of hydrogen. Garet et al. [16]
and Scoppio and Barteri [33] have also observed lower diffusion coefficients from the degassing
transient and attributed this to hydrogen exchanges between reversible traps in ferritic steels
which result in slow degassing when the hydrogen supply progressively decreases. Scoppio and
Barteri [33] therefore suggest that the phenomena occurring during degassing are complex and
hence the parameters estimated from degassing are less significant compared to the values
determined from hydrogen uptake.
The shorter breakthrough time for the second transient, correlates with the consistently higher
diffusion coefficient (1.11 to 1.79 times higher) than that for the first transient (Table 4). Table 4
also indicates that there are only minor differences in the diffusion coefficients calculated from
the breakthrough time for the first transient for the different samples tested. The medium Mn
edge sample exhibited the lowest diffusivity (1.88 × 10⁻¹⁰
m2/s) and the normalised transfer bar
showed the highest diffusivity (5.66 × 10⁻¹⁰
m2/s). For the standard Mn strip, the samples taken
from the edge of the strip gave a lower diffusion coefficient than the centreline region, whereas
the difference between the edge and centreline regions was insignificant for the medium Mn strip.
The various estimates of diffusivity (excluding Dt0 decay) were in reasonable agreement for a
given sample. Further, the trend in diffusivity values for the seven samples examined was similar
for each of the six different calculation methods. For example, the average diffusivity for SMC
was 2.63 × 10⁻¹⁰
m2/s with a standard deviation of 0.71.
Variation in hardness and diffusion coefficient with mean free path has been plotted in Figure 5
for the standard Mn strip edge, strip centreline and normalized transfer bar, which all had similar
ferrite-pearlite microstructures. A linear correlation is evident between hardness and mean free
path and also the diffusivity and mean free path. Consistent with literature, the hardness increases
as the grain size (the mean free path in ferrite) decreases. In contrast, the diffusivity increases as

14
the mean free path increases. These observations agree with an earlier study [12] which showed
that the diffusion coefficient decreases with decreasing grain size for grains smaller than 45 m.
3.4 Trap densities and apparent hydrogen solubility
The computed values of the density of traps, flux, permeability and the subsurface concentration
of hydrogen atoms are given in Table 5. The calculated trap densities varied from 1.3 - 3.1 × 10¹⁸
m-3
for the different samples, being lowest for NTB samples and highest for the MME and MMC
samples. This trend is consistent with the measured diffusion coefficients since the trap densities
are inversely proportional to the diffusion coefficients. Furthermore, there was no difference in
the trap densities of the edge and centreline regions for the medium Mn strip.
The apparent hydrogen solubility is also inversely related to the diffusion coefficient. Therefore,
there were only minor differences in the apparent hydrogen solubility of the samples investigated.
4 Discussion
4.1 Comparison of the estimated permeation parameters with literature
In addition to the microstructure and composition of the steel, the diffusion of hydrogen can be
influenced by other experimental factors including the solution used for permeability testing, the
concentration of promoter (if any), the method used to calculate the diffusion coefficient and the
presence or absence of Pd or an other coating on the exit side of the sample. Serna et al. [34]
have also pointed out that the diffusion coefficient can depend on the charging conditions.
Therefore, although several researchers have studied the diffusion of hydrogen in micro-alloyed
pipeline steels, it is not easy to compare the diffusion coefficients. This is also evident from Table
1 which shows that the diffusion coefficients obtained by different researchers vary significantly.
Tables 1 and 4 show that the values of diffusion coefficient obtained in this study are an order of
magnitude higher than those reported by Dong et al. [27] and Skjellerudsveen et al. [35] for X70
steel. The former researchers used an acidic solution of H2SO4 with 250 mg/L As2O3 and the
latter 0.1 N NaOH without any promoter. Furthermore, the exit side was coated with Pd by
Skjellerudsveen et al. [35] and Ni by Dong et al. [27]. The reported microstructures were also
different.

15
On the other hand, the results obtained from the present study are comparable to those reported
by Park et al. [31], despite their use of NACE solution for the entry side and Pd coating on the
exit side. Diffusion coefficients of 2.3 - 3 × 10⁻¹⁰
m2/s were calculated, in the present study, from
breakthrough times of the first transient for the standard X70 strip comprising a ferrite-pearlite
structure. These results are about 3 times lower than the values of 9.27 - 9.38 × 10⁻¹⁰
m2/s
obtained by Park et al. [31] for ferrite-degenerated pearlite structures in X65 steel. However, a
diffusion coefficient of 3.7 × 10⁻¹⁰
m2/s obtained for the ferrite - bainitic ferrite structure (TBE) in
this study is close to the value of 4.05 × 10⁻¹⁰
m2/s reported by Park et al. [31] for their A2 steel
with a similar microstructure. The present results are also comparable to the values reported by
Koh et al. [30] for pipeline steels having ferrite-pearlite microstructures.
Although the diffusion coefficients are of the same order of magnitude, the values of permeability
and subsurface concentration of hydrogen observed in this study are significantly lower that those
reported by Park et al. [31]. This is possibly related to the different solutions used for the entry
side as well as the presence of Pd coating in the case of Park et al. [31] which allows full
oxidation of the hydrogen arriving at the exit side and gives rise to a higher permeation flux.
4.2 Comparisons of the different samples studied
As discussed earlier, the diffusion coefficients of the different samples tested here were of the
same order of magnitude, with only some minor differences. However, if the first permeation
transients of the different sets of sample conditions are plotted on the same graph, as shown in
Figures 6 (a) to (g), clear differences in the permeation behaviour of the samples are more
noticeable. These differences are discussed below.
4.2.1 Comparison of standard Mn strip edge and centreline
Figure 6 (a) shows the first permeation transient of the SME and SMC samples. It is apparent
from this figure that not only is the breakthrough time longer in the edge samples, but the
transient is less steep, which implies that it contains a higher density of traps which reduce the
mobility of hydrogen. Therefore it takes a longer time to fill the traps and consequently reach a
steady state permeation current.

16
During continuous casting, Mn has a strong tendency to segregate to the centreline region of the
slab. Escobar et al. [48] have demonstrated by etching with LePera reagent that Mn segregation
occurs in hot rolled steels. As a result of this segregation, Mn can combine with S during the last
stages of solidification giving rise to MnS inclusions. These inclusions have been reported to act
as moderate to strong trapping sites which can trap hydrogen reversibly [16] or irreversibly [15]
and thereby reduce the diffusion of hydrogen. Consequently, the centreline samples should
exhibit a lower diffusion coefficient. However, the samples that were used in the permeation
studies did not appear to show any pronounced segregation in terms of the presence of MnS
inclusions. In view of the above, the results obtained here cannot be explained on the basis of
concentration of MnS particles; rather they can be rationalised on the basis of the microstructure
of the samples. As seen in Figures 2 (a), (b) and Table 3, both the edge and centreline samples of
the standard Mn strip show non-uniform microstructures with a bimodal distribution of grains.
However, the edge sample has a larger number of very fine grains and whereas the fraction of
grains having a larger size is higher in the centreline samples, resulting in a lower mean free path
for the edge sample as compared to the centreline sample. As shown in an earlier publication [12]
for X70 steel, ferrite grain sizes smaller than 45 m can reduce the mobility of hydrogen by
trapping at nodes and triple junctions; with the extent of this trapping increasing with decreasing
grain size. Consequently, the large number of finer grains in the edge region could increase the
trapping of hydrogen and thereby give rise to a lower diffusion coefficient. In addition, it can be
expected that the edge region of the strip would contain a higher density of dislocations as
compared to the centreline region, because the faster cooling rate during processing of the strip
promotes transformation to ferrite at lower temperature with an increase in dislocation density,
arising from the transformation volume change. Since dislocations act as reversible traps for
hydrogen, the combined effect of a lower grain size and higher dislocation density of the edge
region of the strip could result in the lower diffusivity of hydrogen.
Some banding of ferrite-pearlite grains parallel to the rolling direction of the strip was also
observed in the centreline samples. Since the samples for permeability tests were obtained by
cutting slices parallel to the rolling plane, this means that the banding was perpendicular to the
direction of hydrogen entry and movement. The effective diffusivities of hydrogen in such
specimens have been reported to be an order of magnitude lower than when hydrogen entry was
along the direction of banding [49-50]. However, in this study the small amount of banding did

17
not appear to have any significant effect in decreasing the diffusion of hydrogen in the centreline
samples as compared to the non-banded edge samples.
4.2.2 Comparison of medium Mn strip edge and centreline
Comparison of the permeation transients of the two regions of the medium Mn strip
(Figure 6 (b)) indicates that there is little difference in the form of the transients and therefore
their hydrogen diffusivity values are similar (Table 4). Examination of the microstructures of the
two regions revealed that the grain sizes were uniform and comparable, with the edge region
showing only a marginally lower mean free path. Therefore, the similarity of the mean free paths
in the ferrite phase for the two regions is consistent with the similarity of the permeation
transients.
4.2.3 Comparison of standard Mn and medium Mn strip
The plot comparing the edge regions of the standard and medium Mn strips is shown in
Figure 6 (c). The breakthrough time and lag time for the medium Mn edge sample were longer
than for the standard Mn edge sample, indicating that trapping is more effective in the medium
Mn strip. An examination of the microstructure of the edge regions of the two steels reveals that
the standard Mn strip has a larger number of grains having a finer grain size and consequently a
smaller mean free path in the ferrite phase. As discussed earlier, a finer grain size is expected to
trap hydrogen and lower its mobility. In view of the grain size effect, the SME samples should
have shown a lower diffusivity, i.e., longer breakthrough and lag times. However, the permeation
results show the opposite.
Recent studies involving precipitate analysis of the two steels using scanning electron
microscopy [51] have shown that the medium Mn steel exhibits a significantly larger number
density of precipitates and inclusions. Most of these precipitates were found to be complex
carbonitrides of Ti and Nb having an average diameter of 0.8 0.8 m. The higher Ti, C and N
contents of the medium Mn X70 steel were reported to result in a significantly larger fraction of
carbonitride precipitates. Fine precipitates of TiC, NbC or complex carbonitrides of Ti and Nb
have been found to act as strong irreversible traps [2, 18, 19]. Permeability studies in pipeline
steels by Koh et al. [30] have also shown that diffusivity of hydrogen decreases as the density of

18
precipitates increases. Therefore, the lower diffusivity of the medium Mn strip compared to the
standard Mn strip can be attributed to the presence of these precipitates which trap hydrogen
effectively and reduce its mobility. This is also consistent with the higher density of traps
calculated for the medium Mn strip, as seen in Table 5.
The permeation transients of the centreline regions of the two steels also show a similar trend
(Figure 6 (d)) with a slightly larger difference in the two strips compared to the edge region.
Again the lower diffusivity of the medium Mn steel can be attributed to the presence of
precipitates. In addition, the mobility of hydrogen in the MMC samples is further reduced by the
contribution to trapping because of a slightly lower mean free path compared to the SMC
samples (Table 3). Therefore, the permeation transients show a slightly greater difference,
relative to those for the edge samples.
4.2.4 Comparison of standard Mn transfer bar edge and centreline
Figure 6 (e) shows the permeation plots for the edge and centreline regions of the X70 TB. This
figure indicates that diffusion is faster in the centreline region of the TB than the edge region.
This effect can be attributed to the coarse granular bainite microstructure formed from coarser
prior austenite grains of TB centreline samples. In contrast, the edge region has a mixture of finer
bainitic ferrite laths and quasi-polygonal ferrite. In addition to the bainitic ferrite grains being fine
with a lower mean free path, the edge microstructure is expected to have a high density of
dislocations which can also trap hydrogen and reduce its mobility. Therefore, the TBE samples
exhibit a lower diffusivity compared to the TBC samples.
4.2.5 Comparison of standard Mn TB edge and normalised TB edge
The transient for the NTB sample is compared with the TBE sample in Figure 6 (f). Not only is
the breakthrough time for the NTB shorter, the transient is also significantly steeper than the TBE
sample, so that the steady state is attained in a shorter time. These observations suggest that the
diffusion of hydrogen is very fast through the NTB microstructure due to the absence of features
that can act as effective traps for hydrogen. This is clearly a consequence of the large polygonal
ferrite grains of the normalised microstructure, which is reflected in its significantly larger mean
free path (Table 3). In addition, the dislocation density is low due to the normalising treatment so

19
that the trapping potential is minimized for this sample. In contrast, the TBE sample had fine
bainitic ferrite structure, smaller grains of quasi-polygonal ferrite and a higher dislocation
density. These factors combine to effectively trap hydrogen and reduce its mobility, giving rise to
a longer breakthrough time and a less steep permeation transient.
4.2.6 Comparison of normalised TB and hot rolled strip of the standard Mn steel
Figure 6 (g) shows a comparison of the first transients obtained for the NTB and SME samples,
both of which have a ferrite-pearlite microstructure. The normalised microstructure consists of
coarse equiaxed grains with a relatively low dislocation density whereas the hot rolled strip has
fine and somewhat elongated grains that are expected to have a higher dislocation density.
Accordingly, the hardness value of 198 7 HV for the hot rolled strip (Table 3) is significantly
higher than for the normalised transfer bar (142 9 HV). Relative to the NTB sample, there was
a substantial increase in the breakthrough time and the time to attain a steady state for the SME
sample, because the finer grains and the higher density of dislocations effectively trap hydrogen
and significantly reduce its mobility, compared to the coarse equiaxed grains in the normalised
microstructure.
5. Conclusions
The medium Mn strip showed the lowest diffusivity due to the combined effect of a fine
grain size and a high density of (Ti,Nb)C,N precipitates.
The normalised transfer bar showed the highest diffusivity due to its large ferrite grains
and a very low dislocation density.
Similar grain sizes for the edge and centreline samples of medium Mn X70 strip resulted
in exhibiting similar hydrogen diffusivities, whereas standard X70 edge samples showed
lower diffusivities than the centreline samples due to the combination of finer grain size
and a higher dislocation density.

20
The low dislocation density and coarser ferrite-pearlite structure of the normalised TB
edge sample exhibited a significantly higher diffusivity than the SME sample despite the
similarity of the microstructure.
The fine structure of bainitic ferrite and associated high dislocation densities of the TB
edge sample resulted in a lower diffusivity than the granular bainite formed from coarser
prior austenite grains of the TB centreline sample.
Acknowledgements
This study was conducted as part of Australian Research Council (ARC) Linkage Grant
(LP0883546) with BlueScope Steel Ltd. (BSL) as the industrial partner. The authors would like
to thank the ARC and BSL for their financial support. The authors would also like to thank BSL
for providing the Hyperm Mod HM 403 unit for carrying out the permeability measurements.
References
1. Lee JY, Lee SM. Hydrogen trapping phenomena in metals with B.C.C. and F.C.C. crystals
structures by the desorption thermal analysis technique. Surface and Coatings Technology 1986;
28: 301-14.
2. Pressouyre GM, Bernstein I. A Quantitative Analysis of Hydrogen Trapping. Metallurgical
Transactions A 1978; 10: 1571-80.
3. Villalba E, Atrens A. SCC of commercial steels exposed to high hydrogen fugacity.
Engineering Failure Analysis 2008; 15: 617-41.
4. Calder RD, Elleman TS, Verghese K. Grain boundary diffusion of tritium in 304- and 316-
stainless steels. Journal of Nuclear Materials 1973; 46: 46-52.
5. Kimura A, Birnbaum HK. Hydrogen induced grain boundary fracture in high purity nickel and
its alloys-Enhanced hydrogen diffusion along grain boundaries. Acta Metallurgica 1988; 36: 757-
66.
6. Tsuru T, Latanision RM. Grain boundary transport of hydrogen in nickel. Scripta Metallurgica
1982; 16: 575-8.
7. Brass AM, Chanfreau A. Electrochemical permeation of hydrogen in high purity nickel at
100°C. Scripta Metallurgica et Materialia 1990; 24: 499-504.
8. Choo WY, Lee JY, Cho CG. Effect of Grain Size. Materials science 1981; 16: 1285–93.
21
9. Wert CA. Trapping of hydrogen in metals. In: Alefeld G, Volkl J, editors. Hydrogen in metals
II. Application-Oriented Properties: Springer-Verlag; 1978, p. 305-330.
10. Yao J, Cahoon JR. Theoretical Modeling of Grain Boundary Diffusion of Hydrogen and its
Effect on Permeation Curves. Acta Metallurgica et Materialia 1991; 39: 119-26.
11. Ichimura M, Sasajima Y, Imabayashi M. Grain Boundary Effect on Diffusion of Hydrogen
in Pure Aluminum. in Materials transactions JIM 1991; 32: 1109-14.
12. Yazdipour N, Haq AJ, Muzaka K, Pereloma EV. 2D modelling of the effect of grain size
on hydrogen diffusion in X70 steel. Computational Materials Science 2012; 56: 49-57.
13. Huang F, Liu J, Deng ZJ, Cheng JH, Lu ZH, Li XG. Effect of microstructure and inclusions
on hydrogen induced cracking susceptibility and hydrogen trapping efficiency of X120 pipeline
steel. Materials Science and Engineering A 2010; 527: 6997-7001.
14. Xue HB, Cheng YF. Characterization of inclusions of X80 pipeline steel and its correlation
with hydrogen-induced cracking. Corrosion Science 2011; 53: 1201–8.
15. Lee SM, Lee JY. The effect of the interface character of TiC particles on hydrogen trapping
in steel. Acta Metallurgica 1987; 35: 2695-700.
16. Garet M, Brass AM, Haut C, Guttierez-Solana F. Hydrogen trapping on non metallic
inclusions in Cr-Mo low alloy steels. Corrosion Science 1998; 40: 1073-86.
17. Stevens MF, Bernstein IM. Metall Trans A 1989; 20A: 909-19.
18. Takahashi I, Matsumoto Y, Tanaka T. in Proc. JIMIS-2. 1979. Minakami, Tokyo, Japan.
19. Valentini R, Solina A, Matera S, De Gregorio P. Influence of Titanium and Carbon
Contents on the Hydrogen Trapping of Microalloyed Steels. Metallurgical and materials
Transactions A 1996; 27: 3773-80.
20. Wei FG, Tsuzaki K. Quantitative Analysis on Hydrogen Trapping of TiC Particles in Steel.
Metallurgical and Materials Transactions A 2006; 37: 331-53.
21. Wei FG, Hara T, Tsuzaki K. Nano-Precipitates Design with Hydrogen Trapping Character
in High Strength Steels. In: Somerday B, Sofronis P, Jones R, editors. Effects of Hydrogen on
Materials, Proceedings of the International Hydrogen Conference, Wyoming, USA; 2008, p 448-
455.
22. Wei FG, Tsuzaki K. Hydrogen Trapping Character of Nano-Sized NBC Precipitates in
Tempered Martensite. In: Somerday B, Sofronis P, Jones R, editors. Effects of Hydrogen on
Materials, Proceedings of the International Hydrogen Conference, Wyoming, USA; 2008, p 456-
463.
23. Yamasaki S, Takahashi T. Evaluation method of delayed fracture property of high strength
steels. Tetsu-to-Hagane 1997; 83: 454-9.

22
24. Yuan X. Precipitates and hydrogen permeation behavior in ultra-low carbon steel. Materials
Science and Engineering: A 2007; 452-453: 116-20.
25. Andenna C, Torella R. A Study of Hydrogen Permeation on API X65 TMCP Steel Under
Stress Conditions. In: Turnbull A, editor. Hydrogen transport and cracking in metals. Proceedings
of a conference, Teddington UK;1995, p. 240-252.
26. Contreras A, Albiter A, Salazar M, Pérez R. Slow strain rate corrosion and fracture
characteristics of X-52 and X-70 pipeline steels. Materials Science and Engineering: A 2005;
407: 45-52.
27. Dong CF, Li XG, Liu ZY, Zhang YR. Hydrogen-induced cracking and healing behaviour
of X70 steel. Journal of Alloys and Compounds 2009; 484: 966-72.
28. Dong CF, Liu ZY, Li XG, Cheng YF. Effects of hydrogen-charging on the susceptibility of
X100 pipeline steel to hydrogen-induced cracking. International Journal of Hydrogen Energy
2009; 34: 9879-84.
29. Kim WK, Koh SU, Yang BY, Kim KY. Effect of environmental and metallurgical factors
on hydrogen induced cracking of HSLA steels. Corrosion Science 2008; 50: 3336-42.
30. Koh SU, Kim JS, Yang BY, Kim KY. Effect of Line Pipe Steel Microstructure on
Susceptibility to Sulfide Stress Cracking. Corrosion Science 2004; 60: 244-54.
31. Park GT, Koh SU, Jung HG, Kim KY. Effect of microstructure on the hydrogen trapping
efficiency and hydrogen induced cracking of linepipe steel. Corrosion Science 2008; 50: 1865-
71.
32. Ramírez E, González-Rodriguez JG, Torres-Islas A, Serna S, Campillo B, Dominguez-
Patiño G, Juárez-Islas JA. Effect of microstructure on the sulphide stress cracking susceptibility
of a high strength pipeline steel. Corrosion Science 2008; 50: 3534-41.
33. Scoppio L, Barteri M. Methods of Hydrogen Uptake Measurements by Electrochemical
Permeation Test on Low Alloy Steels. In: Turnbull A, editor. Hydrogen transport and cracking in
metals. Proceedings of a conference, Teddington UK;1995, p. 204-215.
34. Serna S, Martínez H, López SY, González-Rodríguez JG, Albarrán JL. Electrochemical
technique applied to evaluate the hydrogen permeability in microalloyed steels. International
Journal of Hydrogen Energy 2005; 30: 1333-1338.
35. Skjellerudsveen M, Akselsen OM, Olden V, Johnsen R, Smirnova A. Effect of
Microstructure and Temperature on Hydrogen Diffusion and Trpping in X70 Grade Pipeline
Steel and Its Weldments. in Proceedings of the 2010 EUROCORR Conference, Moscow, Russia;
2010.
36. Williams JG. Advances in Steels for High Strength ERW Linepipe Applications in
Australia. Materials Forum 2007; 31: 1-10.

23
37. Devanathan MAV, Stachurski Z. The Adsorption and diffusion of electrolytic hydrogen in
palladium. The royal society of london A 1962; 270: 90-102.
38. Iino M. Analysis of Irreversible Hydrogen Trapping. Acta Metallurgica 1982; 30: 377-83.
39. Turnbull A, Carroll MW. The Effect of Temperature and H2S Concentration on Hydrogen
Diffusion and Trapping in a 13% Chromium Martensitic Stainless Steel in Acidified NaCl.
Corrosion Science 1990; 30: 667-79.
40. Kiuchi K, McLellan RB. The Solubility and Diffusivity of Hydrogen in Well-Anealed and
Deformed Iron. Acta Metallurgica et Materialia 1983; 31: 961-84.
41. Dunne DP. Ferrite Morphology and Residual Phases in Continuously Cooled low Carbon
Steels. Materials Forum 1999; 23: 63-76.
42. Desforges CD, Duckworth WE, Ryan TFJN, Manganese in ferrous metallurgy: The
Manganese Centre, Paris 1977.
43. Manolatos P, Jerome M, Thual CD, Coze JL. The Electrochemical Permeation of Hydrogen
in Steels Without Palladium Coating. Part I: Interpretation Difficulties. Corrosion Science 1995;
37: 1773-83.
44. Beck B, Bockris JO, McBreen J, Nanis L. Proceedings of the Royal Society of London A
1966; 290: 220.
45. P.Amiot AB, G.Pinard-Legry. Contribution a I’etude du cloquage des a&r pour
constructions soudees. presentee a Deuxieme Congres International. L’hydrogene dans les
metaux. Paris, 3E8. 1977.
46. Bruzzoni P, Garavaglia R. Anodic Iron Oxide Films and Their Effect on The Hydrogen
Permeation Through Steel. Corrosion Science 1992; 33: 1797-807.
47. Charbonnier JC, Margot-Marette H, Brass AM, MAucoutier M. Sulfide Stress Cracking of
High Strength Modified Cr-Mo Steels. Metallurgical Transactions A 1985; 16 A: 935-44.
48. Pérez Escobar D, Miñambres C, Duprez L, Verbeken K, Verhaege M. Internal and surface
damage of multiphase steels and pure iron after electrochemical hydrogen charging. Corrosion
Science 2011; 53: 3166-76.
49. Lee HL, Chan SLI. Hydrogen embrittlement of AISI 4130 steel with an alternate
ferrite/pearlite banded structure. Materials Science and Engineering A 1991; 142: 193-201.
50. Tau L, Chan SLI. Effects of ferrite/pearlite alignment on the hydrogen permeation in a
AISI 4130 steel. Materials Letters 1996; 29: 143-7.
51. Hejazi D, Haq AJ, Yazdipour N, Dunne DP, Calka A, Barbaro F, Pereloma EV. Effect of
Manganese content and microstructure on the susceptibility of pipeline steel to hydrogen
cracking. Materials Science and Engineering A 2012; 551:40-49.

24
LIST OF TABLES
Table 1: Summary of permeation parameters for pipeline steels in literature.
Table 2: Chemical compositions of the steels investigated (wt. %).
Table 3: Sample notation, mean free path in ferrite and hardness.
Table 4: Diffusion coefficients calculated by different methods.
Table 5: Trap density, flux, permeability and solubility.

25
FIGURE CAPTIONS
Figure 1: Schematic showing the location of edge and centreline samples of the
strip/transfer bar.
Figure 2: Optical micrographs of the strip samples (a) standard Mn edge; (b) standard Mn
centerline; (c) medium Mn edge; and (d) medium Mn centreline.
Figure 3: Optical micrographs of transfer bar samples (a) edge; (b) its magnified image; (c)
centerline; and (d) normalised transfer bar. 1 and 2 indicate regions of different
morphologies: bainitic ferrite and polygonal and/or quasi-polygonal ferrite, respectively.
Figure 4: Typical permeation curves for samples examined in this study.
(a) complete plot of two successive permeation cycles for normalised transfer bar sample;
and (b) a plot showing the first and second transients for the medium Mn edge sample with
the second transient (dashed line) superimposed on the first transient line.
Figure 5: Variation in hardness and diffusion coefficient with mean free path for samples
having similar ferrite-pearlite structure and composition.
Figure 6: Comparison of the first permeation transients for (a) standard Mn strip edge and
centreline samples; (b) medium Mn strip edge and centreline; (c) standard and medium Mn
strip edge; (d) standard and medium Mn strip centreline; (e) transfer bar edge and
centreline; (f) transfer bar edge and normalised transfer bar edge; and (g) normalized
transfer bar and hot rolled strip of standard Mn steel.

Table 1: Summary of permeation parameters for pipeline steel in literature.
Publication Steel Solution Coat-
ing Microstructure Method
D (10-10
m2s
-1)
J (mol
H m-2
s-1
× 10-7
)
JL (mol
H m-1
s-1
×
10-10
)
Capp (mol
H m-3
)
[27] X70 0.5 M H2S04
+
250 mg/l
NaAsO2
Ni F+AF Time lag 0.263 9.85 7.6 28.8
[28] X100 F+B Time lag 0.01 2.65 1.4 134
[31] X65 NACE Pd
DP/AF/
B, % M/A, %
Break-
through 4.05 – 9.4
--
0.8-1.4 13-28 F+AF 8.12 5.73
F+B 9.38 4.45
F+DP 3.75 1.28
F+DP 3.93 0.88
[29] X70 NACE Pd F +DP+AF, F+AF+BF Break-
through
0.5-4.3 -- -- --
[34] X52 NACE Pd F+P, AF+P 0.15-0.24 -- -- 2.6 × 10
5-
27.41
[33]* X65 0.1 N NAOH -- Q&T Time
lag 0.9-0.96 -- -- --
[25]** X65 NACE --
F+P
B+M/A
Break-
through
2.4
1.1 -- --
5.7
20.1
F+P
B+MA
Time
lag
2.5
1.2 -- --
5.5
15.6
[30] API NACE Pd F+P, F+B, F+AF 3.5-9.5 -- -- --
[14] X80 0.5 M H2S04 Pd F+BF+M/A Time
lag
0.2 -- 5.2 26
[35] X70 0.1 N NAOH Pd F+P+M 0.73-0.79 -- -- --
F - Ferrite, AF – Acicular Ferrite, B – Bainite, DP – Degenerated Pearlite, M/A – Martensite/Austenite, P – Pearlite, BF – Bainitic ferrite,
GB – Granular Bainite, Q&T – Quenched and tempered . * For 1mm thick samples ** For Zero stress
Table 1

Table 2: Chemical compositions of the steels investigated (wt. %).
Steel C P Mn Si Ni Cr Mo Cu Al Nb Ti V S Ca N
X70 0.074 0.012 1.14 0.22 0.024 0.029 0.1 0.023 0.019 0.06 0.02 0.002 0.002 0.0002 0.0041
MX70 0.085 0.01 0.5 0.19 0.018 0.26 0.11 0.011 0.04 0.059 0.035 0.003 0.002 0.001 0.0054
Table 2

Table 3: Sample notation, mean free path in ferrite and hardness.
Sample Notation Mean free path
(m)
Average Hardness
(HV)
X70 Edge SME 2.97 0.12 198 7
X70 Centreline SMC 4.52 0.18 187 8
MX70 Edge MME 3.96 0.37 187 6
MX70 Centreline MMC 4.05 0.38 186 3
X70 TB Edge TBE 4.26 0.33 170 6
X70 TB Centreline TBC 5.28 0.34 189 3
Normalised TB NTB 8.93 0.89 142 9
Table 3

Table 4: Diffusion coefficients calculated by different methods.
Sample
Dtb (× 10-10
m2s
-1) DT (× 10
-10 m
2s
-1)
Dt0rise
(× 10-10
m2s
-1)
Dt0decay
(× 10-11
m2s
-1)
First Second First Second
SME 2.29 ± 0.05 4.09 ± 1.5 1.97 ± 0.09 1.77 ± 0.06 2.0 ± 0.09 5.90 ± 0.2
SMC 3.02 ± 0.07 3.71 ± 0.7 2.25 ± 0.19 2.06 ± 0.17 2.14 ± 0.15 5.62 ± 0.8
MME 1.88 ± 0.19 3.00 ± 0.44 1.70 ± 0.04 1.57 ± 0.03 1.67 ± 0.07 3.88 ± 0.5
MMC 2.10 ± 0.21 2.54 ± 0.61 1.71 ± 0.1 1.52 ± 0.11 1.59 ± 0.14 4.82 ± 0.5
TBE 3.70 ± 0.02 4.58 ± 0.01 2.10 ± 0.19 1.33 ± 0.31 1.68 ± 0.4 3.84 ± 0.8
TBC 4.87 ± 0.74 5.4 ± 0.63 3.05 ± 0.17 2.15 ± 0.30 2.8 ± 0.19 6.04 ± 0.7
NTB 5.66 ± 0.23 7.46 ± 0.45 4.01 ± 0.02 3.82 ± 0.13 3.62 ± 0.58 7.87 ± 1.1
Table 4

Table 5: Trap density, flux, permeability and solubility.
Sample NT (× 1018
m-3
) Flux J (× 10
-7
mol H m-2
s-1
)
Permeability JL (×
10-10
mol H m-1
s-1
)
Capp (× 10-1
mol H m-3
)
SME 2.68 ± 0.12 1.54 ± 0.26 1.66 ± 0.25 8.40 ± 0.93
SMC 2.37 ± 0.21 1.92 ± 0.22 1.65 ± 0.23 7.38 ± 0.56
MME 3.12 ± 0.08 1.82 ± 0.26 1.95 ± 0.25 11.5 ± 1.5
MMC 3.10 ± 0.18 1.58 ± 0.30 1.55 ± 0.35 9.02 ± 1.5
TBE 2.51 ± 0.23 1.60 ± 0.06 1.67 ± 0.16 8.02 ± 1.5
TBC 1.70 ± 0.1 2.22 ± 0.26 2.34 ± 0.20 7.69 ± 0.91
NTB 1.28 ± 0.01 3.43 ± 0.26 2.42 ± 0.03 6.03 ± 0.11
Table 5

Figure 1Click here to download high resolution image

Figure 2Click here to download high resolution image

Figure 3Click here to download high resolution image
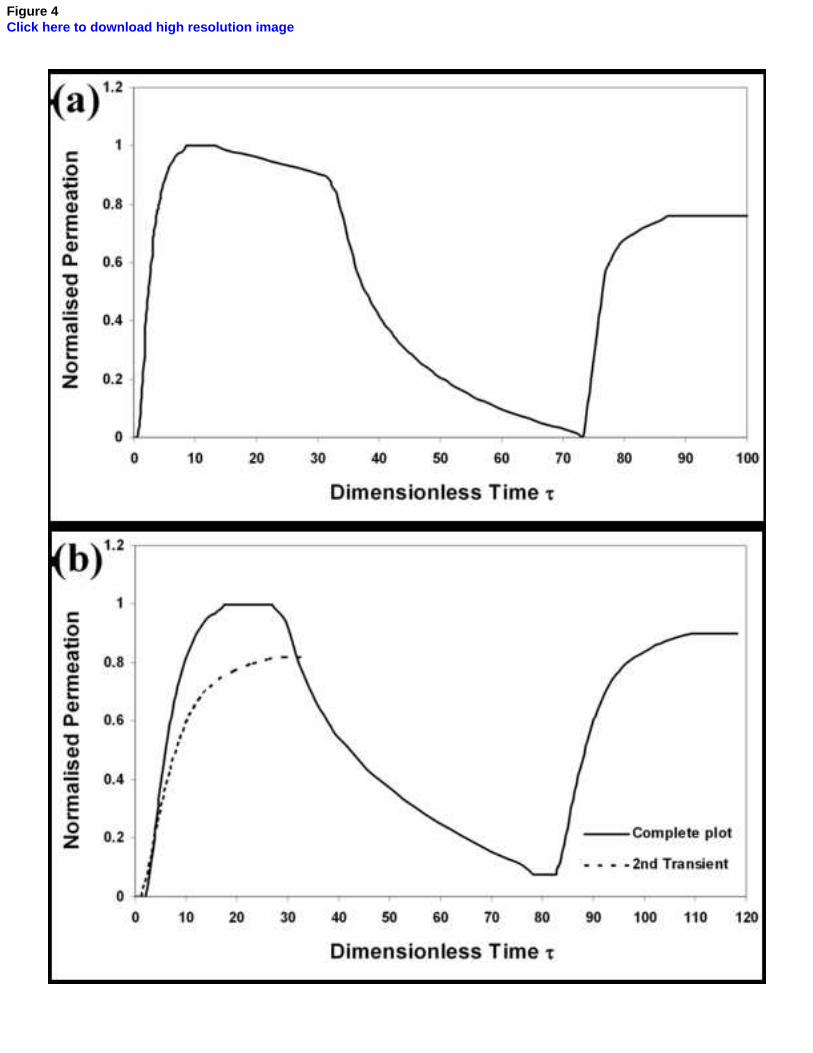
Figure 4Click here to download high resolution image

Figure 5Click here to download high resolution image

Figure 6Click here to download high resolution image