Factors Affecting the Microstructure, Tensile Properties ... - MDPI
13
materials Article Factors Affecting the Microstructure, Tensile Properties and Corrosion Resistance of AA7075 Forgings Teng-Shih Shih 1, *, Ho-Tieh Hsu 1 and Lih-Ren Hwang 2 Citation: Shih, T.-S.; Hsu, H.-T.; Hwang, L.-R. Factors Affecting the Microstructure, Tensile Properties and Corrosion Resistance of AA7075 Forgings. Materials 2021, 14, 5776. https://doi.org/10.3390/ma14195776 Academic Editor: JaeHyung Cho Received: 23 August 2021 Accepted: 24 September 2021 Published: 2 October 2021 Publisher’s Note: MDPI stays neutral with regard to jurisdictional claims in published maps and institutional affil- iations. Copyright: © 2021 by the authors. Licensee MDPI, Basel, Switzerland. This article is an open access article distributed under the terms and conditions of the Creative Commons Attribution (CC BY) license (https:// creativecommons.org/licenses/by/ 4.0/). 1 Department of Mechanical Engineering, National Central University, Jhongli District, Taoyuan 32001, Taiwan; [email protected] 2 Department of Mechanical Engineering, Chung Chou University of Science and Technology, Yuanlin 51003, Taiwan; [email protected] * Correspondence: [email protected] Abstract: AA7075 alloys are high strength alloys and are used as an important material for making en- gineering parts. Forged AA7075 alloys showed significantly decreased toughness when the material was hot deformed at a high temperature. This study investigated the effects of forging parameters on the tensile properties and the microstructure of AA7075 forgings. The tensile properties and corrosion resistance of different forgings were determined to be correlated with their microstructures. The experiment annealed and hot-deformed sample bars at 633 K, cold-deformed them at room tempera- ture (RF), and at sub-zero temperatures (CF). After T73 heat treatment, the microstructures depended on the deformation temperature. This varied significantly, from elongated grains for hot-forged samples to equiaxial grains for cold-deformed samples. The hot-deformed samples had a tensile strength of 592 MPa for UTS, 538 MPa for YS, and 13.4% for elongation. These were stronger but less elongated than the cold-deformed samples. All hot-deformed (HF), RF, and CF samples exhibited mechanical properties that exceeded UTS > 505 MPa, YS > 435 MPa, and an elongation > 13%, and showed moderate corrosion resistance if samples were in contact with a 3.5 wt.% NaCl solution. The toughness of the forgings could be significantly improved by decreasing the forging temperatures. The corrosion resistance of AA7075-T73 forgings was affected by the total grain boundary (GB) lengths per unit area and the 2nd phase particle counts per unit area. Increasing the high-angle grain boundary lengths (HAGBs) per unit area accelerated corrosion and increased the Icorr value. Keywords: cold and hot forging; misorientation angle grain boundary; tensile properties; corrosion resistance 1. Introduction High-strength aluminum alloys, such as AA7075 alloys, are eminently suited for use in lightweight vehicles, aircraft, and sport items. These alloys contain large amounts of zinc, magnesium, and copper, which form complex intermetallic compounds within the matrix. The precipitates and/or intermetallic compounds acquire a specific morphology due to the application of a heat treatment or from the manufacturing process. T73 heat treatment produces samples with an over-aged condition in order to reduce stress corrosion [1,2]. Intermetallic compounds and fine precipitates in the aluminum matrix significantly affect the mechanical properties and anodic performance of AA7075 alloys [3–6]. Forging uses a closed die and high power to produce near net-shaped parts, which de- creases manufacturing costs [7]. Forging also increases the fracture toughness of 7050 alloys if there is a proper process control [8]. Therefore, AA7075-T73 forgings are suited for mak- ing parts for the car industry. However, forging or extrusion can produce a non-uniform macrostructure in the substrate of samples [9]. The structure is significantly affected by the degree of plastic deformation, working temperature, and strain rate. Forged AA7075 alloys show decreased toughness after the material is hot deformed at a high temperature. This study was initiated due to an engineering issue: a thin-walled hub cracked after service. Materials 2021, 14, 5776. https://doi.org/10.3390/ma14195776 https://www.mdpi.com/journal/materials
-
Upload
khangminh22 -
Category
Documents
-
view
2 -
download
0
Transcript of Factors Affecting the Microstructure, Tensile Properties ... - MDPI

materials
Article
Factors Affecting the Microstructure, Tensile Properties andCorrosion Resistance of AA7075 Forgings
Teng-Shih Shih 1,*, Ho-Tieh Hsu 1 and Lih-Ren Hwang 2
�����������������
Citation: Shih, T.-S.; Hsu, H.-T.;
Hwang, L.-R. Factors Affecting the
Microstructure, Tensile Properties
and Corrosion Resistance of AA7075
Forgings. Materials 2021, 14, 5776.
https://doi.org/10.3390/ma14195776
Academic Editor: JaeHyung Cho
Received: 23 August 2021
Accepted: 24 September 2021
Published: 2 October 2021
Publisher’s Note: MDPI stays neutral
with regard to jurisdictional claims in
published maps and institutional affil-
iations.
Copyright: © 2021 by the authors.
Licensee MDPI, Basel, Switzerland.
This article is an open access article
distributed under the terms and
conditions of the Creative Commons
Attribution (CC BY) license (https://
creativecommons.org/licenses/by/
4.0/).
1 Department of Mechanical Engineering, National Central University, Jhongli District, Taoyuan 32001, Taiwan;[email protected]
2 Department of Mechanical Engineering, Chung Chou University of Science and Technology,Yuanlin 51003, Taiwan; [email protected]
* Correspondence: [email protected]
Abstract: AA7075 alloys are high strength alloys and are used as an important material for making en-gineering parts. Forged AA7075 alloys showed significantly decreased toughness when the materialwas hot deformed at a high temperature. This study investigated the effects of forging parameters onthe tensile properties and the microstructure of AA7075 forgings. The tensile properties and corrosionresistance of different forgings were determined to be correlated with their microstructures. Theexperiment annealed and hot-deformed sample bars at 633 K, cold-deformed them at room tempera-ture (RF), and at sub-zero temperatures (CF). After T73 heat treatment, the microstructures dependedon the deformation temperature. This varied significantly, from elongated grains for hot-forgedsamples to equiaxial grains for cold-deformed samples. The hot-deformed samples had a tensilestrength of 592 MPa for UTS, 538 MPa for YS, and 13.4% for elongation. These were stronger but lesselongated than the cold-deformed samples. All hot-deformed (HF), RF, and CF samples exhibitedmechanical properties that exceeded UTS > 505 MPa, YS > 435 MPa, and an elongation > 13%, andshowed moderate corrosion resistance if samples were in contact with a 3.5 wt.% NaCl solution. Thetoughness of the forgings could be significantly improved by decreasing the forging temperatures.The corrosion resistance of AA7075-T73 forgings was affected by the total grain boundary (GB)lengths per unit area and the 2nd phase particle counts per unit area. Increasing the high-angle grainboundary lengths (HAGBs) per unit area accelerated corrosion and increased the Icorr value.
Keywords: cold and hot forging; misorientation angle grain boundary; tensile properties;corrosion resistance
1. Introduction
High-strength aluminum alloys, such as AA7075 alloys, are eminently suited for usein lightweight vehicles, aircraft, and sport items. These alloys contain large amounts of zinc,magnesium, and copper, which form complex intermetallic compounds within the matrix.The precipitates and/or intermetallic compounds acquire a specific morphology due tothe application of a heat treatment or from the manufacturing process. T73 heat treatmentproduces samples with an over-aged condition in order to reduce stress corrosion [1,2].Intermetallic compounds and fine precipitates in the aluminum matrix significantly affectthe mechanical properties and anodic performance of AA7075 alloys [3–6].
Forging uses a closed die and high power to produce near net-shaped parts, which de-creases manufacturing costs [7]. Forging also increases the fracture toughness of 7050 alloysif there is a proper process control [8]. Therefore, AA7075-T73 forgings are suited for mak-ing parts for the car industry. However, forging or extrusion can produce a non-uniformmacrostructure in the substrate of samples [9]. The structure is significantly affected by thedegree of plastic deformation, working temperature, and strain rate. Forged AA7075 alloysshow decreased toughness after the material is hot deformed at a high temperature. Thisstudy was initiated due to an engineering issue: a thin-walled hub cracked after service.
Materials 2021, 14, 5776. https://doi.org/10.3390/ma14195776 https://www.mdpi.com/journal/materials

Materials 2021, 14, 5776 2 of 13
This part was hot forged at a high temperature of 693 K using a close die. This issue wassolved by lowering the forging temperature to 633 K. These topics are of interest to un-derstand the change in microstructures and tensile properties when forging temperaturesare decreased.
Aluminum alloys that deform at cryogenic temperatures are reported to suppress thedynamic recovery that occurs during plastic deformation, so fine grains feature high-anglegrain boundaries [10,11]. One study showed that interaction between high-density disloca-tions facilitates precipitation, so a high density of nano-sized precipitates is produced [12].Nano-grains that are less than 500 nm in diameter are present in AA7075 samples subjectedto compression forging at cryogenic temperatures [13]. The typical structure of cryogeni-cally deformed 7075-T6 or 7075-T73 alloys exhibits fine grains and fine precipitates.
The mechanical properties of cryo-rolled 7075 alloy include a higher Vickers hardness,UTS, and yield strength for samples that are cold-rolled at room temperature (RT). Thetensile properties of the deformed sample are improved by the deformation of ultra-finegrains. There is a higher Vickers hardness, UTS, and yield strength for samples that arecryo-rolled compared to those that are cold-rolled at RT. The tensile properties of thedeformed samples are improved by the formation of ultra-fine grains [14].
Sun and coworkers et al. hot-deformed 7075 alloys at more than 623 K and showedthat dynamic recrystallization occurs in local areas [15]. The grain size in areas where thereis dynamic recrystallization increases as temperature increases and decreases as the strainrate increases [16–18]. This study hot-deforms 7075 alloy at a lower temperature of 633 Kand a high strain rate (1–10 s−1) to increase the tensile properties of 7075 alloy forgings.
Rokni et al. demonstrated that the peak stress for hot deformed 7075 alloy increasesas the deformation temperature decreases and as the strain rate increases [19]. The forgingtemperature (633 K) was more than 573 K, above which there is a significant increase in thesolid solution of MgZn2 in the Al matrix [20].
Gupta et al. studied the hot-deformation of AA7075 alloys and showed that com-pression testing using a high strain rate of 10 s−1 results in a deformation band. EBSDtests showed that 12–13% of low angle grain boundaries were detected in the samples [21].T74 (over-aging) heat treatment causes the grains size of extruded samples to grow anddecreases the HAGBs. For a high strain rate and hot compression, grains are mainlylow-angle grain boundary lengths (LAGBs) in the matrix [22].
Recently, Shih et al. recorded the change in the microstructure of hot- and cold-forged AA6082 alloy. Dynamic recrystallization (DRX) occurred in the hot-deformedsamples. After T6 heat treatment, hot deformed samples have elongated grains with a highaspect ratio. This results in a high tensile strength, but less elongation. Forging at a lowtemperature or room temperature increases elongation by 16% and toughness by 10% [23].
2. Materials and Methods
Extruded AA7075 bars were used for this study. The bars were 55 mm in diameter andwere sliced to produce bar samples with a length of 100 mm. Table 1 shows the chemicalcomposition of AA7075 in wt.%.
Table 1. Chemical Composition of AA7075 (wt.%) Bar Samples That Were Used for This Study.
Element Zn Mg Fe Mn Cr Ti Si Cu
Content 5.63 2.45 0.12 0.03 0.22 0.03 0.09 1.57
After annealing at 513 K for 900 s and 688 K for 2 h, the bar samples were divided intofour groups. One group was cooled to 195 K, stored for 600 s in dry ice and then forgedusing a set of open dies to reduce the thickness by 50%. This set of samples was denotedas CF50. The final forging temperature for the CF50 samples was about 293–313 K. Thesecond group of bar samples were forged at room temperature (RT) using a set of open diesto reduce the thickness by 50%. These samples were denoted as RF50. The final forgingtemperature for RF50 samples was about 313–333 K. The third and fourth groups of bar
Materials 2021, 14, 5776 3 of 13
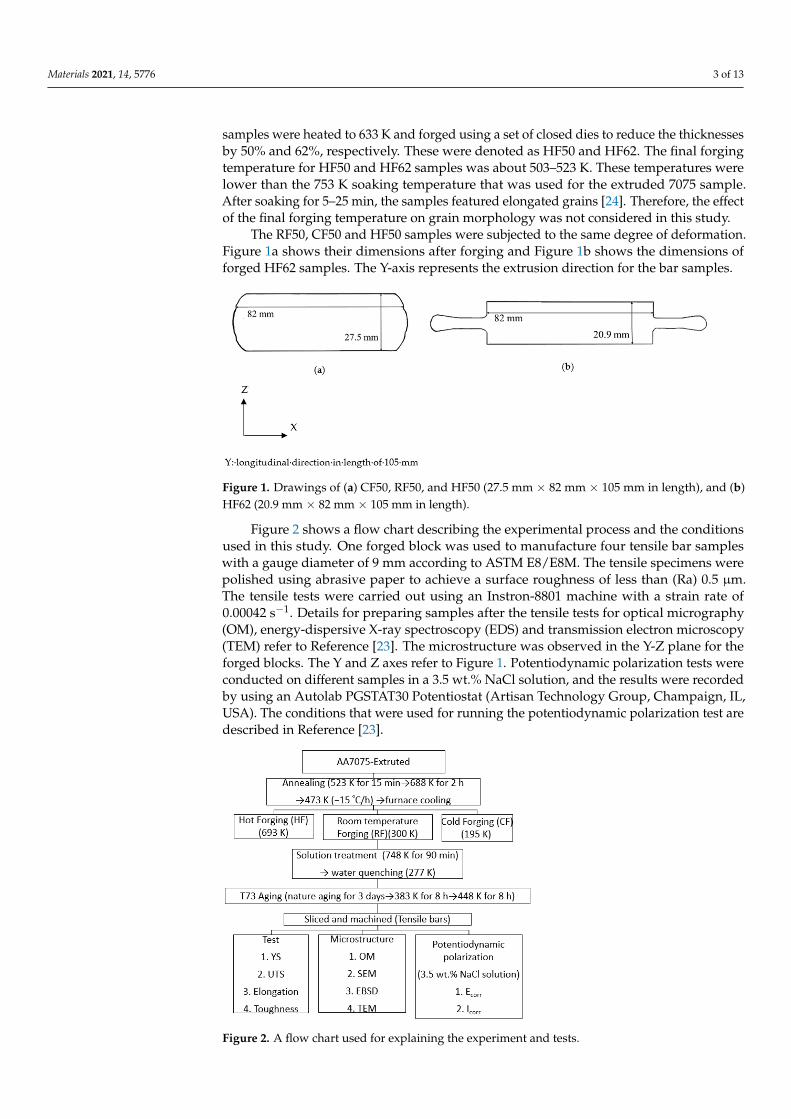
samples were heated to 633 K and forged using a set of closed dies to reduce the thicknessesby 50% and 62%, respectively. These were denoted as HF50 and HF62. The final forgingtemperature for HF50 and HF62 samples was about 503–523 K. These temperatures werelower than the 753 K soaking temperature that was used for the extruded 7075 sample.After soaking for 5–25 min, the samples featured elongated grains [24]. Therefore, the effectof the final forging temperature on grain morphology was not considered in this study.
The RF50, CF50 and HF50 samples were subjected to the same degree of deformation.Figure 1a shows their dimensions after forging and Figure 1b shows the dimensions offorged HF62 samples. The Y-axis represents the extrusion direction for the bar samples.
Materials 2021, 14, x FOR PEER REVIEW 3 of 14
denoted as CF50. The final forging temperature for the CF50 samples was about 293–313 K. The second group of bar samples were forged at room temperature (RT) using a set of open dies to reduce the thickness by 50%. These samples were denoted as RF50. The final forging temperature for RF50 samples was about 313–333 K. The third and fourth groups of bar samples were heated to 633 K and forged using a set of closed dies to reduce the thicknesses by 50% and 62%, respectively. These were denoted as HF50 and HF62. The final forging temperature for HF50 and HF62 samples was about 503–523 K. These tem-peratures were lower than the 753 K soaking temperature that was used for the extruded 7075 sample. After soaking for 5–25 min, the samples featured elongated grains [24]. Therefore, the effect of the final forging temperature on grain morphology was not con-sidered in this study.
The RF50, CF50 and HF50 samples were subjected to the same degree of deformation. Figure 1a shows their dimensions after forging and Figure 1b shows the dimensions of forged HF62 samples. The Y-axis represents the extrusion direction for the bar samples.
Figure 1. Drawings of (a) CF50, RF50, and HF50 (27.5 mm × 82 mm × 105 mm in length), and (b) HF62 (20.9 mm × 82 mm × 105 mm in length).
Figure 2 shows a flow chart describing the experimental process and the conditions used in this study. One forged block was used to manufacture four tensile bar samples with a gauge diameter of 9 mm according to ASTM E8/E8M. The tensile specimens were polished using abrasive paper to achieve a surface roughness of less than (Ra) 0.5 μm. The tensile tests were carried out using an Instron-8801 machine with a strain rate of 0.00042 s−1. Details for preparing samples after the tensile tests for optical micrography (OM), energy-dispersive X-ray spectroscopy (EDS) and transmission electron microscopy (TEM) refer to Reference [23]. The microstructure was observed in the Y-Z plane for the forged blocks. The Y and Z axes refer to Figure 1. Potentiodynamic polarization tests were conducted on different samples in a 3.5 wt.% NaCl solution, and the results were recorded by using an Autolab PGSTAT30 Potentiostat (Artisan Technology Group, Champaign, IL, USA). The conditions that were used for running the potentiodynamic polarization test are described in Reference [23].
Figure 1. Drawings of (a) CF50, RF50, and HF50 (27.5 mm × 82 mm × 105 mm in length), and (b)HF62 (20.9 mm × 82 mm × 105 mm in length).
Figure 2 shows a flow chart describing the experimental process and the conditionsused in this study. One forged block was used to manufacture four tensile bar sampleswith a gauge diameter of 9 mm according to ASTM E8/E8M. The tensile specimens werepolished using abrasive paper to achieve a surface roughness of less than (Ra) 0.5 µm.The tensile tests were carried out using an Instron-8801 machine with a strain rate of0.00042 s−1. Details for preparing samples after the tensile tests for optical micrography(OM), energy-dispersive X-ray spectroscopy (EDS) and transmission electron microscopy(TEM) refer to Reference [23]. The microstructure was observed in the Y-Z plane for theforged blocks. The Y and Z axes refer to Figure 1. Potentiodynamic polarization tests wereconducted on different samples in a 3.5 wt.% NaCl solution, and the results were recordedby using an Autolab PGSTAT30 Potentiostat (Artisan Technology Group, Champaign, IL,USA). The conditions that were used for running the potentiodynamic polarization test aredescribed in Reference [23].
Materials 2021, 14, x FOR PEER REVIEW 4 of 15
Figure 2. A flow chart used for explaining the experiment and tests.
3. Results and Discussion Figure 3 shows the macrostructure of the as-forged HF62 sample. Forging flow lines
were not uniformly distributed and were tangled at the corners of the forged blocks. These parts were excluded from this study. Four tensile bars were manufactured with an equal distance along the central line of the forging blocks. Effective strain of the forged blocks was calculated according to previous work and varied from 0.3 to 1.35 for HF50 and from 1.05 to 1.4 for HF62 [23].
Figure 2. A flow chart used for explaining the experiment and tests.

Materials 2021, 14, 5776 4 of 13
3. Results and Discussion
Figure 3 shows the macrostructure of the as-forged HF62 sample. Forging flow lineswere not uniformly distributed and were tangled at the corners of the forged blocks. Theseparts were excluded from this study. Four tensile bars were manufactured with an equaldistance along the central line of the forging blocks. Effective strain of the forged blockswas calculated according to previous work and varied from 0.3 to 1.35 for HF50 and from1.05 to 1.4 for HF62 [23].
Materials 2021, 14, x FOR PEER REVIEW 4 of 13
Figure 2. A flow chart used for explaining the experiment and tests.
3. Results and Discussion Figure 3 shows the macrostructure of the as-forged HF62 sample. Forging flow lines
were not uniformly distributed and were tangled at the corners of the forged blocks. These parts were excluded from this study. Four tensile bars were manufactured with an equal distance along the central line of the forging blocks. Effective strain of the forged blocks was calculated according to previous work and varied from 0.3 to 1.35 for HF50 and from 1.05 to 1.4 for HF62 [23].
Figure 3. The macrostructures of the as-forged HF62 samples, showing the distribution of flow lines and deformation bands. Figure 3. The macrostructures of the as-forged HF62 samples, showing the distribution of flow linesand deformation bands.
The mean values and standard deviations of the tested tensile strengths are listed inTable 2. Hot-deformed samples (HF50 and HF62) have greater UTS and YS values thancold-deformed samples (CF50 and RF50). The HF62 sample has extremely large values of592 MPa for UTS and of 538 MPa for YS, and exhibits moderate elongation (13.4%). Thecold-deformed samples (CF50 and RF50) have values of 525 MPa for UTS and 465–467 MPafor YS and exhibit a considerable elongation of 16.4–17.4%. The cold-deformed sampleshave a higher toughness (>70 × 10−6 J/m3) and resist tensile fracture better than the hotdeformed samples (54–60 × 10−6 J/m3). The samples differ significantly in terms of tensilestrength, and UTS varies from 36.9 MPa for UTS for HF50 to 13.9 MPa for HF62. The tensileproperties are affected by the microstructure and the effective strain of the forgings. TheHF50 forged block undergoes a wide range of effective strains (0.3 to 1.35) so the deviationis greater than that of the HF62 forged bar, which has values of 1.05 to 1.4. All the forgedsamples have lower UTS and YS, but are more elongated than samples that are prepareddirectly from extruded bars (591 MPa for UTS, 564 MPa for YS, and 13.4% in elongation).The forged samples have tensile properties that exceed those of the standard of the MetalHandbook (505 MPa for UTS, 435 MPa for YS, and 13% elongation).
The EBSD tests gave information about the distribution of the misorientation anglegrain boundaries (MAGBs) over the matrix of the forged samples. The results are shown inFigure 4a–d for the as-forged RF50 and HF50. The samples exhibit elongated grains withmainly LAGB values. Figure 4a,b, respectively, show the results for RF50 and Figure 4c,dshows the results for the HF50 samples. The as-forged RF50 has some fine grains thatfeature HAGB values. Forging at a high compression loading produces a large plasticdeformation in the matrix. The HF50 or RF50 bar samples experienced an effective strainof more than 1.34 during forging [23]. AA7075 alloys also contain high amounts of Zn

Materials 2021, 14, 5776 5 of 13
and Mg alloys, so the stacking fault energy and dislocation movement change. Dynamicrecrystallization (DRX) and dynamic recovery depend on the strain rate, the degree ofdeformation, and the working temperature during deformation.
Table 2. Measured Tensile Strength (UTS, YS, and total elongation TEL) for Different Samples afterT73 Treatment (listed values are the average of four tests).
Sample Code Ultimate TensileStress (MPa)
Yield Stress(MPa)
Total Elongation(%)
Toughness(10−6 J/m3)
7075 * 505 435 13 NA
7075 ** 591 (9.8) 564 (12) 13.4 (0.5) NA
CF50 525.2 (3.4) 467.0 (10.9) 17.4 (1.7) 71.3 (2.1)
RF50 525.2 (26.8) 465.7 (28.1) 16.4 (2.5) 70.5 (4.1)
HF50 547.4 (36.9) 491.8 (39.7) 14.0 (2.0) 53.9 (3.4)
HF62 591.8 (13.9) 538.3 (11.4) 13.4 (0.9) 60.1 (2.9)Tel: total elongation; toughness derived from the stress–strain curves of different tensile bars. Deviations werelisted in the parentheses. * 7075-T73 standard from Metals Handbook, Vol.2–Properties and Selection: NonferrousAlloys and Special-Purpose Materials, ASM International 10th Ed. 1990. ** 7075-T73 as-received bar samples.
Materials 2021, 14, x FOR PEER REVIEW 6 of 13
cation loops within the grain, as shown in Figure 6, for as-forged RF50. The forged sam-ples exhibited significant changes to the microstructure after T73 heat treatment. Vacan-cies were present in the cold forged samples due to the low temperatures. These vacancies resulted in the elimination of dislocations in samples during T73 heat treatment. The mor-phology of CF50 and RF50 grains changed from elongated to equiaxial after heat treat-ment, as respectively shown in Figure 7a,c. The HAGB values (higher than 15°) are high for the matrix of CF50, as shown in Figure 7b. In the RF50 matrix, there are more fractions of LAGB values. These differences are attributed to the inhibition of dynamic recovery due to a fact that CF50 is treated at a sub-zero temperature. Both HF50 and HF62 featured the elongated grains, as shown in Figure 7e,g. However, DXR was more prevalent in HF62 than in HF50. After T73 treatment, the HF62 had almost twice the number of fine grains with grain boundaries (higher than 45°) as the HF50, as shown in Figure 7f,h. The hot-deformed samples featured elongated grains with mainly LAGB values in the matrix. This observation agrees with the results of Khan and Gupta [21,22]. The cold-deformed sam-ples featured mostly equiaxial grains with HAGB values.
(a)
(b)
(c)
(d)
Figure 4. EBSD analysis results: (a,c) inverse pole figure (IPF); (b,d) misorientation angle distribu-tion for (a,b) RF50, (c,d) HF50.
Figure 4. EBSD analysis results: (a,c) inverse pole figure (IPF); (b,d) misorientation angle distributionfor (a,b) RF50, (c,d) HF50.
For this study, dynamic recovery is partially suppressed for samples that are forgedat room temperature. DRX occurs so there are nano-sized grains in the as-forged RF50,as shown in Figure 4b. Dynamic recovery was seen in the hot forged sample because ofthe effect of heat and the MAGB values are mostly less than 10◦, as shown in Figure 4c,dfor the as-forged HF50. Some fine grains are distinguishable in Figure 4c, and these arerepresented by the measured fractions of HAGBs in Figure 4d.
TEM micrographs for the as-forged RF50 and HF50 show the differences betweenthe two samples. These are, respectively, shown in Figure 5a for RF50 and Figure 5b for

Materials 2021, 14, 5776 6 of 13
HF50. The as-forged RF50 featured more dense dislocation loops in the matrix than theas-forged HF50 sample. There was also a nano-sized grain that was about 300 nm anddense dislocation loops within the grain, as shown in Figure 6, for as-forged RF50. Theforged samples exhibited significant changes to the microstructure after T73 heat treatment.Vacancies were present in the cold forged samples due to the low temperatures. Thesevacancies resulted in the elimination of dislocations in samples during T73 heat treatment.The morphology of CF50 and RF50 grains changed from elongated to equiaxial after heattreatment, as respectively shown in Figure 7a,c. The HAGB values (higher than 15◦) arehigh for the matrix of CF50, as shown in Figure 7b. In the RF50 matrix, there are morefractions of LAGB values. These differences are attributed to the inhibition of dynamicrecovery due to a fact that CF50 is treated at a sub-zero temperature. Both HF50 and HF62featured the elongated grains, as shown in Figure 7e,g. However, DXR was more prevalentin HF62 than in HF50. After T73 treatment, the HF62 had almost twice the number of finegrains with grain boundaries (higher than 45◦) as the HF50, as shown in Figure 7f,h. Thehot-deformed samples featured elongated grains with mainly LAGB values in the matrix.This observation agrees with the results of Khan and Gupta [21,22]. The cold-deformedsamples featured mostly equiaxial grains with HAGB values.
Materials 2021, 14, x FOR PEER REVIEW 7 of 13
(a)
(b)
Figure 5. TEM micrograph of (a) as-forged RF50 and (b) as-forged HF50.
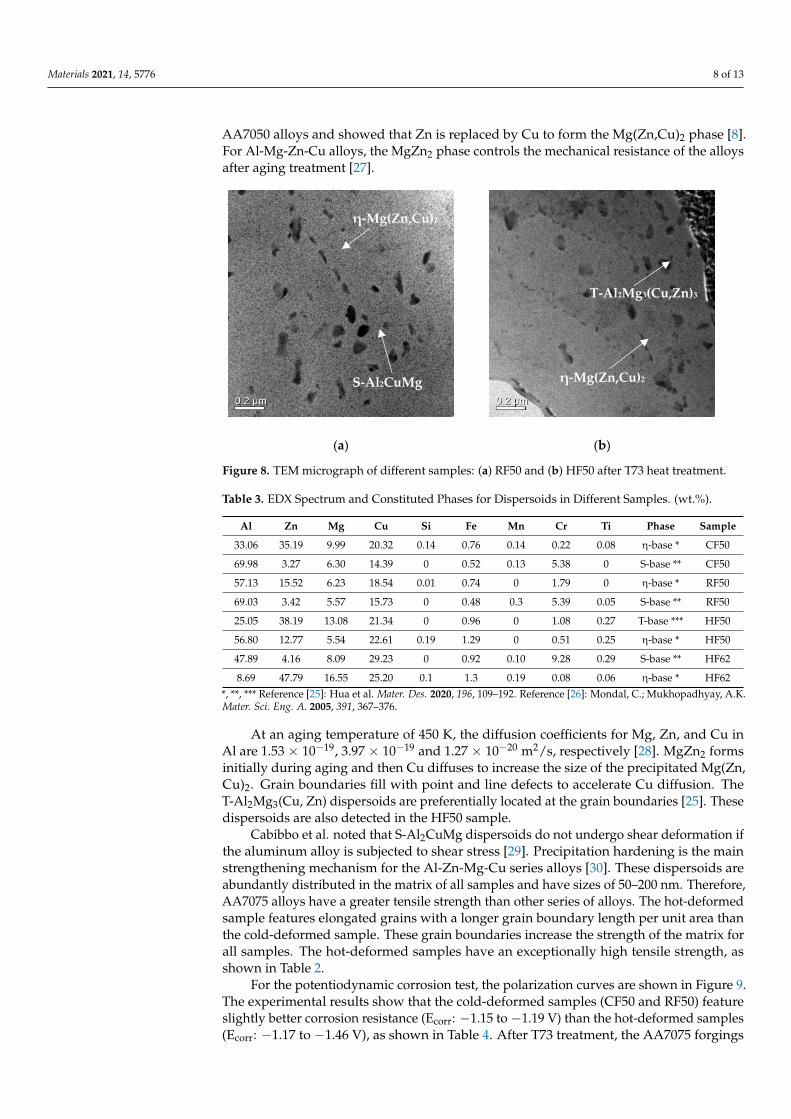
After T73 treatment, dispersoids were produced in the over-aged conditions and these became stable in size. These dispersoids are shown in Figure 8a,b for RF50 and HF50, respectively. The EDX analysis showed the constituted elements of dispersoids, as listed in Table 3. They were Mg(Zn,Cu)2, S-Al2CuMg and T-Al2Mg3(Cu,Zn) bases, as described by Hua et al. [25,26]. Angella and co-workers studied the dispersoids in AA7050 alloys and showed that Zn is replaced by Cu to form the Mg(Zn,Cu)2 phase [8]. For Al-Mg-Zn-Cu alloys, the MgZn2 phase controls the mechanical resistance of the alloys after aging treatment [27].
Figure 6. TEM micrograph of as-forged RF50 showing a nano-sized grains with dense dislocation loops.
Table 3. EDX Spectrum and Constituted Phases for Dispersoids in Different Samples. (wt.%).
Al Zn Mg Cu Si Fe Mn Cr Ti phase Sample 33.06 35.19 9.99 20.32 0.14 0.76 0.14 0.22 0.08 η-base * CF50 69.98 3.27 6.30 14.39 0 0.52 0.13 5.38 0 S-base ** CF50 57.13 15.52 6.23 18.54 0.01 0.74 0 1.79 0 η-base * RF50 69.03 3.42 5.57 15.73 0 0.48 0.3 5.39 0.05 S-base ** RF50 25.05 38.19 13.08 21.34 0 0.96 0 1.08 0.27 T-base *** HF50 56.80 12.77 5.54 22.61 0.19 1.29 0 0.51 0.25 η-base * HF50 47.89 4.16 8.09 29.23 0 0.92 0.10 9.28 0.29 S-base ** HF62 8.69 47.79 16.55 25.20 0.1 1.3 0.19 0.08 0.06 η-base * HF62
*, **, *** Reference [25]: Hua et al. Mater. Des. 2020, 196, 109–192. Reference [26]: Mondal, C.; Mukhopadhyay, A.K. Mater. Sci. Eng. A. 2005, 391, 367–376.
(a)
Figure 5. TEM micrograph of (a) as-forged RF50 and (b) as-forged HF50.
Materials 2021, 14, x FOR PEER REVIEW 7 of 13
(a)
(b)
Figure 5. TEM micrograph of (a) as-forged RF50 and (b) as-forged HF50.
After T73 treatment, dispersoids were produced in the over-aged conditions and these became stable in size. These dispersoids are shown in Figure 8a,b for RF50 and HF50, respectively. The EDX analysis showed the constituted elements of dispersoids, as listed in Table 3. They were Mg(Zn,Cu)2, S-Al2CuMg and T-Al2Mg3(Cu,Zn) bases, as described by Hua et al. [25,26]. Angella and co-workers studied the dispersoids in AA7050 alloys and showed that Zn is replaced by Cu to form the Mg(Zn,Cu)2 phase [8]. For Al-Mg-Zn-Cu alloys, the MgZn2 phase controls the mechanical resistance of the alloys after aging treatment [27].
Figure 6. TEM micrograph of as-forged RF50 showing a nano-sized grains with dense dislocation loops.
Table 3. EDX Spectrum and Constituted Phases for Dispersoids in Different Samples. (wt.%).
Al Zn Mg Cu Si Fe Mn Cr Ti phase Sample 33.06 35.19 9.99 20.32 0.14 0.76 0.14 0.22 0.08 η-base * CF50 69.98 3.27 6.30 14.39 0 0.52 0.13 5.38 0 S-base ** CF50 57.13 15.52 6.23 18.54 0.01 0.74 0 1.79 0 η-base * RF50 69.03 3.42 5.57 15.73 0 0.48 0.3 5.39 0.05 S-base ** RF50 25.05 38.19 13.08 21.34 0 0.96 0 1.08 0.27 T-base *** HF50 56.80 12.77 5.54 22.61 0.19 1.29 0 0.51 0.25 η-base * HF50 47.89 4.16 8.09 29.23 0 0.92 0.10 9.28 0.29 S-base ** HF62 8.69 47.79 16.55 25.20 0.1 1.3 0.19 0.08 0.06 η-base * HF62
*, **, *** Reference [25]: Hua et al. Mater. Des. 2020, 196, 109–192. Reference [26]: Mondal, C.; Mukhopadhyay, A.K. Mater. Sci. Eng. A. 2005, 391, 367–376.
(a)
Figure 6. TEM micrograph of as-forged RF50 showing a nano-sized grains with dense dislocation loops.

Materials 2021, 14, 5776 7 of 13
Materials 2021, 14, x FOR PEER REVIEW 8 of 14
Figure 7. EBSD analysis results: (a,c,e,g) inverse pole figure (IPF) and (b,d,f,h) misorientation angle distribution for (a,b) CF50, (c,d), RF50, (e,f) HF50, and (g,h) HF62 after T73 heat treatment.
(b)
(c) (d)
(e) (f)
(g)
(h)
(a)
Figure 7. EBSD analysis results: (a,c,e,g) inverse pole figure (IPF) and (b,d,f,h) misorientation angledistribution for (a,b) CF50, (c,d), RF50, (e,f) HF50, and (g,h) HF62 after T73 heat treatment.
After T73 treatment, dispersoids were produced in the over-aged conditions andthese became stable in size. These dispersoids are shown in Figure 8a,b for RF50 andHF50, respectively. The EDX analysis showed the constituted elements of dispersoids,as listed in Table 3. They were Mg(Zn,Cu)2, S-Al2CuMg and T-Al2Mg3(Cu,Zn) bases,as described by Hua et al. [25,26]. Angella and co-workers studied the dispersoids in
Materials 2021, 14, 5776 8 of 13
AA7050 alloys and showed that Zn is replaced by Cu to form the Mg(Zn,Cu)2 phase [8].For Al-Mg-Zn-Cu alloys, the MgZn2 phase controls the mechanical resistance of the alloysafter aging treatment [27].
Materials 2021, 14, x FOR PEER REVIEW 9 of 13
(a)
(b)
Figure 8. TEM micrograph of different samples: (a) RF50 and (b) HF50 after T73 heat treatment.
At an aging temperature of 450 K, the diffusion coefficients for Mg, Zn, and Cu in Al are 1.53 × 10⁻¹⁹, 3.97 × 10⁻¹⁹ and 1.27 × 10⁻²⁰ m2/s, respectively [28]. MgZn2 forms initially during aging and then Cu diffuses to increase the size of the precipitated Mg(Zn, Cu)2. Grain boundaries fill with point and line defects to accelerate Cu diffusion. The T-Al2Mg3(Cu, Zn) dispersoids are preferentially located at the grain boundaries [25]. These dispersoids are also detected in the HF50 sample.
Cabibbo et al. noted that S-Al2CuMg dispersoids do not undergo shear deformation if the aluminum alloy is subjected to shear stress [29]. Precipitation hardening is the main strengthening mechanism for the Al-Zn-Mg-Cu series alloys [30]. These dispersoids are abundantly distributed in the matrix of all samples and have sizes of 50–200 nm. There-fore, AA7075 alloys have a greater tensile strength than other series of alloys. The hot-deformed sample features elongated grains with a longer grain boundary length per unit area than the cold-deformed sample. These grain boundaries increase the strength of the matrix for all samples. The hot-deformed samples have an exceptionally high tensile strength, as shown in Table 2.
For the potentiodynamic corrosion test, the polarization curves are shown in Figure 9. The experimental results show that the cold-deformed samples (CF50 and RF50) feature slightly better corrosion resistance (Ecorr: −1.15 to −1.19 V) than the hot-deformed samples (Ecorr: −1.17 to −1.46 V), as shown in Table 4. After T73 treatment, the AA7075 forgings exhibit lower corrosion resistance (Ecorr and Icorr values) than the extruded bar samples (A-T73* in Table 4). The forgings undergo plastic deformation and the grain morphology changes so the microstructure and the corrosion resistance change. The total grain bound-ary length (GBL) of RF50 was computed from Figure 10, which was derived from EBSD test results in Figure 7c, analyzed using HKL-CHANNEL-5 software. The total GBLs and total 2nd-phase particle counts were the metallurgical factors that affected the Ecorr values for AA7075 forgings, as shown in Tables 4–6.
η-Mg(Zn,Cu)2
η-Mg(Zn,Cu)2 S-Al2CuMg
Al
T-Al2Mg3(Cu,Zn)3
Figure 8. TEM micrograph of different samples: (a) RF50 and (b) HF50 after T73 heat treatment.
Table 3. EDX Spectrum and Constituted Phases for Dispersoids in Different Samples. (wt.%).
Al Zn Mg Cu Si Fe Mn Cr Ti Phase Sample
33.06 35.19 9.99 20.32 0.14 0.76 0.14 0.22 0.08 η-base * CF50
69.98 3.27 6.30 14.39 0 0.52 0.13 5.38 0 S-base ** CF50
57.13 15.52 6.23 18.54 0.01 0.74 0 1.79 0 η-base * RF50
69.03 3.42 5.57 15.73 0 0.48 0.3 5.39 0.05 S-base ** RF50
25.05 38.19 13.08 21.34 0 0.96 0 1.08 0.27 T-base *** HF50
56.80 12.77 5.54 22.61 0.19 1.29 0 0.51 0.25 η-base * HF50
47.89 4.16 8.09 29.23 0 0.92 0.10 9.28 0.29 S-base ** HF62
8.69 47.79 16.55 25.20 0.1 1.3 0.19 0.08 0.06 η-base * HF62*, **, *** Reference [25]: Hua et al. Mater. Des. 2020, 196, 109–192. Reference [26]: Mondal, C.; Mukhopadhyay, A.K.Mater. Sci. Eng. A. 2005, 391, 367–376.
At an aging temperature of 450 K, the diffusion coefficients for Mg, Zn, and Cu inAl are 1.53 × 10⁻¹⁹, 3.97 × 10⁻¹⁹ and 1.27 × 10⁻²⁰ m2/s, respectively [28]. MgZn2 formsinitially during aging and then Cu diffuses to increase the size of the precipitated Mg(Zn,Cu)2. Grain boundaries fill with point and line defects to accelerate Cu diffusion. TheT-Al2Mg3(Cu, Zn) dispersoids are preferentially located at the grain boundaries [25]. Thesedispersoids are also detected in the HF50 sample.
Cabibbo et al. noted that S-Al2CuMg dispersoids do not undergo shear deformation ifthe aluminum alloy is subjected to shear stress [29]. Precipitation hardening is the mainstrengthening mechanism for the Al-Zn-Mg-Cu series alloys [30]. These dispersoids areabundantly distributed in the matrix of all samples and have sizes of 50–200 nm. Therefore,AA7075 alloys have a greater tensile strength than other series of alloys. The hot-deformedsample features elongated grains with a longer grain boundary length per unit area thanthe cold-deformed sample. These grain boundaries increase the strength of the matrix forall samples. The hot-deformed samples have an exceptionally high tensile strength, asshown in Table 2.
For the potentiodynamic corrosion test, the polarization curves are shown in Figure 9.The experimental results show that the cold-deformed samples (CF50 and RF50) featureslightly better corrosion resistance (Ecorr: −1.15 to −1.19 V) than the hot-deformed samples(Ecorr: −1.17 to −1.46 V), as shown in Table 4. After T73 treatment, the AA7075 forgings

Materials 2021, 14, 5776 9 of 13
exhibit lower corrosion resistance (Ecorr and Icorr values) than the extruded bar samples(A-T73* in Table 4). The forgings undergo plastic deformation and the grain morphologychanges so the microstructure and the corrosion resistance change. The total grain boundarylength (GBL) of RF50 was computed from Figure 10, which was derived from EBSD testresults in Figure 7c, analyzed using HKL-CHANNEL-5 software. The total GBLs and total2nd-phase particle counts were the metallurgical factors that affected the Ecorr values forAA7075 forgings, as shown in Tables 4–6.
Shih et al. noted that HAGBs are attacked by anions, which are seen as gray lineswhen AA6082-T6 samples are immersed in salt water [23]. The electron current underneaththe corroded particles increases, thus, corrosion is accelerated. The total lengths of HAGBsand 2nd phase particle counts per unit area synergistically accelerate corrosion so the Icorrvalue increases [23]. For this study, CF50 has the longest HAGBs length per unit areaand the maximum 2nd phase particle counts per unit area (956 counts/mm2) so the Icorrand Ipit values are the highest out of all the samples, as shown in Figure 11 and Table 4.HF50 features the shortest HAGBs per unit area and particles at 544 counts/mm2 so ithas the lowest Icorr value for all samples. The 2nd phase particle counts and the HAGBslengths were used to determine the Icorr values. Table 6 shows the measured 2nd phaseparticle counts per unit area for different samples. The particle size ranged from 0.2 µm to10–15 µm.
The 2nd phase particles are believed to contain Mg, Zn, Cu, and some Fe [31,32]. TheCF50 obtained the longest HAGBs per unit area in combination of the greatest amounts ofparticles (956 counts/mm2) to accelerate corrosion and had the maximum Icorr value. TheHF50 and RF50 received similar Icorr values but RF50 had longer HAGB lengths per unitarea and more particle counts. This could be affected by the locations of the particles at, ornear, HAGBs, which is not discussed in this study.
Materials 2021, 14, x FOR PEER REVIEW 10 of 13
Figure 9. Polarization curves from different samples immersed in a 3.5 wt.% NaCl solution.
Figure 10. High angle grain boundaries (>15°) measured from RF50.
Table 4. Polarization Curves for Different Samples Immersed in a 3.5 wt.% NaCl Solution.
Sample Ecorr(V) Icorr(A/cm2) Epit(V) Ipit(A/cm2) A-T73* −1.11 2.71 × 10⁻⁷ NA NA CF50 −1.15 1.02 × 10⁻⁵ −0.70 2.30 × 10⁻⁴ RF50 −1.19 4.45 × 10⁻⁶ −0.71 3.42 × 10⁻⁵ HF50 −1.17 4.12 × 10⁻⁶ −0.72 2.43 × 10⁻⁵ HF62 −1.46 8.96 × 10⁻⁶ −0.69 3.89 × 10⁻⁵
Table 5. Total Grain Boundary Lengths Per Unit Area (mm/mm2) for Different Samples.
Sample Code Total Grain Boundary Lengths per Unit Area (mm/mm2) CF50 28.5 RF50 17.4 HF50 37.2 HF62 66.9
Shih et al. noted that HAGBs are attacked by anions, which are seen as gray lines when AA6082-T6 samples are immersed in salt water [23]. The electron current under-neath the corroded particles increases, thus, corrosion is accelerated. The total lengths of HAGBs and 2nd phase particle counts per unit area synergistically accelerate corrosion so
Figure 9. Polarization curves from different samples immersed in a 3.5 wt.% NaCl solution.
Table 4. Polarization Curves for Different Samples Immersed in a 3.5 wt.% NaCl Solution.
Sample Ecorr(V) Icorr(A/cm2) Epit(V) Ipit(A/cm2)
A-T73 * −1.11 2.71 × 10⁻⁷ NA NACF50 −1.15 1.02 × 10⁻⁵ −0.70 2.30 × 10⁻⁴
RF50 −1.19 4.45 × 10⁻⁶ −0.71 3.42 × 10⁻⁵
HF50 −1.17 4.12 × 10⁻⁶ −0.72 2.43 × 10⁻⁵
HF62 −1.46 8.96 × 10⁻⁶ −0.69 3.89 × 10⁻⁵
* The AA7075 extruded bar samples after solution treatment (748 K/90 min) and T73 aging (Nat-ural aging 3 daysplus 383 K/8h and 448 K/8h).

Materials 2021, 14, 5776 10 of 13
1
Figure 10. High angle grain boundaries (>15◦) measured from RF50.
Table 5. Total Grain Boundary Lengths Per Unit Area (mm/mm2) for Different Samples.
Sample Code Total Grain Boundary Lengths per Unit Area (mm/mm2)
CF50 28.5RF50 17.4HF50 37.2HF62 66.9
Table 6. Measured 2nd Phase Particle Size Distribution for Samples from Optical Micrographs;Particles Counted from 1 µm to Maximum Size in Each Sample (CF50, RF50, HF50, and HF62).
Samples2nd Phase Particle Counts, (#/mm2)
Max.Diameter
AverageDiameter
0.2–1µm
1–5µm
5–10Mm
>10µm Total 2nd Phase Particles (µm)
CF50 663 281 11 1 956 14.4 1.1RF50 322 269 8 0 599 9.6 1.3HF50 317 216 11 0 544 9.0 1.2HF62 570 199 3 0 714 8.9 0.9

Materials 2021, 14, 5776 11 of 13
Materials 2021, 14, x FOR PEER REVIEW 11 of 13
the Icorr value increases [23]. For this study, CF50 has the longest HAGBs length per unit area and the maximum 2nd phase particle counts per unit area (956 counts/mm2) so the Icorr and Ipit values are the highest out of all the samples, as shown in Figure 11 and Table 4. HF50 features the shortest HAGBs per unit area and particles at 544 counts/mm2 so it has the lowest Icorr value for all samples. The 2nd phase particle counts and the HAGBs lengths were used to determine the Icorr values. Table 6 shows the measured 2nd phase particle counts per unit area for different samples. The particle size ranged from 0.2 μm to 10–15 μm.
The 2nd phase particles are believed to contain Mg, Zn, Cu, and some Fe [31,32]. The CF50 obtained the longest HAGBs per unit area in combination of the greatest amounts of particles (956 counts/mm2) to accelerate corrosion and had the maximum Icorr value. The HF50 and RF50 received similar Icorr values but RF50 had longer HAGB lengths per unit area and more particle counts. This could be affected by the locations of the particles at, or near, HAGBs, which is not discussed in this study.
Figure 12 shows the corroded HF62 after the polarization test. An oxide layer was deposited onto the corroded surface. During the test, chloride ions attacked and diffused preferentially into the substrate of the sample via HAGBs. The 2nd phase particles with a size of less than 0.2 μm to about 8 μm were located underneath the sample surface, as shown in Figure 12. If a particle was located at, or near, the HAGBs, it linked the corrosion cracks and likely accelerated corrosion. Both the 2nd phase particles and the HAGBs affect the corrosion resistance of samples.
Figure 11. Relationship between Icorr and total HAGBs grain boundary lengths per unit area (mm/mm2) for different samples; total particle counts (particle size >0.2μm) are included.
Table 6. Measured 2nd Phase Particle Size Distribution for Samples from Optical Micrographs; Par-ticles Counted from 1 μm to Maximum Size in Each Sample (CF50, RF50, HF50, and HF62).
Samples
2nd Phase Particle Counts, (#/mm2) Max. Diameter
Average Diameter
0.2–1 μm
1–5 μm
5–10 Μm
> 10 μm Total 2nd phase Particles (μm)
CF50 663 281 11 1 956 14.4 1.1
RF50 322 269 8 0 599 9.6 1.3
HF50 317 216 11 0 544 9.0 1.2
HF62 570 199 3 0 714 8.9 0.9
Figure 11. Relationship between Icorr and total HAGBs grain boundary lengths per unit area(mm/mm2) for different samples; total particle counts (particle size >0.2µm) are included.
Figure 12 shows the corroded HF62 after the polarization test. An oxide layer wasdeposited onto the corroded surface. During the test, chloride ions attacked and diffusedpreferentially into the substrate of the sample via HAGBs. The 2nd phase particles witha size of less than 0.2 µm to about 8 µm were located underneath the sample surface, asshown in Figure 12. If a particle was located at, or near, the HAGBs, it linked the corrosioncracks and likely accelerated corrosion. Both the 2nd phase particles and the HAGBs affectthe corrosion resistance of samples.
Materials 2021, 14, x FOR PEER REVIEW 12 of 13
Figure 12. The corroded HF62 sample; including the oxide layer on the surface, trapped fine parti-cles in the substrate and corrosion cracks.
4. Conclusions A series of forging parameters were arranged and studied in the experiments. Results
indicated that decreasing forging temperature to RT could be effective at enhancing the toughness from 53.9 × 10⁻⁶ J/m3 to 70.5 × 10⁻⁶ J/m3. This is significant to get an increase of about 40% in toughness to resist tensile fracture. These experimental data are valuable for materials designers who plan to apply forged AA7075 alloys in constructing engineering parts. For technical databases, the important results could be summarized as follows; hot forgings: 547–590 MPa in UTS, 492–538 MPa in YS, 13–14% elongation and moderate cor-rosion resistance of Ecorr (−1.17 V to −1.46 V) and Icorr (4.1 × 10⁻⁶ to 8.9 × 10⁻⁶ A/cm2); cold forgings enhanced elongation (16–17%) and toughness (71 × 10−6 J/m3) and resistance to tensile fracture, enhanced Ecorr values (−1.15 to −1.19 V) and Icorr values (1.02 × 10⁻⁵ to 4.45 × 10⁻⁶ A/cm2).
The corrosion resistance of AA7075 forgings was affected by the resultant microstruc-tures. Increasing HAGBs lengths per unit area and 2nd-phase particle counts accelerated the corrosion to increase the Icorr value when the forged AA7075 alloys were in contact with salt water.
Author Contributions: Conceptualization, T.-S.S.; experiment, H.-T.H.; formal analysis and inves-tigation, T.-S.S., H.-T.H. and L.-R.H.; writing—review and editing, T.-S.S. and L.-R.H. All authors have read and agreed to the published version of the manuscript.
Funding: The authors greatly appreciate the financial support of the Ministry of Science and Tech-nology in Taiwan under grant MOST-01 109-2221-E-008-042.
Institutional Review Board Statement: Not applicable.
Informed Consent Statement: Not applicable.
Data Availability Statement: Not applicable.
Acknowledgments: The authors wish to express thanks for the National Central University for un-dertaking the SEM and TEM tests and the National Taiwan University for the EBSD tests.
Conflicts of Interest: The authors declare no conflict of interest.
References 1. Viana, F.; Pinto, A.M.P.; Santos, H.M.C.; Lopes, A.B. Retrogression and re-ageing of 7075 aluminium alloy: Microstructural
characterization. J. Mater. Process. Technol. 1999, 92–93, 54–59. 2. Umamaheshwer Rao, A.C.; Vasu, V.; Govindaraju, M.; Sai Srinadh, K.V. Stress corrosion cracking behavior of 7xxx aluminum
alloys: A literature review. TNMSC 2016, 26, 1447–1471.
Corroded surface
Figure 12. The corroded HF62 sample; including the oxide layer on the surface, trapped fine particlesin the substrate and corrosion cracks.
4. Conclusions
A series of forging parameters were arranged and studied in the experiments. Resultsindicated that decreasing forging temperature to RT could be effective at enhancing thetoughness from 53.9 × 10⁻⁶ J/m3 to 70.5 × 10⁻⁶ J/m3. This is significant to get an increaseof about 40% in toughness to resist tensile fracture. These experimental data are valuable formaterials designers who plan to apply forged AA7075 alloys in constructing engineeringparts. For technical databases, the important results could be summarized as follows;hot forgings: 547–590 MPa in UTS, 492–538 MPa in YS, 13–14% elongation and moderatecorrosion resistance of Ecorr (−1.17 V to −1.46 V) and Icorr (4.1 × 10⁻⁶ to 8.9 × 10⁻⁶ A/cm2);cold forgings enhanced elongation (16–17%) and toughness (71 × 10−6 J/m3) and resistanceto tensile fracture, enhanced Ecorr values (−1.15 to −1.19 V) and Icorr values (1.02 × 10⁻⁵
to 4.45 × 10⁻⁶ A/cm2).

Materials 2021, 14, 5776 12 of 13
The corrosion resistance of AA7075 forgings was affected by the resultant microstruc-tures. Increasing HAGBs lengths per unit area and 2nd-phase particle counts acceleratedthe corrosion to increase the Icorr value when the forged AA7075 alloys were in contactwith salt water.
Author Contributions: Conceptualization, T.-S.S.; experiment, H.-T.H.; formal analysis and investi-gation, T.-S.S., H.-T.H. and L.-R.H.; writing—review and editing, T.-S.S. and L.-R.H. All authors haveread and agreed to the published version of the manuscript.
Funding: The authors greatly appreciate the financial support of the Ministry of Science and Tech-nology in Taiwan under grant MOST-01 109-2221-E-008-042.
Institutional Review Board Statement: Not applicable.
Informed Consent Statement: Not applicable.
Data Availability Statement: Not applicable.
Acknowledgments: The authors wish to express thanks for the National Central University forundertaking the SEM and TEM tests and the National Taiwan University for the EBSD tests.
Conflicts of Interest: The authors declare no conflict of interest.
References1. Viana, F.; Pinto, A.M.P.; Santos, H.M.C.; Lopes, A.B. Retrogression and re-ageing of 7075 aluminium alloy: Microstructural
characterization. J. Mater. Process. Technol. 1999, 92–93, 54–59. [CrossRef]2. Umamaheshwer Rao, A.C.; Vasu, V.; Govindaraju, M.; Sai Srinadh, K.V. Stress corrosion cracking behavior of 7xxx aluminum
alloys: A literature review. TNMSC 2016, 26, 1447–1471.3. Savas, T.P.; Earthman, J.C. Surface Characterization of 7075-T73 Aluminum Exposed to Anodizing Pretreatment Solutions.
J. Mater. Eng. Perform. 2008, 17, 674–681. [CrossRef]4. Miera, M.S.de.; Curioni, M.; Skeldon, P.; Thompson, G.E. Preferential anodic oxidation of second-phase constituents during
anodising of AA2024-T3 and AA7075-T6 alloys . Surf. Interface Anal. 2010, 42, 241–246. [CrossRef]5. Miera, M.S.de.; Curioni, M.; Skeldon, P.; Thompson, G.E. The behaviour of second phase particles during anodizing of aluminium
alloys. Corros. Sci. 2010, 52, 2489–2497. [CrossRef]6. Cirik, E.; Genel, K. Effect of anodic oxidation on fatigue performance of 7075-T6 alloy. Surf. Coat. Technol. 2008, 202,
5190–5201. [CrossRef]7. Kuhlman, G.W. ASM Handbook, Volume 14A: Metalworking: Bulk Forming; Semiatin, S.L., Ed.; Metalworking Consultant Group
LLC: Mentor, OH, USA, 2005; pp. 299–312.8. Angella, G.; Schino, A.D.; Donnini, R.; Richetta, M.; Testani, C.; Varone, A. AA7050 Al Alloy Hot-Forging Process for Improved
Fracture Toughness Properties. Metal 2019, 9, 64. [CrossRef]9. Ngernbamrung, S.; Suzuki, Y.; Takatsuju, N.; Dohda, K. Investigation of suface cracking of hot-extruded AA7075 billet. Procedia
Manuf. 2018, 15, 217–224.10. Krishna, K.G.; Sivaprasad, K.; Venkateswarlu, K.; HariKumar, K.C. Microstructural Evolution and Aging Behavior of Cryorolled
Al-4Zn-2Mg Alloy. Mater. Sci. Eng. A 2012, 535, 129–135. [CrossRef]11. Das, P.; Rengaswamy, J.; Singh, I.V. Tensile and Impact-Toughness Behaviour of Cryorolled Al 7075 Alloy. Mater. Des. 2011, 32,
1298–1305. [CrossRef]12. Panigrahi, S.K.; Jayaganthan, R. Effect of Ageing on Microstructure and Mechanical Properties of Bulk, Cryorolled, and Room
Temperature Rolled Al 7075 Alloy. J. Alloys Compd. 2011, 509, 9609–9616. [CrossRef]13. Yin, J.; Lu, J.; Ma, H.; Zhang, P. Nanostructural Formation of Fine Grained Aluminum Alloy by Severe Plastic Deformation at
Cryogenic Temperature. J. Mater. Sci. 2004, 39, 2851–2854. [CrossRef]14. Jayaganthan, R.; Brokmeier, H.G.; Schwebke, S.; Panigrah, S.K. Microstructure and texture evolution in cryorolled Al 7075 alloy.
J. Alloys Compd. 2010, 496, 183–188. [CrossRef]15. Sun, Z.C.; Zheng, L.S.; Yang, H. Softening mechanism and microstructure evolution of as-extruded 7075 aluminum alloy during
hot deformation. Mater. Charact. 2014, 90, 71–80. [CrossRef]16. Feng, D.; Wang, G.; Chen, H.; Zhang, X.M. Effect of Grain Size Inhomogeneity of Ingot on Dynamic Softening Behavior and
Processing Map of Al-8Zn-2Mg-2Cu alloy. Met. Mater. Int. 2018, 24, 195–204. [CrossRef]17. Feng, D.; Zhang, X.M.; Liu, S.D.; Deng, Y.L. Constitutive equation and hot deformation behavior of homogenized Al-7.68Zn-
2.12Mg-1.98Cu-0.12Zr alloy during compression at elevated temperature. Mater. Sci. Eng. A 2014, 608, 63–72. [CrossRef]18. Yang, Y.; Zhang, Z.; Li, X.; Wang, Q.; Zhang, Y. The effects of grain size on the hot deformation and processing map for 7075
aluminum alloy. Mater. Des. 2013, 51, 592–597. [CrossRef]19. Rokni, M.R.; Zarei-HAnzaki, A.; Roostaei, A.; Abedi, H.R. An Investigation into the hot deformation characteristics of 7075
aluminum alloy. Mater. Des. 2011, 32, 2339–2344. [CrossRef]

Materials 2021, 14, 5776 13 of 13
20. Zuo, J.; Hou, L.; Shi, J.; Cui, H.; Zhuang, L.; Zhang, J. Effect of deformation induced precipitation on grain refinement andimprovement of mechanical properties of AA7055 alluminum alloy. Mater. Charact. 2017, 130, 123–134. [CrossRef]
21. Gupta, R.K.; Kumar, V.A.; Krishnan, A.S.; Niteshraj, J. Hot Deformation Behavior of Aluminum Alloys AA7010 and AA7075.J. Mater. Eng. Perform. 2019, 28, 5021–5038. [CrossRef]
22. Khan, M.A.; Wang, Y.; Yasin, G.; Nazeer, F.; Malik, A.; Khan, W.Q.; Ahmad, T.; Zhang, H.; Afifi, M.A. The effect of strain rates on themicrostructure and the mechanical properties of an over-aged Al-Zn-Mg-Cu alloy. Mater. Charact. 2020, 167, 110472. [CrossRef]
23. Shih, T.S.; Lin, S.T.; Hwang, L.R. Factors Affecting Toughness and Corrosion Resistance of AA6082 Forgings. J. Mater. Eng.Perform. 2021, 30, 367–378. [CrossRef]
24. Xiao, G.; Jiang, J.; Liu, Y.; Wang, Y.; Guo, B. Recrystallization and microstructure evolution of hot extruded 7075 aluminum alloyduring semi-solid isothermal treatment. Mater. Charact. 2019, 156, 109874. [CrossRef]
25. Hua, L.; Hu, X.; Han, X. Microstructure evolution of annealed 7075 aluminum alloy and its influence on room-temperatureplasticity. Mater. Des. 2020, 196, 109–192. [CrossRef]
26. Mondal, C.; Mukhopadhyay, A.K. On the nature of T(Al2Mg3Zn3) and S(Al2CuMg) phases present in as-cast and annealed 7055aluminum alloy. Mater. Sci. Eng. A 2005, 391, 367–376. [CrossRef]
27. Lang, Y.; Cui, H.; Cai, Y.; Zhang, J. Evolution of nanometer precipitates in AA7050 Alloy subjected to overaging treatment andwarm deformation. In Proceedings of the 13th International Conference on Aluminum Alloys (ICAA13), Pittsburgh, PA, USA,3–7 June 2012; Weiland, H., Rollett, A.D., Cassada, W.A., Eds.; Springer: Cham, Switzerland, 2012; pp. 1223–1226.
28. Du, Y.; Chang, Y.A.; Huang, B.; Gong, W.; Jin, Z.; Xu, H.; Yuan, Z.; Liu, Y.; He, Y.; Xie, F.Y. Diffusion coefficients of some solutes infcc and liquid Al: Critical evaluation and correlation. Mater. Sci. Eng. A 2003, 363, 140–151. [CrossRef]
29. Cabibbo, M. Microstructure strengthening mechanisms in different equal channel angular pressed aluminum alloys. Mater. Sci.Eng. A 2012, 560, 413–432. [CrossRef]
30. Ma, K.; Wen, H.; Hu, T.; Topping, T.D.; Isheim, D.; Seidman, D.N.; Lavernia, E.J.; Schoenung, J.M. Mechanical behavior andstrengthening mechanisms in ultrafine grain precipitation-strengthend aluminum alloy. Acta Mater. 2014, 62, 141–155. [CrossRef]
31. Fan, X.; Jiang, D.; Meng, Q.; Zhong, L. The microstructural evolution of an Al-Zn-Mg-Cu alloy during homogenization. Mater.Lett. 2006, 60, 1475–1479. [CrossRef]
32. Andreatta, F.; Terryn, H.; de Wit, J.H.W. Corrosion behaviour of different tempers of AA7075 aluminum alloy. Electrochim. Acta2004, 49, 2851–2862. [CrossRef]