Exp1 Tensile Test
29
MECHANICS AND MATERIALS LAB SEMESTER 2 (2014/2015) Experiment 1: TENSILE TEST Author’s Name : Sures A/l Sambathan Muthaliayar Group Number : 3 Matrix No : ME092638 Section : 07 Performed date : 16/12/2014 Due date : 29/12/2014 Lab instructor : Dr. Yee Wee Sing 1
-
Upload
independent -
Category
Documents
-
view
0 -
download
0
Transcript of Exp1 Tensile Test

MECHANICS AND MATERIALS LABSEMESTER 2 (2014/2015)
Experiment 1: TENSILE TEST
Author’s Name : Sures A/l Sambathan MuthaliayarGroup Number : 3Matrix No : ME092638Section : 07Performed date : 16/12/2014Due date : 29/12/2014Lab instructor : Dr. Yee Wee Sing
1

CONTENTS
TITLE PAGE
SUMMARY 3
OBJECTIVE 4
THEORY 4
EQUIPEMENT/DESCRIPTION OF EXPERIMENTALAPPARATUS
6
PROCEDURE 11
DATA & OBESERVATIONS 13
ANALYSIS & RESULTS 16
DISCUSSIONS 22
CONCLUSIONS 23
REFERENCES 24
2

SUMMARY
This experiment is known as Tensile Test (Universal Tester). The purpose of the test is to verify the Stress-Strain relationship of materials and to determine some mechanical properties of the materials.
WP 300 will be used and the test pieces are Aluminium and Brass. The properties of the equipment are first learned and the specimens’ specifications are jotted down. Some of the formulas for modulus of elasticity, engineering stress, engineering strain and elongation at fracture are introduced here.
The experimental procedures are carried out. The readings of elongation and its corresponding force are taken and tabulated. Based on these values, the stress and strain valuesare then calculated. Graphs of force against elongation are then drawn and the stress-strain diagrams for both test pieces. The mechanical properties such as Modulus of Elasticity, elongation at fracture, tensile and yield strengthare obtained from those graphs drawn.
3

OBJECTIVES
1. To understand the principles of tensile testing2. To determine the stress-strain relationship for two
typesd of material3. To determine the value of:
a) Elongation of structureb) Tensile strength (UTS)c) Yield strength (offset of 0.2%)d) Modulus of elasticity
THEORY
If a load is static or changed relatively slowly with time andis applied uniformly over a crosssection /surface of a member, the mechanical behaviour may be ascertained by a simple stress-strain test. These tests are most commonly conducted for metals at room temperature. There are three principal ways in which the load may be applied: tension, compression and shear.
Tension is one of the most common mechanical stress-strain tests. The stress-strain diagramshows the different behaviour of the individual materials particularly clearly. Each material has a characteristic pattern of stress and strain. A standard specimen is deformed,usually to fracture with a gradually increasing tensile load that is applied uniaxial along the long axis of a specimen. Most of the tension tests for metals are conducted according to the ASTM Standard E 8 and E 8M, “Standard Test Methods for Tension Testing of Metallic Materials”.
a) Fundamental Principles of the Tensile Test
The tensile test is the best known test in material testing. It confirms tensile fitness, the most basic grounds of material. Also, its moreover possible to confirm stretching at break as a sturdiness estimation ofthe material.
In the tensile test, a mono-axial stretch is made in a material sample. This anxiety is consolidated by method
4

of outside stacking of the example in a longitudinal bearing through a tensile drive. There is then an even dispersal of straight push in the test cross-section of the example.
To confirm the ability of the material, stacking of the specimen is slowly and constantly fabricated until it founders. The most max test contain incident is an estimation of the capability of the material. The chargedtensile value, RM is processed from the most utmost test force, FB and the starting cross-fragment zone, A0 of theexample:
The most fundamental route to of guaranteeing the most extreme test compel is by method of the most maximum pointer on the force showcase. In the tensile test itself, the cross-fragment of the illustration is diminished – its gagged and the precise pesters are quitehigher.
The development at break, an indicate the acclimatizationin length of the case differentiated and its introductorylength, L0 and is figured using the length, LU of the illustration taking after break:
A=LU−L0L0
×100%
To measure the lengths, a few measuring checks are had a cooperation with the test bar. Accompanying split, numerous conclusions of the case are situated as one unitperfectly at the break show and the division between the some measuring stamps is measured.
b) Fundamental Principles of Stress-Strain Diagram
The stress-strain graph (Figure 1) indicates the offbeat behaviour of the distinct materials absolutely plainly. Every material has a their own characteristic pattern of stress and strain.
5
RM=FBA0

Important material information could be perused from the stress-strain graph. Notwithstanding tensile quality, RM,the point of confinement proportionality, RP is especially fascinating. Beneath this point of confinement, the material submits to Hooke's Law with theModulus of Flexibility, E: Strain, ε is corresponding to stress, σ
E=σε
When this stress is passed, bending is no longer relative to the trouble.
One specific imperative parameter from specialized outlook is the yield indicate, RE. From this centre onwards, the materialwinds up being enduringly plastically deformed. Deformation remains when load is assuaged. To guard the function of the section, it may simultaneously not be stacked any further.
With certain materials, for instance reinforced sensitive steel, kept up creeping happens from the yield onwards. The case is broadened without the trouble being broadened push. Inmaterials without avowed creeping, the affirmation stress Rp0.2 is specified. In entirely an awesome case, the material
6

has a unending amplification of 0.2% which remains accompanying accommodate of the burden.
The hardened steel blasts virtually without plastic miss happening but has an actually uplifted tensile value. The tempered steel is far tougher but still has a towering capacity. The fragile reinforced steel has an especially increased prolongation but a level tensile capability. In thiscase, there is indicated slithering in the transition to plastic behaviour. In the aluminium mix, the antsiness-strain bow risings less steeply in the adaptable zone than the distinctive steel materials in light of the compliment modulusof adaptability.
The anxiety-strain graph is processed from the qualities for strength and the stretching recorded the same time as the tensile test.
σ= F
A0 andε=
LU−L0L0
TECHNICAL DESCRIPTION AND EQUIPMENT
The WP 300 material testing device is a robust unit designed specifically for technical instruction and is one of the classical materials testing device in materials science. The flexible design of the unit permits a wide range of different tests requiring tensile or compressive force. Thanks to its clear, sample layout, the unity is ideally suited for both students’ experiments and for demonstrations. Its compact dimensions and relatively low weight permit mobile use and erection on all common laboratory benches.
7

BASIC
In its basic form, the unit does not require any external connections. The test force is generated via a manually actuated hydraulic system and displayed via a large, easily legible display instrument with a trailing pointer. Elongationof the samples is recorded via a dial gauge. All accessories are screwed to the cross members. This means that the test unit can be quickly and easily refitted for various tests. Thebasic unit essentially consists of the following elements:
machine base (1) with handgrip (11) support with cross-head (2) load frame with upper (3) and lower cross-member (4) hydraulic system consisting of a main cylinder (5) and a master cylinder with hand wheel (6) force display (7) elongation display via a dial gauge (8) gripping heads (9) with sample (10)
8

MACHINEBASE
The rigid machine base made of cast iron forms the foundation and ensures stability of the test unit in connection with 4 rubbers feat. The machine base supports the hydraulics and theframe.
SUPPORT
The posts (1) and cross-head (2) form fixed support of the test unit. The various fixed sample receptacles are fastened to the cross-head. The mobile load frame is also mounted on itlow friction linear ball bearings.
LOAD FRAME
9

The load frame consists of the upper (1) and lower cross-member (2) and the guide rod (3). The load frame transmits thetest force from the hydraulic main cylinder to the relevant sample. The load frame is slide-mounted in the cross-head of the support. Tensile samples are clamped between the upper cross-member and the cross-head, whilst compressive samples are clamped between the lower cross-member and the cross-head.
HYDRAULIC SYSTEM
The test force is generated by hydraulic means. A piston in the master cylinder (2) actuated via the hand wheel (1) and the threaded spindle creates a hydrostatic pressure, which induces the test force in the main cylinder (3). The hydraulictransmission ration is 2.77:1, whilst the mechanical transmission ratio hand wheel / spindle is 503:1. Excluding friction losses, this would correspond to a manual force of 1 N per 1.3 kN test force. The full stroke of the main cylinder of 45 mm requires 83 revolutions of the hand wheel.
10

FORCE DISPLAY & ELONGATION MEASUREMENT
The force measuring device operates according to the manometerprinciple. It measures the hydrostatic pressure in the hydraulic system. The large display with a diameter of 160 mm facilitates precise reading. A maximum pointer stores the maximum force. The elongation is measured via an adjustable mounted dial gauge. The dial gauge indicates the relative displacement between the upper cross member and the cross-head.
GRIPPING HEADS
The gripping heads are designed for tensile samples with an M10 threaded head. In addition, flat compression pads can easily be inserted in the crosshead and cross-member and are held by nut.
11

TENSILE SAMPLE
Round samples with an M10 threaded head in accordance with DIN50125 made of aluminium, copper, brass and steel are supplied with the machine. Tensile sample B6 x 30 DIN 50125.This is a short proportional test bar with a measuring length of 30 mm and a diameter of 6 mm.
12

PROCEDURE
1. The test device was set up as follows:
The hand wheel on the master cylinder was untwist till its finally reach its limit and the load frame is the relocated down to its lowest position. (if this has not been done, insert the gripping heads in the upper cross-member and crosshead).
The gripping heads is screwed down with the short bolt atthe bottom and withpressure pad.
Gripping head with the long bolt at the top.
2. The required tensile sample was inserted into the device.
The test length LO of the sample between two marks has been measured and jotted down.
13

The sample was screwed by hand into the lower gripping head as far as the end stop.
The sample is then screwed into the upper gripping head as far as the end stop, by rotating the gripping head itself.
The nut was tightened on the upper gripping head by hand until the gripping head is seated without slack in the upper cross-member.
The dial gauge adjusted The dial gauge is forced upwards on the support bar until
the tracer pin is touching the drive. The rotating scale on the dial gauge was set to zero. The maximum pointer on the force display to was set zero. The tensile sample was slowly and constantly loaded by
rotating the hand wheel. The application of the force has been spread on the
tensile sample over a time interval of 5-10 minutes A sudden jerky force application is crucial to be
avoided. The dial gauge and the sample were observed. For the initial 1 mm extension, the force value for every
0.1 mm extension were recorded. Above 1 mm extension, the force value for every 0.2 mm
extension were recorded. The tensile sample were monitored and jotted down when
constriction begins. From now on, the force will be no longer increase, but instead, will tend to decrease.
14

ATTENTION: don’t be startled! Particularly with some material, fracture will occur with a loud bang.
The sample was remove from the gripping heads The hand wheel on the master cylinder was twisted as far
as it will go and move the load frame down. The following steps above were rrepeated with the other
specimen.
15

DATA AND OBSERVATION
Table 1 : Data for Aluminum
L = 28mm
d = 6.4mm
Elongation (mm), L- L0
Force (kN) Stress, (MPa)
Strain,
0.00 0.00 0 00.10 0.00 0 0.003570.20 0.00 0 0.007140.30 0.15 4.663 0.010710.40 0.65 20.205 0.014290.50 2.20 68.387 0.017860.60 3.80 118.122 0.021430.70 5.30 164.750 0.025000.80 6.10 189.618 0.028571.00 6.50 202.052 0.035711.20 6.80 211.377 0.042861.40 6.90 214.486 0.050001.60 7.20 223.811 0.057141.80 7.30 226.919 0.064292.00 7.60 236.250 0.071432.20 7.60 236.250 0.078572.40 7.60 236.250 0.085712.60 7.60 236.250 0.092862.80 7.60 236.250 0.100003.00 7.20 223.811 0.107143.20 6.80 211.377 0.114293.40 6.60 205.160 0.121433.60 6.60 205.160 0.128573.80 6.30 195.834 0.135714.00 6.10 189.618 0.142864.20 6.00 186.509 0.150004.40 5.70 177.184 0.157144.60 5.40 167.858 0.162494.80 FRACTURE
The material undergoes fracture and splits into half at an elongation of 4.80 mm.
16

17

Table 2 : Data for Brass
L = 30mm
d = 5.9mm
Elongation (mm), L- L0
Force (kN) Stress, (MPa)
Strain,
0.00 0.00 0 00.10 0.80 29.261 0.003330.20 1.50 54.865 0.006670.30 2.80 102.414 0.010000.40 4.20 153.621 0.013330.50 6.40 234.089 0.016670.60 8.80 321.873 0.020000.70 10.50 384.053 0.023330.80 11.40 416.971 0.026671.00 12.20 446.234 0.033331.20 12.60 460.863 0.040001.40 13.00 475.494 0.046671.60 13.20 482.809 0.053331.80 13.40 490.124 0.060002.00 13.60 497.440 0.066672.20 13.70 501.097 0.073332.40 13.80 504.755 0.080002.60 13.80 504.755 0.086672.80 13.80 504.755 0.093333.00 13.80 504.755 0.100003.20 13.80 504.755 0.106673.40 14.00 512.070 0.113333.60 14.00 512.070 0.120003.80 14.00 512.070 0.126674.00 13.60 497.440 0.133334.20 FRACTURE
The material undergoes fracture and splits into half at elongation of 4.20 mm.
18

FRACTURED BRASS AND ALUMINIUM
19

ANALYSIS AND RESULTS
1. ALUMINIUM
GRAPH OF FORCE (kN) VS ELONGATION (MM)
0 1 2 3 4 5 6012345678
Elongation (mm)
Forc
e (kN)
Sample Calculation
a) Stress,
σ = FAo where Ao=
πd2
4 = π× (6.4×10⁻³)2
4=3.216×10⁻⁵mm2
When ∆L=0.1mm , F= 0 kN
σ = 0kN3.216×10−5mm2
=0
b) Strain,
ε = L−LoLo
=0.1mm28mm=3.571×10⁻³
20

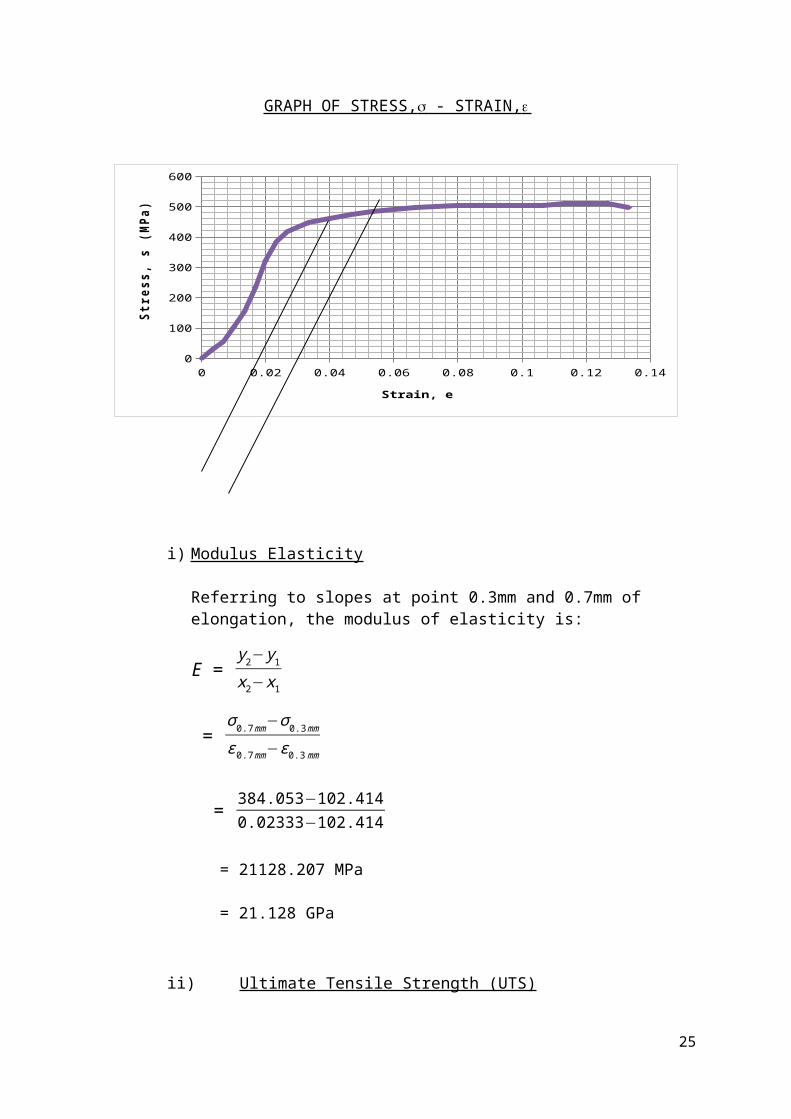
GRAPH OF STRESS, - STRAIN,
0 0.02 0.04 0.06 0.08 0.1 0.12 0.14 0.16 0.180
50
100
150
200
250
Strain, e
Stre
ss,
s (M
Pa)
i) Modulus Elasticity
Referring to slopes at point 0.4mm and 0.8mm of elongation, the modulus of elasticity is:
E = y2−y1x2−x1
= σ0.8mm−σ0.4mm
ε0.8mm−ε0.4 mm
= 189.618−205.2050.02857−0.01429
= 11844.748 MPa
= 11.845 GPa
i) Ultimate Tensile Strength (UTS)
From Graph Stress - Strain Diagram For Aluminium, UTS is:
Ultimate Tensile Strength = 236.25 MPa
21

ii) Elongation at fracture
From Graph Stress - Strain Diagram For Aluminium,
Elongation at fracture: 4.80 mm
A = LU−Lo
Lo x100 =
32.80−28.0028.00 x100 = 17.15%
iii) Yield Strength (offset of 0.2%)
From Graph Stress - Strain Diagram For Aluminium
Yield Strength = 202.052 MPa
0.2% Elongation at fracture = 0.2x4.80mm100 = 9.6µm
Strain, ε = 9.6µm0.012m = 0.0008
Yield Strength (offset of 0.2%), σ = E ε
= 11.845 GPa x 0.0008
= 9.476 MPa
22
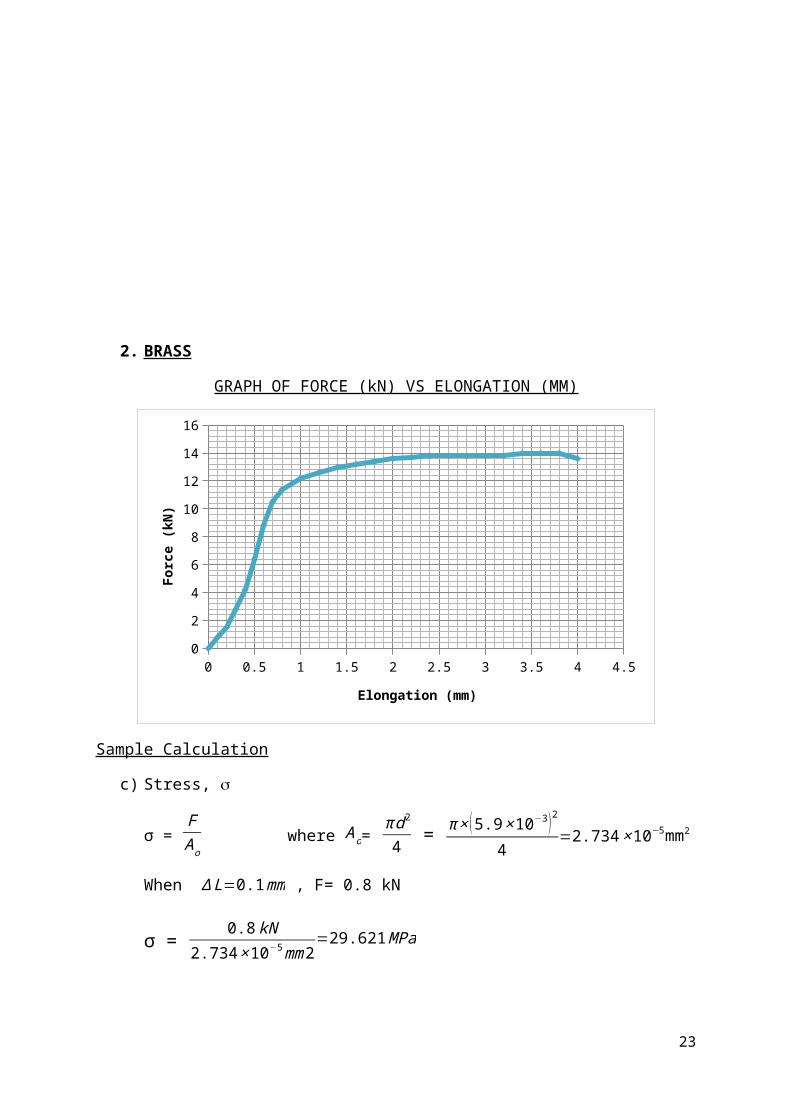
2. BRASS
GRAPH OF FORCE (kN) VS ELONGATION (MM)
0 0.5 1 1.5 2 2.5 3 3.5 4 4.50
2
4
6
8
10
12
14
16
Elongation (mm)
Forc
e (k
N)
Sample Calculation
c) Stress,
σ = FAo where Ao=
πd2
4 = π× (5.9×10⁻³)2
4=2.734×10⁻⁵mm2
When ∆L=0.1mm , F= 0.8 kN
σ = 0.8kN2.734×10−5mm2
=29.621MPa
23

d) Strain,
ε = L−LoLo
=0.1mm30mm=3.333×10⁻³
24
GRAPH OF STRESS, - STRAIN,
0 0.02 0.04 0.06 0.08 0.1 0.12 0.140
100
200
300
400
500
600
Strain, e
Stre
ss,
s (M
Pa)
i) Modulus Elasticity
Referring to slopes at point 0.3mm and 0.7mm of elongation, the modulus of elasticity is:
E = y2−y1x2−x1
= σ0.7mm−σ0.3mm
ε0.7mm−ε0.3mm
= 384.053−102.4140.02333−102.414
= 21128.207 MPa
= 21.128 GPa
ii) Ultimate Tensile Strength (UTS)
25

From Graph Stress - Strain Diagram For Brass, UTS is:
Ultimate Tensile Strength = 504.755 MPa
iii) Elongation at fracture
From Graph Stress - Strain Diagram For Brass,
Elongation at fracture: 4.80 mm
A = LU−Lo
Lo x100 = 32.80−28.0028.00
x100 = 17.15%
iv) Yield Strength (offset of 0.2%)
From Graph Stress - Strain Diagram For Brass,
Yield Strength = 446.234
0.2% Elongation at fracture = 0.2x4.20mm100 = 8.4µm
Strain, ε = 8.4µm0.01m = 0.0008
Yield Strength (offset of 0.2%), σ = E ε
= 21.128 GPa x 0.00084
= 17.879 MPa
26

DISCUSSION
The strength of the concrete can be increase with the addition of steel fibre. The compressive strength values range within 40MPa – 70MPa can be obtained because the tensile capacity doubles with the addition of fibre reinforcement by 1%.
The main objectives this experiment was conducted is to validate the stress-strain relationship for materials (tensile sample), in order to determine the approximate values for the Elongation at fracture, Tensile strength (UTS) and Yield strength (offset at 0.2%).
The material used in this experiment as tensile sample isthe commonly used in architecture industry which is aluminium and brass. The results that are obtained from the experiment are represented in table and graph form .From the Stress-Strain graph obtained based on the experiment conducted on the both tensile samples, the
formulaσ=
FA0 is used to calculate the engineering stress
value. Besides, we used the formulaε=
ΔLL0 to obtain the
engineering strain value. The value of Modulus of Elasticity can be determined from the slope of the graph which is situated in the elastic region from straight line position initially. The point where the elongation increase proportionally with increase in load is know theelastic region. Any deformation after this region will cause permanent deformation on the material and a curvature can be seen on the graph drawn is noted as plastic deformation. As load gradually increases the material will reach its ultimate tensile strength and will later lead to the fracture of the material.
The Modulus of Elasticity for Aluminium and Brass can determine by taking its initial point and the elastic limit point in the elastic region from the stress-strain graph. The Value of Modulus of Elasticity of Aluminium and Brass are 11.845GPa and 21.128GPa respectively.
27

The point where the graph drawn at its peak is before it reaches fracture known as the ultimate tensile strength (UTS). The Ultimate tensile strength for Aluminium and Brass are 236.250MPa and 504.755MPa. We can assume that Brass sustain more force than aluminium before fracture.
The offset of 0.2% was set and drawn on the graph is to find the yield strength. From the analysis, the value of yield strength of Aluminium and Brass is 9.476MPa and 17.879Mpa. From the values obtained its clearly states that Aluminium undergoes fracture earlier than Brass.
CONCLUSIONS
From the experiment conducted, we clearly understood the Principle of Tensile Testing. We were also able to understand the stress – strain relationship of the two types of material which is the Aluminium and Brass. Furthermore, the values of elongation at fracture, tensile strength (UTS), yield strength(offset of 0.2%), and Modulus of Elasticity we able to be obtained from the graph of stress-strain curve drawn based on the result from the experiment. Overall, the objective of thisexperiment is achieved.
28

REFERENCES
Semester 2 2014/2015. MEMB221 Materials Laboratory Manual. COE,UNITEN. Pp 9 - 13.
Beer, Johnston, DeWolf, Mazurek. 2009. Mechanics of Materials.5th Ed. New York: McGraw-Hill. pg48-56.
The Many Uses of Fibers in Concrete Countertops, 2013,
http://www.concretecountertopinstitute.com/blog/tag/tensile-strength/
Stress - Strain Curve
http://en.wikipedia.org/wiki/Stress–strain_curve
29