Battery test-specification development and test ... - Obelics
63
Optimization of scalaBle rEaltime modeLs and functIonal testing for e-drive ConceptS EUROPEAN COMMISSION Horizon 2020 GV-07-2017 GA # 769506 Deliverable No. OBELICS D4.2 Deliverable Title Battery test-specification development and test reports regarding battery assessment metrics Deliverable Date 2019-06-30 Deliverable Type REPORT Dissemination level Public (PU) Written By UCC 1&2 Complete System (incl. E-Motor) Mathieu Ponchant (SIE-SAS) Bart Forrier (SIE NV) Mathieu Ponchant (SIE-SAS) David Delichristov (ViF) Gerhard Benedikt Weiss (ViF) UCC 3 Battery Vincent Heiries (CEA) 2019-06-21
-
Upload
khangminh22 -
Category
Documents
-
view
1 -
download
0
Transcript of Battery test-specification development and test ... - Obelics

Optimization of scalaBle rEaltime modeLs and functIonal testing for e-drive ConceptS
EUROPEAN COMMISSION Horizon 2020 GV-07-2017 GA # 769506
Deliverable No. OBELICS D4.2
Deliverable Title Battery test-specification development and test reports regarding battery assessment metrics
Deliverable Date 2019-06-30
Deliverable Type REPORT
Dissemination level Public (PU)
Written By UCC 1&2 Complete System (incl. E-Motor) Mathieu Ponchant (SIE-SAS) Bart Forrier (SIE NV) Mathieu Ponchant (SIE-SAS) David Delichristov (ViF) Gerhard Benedikt Weiss (ViF) UCC 3 Battery Vincent Heiries (CEA)
2019-06-21

GA # 769506 2 / 63 D4.2 – Battery test-specification development and test reports regarding battery assessment metrics - PU
Marco Ranieri (CEA) Oliver König (AVL) Martin Zaversky (AVL) Ramaka Vishwasri (AVL) Ngoc Nguyen (AVL) Raul Estrada Vazquez (FHJ) Benjamin Zillmann (Bosch) Jürgen Nuffer (FhG LBF) Ashwin Karthikeyan (FhG LBF) UCC 4 HF-Inverter El Hassan Ourami (Valeo) Oliver König (AVL) Thorsten Fischer (AVL SFR) Ouael Manaa (AVL SFR) Raul Estrada Vazquez (FHJ) Damian Miljavec (UL) Tomaz Katrasnik (UL) All/Undefined Andreas Stadler (AVL SFR) Mohamed El Baghdadi (VUB) Yousef Firouz (VUB) Luca Pugi (UNIFI) Edoardo Locorotondo Lorenzo Berzi Marco Pierini Tommaso Favilli
Reviewed by Yousef Firouz & Mohamed El Baghdadi Hellal Benzaoui & Gabriele Leoncini
2019-07-05 2019-07-05
Approved by Horst Pfluegl (AVL) – Project Coordinator 2019-07-16
Status Final 2019-07-16
GA # 769506 3 / 63 D4.2 – Battery test-specification development and test reports regarding battery assessment metrics - PU
Public/Publishable Summary Alternative energy production and usage in combination with E-mobility will replace combustion drive-chains more and more in the next years and decades – due to technical and environmental advantages. Highly efficient E-cars and a narrow mesh of service stations is needed, therefore. Asian producers, as Toyota, do have a development-advance of about 10 years compared to those in Europe. As a result, the need for efficient test methods and devices, which are supporting accelerated research and development activities of European automotive manufacturers is obvious. Within the Horizon 2020 program of the European Union, the OBELICS (Optimization of scalaBle rEaltime modeLs and functIonal testing for e-drive ConceptS) project refers exactly to this topic – i.e. to functional testing and test/system integration of battery, e-motor and inverter. The present report, deliverable 4.2 (D4.2), in combination with the following D4.3 (due in end of September) are the 2nd year deliverables within work package 4 of the Horizon 2020 OBELICS-project. It focusses on battery test-specification development and test reports regarding battery assessment metrics as well as on the development of test methodologies and execution of accelerated tests with batteries in different test environments. This is needed, in order to shorten the development time between design and test, simplify the handling of scalable real-time models for the purpose of testing and reduce the effort for transformation of testing methodologies between different stages of the development process. The objective is an efficiency increase in system engineering testing with respect to the requirements and to improve test case generation and its management. The requirements are often defined implicitly with the models. Further aims are an increased degree of automation, a reduced set of test overhead and project collaboration on testing becomes more straightforward. To ensure a high quality of the undertaken R&D activities, several use-cases (UCs) have been implemented, where similar ones have been put together to use-case clusters (UCCs). The whole project is developed along these UCs. Moreover, a unique OBELICS-use-case contribution matrix was installed, which allows work-packages an interacting comparison of methods and results of all parallel developed UCs, resulting in discussions and common conclusions. The implemented UCCs are as follows:
- UCCs 1 & 2 Complete Systems (incl. e-motors): New e-drive concept & component sizing in earlier design phase (scalable models); E-vehicle system integration, optimization with real world verification (model-based testing)
- UCC 3 Batteries: Battery design and testing for improved safety & reliability - UCC 4 HF-Inverters: e-motor, control and inverter design & testing
Work-package 4 (WP4), which is regarded in this document contains requirements, designs, test methodologies and shall execute first well-defined tests. The test environment shall cover all tests along the development process, starting from MiL to SiL and furthermore to HiL, ViL, PiL via XiL test cases for HF-inverters in combination with e-motors and batteries and its Infrastructure. The investigated methods and results are manifold. Representatively, the following examples may illustrate the contributions of the tree named UCCs to the WP4-activities: Towards creation of test methodologies for scalable tests with HF-inverters, e-motors and motor/batteries, derivations of advanced driving cycles for numerical and experimental testing which combine electric and mechanical loads in correct relation to each other, have been extracted by Bosch and FhG which in turn can be used to identify reliability and safety issues of the battery system. The derivation of an advanced testing procedure has been started by doing mechanical load measurements on two electric vehicles. The loading and stress profiles on the battery system, mounting, vehicle frame and wheel carrier have been measured. By analysing this measuring chain it is possible to describe the load/stress transfer from wheel carrier to the battery system. With this knowledge it is possible to extract and calculate the relevant test signals as input for the FhG LBF multiaxial test rig.

GA # 769506 4 / 63 D4.2 – Battery test-specification development and test reports regarding battery assessment metrics - PU
Additionally, Bosch created a vehicle model to describe and predict the vibration loading and stress on the vehicle battery system. This vehicle model will be used to generate drive files with different road geometries. The load path from the street profile to the battery mounting is covered by the vehicle model. To be close to field applications, realistic street profiles will be used as well. The generated load data on the mounting of the battery system can also be used as input data to the multiaxial test rig. Towards creation of a validation method for battery testing, CEA developed some hardware and an algorithm for online diagnosis – The main purpose of the method is the estimation of the electrochemical impedance of the cell, exploiting an active excitation technique (galvanostatic excitation) performed by the electronics itself. The addressed frequencies of impedance identification process are in the bandwidth between 5 Hz and 5 kHz. The impedance estimation will be the result of a broadband frequency-based signal processing technique taking as input the acquired voltage variation of the cell and the identification current. Online diagnosis of the state of a Li-ion cell, based on its measured and/or indirectly estimated parameters, is a key factor for the safety of a battery-based system. ‘Online’, referred to diagnosis, must be intended as ‘performed during the normal operation of the device and on the long term’ and it is often based on measurement systems themselves, which are based on embedded electronics. The online diagnosis tool we propose to develop uses the electrochemical impedance of a Li-ion cell. This value, always expressed as a function of the frequency Z(f), is identified by synchronous acquisitions of current and voltage on a Li-ion cell during a cell activation procedure. For the definition of self-calibration and optimization procedures for the proposed measurement and diagnostic system to further accelerate and improve test execution, voluntarily, UL develops the methodology for setting up PMSM e-machine models for accelerated testing of HF-inverters with e-motors and batteries, stress tests under combined electro-thermal loading, allowing to represent the actual operational loads more realistically. The scalable transformation methodology for different e-motor designs is still in progress. The measured results through HIL testing are already available and will be used for the formation of scalable transformation methodologies of e-motor design. Towards execution of scalable tests of HF-inverter with e-motor and battery, investigations on test methodology and architecture for HF inverters via implementation of an adequate model inside the e-motor emulator and the trial run performance have been done by AVL. To overcome the drawbacks of non-integrated and frequency-limited (12kHz) tests, AVL proposes a new technology of battery tester, relying on Silicon-Carbide Semiconductor (SiC) technology. Moreover, the controller will be implemented in FPGA technologies to accelerate the online computation and to equally meet the requirement of 20kHz frequency, which could be caused by the E e-motor, HF-Inverter devices. This new testing architecture and device allows to investigate real tests and their effects onto the battery behaviour. The inverter switching ripple plus the current modulation due to machine harmonics and the influence of the driveline control (vibration damping) can be taken into account. For the investigation of the thermal characterisation by implementation and calibration of the state functions of the battery system into the energy management platform, VUB has started to characterize cells (Kyburz eRoad from Siemens) and developed electrothermal models for cell and module level. The detailed model is based on LFP cells which have been modelled through AMESim. The final models have been implemented on both AMESim LMS and MATLAB Simulink platform. The aging model highly depends on the chemistry of the battery. VUB has designed characterization tests and started test setup preparation (voltage cable as well as thermal sensors have been installed on the battery module. For execution of scalable tests applying novel drive files bringing in a multi-axial test rig with climate chamber for battery testing as well as test rigs for testing power electronics, a special test fixture for mechanical measurements was designed by LBF. For doing these measurements, acceleration sensors have been installed and high- and low voltage connections have been established. A restbus simulation was set up to facilitate the communication between the battery and the test rig and to log data from the battery management system (BMS). A system model

GA # 769506 5 / 63 D4.2 – Battery test-specification development and test reports regarding battery assessment metrics - PU
will serve as the basis for generating a drive signal, which will result in emulating the advanced drive file from subtask 4.2.1. Since the superimposition of electrical load (charge and discharge current) is also included, the test procedure will be set up in such a way that charge and discharge profiles for the battery according to specifications were derived and developed. In future it is also planned to integrate additional superimposition of thermal loads (temperature cycles), in order to include the effect of thermal stresses into the evaluation process.

GA # 769506 6 / 63 D4.2 – Battery test-specification development and test reports regarding battery assessment metrics - PU
1. Contents Public/Publishable Summary ..................................................................................................................................... 3
Figures ....................................................................................................................................................................... 7
Tables ......................................................................................................................................................................... 9
1.1 Document Structure ............................................................................................................................... 10
1.2 Deviations from original Description in the Grant Agreement Annex 1 Part A ...................................... 10
1.2.1 Description of work related to deliverable in GA Annex 1 – Part A .................................................... 10
1.2.2 Time deviations from original planning in GA Annex 1 – Part A ......................................................... 11
1.2.3 Content deviations from original plan in GA Annex 1 – Part A ........................................................... 12
1.3 Use-Case Contribution Matrix: Use-Cases, Use-Case-Clusters, Work-Packages and Project-Objectives 13
1.4 Aimed Results ......................................................................................................................................... 13
1.4.1 Objectives and Activities ..................................................................................................................... 13
1.4.2 Methods and Results .......................................................................................................................... 15
1.4.3 Discussions and Conclusions ............................................................................................................... 17
3.1 Sub-Task 4.2.1: Creation of test methodologies for scalable tests of HF-inverter with e-motor/batteries 19
3.1.1 Derivation of advanced drive files for numerical and experimental testing which combines the electric and mechanical loads in the correct relation to each other; the derived drive file will only contain the damage /failure relevant contributions of the operational loads. (FhG LBF) ............................................................... 19
3.1.2 Creation of a validation method battery testing. (CEA)...................................................................... 27
3.1.3 Definition of self-calibration and optimization procedures for the proposed measurement and diagnostic system to further accelerate and improve test execution. (UNIFI) ............................................... 30
3.2 Sub-Task 4.2.2: Execution of scalable tests of HF-inverter with e-motor and batteries – trail run ........ 33
3.2.1 Investigation about Test methodology and architecture for HF inverters with e-motors and batteries via implementation of the e-motor model inside of the e-motor emulator and the trail run performance (AVL SFR, AVL, SIE-SAS, SIE NV, FHJ) ........................................................................................................................ 33
3.2.2 Investigation of the thermal characterisation by implementation and calibration of the state functions of the battery system into the energy management platform (VUB, CEA) ..................................................... 38
3.2.3 Comparison of electrical testing on battery and cell level (AVL) ........................................................ 48
4.1 Use-Cases and their Influence on Work Package 4 ................................................................................. 53
4.1.1 Participating Use-Case-Clusters (UCCs), Use-Cases (UCs) and Use-Case-Leaders (UCLs) ................... 53
4.1.2 Description of UCs, included collaborations and influence on WP4 .................................................. 54
4.1.3 Systematic Project-Flow-Chart and its affection on WP4 ................................................................... 58
5.1 Towards project-applicants .................................................................................................................... 60
5.2 Towards project-partners ....................................................................................................................... 60
6.1 Risk register ............................................................................................................................................. 61

GA # 769506 7 / 63 D4.2 – Battery test-specification development and test reports regarding battery assessment metrics - PU
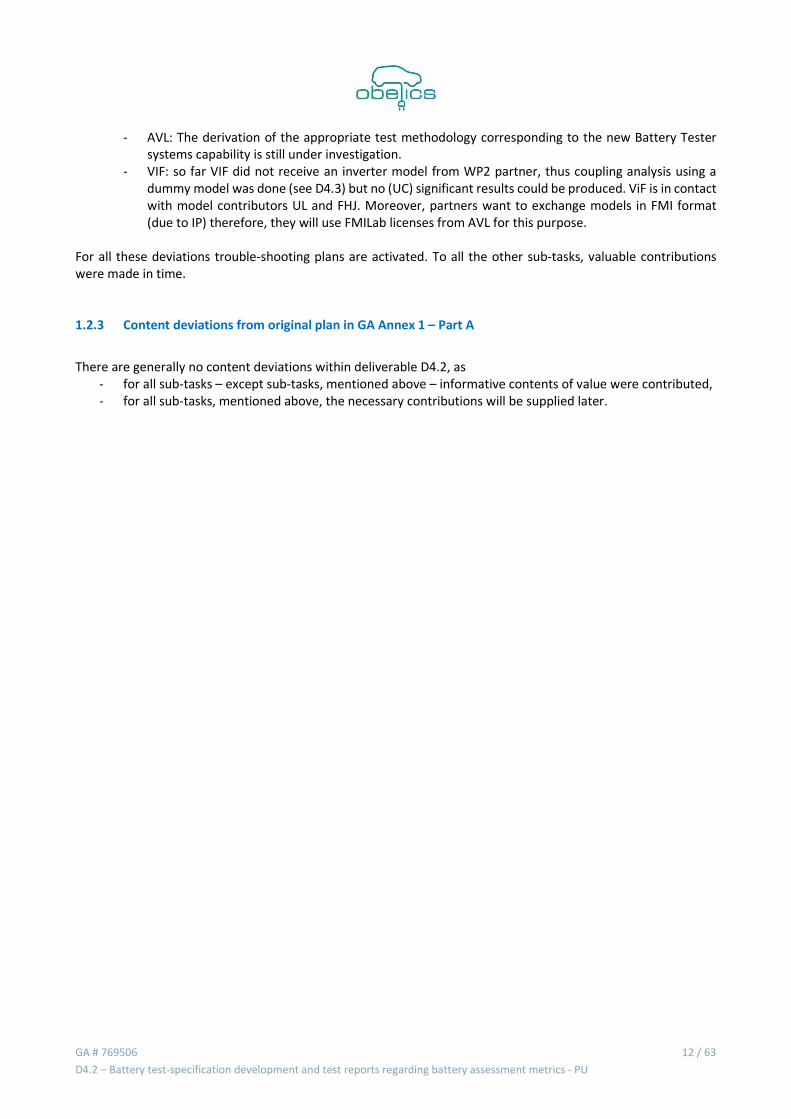
Figures Figure 1 Position of accelerometers on the battery system of the Fiat 500e, accelerometers A9 - A12 are positioned on the hinge points of the battery, accelerometer A13 is positioned in the middle of the battery housing ......... 22 Figure 2 Optimization process in the frequency domain using a Reference PSD for test time shortening ............ 23 Figure 3 Test drive along city, country roads and motorways overlaid near Stuttgart, Germany .......................... 24 Figure 4 Measurement data from city, country roads and motorways .................................................................. 24 Figure 5 Original acceleration signal, a. acceleration in x-direction, b. acceleration in y-direction, c. acceleration in z-direction ................................................................................................................................................................ 25 Figure 6 Optimized acceleration signal – shortened by 72.9 %, a. acceleration in x-direction, b. acceleration in y-direction, c. acceleration in z-direction ................................................................................................................... 25 Figure 7 Charge-discharge current .......................................................................................................................... 26 Figure 8 Temperature profile .................................................................................................................................. 26 Figure 9 From upper left and clockwise: climatic chamber (closed) used to control the cell temperature, function generator to create the PRBS sequence activating the cell, OROS acquisition system, climatic chamber (open). 28 Figure 10 Detail of what is inside the climatic chamber. The green PCB is a prototype of the embedded electronics containing only the analog part. All the computation is performed on PC. ............................................................ 29 Figure 11 Non-working example of an embedded system performing the impedance estimation of a Li-ion cell. Here the algorithm computation is performed on a microcontroller. .................................................................... 29 Figure 12 Thermal system for 3D CFD model verification ....................................................................................... 33 Figure 13 Measurement system for models verification ......................................................................................... 33 Figure 14 Test scheme ............................................................................................................................................. 34 Figure 15 Test setup ................................................................................................................................................ 35 Figure 16 Measurement .......................................................................................................................................... 35 Figure 17 Fiat 500e toy FMU model dedicated to real-time calculation ................................................................. 37 Figure 18 Example of Toy model connected with battery & e-motor model through FMU ................................... 37 Figure 19 Battery cell specification .......................................................................................................................... 38 Figure 20 Test-methodology of VUB........................................................................................................................ 39 Figure 21 a) Installed current cables and temperature sensors on the battery module b) inside the climate room ................................................................................................................................................................................. 40 Figure 22 Capacity test: Measured current and voltage of a LFP cell ..................................................................... 40 Figure 23 Capacity as function of discharge current and ambient temperature .................................................... 41 Figure 24 Parameter estimation procedure for each current/voltage pulse .......................................................... 42 Figure 25 Estimated 2nd order model parameters ................................................................................................... 42 Figure 26 Extracted OCV curves of LFP battery at different temperatures ............................................................. 43 Figure 27 Short current pulses and measured battery voltage ............................................................................... 44 Figure 28 Battery surface temperature corresponding to micro pulse test ............................................................ 44 Figure 29 validation test using WLTC driving cycle .................................................................................................. 45 Figure 30 Example of a Nyquist Diagram, representing Re(Z) and -Im(Z), of a Li-ion cell, obtained by testing a sample cell with laboratory equipent, followe by PC computation ..................................................................................... 46 Figure 31 Im(Z) value expressed as a function of frequency: what is important for our purpose is the frequency value at which it is equal to '0' ................................................................................................................................ 46 Figure 32 By repeating this test many times and at different temperatures, one can determine the evolution of the zero-cross frequency depicted in the previous Figure as a function of the cell’s temperature .............................. 47 Figure 33 Slide n. 5 presented in the Darmstadt meeting ....................................................................................... 47 Figure 34 Slide n. 6 presented in the Darmstadt meeting ....................................................................................... 48 Figure 35 Tesla Model 3 LR battery pack and pack data ......................................................................................... 48 Figure 36 Panasonic 2170 cell taken from Tesla Model 3 battery for comparison tests on cell level .................... 49 Figure 37 Overall measurement trace of battery pack HPPC test ........................................................................... 49 Figure 38: HPPC test overall trace on battery cell level ........................................................................................... 50 Figure 39 HV connection of main circuit of Tesla Model 3 Battery including part resistances ............................... 51 Figure 40 Systematic project-flow-chart for UCC2, including contributions of work-package 4 ............................ 59

GA # 769506 8 / 63 D4.2 – Battery test-specification development and test reports regarding battery assessment metrics - PU
Figure 41 Systematic project-flow-chart for UCC4, including contributions of work-package 4 ............................ 59

GA # 769506 9 / 63 D4.2 – Battery test-specification development and test reports regarding battery assessment metrics - PU
Tables Table 1 Activities of the Fraunhofer LBF within WP4 .............................................................................................. 20 Table 2 Activities focused on battery and inverter-system ..................................................................................... 20 Table 3 List of publications for this project ............................................................................................................. 31 Table 5 Data-set for safe characterization tests ...................................................................................................... 39 Table 6 OCV vs SOC test procedure ......................................................................................................................... 43 Table 7 Test matrix overview ................................................................................................................................... 45 Table 8 Resulting internal resistance @2C current and 25°C, 10s pulse length ...................................................... 50 Table 9 Use-case-clusters and as they are applicated within work-package 4 ....................................................... 53 Table 10 OBELICS-Use-case contribution matrix with reference to work-package 4 .............................................. 53 Table 11 New identified risks within WP4 of the Obelics-Project. .......................................................................... 61 Table 12 Project partners ........................................................................................................................................ 63

GA # 769506 10 / 63 D4.2 – Battery test-specification development and test reports regarding battery assessment metrics - PU
1. Purpose of the document This document represents deliverable D4.2, which explains battery test-specification development and test reports derived from battery assessment metrics as well as development of test methodologies and execution of accelerated tests with batteries in different test environments. 1.1 Document Structure
As the project OBELICS is developed along the use-cases (UCs) with intensive cross-checks by the work-packages (WPs), especially with view to reports, this document initially provides a list of contributing project-partners and reviewers, grouped into three use-case-clusters (UCCs): UCC 1&2 complete system (incl. e-motor), UCC 3 battery, UCC 4 HF-inverter. Here, the UCCs 1 and 2 are bound together, as within WP 4 their contributions are of minor presence, compared with the UCCs 3 and 4. This instant deliverable 4.2 (D4.2) of the WP4 contains the following overviews:
- a list of contributing project-partners and reviewers, - a publishable executive summary, i.e. an abstract, - a list of contents, - a list of figures and - a list of tables.
Followed by the chapters:
- 1. Purpose of the document, which shows the intention of D4.2, - 2. Introduction, where short adoptions to the main intentions of D4.2 are given, - 3. Methods and results and - 4. Discussion and conclusion - 5. Recommendations - 6. Risk register - 7. References - 8. Acknowledgements - 9. Appendix A – Quality Assurance
Of high importance are especially the chapters 3 and 4. This, as here the results of our project investigations are presented, interpreted and evaluated. So, the document structure within chapter 3 methods and results of D4.2 is strictly oriented at the tasks and subtasks of WP 4, listed within the grant agreement (GA). Within any subtask the contributions of the project-partners are grouped again according the above mentioned UCCs. If available, important information of the UCC-contribution matrix is set ahead to every contribution of a project partner, in order to identify the thematically input, expected by the according UC. The chapter 4 discussion and conclusion itself contains the discussion towards main results and important conclusions, in general and for further project-laboratory work. 1.2 Deviations from original Description in the Grant Agreement Annex 1 Part A
1.2.1 Description of work related to deliverable in GA Annex 1 – Part A
WP4 focuses on the creation of requirements, test methodologies and validation / testing of all the functionalities developed along the development process in order to
- shorten the time between design and test

GA # 769506 11 / 63 D4.2 – Battery test-specification development and test reports regarding battery assessment metrics - PU
- simplify the handling of scalable real-time models for the purpose of testing - reduce the effort for transformation of testing methodologies in different stages of the development
process - The objective regarding to requirements is the efficiency increase of system engineering testing by
applying requests from WP2 and WP3 (and indirect from WP5) to increased improvement of test case generation and its management. Results thereof are:
- An improved degree of automation - A reduced set of test overhead - Project collaboration becomes more straightforward
The test environment covers all tests, starting from MiL to SiL and furthermore the HiL, ViL, PiL via XiL test cases for HF-inverters with e-motors and batteries and its Infrastructure with respect to the scalability of the models defined in WP2 and implemented in WP3. Furthermore, scalable system and subsystem tests will be executed via:
- Implementation and integration of the HF-inverters with e-motors and batteries and its Infrastructure. - Integration and simulations tests for EMC - HIL, ViL, PiL Assessment of the System - Mechanical tests (e.g. vibration)
After the implementation and the test execution of the scalable real-time models, these results will be compared and the improvements evaluated. A further activity will be the execution of Back-to-Back tests. Back Testing is a testing process in which events that are associated with it are defined and examined properly. Reason for this activity is:
- A high degree of confidence in the correctness of the implementation (model or software). - Tests do have a high degree of coverage of all produced components. - Any changes in the testing environment can automatically be used at all different test stages.
Task 4.2 contains scalable tests (test method investigation via trial run) for HF-inverter with e-motor and batteries and will be worked out under the lead of AVL-SFR (VUB) by the partners FHJ, SIE-SAS, AVL, UNIFI, CEA, FhG LBF, SIE NV, ViF, Valeo, FO within the project-months M10-M24. In this task, dedicated test methods will be used to evaluate the HF-inverters with e-motors and batteries at different operating conditions and to ensure the robustness of the low-level control systems and their reliability. Furthermore, this task will investigate how these test methods and their outputs will achieve parameterized inverter models including their HF operation and ensure the model scalability at system level. Deliverable D4.2 contains battery test-specification development and test reports regarding battery assessment metrics: Development of test methodologies and execution of accelerated tests with batteries in different test environments. As shown below, all sub-tasks – sub-task 4.2.1 and sub-task 4.2.2 – and the included items are worked out by the project partners properly, step by step and interactive – by use of this open-access document. So, this deliverable 4.2 contains contributions of all use-case clusters, which can be systematically compared, discussed and evaluated. Conclusions are made. 1.2.2 Time deviations from original planning in GA Annex 1 – Part A
There are the following deviations from Annex I – Part A, at the moment:
- LBF/Bosch: due to massive delay in battery delivery from USA to Bosch the corresponding results in the task “Execution of scalable tests applying novel drive files bringing in a multi-axial test rig with climate chamber for battery testing as well as test rigs for testing power electronics” of deliverable D4.2 are delayed. Actually, a solution for the reporting of the delayed results is elaborated.
GA # 769506 12 / 63 D4.2 – Battery test-specification development and test reports regarding battery assessment metrics - PU
- AVL: The derivation of the appropriate test methodology corresponding to the new Battery Tester systems capability is still under investigation.
- VIF: so far VIF did not receive an inverter model from WP2 partner, thus coupling analysis using a dummy model was done (see D4.3) but no (UC) significant results could be produced. ViF is in contact with model contributors UL and FHJ. Moreover, partners want to exchange models in FMI format (due to IP) therefore, they will use FMILab licenses from AVL for this purpose.
For all these deviations trouble-shooting plans are activated. To all the other sub-tasks, valuable contributions were made in time. 1.2.3 Content deviations from original plan in GA Annex 1 – Part A
There are generally no content deviations within deliverable D4.2, as
- for all sub-tasks – except sub-tasks, mentioned above – informative contents of value were contributed, - for all sub-tasks, mentioned above, the necessary contributions will be supplied later.

GA # 769506 13 / 63 D4.2 – Battery test-specification development and test reports regarding battery assessment metrics - PU
2. Introduction Besides the Fiat 500 e, on which the focus is set within the OBELICS-project, there are several other promising E-drive solutions still available on the European market, for example Mercedes B-Klasse Electric Drive, which applies the E-drive of Teslas Model S, the BMW i3 and the VW e-Golf, and of course many others. 1.3 Use-Case Contribution Matrix: Use-Cases, Use-Case-Clusters, Work-Packages and Project-
Objectives
OBELICS improves the real operational performance, safety, reliability, durability and affordability of EVs to attain at least the same level as conventional vehicles. Within WP 4 there are three UC-interactions: UCCs 1&2 complete systems (e-motors), UCC 3 batteries, UCC 4 HF-inverters. Industrial R&D must focus on improved mass-production facilities, implementing advanced components and architectures for higher operational efficiency in multi-level modelling and testing of EV and their components. WP4 focuses on the creation of requirements, test methodologies and validation / testing of all the functionalities, developed all along the development process in order to
- shorten the time between design and test - simplify the handling of scalable Real-time Models for the purpose of testing - reduce the effort for transformation of testing methodologies in different stages of the development
process - The objective regarding to requirements is the efficiency increase of system engineering testing. Results
are: - An improved degree of automation - A reduced set of test overhead
The OBELICS project aims for a step change in the performance (target: + 20%, i.e. from 100 Wh/kg to 120 Wh/kg), efficiency (target: + 20%), safety (target: + factor 10) and lifetime (target: + 30%, i.e. from 100,000 km/8 years to 130,000 km years/11 years) of e-drivetrains and the development time (target: - 40%, i.e. from 5 years to 3 years) and efforts (target: -50%, i.e. from 100 fte and 30 million euro to 50 fte and 15 million euro). Especially for project-wide cross-checks, according the use-case contribution matrix, and for intermediate and final reports, as deliverables and milestones – with view on quality assurance within the OBELICS project – work-packages were defined. Within WP 4 four reports are to be written. The first of these four reports – deliverable 4.1 (D4.1) – has still been delivered in September 2018. This one – deliverable 4.2 (D4.2) – is strictly structured according the tasks and subtasks within the GA. Moreover, within a subtask three UCCs are differentiated, i.e. UCCs 1&2 complete system (incl. e-motor), UCC 3 batteries and UCC 4 HF-inverters, as is given by the central use-case contribution matrix of the OBELICS project. Of high importance are chapter 3 methods and results and chapter 4 discussion and conclusion, as they are containing the systematic, innovative output of WP4. 1.4 Aimed Results
1.4.1 Objectives and Activities
The overall objective of OBELICS is to develop a systematic and comprehensive framework for the design, development and testing of advanced e-powertrains and EVs line-ups, to reduce development efforts by 40% while improving efficiency of the e-drivetrain by 20% and increase safety by a factor of 10 using OBELICS advanced

GA # 769506 14 / 63 D4.2 – Battery test-specification development and test reports regarding battery assessment metrics - PU
heterogeneous model-based testing methods and tools; as well as scalable and easy to parameterize real-time models. Scientific and technical objectives and activities are as follows: 1. Objective: The objective of OBELICS is to define an innovative framework for simultaneous model-based development and testing process by using concurrent engineering approach (interdisciplinary co-operation and parallel work) to reduce the development and testing efforts by 40%. Activity: Within the sub-tasks 4.2.1 and 4.2.2 manifold activities have been undertaken to define an innovative framework for simultaneous model-based development and testing process, in order to reduce the development and testing efforts by 40%, i.e. to fulfill the 1st objective. For example: - The Fraunhofer LBF built up a multi-physical test stand for reliability and safety measurements at battery
systems, testing mechanical, electrical and climatic conditions at the same time. - SIE SAS uses real-time simulators for virtual testing of HF-inverters, using models with test equipment
constraint as well as simulation constraint. 2. Objective: The objective of OBELICS is to develop innovative, scalable and accurate (>90%) models for the development of drive-train components (e-motor, batteries and inverters), validated using XIL approach that are based on first principles (mechanical, physical, electrochemical, electro-thermal, electromagnetic model basis) and allow for systematic scalability towards real-time models. Activity: There have been made efforts to develop innovative, scalable and accurate (>90%) models for the development of drive-train components, that are based on first principles and allow for systematic scalability towards real-time models. For example: - The Fraunhofer LBF develops integrated models for HF-inverters, with combined multi-physical loading
(thermal, mechanical vibrations, external climatic conditions, etc.) during operation. - VUB develops multi-step models for battery testing, including (capacity checks, hybrid pulse power
characterization (HPPC), open circuit voltage (OCV) test, thermal test, validation test). 3. Objective: The objective of OBELICS is to develop an environment and a methodology for fast virtual integration capabilities allowing to virtually integrate the key powertrain components (battery, inverter, electric motor) with several physic-functional vehicle models including brake blending strategies; transmission; chassis associated with document Ref. Ares(2017)3662142 - 20/07/2017 GV-07-2017: Optimization of scalable real-time models and functional testing for e-drive concepts 769506 – OBELICS – Part B Page 5 / 112 (longitudinal with damping); thermal systems, battery conditioning, cooling and HVAC. This objective is one of the key objectives of the project as performance of the complete electric vehicle is impacted at the first order of magnitude by the powertrain integration and key auxiliaries, which inherently requires to consider these interactions in early design stage from a simulation perspective to ensure the proper sizing of the key powertrain components for ensuring optimal operations, for example: - UNIFI develops braking system models, including optimal management for vehicle stability in combination
with control systems like ABS and ESP (“Brake Blending models”). - AVL SFR develops test-setups and models for HF-inverters, where the simulator is able to calculate and
communicate in real-time with external connections. 4. Objective: The objective of OBELICS is to develop methods for automated test generation and efficient execution within combined testing environments (reduction of testing effort by 40%) that are easy to transfer between validation platforms in order to simplify and ease this burdensome and expensive task, which is needed for thorough quality assurance of the final product. For example: - At the Fraunhofer LBF a multi-physical test stand is used for reliability and safety measurements at battery
systems, testing mechanical, electrical and climatic conditions at the same time. - SIE-NV will apply a combination of the toy model based on a Fiat500, and the SimRod model, provided by SIE-
SAS for HF-inverter testing.

GA # 769506 15 / 63 D4.2 – Battery test-specification development and test reports regarding battery assessment metrics - PU
5. Objective: The objective of OBELICS is to derive a novel methodology and tools to assess the safety and reliability of the electric drive trains more efficiently and earlier in the design process (safety improvement by a factor of 10). This will be achieved by combining innovative numerical and experimental methods and tools within multi-domain environments developed within the OBELICS. Activity: This objective is mainly located in other work-packages, as for example in WP5. Nevertheless, safety and reliability aspects are omnipresent in R&D-projects. - Bosch and Fraunhofer LBF are investigating reliability and saftey issues of battery systems, including
mechanical load measurements on two electric vehicles. - VUB develops electrothermal aging models for battery-cell and module level, on both AMESim LMS and
MATLAB Simulink platforms.
6. Objective: The key objective of OBELICS is to demonstrate achieving expected impacts of the project GV.2017 call on a very wide basis of 17 use cases that are organized in 4 topical clusters. These use cases represent real development tasks of EV components and systems and are selected in a way to allow for representative evaluation of the impact of OBELICS deliverables on the development process of EVs. This evaluation process will be based on the metrics and novel virtual as well as physical environments (Objective 1) to warranty credibility of achieved impacts and their relevance, as they will be benchmarked in accordance to the metrics, criteria and environments that will be characteristic for next generation EVs. This objective is part of the activities of ViF and may be found in D4.3. 7. Objective: The objective of OBELICS is to optimize the existing testing procedures, and present adapted and enhanced heterogeneous testing procedures to the international standardization community. For example: - Bosch created a vehicle model, in order to describe and predict the vibration loading on the vehicle battery
system. - SIE-NV combines the toy model based on a Fiat500, and the SimRod model, provided by SIE-SAS, to verify
proper operation of HF-inverters on a real-time (RT) platform. Details to the listed items are shown in the following chapter (methods and results). 1.4.2 Methods and Results
Within this chapter, a short introduction to chapter 3, methods and results, is given along sub-tasks and items for orientation. For more detailed information, tables and figures, please, see below.
Sub-Task 4.2.1: Creation of test methodologies for scalable tests of HF-inverter with e-motor/batteries
Within sub-task 4.2.1, contributions to the item, Derivation of advanced drive files for numerical and experimental testing which combines the electric and mechanical loads in the correct relation to each other …, were made by Bosch and the Fraunhofer LBF, dealing with reliability and safety issues of the battery system. Mechanical load measurements on two electric vehicles included loading profiles on the battery system, mounting, vehicle frame and wheel carrier. Additionally, Bosch developed a vehicle model, in order to describe the vibration loading on the vehicle battery system. This vehicle model will be used to generate drive files with different road geometries. With a multi-physical test stand, the Fraunhofer LBF realizes reliability and safety measurements at battery systems, with mechanical, electrical and climatic conditions at the same time, in order to validate safety and reliability requirements (e.g. lifetime). Combined multi-physical loading, including thermomechanical load, mechanical vibrations, external climatic conditions, is applied to an HF-inverter during close-to-reality tests, simultaneously. However, in conventional lab equipment, at least one of these load components is missing. To the item, Creation of a validation method battery testing, CEA developed hardware and algorithms for online diagnosis – The main purpose of the method is the estimation of the electrochemical impedance of the cell,

GA # 769506 16 / 63 D4.2 – Battery test-specification development and test reports regarding battery assessment metrics - PU
exploiting an active excitation technique (galvanostatic excitation) performed by the electronics, where the frequencies for impedance identification are set within the bandwidth of 5 Hz and 5 kHz. Online diagnosis of the state of a Li-ion cell, realized directly by measured or indirectly by estimated parameters, contributes to the safety of a battery system. Contributions to the item, Definition of self-calibration and optimization procedures for the proposed measurement and diagnostic system to further accelerate and improve test execution, were made by UNIFI, UL and AVL. UNIFI applies Hardware-in-the-loop (HIL) testing for effective High Frequency (HF) Inverter-investigation and has defined a generic mathematical electro-thermal model of HF Inverters, in order to evaluate and predict their performances in terms of Inverter efficiency, considering the semiconductor power losses in conduction and in switching phase. Moreover, UNIFI is involved in the development of Braking system models. Main topics are the analysis and the simulation of torque optimal management for vehicle stability, also considering the interactions with control systems like ABS, ESP; finally, the split of the torque demand in the regenerative electric braking and the conventional dissipative braking (“Brake Blending models”). UL develops a methodology for setting up PMSM e-machine models for accelerated testing of HF-inverters with e-motors and batteries with stress tests under combined electro-thermal loading, allowing to represent the actual operational loads more realistically. AVL DSB investigates, whether the available test program for battery pack level testing can be broken down to battery module and battery cell level testing. Doing so has the big advantage of being able to reduce testing time and effort dramatically as a battery cell with weight between 40g and around 1kg is far easier and faster to test than a battery pack with up to more than 700kg.
Sub-Task 4.2.2: Execution of scalable tests of HF-inverter with e-motor and batteries – trail run Within sub-task 4.2.2 AVL SFR, AVL, SIE-SAS, SIE NV and FHJ are working on the item Investigation about Test methodology and architecture for HF inverters with e-motors and batteries via implementation of the e-motor model inside of the e-motor emulator and the trail run performance. AVL SFR develops a dynamic e-machine model for testing an HF-inverter with an e-machine emulator under real conditions. Efficient back-to-back testing will be developed and used to compare the results from different testing environments. AVL tries to overcome the drawbacks of non-integrated and frequency-limited (12kHz) tests with a new technology of battery tester, relying on Silicon-Carbide Semiconductor (SiC) technology. Moreover, this controller will be implemented in FPGA to accelerate the online computation and to equally meet the requirement of 20kHz frequency. This architecture allows to test the real effects of the components onto a battery: Inverter switching ripples, current modulation due to machine harmonics, driveline control (vibration damping). SIE-SAS develops a test method and assessment investigation for HF-inverters by use of a real-time simulator for virtual testing. The model must comply with test equipment constraints as well as simulation constraints. RT capability has been defined by the fact that the simulator is able to calculate and communicate in real-time with external connections. Amesim RT simulators may be used for inverters, up to the full vehicle model. In any case, it must run with a fixed step solver. Integration steps should be as high as possible in the limit of the test frequency sampling. For inverter purposes it should not be higher than 10 μs (frequency can reach 20 kHz). Real-time platforms are already available (Concurrent SimWB 32 bits & 64 bits, dSPACE SCALEXIO, ETAS LABCAR 32 bits). FHJ enlarges its experience on modeling and implementing HF power converters and corresponding control based on a FPGA platform, for generating controlled signals beyond 20 kHz with high power. SiC-technologies are applied instead of Si-technologies for power switches and diodes, which enables higher switching frequencies, with lower losses and higher temperature tolerance. This in turn reduces the volume necessity of buffer devices (capacitors and inductors), which finally increases the dynamic response of the power converter output. With respect to the

GA # 769506 17 / 63 D4.2 – Battery test-specification development and test reports regarding battery assessment metrics - PU
control, the following requirements can be established: Low latency, fast execution time, fast data transfer, cycle accuracy, and synchronous data sharing. All these requirements can be covered by an FPGA-based computing platform. VUB and CEA are working on the item, Investigation of the thermal characterization by implementation and calibration of the state functions of the battery system into the energy management platform. VUB characterizes battery cells with Kyburz eRoad from Siemens and develops electrothermal models for battery cells on module level. The models have been implemented on AMESim LMS as well as on MATLAB Simulink platforms. The aging model highly depends on the chemistry of the battery and is different from cell to cell. Test sequences contain several systematically ordered steps, i.e. capacity checks, hybrid pulse power characterization (HPPC) tests, open circuit voltage (OCV) tests, thermal test, model accuracy and reliability tests and validation tests. CEA develops hardware and algorithms for online diagnosis of proposed electronic embedded systems for electrochemical impedance estimation of Li-ion cells. The goal of this approach is to be able to determine the temperature of the cell only by measuring its current and voltage and with a precise cell activation, with an embedded and lo-cost equipment. 1.4.3 Discussions and Conclusions
Within work-package 4 of the OBELICS-project, eleven use-cases are developed parallel, without any general interaction in-between. With view to a high quality of the provided research and development activities in these use-cases, an OBELICS-use-case contribution matrix was installed, which allows in steps of work-packages an interacting comparison of methods and results, resulting in discussions and conclusions. Moreover, reports are written according to use-case activities as well as preferably through work-package discussions. As work-package 4 represents functional testing and test/system-integration for
- Complete systems, containing e-motors, batteries and HF-inverters - Batteries, in interaction with HF-inverters, and - HF-inverters, located central within the complete system
Below you find a short overview to the discussion, shown in section 4, with respect to these central categories of vehicles with an e-power-train.
Complete systems, containing e-motors, batteries and HF-inverters Within sub-task 4.2.1 UNIFI and UL are contributing to complete systems, containing e-motors, batteries and HF-inverters under the item Definition of self-calibration and optimization procedures for the proposed measurement and diagnostic system to further accelerate and improve test execution. UNIFI practices Hardware-in-the-loop (HIL) testing as effective approach in the design of power electronics controls, such as High Frequency (HF) inverters, while UL develops methodologies for setting up PMSM e-machine models for accelerated testing of complete systems with stress tests under combined electro-thermal loading. Within sub-task 4.2.2 complete systems are investigated by SIE-SAS, under the item Investigation about test methodology and architecture for HF inverters with e-motors and batteries via implementation of the e-motor model inside of the e-motor emulator and the trail run performance. SIE-SAS discusses test methods and assessment investigations, where real-time simulators are used for virtual testing, in combination with real test equipment.

GA # 769506 18 / 63 D4.2 – Battery test-specification development and test reports regarding battery assessment metrics - PU
Batteries, in interaction with HF-inverters Discussions with focus on batteries have been made within sub-task 4.2.1 by Bosch and Fraunhofer LBF, under the item Derivation of advanced drive files for numerical and experimental testing which combines the electric and mechanical loads in the correct relation to each other; the derived drive file will only contain the damage /failure relevant contributions of the operational loads. Bosch is dealing with reliability and saftey issues of the battery system, based on a multi-physical test stand, present at the Fraunhofer LBF, which is set up for reliability and safety measurements at battery systems, testing mechanical, electrical and climatic conditions at the same time. Under the item Creation of a validation method battery testing, CEA discusses hardware and algorithm for online diagnosis (estimation of the electrochemical impedance of the cell, exploiting an active excitation technique (galvanostatic excitation) performed by the electronics itself). Within sub-task 4.2.2, under Investigation about Test methodology and architecture for HF inverters with e-motors and batteries via implementation of the e-motor model inside of the e-motor emulator and the trail run performance, AVL is discussing, how to overcome the drawbacks of non-integrated and frequency-limited (12kHz) tests, with a new technology of battery tester, relying on SiC-technology. Under the item Investigation of the thermal characterization by implementation and calibration of the state functions of the battery system into the energy management platform VUB discusses the characterization of battery cells (Kyburz eRoad from Siemens) by electrothermal models on cell and module level, while CEA discusses an online diagnosis system, based on an electronic embedded system for electrochemical impedance estimation of Li-ion cells.
HF-inverters, located central within the complete system Within sub-task 4.2.1 there are no contributions, and therefore no discussions to HF-inverters. Within sub-task 4.2.2 discussions towards HF-inverters with e-motor and batteries are made under the item Investigation about Test methodology and architecture for HF inverters with e-motors and batteries via implementation of the e-motor model inside of the e-motor emulator and the trail run performance by AVL SFR. AVL SFR discusses, step by step, a test methodology, which realizes at high-quality level HF-inverter tests with a Power-HIL device. Under the item Investigation about Test methodology and architecture for HF inverters with e-motors and batteries via implementation of the e-motor model inside of the e-motor emulator and the trail run performance FHJ discusses modeling and implementing of HF power converters and their control based on a FPGA platform, for generating controlled signals beyond 20 kHz with high power, with SiC- instead of Si-technology. Concluding, despite Deliverable 4.2 (D4.2), which is primarily dedicated to the battery-system, all work within WP4 is focused to the central HF-inverter, which links the battery-system to the e-motor. Within WP4, D4.1 is meant for brain-storming about measurement and parametrization within the whole E-drive chain, D4.2 sets its focus upon measurements towards the battery and D4.3 resp. D4.4 are focused on the function of the HF-inverter within the E-drive chain – and mainly developed at AVL-SFR. Therefore, the only milestone (MS3) within WP4 makes sure, that the test bench at AVL-SFR for taking reference data is ready and available.

GA # 769506 19 / 63 D4.2 – Battery test-specification development and test reports regarding battery assessment metrics - PU
3. Methods and results Task 4.2 Scalable tests (test method investigation via trial run) for HF-inverter with e-motor and batteries (Lead: VUB; Partners: AVL SFR, FHJ, SIE-SAS, AVL, UNIFI, CEA, FhG LBF, SIE NV, ViF, Valeo, FO) In this task, dedicated test methods will be used to evaluate the HF-inverters with e-motors and batteries at different operating conditions and to ensure the robustness of the low-level control systems and their reliability. Furthermore, this task will investigate how these test methods and their outputs will achieve parameterized inverter models including their HF operation and ensure the model scalability at system level. 3.1 Sub-Task 4.2.1: Creation of test methodologies for scalable tests of HF-inverter with e-
motor/batteries
3.1.1 Derivation of advanced drive files for numerical and experimental testing which combines the electric
and mechanical loads in the correct relation to each other; the derived drive file will only contain the damage /failure relevant contributions of the operational loads. (FhG LBF)
Bosch is dealing with reliability and saftey issues of the battery system. The OBELICS demonstrator battery system (Fiat 500e) for reliability testing is provided by Bosch. The derivation of an advanced testing procedure started already in 2018 by doing mechanical load measurements on two electric vehicles. The loading profile on the battery system, mounting, vehicle frame and wheel carrier where measured. By analyzing this measuring-chain it is possible to describe the load transfer from wheel carrier to the battery system. With this knowledge it is possible to extract the relevant signals as input for the FhG LBF multiaxial test rig. Additionally, Bosch created a vehicle model in WP5 to describe and predict the vibration loading on the vehicle battery system. This vehicle model will be used to generate drive files with different road geometries. The load path from the street profile to the battery mounting is covered by the vehicle model. To be close to field applications realistic street profiles will be used as well. The generated load data on the mounting of the battery system can be also used as input data to the multiaxial test rig. Project-activities of Fraunhofer LBF At the Fraunhofer LBF a multi-physical test stand is available, which is set up for reliability and safety measurements at battery systems, testing mechanical, electrical and climatic conditions at the same time. Therefore, LBF is focused on developing test procedures on battery level in order to validate safety and reliability requirements (e.g. lifetime). E-Mobility inverters in general are subject to combined multi-physical loading during operation. The loads that are seen by the inverter are mainly:
- Thermomechanical load induced by the heat dissipation during electrical operation, - mechanical vibrations, - external climatic conditions.
All of these loads shall be applied during a close-to-reality test, simultaneously. However, in typical lab equipment, at least one of these load components is missing. Standard test equipment, available on the market, in many cases neglects the mechanical vibration loads and focuses on the electrical loads by emulation of the HV Battery and the e-motor. LBF has test facilities available enabling to apply all load quantities at the same time. The Fraunhofer LBF is involved to WP4 as shown below.

GA # 769506 20 / 63 D4.2 – Battery test-specification development and test reports regarding battery assessment metrics - PU
Table 1 Activities of the Fraunhofer LBF within WP4
Task Description of sub-task
Possible work (proposal from Meeting 30.1.18)
Work done so far
4.1.1 Definition of test specification for the battery system
- Alignment with WP 5 (LBF = Leader)
- Feed requirements from WP5 into WP 4
- Connection to UC 3.3
- Test procedure is elaborated wrt mechanical safety
- sensor positioning on Fiat 500e Battery elaborated (with Bosch)
- Definition of battery to be used for test (selected, purchased, to be delivered M9
4.1.2 Test requirements for accelerated testing
- Define load spectra for the inverter for combined testing
- Literature research on acceleration techniques
- Definition of test conditions - Definition of test object (AVL
inverter) 4.2.1 Derivation of
advanced drive files - Conduct test drive with
LBF e-mobility fleet (equipped with sensors)
- Use already available data
- Test drive with Fiat 500e is performed (collab with Bosch)
- Internal research available data - use in battery and inverter
testing) - Actual work: Roland/Ashwin:
analysis of the load data, development of acceleration for battery
- Inverter: nothing new since no inverter available
4.2.2 Execution of scalable tests on batteries and power electronics
- Conduct tests at LBF test stands (Battery tests stand and Inverter test stand)
- Battery: see roadmap/plan already submitted. Battery will be equipped with sensors in 01/2019, tests in 03/2019
- Inverter: since there is no inverter available, no perspective possible! AVL shall decide to provide HW
4.3.2 B2B tests on inverters - Define and conduct the tests in close cooperation with AVL
Future
Herein, the main activities are focused on the battery and inverter-system, as shown below.
Table 2 Activities focused on battery and inverter-system
UCC WP 4 intersection with relation to LBF
3.3 Battery
"Definition of test methods for battery systems and generating input parameter for virtual reliability assessment in WP5 "
4.3 Inverter
Usage of methodologies in a kind of first trial run, test descriptions and the verified results from the Back to Back test definition // Testing methods development & execution of scalable tests

GA # 769506 21 / 63 D4.2 – Battery test-specification development and test reports regarding battery assessment metrics - PU
LBF has still started to investigate available load spectra and available acceleration models and is in the process of defining possible acceleration techniques. It is also of importance to evaluate, in how far methods of structural durability and acceleration in the frequency domain maybe helpful. In functional safety assessment of road vehicles (ISO11) it is mandatory to evaluate all possible risks as well as to classify these risks by means of a 4-fold ASIL scale. These risks are then broken down stepwise to the subsystems and components. Consequently, there is a non-trivial relationship between the failure behavior on component level and the global risk on system level. The evaluation of this relationship is only possible, if quantitative metrics like the failure probability of components can be determined. In order to get realistic estimations of the failure probability, it is in most cases necessary to conduct numerical simulation or hardware tests on these components. The most common methods for proof of reliability and safety of electronic components is either an estimation based on catalogue values and experience, or experimental tests addressing a given or anticipated failure mechanism. In general, due to the ongoing improvement in quality of electronic components the latter is assumed to result in conservative estimations. Definition of test specification for the battery system: The objective is, to define test specifications and overall test procedures for tests at the LBF test-stand, in order to investigate mechanical reliability and safety of the battery system. Work performed: According to our project-partner Bosch, sensor manufacturing and equipping the battery with sensors will be done in time. Test requirements for accelerated testing: The objective is to define test specifications and overall text procedures for tests at the LBF test-stand, in order to reach a reduction in test time effort and -costs. Work performed: In cooperation with our project-partners AVL and Siemens, the setup for inverter-testing is under discussion. Derivation of advanced drive files: The objective is, to derive drive files from fiat 500e test-drives. Work performed: The car was shipped to Darmstadt, where it is prepared by LBF. The collection of data during test drives has been done in July 11+12, 2018 at Bosch in Stuttgart. Concept Task 4.2 of OBELICS involves the evaluation of battery systems for their reliability under different operating conditions. The subtask 4.2.1 as shown above incorporates the generation of advanced drive files for experimental testing of these battery systems. This advanced drive file will be used in subtask 4.2.2 for testing the battery system on a multi-physical test rig at Fraunhofer LBF with a climatic chamber (CC) and vehicle energy system (VES) in addition to the multi-axis shaker table (MAST). A drive file refers to a load signal with varying amplitudes representing real life use cases for reliability testing of a component/system in laboratory conditions in a short span of time. The mechanical acceleration signal and the electrical charge-discharge signal are derived for the purposes of testing and evaluating the mechanical and electrical reliability characteristics of a high voltage battery system, for example on a multi-physical test bench such as the multi-axial vibration testing facility in a climate chamber at Fraunhofer LBF. Commonly, the drive file is derived from numerical simulation or from experimental measurements made from an actual vehicle on test tracks or public roads. In case of OBELICS, this drive file will be derived from measurements made on a Fiat 500e by driving on public roads and test tracks. The measurements were a cooperative work of Fraunhofer LBF and Bosch in the summer of 2018. The experimental drives on the test track facility of Bosch in Stuttgart collected acceleration and GPS data. The advanced drive file in the context of OBELICS refers to a new and innovative approach developed at Fraunhofer LBF. The mechanical acceleration signal is optimised in frequency domain to contain only damage relevant parameters. Sections of the signal with low energy content will be removed from original signal, so the shorter signal implies shorter testing time thus saving on testing costs.

GA # 769506 22 / 63 D4.2 – Battery test-specification development and test reports regarding battery assessment metrics - PU
Data collection – Sensors and Measurements The battery system chosen for the project is the high voltage traction battery of the Fiat 500e. The testing on the multi-physical test bench at Fraunhofer LBF requires a drive file which is generated based on the measurements made on an actual Fiat 500e. These measurements were made using accelerometers and GPS sensors. The accelerometers were fixed to the hinge points of the battery and at the centre of the battery, Figure 1. The GPS sensor was fixed to the roof of the car to collect latitude, longitude and speed data.
Figure 1 Position of accelerometers on the battery system of the Fiat 500e, accelerometers A9 - A12 are positioned on the hinge points of the battery, accelerometer A13 is positioned in the middle of the battery housing
Advanced Drive File – concept of deriving the advanced drive file for OBELICS The advanced innovative drive file with test time shortening in frequency domain uses the power spectral density (PSD) as the basis for the optimization process, Figure 2. The generated drive signal is divided into smaller sections or windows after pre-processing. A PSD of each of the windows is computed and is compared against a ‘Reference PSD’, a PSD which serves as the criteria to decide if a section of the signal is to be retained or not. This process can be applied from a uniaxial to tri-axial signal. The optimised signal is compared against the original signal using pseudo damage computation, RMS and kurtosis parameters.

GA # 769506 23 / 63 D4.2 – Battery test-specification development and test reports regarding battery assessment metrics - PU
Figure 2 Optimization process in the frequency domain using a Reference PSD for test time shortening
The process to optimise the mechanical vibration signal (mechanical load) summarised:
Data measurement from Fiat 500e with accelerometers and GPS sensors (summer 2018). Signal pre-processing – including filtering, resampling, segmenting, etc. Sorting of signals based on GPS signal as public roads (city, country road and motorways), Figure 3. Generating a new signal comprising of signals from different road sections and also measurement data
from test tracks, Figure 4. Optimise test signal length by using the frequency-based test-time optimisation method. Rain-flow calculation and Miner’s rule to estimate the damage content of the drive signal. Compare estimated damage against the damage content of ISO 12405-2 signal for a test duration of 12
hours to determine the number of repetitions of the drive signal required for an effective test.

GA # 769506 24 / 63 D4.2 – Battery test-specification development and test reports regarding battery assessment metrics - PU
Figure 3 Test drive along city, country roads and motorways overlaid near Stuttgart, Germany
Figure 4 Measurement data from city, country roads and motorways
Figures 5 and 6 show the success of the time signal shortening via the proposed optimization process of the mechanical vibration signal. It can be seen that instead of using more than 5000 s of the original acceleration signals in horizontal x- and y- as well as in vertical z-direction, only about 1500 s, shortened by 72.9 %, are necessary to simulate the mechanical loading with the same relevant damage parameters.

GA # 769506 25 / 63 D4.2 – Battery test-specification development and test reports regarding battery assessment metrics - PU
Figure 5 Original acceleration signal, a. acceleration in x-direction, b. acceleration in y-direction, c. acceleration in z-direction
Figure 6 Optimized acceleration signal – shortened by 72.9 %, a. acceleration in x-direction, b. acceleration in y-direction, c. acceleration in z-direction
As for the charge-discharge current signal (electrical load), an electrical current measurement during the test drive is required. However, these measurements were not captured during the particular test drive of the FIAT 500e. Therefore, it becomes necessary to generate these signals manually based on the speed and acceleration of the vehicle. If this generation process does not succeed, alternatively a standard electrical charge-discharge signal consisting of repeated pattern will be used, Figure 7. The electrical charge-discharge signal will be based on measurements made on vehicles similar in size and weight to the Fiat 500e with measurement drive on similar road conditions.

GA # 769506 26 / 63 D4.2 – Battery test-specification development and test reports regarding battery assessment metrics - PU
Figure 7 Charge-discharge current
There is no necessity specified in subtask 4.2.2 to have temperature influence for the tests, but since the tests can be carried out in a climatic chamber and since there is provision to check the performance of the battery system at various temperatures, we might incorporate temperature into testing. This way the influence of temperature can be documented. The temperature profile can either be constant during the test or varying according to time, Figure 8.
Figure 8 Temperature profile
Sine Sweeps In addition to evaluating the battery system based on the generated drive file sine sweeps will be performed. The main aim of these sweeps is to capture the resonance or vibration characteristics of the battery system. Natural frequencies primarily in z-direction (Figure 1), if any in the frequency range of interest (2-200 Hz) can be determined by the sweeps. Another advantage of performing these sweeps before and after the evaluation of battery system on the MAST is to identify any structural changes like loose parts or broken parts inside the system, as the measurement from the sweep before the test wouldn’t match the measurement from the sweep after the test.

GA # 769506 27 / 63 D4.2 – Battery test-specification development and test reports regarding battery assessment metrics - PU
3.1.2 Creation of a validation method battery testing. (CEA)
CEA develops hardware and algorithms for online diagnosis: The main purpose of the method that CEA will develop is the estimation of the electrochemical impedance of the cell, exploiting an active excitation technique (galvanostatic excitation) performed by the electronics itself. The addressed frequencies of impedance identification process are in the bandwidth between 5 Hz and 5 kHz. The impedance estimation will be the result of a broadband frequency-based signal processing technique taking as input the acquired voltage variation of the cell and the identification current (which is measured too). The identification current usually goes from 100 to 400 mA, with a certain shape and duration meant to address some specific frequencies. These two signals, current and voltage, are acquired by the ADCs of the embedded microcontroller (Please keep clear the difference between the current cited above, switched from the cell and measured with specific electronics, and the motor current, which we can neither control nor measure). Embedded impedance estimation - cell activation and measurement procedure: On a standard electric vehicle, the power inverter, switching at a certain frequency, indirectly activate the cells of a battery-pack in a galvanostatic way; the same consideration is true for the battery charger, fast charging or not. Herein, only a small number of frequencies (together with their harmonics) are activated by the devices of a standard electric vehicle, excluding many parts of the impedance power spectrum. Different techniques may be applied, among which the most common are:
- Single sinus frequency swipe, - chirp signal, - wideband signal (white noise ideally).
Focusing on the third technique, good results come from the use of a Pseudo-Random Binary Sequence (PRBS from now on), whose power spectrum can be considered 3dB-flat over a restricted part of it. Online diagnosis of the state of a Li-ion cell, based on its measured and/or indirectly estimated parameters, is a key factor for the safety of a battery-based system. ‘Online’, referred to ‘diagnosis’, must be intended as ‘performed during the normal operation of the device and on the long term’ and it is often based on measurement systems themselves based on embedded electronics. Nevertheless, those systems cannot be implemented without a preliminary simulation of their expected performances, followed by an in-lab demonstration with dedicated equipment on a real device to test (a Li-ion cell in this case). The online diagnosis tool that we propose to develop is the exploitation of the electrochemical impedance of a Li-ion cell. This value, always expressed as a function of the frequency, Z(f), is retrieved from synchronous acquisitions of current and voltage on a Li-ion cell, during a cell activation procedure. Then, from the so estimated impedance, with a precise algorithm one can determine other internal parameters of the cell. In our case, based on what is reported in literature (see references cited in D4.1), we are trying to determine the internal temperature of the cell. As a consequence of all these considerations, our approach, already described from a theoretical point of view in D4.1, will follow three practical steps:
1. In-lab impedance estimation of a Li-ion cell, possibly controlling its temperature in a climatic chamber; 2. Development of an embedded electronics (hardware and software) or adaptation of an existing one to
couple it with a Li-ion cell of our choice; 3. Tests and results.
For the time being, we are working on the first and second steps concurrently (they are somehow linked, one influence the other). The whole of our approach is experimental: relying on what is described in literature (see references in D4.1), we will perform enhanced tests on a Li-ion cell to try to obtain similar results but using an embedded electronic system in the end instead of laboratory equipment. More precisely, experiments will be carried out on a Li-ion cell (3000 mAh INR18650HG2 by LG).

GA # 769506 28 / 63 D4.2 – Battery test-specification development and test reports regarding battery assessment metrics - PU
Between what is described in literature and what is feasible with embedded electronics, a trade-off must be found. By instance, with an embedded system we can hardly overcome the 12 bits of resolution, while in a laboratory one can easily reach 24 bits of resolution. The same is true for the frequency bandwidth that is addresses: in our case a bandwidth between 100 Hz and 2 kHz is the most realistic we can expect to do. In order to perform the in-lab tests (step #1), the equipment depicted here below (figure 9 and 10) shall be used.
Figure 9 From upper left and clockwise: climatic chamber (closed) used to control the cell temperature, function generator to create the PRBS sequence activating the cell, OROS acquisition system, climatic chamber (open).

GA # 769506 29 / 63 D4.2 – Battery test-specification development and test reports regarding battery assessment metrics - PU
Figure 10 Detail of what is inside the climatic chamber. The green PCB is a prototype of the embedded electronics containing only the analog part. All the computation is performed on PC.
By using laboratory equipment, the computation must be carried out on a PC once the data acquired with the acquisition system have been exported. The following step will naturally be to integrate all this on a single platform. Here below a non-working example is depicted in figure 11.
Figure 11 Non-working example of an embedded system performing the impedance estimation of a Li-ion cell. Here the algorithm computation is performed on a microcontroller.
All the computation, which was previously performed on the PC, will be here carried out on the embedded microcontroller. That means that the output of this electronic system will be directly an impedance value, retrieved by a connected PC, which will only read and display data. Here below, the test specification are listed:
Addressed frequency bandwidth for the cell activation: 100 Hz to 2 kHz Type of cell activation: Galvanostatic Activation (that means that a controlled current is switched from
the cell or injected into it, or both, and its Voltage response is measured) Amplitude of current: 200 mA to 400 mA Activation profile: PRBS (Pseudo Random Binary Sequence) Activation duration: about 0,5 seconds, by repeating the PRBS many time for averaging purposes Bias current: none Data link to PC: UART.
The majority of our efforts will be dedicated to the adaptation or the creation of an electronic system suitable for our tests and to the integration of the algorithms calculating the impedance into the microcontroller.

GA # 769506 30 / 63 D4.2 – Battery test-specification development and test reports regarding battery assessment metrics - PU
3.1.3 Definition of self-calibration and optimization procedures for the proposed measurement and diagnostic system to further accelerate and improve test execution. (UNIFI)
UNIFI is using hardware-in-the-loop (HIL) as effective testing approach in the design of power electronics controls, such as High Frequency (HF) Inverters in automotive applications. The definitions of configurable and scalable input/output measurements and the representation of the preliminary procedure for Inverter test preparation to a benchmark test case, were defined in the previous deliverable (Deliverable D4.1 [1]). These topics are the first steps to be explored in order to guarantee safety and correct execution of the test, minimizing time duration and energy consumption. In the last Deliverable (SubTask 4.1.3, Section 3.3.3 [1]), UNIFI has defined a generic mathematical electro-thermal model of HF Inverter for the evaluation and prediction of performances in terms of Inverter efficiency, considering the semiconductor power losses in conduction and in switching phase. Defined electro-thermal model, it was deduced that the evaluation of HF Inverter performances have to be performed considering different parameters:
Voltage DC source level; Control system parameters like Switching Frequency and modulation index; The e-motor inductive load (power factor cos (𝜑)); Output Electrical AC power measurements; Room temperature and type of Cooling System used;
Moreover, in the last Deliverable (SubTask 4.1.4, Section 3.4.4 [1]), it’s defined the list of preliminary test procedures to verify the condition of a benchmark test case, in order to guarantee correct installation/settings of the whole testing system. In particular, the check of connections and the insulations (high-voltage connections), the correct implementation of start-up and shut-down procedures, are defined, and – if not done in other bench – the execution of planned “failure injection” are defined, to verify the correctness of the safety logic implemented at software and hardware level. Currently, UNIFI is involved in the development of Braking system models in the Use Case Clusters UCC1, UCC2 in OBELICS project [2]. Main topics are the analysis and the simulation of torque optimal management for vehicle stability, also considering the interactions with control systems like ABS, ESP; finally, the split of the torque demand in the regenerative electric braking and the conventional dissipative braking (“Brake Blending models”). By the development of these models, UNIFI should perform analysis on the HF Inverter and derive the following topics:
Analysis of Dynamic/Bandwidth response in the Torque Vectoring systems and the HF Inverter synchronization (from WP3);
Investigation of Torque Harmonics and how they could affect the HF Inverter output (from WP3); Safe-operation and fault injection, referring to ISO 26262, on Brake Blending systems (from WP5).
With particular reference to 4.1.2 activities, UNIFI has investigated these topics: Deepening of the input/output preliminary calibration procedure of the Inverter under test bench [4]. Definition of a self-calibration procedure for matching electrical and mechanical impedances between
HF Inverter and emulated systems in the test bench: the aim of this work is the realization of an internal observer that self-calibrates these impedances: it is important in phase design to predict transient behaviors of the tested inverter in order to prevent side effects [4];
Definition of an appropriate self-acting Design Of Experiments (DOE) to optimize test bench efficiency and in order to find out optimal working point for the inverter.
Testing the Inverter and the control system robustness using known driving cycles like NEDC, WLTP, and real world ones combined in a Montecarlo simulation [3].

GA # 769506 31 / 63 D4.2 – Battery test-specification development and test reports regarding battery assessment metrics - PU
Table 3 List of publications for this project
Status publication Type of publication
Title of publication Author(s)
Title of the Journal/ Proceedings/ book
DOI
Published
Publication in Conference proceedings/ Workshop
Online State of Health Estimation of Lithium-Ion Batteries Based on Improved Ampere-Count Method
Locorotondo, E., Pugi, L., Berzi, L., Pierini, M., Pretto, A.
Proceedings - 2018 IEEE International Conference on Environment and Electrical Engineering and 2018 IEEE Industrial and Commercial Power Systems Europe, EEEIC/I and CPS Europe 2018 8493825
10.1109/EEEIC.2018.8493825
Published
Publication in Conference proceedings/Workshop
Online Identification of Thevenin Equivalent Circuit Model Parameters and Estimation State of Charge of Lithium-Ion Batteries
Locorotondo, E., Pugi, L., Berzi, L., Pierini, M., Lutzemberger, G.
Proceedings - 2018 IEEE International Conference on Environment and Electrical Engineering and 2018 IEEE Industrial and Commercial Power Systems Europe, EEEIC/I and CPS Europe 2018, art. no. 8493924
10.1109/EEEIC.2018.8493924
Published Publication in Book Series
Real time models of automotive mechatronics systems: Verifications on “toy models”
Pugi, L., Favilli, T., Berzi, L., Pierini, M., Locorotondo, E.
Mechanisms and Machine Science
10.1007/978-3-030-03320-0_15
Accepted Paper
Publication in Conference proceedings/Workshop
Electrochemical Impedance Spectroscopy of Li-Ion battery on-board the Electric Vehicles based on Fast nonparametric identification method
Locorotondo, E., Pugi, L., Berzi, L., Pierini, M.
Proceedings - 2019 IEEE International Conference on Environment and Electrical Engineering and 2019 IEEE Industrial and Commercial Power Systems Europe, EEEIC/I&CPS Europe 2019
Presenting on 14/06/2019 in Genoa (Italy)
Accepted Paper
Publication in Conference proceedings/Workshop
Application of Regenerative Braking on Electric Vehicles
Pugi, L., Favilli, T., Berzi, L., Pierini, M., Locorotondo, E.
Proceedings - 2019 IEEE International Conference on Environment and Electrical Engineering and 2019 IEEE Industrial and Commercial Power Systems Europe, EEEIC/I&CPS Europe 2019
Presenting on 14/06/2019 in Genoa (Italy)

GA # 769506 32 / 63 D4.2 – Battery test-specification development and test reports regarding battery assessment metrics - PU
Accepted Paper
Publication in Conference proceedings/Workshop
Modeling and simulation of Constant Phase Element for battery Electrochemical Impedance Spectroscopy
Locorotondo, E., Pugi, L., Berzi, L., Pierini, M.
RTSI 2019: 5th International Forum on Research and Technologies for Society and Industry
Presenting on September 2019 in Florence (Italy)
Accepted Paper
Publication in Conference proceedings/Workshop
Analytical Model of Power MOSFET Switching Losses due to Parasitic Components
Locorotondo, E., Pugi, L., Corti, F., Reatti, A.
RTSI 2019: 5th International Forum on Research and Technologies for Society and Industry
Presenting on September 2019 in Florence (Italy)
Accepted Paper
Brake Blending Strategy on Electric Vehicle: Co-simulation Between MATLAB Simulink® and Simcenter Amesim™
Pugi, L., Favilli, T., Berzi, L., Pierini, M., Weiss, G.B., Ponchant, M., Tobia, N.
RTSI 2019: 5th International Forum on Research and Technologies for Society and Industry
Presenting on September 2019 in Florence (Italy)
Within WP2 UL developed the PMSM electromagnetic, thermal, mechanic and ageing models. They will be further coupled together in WP3 to form multi-physical scalable PMSM model. To validate the thermal housing cooling sub-model the need for scalable real physical (hardware) model rise up. The hardware model is built up by using CNC tools. It consists of aluminum tube with cooling channels. The channels are axially oriented with bidirectional liquid coolant flow. The measuring system built-up around the hardware model consists of pressure meter, flow meter and temperature sensors. The coolant liquid is circulating through heat exchanger by the help of auxiliary liquid pump. The so- composed hardware system (Figure 12, left) allows us to validate the coupled thermal and computational fluid dynamics simulation results calculated within WP2. The test results serve to qualitatively validate all results and based on them to properly characterize the thermal model developed further on in WP2. The position of developed measuring hardware system in OBELICS V-curve is shown in Figure 12 (right). The measuring validation hardware cooling system developed in WP4 will form the base for measurement system for coupled models (WP3) verification. As well as the hardware cooling system will be used in UC4.5, where unique HIL and SIL system will be developed. This use case will use multi-physical PMSM (Permanent Magnet Synchronous Machine) machine model (WP2 and WP3) with degradation prediction under arbitrary real driving condition and vehicle parameters (Figure 13), and with a unique feature of virtually scaling power ranges of PMSM machine cooling housing and heat exchanger system in HiL environment with the help of a baseline PMSM machine, that will be scaled to desired power ranges. Further on we develop the methodology for setting up a multi-physical PMSM machine models for accelerated testing of machine stress test under combined electro-thermal loading allowing to represent the actual operational loads more realistically. The scalable transformation methodology for different in-computer PMSM machine designs is still in development progress. The measured results through HIL testing procedure are already available and will be used for formation of scalable transformation methodology of in-computer e-motor design.

GA # 769506 33 / 63 D4.2 – Battery test-specification development and test reports regarding battery assessment metrics - PU
Figure 12 Thermal system for 3D CFD model verification
Figure 13 Measurement system for models verification
3.2 Sub-Task 4.2.2: Execution of scalable tests of HF-inverter with e-motor and batteries – trail run
3.2.1 Investigation about Test methodology and architecture for HF inverters with e-motors and batteries via implementation of the e-motor model inside of the e-motor emulator and the trail run performance (AVL SFR, AVL, SIE-SAS, SIE NV, FHJ)
AVL SFR develops test methodologies, which are described step by step with view to preparation, commission, configuration and test of HF inverters on an e-machine emulator or a similar test bench. The device under test (DUT) is the inverter. The intention of this test methodology is to realize a high-quality level of the test execution of the DUT under realistic load conditions as it is in the field.

GA # 769506 34 / 63 D4.2 – Battery test-specification development and test reports regarding battery assessment metrics - PU
The steps are listed in a practical way with the following sequence:
Step 1 Commissioning and configuration Step 2 Calibration Step 3 Test activation
The further 3 steps (step 4 to step 5) can be prepared and programmed on an automation system to perform this start-up tests, calibrations and behavior of the HF inverter automatically before the stress and performance tests are starting.
Step 4 HF inverter start-up tests Step 5 HF inverter component calibration Step 6 HF inverter behavior and key parameter Step 7 Thermal and stress tests Step 8 Inverter performance tests
These steps are mandatory to increase the quality of a test execution of an HF inverter tremendously.
Figure 14 Test scheme
In the trial run is generated the operating point for one test case based on customer requirements. The operating point approaches by setting a maximum phase current as a function of the torque and the speed. The maximum phase current is determined via current characteristic diagrams of the e-machine. Through the equation for the internal moment of the motor, a torque assigned to each point of the diagram. The torque achieving with different Id/Iq value. The possible Id/Iq value pairs for a torque differ in current amplitude and voltage requirement. The voltage equation evaluated for each speed. At the end, an optimization strategy like MTPA (Most Torque per Ampere) determines the main values, which have to be set up on the emulator test bench. Result of the example: The requirements of the testing for the highest load resulting in 750 Arms phase current and corresponding 9500 Nm torque at UDC = 650 VDC voltage and a speed of 100 rpm. The graph below shows the real measurement result with the parameters explained on the right, measured on the PowerHiL test bench. The test setup (figure 15) for the measurement of the phase currents caused as specified, driven by torque and speed of the HF inverter is on the PowerHiL as shown below.

GA # 769506 35 / 63 D4.2 – Battery test-specification development and test reports regarding battery assessment metrics - PU
Figure 15 Test setup
The major components, which are adapted to the HF inverter are following:
Machine emulator with power supply to emulate the real e-machine Battery emulator (DC supply for the device under test) Power Analyzer to measure the generated high voltage and current directly on the bus bars Test automation system with LV-supply and Bus simulation for the Inverter Cooling water supply for active cooling of the device
Figure 16 Measurement
The inverter is supplied with 650VDC. The graphs above (figure 16) describe the increased phase current with a jump from 361Arms to 747Arms (blue graph). Parallel is the step of the torque visible from 6305Nm to 9537Nm (red graph) incl. the regulation of the torque control (red graph). The e-machine frequency increased from 1,8Hz to 26,7Hz which corresponding the speed from 6,4 rpm to 99,6 rpm.
Torque control
Phase current

GA # 769506 36 / 63 D4.2 – Battery test-specification development and test reports regarding battery assessment metrics - PU
AVL ITS develops testing technologies for high frequency testing of e-components (up to 20kHz). Two limitations of the current battery tester are recognized:
- The sampling frequency of current controller is limited to 12 kHz due to its computational complexity. - The current battery tester performs the test without directly considering the real effects of the other
components of a powertrain and the vehicle, when they are all connected. These drawbacks clearly affect the quality of battery testing as well as testing time and effort, because battery requires further independent tests to take the real effects of the other components into account, as they are moved behind in the current testing process. To overcome the afore mentioned drawbacks, a new technology of battery tester is proposed, relying on Silicon-Carbide Semiconductor (SiC) technology. Moreover, the controller will be implemented in FPGA to accelerate the online computation and to equally meet the requirement of 20kHz frequency. An advantage of this choice is that the controller is easier to be integrated with the other components, i.e. e-motor, HF-Inverter models. The models of e-motor and HF-Inverter will be implemented in FPGA. These models will be connected to the Battery Tester, i.e. the output of the HF-Inverter will be directly injected to the Battery Tester as the set points (the input of Battery Tester). This architecture allows to test the real effects of the components onto battery:
- Inverter switching ripple; - Current modulation due to machine harmonics; - Driveline control (vibration damping).
It is worth emphasizing that AVL-ITS will not implement the models of e-motor and HF-Inverter (and battery model if required) in FPGA. Instead, AVL-ITS will take them over from other partners in OBELICS and assemble them together with the proposed battery testbed. SIE-SAS’s real-time simulators are used for virtual testing. This means, according models must comply with test equipment constraint as well as simulation constraint. RT capability has been defined in (Ponchant, Barella, Stettinger, & Benzaoui, 2017) by the fact that the simulator is able to calculate and communicate with external connections (within the real time step for each integration step). Simcenter Amesim RT simulators correspond to some specific components, like inverters up to the full vehicle model, and can be directly exported (or through FMU with RT). In any case, it must run with a fixed step solver. Integration steps should be as high as possible in the limit of the test frequency sampling. For inverter purposes, this frequency can reach 20 kHz, meaning integration should not be higher than 10 μs for inverter model. With FMU, there is no need, to use a Simulink coder, to generate binary file for real-time target. The real-time platforms are already available (Concurrent SimWB 32 bits & 64 bits, dSPACE SCALEXIO, ETAS LABCAR 32 bits). A configuration parametrization for compilation utility is available within Simcenter Amesim. There is a long list of real-time targets already available, including an additional real-time platform. SIE-SAS, as being mainly involved in WP2 & WP3 and developed a new RT compatible e-motor model as well as a toy model, to take the full vehicle behavior into account. Toy models are useful for testing purposes, as more realistic current profiles are generated, by considering the complete vehicle environment (driving cycle, cooling circuit…). The first toy model corresponds to an integrated vehicle model and is based on Fiat 500e (UC2.3 & UC2.5), where several subsystems are considered:
- Driveline - HV & LV electric circuit - Cooling circuit of battery - Cooling circuit of e-motor & inverter - Air conditioning
This model is real time compatible, by running a fixed step solver with a fixed integration step of 1 ms – and it is available with FMU 2.0.

GA # 769506 37 / 63 D4.2 – Battery test-specification development and test reports regarding battery assessment metrics - PU
Figure 17 Fiat 500e toy FMU model dedicated to real-time calculation
INTime platform is being integrated as available real-time platform for FMU in collaboration with AVL. Dedicated interfaces, which ensure the connection with test bench, could now be used for investigations, especially for inverter testing. Below, in figure 18, there is an example of an interface where battery and motor models are split from the initial full integrated toy model (UC2.3).
Figure 18 Example of Toy model connected with battery & e-motor model through FMU

GA # 769506 38 / 63 D4.2 – Battery test-specification development and test reports regarding battery assessment metrics - PU
3.2.2 Investigation of the thermal characterisation by implementation and calibration of the state functions of the battery system into the energy management platform (VUB, CEA)
VUB already has started to characterize cells and develop electrothermal model in cell and module levels. This detailed model is based on the LFP cells which have been provided by Siemens software. The model has been implemented on both AMESim LMS and MATLAB Simulink platforms. However, the aging model highly depends on the chemistry of the battery and is different cell to cell. The cycling data is needed to analysis the aging process. Battery cells VUB has received one battery module of ‘Kyburz eRoad’ electric vehicle from SIEMENS INDUSTRY SOFTWARE NV (SIE-NV) as shown in figure 19. This module contains four LFP battery cells (CALB_SE200) and nominal capacity of each is 200Ah. Voltage varies between 3.65V to 2.5 in 100% to 0% SoC window and it can tolerate maximum 55°C during discharge and 45°C while it charges. Some key specifications of this cell have been listed in table 5. The shown data-set, offered by the manufacturer, allows safe characterization tests.
Figure 19 Battery cell specification

GA # 769506 39 / 63 D4.2 – Battery test-specification development and test reports regarding battery assessment metrics - PU
Table 4 Data-set for safe characterization tests
Cell measurement and characterization VUB is performing characterization tests on the mentioned cells according to its own planning and methodology which has been indicated in figure 20. VUB started test setup preparation as soon as received the battery module from SIE-NV. Current and voltage cable as well as the thermal sensors have been installed on battery module as shown in Figure 21(a).
Figure 20 Test-methodology of VUB

GA # 769506 40 / 63 D4.2 – Battery test-specification development and test reports regarding battery assessment metrics - PU
Figure 21 a) Installed current cables and temperature sensors on the battery module b) inside the climate room
Capacity test Characterizations always start with capacity check at different current level and ambient temperature to measure cell capabilities at cold, room and hot conditions. For that reason, battery module has been stored in a controllable climate room (figure 21(b)) and cells have been characterized at 10°C (cold condition), 25°C (room temperature) and 45°C (hot condition). Measured current and voltage during capacity test are plotted in figure 22. As shown, battery is charged through the constant-current constant-voltage regime (0.33C DC current) and in each cycle it has been discharged at different current level. In this way, impact of discharge current on remaining capacity can be measured.
Figure 22 Capacity test: Measured current and voltage of a LFP cell
The calculated capacities from measured data at 0.33, 1 and 1.5 and 2 C-rates as well as different ambient temperature have been shown in figure 23. Cell capacity is dropping slowly when discharge current increases. However, this drop is much more obvious when ambient temperature is decreasing. Obviously, capacity has been

GA # 769506 41 / 63 D4.2 – Battery test-specification development and test reports regarding battery assessment metrics - PU
reduced to 180 Ah which is already 20% of nominal capacity. This test indicated how energy and power of battery can be limited at different temperature. Furthermore, capacity will be affected when high current loads is being drawing from battery cells. These types of characterization tests will provide a big picture of battery functionality at different conditions.
Figure 23 Capacity as function of discharge current and ambient temperature
HPPC test In the next step, hybrid pulse power characterization (HPPC) test is performed for battery parameter identification purposes. In this test cells are examined with short period current pulses (10 sec) at different levels (0.3C, 0.6C, 1C, 1.5C and 2C) as shown in figure 24 and at different temperature, same as ones explained for capacity test. The current pulses and corresponding voltage responses later will be used to identify parameters of electrical model of cells. Depending on the model order (1st, 2nd or higher) as the objective function, the parameters will be optimized in the way that satisfy the expected model accuracy.
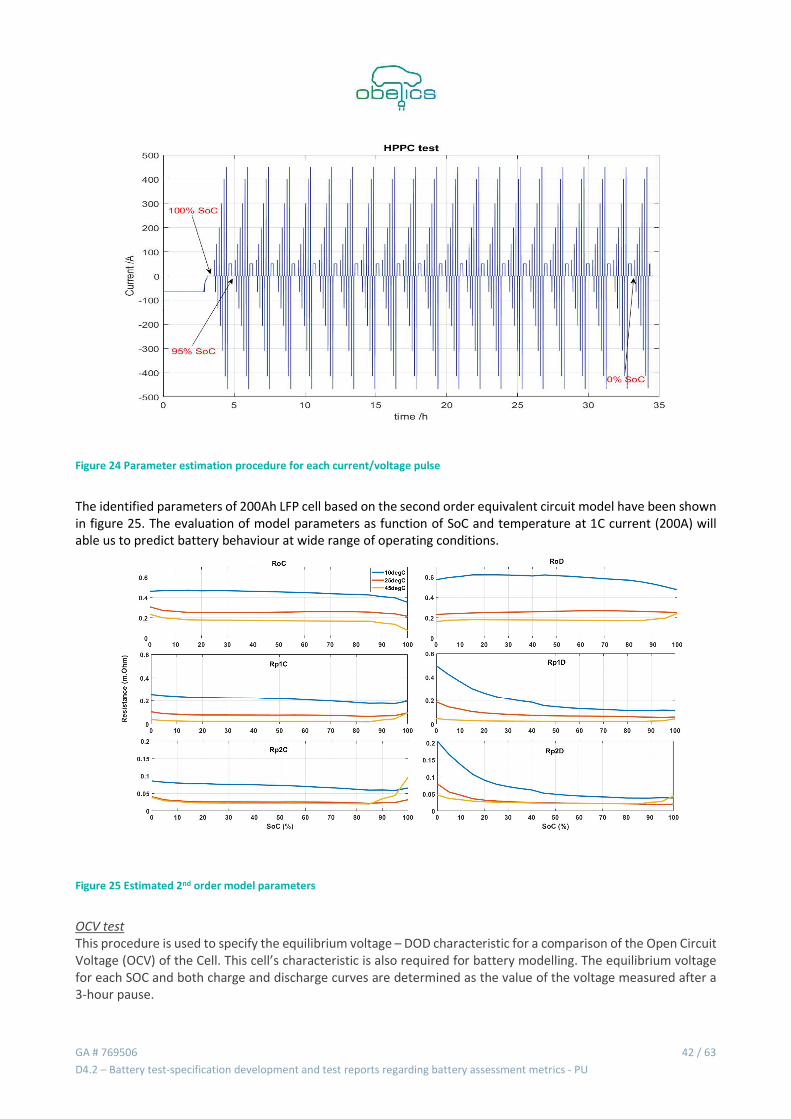
GA # 769506 42 / 63 D4.2 – Battery test-specification development and test reports regarding battery assessment metrics - PU
Figure 24 Parameter estimation procedure for each current/voltage pulse
The identified parameters of 200Ah LFP cell based on the second order equivalent circuit model have been shown in figure 25. The evaluation of model parameters as function of SoC and temperature at 1C current (200A) will able us to predict battery behaviour at wide range of operating conditions.
Figure 25 Estimated 2nd order model parameters
OCV test This procedure is used to specify the equilibrium voltage – DOD characteristic for a comparison of the Open Circuit Voltage (OCV) of the Cell. This cell’s characteristic is also required for battery modelling. The equilibrium voltage for each SOC and both charge and discharge curves are determined as the value of the voltage measured after a 3-hour pause.

GA # 769506 43 / 63 D4.2 – Battery test-specification development and test reports regarding battery assessment metrics - PU
In order to determine the amount of Ah needed to be charged or discharged to establish a fixed SOC, the capacity value obtained in the previous capacity test for each cell will be used, respectively. The time required for the OCV vs. SOC test is approximately 4 days.
Table 5 OCV vs SOC test procedure
Step Action Current (A) Limit
1 Standard charge (25°C) (C/3)
2 Pause (OCV Determination) 0 3h
3 Discharge 40A(C/5) ΔDOD=5%
4 Pause (OCV Determination) 0 3h
5 Repeat 4. - 5. until EODV EODV
6 Pause (OCV Determination) 0 3h
7 Charge 40A(C/5) ΔDOD=5%
8 Pause (OCV Determination) 0 3h
9 Repeat 7. - 8. until EOCV EOCV
The results of OCV have been analysed and showed in figure 26. The OCV curves extracted from test data at 10°C, 25°C and 45°C have been plotted at 5% SoC resolution. Obviously, battery temperature slightly affects OCV values.
Figure 26 Extracted OCV curves of LFP battery at different temperatures
Thermal test The best way to measure the thermal parameters of a thermal system is to heat up the object until its temperature riches to steady state condition. In order to heat up a battery we need to apply a high current load which due to limited SoC window in high C rates, it may not have enough time to rise the temperature adequately. Therefore,

GA # 769506 44 / 63 D4.2 – Battery test-specification development and test reports regarding battery assessment metrics - PU
periodic current profiles (equal and rather short charge/discharge iterations) will be the solution to avoid battery drastic SoC variations and also heat up the cell until its temperature gets to the steady state. Here in VUB, we decided to apply 300A short charge and discharge pulses (2 sec) at 50% of SoC as shown in figure 27. Due to same charge and discharge duration, SoC will remain almost same and it lets experiment continues for hours until temperature reaches to steady-state condition. In order to shorten the experiment length, usually high C rates (>1C) are being used. However, these sudden current polarity variations cause formation of intense electric field gradient across the electrode materials which results in strong thermal and mechanical stress on the cell physical structure.
Figure 27 Short current pulses and measured battery voltage
The measured battery’s surface temperature, corresponding to micro-pulse test has been plotted in figure 28. As described above, the input pulses have been continued until surface temperature raised and stabilized, in this case 14°C. After stabilization, battery goes to resting mode (zero input) until surface temperature reaches to ambient temperature, in this case 10°C.
Figure 28 Battery surface temperature corresponding to micro pulse test

GA # 769506 45 / 63 D4.2 – Battery test-specification development and test reports regarding battery assessment metrics - PU
Validation test Validation test is a separate and totally different load profile from characterization tests which measures model accuracy and reliability. Validation test depends on the application itself. For instance, as OBELICS is an EV related project, a standard EV driving cycle profile (WLTC) has been used for validation as shown in figure 29. The input WLTC load has been repeated until battery SoC reaches to 0% which in this test is 6 cycle. As the input current is very dynamic, temperature doesn’t get stabilised which makes it appropriate for validating the model in transient state.
Figure 29 validation test using WLTC driving cycle
Table 7 gives an overview of tests which have been done (in green) at VUB battery lab.
Table 6 Test matrix overview
Capacity test HPPC test OCV test Thermal test Validation test (cell level)
10°C Done Done Done Done Done
25°C Done Done Done Done Done
45°C Done Done Done Done Done
At CEA, an electronic embedded test system for electrochemical impedance estimation of a Li-ion cell is nowadays under development. Nevertheless, the expected results can be foreseen relying on literature and in-lab tests. By instance, what can be realistically obtained by such an approach is described by the three following graphs, in figure 30, 31 and 32.

GA # 769506 46 / 63 D4.2 – Battery test-specification development and test reports regarding battery assessment metrics - PU
Figure 30 Example of a Nyquist Diagram, representing Re(Z) and -Im(Z), of a Li-ion cell, obtained by testing a sample cell with laboratory equipent, followe by PC computation
Figure 31 Im(Z) value expressed as a function of frequency: what is important for our purpose is the frequency value at which it is equal to '0'

GA # 769506 47 / 63 D4.2 – Battery test-specification development and test reports regarding battery assessment metrics - PU
Figure 32 By repeating this test many times and at different temperatures, one can determine the evolution of the zero-cross frequency depicted in the previous Figure as a function of the cell’s temperature
That means that the goal of this approach is to be able to determine the temperature of the cell by only measuring its current and voltage and with a precise cell activation, with an embedded and lo-cost equipment. This methodology was presented by the CEA representative in the meeting in Darmstadt; the relative slides are here below (only the most meaningful ones, in figures 33 and 34).
Figure 33 Slide n. 5 presented in the Darmstadt meeting
y = -29.445x + 1607.9R² = 0.9859
0200400600800
1000120014001600
0 10 20 30 40 50 60Im(Z
) ze
ro-c
ross
fre
quen
cy [
Hz]
Cell's temperature [°C]
f0 (Hz) Linear (f0 (Hz))

GA # 769506 48 / 63 D4.2 – Battery test-specification development and test reports regarding battery assessment metrics - PU
Figure 34 Slide n. 6 presented in the Darmstadt meeting
3.2.3 Comparison of electrical testing on battery and cell level (AVL)
In the effort to reduce testing time and effort for battery characterization an investigation is done at AVL to assess results on the same battery cell on battery pack and battery cell level. As battery pack the battery of a 2018 Tesla Model 3 is used that is provided by AVL out of AVLs Series Battery Benchmarking program.
Figure 35 Tesla Model 3 LR battery pack and pack data
The same test is also applied on cell level to three of the 4416 cells out of the battery pack. Basic data of the battery cell is shown in figure 36.
Batt
ery
Dat
a
Energy total 78 kWh
Voltage nominal 350 V
Cell number 4416
Cell type 2170 cylindrical
Configuration 96s46p
Cooling Liquid
Weight 469.5 kg
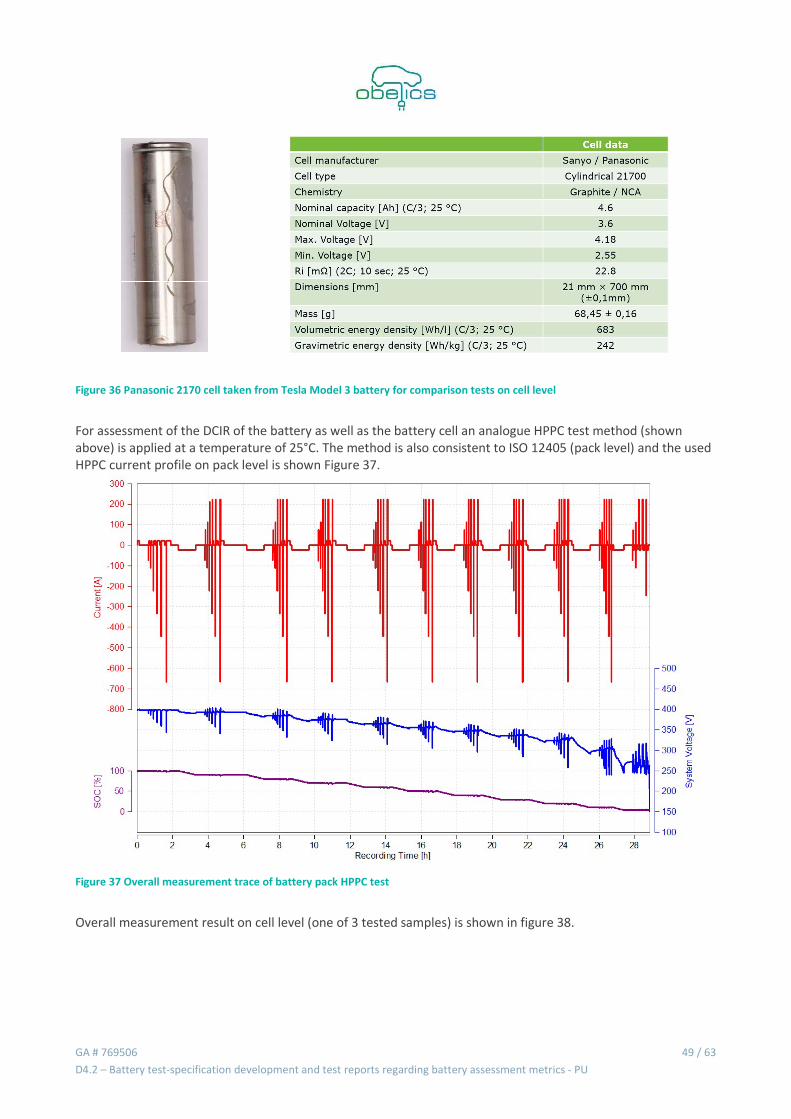
GA # 769506 49 / 63 D4.2 – Battery test-specification development and test reports regarding battery assessment metrics - PU
Figure 36 Panasonic 2170 cell taken from Tesla Model 3 battery for comparison tests on cell level
For assessment of the DCIR of the battery as well as the battery cell an analogue HPPC test method (shown above) is applied at a temperature of 25°C. The method is also consistent to ISO 12405 (pack level) and the used HPPC current profile on pack level is shown Figure 37.
Figure 37 Overall measurement trace of battery pack HPPC test
Overall measurement result on cell level (one of 3 tested samples) is shown in figure 38.

GA # 769506 50 / 63 D4.2 – Battery test-specification development and test reports regarding battery assessment metrics - PU
Figure 38: HPPC test overall trace on battery cell level
The DCIR is calculated as:
𝐷𝐶𝐼𝑅 =𝑈 − 𝑈
𝐼 − 𝐼
Where U is the voltage of the device under test and I is the current applied. t1 is the referring to the point in time that is the specified pulse length after the start of the current pulse at t0 where current must still be 0. A pulse length of 10s is used for comparison between battery pack and battery cell level.
Table 7 Resulting internal resistance @2C current and 25°C, 10s pulse length
Internal resistance @ 1C discharge [mΩ] SOC [%] Cell (average) Cell (96s46p) Pack Δ(Pack;Cell(96s46p)) 10 32,4 67,7 127,7 60,0 20 25,4 53,0 79,7 26,7 30 23,7 49,4 69,9 20,5 40 23,2 48,5 69,5 21,0 50 23,2 48,3 69,2 20,9 60 22,9 47,8 69,0 21,2 70 26,1 54,4 74,4 20,0 80 27,0 56,3 75,8 19,5 90 28,1 58,6 74,8 16,2 100 36,1 75,3 84,2 9,0 Internal resistance @ 2C discharge [mΩ] SOC [%] Cell (average) Cell (96s46p) Pack Δ(Pack;Cell(96s46p)) 10 32,6 68,0 136,2 68,2 20 24,8 51,8 78,7 26,8 30 23,4 48,8 68,6 19,8

GA # 769506 51 / 63 D4.2 – Battery test-specification development and test reports regarding battery assessment metrics - PU
40 23,0 48,0 68,6 20,6 50 23,0 48,0 68,2 20,3 60 22,5 47,0 67,5 20,5 70 24,6 51,4 70,5 19,0 80 25,6 53,5 71,9 18,4 90 26,9 56,1 71,8 15,8 100 32,2 67,1 80,1 13,0 Internal resistance @ 1C charge [mΩ] SOC [%] Cell (average) Cell (96s46p) Pack Δ(Pack;Cell(96s46p)) 10 32,8 68,4 111,9 43,4 20 26,6 55,5 81,5 25,9 30 24,0 50,0 70,9 20,9 40 23,4 48,7 69,3 20,6 50 23,4 48,9 69,1 20,2 60 23,0 48,1 68,8 20,7 70 25,6 53,5 69,3 15,8 80 26,6 55,6 71,9 16,3 90 N/A N/A 69,1 N/A 100 N/A N/A N/A N/A
In Table 7 the reader can find an excerpt of result comparison of pack internal resistance vs cell internal resistance. The Delta between cell internal resistance extrapolated to the packs cell configuration of 96s46p and the pack internal resistance consists of all at the low and high and of SOC there has been a systematic error most probably due to some shift of SOC window. This could not be clarified totally until end of reporting. From these results we learn that there is around 20mOhm of resistance in the HV connections of the battery outside the cells, which will be made plausible in the following. The HV circuitry of the battery is shown in figure 39.
Figure 39 HV connection of main circuit of Tesla Model 3 Battery including part resistances

GA # 769506 52 / 63 D4.2 – Battery test-specification development and test reports regarding battery assessment metrics - PU
The total resistance splits into: Resistance from cellblock to cellblock inside the modules
o Including cellblock to cellblock busbars o Including bonding wires from busbars to cells
EE-Unit internal resistance including all above battery busbars and electrical components All the resistances were measured where possible and otherwise calculated from material specific resistance.
• Calculated bonding resistance: (diameter of bonding 0,5mm, length 15mm, material aluminum)
• ~0,0265Ω∗
∗,
,= 2𝑚Ω => resistance for 1x bonding
• Ω
∗ 96𝑠𝑒𝑟𝑖𝑒𝑠 ∗ 2𝑡𝑖𝑚𝑒𝑠 𝑏𝑜𝑛𝑑𝑖𝑛𝑔 𝑒𝑎𝑐ℎ 𝑐𝑒𝑙𝑙 𝑡𝑜 𝑐𝑒𝑙𝑙 𝑏𝑢𝑠𝑏𝑎𝑟 = 8𝑚Ω => whole bonding
resistance of battery pack • Calculated cell to cell busbar: (cross section 8mm², length 0,15m, material aluminum)
• ~0,0265Ω∗
∗,
= 0,5𝑚Ω => resistance for 1x cell to cell connection busbar
• , Ω
∗ 96𝑠𝑒𝑟𝑖𝑒𝑠 = 7𝑚Ω => whole cell to cell busbar resistance of battery pack
• Calculated EE-Unit internal resistance: • 2𝑚Ω
Overall the estimation of HV connection resistance therefore results in 17 𝑚Ω resistance. Leaving 3 𝑚Ω that couldn’t be explained by this rough estimation versus the internal resistance measurement on pack level. Conclusion: The example has shown that in today’s high capacity batteries a large part of the internal resistance is actually residing in HV connections of the system. This part is fairly well to be estimated by estimation of the single contributor resistances. Keeping in mind that the overall importance of HV connection resistance is not as important as the battery cell resistance itself for operational robustness it is a valid proposition not to measure pack resistance at all if the target is only to get a comparative model of a battery.

GA # 769506 53 / 63 D4.2 – Battery test-specification development and test reports regarding battery assessment metrics - PU
4. Discussion and Conclusions 4.1 Use-Cases and their Influence on Work Package 4
4.1.1 Participating Use-Case-Clusters (UCCs), Use-Cases (UCs) and Use-Case-Leaders (UCLs)
The OBELICS-Use-case contribution matrix demonstrates the partitioning of the use-cases into work-packages. Vice versa, it shows the influences of different use-cases onto a particular work-package. Within work-package 4 of the OBELICS-project, eleven use-cases are developed parallel, without any general interaction in-between. Nevertheless, the use of the use-case contribution matrix, allows in steps of work-packages an interacting comparison of methods and results, resulting in discussions and conclusions. Moreover, reports are written according to use-case activities as well as preferably through work-package discussions. As work-package 4 represents functional testing and test/system-integration for
- Complete systems, containing e-motors, batteries and HF-inverters - Batteries, in interaction with HF-inverters, and - HF-inverters, located central within the complete system
it has a strong relation to the following use-case-clusters (UCCs) and use-cases (UCs):
Table 8 Use-case-clusters and as they are applicated within work-package 4
Use-Case-Cluster Leaders (UCCL)
Use-Case-Clusters (UCC) Targets
Hellal Benzaoui (Volvo) David Delichristov (VIF)
UCCs 1 & 2 Complete Systems (incl. e-motors): New e-drive concept & component sizing in earlier design phase (scalable models) E-vehicle system integration, optimization with real world verification (model-based testing)
Efficiency improvement by 20+%; and reduction in development efforts by 25+% Reduction in testing efforts by 40%; and Efficiency improvement by 20+%
Benjamin Zillmann (Bosch)
UCC 3 Batteries: Battery design and testing for improved safety & reliability
Increased safety of battery system by a factor of 10; Reduction in development and testing efforts by 40%
Raul Estrada-Vazquez (FHJ)
UCC 4 HF-Inverters: E-motor, control and inverter design & testing
Reduction of development and testing efforts by 40%; Efficiency improvement by 20%
Table 9 OBELICS-Use-case contribution matrix with reference to work-package 4
Use-Case Leader (UCL)
Use-Cases (UC) WP4-Targets
Caner Harman (Ford Otosan)
1.3 Ford Otosan e-vehicle controller design and testing
"Module and system level HIL testing to be performed before physical systems/vehicles are developed.

GA # 769506 54 / 63 D4.2 – Battery test-specification development and test reports regarding battery assessment metrics - PU
Performance testing new advanced e-powertrain concept at Ford Otosan’s Inonu Test track"
Bart Forrier (SIE-NV)
2.2 SIE-NV and SIE-SAS e-powertrain model based calibration and validation
Test method and assessment investigation, define test requirements for inverter testing, etc.
David Delichristov (VIF)
2.3 VIF model integration methods and platform
Defining requirements for test environment. Configuration of different co-simulation test setups.
Vincent Heiries (CEA)
3.1 CEA Battery safety improvement and testing
Hardware/algorithm for online diagnosis
Oliver König (AVL)
3.2 AVL 20kHz Battery assessment and testing technologies
"AVL ITS: Development of testing technologies for high frequency testing of e-components (up to 20kHz)., AVL DSB: Requirements for battery testing."
Benjamin Zillmann (Bosch)
3.3 Bosch Battery reliability testing (and safety improvement)
"Definition of test methods for battery systems and generating input parameter for virtual reliability assessment in WP5 "
El Hassan Ourami (Valeo)
4.1 Valeo 20kHz Inverter+Machine behaviour testing and investigation (48V)
"Implementation of the model in real-time FPGA bench Comparison between results of the offline model (WP2) and the results of the real-time model (PiL/HiL) with real inverter control board, AVL (ITS/NP) support comparision with a battery model"
Raul Estrada (FHJ)
4.2 FH-J Advanced Inverter Architecture, Design and Testing (FPGA in-the-Loop)
Investigation into testing requirements for HF inverters // Frizberg AVL/ITS: Dev of new battery tester module
AVL SFR, Thorsten Fischer
4.3 AVL SFR HF inverter design and testing (P-HIL)
Usage of methodologies in a kind of first trial run, test descriptions and the verified results from the Back to Back test definition // Testing methods development & execution of scalable tests
AVL AST, Franz Diwoky
4.4 AVL e-motor controller layout and validation with high fidelity models
Support through AVL-SFR for AST with e-motor controller architecture.
Damian Miljavec (UL)
4.5 UL multivariate high fidelity models for e-motor
Software Scalable to Fixed Hardware-in-The-Loop testing methodology will be developed based on WP2 and WP3 acheived results.
4.1.2 Description of UCs, included collaborations and influence on WP4
The OBELICS-use-case-cluster contribution matrix contains along the horizontal line the development of all the use-cases. Work-packages are arranged along the vertical line, giving the possibility of innovative cross-checks through all UCs. So, eleven UCs contribute to WP4. In order to point out the contributions (models and results) of the different UCCs to WP4, their contributions have been sorted within this and the next both sections. Contributions of outstanding importance for future project activities are held in colored letters.

GA # 769506 55 / 63 D4.2 – Battery test-specification development and test reports regarding battery assessment metrics - PU
4.1.2.1 Complete systems, containing e-motors, batteries and HF-inverters Within sub-task 4.2.1 the focus is generally set on creation of test methodologies for scalable tests of HF-inverter with e-motor/batteries. For complete systems, including e-motors, batteries and HF-inverters investigations to Definition of self-calibration and optimization procedures for the proposed measurement and diagnostic system to further accelerate and improve test execution were made by UNIFI and UL. UNIFI uses hardware-in-the-loop (HIL) testing as effective approach in the design of power electronics controls, such as High Frequency (HF) Inverters in automotive applications. The definitions of configurable and scalable input/output measurements and the representation of the preliminary procedure for Inverter test preparation to a benchmark test case, were defined. These topics are the first steps to be explored in order to guarantee safety and correct execution of the test, minimizing time duration and energy consumption. UNIFI has defined a generic mathematical electro-thermal model of HF Inverter for the evaluation and prediction of performances in terms of Inverter efficiency, considering the semiconductor power losses in conduction and in switching phase. Regarding this topic, a Conference/Proceeding paper is realized, and it will be presented in the following Conference: RTSI 2019: 5th International Forum on Research and Technologies for Society and Industry. Moreover, preliminary test procedures to verify the condition of a benchmark test case, in order to guarantee correct installation/settings of the whole testing system. UNIFI is involved in the development of Braking system models. Main topics are the analysis and the simulation of torque optimal management for vehicle stability, also considering the interactions with control systems like ABS, ESP; finally, the split of the torque demand in the regenerative electric braking and the conventional dissipative braking (“Brake Blending models”). UL on the other hand develops the methodology for setting up PMSM e-machine models for accelerated testing of HF-inverters with e-motors and batteries, stress tests under combined electro-thermal loading, allowing to represent the actual operational loads more realistically. The scalable transformation methodology for different in-computer e-motor designs is still in development progress. The measured results through HIL testing procedure are already available and will be used for formation of scalable transformation methodology of in-computer e-motor design. Within sub-task 4.2.2, where the focus is set on execution of scalable tests of HF-inverters with e-motors and batteries, both Siemens partners are researching complete systems, with respect to the item Investigation about Test methodology and architecture for HF inverters with e-motors and batteries via implementation of the e-motor model inside of the e-motor emulator and the trail run performance. Therefore, test method and assessment investigation for HF-inverters is done by SIE-SAS, where real-time simulators are used for virtual testing. The according models must comply with test equipment constraints as well as with simulation constraints. RT capability has been defined by the fact, that the simulator is able to calculate and communicate in real-time with external connections. Amesim RT simulators correspond to some specific components, like inverters up to the full vehicle model, and can be directly exported (or through FMU with RT). In any case, it must run with a fixed step solver. Integration steps should be as high as possible in the limit of the test frequency sampling. For inverter purposes it should not be higher than 10 μs (frequency can reach 20 kHz). With FMU, there is no need, to use a Simulink coder, in order to generate binary file for real-time target. Real-time platforms are already available (Concurrent SimWB 32 bits & 64 bits, dSPACE SCALEXIO, ETAS LABCAR 32 bits). A configuration parametrization for compilation utility is available within Amesim. There is a long list of real-time targets already available, including an additional real-time platform. SIE-NV will in a first stage use the toy model based on a Fiat500, and in a second stage the SimRod model, provided by SIE-SAS, to verify proper operation on a real-time (RT) platform. Three levels of validation are considered in each stage: The first validation is a real-time simulation of the full vehicle model including all subsystems. The second validation targets the separation of the computational loads between different cores of the RT platform. For example, the vehicle model may be run on one core, and the e-motor model (including the inverter) may be run on a second core. The third set of trial runs is aimed at validating not just the proper real-time integration of

GA # 769506 56 / 63 D4.2 – Battery test-specification development and test reports regarding battery assessment metrics - PU
the model, but also the input/output (I/O) handling in a HiL context. To this end, the vehicle model will be coupled to a real motor and inverter. In order to perform HiL tests on the SimRod inverter and e-motor, an existing HiL setup is being adapted for integration of the SimRod e-motor with inverter. SIE-NV will also perform operational runs on the SimRod, and compare these with the HiL measurements. By comparing the operational or HiL measurements with the pure simulation trial runs, a first validation of the e-motor with inverter can be made. These validations will later on form a basis for model updating. 4.1.2.2 Batteries, in interaction with HF-inverters Within sub-task 4.2.1, Bosch and Fraunhofer LBF are contributing to the item Derivation of advanced drive files for numerical and experimental testing which combines the electric and mechanical loads in the correct relation to each other; the derived drive file will only contain the damage /failure relevant contributions of the operational loads. Bosch is dealing with reliability and saftey issues of the battery system. The derivation of an advanced testing procedure started already in 2018 by doing mechanical load measurements on two electric vehicles. The loading profile on the battery system, mounting, vehicle frame and wheel carrier where measured. By analyzing this measuring chain it is possible to describe the load transfer from wheel carrier to the battery system. With this knowledge it is possible to extract the relevant signals as input for the FhG LBF multiaxial test rig. Additionally, Bosch created a vehicle model to describe and predict the vibration loading on the vehicle battery system. This vehicle model will be used to generate drive files with different road geometries. The load path from the street profile to the battery mounting is covered by the vehicle model. To be close to field applications realistic street profiles will be used as well. The generated load data on the mounting of the battery system can be also used as input data to the multiaxial test rig. The work of the Fraunhofer LBF, as shown in section 3, subdivides into the equipping of the Fiat500e with acceleration sensors, the collection of measurement data during driving on a test drive, the data analysis as well as the composition of the test drive which is then able to be applied to the MAST multiphysical test stand. In general, it is difficult or even impossible to get input data like these since they are either strictly confidential or not available. However, such data are the basis of many investigations from reliability up to AVC problems. Since the sensor application and the test file generation was performed on a real use case used in this project, the results gained with this procedure are also of relevance for other investigations as well, e.g. reliability estimation of an inverter placed in the vehicle. Furthermore, the data may serve as a basis or as a support for system simulation activities ongoing in WP3. Since at LBF also the probabilistic FMEA is developed in WP5, the data will also lay ground for an overall reliability investigation. For the mechanical parts, a stress-strength – interference approach seems applicable by deriving the applied stress from the load data measured here, and the strength data from simulations on component level in WP2. The main aim of this investigation is to serve the basis for the analysis of the mechanical behavior of the Bosch Battery under different SoC under realistic vibration conditions. These relalistic vibrations are now available and are the prerequisite for the MAST investigations actual ongoing at LBF. (The results will be part of the deliverable D4.3). It is also shown here, that the combination of the determined vibrational loads together with damage-relevant contents of the electrical and temperature loads were determined and are ready for application to the Bosch battery. As was shown in the literature survey, there is only little pre-work available showing load data like these, leading to the conclusion that the data created in Obelics will break new ground when applied to the battery for (mechanical) reliability investigation. As a conclusion, in this report it was shown that the data acquisition as well as the test drive file creation could be finished successfully and the data are ready for the nest steps in WP4 as well as in other Work packages. CEA is actively creating a validation method for battery testing with hardware and algorithms for online diagnosis – The main purpose of the method that CEA is developing is the estimation of the electrochemical impedance of the cell, exploiting an active excitation technique (galvanostatic excitation) performed by the electronics itself. The addressed frequencies of impedance identification process are roughly in the bandwidth between 100 Hz and 2 kHz.

GA # 769506 57 / 63 D4.2 – Battery test-specification development and test reports regarding battery assessment metrics - PU
The impedance estimation will be the result of a broadband frequency-based signal processing technique taking as input the acquired voltage variation of the cell and the identification current. Online diagnosis of the state of a Li-ion cell, based on its measured and/or indirectly estimated parameters, is a key factor for the safety of a battery-based system. ‘Online’, referred to diagnosis, must be intended as ‘performed during the normal operation of the device and on the long term’ and it is often based on measurement systems themselves based on embedded electronics. The online diagnosis tool that we propose to develop is the exploitation of the electrochemical impedance of a Li-ion cell. This value, always expressed as a function of the frequency, Z(f), is retrieved from synchronous acquisitions of current and voltage on a Li-ion cell, during a cell activation procedure. Our attempt is focusing on the relationship between the impedance evolution and the cell internal temperature variation, preventing by this the thermal shift. The better knowledge of the battery state, relying on the chosen parameters, and of the state evolution according to a precise use profile is a key factor to improve the vehicle’s safety, as it is studied within WP5. Within sub-task 4.2.2 investigations about test methodology and architecture for HF inverters with e-motors and batteries via implementation of the e-motor model inside of the e-motor emulator and the trail run performance were made by AVL. To overcome the drawbacks of non-integrated and frequency-limited (12kHz) tests, a new technology of battery tester is proposed, relying on Silicon-Carbide Semiconductor (SiC) technology. Moreover, the controller will be implemented in FPGA to accelerate the online computation and to equally meet the requirement of 20kHz frequency, i.e. e-motor, HF-Inverter models. This architecture allows to test the real effects of the components onto battery: Inverter switching ripple, current modulation due to machine harmonics, driveline control (vibration damping). Moreover, VUB and CEA made investigations of the thermal characterization by implementation and calibration of the state functions of the battery system into the energy management platform. VUB has started to characterize cells (Kyburz eRoad from Siemens) and develop electrothermal models for cell and module level. The detailed model is based on LFP cells which have been provided by Siemens software. The model has been implemented on both AMESim LMS and MATLAB Simulink platforms. The aging model highly depends on the chemistry of the battery and is different from cell to cell. VUB has designed characterization tests and started test setup preparation (voltage cable as well as thermal sensors have been installed on the battery module. Characterizations always start with capacity checks at different current levels and ambient temperature to measure cell capabilities at cold, room and hot conditions. The second step, hybrid pulse power characterization (HPPC) test, is performed for battery parameter identification purposes. The open circuit voltage (OCV) test measures the cell voltage at resting mode - no load and measured at different conditions. The thermal test is a type of characterisation which reveals battery behaviour for thermal modelling point of view. The result will be an exponential temperature curve which is used for thermal parameter identification. The validation test is a separate and totally different load profile from characterization tests which measures model accuracy and reliability. Validation tests depend on the application itself. At CEA the proposed electronic embedded system for electrochemical impedance estimation of a Li-ion cell is presently under development. The goal of the approach is to be able to determine the temperature of the cell only by measuring its current and voltage and with a precise cell activation, with an embedded and lo-cost equipment. 4.1.2.3 HF-inverters, located central within the complete system Within sub-task 4.2.1, focusing on the creation of test methodologies for scalable tests of HF-inverters with e-motors/batteries, there are no contributions to D4.2, dealing preferably with belongings to HF-inverters. Contributions preferably to complete systems or batteries are shown above. Towards Sub-Task 4.2.2, execution of scalable tests of HF-inverter with e-motor and batteries – trail run, AVL SFR made valuable contributions to the item investigation about Test methodology and architecture for HF inverters

GA # 769506 58 / 63 D4.2 – Battery test-specification development and test reports regarding battery assessment metrics - PU
with e-motors and batteries via implementation of the e-motor model inside of the e-motor emulator and the trail run performance. AVL SFR describes a test method, step by step, including how to prepare, commission, configure and test an HF inverter on an e-machine emulator or a similar test bench. The device under test (DUT) is the inverter. The intention of this test methodology is to realize a high-quality level of the test execution of the DUT under realistic load conditions as it is in the field. The necessary steps are: Step 1 – Commissioning and configuration, Step 2 – Calibration, Step 3 – Test activation, Step 4 – HF inverter start-up tests, Step 5 – HF inverter component calibration, Step 6 – HF inverter behaviour and key parameter, Step 7 – Thermal and stress tests, Step 8 – Inverter performance tests. These steps are mandatory to increase the quality of a test execution of an HF inverter tremendously. A trial run has been shown. The test setup for PowerHiL-measurements of current phases, driven by torque and speed of the HF inverter have been shown, too. Herein, the major components, which are adapted to the HF inverter are: Machine emulator with power supply to emulate the real e-machine, Battery emulator (DC supply for the device under test), Power Analyzer to measure the generated high voltage and current directly on the bus bars, Test automation system with LV-supply and Bus simulation for the Inverter, Cooling water supply for active cooling of the device. For the item investigation about test methodology and architecture for HF inverters with e-motors and batteries via implementation of the e-motor model inside of the e-motor emulator and the trail run performance, FHJ has a vast experience on modeling and implementing HF power converters and their control based on a FPGA platform, for generating controlled signals beyond 20 kHz with high power. New materials and technologies are needed; e.g. SiC instead of Si for power switches and diodes, which enable higher switching frequencies, with lower losses and higher temperature tolerance. This in turn reduces the volume necessity of buffer devices (capacitors and inductors), which finally increases the dynamic response of the power converter output. The higher dynamic within the intended systems, however, represents a challenge for the instrumentation (sensors and drivers) and the control around the HF power converter. With respect to the control, the following requirements can be established: Low latency, fast execution time, fast data transfer, cycle accuracy, synchronous data sharing. All these requirements can be covered by an FPGA-based computing platform. Concluding, despite Deliverable 4.2 (D4.2), which is primarily dedicated to the battery-system, all work within WP4 is focused to the central HF-inverter, which links the battery-system to the e-motor. Within WP4, D4.1 is meant for brain-storming about measurement and parametrization within the whole E-drive chain, D4.2 sets its focus upon measurements towards the battery and D4.3 resp. D4.4 are focused on the function of the HF-inverter within the E-drive chain – and mainly developed at AVL-SFR. Therefore, the only milestone (MS3) within WP4 makes sure, that the test bench at AVL-SFR for taking reference data is ready and available. 4.1.3 Systematic Project-Flow-Chart and its affection on WP4
The following figures 40 and 41 show the systematic project-flow-charts for the use-case clusters 2 and 4, including all essential parts of the power-train of an e-driven vehicle, which are combined and represented theoretically by models – which are to be developed and updated in WP2 and WP3. These models have to be verified by real world measurements – to be done in WP4. According requirements, standards and exemplary scenarios are to be set – by e.g. WP1. These scenarios do also have an important influence on the test-automation setup – responsibility in WP4.

GA # 769506 59 / 63 D4.2 – Battery test-specification development and test reports regarding battery assessment metrics - PU
Models as well as scenarios for test automation do influence simulations (MiL, SiL) – to be made in WP3 – and simulations & tests (XiL, HuIL, providing ground) – to be made in WP4. All simulations and simulations & tests are finally to compare and evaluate.
Figure 40 Systematic project-flow-chart for UCC2, including contributions of work-package 4
Figure 41 Systematic project-flow-chart for UCC4, including contributions of work-package 4

GA # 769506 60 / 63 D4.2 – Battery test-specification development and test reports regarding battery assessment metrics - PU
5. Recommendations 5.1 Towards project-applicants
For quality-improvement the OBELICS use-case contribution matrix (UCCM) was installed. Herein the use-cases (UCs) are developed horizontally and are cross-checked by one work-package (WP) after the other. Project development is done horizontally along the UCs, reporting preferably vertically along the WPs. Organizationally, as can be seen within this deliverable 4.2 (D4.2), it is difficult to build up this complex structure. This, as
- The partners, which are working along the UCs, are just inserting their descriptions and results into the given structure, according the grant agreement.
- Even if UC- and WP-leaders are well known, interaction between partners from different UCs are seldom present, respectively intensive, to learn from each other. Therefore, within the discussion chapter there are just rare comparisons between different models of different UCs.
Nevertheless, the idea to install a vertical control-mechanism is advantageous. Reporting along the UCs, as the results have been worked out here, is acceptable. Just interactions between the UCs may be intensified – even in earlier states of the project-labour. 5.2 Towards project-partners
As reports are to be written with inputs from all contributing partners, it is of outstanding importance, that contributions are sent in time along the demands of the grant agreement. Contributions of other project-partners, who are engaged with comparable research and development activities should be read continuously, with view to an intensive discussion of comparable results. This, as this is the big benefit of extended European projects. Don’t hesitate to contact project-partners, as thematic problems may be solved earlier.

GA # 769506 61 / 63 D4.2 – Battery test-specification development and test reports regarding battery assessment metrics - PU
6. Risk Register 6.1 Risk register
New identified risks that occurred are listed in the table below.
Table 10 New identified risks within WP4 of the Obelics-Project.
Risk No. What is the risk Probability
of risk occurrence1
Effect of risk2
Solutions to overcome the risk
WP4.5 LBF/Bosch: due to delay in battery delivery from USA to Bosch the corresponding results in the task “Execution of scalable tests applying novel drive files bringing in a multi-axial test rig with climate chamber for battery testing as well as test rigs for testing power electronics” of deliverable D4.2 are delayed. Actually, a solution for the reporting of the delayed results is elaborated.
1 1 LBF/Bosch are busy working, in coordination with the WP-leader and the project-management, to get results in time.
WP4.6 AVL: The test methodology corresponding to the new Battery Tester system is still under discussion between AVL-DSB and AVL-ITS. However, such a collaboration is not tight enough since each department has its own goal and duty in the project.
1 1 Foster further the collaboration between DSB and ITS departments of AVL.
WP4.7 VIF: so far VIF did not receive an inverter model from WP2 partner, thus coupling analysis using a dummy model was done (see D4.3) but no (UC) significant results could be produced. ViF is in contact with model contributors UL and FHJ. Moreover, partners want to exchange models in FMI format (due to IP) but they have not received FMILab licenses from AVL until now.
1 1 Meeting/Alignment with model contributor.
1 Probability risk will occur: 1 = high, 2 = medium, 3 = Low 2 Effect when risk occurs: 1 = high, 2 = medium, 3 = Low

GA # 769506 62 / 63 D4.2 – Battery test-specification development and test reports regarding battery assessment metrics - PU
7. References
[1] Deliverable D4.1, “Test specification for HF-inverters with e-motors”, OBELICS, 2018. [2] Deliverable D3.2, “Toy Models”, OBELICS, 2018. [3] Deliverable D7.5, “Optimization of OBELICS test procedures”, OBELICS, 2018. [4] Locorotondo, E., Pugi, L., Corti, F., Reatti, A., “Analytical Model of Power MOSFET Switching Losses due
to Parasitic Components”, RTSI 2019: 5th International Forum on Research and Technologies for Society and Industry, accepted paper, presenting on September 2019.

GA # 769506 63 / 63 D4.2 – Battery test-specification development and test reports regarding battery assessment metrics - PU
8. Acknowledgement The author(s) would like to thank the partners in the project for their valuable comments on previous drafts and for performing the review.
Table 11 Project partners
Partner no. Partner organisation name Short Name 1 AVL List GmbH AVL 2 Centro Richerche Fiat SCpA CRF 3 FORD Otomotiv Sanayi Anonim sirketi FO 4 Renault Trucks SAS RT-SAS 5 AVL Software and Functions GmbH AVL-SFR 6 Robert Bosch GmbH Bosch 7 SIEMENS INDUSTRY SOFTWARE NV SIE-NV 8 SIEMENS Industry Software SAS SIE-SAS 9 Uniresearch BV UNR 10 Valeo Equipements Electroniques Moteurs Valeo 11 Commissariat à l’Energie Atomique et aux Energies Alternatives CEA 12 LBF Fraunhofer FhG-LBF 13 FH Joanneum Gesellschaft M.B.H. FHJ 14 National Institute of Chemistry NIC 15 University Ljubljana UL 16 University Florence UNIFI 17 University of Surrey US 18 Das Virtuelle Fahrzeug Forschungsgesellschaft mbH VIF 19 Vrije Universiteit Brussel VUB
Copyright ©, all rights reserved. This document or any part thereof may not be made public or disclosed, copied or otherwise reproduced or used in any form or by any means, without prior permission in writing from the OBELICS Consortium. Neither OBELICS Consortium nor any of its members, their officers, employees or agents shall be liable or responsible, in negligence or otherwise, for any loss, damage or expense whatever sustained by any person as a result of the use, in any manner or form, of any knowledge, information or data contained in this document, or due to any inaccuracy, omission or error therein contained. All Intellectual Property Rights, know-how and information provided by and/or arising from this document, such as designs, documentation, as well as preparatory material in that regard, is and shall remain the exclusive property of the OBELICS Consortium and any of its members or its licensors. Nothing contained in this document shall give, or shall be construed as giving, any right, title, ownership, interest, license or any other right in or to any IP, know-how and information.
This project has received funding from the European Union’s Horizon 2020 research and innovation programme under grant agreement No 769506. The information and views set out in this publication does not necessarily reflect the official opinion of the European Commission. Neither the European Union institutions and bodies nor any person acting on their behalf, may be held responsible for the use which may be made of the information contained therein.