Multi-Stress Creep and Recovery Test Method A New Specification
34
Multi-Stress Creep and Recovery Test Method A New Specification John D John D ’ ’ Angelo Angelo Federal Highway Administration Federal Highway Administration Phone 202 Phone 202 - - 366 366 - - 0121 fax 202 0121 fax 202 - - 493 493 - - 2070 2070 John.D John.D ’ ’ [email protected] [email protected]
Transcript of Multi-Stress Creep and Recovery Test Method A New Specification

Multi-Stress Creep and Recovery Test Method
A New Specification
John DJohn D’’AngeloAngelo
Federal Highway AdministrationFederal Highway Administration
Phone 202Phone 202--366366--0121 fax 2020121 fax 202--493493--20702070
John.DJohn.D’’[email protected]@dot.gov

Modified Binders Affect Modified Binders Affect PerformancePerformance
Study same mix different binders.Study same mix different binders.
PG 63-22 mod. no rutting PG 67-22 unmod. 15mm rutting

Multi Stress Creep and RecoveryMulti Stress Creep and Recovery
Test using the DSR
applying a 1 sec creep
stress followed by 9 sec recovery.

Multi Stress Creep and RecoveryMulti Stress Creep and Recovery
Sample prep is exactly the same as the existing Sample prep is exactly the same as the existing RTFOT DSR.RTFOT DSR.

Typical Plot of Creep and Typical Plot of Creep and Recovery dataRecovery data
500
600
700
800
900
1000
1100
1200
1300
1400
0 100 200 300 400 500 600 700 800 900 1000
% Strain
Time in S

Determination of Determination of JnrJnr
0
5
10
15
20
25
30
0 20 40 60 80 100
Time s
Nor
mal
ized
Stra
in %
γu = Avg. un-recovered q strain mm/mm
Jnr
= γu
/ τ
τ
= applied stress during creep kPa
Jnr
= non-recoverable compliance
0
1
2
3
4
5
6
7
0 2 4 6 8 10 12
time s
Stra
in %
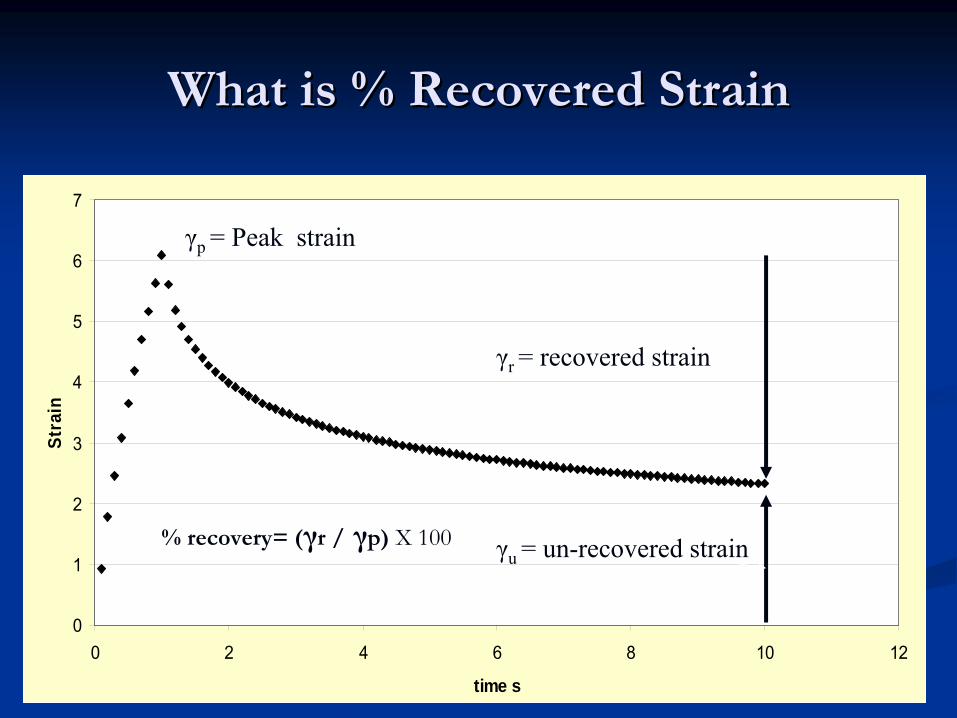
γr = recovered strain
What is % Recovered StrainWhat is % Recovered Strain
γu = un-recovered strain
γp = Peak strain
% recovery= (γr /
γp)
X 100

Standard Test Procedure Standard Test Procedure developed for AASHTOdeveloped for AASHTO

MSCR and RuttingMSCR and Rutting
Any new specification must be blind to Any new specification must be blind to modification.modification.
A new specification must identify the rutting A new specification must identify the rutting potential of all binder types under multiple potential of all binder types under multiple conditions.conditions.

Miss I55 6yr rut Miss I55 6yr rut JnrJnr
3.2 3.2 kPakPa
y = 0.2907x + 0.1297R2 = 0.7499
00.5
11.5
22.5
33.5
4
0 2 4 6 8 10 12
6 yr Jnr 3.2 kPabinder mod true grade rut mm 70C
Ultrapave SBR 70-27 4.5 1.7Styrelf SB 77-29 2 0.44
GTR 80 75-29 1.5 1.21Sealoflex SBS 82-27 3 0.19
Multigrade 72-24 5 2.13Cryo Rubber 75-28 7 1.62
Control 70-24 11 3.5

Hamburg Rut testing MINN Road mixesHamburg Rut testing MINN Road mixes
Jnr 12.8kPa
y = 0.3976x - 0.2894R2 = 0.9646
0.0
2.0
4.0
6.0
8.0
10.0
12.0
14.0
0 5 10 15 20 25 30 35rut mm
Jnr
PG 58-28PG 58-34PG 58-40

-20
-15
-10
-5
0
RU
T D
EPT H
IN m
m
0 2000 4000 6000 8000 10000 12000 14000 16000 18000 20000RUT PASSES AT ~64° C & 158 LBS (703 N)
NuStar Analysis, E-10 Fine, 64-22S @ 64.4°C, 158# AVERAGE BOTH WHEELSBRRS-3, E-10 Fine, 64-22H (70-22) (Citgo) @ 64.2°C @ 158# AVERAGE BOTH WHEELSNuStar, E-10 Fine, 64-22V (76-22) @ 64.0°C 158# AVERAGE BOTH WHEELSNuStar Analysis, E-10 Fine- NuStar 82-22 (64-22V) @ 64.2°C 158# AVERAGE BOTH WHE
NUSTAR STUDY PG 64-22S, 64-22H, 64-22V BINDERS
TESTED IN HAMBURG
DRY AT ~ 64° C, 158# LOAD, E-10 FINE LIMESTONE BLEND
09/14/08 19:45:43 C:\DRIVE_E\PMW 2008\NUSTAR\NuStar Analysis, 64-22S, 64-22H, 64-22V @ ~64°C, 158#.spf

-20
-15
-10
-5
0
RU
T D
EPT H
IN m
m
0 2000 4000 6000 8000 10000 12000 14000 16000 18000 20000RUT PASSES AT ~64° C & 158 LBS (703 N)
NuStar Analysis, E-10 Fine, 64-22S @ 64.4°C, 158# AVERAGE BOTH WHEELSBRRS-3, E-10 Fine, 64-22H (70-22) (Citgo) @ 64.2°C @ 158# AVERAGE BOTH WHEELSNuStar, E-10 Fine, 64-22V (76-22) @ 64.0°C 158# AVERAGE BOTH WHEELSNuStar Analysis, E-10 Fine- NuStar 82-22 (64-22V) @ 64.2°C 158# AVERAGE BOTH WHEBRRS-3, E-10 Fine, 70-22 (Citgo) @ 70.0°C @ 158# AVERAGE BOTH WHEELS
NUSTAR STUDY PG 64-22S, 64-22H, 64-22V BINDERS
TESTED IN HAMBURG
DRY AT ~ 64° C, 158# LOAD, E-10 FINE LIMESTONE BLEND
09/14/08 19:50:55 C:\DRIVE E\PMW 2008\NUSTAR\NuStar Analysis, 64-22S, 64-22H, 64-22V @ ~64°C, 158#

-20
-15
-10
-5
0
RU
T D
EPT H
IN m
m
0 2000 4000 6000 8000 10000 12000 14000 16000 18000 20000RUT PASSES AT ~64° C & 158 LBS (703 N)
NuStar Analysis, E-10 Fine, 64-22S @ 64.4°C, 158# AVERAGE BOTH WHEELSBRRS-3, E-10 Fine, 64-22H (70-22) (Citgo) @ 64.2°C @ 158# AVERAGE BOTH WHEELSNuStar, E-10 Fine, 64-22V (76-22) @ 64.0°C 158# AVERAGE BOTH WHEELSNuStar Analysis, E-10 Fine- NuStar 82-22 (64-22V) @ 64.2°C 158# AVERAGE BOTH WHEBRRS-3, E-10 Fine, 70-22 (Citgo) @ 70.0°C @ 158# AVERAGE BOTH WHEELSBRRS-3, E-10 Fine, 70-22 (Citgo) @ 74.7°C @ 158# AVERAGE BOTH WHEELS
NUSTAR STUDY PG 64-22S, 64-22H, 64-22V BINDERS
TESTED IN HAMBURG
DRY AT ~ 64° C, 158# LOAD, E-10 FINE LIMESTONE BLEND
09/14/08 20:03:29 C:\DRIVE_E\PMW 2008\NUSTAR\NuStar Analysis, 64-22S, 64-22H, 64-22V @ ~64°C, 158#.spf

Rut test Rut test temptemp
PG PG GRADEGRADE
PG GRADE PG GRADE ((JnrJnr))
JnrJnr at Rut at Rut Test TempTest Temp
%RECO%RECO VERYVERY
MIN MIN %RECO%RECO VERYVERY
RUT RUT DEPTH DEPTH 10000 10000 PASSEPASSE SS
6464 7676--2222 6464--22V22V 0.240.24 55.855.8 50.650.6 1.681.68
6464 6464--2222 6464--22S22S 3.43.4 3.43.4 -------------------- 7.17.1
64.464.4 7070--2222 6464--22H22H 1.351.35 4.44.4 33.733.7 3.573.57
6464 8282--2222 6464--22E22E 0.0820.082 78.578.5 66.166.1 1.551.55
7070 7070--2222 7070--22S22S 2.922.92 1.51.5 -------------------- 5.15.1
74.774.7 7070--2222 7070--22<S22<S 5.745.74 0.50.5 ------------------ 13.213.2
NuStarNuStar
Rutting Study Dry Hamburg Rutting Study Dry Hamburg WI E10 fine mixWI E10 fine mix

NuStarNuStar
Rutting Study Dry Hamburg Rutting Study Dry Hamburg WI E10 fine mixWI E10 fine mix
y = 0.4848x - 0.3131R2 = 0.9586
0
1
2
3
4
5
6
7
0 2 4 6 8 10 12 14Rut mm
Jnr 3
.2 k
Pa-1

Affect of Affect of JnrJnr
on Ruttingon Rutting
Reducing Reducing JJnrnr
by half typically reduced rutting by by half typically reduced rutting by half.half.
This affect is seen on ALF sections and This affect is seen on ALF sections and Hamburg Rut TestingHamburg Rut Testing
But most importantly this is seen on the But most importantly this is seen on the Mississippi I 55 sections.Mississippi I 55 sections.
For all mix types and loadings For all mix types and loadings JnrJnr
less than 1 less than 1
had minimal rutting.had minimal rutting.

New high Temp SpecNew high Temp Spec
PG 64 (Standard, Heavy, Very heavy) based on PG 64 (Standard, Heavy, Very heavy) based on traffic.traffic.
PG 64SPG 64S--XX XX JJnrnr
=< 4.0=< 4.0
PG 64HPG 64H--XX XX JJnrnr
=< 2.0=< 2.0
PG 64VPG 64V--XX XX JJnrnr
=< 1.0=< 1.0
Special Cases Port Facilities, Quarry Entrances, Etc. a Special Cases Port Facilities, Quarry Entrances, Etc. a PG 64EPG 64E--XX XX JJnrnr
=< 0.5 can be considered.=< 0.5 can be considered.

Existing PG 76Existing PG 76--22 4% SBS tested @ 22 4% SBS tested @ 4 temperatures 82, 76, 70 & 644 temperatures 82, 76, 70 & 64
0
500
1000
1500
2000
2500
0 1 2 3 4 5 6 7 8 9 10 11
Strain
time S
Jnr 5.69 kPa‐1
% Recovery 20.5%
Jnr 2.35 kPa‐1
% Recovery 37.0%
Jnr 1.18 kPa‐1
% Recovery 40.3%
Jnr 0.47 kPa‐1
% Recovery 51.7%
76 S
70 H
64 E

SBS PG 70SBS PG 70--28 SBS28 SBS
0
0.1
0.2
0.3
0.4
0.5
0.6
0.7
0.8
0.9
1
10 100 1000 10000 100000Stress Pa
Jnr
58C64C70C76C72C calc
1
2
3
4
5
6
7
8
10Compliance values increase with temperature and stress. The rate of increase with stress increases with increased temperature.

OriginalOriginalDSR G*/sinDSR G*/sinδδ
Min 1.0Min 1.0
6464
RTFOTRTFOT64 Standard 64 Standard MSCR3.2 <4.0MSCR3.2 <4.0
6464
64 Heavy 64 Heavy MSCR 3.2<2.0MSCR 3.2<2.0
6464
64 Very heavy64 Very heavyMSCR3.2 <1.0MSCR3.2 <1.0
6464
PAVPAV
S grade S grade DSR G*sinDSR G*sinδδMax 5000Max 5000
2828 2525 2222 1919 1616
H & V grade H & V grade DSR G*sinDSR G*sinδδ
Max 6000Max 6000
2828 2525 2222 1919 1616
New MSCR Binder SpecNew MSCR Binder Spec AASHTO M320 Table 3AASHTO M320 Table 3
Low temp BBR and DTT remain unchanged
[(MSCR3.2 [(MSCR3.2 ––
MSCR 0.1)/ MSCR 0.1)/ MSCR 0.1] < .75MSCR 0.1] < .75

Experiment DesignExperiment Design Time Temperature studyTime Temperature study
Blending Time, hoursBlending Time, hours 2 h2 h 4 h4 h 6 h6 h 6 h + x6 h + x--linkinglinking
Blending Temperature, Blending Temperature, °°CC 188188 200200 188188 200200 188188 200200 188188 200200
M320 High Temp DSRM320 High Temp DSR XX XX XX XX XX XX XX XX
UDOT Elastic RecoveryUDOT Elastic Recovery XX XX XX XX XX XX XX XX
MSCR TestMSCR Test XX XX XX XX XX XX XX XX
UV MicroscopyUV Microscopy XX XX XX XX XX XX XX XX
Incompatible 67-22 base binder mixed with 4% linear SBS elemental sulfur as a cross linker.

76.0
82.0
88.018
8-2h
200-2
h
188-4
h
200-4
h
188-6
h
200-6
h
188-6
h+X
200-6
h+X
M32
0 H
igh
PG G
rade
Changes in M320 High Temp PG Changes in M320 High Temp PG with Processingwith Processing

0
0.1
0.2
0.3
0.4
0.5
0.6
0.7
0.8
0.9
118
8-2h
200-
2h
188-
4h
200-
4h
188-
6h
200-
6h
188-
6h+X
200-
6h+X
Jnr @
70C
Changes in Changes in JJ nrnr
with Processingwith Processing
PG 70E
PG 70V

Changes in UDOT Elastic Recovery Changes in UDOT Elastic Recovery with Processingwith Processing
60.0
65.0
70.0
75.0
80.0
85.0
90.0
95.0
188-2
h
200-2
h
188-4
h
200-4
h
188-6
h
200-6
h
188-6
h+X
200-6
h+X
UD
OT
Elas
tic R
ecov
ery,
%
AASHTO T301-modRTFO, 25°C, 20 cm pull and then cut

Changes in % Recovery MSCR test Changes in % Recovery MSCR test with Processingwith Processing
0
10
20
30
40
50
60
70
188-2h 200-2h 188-4h 200-4h 188-6h 200-6h 188-6h+X 200-6h+X
% R
ecov
ery
MSC
R Recommended Min % Recovery PGXX V
Recommended Min % Recovery PGXX H

Fluorescence MicroFluorescence Micro--graphs at 250 graphs at 250 magnificationmagnification

Fluorescence MicroFluorescence Micro--graphs at 250 graphs at 250 magnificationmagnification
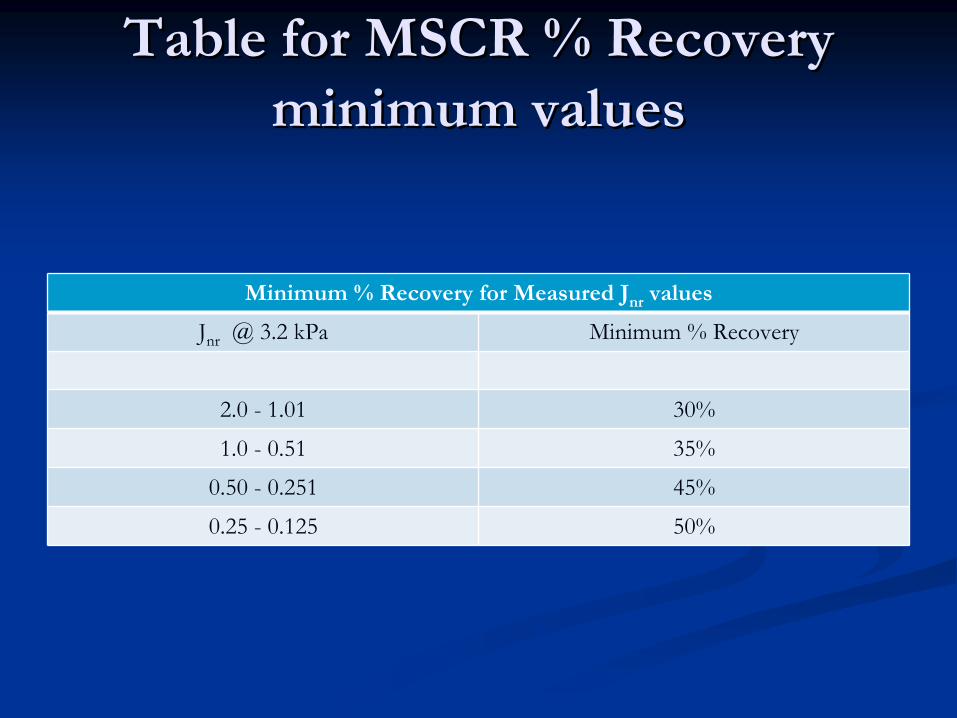
Table for MSCR % Recovery Table for MSCR % Recovery minimum valuesminimum values
Minimum % Recovery for Measured Jnr
values
Jnr
@ 3.2 kPa Minimum % Recovery
2.0 -
1.01 30%
1.0 -
0.51 35%
0.50 -
0.251 45%
0.25 -
0.125 50%

Conclusions and RecommendationsConclusions and Recommendations
Mixing Temperature and X-linking effect the properties of polymer modified binders.
The Elastic Recovery showed little difference between The Elastic Recovery showed little difference between the different processing methods. the different processing methods.
Both SHRP G*/sinBoth SHRP G*/sinδδ
and MSCR indicated the and MSCR indicated the differences between the different processing methods, differences between the different processing methods, but results are different for each.but results are different for each.
The MSCR both The MSCR both JJnrnr
and MSCR % Recovery indicated and MSCR % Recovery indicated larger differences than the SHRP and ER tests.larger differences than the SHRP and ER tests.
The Larger differences were verified by the Florescence The Larger differences were verified by the Florescence Microscopy.Microscopy.

ImplicationsImplications
MSCR test is more discriminating and a MSCR test is more discriminating and a fundamental property test fundamental property test
New practice for SBS blend optimization?New practice for SBS blend optimization?
For researchFor research
For spec.For spec.

ImplementationImplementation
MSCR can replace the ERMSCR can replace the ER
Single protocolSingle protocol
Quick and easyQuick and easy
Fundamental propertyFundamental property

New MSCR SpecificationNew MSCR Specification
MSCR test procedure TPMSCR test procedure TP--70 published Spring 70 published Spring 2008.2008.
New Table 3 accepted by AASHTO published New Table 3 accepted by AASHTO published Spring 2009.Spring 2009.

Thank YouThank You