Characterizing the Tensile Strength of the Fabrics Used in ...
19
Citation: Mazumder, N.-U.-S.; Mandal, S.; Agnew, R.J.; Petrova, A.; Boorady, L.M.; Song, G. Characterizing the Tensile Strength of the Fabrics Used in Firefighters’ Bunker Gear under Radiant Heat Exposure. Polymers 2022, 14, 296. https://doi.org/10.3390/ polym14020296 Academic Editor: In Chul Um Received: 12 November 2021 Accepted: 6 January 2022 Published: 12 January 2022 Publisher’s Note: MDPI stays neutral with regard to jurisdictional claims in published maps and institutional affil- iations. Copyright: © 2022 by the authors. Licensee MDPI, Basel, Switzerland. This article is an open access article distributed under the terms and conditions of the Creative Commons Attribution (CC BY) license (https:// creativecommons.org/licenses/by/ 4.0/). polymers Article Characterizing the Tensile Strength of the Fabrics Used in Firefighters’ Bunker Gear under Radiant Heat Exposure Nur-Us-Shafa Mazumder 1 , Sumit Mandal 1, * , Robert J. Agnew 2 , Adriana Petrova 1 , Lynn M. Boorady 1 and Guowen Song 3 1 Department of Design, Housing and Merchandising, Oklahoma State University, Stillwater, OK 74078-5061, USA; [email protected] (N.-U.-S.M.); [email protected] (A.P.); [email protected] (L.M.B.) 2 Fire Protection and Safety Engineering Technology Program, Oklahoma State University, Stillwater, OK 74078-5061, USA; [email protected] 3 Department of Apparel, Events & Hospitality Management, Iowa State University, Ames, IA 50011-2100, USA; [email protected] * Correspondence: [email protected] Abstract: More than 60,000 firefighters’ injuries were reported by the National Fire Protection Asso- ciation in the U.S. in 2019. Inadequate protection by bunker gear could be a reason for most of the injuries. Firefighters repeatedly encounter thermal hazards due to their job responsibilities. Degrada- tion could occur on bunker gear fabric during thermal exposure. It has been found that the presence of moisture affects performance as well, which may come from wearers’ sweat. Proper evaluation of the tensile strength of the fabrics used in bunker gear could provide information essential for maintenance the overall integrity of the gear. An evaluation of the tensile strength of fabrics when exposed to 10, 15, and 20 kW/m 2 radiant heat flux in the presence of moisture is reported. In each fabric system, a total of sixty-four different samples were prepared for four different types of fabric and four levels of moisture which were exposed to three different radiant heat flux for five minutes. Heat flux and moisture levels have significant impact on tensile strength. The effect of moisture on tensile strength in a three-layered fabric system is higher than that for a single layer fabric. An understanding of the impact of heat and moisture on fabric strength has been achieved. Keywords: fire protective textiles; sweat moisture; fabric strength; radiant heat; textile properties 1. Introduction Firefighting is considered a hazardous occupation because of the environment in which firefighters work. Fire departments in the U.S. responded to 1.3 million fires in 2019, and there is always the risk of death and injury for on-duty firefighters [1,2]. Based on the survey “United States Firefighter Injuries in 2019”, the National Fire Protection Association (NFPA) estimated that in 2019 over 60,000 firefighters’ injuries occurred in the line of duty. Around 40% of these injuries happened at the fire-ground, the area where firefighting operations are carried out [1,3]. In total, 48 firefighters died while on duty in the U.S. in 2019 [4]. Improved protective clothing can minimize the risk of injuries to firefighters [5,6]. Thermal protective fabrics are exposed to various thermal hazards (i.e., radiant heat, steam, hot fluids, etc.) during their lifetime. The outer layer of the fabric comes into direct exposure with these hazards every time bunker gear is worn to a fireground. These hazards might cause polymer chain scission of the fiber which may lead to a change in tensile strength. This may change the integrity of the clothing, a degradation which is rarely considered. However, the loss of protective performance due to the loss of tensile strength, which is caused by polymer degradation of the fiber of the outer layer, might not be detected visually until the damage is extreme. The reduction in thermal protective performance due to the potential strength loss of the outer layer fabric not only has an Polymers 2022, 14, 296. https://doi.org/10.3390/polym14020296 https://www.mdpi.com/journal/polymers
-
Upload
khangminh22 -
Category
Documents
-
view
2 -
download
0
Transcript of Characterizing the Tensile Strength of the Fabrics Used in ...
�����������������
Citation: Mazumder, N.-U.-S.;
Mandal, S.; Agnew, R.J.; Petrova, A.;
Boorady, L.M.; Song, G.
Characterizing the Tensile Strength of
the Fabrics Used in Firefighters’
Bunker Gear under Radiant Heat
Exposure. Polymers 2022, 14, 296.
https://doi.org/10.3390/
polym14020296
Academic Editor: In Chul Um
Received: 12 November 2021
Accepted: 6 January 2022
Published: 12 January 2022
Publisher’s Note: MDPI stays neutral
with regard to jurisdictional claims in
published maps and institutional affil-
iations.
Copyright: © 2022 by the authors.
Licensee MDPI, Basel, Switzerland.
This article is an open access article
distributed under the terms and
conditions of the Creative Commons
Attribution (CC BY) license (https://
creativecommons.org/licenses/by/
4.0/).
polymers
Article
Characterizing the Tensile Strength of the Fabrics Used inFirefighters’ Bunker Gear under Radiant Heat ExposureNur-Us-Shafa Mazumder 1 , Sumit Mandal 1,* , Robert J. Agnew 2 , Adriana Petrova 1, Lynn M. Boorady 1
and Guowen Song 3
1 Department of Design, Housing and Merchandising, Oklahoma State University,Stillwater, OK 74078-5061, USA; [email protected] (N.-U.-S.M.);[email protected] (A.P.); [email protected] (L.M.B.)
2 Fire Protection and Safety Engineering Technology Program, Oklahoma State University,Stillwater, OK 74078-5061, USA; [email protected]
3 Department of Apparel, Events & Hospitality Management, Iowa State University, Ames, IA 50011-2100, USA;[email protected]
* Correspondence: [email protected]
Abstract: More than 60,000 firefighters’ injuries were reported by the National Fire Protection Asso-ciation in the U.S. in 2019. Inadequate protection by bunker gear could be a reason for most of theinjuries. Firefighters repeatedly encounter thermal hazards due to their job responsibilities. Degrada-tion could occur on bunker gear fabric during thermal exposure. It has been found that the presenceof moisture affects performance as well, which may come from wearers’ sweat. Proper evaluationof the tensile strength of the fabrics used in bunker gear could provide information essential formaintenance the overall integrity of the gear. An evaluation of the tensile strength of fabrics whenexposed to 10, 15, and 20 kW/m2 radiant heat flux in the presence of moisture is reported. In eachfabric system, a total of sixty-four different samples were prepared for four different types of fabricand four levels of moisture which were exposed to three different radiant heat flux for five minutes.Heat flux and moisture levels have significant impact on tensile strength. The effect of moistureon tensile strength in a three-layered fabric system is higher than that for a single layer fabric. Anunderstanding of the impact of heat and moisture on fabric strength has been achieved.
Keywords: fire protective textiles; sweat moisture; fabric strength; radiant heat; textile properties
1. Introduction
Firefighting is considered a hazardous occupation because of the environment inwhich firefighters work. Fire departments in the U.S. responded to 1.3 million fires in 2019,and there is always the risk of death and injury for on-duty firefighters [1,2]. Based on thesurvey “United States Firefighter Injuries in 2019”, the National Fire Protection Association(NFPA) estimated that in 2019 over 60,000 firefighters’ injuries occurred in the line of duty.Around 40% of these injuries happened at the fire-ground, the area where firefightingoperations are carried out [1,3]. In total, 48 firefighters died while on duty in the U.S. in2019 [4]. Improved protective clothing can minimize the risk of injuries to firefighters [5,6].
Thermal protective fabrics are exposed to various thermal hazards (i.e., radiant heat,steam, hot fluids, etc.) during their lifetime. The outer layer of the fabric comes intodirect exposure with these hazards every time bunker gear is worn to a fireground. Thesehazards might cause polymer chain scission of the fiber which may lead to a change intensile strength. This may change the integrity of the clothing, a degradation which israrely considered. However, the loss of protective performance due to the loss of tensilestrength, which is caused by polymer degradation of the fiber of the outer layer, mightnot be detected visually until the damage is extreme. The reduction in thermal protectiveperformance due to the potential strength loss of the outer layer fabric not only has an
Polymers 2022, 14, 296. https://doi.org/10.3390/polym14020296 https://www.mdpi.com/journal/polymers

Polymers 2022, 14, 296 2 of 20
economic cost, but also it is related to the safety of the firefighters. Therefore, it is veryimportant to know how the outer layer is affected as it is exposed to various thermalhazards over time [7,8].
It has been found that performance of the fabric is affected by moisture accumulatedinside the fabric [9–18]. Moisture negatively affects the performance of the fabric mostseverely when lower amounts of moisture are added. When exposed to radiant heat, wettedsamples provided more thermal protection than dry samples [15]. Depending on the heatintensity, heat transfer may be increased or decreased by the moisture in the clothing system.Under high heat flux flame exposure, internal moisture increases the heat transfer. Thisscenario is reversed for the low heat flux flame exposure. Under low heat flux exposure,internal moisture has a tendency to decrease the heat transfer for a two-layered wildlandfirefighters’ clothing system when the inner layer is completely soaked [10].
The effects of repeated exposure to heat of personal protective gear have often beenstudied [7,8,19–22]. Variables included intensity of heat flux, time, and frequency of expo-sure, among others. High heat exposure causes more loss of tensile strength compared tothat caused by low heat exposure. Duration of exposure effects tensile strength loss [7]. Fireprotective gear which when subjected to low radiant heat exposure has been evaluated [8].Heat intensity has significant effects on the mechanical performance of the fabrics. How-ever, the thermal protective performance did not change considerably as a consequenceof changes in the mechanical properties [8]. The effects of flash fire on the mechanicalproperties of single layer thermal protective fabrics have been examined [19]. Similar kindsof results were found; the heat flux significantly affected the mechanical properties of thethermal protective fabrics [19].
The strength loss of the outer layer due to repeated thermal exposure could lead tothe disintegration of the clothing system. This ultimately could contribute to the causesof injury to firefighters. The change of strength of the fabrics used in bunker gear dueto radiant heat exposure has been extensively examined [7,8,19–21,23–30]. However, adetermination of strength loss of the outer layer after being exposed to heat when the fabricis in moist condition has not been carried out. The strength loss of the outer layer fabricsused in bunker gear under different heat exposures is reported. Moisture exists in the innerlayer due to fire fighter’s sweating, which also has an impact on the overall integrity of theapparel. Therefore, strength loss for fabric under different heat exposures in dry and wetconditions has been evaluated. A statistical modeling approach has been used to analyzevarious factors affecting the change of tensile strength when exposed to radiant heat in thepresence of moisture.
2. Materials and Methods
In order to provide protection from the high heat encountered at a fireground fire-fighter bunker gear is constructed with single and/or multiple layers of high-performancefabrics. The bunker gear consists of single or multiple layer of high-performance fabrics.High-performance fabrics are usually made of Meta-aramid, Para-aramid, Polybenzimi-dazole, and fire retardant cotton. Changes in the tensile strength of the high-performancefabrics used in bunker gear upon being exposed to radiant heat have been assessed. Dif-ferent amounts of moisture were added into the fabric system being exposed to heat. Thecombination of which simulates the wearers’ sweating.
2.1. Materials
Four different types of high-performance fabrics A, B, C, and D were selected whichare typically used in firefighters’ bunker gear. For the single-layer fabric system these fourdifferent high-performance fabrics were used. To compose the three-layered fabric system,a moisture barrier (fabric E) and thermal liner (fabric F) were used together with thesefour high-performance fabrics. Details of fabrics A, B, C, D, E, F are given in Table 1. Fourdifferent multilayered assemblies were tested: AEF, BEF, CEF, and DEF. The four differenthigh-performance fabrics and three-layered fabric systems are shown in Figure 1. The

Polymers 2022, 14, 296 3 of 20
tensile strength of the selected fabrics in dry and wet conditions was measured by using atensile strength tester (SDL Atlas, Rock Hill, SC, USA) before and after exposure to radiantheat. The process of moisture application, heat exposure and tensile strength measurementare discussed below.
Table 1. Properties of the high-performance fabrics experimented.
Sample Fiber Content Weave Structure Weight a
(g/m2)Thickness b
(mm)
EPI/PPI,Fabric Count c
(EPI + PPI)Absorbency d Tensile Strength e
(Warp Direction)
A Meta-aramid Twill 261 0.62 75/45 (120) 0 1135 N
B Para-aramid/Meta-aramid Ripstop 204 0.53 60/45 (105) 100 1309 N
C Polybenzimidazole/Para-aramid Twill 196 0.51 45/45 (90) 100 1166 N
D FR Cotton Twill 269 0.71 90/50 (140) 0 470 N
EPolybenzimidazole/
Para-aramid/Meta-aramid
Non-woven 202 0.36 NA 100 NA
F Aramid/FR Cot-ton/Polyamide
Woven facecloth/Non-woven batting 225 1.44 NA 0 NA
a Measured according to ASTM D3776 [31]; b Measured according to ASTM D1777 [32]; c Measured according toASTM D3775 [33]; d Measured according to AATCC 22 [34]; e Measured according to ASTM D5034 [35].
Polymers 2022, 14, x FOR PEER REVIEW 3 of 20
different high-performance fabrics were used. To compose the three-layered fabric sys-tem, a moisture barrier (fabric E) and thermal liner (fabric F) were used together with these four high-performance fabrics. Details of fabrics A, B, C, D, E, F are given in Table 1. Four different multilayered assemblies were tested: AEF, BEF, CEF, and DEF. The four different high-performance fabrics and three-layered fabric systems are shown in Figure 1. The tensile strength of the selected fabrics in dry and wet conditions was measured by using a tensile strength tester (SDL Atlas, Rock Hill, SC, USA) before and after exposure to radiant heat. The process of moisture application, heat exposure and tensile strength measurement are discussed below.
Figure 1. Fabric A, B, C, D, and an arrangement of a three-layered fabric system.
The properties of all four high-performance fabrics are listed in Table 1.
Table 1. Properties of the high-performance fabrics experimented.
Sample Fiber Content Weave Structure Weight a (g/m2)
Thickness b (mm)
EPI/PPI, Fabric Count c (EPI + PPI)
Absorbency d
Tensile Strength e
(Warp Direction)
A Meta-aramid Twill 261 0.62 75/45 (120) 0 1135 N B Para-aramid/Meta-aramid Ripstop 204 0.53 60/45 (105) 100 1309 N
C Polybenzimidazole/Para-
aramid Twill 196 0.51 45/45 (90) 100 1166 N
D FR Cotton Twill 269 0.71 90/50 (140) 0 470 N
E Polybenzimidazole/Para-
aramid/Meta-aramid Non-woven 202 0.36 NA 100 NA
F Aramid/FR Cotton/Polyamide Woven facecloth/Non-
woven batting 225 1.44 NA 0 NA
a Measured according to ASTM D3776 [31]; b Measured according to ASTM D1777 [32]; c Measured according to ASTM D3775 [33]; d Measured according to AATCC 22 [34]; e Measured according to ASTM D5034 [35].
2.2. Moisture Application Two different scenarios for moisture application were followed. Moisture was ap-
plied to the fabrics (A, B, C, and D) to simulate the wearers’ sweating during the heat exposure in the single-layer fabric system. However, moisture was applied on the thermal liner to simulate the sweat of the wearers in three-layered fabric systems. For the single layer, the weight of the dry fabric samples was measured first, then the necessary amount
Figure 1. Fabric A, B, C, D, and an arrangement of a three-layered fabric system.
The properties of all four high-performance fabrics are listed in Table 1.
2.2. Moisture Application
Two different scenarios for moisture application were followed. Moisture was appliedto the fabrics (A, B, C, and D) to simulate the wearers’ sweating during the heat exposurein the single-layer fabric system. However, moisture was applied on the thermal linerto simulate the sweat of the wearers in three-layered fabric systems. For the single layer,the weight of the dry fabric samples was measured first, then the necessary amount ofdistilled water was sprayed on the fabric surface until the added moisture content reached20%, 50%, and 100%, respectively. If the fabric weight was X gram 20%, 50%, and 100%moisture indicated that the final weight of the fabric after moisture addition is 1.2×, 1.5×,and 2×. For the three-layered fabric system, the weight of the dry sample (three layers

Polymers 2022, 14, 296 4 of 20
together) was measured first, then with the help of a dropper, the required amount ofdistilled water was added to the thermal liner. Water was added by spray or dropper untilthe weight balance showed the required weight. By using the dropper, it was possible toapply the water all over the thermal liner uniformly. The amount of water needed to beadded in the single-layer fabric system was comparatively lower than the water added inthe three-layered fabric system. A spray was used to ensure the even distribution of thesmall amount of water on the single-layer system fabric and a dropper was used to applywater in the three-layered fabric system.
Distance between the fabric and the spray nozzle was approximately 6 inches toensure that water droplets fell over the whole fabric evenly. Water was added to thethermal liner (three-layered fabric system) by using a dropper. Drops of water were addedin different sections (four corners, center, middle of the four sides) of the fabric to ensureeven distribution of the water in the fabric. Figure 2 shows the application of water infabrics A, B, C, and D in single layer system and also in the thermal liner of the three-layered fabric system to simulate the firefighter’s sweating. Fabrics were treated in threedifferent moisture content levels: 20%, 50%, and 100%. Samples were left on the weightbalance for five minutes before being exposed to heat to ensure that the required amountof moisture has distributed throughout the fabric. In this period, the sample remained onthe weight balance and the final weight was checked before the exposure to ensure therequired amount of water was absorbed in the fabrics.
Polymers 2022, 14, x FOR PEER REVIEW 4 of 20
layer, the weight of the dry fabric samples was measured first, then the necessary amount of distilled water was sprayed on the fabric surface until the added moisture content reached 20%, 50%, and 100%, respectively. If the fabric weight was X gram 20%, 50%, and 100% moisture indicated that the final weight of the fabric after moisture addition is 1.2×, 1.5×, and 2×. For the three-layered fabric system, the weight of the dry sample (three layers together) was measured first, then with the help of a dropper, the required amount of distilled water was added to the thermal liner. Water was added by spray or dropper until the weight balance showed the required weight. By using the dropper, it was possible to apply the water all over the thermal liner uniformly. The amount of water needed to be added in the single-layer fabric system was comparatively lower than the water added in the three-layered fabric system. A spray was used to ensure the even distribution of the small amount of water on the single-layer system fabric and a dropper was used to apply water in the three-layered fabric system.
Distance between the fabric and the spray nozzle was approximately 6 inches to en-sure that water droplets fell over the whole fabric evenly. Water was added to the thermal liner (three-layered fabric system) by using a dropper. Drops of water were added in dif-ferent sections (four corners, center, middle of the four sides) of the fabric to ensure even distribution of the water in the fabric. Figure 2 shows the application of water in fabrics A, B, C, and D in single layer system and also in the thermal liner of the three-layered fabric system to simulate the firefighter’s sweating. Fabrics were treated in three different moisture content levels: 20%, 50%, and 100%. Samples were left on the weight balance for five minutes before being exposed to heat to ensure that the required amount of moisture has distributed throughout the fabric. In this period, the sample remained on the weight balance and the final weight was checked before the exposure to ensure the required amount of water was absorbed in the fabrics.
Figure 2. Schematic diagram of addition of water in the fabrics by spray and dropper.
2.3. Cone Calorimeter To simulate the radiant heat exposure that the firefighters face during fire activities,
a cone calorimeter (Fire Testing Technology Ltd., East Grinstead, United Kingdom) (Fig-ure 3a) was used. The cone calorimeter can provide constant amount of heat on a relatively small size sample (typically 10 cm by 10 cm) [36]. Therefore, the cone calorimeter is the most widely used instrument to study fire-related behavior of materials [37]. The cone calorimeter is named after the conical shape of the radiant heater; with a 160 mm diameter at the bottom and 80 mm on top, the cone produces nearly uniform heat flux on the sample
Figure 2. Schematic diagram of addition of water in the fabrics by spray and dropper.
2.3. Cone Calorimeter
To simulate the radiant heat exposure that the firefighters face during fire activities, acone calorimeter (Fire Testing Technology Ltd., East Grinstead, United Kingdom) (Figure 3a)was used. The cone calorimeter can provide constant amount of heat on a relativelysmall size sample (typically 10 cm by 10 cm) [36]. Therefore, the cone calorimeter is themost widely used instrument to study fire-related behavior of materials [37]. The conecalorimeter is named after the conical shape of the radiant heater; with a 160 mm diameterat the bottom and 80 mm on top, the cone produces nearly uniform heat flux on the sampleunder study [38]. The radiant heat flux can be controlled by the cone-shaped heatingelement, which is made out of Inconel alloys [39]. These alloys are suitable for extreme heatenvironments due to their oxidation-corrosion resistance properties [40]. The specimenholder and the heater are placed horizontally, and there is a shutter plate in betweenseparating the fabric from the heat. The test begins when the plate is removed letting theradiant heat reach the surface of the surface.

Polymers 2022, 14, 296 5 of 20
Polymers 2022, 14, x FOR PEER REVIEW 5 of 20
under study [38]. The radiant heat flux can be controlled by the cone-shaped heating ele-ment, which is made out of Inconel alloys [39]. These alloys are suitable for extreme heat environments due to their oxidation-corrosion resistance properties [40]. The specimen holder and the heater are placed horizontally, and there is a shutter plate in between sep-arating the fabric from the heat. The test begins when the plate is removed letting the radiant heat reach the surface of the surface.
Fabric samples of (10 cm by 10 cm) were prepared according to the standard (ASTM E1354) and placed 25 mm below the cone heater (Figure 3b) [38]. The samples were ex-posed to three different heat flux levels: 10 kW/m2, 15 kW/m2, and 20 kW/m2 for five minutes. To investigate the effect of different heat flux on the mechanical properties, all the fabrics were exposed to the heat for the same amount of time. To keep it constant, all four fabrics were exposed to different level of heat flux for five minutes. At 20 kW/m2 more than five minutes of exposure caused complete burn out of fabric D. Five minutes expo-sure was the highest exposure time without complete degradation of the fabrics; therefore, measuring the strength of the fabrics was possible. Standard test method ASTM E1354 was designed to evaluate fire-retardant materials. Following this test method, samples were conditioned in the textile lab for 24 hours before the heat exposure. After condition-ing, samples were transferred to zip-top bags and exposed to radiant heat within three hours. The moisture was applied to the fabrics just before the heat exposure. The details of moisture application are explained in Section 2.2. Once the exposure was completed, samples were immediately transferred to the zip-top bags and again conditioned for 24 hours before measuring the strength. The heat exposure time was five minutes for all the samples.
(a)
(b)
Figure 3. (a) Cone calorimeter. (b) Schematic diagram of heat exposure of single and multi-layeredfabric system.
Fabric samples of (10 cm by 10 cm) were prepared according to the standard (ASTME1354) and placed 25 mm below the cone heater (Figure 3b) [38]. The samples were exposedto three different heat flux levels: 10 kW/m2, 15 kW/m2, and 20 kW/m2 for five minutes.To investigate the effect of different heat flux on the mechanical properties, all the fabricswere exposed to the heat for the same amount of time. To keep it constant, all four fabricswere exposed to different level of heat flux for five minutes. At 20 kW/m2 more than fiveminutes of exposure caused complete burn out of fabric D. Five minutes exposure was thehighest exposure time without complete degradation of the fabrics; therefore, measuringthe strength of the fabrics was possible. Standard test method ASTM E1354 was designedto evaluate fire-retardant materials. Following this test method, samples were conditionedin the textile lab for 24 hours before the heat exposure. After conditioning, samples weretransferred to zip-top bags and exposed to radiant heat within three hours. The moisturewas applied to the fabrics just before the heat exposure. The details of moisture applicationare explained in Section 2.2. Once the exposure was completed, samples were immediatelytransferred to the zip-top bags and again conditioned for 24 h before measuring the strength.The heat exposure time was five minutes for all the samples.

Polymers 2022, 14, 296 6 of 20
2.4. Tensile Strength Tester
Tinius Olsen H5K tensile strength tester (Figure 4) (SDL Atlas, Rock Hill, SC, USA)was used to measure the tensile strength (in Newton N) of the fabric before and afterradiant heat exposure. ASTM D5034 Grab Test method was used to measure the tensilestrength of the fabric [35]. The Grab test method was chosen over the Strip test method [41]since it is mentioned that strip testing sometimes may lead to clamp fractures. The sameresearch also concluded that for testing textile fabric, the grab test is sufficient [42]. Forthe tensile strength test, the distance between the jaws was 40 mm, and tensile speed was50 mm/min. The tensile strength of the fabrics was measured in the warp direction only.The required tensile strength of warp yarn is usually higher than the weft yarn due tothe weaving mechanism. Therefore, the strength of woven fabric in the warp direction isusually higher than in the weft direction. If the warp yarn does not satisfy the minimumrequirement after the heat exposure, then it can be said that weft will not satisfy either,since the tensile strength of weft is lower than the warp. Therefore, the tensile strength wasmeasured only in the warp direction in this study.
Polymers 2022, 14, x FOR PEER REVIEW 6 of 20
Figure 3. (a) Cone calorimeter. (b) Schematic diagram of heat exposure of single and multi-layered fabric system.
2.4. Tensile Strength Tester Tinius Olsen H5K tensile strength tester (Figure 4) (SDL Atlas, Rock Hill, SC, USA)
was used to measure the tensile strength (in Newton N) of the fabric before and after ra-diant heat exposure. ASTM D5034 Grab Test method was used to measure the tensile strength of the fabric [35]. The Grab test method was chosen over the Strip test method [41] since it is mentioned that strip testing sometimes may lead to clamp fractures. The same research also concluded that for testing textile fabric, the grab test is sufficient [42]. For the tensile strength test, the distance between the jaws was 40 mm, and tensile speed was 50 mm/min. The tensile strength of the fabrics was measured in the warp direction only. The required tensile strength of warp yarn is usually higher than the weft yarn due to the weaving mechanism. Therefore, the strength of woven fabric in the warp direction is usually higher than in the weft direction. If the warp yarn does not satisfy the minimum requirement after the heat exposure, then it can be said that weft will not satisfy either, since the tensile strength of weft is lower than the warp. Therefore, the tensile strength was measured only in the warp direction in this study.
Figure 4. Tensile strength tester.
Tensile strength of fabrics A, B, C, and D was measured after each fabric was exposed to moisture and heat as part of a single-layered system (the fabric itself) and as part of multi-layered systems AEF, BEF, CEF, and DEF, respectively. In single-layer fabric system fabrics, A, B, C, and D were exposed to different radiant heat levels in dry and moist con-ditions. After the five minutes of heat exposure, samples were immediately placed in zip-top bags. Before measuring the tensile strength, all samples were conditioned in the textile lab for 24 hours. Similarly, in the three-layered fabric system, AEF, BEF, CEF, and DEF fabric samples were exposed to radiant heat. Fabric combinations were exposed either in dry condition or with the presence of moisture in the thermal liner. Similarly, after the five minutes of heat exposure, samples were secured in zip-top bags. The outer layer was
Figure 4. Tensile strength tester.
Tensile strength of fabrics A, B, C, and D was measured after each fabric was exposedto moisture and heat as part of a single-layered system (the fabric itself) and as part ofmulti-layered systems AEF, BEF, CEF, and DEF, respectively. In single-layer fabric systemfabrics, A, B, C, and D were exposed to different radiant heat levels in dry and moistconditions. After the five minutes of heat exposure, samples were immediately placed inzip-top bags. Before measuring the tensile strength, all samples were conditioned in thetextile lab for 24 hours. Similarly, in the three-layered fabric system, AEF, BEF, CEF, andDEF fabric samples were exposed to radiant heat. Fabric combinations were exposed either
Polymers 2022, 14, 296 7 of 20
in dry condition or with the presence of moisture in the thermal liner. Similarly, after thefive minutes of heat exposure, samples were secured in zip-top bags. The outer layer wasthen removed from the three-layered system and conditioned for 24 hours measuring thetensile strength.
2.5. Test Protocol
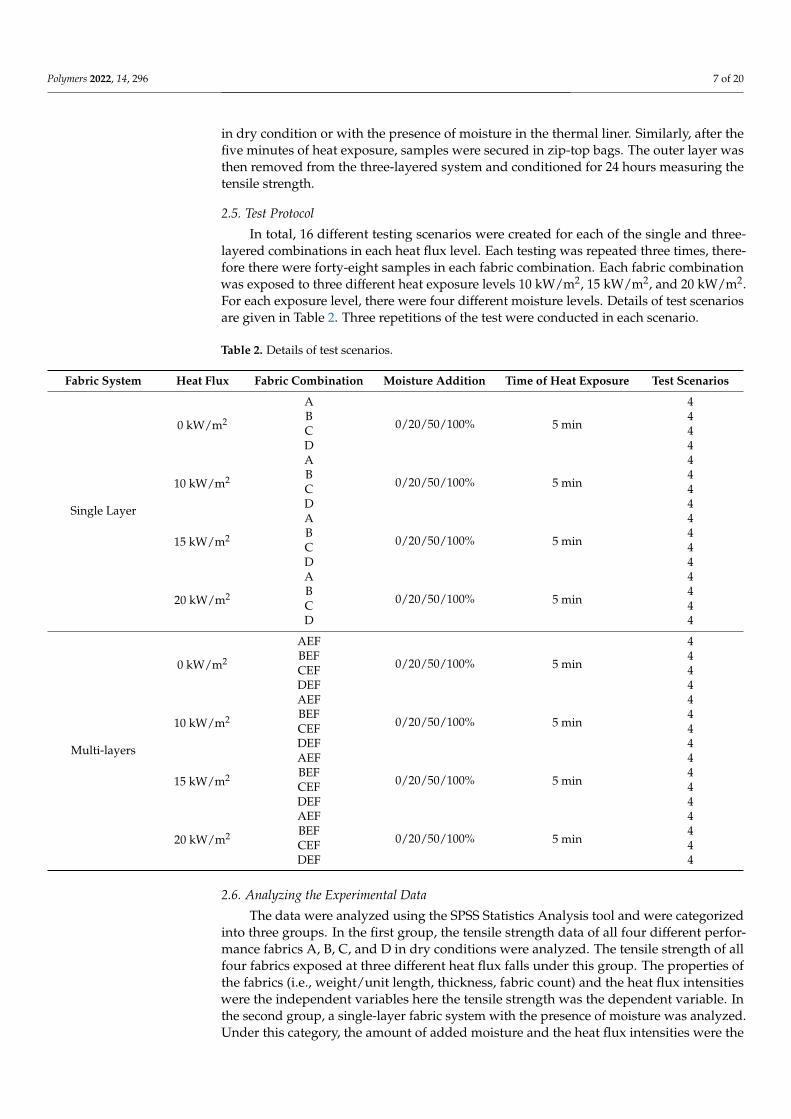
In total, 16 different testing scenarios were created for each of the single and three-layered combinations in each heat flux level. Each testing was repeated three times, there-fore there were forty-eight samples in each fabric combination. Each fabric combinationwas exposed to three different heat exposure levels 10 kW/m2, 15 kW/m2, and 20 kW/m2.For each exposure level, there were four different moisture levels. Details of test scenariosare given in Table 2. Three repetitions of the test were conducted in each scenario.
Table 2. Details of test scenarios.
Fabric System Heat Flux Fabric Combination Moisture Addition Time of Heat Exposure Test Scenarios
Single Layer
0 kW/m2
A
0/20/50/100% 5 min
4B 4C 4D 4
10 kW/m2
A
0/20/50/100% 5 min
4B 4C 4D 4
15 kW/m2
A
0/20/50/100% 5 min
4B 4C 4D 4
20 kW/m2
A
0/20/50/100% 5 min
4B 4C 4D 4
Multi-layers
0 kW/m2
AEF
0/20/50/100% 5 min
4BEF 4CEF 4DEF 4
10 kW/m2
AEF
0/20/50/100% 5 min
4BEF 4CEF 4DEF 4
15 kW/m2
AEF
0/20/50/100% 5 min
4BEF 4CEF 4DEF 4
20 kW/m2
AEF
0/20/50/100% 5 min
4BEF 4CEF 4DEF 4
2.6. Analyzing the Experimental Data
The data were analyzed using the SPSS Statistics Analysis tool and were categorizedinto three groups. In the first group, the tensile strength data of all four different perfor-mance fabrics A, B, C, and D in dry conditions were analyzed. The tensile strength of allfour fabrics exposed at three different heat flux falls under this group. The properties ofthe fabrics (i.e., weight/unit length, thickness, fabric count) and the heat flux intensitieswere the independent variables here the tensile strength was the dependent variable. Inthe second group, a single-layer fabric system with the presence of moisture was analyzed.Under this category, the amount of added moisture and the heat flux intensities were the
Polymers 2022, 14, 296 8 of 20
independent variables along with the above-mentioned fabric properties (i.e., weight/unitlength, thickness, fabric count) the tensile strength was the dependent variable. The three-layered fabric systems where the moisture was added in the thermal liner falls under thethird category. Variables in the third group are the same as the second group, where theonly difference is that the multi-layer fabric system was analyzed within this group insteadof the single-layer fabric system, where moisture was applied in the thermal liner fabrics.Properties (i.e., weight/unit length, thickness, fabric count) of the three-layered fabricsystems and tensile strength of the outer layer have been normalized between -1 and +1,while the average value is set to zero. The normalized variable X i,norm is expressed in thebelow equation. The normalization process reduces the redundancy rates in the data bypulling out the abnormal factors.
Xi,norm =Xi − Xi,avg
Ri,max(1)
where, Ri,max = Maximum [(Xi,max − Xi,avg),(Xi,avg − Xi,min)]. In the above equation theXi is the value of selected variable (thickness, air permeability, thermal and evaporativeresistance, and tensile strength), Xi,avg is the average value of that particular variable, Xi,minis the minimum value of that variable, Xi,max is the maximum value of that variable, andRi,max is the maximum range between the average value and either the minimum or themaximum of that variable. A multi-linear regression analysis of the normalized dataset ofthe fabric properties and the tensile strength has been conducted by using the SPSS StatisticsAnalysis tool to understand the relation between the fabric properties and the change intensile strength. It has been hypothesized that these fabric properties can represent linearregression with tensile strength. Different studies were found where linear regressionanalysis was used to model the relation between fabric properties and performance [43,44].The amount of moisture added, and the heat intensity levels were considered as the ordinalindependent variables for the regression analysis. Among the three independent variables(i.e., weight, thickness, and fabric count), the properties that showed the highest absoluteregression coefficient was considered the key property affecting the tensile strength. Thisanalysis was carried out at 95% Confidence Interval. p-value obtained from regressionanalysis was analyzed to identify the fabric properties that have a significant effect on thetensile strength loss. The significance test was carried out at 0.05 significance level. Thus, ifthe obtained value was less than 0.05 then the properties were significant.
3. Results and Discussion
Section 3 are divided into three sub-sections. In Section 3.1, change of tensile strengthof the fabrics A, B, C, and D in the dry condition is discussed. In Section 3.2, the tensilestrength change of the fabrics A, B, C, and D is discussed while only single layer fabricswere exposed with moisture. In Section 3.3, changes of tensile strength of the outer layersin three-layered fabric systems are discussed while the fabric system was exposed withmoisture in the thermal liner. The radiant heat-treated fabrics were conditioned for 24 hbefore measuring the tensile strength. The tensile strength (warp direction) of the fabricsA, B, C, and D were measured by the tensile strength tester using the standard methodASTM D5034.
3.1. Effect of Radiant Heat on Tensile Strength of the Fabrics in Dry Condition
The initial strength of the fabric usually depends on the fabric and yarn properties,such as count, twist, ends and picks per inch, cover factor, weave structure, etc., and thetype of fiber present in the fabric [45–49]. The summary of the radiant heat on tensilestrength summarizes in Table 3. Since three of the experimented fabrics (A, B, and C)were made from synthetic fiber and fabric D was made from a natural fiber, the initialtensile strength of these two categories of fabrics was significantly different. In addition, thechanging behavior of tensile strength after the radiant heat exposure also can be categorizedinto two groups. fabrics A, B, C behave similarly compared to fabric D, which behaved
Polymers 2022, 14, 296 9 of 20
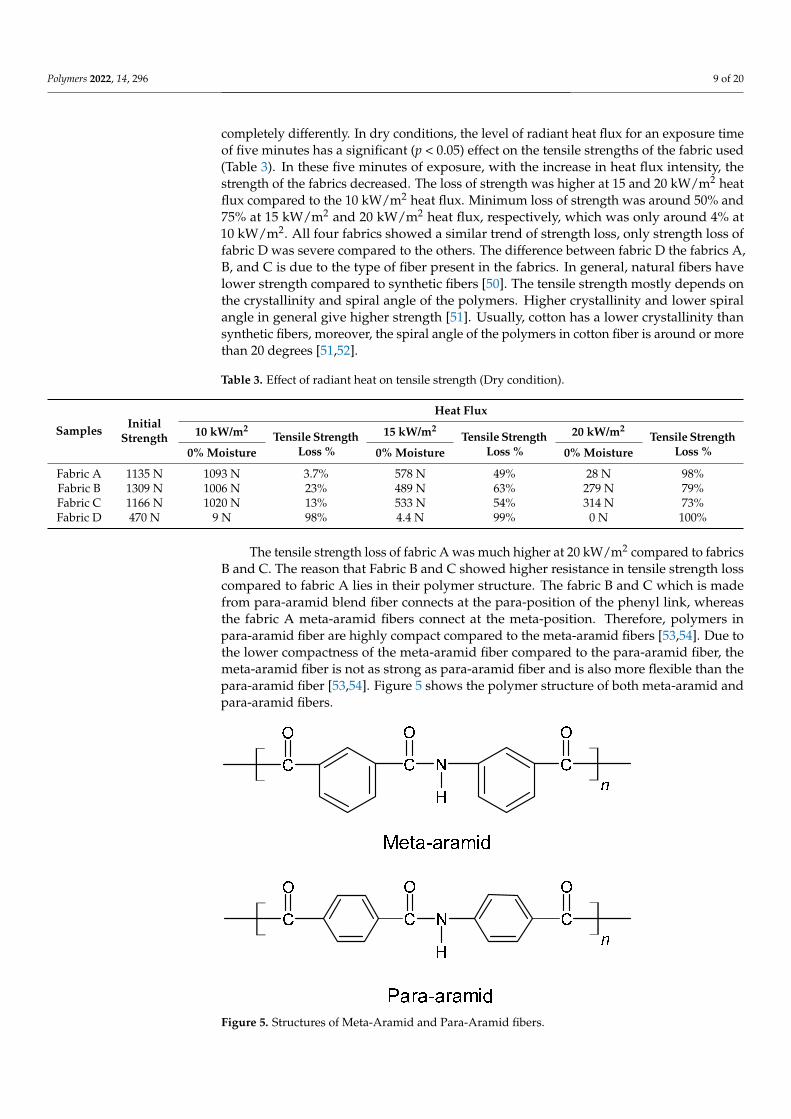
completely differently. In dry conditions, the level of radiant heat flux for an exposure timeof five minutes has a significant (p < 0.05) effect on the tensile strengths of the fabric used(Table 3). In these five minutes of exposure, with the increase in heat flux intensity, thestrength of the fabrics decreased. The loss of strength was higher at 15 and 20 kW/m2 heatflux compared to the 10 kW/m2 heat flux. Minimum loss of strength was around 50% and75% at 15 kW/m2 and 20 kW/m2 heat flux, respectively, which was only around 4% at10 kW/m2. All four fabrics showed a similar trend of strength loss, only strength loss offabric D was severe compared to the others. The difference between fabric D the fabrics A,B, and C is due to the type of fiber present in the fabrics. In general, natural fibers havelower strength compared to synthetic fibers [50]. The tensile strength mostly depends onthe crystallinity and spiral angle of the polymers. Higher crystallinity and lower spiralangle in general give higher strength [51]. Usually, cotton has a lower crystallinity thansynthetic fibers, moreover, the spiral angle of the polymers in cotton fiber is around or morethan 20 degrees [51,52].
Table 3. Effect of radiant heat on tensile strength (Dry condition).
Samples InitialStrength
Heat Flux
10 kW/m2Tensile Strength
Loss %
15 kW/m2Tensile Strength
Loss %
20 kW/m2Tensile Strength
Loss %0% Moisture 0% Moisture 0% Moisture
Fabric A 1135 N 1093 N 3.7% 578 N 49% 28 N 98%Fabric B 1309 N 1006 N 23% 489 N 63% 279 N 79%Fabric C 1166 N 1020 N 13% 533 N 54% 314 N 73%Fabric D 470 N 9 N 98% 4.4 N 99% 0 N 100%
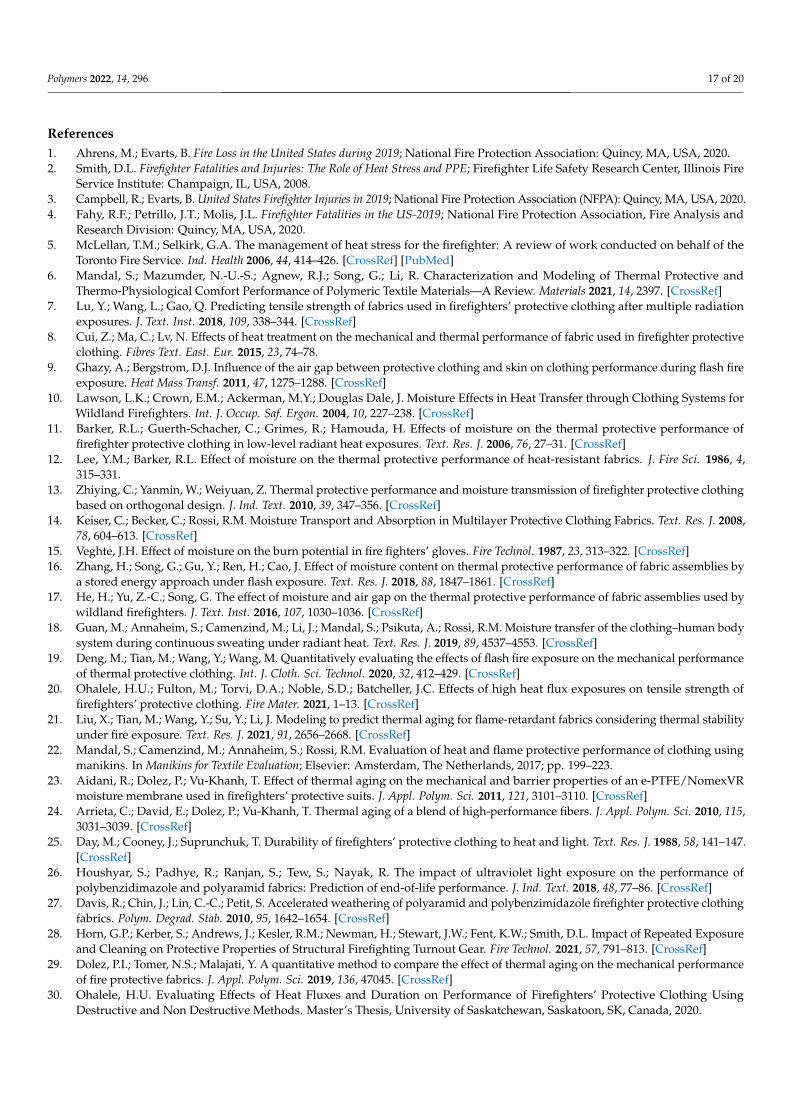
The tensile strength loss of fabric A was much higher at 20 kW/m2 compared to fabricsB and C. The reason that Fabric B and C showed higher resistance in tensile strength losscompared to fabric A lies in their polymer structure. The fabric B and C which is madefrom para-aramid blend fiber connects at the para-position of the phenyl link, whereasthe fabric A meta-aramid fibers connect at the meta-position. Therefore, polymers inpara-aramid fiber are highly compact compared to the meta-aramid fibers [53,54]. Due tothe lower compactness of the meta-aramid fiber compared to the para-aramid fiber, themeta-aramid fiber is not as strong as para-aramid fiber and is also more flexible than thepara-aramid fiber [53,54]. Figure 5 shows the polymer structure of both meta-aramid andpara-aramid fibers.
Polymers 2022, 14, x FOR PEER REVIEW 10 of 20
Figure 5. Structures of Meta-Aramid and Para-Aramid fibers.
Effect of radiant heat exposure in dry condition on tensile strength of all four outer layers has been illustrated in Figure 6.
Figure 6. Effect of radiant heat on tensile strength of the fabrics in dry condition.
The tensile strength of the fabric is mostly dependent on the organization of the pol-ymer chains and the macrostructure [55–57]. A similar pattern of loss of tensile strength with increased temperature is observed from Figure 6. The loss of tensile strength can be explained due to the fibrillar to the lamellar transformations within the fibers which cause an increase in crystallinity with lamellar spacing [58]. A linear regression analysis tool has been used to find out the R square and t-test (t and p) values. As mentioned earlier, data have been grouped into three categories. In the first category, the tensile strength of four high-performance fabrics exposed in three different heat flux in dry conditions have been analyzed. Independent variables: (i) fabric properties (Weight/unit length, thickness, fab-ric count); (ii) heat flux intensities (10, 15, and 20 kW/m2) are the ordinal variables. De-pendent variable: tensile strength of the fabrics A, B, C, and D. The results are as shown in Table 4.
Table 4. Statistical analysis of the tensile strength of the outer layer fabrics exposed in dry condi-tions.
0200400600800
10001200140016001800
0 5 10 15 20 25 30
Tens
ile S
tren
gth
in N
Heat Flux in kW/m2
Effect of Radiant Heat on Tensile Strength of the Fabrics in Dry Condition
Fabric A
Fabric B
Fabric C
Fabric D
Figure 5. Structures of Meta-Aramid and Para-Aramid fibers.

Polymers 2022, 14, 296 10 of 20
Effect of radiant heat exposure in dry condition on tensile strength of all four outerlayers has been illustrated in Figure 6.
Polymers 2022, 14, x FOR PEER REVIEW 10 of 20
Figure 5. Structures of Meta-Aramid and Para-Aramid fibers.
Effect of radiant heat exposure in dry condition on tensile strength of all four outer layers has been illustrated in Figure 6.
Figure 6. Effect of radiant heat on tensile strength of the fabrics in dry condition.
The tensile strength of the fabric is mostly dependent on the organization of the pol-ymer chains and the macrostructure [55–57]. A similar pattern of loss of tensile strength with increased temperature is observed from Figure 6. The loss of tensile strength can be explained due to the fibrillar to the lamellar transformations within the fibers which cause an increase in crystallinity with lamellar spacing [58]. A linear regression analysis tool has been used to find out the R square and t-test (t and p) values. As mentioned earlier, data have been grouped into three categories. In the first category, the tensile strength of four high-performance fabrics exposed in three different heat flux in dry conditions have been analyzed. Independent variables: (i) fabric properties (Weight/unit length, thickness, fab-ric count); (ii) heat flux intensities (10, 15, and 20 kW/m2) are the ordinal variables. De-pendent variable: tensile strength of the fabrics A, B, C, and D. The results are as shown in Table 4.
Table 4. Statistical analysis of the tensile strength of the outer layer fabrics exposed in dry condi-tions.
0200400600800
10001200140016001800
0 5 10 15 20 25 30
Tens
ile S
tren
gth
in N
Heat Flux in kW/m2
Effect of Radiant Heat on Tensile Strength of the Fabrics in Dry Condition
Fabric A
Fabric B
Fabric C
Fabric D
Figure 6. Effect of radiant heat on tensile strength of the fabrics in dry condition.
The tensile strength of the fabric is mostly dependent on the organization of thepolymer chains and the macrostructure [55–57]. A similar pattern of loss of tensile strengthwith increased temperature is observed from Figure 6. The loss of tensile strength can beexplained due to the fibrillar to the lamellar transformations within the fibers which causean increase in crystallinity with lamellar spacing [58]. A linear regression analysis tool hasbeen used to find out the R square and t-test (t and p) values. As mentioned earlier, datahave been grouped into three categories. In the first category, the tensile strength of fourhigh-performance fabrics exposed in three different heat flux in dry conditions have beenanalyzed. Independent variables: (i) fabric properties (Weight/unit length, thickness, fabriccount); (ii) heat flux intensities (10, 15, and 20 kW/m2) are the ordinal variables. Dependentvariable: tensile strength of the fabrics A, B, C, and D. The results are as shown in Table 4.
Table 4. Statistical analysis of the tensile strength of the outer layer fabrics exposed in dry conditions.
Model Summary
R2 Value F p
0.83 8.82 0.007
Coefficients t p
Weight/unit Length 2.21 0.063Thickness −1.92 0.096
Fabric Count 0.102 0.921Heat Intensity Level −3.790 0.007
Individual R Square Values between the Fabric Properties and Tensile Strength
Fabric Properties R2 ValueWeight/unit length 0.225
Thickness 0.379Fabric Count 0.358

Polymers 2022, 14, 296 11 of 20
The t-test value matches the earlier discussion. The negative t value of the heatintensity levels indicated that an increase in heat flux reduces the tensile strength of thefabric. The p-value suggests the significance of the effect on tensile strength. From the Rsquare values, it can be seen that thickness has the highest value compared to linear densityand fabric count. Therefore, it can be said that thickness is the most important propertywhile considering the tensile strength of the fabric [59]. Fabric count seems the second mostimportant property. Nevertheless, both thickness and fabric count moderately affect thetensile strength as their R square values are fairly high [58,60].
3.2. Effect of Moisture and Radiant Heat on Tensile Strength of Fabrics in Single Layer Fabric System
In the single-layer fabric system, moisture did not have much effect on the tensilestrength of the fabrics (Figure 7). The tensile strength of fabrics in the single-layer fabricsystem at both dry and moist conditions was almost similar. The addition of moisture inthe single-layer fabric system slightly affected the tensile strength loss. This is becauseof the ease of evaporation of the water from the single-layer fabric. The moisture ofthe outer layer evaporated very quickly, which resulted in increased temperature in thefabric system, leading to the fabric to behave similarly to the dry fabric [61]. The quickevaporation of the moisture results in the thermal degradation of the polymer chain. Sincethe moisture evaporated very quickly, the tensile strength of the moist fabric was almostlike the dry fabric. A slightly improved tensile strength was shown at 10 kW/m2 whenthe moisture percentage was 100%. The tensile strength of fabric A increased initiallywith respect to moisture during the heat exposure at 10 kW/m2. This increasing tensilestrength phenomenon could be explained based on the initial strength of fabric A in moistconditions. The initial tensile strength of fabric A in moist condition was lower than thedry condition. This is likely due to moisture reducing the friction between the fibers whichresulted in lower tensile strength of the fabric in moist conditions before the heat exposure.
Multiple linear regression analysis tool has been used to determine the R square andt-test value (t and p values). The independent and dependent variables are as follows:Independent variables: (i) Fabric Properties (Weight/unit length, thickness, fabric count);(ii) Heat flux intensities (0, 10, 15, and 20 kW/m2), and moisture addition amount (0, 20,50, and 100%) are the ordinal independent variables. Dependent variable: Tensile strengthof the outer layer fabric. The results are shown in Table 5. All four fabrics A, B, C, and Dbehaved almost similarly in both dry and moist conditions in single-layer fabric system.Only a very minor difference was seen when moisture addition was 100%.
In the single-layered fabric system, the moisture had no or minimal effect on the tensilestrength. The statistical values also suggest a similar result. The t-values for the moistureare positive and almost near zero. This suggests that moisture in the single-layer has aminimum effect on the tensile strength of the outer layer fabric. On the other hand, heatflux intensity has a similar negative effect on the t-value. From the R square values, it canbe seen that thickness has the highest value compared to linear density and fabric count.Therefore, it can be said that thickness is the most important property while consideringthe tensile strength of the fabric. Fabric count seems the second most important property.Nevertheless, both thickness and fabric count moderately affect the tensile strength as theirR square values are fairly high. The summary of the effects of moisture and radiant heat insingle-layer fabric system is shown in the table below (Table 6).
3.3. Effect of Moisture and Radiant Heat on Tensile Strength of Outer Layer Fabrics in Three-LayeredFabric System
Added moisture had a significant (p < 0.05) positive effect on the strength loss of thefabrics (Figure 8). At a lower heat intensity level of 10 kW/m2 and five minutes of exposuretime, the tensile strength loss percentage was very low compared to the dry and singlelayer moist fabrics. No or minimum strength loss was seen for most of the fabrics at lowerheat flux with the presence of moisture in the thermal liner. With the increase in heat flux,the effect of moisture decreased eventually. At 15 kW/m2 heat flux 100% moisture showed

Polymers 2022, 14, 296 12 of 20
the highest effect on the tensile strength loss. Only without the fabric D all other fabricswere able to retain most of their strength when exposed to 15 kW/m2 heat flux for fiveminutes. The highest amount of strength loss was only 15%, which was around 60% at15 kW/m2 without moisture or the presence of moisture in the single layer.
Polymers 2022, 14, x FOR PEER REVIEW 12 of 20
Figure 7. Effect of moisture and radiant heat on tensile strength of fabrics in single layer fabric sys-tem.
Multiple linear regression analysis tool has been used to determine the R square and t-test value (t and p values). The independent and dependent variables are as follows: Independent variables: (i) Fabric Properties (Weight/unit length, thickness, fabric count); (ii) Heat flux intensities (0, 10, 15, and 20 kW/m2), and moisture addition amount (0, 20, 50, and 100%) are the ordinal independent variables. Dependent variable: Tensile strength of the outer layer fabric. The results are shown in Table 5. All four fabrics A, B, C, and D behaved almost similarly in both dry and moist conditions in single-layer fabric system. Only a very minor difference was seen when moisture addition was 100%.
Table 5. Statistical analysis of single layer fabric system in presence of moisture.
Model Summary R Square F p
0.84 30 0.001 Coefficients t p
Weight/unit length 4.415 0.000 Thickness −3.642 0.001
Fabric Count 0.037 0.970 Heat Intensity Level −7.97 0.0001
Moisture Level 0.431 0.670
0200400600800
100012001400
0 10 20 30
Tens
ile S
tren
gth
in N
Heat Flux in kW/m2
Effect of Radiant Heat and Moisture on Tensile Strength of
Fabric A
0% moisture
20% moisture
50% moisture
100 %moisture
0
500
1000
1500
2000
0 10 20 30Te
nsile
Str
engt
h in
NHeat Flux in kW/m2
Effect of Radiant Heat and Moisture on Tensile Strength of
Fabric B
0% moisture
20% moisture
50% moisture
100 %moisture
0
500
1000
1500
0 10 20 30Tens
ile S
tren
gth
in N
Heat Flux in kW/m2
Effect of Radiant Heat and Moisture on Tensile Strength of
Fabric C
0% moisture
20% moisture
50% moisture
100 %moisture
0
500
1000
0 10 20 30Tens
ile S
tren
gth
in N
Heat Flux in kW/m2
Effect of Radiant Heat and Moisture on Tensile Strength
Fabric D
0% moisture
20% moisture
50% moisture
100 %moisture
Figure 7. Effect of moisture and radiant heat on tensile strength of fabrics in single layer fabric system.
Table 5. Statistical analysis of single layer fabric system in presence of moisture.
Model Summary
R Square F p
0.84 30 0.001Coefficients t p
Weight/unit length 4.415 0.000Thickness −3.642 0.001
Fabric Count 0.037 0.970Heat Intensity Level −7.97 0.0001
Moisture Level 0.431 0.670
Individual R Square Values between the Fabric Properties and Tensile Strength
Fabric Properties R Square ValueWeight/unit length 0.245
Thickness 0.392Fabric Count 0.374

Polymers 2022, 14, 296 13 of 20
Table 6. Effect of moisture and radiant heat on tensile strength of outer layer fabrics (Single layer).
Samples
Heat Flux
10 kW/m2 15 kW/m2 20 kW/m2
Moisture Addition and Tensile Strength Loss %
0% ∆% 20% ∆% 50% ∆% 100% ∆% 0% ∆% 20% ∆% 50% ∆% 100% ∆% 0% ∆% 20% ∆% 50% ∆% 100% ∆%
Stre
ngth
(N)
Stre
ngth
(N)
Stre
ngth
(N)
Stre
ngth
(N)
Stre
ngth
(N)
Stre
ngth
(N)
Stre
ngth
(N)
Stre
ngth
(N)
Stre
ngth
(N)
Stre
ngth
(N)
Stre
ngth
(N)
Stre
ngth
(N)
Fabric A 1093 3.7 1067 −10 1064 −13 1110 −17 578 49 672 30 741 21 702 26 28 98 77 92 42 96 93 90Fabric B 1006 23 997 23.80 1007 23 7093 16.5 489 63 512 61 559 57 568 57 279 79 359 73 369 72 363 72Fabric C 1020 13 1024 12 1142 3 1159 0.60 533 54 544 53 581 50 575 51 314 73 461 60 429 63 439 62Fabric D 9 98 9.6 98 8.4 97.8 10.6 97.1 4.4 99 5 98.7 6.8 98.3 9.2 97.6 0 100 4.5 99 4.7 99 0 100
Polymers 2022, 14, x FOR PEER REVIEW 14 of 20
heat flux, lower moisture content (20% and 50%) did not affect the tensile strength signif-icantly. The moisture helped significantly to retain the tensile strength, especially at lower temperatures. The heat is absorbed in the process of transforming moisture into vapor. Since most of the heat energy has been used to evaporate the moisture the temperature inside of the exposed samples did not increase much [62]. Therefore, the loss of tensile strength was considerably lower than dry and single layer moist conditions. The presence of moisture in the thermal liner could increase the heat capacity of the fabrics, which re-sulted in a significant amount of thermal energy storage within the fabric system [6,59,63,64].
Addition of moisture in the thermal liner had a significant positive effect on the ten-sile strength of fabrics A, B, and C, with only fabric D being the exception. This phenom-enon is due to the type of fiber (i.e., natural or synthetic) present in the fabric, which has been discussed earlier. Added moisture had a significant effect on the strength loss of Fabric A. In wet condition, there is negligible amount of strength loss or slight gain in strength shown by this fiber. Tensile strength data show that the strength loss percentage was negative for 20% and 100% moisture addition. The strength loss was also significantly lower at 15 kW/m2 and 20 kW/m2 with the presence of moisture compared to the dry fab-rics. With the increased moisture, the strength loss percentage decreased. The strength losses were 32%, 25%, and 14%, respectively, for 20%, 50%, and 100% moisture addition at 15 kW/m2. However, at the highest radiant flux at 20 kW/m2 the strength loss percent-ages were 95% and 93% for 20% and 50% moisture addition. At higher heat flux, lower moisture content (20% and 50%) did not affect the tensile strength significantly. However, at 100% moisture addition the heat loss percentage was only 49% which is half compared to 98% at the dry condition at 20 kW/m2. The 20% and 50% moisture addition had a very minor effect on the tensile strength at 15 and 20 kW/m2 in fabric B. The difference was below 10% at this moisture addition compared to the dry condition. However, the 100% moisture addition showed a significant effect even at higher heat flux. The tensile strength loss was 12% and 54% at 15 and 20 kW/m2, respectively, which were 63% and 79% for the same fabric in dry condition.
0
500
1000
1500
0 20 40
Tens
ile S
tren
gth
in N
Heat Flux in kW/m2
Effect of Radiant Heat and Moisture on Tensile Strength
of Fabric A0%moisture
20%moisture
50%moisture
100 %moisture
0
500
1000
1500
2000
0 20 40
Tens
ile S
tren
gth
in N
Heat Flux in kW/m2
Effect of Radiant Heat and Moisture on Tensile Strength of Fabric B
0%moisture
20%moisture
50%moisture
100 %moisture
Polymers 2022, 14, x FOR PEER REVIEW 15 of 20
Figure 8. Effect of radiant heat and moisture on tensile strength of the outer layer fabrics in multi-layered fabric system.
During the five minutes of exposure after the evaporation of the 20% and 50% added moisture maybe there was sufficient time to degrade the outer layer fabric. Therefore, this amount of moisture did not help the fabric retain its tensile strength by increasing the heat capacity of the fabric. However, the 100% moisture addition increased the heat capacity of the fabric to a certain level that the fabric to retain its strength, and therefore the tensile strength loss was lower at this moisture content. At lower radiant heat 10 kW/m2 and with 20% moisture addition, the strength loss was 11% which was 13% at dry condition for the fabric C. Therefore, 20% moisture did not help significantly at lower heat flux. The in-creased heat capacity of the fabric for 20% moisture addition was not sufficient enough to retain the tensile strength during five minutes of exposure. However, for the 50% and 100% moisture addition, there was no loss or increase in the tensile strength (Figure 8). Therefore, the amount of moisture can play a significant effect on the tensile strength at low radiant heat. At 20% and 50% moisture, there was no effect at 20 kW/m2 heat exposure. The heat loss percentage was same for the 20% and 50% moisture while compared to the dry fabric. However, 100% moisture played a significant role at 20 kW/m2. At a higher heat flux of 20 kW/m2 this fabric behaved very differently compared to the other fabrics. The strength loss was lower at 20 kW/m2 compared to the 15 kW/m2. At 100% moisture content and 20 kW/m2 radiant heat this fabric behaved similarly to the 50% moisture con-tent and 10 kW/m2 radiant heat exposure, which is a slight increase in tensile strength. Moisture played a significant role at higher heat flux 20 kW/m2. The change of orientation of the polymer chains in presence of moisture could be the reason for this increase in strength. The strength loss decreased to 39% with 20% moisture addition which was 73% at dry conditions. This then comes down to 22% loss at 50% moisture, and then 3% in-crease at 100% moisture addition.
As discussed above, the least resistance to radiant heat exposure is shown by fabric D (Figure 8). In dry condition, this fabric lost almost 100% of its strength even at 10 kW/m2. The moisture had a positive effect only at the lower radiant heat exposure 10 kW/m2. The tensile strength loss was 44% and 33%, respectively for 50% and 100% moisture content compared to the 98% at dry conditions. However, at higher heat flux 15 and 20 kW/m2
moisture did not play any significant role. The strength loss of the moist fabrics at all per-centages was similar to the dry fabrics. Moisture did not help much at higher tempera-tures because once the moisture evaporated the temperature inside the sample raised dur-ing five minutes of exposure [65]. Fabric D loses its strength even at a lower heat flux of 10 kW/m2. Therefore, at 15 and 20 kW/m2 moisture could not help much in retaining the tensile strength. Once the moisture evaporated, the temperature increased, and fabric lost its tensile strength immediately. Multi-layer fabric system with the presence of moisture
0
500
1000
1500
0 20 40Tens
ile S
tren
gth
in N
Heat Flux in kW/m2
Effect of Radiant Heat and Moisture on Tensile Strength
of Fabric C0%moisture
20%moisture
50%moisture
100 %moisture
0200400600800
0 20 40Tens
ile S
tren
gth
in N
Heat Flux in kW/m2
Effect of Radiant Heat and Moisture on Tensile Strength of Fabric D
0%moisture
20%moisture
50%moisture
100 %moisture
Figure 8. Effect of radiant heat and moisture on tensile strength of the outer layer fabrics in multi-layered fabric system.
At lower temperatures in the presence of moisture, there might be orientation changesof polymer chain occurred in some fabrics, which led to an increase in the crystalline regionand increased the strength of the fiber. The strength loss was also lower at 15 kW/m2 and20 kW/m2 in the presence of moisture compared to the dry fabrics for most of the fabrics.With moisture increasing, the strength loss percentage decreased. At higher heat flux,lower moisture content (20% and 50%) did not affect the tensile strength significantly. Themoisture helped significantly to retain the tensile strength, especially at lower temperatures.The heat is absorbed in the process of transforming moisture into vapor. Since most of theheat energy has been used to evaporate the moisture the temperature inside of the exposedsamples did not increase much [62]. Therefore, the loss of tensile strength was considerablylower than dry and single layer moist conditions. The presence of moisture in the thermal

Polymers 2022, 14, 296 14 of 20
liner could increase the heat capacity of the fabrics, which resulted in a significant amountof thermal energy storage within the fabric system [6,59,63,64].
Addition of moisture in the thermal liner had a significant positive effect on the tensilestrength of fabrics A, B, and C, with only fabric D being the exception. This phenomenonis due to the type of fiber (i.e., natural or synthetic) present in the fabric, which has beendiscussed earlier. Added moisture had a significant effect on the strength loss of Fabric A.In wet condition, there is negligible amount of strength loss or slight gain in strength shownby this fiber. Tensile strength data show that the strength loss percentage was negativefor 20% and 100% moisture addition. The strength loss was also significantly lower at15 kW/m2 and 20 kW/m2 with the presence of moisture compared to the dry fabrics. Withthe increased moisture, the strength loss percentage decreased. The strength losses were32%, 25%, and 14%, respectively, for 20%, 50%, and 100% moisture addition at 15 kW/m2.However, at the highest radiant flux at 20 kW/m2 the strength loss percentages were 95%and 93% for 20% and 50% moisture addition. At higher heat flux, lower moisture content(20% and 50%) did not affect the tensile strength significantly. However, at 100% moistureaddition the heat loss percentage was only 49% which is half compared to 98% at the drycondition at 20 kW/m2. The 20% and 50% moisture addition had a very minor effect onthe tensile strength at 15 and 20 kW/m2 in fabric B. The difference was below 10% at thismoisture addition compared to the dry condition. However, the 100% moisture additionshowed a significant effect even at higher heat flux. The tensile strength loss was 12% and54% at 15 and 20 kW/m2, respectively, which were 63% and 79% for the same fabric indry condition.
During the five minutes of exposure after the evaporation of the 20% and 50% addedmoisture maybe there was sufficient time to degrade the outer layer fabric. Therefore, thisamount of moisture did not help the fabric retain its tensile strength by increasing the heatcapacity of the fabric. However, the 100% moisture addition increased the heat capacity ofthe fabric to a certain level that the fabric to retain its strength, and therefore the tensilestrength loss was lower at this moisture content. At lower radiant heat 10 kW/m2 andwith 20% moisture addition, the strength loss was 11% which was 13% at dry conditionfor the fabric C. Therefore, 20% moisture did not help significantly at lower heat flux. Theincreased heat capacity of the fabric for 20% moisture addition was not sufficient enoughto retain the tensile strength during five minutes of exposure. However, for the 50% and100% moisture addition, there was no loss or increase in the tensile strength (Figure 8).Therefore, the amount of moisture can play a significant effect on the tensile strength at lowradiant heat. At 20% and 50% moisture, there was no effect at 20 kW/m2 heat exposure.The heat loss percentage was same for the 20% and 50% moisture while compared to thedry fabric. However, 100% moisture played a significant role at 20 kW/m2. At a higherheat flux of 20 kW/m2 this fabric behaved very differently compared to the other fabrics.The strength loss was lower at 20 kW/m2 compared to the 15 kW/m2. At 100% moisturecontent and 20 kW/m2 radiant heat this fabric behaved similarly to the 50% moisturecontent and 10 kW/m2 radiant heat exposure, which is a slight increase in tensile strength.Moisture played a significant role at higher heat flux 20 kW/m2. The change of orientationof the polymer chains in presence of moisture could be the reason for this increase instrength. The strength loss decreased to 39% with 20% moisture addition which was 73% atdry conditions. This then comes down to 22% loss at 50% moisture, and then 3% increaseat 100% moisture addition.
As discussed above, the least resistance to radiant heat exposure is shown by fabric D(Figure 8). In dry condition, this fabric lost almost 100% of its strength even at 10 kW/m2.The moisture had a positive effect only at the lower radiant heat exposure 10 kW/m2.The tensile strength loss was 44% and 33%, respectively for 50% and 100% moisturecontent compared to the 98% at dry conditions. However, at higher heat flux 15 and20 kW/m2 moisture did not play any significant role. The strength loss of the moist fabricsat all percentages was similar to the dry fabrics. Moisture did not help much at highertemperatures because once the moisture evaporated the temperature inside the sample

Polymers 2022, 14, 296 15 of 20
raised during five minutes of exposure [65]. Fabric D loses its strength even at a lowerheat flux of 10 kW/m2. Therefore, at 15 and 20 kW/m2 moisture could not help much inretaining the tensile strength. Once the moisture evaporated, the temperature increased,and fabric lost its tensile strength immediately. Multi-layer fabric system with the presenceof moisture in the thermal liner during the exposure has been analyzed. Same linearregression analysis tool has been used to determine the R square and t-test value (t andp values). The independent and dependent variables are as follows: Independent variables:(i) Fabric properties (Weight/unit length, thickness, fabric count); (ii) Heat flux intensities(0, 10, 15, and 20 kW/m2) and moisture addition amount (0, 20, 50, and 100%) are theordinal independent variables. Dependent variable: Tensile strength of the outer layerfabric. The results are shown in Table 7.
Table 7. Statistical analysis of multi-layered fabric system in presence of moisture in the thermal liner.
Model Summary
R Square F p
0.81 26.02 0.001Coefficients t p
Weight/unit length 3.434 0.002Thickness −2.703 0.011
Fabric Count −0.642 0.526Heat Intensity Level −5.941 0.0001
Moisture Level 3.214 0.003Individual R Square Values between the Fabric Properties and Tensile Strength
Fabric Properties R Square ValueWeight/unit length 0.303
Thickness 0.452Fabric Count 0.446
From the earlier discussion, we have seen that in the three-layered fabric system withthe presence of moisture in the thermal liner, moisture has positive effect on the tensilestrength. On the other hand, the level of heat intensity has a negative effect on the tensilestrength. The t-test value in the above table shows the same result. For all four outer layers,t-values for moisture have a positive value, and heat intensity values have a negative value.All the t-test values except fabric count are statistically significant when the alpha value is0.1 or lower.
Additionally, the R2 values of the multi-layer fabric system are lower compared tothe single-layer fabric system. This suggests the moisture in the thermal liner plays crucialpart in determining the effect on tensile strength of the fabrics compared to the presenceof moisture in the single layer. Since moisture in the outer layer did not affect the tensilestrength, the strength almost depended on the heat flux intensities solely. Therefore, the Rsquare values are greater in the single-layered fabric system compared to the three-layeredfabric system. Similar to the previous discussion, thickness is the most important propertywhen we consider the fabric tensile strength. Similarly, fabric count is the second mostimportant property. Nevertheless, both thickness and fabric count moderately affect thetensile strength as their R square values are fairly high. Table 8 summarizes the combinedeffect of radiant heat and moisture on the tensile strength of all four outer layer fabrics.
Table 8. Effect of radiant heat on tensile strength (Wet condition).
Samples
Heat Flux
10 kW/m2 15 kW/m2 20 kW/m2
Moisture Addition and Tensile Strength Loss %
0% ∆% 20% ∆% 50% ∆% 100% ∆% 0% ∆% 20% ∆% 50% ∆% 100% ∆% 0% ∆% 20% ∆% 50% ∆% 100% ∆%
Stre
ngth
(N)
Stre
ngth
(N)
Stre
ngth
(N)
Stre
ngth
(N)
Stre
ngth
(N)
Stre
ngth
(N)
Stre
ngth
(N)
Stre
ngth
(N)
Stre
ngth
(N)
Stre
ngth
(N)
Stre
ngth
(N)
Stre
ngth
(N)
Fabric A 1093 3.7 1143 −0.7 1095 3.5 1146 −0.97 578 49 768 32 849 25 980 14 28 98 58 95 80 93 577 49

Polymers 2022, 14, 296 16 of 20
Table 8. Cont.
Samples
Heat Flux
10 kW/m2 15 kW/m2 20 kW/m2
Moisture Addition and Tensile Strength Loss %
0% ∆% 20% ∆% 50% ∆% 100% ∆% 0% ∆% 20% ∆% 50% ∆% 100% ∆% 0% ∆% 20% ∆% 50% ∆% 100% ∆%
Stre
ngth
(N)
Stre
ngth
(N)
Stre
ngth
(N)
Stre
ngth
(N)
Stre
ngth
(N)
Stre
ngth
(N)
Stre
ngth
(N)
Stre
ngth
(N)
Stre
ngth
(N)
Stre
ngth
(N)
Stre
ngth
(N)
Stre
ngth
(N)
Fabric B 1006 23 1200 8.3 1291 1.4 1251 4.4 489 63 483 63 588 55 1149 12 279 79 304 77 325 75 596 54Fabric C 1020 13 1042 11 1202 −3 1161 0.4 533 54 511 56 562 52 1163 0.3 314 73 707 39 904 22 1204 −3.3Fabric D 9 98 28 94 263 44 315 33 4.4 99 5.3 98.9 5.1 98.9 12.8 97 0 100 4.2 99 3.3 99 36.5 92
∆: Change of tensile strength (compared to the initial strength before the heat exposure and dry condition).
4. Conclusions
This study investigated the change of tensile strength of the fabrics in presence ofmoisture, used in firefighters’ bunker gear under radiant heat exposure. The tensile strengthof the fabrics has been characterized under different heat flux in dry and moist conditions.Thickness and the fabric count have been found as the key fabric properties affecting thetensile strength. The presence of moisture also plays a complicated role in determining thechange of tensile strength depending on the amount and location of the moisture. Moisturehad a significant positive effect on the tensile strength when the moisture was in the thermalliner and the amount of moisture was higher. This research will help to understand theoverall integrity of the firefighters’ bunker gear after being worn at fire sites. However,the change of tensile strength may not be directly related to the protective performance.Therefore, further research may be completed to develop the relationship between thechange of tensile strength and the protective performance of thermal protective clothing.The changes of tensile strength also could not be quantified in terms of orientational changesof polymer chains, which could be another interesting study for further development ofthis research. It is expected that this research will help to understand the change of tensilestrength of the fabric used in thermal protective clothing after being exposed to radiantheat, which will eventually help to identify the overall integrity of the firefighters’ thermalprotective clothing. Our research will help to develop improved fabrics by maintainingbetter integrity of the firefighters’ clothing while on duty. This effort could help to improveoccupational health and safety for firefighters
Author Contributions: N.-U.-S.M.: Conceptualization, designing and performing experiments,writing, data analysis. S.M.: conceptualization, designing experiments, writing, data analysis,supervision. R.J.A.: conceptualization, A.P.: data analysis, writing—review and editing. L.M.B.:writing—review and editing, supervision. G.S.: designing experiments. All authors have read andagreed to the published version of the manuscript.
Funding: This research received no external funding.
Institutional Review Board Statement: Not applicable.
Informed Consent Statement: Not applicable.
Data Availability Statement: The data presented in this study are available on request from thecorresponding author.
Acknowledgments: N.-U.-S.M. is grateful to the department of Design, Housing and Merchandisingof Oklahoma State University, USA, for giving him the opportunity to successfully complete hismaster’s thesis. Sumit Mandal would like to thank Oklahoma State University, USA, for providinghim with a start-up grant.
Conflicts of Interest: The authors declare no conflict of interest.
Polymers 2022, 14, 296 17 of 20
References1. Ahrens, M.; Evarts, B. Fire Loss in the United States during 2019; National Fire Protection Association: Quincy, MA, USA, 2020.2. Smith, D.L. Firefighter Fatalities and Injuries: The Role of Heat Stress and PPE; Firefighter Life Safety Research Center, Illinois Fire
Service Institute: Champaign, IL, USA, 2008.3. Campbell, R.; Evarts, B. United States Firefighter Injuries in 2019; National Fire Protection Association (NFPA): Quincy, MA, USA, 2020.4. Fahy, R.F.; Petrillo, J.T.; Molis, J.L. Firefighter Fatalities in the US-2019; National Fire Protection Association, Fire Analysis and
Research Division: Quincy, MA, USA, 2020.5. McLellan, T.M.; Selkirk, G.A. The management of heat stress for the firefighter: A review of work conducted on behalf of the
Toronto Fire Service. Ind. Health 2006, 44, 414–426. [CrossRef] [PubMed]6. Mandal, S.; Mazumder, N.-U.-S.; Agnew, R.J.; Song, G.; Li, R. Characterization and Modeling of Thermal Protective and
Thermo-Physiological Comfort Performance of Polymeric Textile Materials—A Review. Materials 2021, 14, 2397. [CrossRef]7. Lu, Y.; Wang, L.; Gao, Q. Predicting tensile strength of fabrics used in firefighters’ protective clothing after multiple radiation
exposures. J. Text. Inst. 2018, 109, 338–344. [CrossRef]8. Cui, Z.; Ma, C.; Lv, N. Effects of heat treatment on the mechanical and thermal performance of fabric used in firefighter protective
clothing. Fibres Text. East. Eur. 2015, 23, 74–78.9. Ghazy, A.; Bergstrom, D.J. Influence of the air gap between protective clothing and skin on clothing performance during flash fire
exposure. Heat Mass Transf. 2011, 47, 1275–1288. [CrossRef]10. Lawson, L.K.; Crown, E.M.; Ackerman, M.Y.; Douglas Dale, J. Moisture Effects in Heat Transfer through Clothing Systems for
Wildland Firefighters. Int. J. Occup. Saf. Ergon. 2004, 10, 227–238. [CrossRef]11. Barker, R.L.; Guerth-Schacher, C.; Grimes, R.; Hamouda, H. Effects of moisture on the thermal protective performance of
firefighter protective clothing in low-level radiant heat exposures. Text. Res. J. 2006, 76, 27–31. [CrossRef]12. Lee, Y.M.; Barker, R.L. Effect of moisture on the thermal protective performance of heat-resistant fabrics. J. Fire Sci. 1986, 4,
315–331.13. Zhiying, C.; Yanmin, W.; Weiyuan, Z. Thermal protective performance and moisture transmission of firefighter protective clothing
based on orthogonal design. J. Ind. Text. 2010, 39, 347–356. [CrossRef]14. Keiser, C.; Becker, C.; Rossi, R.M. Moisture Transport and Absorption in Multilayer Protective Clothing Fabrics. Text. Res. J. 2008,
78, 604–613. [CrossRef]15. Veghte, J.H. Effect of moisture on the burn potential in fire fighters’ gloves. Fire Technol. 1987, 23, 313–322. [CrossRef]16. Zhang, H.; Song, G.; Gu, Y.; Ren, H.; Cao, J. Effect of moisture content on thermal protective performance of fabric assemblies by
a stored energy approach under flash exposure. Text. Res. J. 2018, 88, 1847–1861. [CrossRef]17. He, H.; Yu, Z.-C.; Song, G. The effect of moisture and air gap on the thermal protective performance of fabric assemblies used by
wildland firefighters. J. Text. Inst. 2016, 107, 1030–1036. [CrossRef]18. Guan, M.; Annaheim, S.; Camenzind, M.; Li, J.; Mandal, S.; Psikuta, A.; Rossi, R.M. Moisture transfer of the clothing–human body
system during continuous sweating under radiant heat. Text. Res. J. 2019, 89, 4537–4553. [CrossRef]19. Deng, M.; Tian, M.; Wang, Y.; Wang, M. Quantitatively evaluating the effects of flash fire exposure on the mechanical performance
of thermal protective clothing. Int. J. Cloth. Sci. Technol. 2020, 32, 412–429. [CrossRef]20. Ohalele, H.U.; Fulton, M.; Torvi, D.A.; Noble, S.D.; Batcheller, J.C. Effects of high heat flux exposures on tensile strength of
firefighters’ protective clothing. Fire Mater. 2021, 1–13. [CrossRef]21. Liu, X.; Tian, M.; Wang, Y.; Su, Y.; Li, J. Modeling to predict thermal aging for flame-retardant fabrics considering thermal stability
under fire exposure. Text. Res. J. 2021, 91, 2656–2668. [CrossRef]22. Mandal, S.; Camenzind, M.; Annaheim, S.; Rossi, R.M. Evaluation of heat and flame protective performance of clothing using
manikins. In Manikins for Textile Evaluation; Elsevier: Amsterdam, The Netherlands, 2017; pp. 199–223.23. Aidani, R.; Dolez, P.; Vu-Khanh, T. Effect of thermal aging on the mechanical and barrier properties of an e-PTFE/NomexVR
moisture membrane used in firefighters’ protective suits. J. Appl. Polym. Sci. 2011, 121, 3101–3110. [CrossRef]24. Arrieta, C.; David, E.; Dolez, P.; Vu-Khanh, T. Thermal aging of a blend of high-performance fibers. J. Appl. Polym. Sci. 2010, 115,
3031–3039. [CrossRef]25. Day, M.; Cooney, J.; Suprunchuk, T. Durability of firefighters’ protective clothing to heat and light. Text. Res. J. 1988, 58, 141–147.
[CrossRef]26. Houshyar, S.; Padhye, R.; Ranjan, S.; Tew, S.; Nayak, R. The impact of ultraviolet light exposure on the performance of
polybenzidimazole and polyaramid fabrics: Prediction of end-of-life performance. J. Ind. Text. 2018, 48, 77–86. [CrossRef]27. Davis, R.; Chin, J.; Lin, C.-C.; Petit, S. Accelerated weathering of polyaramid and polybenzimidazole firefighter protective clothing
fabrics. Polym. Degrad. Stab. 2010, 95, 1642–1654. [CrossRef]28. Horn, G.P.; Kerber, S.; Andrews, J.; Kesler, R.M.; Newman, H.; Stewart, J.W.; Fent, K.W.; Smith, D.L. Impact of Repeated Exposure
and Cleaning on Protective Properties of Structural Firefighting Turnout Gear. Fire Technol. 2021, 57, 791–813. [CrossRef]29. Dolez, P.I.; Tomer, N.S.; Malajati, Y. A quantitative method to compare the effect of thermal aging on the mechanical performance
of fire protective fabrics. J. Appl. Polym. Sci. 2019, 136, 47045. [CrossRef]30. Ohalele, H.U. Evaluating Effects of Heat Fluxes and Duration on Performance of Firefighters’ Protective Clothing Using
Destructive and Non Destructive Methods. Master’s Thesis, University of Saskatchewan, Saskatoon, SK, Canada, 2020.
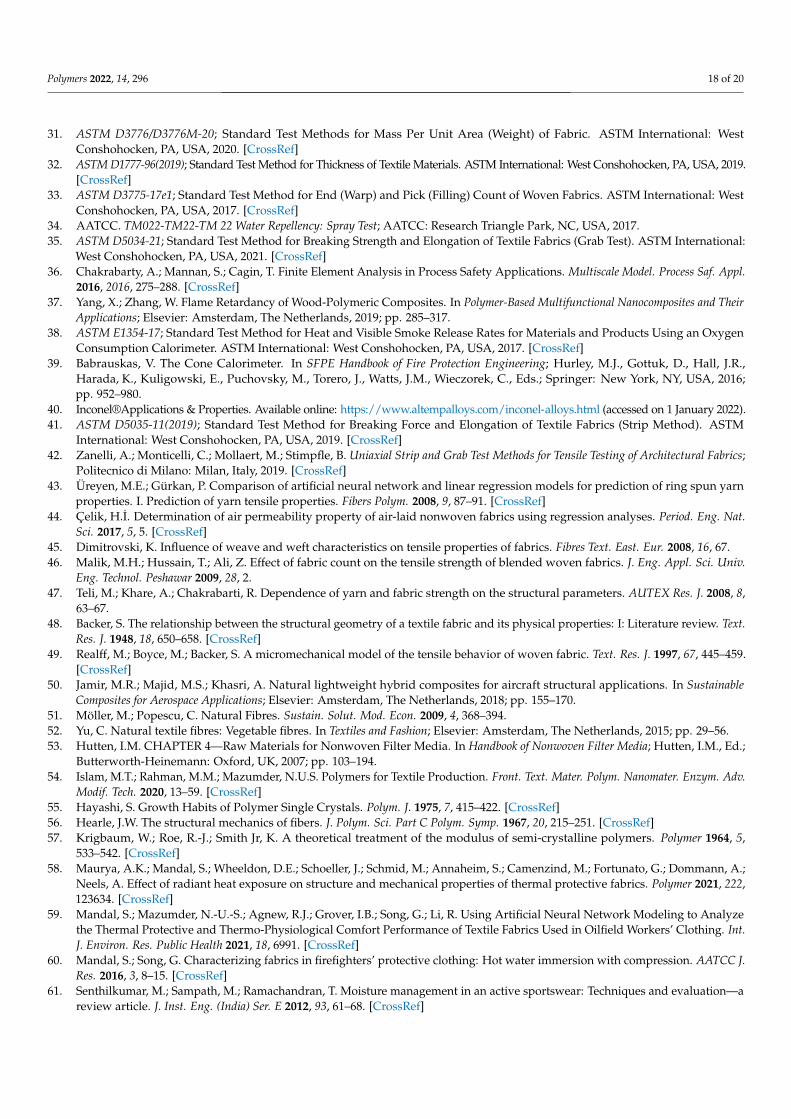
Polymers 2022, 14, 296 18 of 20
31. ASTM D3776/D3776M-20; Standard Test Methods for Mass Per Unit Area (Weight) of Fabric. ASTM International: WestConshohocken, PA, USA, 2020. [CrossRef]
32. ASTM D1777-96(2019); Standard Test Method for Thickness of Textile Materials. ASTM International: West Conshohocken, PA, USA, 2019.[CrossRef]
33. ASTM D3775-17e1; Standard Test Method for End (Warp) and Pick (Filling) Count of Woven Fabrics. ASTM International: WestConshohocken, PA, USA, 2017. [CrossRef]
34. AATCC. TM022-TM22-TM 22 Water Repellency: Spray Test; AATCC: Research Triangle Park, NC, USA, 2017.35. ASTM D5034-21; Standard Test Method for Breaking Strength and Elongation of Textile Fabrics (Grab Test). ASTM International:
West Conshohocken, PA, USA, 2021. [CrossRef]36. Chakrabarty, A.; Mannan, S.; Cagin, T. Finite Element Analysis in Process Safety Applications. Multiscale Model. Process Saf. Appl.
2016, 2016, 275–288. [CrossRef]37. Yang, X.; Zhang, W. Flame Retardancy of Wood-Polymeric Composites. In Polymer-Based Multifunctional Nanocomposites and Their
Applications; Elsevier: Amsterdam, The Netherlands, 2019; pp. 285–317.38. ASTM E1354-17; Standard Test Method for Heat and Visible Smoke Release Rates for Materials and Products Using an Oxygen
Consumption Calorimeter. ASTM International: West Conshohocken, PA, USA, 2017. [CrossRef]39. Babrauskas, V. The Cone Calorimeter. In SFPE Handbook of Fire Protection Engineering; Hurley, M.J., Gottuk, D., Hall, J.R.,
Harada, K., Kuligowski, E., Puchovsky, M., Torero, J., Watts, J.M., Wieczorek, C., Eds.; Springer: New York, NY, USA, 2016;pp. 952–980.
40. Inconel®Applications & Properties. Available online: https://www.altempalloys.com/inconel-alloys.html (accessed on 1 January 2022).41. ASTM D5035-11(2019); Standard Test Method for Breaking Force and Elongation of Textile Fabrics (Strip Method). ASTM
International: West Conshohocken, PA, USA, 2019. [CrossRef]42. Zanelli, A.; Monticelli, C.; Mollaert, M.; Stimpfle, B. Uniaxial Strip and Grab Test Methods for Tensile Testing of Architectural Fabrics;
Politecnico di Milano: Milan, Italy, 2019. [CrossRef]43. Üreyen, M.E.; Gürkan, P. Comparison of artificial neural network and linear regression models for prediction of ring spun yarn
properties. I. Prediction of yarn tensile properties. Fibers Polym. 2008, 9, 87–91. [CrossRef]44. Çelik, H.I. Determination of air permeability property of air-laid nonwoven fabrics using regression analyses. Period. Eng. Nat.
Sci. 2017, 5, 5. [CrossRef]45. Dimitrovski, K. Influence of weave and weft characteristics on tensile properties of fabrics. Fibres Text. East. Eur. 2008, 16, 67.46. Malik, M.H.; Hussain, T.; Ali, Z. Effect of fabric count on the tensile strength of blended woven fabrics. J. Eng. Appl. Sci. Univ.
Eng. Technol. Peshawar 2009, 28, 2.47. Teli, M.; Khare, A.; Chakrabarti, R. Dependence of yarn and fabric strength on the structural parameters. AUTEX Res. J. 2008, 8,
63–67.48. Backer, S. The relationship between the structural geometry of a textile fabric and its physical properties: I: Literature review. Text.
Res. J. 1948, 18, 650–658. [CrossRef]49. Realff, M.; Boyce, M.; Backer, S. A micromechanical model of the tensile behavior of woven fabric. Text. Res. J. 1997, 67, 445–459.
[CrossRef]50. Jamir, M.R.; Majid, M.S.; Khasri, A. Natural lightweight hybrid composites for aircraft structural applications. In Sustainable
Composites for Aerospace Applications; Elsevier: Amsterdam, The Netherlands, 2018; pp. 155–170.51. Möller, M.; Popescu, C. Natural Fibres. Sustain. Solut. Mod. Econ. 2009, 4, 368–394.52. Yu, C. Natural textile fibres: Vegetable fibres. In Textiles and Fashion; Elsevier: Amsterdam, The Netherlands, 2015; pp. 29–56.53. Hutten, I.M. CHAPTER 4—Raw Materials for Nonwoven Filter Media. In Handbook of Nonwoven Filter Media; Hutten, I.M., Ed.;
Butterworth-Heinemann: Oxford, UK, 2007; pp. 103–194.54. Islam, M.T.; Rahman, M.M.; Mazumder, N.U.S. Polymers for Textile Production. Front. Text. Mater. Polym. Nanomater. Enzym. Adv.
Modif. Tech. 2020, 13–59. [CrossRef]55. Hayashi, S. Growth Habits of Polymer Single Crystals. Polym. J. 1975, 7, 415–422. [CrossRef]56. Hearle, J.W. The structural mechanics of fibers. J. Polym. Sci. Part C Polym. Symp. 1967, 20, 215–251. [CrossRef]57. Krigbaum, W.; Roe, R.-J.; Smith Jr, K. A theoretical treatment of the modulus of semi-crystalline polymers. Polymer 1964, 5,
533–542. [CrossRef]58. Maurya, A.K.; Mandal, S.; Wheeldon, D.E.; Schoeller, J.; Schmid, M.; Annaheim, S.; Camenzind, M.; Fortunato, G.; Dommann, A.;
Neels, A. Effect of radiant heat exposure on structure and mechanical properties of thermal protective fabrics. Polymer 2021, 222,123634. [CrossRef]
59. Mandal, S.; Mazumder, N.-U.-S.; Agnew, R.J.; Grover, I.B.; Song, G.; Li, R. Using Artificial Neural Network Modeling to Analyzethe Thermal Protective and Thermo-Physiological Comfort Performance of Textile Fabrics Used in Oilfield Workers’ Clothing. Int.J. Environ. Res. Public Health 2021, 18, 6991. [CrossRef]
60. Mandal, S.; Song, G. Characterizing fabrics in firefighters’ protective clothing: Hot water immersion with compression. AATCC J.Res. 2016, 3, 8–15. [CrossRef]
61. Senthilkumar, M.; Sampath, M.; Ramachandran, T. Moisture management in an active sportswear: Techniques and evaluation—areview article. J. Inst. Eng. (India) Ser. E 2012, 93, 61–68. [CrossRef]

Polymers 2022, 14, 296 19 of 20
62. Hes, L.; Loghin, C. Heat, moisture and air transfer properties of selected woven fabrics in wet state. J. Fiber Bioeng. Inform. 2009, 2,141–149.
63. Slavinec, M.; Repnik, R.; Klemencic, E. The impact of moisture on thermal conductivity of fabrics. Anal. Pazu 2016, 6, 8–12.64. Song, G.; Mandal, S.; Rossi, R. Thermal Protective Clothing for Firefighters; Woodhead Publishing: Cambridge, UK, 2016.65. Bonaldi, R.R. 6—Functional finishes for high-performance apparel. In High-Performance Apparel; McLoughlin, J., Sabir, T., Eds.;
Woodhead Publishing: Cambridge, UK, 2018; pp. 129–156.