Impact Response of Nanofluid-Reinforced Antiballistic Kevlar Fabrics
Upload
khangminh22Category
view
1download
0
i
ENHANCED TECHNIQUES FOR FINGERMARK RECOVERY FROM FABRICS
JOANNA MAY FRASER
A thesis submitted in partial fulfilment of the requirements of Abertay University for the
degree of Doctor of Philosophy
August 2013
CERTIFICATION
I certify that this thesis is the true and accurate version of the thesis approved by the
examiners, and that all relevant ordinance and regulations have been fulfilled.
Signed …………………………………………… Date……………….
(Director of Studies)

i
DECLARATION
I, (Joanna May Fraser), declare that this thesis is the product of my own effort. I can
confirm that where information has been derived from other sources, this has been
indicated in the thesis.
Signed: _____________________________________ Date: ______________
(Joanna May Fraser)

ii
"All of us take pride and pleasure in the fact that we are unique, but I'm afraid that
when all is said and done the police are right: it all comes down to fingerprints."
David Sedaris (1997)

iii
Acknowledgements
There are many people I would like to thank for their help in contributing to the
success of this work.
The first person I would like to thank is my supervisor, Professor David H.
Bremner, your willingness to share your knowledge and the encouragement you gave
me throughout the last six years has kept me going allowing me to complete this
thesis.
Next, I would like to thank my external advisors, Paul Deacon (SPAFS) and
Stephen Bleay (CAST) for their support and assistance. Their knowledge on
fingerprinting techniques and operational experience has been invaluable. They have
increased my own knowledge of fingerprinting immensely and showed great patience
with the practical side of the research, spending many hours explaining and
demonstrating the techniques required for this thesis.
The staff - academic, technical and administrative, of the University of Abertay
Dundee, School of Science, Engineering and Technology should also be acknowledged
for their support, knowledge and patience throughout my entire time at Abertay. Also
those who were donors during the many trials, an added thank you for putting up with
the requirements that this entailed.
Also the honours project students who carried out work related to my thesis –
Kirsten Black, Mel Smith, Susan Knighting, Husayn Al-Khairulla, David Lamont, Phoebe
Streets, Helen Graham, Helen Rose, Sarah Aitken, Andrew Southward, Dougie Tait and
Katie Davidson. The work these students carried out both validated and advanced my
own work.
Finally, I would like to thank my family and friends, who all kept me sane with
their support and encouragement from day one of this PhD, I am grateful to say this
support is still ongoing.

iv
Abstract
Fingermarks have been used for centuries as a means of determining an individual’s identity and fabrics have long been considered a difficult substrate from which to visualise and collect fingermarks. This study mainly concentrated on vacuum metal deposition (VMD) and cyanoacrylate fuming (CAF), to ascertain whether these methods could visualise planted marks and consequently be used in the examination of clothing from assault cases.
Nine different fabrics: cotton, polycotton, polyester, nylon, nylon-Lycra, satin, silk, rayon and linen along with fifteen donors ranging in age, sex and ability to leave fingermarks were used during this work. The donors were previously tested on paper to determine their propensity to leave fingermarks, which gave an indication as to their donor ability level – poor, medium or good. The samples were collected and processed with the appropriate technique after a determined time interval, generally, 1, 2, 3, 4, 5, 6, 7, 14, 21 and 28 days, however this was altered for some of the trials.
From the results, it was found that both VMD and CAF did visualise marks and ridge detail from latent fingermarks. VMD was found to be the most suitable technique for development of fingermarks on fabric, with gold + zinc VMD best for light coloured fabrics and silver VMD for dark. CAF also visualised several identifiable marks, even with the problems of background fluorescence from the basic yellow 40 (BY40) dye used to visualise the cyanoacrylate (CA) polymer. Generally, it appears that the smoother fabrics with a tighter weave, such as nylon and silk allowed the visualisation of more detail than rougher and/or looser weave fabrics such as cotton and linen. The latter tended only to show empty marks or marks, which gave indications of where the fabric had been touched. However, fabrics that did show marks, even if not suitable for identification, could still give information as to the sequence of events that may have occurred during an assault as well as identifying an area to tape for DNA. It was determined that it was possible to collect DNA from VMD visualised marks which led to partial and full profiles of those who touched and grabbed the test swatches or items of clothing tested.
Though both VMD and CAF were affected by the addition of water to the surface of the fabrics being processed, marks and ridge detail were still detected, though CAF was less effective than VMD. With sequential treatment, it appears that the optimum sequence is VMD followed by CAF, due to enhancement of contrast between the metal deposits and BY40 yellow stained background. CAF then VMD only led to extra detail being observed on nylon-Lycra. There was limited success with 1,8-diaza-9-fluorenone (DFO), small particle reagent (SPR), ninhydrin, fluorescent powders or the sputter coater for alternative VMD metals. The production of nanoparticles was unsuccessful; so no fingermark visualisation was attempted. Finally, the issue of ridge detail being obscured by the fabric weave may have been resolved by the use of IR photography or FFT processing.
In conclusion, both VMD and CAF are viable processes for the development of fingermark and palm detail on fabric, clothing and textiles. It must be considered however that the donor and fabric being processed greatly affected the level of detail visualised. However, even if ridge detail is not visualised, any marks that are present could indicate a sequence of events or act as an area to target for DNA profiling.

v
Abbreviations
AWRE – Atomic Weapons Research Establishment
BY40 – Basic Yellow 40
CA – Cyanoacrylate
CAF – Cyanoacrylate fuming
CAST – Centre for Applied Science and Technology
DFO – 1,8-Diaza-9-fluorenone
FFT – Fast Fourier Transform
HOSDB – Home Office Scientific Development Branch
IR – Infrared
MEG - Monoethyleneglycol
MMD – Multimetal deposition
NAFIS - National Automated Fingerprint Identification System
NGM – Next Generation Multiplex
PCR – Polymerase Chain Reaction
PET – Polyethylene terephthalate
PITO - Police Information Technology Organisation
PP - Polypropylene
SEM – Scanning Electron Microscope
SGM – Second Generation Multiplex
SOP – Standard Operating Procedures
SPR – Small Particle Reagent
SPAFS – Scottish Police Authority Forensic Services (formerly Scottish Police Services
Authority, SPSA)
SRBD - Scientific Research and Development Branch
tDNA – Touch DNA
VMD – Vacuum Metal Deposition

vi
Table of Contents
1. INTRODUCTION ................................................................................... 1
1.1 Background to fingerprints and fingermarks ....................................... 1
1.1.1 Fingerprint history................................................................................ 1
1.1.2 Skin formation ..................................................................................... 3
1.1.3 Formation of finger and palm prints ....................................................... 5
1.1.4 Composition of fingerprint residues ....................................................... 9
1.1.5 Permanency and uniqueness of prints .................................................. 14
1.1.6 Use of fingermarks and palms in identification ...................................... 17
1.2 Background to fabrics ........................................................................ 18
1.2.1 Fabric types ...................................................................................... 19
1.2.2 Moisture absorption and porosity of fabrics .......................................... 23
1.2.3 Fabric fingerprinting in forensic science ............................................... 24
1.3 Background to Vacuum Metal Deposition (VMD) and Cyanoacrylate
Fuming (CAF) techniques used in research ............................................... 28
1.3.1 VMD ................................................................................................. 28
1.3.2 CAF .................................................................................................. 31
1.3.3 VMD versus CAF and sequential treatment ........................................... 34
2. EXPERIMENTAL ...................................................................................... 36
2.1 Fabrics ............................................................................................... 36
2.2 Donors ............................................................................................... 36
2.2.1 Donor grading ................................................................................... 38
2.3 Storage .............................................................................................. 38
2.4 Grading of marks ............................................................................... 38
2.5 Vacuum metal deposition (VMD) materials and methods .................. 39
2.5.1 Gold + zinc ....................................................................................... 39
2.5.2 Silver ................................................................................................ 40
2.6 Cyanoacrylate (CAF) .......................................................................... 41
2.6.1 Benchtop superglue fuming chamber ................................................... 41
2.6.2 Scottish Police Authority Forensic Services (SPAFS) CAF cabinets ........... 42
2.7 Quaser................................................................................................ 43
2.8 Crime lites .......................................................................................... 43
2.9 Sputter coater .................................................................................... 44
2.10Sonication .......................................................................................... 44
2.11Preparation of carbon particles .......................................................... 45

vii
2.11.1 From Glucose/hydrochloric acid (HCl) .................................................. 45
2.11.2 From glucose/sodium hydroxide (NaOH) solution .................................. 45
2.11.3 From coffee ....................................................................................... 46
2.11.4 From activated carbon cloth ................................................................ 46
2.12Characterisation of carbon particles .................................................. 46
2.12.1 Spectrofluorophotometer .................................................................... 46
2.12.2 Fluorescence microscopy .................................................................... 46
2.13Examination of the carbon particles for visualisation of latent
fingermarks............................................................................................... 47
2.13.1 Visualisation with Quaser .................................................................... 47
2.13.2 Visualisation with the fluorescent microscope ....................................... 47
2.14Studies on the effect of water on samples visualised with VMD and
CAF …………………………………………………………………………………………47
2.14.1 The effect of moisture on the visualisation of latent marks .................... 47
2.14.2 Hydrophobicity and hydrophilicity testing ............................................. 48
2.15Visualisation of latent fingermarks using chemical processes ........... 49
2.15.1 1, 8-Diaza-9-fluorenone (DFO) ............................................................ 49
2.15.2 Ninhydrin .......................................................................................... 50
2.15.3 Small particle reagent (SPR) ............................................................... 51
2.15.4 Fluorescent fingerprint powders .......................................................... 52
3. VISUALISATION OF FINGERMARKS ON FABRIC SWATCHES BY MEANS
OF VACUUM METAL DEPOSITION (VMD) ..................................................... 53
3.1 Aims ................................................................................................... 53
3.2 Grading of marks ............................................................................... 53
3.3 Donor one .......................................................................................... 53
3.4 Donor two .......................................................................................... 57
3.5 Donor three ........................................................................................ 58
3.6 Donor five .......................................................................................... 59
3.7 Donor six ............................................................................................ 61
3.8 Donor seven ....................................................................................... 62
3.9 Donor eight ........................................................................................ 63
3.10Donor nine ......................................................................................... 64
3.11Donor ten ........................................................................................... 66
3.12Donor eleven ...................................................................................... 67
3.13Donor twelve ..................................................................................... 68

viii
3.14Donor thirteen ................................................................................... 69
3.15Donor fifteen ...................................................................................... 70
3.16Donor sixteen ..................................................................................... 71
3.17Donor twenty ..................................................................................... 73
3.18Overview of donor grading ................................................................ 74
3.19Amount and quality of ridge detail visualisation ................................ 75
3.20Palmar flexion creases found on fabrics ............................................ 81
3.21Ridge detail found on test fabrics ...................................................... 82
3.22Statistical analysis of fabric suitability for VMD fingermark
visualisation. ............................................................................................. 83
3.23Target areas for DNA on test fabrics .................................................. 84
3.24Visualisation of samples by means other than photography ............. 86
3.25Conclusion ......................................................................................... 92
4. VISUALISATION OF FINGERMARKS ON FABRIC SAMPLES BY MEANS OF
CYANOACRYLATE FUMING (CAF) ................................................................. 94
4.1 Aims ................................................................................................... 94
4.2 Donor one .......................................................................................... 94
4.3 Donor two .......................................................................................... 96
4.4 Donor three ........................................................................................ 97
4.5 Donor five .......................................................................................... 98
4.6 Donor six ............................................................................................ 99
4.7 Donor seven ....................................................................................... 99
4.8 Donor eight ........................................................................................ 99
4.9 Donor nine ....................................................................................... 100
4.10Donor ten ......................................................................................... 101
4.11Donor eleven .................................................................................... 102
4.12Donor twelve ................................................................................... 102
4.13Donor thirteen ................................................................................. 102
4.14Donor fifteen .................................................................................... 103
4.15Donor sixteen ................................................................................... 103
4.16Donor twenty ................................................................................... 103
4.17Statistical analysis of CAF fingermark visualisation on cotton, nylon,
polyester and polycotton ........................................................................ 103
4.18Overall discussion ............................................................................ 104
ix
5. THE RECOVERY OF FINGERMARKS FROM FABRIC USING VACUUM METAL
DEPOSITION (VMD) AND CYANOACRYLATE FUMING (CAF): 7 DAY STUDY ON
RAYON, SATIN, NYLON-LYCRA, SILK AND LINEN. ..................................... 107
5.1 Aim ................................................................................................... 107
5.2 Results and discussion ..................................................................... 107
5.3 Statistical analysis of VMD and CAF fingermark visualisation on rayon,
satin, nylon-Lycra and silk. ..................................................................... 112
6. Sequential treatment of fabrics ........................................................... 115
6.1 Aim ................................................................................................... 115
6.2 Results and discussion ..................................................................... 115
6.3 Sequential VMD then CAF ................................................................ 116
6.3.1 VMD only compared to sequential VMD then CAF ............................... 116
6.3.2 Sequential VMD then CAF Donor one ................................................. 117
6.3.3 Sequential VMD then CAF Donor two ................................................. 119
6.3.4 Sequential VMD then CAF Donor three ............................................... 120
6.4 Sequential CAF then VMD ................................................................ 127
6.4.1 CAF only compared to sequential CAF then VMD................................. 127
6.4.2 Sequential CAF then VMD - Donor one ............................................... 128
6.4.3 Sequential CAF then VMD - Donor two ............................................... 129
6.4.4 Sequential CAF then VMD Donor three ............................................... 130
6.5 Conclusion ....................................................................................... 135
7. COMPARISON OF THE RECOVERY OF FINGERMARKS FROM FABRIC
USING VACUUM METAL DEPOSITION (VMD) AND CYANOACRYLATE FUMING
(CAF) .......................................................................................................... 137
7.1 Aims ................................................................................................. 137
7.2 Background ...................................................................................... 137
7.3 Processes used in the study ............................................................. 138
7.4 Fabrics used in studies ..................................................................... 139
7.5 Donors used in studies ..................................................................... 140
7.6 Deposition methods used in studies ................................................ 140
7.7 Timelines used in studies ................................................................. 141
7.8 Fingermark grading used in studies ................................................. 141
7.9 VMD donor grading .......................................................................... 141
7.9.1 Cotton ............................................................................................ 142
7.9.2 Polycotton ....................................................................................... 143

x
7.9.3 Polyester ......................................................................................... 145
7.9.4 Satin ............................................................................................... 146
7.9.5 Nylon .............................................................................................. 147
7.9.6 Silk, Lycra, linen and PVC ................................................................. 148
7.10Fingermark grading of fabrics visualised with VMD ......................... 149
7.11Target areas visualised by VMD ....................................................... 153
7.12The effect method of sample donation has on fingermark visualisation
with VMD ................................................................................................ 154
7.13Effect of metal type used during VMD on visualised fingermarks .... 160
7.14CAF Donor grading ........................................................................... 162
7.14.1 Nylon .............................................................................................. 163
7.14.2 Satin ............................................................................................... 165
7.14.3 Silk ................................................................................................. 166
7.14.4 Nylon/polyester, nylon-Lycra, viscose, linen, PVC and wool .................. 167
7.15Fingermark grading of fabrics visualised with CAF .......................... 168
7.16Target areas visualised by CAF ........................................................ 170
7.17Effect method of sample donation has on fingermark visualisation
with CAF .................................................................................................. 172
7.18Effect duration of CAF has on fingermark visualisation ................... 176
7.19Comparison of VMD and CAF ............................................................ 177
8. EFFECTS OF VARYING AMOUNTS OF WATER ON SAMPLES VISUALISED
WITH VACUUM METAL DEPOSITION (VMD) AND CYANOACRYLATE (CAF) 179
8.1 Aim ................................................................................................... 179
8.2 Introduction ..................................................................................... 179
8.3 VMD Study ....................................................................................... 180
8.3.1 VMD Treatment 1 – Dew .................................................................. 180
8.3.2 Results of individual donors .............................................................. 183
8.3.3 VMD Treatment 2 – moderate rain .................................................... 187
8.3.4 Results of individual donors .............................................................. 190
8.3.5 VMD Treatment 3 – heavy rain ......................................................... 193
8.3.6 Overall conclusion ............................................................................ 198
8.4 CAF study ......................................................................................... 199
8.4.1 CAF Treatment 1 - dew .................................................................... 199
8.4.2 CAF Treatment 2 – moderate rain ..................................................... 206
8.4.3 CAF Treatment 3 – heavy rain ........................................................... 210

xi
Overall effect of heavy rain on fabrics .................................................... 211
8.5 Statistical analysis of the effect of varying levels of water on the
fingermark visualisation using VMD and CAF. ......................................... 214
8.6 Comparison of VMD and CAF ............................................................ 220
8.7 Hydrophobicity and hydrophilicity of fabrics ................................... 222
8.8 Effect of washing on fabric surface texture ..................................... 225
8.8.1 Effect of water on the fabrics used in this study ................................. 228
9. DEPLETION SERIES WITH COMPARATIVE VISUALISATION TECHNIQUES
…………………………………………………………………………………………..231
9.1 Aim ................................................................................................... 231
9.2 Results and discussion ..................................................................... 231
9.2.1 Day 1.............................................................................................. 232
9.2.2 Day 3.............................................................................................. 233
9.2.3 Day 7.............................................................................................. 234
9.2.4 Day 28 ............................................................................................ 234
9.3 Statistical analysis of SPR, ninhydrin, dry DFO and fluorescent powder
and their effectiveness in fingermark visualisation. ............................... 235
9.4 Conclusion ....................................................................................... 237
10. COLD CASE STUDY ............................................................................... 238
10.1Aim ................................................................................................... 238
10.2Background ...................................................................................... 238
10.3Results and discussion ..................................................................... 238
10.4Statistical analysis of VMD and CAF visualisation of fingermark
visualisation on fabric samples where the samples are between 2.8 and
4.5 years old. .......................................................................................... 242
11. COLLABORATIVE WORK ....................................................................... 245
11.1Optimising touch deoxyribonucleic acid (tDNA) recovery and analysis
from fabrics and clothing ........................................................................ 245
11.1.1 Aim ................................................................................................ 245
11.1.2 Background ..................................................................................... 245
11.1.3 tDNA recovery from fabrics ............................................................... 249
11.1.4 Effect of VMD on tDNA recovery and profiling on nylon samples .......... 249
11.1.5 Effect of VMD on tDNA recovery and profiling on items of clothing ....... 252
11.1.6 Direct PCR of polyester samples ........................................................ 257
11.1.7 Overview of VMD on the recovery and profiling of DNA from fabrics and
clothing ...................................................................................................... 258

xii
11.2Blind Trial using Vacuum Metal Deposition (VMD) and Cyanoacrylate
Fuming (CAF) on Fabric Swatches .......................................................... 259
11.2.1 Aim ................................................................................................ 259
11.2.2 Background ..................................................................................... 259
11.2.3 Results and discussion...................................................................... 260
12. NOVEL APPROACHES ........................................................................... 266
12.1Sputter coater and Adroit FC-3000 .................................................. 266
12.1.1 Three Days Old ................................................................................ 268
12.1.2 One day old .................................................................................... 268
12.1.3 Zero days old .................................................................................. 269
12.2Nanoparticles ................................................................................... 273
12.2.1 Aim ................................................................................................ 273
12.2.2 Introduction .................................................................................... 273
12.2.3 Nanoparticle production ................................................................... 276
13. CONCLUSIONS ..................................................................................... 280
13.1Visualisation of latent marks ........................................................... 280
13.2Sequential treatment of samples ..................................................... 280
13.3Fabric type ....................................................................................... 281
13.4Donors ............................................................................................. 281
13.5Palmar flexion creases ..................................................................... 282
13.6Age of mark...................................................................................... 282
13.7DNA recovery ................................................................................... 282
13.8Recording of ridge detail .................................................................. 283
13.9Effect of moisture on detail observed .............................................. 283
13.10 Original contribution ................................................................. 283
14. FUTURE WORK ..................................................................................... 285
14.1To determine if the use of a one-step fluorescent cyanoacrylate will be
effective on fabric and solve the problem of back ground fluorescence
from the dye portion of the CAF process. ................................................ 285
14.2The use of an alternative to BY40 for the staining of the CA polymer
……………………………………………………………………………………….287
14.3Lifting marks visualised on fabrics using VMD or CAF or a combination
of the two, to see if this can combat the problem that the weave pattern of
the fabric causes on the recording of fingermark ridge detail observed . 288
14.4Investigate and refine the use of FFT and IR imaging in relation to
visualising fingermarks on fabric ............................................................ 289

xiii
14.5Examine, in much more detail the fingerprint residues themselves and
how they interact with the fabrics, how much they penetrate into the
surface of the fabric, as well as how they spread across the surface ..... 290
It would be interesting and helpful to work out exactly what was
happening with the fingermarks after they were deposited on to each
fabric type, as this might help the operator decide which visualisation
technique would be most suitable to use on the specific item being
examined. ............................................................................................... 290
14.6To investigate the use of the Adroit FC-300 and metal sublimation to
determine whether identifiable latent marks can be visualised on fabrics.
……………………………………………………………………………………….290
15. REFERENCES ........................................................................................ 292
16. APPENDICES ........................................................................................ 312
16.1Appendix 1 - DNA data from Ignacio Quinones Garcia .................... 312
16.2Appendix 2 - Publications ................................................................ 321
16.2.1 Visualisation of fingermarks and grab impressions on fabrics. Part 1:
Gold/zinc vacuum metal deposition. .............................................................. 321
16.2.2 Visualisation of fingermarks and grab impressions on dark fabrics using
silver vacuum metal deposition. .................................................................... 325
16.2.3 A comparison of the use of vacuum metal deposition versus cyanoacrylate
fuming for visualisation of fingermarks and grab impressions on fabrics. .......... 331
The published articles in pages 321-337 have been removed to comply with UK Copyright Law
1
1. INTRODUCTION
1.1 Background to fingerprints and fingermarks
1.1.1 Fingerprint history
Hand and fingermarks have been used for centuries as identifying marks, for
example as signatures of individuals who did not know how to write. Ancient
earthenware, thought to be at least 6000 years old was found to bear clear prints
containing ridge detail and in ancient China documents were sealed with string and
clay discs, which would have the author’s name stamp on one side and their
fingermark on the other (Barnes 2011). Pepper (2010) states that Nehemiah Grew
was the first Western individual to describe the ridge patterns on the palms and soles
in his 1684 paper. However, in 1687 Marcello Malpighi published a treatise,
“Concerning the External Tactile Organs”, in which he discussed friction ridge skin and
how it helped humans to grasp and walk. It was not until J. C. A. Mayer in 1788 that
the friction ridge individuality and uniqueness was discussed “Although the
arrangement of skin ridges is never duplicated in two persons, nevertheless the
similarities are closer among some individuals. In others the differences are marked,
yet in spite of their peculiarities of arrangement all have a certain likeness” (Barnes
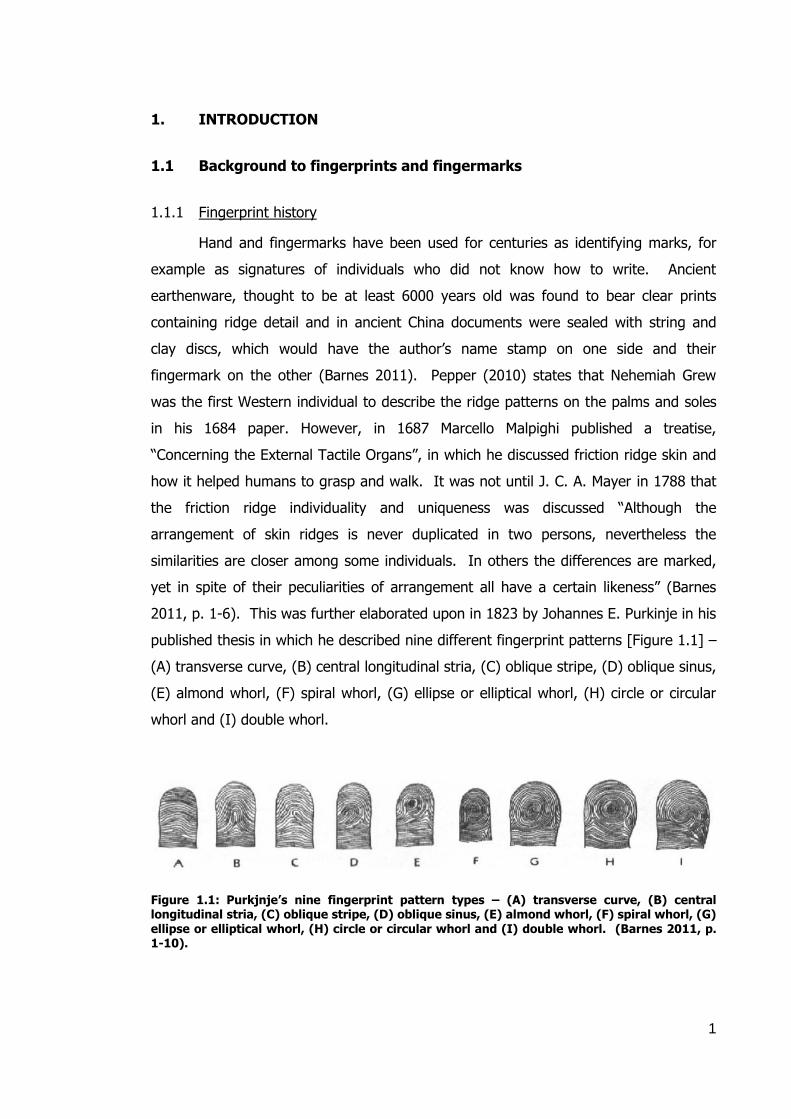
2011, p. 1-6). This was further elaborated upon in 1823 by Johannes E. Purkinje in his
published thesis in which he described nine different fingerprint patterns [Figure 1.1] –
(A) transverse curve, (B) central longitudinal stria, (C) oblique stripe, (D) oblique sinus,
(E) almond whorl, (F) spiral whorl, (G) ellipse or elliptical whorl, (H) circle or circular
whorl and (I) double whorl.
Figure 1.1: Purkjnje’s nine fingerprint pattern types – (A) transverse curve, (B) central longitudinal stria, (C) oblique stripe, (D) oblique sinus, (E) almond whorl, (F) spiral whorl, (G) ellipse or elliptical whorl, (H) circle or circular whorl and (I) double whorl. (Barnes 2011, p. 1-10).

2
However, it was not until 1880 and the work carried out by Dr Henry Faulds
that these patterns were considered of use in identifying individuals. Faulds witnessed
that different patterns could be observed on the fingers and that even if the outer
layers of the skin on the fingertips were removed they would regrow as the skin
recovered from the injury. Thus, the fingerprints were persistent and unchanging, so
could be used for identification purposes in criminal cases. Sir William Herschel agreed
that fingerprints were unchanging, even taking his own prints during his adult lifetime.
He also noted that prints could be used for identification purposes. At the time (1858)
he was working as a Civil servant in India and he would have employees leave their
handprint on the back of their contract, so each individual could be distinguished when
they came to collect their pay. He also got prisoners to leave their fingermark next to
their name in order to prevent others serving the prison sentence in place of the guilty
person (Pepper 2010; NSTC 2006; Gaensslen, Harris and Lee 2008). In 1892 Sir
Francis Galton published a book, “Finger Prints” and described how to classify
fingermarks using different pattern types and minutiae (Galton details). He also
believed that prints were unchanging, and thus could be used to identify individuals
and he even calculated that the likelihood of two individuals having the same
fingerprints was “64 million to 1” (Jackson and Jackson 2011, p. 108). It was the work
carried out by Galton and Faulds that led Sir Edward Henry, along with Azizul Haque
and Hem Chandra Bose, to develop a system of classification, using the three basic
fingerprint types (loops, arches and whorls) augmented by minutiae or Galton details.
In 1901 Henry became an assistant commissioner at the Metropolitan Police where his
system was used by the newly set up fingerprint bureau. Previously a combination of
Bertillonage, a system of 11 body measurements, such as arm length, head size and
arm span as well as Galton’s system was being used, though this was deemed
unsatisfactory. It was a year later, in 1902, that fingermark evidence was first
recorded in the case of a robbery where Harry Jackson was identified from a mark left
in fresh paint which indicated that he had been at the house (he had been in prison
before therefore could be identified from his records). By the 1930s the Henry system
of the 10 print cards, which gave a permanent record of all 10 fingertips and marks,
was being used worldwide by over 50 bureaux. A modified version of this system is
still in use in Britain today, though has now become computerised in the form of
IDENT1 and LiveScan. Though in other parts of the world it was Juan Vucetich’s
system that was used – Vucetich studied Galton’s work and devised a classification
system that was used to individualise and identify criminals and prisoners. An example

3
of the use of fingermarks to solve a case is the 1892 case of Francisca Rojas – her two
children were murdered and she had her throat cut. Francisca blamed a man she had
spurned, however a bloody thumbmark was found at the crime scene and identified as
being Francisca’s and she confessed that it was in fact her that had murdered both her
children and cut her own throat (Barnes 2011). Through history there have been
several cases where fingermarks have been the only or most significant evidence used
to convict – 1902 Alphonse Bertillon identified Henri Leon Scheffer as the murderer of
Joseph Reibel from some bloody fingermarks on a broken glass panel; in 1905 the case
of Alfred and Albert Stratton was the first case in England where fingermark evidence
was used to convict the brothers of double murder on eyewitness testimony and
Alfred’s thumb mark on a cashbox and its 11 points of comparison and the 1911
burglary case of Crispi who was convicted on a fingermark on a pane of glass (Barnes
2011). All of these cases illustrate the uniqueness of fingerprints and the effectiveness
in which their identification can help solve crimes and is still relevant even to this day.
It should be stressed however, that the presence of fingermarks at a locus does not
indicate or prove criminal activity, only that the person has been at this location to be
able to leave their fingermarks there. Research in the area of fingermarks has been
around for centuries and will be for many years to come with the advancement of
commonly used fingermark visualisation techniques and discovery of new methods of
fingermark enhancement.
1.1.2 Skin formation
Humans all have the same skin structure consisting of epidermis [Figure 1.2],
dermis and subcutaneous layers, which over most of the body, is relatively smooth.
However, notable exceptions are the palms and fingers of the hand as well as the sole
and toes of the feet. These areas are called friction skin and though they appear
different to the rest of the skin surface, due to their ridged appearance, they are
composed of the same structural units.
The epidermis is the top layer and comprises five flattened or squamous
epithelial layers – the stratum corneum, stratum lucidum, stratum granulosum, stratum
spinosum and stratum germinativum. The stratum corneum, also known as the horny
layer, is the thickest of the layers composing of approximately 30 layers of dead
flattened keratinised cells that do not contain a nucleus. As this is the top layer of skin
it is continually shedding cells and these are replaced by cells from the layers below

4
(Godfrey 1992; Droual 2012). This layer forms a barrier to protect the layers below
from chemicals, infection and the skin drying out (Girod, Ramotowski and Weyermann
2012). The stratum lucidum layer is not present everywhere but usually found in the
areas of thicker skin, such as the soles and palms. The cells are again flattened, may
not contain nuclei and are transparent. Therefore, this layer will be present in the
hands and will be part of the friction ridge skin. The stratum granulosum is usually
only about 4 layers thick and contains granular cells, which contain a precursor to
keratin and may still have nuclei and other cell bodies and this is considered to be
where cells start to die. The stratum spinosum or prickle cell layer (due to the being
covered by fibrils), is thinner and the cells are starting to become flattened. The final
layer of the epidermis is the stratum germinativum also known as the basal or
malpighian layer, which is a single layer of cells that are still actively dividing, contain
nuclei and are in direct contact with the dermis.
Figure 1.2: Layers of the epidermis, showing structural order starting at the skin’s surface with the stratum corneum, then stratum lucidum, stratum granulosum, stratum spinosum, stratum germinativum and finally, the dermis (Droual 2012).
The dermis comprises of two layers containing all the blood vessels, nerves and
sebaceous and sweat glands – the papillary layer, which contain papillae that help with
exchange of oxygen, nutrients as well as waste and the reticular layer, containing
fibroblasts, mast cells, collagen, elastin and reticulum which help the skin stay supple,
resilient as well as keeping the dermis connected to the epidermis.
5
The subcutaneous layer is the final layer and is positioned close to the internal
organs, thus allowing for the skin to move over these organs and it comprises of fat
cells and connective tissue (Godfrey 1992; Droual 2012).
1.1.3 Formation of finger and palm prints
Fingerprints are formed in the womb and are unique and unchanging
throughout a human’s life, only increasing in size from child to adulthood. The only
other alterations that may occur are through deep injury or disease. By the fourth
week of gestation a recognisable hand starts to form, as opposed to the paddle like
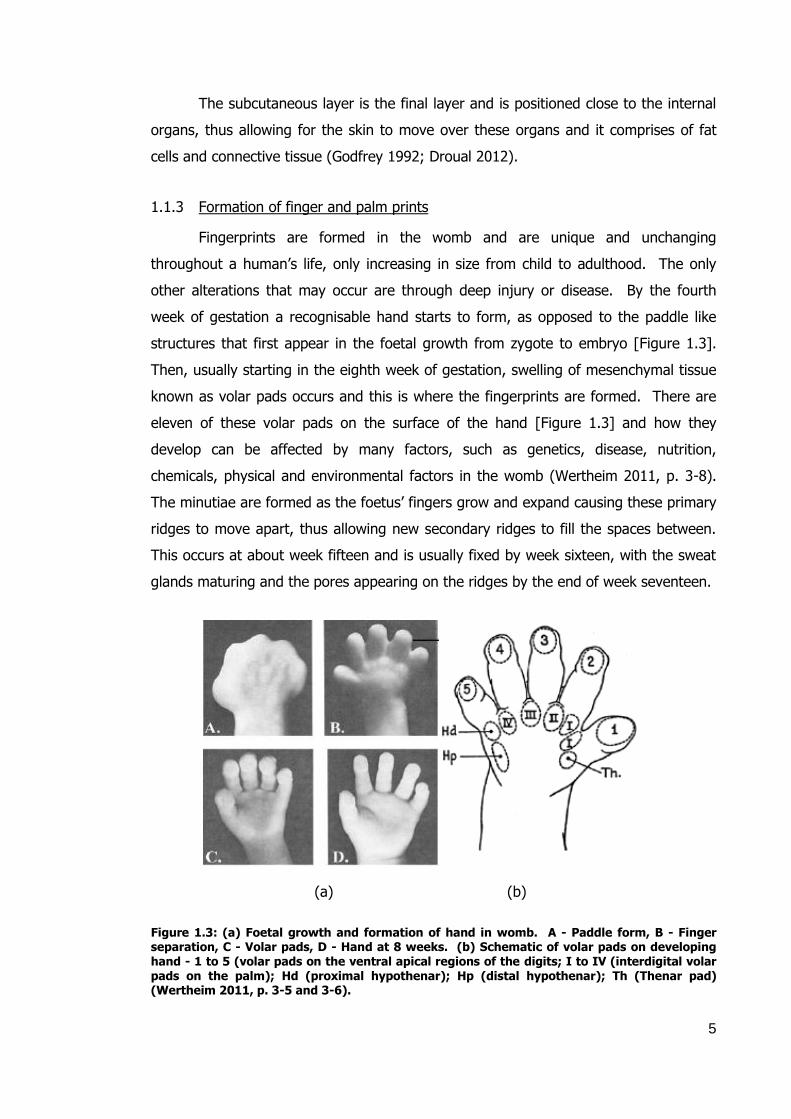
structures that first appear in the foetal growth from zygote to embryo [Figure 1.3].
Then, usually starting in the eighth week of gestation, swelling of mesenchymal tissue
known as volar pads occurs and this is where the fingerprints are formed. There are
eleven of these volar pads on the surface of the hand [Figure 1.3] and how they
develop can be affected by many factors, such as genetics, disease, nutrition,
chemicals, physical and environmental factors in the womb (Wertheim 2011, p. 3-8).
The minutiae are formed as the foetus’ fingers grow and expand causing these primary
ridges to move apart, thus allowing new secondary ridges to fill the spaces between.
This occurs at about week fifteen and is usually fixed by week sixteen, with the sweat
glands maturing and the pores appearing on the ridges by the end of week seventeen.
(a) (b)
Figure 1.3: (a) Foetal growth and formation of hand in womb. A - Paddle form, B - Finger separation, C - Volar pads, D - Hand at 8 weeks. (b) Schematic of volar pads on developing hand - 1 to 5 (volar pads on the ventral apical regions of the digits; I to IV (interdigital volar pads on the palm); Hd (proximal hypothenar); Hp (distal hypothenar); Th (Thenar pad) (Wertheim 2011, p. 3-5 and 3-6).

6
The type of fingerprint that develops is dependent on the shape of the pads
and the stresses caused by the growth and development of the hands – whorls and
arches form symmetrical volar pads, with whorls forming from high round pads, while
arches are produced from low pads. The ridges form around the centre or core of the
volar pad and work outwards toward the edge of the finger. Loops form when the
volar pads are asymmetric [Figure 1.4]. The three types of fingerprints, whorls, loops
and arches form specific patterns though Babler (1987) comments that it is more to do
with the width of the volar pads, where a small difference (9 mm) can produce a
change from a radial loop to an ulnar loop. There is also the theory that the patterns
are due to growth stresses and the folding of the basal layer in the epidermis (Kücken
and Newell 2005).
(a) (b) (c)
Figure 1.4: Formation of fingerprint types from volar pads: (a) a low pad will lead to the formation of an arch, while (b) a high pad will produce a whorl and (c) an intermediate pad will lead to a loop being formed (Martijn 2012).
Whorls account for approximately 35 % of fingerprints and can be sub-
classified into plain, central pocket loop, double loop and accidental whorl [Figure 1.5].
Whorls have the ridges circling the core of the print and have two deltas. The plain
whorl has at least one ridge completely circling its core; a central pocket loop whorl
has two deltas, but does not have a ridge encircling the core; the double loop whorl or
twinned loop has two loops intertwined; and the accidental whorl is made up of a
combination of the three other whorl types or a print that does not fit into any other
fingerprint category. Loops account for approximately 60 % of fingerprints and have
at least one ridge entering from one side, recurving and exiting from the same side, a
minimum of one ridge count (number of ridges between the core and delta), only one
delta and a core. There are two types of loops - ulnar (the open section of the loop
points to the ulnar bone, at the little finger side of the hand) and radial loops (the open
section of the loop points to the radial bone, the thumb side of the hand). Arches
account for approximately 5 % and have their ridges entering from one side and
exiting from the other, this type of print has no deltas. There are two types of arches

7
– plain and tented. Plain arches form a smooth flow of ridges from one side of the
print to the other, while tented arches form an arch of about 90 ° or have a central
ridge pointing upwards in the centre of the print (Davey 2003; Barnes 2011; Jackson
and Jackson 2011).
Figure 1.5: The eight general fingerprint pattern types of plain arch, tented arch, ulnar loop, radial loop, plain whorl, central pocket whorl, double loop whorl and accidental whorl (FBI 2012).
There are three levels in finger identification – level 1 detail, which is the
fingerprint type; level 2, which is the Galton detail or minutiae; and finally level 3,
which includes the palmar flexion creases, number of pores, their location and shape
as well as the size and shape of ridges (Gaensslen, Harris and Lee 2008). There are
many types of minutiae [Figure 1.6] – ridge ending, bifurcation, island or independent
ridge, spur, lake and crossover. A ridge ending is where the ridge stops; a bifurcation
is where one ridge splits into two ridges; an island or independent ridge is a short
ridge; a spur is where a ridge has a small ridge extending from it; a lake is where a
ridge splits and then re-joins again and finally a crossover is where two ridges are
joined by a smaller ridge.

8
Figure 1.6: Fingermark containing four types of minutiae as well as a delta, a pore and a core. The minutiae are: a crossover, where one ridge joins another; a bifurcation, where the ridge splits into two; a ridge ending, where the ridge stops; an island, which is an extremely small short ridge; the core is the centre of the print; while the delta is a point on the print at or near to where two ridges diverge; and the pore is where the fingerprint residues are released onto the surface of the skin (Alga 2002).
The formation of the lines on the palm also occurs during gestation between
weeks six and eleven, when the creases form between the volar pads and it is thought
to be caused by the foetus grasping its hands. There are several different lines formed
on the palms, such as vestiges on the thena, which flow at right angles to the rest of
the ridges on the palm and flexion creases. They are split into three main types –
major flexion creases, minor flexion creases and secondary creases. The major
creases are, as the name suggests, the largest creases on the hand and they run
transversely across the palm. These three creases are called the thenar or radial
transverse (also known as the life line), proximal transverse (the head line) and distal
transverse creases (the heart line). They can appear as deep solid lines or made up of
smaller creases (accessory creases). The minor creases are not always present or
pronounced as the major creases and can be split into several types: minor flexion
creases; longitudinal or finger creases, which run from the base of the fingers to the
wrist; accessory distal transverse creases and the hypothena crease; finally the
secondary creases are all the other creases on the palm (Davey 2003; Dhananjay,
Guru Rao and Muralikrishna 2011). Palm marks are also useful in the sense that they
are larger than fingermarks so they too can be used for identification purposes as they
contain a lot of information – palmar flexion creases, principal lines, deltas, ridges and
pores (Nibouche and Jiang 2013).
9
As well as having different classifications of marks there are also three different
types of marks – visible, plastic and latent. Visible marks are those that can be seen
by the naked eye and therefore do not need any form of enhancement. They can be
formed by an individual transferring paint, blood, oil, cosmetics or other substances
from one substrate to another via their fingertips and leaving a mark on a substrate.
Plastic marks are formed when an individual leaves an impression of their mark in a
soft substance such as putty, food or wax. These marks form a three dimensional
impression of the person’s fingertip and therefore ridge detail. Consequently they do
not generally need enhancement, though in some cases enhancement may make the
mark more obvious. Finally, latent marks are marks that are not visible to the naked
eye and need to be enhanced in some way to make them visible using suitable
lighting, physical or chemical treatments (Gaensslen, Harris and Lee 2008).
1.1.4 Composition of fingerprint residues
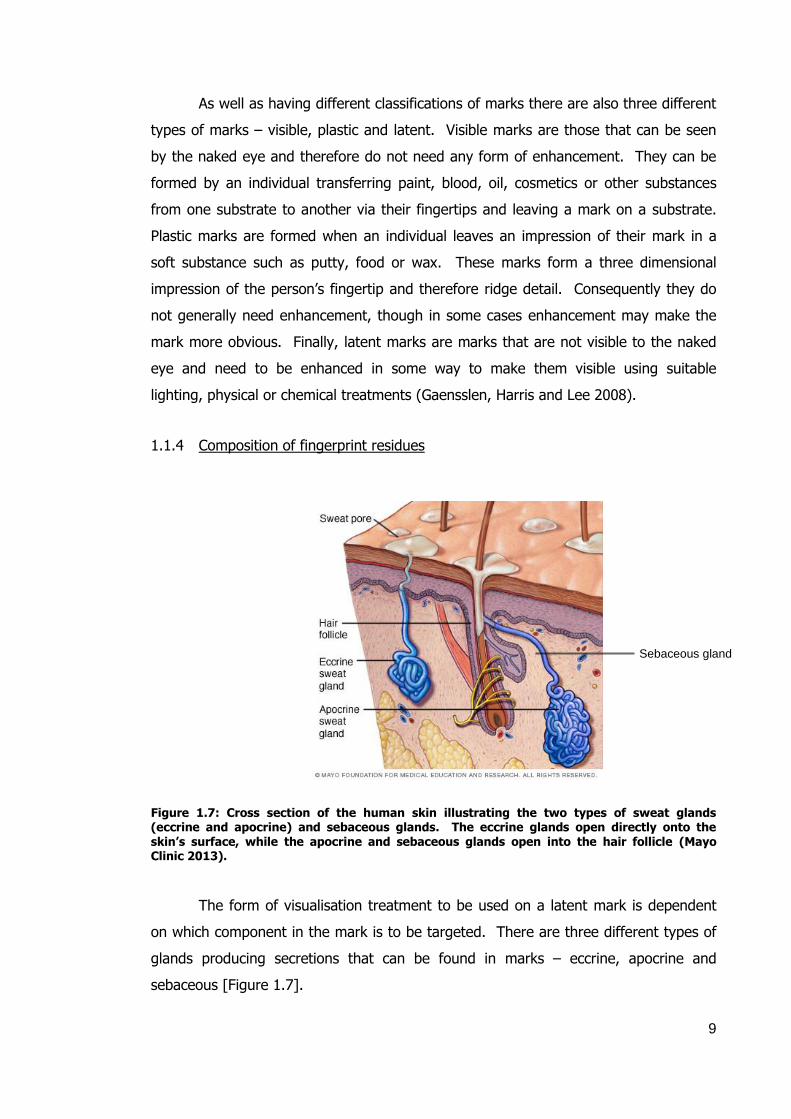
Figure 1.7: Cross section of the human skin illustrating the two types of sweat glands (eccrine and apocrine) and sebaceous glands. The eccrine glands open directly onto the skin’s surface, while the apocrine and sebaceous glands open into the hair follicle (Mayo Clinic 2013).
The form of visualisation treatment to be used on a latent mark is dependent
on which component in the mark is to be targeted. There are three different types of
glands producing secretions that can be found in marks – eccrine, apocrine and
sebaceous [Figure 1.7].
Sebaceous gland
10
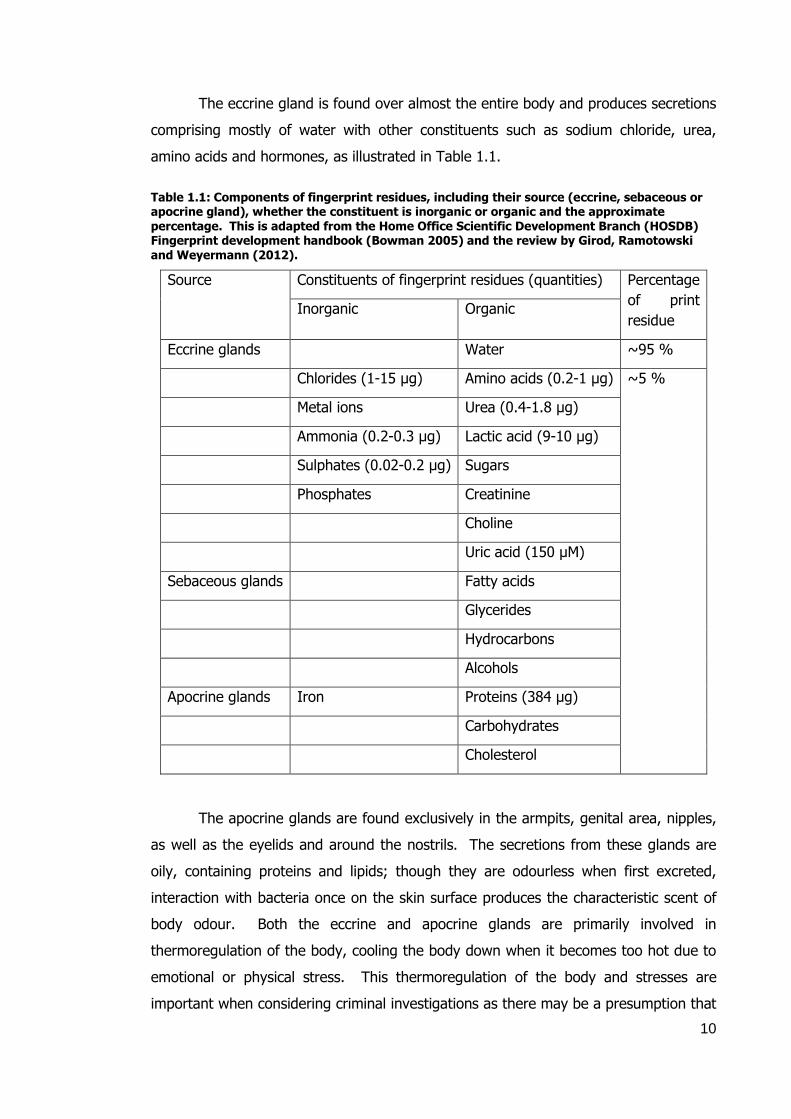
The eccrine gland is found over almost the entire body and produces secretions
comprising mostly of water with other constituents such as sodium chloride, urea,
amino acids and hormones, as illustrated in Table 1.1.
Table 1.1: Components of fingerprint residues, including their source (eccrine, sebaceous or apocrine gland), whether the constituent is inorganic or organic and the approximate percentage. This is adapted from the Home Office Scientific Development Branch (HOSDB) Fingerprint development handbook (Bowman 2005) and the review by Girod, Ramotowski and Weyermann (2012).
Source Constituents of fingerprint residues (quantities) Percentage
of print
residue Inorganic Organic
Eccrine glands Water ~95 %
Chlorides (1-15 µg) Amino acids (0.2-1 µg) ~5 %
Metal ions Urea (0.4-1.8 µg)
Ammonia (0.2-0.3 µg) Lactic acid (9-10 µg)
Sulphates (0.02-0.2 µg) Sugars
Phosphates Creatinine
Choline
Uric acid (150 µM)
Sebaceous glands Fatty acids
Glycerides
Hydrocarbons
Alcohols
Apocrine glands Iron Proteins (384 µg)
Carbohydrates
Cholesterol
The apocrine glands are found exclusively in the armpits, genital area, nipples,
as well as the eyelids and around the nostrils. The secretions from these glands are
oily, containing proteins and lipids; though they are odourless when first excreted,
interaction with bacteria once on the skin surface produces the characteristic scent of
body odour. Both the eccrine and apocrine glands are primarily involved in
thermoregulation of the body, cooling the body down when it becomes too hot due to
emotional or physical stress. This thermoregulation of the body and stresses are
important when considering criminal investigations as there may be a presumption that

11
a person involved in criminal activity may experience heightened emotions or stresses,
which in turn may lead to increased levels of secretions. Therefore, marks left at a
crime scene may contain higher levels of the secretions from the eccrine and apocrine
glands. Eccrine and apocrine glands also excrete waste products, which can include
drugs and their metabolites. Thus drugs can be detected in latent marks and this has
been extensively researched. For example, Day et al. (2004) detected several drugs
including codeine phosphate, cocaine hydrochloride, caffeine and Paracetamol in
cyanoacrylate (CAF) visualised marks; while Hazarika, Jickells and Russell (2008) found
cotinine in smoker’s latent marks and the Ng et al. (2009) study detected caffeine in
marks.
The sebaceous glands produce sebum, which is involved in keeping the skin
supple, helps in waterproofing and prevents bacterial growth. These glands are
usually connected to hair follicles and are mostly on the face and scalp, though they
can be found in other areas such as the nose, eyelids and genitals.
Therefore, the main components of latent marks, a mixture of water, oils from
the body and hair as well as contaminants, such as foodstuffs and make-up are
released onto the skin from the sweat pores. These secretions are transferred from
the fingers and/or palm onto substrates and, consequently, marks are deposited, and
can be visualised and recorded.
The need to consider the composition of the marks is important as once they
are deposited on a substrate the levels of the components can change. Water
evaporates, while other components degrade, therefore it is important to understand
this, as well as the substrate type, when the process of visualisation is considered
(Champod et al. 2004). There are several factors, such as the individual’s health,
profession, age and even sex, which can influence the level of residues deposited onto
a substrate. Then, once the residues have been deposited environmental factors, such
as temperature, humidity and the time they are on the substrate can also affect the
levels and how long they remain on the substrate (Ramotowski 2001; Yamashita and
French 2011). Therefore not everyone will leave the same levels of the components
expected to be found in a fingermark, and the environment will have an effect on the
levels and how long they can be detected in the mark. For example, the levels of fatty
acids in the sebum and therefore in latent marks varies with the age of the person. In
infants the levels of fatty acids are 1.5 %, rising to 20-23 % in children under 4 and
dropping to 16-19 % in adolescents and those under 45. The same can be seen with

12
other lipids, such as glycerides, fatty esters and cholesterol in sebaceous secretions,
which all change in levels throughout a person’s lifetime (Yamashita and French 2011).
Porous substrate (I)
(a) (b) (c)
Nonporous substrate (II)
(a) (b)
Figure 1.8: Ageing of latent fingermarks showing the effect of time on the residues deposited on I a porous substrate: I(a) immediate deposition; I(b) minutes/hours after deposition; I(c) weeks/months after deposition and II(a) on a nonporous substrate immediately after deposition and II(b) weeks/months after deposition (adapted from Champod et al. 2004, p. 110).
Latent marks left on substrates consist of a combination of the secretions of all
the different glands in the skin. The largest component, as illustrated by Table 1.1 on
page 10, is water and this will start to evaporate as soon as the mark is deposited,
leaving the other components, such as the water-soluble salts and amino acids as well
as the water-insoluble proteins and lipids. It is these components that the different
Fingerprint residue immediately
after deposition
Fingerprint residue
weeks/months after deposition
Fingerprint residue immediately
after deposition
Water-insoluble
component
Water-soluble component
Minutes/hours after deposition
Water-insoluble
component
Amino
acids
Urea, salts
etc.
Weeks/months after
deposition

13
visualisation techniques target, such as powders for water, ninhydrin for the amino
acids and physical developer for the lipids (Yamashita and French 2011). The precise
location of the components depends on the porosity of the substrate, for example, on
a porous substrate the water-soluble components will soak in, while the water-
insoluble components will sit on the surface of the substrate. With a nonporous
substrate all the components will sit on the substrate’s surface and be affected by
evaporation rather than being absorbed by the substrate [Figure 1.8] (Champod et al.
2004).
Fabrics are generally considered to be porous substrates though this depends
on the chemical composition of the fabric and whether it is natural or manmade.
These factors will dictate how absorbent the fabric is and thus how much of the
fingerprint residue will be absorbed into the fabric or remain on the substrate’s surface.
The rate at which the residues evaporate from the surface of the substrate is
dependent on its porosity as well as on several environmental factors, such as
humidity, sunshine, wind and temperature (Champod et al. 2004). Over the first two
weeks of mark deposition there can be up to an 85 % reduction in weight and this is
primarily due to loss of water and then the remainder of the components are subject to
such processes as degradation, migration and oxidation (Girod, Ramotowski and
Weyermann 2012). Holyst (1987, cited in Champod et al. 2004, p. 199-201) stated
that ageing and thus lifetime of a mark is dependent on many factors: temperatures,
low humidity, light exposure and even dust. Also, a mark may last 15 times longer
when kept indoors rather than outdoors and that greasy marks last five times longer
than sweaty marks. How much of each component is lost is dependent in some part
on the substrate as marks tend to stay best on nonporous smooth substrates, such as
glass, metal and plastics. However, residues that are on a non-porous surface can be
more easily wiped or washed off that substrate than residues that have penetrated to
some degree into the substrate. This again is reinforced by the Girod, Ramotowski and
Weyermann (2013) review where the combined studies showed that on porous
substrates, such as paper and cotton, eccrine secretions are absorbed easily into the
substrate, whereas sebaceous secretions are absorbed more slowly. Semi-porous
substrates, such as plastics and glossy paper absorb eccrine secretions more slowly
than on porous substrates and sebaceous secretions were extremely slow to be
absorbed. On nonporous substrates, such as metal and glass, both eccrine and
sebaceous secretions remain on the substrate’s surface until biological, chemical or

14
physical degradation occurs. Research into environmental effects on latent
fingermarks has been carried out for decades and advances made into mark survival
under different conditions and substrate surfaces. Barnett and Berger (1977)
investigated the effect of temperature and different levels of humidity. Their study had
a one day to 7 week timeline with marks being deposited on glass microscope slides,
dusted, lifted and graded by two individuals. Overall, there was a significant difference
between the natural or clean marks and the loaded or greased marks as well as dirty
marks, with the clean hands scoring higher. They also found that the number of
useable good marks decreased during the timeline and that high humidity impacted
poorly the grade the marks achieved, whereas low humidity did not seem to cause a
detrimental effect. Interestingly, temperature (20 °C and 30 °C) did not seem to have
a significant effect on the difference between marks that were developed immediately
and the overall score during the whole timeline. The effect of moisture in the form of
humidity, dew and rain may also be influential. Johnson (1973) determined that high
humidity may prevent or slow evaporation of water from the mark or even prevent
development of the mark, whereas low humidity may speed evaporation of the mark.
Rain, however, can wash away fingerprint residues or prevent a mark from being
deposited if the substrate is wet. Dew dissolves enough of the water-soluble residues
in a mark, causing it to be diminished and/or distorted. This causes them to be diluted
and spread over the substrate’s surface; however, if the mark is laid onto a dew
soaked substrate it may not adhere to the surface at all.
Overall, there are many factors that need to be considered when attempting to
visualise fingermarks and grab marks from a variety of substrate types. It can be
concluded that secretions on fabrics will be absorbed and therefore less detail
visualised. However, as discussed in the section 1.2.1, fabrics will have different
porosities due to their chemical and physical composition and latent fingermarks on
fabrics will be affected by environmental conditions, donor deposits as well as
contaminants on the donor’s hands.
1.1.5 Permanency and uniqueness of prints
As discussed previously, fingerprints are formed in the womb, are unchanging
throughout a person’s life and are unique to each person; even identical twins do not
have the same fingerprints. Two papers published in Pattern Recognition (Jain,
Prabhakar and Pankanti 2002; Kong, A. W., Zhang, D. and Lu, G. 2006) discuss the
15
similarities in fingerprints and palmprints in relation to the use of biometric verification.
As identical twins result from the splitting of a single egg they have the same DNA,
thus will be extremely similar genetically but as they do not occupy the same position
in the womb they are exposed to different environmental factors, thus will develop
different fingerprints, palmar flexion creases, iris and retina. It has been found that
twins may share fingerprint types or have similar principal lines, for example if one
twin has a whorl on their ring finger, so might their twin, however the minutiae will not
be the same.
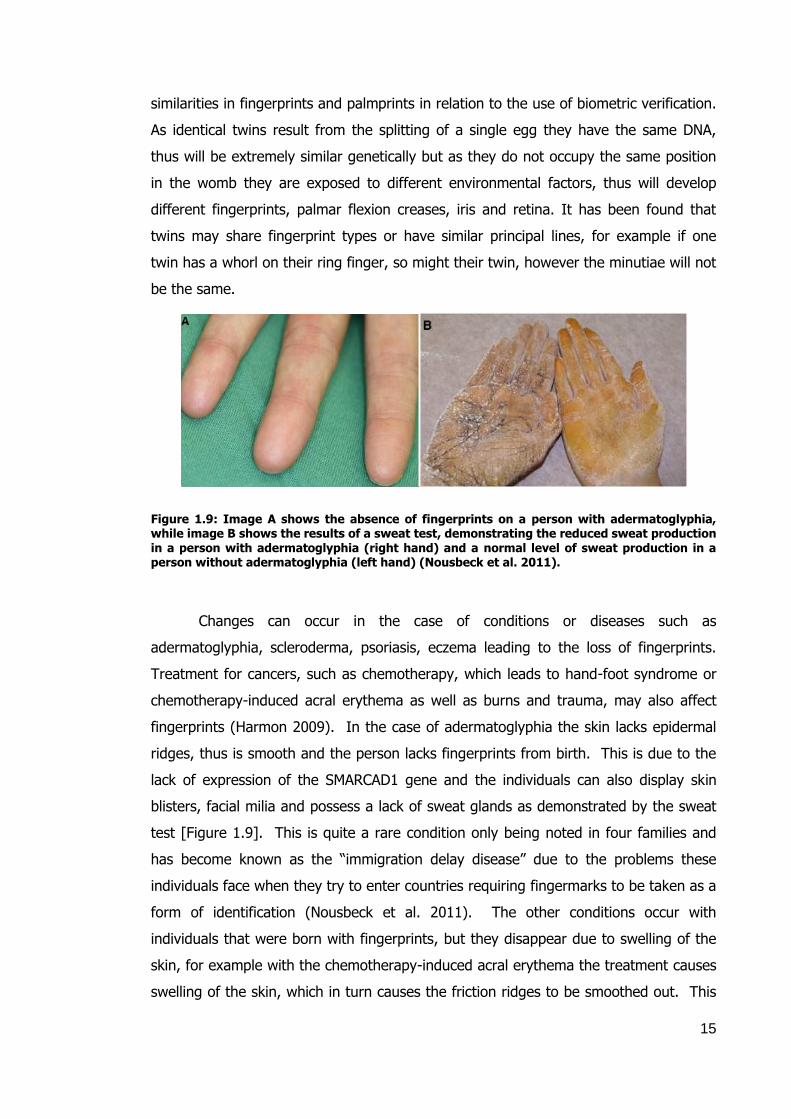
Figure 1.9: Image A shows the absence of fingerprints on a person with adermatoglyphia, while image B shows the results of a sweat test, demonstrating the reduced sweat production in a person with adermatoglyphia (right hand) and a normal level of sweat production in a person without adermatoglyphia (left hand) (Nousbeck et al. 2011).
Changes can occur in the case of conditions or diseases such as
adermatoglyphia, scleroderma, psoriasis, eczema leading to the loss of fingerprints.
Treatment for cancers, such as chemotherapy, which leads to hand-foot syndrome or
chemotherapy-induced acral erythema as well as burns and trauma, may also affect
fingerprints (Harmon 2009). In the case of adermatoglyphia the skin lacks epidermal
ridges, thus is smooth and the person lacks fingerprints from birth. This is due to the
lack of expression of the SMARCAD1 gene and the individuals can also display skin
blisters, facial milia and possess a lack of sweat glands as demonstrated by the sweat
test [Figure 1.9]. This is quite a rare condition only being noted in four families and
has become known as the “immigration delay disease” due to the problems these
individuals face when they try to enter countries requiring fingermarks to be taken as a
form of identification (Nousbeck et al. 2011). The other conditions occur with
individuals that were born with fingerprints, but they disappear due to swelling of the
skin, for example with the chemotherapy-induced acral erythema the treatment causes
swelling of the skin, which in turn causes the friction ridges to be smoothed out. This
16
does not occur with all patients and can be relieved by topical lotions and vitamin E
treatment (Hueso et al. 2008).
Nevertheless, even if an individual possess prints, which are permanent, the
quality of fingermarks left are affected by many things, such as dryness of skin, cuts,
scars, even contaminants on the skin, but a major factor is the effect of age. There
can be a reduction in ridges due to the person’s job, accidents, as well as an increase
caused by wrinkles from ageing. Thus there can be false minutiae that may be
temporary or that will become permanent, which in turn can affect the identification
due to alteration of the overall print. The prints are still unique to this person, though
they have changed in the sense that there may be an increase or decrease in detail.
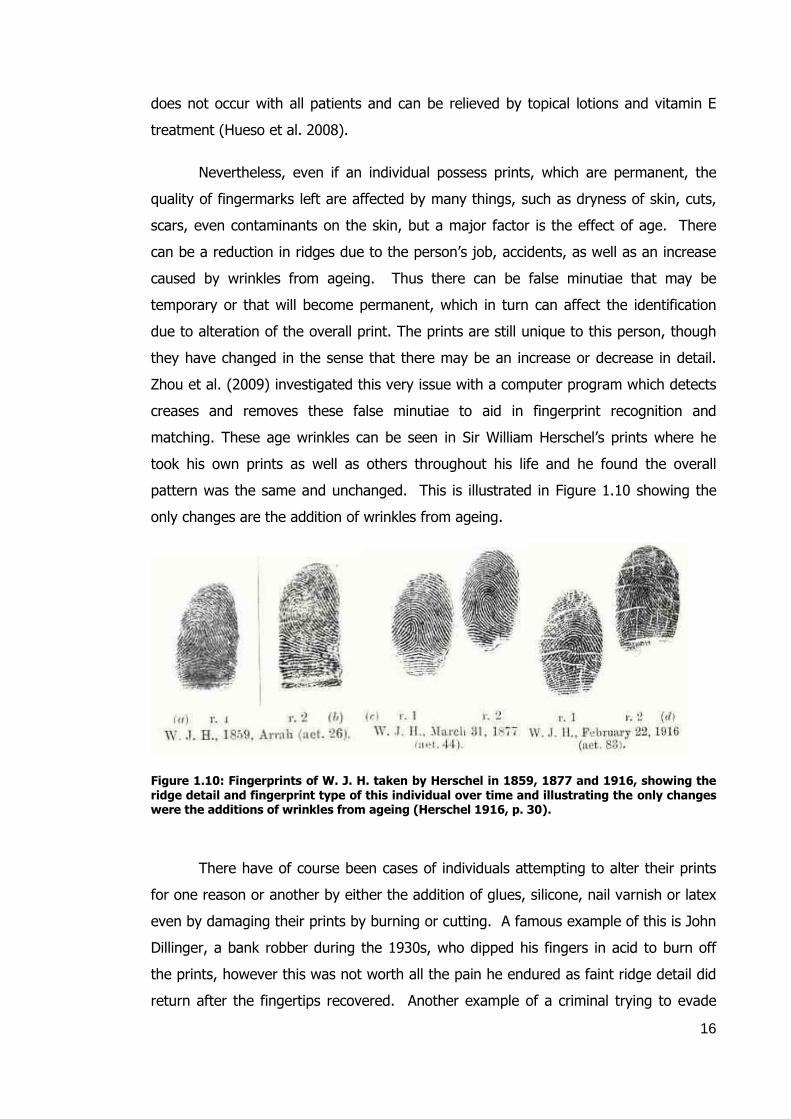
Zhou et al. (2009) investigated this very issue with a computer program which detects
creases and removes these false minutiae to aid in fingerprint recognition and
matching. These age wrinkles can be seen in Sir William Herschel’s prints where he
took his own prints as well as others throughout his life and he found the overall
pattern was the same and unchanged. This is illustrated in Figure 1.10 showing the
only changes are the addition of wrinkles from ageing.
Figure 1.10: Fingerprints of W. J. H. taken by Herschel in 1859, 1877 and 1916, showing the ridge detail and fingerprint type of this individual over time and illustrating the only changes were the additions of wrinkles from ageing (Herschel 1916, p. 30).
There have of course been cases of individuals attempting to alter their prints
for one reason or another by either the addition of glues, silicone, nail varnish or latex
even by damaging their prints by burning or cutting. A famous example of this is John
Dillinger, a bank robber during the 1930s, who dipped his fingers in acid to burn off
the prints, however this was not worth all the pain he endured as faint ridge detail did
return after the fingertips recovered. Another example of a criminal trying to evade

17
the authorities by altering his prints is Robert J. Philipps, who grafted skin from his
chest onto his fingers. Though this did obliterate his fingerprints he was identified by
the skin on his finger joints and the areas around the grafts. Nowadays though
criminals are still trying to obliterate their prints, as in the cases of drug dealer Marc
George who grafted skin from his soles to his fingers and Jose Izquierdo [Figure 1.11]
who performed a Z cut – triangular cuts to the fingertip, swapping the patches and
then stitching back together, but there seems to be many more people doing this to try
to avoid identification at border control. These changes involving Z cuts, altering with
lasers and swapping prints from one finger to another, which does of course change
the prints, but again makes them more individual and unique, thus identification is still
possible and in many cases the unusual appearance of the prints causes suspicion and
investigation (BBC 2012; Yoon, Feng and Jain 2012).
Figure 1.11: “Z” cut fingerprint of Jose Izquierdo. (A) showing his original fingerprint and (B) after being altered by cutting a “Z” shape where two parts of the skin are moved to form a different pattern (Yoon, Feng and Jain 2012).
1.1.6 Use of fingermarks and palms in identification
As previously stated a modified Henry’s 10 print system is still being used in
fingerprint identification systems, such as IDENT1 and LiveScan. All of these methods
use detail in the form of ridges, direction of flow, orientation, location, minutiae as well
as 3rd level detail, such as sweat pores and the spaces between the ridges, to lead to
identifications from 10 print cards and marks from scenes of crime. This is also the
case with information gleaned from palm marks which also contain friction ridges,
valleys and minutiae with palms also showing palmar flexion creases. The Australian
NAFIS is said to be the largest in the world and contains approximately 11 million palm
A B

18
marks (CRIMTAC 2011), while in the UK IDENT1 contains approximately 12 million
palm mark pairs (Wormack 2012). The use of palm marks in identifications is
important when you consider that about 30 % of all marks recovered from different
scenes of crime in America (Vacca 2007) and for the UK 20 % of all marks found in
2006 (Odyseos 2006) were palm marks, rising to 30 % in 2013 (Sutton et al. 2013).
Therefore the inclusion of palm print capture to fingerprinting systems has been added
to improve identifications. In 2001, the UK Police Information Technology
Organisation (PITO) organised the development of a National Automated Palm system
allowing all the police forces to be able to access palm mark records on a national
database (Hurst 2002). LiveScan is used by most UK police forces to electronically
record the marks of individuals arrested. These are then compared against the
database and have been reported as being over 98 % accurate, thus reducing the time
it takes to identify individuals involved in crimes (Pepper 2010).
1.2 Background to fabrics
Many crimes such as assaults, kidnapping and even theft involve fabrics at
some point with clothing being the most common fabric seen in forensic laboratories
(Adolf 1999). However, it is difficult to recover fingermarks from fabric due to the
nature of its surface. The Home Office fingerprint manual states there is no “proven
process” with fabrics for fingermark visualisation though it recommends that either
radioactive sulphur dioxide or CAF is used. (Note: although still recommended in the
most recently published manual the use of radioactive sulphur dioxide has been
discontinued on Health and Safety grounds). The manual also states that the fabrics
must have a minimum of three threads per millimetre, must not have been exposed to
rain nor have been worn next to the skin for more than two hours (Bowman 2005;
Fraser et al. 2011). The fabrics variously used in this study: cotton, polyester,
polycotton, nylon, satin, rayon viscose, linen, silk and nylon-Lycra were chosen as they
are commonly found in modern day clothing. Natural fabrics such as cotton are highly
hydrophilic allowing sweat to be absorbed into the fabric and then enabling
evaporation so ensuring the wearer stays cool and comfortable. Synthetic clothing,
such as nylon are more hydrophobic meaning the sweat will collect on its surface
making the wearer feel “clammy” (Wakelyn et al. 2007, p. 642). Therefore clothing
fabrics and their uses are based on these properties as well as appearance and
personal preference.

19
1.2.1 Fabric types
Cotton
Cotton is obtained from the shrub Gossypium, which is found in tropical and
subtropical areas of the world, such as China, India, America and Africa. It is a natural
cellulose fibre spun into tubular threads and then woven into cloth, from the protective
soft ball produced by the shrub to protect its seeds (Wakelyn et al. 2007; Nanal
2012a).
Cotton has been used since prehistoric times in the form of clothing and
accounts for approximately 38 – 50 % of all fibres used in the textile industry is still
the most used natural fibre in clothing (Wakelyn et al. 2007; Nanal 2012a). Due to the
properties of cotton it is used in many different clothing types ranging from hard
wearing denim and T-shirts to more delicate items such as dresses, shirts and
underwear. Cotton can be used on its own as well as being blended with other fibres,
such as polyester to increase durability and elastane to increase the stretchiness of the
fabric. Benefits of cotton are its softness, breathability, as well as its hydrophilic
properties which allow absorbency of water (to the core of the fibre), thus making it
easier to remove dirt and allowing an even absorbency of dye (FAO 2009; NCCA 2013).
Polyester
Polyester is a manmade fibre consisting of a long chain polymer usually formed
by the polymerisation of terephthalic acid (TA), and monoethyleneglycol (MEG) in the
presence of antimony trioxide and titanium dioxide [Figure 1.12].
COOHHOOC +
CH2
CH2
O
O
O
O
* *n
OH CH2 CH
2OH
terephthalic acidmonoethylene glycol
polyethylene terephthalate (polyester)
Figure 1.12: A polycondensation reaction of terephthalic acid and monoethylene glycol to form polyethylene terephthalate, more commonly known as polyester.

20
The fabric is durable, strong and generally water resistant, due to its
hydrophobic nature. It protects the body from the cold as a result of the air inside the
fibres which become warmed from the body and act as a heat insulator. Other
beneficial qualities of polyester is its resistance to wrinkles, shrinking and staining, it is
also quick to dry and therefore is the most used fibre in many items of everyday
clothing. Today, microfibers and blends have made the fabric more comfortable and
luxurious with a silk like feel and appearance thus this versatility makes it the most use
fibre in the manufacture of clothing.
Polyester is generally a long smooth bright fibre, which can be flat, triangular,
trilobal, hollow or dog bone in shape. It has cationic dyeability which allows bright acid
dyes to add colour, though it may also contain delustrants to reduce the overall
brightness of the fabric as the fibres can fluoresce under ultra violet (UV) light. It is
also a high tensile fibre with a micro denier, making it extremely soft. Additionally, it
can be used on its own or blended with cotton, wool or viscose rayon to produce
fabrics with the properties of both fabric types (Nanal 2012b; Geno 2013).
Nylon
There are many different types of nylons, though the most commonly used in
the manufacture of clothing is nylon 6 or nylon 6,6. Nylon 6,6 [Figure 1.13] is a
synthetic polyamide produced by a condensation reaction between adipic acid and
hexamethylene diamine while Nylon 6 [Figure 1.14] is formed by the ring opening
polymerisation of ε-caprolactam (Trossarelli 2010). Both these nylons were developed
at Du Pont in the 1930s and they were first used commercially in 1939 with the sale of
stockings (Saunders 1998; Hegde et al. 2004).
COOHHOOC
NH2
NH2
adipic acid hexamethylene diamine
+
N
O
*
O
H
N*
H
n
nylon 6,6
Figure 1.13: The production of nylon 6,6 from adipic acid and hexamethylene diamine.

21
O
*N
*
H
n
N H
O
Nylon 6caprolactam
Figure 1.14: The production of Nylon 6 from caprolactam.
To produce the fibres the crude nylon is first melted, spun and cooled, and the
resulting product is cold-drawn at room temperature through spinnerets, until they are
approximately four times their original length. This in turn increases both the stiffness
and tensile strength of the newly formed fibres, which have a higher tensile strength
than natural fibres such as silk, cotton and rayon (Hegde et al. 2004).
Nylon is a strong fibre, which shows elastic as well as abrasion and chemical
resistant properties. Unlike natural fibres such as cotton and wool which both absorb
dye and water readily nylon can be dyed with difficulty though it does not absorb much
liquid, due to its hydrophobicity. Nylon feels warm, is light weight, and is soft and
smooth, even silk-like in feel, thus is good for a wide range of clothing (Hegde et al.
2004; AFMA/FEB 2012a). Nylon can also be mixed with other fabrics, such as the
nylon-Lycra used in this study (80 % nylon and 20 % Lycra)
Satin
Figure 1.15: A satin weave demonstrating warp threads running side to side and the weft threads running top to bottom (Barlow 1879, p. 117).
Satin is not technically a distinct fabric, but a type of weave [Figure 1.15]
consisting of broken twill, which has a shiny surface with a dull reverse. This is caused
22
by there being a minimum of five weft threads lying or floating over the top of the
warp, causing the shiny surface and the dull reverse to the fabric. Though this fabric
can be quite heavy and originally in the Middle Ages made only from silk, it can be
made in a variety of weights and fabric mixes, such as polyester, viscose and silk, thus
has a variety of uses from evening gowns to bedding (Tikkanen 2010; Abrahart and
Whewell 2013).
Viscose rayon
Rayon was the first discovered and manufactured in 1892, though was not
commercially produced until 1910 as “Artificial silk”. It is produced from regenerated
cellulose, therefore has similar characteristics as cotton and is also known as viscose,
acetate or alginate (Simmons 1978). Viscose rayon fibre can be woven into a soft,
easy to dye, highly absorbent, breathable fabric that can be used in the manufacture
of clothing ranging from lingerie to dresses and sportswear (Smith [no date];
AFMA/FEB 2012b). Rayon does however tend to have a strong lustre, due to its
surface weave and the internal structures of the fibres so will reflect light quite readily
unless delustring is carried out (Marsh 1966).
Linen
Linen is produced from fibres made from the flax plant, Linum usitatissimum,
though it can also be made from cotton and hemp (Geijer 1979). Natural linen has a
high lustre or sheen and can range in colour from light tan to grey which requires
bleaching to form the white linen seen in much of the summer linens. There are two
different types of flax linen fibre – short tow fibres, which produce rougher fabrics and
the longer line fibres, which produce fine fabrics.
This fabric has been manufactured for centuries even as far back as prehistoric
times and it is known that the wrappings on Egyptian mummies were linen.
Nowadays, linen is used to make summer shirts, dresses and trousers due to the fact
that the fabric allows the wearer to stay cool in hot weather, as well as absorbing
water quite easily (up to one fifth of its dry weight, without feeling damp) and then
drying out quite quickly. Even though the fibres are strong and shrink very little, the
fabric does however crease quite easily and can become worn quite quickly in the
creased areas as the fibres do not stretch (Anon [no date]; Geijer 1979).

23
Silk
Silk was first produced in China as far back as 3500 BC, as a luxury cloth and
today China is still the leading silk producer in the world. The production of silk is
called sericulture and involves the raising of the silk moth (Bombyx mori) through its
full lifecycle from moths, to eggs, to worm, to the pupa or cocoon. The latter is
formed by the worm secreting the silk thread, comprised of fibroin and sericin, which is
wound around itself to form a cocoon. The way in which the silk worms produce a
cocoon is from two glands in their head which produce a viscous liquid, which is forced
through ducts similar to the spinnerets in the production of man-made fibres. The
resulting fibres have a high tensile strength, even stronger than steel and unusually for
fabric fibres, silk still maintains 80-85 % of its strength when wet (Trevisan et al. [no
date]; Geijer 1979). The appearance and the ability of silk to keep the wearer cool in
hot climates and warm in colder climates means it is used in a diverse range of
clothing (Winter Silks 2013).
1.2.2 Moisture absorption and porosity of fabrics
All fabrics will absorb moisture from the atmosphere, but the amount absorbed
depends on the ambient conditions, temperature and the humidity as well as how
hydrophobic or hydrophilic the fibres are which relates to both the chemical and
physical characteristics. The amount of water that is absorbed can be expressed as a
percentage and is termed moisture regain.
Moisture regain = Conditioned weight – Dry weight x 100 %
Dry weight
If a fibre is hydrophobic the moisture regain will be close to zero as it tends to
repel water and moisture, whereas a hydrophilic fibre attracts water therefore will have
a higher moisture regain - up to 15 % at 21 °C and a relative humidity of 65 %.
Natural fabrics such as cotton and rayon are hydrophilic, thus have the ability to
absorb moisture readily, this also means they are easier to process, to finish and dye,
especially if aqueous dyes are used. Synthetic fibres such as nylon and polyester tend
to be hydrophobic and do not absorb moisture to any high level, which in turn makes it
quicker drying (Needles 1981). This means that fabrics have different uses due to
these properties (Wakelyn et al. 2007, p. 642).
24
1.2.3 Fabric fingerprinting in forensic science
Fabric has always been considered a difficult substrate on which to visualise
fingermarks and consequently processing for fingermarks is rarely carried out
operationally unless the marks are visible. However, over the years there have been
several fingerprinting techniques investigated for the acquisition of fingermarks from
fabrics. Vacuum metal deposition (VMD) was studied in the 1970s by Hambley (1972),
as well as the Atomic Energy Research Establishment (AWRE), for acquiring
fingermarks from fabric (cotton, taffeta, rayon and nylon) with the sequential use of
gold followed by cadmium resulting in a grey colouration on all areas except those
where the fingerprint ridges were (Godsell 1972; Thomas 1978). It was observed by
Collins, Coles and Stroud (1973) that there was no development on nylon-chiffon,
taffeta and rayon-satin only showed empty marks but both white cotton lawn and
patterned cotton satin allowed the development of good ridge detail. Thomas (1973)
found that marks could survive heavy rain and temperatures up to 25 °C, though the
detail visualised was donor dependant, however only one fabric type was used during
the study. Further tests were carried out using a Bell jar vacuum container by Abe
(1978) who found that gold followed by cadmium on rayon, silk and thin cotton
resulted in visualising fingermarks on the fabric’s surface and even on the reverse of
some of the thinner fabrics, which they suggested was a result of the fingerprint
residues penetrating into the fabric. Though there was some success in the use of
VMD on fabrics, further research and the employment of VMD operationally was
abandoned when it was determined that radioactive sulphur dioxide was more
successful, both in the detail visualised and the fact that it did not impact negatively on
further forensic testing.
Experiments with radioactive sulphur dioxide were carried out on several un-
named smooth tight weave fabrics first by pressing on swatches pinned to boards and
then by grabbing swatches wrapped around an arm. These experiments resulted in
“characterisation of finger and palm impressions”, though this did not result in
“uniform clarity” of ridge detail over the whole grab impression as seen in the joints of
the fingers probably due to the hand position and grabbing action used during the
deposition onto the fabric (Godsell 1972; Ganson and Godsell 1973). Further tests
found that radioactive sulphur dioxide could label and thus visualise marks older than 5
days found indoors, however deterioration of the marks did occur after seven days and
if a piece of evidence had been recovered from an outdoor site then it would not
25
recover marks older than 1 day (Godsell 1972; Jones and Clark 1975). The majority of
these studies were all carried out on clean, new, unworn fabrics, though Collins, Coles
and Stroud (1973) did investigate, using VMD, a corset and a blouse, though the
results were not impressive – the corset showed no marks, but did visualise marks
from the spring reinforcements, while the blouse showed only fresh marks but not on
the section that was left outside overnight in 100 % relative humidity. Thus it was
concluded that fabric that has been worn does not stop the visualisation of marks and
marks, though it should not have been in contact with the skin (such as underwear), or
underneath or in contact with other clothing (such as a shirt worn under a jacket).
Hambley (1972) carried out substantial work on VMD over the course of his
PhD determining that single metals had problems during coating – zinc led to spotting,
copper and antimony coated the whole surface of the substrate thus leading to the loss
of any potential marks. It was discovered that zinc and cadmium were ultimately the
best metals to use, but at reduced temperatures, a thin film of gold or silver had to be
added prior to the use of zinc or cadmium. The use of these metals on various fabrics
was then studied and it was seen that lower gold amounts gave the best level of detail
when followed by cadmium and that all the fabrics, with the exception of red nylon,
gave good quality marks. The red nylon was an open weave fabric that moved under
contact, thus any marks would be distorted during deposition. There was, however, a
problem with recording images as detail seen by the eye was not captured by the
camera. The issues involved the fibre distorting the ridges or it being difficult to work
out which were fine ridges of marks and the weave of the fabric. Therefore work was
carried out on determining the best method, including X-ray, infrared, white light and
UV illumination to record the marks, but these were all limited or even completely
unsuccessful. Overall, Hambley determined that marks could be visualised on fabrics,
though there is an effect from the donors, how the marks were deposited, and even
what the fabrics were washed with. It was found that detergents break down the fats
and greases on the fabric during and after the washing process and this impacts on
the fingerprint residues leading to degradation. Thus one week was the time limit for
developing fingermarks and this was under ideal conditions. It was concluded that
fabrics of a close weave should develop fingermarks and that the deposits penetrated
the weave allowing continuous ridge detail to be observed but coarser fabrics may
develop discontinuous ridge detail.

26
Work was also carried out in the 1980s, by Albinson (1984) at the Scientific
Research and Development Branch (SRBD), using worn clothing and several different
visualisation techniques, including VMD and radioactive sulphur dioxide. The items
used were a mixture of old clothing that had been washed and worn for years, as well
as new clothing that went through at least six “wash and wear cycles”. With the
radioactive sulphur dioxide, the results were fabric dependant – polyester cotton had
low contrast between the fabric and the marks, with a “high background”, this was
thought to be due to “body soil” and washing powders. Of the other fabrics tested
silk, polyester, nylon and acetate had a “low background” and better contrast between
the substrate and the marks. VMD gave similar results – polyester cotton was of lower
quality due to the texture of the fabric’s surface, which led to metal deposits that were
light and patchy. Acetate, nylon and silk all showed good detail and contrast between
the fabric and the marks. Both techniques were tested with split marks on day one
and day seven and VMD showed more detail on the day one samples, 31 % of the
marks were graded 3 or 4 (3 - some ridge detail observed, but most obscured by the
fabric weave: 4 – ridge detail and characteristics observed), whereas the remaining
splits at day seven only had 10 % graded 3 or 4. With the radioactive sulphur dioxide
there was a greater reduction in detail from the one to seven day samples and when
directly comparing the two techniques the radioactive sulphur dioxide gave better
results – 38 % graded 3 or 4 compared to only 10 % with VMD. Overall, it was felt
that finding good identifiable fingermarks on fabric with either technique was “very
low” and that a good donor was necessary to lay a mark on a close weave smooth
fabric that was kept in a protected environment and processed quickly after the
incident.
With regard to fabrics and the suggested use of either radioactive sulphur
dioxide or superglue fuming (Bowman 2005) [Figure 1.16], it is CAF that offers the
best option. In both cases, the manual states that the fabric needs to be clean, free of
nap, with minimal folds or creases caused by handling and have a minimum thread
count of three threads per mm of fabric to have any chance of success in visualising a
latent mark (Bowman 2005). Radioactive sulphur dioxide is no longer being used
operationally (Deacon, P. 2006. pers. comm., 18 September); in fact the CAST
(formally known as HOSDB) equipment was put into storage in 2005 (HOSDB 2005b).
Therefore, the use of superglue and the previously researched VMD, along with a few
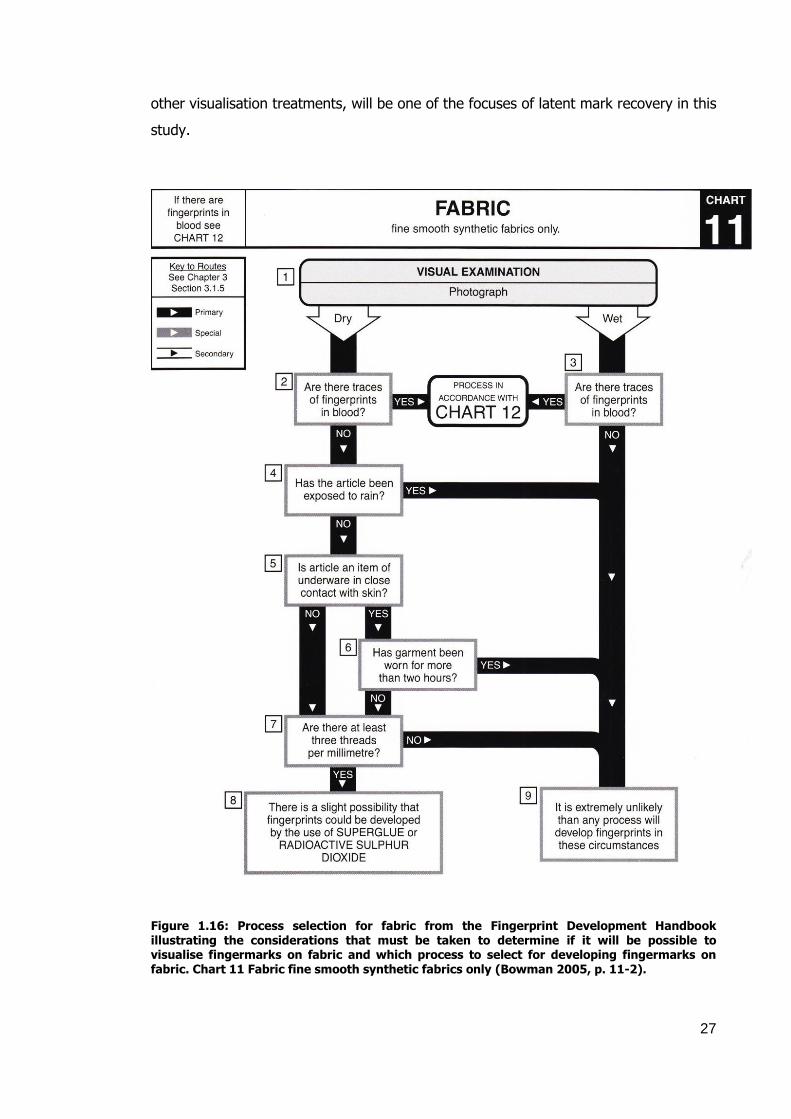
27
other visualisation treatments, will be one of the focuses of latent mark recovery in this
study.
Figure 1.16: Process selection for fabric from the Fingerprint Development Handbook illustrating the considerations that must be taken to determine if it will be possible to visualise fingermarks on fabric and which process to select for developing fingermarks on fabric. Chart 11 Fabric fine smooth synthetic fabrics only (Bowman 2005, p. 11-2).

28
1.3 Background to Vacuum Metal Deposition (VMD) and Cyanoacrylate
Fuming (CAF) techniques used in research
1.3.1 VMD
VMD uses high vacuum and the heating of metals to cause their evaporation and then
subsequent coating in thin layers on smooth substrates such as glass and plastics.
This is a highly sensitive technique that is effective on older items that have been
exposed to extreme conditions, such as water (Bowman 2005). There are several
different systems and manufacturers of VMD equipment, though all work in the same
manner. The article to be processed is attached to the workholder [Figure 1.18],
generally with magnets, and the pressure is lowered to below 3 x 10⁻⁴ mbar and gold is
heated in the filaments [Figure 1.17] for 10 seconds, followed by zinc (at a pressure of
~5 x 10⁻⁴ mbar) until ridge detail is viewed. This procedure applies in the case of a
manually operated VMD system but in automated VMD, times will be pre-set for the
zinc heating cycle and as there may not be a window, the zinc deposition cannot be
viewed. Generally, gold is deposited first the whole surface of the substrate is coated
and penetrates into any fingerprint residues, forming a nucleating layer of
agglomerates to which the zinc then adheres to produce a grey coloured coating. This
leads to a negative mark where the valleys of the mark are grey in colour as the zinc
cannot penetrate the fingerprint residues and can only attach to gold that is not in the
fingerprint residues. Thus, the areas that are coated by the fingerprint residues
remain the colour of the substrate though there are incidences were the opposite
occurs and a positive mark is produced (Lennard 2001; Bowman 2005; Dai et al. 2006)
[Figure 1.19]. It has been suggested (Smith 1989) that one reason for this is due to
“epitaxial growth” of the crystals of sodium chloride within the fingerprint residues
allowing the gold and zinc to bind in the residues, thus causing a reverse of the norm.
However, Kent et al. (1976) suggested that this was due to the substrate being
processed absorbing the organic components in the fingerprint residues, leaving the
solid inorganic salts, which means the gold penetrates the substrate rather than the
residues. Another explanation could be the substrate being processed, for example
high-density polyethylene is generally negative development whereas low-density
polyethylene generally shows positive development (Grant, Springer and Ziv 1996).
Therefore, in the case of VMD, the production of a negative mark is considered normal,
with the dark valleys and substrate coloured ridges, whereas the reverse of this in the
form of a positive mark would be considered unusual. Consideration of this must be
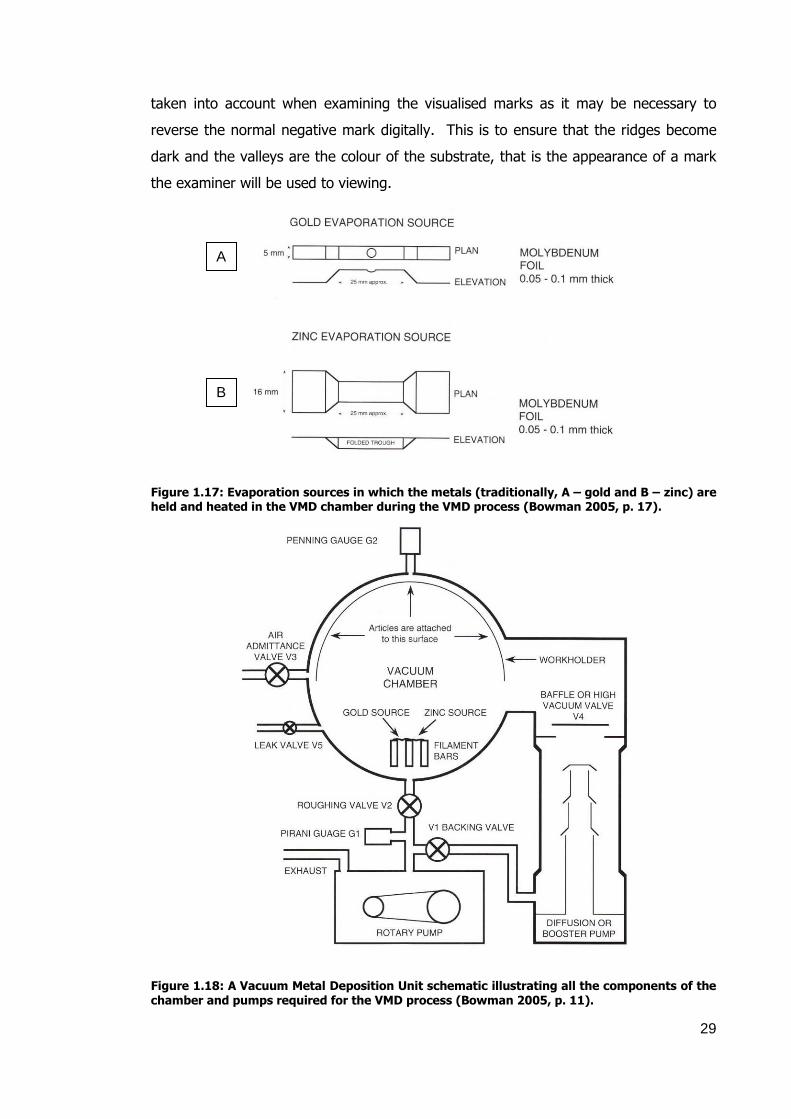
29
taken into account when examining the visualised marks as it may be necessary to
reverse the normal negative mark digitally. This is to ensure that the ridges become
dark and the valleys are the colour of the substrate, that is the appearance of a mark
the examiner will be used to viewing.
Figure 1.17: Evaporation sources in which the metals (traditionally, A – gold and B – zinc) are held and heated in the VMD chamber during the VMD process (Bowman 2005, p. 17).
Figure 1.18: A Vacuum Metal Deposition Unit schematic illustrating all the components of the chamber and pumps required for the VMD process (Bowman 2005, p. 11).
A
B

30
Figure 1.19: VMD deposition of gold and zinc onto fabric and fingerprint residues. Gold covers the whole surface of the substrate and penetrates into the fingerprint residues, while the zinc only attaches to the freely available gold that is not covered by the fingerprint residues (adapted from Philipson and Bleay 2007).
VMD was not designed to detect fingermarks, but to apply metal coatings, such
as semiconductors, a process that required the workers to wear gloves to prevent
fingermarks from forming on the surface of the items. This led Professor Tolansky to
suggest to the Home Office that they use this technique to develop latent marks on
paper (Edwards 1976; Kent et al. 1976; Young 1980; Smith 1989). This idea was
investigated in France on different types of paper – uncoated, onionskin, glossy and
typing paper, to determine which metal types would visualise the most detail and how
long these marks would last (Theys et al. 1968). The majority of research determined
that gold followed by cadmium was the best sequence, though due to the health and
safety issues associated with cadmium it was replaced with zinc (Kent 1981). VMD
was also investigated as a method for recovering fingermarks from fabrics. More
recently, work has been carried out in Australia on various plastic types and the
different “print development regimes”, along with selected levels of gold needed prior
to deposition of zinc (Yamashita and French 2011). Jones et al. (2001a, 2001b, 2001c)
investigated the effect of excess gold during “normal and reverse development” on
polyethylene. They also studied the effect of donor, age of mark and polymer type on
how latent fingermarks developed on other plastics. Results showed that extra gold
could be added to a sample without inhibiting zinc deposition as long as gold, then zinc
is added before removal of the sample from the machine the process may be repeated
as if it had not been previously processed. This is due to the original gold clusters
having been deactivated by the zinc and air forming zinc oxide, therefore not all of the
new gold bonds to the original gold clusters (Jones et al. 2001b). It was determined
that it was the substrate surface causing the normal and reverse development, due to
Fabric
Gold
deposit
Fingerprint
residue Zinc
deposit

31
how the gold film formed on the substrate and therefore how the zinc attached to it
(Jones et al. 2001a). This effect of the substrate surface was further investigated
(Jones et al. 2001c) and it was concluded that it could be due to the plasticisers and
dyes that had been added to the polymers. Thus, it would be advantageous to identify
the polymer prior to VMD to help determine the likely number of gold counts that
would need to be used. They also determined that the donor and the heaviness of
their deposits greatly affected how well marks were developed. Heavy deposits
required greater gold counts for development and may only show as empty marks,
while lighter deposits need a smaller amount of gold. This is also reflected in the age
of a mark and when empty marks occur since as marks age they dry out and become
thinner and lighter, whereas empty marks are caused by heavy deposits that cover the
whole mark area so the gold becomes buried and not available for the zinc to bind to,
so no ridges are visualised. This may be caused by the donor having heavy deposits or
by the substrate allowing diffusion of residues, thus filling of the valleys (Jones 2002).
These are all factors that need to be considered with the various manmade and natural
fabrics, as well as the different donors and the timeline used in this study.
1.3.2 CAF
HO.
+ CH2
COOCH2CH
3
CN
OH CH2 C
COOCH2CH
3
CN.Initiation
Polymerisation
OH CH2 C
COOCH2CH
3
CN. CH2
COOCH2CH
3
CN
+ OH CH2 C
COOCH2CH
3
CN
CH2
C
COOCH2CH
3
CN.
ethyl cyanoacrylate
hydroxyl radical
Figure 1.20: Polymerisation reaction for ethyl cyanoacrylate. Initiation by the hydroxyl radical on ethyl cyanoacrylate followed by polymerisation (Bleay et al. 2012).
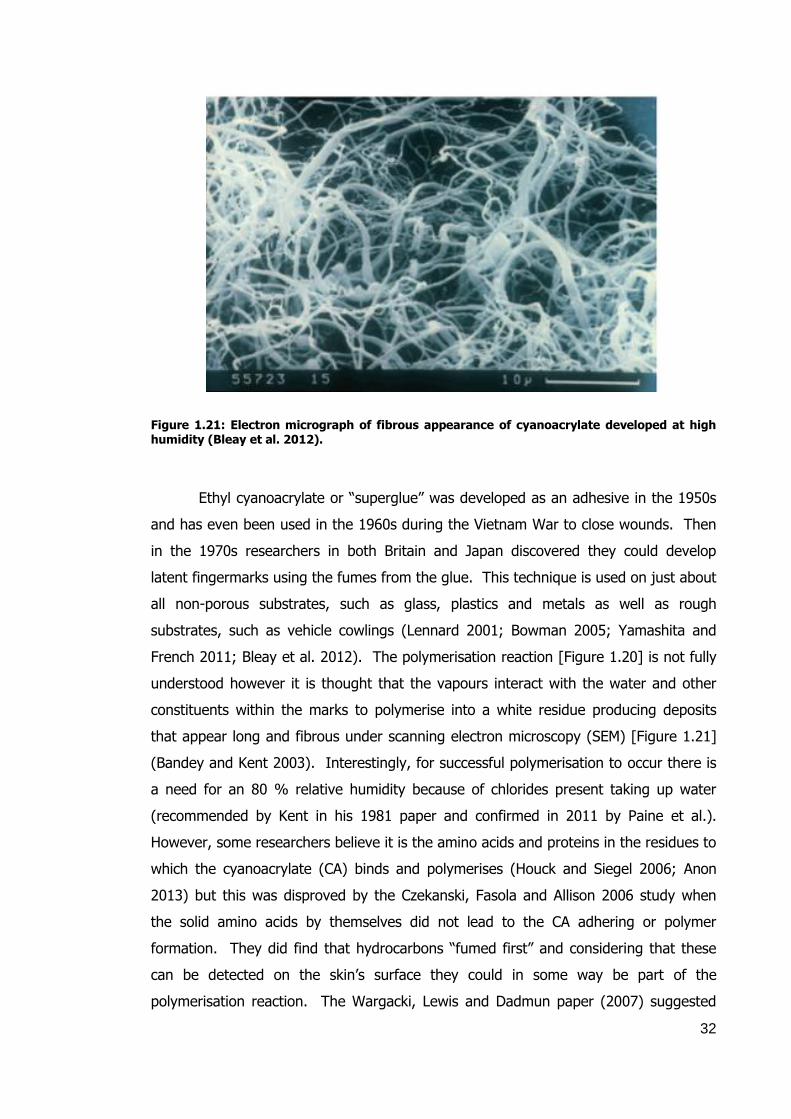
32
Figure 1.21: Electron micrograph of fibrous appearance of cyanoacrylate developed at high humidity (Bleay et al. 2012).
Ethyl cyanoacrylate or “superglue” was developed as an adhesive in the 1950s
and has even been used in the 1960s during the Vietnam War to close wounds. Then
in the 1970s researchers in both Britain and Japan discovered they could develop
latent fingermarks using the fumes from the glue. This technique is used on just about
all non-porous substrates, such as glass, plastics and metals as well as rough
substrates, such as vehicle cowlings (Lennard 2001; Bowman 2005; Yamashita and
French 2011; Bleay et al. 2012). The polymerisation reaction [Figure 1.20] is not fully
understood however it is thought that the vapours interact with the water and other
constituents within the marks to polymerise into a white residue producing deposits
that appear long and fibrous under scanning electron microscopy (SEM) [Figure 1.21]
(Bandey and Kent 2003). Interestingly, for successful polymerisation to occur there is
a need for an 80 % relative humidity because of chlorides present taking up water
(recommended by Kent in his 1981 paper and confirmed in 2011 by Paine et al.).
However, some researchers believe it is the amino acids and proteins in the residues to
which the cyanoacrylate (CA) binds and polymerises (Houck and Siegel 2006; Anon
2013) but this was disproved by the Czekanski, Fasola and Allison 2006 study when
the solid amino acids by themselves did not lead to the CA adhering or polymer
formation. They did find that hydrocarbons “fumed first” and considering that these
can be detected on the skin’s surface they could in some way be part of the
polymerisation reaction. The Wargacki, Lewis and Dadmun paper (2007) suggested

33
that the reaction might be caused by lactate and alanine that are found in eccrine
sweat residues, as they are capable of initiating the process. This polymerisation will
happen at room temperature, though it is accelerated by heat; thus CAF cabinets are
heated to 120 °C (Bowman 2005). Care must be taken not to heat the glue too high
as it has been found that at temperatures higher than 220 °C hydrogen cyanide gas
can be produced, which is hazardous to health (Stokes and Brennan 1995). The white
polymer that is produced from a fingermark is visible on darker substrates, however on
lighter coloured substrates it sometimes needs to be further enhanced by the use of
fluorescent dyes, such as basic yellow 40 (BY40) which could then by viewed and
recorded under laser or Crime lites (Bowman 2005).
BY40 was used originally as a textile dye and, as the name suggests, will dye
the CAF polymer a yellow colour. However to fully see and record the ridge detail
visualised by the CAF and BY40 it needs to be viewed under a light source, such as a
Quaser (excitation filter – cut on 385 nm and cut off 469 nm, viewing filter – cut on
476 nm) or Crime lite (Blue 420-470 nm, goggles GG495 and filter yellow 476 nm).
The items that have been treated with CAF are generally submerged in BY40 for one
minute to allow the dye to adhere to the CA polymer and then rinsed with running
water to remove any excess dye from the surface of the substrate. BY40 is also
considered safer that some of the other dyes that have been previously utilised, as
none of the ingredients used in its manufacture are carcinogenic and are listed as
having low toxicity (Wilkinson 1996) and as a result it is the preferred operational dye
in the UK for use after CAF. The reason why BY40 is used to enhance the CA polymer
is that it is able to absorb the light emitted by either the Quaser or Crime lites and then
emit some of this light at a different but longer wavelength and therefore a different
colour. The molecules on the substrate surface will absorb the light shone on it and in
doing so it rises to a higher energy level then drops back to a lower level or ground
state when it releases energy in the form of fluorescence. The colour of the light
observed is different from the light shone on the substrate’s surface and is said to be
“red-shifted”. The difference of the excitation light and the emitted light is termed the
“Stokes shift”. To allow this new colour to be seen and then photographed filters and
goggles must be used to remove the reflected light that is not absorbed and allow the
fluorescent light to be transmitted. The correct wavelength of light or excitation band
must be used or the dye, in this case, BY40 will not fluoresce and the fingermark will
not be distinguished from the background substrate. This wavelength of light can be

34
produced by a Blue Crime light (420-470 nm) or Quaser (350-469 nm) and the correct
viewing filter, camera filters and goggles must be used to allow the operator to view
and record any fingermarks that are visualised (Bowman 2005; Yamashita and French
2011).
1.3.3 VMD versus CAF and sequential treatment
Several studies have been carried out comparing VMD and CAF for their
sensitivity in visualising fingermarks but the reported results were mixed with some
indicating that VMD was better than CAF, while others showed little or no difference.
For example, in the study by Lennard et al. [1992] it was found that both VMD and
CAF showed the same levels of sensitivity on 3 year old glass and polythene samples.
However, CAF followed by VMD did at times increase the detail especially on plastic
credit cards, but VMD followed by CAF did not enhance the detail observed. Misner
(1992, 1993) found that VMD detected around 15 % more marks than CAF and
Masters and DeHaan (1996) observed that marks under two months old gave the same
level of detail with both VMD and CAF (86 %), while with marks over 24 months old
VMD was more successful – 84 % compared to 60 %.
Overall, VMD is considered a more sensitive technique than CAF (Kent 1990;
Misner 1992; Masters and DeHaan 1996) when it comes to fingermarks that have been
exposed to adverse conditions, such as rain or if the fingermarks are old (Batey et al.
1998). However, CAF is less expensive, is available to most Police departments and
researchers, as well as being an easier technique to implement.
CAF/VMD sequential treatment has been carried out on other substrates, such
as milk cartons, cling-film and polymer banknotes. The milk carton went through CAF
and fluorescent staining, which visualised limited ridge detail. Further treatment with
VMD produced three identifiable marks, which in turn led to an identification of a
suspect, a guilty plea and the suspect waiving his right to trial (Murphy 1991). With
the cling-film, it was determined that sequential use of VMD with gold + zinc followed
by silver gave ridge detail in empty marks, whereas silver then gold + zinc “gave no
improvement in ridge definition”. In addition, silver deposition could be carried out
before or after CAF, but neither gave much improvement, while gold + zinc should be
carried out before CAF “to maximise the number of marks developed”. This in turn led
to a suggested sequential order of gold + zinc VMD, silver VMD, then CAF (Philipson
and Bleay 2007). With polymer banknotes, it was determined that VMD after CAF

35
required less gold and led to marks of better quality. However, the use of stains
before CAF or VMD led to worse detail as it was believed that the fingerprint residues
were “washed away”, thus there was less mark to visualise. Also, CAF and BY40
followed by VMD led to zinc being deposited across the whole surface of the
banknotes, and even though the deposits were fainter on the ridges it made them
harder to see. Even repeated staining did not increase the contrast between the
substrate and ridges, therefore this order of visualisation was not deemed to be “an
acceptable option” (Jones 2002). However earlier work on polyvinyl chloride (PVC)
and polyethylene terephthalate (PET) plastics determined that marks developed with
sequential CAF then VMD treatment would normally result in empty marks. It was
suggested that CAF must be affecting how the gold layer forms or deposits on the
substrate (Jones 2001c). Jones, Downham and Sears (2012) took the study of VMD
and CAF to the nano level by examining the residues and deposits with scanning
electron microscopy (SEM). Here they found that the CA was concentrated around the
pores on the ridges and that once VMD was applied it led to additional visualisation as
the metal deposits covered areas not coated by the CA. The metal did adhere to the
CA polymer, but also to areas with no CA, thus the ridged detail was enhanced, though
the areas without the CA were lighter. Normally, in the UK, CAF followed by VMD is
useful in increasing the clarity of ridges, especially on plastic packing materials,
however some police forces still prefer to use VMD first (Downham 2011). With this in
mind this study will also investigate whether VMD followed by CAF or CAF then VMD is
the more effective sequential treatment on fabrics.
As previously discussed, fabric is a difficult substrate on which to visualise
fingermarks, however as crimes, such as assault, kidnapping and robberies can involve
fabrics, textiles and clothing it would be highly advantageous to be able to visualise
marks, marks and to identify areas from which to collect DNA.
Therefore, the main aims of the research were to determine:
whether latent marks can be visualised on fabric;
the most effective technique for acquiring marks from fabrics;
the factors which contribute to the acquisition of marks from fabrics;
if the type of mark can give an indication of the sequence of events in
an incident/crime;
if DNA can be collected from the visualised areas;
if alternative visualisation techniques could be employed.

36
2. EXPERIMENTAL
2.1 Fabrics
All of the fabric types chosen for this study are used in the manufacture of
common clothing and all complied with the Home Office requirement of a minimum of
three threads per mm.
Cotton (100 %, white and dark blue, 3 threads per mm)
Polycotton (60 % cotton and 40 % polyester, white and black, 3 threads per mm)
Polyester (100 %, white and black, 4 threads per mm)
Nylon (100 %, white, 3 threads per mm)
Nylon-Lycra (80 % nylon and 20 % Lycra, white, 4 threads per mm)
Satin (100 % viscose, white and black, 4 threads per mm)
Silk (100 % Crepe de Chine, heavy white, 6 threads per mm)
Viscose rayon (100 % regenerated cellulose, white, 4 threads per mm)
Linen (100 %, white, 3 threads per mm)
2.2 Donors
The donors used in this study were a mix of males and females who ranged in
age from 35 to 60 years old and had varying potentials to leave fingermark deposits.
Originally, there were 20 donors, however five dropped out of the study at various
points (donor four, fourteen, seventeen, eighteen, and nineteen) therefore their data
was removed from the final analysis.
Prior to collection, the donors had not washed their hands or applied
cosmetics/hand creams for at least 30 minutes and had not been loaded with extra
sebaceous deposits, therefore the deposits left were “natural” and contained only the
deposits normally found on the donors’ hands. The donors were asked to rub their
hands together prior to deposition, to ensure an even distribution of residues over the
surface of the skin on their hands and fingers. In chapter 7, where other researcher’s
work is discussed, some of these donors used a loaded method of deposition, as
detailed in section 7.6. The loaded method of deposition involves the donor wiping
their fingers and palms over their forehead, nose and/or behind their ears to add extra
sebaceous and sweat secretions. Again, the donors would then rub their hands
together to evenly spread these additional residues over their hands, prior to
deposition.

37
All donors had been previously graded on paper substrates thus indicating their
relative ability to leave marks on these substrates. It is noteworthy that this did not
always correspond to the results on fabric in that a donor may have been good on
paper but not on fabric and vice versa. Also, some depositions were carried out
differently from above depending on the visualisation process being used and details
for the specific methodology can be found in individual sections.
The types of donations can be classified as:
(1) Grabs – the fabric swatch was placed over the arm of the collector, who was
wearing a lab coat. The donor then grabbed the arm and swatch with reasonable
force for approximately 10 seconds to simulate the action of an assault. The
consistency of pressure applied was determined by the researcher who was being
grabbed. Grabs were utilised in this study as they were closer to an action that may
occur during an assault and thus a more realistic scenario. The use of a balance was
deemed inconsistent and that apparatus, such as “the fingerprint sampler” design by
Sarah Fieldhouse (2011) was not practicable for this type of deposition.
(2) Pushes – this process was used by some of the student researchers and
involved the donors pressing down, for approximately 10 seconds on the fabric swatch,
either onto a flat surface, such as a table, or onto the collector’s lab coat covered arm,
again.
(3) Split grabs - the fabric swatch was placed over the arm of the collector who
was wearing a lab coat and the donor then grabbed the arm and swatch for
approximately 10 seconds making sure that 2 fingers were on each side of the middle
on the swatch. The swatch was then cut in half, so that one portion could be exposed
to the condition under study and the other half acted as a control.
(4) Split depletions – a collection grid with either three or four columns of 5 cut out
sections was placed over the fabric swatch and a mark was placed at the top and
bottom of each cut out to show were the middle of each mark was. The donor then
pressed the same single finger into each cut out section in the column thus leaving
latent marks with fewer residues as they worked down each column. The marks were
then cut down the middle to allow the comparison of different techniques on the same
fingermark set. The number of sets of columns, three or four, was dependent on how
many techniques were being compared.

38
2.2.1 Donor grading
Poor - Produced little or no target area, nor detail in palm and fingertips.
Medium - Produced a target area, leaving some palmar flexion detail and some ridge
detail in fingertips.
Good - Produced a target area, leaving palmar flexion crease detail and excellent to
good ridge detail in fingertips.
The assigned grade ranges were based on the level of detail visualised on the
samples. This was based on the grades assigned to the samples grades (see section
2.4), these values for each fabric type were added together and divided by the number
of days (10) to determine the average value. This led to grading ranges of 0 – 1.3 for
poor; 1.4 – 1.5 for medium to poor, 1.6 – 1.9 for medium, 2 – 2.3 for good to medium
and 2.4 and higher for good. The intermediate grades of medium to poor and good to
medium were included to take into account that there could be a mixture of high and
low grades within the set. Thus, the range of grades as well as the target areas in the
samples were then taken into account when assigning the overall grade value ranges.
As previously stated all donors prior to their inclusion in the study were tested
on paper to determine their propensity to leave fingermarks. This however was only
an indication as a donor could have been rated as good and leave excellent
fingermarks on one substrate only to be considered a poor donor on another substrate
as little or no detail was left.
2.3 Storage
All swatches were stored in the dark, at room temperature in labelled plastic
wallets for 1, 2, 3, 4, 5, 6, 7, 14, 21 or 28 days or 1, 3, 7 or 28 days, dependent on the
study and were then processed at the relevant time.
2.4 Grading of marks
The grading of the marks was based on the Home Office (CAST) system (Sears
et al. 2011):
(0) No development – negative, no visible or recognisable marks on fabric.
(1) “Empty” marks - could see where the donor had touched the fabric but no ridge
detail on fingertips or palm.

39
(2) Fair – Full pattern and ridge flow on 1 or 2 fingers or approximately 1/3 partial
detail on all the fingers and/or palmar flexion creases visible, but not enough
detail for identification.
(3) Good - ridge characteristics (Galton details) visible on at least 3 fingers or
approximately 1/3 to 2/3 partial detail on all fingermarks.
(4) Excellent - good ridge detail on all 5 fingertips and palm with visible pores,
ridge edge detail and ridge flow.
2.5 Vacuum metal deposition (VMD) materials and methods
2.5.1 Gold + zinc
The fabric types used in this study were cotton, nylon, polyester and polycotton
and were all white in colour. The fabrics were prepared for deposit collection by
cutting 23 cm x 16 cm sized samples, which were labelled with the fabric type, hand
position (F – fingers, P – palm), donor number and process day. The deposition
collection was carried out by the fabric swatch being laid on the collector’s arm and the
donor “grabbing” the sample firmly for 10 seconds. After acquisition, the samples
were kept in plastic wallets, as described in section 2.3 above.
The VMD equipment used in this study was an Edwards 24” Metal Deposition
Unit, manufactured by Mason Vactron Ltd UK and was operated manually as described
in the Home Office Scientific Development Branch documentation (Bowman 2009).
The samples were placed in the chamber and attached to the holder using magnets
around the sample’s edge. Gold wire (0.25 mm in diameter 99 %, Knight and Day)
was cut to approximately 5 mm length (0.002 g) and was placed in the centre filament
and zinc pieces (1 g) were added to the other two filaments. The chamber door was
closed and the pressure reduced to 4x10⁻¹ mbar (roughing cycle) before switching to
the high vacuum cycle. The chamber pressure was reduced to 3x10⁻⁴ mbar and the
gold filament current was switched on to allow the gold to evaporate for about 5
seconds. The zinc filament was then turned on until sufficient zinc was deposited and
fingermark detail could be seen on the sample as well as the paper test mark, which
was placed next to the sample to ensure the process was working correctly. This was
all directly observed throughout the deposition process. The VMD chamber was then
brought back up to atmospheric pressure, the sample removed, labelled with a scale
containing details of the fabric type, donor and test day, and then photographed. The
visualised marks were then graded.

40
2.5.2 Silver
The fabrics (specimen size - 23 cm x 16 cm) which were investigated were
black polycotton (60 % cotton and 40 % polyester mix), black polyester, black satin
and dark blue cotton. They all had four threads per mm of material and were hand
washed prior to use using detergent powder (ASDA 2 in 1 Moonflower and Ylang Ylang
biological washing tablets) to remove any potential contaminants. Once prepared,
each fabric specimen was stored in a plastic wallet labelled with the donor number and
the day on which the marks were to be collected.
The left hand grab mark was acquired by placing the fabric over the collector’s
arm and the donor grabbed it firmly for 10 seconds. The right hand press mark was
acquired by laying the fabric on the collector’s arm and having the donors press firmly
for 10 seconds. After collection, the specimen was returned to its wallet as described
in section 2.3, and then treated with silver VMD (Ag-VMD). All marks were “natural”,
thus no extra residues or cosmetics were added and the donors would not have
washed their hands for approximately 30 minutes prior to deposition. This in turn
meant only one fabric type was collected at a time and if more than one specimen was
collected per day a time period of at least 1 hour was ensured to allow the donor’s
secretions to be replenished.
An Edwards 24” metal deposition machine (Mason Vactron Ltd, UK) was used
for the treatment of specimens. The silver wire (0.5 mm in diameter 99 %; Sigma-
Aldrich UK) was cut to approximately 5 mm lengths and 3 pieces (30 mg in total)
placed in the central evaporation boat within the VMD chamber (HOSDB 2005a). The
fabric specimen was placed in the chamber and it was evacuated to a pressure of
3x10⁻¹ mbar using rotary pumps then switched to diffusion pumping to obtain a high
vacuum of about 4x10⁻⁴ mbar, at which point the current to the boat containing the
silver was switched on and increased until the silver evaporated (about 5 seconds).
Test marks on paper were placed next to the samples in the VMD chamber in order to
confirm that the process was working properly. After treatment, the VMD chamber
was brought back to atmospheric pressure, the specimen removed, labelled with a
scale-ruler detailing the fabric type, donor, test day, then photographed and all
visualised marks were graded.
The VMD equipment oil levels were regularly checked by the Scottish Police
Authority (SPA) staff to ensure that the equipment was running optimally. The
equipment was cleaned after each use by the researcher to remove any metal deposits

41
from the interior surfaces and the viewing windows in order to reduce the chances of
cross-contamination by use of MicroSol on the interior surfaces, while the glass viewing
windows were cleaned after each use with a 10 % acetic acid solution, followed by
water and then oil (Silkair VG22 general purpose airline oil). The interior was also
relined with aluminium foil, thus ensuring there was no build-up of metals on the glass
or interior surfaces which could lead to the heated VMD metal preferentially attaching
to the previous metal build-up rather than the current sample being treated. An
external contractor (Applied Vacuum Engineering Ltd.) was also employed to service
the equipment - testing all the pumping systems, vacuum capabilities thus determining
that it was operating at optimum standards.
2.6 Cyanoacrylate (CAF)
2.6.1 Benchtop superglue fuming chamber
The Electronic Services (London) unit consisting of a low-profile flat plinth
housing a humidifier, glue heater, circulation fan, purge-unit (containing 1.25 Kg of
activated carbon granules within a nylon bag) and control panel was utilised.
Prior to the start of the trials the temperature of the hotplate was determined
by the use of a digital thermocouple (RS 206-3738) and the humidity by means of a
humidity meter (Fluke 971) in order to determine that they were at the correct
operational needs of 120 °C and a relative humidity of 80 %.
The cabinet was also profiled to determine whether the glue vapour was evenly
distributed throughout the cabinet or whether there were areas of higher or lower
concentrations of glue vapours. This was carried out by placing pieces of acetate
loaded with a single latent fingermark at different positions in the cabinet and
comparing the quality of mark developed. Using this technique, it was determined that
the cabinet did in fact have an even distribution of vapours and therefore samples
could be placed in all areas of the cabinet.
After each run the interior of the cabinet was washed with water and detergent
(Tesco washing up liquid) to remove any polymer that had formed on the surfaces and
a soft sponge was used to prevent scratches from forming. This is done to prevent
preferential attraction of the glue vapours to scratches and polymer on the cabinet
interior rather than the sample being processed.
The samples were hung from the rails leaving gaps to allow air to circulate and
ensure a uniform humidity and dispersion of cyanoacrylate (CA) fumes within the

42
chamber. The water reservoir was filled with distilled water and CA (approximately 0.5
g Superglue, CSI Ltd.) was placed in an aluminium foil tray on the glue heater, making
sure the bottom of the tray was in good contact with the heater. The glass lid was
then placed over the base unit, checking that all the seals were covered. Once each
cycle (humidity – 5 minutes, glue – 12 minutes and purge – 20 minutes) was
completed, the samples were removed and enhanced by dipping for 1 minute in basic
yellow 40 (2 g BY40 in 1000 mL ethanol) then rinsing with water, and viewing the
visualised impressions under Quaser light (350-469 nm) or Crime lite (Blue 420-470
nm). The visualised marks were then photographed using either the Quaser or a
Nikon D40 digital camera with a yellow 476 nm filter and then graded.
2.6.2 Scottish Police Authority Forensic Services (SPAFS) CAF cabinets
Some samples were processed using either an MVC3000 or MVC5000 cabinet
located at the SPAFS Dundee labs. Both cabinets were used in the automated mode
and had also been profiled by placing acetate pieces with a single print on them in 9
separate areas throughout the cabinet. This determined that each of the cabinets
worked evenly throughout, so there were no issues as to where samples had to be
placed for processing.
The CAF cabinets were regularly tested, by means of a thermocouple (RS 206-
3738) and humidity meter (Fluke 971) as well as being regularly cleaned by the
researcher and the Scottish Police Authority (SPA) staff to determine the equipment
was running optimally. The cleaning was necessary to prevent a build up of
cyanoacrylate polymer on the cabinet’s surfaces, which could lead to preferential
attachment of the cyanoacrylate fumes to this polymer rather than the items being
processed. The glass surfaces were cleaned with a dilute washing up detergent/water
solution. The cabinets were also regularly tested for DNA contamination and cleaned
with MicroSol. This is important if the samples were to be sequentially tested for DNA
after CAF processing as DNA from previous samples could lead to cross-contamination.
An external contractor (foster+freeman) was also employed to service the equipment -
testing all the systems, determining that the cabinets were operating at optimum
humidity and heating standards, as well as ensuring that the filters removed all the
glue vapours.
The samples were hung in the CA cabinet and ethyl cyanoacrylate
(Cyanobloom, foster+freeman; 2 g for the MVC3000 or 4 g for the MVC 5000) was
added to the aluminium foil dish in the heater. A standard 45-minute cycle with

43
relative humidity of 80 % and temperature of 120 C (15 minute humidity cycle, 15
minute superglue cycle and 20 minute purge cycle for the MVC 3000 and 40 minute
purge cycle for the MVC 5000) was used to visualise the samples. Once processed, the
samples were then enhanced with BY40 and recorded as described above.
2.7 Quaser
The Quaser (2000/30 Mason Vactron, UK) was fitted with a 300 Watt Xenon arc
lamp with an output range of 350 – 600 nm. The excitation filter wavebands were
between 340 and 600 nm, while the six viewing filters ranged between 593 nm and
476 nm and the filter selected was dependent on which chemical visualisation process
had been used. The Quaser camera lower filter was set with IR Block on and the
wavelength was adjusted using the upper filter between 415 nm and 593 nm.
Samples were placed on the sample tray under the camera lens on the
worktable and were then photographed under the appropriate wavelength of light,
camera filter and viewing filter.
CAF – wavelength (355-469 nm), camera and viewing filter (476 nm).
DFO – wavelength (473-548 nm), camera and viewing filter (497 nm).
SPR – white light and no camera or viewing filter.
The laser output of the Quaser was tested regularly to confirm it was working
optimally. This was done by an external technician during the annual service using a
foster+freeman meter and by staff on a monthly basis by use of a camera lens
metering (Nikon D300) to view a BY40 stained CAF fingermark, using the same
exposure time used at the annual service. If this exposure time increased, then the
Quaser output was deemed not to be at its optimum and the technician was called to
repair it.
2.8 Crime lites
The Crime lites (foster+freeman, UK) consist of six torches which range in
wavelengths (350 nm – 700 nm, UV to white light), along with goggles and camera
filters to be used with each different torch. This study utilised different Crime lites to
view latent marks visualised with CAF, DFO and the fluorescent fingerprint powder.
CAF – wavelength (blue 420-470 nm), goggles (yellow 476 nm) and camera filter
(yellow 476 nm).
44
DFO – wavelength (green 500-560 nm), goggles (orange 549 nm) and viewing filter
(orange 549 nm).
Fluorescent fingerprint powder – wavelength (blue 420-470 nm), goggles (yellow
goggles 476 nm) and camera filter (yellow 476 nm).
The appropriate Crime lite for each sample type was mounted onto a small
retort stand then shone onto the whole sample surface to visualise any marks. This
set-up allowed the researcher to have their hands free to manipulate the sample and
camera with ease. The Crime lites were only used for a half hour at a time before the
batteries were changed for fully charged batteries thus preventing the battery from
becoming low and therefore not illuminating the sample at the full capacity.
2.9 Sputter coater
The fabric swatches (40 x 40 mm) of linen, nylon, polycotton, cotton, black
satin, white satin, nylon-Lycra and polyester were each planted with a single natural
latent mark and the swatches were left for the desired time period (one hour and 3
days). Each fabric was treated using an appropriate metal target (nickel, copper or
aluminium, diameter 55 mm and width 0.5 mm).
The samples were placed one at a time in the sputter coater platform (SEM
coating unit PS3) and secured via the stage pin, and then the unit was evacuated.
Once the correct vacuum was achieved, the ready light illuminated, the test button
was depressed to determine the deposition current, the start button was set to 30
seconds and the deposition commenced. This was continued for approximately 5
minutes in 30 seconds time-periods, with a viewing after each coating, to ascertain if
any marks were visualised. To view the sample after each 30 second time-period, the
chamber was returned to atmospheric pressure and any marks or deposits noted up to
the a maximum of 5 minutes. The samples were all photographed with a Nikon D40
camera and any detail recorded.
The vacuum used ranged from 1 x 10⁻¹ – 3 x 10⁻¹ mbar, with a current of 8 – 50
mA depending on the metal target used and fabric being processed.
2.10 Sonication
Samples were sonicated using a 20 kHz Misonix Ultrasonic Liquid Processor
(model S-4000-010) with an output power of 600 W and fitted with a titanium probe
with tip area of 1.17 cm2 [Figure 2.1]. The amplitude was set at 35 %, with no pulsing
and the location of the probe tip was maintained at 20 mm from the bottom of the

45
reactor vessel (400 mL beaker). Due to heat being produced by sonication of the
solution, the reaction beaker was placed in a salt/ice/water bath (15 g salt /~1500 g
ice/400 mL water) to aid cooling.
Figure 2.1: Sonication equipment set-up, showing the water bath, the reaction vessel and the ultrasonic probe. (Reproduced with permission from Milne, project work 2012).
2.11 Preparation of carbon particles
2.11.1 From Glucose/hydrochloric acid (HCl)
The preparation of carbon nanoparticles was attempted using an aqueous
glucose solution as starting material according to the experimental methodology of Li
et al. (2011). Glucose (18.0 g) was dissolved in distilled water (100 mL) in a 250 mL
beaker and HCl (100 mL; 36 % wt %) was added. The beaker was partially immersed
in a salt/ice bath and sonicated for 6 hours at 20 kHz. The excess water was
evaporated in an oven (70 ºC) overnight (10 hours) and a portion of the resulting
paste (1 g) was removed and dissolved in distilled water (100 mL), centrifuged (2
minutes), and filtered using a 0.22 µm filter. This solution was then examined, neat
and as samples ranging from a 1:1 dilution with water up to a 1:10 dilution, using a
spectrofluorophotometer and a fluorescence microscope.
2.11.2 From glucose/sodium hydroxide (NaOH) solution
Glucose (18 g) was dissolved in distilled water (100 mL), to which NaOH (100
mL of 1 mol/L) was added and this was sonicated for 6 hours at an amplitude of 35 %

46
and no pulsing. The solution was then adjusted to pH 7 with the addition of HCl and
then ethanol (100 mL) was added dropwise while the solution was under constant
stirring. Magnesium sulfate (MgSO4, 24 g) was added with stirring for 20 minutes, then
stored for 24 hours at room temperature before centrifuging (2 minutes) and filtering
(0.22 µm). The resulting solutions were stored in large centrifuge tubes and examined
neat and as 1:1 to 1:10 dilutions with distilled water, using the
spectrofluorophotometer and a fluorescence microscope.
2.11.3 From coffee
Coffee grounds (1 g) were added to distilled water (100 mL) and sonicated for
1 hour at 35 % amplitude and no pulsing. The solution was centrifuged for 2 minutes,
filtered using a 0.22 µm filter and then stored before applying to latent marks on
various substrates (glass, paper and fabric) to determine the effectiveness in
visualising latent fingermarks. These marks were then viewed using the Quaser.
2.11.4 From activated carbon cloth
Activated carbon cloth (2 g) was cut into small pieces, suspended in distilled
water (200 mL) and sonicated for 6 hours at an amplitude of 35 %. A sample (10 mL)
was removed every hour, centrifuged (2 minutes), passed through a 0.22 µm filter,
and then stored in centrifuge tubes. Each sample was then viewed using the
spectrofluorophotometer and a fluorescence microscope.
2.12 Characterisation of carbon particles
2.12.1 Spectrofluorophotometer
A spectrofluorophotometer (Shimadzu RF-1501) was used to examine the
carbon particles produced above for any evidence of fluorescence. Each solution was
placed in quartz cuvettes in the spectrofluorophotometer and the spectrum recorded
using the excitation range from 350 to 850 nm, increasing at 50 nm increments.
Additionally, the colours emitted were noted and photographs taken.
2.12.2 Fluorescence microscopy
The microscope (Leica DMR Qwin colour) fitted with a camera (Sony EXwave
HAD DSP 3CCD colour video camera) was used to examine the particles produced as
described above. A thin film of an aqueous suspension of carbon particles was applied
to glass slides and allowed to dry at room temperature. The slides were viewed with

47
different light filters (1H, 2H, 3H and 4H), at both the x50 and x400 magnifications and
images were recorded.
1H (Filter cube A) – UV excitation range and excitation filter (340 – 380 nm).
2H (Filter cube D) – UV/violet excitation range and excitation filter (355 – 425 nm).
3H (Filter cube I3) – blue excitation range and excitation filter (450 – 490 nm).
4H (Filter cube N2.1) – green excitation range and excitation filter (515 – 560 nm).
2.13 Examination of the carbon particles for visualisation of latent
fingermarks
2.13.1 Visualisation with Quaser
In order to allow the solutions to be more easily applied to the test substrates,
AEROSOL OT detergent (0.075 mL for every 50 mL of solution) was added to all the
solutions prepared above. Loaded marks were placed 1 h previously on glass
microscope slides, paper (recycled and white) and fabric swatches and the solutions
were applied by pouring the solution directly over the substrate, dipping the substrate
into the solution, and/or painting the solution onto the substrate with a soft haired
brush. The samples were viewed and photographed under all the Quaser wavelengths
using the appropriate filters in an attempt to determine which, if any, were suitable for
the visualisation of latent fingermarks.
2.13.2 Visualisation with the fluorescent microscope
All the solutions were applied by pouring, dipping and/or painting onto glass
microscope slides containing a loaded mark deposited 1 h previously, then viewed at
x50 and x400 magnifications with different cube filters (1H, 2H, 3H and 4H) and
images were recorded.
2.14 Studies on the effect of water on samples visualised with VMD and
CAF
2.14.1 The effect of moisture on the visualisation of latent marks
The fabric swatches (linen, nylon-Lycra, nylon, white satin and black satin)
were planted with natural marks and then cut in half to split the planted marks. One-
half was stored as a control and the other half treated with water.
This study used three donors, who were previously determined as good,
medium and poor from previous fabric studies. The donors placed a natural grab mark
48
on each of the fabrics for each of the timelines (1, 3, 7, 14 and 28 days) and
conditions (dew, moderate rain and heavy rain). These were then split in half and
stored in plastic wallets until they had reached the required age.
A spray bottle was filled with distilled water and the fabric swatches were
sprayed, individually, with varying amounts of water* to simulate different conditions.
The swatches were then allowed to dry at room temperature on a paper towel then
stored in plastic wallets for an appropriate amount of time before being processing
with either VMD or CAF. The samples (controls and water treated) were then graded
and photographed with the Nikon D40 camera (using the yellow 476 nm filter and blue
420 – 470 nm Crime lite in the case of the CAF specimens).
*Water levels:
dew – one full spray (approximately 1 mL of distilled water) which led to the
specimen having a layer of water drops on the fabric surface;
moderate rain fall – 5 full sprays (approximately 5 mL of distilled water) which
produced small areas of water soaking into and through the fabric;
heavy rain fall – 15 full sprays (approximately 15 mL of distilled water) which
completely soaked the sample from the front to the back surface.
2.14.2 Hydrophobicity and hydrophilicity testing
In an attempt to determine the relative hydrophilicity or hydrophobicity of the
fabrics (polycotton, nylon-Lycra, nylon, linen, silk, satin, polyester, cotton and rayon,
all white in colour as well as black satin) each was cut into 6 x 6 cm sized swatches
and weighed on an analytical balance to four decimal places. The samples were then
each separately submerged in distilled water (100 mL) for 1 minute, removed, shaken
to remove excess water, and reweighed. This absorption of water was repeated 3
times and the average weight gain determined. The swatches were then allowed to
dry, then stored in plastic wallets, and reweighed at 1, 3, 7, 14 and 28 day intervals.
In order to determine each fabric’s starting weight, wet weight and dry weight over a
28 day period.
The intrinsic absorbency value was calculated by dividing the water volume by
the weight of the fabric swatch. The volume of water was calculated by the
subtracting the dry weight of the fabric from the wet weight in grams and then
converting to volume, assuming the density of the water was 1 g/mL. With the weight
of each fabric calculated from the average of the dry weights (starting weight, weight
after drying; weights at day 1, 3, 7, 14 and 28).

49
This test is based on that used in the “Determination of Absorbency and Rate of
Absorbency of Wipers” (Texwipe 2011).
2.15 Visualisation of latent fingermarks using chemical processes
Each fabric (nylon, nylon-Lycra, polyester, silk, polycotton and satin - all white
in colour) was cut into 23 x 16 cm sized swatches. The following studies used three
donors, who were previously determined as good, medium and poor from previous
fabric studies. The donors placed a depletion series of natural marks on each of the
fabrics for each of the timelines (1, 3, 7 and 28 days). These were then split in half
and stored in plastic wallets until they had reached the required age.
2.15.1 1, 8-Diaza-9-fluorenone (DFO)
DFO (traditional method)
DFO powder (0.5 g) was placed in a 2 L glass beaker along with methanol (100
mL), ethyl acetate (100 mL) and acetic acid (20 mL) and stirred with a magnetic stirrer
until a clear, yellow solution was produced. Petroleum ether (780 mL) was then added
with stirring and the resulting solution was stored in a dark bottle in the solvent
cupboard until required.
The samples were placed into a shallow tray containing enough DFO solution to
completely cover the samples, then after approximately 5 seconds the samples were
removed and placed onto paper to dry. Finally, the samples were placed in the DFO
oven (Heraeus instruments UT 6200) at a temperature of 100 ºC for 20 minutes. All
the samples were viewed with white light as well as under the Green (500-560 nm)
Crime lite and were all photographed with the Nikon D40 camera fitted with an orange
549 nm filter. The samples were also photographed with the Quaser using the 497 nm
viewing filter and an excitation filter of 473-548 nm.
DFO (dry method)
Stock solution (50 mL) was used to coat 32 cm filter papers (W and R Balston
Ltd. No. 44,) and these were hung in the fume hood until dry and then stored in a
plastic bag in the solvent cupboard.
The samples were “sandwiched” between the DFO soaked filter papers and
steamed with a Tefal Superglide IS iron (1 minute) containing acetic acid (5 %)
solution. The samples were then removed from between the filter papers and placed

50
between weighted (6 x 1 Kg weights) steel A4 sized plates and heated in the DFO
cabinet to 110 ºC for 10 minutes.
The samples were then viewed and recorded as described in the traditional
DFO method section.
Prior to the trials, the temperature of the DFO cabinet was determined by use
of a digital thermocouple (RS 206-3738) to ensure it was at the correct operational
temperature of either 100 °C for the traditional method or 110 °C for the dry method.
2.15.2 Ninhydrin
The stock solution was prepared by placing ninhydrin (25 g) in a clean dry 400
mL beaker, adding ethanol (225 mL) whilst stirring with a magnetic stirrer to produce a
slurry. Ethyl acetate (10 mL) was then added followed by acetic acid (25 mL) with
continuous stirring until a clear, yellow solution was produced. The solution was then
stored in a dark glass bottle, at room temperature until required.
To produce the required working solution, the stock solution (52 mL) was
placed in a 2 L beaker and petroleum ether (1000 mL) added with stirring, to afford a
pale yellow solution. This was then transferred to a dark glass bottle and stored at
room temperature.
Traditional method
The samples were processed following the standard operating procedures
(SOPs) as described in the Fingerprint manual (Bowman 2005). The samples were
placed in a shallow tray of the solution for approximately 5 seconds and then on paper
until dry. They were then placed on cardboard in the ninhydrin oven (Gallenkamp
BR185H SP) at 80 °C and a relative humidity of 65 % for 5 minutes, as per SOPs.
Finally, the samples were viewed under white light and photographed with a Nikon
D40 camera.
Prior to the start of the trial, the temperature of the cabinet was determined by
the use of a digital thermocouple (RS 206-3738) and the humidity by means of a
humidity meter (Fluke 971) to ensure they were at the correct operational needs of 80
°C and a relative humidity of 65 %. The cabinet was also profiled to determine
whether there was an even humidity within the cabinet. This was carried out by
placing pieces of paper loaded with a single latent fingermark at different positions in
the cabinet and comparing the quality of marks developed. Using this technique, it

51
was determined that the cabinet did in fact have an even distribution of humidity and
therefore samples could be placed in all areas of the cabinet.
Steam Iron method
The samples were subjected to heat and humidity by moving a steam iron
(Tefal Superglide IS) to approximately 3 cm over the sample surface for 30 seconds.
The temperature of the metal plate on the steam iron was measured by means of a
digital thermocouple, RS 206-3738 (100-120 °C) and humidity by means of a Fluke 971
humidity meter (relative humidity 85 %). The samples were then viewed under white
light and photographed with a Nikon D40 camera.
The no heat or humidity method
The samples were dipped in the DFO solution for 5 seconds and then left to dry
without any addition of heat or humidity. Once dry they were recorded under white
light by photographing with a Nikon D40 camera.
All samples were viewed, photographed and details recorded after each process
was complete. The samples were then stored in the plastic wallets and re-examined
after one week and one month to determine whether extra ridge detail or colouration
(Ruhemann’s purple) had developed.
2.15.3 Small particle reagent (SPR)
A concentrated solution was prepared by measuring tap water (500 mL) into a
clean 600 mL beaker, to which 10 % AEROSOL OT solution (7.5 mL) was added with
stirring. Next, molybdenum disulphide (50 g) was weighed and placed into a clean 1 L
beaker and small portions of the detergent solution were added until a smooth paste
was achieved. Then, half the remaining detergent solution was added with stirring
until a slurry was produced and this was transferred to a clean plastic bottle and the
remaining detergent was added to the beaker to transfer any remaining powder to the
bottle.
The working solution was prepared by shaking the concentrated solution,
pouring it into a plastic 5 L bottle and adding tap water (4.5 L). This solution can be
kept indefinitely, however it needed to be shaken before each use to ensure even
distribution of reagent.
The fabric swatches were immersed in the solution and held stationary (30
seconds) in the suspension near the bottom of the basin. They were carefully
52
removed, inverted and drawn through a tank of tap water and dried by hanging on a
“washing line”. The swatches were then viewed under white light and photographed
using a Nikon D40 camera.
2.15.4 Fluorescent fingerprint powders
In a darkened room, using the blue (430-470 nm) Crime lite and the yellow
goggles (476 nm), a magnetic brush was used to apply the red fluorescent magnetic
Crime Scene Investigation Equipment Ltd.) to the fabric swatches to enhance the
planted latent marks. The swatches and any visualised marks were illuminated with
the blue Crime lite (420 – 470 nm) then photographed using the Nikon D40 camera
fitted with a yellow filter (476 nm).
53
3. VISUALISATION OF FINGERMARKS ON FABRIC SWATCHES BY MEANS
OF VACUUM METAL DEPOSITION (VMD)
3.1 Aims
To use VMD in order to visualise fingermark and palm ridge detail on fabrics
and to discover the quality of marks visualised on cotton, nylon, polyester and
polycotton samples and determine the variability between fifteen donors and the effect
of ageing the samples over a 28 days.
3.2 Grading of marks
(0) No development – negative, no visible or recognisable marks on fabric.
(1) “Empty” marks - could see where the donor had touched the fabric but no ridge
detail on fingertips or palm.
(2) Fair – Full pattern and ridge flow on 1 or 2 fingers or approximately 1/3 partial
detail on all the fingers and/or palmar flexion creases visible, but not enough
detail for identification.
(3) Good - ridge characteristics (Galton details) visible on at least 3 fingers or
approximately 1/3 to 2/3 partial detail on all fingermarks.
(4) Excellent - good ridge detail on all 5 fingertips and palm with visible pores,
ridge edge detail and ridge flow.
3.3 Donor one
Figure 3.1 shows the gradings for donor one on cotton, nylon, polyester and
polycotton. Interestingly, this donor had a rating of medium to poor on cotton and
was the only donor to deposit any ridge detail on cotton [Figure 3.2]. All the other
cotton samples were graded as empty (days 3 – 7, 21 and 28). These empty samples
ranged from full grab impressions to just finger impressions, which means that even
though an identification could not be made as there was no ridge detail, they could
have produced a target area from which DNA may be obtained.
On nylon this donor gave an overall rating of good, due to there being 3
excellent samples (days 2 [Figure 3.3], 5 and 14), 4 good samples (days 1, 3, 6 and 7)
and 3 fair samples (days 4, 21 [Figure 3.4] and 28). As these samples contain ridge
detail and palmar flexion creases, of varying strengths, it may be possible to identify
the individual from this information.

54
0
1
2
3
4
1 2 3 4 5 6 7 14 21 28
Gra
din
g o
f D
eve
lop
ed
F
ing
erm
ark
s
Day
Cotton
Nylon
Polyester
Polycotton
Figure 3.1: Grades of fingermarks (1 – 4) for donor one over the 10 day timeline (days 1 – 7, 14, 21 and 28) on cotton, nylon, polyester and polycotton, visualised with VMD.
Figure 3.2: Close up of faint ridge detail in the right index finger of donor one, on a day old cotton fabric. Sample image was taken with a Nikon D40 using white light.
The polyester samples produced a good donor rating, with all the samples
providing a target area for DNA. There was ridge detail on days 1, 3, 4, 7 and 14, with
all other days (2, 5, 6, 21 and 28) having palmar flexion creases but empty marks. All

55
this information could however help lead to identification – there has been much work
done with palmar flexion creases and their use in identification over the last 10 years
(Wormack 2012). The fact that all of the swatches contain palmar flexion creases
indicates that the possibility of identifying this donor from any of the marks left is quite
good, even with the samples (days 21 and 28) that only contained some palmar flexion
creases.
Figure 3.3: Example of an excellent sample (grade 4) from donor one (day 2 on nylon), containing ridge detail on all fingers and thumb as well as palmar flexion creases. Photograph taken with a Nikon D40 using white light.
Considering, the polycotton samples this donor had a rating of good due to all
days producing some ridge detail and palm lines even in the later days. For example,
the samples ranged from the marks having palmar flexion creases and all fingers with
ridge detail (days 1, 3, 4, 7, 14 and 28) to those with missing portions of detail on
fingers (days 2, 5, 6 and 21).
Overall, the average grade for each fabric can be calculated by adding all the
grades for all the days for each fabric and then dividing by 10 (the number of days in
the timeline). Therefore, with this donor, polycotton (average grade of 3.6) was the
most successful fabric followed by nylon (3), polyester (2.6), and finally cotton (1.30).
The propensity of a fabric to show high rating was determined by the donor and the
number of high graded samples obtained. When considering these high graded
samples and their level of ridge detail it can be considered that the most successful

56
day for each fabric was: day 7 for polyester (grade 4), days 2, 5 and 14 (grade 4) for
nylon, days 1, 3, 4, 7, 14 and 28 (grade 4) for polycotton, and day 1 for cotton (grade
3). Therefore, with this donor there does not seem to a consistent day for the
collection of a “good” mark. This is demonstrated when the overall gradings for all
fabrics is considered; this donor had no 0 grades, only 20 % were grade 1, this
increased to 23 % for grade 2, which would contain some ridge detail, then a high of
32 % for grade 3 and dipping to 25 % for grade 4, both of which would contain
identifiable ridge detail.
Figure 3.4: Example of a fair sample (grade 2) from donor one (day 21 on nylon), containing palmar flexion creases and empty marks with no ridge detail. Photograph taken with a Nikon D40 using white light.
The level of ridge detail observed does seem to be dependent on the fabric
type and, most likely, some influence from the donor – diet, their activity level and
their temperature (Ramotowski 2001; Yamashita and French 2011), as to the level of
detail left on the swatch. With this donor all the fabrics produced identifying ridge
detail, both in the form of fingermark ridges and palmar flexion creases through the
whole of the timeline, with the exception of cotton which only had ridge detail on the
freshest sample (day 1). Thus, this donor appears to leave identifying information on

57
three out of the four fabrics as well as obvious target areas that may lead to DNA
collection and therefore a DNA profile.
3.4 Donor two
This donor [Figure 3.5] had a rating of poor for cotton due to there being four
instances of no development (days 2 – 4 and 6) and five empty samples (days 5 and 7
– 28). These samples ranged from fingertips to fingers and palmar flexion creases,
such as the moderate sample (day 1) which gave a grab image and detail in the palm.
The donor rating for nylon was medium due to six out of the ten samples being good
(days 1 and 5) or fair (days 3, 4, 6 and 28), thus giving ridge detail in the palm as well
as fingertips. While the donor rating for polyester was medium as only one sample
was rated as having good ridge detail (day 1) and the rest having, at most, palmar
flexion creases. The donor rating was medium on the polycotton due to the increase
in samples showing ridge detail. The days with palmar flexion creases (1, 6, 7 and 28)
and those with ridge detail (1 and 6) give a higher chance of identification via ridge
detail compared to polyester, as this fabric only had ridge detail on the freshest sample
- day 1.
0
1
2
3
4
1 2 3 4 5 6 7 14 21 28
Gra
din
g o
f D
eve
lop
ed
F
ing
erm
ark
s
Day
Cotton
Nylon
Polyester
Polycotton
Figure 3.5: Grades of fingermarks (0 – 3) for donor two over the 10 day timeline (days 1 – 7, 14, 21 and 28) on cotton, nylon, polyester and polycotton, visualised with VMD.
The ridge detail from this donor is mostly in the form of palmar flexion creases
with the odd fingermark ridge detail on the fresher samples or shinier fabrics.

58
Therefore, with this donor, identification would be more likely from the DNA collected
from the target areas, as demonstrated by the collaborative work carried out in
conjunction with Ignacio Quinones Garcia (Quinones, I. 2012. pers. comm., 15 March;
Quinones Garcia 2011). This work showed that it was possible to achieve full DNA
profiles from samples first treated using the VMD process, as the marks visualised by
the VMD process allowed the operator to target an area that had been touched.
Overall, for this donor the fabrics can be rated in order of highest number of
successful ridge detail as polycotton, nylon, polyester and cotton and the most
successful days were 1 and 6 (grade 3) for polycotton, days 1 and 5 (grade 3) for
nylon, day 1 (grade 3) for polyester and day 1 (grade 1) for cotton. The overall
average grading reinforces this, with polycotton 1.9, nylon 1.8, polyester 1.6, and
cotton only 0.7.
Though this donor generally had good development of their palmar flexion
creases they tended to have empty marks with no ridge detail. Overall, only half the
swatches contained detail of one form or another – 13 % at 0 and 37 % at 1, with
palmar flexion creases in 37 % of the swatches (grade 3) and only 13 % (grade 2)
with some form of ridge detail. So, the only way identification could be made with this
donor on polyester would be from the palmar flexion creases or from the possibility of
DNA extracted from targeting the areas visualised with the VMD process.
3.5 Donor three
Figure 3.6 shows that this donor had a rating of poor for cotton, as all the
samples were either empty (days 1, 2, 3, 5, 6 and 7) or showed no development (days
4, 7, 21 and 28). This donor’s rating for nylon is also poor, as six out of the ten
samples were empty (days 1, 2, 6, 14 and 21) or showed no development (day 28).
Days 3, 4, 5 and 7 are fair, giving detail in the palm which may help with identification.
The polyester rating for this donor was again poor with only two days (5 and 7)
producing any identification marks – that of palmar flexion creases. Finally, with the
polycotton fabric the donor rating was again poor with only days 2 and 3 producing
any identification marks – some palmar flexion creases on day 2 and faint ridge detail
on day 3.
Overall, this donor does not tend to leave identifying marks in the form of ridge
detail – there were only two samples that had fingermark ridge detail and four that
had palmar flexion creases. None of this donor’s samples were graded above 2; 20 %
were graded 2, 52 % were grade 1 and 28 % were 0. This donor left few marks or

59
areas to target for DNA collection - in the case of polycotton only half of the samples
had areas to be targeted and some of these only possible fingertip marks thus could be
artefacts of the process and not areas of contact at all.
0
1
2
3
4
1 2 3 4 5 6 7 14 21 28
Gra
din
g o
f D
eve
lop
ed
Fin
ge
rma
rks
Day
Cotton
Nylon
Polyester
Polycotton
Figure 3.6: Grades of fingermarks (0 – 2) for donor three over the 10 day timeline (days 1 – 7, 14, 21 and 28) on cotton, nylon, polyester and polycotton, visualised with VMD.
Therefore, the fabric ranking for this donor was nylon (1.3), due to its overall
grade of 1.3 and that this fabric had the highest number of grade 2 samples (days 3,
4, 5 and 7); followed by polyester (1) with grade 2 samples on day 5, polycotton (0.8)
grade 2 samples on days 2 and 3, and cotton (0.6) which was only grade 1 for its
positive samples (days 1, 2, 3, 5, 6 and 14). As there is little to no ridge detail with
this donor and the only days containing any ridged detail were only grade 2 the
likelihood of this donor being identified is quite low.
3.6 Donor five
This donor [Figure 3.7] was poor on cotton, as five of the samples are classed
as no development (days 1, 2, 7, 21 and 28) and five are empty (days 3, 4, 5, 6 and
14) with only faint grab or just fingertip marks, leading to an overall grading of 0.5.
The nylon samples gave a good to medium donor rating as days 1 to 7 showed fair to

60
excellent results producing detail in the palms and fingertips. Days 14 to 28 though
empty, produced grab impressions with some palmar flexion creases, which resulted in
an overall grading of 2.3. The polyester samples gave a donor rating of poor due to
one sample having no development (day 6), five days only having faint or possible
marks (days 1, 4, 5, 14 and 21) and only three days having fair ratings (days 2, 3 and
7), thus giving an overall grading of 1.3. The marks on the polycotton samples led to
a medium to good rating, with nine samples containing some level of detail and only
two samples with no development (days 6 and 28). Those with detail ranged from
giving full grab with palmar flexion creases and ridge detail (days 2, 3, 4, 7, 14 and 21)
to those with palmar flexion creases but empty marks (days 1, 5, and 7), resulting in
an overall grading of 1.8 for polycotton. When combining all the samples, the overall
grades were: 20 % at grade 0 with no ridge detail, 35 % grade 1, 25 % grade 2, 17 %
grade 3 and only 3 % grade 4.
0
1
2
3
4
1 2 3 4 5 6 7 14 21 28
Gra
din
g o
f D
eve
lop
ed
Fin
ge
rma
rks
Day
Cotton
Nylon
Polyester
Polycotton
Figure 3.7: Grades of fingermarks (0 – 4) for donor five over the 10 day timeline (days 1 – 7, 14, 21 and 28) on cotton, nylon, polyester and polycotton, visualised with VMD.
Therefore, this donor left some form of good ridge detail on nylon and
polycotton, with less on polyester and none on the cotton. They did however leave
target areas on the majority of fabric days, except cotton days 1, 7, 21 and 28,
polyester day 6 and polycotton days 6 and 28. Again, even though these empty
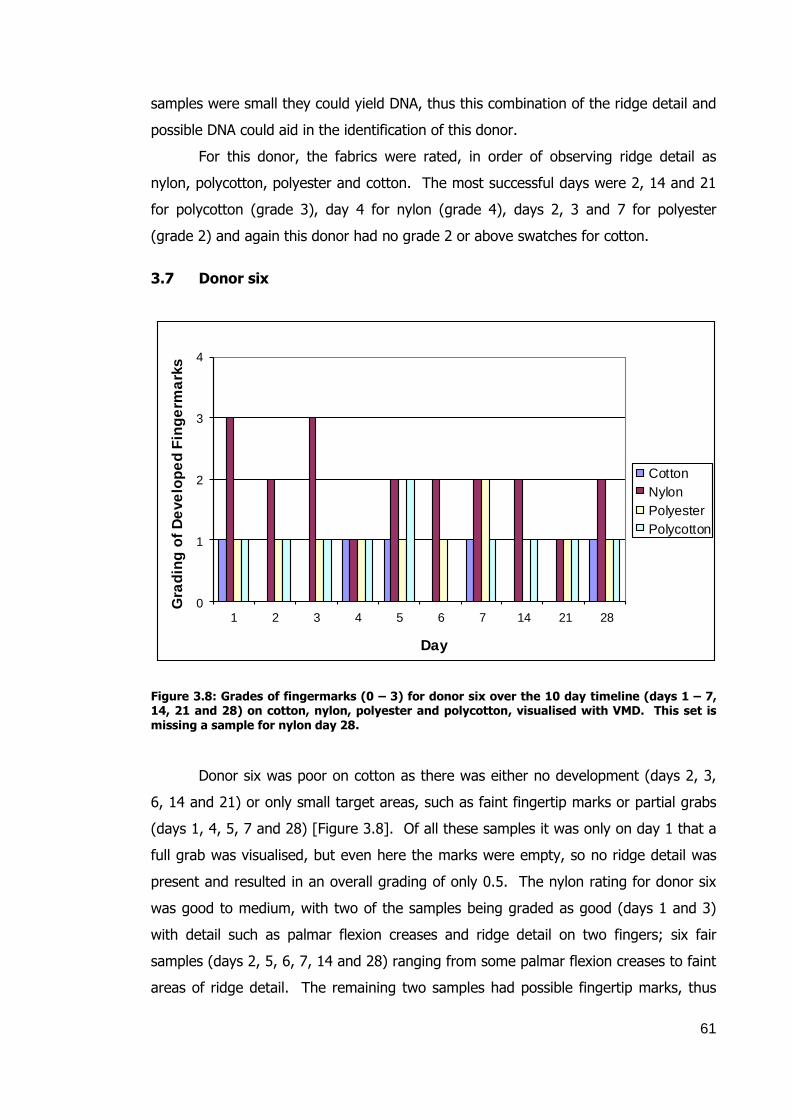
61
samples were small they could yield DNA, thus this combination of the ridge detail and
possible DNA could aid in the identification of this donor.
For this donor, the fabrics were rated, in order of observing ridge detail as
nylon, polycotton, polyester and cotton. The most successful days were 2, 14 and 21
for polycotton (grade 3), day 4 for nylon (grade 4), days 2, 3 and 7 for polyester
(grade 2) and again this donor had no grade 2 or above swatches for cotton.
3.7 Donor six
0
1
2
3
4
1 2 3 4 5 6 7 14 21 28
Gra
din
g o
f D
eve
lop
ed
Fin
ge
rma
rks
Day
Cotton
Nylon
Polyester
Polycotton
Figure 3.8: Grades of fingermarks (0 – 3) for donor six over the 10 day timeline (days 1 – 7, 14, 21 and 28) on cotton, nylon, polyester and polycotton, visualised with VMD. This set is missing a sample for nylon day 28.
Donor six was poor on cotton as there was either no development (days 2, 3,
6, 14 and 21) or only small target areas, such as faint fingertip marks or partial grabs
(days 1, 4, 5, 7 and 28) [Figure 3.8]. Of all these samples it was only on day 1 that a
full grab was visualised, but even here the marks were empty, so no ridge detail was
present and resulted in an overall grading of only 0.5. The nylon rating for donor six
was good to medium, with two of the samples being graded as good (days 1 and 3)
with detail such as palmar flexion creases and ridge detail on two fingers; six fair
samples (days 2, 5, 6, 7, 14 and 28) ranging from some palmar flexion creases to faint
areas of ridge detail. The remaining two samples had possible fingertip marks, thus

62
were graded as empty (days 4 and 21); overall this donor achieved a grading on nylon
of 2. With polyester this donor had a poor rating as all the samples, with the exception
of day 7 (fair) and day 14 (no development), were classed as empty. The fair sample
on day 7 only contained some palmar flexion creases and no other ridge detail, thus
overall this fabric had a grade of 1. Polycotton also had a poor rating for donor six,
again due to the majority of samples only having empty ratings (days 1, 2, 3, 4, 7, 14,
21 and 28). Day 5 was fair with only signs of a faint grab, though there were a few
palmar flexion creases and some very faint ridge detail on the thumb. Day 6 was
graded as no development, though there was a possible thumb and finger mark.
Therefore, polycotton showed an overall grade of 1.
With the grades all combined donor six had 60 % of swatches graded 0 (20 %)
and 1 (40 %), thus reinforcing that this donor does not consistently leave identifiable
marks. The rest of the swatches did contain some form of ridge detail, 27 % were
grade 2 and 13 % were graded 3, with the majority of these being found on nylon, a
smoother and tighter weave fabric.
Overall, for this donor, the fabrics can be rated in the order: nylon, polycotton,
polyester and cotton, with the most successful days being day 1 and 3 for nylon (grade
3), day 5 for polycotton (grade 2), day 7 for polyester (grade 2) and for cotton (either
1 or 0).
3.8 Donor seven
The rating for donor seven [Figure 3.9] on cotton was poor as seven samples
(days 1 – 4, 6 and 7) were grade 1, thus only target areas. The nylon samples also
gave a poor rating as only two samples (days 1 and 3) were fair, giving some palmar
flexion creases, the rest were either empty (days 2, 4, 5, 6, 7 and 21) or no
development as in days 14 and 28. Overall, polyester gave a poor rating as five days
(1, 2, 4, 14 and 28) gave no development and only possible fingertip impressions (days
1, 2, 4 and 28). Days 3, 5, 6 and 21 gave empty ratings and no ridge detail with day 7
being the only sample to give palmar flexion creases that may help with identification.
The day 14 swatch displayed zinc deposits only, therefore did not produce any ridge
detail of a target area or area to swab for DNA. Finally, polycotton again produced a
poor donor rating with two days (4 and 21) producing no development. The remaining
marks (days 1, 2, 3, 5, 6, 7, 14 and 28) left target areas of fingertip impressions to
grab impressions, but no ridge detail.

63
0
1
2
3
4
1 2 3 4 5 6 7 14 21 28
Gra
din
g o
f D
eve
lop
ed
Fin
ge
rma
rks
Day
Cotton
Nylon
Polyester
Polycotton
Figure 3.9: Grades of fingermarks (0 – 2) for donor seven over the 10 day timeline (days 1 – 7, 14, 21 and 28) on cotton, nylon, polyester and polycotton, visualised with VMD.
This donor may produce identification from DNA though not every day left a
target area for DNA acquisition. This donor did not however leave enough ridge detail
to help with identification, therefore the order of fabric ratings are: nylon, polyester,
polycotton and cotton. With the most successful days being days 1 and 3 for nylon
(grade 2) and day 7 for polyester (grade 2), while neither polycotton nor cotton had
any grade 2 or higher samples. The overall grading also illustrated that this donor is
unlikely to be identified by ridge detail – cotton had an overall grading of 0.7, nylon 1,
polyester 0.6 and polycotton 0.8. This is reinforced by 28 % being grade 0, 62 %
were grade 1 and only 10 % were grade 2.
3.9 Donor eight
With this donor [Figure 3.10] the rating was poor for all the fabrics, except
nylon which was medium to poor. On cotton half the samples showed no development
(days 3 – 7) and only zinc deposition though- day 7 did have a faint mark, which may
have been a finger impression. All the other samples were empty with days 1, 2 and 14
being grab impressions, which were either faint or only partial grabs and days 21 and
28 showing only fingertip marks giving a low overall grading of 0.5. The nylon samples
all had grab marks, however only four days (2, 5, 6 and 28) had palmar flexion creases
thus resulting in an overall grade of 1.5, meaning only a small chance of identification
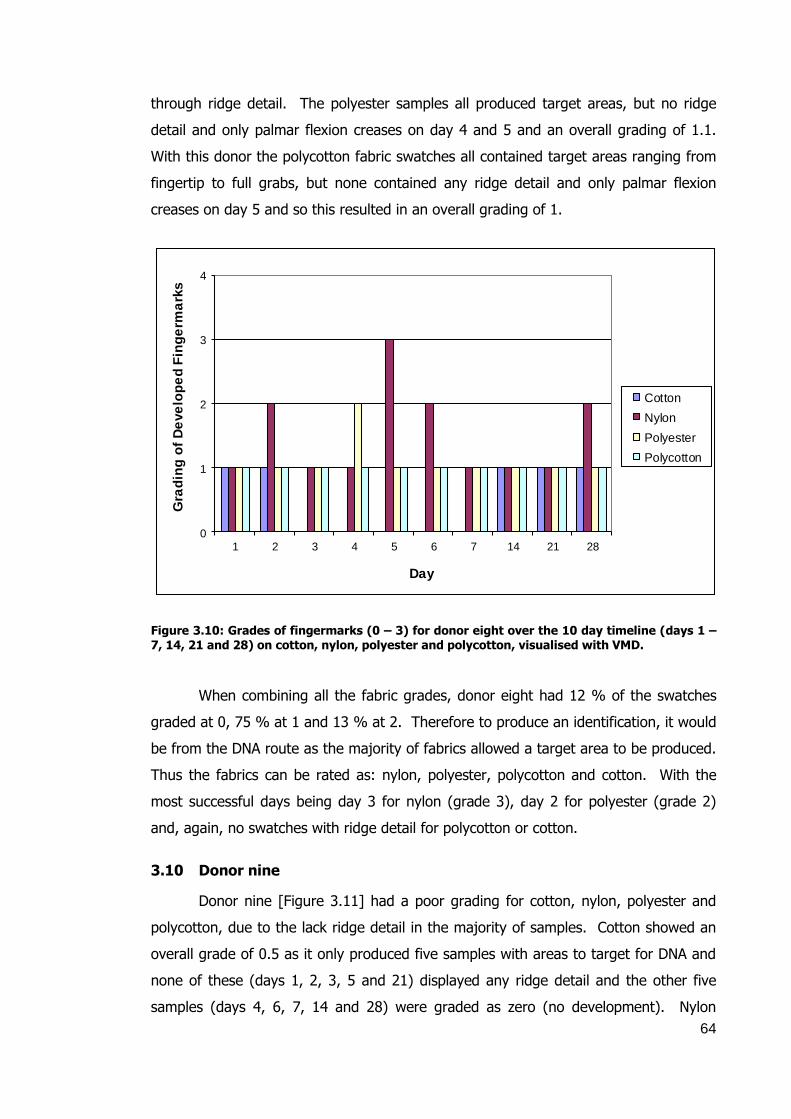
64
through ridge detail. The polyester samples all produced target areas, but no ridge
detail and only palmar flexion creases on day 4 and 5 and an overall grading of 1.1.
With this donor the polycotton fabric swatches all contained target areas ranging from
fingertip to full grabs, but none contained any ridge detail and only palmar flexion
creases on day 5 and so this resulted in an overall grading of 1.
0
1
2
3
4
1 2 3 4 5 6 7 14 21 28
Gra
din
g o
f D
eve
lop
ed
Fin
ge
rma
rks
Day
Cotton
Nylon
Polyester
Polycotton
Figure 3.10: Grades of fingermarks (0 – 3) for donor eight over the 10 day timeline (days 1 – 7, 14, 21 and 28) on cotton, nylon, polyester and polycotton, visualised with VMD.
When combining all the fabric grades, donor eight had 12 % of the swatches
graded at 0, 75 % at 1 and 13 % at 2. Therefore to produce an identification, it would
be from the DNA route as the majority of fabrics allowed a target area to be produced.
Thus the fabrics can be rated as: nylon, polyester, polycotton and cotton. With the
most successful days being day 3 for nylon (grade 3), day 2 for polyester (grade 2)
and, again, no swatches with ridge detail for polycotton or cotton.
3.10 Donor nine
Donor nine [Figure 3.11] had a poor grading for cotton, nylon, polyester and
polycotton, due to the lack ridge detail in the majority of samples. Cotton showed an
overall grade of 0.5 as it only produced five samples with areas to target for DNA and
none of these (days 1, 2, 3, 5 and 21) displayed any ridge detail and the other five
samples (days 4, 6, 7, 14 and 28) were graded as zero (no development). Nylon

65
showed an overall grade of 1.1 as there were two fair samples with some palmar
flexion creases (days 2 and 7), seven empty samples (days 1, 3, 4, 6, 14, 21 and 28)
with only small target areas for possible DNA collection and finally day 5 had no
development. Therefore with this lack of detail donor nine had a poor grading.
Polyester had an overall grading of 1 as it only produced one fair sample with faint
ridge detail on the thumb and first finger (day 3). All other days were empty (rating
1), ranging from faint grab impressions to fingertip impressions only, with the
exception of day 4 which had a possible fingertip and thumb impression and therefore
had a zero rating. Polycotton produced a fair rating for day 1 as there was ridge detail
on the thumb; however the other days were empty so producing an overall grading of
1.1.
0
1
2
3
4
1 2 3 4 5 6 7 14 21 28
Gra
din
g o
f D
eve
lop
ed
Fin
ge
rma
rks
Day
Cotton
Nylon
Polyester
Polycotton
Figure 3.11: Grades of fingermarks (0 – 2) for donor nine over the 10 day timeline (days 1 – 7, 14, 21 and 28) on cotton, nylon, polyester and polycotton, visualised with VMD.
Overall, this donor had a poor rating due to a lack of identifying ridge detail and
only had 10 % of swatches graded as 2, 72 % grade 1 and 18 % grade 0, so any
identification would have to come from the possible collection of DNA. The fabrics can
be still be rated in order of successful ridge detail as nylon, polycotton, polyester and
cotton. With the most successful days, all at grade 2, being day 1 for polycotton, days
2 and 7 for nylon, day 3 for polyester, and no grade 2 or above for cotton.
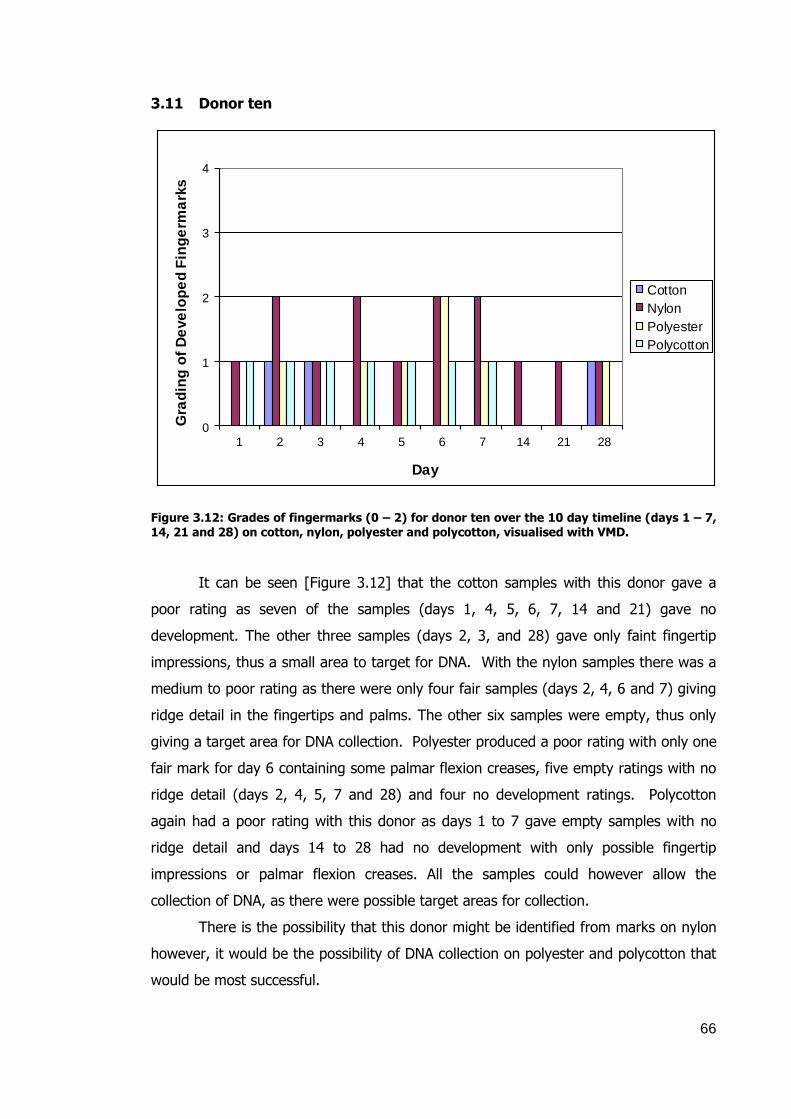
66
3.11 Donor ten
0
1
2
3
4
1 2 3 4 5 6 7 14 21 28
Gra
din
g o
f D
eve
lop
ed
Fin
ge
rma
rks
Day
Cotton
Nylon
Polyester
Polycotton
Figure 3.12: Grades of fingermarks (0 – 2) for donor ten over the 10 day timeline (days 1 – 7, 14, 21 and 28) on cotton, nylon, polyester and polycotton, visualised with VMD.
It can be seen [Figure 3.12] that the cotton samples with this donor gave a
poor rating as seven of the samples (days 1, 4, 5, 6, 7, 14 and 21) gave no
development. The other three samples (days 2, 3, and 28) gave only faint fingertip
impressions, thus a small area to target for DNA. With the nylon samples there was a
medium to poor rating as there were only four fair samples (days 2, 4, 6 and 7) giving
ridge detail in the fingertips and palms. The other six samples were empty, thus only
giving a target area for DNA collection. Polyester produced a poor rating with only one
fair mark for day 6 containing some palmar flexion creases, five empty ratings with no
ridge detail (days 2, 4, 5, 7 and 28) and four no development ratings. Polycotton
again had a poor rating with this donor as days 1 to 7 gave empty samples with no
ridge detail and days 14 to 28 had no development with only possible fingertip
impressions or palmar flexion creases. All the samples could however allow the
collection of DNA, as there were possible target areas for collection.
There is the possibility that this donor might be identified from marks on nylon
however, it would be the possibility of DNA collection on polyester and polycotton that
would be most successful.
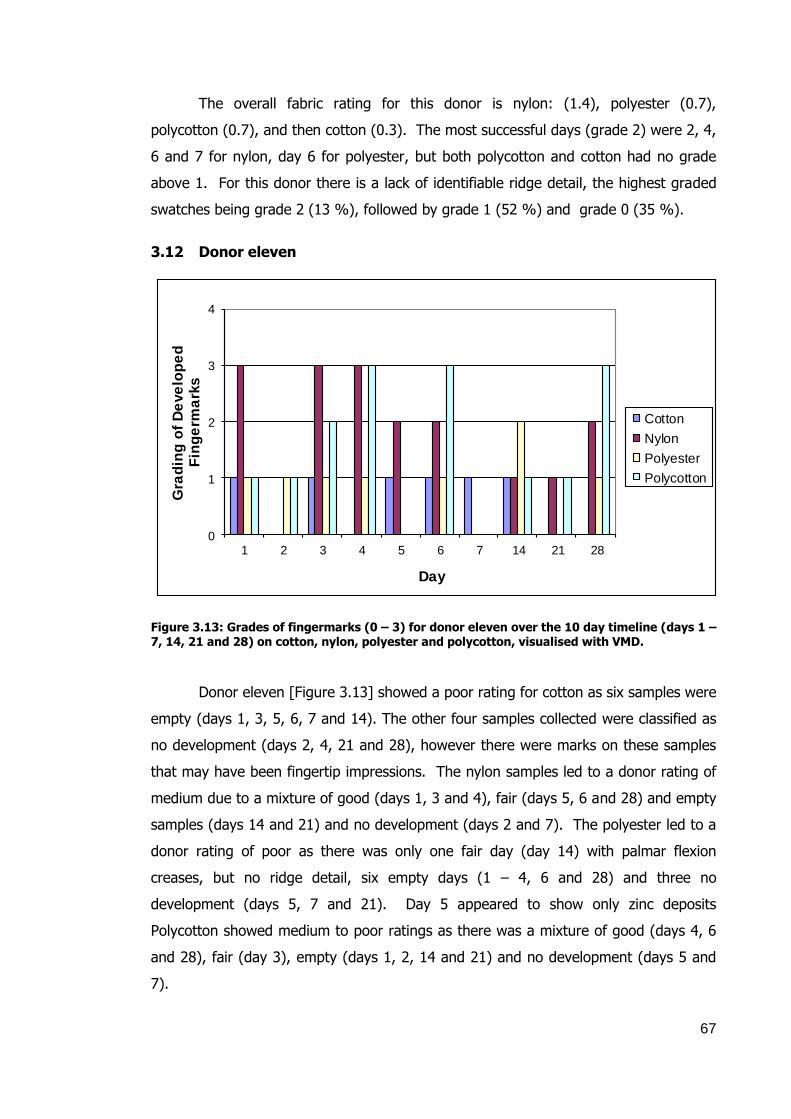
67
The overall fabric rating for this donor is nylon: (1.4), polyester (0.7),
polycotton (0.7), and then cotton (0.3). The most successful days (grade 2) were 2, 4,
6 and 7 for nylon, day 6 for polyester, but both polycotton and cotton had no grade
above 1. For this donor there is a lack of identifiable ridge detail, the highest graded
swatches being grade 2 (13 %), followed by grade 1 (52 %) and grade 0 (35 %).
3.12 Donor eleven
0
1
2
3
4
1 2 3 4 5 6 7 14 21 28
Gra
din
g o
f D
eve
lop
ed
F
ing
erm
ark
s
Day
Cotton
Nylon
Polyester
Polycotton
Figure 3.13: Grades of fingermarks (0 – 3) for donor eleven over the 10 day timeline (days 1 – 7, 14, 21 and 28) on cotton, nylon, polyester and polycotton, visualised with VMD.
Donor eleven [Figure 3.13] showed a poor rating for cotton as six samples were
empty (days 1, 3, 5, 6, 7 and 14). The other four samples collected were classified as
no development (days 2, 4, 21 and 28), however there were marks on these samples
that may have been fingertip impressions. The nylon samples led to a donor rating of
medium due to a mixture of good (days 1, 3 and 4), fair (days 5, 6 and 28) and empty
samples (days 14 and 21) and no development (days 2 and 7). The polyester led to a
donor rating of poor as there was only one fair day (day 14) with palmar flexion
creases, but no ridge detail, six empty days (1 – 4, 6 and 28) and three no
development (days 5, 7 and 21). Day 5 appeared to show only zinc deposits
Polycotton showed medium to poor ratings as there was a mixture of good (days 4, 6
and 28), fair (day 3), empty (days 1, 2, 14 and 21) and no development (days 5 and
7).

68
Overall, though this donor did have some identifiable ridge detail with nylon
and polycotton, the overall gradings had 82 % classed as unidentifiable (30 % at grade
0 and 52 % grade 1) and only 18 % being identifiable (10 % at grade 2 and 8 % at
grade 3). Therefore, this donor may be more likely to be identified by DNA collection,
as all days and fabrics gave some target areas or the possibility of a target area
(except polyester day 5). Thus, the overall fabric rating was nylon (1.7), polycotton
(1.5), polyester (0.8) and cotton (0.6) and the most successful days were 4, 6 and 28
for polycotton (grade 3), days 1, 3 and 4 for nylon (grade 3), day 14 for polyester
(grade 2) and no days for cotton.
3.13 Donor twelve
0
1
2
3
4
1 2 3 4 5 6 7 14 21 28
Gra
din
g o
f D
eve
lop
ed
Fin
ge
rma
rks
Day
Cotton
Nylon
Polyester
Polycotton
Figure 3.14: Grades of fingermarks (0 – 2) for donor twelve over the 10 day timeline (days 1 – 7, 14, 21 and 28) on cotton, nylon, polyester and polycotton, visualised with VMD.
With donor twelve [Figure 3.14] there was no development on any of the
cotton samples with only day 1 giving a possible finger impression, therefore the rating
was poor. The rating for nylon was also poor as there were only two fair samples (days
1 and 6), with faint ridge detail on some fingers, while the rest were empty. Polyester
also had a poor rating with only 3 days (1, 3 and 7) that were not classed as zero and
days 4 and 21 only had zinc deposits. With polycotton, the majority of days had no

69
development and only possible fingertip impressions or zinc deposits. Days 14 and 21,
though positive, were empty with only faint fingertip impressions.
Overall this donor produced very little ridge detail or target areas (with the
exception of nylon) and therefore little chance of identification. The fabrics can still be
rated: nylon (1.2), polyester (0.3), polycotton (0.2) and cotton (0). The only
successful fabric with swatches graded higher than 1 was days 2 and 6 for nylon
(grade 2) and this donor was poor for all the fabrics and this can be seen with the
overall grading percentages of – grade 0 (62 %), grade 1 (33 %) and grade 2 (5 %).
3.14 Donor thirteen
0
1
2
3
4
1 2 3 4 5 6 7 14 21 28
Gra
din
g o
f D
eve
lop
ed
Fin
ge
rma
rks
Day
Cotton
Nylon
Polyester
Polycotton
Figure 3.15: Grades of fingermarks (0 – 3) for donor thirteen over the 10 day timeline (days 1 – 7, 14, 21 and 28) on cotton, nylon, polyester and polycotton, visualised with VMD.
The rating for cotton [Figure 3.15] was again poor and of the 10 samples, six
contained no development (days 2, 3, 4, 5, 7 and 28). The other samples (days 1, 6,
14 and 21) were empty and only contained small target areas and no full grabs. The
nylon rating was medium to poor as there were six fair samples (1, 2, 3, 4, 7 and 14)
all containing ridge detail on some fingertips or palms. There were also three empty
samples (days 5, 6 and 21), containing faint grab or finger impressions and on day 28
a sample with no development. Therefore, all the samples with the exception of day
28 have areas that could be used to target for DNA. Polyester also had a rating of

70
medium to poor with three good samples (days 1, 2 and 7) which contained palmar
flexion creases and some ridge detail on the thumb and first finger. Also, polyester
had one fair sample (day 3) with ridge detail on the thumb; four empty samples (days
4, 14, 21 and 28) with faint grab and/or impressions and two samples with no
development (days 5 and 6). Polycotton gave a poor rating with only day 1 giving a
good rating as there were palmar flexion creases and ridge detail on the thumb and
day 7 being fair as there were some palmar flexion creases. Days 2 – 4, 14 and 21
were all empty and days 5, 6 and 28 had no development and only zinc deposits.
Therefore days 1 and 7 may help with identification however all days with the
exception of 5, 6 and 28 may produce a DNA profile to aid identification.
Overall, donor thirteen is more likely to be identified from DNA rather than from
ridge detail. It is still possible to give the fabrics a rating: polyester had some higher
grades but the same overall grading as nylon (1.5), polycotton (1) and cotton (0.4).
The most successful days for the fabrics were days 1 - 4, 7 and 14 for nylon (grade 2),
days 1, 2 and 7 for polyester (grade 3) and day 1 for polycotton (grade 3), while
cotton had no grade 2 or above swatches. With the gradings combined the
percentages show why this donor was poor. Though there are 10 % of the swatches
graded at 3, there were only 20 % grade 2, (thus a combined 30 % with ridge detail)
and grade 1 (10 %) and grade 0 (30 %).
3.15 Donor fifteen
This donor [Figure 3.16] had a rating of poor for cotton due to six samples
having no development (days 5 – 28) and two empty samples (days 2 and 4) with only
finger marks, which resulted in an overall grading of 0.4. The nylon rating for this
donor was medium. Day 1 gave no development; days 2, 3 and 7 were classed as
good as they all contained palmar flexion creases and detail in some of the fingertips;
days 4, 6, 14 and 21 were fair as all contained palmar flexion creases, while day 28
was classed as empty as there was only a grab with no ridge detail. Thus nylon
achieved an overall grading of 1.9. The polyester rating was poor (overall grade of
0.6) due to six samples having no development (days 1, 4, 6, 7, 21 and 28) and, of
these, only day 4 having possible fingertip and thumb tip marks. Of the four other
samples, there were two fair (days 3 and 5) and two empty (days 2 and 14) with only
ridge detail on the thumb of day 3 and thumb and three fingers of the day 5 sample.
Finally, polycotton was also poor (overall grade of 1) due to only days 1 to 3 producing

71
ridge detail or palmar flexion creases. Days 4, 5 and 14 were empty and days 6, 7, 21
and 28 had no development with only possible fingertip marks on day 7.
0
1
2
3
4
1 2 3 4 5 6 7 14 21 28
Gra
din
g o
f D
eve
lop
ed
Fin
ge
rma
rks
Day
Cotton
Nylon
Polyester
Polycotton
Figure 3.16: Grades of fingermarks (0 – 3) for donor fifteen over the 10 day timeline (days 1 – 7, 14, 21 and 28) on cotton, nylon, polyester and polycotton, visualised with VMD.
When combining all the grades it was determined that this donor produced
ridge detail on nylon, polyester and polycotton, though in most cases at low levels –
only 10 % grade 3 and 20 % grade 2 with the rest containing no ridge detail, 28 %
grade 1 and 42 % grade 0. This donor did however, produce more DNA target areas
therefore more likelihood of producing identification from a DNA profile than from ridge
detail. Fabric ratings for this donor are nylon, polycotton, polyester and cotton with
the most successful days being 2, 4 and 7 for nylon (grade 3), day 3 for polyester
(grade 3) and day 1 for polycotton (grade 2) and again no grade 2 or above for cotton.
3.16 Donor sixteen
This donor [Figure 3.17] rating on cotton was poor, with an overall grade of
0.5, due to half the samples being empty (days 1, 3, 7, 21 and 28) and the other half
having no development (days 2, 4, 5, 6 and 14). The nylon samples led to a medium
donor rating with an overall grading of 1.7 due to two good samples (days 1 and 2);
three fair samples (days 3, 6 and 7) and five empty samples (days 4, 5, 14, 21 and

72
28). The good and fair samples gave varying levels of ridge and palm detail, whereas
the empty samples would only be target areas from which to collect DNA.
0
1
2
3
4
1 2 3 4 5 6 7 14 21 28
Gra
din
g o
f D
eve
lop
ed
Fin
ge
rma
rks
Day
Cotton
Nylon
Polyester
Polycotton
Figure 3.17: Grades of fingermarks (0 – 3) for donor sixteen over the 10 day timeline (days 1 – 7, 14, 21 and 28) on cotton, nylon, polyester and polycotton, visualised with VMD.
The polyester gave a poor donor rating and an overall grading of 0.9 as there
were three fair days (1, 2 and 5), three empty samples (days 3, 4 and 6) and four
samples with no development (days 7, 14, 21 and 28). Polycotton produced a poor
rating (overall 0.8) due to two samples (days 1 and 5) containing some palmar flexion
creases and days 2, 3, 4 and 28 producing grab marks. The remaining days (6, 7, 14
and 21) had no development and half were zinc deposits only. Therefore the palmar
flexion creases may help in identification, though eight out of the ten samples may
yield DNA to produce a profile that could aid in identification.
Overall, this donor may be identified from marks on nylon however for the
other fabrics it is the possible DNA that may lead to an identification (except polyester
day 28). There were only 25 % of the swatches containing ridge detail – 20 % grade
2 and 5 % grade 3, the rest were 0 (33 %) and 1 (42 %). The overall fabric rating
order for this donor is: nylon, polyester, polycotton and cotton and the most successful
days were days 1 and 2 for nylon (grade 3), days 1, 2 and 5 for polyester (grade 2)
and days 1 and 5 for polycotton (grade 2) and again no swatches graded higher than 1
for cotton.

73
3.17 Donor twenty
0
1
2
3
4
1 2 3 4 5 6 7 14 21 28
Gra
din
g f
o D
eve
loped
Fin
germ
ark
s
Day
Cotton
Nylon
Polyester
Polycotton
Figure 3.18: Grades of fingermarks (0 – 3) for donor twenty over the 10 day timeline (days 1 – 7, 14, 21 and 28) on cotton, nylon, polyester and polycotton, visualised with VMD.
This donor [Figure 3.18] had an overall grading of 0.8 (poor) for cotton as eight
of the ten samples (days 1 – 14) were empty, while the other two samples showed no
development. The nylon rating was good (overall grading 2.4) with a mix of fair to
excellent samples and only one empty sample (day 28). The fair samples on days 2, 4
and 7 all contained some ridge detail and on day 14 there were palmar flexion creases.
The good samples on days 1 and 5 both contained palmar flexion creases and ridge
detail on three to four digits, while the two excellent samples (days 3 and 21) showed
palmar flexion creases and ridge detail on all digits, with day 21 having some of the
palm missing. The polyester rating was poor with three samples being fair (days 2, 6
and 7) with only palmar flexion creases and empty marks. The remainder (days 1, 3,
4, 5, 14 and 28) were empty with only target areas and no ridge detail, while day 21
had no development, only a possible thumb mark for DNA collection and an overall
grading of 1.2. The polycotton samples (overall grading of 1.5) produced a medium to
poor rating as there was an excellent sample (day 7) and a good sample (day 5) that
both produced ridge detail. The rest were fair (days 2 and 3) or empty (days 14 and
21).
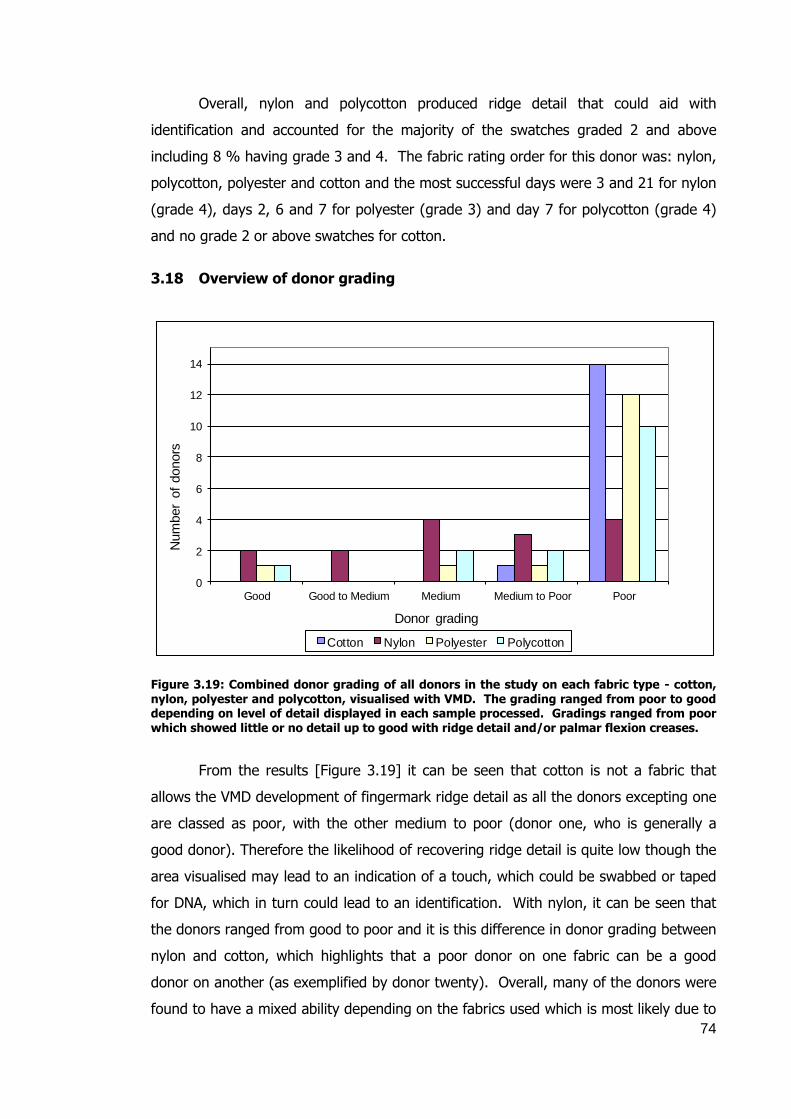
74
Overall, nylon and polycotton produced ridge detail that could aid with
identification and accounted for the majority of the swatches graded 2 and above
including 8 % having grade 3 and 4. The fabric rating order for this donor was: nylon,
polycotton, polyester and cotton and the most successful days were 3 and 21 for nylon
(grade 4), days 2, 6 and 7 for polyester (grade 3) and day 7 for polycotton (grade 4)
and no grade 2 or above swatches for cotton.
3.18 Overview of donor grading
0
2
4
6
8
10
12
14
Good Good to Medium Medium Medium to Poor Poor
Num
ber
of
donors
Donor grading
Cotton Nylon Polyester Polycotton
Figure 3.19: Combined donor grading of all donors in the study on each fabric type - cotton, nylon, polyester and polycotton, visualised with VMD. The grading ranged from poor to good depending on level of detail displayed in each sample processed. Gradings ranged from poor which showed little or no detail up to good with ridge detail and/or palmar flexion creases.
From the results [Figure 3.19] it can be seen that cotton is not a fabric that
allows the VMD development of fingermark ridge detail as all the donors excepting one
are classed as poor, with the other medium to poor (donor one, who is generally a
good donor). Therefore the likelihood of recovering ridge detail is quite low though the
area visualised may lead to an indication of a touch, which could be swabbed or taped
for DNA, which in turn could lead to an identification. With nylon, it can be seen that
the donors ranged from good to poor and it is this difference in donor grading between
nylon and cotton, which highlights that a poor donor on one fabric can be a good
donor on another (as exemplified by donor twenty). Overall, many of the donors were
found to have a mixed ability depending on the fabrics used which is most likely due to

75
the fabric surface and the levels of residues left thereon. In the case of cotton and
nylon there were only five donors that were found to be poor on both fabrics.
Polyester also did not appear to allow ridge detail visualisation with the majority
of donors (twelve) being rated as poor. Of the rest, one was good, one medium and
one medium to poor rating and there was only one donor (donor one), who had a
medium to poor rating for cotton and a good rating for nylon. With polycotton, ten of
the donors were poor, with the rest rated as medium/poor to good - the good donor
again being donor one.
The differences between the fabrics and the donor’s ability to leave ridge detail
could be due to certain fabrics allowing the fingerprint oils to evaporate more readily.
Also/alternatively, the fabric is more absorbent and therefore the oil deposits from the
donor’s hands do not stay on the fabric’s surface, which in turn could mean there will
not be any interference as to where the gold and zinc is deposited during the VMD
process. When comparing all the fabrics it appears that the smoother the surface the
more readily ridge detail is observed. For example, nylon is the smoothest fabric and
only four out of fifteen donors were rated as poor, compared to the roughest fabric
(cotton) having fourteen donors rated as poor and only one as medium to poor.
3.19 Amount and quality of ridge detail visualisation
This comparison of all the donors and days for each fabric is shown in Figure
3.20 – 3.27]. It can be seen by comparing the bar charts for cotton [Figure 3.20 and
3.21] and nylon [Figure 3.22 and 3.23] that the nylon samples produced much more
detail – eighty one nylon samples (graded higher than empty) compared to only three
cotton samples meeting this criteria. With cotton these three donors were: donor one
on day 1 graded as good and on day 14 as fair and donor two on day 1 with a fair
grading. When this is compared to the nylon samples, it can be seen that there are
many more samples ranging from fair to excellent and this amount of ridge detail could
increase the possibility of identification.
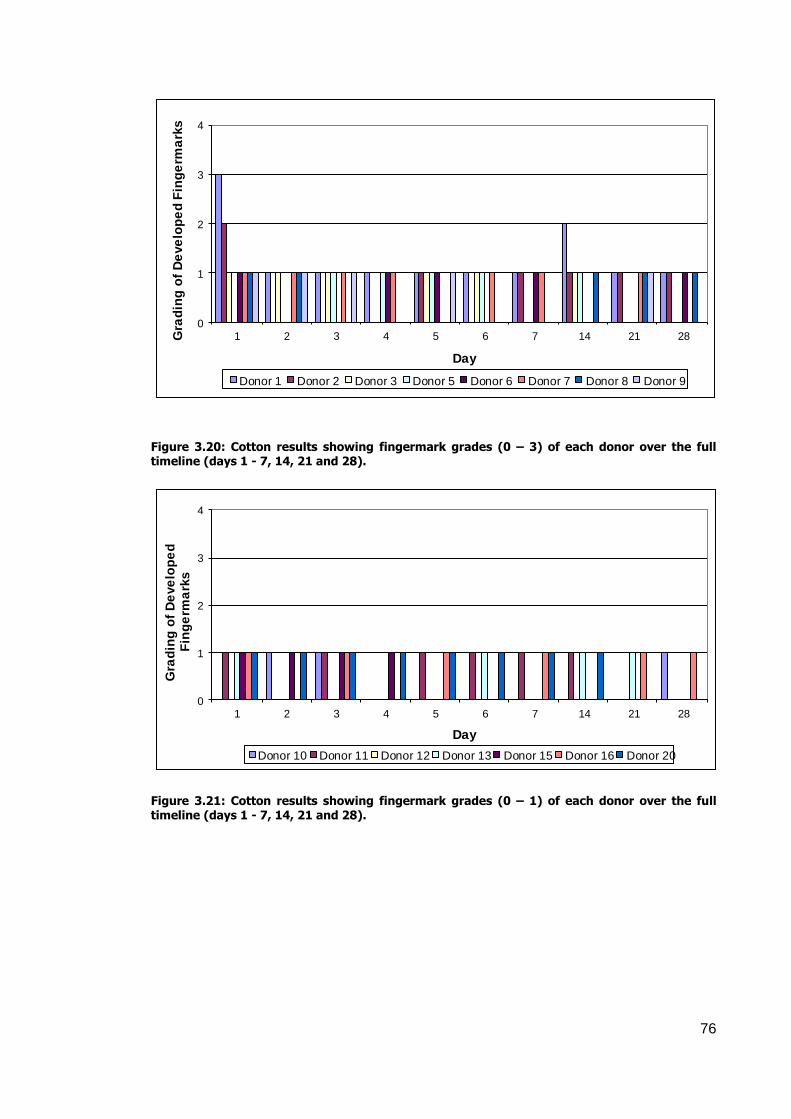
76
0
1
2
3
4
1 2 3 4 5 6 7 14 21 28Gra
din
g o
f D
eve
lop
ed
Fin
ge
rma
rks
Day
Donor 1 Donor 2 Donor 3 Donor 5 Donor 6 Donor 7 Donor 8 Donor 9
Figure 3.20: Cotton results showing fingermark grades (0 – 3) of each donor over the full timeline (days 1 - 7, 14, 21 and 28).
0
1
2
3
4
1 2 3 4 5 6 7 14 21 28
Gra
din
g o
f D
eve
lop
ed
F
ing
erm
ark
s
Day
Donor 10 Donor 11 Donor 12 Donor 13 Donor 15 Donor 16 Donor 20
Figure 3.21: Cotton results showing fingermark grades (0 – 1) of each donor over the full timeline (days 1 - 7, 14, 21 and 28).

77
0
1
2
3
4
1 2 3 4 5 6 7 14 21 28
Gra
din
g o
f D
eve
loped
Fin
germ
ark
s
Day
Donor 1 Donor 2 Donor 3 Donor 5 Donor 6 Donor 7 Donor 8 Donor 9
Figure 3.22: Nylon results showing fingermark grades (0 - 4) of each donor over the full timeline (days 1 - 7, 14, 21 and 28).
0
1
2
3
4
1 2 3 4 5 6 7 14 21 28
Gra
din
g f
or
De
ve
lop
ed
Fin
ge
rma
rks
Day
Donor 10 Donor 11 Donor 12 Donor 13 Donor 15 Donor 16 Donor 20
Figure 3.23: Nylon results showing fingermark grades (0 – 4) of each donor over the full
timeline (days 1 - 7, 14, 21 and 28).

78
0
1
2
3
4
1 2 3 4 5 6 7 14 21 28Gra
din
g o
f D
eve
lop
ed
Fin
ge
rma
rks
Day
Donor 1 Donor 2 Donor 3 Donor 5 Donor 6 Donor 7 Donor 8 Donor 9
Figure 3.24: Polyester results showing fingermark grades (0 – 4) of each donor over the full timeline (days 1 - 7, 14, 21 and 28).
0
1
2
3
4
1 2 3 4 5 6 7 14 21 28
Gra
din
g o
f D
eve
lop
ed
Fin
ge
rma
rks
Day
Donor 10 Donor 11 Donor 12 Donor 13 Donor 15 Donor 16 Donor 20
Figure 3.25: Polyester results showing fingermark grades (0 – 3) of each donor over the full timeline (days 1 - 7, 14, 21 and 28).
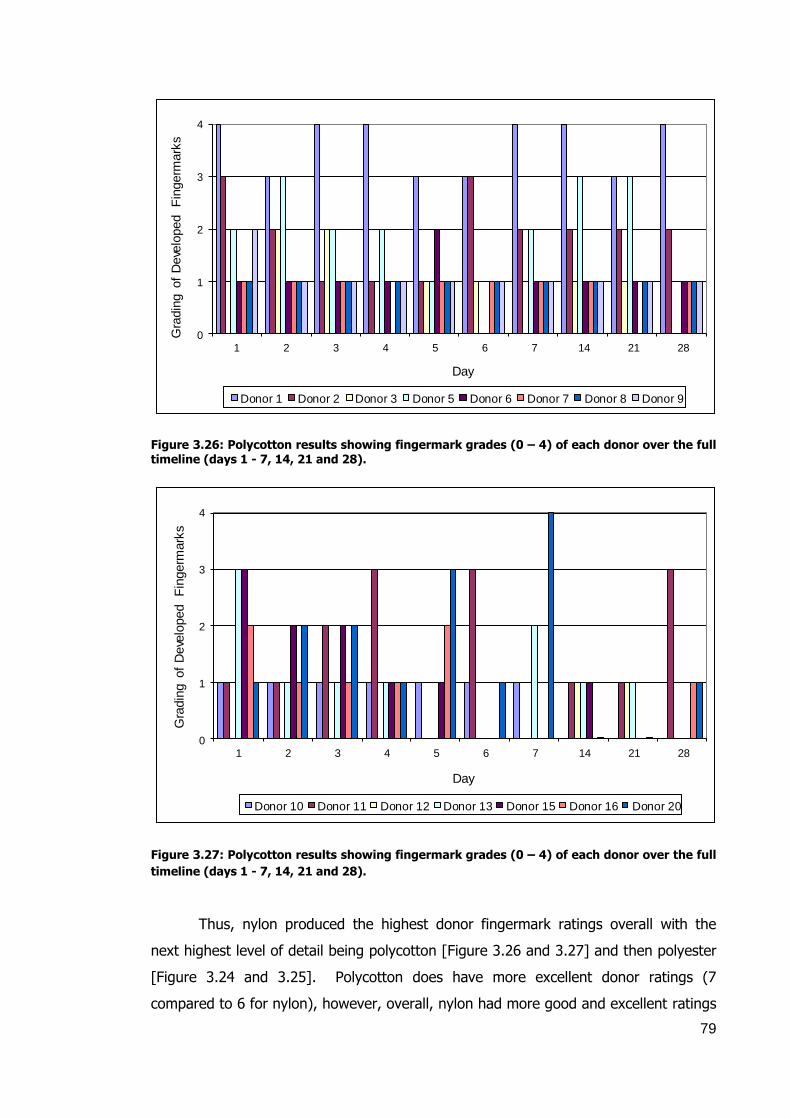
79
0
1
2
3
4
1 2 3 4 5 6 7 14 21 28
Gra
din
g o
f D
eve
loped
Fin
germ
ark
s
Day
Donor 1 Donor 2 Donor 3 Donor 5 Donor 6 Donor 7 Donor 8 Donor 9
Figure 3.26: Polycotton results showing fingermark grades (0 – 4) of each donor over the full timeline (days 1 - 7, 14, 21 and 28).
0
1
2
3
4
1 2 3 4 5 6 7 14 21 28
Gra
din
g o
f D
eve
loped
Fin
germ
ark
s
Day
Donor 10 Donor 11 Donor 12 Donor 13 Donor 15 Donor 16 Donor 20
Figure 3.27: Polycotton results showing fingermark grades (0 – 4) of each donor over the full
timeline (days 1 - 7, 14, 21 and 28).
Thus, nylon produced the highest donor fingermark ratings overall with the
next highest level of detail being polycotton [Figure 3.26 and 3.27] and then polyester
[Figure 3.24 and 3.25]. Polycotton does have more excellent donor ratings (7
compared to 6 for nylon), however, overall, nylon had more good and excellent ratings

80
(28) compared to polycotton (22) and polyester (9). Therefore, it can be seen that
nylon had more samples with identifiable detail, and thus can be considered to be the
fabric with the highest probability of acquiring a successful mark.
When considering all the fabrics there does not seem to be a pattern as to
when is the best time to obtain the greatest amount of ridge detail. For example, with
cotton all donors gave either empty or no development, with the exception of donor
one and two who left a good and a fair sample on day 1 and donor one on day 14
leaving a fair sample [Figure 3.20]. This reinforces the idea that cotton has a poor
ability to retain fingermark information. Donors on nylon are quite consistent in the
detail they leave. For example, donor one left good to excellent marks from day 1 to
14 (with only one fair on day 4), only going down to a fair on days 21 and 28. Whereas
donor seven only produced two fair samples on days 1 and 3, with the rest from days
4 – 7 being empty and days 21 and 28 being of no development. Both these donors
have less detail in days 21 and 28; however donors two and twenty left fair and
excellent detail on day 21.
When looking at polyester, again it is donor one that deposited the good to
excellent ridge detail (days 1, 3, 4 and 7) with donor thirteen also leaving good ridge
detail on days 1, 2 and 7. This high level of grading, thus detail was unusual for donor
thirteen as they usually did not leave any more than a ridge detail grading of fair to
empty and were generally classed as poor. This could be attributed to the donor doing
something different, such as the food they had eaten or activity level, on these days,
which allowed more deposits to be left and retained by the fabric.
With polycotton, it is again donor one who leaves the most ridge detail
information (six excellent and four good ratings) followed by donor eleven with three
good and donors two and twenty with two good ratings. In general, this fabric
visualises target areas with the exception of poor donors on the later days, though it is
still nylon that allows the more ridge detail to be seen.
Therefore these results demonstrate it is the donor and their ability rather than
the type of fabric that is the most important when considering how much detail is left.
The only conclusions that can be drawn about the amount of detail on each fabric is
that with nylon and polycotton there will be more chance of finding some ridge detail.
However, in a real case if a cotton or polyester article had been tested the day after
the incident and the assailant was an extremely good donor some detail might be
found.

81
3.20 Palmar flexion creases found on fabrics
Figure 3.28 demonstrates that all the fabric samples contained palmar flexion
creases on all ten days and that there were more samples with palmar flexion creases
than ridge detail. The amount of cotton samples with palmar flexion creases ranged
from only one in a day (days 2, 3, 5, 7, 14 and 21) to three in a day (days 1 and 28).
The amount of nylon samples with palmar flexion creases ranged from only three in a
day (day 28) to eight in a day (day 3). With polyester there was a high of seven out of
fifteen on day 7 to lows of two (days 3, 4 and 21) and one on day 28, whereas
polycotton had six donors with marks on their samples for day 1 and 7 followed by five
(days 2, 3 and 5) down to two on days 4 and 14. Though all the fabrics had swatches
that contained marks there were no days where all the samples of all the fabrics were
positive for palmar flexion creases. Overall, it was nylon again that showed the highest
number of swatches positive for palmar flexion creases, followed by polycotton,
polyester and cotton.
0
1
2
3
4
5
6
7
8
9
1 2 3 4 5 6 7 14 21 28
Nu
mb
er
of
Sa
mp
les
Wit
h P
alm
ar
Fle
xio
n
Cre
ase
s
Day
Cotton
Nylon
Polyester
Polycotton
Figure 3.28: Overall number of cotton, nylon, polyester and polycotton samples from all
donors over the whole timeline (days 1 – 7, 14, 21 and 28) which contained palmar flexion
creases.
Over the last decade there has been much research carried out on the
usefulness of palmar flexion creases and palm marks for identification purposes.
Examples include, biometric identification for entry systems, fingerprinting databases –
International Automated Fingerprint Identification System (IAFIS), National Automated

82
Fingerprint Identification System (NAFIS) (Nibouche, Jiang and Trundle 2012) and the
British IDENT1 (SPSA 2006a, 2006b, 2007), as well as the differences between
genetically identical individuals (Kong, Zhang and Lu 2006). Therefore, this shows that
though palm marks are not always considered in relation to suspect identification, they
can be used as identifiable markers, by use of the wrinkles, ridges and principal lines
found on the palms. This is especially relevant when considering it has been stated
“about 30 per cent of the latent marks recovered from crime scenes are from palms”
(Jain and Feng 2009).
3.21 Ridge detail found on test fabrics
Figure 3.29 shows cotton only had one day (day 1) and one sample that
displayed ridge detail, whereas nylon, polyester and polycotton showed such detail on
all of the days except day 28 in the case of nylon and polyester. The nylon samples
showed the most detail on days 1 and 2 with nine samples, hardly any on days 14 and
21 and none on day 28, which shows that the fresher samples (days 1 and 2) allowed
more detail to be developed and that, in the case of nylon, detail declined as the
samples aged.
0
2
4
6
8
10
1 2 3 4 5 6 7 14 21 28
Num
ber
of
Sam
ple
s C
onta
inin
g R
idge D
eta
il
Day
Cotton
Nylon
Polyester
Polycotton
Figure 3.29: Overall number of cotton, nylon, polyester and polycotton samples from all donors over the whole timeline (days 1 – 7, 14, 21 and 28) which contained ridge detail.

83
The fact that the level of ridge detail left is due to the freshness of the samples
is reinforced by the results from day 3 where seven nylon, five polyester and six
polycotton donors all left some form of ridge detail. Also noteworthy is the observation
that the number of donors leaving ridge detail reduces until day 21 when there are
only two donors on nylon and polycotton and one donor on polyester that leave ridge
detail and then on day 28 only two polycotton donors leaving ridge detail. All this
indicates that the best fabric is nylon followed by polycotton when it comes to allowing
the development of ridge detail by VMD. This could be explained by the weave
structure and the ability of the fabrics to absorb residues. Both factors could make it
more or less easy for the fabric to absorb the fingerprint residues or for them to
evaporate from the fabric surface. Therefore if the residues are absorbed or evaporate
then the VMD process will cover the fabric surface as there are no residues to stop the
zinc adhering to the gold and therefore no fingerprint residues will be visualised. Thus
the age of the samples does seem to have an effect on the level of detail visualised.
When considering the fabric the more open the weave or the rougher the surface, the
less ridge detail is visualised and conversely the tighter and/or smoother the weave the
more detail is observed. This is illustrated when the order of most detail is considered;
an average was calculated for each fabric type from the 150 samples (15 donors and
10 timeline samples). Nylon was the smoothest fabric with the most detail observed,
giving an average grade of 1.72, then polycotton with 1.18, polyester with 1.08, while
cotton only had 0.54. This may be expected as cotton was the roughest fabric,
showed the least ridge detail, palmar flexion creases and even target areas. These
results follow the same pattern as detailed in the 1993 study by Misner who
determined that the fabric needed to have a smooth surface and a fine weave to allow
detail to be visualised. Therefore, when considering the fabrics studied here and the
smoothness of each one the order and amount of detail observed is not unexpected.
Operationally, the amount of ridge detail could possibly be improved by
removing the samples from the VMD equipment, covering the areas of detail that need
to be preserved and protected and then reprocessing.
3.22 Statistical analysis of fabric suitability for VMD fingermark
visualisation.
The Kruskal-Wallis test was performed on data collated on the grades allocated
to each of the samples and fabric types processed with VMD. This was carried out in

84
an attempt to determine which of the fabric types would be most likely to allow the
visualisation of the highest level of detail, therefore be most likley to lead to ridge
detail and the possiblity of an identification. The null hypothesis (H0) is that there is no
difference between fabrics when the visualisation technique is VMD, and the alternative
hypotheis (HA) is that there is a difference. The hypothesis that is accepted is
dependent on the p-value. If this value is <0.05 the H0 is rejected and the HA
accepted and if the p-value is >0.05 then the opposite is the case.
As can be seen from Table 3.1 all of the fabric sets contained the same number of
samples (150), however their mean ranks were quite different and therefore could be
ranked in order of highest overall gradings. Nylon (401.95) being the fabric with the
highest number of graded samples, followed by polycotton (310.60), polyester
(294.55) and cotton (194.90) with the lowest number of graded samples. H0 can
therefore be rejected (p<0.001) and HA accepted meaning there is a difference
between the fabrics and therefore the level of detail that could be visualised on each of
the fabrics This fabric order is the same as discussed in section 3.21 thus these results
reinforce the opinion that the smoother tighter weave fabrics allow more viusalisation
of ridge detail and therefore have a higher likelihood of leading to an identifcation.
Table 3.1: Kruskal-Wallis test using fabric as the grouping variable to compare grades produced in the four fabrics (cotton, nylon, polyester and polycotton) visualised using VMD. Results show the number of each samples in each fabric set, the mean rank of each fabric set, the Kruskal-Wallis value, degrees of freedom and p-value.
Fabric Type Number Mean Rank Kruskal-
Wallis Value
Degrees of
Freedom p-value
Cotton 150 194.90
123.112 3 <0.001 Nylon 150 401.95
Polyester 150 294.55
Polycotton 150 310.60
3.23 Target areas for DNA on test fabrics
The ability of the fabrics to allow an individual to leave a target area on a
fabric, which could be tested for DNA, is shown in Figure 3.30. It can clearly be seen
that even though all materials have target areas every day, it is nylon that shows the
most with six of the days (days 2, 3, 4, 6, 7 and 21) when all of the donors left target
areas. The lowest number of donors to leave target areas is on day 28 but still 80 %
of the donors tested left a target area.

85
Figure 3.30: Overall percentage of cotton, nylon, polyester and polycotton samples from all donors over the whole timeline (days 1 – 7, 14, 21 and 28) which contained target areas.
The highest number of donors to leave target areas on cotton was on day 1 (86
%), but this falls to 60 % by day 2 and generally decreases to a minimum of 40 %
(day 28). This information again reinforces the opinion that nylon is a more effective
fabric from which to recover information about the individual, be that DNA or
fingermark detail and that it constantly gives more information than cotton.
Neither polyester nor polycotton have a 100 % day, though both have days
were fourteen (93 %) donors produced a target area – polyester on day 3 and
polycotton on days 2 and 3. The rest of the days ranged from a low of 60 %
(polyester days 4 and 21 and polycotton day 28) to a high of 87 % (polyester day 2
and polycotton day 1).
In conclusion, of the fabrics utilised in this study nylon demonstrates a better
ability to retain fingerprint residues and therefore allow more ridge detail to be
developed through VMD. However, all the fabrics have the propensity to allow
development of impressions, from small fingertip to full grabs that could be utilised as
target areas for DNA.

86
3.24 Visualisation of samples by means other than photography
It was found that ridge detail that could be seen on samples by the naked eye
was not reproduced when photographed, due to the fabric weave interfering or
disguising the mark. The use of fast Fourier transform (FFT) did lead to improved
contrast between the fabric and the ridge detail, thus allowing some to be more easily
seen. Paul Deacon (2012. pers. comm., 5 December) carried out some FFT work on
samples produced in this study and this showed a reduction in the background
patterns caused by the fabric weave, enabling more ridge detail to be viewed which
made it easier to see and determine the ridges and thus aid in identification. For
example, Figure 3.31 and 3.32 show swatches with clear hand grabs. However the
photographs on the left hand side of both, were taken with a Nikon D50 camera under
normal white lighting and no real ridge detail can be observed in the fingertips even
though it could be seen by the naked eye [Figure 3.31 was graded as a 4 and Figure
3.32 a grade 3]. The right hand side photographs in each figure shows improvement
after using a Nikon D300 camera and a FFT software package and in Figure 3.31, ridge
detail in all the fingers can clearly be seen, whereas in the original photograph the
fingers look empty. Figure 3.32 shows the same improvement in that the flexion
creases on the palm and fingers as well as in the fingertip. The use of FFT led to
increased ridge detail in many of the samples tested. However, these samples were
not regraded in the main study as they were only a small selection and not all the
other samples had FFT performed on them and therefore were not regraded, thus the
inclusion of this new data may have led to the overall results becoming skewed.
This is reinforced by the work carried out in conjunction with Jen Raymond of
the NSW Police during a visit to Australia (2010. pers. comm., 30 August), here three
different fabric types (pink polyester, black and white striped satin and brown cotton)
had marks planted and were processed with gold + zinc VMD.

87
Figure 3.31: Day 2, donor one, nylon VMD visualised swatch. Image on left taken with Nikon D50 – palmar flexion creases visible, though all marks are empty. Image on right after FFT – ridge detail can now be seen in the fingertips (Deacon 2013a).
Figure 3.32: Day 2, donor fifteen, nylon VMD visualised swatch. Image on left taken with Nikon D50 – showing limited ridge detail. Image on right after FFT – showing enhanced ridge detail in palm and on fingers (Deacon 2013b).

88
Figure 3.33: Pink polyester fabric grab sample visualised using VMD and photographed under
white light, showing only a faint grab and limited detail (Raymond 2010a).
On the processed swatches, varying levels of detail were observed, but again
less was seen in the photographs than by the naked eye. With the pink polyester it
was found that small reflections on the surface of the fabric made it difficult to
visualise the ridge detail [Figure 3.33]. Consequently, cross-polarised light was
investigated where a circular polarising filter on the light source and lens was rotated
until the reflections disappeared. This made the ridges easier to see due to less
interference from the fabric weave [Figure 3.34]. FFT was also used, which further
improved the ridge detail that could be observed [Figure 3.35] as there was even less
interference from the weave.

89
Figure 3.34: The same pink polyester fabric grab as in figure 3.33 photographed using cross-
polarised lights, shows a clearer and more obvious grab (Raymond 2010b).
Figure 3.35: The same pink polyester fabric grab from figure 3.33 showing further
enhancement by photographing using a FFT filter. Both the hand and ridge detail is more
obvious with FFT than with either white or cross-polarised light (Raymond 2010c).

90
When black and white satin was viewed with white light there was the
compounding factors of two different colours as well as the fabric weave and
reflections, therefore it was difficult to see any ridge detail. This was improved slightly
by the use of a shift lens and a diffuse white light box or specular light held beside the
lens and the use of FFT improved it a little more by removing more of the fabric
weave. However it was the use of infra-red light that led to the greatest improvement;
here tungsten lighting was shone on the sample and photographed with an IR blocking
filter removed and an IR pass filter fitted on the lens of the camera. With the use of
IR the fabric pattern was completely removed, however some interference from the
fabric weave could still be seen, which still interfered with the visualisation of the ridge
detail. The use of all these techniques aided in the improvement of the recorded ridge
detail, which in turn could help in the interpretation of the marks, and, hence, a
successful identification of an individual. The above methods of enhancement involved
the use of different photography and lighting conditions; however a simpler method of
improving the marks further was demonstrated on the satin. This involved the VMD
developed marks being treated with magnetic black powder, then tape and gel lifts
were used to remove the marks from the fabric. As they were no longer sitting on the
surface of the fabric, but on a clear and un-patterned surface, there was no longer an
issue in terms of the fabric weave obscuring the ridge detail.
The VMD development of the brown cotton fabric was less successful than the
other fabrics and the original image did not show much of detail; however it was
determined that something as simple as changing the background upon which the
swatch is photographed could improve the detail observed. This is illustrated in Figure
3.36 and 3.37 where cross polarised light was used to take photographs on both a
white and a black background. It was determined that the black background was the
more effective and this was further enhanced with inverse FFT [Figure 3.38] allowing
palmar flexion creases to be more clearly seen, along with flexion creases on the
fingers. Though the fingertips are still empty this new information could at the least
include or exclude an individual as a suspect in a case.

91
Figure 3.36: Brown cotton fabric grab sample visualised using VMD photographed with white
light on white background, showing an extremely faint hand mark with little detail (Raymond
2010d).
Figure 3.37: Brown cotton fabric grab sample visualised using VMD photographed with white
light on black background. Here the hand became a little more obvious with the introduction
of a darker background (Raymond 2010e).

92
Figure 3.38: Brown cotton grab sample visualised using VMD photographed with white light
on black background after inverse FFT. This combination of coloured background and FFT led
to a more obvious hand mark with clearer ridge detail (Raymond 2010f).
3.25 Conclusion
When considering all the fabrics it seems that it is the less porous and
smoother fabrics with the tighter weave that display the most ridge detail. For
example, compare nylon to the fabrics with a rougher and/or more porous surface
which only seemed to display empty pints or grab outlines. However, even though
these marks may not help with identification through ridge detail they could be used to
target for DNA, rather than taping or swabbing the whole article or for a way of
corroborating or refuting the sequence of events. There is an issue of the fabric
weave obscuring or interfering with the level of ridge detail that can be recorded
photographically, however the use of FFT or IR photography seems to be a way of
combating this problem. Therefore, in future work a digital camera system (DCS),
such as those regularly used by the forensic police laboratories, must be used to
record and enhance the images. Thus, enhancement, such as that produced by FFT
could be used to increase the level of detail observed as well as reduce the
background interference from the fabric weave and this higher level of detail would
lead to a greater chance of identification. As this technique was not used in the main

93
study the impact cannot be determined as to the full effect the use of FFT could have
had on the final grades of each mark, however it could be suggested that many of the
marks would have resulted in a higher grade.
The age of the sample does seem to impact on the level of detail visualised by
the VMD process, so it would be advantageous to process items as soon as possible
after acquisition in order to optimise the amount of detail visualised. Therefore if an
individual reports an assault within the first few days, there may be a higher chance of
visualising ridged detail. The report by Kelly, Lovett and Regan in 2005 states that in
most cases if an individual is going to be report an assault they generally do so within
the first few days. Thus it is likely that with a suitable fabric, ridge detail may be
observed, however even if the article is not processed quickly this study has also
demonstrated that older samples can contain ridge detail or palmar flexion creases as
well as showing areas from which to collect DNA samples.
The biggest factor regarding whether ridge detail is, or is not, observed is the
donor. A good donor can regularly provide excellent marks in the form of ridge detail
in the fingertips, on the palms, as well as visible areas to swab for DNA. While poor
donors do not leave good detail, which may be due to their drier skin and consequently
having lower levels of residues, which in turn would not allow for as high a level of
detail, however there is still the possibility of collection of DNA and an identification via
a DNA profile.
Therefore, VMD should be considered as a useful tool in the identification of
ridge detail in the fingertips and palms as well as visualising areas to target for DNA
collection, all of which could aid in the identification of assailants from victim’s clothing.

94
4. VISUALISATION OF FINGERMARKS ON FABRIC SAMPLES BY MEANS
OF CYANOACRYLATE FUMING (CAF)
4.1 Aims
To use CAF in order to determine the level of fingermark and palm ridge detail
on fabrics and to discover the quality of marks visualised on cotton, nylon, polyester
and polycotton and determine the variability between fifteen donors and the effect of
ageing the samples over a 28 days.
4.2 Donor one
0
1
2
3
4
1 2 3 4 5 6 7 14 21 28
Gra
din
g o
f D
eve
lop
ed
Fin
ge
rma
rks
Day
Cotton
Nylon
Polyester
Polycotton
Figure 4.1: Grades of fingermarks (0 – 2) for donor one over the 10 day timeline (days 1 – 7, 14, 21 and 28) on cotton, nylon, polyester and polycotton, visualised with CAF.
Figure 4.1 shows that donor one had a poor rating for nylon, cotton, polyester
and polycotton due to the lack of any target areas on all samples except day 7
polyester [Figure 4.2] and this sample only had the possibility of a fingertip impression.
Therefore, each of these fabrics had an overall fingermark grading of 0. Though nylon
also achieved a poor donor rating as all but two samples (days 4 and 5) displaying
target areas - these ranged from a faint hand grab (grade 1) to full grab with palmar
flexion creases (grade 2)[Figure 4.3]. This resulted in nylon achieving an overall
grading of 1 and, though none of the samples showed any ridge detail, four of them

95
(days 2, 6, 21 and 28) contained palmar flexion creases therefore these could possibly
help in identification.
Figure 4.2: Possible fingertip mark on donor one, day 7, polyester fabric sample, visualised with CAF/BY40, photographed with a Nikon D40, a yellow (476nm) filter and blue Crime lite (420 - 470nm).
Overall, this donor did not leave successful marks – 80 % were graded as 0
with only 15 % grade 1 and two samples (5 %) graded as 2. When considering DNA
collection, eight out of ten nylon samples had grabs that could be used as target areas
for DNA and though it was not determined, in this work; whether the CAF would
interfere with DNA collection several reports have indicated that this is not
problematical. In both the Lee and Gaensslen (2001) and Ramotowski (2013) editions
of “Advances in Fingerprint Technology” it is stated that the person examining an
article used to have to decide whether the DNA or the mark was the most important,
as DNA analyses used to be effected by CAF, but with the advances that have been
made in DNA processing it is no longer necessary as less of the chemical fingerprinting
techniques “inhibit sample analyses” (Lee and Gaensslen 2001, p: 91) and that
extremely small amounts of DNA have been collected and processed. This is
reinforced by the comments in the papers of Bille, Cromartie and Farr (2009) and
Wickenheiser and Challoner [no date] who indicate that the use of CAF still allowed for
full DNA profiling and the fuming process may actually help by causing the cells and,
thus DNA, to be secured to the item. Wickenheiser and Challoner (1999, p:3)
hypothesised that the cyanoacrylate (CA) covered the skin cells and kept them on the

96
item until they are collected later by swabbing or taping, therefore making CAF a “non-
DNA-destructive” technique.
Figure 4.3: Full hand grab demonstrating palm lines and empty marks on donor one, day 6, nylon sample, visualised with CAF/BY40, photographed with a Nikon D40, a yellow (476nm) filter and blue Crime lite (420 - 470nm).
4.3 Donor two
Donor two also had poor ratings for cotton, polycotton and polyester with all
samples having no development or target areas [Figure 4.4], with the exception of day
7, polyester having a possibility of a fingertip impression. Therefore each of these
fabrics has overall gradings of 0. The overall nylon rating was also poor however there
were four fair ratings (days 1, 6, 7 and 14, all grade 2), five empty ratings (days 2, 3,
5, 21 and 28, all grade 1) and one no development rating (day 4). This gave nylon an
overall fingermark grading of 1.3, though again none of the samples produced ridge
detail that could help in identification. This low overall grade is due to the high
percentage (65 %) of grade 0 samples and only 23 % for grade 1 samples. However,
days 1 [Figure 4.5], 6, 7, 14 and possibly 5, had palmar flexion creases (13 % of all
swatches) that could help in identification. Thus, all days, except 4, had target areas
these could be taped for DNA.

97
0
1
2
3
4
1 2 3 4 5 6 7 14 21 28
Gra
din
g o
f D
ev
elo
pe
d F
ing
erm
ark
s
Day
Cotton
Nylon
Polyester
Polycotton
Figure 4.4: Grades of fingermarks (0 – 2) for donor two over the 10 day timeline (days 1 – 7, 14, 21 and 28) on cotton, nylon, polyester and polycotton, visualised with CAF.
Figure 4.5: Full hand grab demonstrating palm lines and empty marks on donor two, day 1,
nylon sample, visualised with CAF/BY40, photographed with a Nikon D40, a yellow (476nm)
filter and blue Crime lite (420 - 470nm).
4.4 Donor three
With donor three, there was a lack of development and target areas so their
donor rating was poor with an overall grading of 0 for cotton, polycotton and polyester.
However, this time there were two days, 7 and 28, that produced the possibility of

98
target areas in the form of thumb and fingertip marks on polyester. The nylon rating
for this donor was also poor, however with this fabric day 2 had a fair rating (grade 2),
four days were empty (days 6, 7, 21 and 28, grade 1) and there was four no
development ratings (days 1, 3, 4 and 14, grade 0). Nevertheless, all these days have
the possibility of target areas and only one day (5) with no development at all. This
does of course mean that for nylon with an overall fingermark grading of 0.6 there are
no fingermark details that could help lead to an identification. This is reinforced by the
overall percentages – grade 0 (87 %), grade 1 (10 %) and grade 2 (3 %).
4.5 Donor five
Figure 4.6: Faint hand grab with empty marks and possible palm lines on donor five, day 2,
nylon sample, visualised with CAF/BY40, photographed with a Nikon D40, a yellow (476nm)
filter and blue Crime lite (420 - 470nm).
Donor five had one polyester sample, on day 5, that showed a possibility of a
fingertip and palm mark, however both cotton and polycotton showed no development
and therefore this donor was rated as poor and had an overall grading of 0 for each
fabric type. The nylon samples were rated as poor and had an overall fingermark
grading of 0.8, due to lack of identifying detail with two no development (days 5 and
28, grade 0) with one having a possible target area and all the others (days 1, 2
[Figure 4.6], 3, 4, 6, 7, 14 and 21, grade 1) being empty. The empty samples ranged

99
from full grab with possible palmar flexion creases to extremely faint grabs and of
these samples, nine could be taped for the collection of DNA. Ridge detail
identification is not possible with these samples, as 80 % had a grade 0 and 20 % a
grade 1.
4.6 Donor six
Donor six had one polyester sample (day 7) with a possible palm mark, while
cotton and polycotton produced no development and therefore a poor donor rating and
overall grade of 0 for each of these fabric types. The nylon rating was also poor due
to only three samples out of ten having a rating other than no development (days 2, 5
and 14, grade 1), thus grades of 1 and an overall fingermark grading of 0.3. However,
of the remaining seven there were no development samples, three had the possibility
of producing a target area for DNA collection. With these samples there is not much
chance of identification as 92 % were grade 0 and only 8 % grade 1. Of these grade 1
samples only day 5 had palmar flexion creases and none had any ridge detail.
4.7 Donor seven
Donor seven had a poor rating for all four fabrics, due to there being very few
observable marks, none on cotton or polycotton and only seven marks on the nylon
and polyester swatches. For polyester, the only positive mark was day 5, with this
sample having the possibility of fingertip and thumb impressions. Nylon had one
empty grade 1 rating (day 2) which was a faint grab, while days 1, 5, 6, 7 and 14 have
the possibility of fingertip and palmar flexion creases, so were graded as 0, which led
to an overall fingermark grade of 0.1. Thus, this donor has little chance of
identification via ridge detail due to 97 % of the swatches being graded as 0 and only
3 % having a grade of 1.
4.8 Donor eight
Donor eight also had a poor rating for all four fabrics due to lack of any
development. Cotton produced a possible mark of the donor’s thumb, palm and
fingertip on day 3, but was graded as 0 for all days. Nylon on the other hand was still
poor for the donor rating, as most of the samples were grade 0 (92 %) and the rest
were grade 1 (8 %). These grade 1 empty ratings (days 7, 14 and 28) were faint
grabs and fingertip marks but had no ridge detail. As nylon had the only positive

100
samples, the overall fingermark grading was 0.3 for nylon, with 0 for cotton, polyester
and polycotton.
4.9 Donor nine
0
1
2
3
4
1 2 3 4 5 6 7 14 21 28
Gra
din
g o
f D
ev
elo
pe
d F
ing
erm
ark
s
Day
Cotton
Nylon
Polyester
Polycotton
Figure 4.7: Grades of fingermarks (0 – 2) for donor nine over the 10 day timeline (days 1 – 7, 14, 21 and 28) on cotton, nylon, polyester and polycotton, visualised with CAF.
Figure 4.8: Donor nine, day 2, nylon sample, illustrating a hand grab with palm lines.
Photographed with a Nikon D40 camera, a yellow (476nm) filter and blue Crime lite (420 -
470nm).

101
Donor nine [Figure 4.7] had a poor donor rating for all the fabrics and overall
fingermark grades of 0, except for nylon, with an overall fingermark grade of 0.8,
(calculated from 82 % at grade 0, 15 % at grade 1 and 3 % at grade 2). When
considering each fabric separately, cotton had no development in all of the samples;
polyester had possible fingertip and thumb marks for days 1, 2 and 7; and polycotton
had possible target areas, in the form of possible thumb and fingertip marks, on day
21. Nylon had one fair rating on day 2 (grade 2) [Figure 4.8] as there were palmar
flexion creases in the grab mark that could aid in identification. Nylon also had six
empty days (1, 4, 5, 7, 14 and 28, grade 1), which gave obvious marks, though these
could not be used for identification, as they did not contain any ridge detail, but these
areas could be targeted for DNA.
4.10 Donor ten
Figure 4.9: Donor ten, day 2, nylon sample, illustrating a hand grab with palm lines.
Photographed with a Nikon D40, a yellow (476nm) filter and blue Crime lite (420 - 470nm).
Donor ten had a poor rating for polyester, polycotton and cotton (overall grades
of 0) due to lack of development of marks or target areas, though day 3 cotton did
have a possible thumb and fingermark so a target area for DNA. The nylon rating was
poor also as there was only one no development (day 5, grade 0), along with one fair
(day 2, grade 2) and the remaining eight were grade 1, giving an average overall
102
fingermark grade of 1.0. These samples contained some palmar flexion creases
[Figure 4.9], which may help produce an identification of the donor, however the very
low overall percentages from all the fabrics of 77 % with grade 0, 20 % with grade 1
and 3 % with grade 2 means that identification of the donor is extremely unlikely.
4.11 Donor eleven
Donor eleven had no development for cotton, polyester and polycotton, thus
these fabrics had a poor rating and overall fingermark gradings of 0. Nylon had a poor
donor rating and an overall fingermark grading of 0.6 due to there being six empty
rated days (1, 2, 4, 7, 14 and 21, grade 1), which had grabs and target areas. Though
the overall grade percentages from all the fabrics were only 0 (90 %) and 1 (10 %),
thus there is little evidence of the fabrics being touched. This could help in confirming
or refuting a case scenario as well as giving target areas that could be used to tape for
DNA and possibly produce a DNA profile.
4.12 Donor twelve
Donor twelve had a percentage of 85 % at grade 0, 12 % for grade 1 and 3 %
for grade 2, thus an overall poor grading. Cotton, polycotton and polyester had overall
grade rating 0 due to no development, though there were three possible days on
polyester (5, 7 and 14), which could be targeted for DNA. The nylon fabric showed a
poor donor rating with an overall grade of 0.7. This was produced from one fair day
(day 2, grade 2) with palmar flexion creases; five empty days (3, 6, 7, 14 and 21,
grade 1) with some palmar flexion creases and obvious target areas for DNA taping
and three no development days (1, 5 and 28, grade 0) with no marks or target areas.
4.13 Donor thirteen
Donor thirteen also had no development (grade 0) for cotton, polyester and
polycotton, thus was rated as poor for all three fabrics. Polyester did have one day
(day 2) that had a possible target area that could be taped for DNA. Though 80 % of
all the swatches were grade 0, nylon had eight samples (20 %) assessed as empty
(grade 1), thus giving an overall rating of poor with target areas ranging from
extremely faint grabs to full grabs with possible palmar flexion creases that could aid in
identification. All of the days with the exception of day 3 produced target areas that
could be swabbed for DNA.

103
4.14 Donor fifteen
Donor fifteen was rated at poor (grade 0) for all the fabrics. Polyester did have
one day (day 3) with possible fingertip marks thus an area to target for DNA. Nylon is
the only other fabric to have faint grabs and fingertip marks (days 2, 4, 6, 14 and 28),
which led to an overall grading of 0.5. One nylon sample (day 28) even had possible
palmar flexion creases, which could aid identification, while all the others with the
exception of day 3 and 5 have potential target areas. Thus, with overall percentages
of 87 % of grade 0 and 13 % of grade 1 identification of the donor would have to
come from taping the target areas for DNA, as there is no ridge detail to help with an
identification.
4.15 Donor sixteen
Donor sixteen only had two days (7 and 14) that showed possible target areas
on polyester, while nylon had four empty days (1, 6, 14 and 21, grade 1) with faint
grabs and three days (3, 4 and 7, grade 0) with possible grab and fingertip marks,
while all other samples were negative. Thus the overall fingermark grading for nylon
was 0.4 while polyester, cotton and polycotton were grade 0, the lack of marks and
target areas on all the fabrics resulted in a donor rating of poor. Overall for donor
sixteen, the grades were 90 % at 0 and 10 % at grade 1 meaning that there were no
identifying details.
4.16 Donor twenty
Donor twenty had a poor rating for all the fabrics, this is due to all the cotton
and polyester samples being grade 0, while only one (day 1, grade 0) polycotton
sample having possible thumb and fingertip marks. Nylon had three positive samples,
one sample (day 6) had a fair rating (grade 2) as the grab mark produced had palmar
flexion creases and two samples (day 2 and 5) were rated as empty with faint grabs
(grade 1). Overall this donor had 92 % at grade 0, 5 % grade 1 and 3 % grade 2,
which would not aid in identification but may point to possible target areas that could
be taped for DNA.
4.17 Statistical analysis of CAF fingermark visualisation on cotton, nylon,
polyester and polycotton
The Kruskal-Wallis test was performed on data collated on the CAF processed
samples, in an attempt to determine which of the fabric types would be most likely to
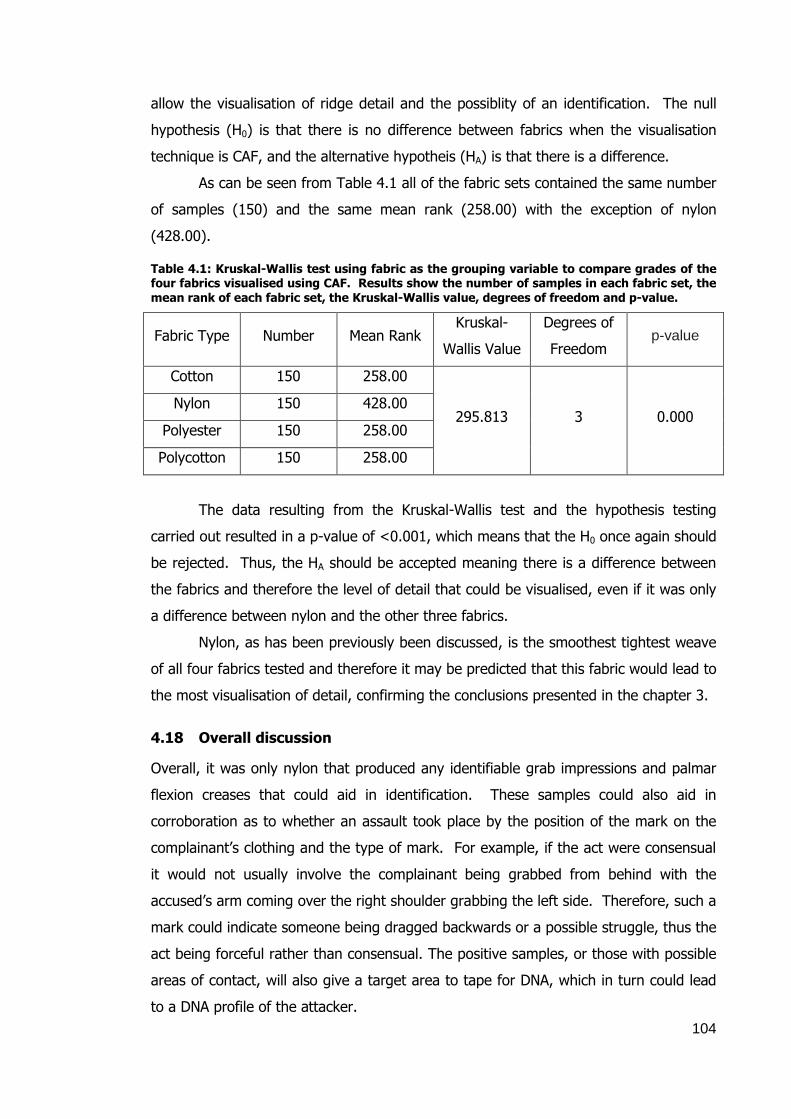
104
allow the visualisation of ridge detail and the possiblity of an identification. The null
hypothesis (H0) is that there is no difference between fabrics when the visualisation
technique is CAF, and the alternative hypotheis (HA) is that there is a difference.
As can be seen from Table 4.1 all of the fabric sets contained the same number
of samples (150) and the same mean rank (258.00) with the exception of nylon
(428.00).
Table 4.1: Kruskal-Wallis test using fabric as the grouping variable to compare grades of the four fabrics visualised using CAF. Results show the number of samples in each fabric set, the mean rank of each fabric set, the Kruskal-Wallis value, degrees of freedom and p-value.
Fabric Type Number Mean Rank Kruskal-
Wallis Value
Degrees of
Freedom p-value
Cotton 150 258.00
295.813 3 0.000 Nylon 150 428.00
Polyester 150 258.00
Polycotton 150 258.00
The data resulting from the Kruskal-Wallis test and the hypothesis testing
carried out resulted in a p-value of <0.001, which means that the H0 once again should
be rejected. Thus, the HA should be accepted meaning there is a difference between
the fabrics and therefore the level of detail that could be visualised, even if it was only
a difference between nylon and the other three fabrics.
Nylon, as has been previously been discussed, is the smoothest tightest weave
of all four fabrics tested and therefore it may be predicted that this fabric would lead to
the most visualisation of detail, confirming the conclusions presented in the chapter 3.
4.18 Overall discussion
Overall, it was only nylon that produced any identifiable grab impressions and palmar
flexion creases that could aid in identification. These samples could also aid in
corroboration as to whether an assault took place by the position of the mark on the
complainant’s clothing and the type of mark. For example, if the act were consensual
it would not usually involve the complainant being grabbed from behind with the
accused’s arm coming over the right shoulder grabbing the left side. Therefore, such a
mark could indicate someone being dragged backwards or a possible struggle, thus the
act being forceful rather than consensual. The positive samples, or those with possible
areas of contact, will also give a target area to tape for DNA, which in turn could lead
to a DNA profile of the attacker.
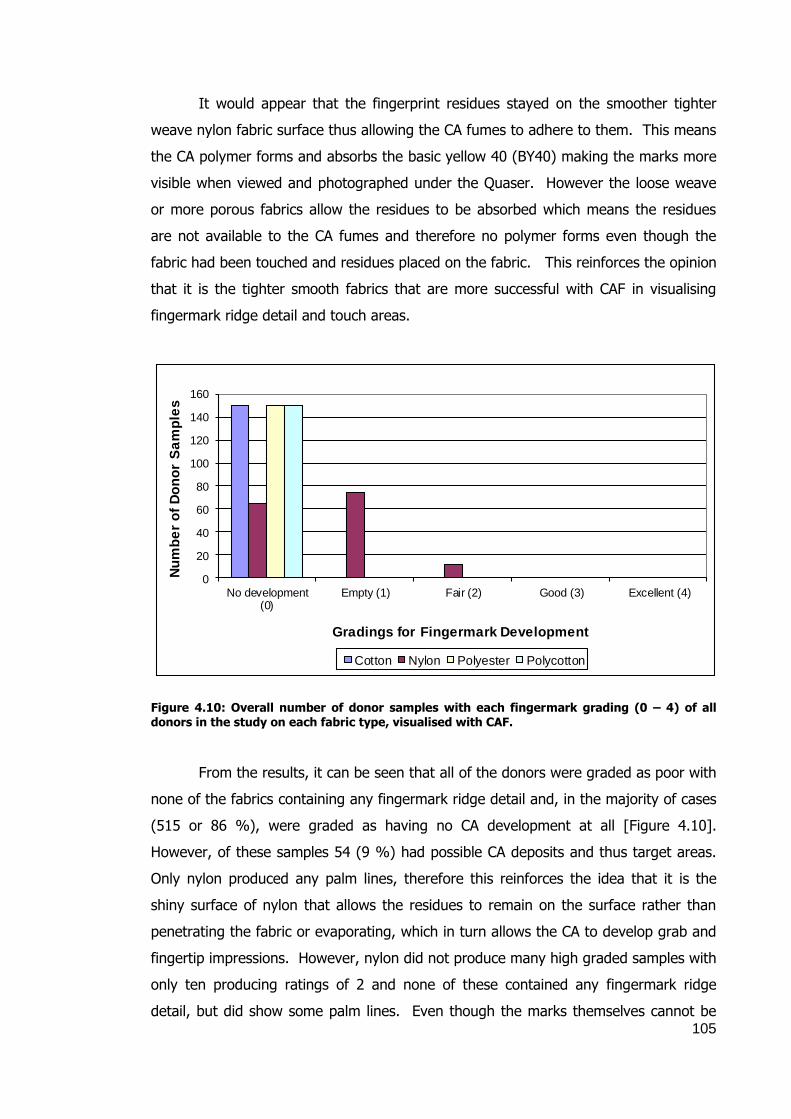
105
It would appear that the fingerprint residues stayed on the smoother tighter
weave nylon fabric surface thus allowing the CA fumes to adhere to them. This means
the CA polymer forms and absorbs the basic yellow 40 (BY40) making the marks more
visible when viewed and photographed under the Quaser. However the loose weave
or more porous fabrics allow the residues to be absorbed which means the residues
are not available to the CA fumes and therefore no polymer forms even though the
fabric had been touched and residues placed on the fabric. This reinforces the opinion
that it is the tighter smooth fabrics that are more successful with CAF in visualising
fingermark ridge detail and touch areas.
0
20
40
60
80
100
120
140
160
No development(0)
Empty (1) Fair (2) Good (3) Excellent (4)
Nu
mb
er
of
Do
no
r S
am
ple
s
Gradings for Fingermark Development
Cotton Nylon Polyester Polycotton
Figure 4.10: Overall number of donor samples with each fingermark grading (0 – 4) of all donors in the study on each fabric type, visualised with CAF.
From the results, it can be seen that all of the donors were graded as poor with
none of the fabrics containing any fingermark ridge detail and, in the majority of cases
(515 or 86 %), were graded as having no CA development at all [Figure 4.10].
However, of these samples 54 (9 %) had possible CA deposits and thus target areas.
Only nylon produced any palm lines, therefore this reinforces the idea that it is the
shiny surface of nylon that allows the residues to remain on the surface rather than
penetrating the fabric or evaporating, which in turn allows the CA to develop grab and
fingertip impressions. However, nylon did not produce many high graded samples with
only ten producing ratings of 2 and none of these contained any fingermark ridge
detail, but did show some palm lines. Even though the marks themselves cannot be

106
used to identify the assailant they can be targeted for DNA and may lead to an
identification.
When considering the results as a whole there does not seem to be a better
time after which to develop a sample to visualise marks – the majority of days
developed some mark on nylon even if it was just a fingertip impression target area.
Of the 150 nylon samples, only 32 developed no impressions and these were spread
across all the days from day 1 to day 28. Impressions were found on 118 samples
with one day with 100 % of the samples containing impressions (day 14); three days
(1, 2 and 7) with fourteen impressions; one day each with thirteen and twelve samples
with impressions (days 21 and 6 respectively); one day with ten and nine samples
(days 28 and 4) and finally two days (3 and 5) with eight samples. This demonstrates
that target areas can be developed on nylon up to twenty-eight days after an incident.
Though day one and two have 93 % of samples with target areas, this has dipped, on
day three, to 53 %, so it is probably best to try and collect DNA as early as possible.
However, after day six the samples with target areas jumped back up to 80 % and
higher only dropping to 67 % on day twenty-eight. Of the remaining 450 samples
(cotton, polyester and polycotton) only 21 developed target areas. Cotton only had
two samples on day 3, polycotton had one sample on day 1 and one on day 21,
whereas polyester had the most target areas samples (17) – one on day 1, three on
days 2 and 5, seven on day 7, two on day 14 and one on day 28. This lack of
impression development further illustrates the point that these duller fabrics do not
allow the fingerprint residues to remain on the fabric surface long enough for them to
be visualised using CAF. Therefore, these results indicate that shiny manmade fabrics
appear to be better at allowing the visualisation of impressions by means of CAF. To
confirm this further more research will need to be carried out utilising more manmade
and natural fabrics having different surface properties.

107
5. THE RECOVERY OF FINGERMARKS FROM FABRIC USING VACUUM
METAL DEPOSITION (VMD) AND CYANOACRYLATE FUMING (CAF): 7 DAY
STUDY ON RAYON, SATIN, NYLON-LYCRA, SILK AND LINEN.
5.1 Aim
To use VMD and CAF in order to determine the level of ridge detail that can be
visualised on rayon, satin, nylon-Lycra, silk and linen from fifteen donors after 7 days.
The standard grading for donors (good, medium and poor) and samples (0, 1, 2, 3 and
4) were used throughout.
5.2 Results and discussion
Although cotton, polyester, polycotton and nylon are the most common fabrics
used in the manufacture of modern clothing others, such as rayon, satin, nylon-Lycra,
silk and linen warranted investigation. However, as many of the latter fabrics had
been tested previously and used in various student studies it was felt that rather than
carrying out the usual full timeline that only day 7 would be studied. This reduction in
work would allow new areas of study to be investigated, while validating pervious work
as well as giving an overall view as to whether marks could be visualised using VMD
and CAF.
As with the previous sections there were 15 donors used on all of the five
fabrics (rayon, satin, nylon-Lycra, silk and linen) and these samples were processed
after seven days, which resulted in a total of 75 samples. The overall result from
rating of the fabrics based on the detail visualised is shown in Figure 5.1. Satin, with
two donors of grade 4 (showing full ridge detail); one swatch with a grade 3 (less
detail, but enough to aid in identification; seven swatches at grade 2 (limited detail in
the fingertips and some palmar flexion creases; four touches (grade 1) and only one
with no development. Silk had no grade 4 samples; one grade 3; seven grade 2; six
grade 1 and again one grade 0, so there were slightly less samples with identifiable
detail compared to satin, though still more detail than the other three fabrics. Rayon,
although a tightly woven fabric with a smooth surface (though not as smooth as satin
and silk), would be expected to allow the residues to sit on the surface, thus ridge
detail could be visualised. Linen, which has a looser more open weave, should show
less detail. This is seen from Figure 5.1 with rayon having six samples graded 2, the
majority (nine samples) were grade 1 (eight samples) and 0 (one sample). The nylon-

108
Lycra, however, judging from its characteristics would be expected to show more detail
due to the tightness of weave and smoothness of the surface but, in this instance this
was not observed. Out of the fifteen samples, there were only six with gradings higher
than 0: four at 1 and two at 2 and of these six there were only two that contained any
detail, while the other four were only indications of where the fabric had been touched.
The reason for the low levels of detail observed on nylon-Lycra may be attributed to
highly shiny fabric obscuring some detail or, possibly, the composition of the fabric not
allowing the residues to remain on the surface but to be absorbed, therefore not
available for VMD visualisation.
0
1
2
3
4
1 2 3 5 6 7 8 9 10 11 12 13 15 16 20
Gra
de
Donor
Rayon Satin Nylon-Lycra Silk Linen
Figure 5.1: Grades of fingermarks visualised with VMD for all donors after 7 days on rayon, satin, nylon-Lycra, silk and linen.
Overall, these fabrics, though only processed for one day (day 7) do follow the trend of
the fabrics, cotton, nylon, polycotton and polyester, previously reported in section 3
and 4. Fabrics such as nylon and polyester, with a smoother tighter weave allowed the
visualisation of more detail compared to the rougher and/or looser weave fabrics
cotton and polycotton.
When considering the donors they too seem to follow the trends found
previously with the planted marks of donors one, two and five giving good visualisation
with detail compared to donors such as six, seven and ten who generally left marks
that led to little or no visualisation. The level of detail observed from each of the
visualised samples could be due to the levels of residues produced by the donors, but

109
environmental factors may have contributed. Temperature, either being hotter or
colder at the time of collection; what had been eaten (spicy foods) prior to donation of
their marks; or exercising.
Figure 5.2: Close-up of donor five’s thumb mark containing grade 4 detail on a day 7 satin sample. Photograph taken with a Nikon D40 and white light.
Figure 5.3: Example of grab from donor one (day 7 on rayon), containing some palmar flexion creases with empty marks. Photograph taken with a Nikon D40 and white light.
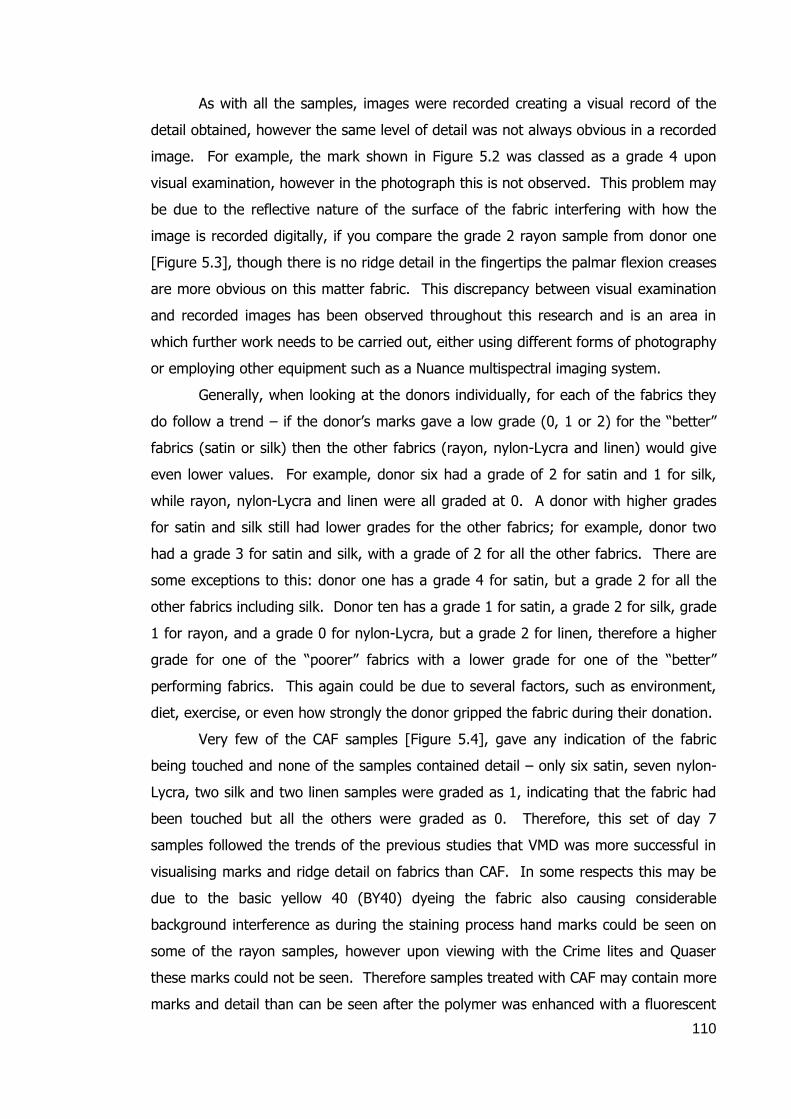
110
As with all the samples, images were recorded creating a visual record of the
detail obtained, however the same level of detail was not always obvious in a recorded
image. For example, the mark shown in Figure 5.2 was classed as a grade 4 upon
visual examination, however in the photograph this is not observed. This problem may
be due to the reflective nature of the surface of the fabric interfering with how the
image is recorded digitally, if you compare the grade 2 rayon sample from donor one
[Figure 5.3], though there is no ridge detail in the fingertips the palmar flexion creases
are more obvious on this matter fabric. This discrepancy between visual examination
and recorded images has been observed throughout this research and is an area in
which further work needs to be carried out, either using different forms of photography
or employing other equipment such as a Nuance multispectral imaging system.
Generally, when looking at the donors individually, for each of the fabrics they
do follow a trend – if the donor’s marks gave a low grade (0, 1 or 2) for the “better”
fabrics (satin or silk) then the other fabrics (rayon, nylon-Lycra and linen) would give
even lower values. For example, donor six had a grade of 2 for satin and 1 for silk,
while rayon, nylon-Lycra and linen were all graded at 0. A donor with higher grades
for satin and silk still had lower grades for the other fabrics; for example, donor two
had a grade 3 for satin and silk, with a grade of 2 for all the other fabrics. There are
some exceptions to this: donor one has a grade 4 for satin, but a grade 2 for all the
other fabrics including silk. Donor ten has a grade 1 for satin, a grade 2 for silk, grade
1 for rayon, and a grade 0 for nylon-Lycra, but a grade 2 for linen, therefore a higher
grade for one of the “poorer” fabrics with a lower grade for one of the “better”
performing fabrics. This again could be due to several factors, such as environment,
diet, exercise, or even how strongly the donor gripped the fabric during their donation.
Very few of the CAF samples [Figure 5.4], gave any indication of the fabric
being touched and none of the samples contained detail – only six satin, seven nylon-
Lycra, two silk and two linen samples were graded as 1, indicating that the fabric had
been touched but all the others were graded as 0. Therefore, this set of day 7
samples followed the trends of the previous studies that VMD was more successful in
visualising marks and ridge detail on fabrics than CAF. In some respects this may be
due to the basic yellow 40 (BY40) dyeing the fabric also causing considerable
background interference as during the staining process hand marks could be seen on
some of the rayon samples, however upon viewing with the Crime lites and Quaser
these marks could not be seen. Therefore samples treated with CAF may contain more
marks and detail than can be seen after the polymer was enhanced with a fluorescent

111
dye. Even though very little was recorded in terms of marks, what was viewed still
followed the now expected trend of the smoother tighter weave fabrics (silk and satin)
having more positive marks compared to the rougher more open weave linen and
rayon.
0
1
2
3
4
1 2 3 5 6 7 8 9 10 11 12 13 15 16 20
Gra
de
Donor
Rayon Satin Nylon-Lycra Silk Linen
Figure 5.4: Grades of fingermarks visualised with CAF for all donors after 7 days on rayon, satin, nylon-Lycra, silk and linen.
The overall results from rating of the fabrics based on the detail visualised in
Figure 5.4, shows that the order, from most detail to least, was nylon-Lycra, satin,
joint silk and linen and rayon. This is not unexpected, when considering the surface of
the fabric types – both satin and silk have smooth tight weave surfaces, while rayon
did not have as smooth a surface, so would be expected. However, the results for
linen and nylon-Lycra were unexpected. Linen had a rougher surface, therefore little
visualisation would be expected whereas nylon-Lycra fabric was quite smooth and had
a tight weave, so it would be expected that more development would be seen. This
was not the case as nylon-Lycra, though rated as having the most samples with grades
higher than zero overall did not allow for much development of ridge detail or marks
possibly. This result may have been due to the deformation of the fabric whilst the
fingermark was being deposited.
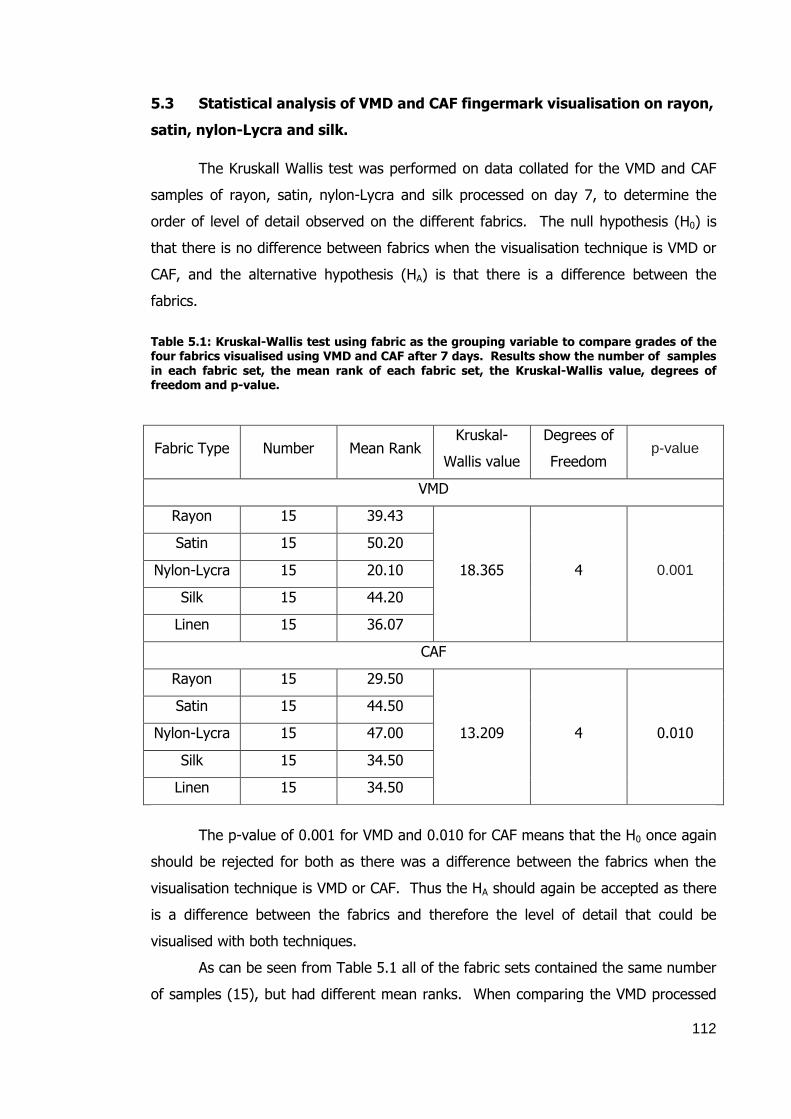
112
5.3 Statistical analysis of VMD and CAF fingermark visualisation on rayon,
satin, nylon-Lycra and silk.
The Kruskall Wallis test was performed on data collated for the VMD and CAF
samples of rayon, satin, nylon-Lycra and silk processed on day 7, to determine the
order of level of detail observed on the different fabrics. The null hypothesis (H0) is
that there is no difference between fabrics when the visualisation technique is VMD or
CAF, and the alternative hypothesis (HA) is that there is a difference between the
fabrics.
Table 5.1: Kruskal-Wallis test using fabric as the grouping variable to compare grades of the four fabrics visualised using VMD and CAF after 7 days. Results show the number of samples
in each fabric set, the mean rank of each fabric set, the Kruskal-Wallis value, degrees of freedom and p-value.
Fabric Type Number Mean Rank Kruskal-
Wallis value
Degrees of
Freedom p-value
VMD
Rayon 15 39.43
18.365 4 0.001
Satin 15 50.20
Nylon-Lycra 15 20.10
Silk 15 44.20
Linen 15 36.07
CAF
Rayon 15 29.50
13.209 4 0.010
Satin 15 44.50
Nylon-Lycra 15 47.00
Silk 15 34.50
Linen 15 34.50
The p-value of 0.001 for VMD and 0.010 for CAF means that the H0 once again
should be rejected for both as there was a difference between the fabrics when the
visualisation technique is VMD or CAF. Thus the HA should again be accepted as there
is a difference between the fabrics and therefore the level of detail that could be
visualised with both techniques.
As can be seen from Table 5.1 all of the fabric sets contained the same number
of samples (15), but had different mean ranks. When comparing the VMD processed

113
samples, satin had the highest mean rank of 50.20, followed by silk (44.20), rayon
(39.43), linen (36.07) and, finally, nylon-Lycra (20.10) with the lowest mean rank.
With the CAF samples the order was different with nylon-Lycra containing the most
detail and a mean rank of 47.00, while satin now had the second highest mean rank
(44.50), next was silk and linen with a joint mean rank of 34.50 and rayon was with a
mean rank of 29.50. Although this is the same order as discussed in section 5.2
above, thus is statistically confirming that interpretation of the results, there are still
some unexpected outcomes. With VMD, nylon-Lycra was the fabric with the lowest
mean rank and therefore least level of detail, whereas with CAF the opposite was the
case, with nylon-Lycra having the highest mean ranking and therefore the most detail.
Nylon-Lycra is a relatively smooth tight weave fabric therefore, it would be expected
that this fabric would allow visualisation of fingermarks, though in the case of VMD this
did not occur. This may have been due to the surface not allowing the metals to be
attached or that when the marks were being deposited the surface was distorted and
therefore the residues were not on the surface and available for adherence of the
metals. With CAF, nylon-Lycra had most samples with grades higher than zero, though
there was little visualisation with this fabric or any of the other fabrics. Therefore, it is
hard to determine whether this is the true rank order of these fabrics and more
samples would need to be processed to confirm this. However, based on the data
collected it would be expected that a smoother fabric such as nylon-Lycra would allow
a higher level of visualisation.
A Mann-Whitney U test was also performed to look at each of the fabrics and
determine which technique, VMD or CAF, is more suitable and more likely to lead to
the visualisation of fingermarks on the fabric’s surface and it appears that VMD is the
most successful. The H0 is therefore no difference between the two visualisation
techniques of VMD or CAF, and the HA is that there is a difference between the
techniques.
Table 5.2 illustrates this when the mean rank and sum of means of each fabric
is considered, four out of the five fabrics - rayon, satin, silk and linen all have values
for the VMD technique that are significantly higher than those for the CAF technique.
All of the fabrics have mean ranks and sum of ranks for VMD that are approximately
twice that for CAF. Therefore, in the case of rayon, satin, silk and linen, VMD should
be considered the technique of choice in attempting to visualise fingermarks. Nylon-
Lycra is the only fabric where this is not the case with a mean rank of 15.47 and a sum
of marks of 232.00 for VMD, while the CAF values were 15.53 and 233.00 respectively,

114
therefore in this instance it could be considered that there is little difference between
the two techniques. Thus, either VMD or CAF could be used in an attempt to visualise
fingermarks on nylon-Lycra, though the likelihood of visualising any marks would be
quite low. This is reinforced by the p-value, as nylon-Lycra is the only fabric being
higher than 0.001. All the other fabrics (rayon, satin, silk and linen) have a p-value of
<0.001, therefore the (HA) should be accepted and the conclusion is that there is a
difference between VMD and CAF. Whereas nylon-Lycra had a p-value of 0.981,
therefore there is little to choose between the two techniques thus the H0 should be
accepted and the HA rejected.
Table 5.2: Mann-Whitney U test using fabric as the grouping variable to compare grades of the four fabrics visualised using VMD and CAF after 7 days. Results show the number of
samples in each fabric set, the mean rank of each fabric set, the sum of the ranks, the Mann-Whitney U value, degrees of freedom and p-value.
Fabric Technique Number Mean
Rank
Sum of
Ranks
Mann-
Whitney U
Value
p-value
Nylon-Lycra VMD 15 15.47 232.00
112.000 0.981 CAF 15 15.53 233.00
Rayon VMD 15 22.50 337.50
7.500 0.000 CAF 15 8.50 127.50
Satin VMD 15 21.50 322.50
22.500 0.000 CAF 15 9.50 142.50
Silk VMD 15 22.03 330.50
14.500 0.000 CAF 15 8.97 134.50
Linen VMD 15 20.08 261.00
25.000 0.000 CAF 15 9.67 145.00
In conclusion, the statistical testing showed that VMD is the more suitable
technique to use when attempting to visualise fingermarks on the majority of fabrics
tested. The fabrics are ranked in the order: satin, silk, rayon, linen and nylon-Lycra for
VMD and nylon-Lycra, satin, silk, with linen and rayon being ranked joint last for CAF.
115
6. Sequential treatment of fabrics
6.1 Aim
To use vacuum metal deposition (VMD) and cyanoacrylate fuming (CAF)
sequentially (VMD then CAF or CAF then VMD) to determine the level of fingermark
and palm ridge detail that can be visualised on white satin, black satin, nylon, nylon-
Lycra and linen from the initial visualised treatment (either VMD or CAF) and the effect
of the sequential (either CAF or VMD).
6.2 Results and discussion
As previously stated, VMD is believed to be the more sensitive technique
compared to CAF, therefore this study was designed to test this theory as well as
determine what effect each technique would have on the other. One set of samples
were first processed with VMD the results recorded then processed with CAF to
determine the effect this secondary treatment would have on the original results –
would they improve the level of marks already on the fabric swatches or would this
secondary treatment have a detrimental effect? This was then repeated on samples
originally processed with CAF. The marks, if any, were recorded and graded then the
swatches were treated with VMD and the results recorded.
Philipson and Bleay (2007) found that the sequential treatment of an item with
gold + zinc VMD followed by CAF did lead to an increase in marks visualised as did
several police force representatives who attended the VMD Users Group meeting
(Downham 2011). However, with the reverse of CAF followed by VMD it was observed
that less gold was required for the VMD and that the use of dyes had a negative effect
on the final results (Jones 2002). Thus, the same experiment was carried out with a
variety of new fabrics using each sequence to determine which developed more
positive marks and detail or whether it led to a reduction in the detail that was
observed with the single process. VMD followed by CAF was compared to CAF then
VMD to determine which was the better sequence and which visualised the most
marks.
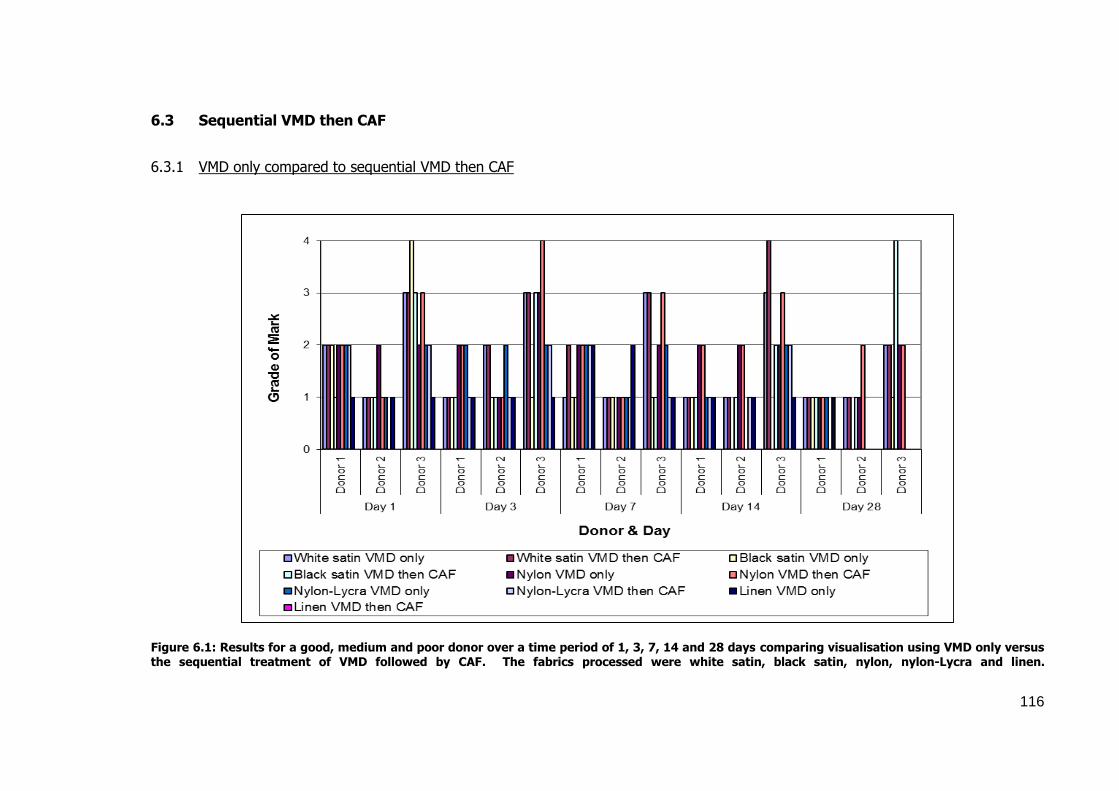
116
6.3 Sequential VMD then CAF
6.3.1 VMD only compared to sequential VMD then CAF
Figure 6.1: Results for a good, medium and poor donor over a time period of 1, 3, 7, 14 and 28 days comparing visualisation using VMD only versus the sequential treatment of VMD followed by CAF. The fabrics processed were white satin, black satin, nylon, nylon-Lycra and linen.
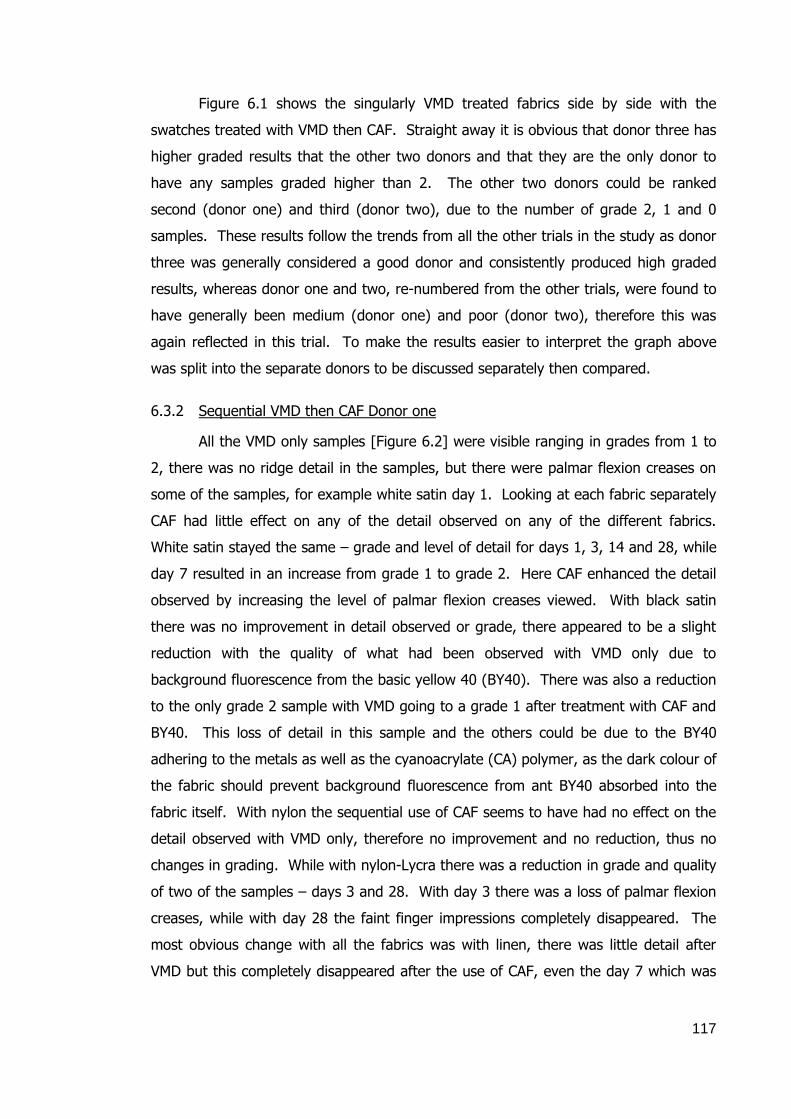
117
Figure 6.1 shows the singularly VMD treated fabrics side by side with the
swatches treated with VMD then CAF. Straight away it is obvious that donor three has
higher graded results that the other two donors and that they are the only donor to
have any samples graded higher than 2. The other two donors could be ranked
second (donor one) and third (donor two), due to the number of grade 2, 1 and 0
samples. These results follow the trends from all the other trials in the study as donor
three was generally considered a good donor and consistently produced high graded
results, whereas donor one and two, re-numbered from the other trials, were found to
have generally been medium (donor one) and poor (donor two), therefore this was
again reflected in this trial. To make the results easier to interpret the graph above
was split into the separate donors to be discussed separately then compared.
6.3.2 Sequential VMD then CAF Donor one
All the VMD only samples [Figure 6.2] were visible ranging in grades from 1 to
2, there was no ridge detail in the samples, but there were palmar flexion creases on
some of the samples, for example white satin day 1. Looking at each fabric separately
CAF had little effect on any of the detail observed on any of the different fabrics.
White satin stayed the same – grade and level of detail for days 1, 3, 14 and 28, while
day 7 resulted in an increase from grade 1 to grade 2. Here CAF enhanced the detail
observed by increasing the level of palmar flexion creases viewed. With black satin
there was no improvement in detail observed or grade, there appeared to be a slight
reduction with the quality of what had been observed with VMD only due to
background fluorescence from the basic yellow 40 (BY40). There was also a reduction
to the only grade 2 sample with VMD going to a grade 1 after treatment with CAF and
BY40. This loss of detail in this sample and the others could be due to the BY40
adhering to the metals as well as the cyanoacrylate (CA) polymer, as the dark colour of
the fabric should prevent background fluorescence from ant BY40 absorbed into the
fabric itself. With nylon the sequential use of CAF seems to have had no effect on the
detail observed with VMD only, therefore no improvement and no reduction, thus no
changes in grading. While with nylon-Lycra there was a reduction in grade and quality
of two of the samples – days 3 and 28. With day 3 there was a loss of palmar flexion
creases, while with day 28 the faint finger impressions completely disappeared. The
most obvious change with all the fabrics was with linen, there was little detail after
VMD but this completely disappeared after the use of CAF, even the day 7 which was
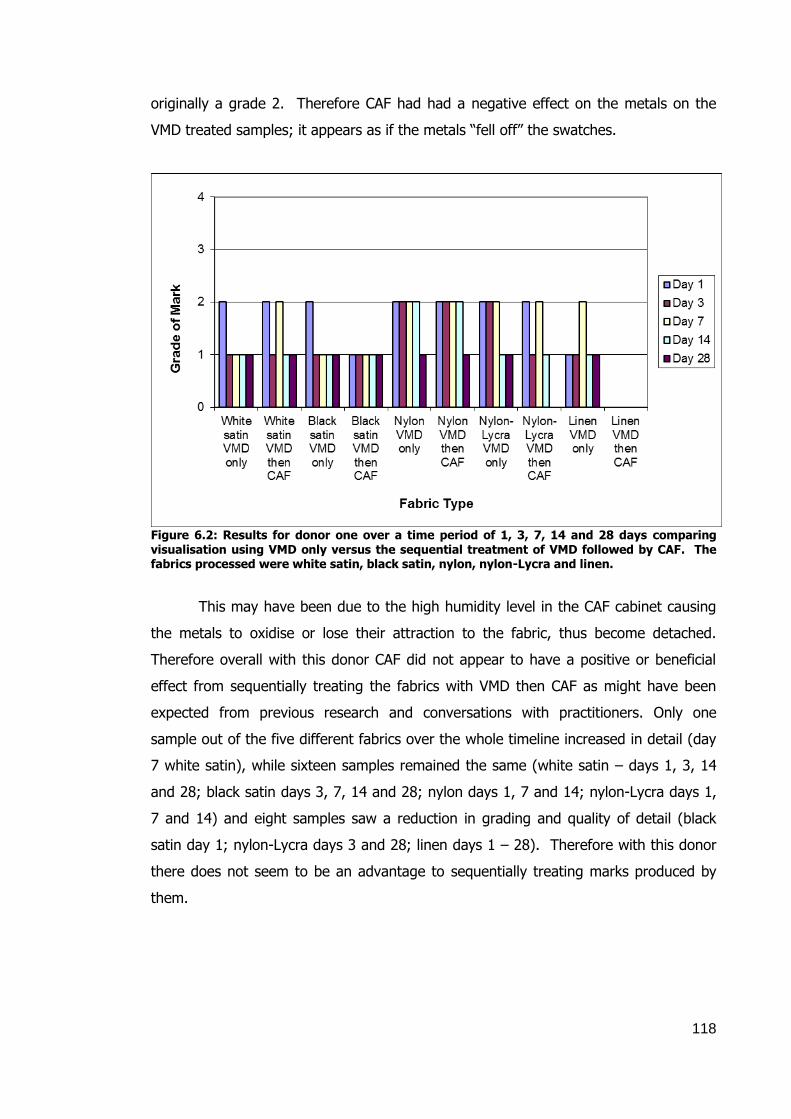
118
originally a grade 2. Therefore CAF had had a negative effect on the metals on the
VMD treated samples; it appears as if the metals “fell off” the swatches.
Figure 6.2: Results for donor one over a time period of 1, 3, 7, 14 and 28 days comparing visualisation using VMD only versus the sequential treatment of VMD followed by CAF. The fabrics processed were white satin, black satin, nylon, nylon-Lycra and linen.
This may have been due to the high humidity level in the CAF cabinet causing
the metals to oxidise or lose their attraction to the fabric, thus become detached.
Therefore overall with this donor CAF did not appear to have a positive or beneficial
effect from sequentially treating the fabrics with VMD then CAF as might have been
expected from previous research and conversations with practitioners. Only one
sample out of the five different fabrics over the whole timeline increased in detail (day
7 white satin), while sixteen samples remained the same (white satin – days 1, 3, 14
and 28; black satin days 3, 7, 14 and 28; nylon days 1, 7 and 14; nylon-Lycra days 1,
7 and 14) and eight samples saw a reduction in grading and quality of detail (black
satin day 1; nylon-Lycra days 3 and 28; linen days 1 – 28). Therefore with this donor
there does not seem to be an advantage to sequentially treating marks produced by
them.

119
6.3.3 Sequential VMD then CAF Donor two
Figure 6.3: Results for donor two over a time period of 1, 3, 7, 14 and 28 days comparing visualisation using VMD only versus the sequential treatment of VMD followed by CAF. The fabrics processed were white satin, black satin, nylon, nylon-Lycra and linen.
The overall initial detail of the samples after VMD [Figure 6.3] was not
extremely high, no samples graded over 2, though with this donor several samples
were graded as zero (five VMD only samples in total). Though as previously discussed
this donor is considered a poor donor, therefore these results are not unexpected. In
all there were thirteen samples with grades that remained unchanged, eight that
became lower in their grade and only four became higher.
With this donor there does appear to have been some effect from the
sequential treatment of the VMD treated samples after CAF and BY40. With white
satin the grades of the swatches all remained the same – all the grade one samples
remained grade one; however the CAF and addition of BY40 does seem to have made
the marks stand out more than with just the VMD. The same occurred with the day 3
sample that was grade 2; it had some extra ridge detail on the index and middle
fingertips after CAF and BY40 staining. With black satin two days remained the same
gradings (days 1 and 3, both grade 1), though in both cases there was a slight change
in the detail observed after CAF – day 1 went from a full to a faint grab, thus a

120
reduction in detail; while day 3 improved in detail from just fingermarks to a faint grab,
but both samples were still graded as 1. Day 7 was the only sample that reduced in
grading from a 1 to 0 and only possible fingermarks, while days 14 and 28 both went
from a grade 0 to a grade 1, nothing to faint fingermarks. Therefore with this donor
on these fabrics there was only a small amount of increase in detail, which has not
given any extra information that would help with an identification, other than target
areas. With nylon most of the samples stayed the same, days 3 and 7 at grade 1 and
day 14 at grade 2, though day 3 and 7 became slightly more obvious after the CAF.
Day 1 reduced in detail going from a grade 2 to a grade 1 and this appears to be due
to a loss of the metal deposits. Day 28 was the only sample to increase in detail going
from a grade 1 to grade 2. With nylon-Lycra the younger samples reduced in the
observed detail – day 1 reduced from grade 1 to 0 with only possible fingertip
impressions, while day 3 dropping from a 2 to 1. Days 7 and 28 remained the same, 1
and 0 respectively, while day 14 was the only sample to improve in detail, going from a
negative grade 0 to a grade 1 with possible fingermarks. The final fabric in the set
was linen and all samples reduced in quality with the exception of day 28, though this
was zero for VMD only and VMD then CAF. The samples that reduced in detail were
originally just indications of where the sample was touched, such as a faint grab or
fingertip impression, while the day 7 sample had palmar flexion creases, but after CAF
and BY40 the was not even an indication of where the sample had been grabbed.
Thus with this donor the use of CAF after VMD did not lead to enough extra
information or detail to increase the chance of an identification.
6.3.4 Sequential VMD then CAF Donor three
Donor three was the most successful of the donors in this trial as they were the
only donor to have samples graded over 2 and the highest number of samples with
increased detail/grading, though this donor was generally considered a good donor, so
the results were not unexpected. With the other two donors there was not a great
deal of improvement or enhancement to the detail observed on the sequentially
treated samples. With this donor, there was a little more evidence as to the usefulness
of dual treatment. With white satin the majority of the samples, days 1, 3, 7 and 28,
all stayed the same grade and all had varying levels of palmar flexion creases and
detail. There was one day – day 14, that increased in detail from a grade 3 to a grade
4, so the CAF led to ridge detail being observed on two more fingers. With VMD only
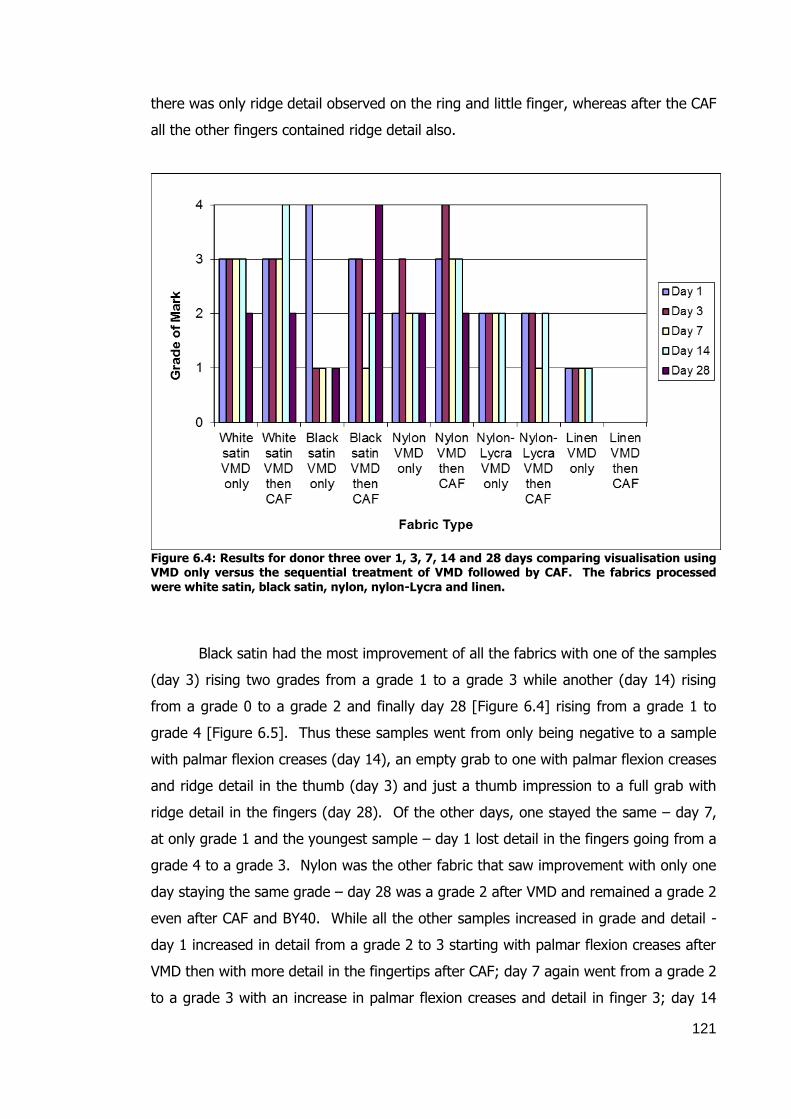
121
there was only ridge detail observed on the ring and little finger, whereas after the CAF
all the other fingers contained ridge detail also.
Figure 6.4: Results for donor three over 1, 3, 7, 14 and 28 days comparing visualisation using VMD only versus the sequential treatment of VMD followed by CAF. The fabrics processed were white satin, black satin, nylon, nylon-Lycra and linen.
Black satin had the most improvement of all the fabrics with one of the samples
(day 3) rising two grades from a grade 1 to a grade 3 while another (day 14) rising
from a grade 0 to a grade 2 and finally day 28 [Figure 6.4] rising from a grade 1 to
grade 4 [Figure 6.5]. Thus these samples went from only being negative to a sample
with palmar flexion creases (day 14), an empty grab to one with palmar flexion creases
and ridge detail in the thumb (day 3) and just a thumb impression to a full grab with
ridge detail in the fingers (day 28). Of the other days, one stayed the same – day 7,
at only grade 1 and the youngest sample – day 1 lost detail in the fingers going from a
grade 4 to a grade 3. Nylon was the other fabric that saw improvement with only one
day staying the same grade – day 28 was a grade 2 after VMD and remained a grade 2
even after CAF and BY40. While all the other samples increased in grade and detail -
day 1 increased in detail from a grade 2 to 3 starting with palmar flexion creases after
VMD then with more detail in the fingertips after CAF; day 7 again went from a grade 2
to a grade 3 with an increase in palmar flexion creases and detail in finger 3; day 14

122
also increasing from a grade 2 to 3, with palmar flexion creases and empty marks to
increased detail and additional detail in thumb; finally day 3 increased from a grade 3
to a grade 4, starting with palmar flexion creases and detail in only finger 1 and 2 to
detail in all fingers and thumb. Therefore with nylon and a good donor as in the case
of this donor the sequential treatment of CAF after VMD did lead to an enhancement in
detail and therefore an increase in the chance of identification. With nylon-Lycra one
sample (day 7) reduced in quality from a grade 2 to grade 1 and a loss of detail in the
palm, while all the other days 1, 3, 14 and 28 stayed the same with no effect from the
additional treatment with CAF.
Figure 6.5: Left: Black satin, donor three, day 28, VMD only with only faint indication of where the fabric has been grabbed, though there is no ridge detail observed. Right: the same swatch after sequential treatment with CAF - it is now possible to see ridge detail in all the fingers and on the palm.
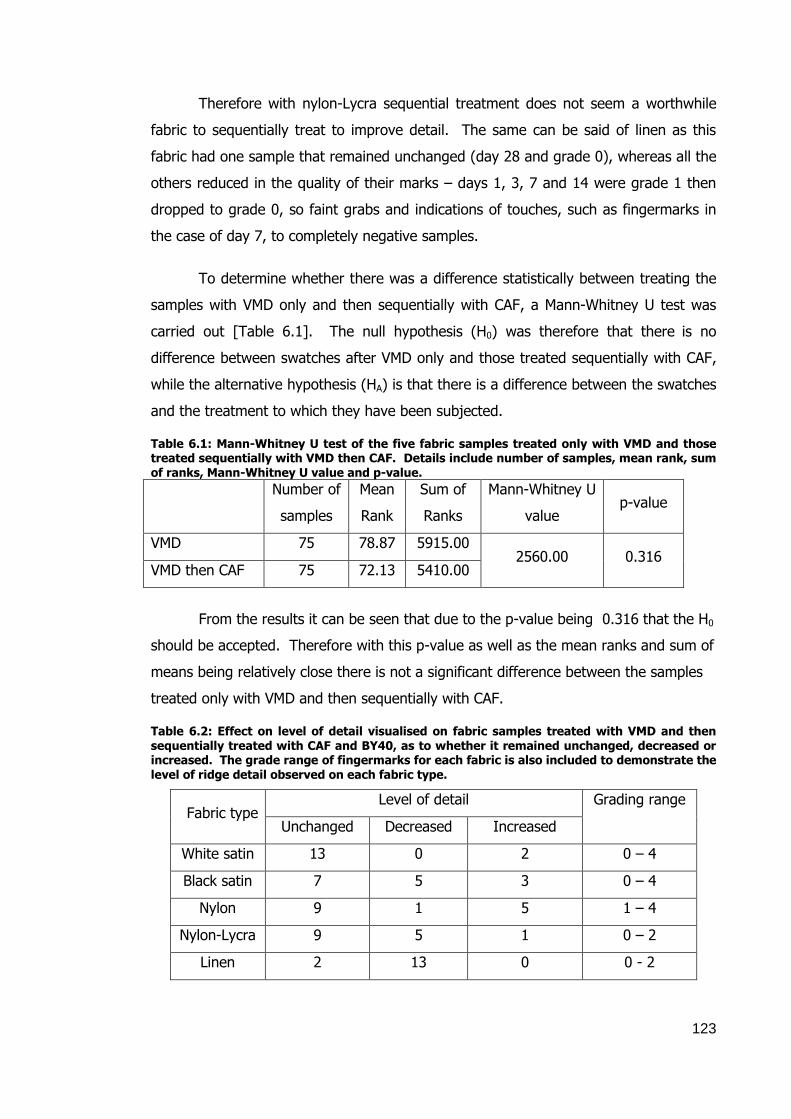
123
Therefore with nylon-Lycra sequential treatment does not seem a worthwhile
fabric to sequentially treat to improve detail. The same can be said of linen as this
fabric had one sample that remained unchanged (day 28 and grade 0), whereas all the
others reduced in the quality of their marks – days 1, 3, 7 and 14 were grade 1 then
dropped to grade 0, so faint grabs and indications of touches, such as fingermarks in
the case of day 7, to completely negative samples.
To determine whether there was a difference statistically between treating the
samples with VMD only and then sequentially with CAF, a Mann-Whitney U test was
carried out [Table 6.1]. The null hypothesis (H0) was therefore that there is no
difference between swatches after VMD only and those treated sequentially with CAF,
while the alternative hypothesis (HA) is that there is a difference between the swatches
and the treatment to which they have been subjected.
Table 6.1: Mann-Whitney U test of the five fabric samples treated only with VMD and those treated sequentially with VMD then CAF. Details include number of samples, mean rank, sum of ranks, Mann-Whitney U value and p-value.
Number of
samples
Mean
Rank
Sum of
Ranks
Mann-Whitney U
value p-value
VMD 75 78.87 5915.00 2560.00 0.316
VMD then CAF 75 72.13 5410.00
From the results it can be seen that due to the p-value being 0.316 that the H0
should be accepted. Therefore with this p-value as well as the mean ranks and sum of
means being relatively close there is not a significant difference between the samples
treated only with VMD and then sequentially with CAF.
Table 6.2: Effect on level of detail visualised on fabric samples treated with VMD and then sequentially treated with CAF and BY40, as to whether it remained unchanged, decreased or increased. The grade range of fingermarks for each fabric is also included to demonstrate the level of ridge detail observed on each fabric type.
Fabric type Level of detail Grading range
Unchanged Decreased Increased
White satin 13 0 2 0 – 4
Black satin 7 5 3 0 – 4
Nylon 9 1 5 1 – 4
Nylon-Lycra 9 5 1 0 – 2
Linen 2 13 0 0 - 2

124
When all the data is collated from all the donors it can be seen [Table 6.2 and
Table 6.3] that the majority of samples (53 %) did not change in the detail produced by
the original VMD treatment and subsequent treatment with CAF. While 32 % of the
samples decreased in grade and detail and only 15 % increased in detail and the
majority of these samples, (8 out of the 11 increased swatches) were from the same
donor – three. Therefore again the level of detail produced can be seen to be affected
by the donor and the level of residues they produce and deposit.
Table 6.3: Chi-squared test results comparing the grade change (unchanged, decreased, increased) observed for the sequential treatment (VMD then CAF) of planted latent marks on five fabrics. Detailing the actual count obtained, the expected count, the percentage of each technique at each grade, as well as the residual value.
Fabric Effect of CAF on VMD treated samples
Unchanged Decreased Increased Total
White satin
Count 13 0 2 15
Expected count 8.0 4.8 2.2 15.0
Percentage with grade (%)
86.7 0.0 13.3 100
Residual 5.0 -4.8 -0.2
Black satin
Count 7 5 3 15
Expected count 8.0 4.8 2.2 15.0
Percentage with grade (%)
46.7 33.3 20.0 100
Residual -1.0 0.2 0.8
Nylon Count 9 1 5 15
Expected count 8.0 4.8 2.2 15.0
Percentage with grade (%)
60.0 6.7 33.3 100
Residual 1.0 -3.8 2.8
Nylon-Lycra
Count 9 5 1 15
Expected count 8.0 4.8 2.2 15.0
Percentage with grade (%)
60.0 33.3 6.7 100
Residual 1.0 0.2 -1.2
Linen Count 2 13 0 15
Expected count 8.0 4.8 2.2 15.0
Percentage with grade (%)
13.3 86.7 0.0 100
Residual -6.0 8.2 -2.2
Total Count 40 24 11 75
Expected count 40.0 24.0 11.0 75.0
Percentage with grade (%)
53.3 32.0 14.7 100
With the chi-square test also carried out reinforcing these findings discussed
above. The null hypothesis (H0) in this case is that there was no increase or decrease
in the detail observed on the VMD treated fabrics after being sequentially treated with

125
CAF. Therefore, the alternative hypothesis (HA) is that there is a difference in detail
between the VMD only treated fabrics and those that were treated sequentially with
CAF. This led to the χ² (8) = 36.561 p<0.001, therefore the H0 should be rejected due
to such a low p-value and the HA accepted, which in turn illustrates that there is a
significant difference in the ridge detail observed on the fabric swatches after being
sequential treated with CAF.
With the information for the tables above the fabrics can be ranked as to their
level of positive detail from gradings to level after sequential treatment and the order
is nylon; white satin; black satin; nylon and linen (highest to lowest). When the
grading range within each fabric is considered the order does not really change nylon
is still first, followed by the two satins in joint second place, then nylon-Lycra and linen
being joint last. Nylon was second equal highest for samples staying the same grade
after sequential treatment and equal to nylon-Lycra, while it had the least number of
samples that became worse, only one of its day 1 sample; it also had the highest
number of samples that improved in grade and detail observed after the sequential
treatment. Thus it could be presumed that nylon items would be more likely to stay
the same or increasing in detail than decreasing if they were treated with CAF after
they had been treated firstly with VMD. However when the information in Table 6.3 is
taken into account, the expected counts were different from the actual counts in that
the number that the expected number was 4.8, but the actual number was 1. In the
case of the increased samples the expected value was 2.2, whereas the actual number
was 5. White satin had no samples that reduced in detail, the majority – 13 in total
stayed the same and two samples increased in their level of detail. Again, the
expected counts (4.8) illustrate that statistically it would have been expected that more
samples would have decreased in detail, whereas no samples decreased in value.
Therefore, white satin items are more likely to stay the same but there may be an
increase in detail on items handled by a medium to good donor. With black satin
nearly half the samples (7) stayed the same with no addition detail visualised, while
only 3 samples increased in detail and the remaining 5 reduced in detail. However, all
the values were quite close to the expected values as shown in Table 6.3. Thus with
black satin items are just as likely to decrease as they are to increase in detail
therefore a decision would have to be made as to whether a sequential treatment
would be carried out as it may be detrimental. However, as ridge detail would most
likely be recorded between treatments it may be useful to attempt CAF after VMD.
With Nylon-Lycra over half of the samples (9) stayed the same grade, which is close to

126
the expected value of 8 and did not display much more if any extra detail, 5 samples,
the same as with black satin, reduced in detail, whereas only one sample increased in
grade and therefore detail. Thus nylon-Lycra items are more likely to reduce in detail
than increase, which in turn means using CAF after VMD on linen would most likely not
be of any benefit. Finally with linen the metal deposited on the fabric during the VMD
process appeared to “fall off” the swatches during the CAF process. Therefore any
detail originally seen was lost, which in turn means there would be little point in
sequentially processing linen with VMD then CAF as no extra detail would be produced
and target areas for DNA would be lost along with information about the sequence of
events that may have taken place. This unusual effect of the loss of metals is
illustrated by the results, where the expected decrease value was only 4.8 and the
unchanged value was 8, which is quite different from the actual values of 13 and 2
respectively.
Overall, the order of fabric follows the general trend of the smooth tighter
weave the more detail, as does the order of improvement from sequential treatment.
It was the smooth manmade fabrics that had more improved detail and less samples
with reduced detail, whereas the natural fabric used in the study (linen), had no
improvement, it only had two samples that stayed the same and all the others, 87 %
in total, reduced in detail. The reduction in detail on some of the samples may be in
part to do with the humidity in the CAF cabinet loosening the metals attachments to
the fabrics’ surfaces or may be to do with the use of BY40 after the CAF. It has been
suggested by Jones (2002) that the use of dyes have a detrimental effect on the detail
already produced with items that were processed first with CAF then VMD, therefore
future work should be carried out into this area and possibly trying CAF without the
use of BY40 after. This would allow it to be determined as to whether there was an
effect from the use of BY40. It should be noted, however. that due to the use of
donors planting natural marks rather than the use of an artificial residue stamp there
cannot be a guarantee that there definitely was a mark planted each time. Therefore,
there are limitations to this study and if repeated the use of a stamp could be
considered. However, in this study, the researcher was attempting to keep the
deposition method close to what might occur during a real-life scenario and this is why
a stamp and artificial residues were not used.
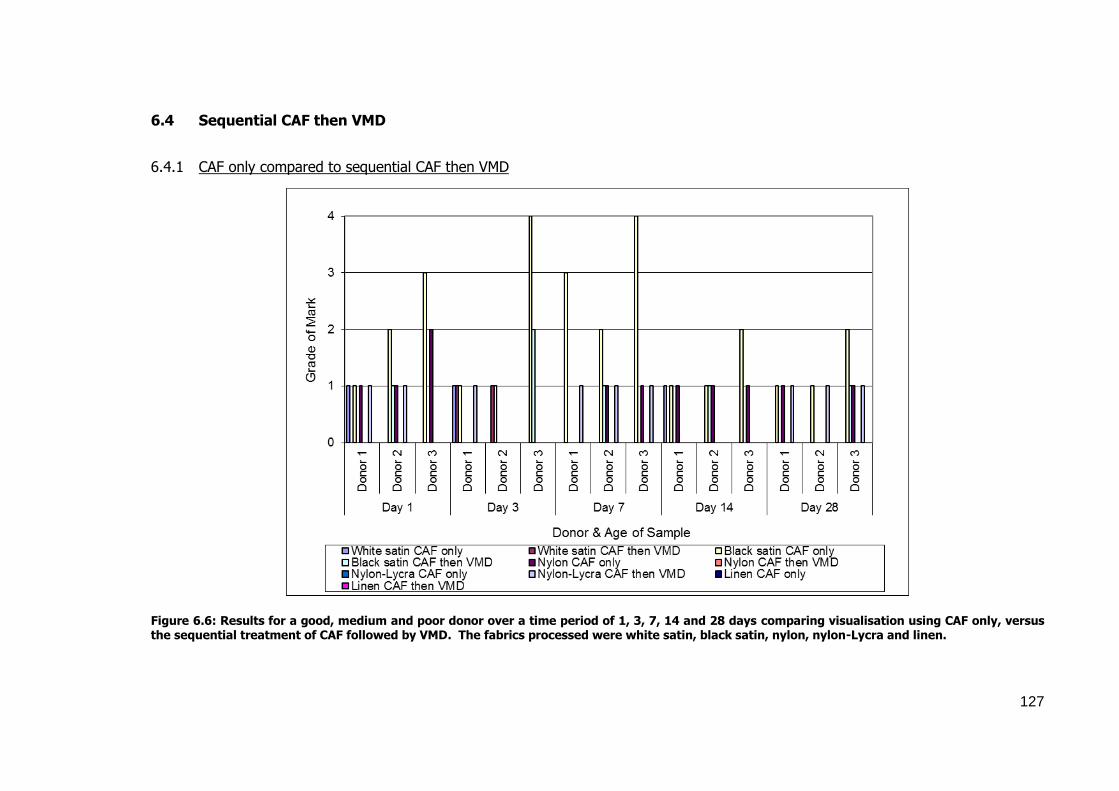
127
6.4 Sequential CAF then VMD
6.4.1 CAF only compared to sequential CAF then VMD
Figure 6.6: Results for a good, medium and poor donor over a time period of 1, 3, 7, 14 and 28 days comparing visualisation using CAF only, versus the sequential treatment of CAF followed by VMD. The fabrics processed were white satin, black satin, nylon, nylon-Lycra and linen.

128
CAF followed by VMD is the preferred sequence by many practitioners, however
from the information that can be seen in Figure 6.6, CAF is not very successful with the
fabrics used in this trial. There are very few positive samples when compared to the
results of VMD followed by CAF and, of the donors, again it is donor three who has the
most positive and highest graded samples, followed by donor one and then two,
though this time the difference between donor one and two is not as pronounced.
6.4.2 Sequential CAF then VMD - Donor one
Figure 6.7: Results for donor one over a time period of 1, 3, 7, 14 and 28 days comparing visualisation using CAF only, versus the sequential treatment of CAF followed by VMD. The fabrics processed were white satin, black satin, nylon, nylon-Lycra and linen.
White satin [Figure 6.7] is the only sample that did not lose all the detail of all
the samples first visualised – day 3 was originally graded 1 and remained at this grade,
though they were only finger and thumb marks. Two other days remained the same
grade – day 7 and 28, though these were graded as zero, so there was nothing to start
with. Two days decreased in their level of detail - day 1, which was originally a faint
fingermark with the CAF treatment reducing to only a possible fingermark and a grade
0; while day 14 started at a grade 1 faint grab dropping to a grade 0 and only a
possible target area. With black satin, this is obviously not the sequence to use as all
of the detail visualised with CAF was lost once VMD was carried out over the top, even

129
with the grade 3 day 7 sample. Nylon only had three positive samples after CAF, all
graded 1. Day 1 dropped from a grab to only a possible thumb and fingertip
impressions; day 14 dropped from a grab to a possible fingertip impression and day 28
from a grab to nothing, just a negative sample. With days 3 and 7 the grades started
at 0 and remained at 0. Linen did not produce any positive samples after CAF and this
was not improved by the use of VMD – all the days remained at a grade of 0. Nylon-
Lycra was the only fabric where there was any improvement on the originally treated
swatches - days 1, 3, 7 and 28 all started at grade 0 rising to grade 1 after the
sequential VMD. Day 1 rose from nothing, a negative sample, to an extremely faint
grab; day 3 rose to a grab, no detail and parts of hand missing; day 7 to a possible
thumb and finger; day 14 to a possible thumb mark and finally day 28 became a faint
grab. Overall this donor had eleven samples that remained unchanged in their grade;
ten samples lost detail and became lower in grade, while four samples, all linen
displayed more detail after the sequential treatment.
6.4.3 Sequential CAF then VMD - Donor two
0
1
2
3
4
WhitesatinCAFonly
WhitesatinCAFthenVMD
BlacksatinCAFonly
BlacksatinCAFthenVMD
NylonCAFonly
NylonCAFthenVMD
Nylon-LycraCAFonly
Nylon-LycraCAFthenVMD
LinenCAFonly
LinenCAFthenVMD
Gra
de
of
Ma
rk
Fabric Type
Day 1
Day 3
Day 7
Day 14
Day 28
Figure 6.8: Results for donor two over a time period of 1, 3, 7, 14 and 28 days comparing visualisation using CAF only, versus the sequential treatment of CAF followed by VMD. The fabrics processed were white satin, black satin, nylon, nylon-Lycra and linen.
With this donor [Figure 6.8] there was also very little in the way of positive
samples and of those samples even less remained positive after the sequential

130
treatment of VMD. White satin was zero for all days, with the exception of day 3, this
sample changed from a zero grade and negative to a grade 1 and possible target area.
Black satin again lost the majority of the detail originally visualised with CAF - day 14
remained the same (grade 1), a faint grab to faint fingertip and thumb impression.
Day 1 lost detail dropping from a grade 2 to 1 (a grab to a faint grab); day 7 also
dropped from a grade 2 to 1, from a grab with partial ridge detail in thumb to fingertip
impression only; days 3 and 28 dropped from a grade 1 to a grade 0 – a grab and faint
grab to negative blank samples. Nylon had two days (3 and 28) which started as
grade 0 and remained at this grade, while the other days (1, 7 and 14) all lost detail -
day 1 was only a fingertip and thumb impression, then became a negative; while day 7
started as a fingertip and dropped to only possible target area; with day 14 starting as
a faint grab to another negative sample. Linen again like donor one did not produce
any detail after CAF only or CAF then VMD. Again nylon-Lycra produced positive
samples after sequential VMD from samples that had no detail from the originally CAF
treated samples. There was no detail with days 3 and 14 – graded 0 for both CAF and
CAF then VMD, but days 1, 7 and 28 all improved from a grade 0 to grade 1 – negative
to possible finger impressions. Overall, with this donor the majority of samples
remained unchanged – fourteen in total, though the majority were and remained grade
0 (nine and 64 % or 12 % overall), while seven samples dropped in detail and grading
(9 %) and only four increased in detail ( 5 %). Thus this reinforces that the only fabric
out of those used in this section that could benefit from this sequential method is
nylon-Lycra, all other fabrics performed worse after sequential CAF then VMD, with
only the day 3 white satin improving its grading, though this was not a great change in
grade or detail observed.
6.4.4 Sequential CAF then VMD Donor three
White satin [Figure 6.9] was graded as 0 for all days, though days 7 and 28
had possible fingertip impressions after the sequential VMD. Black satin, as with the
other two donors, again lost detail with all of the days - day 1 dropped from a grade 3
to grade 0, from a full grab to only a possible grab. Day 3 dropped from a grade 4 to
grade 2, from a grab with palmar flexion creases and ridge detail to a faint grab and
only possible palmar flexion creases. Day 7 went from an excellent grade 4 to a
negative grade 0 from a grab, with ridge detail and palmar flexion creases to nothing
and day 14 dropped from a grade 2 to 0, full grab with some palmar flexion creases to

131
nothing. Finally day 28 dropped from a grade 2 to a grade 1 - a full grab with some
palmar flexion creases to only a faint grab and no detail.
Figure 6.9: Results for donor three over a time period of 1, 3, 7, 14 and 28 days comparing visualisation using CAF only, versus the sequential treatment of CAF followed by VMD. The fabrics processed were white satin, black satin, nylon, nylon-Lycra and linen.
Nylon the same as the other donors had some positive samples with just CAF
(days 7, 14 and 28 – grade 1 and day 1 – grade 2), but all this detail was lost after the
sequential treatment with VMD. The samples dropped from - day 1 a grade 2 with a
full grab and palmar flexion creases to a negative sample with no indication of even a
touch; day 7 dropped from a faint finger impressions to a negative sample; day 14
again a grab to nothing and day 28 a faint grab to only a possible fingertip impression.
The final day – day 3, did not have any detail from the start, was a grade 0 after CAF
and remained a grade 0 after CAF then VMD. Once more, linen displayed no detail for
any days after either treatment. While nylon-Lycra again was the most positive fabric
in terms of positive samples after the sequential treatment – though with this donor
three of the samples remained zero grades – day 1 had very little metal deposits at all,
while both days 3 and 14 were negative after only CAF, but had possible finger
impressions after the sequential VMD. Days 7 and 28 both improved and had positive
marks after the VMD - day 7 had a partial grab, while day 28 had a finger impression
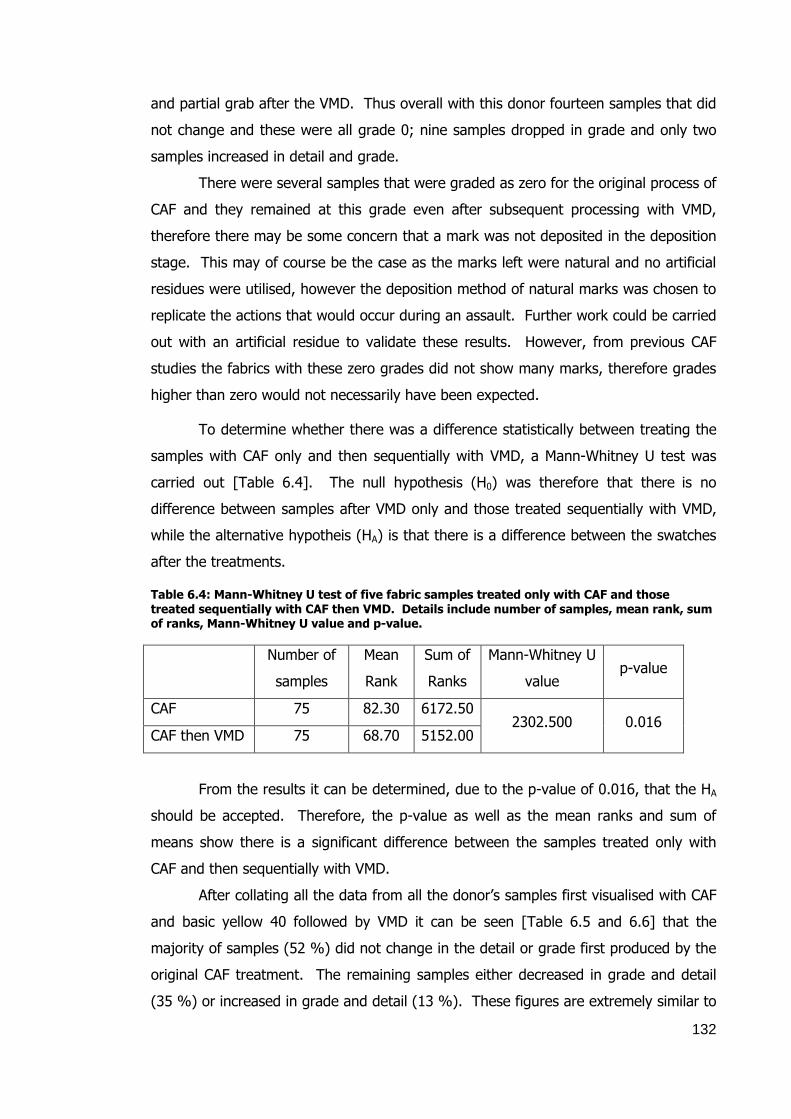
132
and partial grab after the VMD. Thus overall with this donor fourteen samples that did
not change and these were all grade 0; nine samples dropped in grade and only two
samples increased in detail and grade.
There were several samples that were graded as zero for the original process of
CAF and they remained at this grade even after subsequent processing with VMD,
therefore there may be some concern that a mark was not deposited in the deposition
stage. This may of course be the case as the marks left were natural and no artificial
residues were utilised, however the deposition method of natural marks was chosen to
replicate the actions that would occur during an assault. Further work could be carried
out with an artificial residue to validate these results. However, from previous CAF
studies the fabrics with these zero grades did not show many marks, therefore grades
higher than zero would not necessarily have been expected.
To determine whether there was a difference statistically between treating the
samples with CAF only and then sequentially with VMD, a Mann-Whitney U test was
carried out [Table 6.4]. The null hypothesis (H0) was therefore that there is no
difference between samples after VMD only and those treated sequentially with VMD,
while the alternative hypotheis (HA) is that there is a difference between the swatches
after the treatments.
Table 6.4: Mann-Whitney U test of five fabric samples treated only with CAF and those treated sequentially with CAF then VMD. Details include number of samples, mean rank, sum of ranks, Mann-Whitney U value and p-value.
Number of
samples
Mean
Rank
Sum of
Ranks
Mann-Whitney U
value p-value
CAF 75 82.30 6172.50 2302.500 0.016
CAF then VMD 75 68.70 5152.00
From the results it can be determined, due to the p-value of 0.016, that the HA
should be accepted. Therefore, the p-value as well as the mean ranks and sum of
means show there is a significant difference between the samples treated only with
CAF and then sequentially with VMD.
After collating all the data from all the donor’s samples first visualised with CAF
and basic yellow 40 followed by VMD it can be seen [Table 6.5 and 6.6] that the
majority of samples (52 %) did not change in the detail or grade first produced by the
original CAF treatment. The remaining samples either decreased in grade and detail
(35 %) or increased in grade and detail (13 %). These figures are extremely similar to

133
those obtained by the VMD then CAF sequential sequence; however the starting
grades for these figures were much lower. Overall there were only forty four positive
samples - thirty four grade 1, six grade 2, two grade 3 and two grade 4 samples.
Table 6.5: Effect on level of detail visualised on five fabric samples treated with CAF and BY40 and then sequentially treated with VMD. The grade range of fingermarks for each fabric is also included to demonstrate the level of ridge detail observed on each fabric type.
Fabric type Level of detail Grading range
Unchanged Decreased Increased
White satin 12 2 1 0 – 1
Black satin 1 14 0 0 – 4
Nylon 5 10 0 0 – 2
Nylon-Lycra 6 0 9 0 – 1
Linen 15 0 0 0
A chi-square test was carried out resulting in χ² (8) = 78.949 p<0.001, which
indicates that the HA that is accepted, as there is a difference between the way the
samples have been treated.
With the information from Table 6.5 and 6.6 the fabrics can be ranked as to
their level of positive detail from gradings to level after sequential treatment and the
order is nylon-Lycra; white satin; nylon; black satin; linen (highest to lowest). When
the grading range within each fabric is considered the order is quite different – black
satin is first with the highest grading of 4, followed by nylon, then the white satin and
nylon-Lycra tied with their highest grade only being 1, then finally linen, with all
samples before and after sequential treatment grading 0. Nylon-Lycra was the third
highest for samples staying the same grade after sequential treatment (six), third only
to linen and white satin, it did not have any decreased samples that became worse
after sequential VMD treatment, and finally nylon-Lycra had the highest number of
samples that increased in detail, nine in total. Thus, it could be presumed that nylon-
Lycra items would be more likely to increase in detail if they had been treated with CAF
then VMD, whereas the expected count (5.2) showed that more samples were
expected to decrease in detail. White satin had two samples that reduced in detail, the
majority – twelve in total stayed the same and one sample increased in its level of
detail. Therefore white satin items are more likely to remain unchanged than increase
or decrease in detail, even though statistically fewer samples (7.8 compared to 12)

134
were expected to stay unchanged, while 5.2 were expected to decrease and 2.0 to
increase, compared to the actual results of 2 and 1.
Table 6.6: Chi-squared test results comparing the grades and grade change (unchanged, decreased, increased) observed for the sequential treatment (CAF then VMD) of planted latent marks on five fabrics.
Fabric Effect of CAF on VMD treated samples
Unchanged Decreased Increased Total
White
satin
Count 12 2 1 15
Expected count 7.8 5.2 2.0 15.0
Percentage with grade (%)
80.00 13.3 6.7 100
Residual 4.2 -3.2 -1.0
Black satin
Count 1 14 0 15
Expected count 7.8 5.2 2.0 15.0
Percentage with
grade (%)
6.7 93.3 0.0 100
Residual -6.8 8.8 -2.0
Nylon Count 5 10 0 15
Expected count 7.8 5.2 2.0 15.0
Percentage with grade (%)
33.3 66.7 0.0 100
Residual -2.8 4.8 -2.0
Nylon-
Lycra
Count 6 0 9 15
Expected count 7.8 5.2 2.0 15.0
Percentage with
grade (%)
40.0 0.0 60.0 100
Residual -1.8 -5.2 7.0
Linen Count 15 0 0 15
Expected count 7.8 5.2 2.0 15.0
Percentage with
grade (%)
100 0.0 0.0 100
Residual 7.2 -5.2 -2.0
Total Count 39 26 10 75
Expected count 39. 26.0 10.0 75.0
Percentage with grade (%)
52.00 34.7 13.3 100
With nylon, only five samples remained unchanged while the remaining ten
samples all reduced in detail – there was very little detail to start with, but after the
sequential VMD treatment the majority of detail disappeared. Therefore, nylon items
sequentially treated with CAF then VMD will most likely lose any detail that was
originally visualised by CAF, thus this is not a suitable treatment sequence for nylon.
The expected counts in Table 6.6 showed that nylon was expected to have less
decrease in detail (5.2 compared to the actual 10), while more samples were expected
to remain unchanged (7.8, compared to 5) and some samples were expected to
increase in detail (2 compared to 0). Black satin one sample stayed the same with no
addition detail visualised, all the remaining fourteen samples reduced in detail, which is

135
quite different to the expected counts of 7.8 unchanged, 5.2 decreased and 2
increased. Thus with black satin items are most likely to decrease in detail, thus this
sequence would again not be advised as a way of increasing detail. Finally, with linen
no detail was visualised with CAF or after VMD was used to sequentially treat the
samples, which again is quite different to the expected statistical results which indicate
that there should be 7.8 unchanged, 5.2 decreased and 2 increased. Thus, it seems
that with linen, the use of CAF or CAF and then sequential VMD treatment, will not lead
to visualisation of any detail, so it appears that VMD alone is the best method to treat
this fabric.
Overall, the order of fabric again seems to be following the general trend of the
smooth tighter weave the more detail as does the order of improvement from
sequential treatment. Though as with the previous sections in this study, there is less
detail in the CAF treated samples than there were with the original VMD treated
samples. There were only 44 samples in total that were positive (59 %), while the
remaining 41 % were negative, which seems to reinforce that CAF is the less effective
treatment on fabrics and that the BY40 dye may be negatively impacting on the
visualisation.
6.5 Conclusion
The use of VMD then CAF did seem to increase the detail visualised on the
samples on some fabrics or at least make the detail more obvious and easier to see,
such as the donor three black satin swatches. However, some of the samples did not
change or the sequential treatment was detrimental to the original detail visualised.
On some fabrics the CAF process appeared to remove the metal deposits from the
fabric – linen is a prime example, the limited detail and metals deposits seems to
completely disappear after the CAF and no new or additional detail was observed after
the BY40 staining and viewing under the Quaser or Crime lites. With the CAF then
VMD, this seemed to reduce the amount of detail or marks previously visualised with
CAF only on the majority of fabrics and samples. This may be due to the VMD metals
attaching to the fabric and the CAF deposited afterward adhering to these metals as
well as the fingerprint residues thus disguising any marks previously noted.
Therefore this current research seems to support the use of VMD over CAF, however if
they were to be used sequentially this trial suggests to use CAF after VMD. More work
obviously needs to be done in this area with more donors and fabrics to determine the
full extent of sequential treatment and its impact on visualised detail. However, overall

136
satin seems to benefit from sequential VMD then CAF, as does nylon, though nylon-
Lycra and linen do not. With CAF then VMD the only fabric that seems to benefit from
this sequential treatment is nylon-Lycra.

137
7. COMPARISON OF THE RECOVERY OF FINGERMARKS FROM FABRIC
USING VACUUM METAL DEPOSITION (VMD) AND CYANOACRYLATE FUMING
(CAF)
Note: this work is a comparative study of the two techniques of VMD and CAF
carried out by myself (Researcher one and four) and, where indicated, Forensic
Science Honour’s project students (named researchers two, three, five, six and seven)
under my guidance.
7.1 Aims
To investigate the effectiveness of metal deposition (VMD) and cyanoacrylate
fuming (CAF) in visualising planted fingermarks and palm marks on various pre-cut
fabric swatches of cotton, polycotton, polyester, nylon and satin.
7.2 Background
Fifteen donors planted their marks using either a natural or loaded method of
deposition utilising either a grab and/or push technique. These donors ranged in age,
sex and ability to leave latent fingermarks.
Once the impressions were planted the fabric swatches were aged for varying
lengths of time – 1, 2, 3, 4, 5, 6, 7, 14, 21 and 28 days, and then processed with
either VMD or CAF. Once visualised the samples were graded as to whether target
areas were visible as well as the amount of ridge detail and palm marks visualised,
using the scale 0, 1, 2, 3 or 4 – 0 being no development and 4 being excellent.
Both VMD and CAF were investigated to determine their effectiveness in the
visualisation of fingermark and hand mark impressions on fabric swatches, as a model
for the usefulness of these techniques in the visualisation of fingermarks on clothing
collected from cases of sexual and/or physical attacks. The visualisation of these
marks could help in the identification of those involved in assault cases through ridge
detail and palmar flexion creases as well as visualising areas that could be targeted for
DNA collection then profiling. These marks can also help in corroborating a sequence
of events. For example, a consensual encounter is less likely to involve marks that
indicate the complainant was grabbed from behind or a person whose family are
convinced they did not commit suicide by jumping in front of a train, would have marks
on their back indicating a push.
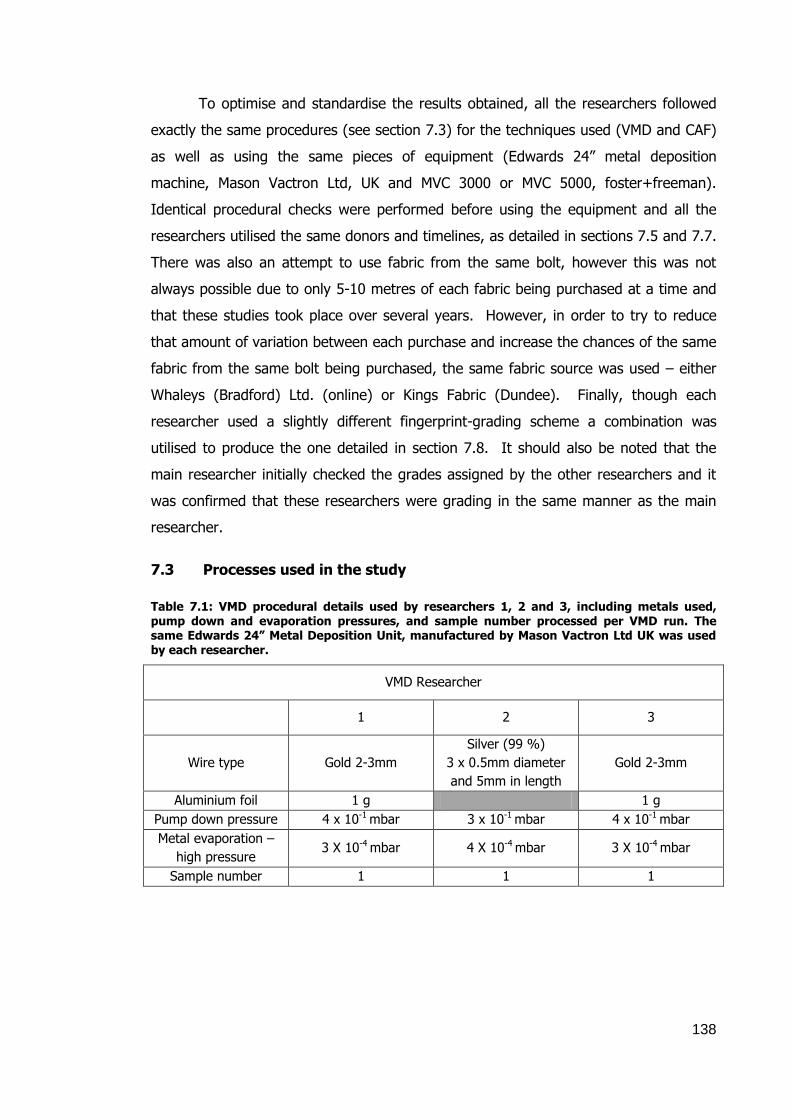
138
To optimise and standardise the results obtained, all the researchers followed
exactly the same procedures (see section 7.3) for the techniques used (VMD and CAF)
as well as using the same pieces of equipment (Edwards 24” metal deposition
machine, Mason Vactron Ltd, UK and MVC 3000 or MVC 5000, foster+freeman).
Identical procedural checks were performed before using the equipment and all the
researchers utilised the same donors and timelines, as detailed in sections 7.5 and 7.7.
There was also an attempt to use fabric from the same bolt, however this was not
always possible due to only 5-10 metres of each fabric being purchased at a time and
that these studies took place over several years. However, in order to try to reduce
that amount of variation between each purchase and increase the chances of the same
fabric from the same bolt being purchased, the same fabric source was used – either
Whaleys (Bradford) Ltd. (online) or Kings Fabric (Dundee). Finally, though each
researcher used a slightly different fingerprint-grading scheme a combination was
utilised to produce the one detailed in section 7.8. It should also be noted that the
main researcher initially checked the grades assigned by the other researchers and it
was confirmed that these researchers were grading in the same manner as the main
researcher.
7.3 Processes used in the study
Table 7.1: VMD procedural details used by researchers 1, 2 and 3, including metals used, pump down and evaporation pressures, and sample number processed per VMD run. The same Edwards 24” Metal Deposition Unit, manufactured by Mason Vactron Ltd UK was used by each researcher.
VMD Researcher
1 2 3
Wire type Gold 2-3mm
Silver (99 %)
3 x 0.5mm diameter
and 5mm in length
Gold 2-3mm
Aluminium foil 1 g 1 g
Pump down pressure 4 x 10⁻¹ mbar 3 x 10⁻¹ mbar 4 x 10⁻¹ mbar
Metal evaporation –
high pressure 3 X 10⁻⁴ mbar 4 X 10⁻⁴ mbar 3 X 10⁻⁴ mbar
Sample number 1 1 1

139
Table 7.2: CAF procedural details used by researcher 4, 5, 6 and 7, including glue quantity, humidity cycle, glue application and purge cycles, as well as dye used, length of dyeing process and light source used for enhancement.
CAF Researcher
4 5 6 7
Cyanoacrylate
(MVC 3000/5000) 2 or 4 g 2 or 4 g 2 or 4 g 2 or 4 g
Humidity 79 % 80 % 79 % 80 %
Temperature 120.7 C 100 C 120.7 C 120 C
Humidity cycle 15 minutes 20 minutes 15 minutes 15 minutes
Glueing cycle 15 minutes 20 minutes 15 minutes 20, 40 and 60
minutes
Purge cycle (MVC
3000/5000) 20/40 minutes 20/40 minutes 20/40 minutes 20/40 minutes
Dye
BY40 dye (2 g)
dissolved in
ethanol (1L)
BY40 dye (2 g)
dissolved in
ethanol (1L)
BY40 dye (2 g)
dissolved in
ethanol (1L)
BY40 dye (2 g)
dissolved in
ethanol (1L)
Dye submersion
time 1 minute 1 minute 1 minute 1 minute
Light source laser light (350-
469 nm)
a forensic light
(450-485 nm)
laser light (350-
469 nm)
laser light (352-
469 nm)
7.4 Fabrics used in studies
Table 7.3: Fabrics used by researchers 1-7 for VMD and CAF trials. Fabrics were selected as being representative of those commonly used in the manufacture of modern clothing and all had a minimum count of 3 threads per mm.
Researcher
Fabric type 1 2 3 4 5 6 7
Nylon White White White White White White
Cotton White Dark blue White White White
Polyester White Black White White Navy White
Polycotton White Black White White White
Satin Black Black White Green
Silk White Navy Multi-
coloured
Lycra White
Linen White Lilac
Polyester/cotton
(65/35 %) White
Polyvinyl
chloride (PVC) White Brown
Nylon-Lycra Black
Wool Black and
cream
Nylon/polyester Pink
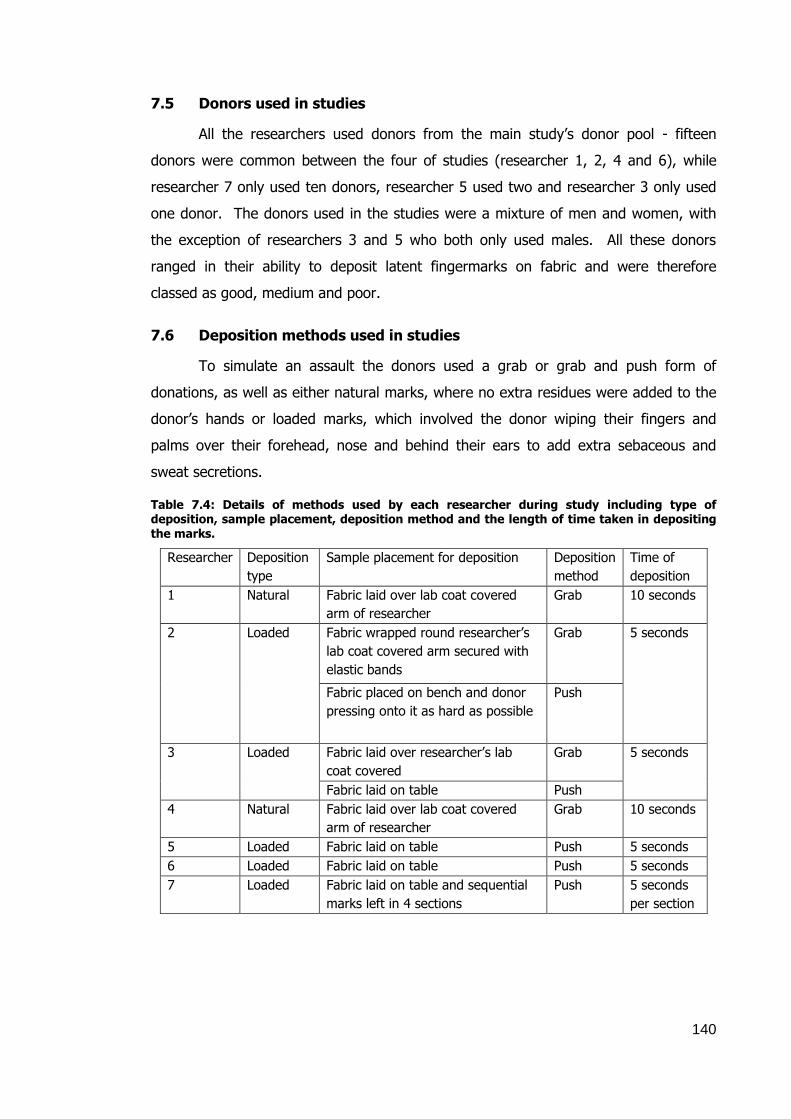
140
7.5 Donors used in studies
All the researchers used donors from the main study’s donor pool - fifteen
donors were common between the four of studies (researcher 1, 2, 4 and 6), while
researcher 7 only used ten donors, researcher 5 used two and researcher 3 only used
one donor. The donors used in the studies were a mixture of men and women, with
the exception of researchers 3 and 5 who both only used males. All these donors
ranged in their ability to deposit latent fingermarks on fabric and were therefore
classed as good, medium and poor.
7.6 Deposition methods used in studies
To simulate an assault the donors used a grab or grab and push form of
donations, as well as either natural marks, where no extra residues were added to the
donor’s hands or loaded marks, which involved the donor wiping their fingers and
palms over their forehead, nose and behind their ears to add extra sebaceous and
sweat secretions.
Table 7.4: Details of methods used by each researcher during study including type of deposition, sample placement, deposition method and the length of time taken in depositing the marks.
Researcher Deposition
type
Sample placement for deposition Deposition
method
Time of
deposition
1 Natural Fabric laid over lab coat covered
arm of researcher
Grab 10 seconds
2 Loaded Fabric wrapped round researcher’s
lab coat covered arm secured with
elastic bands
Grab 5 seconds
Fabric placed on bench and donor
pressing onto it as hard as possible
Push
3 Loaded Fabric laid over researcher’s lab
coat covered
Grab 5 seconds
Fabric laid on table Push
4 Natural Fabric laid over lab coat covered
arm of researcher
Grab 10 seconds
5 Loaded Fabric laid on table Push 5 seconds
6 Loaded Fabric laid on table Push 5 seconds
7 Loaded Fabric laid on table and sequential
marks left in 4 sections
Push 5 seconds
per section

141
7.7 Timelines used in studies
Generally, the same timeline of 1 to 28 days was used, though some
researchers did not use the full range, as shown below.
VMD - Days 1, 2, 3, 4, 5, 6, 7, 14, 21 and 28 (researcher 2, no results for days 5, 6, 14
or 28)
CAF – Days 1, 2, 4, 5, 6, 7, 14, 21 and 28 (researcher 7, no results for days 2, 4, 6, 14
or 28)
7.8 Fingermark grading used in studies
Each researcher had their own set of grading criteria that has been combined
to produce the set below.
Excellent (4) – good ridge detail on all 5 fingertips and palm with visible pores, ridge
edge detail and ridge flow.
Good (3) – ridge characteristics (Galton details) visible on at least 3 fingers or
approximately 1/3 to 2/3 partial detail on all fingermarks.
Fair (2) – Full pattern and ridge flow on 1 or 2 fingers or approximately 1/3 partial
detail on all the fingers and/or palmar flexion creases visible, but not enough detail for
identification.
Empty (1) – the location where the donor had touched the fabric could be seen, but
no ridge detail observed on fingertips or palm.
No development (0) – negative, no visible or recognisable marks on fabric.
7.9 VMD donor grading
When comparing all the fabrics and donors tested [Figure 7.1] there did appear
to be a trend, even if the donors are not consistently at the same rating for different
fabrics. For example, donor one consistently developed the highest gradings, such as
good on nylon; medium on polycotton and silk; medium to good on polyester; poor to
medium on cotton and poor on satin, Lycra, linen and PVC. This, in turn, reinforces
the view stated above that this donor leaves good marks, even though they were now
consistently rated as a good donor. Donors five and fourteen could also be considered
good donors with a mix of good (donor fourteen on nylon), medium to good (donor
five on nylon), medium (donor five on polycotton and polyester and donor fourteen on
polyester), medium to poor (donor fourteen on polycotton) and poor (both five and
fourteen on satin and cotton). The other donors could be ranked as good to medium
(donors two, four, six, eleven and fifteen), medium (donors nine and ten), medium to

142
poor (donors twelve and thirteen) and poor (donors three, seven and eight) – these
were poor donors for all the fabrics tested. Donor seven was expected to be a poor
donor due to their performance in other trials and the results in the current trials
reinforced this. This poor donor rating may be due in part to donor seven having dry
hands, thus lack of fingerprint residues. Donors three and eight had not previously
been tested experimentally but discussions about the dryness of their skin and contact
with chemicals pointed to them being poor donors. Differences in environmental
factors can also lead to an effect on the amount of secretions and therefore the
fingerprint residues deposited as well as how much pressure was used to deposit the
marks on the fabrics.
0
2
4
6
8
10
12
14
Poor Poor toMedium
Medium Medium toGood
Good
Nu
mb
er
of
Do
no
rs
Fabric Type
Polyester Nylon Cotton Polycotton Satin Silk Lycra Linen PVC
Figure 7.1: Combined donor grading in the study on each fabric type visualised with VMD. The grading ranged from poor to good depending on level of detail displayed in each sample processed, poor having little or no detail up to good with ridge detail and/or palmar flexion creases.
7.9.1 Cotton
Generally, as illustrated in the table below [Table 7.5], cotton did not allow the
visualisation of fingermark ridge detail – only donors one and two had any gradings
higher than 1, while all the other donors either left latent marks that did not visualise
after VMD or only showed areas of contact (grade 1). The grades that were higher
than 1 tended to be on the younger samples – days 1 and 3, though donor one did
have a grade 2 sample on day 7. This could indicate, especially with the days 1 and 3
samples, that the fingerprint residues are quite quickly absorbed into the cotton
therefore not available for VMD visualisation. The higher than expected grade on day

143
7 could have been a spurious result due to the donor being exposed to different
environmental factors such as heat, exercising prior to donation or different food
consumption, all of which could have led to higher than normal fingerprint residues
being produced and therefore deposited on that sample. Due to the low gradings for
the majority of samples all the donors, except donor one, were graded as poor. Donor
one had a grading of poor to medium due to three of the samples containing some
level of ridge detail and/or palmar flexion creases.
Table 7.5: VMD donor rating and range of donor fingermark gradings for each day on cotton illustrating the effect of age on the ridge detail visualised.
Donor Day
Donor rating 1 2 3 4 5 6 7 14 21 28
1 1-3 1 1-2 0-1 1 0-1 0-2 0-1 0-1 0-1 Poor - Medium
2 1-2 0-1 0-1 0-1 1 0 1 1 1 1 Poor
3 0-1 0-1 0-1 0 0-1 0-1 0 0-1 0-1 0 Poor
4 0-1 1 0-1 1 0 0 0-1 0 0-1 0-1 Poor
5 0 0 0-1 0-1 0-1 0-1 0 0-1 0 0 Poor
6 0-1 0 0 0-1 0-1 0 0-1 0 0 0-1 Poor
7 0-1 0-1 0-1 0-1 0 0-1 0-1 0 0-1 0 Poor
8 0-1 0-1 0 0 0 0 0 1 0-1 0-1 Poor
9 0-1 0-1 0-1 0 0-1 0 0 0-1 0-1 0 Poor
10 0 0-1 0-1 0 0 0 1 0 0 0-1 Poor
11 0-1 0-1 0-1 0 0-1 0-1 0-1 0-1 0 0 Poor
12 0 0 0 0 0-1 0 0-1 0 0 0 Poor
13 0-1 0-1 0 0 0-1 0-1 0-1 0-1 0-1 0 Poor
14 1 0-1 0-1 0-1 1 1 1 0-1 0 0 Poor
15 0-1 0-1 0-1 0-1 0 0 0 0-1 0 0 Poor
7.9.2 Polycotton
Polycotton had the full range of fingermark gradings between all the donors,
from no development (0) to full ridge detail (4) which equates to a mixture of poor to
medium donors. Again, it is donor one who had the best detail developed across the
full timeline – every day contained samples that contained identifiable ridge detail
(grade 2 – 4) and led to donor one being classed as a medium donor. Donor five was
also classed as medium, as they too had 6 out of 10 samples with identifiable ridge
detail. However, with this donor, the majority of days had samples with no

144
development and two days (6 and 28) graded 0. There were four other donors (two,
four, eleven and fourteen) who left some level of identifiable ridge detail over the
timeline. These donors ranged in detail from 0 to 4 though there did not seem to be
any consistency as to when the higher fingermark grades were visualised, which again
illustrates the variability of deposits left by different individuals. Donor two was the
most consistent of the four donors in terms of depositing similar grades across the
timeline. Therefore, it could be concluded that this donor produces constant levels of
residues and these residues remain on the surface of the fabric allowing them to be
visualised by the VMD process.
Table 7.6: Polycotton VMD donor rating and range of donor fingermark gradings for each day illustrating the effect of age on the ridge detail visualised on the samples .
Donor Day
Donor rating 1 2 3 4 5 6 7 14 21 28
1 1-4 1-3 1-4 1-4 1-3 1-3 1-4 1-4 0-3 1-4 Medium
2 1-3 1-2 1 1 1 1-3 1-2 1-2 1-2 1-2 Poor - Medium
3 0 0-2 0-2 0 0-1 0-1 0 0-1 1 0 Poor
4 1-2 1 0-1 0-1 0-2 0 0-1 0 0 1 Poor - Medium
5 0-2 0-3 0-1 0-2 0-1 0 0-2 1-3 0-3 0 Medium
6 0-1 0-1 0-1 0-1 0-2 0 0-1 0-1 0-1 0-1 Poor
7 0-1 0-1 0-1 0 0-1 0-1 0-1 0-1 0 0-1 Poor
8 0-1 0-1 0-1 0-1 0-1 0-1 0-1 0-1 0-1 1 Poor
9 0-2 1 0-1 0-1 1 0-1 0-1 0-1 0-1 0-1 Poor
10 1 1 0-1 0-1 0-1 0-1 1 0 0 0 Poor
11 0-1 1 1-2 0-3 0-1 0-3 0-1 0-1 0-1 0-3 Poor - Medium
12 0-1 0-1 0 0 0-1 0-1 0-1 0-1 0-1 0 Poor
13 0-3 0-1 0-1 0-1 0-1 0-1 0-2 0-1 0-1 0 Poor
14 1 1-2 1-2 1 1-3 1 1-4 0 0 1 Poor - Medium
15 0-3 0-2 0-2 1 0-1 0 0 0-1 0 0 Poor
Both donor eleven and fourteen had samples of grade 3 and even grade 4 in
the case of day 7 but these donors also had several negative samples with no
development at all. All the other donors were rated as poor as the highest grading
found was 2, though the majority were 1 and 0. Interestingly, donor fifteen had some
identifiable samples (grade 2 and 3) though these were only on days 1 – 3 and this
may be due to more residues sitting on the fabric surface and therefore available for
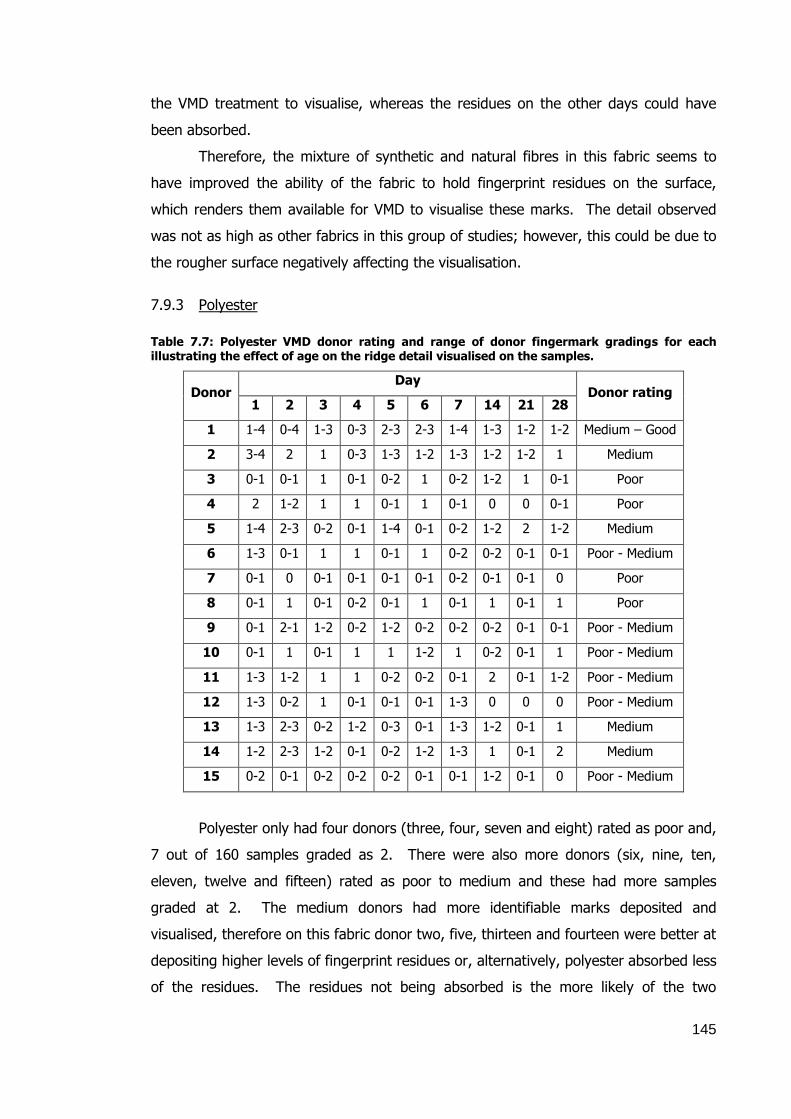
145
the VMD treatment to visualise, whereas the residues on the other days could have
been absorbed.
Therefore, the mixture of synthetic and natural fibres in this fabric seems to
have improved the ability of the fabric to hold fingerprint residues on the surface,
which renders them available for VMD to visualise these marks. The detail observed
was not as high as other fabrics in this group of studies; however, this could be due to
the rougher surface negatively affecting the visualisation.
7.9.3 Polyester
Table 7.7: Polyester VMD donor rating and range of donor fingermark gradings for each illustrating the effect of age on the ridge detail visualised on the samples.
Donor Day
Donor rating 1 2 3 4 5 6 7 14 21 28
1 1-4 0-4 1-3 0-3 2-3 2-3 1-4 1-3 1-2 1-2 Medium – Good
2 3-4 2 1 0-3 1-3 1-2 1-3 1-2 1-2 1 Medium
3 0-1 0-1 1 0-1 0-2 1 0-2 1-2 1 0-1 Poor
4 2 1-2 1 1 0-1 1 0-1 0 0 0-1 Poor
5 1-4 2-3 0-2 0-1 1-4 0-1 0-2 1-2 2 1-2 Medium
6 1-3 0-1 1 1 0-1 1 0-2 0-2 0-1 0-1 Poor - Medium
7 0-1 0 0-1 0-1 0-1 0-1 0-2 0-1 0-1 0 Poor
8 0-1 1 0-1 0-2 0-1 1 0-1 1 0-1 1 Poor
9 0-1 2-1 1-2 0-2 1-2 0-2 0-2 0-2 0-1 0-1 Poor - Medium
10 0-1 1 0-1 1 1 1-2 1 0-2 0-1 1 Poor - Medium
11 1-3 1-2 1 1 0-2 0-2 0-1 2 0-1 1-2 Poor - Medium
12 1-3 0-2 1 0-1 0-1 0-1 1-3 0 0 0 Poor - Medium
13 1-3 2-3 0-2 1-2 0-3 0-1 1-3 1-2 0-1 1 Medium
14 1-2 2-3 1-2 0-1 0-2 1-2 1-3 1 0-1 2 Medium
15 0-2 0-1 0-2 0-2 0-2 0-1 0-1 1-2 0-1 0 Poor - Medium
Polyester only had four donors (three, four, seven and eight) rated as poor and,
7 out of 160 samples graded as 2. There were also more donors (six, nine, ten,
eleven, twelve and fifteen) rated as poor to medium and these had more samples
graded at 2. The medium donors had more identifiable marks deposited and
visualised, therefore on this fabric donor two, five, thirteen and fourteen were better at
depositing higher levels of fingerprint residues or, alternatively, polyester absorbed less
of the residues. The residues not being absorbed is the more likely of the two
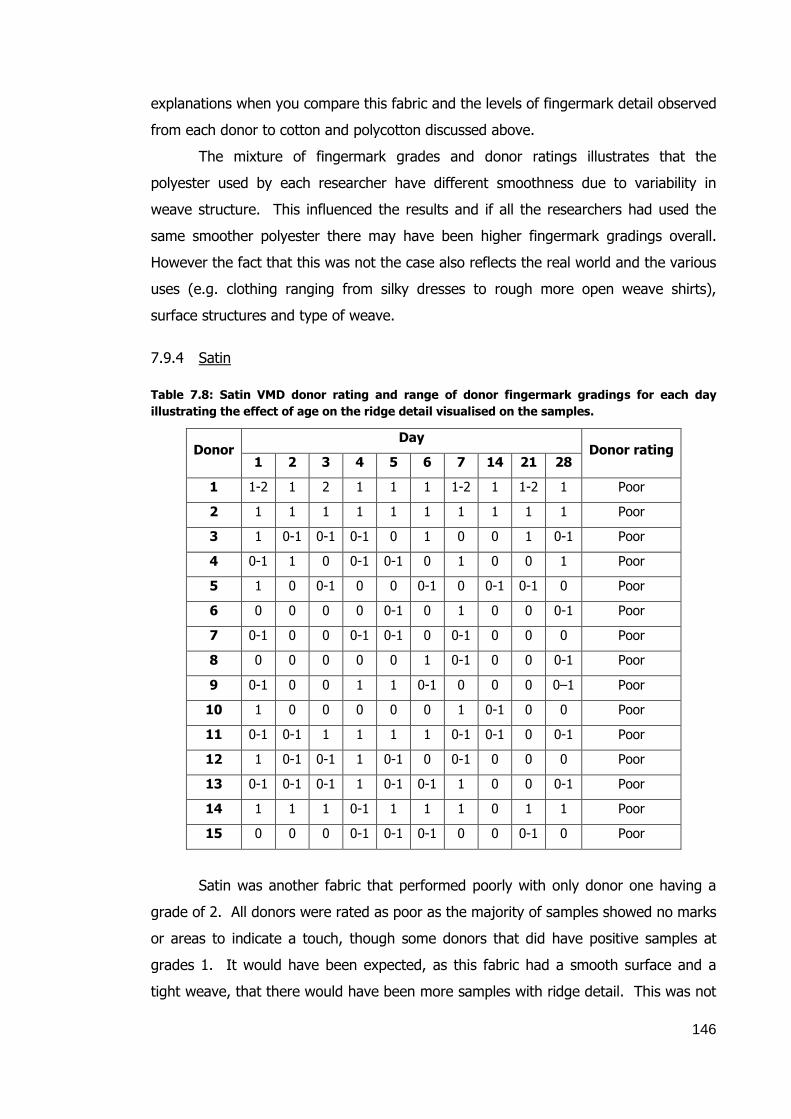
146
explanations when you compare this fabric and the levels of fingermark detail observed
from each donor to cotton and polycotton discussed above.
The mixture of fingermark grades and donor ratings illustrates that the
polyester used by each researcher have different smoothness due to variability in
weave structure. This influenced the results and if all the researchers had used the
same smoother polyester there may have been higher fingermark gradings overall.
However the fact that this was not the case also reflects the real world and the various
uses (e.g. clothing ranging from silky dresses to rough more open weave shirts),
surface structures and type of weave.
7.9.4 Satin
Table 7.8: Satin VMD donor rating and range of donor fingermark gradings for each day
illustrating the effect of age on the ridge detail visualised on the samples.
Donor Day
Donor rating 1 2 3 4 5 6 7 14 21 28
1 1-2 1 2 1 1 1 1-2 1 1-2 1 Poor
2 1 1 1 1 1 1 1 1 1 1 Poor
3 1 0-1 0-1 0-1 0 1 0 0 1 0-1 Poor
4 0-1 1 0 0-1 0-1 0 1 0 0 1 Poor
5 1 0 0-1 0 0 0-1 0 0-1 0-1 0 Poor
6 0 0 0 0 0-1 0 1 0 0 0-1 Poor
7 0-1 0 0 0-1 0-1 0 0-1 0 0 0 Poor
8 0 0 0 0 0 1 0-1 0 0 0-1 Poor
9 0-1 0 0 1 1 0-1 0 0 0 0–1 Poor
10 1 0 0 0 0 0 1 0-1 0 0 Poor
11 0-1 0-1 1 1 1 1 0-1 0-1 0 0-1 Poor
12 1 0-1 0-1 1 0-1 0 0-1 0 0 0 Poor
13 0-1 0-1 0-1 1 0-1 0-1 1 0 0 0-1 Poor
14 1 1 1 0-1 1 1 1 0 1 1 Poor
15 0 0 0 0-1 0-1 0-1 0 0 0-1 0 Poor
Satin was another fabric that performed poorly with only donor one having a
grade of 2. All donors were rated as poor as the majority of samples showed no marks
or areas to indicate a touch, though some donors that did have positive samples at
grades 1. It would have been expected, as this fabric had a smooth surface and a
tight weave, that there would have been more samples with ridge detail. This was not

147
the case so there must be other factors influencing the results, such as a coating on
the fabric’s surface preventing the fingerprint residues from adhering or that the
residues were quickly absorbed into the fabric leading to little or no development from
the VMD process.
7.9.5 Nylon
Nylon showed the greatest level of fingermark detail and the highest number of
good and medium to good rated donors. It also appears as if the detail obtained was
consistent for each donor with the exception of donor two, as all the other donors
received the same grade from each researcher. However, donor two who had a range
for each day and in the case of days 7 and 21 this ranged from grade 1 to 4, again
showing the variability of donors and the residues they produce. Overall, even with
the higher levels of detail, the rating of the donors do seem to follow the pattern
displayed with the other fabrics – poor donors are still poor, whereas the better
donors, for example donor one is still the best and highest rated donor.
Table 7.9: Nylon VMD donor rating and range of donor fingermark gradings for each day
illustrating the effect of age on the ridge detail visualised on the samples.
Donor Day
Donor rating 1 2 3 4 5 6 7 14 21 28
1 3 4 3 2 4 3 3 4 2 2 Good
2 2-4 1-2 2 2-4 3 2 1-4 1 1-4 2 Medium
3 1 1 2 2 2 1 2 1 1 0 Poor
4 3 3 2 1 1 2 2 1 1 1 Medium
5 2 3 2 4 3 3 3 1 1 1 Medium – Good
6 3 2 3 1 2 2 2 2 1 2 Medium
7 2 1 2 1 1 1 1 0 1 0 Poor
8 1 2 1 1 3 2 1 1 1 2 Poor
9 1 2 1 1 0 1 2 1 1 1 Poor
10 1 2 1 2 1 2 2 1 1 1 Poor – Medium
11 3 0 3 3 2 2 0 1 1 2 Medium
12 2 1 1 1 1 2 1 1 1 1 Poor
13 2 2 2 2 1 1 2 2 1 0 Poor – Medium
14 3 2 4 2 3 1 2 2 4 1 Good
15 0 3 2 3 1 2 3 2 2 1 Medium – Good

148
This increase in detail and marks observed is most likely due to the surface of
the nylon being smooth and the weave being quite tight. In addition, the lack of
porosity of this fabric would allow the fingerprint residues to remain on the surface and
therefore be freely available for visualisation during the VMD process.
7.9.6 Silk, Lycra, linen and PVC
Fewer researchers used silk, Lycra, linen and PVC in their studies so the results
were combined to give an overview as to the fingermark visualisation ability of these
fabrics. Silk was the highest donor rated fabric (medium) and contained the most
fingermark detail as would be expected since silk is smooth and has a relatively tight
weave. Lycra is another example of a tight weave fabric, however it was not as
smooth as the silk and the stretchy nature of the fabric may have resulted in the grab
or push opening up the weave as it was held and therefore the residues do not remain
on the surface, but are forced into the fabric. PVC is also quite smooth, however very
little detail was observed so, again, this could be due to the surface coating as stated
by Ramotowski (2013, p. 77) “heavily plasticized” PVC did not develop many marks
and had “little success”. Linen was also rated as poor donor-wise and had a
fingermark rating of 1 for all days, except day 1; this would be expected from the open
weave and quite rough surface of linen.
Table 7.10: VMD Donor rating and range of donor grading for donor one, for each day on silk,
Lycra, linen and PVC demonstrating the effect of age on sample).
Fabric Day
Donor rating 1 2 3 4 7 21
Silk 2 2 -2 2 - 4 4 2 -4 1 Medium
Lycra 1 1 1 1 1 0 Poor
Linen 0 1 1 1 1 1 Poor
PVC 0 -1 0 1 - 2 1 1 0 Poor
Overall, when considering donor ratings, nylon produced the best development
as it was the only donor to show good ratings (donor one and fourteen). Nylon had
the highest number of excellent ratings (4) and donors with good to medium gradings
(53 % of the donors for nylon). The other fabrics were lower in their donor gradings -
polyester (33 % of donors rating medium to medium/good) and polycotton (13 %
donors rating medium), though with some donors (nine, twelve and thirteen) polyester
was the same or better than nylon. Satin and cotton were always poor as virtually all

149
their grade ratings were 0 or 1. However, donor one, who consistently produced
better than average deposits, was an exception having a poor to medium rating due to
this donor showing ridge detail on cotton [Table 7.5].
The effect of age on the samples and the ability of VMD to visualise impressions
can also be seen in Table 7.5 – 7.10. It appears that the production of marks is
independent of the age of the sample. Researcher two found that freshly planted
marks in many cases contained too much oil therefore lead to empty marks, the
samples that were between 3 and 7 days old had lost some of the oils and therefore
produced the full range of gradings, while the oldest marks were mixed varying
between no marks and excellent. This may of course been caused in part to the fact
that this researcher was using loaded marks, which will contain higher than expected
levels of secretions, due to the addition of oils from the forehead and/or from behind
the ear (Kent 2010). Researcher three found similar levels of development on each
day, however some previously unseen ridge detail was observed on two samples that
were re-examined a few days later. Researcher three also used the loaded method of
deposition; therefore this could have impacted on the results obtained, however
researcher one used the natural method of deposition and found that there was an
even spread between days and donors. With the natural deposition method it was
found that the early impressions produced better detail than the loaded method
samples which reinforces the idea that the loaded method adds too much oil to the
hands before donations, leading to the marks being overloaded and no detail
visualised. There were also a few occasions where there was an unexpected lack of
information, such as donor thirteen on polyester who had a rating of 3 on days 1 and
2, 2 on day 3, 1 on day 4, no development on 5 and 6, then back up to a 3 on day 7
and back down to 1 for days 14 – 28. This may be due to environmental or physical
conditions, such as the donor being colder and therefore producing fewer residues.
This may have been the case as polycotton was collected on the same days and
produced similar ratings; in particular a 3 on day 1 and no development on days 5 and
6. Therefore the conditions were the same for the collection of both fabrics and thus
may have affected the marks visualised.
7.10 Fingermark grading of fabrics visualised with VMD
A large number of the 1908 samples were graded as either 0 (815; 43 %) or 1
(793; 42 %) thus would not be helpful with identification as there is no ridge detail,
but, many would give target areas for DNA collection. Figure 7.2 shows that there
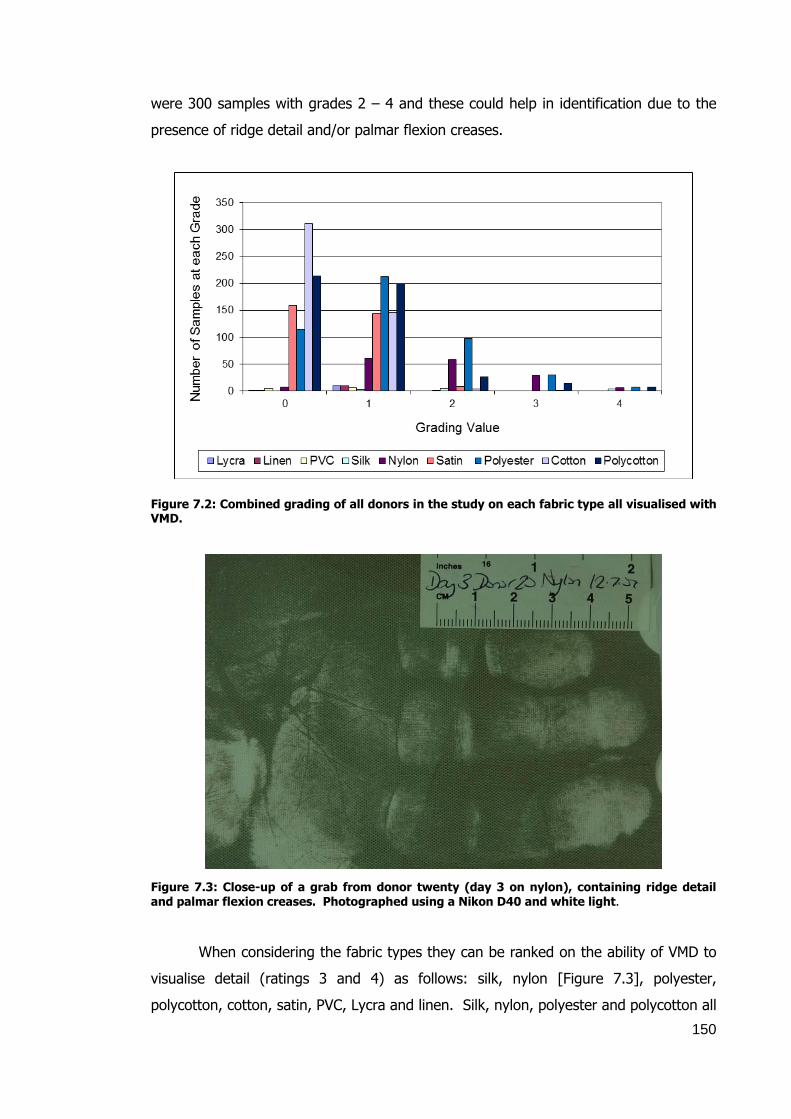
150
were 300 samples with grades 2 – 4 and these could help in identification due to the
presence of ridge detail and/or palmar flexion creases.
Figure 7.2: Combined grading of all donors in the study on each fabric type all visualised with VMD.
Figure 7.3: Close-up of a grab from donor twenty (day 3 on nylon), containing ridge detail and palmar flexion creases. Photographed using a Nikon D40 and white light.
When considering the fabric types they can be ranked on the ability of VMD to
visualise detail (ratings 3 and 4) as follows: silk, nylon [Figure 7.3], polyester,
polycotton, cotton, satin, PVC, Lycra and linen. Silk, nylon, polyester and polycotton all

151
had samples with grade 4 ratings, but cotton only had one grade 3 and four grade 2
samples. However, satin had nine grade 2 samples and PVC had one grade 2 sample
with all the other fabrics being grade 1 or 0. If ratings of 2 are taken into
consideration the order is nearly the same: silk, nylon, polyester, polycotton, PVC,
satin, cotton, Lycra and linen, with only cotton and satin having switched order.
It is thought that polyester would have had more higher-ranking samples if
researcher 1 had used a shinier fabric, the one used during this trial was quite matt in
appearance and did not have such a smooth surface compared to the other polyester
fabrics used. Also, polyester usually has some sort of waterproofing or coating, as do
some other fabrics, which may be removed through washing, therefore may have had
some effect on the results as not all the polyester fabric samples were washed prior to
testing. However, in many assault cases clothing may not have been washed prior to
wearing. Therefore, the inclusion of fabrics that had not been washed prior to testing
was thought to be sensible to allow for a realistic comparison.
Overall, it appears that the manmade fabrics tend to allow more ridge detail
development; for example, nylon and polyester consistently produce more than the
natural fabrics such as cotton and silk. This could be due to the fingerprint residues
being less likely to be absorbed or perhaps, evaporating off the fabric. There does also
appear to be a link between the fabric type and shininess of the fabric. Polyester (7
samples) and nylon (6 samples) had the highest donor and ridge detail ratings (and as
previously stated it is thought that polyester would have allowed more to be developed
if researcher 1 had used a shinier fabric), followed by silk (4 samples). However, with
the particular sample of satin used by these researchers the opposite was observed.
Even though it was an extremely shiny fabric, fewer high ratings were seen perhaps
because the shininess could have actually masked any ridge detail.
The amount of detail visualised is dependent on the fabric being examined, as
well as the environmental conditions in which the marks were “laid”. For example,
with good donor one, the chance of VMD visualising enough detail to lead to
identification is quite high. Though this donor did not always leave impressions that
would produce identifiable detail (ratings 0-2) there were more days and fabrics that
were successful than were not. On satin, this donor was the only one to produce a
rating of anything higher than 1; on days 1, 3, 7 and 21 there was a rating of 2 which
contained some detail, though possibly not enough to lead to an identification. On
cotton, this was the only donor to produce any ridge detail though this was only on a

152
fresh, day 1 sample. This emphasises that this is a good donor and that cotton is a
poor fabric that does not allow ridge detail to be produced [Figure 7.4].
Figure 7.4: Example of a grab from donor seven (day 1 on cotton) containing palmar flexion creases and empty marks, thus no ridge detail. Photographed using a Nikon D40 and white light.
Considering the best three fabrics (polyester, nylon and polycotton) there was a
range of ratings within most days, but with donor one there was a considerable
number of ratings at 3 or 4. Polyester showed more 0, 1 and 2 ratings but this fabric
had ratings of 3 or 4 on eight out of the ten days tested, with only the later days (21
and 28) producing either ratings 1 or 2.
With nylon, donor one had the same ratings for all three researchers [Table
7.9] though this time there were three days with a rating of 2, but no 0 or 1 ratings
therefore around a 70 % chance of visualising ridge detail with this donor. Finally,
polycotton only had one 0 rating (one of the day 21 samples) with the rest of the days
having ratings of 3 and 4. The range of ratings within each day, with the exception of
nylon for all donors except donor two, demonstrates that the physical and
environmental conditions have an effect on the donations and therefore the detail
visualised by VMD. This is reinforced by considering one of the poor donors (donor
seven). Cotton, polycotton and satin only had ratings that showed touches but no
detail (0 and 1 ratings); polyester was the same with the exception of day 7 that had a
2 rating; and finally nylon where this donor had two days with rating 2. There were no
days that had ratings that would lead to identifiable detail. Therefore, this donor’s

153
poor ability to leave good deposits reinforces the theory that there are many physical
conditions, such as increased secretions due to exercise, excitement and fear or
naturally having dry skin that change the ability of donors to leave impressions that
can be visualised by VMD.
7.11 Target areas visualised by VMD
Table 7.5 shows that all the fabrics displayed target areas, from 20 % in the
case of day 6 (cotton) to 84 % in the case of day 3 (polyester); some were only
fingertip marks but others showed full hands. Therefore the more detailed hand marks
[Figure 7.6] could help lead to identifications or at the very least exclude or include a
suspect. Here polyester had samples that developed target areas over the full timeline
ranging between a low of 16 % of the samples on day 28 to a high of 49 % on days 1
and 2. All these target areas could also help lead to a “picture of events” – does the
impression indicate a gentle hold or touch or a forceful grab or push indicative of the
complainant’s or suspect’s sequence of events?
0
10
20
30
40
50
60
70
80
90
100
1 2 3 4 5 6 7 14 21 28
Perc
enta
ge (
%)
Day
Cotton Nylon Polyester Polycotton Satin
Figure 7.5: All fabric samples from every donor (1 – 20) from all days containing target areas ranging from fingertip impressions to full hand impressions.
Not every mark visualised by the donors contained ridge detail, therefore the
marks could not be used for identification purposes, but this section investigated the
use of empty marks as target areas for DNA and as a possible means of determining a
sequence of events.

154
All these marks could also be used as an area to target for DNA and as the
Home Office fingerprinting protocols and the work carried out in conjunction with
Ignacio Quinones (Quinones, I. 2012. pers. comm., 15 March) suggests that VMD does
not affect the collection of DNA therefore the development of DNA profiles could be
possible. Thus even if ridge detail is not developed it can aid targeting a garment for
DNA, which in turn may lead to an identification.
0
10
20
30
40
50
60
70
80
90
100
1 2 3 4 5 6 7 14 21 28
Perc
enta
ge (
%)
Day
Cotton Nylon Polyester Polycotton Satin
Figure 7.6: All fabric samples from every donor (1 – 20) from all days containing target areas containing ridge detail and palmar flexion creases.
7.12 The effect method of sample donation has on fingermark visualisation
with VMD
Figure 7.7 shows the results of two different methods (grab and push) for
sample donation. These methods of donation were used to simulate the actions an
individual would use during an attack or assault. On first impressions it seems there is
little difference between either method – some fabrics produced an even 50/50 spilt
(polycotton and silk) with other samples diverging from the 50/50 split by a range of 2
% (polycotton) to 18 % (Lycra).

155
Figure 7.7: Comparison of grab versus push method of deposition visualised with VMD. Visible marks were graded 1 to 4. (Data from researcher 1 has been removed to prevent results appearing skewed as only grab samples taken).
Figure 7.8: (A) Example of a push deposition on nylon visualised with VMD and (B) a grab deposition on nylon visualised with VMD, demonstrating the differences in appearance between a push, with its straight thin fingers and a grab with the bent fingers and a wider appearance (Streets 2009).
The main observation from the method of deposition seems to be that push
deposits tended to produce better ridge detail in the fingers, whereas grabs produce
better detail in the palm. This may be due to the nature of the hold as pushes lead to
more pressure on the fingers, whereas a grab may put more pressure onto the palm,
A B

156
therefore lead to more detail in these areas. There is also a difference in the overall
appearance of the shape of the fingers with the different types of depositions as
illustrated in Figure 7.8 above. With pushes the hands tend to be held with the fingers
open and flat which leads to fingermarks that appeared thinner and straighter when
visualised. With grabs the hand is held in an open fist shape and the fingers are
curved, which leads to fingermarks that appeared thicker and more bent. This
variation in appearance and level of detail is mostly likely being due to the nature of
the hold. For example, pushes lead to more pressure and contact from the fingers,
whereas a grab may put more pressure onto the palm. This in turn would explain why
there were differences in areas of detail visualised as well as the shape of the fingers
and why the grab and push appear different to each other. This type of information
could therefore aid in an investigation, if it can be used to determine the sequence of
events, possible force used and type of action and hand position used during an
altercation.
A Chi-squared test was carried out to determine statistically whether there was
a relationship between the deposition method (grab or push) and the grade assigned
to the level of ridge detail obtained. The null hypothesis (H0) is that there is no
difference between the method of deposition (grab or push), and the alternative
hypotheis (HA) that there is a difference between the deposition method.
The p-value in this case was <0.001, which means the H0 should be rejected
and that there is a difference between the two deposition methods.
The residual values in Table 7.11 indicate that the grab method of deposition
was observed less often at grade 0 than expected with an actual count of 531
compared to the expected count of 534.6. The push method was observed more often
than expected with an observed count of 283 compared to the expected count of
279.4. At grade 1, the grab method showed comparable results, with the grab having
a lower count (482) than expected (512.9), while the push method was the opposite
with a higher count (299) compared to an expected count of 268.1. However, at
grade 2 and 3 the opposite is true with the grab method having a higher
experimentally observed count, the statistically calculated expected count. However,
the push method showed the opposite trend. With grade 4, the frequency of the
methods reversed once more, with the grab being observed less often, however at this
grade the difference was quite small, at only 0.7. Therefore, it could be stated that
grab method showed most indications of the fabric being touched and a good level of
ridge detail with the push method having a higher level of ridge detail.

157
Table 7.11: Chi-squared test results comparing the grades (0 - 4) observed for the grab and push technique of planting latent marks on nine fabrics visualised using VMD. The actual count obtained, the expected count, the percentage of each technique at each grade, as well as the residual values are given.
Grade Grab Push Total
0 Count 531 283 814
Expected count 534.6 279.4 814.0
Percentage with grade (%) 65.2 34.8 100
Residual -3.6 3.6
1 Count 482 299 781
Expected count 512.9 268.1 781.0
Percentage with grade (%) 61.7 38.3 100
Residual -30.9 30.9
2 Count 164 48 212
Expected count 139.2 72.8 212.0
Percentage with grade (%) 77.4 22.6 100
Residual 24.8 -24.8
3 Count 57 14 71
Expected count 46.6 24.4 71.0
Percentage with grade (%) 80.3 19.7 100
Residual 10.4 -10.4
4 Count 19 11 30
Expected count 19.7 10.3 30.0
Percentage with grade (%) 63.3 36.7 100
Residual -0.7 .07
Total Count 1253 655 1908
Expected count 153.0 655.0 1908.0
Percentage with grade (%) 65.7 34.3 100
A comparison of natural versus loaded deposition was also undertaken. In the
case of natural fingerprint deposits, the donors were asked not to wash their hands for
approximately 45 minutes prior to donations so their natural fingerprint deposit levels
would be captured. In the case of loaded deposits the donors rubbed their fingers
over their noses, forehead and behind their ears, then rubbing their hands together to
give an even (though not natural) level of deposits.
When these were compared [Figure 7.9] it would appear, even though the
loaded method had over twice as many samples, that loaded deposits tend to produce
more 0 graded results, ranging from no development to possible target areas for DNA.

158
Figure 7.9: Percentage of samples for each grade (0 – 4) when comparing “natural” versus loaded method of deposition on all fabric types (Lycra, linen, PVC, silk, nylon, satin, polyester, cotton and polycotton). Loaded (1308 samples) versus Natural (600 samples).
When ridge detail was observed, however a natural deposit produces more
ridge detail than the loaded marks. This may be due to loaded marks having too high
a level of fingerprint secretions therefore obscuring ridge detail when deposited
whereas the natural marks may not have enough to consistently leave ridge detail but
are less likely to obscure ridge detail. This is expressed by Kent in his 2010 paper
about standardising protocols for testing fingerprint reagents when he comments that
“grooming” or loading of marks can increase the levels of fatty materials in the marks
by as much as 50 times compared to a mark that has not had any extra residues
added. This can make the reagents look as if they are better or more effective than
they would usually and that with some of the more sensitive techniques it can cause
an overloading effect and there will be no ridge detail and only an outline of where the
marks had been planted. For example, in the case of VMD the loading of marks can
cause the valleys to be filled which can prevent deposition of the metals. Therefore
Kent suggests that loaded marks should not be used and only the rubbing of the hands
together prior to planting to evenly distribute the residues should be done. The
amount of fingerprint secretions either loaded or natural is of course dependent on the
donor, for example a poor donor, such as seven, left poor marks whether they
deposited loaded or natural marks.

159
A Chi-squared test was carried out to determine statistically whether there was
a relationship between the treatment used (loaded or natural) and the grade obtained.
The null hypothesis (H0) is that there is no difference between the method of
deposition (loaded or natural), and the alternative hypotheis (HA) is that there is a
difference between the deposition method. The p-value in this case was <0.001,
which means the H0 should be rejected and that there is a difference between the two
deposition methods, so HA should be accepted.
Table 7.12: Chi-squared test results comparing the grades (0 - 4) observed for the loaded and natural technique of planting latent marks visualised with VMD. The actual count obtained, the expected count, the percentage of each technique at each grade and the residual values are given.
Grade Loaded Natural Total
0 Count 663 152 815
Expected count 558.7 256.3 815
Percentage with grade (%) 81.3 18.7 100
Residual 104.3 -104.3
1 Count 513 280 793
Expected count 54306 249.4 793.0
Percentage with grade (%) 64.7 35.3 100.0
Residual -30.3 30.6
2 Count 95 106 201
Expected count 13708 63.2 210.0
Percentage with grade (%) 47.3 52.7 100.0
Residual -42.8 42.8
3 Count 28 47 75
Expected count 51.4 23.6 75
Percentage with grade (%) 37.3 62.7 100.0
Residual -23.4 23.4
4 Count 9 15 24
Expected count 16.5 7.5 24.0
Percentage with grade (%) 37.5 62.5 100.0
Residual -7.5 7.5
Total Count 1308 600 1908
Expected count 1308.0 600.0 1908.0
Percentage with grade (%) 68.6 31.4 100.0
From Table 7.12, the residual values indicate that the natural samples were
observed less often at grade 0 than expected with an actual count of 152 compared to
the expected count of 256.3, whereas the loaded samples were observed more often
than expected having an observed count of 663 compared to the expected count of
558.7. The opposite was true with the remaining grades (1 – 4) where the natural
technique was observed more often than expected and the loaded method was
observed less often than expected. The biggest difference is seen for grade 2 with the
actual natural count being 106, whereas the expected count was 63.2. Though the

160
difference with the other grades was not as large, they were all higher than expected,
which means that the expected counts of all the loaded marks were lower than
expected.
This means that the technique of using natural prints to plant marks led to less
zero graded marks, more visible marks and more marks that contained ridge detail.
Thus, the natural technique is more effective at leaving marks on fabric that can be
visualised with VMD and contain more ridge detail compared to the loaded technique.
Therefore, the conclusion is the same as previously discussed on page 159 and
reinforces the opinion that natural and not loaded prints should be used when carrying
out fingermark research.
7.13 Effect of metal type used during VMD on visualised fingermarks
The final comparison made during this study was between the metals utilised
during the VMD process - a single metal (silver) and the more commonly used two
metals (gold + zinc) on cotton, polyester and polycotton [Figure 7.10, 7.11 and 7.12].
Figure 7.10 shows that, for cotton, gold + zinc seems to produce more ridge
detail leading to gradings of 2 and 3 with silver only leading to 0 or 1 gradings.
Therefore, with cotton it would be more sensible to use the gold + zinc method to
visualise marks, as this has visualised the most detail in this study. This increased
detail may be due to the gold producing anchor points for the zinc, thus making the
detail more visible, whereas the silver only attaches to silver already deposited so there
may be less attachment and contrast, therefore less visualisation of detail.
With polyester [Figure 7.11] the split was even for 0 – 3 ratings, but only gold
+ zinc producing any 4 gradings. Therefore, to visualise higher levels of ridge detail it
appears that gold + zinc is the process to choose. However, both metal choices work
quite well, therefore choice of which metal(s) to use may be down to the colour of the
fabric being processed. For example, silver is easier to see on darker fabrics as it
appears silver in colour, whereas the gold + zinc appears grey in colour, so it not as
obvious on darker fabrics.
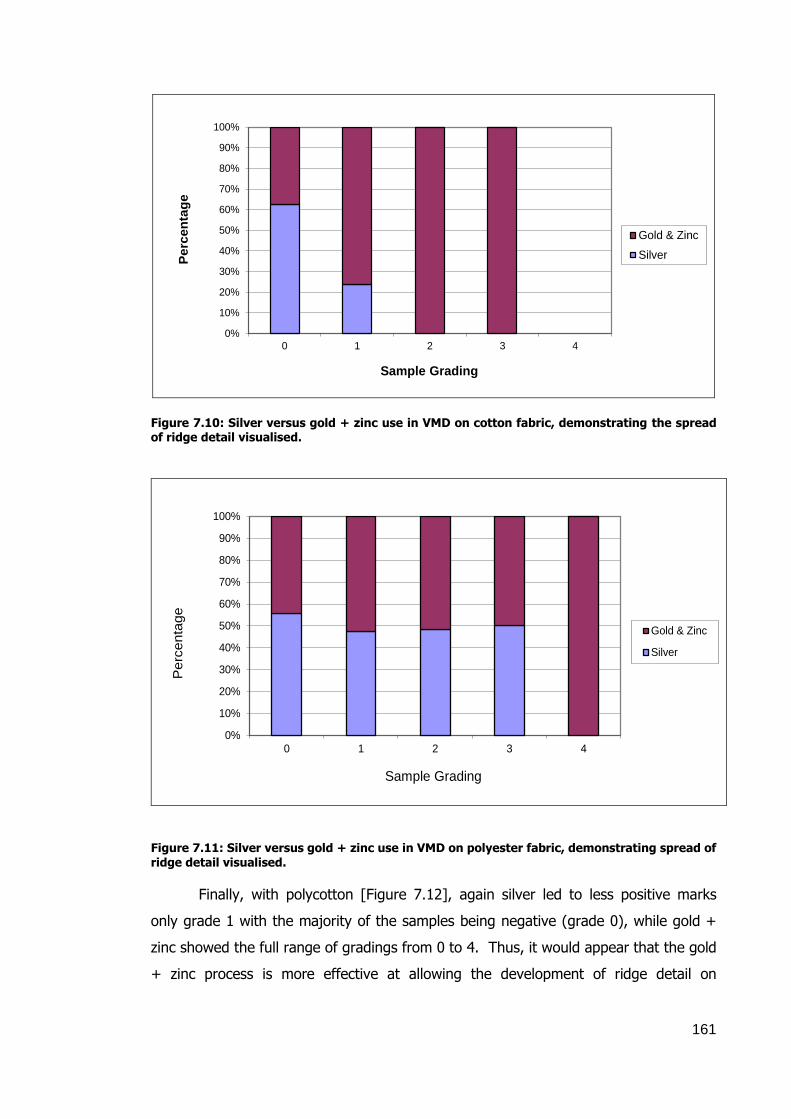
161
0%
10%
20%
30%
40%
50%
60%
70%
80%
90%
100%
0 1 2 3 4
Perc
en
tag
e
Sample Grading
Gold & Zinc
Silver
Figure 7.10: Silver versus gold + zinc use in VMD on cotton fabric, demonstrating the spread of ridge detail visualised.
0%
10%
20%
30%
40%
50%
60%
70%
80%
90%
100%
0 1 2 3 4
Perc
enta
ge
Sample Grading
Gold & Zinc
Silver
Figure 7.11: Silver versus gold + zinc use in VMD on polyester fabric, demonstrating spread of ridge detail visualised.
Finally, with polycotton [Figure 7.12], again silver led to less positive marks
only grade 1 with the majority of the samples being negative (grade 0), while gold +
zinc showed the full range of gradings from 0 to 4. Thus, it would appear that the gold
+ zinc process is more effective at allowing the development of ridge detail on

162
polycotton and would be the metals to choose if the article being processed was
composed of polycotton.
0%
10%
20%
30%
40%
50%
60%
70%
80%
90%
100%
0 1 2 3 4
Perc
en
tag
e
Sample Grading
Gold & Zinc
Silver
Figure 7.12: Silver versus gold + zinc use in VMD on polycotton fabric, demonstrating spread of ridge detail visualised.
Overall, it appears that different fabrics show varying levels of ridge detail
depending on the metal(s) used during VMD. However, as only three fabrics were
processed with gold + zinc and silver VMD, more work needs to be carried out to
determine which should be used for each different fabric type commonly encountered
in modern clothing and operationally in relation to crimes.
7.14 CAF Donor grading
The amount of detail visualised [Figure 7.13 and Table 7.10 – 7.15] and
therefore the donors’ grading appears to follow a similar trend to VMD. Once more,
donor one consistently ranked in the higher end of the best results – good on silk,
medium to good on nylon and satin, medium on nylon/polyester and PVC and poor on
nylon-Lycra, viscose, linen and wool. One researcher included nylon/polyester and
wool in their study, however as nylon/polyester was not found to be in common use
and wool does not generally comply with the Home Office’s three threads per mm rule,
therefore these fabrics were excluded from the other studies. These donor gradings
also reflect most of the results for VMD – Lycra and linen were poor; PVC however,
produced a lower rating of poor with VMD compared to medium with CAF.
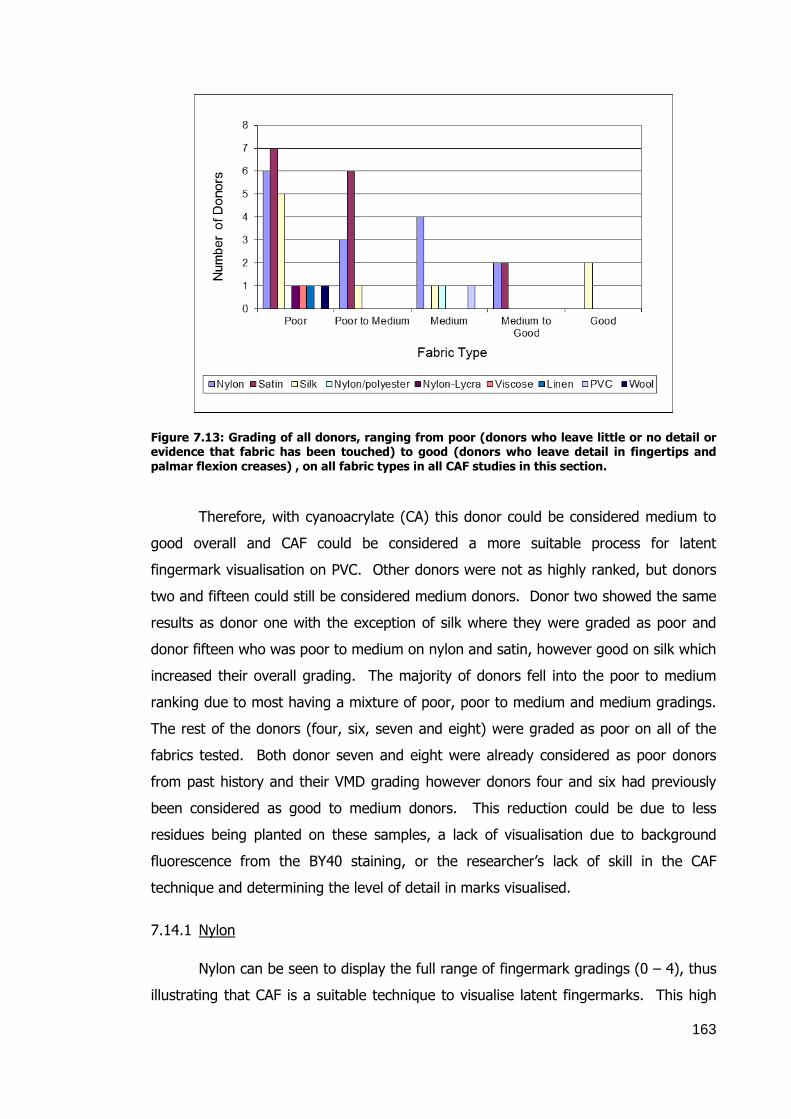
163
Figure 7.13: Grading of all donors, ranging from poor (donors who leave little or no detail or evidence that fabric has been touched) to good (donors who leave detail in fingertips and palmar flexion creases) , on all fabric types in all CAF studies in this section.
Therefore, with cyanoacrylate (CA) this donor could be considered medium to
good overall and CAF could be considered a more suitable process for latent
fingermark visualisation on PVC. Other donors were not as highly ranked, but donors
two and fifteen could still be considered medium donors. Donor two showed the same
results as donor one with the exception of silk where they were graded as poor and
donor fifteen who was poor to medium on nylon and satin, however good on silk which
increased their overall grading. The majority of donors fell into the poor to medium
ranking due to most having a mixture of poor, poor to medium and medium gradings.
The rest of the donors (four, six, seven and eight) were graded as poor on all of the
fabrics tested. Both donor seven and eight were already considered as poor donors
from past history and their VMD grading however donors four and six had previously
been considered as good to medium donors. This reduction could be due to less
residues being planted on these samples, a lack of visualisation due to background
fluorescence from the BY40 staining, or the researcher’s lack of skill in the CAF
technique and determining the level of detail in marks visualised.
7.14.1 Nylon
Nylon can be seen to display the full range of fingermark gradings (0 – 4), thus
illustrating that CAF is a suitable technique to visualise latent fingermarks. This high

164
level of detail is most likely due to the low porosity of nylon, meaning the fingerprint
residues are less likely to be absorbed into the fabric but reside on the surface and
form a polymer with CAF. Also there is less absorption of the BY40 dye into the fabric
which in turn means less background fluorescence and more visible detail.
Table 7.13: Nylon CAF donor rating and range of donor fingermark grading for each day illustrating the effect of age on the ridge detail visualised on the samples (grade 0 – 4).
Donor Day
Donor rating 1 2 3 4 5 6 7 14 21 28
1 1-4 1-4 0-4 0-4 0-4 0-2 0-4 0-4 1-4 0-1 Medium – Good
2 0-2 1-2 0-4 0-2 1-4 0-2 0-4 2-4 1-4 1-4 Medium – Good
3 0-2 1-2 0-4 0-2 0-2 1 1 0-1 1-2 1-2 Medium
4 0-1 0-1 0-1 0-1 0-1 0-1 0-1 1 1-0 0-1 Poor
5 0-4 1-4 0-2 1-4 0-2 0-1 0-1 1 0-1 0 Medium
6 0-1 1 0-2 0-1 1 0 0-1 1 0-1 0-1 Poor
7 0-1 0-1 0-1 0 0 0 0-1 0-1 0-1 0-1 Poor
8 0-1 0-1 0-1 0-1 0-1 0 0-1 1 0-1 1 Poor
9 1 1-2 0-1 1 1 0 0-1 1 0-1 1 Poor
10 1 1-2 0-1 1 0-1 0-1 0-1 1 1 1 Poor
11 1 1-2 0-2 1-2 0 0 1 1 1 1 Medium
12 0 1-2 1 0-1 0 1 1 1-2 1 0-1 Poor – Medium
13 0-1 1-2 0– 0-1 1-2 1 0-1 1 0-1 1 Poor – Medium
14 0-2 1 0-2 0-2 1-4 1-2 0-2 0-2 0-2 0-1 Medium
15 0-1 1-2 0-1 1-4 0-1 0-1 0-1 1 0-2 1 Poor – Medium
Once more donor one had the most high fingermark grades, resulting in their
overall medium to good donor grading. Every day, with the exception of days 6 and
28, have a grade 4 sample, illustrating again that this donor deposits good levels of
fingerprint residues. With this many grade 4 samples it might be expected that this
donor would have a good rating, however within the same day they also had 0 and 1
graded fingermark samples which explains the medium to good rating. Donor two also
had a medium to good donor rating, though unlike donor one, they did not have as
many grade 4 fingermarks. They also appeared to be less consistent with their
deposits and therefore the grading each received The first day to have a grade 4
fingermark was day 3, when it was still quite fresh, but the remaining grade 4
fingermarks were on days 5, 7, 14, 21 and 28, so much older. This shows that the
donor does have an impact on the level of fingermarks developed. However, the

165
donor produces a variable amount of fingerprint residues and that the amount of
residues must be influenced by several internal and external factors, such as diet,
temperature and activity. The other donors were quite mixed with the levels of detail
visualised with CAF. Only donors 3, 5 and 14 displayed any grade 4 fingermarks, with
the majority of the donors having grade 2 as the highest fingermark grading. Overall
the detail visualised on nylon was higher than the other fabrics in the studies.
7.14.2 Satin
With satin it was donor one again who had the highest level of detail – a grade
4 on day 1, with grade 2 and 3 fingermarks on days 2 – 4, 6, 14 and 28 giving this
donor a medium to good donor rating. Donor two also had a medium to good rating
and in some incidences had higher fingermark grading than donor one. This was seen
on day 2, where donor two had a 3, so more detail than donor one with only a grade
2, as well as day 28 where donor two again had a fingermark grading of 3 while donor
one was 1 to 2. This illustrates that donors can fall into general categories, but it does
not mean that if they are good on one substrate or fabric that they will be good on all
fabrics. The remaining donors were split between being poor to medium and poor
donors – donors three, four, six, seven, eight, twelve and thirteen classed as poor with
donors five, nine, ten, eleven, fourteen and fifteen classed as poor to medium. The
difference between each group is down to the number of grade 2 samples, compared
to the number of 1 and 0 grades. The poor donors comprised of individuals with very
little evidence of contact, so only grade 0 or 1 samples, while the poor to medium
donors had some extra detail (grade 2) and more indication of the fabric having been
touched (grade 1).
Satin is a smooth fabric with a tight weave, therefore it would have been
expected that more detail and thus higher fingermark gradings would have been
observed. The lack of detail could not be blamed on the BY40 as there was less
absorption with satin than with other fabrics, therefore the lack of visualised
fingermarks and marks could be produced by the reflective nature of the fabric causing
the detail to be missed or obscured. This reflection or some sort of coating of the
fabric’s surface seems to be the most likely explanation because if the BY40 was not
absorbed to any great extent it would be expected that the fingerprint residues would
then stay on the surface of the fabric rather than being absorbed and therefore
available to form a polymer with the CA.

166
Table 7.14: Satin CAF donor rating and range of donor fingermark grading for each day illustrating the effect of age on the ridge detail visualised on the samples (grade 0 – 4).
Satin
Donor Day
Donor rating 1 2 3 4 5 6 7 14 21 28
1 0-4 2 1-3 1-2 0-1 2-3 0-1 2-3 1 1-2 Medium – Good
2 0-1 3 0-1 2 0-1 2 1 2 1 3 Medium – Good
3 0 0 0 0 Poor
4 0-1 0 0-1 1 0-1 0 0-1 0 0-1 0 Poor
5 0-1 0 1-2 1 0-1 0 0-1 1 0-1 0 Poor – Medium
6 0 0 0 0 0 0 0 0 Poor
7 0 0 0 0 0 0 0 0 0 Poor
8 0-1 0 1 0 0-1 0 0-1 0 0 0 Poor
9 1-2 0 1 1 0-1 0-1 1 0 Poor – Medium
10 0-2 0 0-1 0 0-1 0 0-2 0 0-3 1 Poor – Medium
11 2 1 2 0 0 0 0 0 0 Poor – Medium
12 0 1 0 0 0 0 0 0 0 Poor
13 0-1 1 0-1 0 0-1 0 0 0 0-1 0 Poor
14 0-2 0 1 0 0-1 1 0-1 0 0 1 Poor – Medium
15 1-2 1 0-2 2 0-1 1 0-1 0 0-1 0 Poor - Medium
7.14.3 Silk
Silk is the only fabric in this section to have donors rated as good, because
donor one and fifteen both had high fingermark grades (3 and 4) with fewer lower
graded samples (0 and 1). Surprisingly, donor two performed extremely poorly on silk
with only one day showing a grade 2 sample, while all the other days that were
collected being graded as 0 or 1. It could be suggested that the days that were not
collected or processed could have provided good detail, however the fresher samples
that were collected and processed (days 1 and 3) had either no development or only
an indication of the fabric being touched or, in the case of day 3, some palmar flexion
creases. Therefore is seems that on silk this donor does not leave useful fingerprint
residues or latent marks. Donor fifteen seemed to perform better on this fabric than
those previously discussed with more higher fingermark grades, however again several
samples were not processed so this could influence the final grade. The other poor
donors were also poor with the other fabrics, with the exception of donor five who was
rated as medium on nylon and poor to medium on satin.
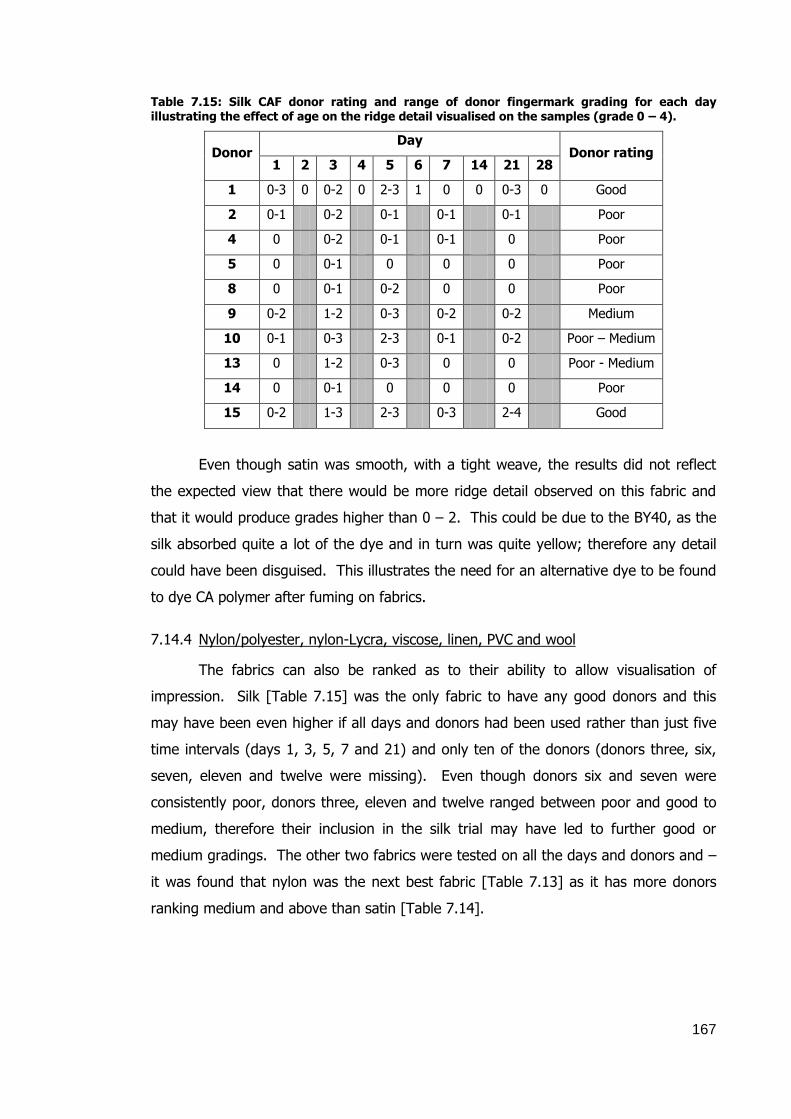
167
Table 7.15: Silk CAF donor rating and range of donor fingermark grading for each day illustrating the effect of age on the ridge detail visualised on the samples (grade 0 – 4).
Donor Day
Donor rating 1 2 3 4 5 6 7 14 21 28
1 0-3 0 0-2 0 2-3 1 0 0 0-3 0 Good
2 0-1 0-2 0-1 0-1 0-1 Poor
4 0 0-2 0-1 0-1 0 Poor
5 0 0-1 0 0 0 Poor
8 0 0-1 0-2 0 0 Poor
9 0-2 1-2 0-3 0-2 0-2 Medium
10 0-1 0-3 2-3 0-1 0-2 Poor – Medium
13 0 1-2 0-3 0 0 Poor - Medium
14 0 0-1 0 0 0 Poor
15 0-2 1-3 2-3 0-3 2-4 Good
Even though satin was smooth, with a tight weave, the results did not reflect
the expected view that there would be more ridge detail observed on this fabric and
that it would produce grades higher than 0 – 2. This could be due to the BY40, as the
silk absorbed quite a lot of the dye and in turn was quite yellow; therefore any detail
could have been disguised. This illustrates the need for an alternative dye to be found
to dye CA polymer after fuming on fabrics.
7.14.4 Nylon/polyester, nylon-Lycra, viscose, linen, PVC and wool
The fabrics can also be ranked as to their ability to allow visualisation of
impression. Silk [Table 7.15] was the only fabric to have any good donors and this
may have been even higher if all days and donors had been used rather than just five
time intervals (days 1, 3, 5, 7 and 21) and only ten of the donors (donors three, six,
seven, eleven and twelve were missing). Even though donors six and seven were
consistently poor, donors three, eleven and twelve ranged between poor and good to
medium, therefore their inclusion in the silk trial may have led to further good or
medium gradings. The other two fabrics were tested on all the days and donors and –
it was found that nylon was the next best fabric [Table 7.13] as it has more donors
ranking medium and above than satin [Table 7.14].
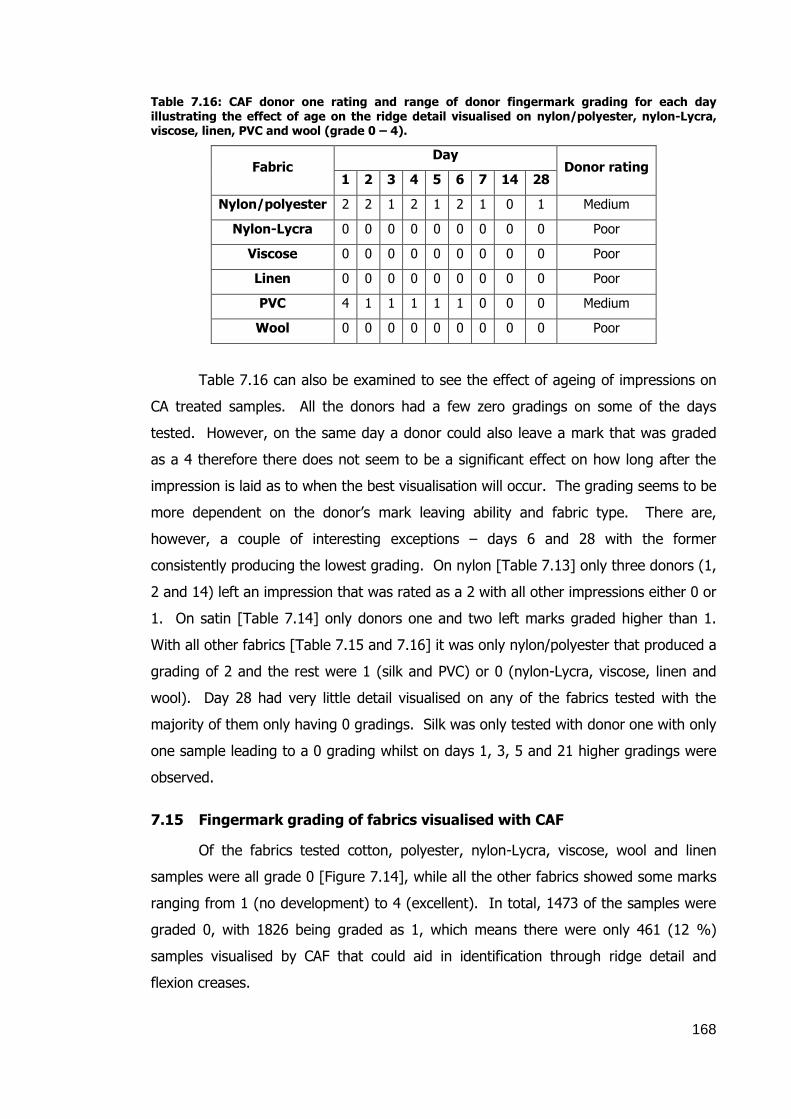
168
Table 7.16: CAF donor one rating and range of donor fingermark grading for each day illustrating the effect of age on the ridge detail visualised on nylon/polyester, nylon-Lycra, viscose, linen, PVC and wool (grade 0 – 4).
Fabric Day
Donor rating 1 2 3 4 5 6 7 14 28
Nylon/polyester 2 2 1 2 1 2 1 0 1 Medium
Nylon-Lycra 0 0 0 0 0 0 0 0 0 Poor
Viscose 0 0 0 0 0 0 0 0 0 Poor
Linen 0 0 0 0 0 0 0 0 0 Poor
PVC 4 1 1 1 1 1 0 0 0 Medium
Wool 0 0 0 0 0 0 0 0 0 Poor
Table 7.16 can also be examined to see the effect of ageing of impressions on
CA treated samples. All the donors had a few zero gradings on some of the days
tested. However, on the same day a donor could also leave a mark that was graded
as a 4 therefore there does not seem to be a significant effect on how long after the
impression is laid as to when the best visualisation will occur. The grading seems to be
more dependent on the donor’s mark leaving ability and fabric type. There are,
however, a couple of interesting exceptions – days 6 and 28 with the former
consistently producing the lowest grading. On nylon [Table 7.13] only three donors (1,
2 and 14) left an impression that was rated as a 2 with all other impressions either 0 or
1. On satin [Table 7.14] only donors one and two left marks graded higher than 1.
With all other fabrics [Table 7.15 and 7.16] it was only nylon/polyester that produced a
grading of 2 and the rest were 1 (silk and PVC) or 0 (nylon-Lycra, viscose, linen and
wool). Day 28 had very little detail visualised on any of the fabrics tested with the
majority of them only having 0 gradings. Silk was only tested with donor one with only
one sample leading to a 0 grading whilst on days 1, 3, 5 and 21 higher gradings were
observed.
7.15 Fingermark grading of fabrics visualised with CAF
Of the fabrics tested cotton, polyester, nylon-Lycra, viscose, wool and linen
samples were all grade 0 [Figure 7.14], while all the other fabrics showed some marks
ranging from 1 (no development) to 4 (excellent). In total, 1473 of the samples were
graded 0, with 1826 being graded as 1, which means there were only 461 (12 %)
samples visualised by CAF that could aid in identification through ridge detail and
flexion creases.
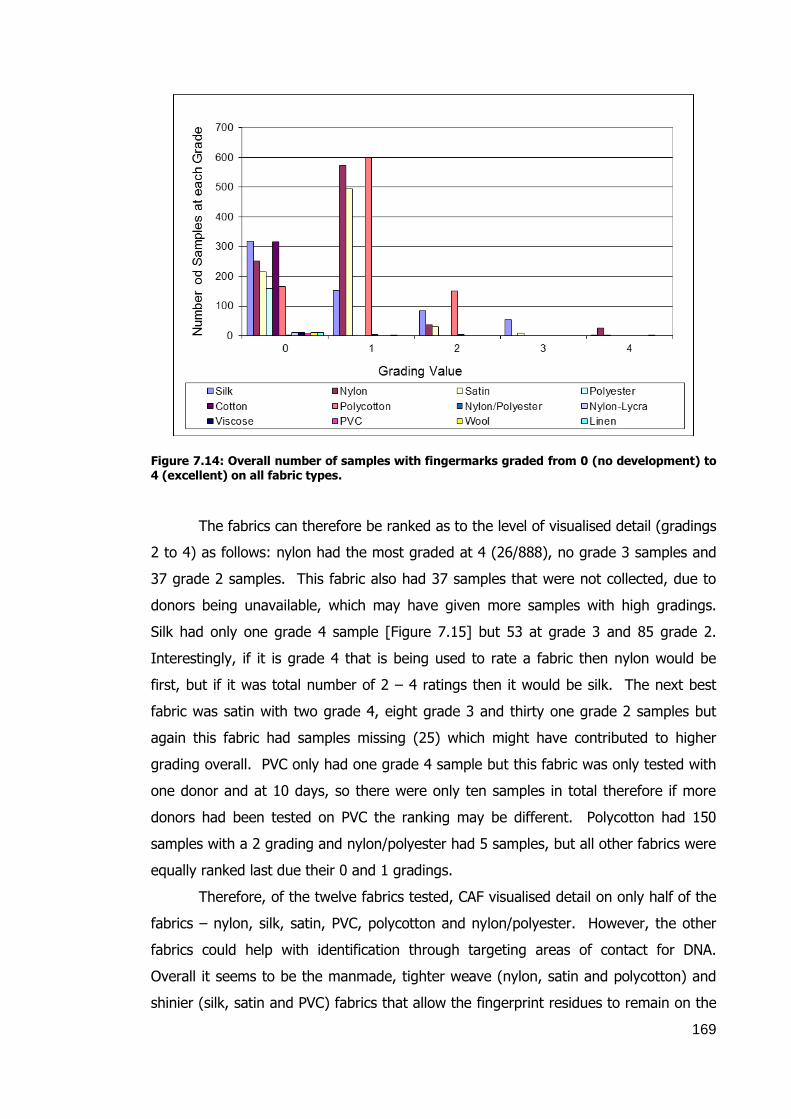
169
Figure 7.14: Overall number of samples with fingermarks graded from 0 (no development) to 4 (excellent) on all fabric types.
The fabrics can therefore be ranked as to the level of visualised detail (gradings
2 to 4) as follows: nylon had the most graded at 4 (26/888), no grade 3 samples and
37 grade 2 samples. This fabric also had 37 samples that were not collected, due to
donors being unavailable, which may have given more samples with high gradings.
Silk had only one grade 4 sample [Figure 7.15] but 53 at grade 3 and 85 grade 2.
Interestingly, if it is grade 4 that is being used to rate a fabric then nylon would be
first, but if it was total number of 2 – 4 ratings then it would be silk. The next best
fabric was satin with two grade 4, eight grade 3 and thirty one grade 2 samples but
again this fabric had samples missing (25) which might have contributed to higher
grading overall. PVC only had one grade 4 sample but this fabric was only tested with
one donor and at 10 days, so there were only ten samples in total therefore if more
donors had been tested on PVC the ranking may be different. Polycotton had 150
samples with a 2 grading and nylon/polyester had 5 samples, but all other fabrics were
equally ranked last due their 0 and 1 gradings.
Therefore, of the twelve fabrics tested, CAF visualised detail on only half of the
fabrics – nylon, silk, satin, PVC, polycotton and nylon/polyester. However, the other
fabrics could help with identification through targeting areas of contact for DNA.
Overall it seems to be the manmade, tighter weave (nylon, satin and polycotton) and
shinier (silk, satin and PVC) fabrics that allow the fingerprint residues to remain on the

170
fabric surface and therefore allow the CA to adhere to these and form the white
polymer and therefore allow the visualisation of ridge and palmar detail.
Figure 7.15: Example of a grade 4 fingermark, containing full ridge detail, on patterned silk (Al-Khairulla 2009).
7.16 Target areas visualised by CAF
Nylon/polyester produced a target area for all days except day 14; PVC for days
1, 2, 3, 4, 5 and 6; while nylon-Lycra, linen and wool did not produce any target areas.
The rest of the fabrics have been included in two sets of tables and graphs that show
all the target areas produced [Figure 7.16] and those showing target areas that include
ridge detail [Figure 7.17]. Cotton and polycotton were the worst performing fabrics as
cotton only had one day (day 3) that had 2 samples with a target area and no samples
with any ridge detail and polycotton had two days (day 1 and day 21) only containing
target areas and, again, none with ridge detail. Considering target areas the rest of
the fabrics can be ranked (least target areas to most) as polyester, silk, satin and
nylon. Polyester had days with no samples with target areas (days 4, 6 and 21) to
days with 7 samples (47 %) with visualised target areas. Silk was only tested on five
days (days 1, 3, 5, 7 and 21) with the number and percentage of samples with
visualised target areas ranging from 26 (22 %) to 72 (60 %). Satin had a wider range
of samples with visualised target areas ranging from only 3 (21 %) to 121 (91 %) and
nylon was similar with 15 samples (56 %) and 24 (100 %). These target areas did not
all contain ridge detail and may only be an indication that the fabric has been touched,
however they could be targeted for DNA, rather than the whole article being taped.

171
0
10
20
30
40
50
60
70
80
90
100
1 2 3 4 5 6 7 14 21
Pe
rce
nta
ge
(%
)
Day
Silk Satin Nylon Polyester Cotton Polycotton
Figure 7.16: Percentage of samples with target areas visualised by CAF over the full timeline (days 1 – 7, 14, 21 and 28). Note that the fabrics with only 10 samples have not been included in the graph.
0
10
20
30
40
50
60
70
80
90
100
1 2 3 4 5 6 7 14 21 28
Perc
enta
ge (
%)
Day
Silk Satin Nylon Polyester Cotton Polycotton
Figure 7.17: Percentage of samples with identifiable target areas, those containing ridge detail and palmar flexion creases, visualised by CAF over the full timeline (days 1 – 7, 14, 21 and 28). Note that polyester, cotton and polycotton showed no identifiable detail.
Figure 7.17 illustrates just the target areas on the fabrics that contain ridge
detail, (gradings of 2 and higher) and shows that cotton, polycotton and polyester
produced no ridge detail on any of the samples. Satin and nylon showed similar levels
of detail though, due to nylon’s day 6 samples, having more detail it was ranked
higher. Even though the results are slightly skewed by the fact that silk was only

172
tested on five of the 10 days it could be ranked highest as it produced the most
samples with ridge or palm detail, with day 5 having a value of 50 %. Thus, these
samples could help lead to an identification using the ridged detail from the fingers and
palmar flexion creases along with any DNA that could be collected from the target
areas.
7.17 Effect method of sample donation has on fingermark visualisation
with CAF
Figure 7.18: Grab versus push method of deposition on nylon fabric, showing the percentage of marks visualised with CAF. Depositions were graded 0 to 4 (1308 push samples compared to 600 grab samples).
As with VMD, the CAF study also utilised two different methods of donation to
attempt to simulate the effects of an assault on fabrics. As nylon was the only fabric
used by more than one researcher, this is the only fabric to be used to illustrate the
differing effects of deposits (loaded and natural) and method of deposition (grab and
push). However, this meant that, overall, there were over twice as many push
samples (1308) as grab samples (600). Considering the results are skewed due to the
differing numbers of samples between push and grabs, Figure 7.18 illustrates that the
grab method leads to more ridge detail being visualised as this method has much
higher percentages with gradings higher than 2. Although there were samples in the
push method that had gradings of 2 to 4 there were more that were graded as 0 and
1. Therefore, if the numbers had been the same it looks as if the grab method would
produce the most samples that would help lead to identification. However, the 0 and 1

173
gradings should not be discounted as these can help in verifying the sequences of
events and lead to areas to be targeted for DNA.
A Chi-squared test was carried out to determine statistically whether there was
a relationship between the deposition method (grab or push) and the grade obtained.
The null hypothesis (H0) is that there is no difference between the method of
deposition (garb or push), and the alternative hypotheis (HA) is that there is a
difference between the deposition method. The p-value in this case was <0.001,
which means the H0 should be rejected and that there is a difference between the two
deposition methods, therefore the HA should be accepted.
Table 7.17: Chi-squared test results comparing the grades (0 - 4) observed for the grab and loaded technique of planting latent marks on nylon visualised with CAF. Data for the actual
count obtained, the expected count, the percentage of each technique at each grade, as well as the residual value is shown.
Grade Grab Push Total
0 Count 152 663 815
Expected count 256.3 558.7 815.0
Percentage with grade (%) 18.7 81.3 100
Residual -104.3 104.3
1 Count 280 513 793
Expected count 246.4 543.6 793.0
Percentage with grade (%) 35.3 64.7 100
Residual 30.6 -30.6
2 Count 106 95 201
Expected count 63.2 137.8 201.0
Percentage with grade (%) 52.7 47.6 100
Residual 42.8 -42.8
3 Count 47 28 75
Expected count 23.6 51.4 75.0
Percentage with grade (%) 62.7 37.3 100
Residual 23.4 -23.4
4 Count 15 9 24
Expected count 7.5 16.5 24.0
Percentage with grade (%) 62.5 37.5 100
Residual 7.5 -7.5
Total Count 600 1308 1908
Expected count 600.0 1308.0 1908.0
Percentage with grade (%) 31.4 68.6 100
The residual values results shown in Table 7.17 indicate that the grab method
of deposition was observed less often at grade 0 than expected whilst the push
method was observed more often than expected. However, the rest of the grades
showed the opposite trend with all the grab deposits being observed more often than

174
expected. Therefore, this indicates that the grab method gave more ridge detail than
the push method when the method of visualisation was CAF.
0%
10%
20%
30%
40%
50%
60%
70%
80%
90%
100%
0 1 2 3 4
Pe
rce
nta
ge
Sample Grading
Loaded
Natural
Figure 7.19: Loaded versus natural deposition on nylon fabric, showing the percentage of
visualised marks graded at 0 to 4 (150 natural samples compared to 118 loaded samples, as
32 samples not collected).
To demonstrate the optimum method of fingermark deposits with CAF, the
results from only two researchers who had the same number of donors and developed
samples after the same number of days were used. With CAF, the results were the
opposite to those of VMD with the loaded method, as more grade 2 and 4 ridge detail
was observed compared to the natural method of deposition [Figure 7.19]. Natural
this time did have some gradings of 2 that contained ridge detail, but the majority
were 0 and 1, thus no development or only touches. This may be because the loaded
marks contain more residues (amino acids, fatty acids, proteins and moisture) and
therefore they allowed more polymer to adhere and therefore produce more visible
white polymer ridges. Interestingly, neither the loaded nor the natural methods led to
any of the samples with gradings of 3 which was unexpected as there were samples of
the loaded method leading to gradings of 4. There were only 20 samples of the loaded
method that led to gradings of 4, but considering there were four gradings it would be
expected that you would have a mix of all the lower gradings.
A Chi-squared test was carried out to determine statistically whether there was
a relationship between the treatment used (loaded or natural) and the grade obtained
when visualised with CAF. The null hypothesis (H0) is no difference between the
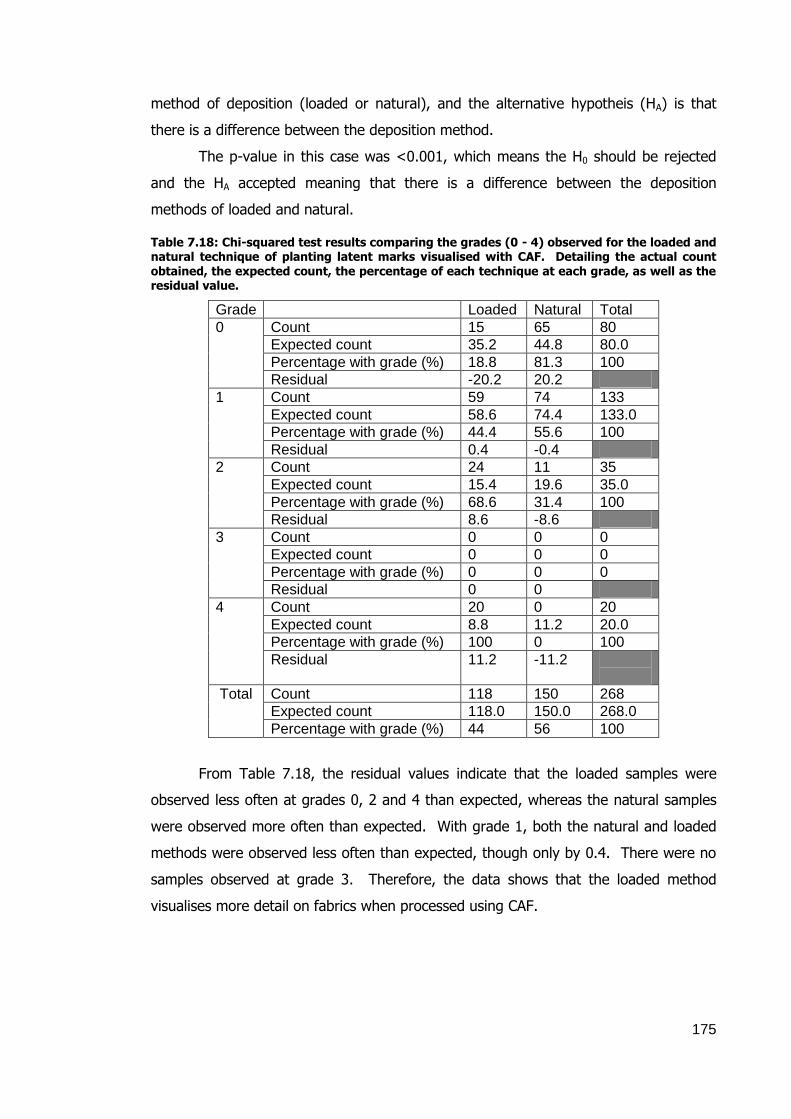
175
method of deposition (loaded or natural), and the alternative hypotheis (HA) is that
there is a difference between the deposition method.
The p-value in this case was <0.001, which means the H0 should be rejected
and the HA accepted meaning that there is a difference between the deposition
methods of loaded and natural.
Table 7.18: Chi-squared test results comparing the grades (0 - 4) observed for the loaded and natural technique of planting latent marks visualised with CAF. Detailing the actual count obtained, the expected count, the percentage of each technique at each grade, as well as the residual value.
Grade Loaded Natural Total
0 Count 15 65 80
Expected count 35.2 44.8 80.0
Percentage with grade (%) 18.8 81.3 100
Residual -20.2 20.2
1 Count 59 74 133
Expected count 58.6 74.4 133.0
Percentage with grade (%) 44.4 55.6 100
Residual 0.4 -0.4
2 Count 24 11 35
Expected count 15.4 19.6 35.0
Percentage with grade (%) 68.6 31.4 100
Residual 8.6 -8.6
3 Count 0 0 0
Expected count 0 0 0
Percentage with grade (%) 0 0 0
Residual 0 0
4 Count 20 0 20
Expected count 8.8 11.2 20.0
Percentage with grade (%) 100 0 100
Residual 11.2 -11.2
Total Count 118 150 268
Expected count 118.0 150.0 268.0
Percentage with grade (%) 44 56 100
From Table 7.18, the residual values indicate that the loaded samples were
observed less often at grades 0, 2 and 4 than expected, whereas the natural samples
were observed more often than expected. With grade 1, both the natural and loaded
methods were observed less often than expected, though only by 0.4. There were no
samples observed at grade 3. Therefore, the data shows that the loaded method
visualises more detail on fabrics when processed using CAF.

176
7.18 Effect duration of CAF has on fingermark visualisation
Figure 7.20:- Effect of duration of CAF cycle on the marks visualised on nylon, satin, silk and polycotton. (Only ratings of 1 and over shown - 895 in total).
Researcher 7 investigated the effect of varying the lengths of time in which the
samples were in the CAF chamber during the fuming cycle and found the effects were
more dramatic on some fabrics than others. With polycotton, there was no effect as
there was no development at any of the fuming times. However, when looking at the
samples with a grading of 1 or higher [Figure 7.20] a number of conclusions can be
drawn. Silk showed little difference between each time as 20 minutes led to 82 (41 %)
samples with marks, 40 minutes gave 88 samples (44 %) and 60 minutes produced 74
samples (37 %). Nylon did not have a wide variation in number of samples with marks
- 146 samples (73 %) at 20 minutes, 132 (66 %) at 40 minutes and 158 (79 %) at 60
minutes, but as can be seen it did lead to more marks developing overall. Satin was
the fabric that had the most variation; at 20 minutes only 25 samples (13 %) had
visible marks, this dropped to 13 (7 %) at 40 minutes, but at 60 minutes this grew to
an impressive 177 samples (89 %) with marks. These results appear to indicate that
with satin, sample development might benefit from longer fuming times but in the
majority of fabric types changing the fuming duration it does not seem to have a
significant effect, therefore it may be more advisable to use shorter times and then
retreat the sample.

177
Figure 7.21: Effect of duration of CAF cycle on the number of marks developing a grading of 2 and over, on nylon, satin, silk and polycotton.
When the samples with gradings of 1 are removed from the bar chart [Figure
7.21] the results change quite dramatically – nylon disappears and satin drops to levels
below 10. Silk is the only fabric to still have significant samples with gradings above 1,
with 54 samples after 20 minutes, 46 for 40 minutes and 39 for 60 minutes. This
indicates that as the detail drops with each 20 minutes of fuming, it is probably best to
treat the sample for a short time and reprocess if it is thought improved marks will be
visualised (Deacon, P. 2007. pers. comm., 15 August).
7.19 Comparison of VMD and CAF
When comparing both techniques VMD appears to give the most identifiable
marks, with 99/1908 (5 %) graded as 3 or 4, compared to 91/3698 (3 %) from the CA
visualisation.
Nylon, polycotton, polyester and cotton seem to be more suited to visualisation
with VMD as they all had more samples graded 3 or 4 though the results are skewed
due to differing numbers of samples tested with each process. It was observed that
22 % of the nylon samples were graded either 3 or 4 samples with VMD compared to
only 3 % developed using CAF and no polycotton, polyester and cotton 3 or 4 graded
samples with CAF. With silk, the values were a bit skewed as VMD only processed
twelve samples and four were grade 4, thus 33 % of the total samples compared to
CAF with 54/610 samples being grade 3 or 4, thus 9 %. With satin, there were no 3 or

178
4 graded samples with VMD, but 10 were visualised with CAF. Therefore silk and satin
seem to be more suited to CAF. Linen does not appear to be a fabric that suits
development with either VMD or CAF, and VMD is not useful on Lycra. Several of the
fabrics (cotton, polyester, nylon-Lycra, viscose, wool and linen) utilised in the study did
not allow the visualisation of any ridge detail; therefore CAF does not appear to be a
suitable technique for these fabric types.
Target areas visualised with each technique also show that VMD led to higher
numbers and percentages on cotton, polyester, and polycotton, whereas CAF only had
one day on both cotton and polycotton that produced any marks, however CAF did
perform better than VMD on nylon and satin.
There does not seem to be a “best time” for development of identifiable detail
that is consistent for all fabrics utilising either development technique. Some fabrics,
such as polyester and polycotton seem to allow visualisation of better or more detail in
the first few days (days 1 and 2 using VMD led to 49 % and 18 % respectively).
However, using CAF on some fabrics such as satin and nylon allowed more detail to be
developed later – day 4 satin (21 %) and nylon (23 %) and day 14 satin (21 %) and
nylon (21 %). This should be seen as positive since most assaults are reported to the
police within a few days some individuals may take longer to report the crime.
Therefore, even though identifiable marks may not be visualised a target area for DNA
collection or a picture of events of the assault may be determined. This of course
depends on the fabric type and the assailant’s ability to leave marks that can be
developed visualising ridge detail and palmar flexion creases, as poor donors seem to
consistently leave poor quality ridge detail or target areas across all fabrics and
development techniques.
Overall, from the results it was determined that VMD processing led to the most
identifiable marks (graded 3 – 4) and more target areas being visualised than CAF.
While VMD had more target areas on polycotton, polyester and cotton, CAF visualised
more on nylon and satin. In addition, both techniques appear to be more successful
on shiny, tight weave fabrics, such as nylon than dull rougher fabrics, such as cotton.
179
8. EFFECTS OF VARYING AMOUNTS OF WATER ON SAMPLES VISUALISED
WITH VACUUM METAL DEPOSITION (VMD) AND CYANOACRYLATE (CAF)
8.1 Aim
To determine the effects that varying amounts of water have on the level of
detail visualised by VMD and CAF on white satin, black satin, nylon, nylon-Lycra and
linen and to determine the relative hydrophobicity and hydrophilicity of each of the
fabrics utilised.
8.2 Introduction
Due to the nature of many crime items collected from crime scenes are not
always in pristine condition and may be dirty, broken or even wet. For example,
during an assault the victim may be beaten, their clothes torn and then left for dead.
Therefore, the victim and their clothing will be exposed to the environmental
conditions, such as sun, wind, rain and even morning dew. All the samples that have
been used previously in the current work have been clean, new, unwashed fabrics,
which have not been affected by contaminants or environmental conditions. The effect
that different levels of water have on the detail that can be visualised with both VMD
and CAF is now reported. It is not feasible to leave the samples out in the open for
adventitious water, therefore a water spray was used to simulate morning dew,
moderate rain and heavy rain which represented some environmental conditions to
which real samples may be exposed. This in itself is not realistic as two different items
may not be covered in the same amount of water even under the same wet conditions.
However, a spray bottle was used to keep the amount of water applied to the fabrics
constant thus keeping the variables to a minimum.
Since VMD and CAF are the main techniques studied throughout this research
these were utilised to determine the effect of moisture on the fabrics. Since both
techniques work on different components in fingerprint residues, water may have
different effects on how the marks are visualised. For example, Yamashita and French
state in the Fingerprint Source Book, “VMD was capable of developing prints on
substrates exposed to water” (2011, p. 37) and that “VMD remains effective on wetted
items, whereas cyanoacrylate (CA) fuming does not” (2011, p. 37). Therefore, it
would be expected that VMD would visualise marks on wet fabrics more readily than
CAF however, as various amounts of water were used, it could be expected that there
would be different effects on the marks and what is then visualised. This may mean

180
that under certain wet conditions CAF may be a better technique to use. It would be
expected that the less water applied to the fabric and marks, the less effect this would
have on the disruption to the level of detail visualised. Thus, this section will test the
hypothesis that VMD will visualise more detail than CAF at each of the different wet
weather conditions – morning dew, moderate rain and heavy rain.
The volume of water added was determined by reproducing the general
appearance of each weather condition on a swatch of fabric, using a spray bottle. Dew
had the appearance of beads of water sitting on the surface of the fabric with little or
none of the water penetrating or soaking into the surface. This result was achieved
with one spray from the spray bottle (approximately 1 mL). The moderate rain had
beads of water with some soaking of the water into the fabric’s surface and this was
achieved with five sprays, one after the other from the spray bottle (approximately 5
mL). The final weather condition of heavy rain had the water completely soaking into
the fabric surface and through to the underlying surface. This was achieved with 15
sprays from the spray bottle (approximately 15 mL).
It must be noted that based on previous studies with both VMD and CAF that
there may be an expectation that some fabrics may not allow the visualisation of marks
or there would be very few marks visualised. Thus both the controls and treated
swatches/samples would not contain marks. However, some fabrics did therefore it is
the difference between these and thus between the controls and treated that are
discussed in this section.
8.3 VMD Study
8.3.1 VMD Treatment 1 – Dew
Overall effect of dew on fabrics
As can be seen from Figure 8.1, the majority of samples 123 (82 %) contained
a visible mark, with only 27 (eight controls and nineteen treated samples) not showing
any indication of where the fabric had been touched. There were 33 samples out of
the 150 (22 %) that had some form of detail, 28 (37 %) coming from the control
samples and only five (7 %) from the samples subjected to the dew. The reduced
numbers show there has been some effect on the VMD process, especially when you
consider that of these samples there were only three that had the same grade showing
detail whereas 23 samples had a lower grade. Overall there does not seem to be as
significant a difference with 38 samples changing grade between the treated and non-

181
treated samples and 37 staying the same, but 32 of these samples were graded 1 or 0,
so would not give any information about identity. The 19 grade 1 samples may of
course give information about where the fabric had been touched and therefore of
some use in that case.
Overall, it appears as if dew, with approximately 1 mL of water added per
sample, was less detrimental to white satin as it was the most successful with
identifiable ridge detail, three grade four samples (combined treated and controls).
The only other fabric to have any grade three samples was nylon with only one
sample. However, considering the overall grades for both fabrics nylon had more
grade 2 samples with thirteen compared to four for white satin. Therefore, for
samples with ridge detail, nylon could be considered more successful. The other
fabrics in order of success were nylon-Lycra (nine grade 2, twelve grade 1 and nine
grade 0), linen (two grade 2, twenty one grade 1 and seven grade 0) and black satin
(twenty grade 1 and ten grade 0).
The lack of detail and only touches on the black satin could be explained by the
fact that silver, rather than gold + zinc was used for the visualisation and the
operator’s lack of experience with this metal may have led to detail being lost if the
samples were left in the chamber for too long or even not long enough.
When comparing the treated and control samples it can be seen that the
control samples all had higher numbers of samples with grades higher than zero. In
one sense this would be expected as the addition of water could lead to fingerprint
residues been washed off the surface of the fabrics, however it has been documented
that VMD is a process that can develop marks on substrates that have been exposed to
adverse conditions (Batey et al. 1998). Thus, less reduction in detail might be
expected, especially considering the small volume (1 mL) of water added over the
whole surface of the sample.
Donor three appears to be the most successful in the dew treatment as s/he
was the only one to achieve grade 3 samples, though this could be expected as this
donor was considered in other studies to be a good donor. Donor two was the least
successful in this trial with the fewest positive marks, though again when compared to
other studies reported earlier this is not unexpected as they were considered to be a
poor donor.

182
0
0.5
1
1.5
2
2.5
3
3.5
Dono
r 1
Dono
r 2
Dono
r 3
Dono
r 1
Dono
r 2
Dono
r 3
Dono
r 1
Dono
r 2
Dono
r 3
Dono
r 1
Dono
r 2
Dono
r 3
Dono
r 1
Dono
r 2
Dono
r 3
Day 1 Day 3 Day 7 Day 14 Day 28
Gra
de
of
Sa
mp
le
Donor & Day
White satin White satin control Black satin Black satin control Nylon
Nylon control Nylon-Lycra Nylon-Lycra control Linen Linen control
Figure 8.1: Overall results of controls and samples subjected to simulated dew on VMD processed fabrics (white satin, black satin, nylon, nylon-Lycra and linen), for a good, medium and poor donor over 1, 3, 7, 14 & 28 days.

183
8.3.2 Results of individual donors
Donor one
Figure 8.2: Donor one: grades of all samples and controls visualised with VMD. One half of each sample was subjected to simulated dew, while the other half acted as a control with no water added.
Donor one [Figure 8.2], who was considered to be a medium donor and would
be expected at least to show some indications as to where the marks had been
planted. This was the case in the majority of samples with 48/50 (96 %) being graded
at one or above. The samples that were graded as zero had all been subjected to the
dew, therefore even though these samples went from grade 1 on the controls to grade
0 it appears as if the water has had an effect on the marks. This donor had no
samples, neither control or treated, graded at 3 or 4, therefore this reflects the
medium grading this donor achieved in the other studies. There were only ten
samples (20 % overall, 18 % of these from the controls and 2 % from the treated)
that contained any ridge detail; therefore it is unlikely that this donor would be
identified by the marks recovered from the fabrics in this study.
Examination of the results for each of the fabrics individually indicates a trend
in reduction of grading from controls to treated samples. With white satin there was
no change for all the samples staying at grade 1 with the exception of day one, where
the control was a grade 2, whereas the treated sample was a grade 1. With black

184
satin, all the samples were grade 1 with the exception of day 14, where the treated
sample dropped to zero. There was a bigger change with nylon where days 1, 3 and
14 dropped from a grade 2 to a grade 1, with only days 7 and 28 staying the same
(grade 2 and grade 1 respectively). With nylon-Lycra, only day 28 showed no effect
from the moisture, while all the other days had a decrease in grading – days 1, 3 and 7
from a grade 2 to a grade 1 and day 14 from a grade 1 to a grade 0. Linen had little
change at all – all samples stayed at grade 1, except day 7 which was initially graded
as 2 but dropped to a grade 1 after treatment.
When considering this information there does not seem to be a correlation with
age of the marks and the quality of detail observed over the timeline as the majority of
the samples did not change, or had insignificant changes, in grading. Therefore, for
this donor, there does not seem to be a significant decline of the detail observed over
the full timeline.
Donor two
Figure 8.3: Donor two: grades of all samples and controls visualised with VMD. One half of each sample was subjected to simulated dew, while the other half acted as a control with no water added.
Donor two [Figure 8.3] is the poorest donor out of the three in this trial, and
this is consistent with results from most other trials. This donor had no samples with
185
grades higher than a 2, with 32 % being graded as zero, 54 % were grade 1 and 14 %
at grade 2. These grade 2 samples only had limited ridge detail; therefore, it is highly
unlikely that this donor would be identified from their marks left on fabrics.
Again, with this donor there was little change in the grades over each fabric
and the timeline. White satin was graded as 1 for all days, except day 3 where it was
a grade 2 on the control dropping to a grade 1 for the treated sample. Black satin
remained unchanged for four out of the five days – grade 1 for days 1 and 3, grade 0
for days 14 and 28, while day 7 was the only day that changed dropping from a grade
1 to a grade 0 after addition of water. Nylon also had three days where the samples
stayed the same grading – day 1 (grade 2), days 7 and 28 (grade 1), while day 3
dropped from a grade 1 to grade 0 and day 14 dropped from a grade 2 to a grade 1.
Nylon-Lycra was the least successful fabric for this donor as it had the most samples
graded at 0, with only one set of samples (control and treated) being rated as grade 2
and all the others were either grade 1 or 0. With linen two samples stayed the same
for control and treated – day 1 (grade 1) and day 28 (grade 0), while all the others
were reduced from control to treated.
There was some change in grading between the controls and treated samples –
grade 0 (20 % control compared to 10 % treated); grade 1 (30 % for the control and
24 % for the treated samples) and grade 2 (10 % for the controls and 4 % for the
treated samples). It cannot really be determined as to the effect of the moisture on
the samples as there is not a big enough difference between the two. However, this
donor is generally a poor so it would not be expected that s/he would have a great
deal of ridge detail and this is what was observed.
Donor three
Donor three [Figure 8.4] could be considered the most successful out of the
three in this trial as s/he was the only one to achieve grade 3 (overall 10 % of the
samples) in other studies, this donor has been classed as good, so there was a
presumption that they would produce ridge detail in this trial. This was the case as
this donor had the highest number of positive samples – 41/50 (82 %), with 16 (32 %)
producing ridge detail.

186
Figure 8.4: Donor three: grades of all samples and controls visualised with VMD. One half of each sample was subjected to simulated dew, while the other half acted as a control with no water added.
Looking at each fabric individually water does seem to have had a considerable
effect on the samples. White satin has had a drop in grading for each day with
samples showing a decrease in detail from the freshest to the oldest samples,
suggesting that water has affected the detail visualised. Black satin also only had
samples graded at 1 or 0 – either remaining unchanged, such as in the case of day 1,
3 (grade 1), and day 14 (grade 0), or reducing in detail, days 7 and 28 dropped from
grade 1 (control) to grade 0 (treated). Nylon however does show an effect of the
moisture on all the days and samples – days 1, 7, 14 and 28 were all grade 2,
dropping to grade 1 for the weathered samples, while day 3 started at the higher
grade 3 and dropped to grade 2. This was the same with nylon-Lycra, with all days,
except for 28 (zero for both control and treated), dropping from a grade 1 to grade 0.
This could have again been due to the fabrics construction and the fact that the metals
did not seem to adhere well to the surface. Linen was another fabric without samples
graded higher than 1 and of those two days (1 and 7) remained at grade 1 for both
the control and treated sample, while days 3 and 14 dropped from a grade 1 (control)
to a grade 0 (treated). Day 28 however showed an improvement rising from a grade 0
for the control to a grade 1. This could be due to several factors such as the donor not

187
grabbing the fabric evenly thus not depositing the same amount of residues on each
portion of the fabric or that they did not have an even amount of residues on their
hand at the time of deposition.
Considering the controls versus the samples that had been treated with water it
can be seen that there are less positive samples with detail for those that had been
treated with water. There were nine (18 %) graded at 2 for the controls and only five
(10 %) for those treated with water, while there were no grade 3 samples for the
treated samples and five (10 %) for the controls. The only sample that was higher
was day 28 linen, which was grade 0 for the control but rose to grade 1 after
treatment. This difference may have been related to the rough surface of the fabric on
the different sections being tested leading to different levels of detail observed.
8.3.3 VMD Treatment 2 – moderate rain
Overall effect of moderate rain on fabrics
With this treatment, the addition of 5 mL of water per sample, [Figure 8.5] 118
(78 %) of the samples were positive for marks, with the highest percentage being
touches or grade 1 (51 %), followed by grade 2 at 23 %, with these samples
containing some level of ridge detail. There was much less success with the higher
gradings, with only 3 % at 3, and 1 % at 4. Overall, 27 % of the samples contained
some level of ridge detail, which illustrates that even with the increased water added,
VMD can still visualise detail, though this was dependent on the donor and the
secretions they deposit as well as the surface of the fabric. The water caused an effect
with the treated samples, as the detail reduced in the majority of samples that had
been subjected to the moderate rain.
The only samples to increase in number were the grade 1 and grade 0, though
this makes sense if water really is affecting the level of detail – the control samples
that had gradings of 2 to 4 dropped down one grading, while the sample controls that
were graded as 1 generally dropped to 0 or remained the same.

188
0
1
2
3
4
Dono
r 1
Dono
r 2
Dono
r 3
Dono
r 1
Dono
r 2
Dono
r 3
Dono
r 1
Dono
r 2
Dono
r 3
Dono
r 1
Dono
r 2
Dono
r 3
Dono
r 1
Dono
r 2
Dono
r 3
Day 1 Day 3 Day 7 Day 14 Day 28
Gra
de
of
Ma
rk
Donor & Day
White satin White satin Control Black satin Black satin Control Nylon
Nylon Control Nylon-Lycra Nylon-Lycra Control Linen Linen Control
Figure 8.5: Overall results of controls and samples subjected to simulated moderate rain on VMD processed fabrics (white satin, black satin, nylon, nylon-Lycra and linen and controls), for a good, medium and poor donor over 1, 3, 7, 14 & 28 days.

189
With this moderate rain treatment, it was white satin that was the most
successful as it was the only fabric that showed grades 4 and 3. This is most likely due
to the fabric surface as it is smooth and has a tight weave and consequently
considerable water just sat on the surface rather than soaking into the fabric. Thus the
residues may have survived the “rain”, not been washed off and thus been available
for the metals during VMD. Donor three (the best donor) had highest grades and this
should be expected that s/he would produce detail as well as indications of where the
fabric had been touched. Donor one was next, followed by donor two and this follows
the trend from previous studies also – donor one is considered a medium donor and
donor two a poor donor. There was little change with the black satin – the majority of
the samples remained the same, either grade 1 or 0, with the only two samples
dropping in gradings being day 1 donor two (1 to 0) and day 28 donor one (2 to 1).
Again, the lack of detail and the fact that really only touches could be seen was most
likely due to the inexperience in the operator in the use of silver metal. Nylon had
more success in retaining the same level of detail between the controls and the treated
samples with eight out of the fifteen remaining the same grade (either 2 or 1), while
the other seven samples dropped from a 2 to 1. Therefore, with this fabric 100 % of
the samples resulted in a target. The moisture added had a definite effect on the
nylon-Lycra – all of the earlier days (1 – 7) had reductions in the level of detail
observed, either dropping from a grade 2 to 1 or grade 1 to 0. On the later the only
sample to change grade was donor one on day 14 from a 1 to a 0. With linen there
was little change between all the days and treatments with eleven of the samples
remaining the same between control and treated sample. The only samples to change
were day 1 donor one, day 3 donor two, day 7 donor two, all dropping from grade 1 to
0 and day 14 donor two rising from 0 to 1 in the treated sample. This increase was
unexpected as the increase in amount of water would be expected to reduce the level
of contact and detail, thus this could be uneven distribution of residues on the donor’s
hand or an uneven grab of the swatch. Overall, however there does seem to have
been an effect on the level of detail and even contact observed between the controls
and treatments, thus it appears that there is an effect on the VMD by the addition of
water.
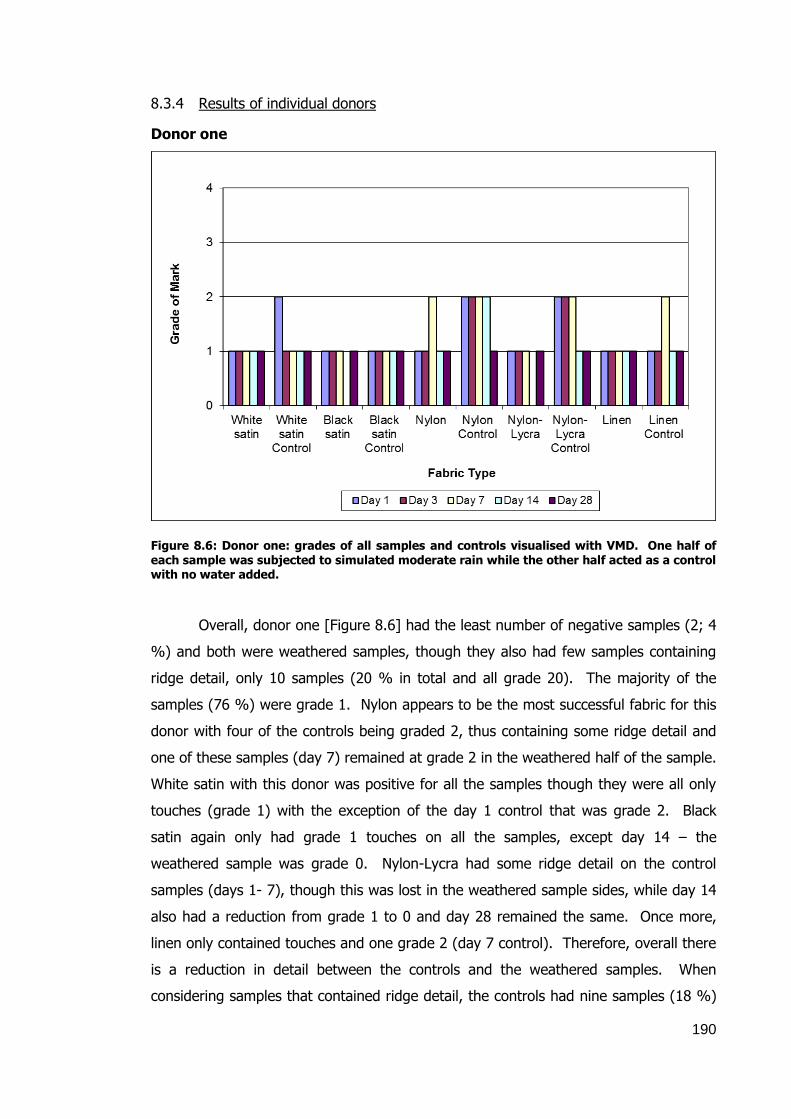
190
8.3.4 Results of individual donors
Donor one
Figure 8.6: Donor one: grades of all samples and controls visualised with VMD. One half of each sample was subjected to simulated moderate rain while the other half acted as a control with no water added.
Overall, donor one [Figure 8.6] had the least number of negative samples (2; 4
%) and both were weathered samples, though they also had few samples containing
ridge detail, only 10 samples (20 % in total and all grade 20). The majority of the
samples (76 %) were grade 1. Nylon appears to be the most successful fabric for this
donor with four of the controls being graded 2, thus containing some ridge detail and
one of these samples (day 7) remained at grade 2 in the weathered half of the sample.
White satin with this donor was positive for all the samples though they were all only
touches (grade 1) with the exception of the day 1 control that was grade 2. Black
satin again only had grade 1 touches on all the samples, except day 14 – the
weathered sample was grade 0. Nylon-Lycra had some ridge detail on the control
samples (days 1- 7), though this was lost in the weathered sample sides, while day 14
also had a reduction from grade 1 to 0 and day 28 remained the same. Once more,
linen only contained touches and one grade 2 (day 7 control). Therefore, overall there
is a reduction in detail between the controls and the weathered samples. When
considering samples that contained ridge detail, the controls had nine samples (18 %)

191
compared to only one grade 2 (2 %) in the weathered samples, thus water must have
affected the level of detail.
Donor two
0
1
2
3
4
Whitesatin
Whitesatin
Control
Blacksatin
Blacksatin
Control
Nylon NylonControl
Nylon-Lycra
Nylon-Lycra
Control
Linen LinenControl
Gra
de
of
Ma
rk
Fabric Type
Day 1 Day 3 Day 7 Day 14 Day 28
Figure 8.7: Donor two: grades of all samples and controls visualised with VMD. One half of each sample was subjected to simulated moderate rain while the other half acted as a control with no water added.
Donor two [Figure 8.7] has shown, once more, that s/he is a poor donor – they
had the highest number of negative samples, 16 out of 50 (32 %) and the least
number of samples with ridge detail, only 9 samples (18 %) and all grade 2. Nylon
was also the most successful fabric with this donor. Days 1, 3 and 14 all graded 2 for
controls and weathered, while day 7 was graded 2 for the control, dropping to grade 1
for the weathered and day 28 was grade 1 for both control and weathered; thus there
seems to be little effect from the water on this fabric. White satin does however seem
to have been affected by the water as all days were reduced except day 28, which
remained a grade 1 for control and weathered. Black satin was the least successful
fabric with this donor – days 14 and 28 were grade 0, while the other days were quite
mixed. Nylon-Lycra showed a similar trend: three days (1, 7 and 14) remained the
same at grade 1, while day 28 was grade 0 for both and day 3 dropping a grade from
2 for the control to 1 for the weathered. Linen had even less detail – all the positive
samples were only graded at 1. Day 1 remained grade 1 for both control and
weathered, day 3 and 7 dropped from grade 1 for the control to grade 0 for the

192
weathered, day 14 had an increase from grade 0 to grade 1 for the weathered and
finally day 28 was negative for both samples.
This donor’s results were a bit mixed with very little detail for either control or
weathered portion of the samples – only 18 % of the samples were graded above 1
and these were all grade 2. The rest of the positive samples were evenly spread
between the control (26 %) and weathered samples (24 %), with a slightly smaller
number of negative samples for the control samples, 12 % compared to 20 % for the
weathered samples. Therefore there has been a reduction in many of the samples
between control and weathered, but generally this donor has performed poorly and it
is very unlikely that they would be identified from fingermarks on fabric.
Donor three
Figure 8.8: Donor three: grades of all samples and controls visualised with VMD. One half of each sample was subjected to simulated moderate rain while the other half acted as a control with no water added.
Again, donor three [Figure 8.8] demonstrates out of the donors in this trial that
they are the most successful – again they are the only donor to achieve any grades
higher than 2 and had the most samples with ridge detail, 14 (28 %) in total, and of
these, two were grade 4 (containing excellent detail) and four were grade 3.
193
There does seem to have been an effect with the addition of water with all of
the samples graded 2 and above since they dropped in detail from the control to the
weathered samples, with the exception of nylon day 1 which remained at grade 2 for
each. With white satin the change was quite significant – while days 1 and 28 only
dropped one grade, days 3 and 14 dropped two grades and day 7 dropped three.
Therefore, there was a dramatic loss of ridge detail in all of these samples and is most
likely due to the fabric becoming completely soaked resulting in the fingerprint residues
being washed away. Black satin and linen both performed poorly with only touches
(grade 1) or negative samples (grade 0) for all the samples and it was the fresher
samples that had positive grades – days 1, 3 and 7 for black satin and days 1 and 3
only for linen. Nylon was quite consistent with all except day 28 being graded 2 for
the controls, day 28 was graded 1, while day 1 for the weathered remained a grade 2
with all the other samples being graded 1. Nylon-Lycra also had a reduction in detail
for all days except day 14, which remained at grade 1, and day 28, which was negative
for both control and weathered.
8.3.5 VMD Treatment 3 – heavy rain
Overall effect of heavy rain on fabrics
This final treatment [Figure 8.9] had the most water added, approximately 15
mL of water per sample, therefore there would be an expectation that this would have
the most effect on the samples and the detail visualised. There was a reduction in
positive samples with this treatment, but only seven less than for moderate rain, here
there were 111 positive samples with means 74 % of all the samples had a mark
indicating a touch or even ridge detail. In the case of the ridge detail there were 34
samples containing ridge detail and were graded overall at 2 to 3. The majority (29
samples) were grade 2, but there were four grade 3 samples and one grade 4
containing identifiable detail.
White satin again seems to be the most successful fabric as it is the only one
that had any grade 3 and 4 samples and these were all on samples from the good
donor. It also had the second fewest negative samples, only four compared to the
next lowest fabric of linen at eight samples. Nylon had less negative samples, with
only one of day 14 (donor two), though there was a reduction in all but three of the
other samples. The three that did not reduce in grade were day 1 (donor two) and
day 28 (donors one and two), but since these samples were grade 1 they did not
contain any detail.

194
Figure 8.9: Overall results of controls and samples subjected to simulated heavy rain on VMD processed fabrics and controls for a good, medium and poor donor over 1, 3, 7, 14 & 28 days.

195
The other samples reduced from some detail (grade 2) to no detail and
indication of a touch only (grade 1). This reduction can also be seen in the nylon-
Lycra samples as the majority went from grade 2 and 1 to zero, with the exception of
day 7 (donor one), which dropped from grade 2 to a grade 1 and there were also four
samples that remained at grade 1. With linen there were less samples with detail to
begin with; only four grade 2 samples in the controls and one in the treated samples.
Therefore water has definitely caused a detrimental effect on these samples as there
has been a complete loss of detail and visible marks. Finally, black satin had the least
change – eight samples remained at grade 1, while five remained at grade 0. Only two
samples dropped in their grade from 1 to 0. Therefore even though water did not
seem to have an effect on the visualisation this fabric appears to be poor at developing
marks and marks using silver VMD.
Donor one
Figure 8.10: Donor one: grades of all samples and controls visualised with VMD. One half of each sample was subjected to simulated heavy rain while the other half acted as a control with no water added.
Donor one [Figure 8.10] had the most positive marks (94 %) of all the donors
for this treatment. There were only 14 (28 %) of these samples containing ridge detail
and these were all only at grade 2, therefore may not help with identification. Of these

196
grade 2 samples; twelve were on the control side and only two on the treated side.
White satin and linen were grade 2 in the controls and weathered samples, while all
the other grade 2 samples changed to the lower grade of 1 on the treated side of the
swatch.
There does not seem to be a fabric that can be stated as being the most
successful. Nylon had the most grade 2 samples, but these were all on the control
samples and all reduced to grade one once treated. While both white satin and linen
had four grade 2 samples, three on the control side and one on the treated side. Black
satin had the least detail and change – all samples were grade 1 for all the controls
and treatments. Nylon-Lycra was the most changed fabric with day 28 the only one
remaining at the same grade.
Due to the limited detail on the control samples it is hard to say with conviction
that the water had an effect on the other half of the samples.
Donor two
Figure 8.11: Donor two: grades of all samples and controls visualised with VMD. One half of each sample was subjected to simulated heavy rain while the other half acted as a control with no water added.
Donor two [Figure 8.11] again shows s/he is the weakest donor in this set of
donors with only 30 (60 %) of their samples being positive and only 7 (14 %) of these
197
containing ridge detail. The rest (46 %) were grade 1, therefore could only be used to
give information about the circumstances or as a target area for DNA taping.
With this donor, nylon had the highest detail with three control days (3, 7 and
14) being graded at 2, however days 3 and 7 dropped to 1 and day 14 to 0 after
treatment. There were only three other fabrics (white satin, nylon-Lycra and linen)
that had grade 2 samples, though white satin was the only fabric where the grade 2
remained on the treated side. The grade was reduced on the treated side for both
linen (down to 1) and nylon-Lycra (to 0). All the other samples were graded either 1
or 0 so they either had only an indication of a touch or were negative.
Overall, there does appear to be some indication that the water added to the
samples has impacted negatively, though there was limited detail to begin with. There
were only one grade 2, seven grade 1 and seven grade 0 samples that remained the
same for the control and treated. All the other samples reduced in detail from 2 to 1
or 1 to 0, therefore 70 % of the samples seem to have been effected by the heavy
rain. Though adverse conditions, such as rain are not expected to stop development
of marks with VMD, the large volume of water, which totally soaked the fabrics either
washed the marks off the surface or they were absorbed into the fabrics.
Donor three
Though this donor [Figure 8.12] did not have the highest number of positive
samples, 68 % compared to donor one having 94 %, s/he was the most successful if
the samples with detail are considered as this donor was the only one with grade 3 and
4 samples. There were four grade 3 samples, three on control samples and one on a
treated sample and the only grade 4 observed was on a control sample. Donor one
had 14 positive samples (one more than donor three), however they were all grade 2,
so donor three is definitely the more successful in terms of the development of ridge
detail.
White satin was the most successful fabric with this donor, being the only one
to have identifiable ridge detail, with all of these samples reducing value from the
control to the treated samples, showing water has affected the detail obtained. Nylon
was the next best sample at allowing visualisation; all the controls were grade 2 and all
reduced to grade 1 for the samples subjected to the weathering. Nylon-Lycra was the
only other fabric with ridge detail, though this was only on the day 1 and day 7 control
samples, but they all dropped to zero on the half subjected to water. There were only
two other samples with positive grades – days 3 and 14. While day 3 dropped to a

198
negative grade 0 for the treated half, the treated half of day 14 remained the same.
Black satin and linen were quite similar in their timeline profiles. The former had five
grade 1 samples, three on the control halves and two on the weathered halves, while
linen had one extra grade 1 on the control of day 14.
Figure 8.12: Donor three: grades of all samples and controls visualised with VMD. One half of each sample was subjected to simulated heavy rain while the other half acted as a control with no water added.
Thus, with this donor, the water affected the detail recovered from the VMD
treated samples as all the samples with detail on the control samples was reduced on
the sample halves subjected to the heavy rain treatment.
8.3.6 Overall conclusion
When taking all the data into consideration the effect of water can be seen by
the reduction in the number of positive samples as the level of water increased. Dew
was the least amount of water added and resulted in the highest number of positive
marks (123/150; 82 %), moderate rain led to 118 (79 %) and, heavy rain had fewer
positive samples, 111 (74 %). However, the same cannot be said of the ridge detail
observed - the dew samples had the fewest samples with ridge detail (33; 22 %),
moderate rain had the highest with 41 marks (27 %) and heavy rain reduced in
number again to 34 marks (23 %). Rather than the expected ranking from most to
least detail being dew, moderate rain and heavy rain the order appears to be moderate

199
rain, dew then heavy rain. Therefore though the addition of water has had an impact
there must also be some effect from the fabric and the donors as to the level of detail
visualised with VMD.
This conclusion is based on the data observed during the study; however there
were several samples including control samples that did not show any marks at all,
even though they had not been affected by water. Therefore, this study needs to be
repeated, possibly with artificial residues and a stamp, to determine the true effect of
the water. This was not carried out originally due to a similarity in results from other
studies. For example, cotton did not show much detail in previous studies, therefore
there was an expectation that none would appear in this study either and this was
generally the case as illustrated by the results.
8.4 CAF study
8.4.1 CAF Treatment 1 - dew
Overall effect of dew on fabrics
It can clearly be seen from Figure 8.13 that black satin is the most successful
fabric in terms of visualisation with the addition of 1 mL of water in the dew section –
all donors and days had positive marks (ranging from grades 1 – 3 for the treated
samples), with the exception of day 7 donor three (grade 0). From other studies,
donor three, had been found to be a consistently good donor, whose marks generally
were obvious and, in many cases contained ridge detail. The lack of marks on this day
may have been due to the increased moisture or other factors, such as cold or dry
hands. The overall number of positive marks (14/15 or 93 %) for black satin may be
due to the fluorescence, from the BY40 being obscured by the dark colour of the
fabric. As a result, no background staining or fluorescence was observed with the
Crime lites. It could also be due to the hydrophobicity of the black satin as the water
tended to sit more on the surface rather than soaking into the fabric meaning that the
residues were not washed off or absorbed. White satin was the only other fabric with
positive marks (all grade 1) for the treatment (7 %) and 4 for the controls (27 %). It
would be expected for this fabric type (tight smooth weave) that there would be more
positive marks, however it was determined in water absorption tests (see section 8.6)
that this fabric was more hydrophilic. Thus, it could be presumed that there were
fewer residues on the fabric surface for the CAF to adhere to and therefore less
visualisation.

200
0
1
2
3
4
Dono
r 1
Dono
r 2
Dono
r 3
Dono
r 1
Dono
r 2
Dono
r 3
Dono
r 1
Dono
r 2
Dono
r 3
Dono
r 1
Dono
r 2
Dono
r 3
Dono
r 1
Dono
r 2
Dono
r 3
Day 1 Day 3 Day 7 Day 14 Day 28
Gra
de
of
Ma
rk
Day and Donor
White satin White satin Control Black satin Black satin Control Nylon
Nylon Control Nylon-Lycra Nylon-Lycra Control Linen Linen Control
Figure 8.13: Overall results of controls and samples subjected to simulated dew on CAF processed fabrics and controls for a good, medium and poor donor over 1, 3, 7, 14 & 28 days.

201
With black satin there does seem to be some effect of moisture on marks that
can be visualised as 40 % of the samples had decreased visualisation under the dew
treatment when compared to their controls. There was no change in 53 % of the
gradings and one sample (7 %) increased which reinforces the point that moisture
content does affect the amount/quality of marks visualised. Nylon-Lycra and linen
were negative for all donors and days (both the controls and the samples subjected to
dew), which was a similar result to other CAF studies with these fabrics, so not
unexpected.
A natural method of deposition was used rather than artificial residues and a
stamp, because the research attempted to keep the methodology as close to a real-life
situation as possible. Consequently, the lack of marks may be, in part, due to a lack of
residues present on the samples. However, the donors used in this study were a mix
of a poor, medium and good donor so there would be an expectation that the good
and even medium donor would deposit marks. As suggested in section 8.3.6 this work
should be repeated to help determine whether it is an initial lack of residues or the
process (in this case CAF) that did not allow for the visualisation of marks. At the time
of the study, time constraints and previously acquired data from other studies there
was an expectation that CAF would not visualise much detail, therefore the same might
be expected during this study. Thus, when little and in some cases no detail was
observed it was not seen as unusual or unexpected, therefore the study was not
repeated.
Donor one
Figure 8.14 shows the result for donor one, who from previous studies was
considered a medium donor. Here it can be seen that neither linen nor nylon-Lycra
had any marks visualised. In the case of linen this was not unexpected due to the
open weave and roughness of the fabric previously shown to be detrimental to CAF
attachment but nylon-Lycra had mixed results in previous studies. It does have a
smoother surface and tighter weave, but tended not to show many areas of contact,
and it has a tendency to absorb liquid, which, in turn, could dilute or remove the
residues thus reducing the possibility of CAF attachment. White satin in this study had
no contact marks for the treated samples with visible marks of only grade 1 for the
controls, with the exception of day 7, which remained grade 0. All of the nylon
samples remained the same on the treated and the controls, with the exception of day
7 where the control was grade 1 and the treated sample reduced to a grade 0. Black

202
satin was the fabric that performed the best with this donor. One sample did go down
in its grading (day 14 went from a 2 to a 1) and days 3 and 28 remained the same
(grade 1), however days 1 and 7 improved by going from a grade 1 to 2 and 3
respectively. When considering the fabric weave, including tightness and smoothness,
these results could be expected leading to the fabric ranking of black satin, nylon,
white satin, nylon-Lycra and linen. The satins and nylon are all quite smooth with tight
weaves thus marks and detail would be expected to be visualised, whereas the nylon-
Lycra is not as smooth and the linen is quite rough, therefore less detail or marks
would be expected.
Figure 8.14: Donor one: grades of all samples and controls visualised with CAF. One half of each sample was subjected to simulated dew while the other half acted as a control with no water added.
When considering the timeline and age of the samples there does not seem to
be a correlation between how old the samples are and the quality of marks visualised.
Of the samples with marks, the fresher samples (days 1 and 3) did in some cases
visualise touch marks (grade 1) for the treatments and controls, but it was day 7 that
gave the highest grading of a 3. There was also a grade 2 for a day 1 black satin
control (decreasing to a grade 1 when treated) and day 14 black satin treatment (an
increase from a grade 1 on the control). Therefore if the hypothesis was that as the
samples aged the grading reduced this has not been proven in these samples.

203
Donor two
Figure 8.15: Donor two: grades of all samples and controls visualised with CAF. One half of each sample was subjected to simulated dew while the other half acted as a control with no water added.
Donor two [Figure 8.15] was the poorest of the three donors in this study as
three of the fabrics, linen, nylon and all, but one, control sample (day 1) for the white
satin gave no visible marks of any kind. The black satin, which was the best
performing fabric with donor one, visualised marks on all days, however there was no
difference between the treated and the controls. Nylon again had samples with no
change between the treatment and controls on days 3, 28 (grade 0) and 7 (grade 1),
however there were two samples where the grade decreased from the control to
treated – from a grade 1 to a grade 0. Thus the addition of water had a small effect
on the nylon samples but no change on the black satin where the grades remained the
same.
Considering the age of the samples with marks, it would be expected that the
fresher planted marks would be more easily visualised and extra detail would be seen,
however, considering Figure 8.15, it was the older marks such as day 7 that have the
highest grade (black satin – treatment and control). Overall donor two does not have
many visualised marks (only 30 % of the samples) and all of them are on the high
performing fabrics satin and nylon.

204
The addition of water did not seem to have an effect on the black satin – the
gradings remained the same with the controls and those treated with dew. There does
however seem to be an effect with nylon where only the day 7 of the positive control
samples displayed a mark after water was added. Interestingly, with the white satin,
there was only one positive sample (day 1) and this was for the dew treated sample,
though this was just a touch mark, so may not have been from the grab but rather an
artefact of the processing.
Donor three
Donor three [Figure 8.16] gave the marks with most detail – the only donor to
achieve grade 4 marks (days 1, 3 and 7 on black satin), however these all reduced
upon the addition of dew. The moisture appeared to have an effect on nylon but
many of the samples remained the same with the controls and treated samples having
the same grade. However days 14 and 28 went from grade 1 to grade 0 for both
days, therefore it would appear that the moisture has negatively impacted on the
ability of CAF to visualise marks.
Figure 8.16: Donor three: grades of all samples and controls visualised with CAF. One half of each sample was subjected to simulated dew while the other half acted as a control with no water added.

205
Generally, more detail can be seen after visualisation if the fabric is
hydrophobic and allows moisture to remain on the surface. Nylon and satin are more
hydrophobic, therefore, there is greater visualisation, whereas linen and, unexpectedly,
nylon-Lycra are more hydrophilic and allow the water to be absorbed along with the
residues resulting in removal of marks from the fabric’s surface leaving nothing for the
CAF to adhere to and visualise marks.

206
8.4.2 CAF Treatment 2 – moderate rain
0
1
2
3
4
Dono
r 1
Dono
r 2
Dono
r 3
Dono
r 1
Dono
r 2
Dono
r 3
Dono
r 1
Dono
r 2
Dono
r 3
Dono
r 1
Dono
r 2
Dono
r 3
Dono
r 1
Dono
r 2
Dono
r 3
Day 1 Day 3 Day 7 Day 14 Day 28
Gra
de
of
Ma
rk
Donor & Day
White Satin White Satin control Black satin Black satin Control Nylon
Nylon Control Nylon-Lycra Nylon-Lycra Control Linen Linen Control
Figure 8.17: Overall results of controls and samples subjected to simulated moderate rain on CAF processed fabrics and controls for a good, medium
and poor donor over 1, 3, 7, 14 & 28 days.
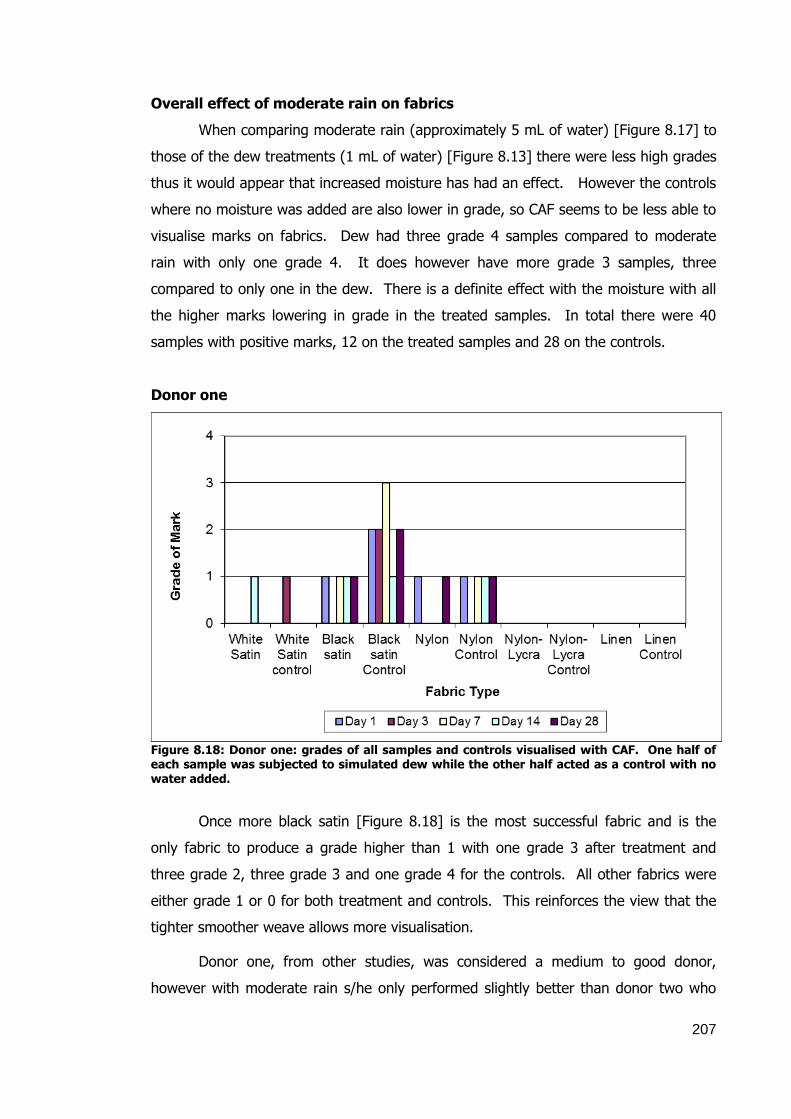
207
Overall effect of moderate rain on fabrics
When comparing moderate rain (approximately 5 mL of water) [Figure 8.17] to
those of the dew treatments (1 mL of water) [Figure 8.13] there were less high grades
thus it would appear that increased moisture has had an effect. However the controls
where no moisture was added are also lower in grade, so CAF seems to be less able to
visualise marks on fabrics. Dew had three grade 4 samples compared to moderate
rain with only one grade 4. It does however have more grade 3 samples, three
compared to only one in the dew. There is a definite effect with the moisture with all
the higher marks lowering in grade in the treated samples. In total there were 40
samples with positive marks, 12 on the treated samples and 28 on the controls.
Donor one
Figure 8.18: Donor one: grades of all samples and controls visualised with CAF. One half of each sample was subjected to simulated dew while the other half acted as a control with no water added.
Once more black satin [Figure 8.18] is the most successful fabric and is the
only fabric to produce a grade higher than 1 with one grade 3 after treatment and
three grade 2, three grade 3 and one grade 4 for the controls. All other fabrics were
either grade 1 or 0 for both treatment and controls. This reinforces the view that the
tighter smoother weave allows more visualisation.
Donor one, from other studies, was considered a medium to good donor,
however with moderate rain s/he only performed slightly better than donor two who

208
was considered a poor donor. For donor one – nylon-Lycra and linen were all grade 0;
white satin had a grade 1 for both the treatment (day 14) and control (day 3). The
nylon samples had three days with unchanged grades, days 1 and 2 (grade 2), day 3
(grade 0), whereas days 7 and 14 were zero for the treatment and 1 for the control.
Black satin was once again the best fabric but all days had poorer grades for all the
weathered sample.
Donor two
Figure 8.19: Donor two: grades of all samples and controls visualised with CAF. One half of each sample was subjected to simulated dew while the other half acted as a control with no water added.
Donor two [Figure 8.19] was once again the least successful donor having both
nylon-Lycra and linen negative for all days and treatments, while white satin was
negative for both treatment and controls for all days with the exception of day 3
control. Nylon only had grade 1 for the controls on days 1, 7 and 14 and black satin
was negative for day 1 control as well as days 7 and 14 of the treated. Though,
interestingly, black satin had grade 0 for the day 1 control, but a grade 3 for the
treated, and this may be due to how the donor gripped this sample, differences in the
surface of this fabric, the distribution of residues on the hand or even how the CA
adhered to the residues.

209
Donor three
Figure 8.20: Donor three: grades of all samples and controls visualised with CAF. One half of each sample was subjected to simulated dew while the other half acted as a control with no water added.
Though donor three [Figure 8.19] had the highest graded samples with grades
4 and 3 for black satin s/he only had the second highest number of positive samples –
13 compared to 17 for donor one and 11 for donor two. They were negative for white
satin, nylon-Lycra and linen. This was not as predicted as this donor was considered a
good donor, therefore would have been expected to have the highest number of
positive samples compared to the other two donors. The nylon control was graded as 1
for all days, with only day 7 of the treated giving any positive samples (grade 1). The
black satin, as with both the other donors, was the most successful – all the controls
had positive grades ranging from 1 to 4, however it was only days 1 and 14 of the
treated samples that gave positive marks (grade 1). This illustrates that the moisture
has had an effect on the visualisation of marks for this donor.

210
8.4.3 CAF Treatment 3 – heavy rain
0
1
2
3
4
Dono
r 1
Dono
r 2
Dono
r 3
Dono
r 1
Dono
r 2
Dono
r 3
Dono
r 1
Dono
r 2
Dono
r 3
Dono
r 1
Dono
r 2
Dono
r 3
Dono
r 1
Dono
r 2
Dono
r 3
Day 1 Day 3 Day 7 Day 14 Day 28
Ga
rde
of
Ma
rk
Donor & Day
White Satin White Satin control Black Satin Black Satin control Nylon
Nylon control Nylon-Lycra Nylon-Lycra control Linen Linen control
Figure 8.21: Overall results of controls and samples subjected to simulated heavy rain on CAF processed fabrics and controls for a good, medium and poor donor over 1, 3, 7, 14 & 28 days.

211
Overall effect of heavy rain on fabrics
This set [Figure 8.21] has the least number of samples, both controls and
weathered, that were positive for marks. There were 32 marks in total (6 for treated
and 26 for controls), compared to 51 for the dew set (22 for treated and 29 for
controls) and 40 for moderate rain (12 for treated and 28 for controls). Of the positive
samples there were only six grade 2, one grade 3 and two grade 4 samples, therefore
only nine samples (6 %) in total that contain any ridge detail that could aid in
identification. It can clearly been seen that the water sprayed onto the samples
(approximately 15 mL) did have a detrimental effect. Three of the fabric types (white
satin, black satin and nylon) had positive samples for the controls (ranging from 1 to
4), while the areas subjected to the water only had positive samples for black satin.
Therefore it must be considered that the water has either allowed the residues
to penetrate the fabric surface or they were rinsed away so there was nothing for the
CA to bind to and produce polymers thus no visualisation of ridge detail.
Donor one
Figure 8.22: Donor one: grades of all samples and controls visualised with CAF. One half of each sample was subjected to simulated dew while the other half acted as a control with no water added.

212
With the exception of day 1 control, donor one [Figure 8.22] had no positive
samples for nylon-Lycra, linen or white satin. While nylon control samples fared
slightly better with all, except day 3 (grade 0) being positive for touches (grade 1). It
was the black satin controls once again that had the highest grades and the most
positive samples, however all the weathered samples were negative except day 7
which had a grade of 1. This would seem to add to the opinion that the simulated
heavy rain has washed off any residues, which would have allowed CAF enhancement.
It also seems to reinforce the hypothesis that it is the smoother tighter weave fabrics
which allow CAF visualisation. The fabrics with positive marks are nylon and black
satin both of which are smooth and have the tightest weaves out of the five fabrics
tested.
Donor two
Figure 8.23: Donor two: grades of all samples and controls visualised with CAF. One half of each sample was subjected to simulated dew while the other half acted as a control with no water added.
Again donor two [Figure 8.23] had the lowest grades overall with only 7 on
controls and 2 on the treated though interestingly one of the weathered samples (day
1 grade 2) was negative on the control. This may have been due to several factors,
such as residues on the donor’s hand or the force in which each half of the hand held
the fabric. This donor is generally a poor donor therefore these results are not

213
unexpected and the positive samples were on nylon and black satin, which have
consistently resulted in positive marks.
Donor three
0
1
2
3
4
White
Satin
White
Satin
control
Black
Satin
Black
Satin
control
Nylon Nylon
control
Nylon-
Lycra
Nylon-
Lycra
control
Linen Linen
control
Gra
de
of
Ma
rk
Fabric Type
Day 1 Day 3 Day 7 Day 14 Day 28
Figure 8.24: Donor three: grades of all samples and controls visualised with CAF. One half of each sample was subjected to simulated dew while the other half acted as a control with no water added.
Donor three [Figure 8.24] was negative for any marks on the controls and
treated on nylon-Lycra, linen and white satin as well as treated on nylon. The nylon
controls were positive for touches on all days except day 28, while the black satin
control samples were positive for all days ranging from 1 (day 3), 2 (days 1 and 14), 3
(day 28) and 4 (day 7).
Overall, the results for CAF were as expected – an increase in moisture led to a
decrease in visualisation. Dew had the highest number of marks 34 % with 11 % of
these with ridge detail, moderate rain showed 27 % positive marks and 8 % ridge
detail, and heavy rain with 21 % and ridge detail 6 %. This is expected as CAF is
generally not considered for productions that have been subjected to adverse weather
conditions (Yamashita and French 2011). There was a difference in detail observed
between each condition and the control samples. This is most likely due to the residue
levels on the donors’ hands on the day of collection as it is possible for a good donor to
have a day where their residue levels are reduced as a result of a reduction in
temperature or ill health. A way to confirm this would be to use an artificial residue

214
and stamp rather than a living individual and their natural level of residues. However,
the research was attempting to simulate a real-life scenario, such as an assault
through grabbing or pushing, which could not be reproduced with a stamp.
8.5 Statistical analysis of the effect of varying levels of water on the
fingermark visualisation using VMD and CAF.
The Mann-Whitney U test [Table 8.1] was first carried out to determine which
technique, VMD or CAF, was most effective in allowing fingermarks to be visualised on
the various fabrics (white satin, black satin, nylon, nylon-Lycra and linen) under each
condition (dew, moderate rain and heavy rain) as well as the controls which were not
exposed to the water. The null hypothesis (H0) is therefore no difference between
fabrics when the visualisation technique is VMD or CAF, and the alternative hypothesis
(HA) is that there is a difference between the fabrics. The p-value of <0.001 indicates
that there is indeed a difference between the two techniques of VMD and CAF and that
therefore the HA must be accepted and H0 rejected.
Table 8.1: The Mann-Whitney U test of the five fabric samples visualised with VMD or CAF after half of the samples had been exposed to the different water conditions, while controls were left unexposed. Details include number of samples, mean rank, sum of ranks, Mann-Whitney U value and p- value.
Number of
samples
Mean
Rank
Sum of
Ranks
Mann-Whitney
U value p-value
Dew
VMD 150 185.22 27782.50 6042.000 0.000
CAF 150 115.78 17367.50
Moderate rain
VMD 150 190.95 28642.00 5183.000 0.000
CAF 150 110.05 16508.00
Heavy rain
VMD 150 190.08 28512.50 5312.500 0.000
CAF 150 110.92 16637.50
Each condition had the same number of VMD and CAF treated samples (150),
therefore a direct comparison could be carried out. In each case it was VMD that had
the higher mean ranks – 185.22 for dew, 190.95 for moderate rain and 190.08 for the
heavy rain, compared to CAF with 115.78 for dew, 110.05 for moderate rain and
110.92 for heavy rain. Therefore, the fact that the mean rank values and the sum of

215
ranks are so much higher for VMD compared to those observed for the CAF means that
it is the VMD technique that is more effective at allowing the enhancement of
fingermarks on the fabrics tested.
As the controls and the samples that have been treated with the various levels
of water have been combined for this test it is not possible to conclude which weather
condition has had the most effect on the method used to visualise the planted
fingermarks. Therefore, the next three tables of Kruskal-Wallis test results [Table 8.2 -
Table 8.4] have been separated out into the three different conditions, thus allowing the
effect on each weather condition to be determined separately on each fabric tested.
With dew [Table 8.2] the mean rank values show that in each case the controls
and those treated showed there is a definite order in which the fabrics show detail,
though the order changes depending on the visualisation technique and whether the
samples have been treated with water or not.
When considering the control samples that were visualised with VMD, the fabric
order determined by the mean rank values is nylon (51.67), white satin (46.20), nylon-
Lycra (39.83), linen (29.00) and then black satin (23.30). These results reinforce the
opinion that it is indeed the smoothness of the fabric surface and the tightness of its
weave that allows increased detail to be observed. When the fabrics tested in this
section are considered, the first three fabrics with the highest mean rank values
(nylon, white satin and nylon-Lycra) all have smooth surfaces and tight weave
structures. The next fabric, linen, is not as smooth and has a more open weave
structure. The only fabric that does not follow this pattern is black satin and even
though it is a smooth fabric and has a tight weave it had the lowest mean rank value.
This is therefore unexpected, however may be explained by the inexperience of the
researcher in using silver metal for VMD and that there is less contrast between the
dark colour of the fabric and the silver deposited during VMD.
A similar pattern can be seen with the dew treated samples that were visualised
with VMD with the highest to lowest mean rank values being nylon (48.27), white satin
(46.87), linen (33.33), nylon-Lycra (32.87) and black satin (28.87). Linen and nylon-
Lycra however have changed position in the order of detail visualised, though this
change could be explained by the addition of water to the samples prior to treatment
with VMD. This could either cause the loss of residues by dilution and absorption into
the fabric or evaporation of the water, therefore there being less for the VMD to
adhere to and visualise. This difference in the controls and water treated samples can
also be seen with the p-values of <0.001 for the controls and 0.005 for the treated

216
samples. These p-values also reinforce that the fabrics are different as both values
indicate that the HA needs to be accepted and H0 rejected.
Table 8.2: Kruskal-Wallis test of the five fabrics processed with VMD or CAF after half of the samples had been exposed to dew water conditions, while controls were left unexposed. Details include number of samples, mean rank, sum of ranks, Kruskal-Wallis value and p- value.
Number of
samples
Mean
Rank
Kruskal-
Wallis value
Degrees of
Freedom p-value
VMD Control
White satin 15 46.20
21.116 4 0.000
Black satin 15 23.30
Nylon 15 51.67
Nylon-Lycra 15 39.83
Linen 15 29.00
VMD Dew treated
White satin 15 46.87
15.067 4 0.005
Black satin 15 28.87
Nylon 15 48.27
Nylon-Lycra 15 32.87
Linen 15 33.33
CAF Control
White satin 15 32.30
51.263 4 0.000
Black satin 15 64.37
Nylon 15 46.33
Nylon-Lycra 15 23.50
Linen 15 23.50
CAF Dew treated
White satin 15 29.27
48.583 4 0.000
Black satin 15 63.17
Nylon 15 43.57
Nylon-Lycra 15 27.00
Linen 15 27.00
With the CAF visualised samples the mean rank values illustrate the expected
results if the fabric weave is considered – smoothest to roughest. Black satin (64.37
for control and 63.17 for treated); nylon (46.33 for control and 43.57 for treated);
white satin (32.30 for control and 29.27 for treated) with nylon-Lycra and linen (23.50
for control and 27.00 for treated) being joint last. This order is similar to that of the
217
VMD treated samples, with black satin being the only significant difference. This could
be explained by the fabric being black, the CA polymer yellow/white and there being
less background fluorescence, therefore the marks were easier to see. Thus, the data
illustrates that the fabrics were in fact different, which is reinforced by the p-values of
<0.001. Therefore the HA should once again be accepted and the H0 be rejected.
With the moderate rain results [Table 8.3] the control samples could be ranked
with their mean rank values illustrating the order of fabrics with the highest level of
detail: white satin (53.00), nylon (51.70), nylon-Lycra (37.17), linen (25.03) and black
satin (23.10). This is also the order of smoothness of the fabric surfaces, with the
exception of the black satin. This would be as expected if the hypothesis that the
smoother the fabric the more detail is visualised. The fact that less detail was
observed on the black fabric could, as suggested earlier, be due to the fabric and VMD
metal colour not allowing enough contrast for the detail to be observed. The order
with the treated samples was different: nylon (52.00), white satin (42.23), joint black
satin and nylon-Lycra (32.17) and linen (31.43). This change in order may be due to
the addition of water to the samples, in that white satin absorbs more water than the
nylon and therefore could have influenced the results obtained. The p-values illustrate
that the fabrics were different (p<0.001 for controls and 0.009 for treated), even with
two of the treated samples having the same mean rank (treated black satin and nylon-
Lycra, 32.17) the HA should be accepted and the H0 rejected.
The results for the control and treated CAF samples, though having different
mean rank values, follow the same order ranking: black satin (62.27 for the control
and 54.13 for the treated); nylon (51.20 for the control and 38.90 for the treated);
white satin (28.53 for the control and 33.97 for the treated) and, jointly, nylon-Lycra
and linen (24.00 for the control and 31.50 for the treated). The higher levels of detail
observed would be expected if the hypothesis of the smoothness of the fabric surface
and tightness of weave applied. Therefore the fabrics can be considered different and
this is reinforced by the p- values both being <0.001. Thus once again the HA should
be accepted and the H0 rejected.

218
Table 8.3: Kruskal Wallis test of the five fabrics processed with VMD or CAF after half of the samples had been exposed to moderate rain conditions, while controls were left unexposed. Details include number of samples, mean rank, sum of ranks, Kruskal-Wallis value and p-value.
Number of
samples
Mean
Rank
Kruskal-
Wallis value
Degrees of
Freedom p-value
VMD Control
White satin 15 53.00
28.945 4 0.000
Black satin 15 23.10
Nylon 15 51.70
Nylon-Lycra 15 37.17
Linen 15 25.03
VMD Moderate Rain Treated
White satin 15 42.23
13.447 4 0.009
Black satin 15 32.17
Nylon 15 52.00
Nylon-Lycra 15 32.17
Linen 15 31.43
CAF Control
White satin 15 28.53
53.702 4 0.000
Black satin 15 62.27
Nylon 15 51.20
Nylon-Lycra 15 24.00
Linen 15 24.00
CAF Moderate Rain Treated
White satin 15 33.97
26.510 4 0.000
Black satin 15 54.13
Nylon 15 38.90
Nylon-Lycra 15 31.50
Linen 15 31.50
The heavy rain results [Table 8.4 and 8.5] though not in the expected orders
do again show that all the fabrics are different with p- values of 0.000 and 0.004 for
the control and treated respectively. The mean rank values also allow the fabrics to be
ranked in order of the level of detail observed. The VMD control samples could be
ranked in order of most to least detail as white satin (48.40), linen (34.73), nylon-Lycra
(33.73), nylon (25.80) and black satin (20.33). While the treated samples can be
ranked nylon (48.17), white satin (47.20), linen (35.63), black satin (34.17) and nylon-

219
Lycra (24.83). While the order for the CAF treated samples is, for the controls, black
satin (63.20); nylon (49.57); white satin (27.33) with joint for nylon-Lycra and linen
(25.00). The treated samples had the black satin ranked first with a mean rank value
of 50.00 and all the other fabrics (white satin, nylon, nylon-Lycra and linen) with the
value of 35.00. The reduction in differences between the values for the treated
samples could be attributed to the water being added to the samples and therefore the
removal of residues, thus decreasing the residues remaining to be visualised.
However, this would not explain the difference in the values and order observed in the
VMD control samples. Therefore, this must be due to some other variable, such as the
donors and the level of residues on their hands at the time of deposition.
Again with both the VMD samples (controls and treated) and CAF samples
(controls and treated) the p-values were all <0.001, therefore as the p-value is <0.05
the HA should be accepted and the H0 rejected.
Table 8.4: Kruskal Wallis test of the five fabrics processed with VMD after half of the samples had been exposed to heavy rain conditions, while controls were left unexposed. Details include number of samples, mean rank, sum of ranks, Kruskal-Wallis value and p-value.
Number of
samples
Mean
Rank
Kruskal-
Wallis value
Degrees of
Freedom p-value
VMD Control
White satin 15 48.40
25.082 4 0.000
Black satin 15 20.33
Nylon 15 25.80
Nylon-Lycra 15 33.73
Linen 15 34.73
VMD Heavy Rain Treated
White satin 15 47.20
15.367 4 0.004
Black satin 15 34.17
Nylon 15 48.17
Nylon-Lycra 15 24.83
Linen 15 35.63

220
Table 8.5: Kruskal Wallis test of the five fabrics processed with CAF after half of the samples
had been exposed to heavy rain conditions, while controls were left unexposed. Details include number of samples, mean rank, sum of ranks, Kruskal-Wallis value and p-value.
Number of
samples
Mean
Rank
Kruskal-
Wallis value
Degrees of
Freedom p-value
CAF Control
White satin 15 27.23
54.607 4 0.000
Black satin 15 63.20
Nylon 15 49.57
Nylon-Lycra 15 25.00
Linen 15 25.00
CAF Heavy Rain Treated
White satin 15 35.00
25.714 4 0.000
Black satin 15 50.00
Nylon 15 35.00
Nylon-Lycra 15 35.00
Linen 15 35.00
Overall, with the various levels of water added to the samples, both the control
and treated samples have extremely low p-values – all the controls were 0.000, while
the VMD treated samples - dew (0.005), moderate rain (0.009), heavy rain (0.004)
were all higher. Therefore there is a definite difference between all the fabrics tested
when visualised by either VMD or CAF and thus the HA should be accepted in all cases.
8.6 Comparison of VMD and CAF
When comparing the two different techniques it appears that water has had a
similar effect on both, with a reduction in the number of positive samples and the level
of detail, though this is more dramatic with CAF. The data shows that there is quite a
difference between the VMD and CAF, however this is as expected, when the literature
indicates that VMD can visualise marks after the substrate has been subjected to
moisture, but CAF is not effective at visualising marks after similar treatment
(Yamashita and French 2011). The dew had a high level of positive marks for the VMD
(82 %) while the CAF samples only had 34 % positive marks. The difference with the
moderate rain samples is even higher – VMD had 79 % of positive marks, while the
CAF was only 27 %. With the heavy rain there was a difference of 53 % between the
VMD (74 %) and the CAF (21 %). The level of detail is also higher in the VMD
samples compared to the CAF samples – dew had 22 % of the samples showing ridge

221
detail, whereas CAF only had 11 %; moderate rain had 27 % for VMD and only 8 %
for CAF; finally, with heavy rain VMD had 23 % and CAF 6 %. All this illustrates that
VMD is indeed more effective at visualising fingermarks, grabs and marks on items that
have been wetted. Though the techniques have both been affected by the level of
water added to them there is also an effect from the donor and the fabric being tested
on the level of detail visualised.
There is a definite trend in donors with donor one being a medium donor in
most other studies and in this case, one was found to be the same; while donor two
had always been considered a poor donor, which was the same in this study; finally
donor three is a good donor in all trials. There were some exceptions to this however,
as donor one CAF, in the moderate rain, was only slightly better than donor two who
was considered a poorer donor. Therefore this illustrates that even though donors can
be given a general classification this is not always the case as there can be many
factors that influence the secretions produced by a person, such as their sex,
occupation, whether they have applied cosmetics or even ran their hands through their
hair (Yamashita and French 2011). All of these factors could result in the donor
leaving poorer or better quality latent fingermarks.
There was a difference in the order of the fabrics that allowed visualisation of
ridge detail, and this is reinforced by the statistical tests carried out and described in
section 8.5. The order for the VMD samples was nylon, white satin, nylon-Lycra, linen
and black satin, while that for the CAF samples was black satin, nylon, white satin, and
then nylon-Lycra and linen being tied for last place as neither visualised any detail or
marks. The order is similar and the difference in position of the black satin could be
attributed to there not being background fluorescence from the BY40 therefore more
detail could be seen, while with the VMD, the operator was unfamiliar with the use of
silver VMD therefore this may have affected the level of detail observed. When the
smoothness of the fabric surface is considered, it was nylon, nylon-Lycra, white and
black satin, linen. The order of the detail observed with both techniques seems to
follow the same order; the smoother the surface of the fabric the more detail
observed. The absorbency (most to least absorbent) is linen, nylon-Lycra, black satin,
white satin, nylon and appears to follow the opposite order. This makes sense as the
more water a fabric will absorb the less residues will remain on the surface as they will
most likely be absorbed into the fabric or washed off and not be available to the
visualisation technique.

222
Examining of the grades, in conjunction with the different weather treatments,
indicates that the level of detail has been affected by increasing amounts of water.
With VMD, the most grade 0 samples can be found in the heavy rain treatment (30
samples), followed by moderate rain (20 samples), then lastly dew (19 samples). This
would be expected if water is having a detrimental effect on visualisation. With grade
1, the opposite can be seen as dew has the highest number (51 samples), the
moderate rain (45 samples) and lastly heavy rain (40 samples), though again this
would be expected as more water would lead to less detail. Grade 2 does not really
follow the trend of more water less detail as moderate rain had the highest number of
samples (nine), followed by dew (five) and then heavy rain (four). Therefore, this
could be a result of donor effects – their ability to leave good detail or that their
residues may not have been at suitable levels to leave good detail. With grade 3
samples, as there were only two – one after the moderate rain and the other after
heavy rain, this shows water is having an impact of the quality of detail visualised.
With the CAF samples the expected trend is observed with an increase in negative
samples as the water levels increase - dew (52 samples), moderate rain (62 samples)
and heavy rain (69 samples). The number of positive samples decreases as the water
levels increase – for grade 1 dew had fifteen positive samples, moderate rain twelve
and heavy rain five. With grade 2, dew had six samples, moderate rain zero, and
heavy rain one, so a slight deviation from the expected. Finally, grade 3 samples only
had two positive samples – one for dew and one for moderate rain, which could be
expected, the more water added to the samples the less detail observed. Both
techniques are thus following the expected trends of more water leading to less detail
visualised.
8.7 Hydrophobicity and hydrophilicity of fabrics
As discussed in the introduction (Section 1.2.1 and 1.2.2), most fabrics absorb
moisture from their surroundings, but how much depends on the chemical and physical
properties of the fabric. Also, natural fibres tend to be more hydrophilic and have a
higher percentage regain, whereas manmade fibres are the opposite. Thus, it would
be expected that this would have an effect on how fingerprint residues would sit on
the fabric surface, how much would be available for fingerprint processing techniques,
and how much dye would be taken up during CAF processing. Therefore, a small
absorbency study (as described in section 2.14.2) was embarked upon to attempt, in a
simplistic manner, to determine whether the uptake of water by a selection of fabrics
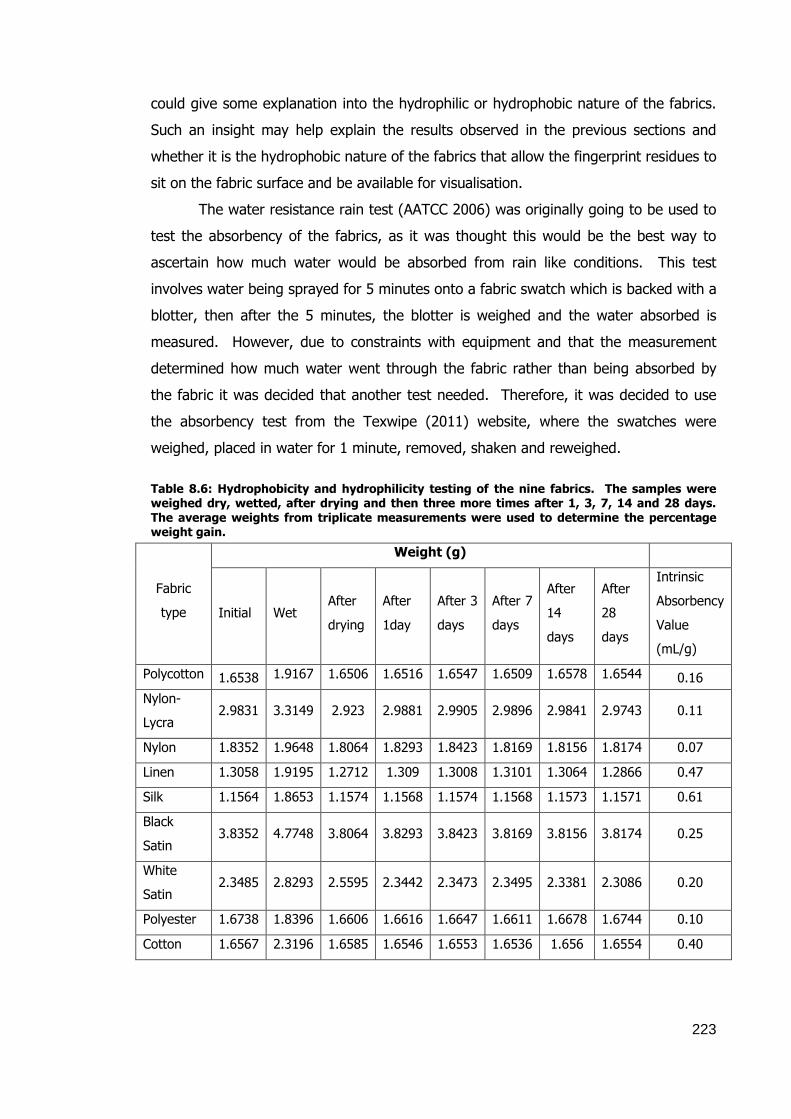
223
could give some explanation into the hydrophilic or hydrophobic nature of the fabrics.
Such an insight may help explain the results observed in the previous sections and
whether it is the hydrophobic nature of the fabrics that allow the fingerprint residues to
sit on the fabric surface and be available for visualisation.
The water resistance rain test (AATCC 2006) was originally going to be used to
test the absorbency of the fabrics, as it was thought this would be the best way to
ascertain how much water would be absorbed from rain like conditions. This test
involves water being sprayed for 5 minutes onto a fabric swatch which is backed with a
blotter, then after the 5 minutes, the blotter is weighed and the water absorbed is
measured. However, due to constraints with equipment and that the measurement
determined how much water went through the fabric rather than being absorbed by
the fabric it was decided that another test needed. Therefore, it was decided to use
the absorbency test from the Texwipe (2011) website, where the swatches were
weighed, placed in water for 1 minute, removed, shaken and reweighed.
Table 8.6: Hydrophobicity and hydrophilicity testing of the nine fabrics. The samples were weighed dry, wetted, after drying and then three more times after 1, 3, 7, 14 and 28 days. The average weights from triplicate measurements were used to determine the percentage weight gain.
Fabric
type
Weight (g)
Initial Wet After
drying
After
1day
After 3
days
After 7
days
After
14
days
After
28
days
Intrinsic
Absorbency
Value
(mL/g)
Polycotton 1.6538 1.9167 1.6506 1.6516 1.6547 1.6509 1.6578 1.6544 0.16
Nylon-
Lycra 2.9831 3.3149 2.923 2.9881 2.9905 2.9896 2.9841 2.9743 0.11
Nylon 1.8352 1.9648 1.8064 1.8293 1.8423 1.8169 1.8156 1.8174 0.07
Linen 1.3058 1.9195 1.2712 1.309 1.3008 1.3101 1.3064 1.2866 0.47
Silk 1.1564 1.8653 1.1574 1.1568 1.1574 1.1568 1.1573 1.1571 0.61
Black
Satin 3.8352 4.7748 3.8064 3.8293 3.8423 3.8169 3.8156 3.8174 0.25
White
Satin 2.3485 2.8293 2.5595 2.3442 2.3473 2.3495 2.3381 2.3086 0.20
Polyester 1.6738 1.8396 1.6606 1.6616 1.6647 1.6611 1.6678 1.6744 0.10
Cotton 1.6567 2.3196 1.6585 1.6546 1.6553 1.6536 1.656 1.6554 0.40

224
Overall, the order of absorbency determined (Table 8.6) by the fabric intrinsic
absorbency values was silk (0.61), linen (0.47), cotton (0.40), black satin (0.25), white
satin (0.20), polycotton (0.16), nylon-Lycra (0.11), polyester (0.10) and nylon (0.07).
This does seem, in part, to confirm the hypothesis that the natural fabrics are more
absorbent, or hydrophilic, than the manmade fabrics. The three pure natural fabrics,
silk, linen and cotton were the first, second and third most absorbent fabrics. A similar
test was carried out by Tri-Sis Inc. (no date) in which it was determined that natural
fabrics absorbed the most water – cotton (50 to 60 %), wool (40 %) and rayon as
much as 95 %. Thus, the results obtained in the current study are quite similar as the
intrinsic absorbency value, if converted to a percentage, would show that cotton
absorbed 40% of its dry weight. The mixed fabric, polycotton was at the lower end of
the absorbency spectrum and this could be due to the 40 % polyester component of
the fabric, which could be increasing the hydrophobicity. Therefore polycotton is more
absorbent than polyester by itself, but less absorbent than cotton alone. The three
fabrics with the lowest absorbency were nylon-Lycra, polyester and nylon, all of which
are manmade, therefore would be expected to be less absorbent and more
hydrophobic. The Tri-Sis Inc. (no date) states that polyester absorbed 3 to 5 % with
nylon absorbing 11 to 12 % but the results obtained in this study were slightly
different with nylon being 7 % and polyester 10 %. The results confirmed that there is
a reduced level of water absorption in these fabrics and lack of water uptake was most
likely due to surface coatings or treatments, as well as physical and chemical
properties of the fabrics.
All the fabrics adhered to the Home Office suggestion (Bowman 2005) of a
minimum of three threads per millimetre (mm) with silk having the highest thread
count of six, the satins, polyester and nylon-Lycra all had four and nylon, polycotton,
cotton and linen had three threads per mm. The more threads per mm in the fabric
would produce tighter weave, though this is not always the case, as weave also relates
to the size of the fibres themselves. Silk had the finest and highest number of threads
per mm with six, which led to the tightest weave, but the satins and nylon-Lycra had a
comparable tightness to their weave, but with less fibres. Nylon was the next tightest
weave fabric, though the three fibres per mm were quite large thus leading to a tighter
weave. Polyester had one more thread per mm (four), but it had a more open weave
when compared to nylon. The remaining fabrics all had three threads per mm, but
how they were woven together affected the tightness of the weave with polycotton
having the tightest weave, even though it comprised of threads differing in size.

225
Cotton had quite evenly sized threads, but they were larger and looser in how they
were woven together. The final, and most loosely and open woven fabric, was linen
which comprised of alternating thick and thin threads and many loose fibres.
The smoothness of the fabrics did not follow the same pattern as the tightness
of the weave and was, in order, nylon, nylon-Lycra, satin, silk, polycotton, polyester,
cotton and linen. Nylon was more open than nylon-Lycra but the fibres themselves
were smaller, while the nylon-Lycra weave was rougher or “lumpier” in appearance.
Satin had a more even surface with no loose fibres and silk had a “bumpy” surface,
though there were no loose fibres, whereas polycotton and polyester had a few loose
fibres on their surface. The number of loose fibres was higher with cotton and linen,
which, in turn increased the roughness of the surface. Therefore, there are several
aspects that need to be considered when determining the absorbency as well as how
hydrophobic or hydrophilic a fabric is and therefore the effect this could have on the
level of detail visualised. The tightness of weave, number of threads, composition of
the fabric, and therefore the effect these have together on ridge detail visualised.
Overall, it does appear that natural fibres absorb water more than manmade
fibres, thus it would be expected that the natural fabrics would therefore absorb more
of the fingerprint residues, as they are 95 % water (Bowman 2005; Girod, Ramotowski
and Weyermann 2012) and this would probably impact negatively on the level of detail
visualised. This does seem to be the case when the fingermark gradings of each
fabric, reported in the previous chapters is considered. It does indeed appear that the
majority of the natural fabrics did not show much or any fingermark detail, whereas
the manmade fabrics allowed high graded marks to be visualised. There were
however exceptions: in some instances silk had high gradings, whereas polyester had
low grading, therefore this demonstrates that it is not only the hydrophobicity, but the
fabric and even the donor that has an effect on the level of detail visualised.
8.8 Effect of washing on fabric surface texture
When considering the previous results it can be concluded that the structure
and properties of the fabrics are important with regard to the level of detail visualised.
This does not just apply to the chemical properties and their weave, but also if
coatings have been applied or surface damage due to washing. Therefore a mixture of
manmade and natural fabrics (cotton, linen, nylon-Lycra, polycotton, polyester, satin
and silk) were utilised in these studies to determine the effect, if any, of washing on

226
the fabric surfaces. Thus, all the fabrics were photographed using a x 200 Veho™
Discovery™ VMS-001 Universal serial bus (USB) microscope when they were new and
unwashed. How the unwashed fabrics appeared can be seen in the first column of
images in Figure 8.25, then all the fabrics were washed one time (second column), re-
photographed, washed another 4 times and re-photographed (third column), then
finally washed again until they had been washed a total of twenty times and re-
photographed once more (fourth column). Even after twenty washes, many of the
fabrics felt and appeared visually the same, with only cotton, linen, nylon and
polycotton appearing slightly different. However the washing did not appear to have
any effect on surface morphology of nylon-Lycra, polyester, satin or silk. Therefore,
the effect of surface defects, printed patterns and the actual wearing of the fabrics, as
well as potential wear and tear must have more effect than washing alone on the
surface structure of the fabric. This effect of washing was examined on a bigger scale
in a final year student project examining the effect of washing on the level of
fingermark detail visualised using CAF (Davidson 2013) – who, again, took
photographs from the initial clean, new, unwashed polycotton and satin fabrics and
then after every wash. However, this time the student was also looking at what effect
washing had on fingermark recovery. After the fabric had been washed a section was
cut off, natural fingermarks were planted in a depletion series and then processed
using CAF. Then the remaining fabric was washed again, and the process repeated
until all the fabric had been used. The overall results reinforced the findings of this
study and showed that there was little physical effect observable on the fabric surface
from the repeated washing but there did seem to be an influence on the level of detail
visualised. As the washes increased there was a decrease in the number of
fingermarks visualised and of these marks the level of ridge detail observed was
reduced (Davidson, K. 2013. Pers. comms, 9th May; Davidson 2013).
This could be due to coatings being removed from the fabric surface and
making it easier for the residues to be absorbed into the fabric and therefore
unavailable for interaction with the CAF. Another reason could have been the addition
of optical brighteners from the washing detergent or an improved uptake of the BY40
dye, both of which could have led to increased background fluorescence. This
hypothesis will require further testing. It could also mean that the surface morphology
was altered, but at a level that could be observed with the USB microscope or
photography indicating that it might be chemical rather than physical.

227
Unwashed One wash Five washes Twenty washes
Figure 8.25: Images taken with an x200 magnification USB microscope of the effect of washing on cotton (A), linen (B), nylon-Lycra (C), nylon (D), polycotton (E), polyester (F), satin (G) and silk (H). The first image is of the original unwashed fabric; second image after one wash; third after 5 washes and fourth after 20 washes.
A
B
H
C
D
E
F
G

228
“Wear and tear” or roughing up of a fabric’s surface could lead to a reduction in
detail. For example, a smooth fabric, such as satin, can become pilled, where small
balls from on the surface when different areas of the garment are rubbed together
when the item is worn. This could lead to a rough surface, which could then affect the
level of detail visualised on a fabric that would normally have allowed good detail to be
observed. A small trial on the effect that wear would have on to the fabrics and their
ability to allow the visualisation of fingermarks was also performed, though this “did
not produce conclusive results” (Davidson, K. 2013. Pers. comms, 9th May). Therefore,
more work needs to be performed on the effect of washing as well as “wear and tear”
on fabrics and their morphology to fully determine the effect on fingermark
visualisation and, therefore, operational use.
The majority of cases that would involve clothing being examined would be
assault cases where the most victims are aged between 16 and 24 (13.3 % men and
4.3 % women) (Hall and Innes 2011). However, if the type of assault is of a sexual
nature the victims tend to be women and the Office for National Statistics (2013)
reports that 3 % of women in England and Wales were the victims of sexual assault
during 2011, whereas the percentage for men was 0.3 %. Also, a Scottish
Government report (2011) states that these types of crimes occurred in many places,
from shops (6 %), the victim’s home (11 – 12 %), to their place of work (19 %),
however the majority (22 %) occurred when the individual was at a pub or nightclub.
Therefore, when considering sexual assaults on young women many could occur on
nights out, thus the effect of washing as well as wear and tear may be negligible, as
the majority of young women, tend to purchase a new outfit for the occasion.
8.8.1 Effect of water on the fabrics used in this study
Overall, there was a trend with the addition of water to the surface of the
fabrics in this study; the more water that was added the level of detail visualised with
both VMD and CAF was reduced. This reinforces the literature and experiences of
previous researchers as well as those who use the VMD and CAF techniques
operationally. It is generally acknowledged that VMD is considered to be a more
sensitive technique for the development of marks and marks on items that had been
subjected to adverse conditions, such as the item being wetted. Also, it has been
suggested that CAF is not a suitable technique to use on wetted items and that it
would not be expected to recover detail (Yamashita and French 2001). This is

229
confirmed in this study as VMD visualised more detail and detail of a higher quality
than CAF.
It was also seen that the fabrics behaved differently to the various amounts of
water added to their surface. For example, the water sat on the surface of nylon with
all the conditions, with only a small amount soaking in with the moderate rain
conditions though more with the heavy rain. Linen absorbed more water even with the
dew treatment as seen when viewed under a microscope. The water beads could
clearly be seen tangled in the fibres of the loose weave, and with the heavy rain the
water completely soaked into the fabric and the paper towel underneath it. Therefore,
the natural fabric, linen is more absorbent than the manmade nylon; this in turn was
not unexpected when Geijer (1979) states that linen absorbs water quite easily, while
nylon is quite hydrophobic (Hegde et al. 2004). Therefore this and the information
gleaned from the hydrophobicity and hydrophilicity study above show that the chemical
composition as well as the surface structure has a great effect on how the fabrics
behave when they interact with water.
The donor also has an effect on the level of detail visualised with both
techniques. A good donor on fabric will usually produce more detail than a medium or
poor donor with the detail being of better quality on fabrics that have a tighter
smoother weave.
The timeline should also be considered due to the impact of environmental,
physical and chemical effects of the composition and length of life of the fingermark.
As it ages the water is first to be lost and depending on how porous the substrate is
the water-soluble components soak into the substrate and are not available for certain
visualisation processes (Champod et al. 2004). Older marks will not be as easily
visualised with CAF as it is the water and salts that are needed for this process to
work, whereas VMD works best with more oily residues so this is one reason why VMD
can visualise older marks. However, during this study older marks have, unexpectedly,
been visualised at times when they were not expected. Therefore just because an
item is old does not mean there is no possibility of a mark being visualised.
When considering whether to process an item of clothing or textiles there are
several factors that need to be considered first: has the item been wetted at any time
and to what level; is the item a natural or manmade fabric; and how long has it been
between incident, collection and processing. This may help decide what technique is
going to be more useful and possibly more successful; however both techniques have

230
shown success in visualising marks and marks of varying levels of detail on many
different fabric types and of different ages and consequently both VMD and CAF should
be considered as possible techniques for obtaining fingermarks from clothing.

231
9. DEPLETION SERIES WITH COMPARATIVE VISUALISATION
TECHNIQUES
9.1 Aim
To determine the level of fingermark detail that can be visualised from a
depletion series with small particle reagent (SPR), ninhydrin, 1,8-diaza-9-fluorenone
(DFO) and fluorescent powder from three donors over a 1, 3, 7, 14 and 28 days
timeline.
9.2 Results and discussion
This section considers other commonly used fingerprinting techniques, such as
SPR, ninhydrin and DFO as well as the more novel technique of fluorescent powders.
SPR, which is generally used on non-porous substrate such as plastic bags and glass,
interacts with “fatty constituents” to form a dark black/grey mark. Both ninhydrin and
DFO react with the amino acids in the fingermarks with the former producing a purple
mark (Ruhemann’s purple), whereas the latter gives a mark that fluoresces under light
in the range of 470 – 578 nm, though it may also produce a pink/purple coloured
mark. Both techniques are generally used on porous substrates, such as paper
(Bowman 2005). Fluorescent powders adhere to the water in the fingerprint residues
but need to be viewed under UV or laser light and can be used on a variety of
substrates such as card, wood and metals (Yamashita and French 2011).
All the marks were directly compared to CAF by use of split depletion series
[Figure 9.1], thus allowing these techniques to be compared to a methodology that
had previously yielded fingermarks and ridge detail on fabrics. However, overall there
was little success with any of these techniques. As a starting point a shortened
timeline was used (days 1, 3, 7 and 28) and the number of donors was reduced to
three. Each technique (SPR, ninhydrin, DFO and fluorescent powders) were compared
to CAF by use of a split mark. Split marks were also used to compare the two different
types of DFO (the traditional method was compared to the dry method as detailed in
the 1995 paper by Bratton and Juhala) and three types of ninhydrin (traditional, using
an iron and no heat or humidity).

232
Figure 9.1: Example of fingermark placement for split depletion samples. The donor placed one finger at position 1, and then position 2, without adding any more residues, continuing until position 5 is reached. This would then be repeated for each column of marks, using a different finger each time, until all the positions were filled.
9.2.1 Day 1
SPR had only negative results for all donors and fabrics with the exception of
donor one on nylon, which had empty marks at the first three depletions so all were
graded as 1 (Home Office grading system) as none had any ridge detail. The CAF split
samples were also graded as 1, however all five planted marks were visible with
donors one and two. Donor one also had grade 1 marks in depletion positions 1 - 4 on
satin and there was a possible mark on polyester for donor three.
With ninhydrin, the fabrics themselves became coloured, ranging in a light pink
to a dark blue [Figure 9.2] and this may have been due to the presence of proteins in
the fabrics. There were not many marks, and those present, were at the start of the
depletion series. Donor one had marks on nylon at depletions one and two and on
polycotton at position one, thus grade 1 for all. With donor two, nylon showed faint
marks at depletions one to five, but no ridge detail, thus grade 1. These marks

233
corresponded again to the CAF marks i.e. positive depletions one – five for nylon donor
one and two, with depletions one – four donor one satin, while all others were
negative.
Dry DFO and fluorescent powders were negative for all donors and fabrics. The
corresponding CAF samples had limited visualisation also – only positive grade 1
samples for nylon (depletions one – five) for donors one and two.
Figure 9.2: Day 1 samples of (A) polycotton and (B) nylon Lycra illustrating the range of colour produced on the different fabrics used in study, after processing with ninhydrin.
9.2.2 Day 3
SPR was negative for all fabrics and donors except nylon which had positive
empty marks at depletions one – four, for donor one and three, with only a possible
mark at depletion three for donor two. There were positive marks for nylon with all
donors at depletions one – five with CAF. Ninhydrin and dry DFO samples all were
negative with only discolouration to the fabric surfaces. There were however positive
marks with the fluorescent powder – donor three had marks on nylon (depletions one
– five) and a possible mark on polycotton (depletion one). Donor one was even more
positive with ridged detail at depletion one and two (grade 4, Figure 9.3) as well as
depletion five (grade 3) on polycotton fabric. Again, all the corresponding CAF samples
only had positive, grade 1 marks for all the donors on the nylon marks (depletions one
– five).
A
B

234
Figure 9.3: Ridge detail at positions 1, 2 and 5 of donor one, day 3 polycotton depletion series. Visualised with fluorescent powder and photographed using a Quaser (white light setting).
9.2.3 Day 7
There were very few positive marks for SPR, ninhydrin or dry DFO. SPR was
completely negative for all donors and fabrics. With ninhydrin, there was staining and
some positive marks for donor one on nylon, polyester and polycotton, along with
donor three on polyester. Dry DFO had a possible mark for donor one on nylon-Lycra.
The fluorescent powders had some ridge detail and donor one was the most successful
with marks on four of the fabrics (nylon, silk, polycotton and satin). There was also
ridge detail on polycotton (grade 2, depletions one – five) and satin (grade 2 for
depletions one – three and grade 4 at depletion four). The CAF again only had positive
marks on the nylon swatches for all the donors, though none contained ridge detail.
9.2.4 Day 28
This was the least successful of all the days having no marks with ninhydrin or
dry DFO and only one empty mark for donor one on nylon. However, there was some
success with the fluorescent powder where donor one had marks on nylon (depletions
one – five) and ridge detail on polycotton (grade 2 for depletions one – three and
grade 1 for depletions four – five). Again the corresponding CAF samples only had
marks on the nylon samples and once more there was no ridge detail.
As ninhydrin can develop further with time all the samples, for all the timelines,
were stored and reviewed after one week and one month to see if extra detail or
Ruhemann’s purple had developed. However, though some of the samples appeared
to be more purple in colour no extra detail was observed.
1 5 2

235
9.3 Statistical analysis of SPR, ninhydrin, dry DFO and fluorescent powder
and their effectiveness in fingermark visualisation.
The Kruskal-Wallis test was used to determine the effectiveness of various
fingermark development techniques (SPR, ninhydrin, dry DFO and fluorescent
powders) in visualising fingermarks on five different fabrics (nylon, nylon-Lycra, silk,
polycotton and satin). The null hypothesis (H0) is no difference between the
visualisation techniques of SPR, ninhydrin, dry DFO or fluorescent powders, and the
alternative hypotheis (HA) is that there is a difference between the techniques.
The majority of the samples in this study were not positive and did not allow
the visualisation of marks or detail and this is reinforced by the results of the Kruskal-
Wallis test [Table 9.1]. Here it can be seen that all the p-values were equal to or
higher than 0.05, therefore in each case the H0 should be accepted and the HA rejected
meaning that there is not a difference between the different techniques used to
visualise the marks.
With nylon, there was some difference between the techniques used to
visualise marks as illustrated by the mean rank values for SPR and fluorescent powder
(28.50), ninhydrin (22.50) and dry DFO (18.50). Thus, it could be determined that of
the four techniques used, SPR and the fluorescent powders are more successful in
visualising marks, whereas the dry DFO is the least successful. The conclusion that the
techniques are all similar in their limited ability to visualise detail is reinforced by the p-
value of 0.050, and therefore that H0 should be accepted.
Considering fabrics, the values for the nylon-Lycra samples show there was no
difference between the techniques as they all had the same mean rank value of 24.50
and a p-value of 1.000 indicating this also, thus the H0 should once again be accepted.
However, polyester showed some detail with the ninhydrin (27.50), while all the other
techniques were the same (23.50), thus the p-value was significantly high at 0.105.
Silk had the same p-value of 0.105 but this time the fluorescent powder (27.50)
visualised the marks, while the other techniques all had a mean rank value of 23.50.
While polycotton had the same mean rank values for SPR and the dry DFO (22.00)
ninhydrin and the fluorescent powder were higher (27.75 and 27.25), but overall there
was little difference so the p-value of 0.106 meaning the H0 should be accepted. The
final fabric, satin, had the same mean rank value of 24.00 and a p-value of 0.392,
indicating that the techniques were not different in this instance and the H0 should be
accepted.

236
Table 9.1: The Kruskal-Wallis tests carried out on the six fabrics involved in the depletion series study of SPR, ninhydrin, dry DFO and fluorescent powder. Data shown includes the number of samples, mean rank, Kruskal-Wallis value, degrees of freedom and p- value.
Nylon Number of
samples
Mean
Rank
Kruskal-
Wallis
Value
Degrees of
Freedom p-value
SPR 12 28.50
7.833 3 0.050 Ninhydrin 12 22.50
Dry DFO 12 18.50
Fluorescent powder 12 28.50
Nylon-Lycra
SPR 12 24.50
0.000 3 1.000 Ninhydrin 12 24.50
Dry DFO 12 24.50
Fluorescent powder 12 24.50
Polyester
SPR 12 23.50
6.130 3 0.105 Ninhydrin 12 27.50
Dry DFO 12 23.50
Fluorescent powder 12 23.50
Silk
SPR 12 23.50
6.130 3 0.105 Ninhydrin 12 23.50
Dry DFO 12 23.50
Fluorescent powder 12 27.50
Polycotton
SPR 12 22.00
6.127 3 0.106 Ninhydrin 12 27.75
Dry DFO 12 22.00
Fluorescent powder 12 27.25
Satin
SPR 12 24.00
3.000 3 0.392 Ninhydrin 12 24.00
Dry DFO 12 24.00
Fluorescent powder 12 26.00

237
9.4 Conclusion
The majority of results were poor as illustrated by the Kruskal-Wallis test results
and that for all the techniques studied 78 % of the swatches were graded as 0, while
only 20 % were rated as 1, 1 % graded as 2, 0.2 % as 3 and 0.2 % as 4. A
comparison of the different types of DFO and ninhydrin was performed but the
visualisation of marks using these techniques was also unsuccessful showing that
neither technique is suitable for visualising marks on fabrics. Potentially the use of
fluorescent powder is worth investigating further, especially due its success on feathers
(McMorris, H. 2012 pers. comm., 12 April) which could be considered comparable to
fabrics. This, however, is an extremely messy process and probably not practical for
operational work.

238
10. COLD CASE STUDY
10.1 Aim
To use vacuum metal deposition (VMD) and cyanoacrylate fuming (CAF) to
determine the level of fingermark and palm ridge detail from fifteen donors that can be
visualised on cotton, nylon, polycotton and polyester samples aged over 2.5 years old.
10.2 Background
Many assault cases are reported relatively quickly after the event and as
commented, reported that “the majority of reports to the police were made within 24
hours” (Kelly, Lovett and Child 2005), while Feist et al. (2007) stated that about half of
the cases were reported on the same day and just under a third after over a week.
Some cases though quickly reported and brought to Police attention are not solved or
the investigation comes to a natural halt after all avenues of investigation are
exhausted. These result in “cold cases” where evidence is put into storage and the
case closed but the case can be reopened if new technologies are developed or new
evidence comes to light. With that in mind this mini study aimed to simulate a cold
case where evidence has either not been examined for fingermarks during the initial
investigation or where no marks were found using other techniques.
10.3 Results and discussion
Samples of cotton, nylon, polycotton and polyester ranging from 2.8 – 4.2
years old were processed using standard operating procedures (SOP) for VMD (gold +
zinc) and CAF. The samples to be processed using VMD or CAF were collected at the
same time and stored at room temperature in plastic wallets, therefore the fabric
samples are approximately the same age for VMD and CAF processing.
Cotton [Figure 10.1, Table 10.1] did not allow the visualisation of any marks
using CAF and only 1 for VMD. The only positive result (9 %) for the VMD was from
donor twenty (classed as a good donor) and was only a single fingermark impression.
With the VMD cotton samples there were also several with possible target areas –
donors two, six, seven, nine and ten, but all were empty marks and none of them
contained any ridge detail. These results were not unexpected when comparing to
results from previous studies on younger marks in which few cotton samples allowed
the visualisation of areas of contact let alone ridge detail. It was hypothesised that the

239
surface of the cotton allows the residues to evaporate or soak into the fabric surface;
therefore are not available for either the VMD metals or cyanoacrylate (CA) during
fuming to visualise any marks.
Table 10.1: VMD and CAF grading for donors 1, 2, 5-12, 15, 16 and 20 on cotton, nylon, polycotton and polyester fabrics. Grey squares indicate where a sample was not collected.
Cotton Nylon Polycotton Polyester
Donor VMD CAF VMD CAF VMD CAF VMD CAF
1 0 0 0 1 1 0 2 0
2 0 0 2 1 1 0 2 0
5 0 1 0 0 1 0
6 0 0 1 1 0 0 0 0
7 0 0 0 0 0 0 0 0
8 0 0 1 0 0 0 0 0
9 0 0 0 1 0 0
10 0 0 1 1 0 0 1 0
11 0 0 2 1 0 0
12 0 0 0 0 0 0
15 0 1
16 0 0 1 1 0 0 0 0
20 1 0 1 1 0 0 0 0
Polycotton [Figure 10.1] did not allow visualisation of the CAF 2.84 year old
samples and only two grade 1 marks on the VMD 2.83 year old samples in which both
showed hand grabs with donor one being more obvious than donor two. Therefore
these marks were only indications of where the fabric had been touched and could not
be used to identify the donors due to lack of ridge detail. Of the positive samples the
donors were classed as good and good to medium from past studies. In past studies,
polycotton, like cotton, did not allow much visualisation of ridge detail, palmar flexion
creases or grab marks, therefore to see marks on samples of such an age there would
be an expectation that they would be from good donor donations.

240
Figure 10.1: Combined grading for all fabric types (cotton, nylon, polycotton and polyester) of “Cold case” samples visualised with VMD and CAF. Samples range in age from 2.8 to 4.2 years old.
Polyester was negative for all CAF samples. VMD did however have more
positive polyester samples (five) compared to the VMD polycotton samples (only two
positive samples). Polyester had grade 2 for donors one and two, with grade 1 for
donors five, ten and twenty. Additionally polyester had two other samples that had
possible target areas (donor six and sixteen). The positive samples were from donors
classed as good to medium, with the exception of donor ten who was classed as poor.
The marks graded as 1 visualised on polyester were again not useful for identification,
however could be targeted for DNA. The marks graded as 2 could possibly aid in
identification due to the palmar flexion creases that have been visualised. Thus,
overall, the combination of visualised marks and targeting for DNA could help in the
identification of the person that has touched this fabric.
Nylon had the most positive samples for both VMD (7/13; 54 %) and CAF
(10/13; 77 %) and even those classed as negative had possible target areas, raising
the percentages to 70 % for VMD and 85 % for CAF. The visualised marks ranged
from grabs with palmar flexion creases to possible fingermarks which may aid in direct
identification or via DNA swabbing.
What comparing the techniques to each other [Figure 10.2] VMD seems to be
more effective than CAF with 15/45 samples having positive marks and a further 8 of
possible marks compared to CAF with 10/45 positive marks and 1 possible mark. As
already discussed the majority of marks were empty grade 1 marks with no ridge
detail. It was the VMD samples that had all of the highest grades of 2, all with palmar

241
flexion creases (2 on polyester and 2 on nylon). Thus, this detail combined with the
number of positive marks visualised with VMD (15 compared to 10 CAF samples)
reinforces the opinion that VMD is more effective than CAF in visualising detail.
However it must be said that the 10 positive marks for CAF were all on the same fabric
(nylon), so CAF performed better on this fabric than VMD. VMD had three less
samples than CAF with 7 positive marks, though two of these were graded as 2,
whereas all the CAF samples were 1. Therefore, even though CAF visualised more
positive samples these marks did not contain much detail, if any, and as VMD had
higher values it can be considered to be more effective overall.
Figure 10.2: Number of VMD and CAF visualised “Cold case” samples displaying positive and possible marks visualised on all fabrics (cotton, polycotton, polyester and nylon).
Though not all of these cold case samples exhibited as many marks as younger
samples (maximum age of 28 days in all other studies) with only 23 out of 90 samples
(26 %) showing grades above 0, these results do follow the trends of previous studies.
Rougher fabrics, such as cotton, allowed visualisation of fewer marks while smoother
tighter weave fabrics, such as nylon allowed more marks and more ridge detail to be
observed. Thus, evidence that was not investigated for fingermarks at the time of
initial investigation or evidence from old unsolved cases could be examined later with
the possibility of visualisation. This may not lead to identification through ridge detail
but it may help investigator target areas to swab for DNA or allow the sequence of
events to be determined or confirmed.

242
10.4 Statistical analysis of VMD and CAF visualisation of fingermark
visualisation on fabric samples where the samples are between 2.8 and 4.5
years old.
Table 10.2: Mann-Whitney U test for the four fabric samples aged between 2.8 and 4.2 years old with planted grab marks processed with either VMD or CAF. Details include number of samples, mean rank, sum of ranks, Mann-Whitney U value and p-value.
Number of
samples
Mean
Rank
Sum of
Ranks
Mann-Whitney
U value p-value
All Fabrics
VMD 44 48.36 2128.00 798.000 0.064
CAF 44 40.64 1788.00
Cotton
VMD 11 12.00 132.00 55.000 0.317
CAF 11 11.00 121.00
Polycotton
VMD 11 12.50 137.50 49.500 0.147
CAF 11 10.50 115.00
Polyester
VMD 11 14.00 154.00 33.000 0.014
CAF 11 9.00 99.00
Nylon
VMD 11 11.73 129.00 58.000 0.851
CAF 11 11.27 124.00
The Mann-Whitney U test [Table 10.2] illustrates which technique – VMD or
CAF is more suitable and effective at visualising fingermarks on the fabrics (cotton,
polycotton, polyester and nylon) over 2 years old. The null hypothesis (H0) is therefore
no difference between the VMD or CAF visualisation techniques, and the alternative
hypotheis (HA) is that there is a difference between the techniques.
With all the fabrics combined VMD had the higher mean rank (48.36) and sum
of ranks (2128.00) compared to CAF which had a mean rank of 40.64 and sum of
ranks of 1788.00. Therefore, overall VMD is the more suitable and effective technique
than CAF for the visualisation of fingermarks. The overall p-value was 0.064, which
means there is a significant difference and that the H0 should accepted and the HA
rejected.

243
When looking at each fabric separately it can be seen that VMD was the
technique of choice for each fabric in the study, though with some fabrics the
difference is not as significant. Cotton showed a mean rank of 12.00 and sum of ranks
of 132.00 with VMD, whereas the CAF values were lower with a mean rank of 11.00
and a sum of ranks of 121.00. The p-value with cotton was 0.317, which means there
is a not a significant difference and the H0 should be accepted and the HA rejected.
Polycotton showed similar values of 12.50 for the mean rank, 137.50 for the sum of
ranks with VMD, while with CAF the mean rank value was 10.50 and the sum of means
was 115.00. These values led to the p-value of 0.147, thus the H0 should again be
accepted and the HA rejected. These fabrics did not allow much detail from either
technique and in most cases, it was just marks indicating the fabric had been touched
and therefore this would explain why there is not as big a difference in the values from
the Mann-Whitney U tests. Polyester showed a bigger difference between the VMD
and CAF values, with the mean rank values of 14.00 for VMD and 9.00 for CAF samples
as well as sum of ranks of 154.00 (VMD) and 99.00 (CAF). The overall p-value was
0.014, thus this time the HA should be accepted indicating that there is a difference
between the two techniques. The final fabric tested was nylon, and these samples
resulted in mean rank values of 11.73 for the VMD processed samples and 11.27 for
the CAF treated samples. The sum of ranks means were also extremely similar with
129.00 for VMD and 124.00 for CAF. These values all resulted in a p-value of 0.851,
which is significantly high and therefore would lead to the H0 being accepted.
Therefore, in each case the Mann-Whitney U values illustrate that the VMD technique
is the one that is most effective at visualising marks on these fabrics. However, three
out of the four fabrics (nylon, cotton and polycotton) had significance values that are
quite high indicating that there is not a significant difference between how much detail
was visualised using the two techniques.
To reinforce the information determined by the Mann-Whitney U test and to
determine which fabric visualised the most detail, a Kruskal-Wallis test [Table 10.3]
was also carried out. In this case the H0 is that there is no difference between the
fabrics, and the HA is that there is a difference between the fabrics. The results for
VMD showed that there was indeed a difference between the four fabrics as the p-
value was 0.023 which means there is a significant difference between the fabrics
tested and therefore the HA should be accepted and the H0 rejected. The fabrics could
also be ranked in order of the detail visualised. Nylon had the highest rank number
(29.09), followed by polyester (25.45), polycotton (18.64) and cotton (16.82) with the

244
lowest number. With CAF, there was only one fabric that had a value different from
the other – nylon had a mean rank of 34.50, whereas all the other fabrics (cotton,
polyester and polycotton) had the mean rank of 18.50. Therefore nylon was the only
fabric to show any detail, which is reinforced by the p-value of <0.001, therefore, here
the H0 should be rejected and the HA accepted, as there is a difference between nylon
and the rest of the fabrics.
Table 10.3: Kruskal-Wallis test of the four fabrics aged 2.8 to 4.2 years with planted latent grabs which were visualised with either VMD or CAF. The table includes details of sample number, mean rank, Kruskal-Wallis value, degrees of freedom and asymptotic significance value.
Number of
samples
Mean
Rank
Kruskal-Wallis
value p-value
VMD
Cotton 11 16.82
9.496 0.023 Polycotton 11 18.64
Polyester 11 25.45
Nylon 11 29.09
CAF
Cotton 11 18.50
28.667 0.000 Polycotton 11 18.50
Polyester 11 18.50
Nylon 11 34.50
Overall, with the information gleaned from the other studies reported in this
thesis, the order determined here with the VMD and, in part by the CAF, was not
unexpected as this has been found in earlier work reported in this thesis and follows
the hypothesis that more detail is visualised on smoother tighter weave fabrics. It was
also determined, in the other studies that VMD was more effective than CAF in
visualising finger ridge detail and marks, which has also been confirmed here.
Therefore, both the Kruskal-Wallis and Mann-Whitney U tests, confirm the expected
results that VMD visualises more detail then CAF and, of the four fabrics tested in this
cold case section, nylon allows the visualisation of the most detail.
245
11. COLLABORATIVE WORK
11.1 Optimising touch deoxyribonucleic acid (tDNA) recovery and analysis
from fabrics and clothing
11.1.1 Aim
To determine whether VMD has an effect on the recovery of tDNA from fabric.
11.1.2 Background
Touch deoxyribonucleic acid (tDNA) can be found when a person touches or
picks up an item and even though approximately 400,000 epithelial cells shed per day
by humans are keratinised thus do not contain a nuclei they do contain fragmented
DNA. Thus this, along with sweat containing free nucleic acid, contributes to tDNA
being a useful source of DNA profiles (Ryan 2012). Many studies have been carried
out, dating as far back as Pesaresi et al. (2003), to determine if DNA can be
successfully collected from items used in crimes. Also, more recently, the amount of
DNA that can be collected from fabric, glass and wood items, which had been held for
60 seconds (Daly, Murphy and McDermott 2012) as well as cotton and plastic items
which donors rubbed on their hands for 15 seconds (Goray et al. 2010) has been
reported. Both of these studies showed that small quantities of DNA (1.23 ng for the
fabric in the Daly, Murphy and McDermott (2012) study and 11.68 ng for the Goray
(2010) study could be recovered from these short contacts. These are extremely small
quantities, however with the use of the polymerase chain reaction (PCR) these small
quantities can be replicated and thus the possibility of a profile being obtained
increased to 23 % of the time in the case of the Daly, Murphy and McDermott (2012)
study.
The amount of DNA that may be recovered is dependent on several factors,
such as the type of contact; the substrate contacted as well as the person themselves.
Goray et al. (2010) showed that increased pressure and friction led to an increase in
transfer of DNA, so if increased friction increases transfer it is only logical that a
rougher substrate will also lead to increased DNA retention. The individual involved in
the contact also impacts on the amount of transfer – washing reduces DNA on an
individual’s hands; Wickenheiser (1999) noted that individuals who touch their faces
and hair, thus load their hands with extra DNA. While the amount a person sweats can
also increase the available DNA – Wickenheiser (1999) suggested it is the sweat

246
moving through the pores, thus picking up cells and therefore DNA on the way or that
the sweat contains cell-free nucleic acids and epithelial cells, both of which contain
DNA (Quinones and Daniel 2012). How long this DNA stays on the substrates has only
been studied to a small extent. Raymond et al. (2009) found that after 2 weeks there
was a significant reduction of recoverable DNA on gloss painted window sills and vinyl
surfaces, however when testing old case samples they found that DNA was recovered
from a laptop 62 days after the crime and 55 days from a bag involved in a drugs case.
More interestingly for this thesis, is the work carried out by Linacre et al. in 2010
where cotton, nylon and polyester were rubbed by donors between their thumb and
forefinger for 5 seconds. The samples were then placed on a sunlit windowsill after
which direct amplification was carried out up to 36 days later and full, as well as “near
complete profiles” were obtained.
Therefore, to determine the best operational parameters, fabric samples were
treated with vacuum metal deposition (VMD) to allow the area grabbed by an
individual to be visualised and targeted for DNA, which could then be extracted and
analysed. During an assault, which is what the deposition of the grab marks is
simulating, there will be interaction between the assailant and victim in the form of
hitting, pushing, grabbing and so on, which in turn will result in an exchange of DNA as
well as fingermarks and hand marks being left. However, the marks left on the
individual and their clothing, unless blood marks, will be latent marks so need to be
visualised and then the marks may aid in the determination of the sequence of events
and an identification, as well as showing where the article should be taped or swabbed
for tDNA.
Many techniques can be used to visualise latent fingermarks, such as
fingerprint powders, VMD, ninhydrin, 1, 8-diaza-9-fluorenone (DFO) and cyanoacrylate
fuming (CAF) with basic yellow 40 (BY40) and many studies have been carried out as
to whether there is an impact on DNA recovery when performing these techniques
prior to DNA collection.
Stein, Kyeck and Henssge (1996) used blood and saliva stains on various
substrates and visualisation techniques to determine their effect on the DNA recovered.
They studied the use of: CAF on razor blades and plastic foils; carbon fingerprint
powder on glass slides; gentian violet on the sticky side of adhesive tape; and
ninhydrin on paper. They found that the chemicals used in the visualisation processes
did not have a detrimental effect on the DNA extraction, quality, and typing, therefore
stated that fingerprinting could be carried out before DNA collection without damaging

247
the DNA. Zamir, Springer and Glattstein (2000) employed adhesive tape to investigate
the recovery of DNA from fingermarks visualised using the techniques CAF/BY40 and
crystal violet staining. Though there were a reduced number of loci obtained, profiles
were obtained from all but one of the donors; again illustrating that fingermark
enhancement could be carried out prior to DNA collection. A more recent report by
Bhoelai et al. (2011) utilising paper and plastics found that VMD and CAF still allowed
successful short tandem repeat (STR) profiling afterward, however BY40 and other
techniques that involved dyeing via washing reduced DNA recovery.
DFO and ninhydrin are also popular fingerprinting techniques and are generally
used on porous substrates such as paper. Zamir, Oz and Geller (2000) investigated
DFO, while Schulz et al. (2004) studied ninhydrin and Sewell et al. (2008) investigated
both techniques. They all found that DNA could successfully be collected from all the
paper-based substrates examined. Zamir, Oz and Geller (2000, p. 446) noted that
while DFO was considered to “be a destructive reagent in DNA profiling” they were still
able to obtain DNA profiles by using STR analysis. Schulz et al. (2004) used wallpaper
from a criminal case and thought the DNA recovered turned out to be from the
mother’s partner, as well as another individual, possibly a friend and not the assailant.
Although, this did not help in the case itself it demonstrated that ninhydrin did not
interfere with DNA recovery. The same could be seen in the Sewell et al. (2008)
study, where they found that the available DNA was decreased due to the paper type,
especially the office paper and card and not due to the fingerprinting techniques.
Schulz et al. (2004) found that amplification was not compromised to a great level,
therefore profiles were obtained and Bhoelai (2011) found the same, but that ninhydrin
and DFO may cause DNA contamination.
von Wurmb, Meissner and Wegener (2001) and Bille et al. (2009) investigated
the use of CAF on glass slides and pipe bombs respectively. Though von Wurmb,
Meissner and Wegener (2001) were testing saliva and not fingermarks it is the effect of
CAF on DNA recovery that is of interest and here they found that both extraction
methods (Chelex method and an Invisorb Forensic kit) allowed extraction and
therefore amplification and DNA profiles. They did find however, that the Chelex CAF
treated samples were sometimes 60 % lower than the controls or even did not allow
complete amplification. On the other hand, the Invisorb method, though more time
consuming, produced a more effective amplification. They also stated that there was
an added benefit to using CAF in that the saliva stains were more visible and fixed into
position, thus easier to target for extraction. The Bille, Cromartie and Farr (2009)

248
study measured amounts of DNA, in the form of a cell suspension, added to areas on
pipe bombs, which were then deflagrated, the pieces collected, CAF performed and the
visualised areas swabbed. There was a significant loss of DNA from what was planted,
up to 90 % after a 3 month delay between blast and collection, but they decided that
CAF did not have “a measurable effect” on DNA being collected and processed.
Shalhoub et al. (2008) reported on the use of DNA collection after CAF processing of
fingermarks that had been deposited on several substrates such as a drinks can, plastic
bottle, waxed paper cup, glass light bulb, £2 coin and plastic mobile phone case.
IsomarkTM, a casting material, was then coated over the marks, left for 24 hours,
recovered then both the cast material and the substrate were treated with CAF, before
being swabbed for DNA. Overall, the CAF made the marks easier to see on the
IsomarkTM but there was little difference between the quality of marks visualised with
the casting material and on the surface of the coin, bottle, mobile case or cup,
however the casting material was found to have poor and unclear detail on the cup
and mobile case. Thus, IsomarkTM was more successful at recovering fingermark detail
from non-porous substrates and that more DNA was recovered from the non-porous
smooth substrates, such as the aluminium can. Approximately 42 % of the substrates
tested gave enough DNA to be profiled and 82 % of these gave full profiles.
Less work seems to have been carried on as to the effect of DNA recovery after
metal deposition to visualise fingermarks. The paper by Lowe et al. (2003) and oral
presentation by Murray et al. (no date) based on the same work examined several
enhancement techniques and found that DNA profiles could be obtained between 33 %
and 100 % of the time, depending on the technique and when the DNA was collected.
In the case of metal deposition, 100 % donor profile was recovered from a freshly
enhanced mark compared to 0 % from one that had been left for 100 days. They
found that more DNA was recovered from marks on non-porous substrates and
generally more DNA was collected from fresher marks, with the exception of vacuum
CAF (a technique used out with the UK) which actually increased from 49 % from the
freshly enhanced mark to 86 % on the 100 day old enhanced mark.
While all these studies show there was some effect on the amount, they all
allowed DNA to be recovered and profiles obtained and in some cases the visualisation
technique “fixed” the DNA in place and made it more obvious to find and thus collect.
Therefore, the current study carried out in conjunction with Ignacio Quinones Garcia
aimed to determine what effect, if any, that gold + zinc VMD had on whether it was
possible to recover sufficient DNA from finger marks on fabrics to produce a profile.
249
11.1.3 tDNA recovery from fabrics
The identification of an assailant in assault cases comes from the testimonies of
the victims and eyewitnesses as well as other evidence, such as fingermarks and tDNA.
During an assault the individuals and their clothing will be pulled, grabbed and
damaged, so there is most likely a transfer of DNA from one individual to the other and
their clothing. In order to simulate this scenario, fabric samples and items of clothing
were grabbed and then processed with VMD to visualise marks and DNA collected.
The fabrics, studied in this section, were all in common use for modern day clothing,
and included: 100 % nylon swatches, 100 % cotton T-shirts and a 100 % polyester
chemise, which might be seen in assault cases, and, hence, in forensic laboratories.
Generally, to collect DNA from clothing the item is taped with adhesive tape
over the areas that are thought to have been touched, until the tape has reduced in
tackiness due to fibres and cellular material coating its surface. The tape may then be
swabbed with xylene to increase extraction efficiency. However, due to the loss of cell
free nucleic acids by the possibility of them being soaked into the fabrics (Linacre
2010) direct amplification was also carried out in an attempt to collect as much
material as possible.
Therefore, this study will aim to determine what effect VMD has on the
recovery of tDNA from fabric and clothing collected during simulated violent crimes, as
well as which method of DNA collection is best to recover the highest quantity of tDNA.
11.1.4 Effect of VMD on tDNA recovery and profiling on nylon samples
Day 6 nylon samples from nine of the donors (two, five, six, nine, eleven,
thirteen, fifteen, sixteen and twenty) used in the study were sent for DNA analysis
(Quinones Garcia, I. 2011. pers. comm., 11 May; Quinones Garcia 2011), along with
untreated control swatches and DNA buccal swabs. These swatches contained marks
[Table 11.1 and Figure 11.1], though some in the case of donor two and five were
good, none were excellent, therefore less likely to lead to an identification from ridge
detail. However, even though creases are sometimes observed on fabric and clothing
from grabs after VMD it is more obvious where the fabric has been touched, thus the
collection of DNA should be easier.
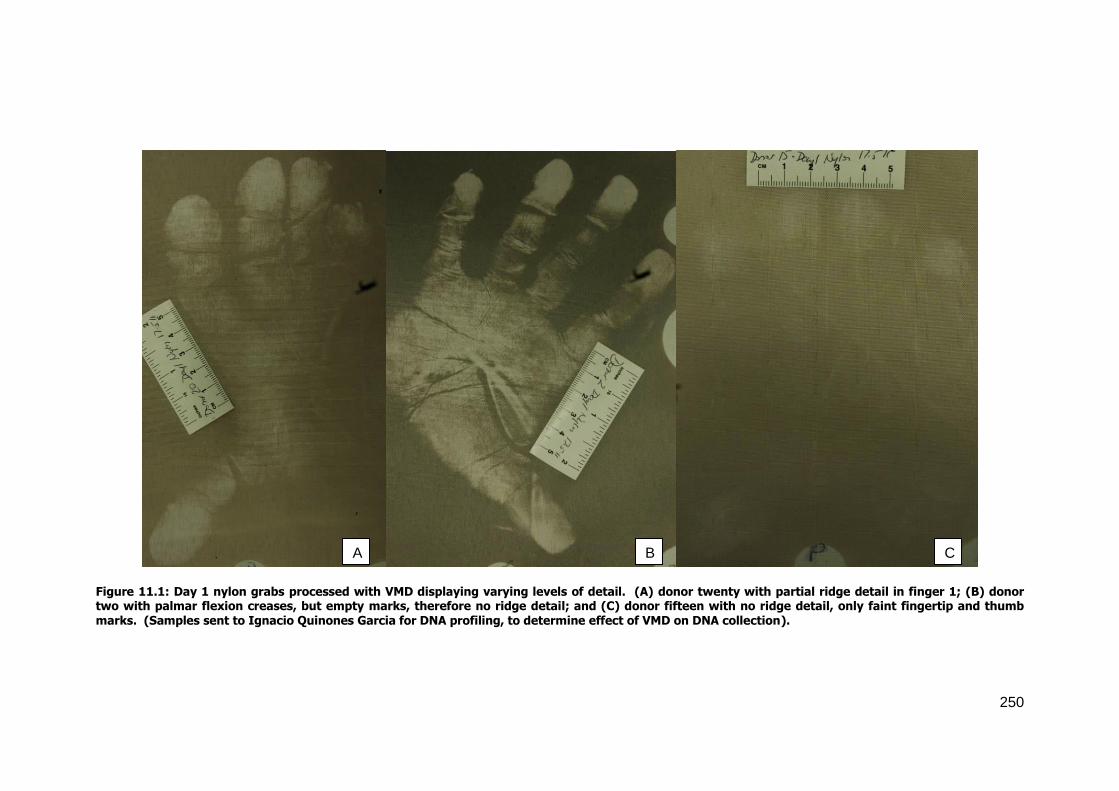
250
Figure 11.1: Day 1 nylon grabs processed with VMD displaying varying levels of detail. (A) donor twenty with partial ridge detail in finger 1; (B) donor two with palmar flexion creases, but empty marks, therefore no ridge detail; and (C) donor fifteen with no ridge detail, only faint fingertip and thumb
marks. (Samples sent to Ignacio Quinones Garcia for DNA profiling, to determine effect of VMD on DNA collection).
A C B

251
Table 11.1: Ridge detail (grades and descriptions) visualised with VMD on nylon samples for
donors 2, 5, 6, 9, 11, 13, 15, 16 and 20. Samples then sent to Ignacio Quinones Garcia for DNA profiling.
Donor Ridge grade Detail description
2 Fair (2) Grab – palm lines, empty marks
5 Good (3) Grab – some palm lines (40 %) and ridge detail on finger 3 (other
marks dark)
6 Fair (2) Grab – very little palm, faint ridge detail on finger 2
9 Empty (1) Grab – not much palm or fingers 3 and 4
11 Fair (2) Target area - palm lines and empty marks
13 Empty (1) Finger impressions and small area of palm
15 Fair (2) Partial grab – thumb and fingers 1 (including ridge detail), 2 and tip
of 4
16 Fair (2) Grab – light and dark areas, palm lines (50 %)
20 Empty (1) Thumb and fingertip impressions
To collect the DNA, sections were cut from the grab marks visualised by the
VMD process. The VMD treated untouched controls and the untreated samples both
had 12 x 8 cm sections cut from their centres, as it was expected that the donor would
have touched this area. These were then cut into 2 cm2 sections and dried blood spot
protocol extraction carried out with a QIAgen QIAamp® DNA Mini extraction kit.
Table 11.2: NGM chemistry-processed DNA profile results of VMD treated grabs on nylon swatches and untreated nylon swatches containing grabs.
Donor VMD Treated Samples Untreated Samples
Alleles Dropin Alleles Dropin
2 31 11 32 11
27 2 31 12
5 28 10 21 10
24 6 22 7
6 32 7 25 9
12 2 21 20
9 14 9 4 0
0 0 14 8
11 29 7 22 15
32 0 31 15
13 32 13 20 9
28 11 11 11
15 18 20 19 19
12 2 30 14
16 32 1 32 1
31 1 30 12
20 32 5 32 12
12 3 31 13
Average 25 7 23 11

252
From Table 11.2 and the data in appendix 16.1 [Table 16.1 – 16.9] it can be
seen that the treated samples produced an average of 25 true alleles (full profile 78 %
of the time) whereas with the untreated samples an average of 23 true alleles were
obtained (full profiles 72 % of the time). Thus, there appears to be no interference
from the VMD in the polymerase chain reaction (PCR) process and that the VMD
actually aided in the process by visualising where to collect the DNA. Therefore, it
could be considered that there was a correlation between how well the mark was
developed and quantity of DNA – the higher the detail visualised the more DNA was
collected, thus a higher chance of a profile.
11.1.5 Effect of VMD on tDNA recovery and profiling on items of clothing
To make the study more realistic and relevant to operational cases, 100 %
cotton T-shirts and 100 % polyester chemises were examined. The items were
grabbed by the donors (five, thirteen and twenty) to simulate an attack, enhanced with
VMD [Figure 11.2] and then taped twice. The DNA was then extracted from the tape
using a QIAGen Mini spin column and 50 µL elution recovered.
After VMD the T-shirts and chemise showed few marks and no ridge detail
[Figure 11.2] – though on the T-shirts: donor five had a faint grab with outlines of the
fingers, thumb with some of the palm; donor thirteen had a very faint grab; finally,
donor twenty had no palm, only finger and thumb tip outlines [Figure 11.2].
Table 11.3: Results detailing amount (ng) of DNA collected and number alleles amplified using SGM Plus and NGM chemistries from samples taken from VMD-processed satin polyester chemises and cotton T-shirts.
DNA
Collection Method
Donor DNA
collected (ng)
Number of Alleles Amplified
SGM Plus NGM
Polyester Chemise
Taping 5 21.5 22 32
13 4.5 18 32
20 8 22 22
High
Volume
Extraction
5 0 0 0
13 0 0 0
20 0 0 0
Cotton T-shirts
Taping 5 0 0 0
13 1 0 0
20 1 1 4
High Volume
Extraction
5 0 0 0
13 0.25 0 0
20 0.1 0 0

253
Figure 11.2: VMD-processed samples of clothing displaying faint grab marks from donor twenty. (A) 100 % cotton T-shirts and (B) 100 % satin polyester chemise. Samples sent to Ignacio Quinones Garcia for DNA profiling, to determine effect of VMD on DNA collection.
A B
255
Operationally the T-shirt was more difficult to attach to the VMD cradle and had
to be folded to fit, therefore making it thicker than the previously used samples.
Compared to the swatch samples it also took much longer (approximately half an hour)
to evacuate the chamber in the presence of the T-shirts and the vacuum fluctuated
most likely due to the size of the sample and heavier T-shirt cotton that was used.
This increased time to pump down (up to two hours) agrees with the work of Collins,
Cole and Stroud (1973) during their Atomic Weapons Research Establishment (AWRE)
trials using worn items of clothing. The lack of ridge detail, but definite target areas
obtained on the T-shirts in the current work was similar to that found on cotton
sheeting or shirt material in the Collins, Cole and Stroud (1973) study. With the
polyester chemises donor five only left a faint grab, however this time there was also
some palmar flexion creases (approximately 20 %). There may have been more detail
visualised had the article been completely flush to the cradle, as this may have
effected metal deposition, however this illustrates the possible problems that may
occur with processing full items of clothing. Both donors thirteen and twenty only left
empty fingermarks and no detail or any palmar flexion creases. The marks visualised
with this satin weave polyester were not as detailed as with the corresponding
samples, however this is most likely due to the article being larger and the metal
deposition not being as effective. Of course, it may also be due to the donors who
may not have had as many residues on their hands on the donation days, or, even, the
fabric itself having a protective coating on the surface.
With the cotton T-shirts [Table 11.3], donor five gave no profile information for
either taping or high volume extraction using Second generation multiplex (SGM) plus
or Next generation multiplex (NGM) chemistries. Donor thirteen afforded 1 ng of DNA
for taping, but no alleles for SGM plus or NGM and only 0.25 ng of DNA for high
volume extraction with no alleles being amplified. Finally, donor twenty also resulted in
1 ng of DNA from taping and this led to 1 allele being amplified with SGM plus and 4
with NGM, while only 0.1 ng was collected from the high volume extraction method
and this did not result in any alleles being amplified. The polyester results [Table 11.3]
with the taping method were more successful, in that each donor (donor five 21.5 ng,
thirteen 4.5 ng and donor twenty 8 ng) had much more DNA collected, which in turn,
resulted in more alleles being amplified. For donor five, 22 alleles were amplified using
SGM plus compared to 32 alleles using NGM; with donor thirteen there were 18 using
SGM plus and 32 using NGM; and with donor twenty the results were 22 for SGM plus

256
and 32 for NGM. However, the high volume extraction was unsuccessful entirely – no
DNA extracted from the chemises and therefore no alleles amplified.
The cotton results did not produce as many alleles as the nylon samples and
this may be due to the surface properties of the fabrics themselves – cotton is more
absorbent than nylon, therefore the cell free nucleic DNA may have been absorbed into
the fabric becoming harder to collect from the fibres during the extraction process. It
could also be as simple as the fact that high volume extraction is more effective on
different substrates than others. However the taping did give some positive results,
therefore if further work was carried out on both techniques to optimise the processes
they could be used in conjunction with VMD to produce a DNA profile and aid in
identifications.
A Mann-Whitney U test was carried out to determine whether taping or high
volume extraction was more effective at extracting DNA from two different clothing
types (polyester satin chemise and cotton T-shirts). Thus, the null hypothesis (H0) is
no difference in the extraction techniques while the alternative hypotheis (HA) is that
there is a difference between the techniques.
Table 11.4: Mann-Whitney U test results for the two different techniques of DNA amplification collected via two different methods from two fabric articles visualised using VMD. Results show the number of samples in each fabric set, the mean rank of each fabric set, the sum of the ranks, the Mann-Whitney U value, degrees of freedom and p-value.
Fabric Technique Number Mean
Rank
Sum of
Ranks
Mann-Whitney U
Value p-value
SGM Plus
Satin Taping 6 5.00 15.00
0.000 0.034 High Volume Extraction 6 2.00 6.00
Cotton Taping 6 4.00 12.00
3.000 0.317 High Volume Extraction 6 3.00 9.00
NGM
Satin Taping 6 5.00 15.00
0.000 0.034 High Volume Extraction 6 2.00 6.00
Cotton Taping 6 4.00 12.00
3.000 0.317 High Volume Extraction 6 3.00 9.00
When considering the data in Table 11.4, the HA should be accepted and the H0
rejected in the case of satin as the p-value is <0.05 (0.034) for both the SGM Plus and
NGM. However, the cotton T-shirts all have a p-value of 0.317, thus the H0 should be
accepted as there is little difference between the two techniques.

257
The DNA extraction techniques can be seen as different in the case of both
techniques for the satin as the mean rank and sum of ranks are high for satin
compared to cotton. This is as expected when considering the high volume extraction
method did not collect any alleles for amplification on either the polyester chemises or
the cotton T-shirts [Table 11.3]. Therefore, it appears that in the case of these types
of clothing that the taping method should be used to extract DNA, prior to
amplification.
11.1.6 Direct PCR of polyester samples
Ten donors planted grabs on two separate polyester samples and then one was
treated with VMD, while the other was untreated. Controls, including clean untouched
and unprocessed samples as well as untouched samples treated with VMD were also
processed. Direct PCR was carried out on all the samples using the Linacre et al.
(2010) method of directly amplifying samples with NGM – duplicates of the treated
samples had 2 cm x 2 cm sections removed, with irradiated scissors to reduce
contamination, while the samples that were untreated had section removed from the
areas thought to have been grabbed by the donors. The direct PCR method was used
as the high volume extraction method had proved unsuccessful on several fabric types
and the fact that the free nucleic acids may soak into the fabric, thus be unavailable
for taping.
Table 11.5: Results detailing number of alleles amplified using NGM from polyester swatches that had been grabbed by the donor. The swatches treated with VMD to visualise the grab mark are compared to those left untreated.
Alleles Amplified
Samples 0 - 5 6 - 10 11 – 15 16 - 20 21 – 25 26 - 30 31 - 32
Treated 11 2 1 0 1 1 4
Untreated 18 2 0 0 0 0 0
The results for the VMD visualised samples proved to be more successful than
the samples that had not undergone VMD [Table 11.5]. None of the untreated
samples yielded a full profile and 90 % only had five NGM alleles successfully
amplified, whereas four out of 20 (20 %) VMD treated samples resulted in a full DNA
profile. Therefore it seems that VMD does not inhibit PCR and can be used to target
areas to collect DNA from, which in turn could improve the chances of producing a full
profile [Figure 11.3].

258
Figure 11.3: Example of high quality full NGM DNA profile obtained from a sample visualised with VMD (Quinones Garcia, I. 2011. pers. comm., 26 May; Quinones Garcia 2011).
The direct PCR process was also carried out using archived, 2007, VMD
visualised samples from the same donors – again carried out in duplicate from sections
cut from the visualised grab. These samples were used to imitate a cold case sample
that of a piece of evidence that has been left unexamined or unsuccessfully examined
for many years. The results were extremely low for these samples – only one sample
produced a full profile, two produced partial profiles, while all the other samples
produced no profiles. However, these samples were considerably older than any of the
other samples examined, so it could be considered a success to be able to produce a
DNA profile from 10 % of the samples (Quinones Garcia, I. 2011. pers. comm., 26
May; Quinones Garcia 2011).
11.1.7 Overview of VMD on the recovery and profiling of DNA from fabrics and
clothing
VMD does not appear to interfere with DNA extraction and PCR, and hence the
ability to obtain full and/or partial profiles. It also aids DNA recovery by indicating
where an item has been touched, thus reducing the area of the article that needs to be
taped, as well as unnecessary taping of areas that have not been touched and thus a

259
reduction of contamination by mixed profiles. As well as helping locate tDNA the
visualised marks can illustrate in some way what may have occurred during an
incident, which coupled with the tDNA evidence, can add strength to the significance of
the resulting evidence. Generally in case work the areas that would be taped would
not be as high as the 50 % that was taped during this study and would be guided by
information from witnesses and the victim themselves, therefore the marks visualised
by VMD can only aid in this process by helping to pinpoint where the item should be
taped.
There is always the possibility of contamination and secondary transfer during
processing and this was found to be the case with some of the samples in this study,
with overall percentages of 17 for the NGM profiles and 12 of the SGM profiles
containing contaminating peaks (Quinones Garcia, I. 2012. pers. comm., 6 April;
Quinones Garcia 2011). This is especially likely to occur in real-life cases as the victim
will of course be wearing their clothing, thus their own DNA will be present. It should
be noted that the negative controls in the study were clean, therefore the extra alleles
most likely came from the donors or were present already on those fabrics, but not on
the controls. Quinones Garcia also stated that “the number of contaminating alleles
noted in untreated samples was slightly higher than in treated samples. This can
suggest that by targeting relevant touched areas, contamination can be reduced, as
DNA recovery from areas not touched by the volunteer are avoided, thus minimising
contaminant deposits” (Quinones Garcia, I. 2012. pers. comm., 6 April).
Overall, VMD combined with DNA extraction and profiling seem to be a viable
way of identifying an assailant in serious crimes – the combination of ridge detail as
well as a DNA profile could help lead to the identification of those involved.
11.2 Blind Trial using Vacuum Metal Deposition (VMD) and Cyanoacrylate
Fuming (CAF) on Fabric Swatches
11.2.1 Aim
To determine whether planted marks on various fabrics can be processed with
VMD or CAF and correctly located by a fingermark expert.
11.2.2 Background
All the samples throughout this study were graded by the same person, who is
not a fingermark expert, therefore it was decided to carry out blind trials where an
operational fingermark expert from the Scottish Police Authority Forensic Services

260
(SPAFS) would process, grade and record any marks visualised. In so doing, the bias
that may be in place due to the researcher collecting the samples and processing them
was removed and the individual processing the samples would have to use their
knowledge and expertise to evaluate whether the marks visualised were in fact
fingermarks. The fingermark expert has over 20 years of experience in fingermark
recovery and identification, working both in the field as well as in the laboratory. This
experience covers all aspects of chemical and physical development of fingermarks,
photography, as well as identification of fingermarks by comparing crime scene marks
to 10 print cards.
11.2.3 Results and discussion
Two different blind trials were performed with silk, cotton and polycotton for
the grid study and silk, rayon and polycotton for the grabs. The grid swatches had five
marks planted in known areas by the researcher. The swatches were then processed
and analysed by the fingermark expert and then compared to the location of the
planted marks. In the grab study, two out of the three swatches had grabs planted by
the researcher and then the swatches were processed and analysed by the expert.
With regards standardisation of the samples in this trial the expert followed the
same procedure for VMD and CAF as well as using the same grading scale as the
researcher.
For the grids [Table 11.6] it appears that VMD is more successful than CAF in
visualising marks on the three fabrics used in the trial, as 34 out of 45 marks on the
VMD samples were visualised, whereas only 14 out of 45 marks were visualised on the
CAF samples. When considering the results from the other trials in this study it follows
an expected pattern of smoother, tighter weave fabrics, in this case the silk, were
visualised more and with better detail than rougher and or looser weave fabrics, such
as the cotton and polycotton. However, while VMD visualised more marks, it was CAF
that visualised more ridge detail, as can be seen by considering at each fabric
individually.

261
Table 11.6: Grids for silk, cotton and polycotton for donor A, B and C (X indicates a fingermark or mark, while O indicates where a mark had been planted, but was not visualised)
VMD CAF
Fabric silk cotton polycotton silk cotton polycotton
Position A B C A B C A B C A B C A B C A B C
1 X X X O O O O
2 X X X O X X X
3 O X X X O O
4 X O O
5 X X X
6 O O O O O
7 O X X X O O O
8 X X X X O O O
9 X X O X X O
10 X X O O O
11 O X X O
12 O X O X X O O
13
14 X O O
15 X X O X X O
16 X X O X X X
17 O O O
18 O X X X X O
Silk VMD donor A was positive on all the planted grid boxes though all of these
marks were empty with no ridge detail. It is thought that the reason why they were all
empty was that the marks were too fresh – they had been planted on the same day
they were processed therefore the rest of the samples were collected, then processed
three days later. Silk VMD donor B was negative on four out of the five planted marks,
with the fifth mark being graded as a possible mark, though would not be considered
an empty mark and definitely did not contain any ridge detail. This donor was
considered a poor donor in the other studies, therefore the lower number of positive
marks compared to the other two donors was not unexpected. Donor C silk VMD was
positive for all the planted marks, though again no ridge detail was seen and this was
unexpected as C was considered a good donor in other studies. The lack of ridge
detail may have been due to the marks being too fresh as previously discussed. Silk

262
CAF donor A mostly visualised scuff marks (marks that could not be identified as being
from a fingermark) on square 2, 7, 9 and 15, as well as squares 5 and 8, though no
mark had been planted here. This may have been due to contamination on the fabric
or the donor touching these areas as they planted their other requested marks. This
donor did however; leave a mark in square 18 that contained a visible pattern, though
the ridge detail was poor it was enhanced further by use of fast Fourier transform
(FFT) [Figure 11.4].
Silk CAF donor B had four positive marks, two on squares 3 and 8 with no ridge
detail, two on squares 12 and 16 with poor ridge detail, and the fifth planted mark on
square 6 was not visualised. Finally, silk CAF donor C had two false marked squares
(squares 1 and 2) and one positive mark (square 16). Of the other planted marks,
three contained varying levels of ridge detail: square 9 was poor, while square 5 and 7
both contained some detail. Both squares 5 and 7 contained visible patterns, though
the ridge detail in square 7 was broken in areas, while in square 5 it was good and was
enhanced further by use of FFT [Figure 11.5].
Figure 11.4: CAF-visualised silk donor A sample; (A) displaying poor ridge detail and (B) same sample after FFT with ridge detail enhanced (Deacon 2012a).
A B
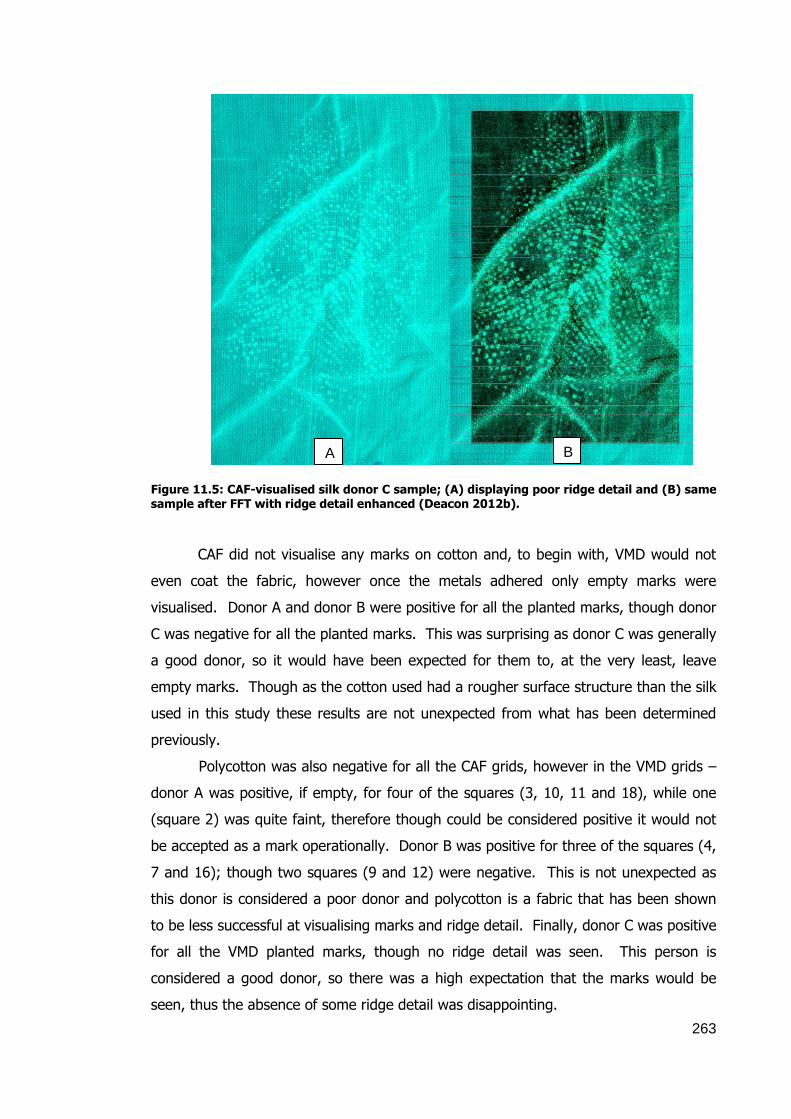
263
Figure 11.5: CAF-visualised silk donor C sample; (A) displaying poor ridge detail and (B) same sample after FFT with ridge detail enhanced (Deacon 2012b).
CAF did not visualise any marks on cotton and, to begin with, VMD would not
even coat the fabric, however once the metals adhered only empty marks were
visualised. Donor A and donor B were positive for all the planted marks, though donor
C was negative for all the planted marks. This was surprising as donor C was generally
a good donor, so it would have been expected for them to, at the very least, leave
empty marks. Though as the cotton used had a rougher surface structure than the silk
used in this study these results are not unexpected from what has been determined
previously.
Polycotton was also negative for all the CAF grids, however in the VMD grids –
donor A was positive, if empty, for four of the squares (3, 10, 11 and 18), while one
(square 2) was quite faint, therefore though could be considered positive it would not
be accepted as a mark operationally. Donor B was positive for three of the squares (4,
7 and 16); though two squares (9 and 12) were negative. This is not unexpected as
this donor is considered a poor donor and polycotton is a fabric that has been shown
to be less successful at visualising marks and ridge detail. Finally, donor C was positive
for all the VMD planted marks, though no ridge detail was seen. This person is
considered a good donor, so there was a high expectation that the marks would be
seen, thus the absence of some ridge detail was disappointing.
B A
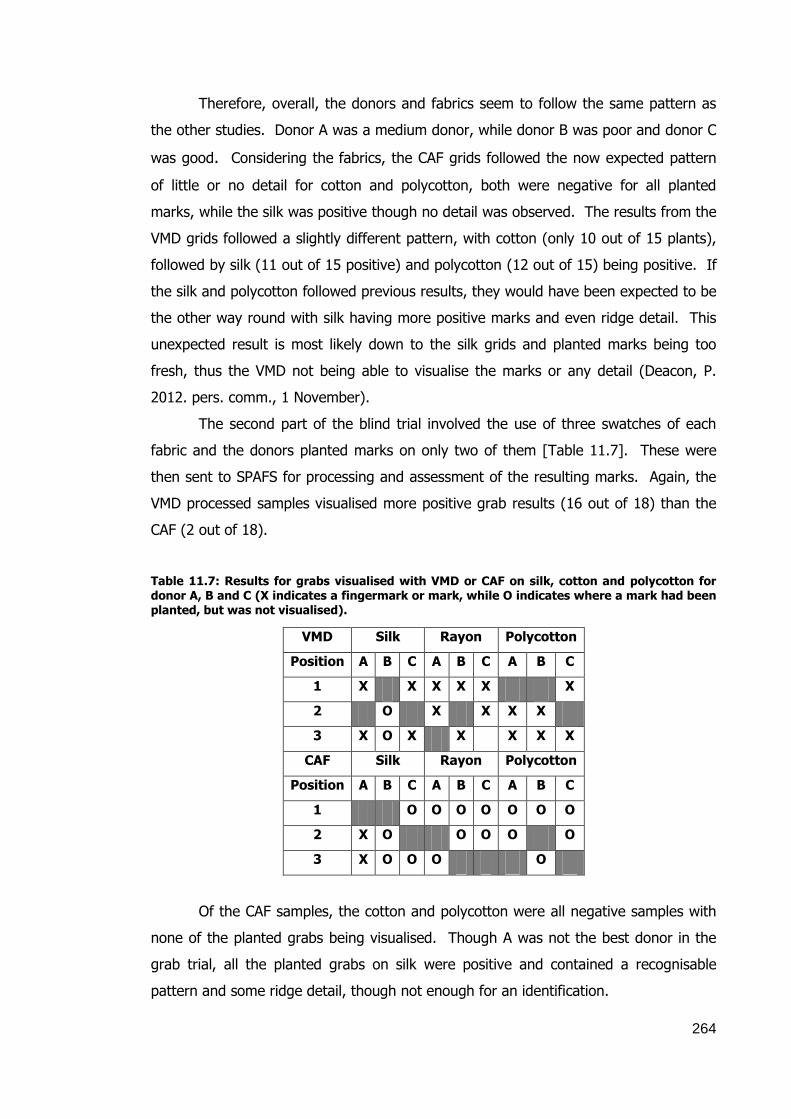
264
Therefore, overall, the donors and fabrics seem to follow the same pattern as
the other studies. Donor A was a medium donor, while donor B was poor and donor C
was good. Considering the fabrics, the CAF grids followed the now expected pattern
of little or no detail for cotton and polycotton, both were negative for all planted
marks, while the silk was positive though no detail was observed. The results from the
VMD grids followed a slightly different pattern, with cotton (only 10 out of 15 plants),
followed by silk (11 out of 15 positive) and polycotton (12 out of 15) being positive. If
the silk and polycotton followed previous results, they would have been expected to be
the other way round with silk having more positive marks and even ridge detail. This
unexpected result is most likely down to the silk grids and planted marks being too
fresh, thus the VMD not being able to visualise the marks or any detail (Deacon, P.
2012. pers. comm., 1 November).
The second part of the blind trial involved the use of three swatches of each
fabric and the donors planted marks on only two of them [Table 11.7]. These were
then sent to SPAFS for processing and assessment of the resulting marks. Again, the
VMD processed samples visualised more positive grab results (16 out of 18) than the
CAF (2 out of 18).
Table 11.7: Results for grabs visualised with VMD or CAF on silk, cotton and polycotton for donor A, B and C (X indicates a fingermark or mark, while O indicates where a mark had been planted, but was not visualised).
VMD Silk Rayon Polycotton
Position A B C A B C A B C
1 X X X X X X
2 O X X X X
3 X O X X X X X
CAF Silk Rayon Polycotton
Position A B C A B C A B C
1 O O O O O O O
2 X O O O O O
3 X O O O O
Of the CAF samples, the cotton and polycotton were all negative samples with
none of the planted grabs being visualised. Though A was not the best donor in the
grab trial, all the planted grabs on silk were positive and contained a recognisable
pattern and some ridge detail, though not enough for an identification.

265
The VMD samples only had one negative set (donor B; rayon), and while all
other grabs were visualised, donor A, silk and donor C, polycotton contained only
empty marks. Donor A, rayon was positive for the correct samples (no false positives
were detected); though there were only empty marks and the grabs were not full
hands. Polycotton did have full hand grabs for the correct samples, but did not contain
ridge detail in any of the fingertips or any palmar flexion creases. With the silk
samples the positive samples, had no ridge detail, but did contain palmar flexion
crease, which could help with identification. Donor B was negative for rayon and even
though the correct samples were identified for polycotton and silk, there was no ridge
detail in any of the grabs. Donor C had the most visible detail of all the donors. Rayon
and silk were both positive for the correct samples, but neither fabric contained ridge
detail. However, the most detail was seen on polycotton samples, with palmar flexion
creases in one instance identifiable marks in the other.
In conclusion, even though both the grids and grabs blind trials, do not
completely follow the results obtained previously (for example, silk did not produce as
many positive marks) these experiments did show that other individuals can process
fabrics using VMD and CAF to visualise marks, both empty and with identifiable ridge
detail.

266
12. NOVEL APPROACHES
12.1 Sputter coater and Adroit FC-3000
Operationally, VMD uses gold + zinc, though occasionally silver metals on case
work, however other metals have also been examined. Philipson and Bleay (2007)
investigated several different metals, such as copper, silver, gold, tin and indium, on
different plastic substrates. They determined that it was copper and silver that
visualised identifiable marks while the others had more limited success, thus copper as
well as silver were investigated further and compared to the traditional gold + zinc.
These comparative results were mixed, with copper not producing better results than
silver except on PVC cling film, therefore was excluded from the rest of the study; gold
+ zinc also did not always give the best results and on several occasions only
visualised empty marks. The empty marks may have been as a result of high levels of
fatty fingerprint residues migrating into the valley portions of the marks thus “blurring
the lines” of the ridges due to high gold diffusion. They also found that with silver,
further detail could be observed after 24 h, and suggested that productions be re-
examined after a passage of time. The use of silver VMD has also been examined
during this current study and the results can be seen in section 7.13 as well as
Knighting et al. (2013) [Appendix 15.1.2].
Not everyone used commercial VMD machines. Kent and Stoilović (1995)
carried out sputter coating, using four different metal targets – gold, platinum, zinc
and copper, on polythene bags (fresh and one year old). They found that copper and
zinc showed good results on the fresh and year old samples, but only poor results from
the third depletion onwards. However, the gold and platinum were found to be the
best and they went on to compare the platinum sputter coated samples to those
visualised with CAF and rhodamine 6G staining. Here the sputter coated samples were
found to be higher in sensitivity and produced superior results than the CAF samples.
Sputter deposition with gold was also utilised by Turner et al. (2010) as an alternative
to VMD or CAF and successfully visualised 12 to 16 identifiable minutiae on glass slides
as well as on polyvinyl chloride acetate and polyethene substrates that had been
immersed in water for seven days. Overall, they deemed that the sputter coater marks
were clearer than those produced by either VMD or CAF. They also felt that the lower
running and maintenance costs of the sputter coater made this a more affordable
alternative, and so the “technique of choice for the development of latent marks on
267
non-porous surfaces” (Turner et al. 2010, p. 19). Though this was not tested on
fabrics, third level detail was observed on non-porous glass microscope slides and
plastics. Work was also carried out with copper phthalocyanine in a modified vacuum
desiccator producing “excellent ridge detail clarity on light coloured surfaces” (Williams
et al. 2011, p. 28) on paper (a porous substrate and comparable to fabrics). Yu et al.
(2011) examined the use of zinc oxide in a thermal evaporator, on plastic substrates
with comparable results to gold+zinc VMD. The zinc oxide however, did not need gold
to aid in attachment to the fingerprint residues and was found to visualise marks aged
for 45 days more effectively than VMD. Aluminium has also been investigated as an
alternative to the traditional to gold + zinc. Aluminium and gold +zinc were compared
by Gunaratne, Knaggs and Stansbury (2007) on different plastics using split marks
over a timeline of less than 48 hours to over 90 days. They found that aluminium was
more successful on the younger marks, producing more detail and of better quality,
whereas gold + zinc was superior on the older marks. Therefore they suggested that
aluminium is a good metal choice, though both methods should be considered for older
marks. Overall, the techniques do seem to have achieved the visualisation of
fingermarks therefore the current study attempted to emulate this by utilising a sputter
coater (SEM coating unit PS3).
In order to imitate a miniature VMD chamber, the metals nickel, copper and
aluminium were heated under vacuum in a sputter coater. These metals were chosen
as they are reasonably easy to purchase and relatively inexpensive, thus accessible to
all researchers and police departments. Lead, platinum and magnesium were also
suggested, but although lead and platinum gave marks with “good contrast” in the
Atomic Weapons Research Establishment (AWRE) studies (Coles and Stroud 1973),
lead was excluded in the current research due to health and safety reasons and
platinum was too expensive. In the AWRE studies magnesium gave marks with good
detail, however needed “a high incident flux” which was not possible with the
equipment used in this study (Collins, Coles and Stroud 1973). As with previous
studies described in this thesis the timeline chosen was in relation to when violent
crimes are reported, generally within the first few days, (Kelly, Lovett and Child 2005)
and due to the first collection being taken on a Friday it was processed on the Monday,
thus was day 3.

268
12.1.1 Three Days Old
With nickel, no deposits were observed on nylon, white satin, cotton or black
satin, though the (apparent) lack of metal deposition on black satin may have been
due to the darkness of the fabric rather than no nickel being deposited. Polycotton
had minimal deposition after the full 300 seconds, but no fingermarks were observed.
With polyester and nylon-Lycra there was a visual deposition of nickel after 30 seconds
and after 60 seconds with linen, but no marks where the marks were planted were
obtained.
The copper target also resulted in little deposition occurring or any marks being
observed. Nylon-Lycra had a definite deposit but no mark or detail was seen, while
cotton had a better coating than with nickel, but there was still no indication of a mark.
An extremely faint deposit was observed after 30 seconds on polyester, however no
mark or detail was observed even after the full exposure time (300 seconds). Linen,
polycotton and white satin had extremely faint deposits after 60 seconds, but again no
marks or detail was observed after 300 seconds. The nylon had more copper
deposited during successive coatings, however there was no indication of where the
mark was planted and, black satin had no deposit at all, though as previously stated
this may be due to darkness of fabric.
The aluminium target was the poorest of all three of the targets used in the
study and it took over 60 seconds for any deposits to be observed on nylon, 90
seconds for cotton, 120 seconds for white satin, 180 seconds for linen and nylon-Lycra
and 240 seconds for polycotton. No marks or detail of any kind were observed on any
of these fabrics with hardly any deposits on polyester and nothing observed with black
satin.
12.1.2 One day old
As the results did not produce any marks or detail of any kind the delay
between planting the marks and processing was reduced to one day, though this did
not improve the detail visualised. With nickel, there was no deposit at all with black
satin; only a faint deposit but no marks or detail for nylon and white satin after 30
seconds, polyester and cotton after 60 seconds; nylon-Lycra after 90 seconds; linen
after 120 seconds and polycotton after 150 seconds. Copper was similar in the lack of
deposition and marks; and polycotton only had minimal copper deposits after 60
seconds, but no marks or detail observed even after the full 300 seconds. With nylon,
polyester and white satin there was minimal deposits of aluminium from 60 seconds

269
onwards but no marks observed, while with cotton and linen it took 90 seconds for any
aluminium to be observed. Nylon-Lycra was a bit more unusual in that there was a
faint deposit on some outer areas of the swatch after 30 seconds with more metal
being deposited after another 30 seconds, with a possible mark being observed after
120 seconds and irregular deposits at 150 seconds, but no ridge detail was observed at
any time. On the black satin at 300 seconds it could be seen where the mark had
been planted, but this was not enhanced by further deposits. In fact, as more metal
was deposited it made the mark harder to see, and there was the impression that the
metal was coating the whole substrate surface including the mark. Finally, with the
aluminium target there were no marks or detail of any kind and it took 60 seconds for
even a minimal coating on polycotton, nylon and white satin; 90 seconds for cotton
and linen; 150 seconds for any coating to be observed on polyester and a full 240
seconds before any deposits of aluminium was observed.
12.1.3 Zero days old
As none of the targets visualised any detail or even any areas that might have been
where the mark had been planted on the swatches it was decided to plant the marks
and try visualising them on the same day. Thus, day 0 followed the same processes –
marks were planted on the swatches and then after an hour were processed with the
appropriate metal. Nickel, again showed no detail and no planted marks were
visualised. There was no deposit of metal at all on nylon-Lycra; while after 30 seconds
there were only faint deposits for nylon and cotton; the same for white satin and
polyester after 60 seconds; 120 seconds for cotton and 150 seconds for linen. For
black satin there was a possible mark after 180 seconds and by 300 seconds there was
a faint difference between background and planted mark, though this may have been
due to the colour of the fabric allowing the mark to be visible from the planting stage.
Copper left no deposit or made any marks visible for the whole 300 seconds on
polycotton. While nylon, cotton and polyester only gave extremely faint deposit after
30 seconds, and though these deposits became darker after 60 seconds no marks or
marks became visible. Copper deposits only appeared on white satin and linen from
60 seconds onwards, but no marks were visualised. With nylon-Lycra faint deposits
were viewed from 90 seconds, which although they became stronger did not visualise
any marks. With the black satin, an oval shape was observed where the mark had
been planted, but no detail was observed. Again this mark could be seen at the start,
as with other black satin samples, but in this case the mark did become more obvious

270
from 150 seconds, though once more no ridged detail was observed. When aluminium
was tried, the cotton only had a faint coating after 30 seconds, but no marks or detail
was observed after the full 300 seconds. Nylon, gave extremely faint deposits after 90
seconds, but no marks or detail observed after 300 seconds; and both white satin and
polyester displayed an extremely faint deposit after 150 seconds with minimal deposit
overall and no marks. While black satin displayed a partial mark at 150 seconds, this
was not the full outline of a fingermark and may have been due to contamination
rather than fingerprint residues. Minimal metal deposits were seen on linen at 180
seconds, polycotton at 270 seconds and nylon-Lycra only showing some deposition at
the very end (300 seconds).
Therefore overall, when comparing all three metal targets even though there
was little deposition of the metals and no real marks, they can still be rated in their
ability to coat the fabric from the best to worst - copper, nickel and aluminium.
In conclusion, the sputter coater used in this study did not provide any ridge
detail and only limited success in visualising the area a mark had been planted. There
were possible outlines on black satin for copper and nickel on day 0 and with copper
on day 1 with a slight mark also on aluminium for day 0. However, there may be more
success in using these metal types in a full sized VMD machine, as in the case of the
work carried out with silver VMD by the Home Office in 2005 and by Philipson and
Bleay in 2007. For example, the Adroit FC-300 latent mark development system has
been developed by The Linde Group Canada and though this is marketed as a system
to develop fingermarks with ninhydrin, cyanoacrylate and sublimation dyes (Swofford
et al. 2012). The Adroit FC-300 has also been used to vacuum coat with aluminium
(Knaggs, C. 2010. pers. comm., 2 August) with considerable success with full ridge
detail visualised [Figure 12.1]. Therefore this technique could be used in a similar
manner as a VMD machine, however, the Linde website and literature state there are
several advantages of this piece of equipment over the traditional VMD. The Adroit
FC-300 has a non-stick coating on the chamber walls, therefore is easier to keep clean
and to clean; that the table on which the work holders stand rotates 360 ° therefore
allows the person processing the samples to view ever side and surface of the sample
as well as the viewing port can be lit with multiple light sources, including lasers and
alternative light sources (The Linde Group 2013). Therefore with these advantages
and the success of the use of aluminium is a good reason that this piece of equipment
should be investigated further as to its usefulness in visualising fingermarks on fabrics.

271
Figure 12.1: Fingermarks developed on an apple (1) and duct tape (2) using aluminium metal in the Adroit FC-300 (Knaggs 2007).
Figure 12.2: Grabs on nylon visualised with dye sublimation in the Adroit FC-300. Donor one (1) has a full hand and palmar flexion creases, but no ridge detail in the fingers while donor two (2) only contains a faint finger and thumb mark (Knaggs 2012a).
As part of the current work, some fabric swatches, containing planted latent
marks, were processed using the Adroit FC-300, though with dye sublimation (Linde
LR1 dye) rather than metal deposits. All the samples were aged for two weeks,
processed with the Linde LR1 dye then photographed with a Nikon digital camera fitted
1 2
1 2

272
with an orange filter and using a 440 nm light source. Figure 12.2 shows an emailed
photograph of a swatch that had marks planted in UK and then processed in Canada.
Although the results were not as successful as the aluminium images shown in Figure
12.1 or some of the VMD processed swatches, they did visualise hand grabs and it is
believed that once the correct cycle has been determined then samples will be
obtained with more defined detail. It was found that nylon [Figure 12.2], silk [Figure
12.3] and polycotton appeared to most readily allow the areas that had been grabbed
to be visualised, while Lycra, cotton and linen [Figure 12.3] required more work to
determine the “optimum technique” (Knaggs, C. 2012. pers. comm., 12 June).
Figure 12.3: Grabs on silk and linen visualised with dye sublimation in the Adroit FC-300. The silk sample is a full hand with palmar flexion creases and empty marks, while the linen only contains faint finger and thumb marks with little palm visible (Knaggs 2012b).
From the emailed photographs it was determined that there was no visible
ridge detail, however after refinement of the technique and possibly use of fast Fourier
transform (FFT), ridge detail may be observed with the sublimation dye. Also, further
work could involve the use of metal rather than dyes and this may improve the detail
even further. Nevertheless, this brief examination using the Adroit FC-300 supports
the VMD and CAF work reported herein where the tighter and smoother the weave the
more detail that will be visualised.
1 2
273
While ridge detail was not produced the operator stated that the “dye
sublimation process was found not to interfere with DNA so if this can be confirmed
using fabrics it may be useful for presumptive testing and locating DNA on clothing.”
(Knaggs, C. 2012. pers. comm., 23 May). Thus, as seen in the VMD and CAF work, if
ridge detail is not visualised there is still the possibility of recovering DNA which can
help lead to an identification.
Therefore, though the sputter coater work described here was not effective
there was some success reported in the past with trials by Kent and Stoilović (1995)
and Turner et al. (2010). However, as seen by the work carried out by Knaggs it is
possible to visualise excellent ridge detail on non-porous substrates.
12.2 Nanoparticles
12.2.1 Aim
To investigate the production of fluorescent nanoparticles and examine their
possible use for visualising latent fingermarks.
12.2.2 Introduction
Much work has been carried out over the years on nanoparticles in relation to
their use in visualising fingermarks. This has included the detection of drugs (Hazarika
et al. 2008, 2010; Leggett et al. 2007) and amino acids (Spindler et al. 2011) in
fingermark ridges and the production of fingerprint powders containing nano-scale
particles (Theaker, Hudson and Rowell 2008). There have also been advances in the
use of precious metals, such as gold (Becue, Champod and Margot 2007; Choi et al.
2008b; Schnetz et al. 2008; Gao et al. 2009; Fairley et al. 2012) and silver (Sametband
et al. 2007) to visualise marks. The above research comments on how these particles
can adhere to the ridges making them visible via fluorescence, either from the
nanoparticles themselves (Hazarika et al. 2008, 2010) or from moieties attached to the
nanoparticles, such as gold (Fairley et al. 2012) or fluorescent dyes (Theaker, Hudson
and Rowell 2008) study.
Some studies (Hazarika, Jickells and Russell 2008, 2010; Leggett et al. 2007)
utilised antibodies to the drug metabolites of marijuana, methadone, cocaine and
nicotine. As these metabolite compounds are excreted from the body in sweat and,
since this is one of the main components of fingerprint residues, the fluorescently-

274
tagged antibodies attaching to the metabolites causes the whole or parts of the
fingermarks containing the metabolites to fluoresce, thus become visible and
identifications made. All of these studies stated that “lifestyle intelligence” (Leggett et
al. 2007, p. 4100) can be gleaned from the fingermark and if the individual has
ingested drugs, their metabolites will be excreted onto the skin and identified. It was
also cautioned that care must be taken in the identification of some metabolites. For
example the detection of morphine could be an innocent result of the individual being
administered with codeine rather than morphine (Hazarika et al. 2010).
Amino acid sensitive fingerprint reagents, such as ninhydrin and 1,8-diaza-9-
fluorenone (DFO), have been used historically but more recently in the form of Genipin
and Lawsone (Jelly et al. 2009), however Spindler et al. (2011) utilised the antibodies
of the amino acids conjugated with gold nanoparticles to visualise the fingermarks. In
this case the conjugated gold/amino acid marks outperformed the unconjugated anti-
L-amino acid antibody marks with more and better detail being observed.
Metals, especially gold, have been the most widely used in the production of
nanoparticles either in the form of colloidal gold or multimetal deposition (MMD). This
is illustrated in the use of gold nanoparticles to attach to fingermarks, and then act as
sites of attachment for silver particles producing dark ridge detail (Becue, Champod
and Margot 2007). Though this is an improvement on the traditional method there are
still several steps and this limits where this process can be performed. In a later paper
the use of zinc oxide rather than silver as the material adhering to the gold
nanoparticles was reported (Becue et al. 2008). The zinc oxide (ZnO) could be seen
clearly under white light and produced a white coloured fingermark as well as under
UV (300-400 nm) to produce a green colouration to the mark, which is extremely
useful if the substrate is dark. Both processes were successful in visualising detail on a
variety of substrates and ages of marks and improved on the more traditional MMD
formulations. A further reduction in steps was reported by Gao et al. (2009) leading to
clearer marks due to a lack of background interference, more defined ridge detail and
a red colouration to the marks themselves. The nanoparticles could also work in a
wider pH range, 2.5 - 5.0 compared to the 2.5 - 2.8 of the traditional MMD method,
which makes it easier and more practical for everyday laboratory use. Stauffer et al.
(2007) also found that by replacing the silver enhancement of gold colloids by a gold
enhancement procedure, there was a reduction of the number of baths and reagents

275
used, therefore a reduction in cost, labour and an improvement in the shelf life of the
solution.
Sametband et al. (2007) investigated the effect of introducing the gold
nanoparticles into the silver physical developer process. They found that though the
traditional method of silver physical developer did produce marks, the quality was
enhanced by the presence of gold nanoparticles dissolved in petroleum ether and
stabilised by n-alkanethiols. They also determined that the length of the n-alkanethiol
chains was linked to the quality of the marks developed in that the longer chains
produced clearer marks.
With all the different studies into nanoparticles two papers collated and
compared the different methods of nanoparticle fingermark visualisation have been
published (Choi et al. 2008b; Fairley et al. in 2011). The former review discussed
metal particles, metal oxide particles, metal sulphide and other metal-containing
particles. With the metal particles, such as MMD and SMD in solution, it is the
positively charged amino acids and proteins of the fingermark that attract the
negatively charged gold nanoparticles. These then form sites of nucleation for the
silver in the physical developer, leading to increased enhancement of fingermarks.
Generally, this was more effective than silver developer on its own and better or equal
to VMD and CAF on plastics, but less sensitive than DFO or CAF on dry substrates. The
authors conclude that improvements in single metal deposition (SMD) has produced
results on the same level as MMD and nanoparticles in fingerprint powders has led to
cleaner, sharper development of marks, with less staining in the background. The
Fairley et al. (2012) paper compared the different MMD techniques and their use on
substrates, such as cling film; leather plasticized vinyl and masking tape that do not
generally allow good development of fingermarks. The overall conclusion was that the
most successful method was colloidal gold followed by physical developer with reduced
pH (Schnetz and Margot 2001). However, it was found that this method, though better
on cling film and plasticized vinyl, was ineffective on masking tape and leather.
The majority of the nanoparticle methods already discussed have involved gold.
However, Theaker, Hudson and Rowell (2008) described the use of fluorescent dyes
that were embedded into the nanoparticles, which produced a fingerprinting powder
that could visualise marks of various ages and due to being a traditional dark powder
with the fluorescent particles embedded, the marks could be readily viewed in both

276
white and UV light. The Choi et al. (2007, 2008a) studies also reported titanium
dioxide and zinc oxide powders, which were used on glass, polyethylene and
aluminium foil. These were viewed under UV light and the fluorescence produced
allowed the latent fingermarks to be visualised, and in the case of the titanium dioxide
powder good visualisation of ridge detail to the third level on the glass slides was
observed.
These powder processes seem relatively simple, however many of the
techniques described above use complicated or multi-step processes; require
scrupulously clean glassware; and doubly distilled water in order to prevent any
nucleation or development of colloidal gold on areas other than the fingermark ridges
(Schnetz and Margot 2001). Consequently, it was decided to look into the possibility of
producing a solution that would be easily prepared and then applied to the latent
marks in simple steps causing the marks to fluoresce, thus allowing them to become
visible.
Carbon nanoparticles that fluoresce would seem to be a possible area for
advancement in visualisation of latent marks. Sun et al. (2006) reported that
quantum-sized dots produced a stable photoluminescence, while the Ray et al. (2009)
study produced multiple sized nanoparticles that emitted differently coloured light
depending on the wavelength at which the particles were excited, from blue-green
with UV to yellow with blue excitation. These nanoparticles had been produced from
the oxidation of carbon soot, as were the particles produced by Tian et al. (2009),
which also produced photoluminescence. It was, however, the papers by Li et al.
(2011a, 2011b) that reported fluorescing carbon nanoparticles via ultrasonic treatment
where were of most interest. Here, the particles were produced from an active
carbon/hydrogen peroxide solution or a glucose/sodium hydroxide solution treated
ultrasonically. The resulting nanoparticles emitted strongly in the near infra-red and
visible spectrum, therefore work was embarked upon to determine whether these
carbon particles could be used to adhere to, and therefore visualise, latent marks.
12.2.3 Nanoparticle production
Glucose and hydrochloric acid (HCl) as well as glucose and sodium hydroxide
(NaOH) were separately sonicated for 6 h at 20 kHz. Initially, the solutions were clear
and colourless and remained this way until the water was evaporated and the solution
277
turned progressively darker until a thick dark brown/black slurry was produced which
was diluted with distilled water for further investigation. In another set of
experiments, coffee and activated carbon cloth suspensions were also sonicated (1 h
and 6 h respectively at 20 kHz) to afford, after filtration, a clear colourless solution.
Each solution was then placed separately into the spectrofluorophotometer and
observed under the wavelengths of 300 nm to 900 nm. The glucose/HCl solution pre
and post filtering, pre and post evaporation, sonicated and diluted (1:10 in distilled
water) displayed nearly the same colours at each wavelength, while the control glucose
solution was slightly different from 600 – 900 nm. The same was observed with the
glucose/NaOH solutions, the coffee solutions and the carbon solution, with only slight
variances in tone rather than colour. Thus, it was determined that the colour being
emitted was from the spectrofluorophotometer and not caused by any fluorescence
from the solutions themselves. As this was unsuccessful the solutions were observed
using a fluorescent microscope.
The solutions were tested neat and diluted with distilled water (1:1 - 1:10) and placed
on glass slides and viewed under the different cubes of the microscope. The different
cubes used were: 1 H, UV excitation range and excitation filter (340 – 380 nm); 2 H,
UV/violet excitation range and excitation filter (355 – 425 nm); 3 H, blue excitation
range and excitation filter (450 – 490 nm); 4 H, green excitation range and excitation
filter (515 – 560 nm).
The colours were nearly the same for each dilution and each solution –
glucose/HCl, glucose/NaOH and coffee. For 1 H the backgrounds were all blue,
ranging from dull to bright with some solutions containing some clusters of particles;
for 2 H the backgrounds were yellow or yellow/green with green clusters; with 3 H the
backgrounds were green to bright lime green with green clusters; and finally the 4 H
had a dull red to bright red background with bright red clusters. The components of
the solutions (ethanol, HCl, glucose and water) and the slides were also examined and
they too exhibited the same colours, but were all dull with no fluorescence – 1 H were
all blue, 2 H were all yellow or yellow/orange, 3 H were all green and 4 H were all red.
All the previous samples had been smeared onto the glass slides, so in an
attempt to determine whether it was the application that led to a lack of particles and
limited fluorescence an alternative method was tried. The solutions were applied by
pouring directly over the slides, dipping the slide into the solutions for approximately 2,
10 or 30 seconds or painting the solution onto the slide with a soft natural hair

278
paintbrush and, this time, the size of the smallest particle was also measured. This
was carried out on plain clean slides as well as slides that had a mark planted one hour
prior to the solutions being applied. Again the colours observed on the slides and the
fluorescence of any particles was extremely similar for all solutions and methods of
application. The solutions were observed at x400 and x50 magnification – 1 H the
background colour was pale blue with blue or bright blue; 2 H had a yellow
background with bright green or white with green outlines to the particles; 3 H had a
bright yellow or yellow/green background with green or dark lime green particles; and
4 H had red particles on red backgrounds, while the particles ranged in size from 0.69
– 624.72 µm, thus were not nanoparticle sized.
Figure 12.4: Planted mark coated with putative nanoparticles from coffee sonicated for 1 h,
photographed at a magnification of x50. Ridge detail in the form of skin cells and particles is visible on the slide.
The particles that were observed did fluoresce, but did not adhere to the marks
that had been planted and in some cases the mark actually appeared to repel the
solutions, therefore 10 % AEROSOL OT detergent solution was added to help
overcome this issue. At x50 magnification, it was possible to see some of the particles
attached to the ridges [Figure 12.4], but there was not enough of the mark visible to
be able to identify an individual. Therefore, it was necessary to view the samples in
such a way as to allow the whole of the mark to be seen, so they were viewed under
the Crime lites and Quaser.
With all the Crime lite samples, which were on glass and paper (both recycled
and bleached) the majority were negative. Some of the paper fibres fluoresced, while
on others the outline of where the mark had been planted or the edge of the solution
could be seen, but there was no detail. Use of the Quaser followed the same pattern
with every single possible combination of settings tried being either negative, with only

279
a few samples displaying the solution front, or some of the fibres in the paper samples
fluorescing.
Overall, the production of fluorescing nanoparticles was not achieved at this
time even after following the method of Li et al. (2011a). There was some
fluorescence at the solution front edge and some particles, though probably not nano-
sized. There was an improvement from the original starting solution by the addition of
a detergent, which enabled the solutions to adhere to the planted marks, but any
particles that could be viewed under the microscope were not visible under the Crime
lites or Quaser. Thus, more work is necessary to further refine the methodology to
produce nanoparticles that can adhere to marks, fluoresce and be seen under the
Crime lites or Quaser.

280
13. CONCLUSIONS
13.1 Visualisation of latent marks
When considering all the data, vacuum metal deposition (VMD) is the most
successful technique for visualising latent fingermarks, palmar flexion creases and grab
marks on fabrics throughout the study’s 10 day timeline (days 1 – 28) as well as on
samples that were over 4 years in age (Fraser et al. in press). In the majority of the
study, the traditional method of gold + zinc was used and this was reasonably
successful in visualising ridge detail and grab marks on the lighter coloured fabrics,
however silver VMD was deemed more successful on the darker fabrics (Knighting et
al. 2013). Cyanoacrylate fuming (CAF) did visualise marks, however the ridge detail
observed was in many cases not at the same level as VMD. With CAF there was also
the issue of the background fluorescence caused by the basic yellow 40 (BY40) dye
possibly obscuring detail on the samples. If this issue could be solved CAF may have
significant advantages over VMD, such as reduced costs and availability of the
equipment, making it the method of choice. Other techniques, such as 1,8-diaza-9-
fleorenone (DFO), small particle reagent (SPR), ninhydrin and fluorescent powder had
limited success probably due to these materials reacting as much with the fabrics as
the fingerprint residues thus the whole surface becoming coloured and the fingermarks
not visible. Also, attempts at utilising alternative metals in conjunction with the sputter
coater, were largely unsuccessful though the use of the Adroit FC-3000 may be
promising. Similarly, attempts at producing nanoparticles were not successful and
therefore their effectiveness in visualising fingermarks could not be evaluated. In
conclusion, VMD appears to be the best technique in that it visualises more detail on
more fabric types, with most donors over the full timeline used.
13.2 Sequential treatment of samples
It was found that sequential treatments with VMD then CAF on the smoother,
manmade fabric showed more improvement on detail whereas the natural fabric, linen
showed no improvement, which indicates the fabric surface is probably influencing the
detail observed. The addition of humidity from the CAF may also be affecting the
attachment of the metals to the fabrics and so decreased the detail was observed.
With CAF then VMD there was no extra detail observed by this order of treatment of
fabric with the exception of nylon-Lycra, which did increase in detail. Overall, there is
little benefit to sequential treatment especially if CAF is used first.

281
The use of CAF after VMD does seem to increase the detail due to the use of
BY40 after the CAF enhancing the contrast between the metal deposits and the, now,
yellow background fabric colour. In some cases such treatment was detrimental and
even reduced the level of detail originally observed. There may also be the possibility
that the BY40 is obscuring detail, visualised by the CAF, due to background
fluorescence, therefore considerably more detail may be present on the fabric but
cannot be observed.
13.3 Fabric type
Generally, fabrics such as nylon, satin and silk, which are porous, and have
smoother, tighter weaves, displayed higher levels of detail. Porous, rougher and more
open weave fabrics, such as cotton, polyester and polycotton, exhibited less detail.
Most fabrics showed some level of detail indicating that it had been touched, in some
cases only a possibility of a fingertip mark, and this could help a technician to target
areas to tape for DNA. The fabric type and its effect on the level of detail visualised is
discussed in more detail in each of the thesis’ published papers – Fraser et al. 2011,
Fraser et al. in press and Knighting et al. 2013. These papers can also be found in
appendix 16.2.
It was also observed that the more hydrophobic a fabric, the less the residues
are absorbed into the fabric and therefore are more available to the visualisation
technique and hence, an increase in detail visualised. Whereas hydrophilic fabrics
allow the residues to absorb into the fabric thus are not available, therefore a
reduction in marks visualised. Fabrics may also have coatings that can affect how well
the fingerprint residues adhere to them and these can be removed through washing
and wearing. The wear and tear of a fabric surface could also lead to a reduction in
detail, due to conversion from a smooth to a rougher surface structure.
13.4 Donors
Donors seem to be one of the biggest variables and in this study they ranged
from good to poor. Generally, a good donor, who produces a large amount of
fingerprint residues, will give better ridge detail than a donor with drier hands or
reduced levels of residues. This too is discussed in the published papers, however it
must also be noted that a donor who is considered good may not always leave
excellent detail due to changes in health, diet and environment. There were times
where good donor samples did not show detail and there poor donor samples that

282
unexpectedly showed good detail. Therefore, this illustrates the variable nature of
fingerprint deposits and fingerprint residue production.
13.5 Palmar flexion creases
Not all donors left ridge detail in the finger tips, but many left palmar flexion
creases and though this detail is not always considered during police investigations but
is becoming more important as potential evidence. Approximately 30 % of all latent
marks found at crime scenes are in the form of palm marks (Sutton et al. 2013),
therefore these recovered marks and the fact palm marks are now recorded during the
booking process of suspects, shows they are a useful tool in the connecting of
individuals to crimes. In addition, if the nature of the crimes that involve the
processing of clothing, such as sexual and physical assaults is considered, it would be
expected to involve the suspect grabbing and pushing the complainant. Therefore,
there would be a high possibility that palms would be placed on the items of clothing
and then may by visualised if processed and so aid in identity.
13.6 Age of mark
Generally, fresher marks developed higher levels of detail, although, with the
correct conditions such as a good donor and a smooth tight weave fabric older marks
can also be visualised. However, even samples, which were up to 4.2 years old
(discussed in the cold case section 10.3), gave some palmar flexion creases indicating
the areas of the item that had been touched therefore could be used to show a
sequence of events and as a place to target for DNA.
13.7 DNA recovery
The use of DNA in producing an identification, was illustrated with samples that
were visualised with VMD, where it was determined that it was possible to collect
partial and full DNA profiles. Therefore this work carried out with VMD samples along
with literature stating that the cyanoacrylate (CA) polymer encapsulates the DNA
making it available for collection means neither process should prevent the collection of
DNA thus identifying the individual that touched or grabbed the fabric. Nevertheless,
where no ridge detail was visualised with either process, the empty marks could still be
targeted for taping and DNA collection that could lead to an identification.
This collaborative work has been submitted to Forensic Science International
Genetics for publication and is awaiting review.

283
13.8 Recording of ridge detail
There were several problems with the recording of detail on the samples and
either infrared (IR) or fast Fourier transform (FFT) imaging could be the solution to the
problem of recording the level of ridge detail as viewed by the operator on the
processed item. The human eye appears to be able to discriminate between the fabric
weave and the ridge detail on the fabric, whereas a digital camera appears to record
the marks, ridge detail and the fabric weave. Potentially, the marks could be recorded
using an IR camera or, alternatively, a regular digital camera could be used followed
by processing with FFT. Both of these techniques were used in a limited manner
during this study (see section 3.24) and some extra detail was found.
13.9 Effect of moisture on detail observed
There are several factors, such as the levels of water applied to the fabrics, that
led to changes in the level of detail observed. An increase in water generally led to a
decrease in detail and this was more obvious with CAF compared to VMD which
reinforces the literature view, that states that VMD can be used on substrates that
have been exposed to adverse aqueous conditions and that CAF does not easily
visualise marks on items that have been wetted.
13.10 Original contribution
Very little work has been carried out in the past in relation to fingermark
recovery from fabrics using VMD and much of it is anecdotal and, if it was published, it
took the form of technical reports and notes. Work reported in this thesis has detailed
the methodology and operational parameters necessary to optimise the technique of
VMD and has utilised a massive study involving nine different fabrics: cotton,
polycotton, polyester, nylon, nylon-Lycra, satin, silk, rayon and linen along with fifteen
donors ranging in age, sex and ability to leave fingermarks. The samples were
collected and processed with the appropriate technique over various time periods,
generally, 1, 2, 3, 4, 5, 6, 7, 14, 21 and 28 days.
For the first time, a direct comparison of the use of VMD versus CAF has been
carried out and that it was found that both VMD and CAF did visualise marks and ridge
detail from latent fingermarks. Statistical analysis showed that VMD the most suitable
technique for development of fingermarks on fabric, with gold + zinc VMD best for
light coloured fabrics and silver VMD for dark. CAF also visualised several identifiable
marks, even with the problems of background fluorescence from the basic yellow 40

284
(BY40) dye used to visualise the cyanoacrylate (CA) polymer. It was found that the
smoother fabrics with a tighter weave, such as nylon and silk allowed the visualisation
of more detail than rougher and/or looser weave fabrics such as cotton and linen. The
latter tended only to show empty marks or marks, which gave indications of where the
fabric had been touched. However, fabrics that did show marks, even if not suitable
for identification, could still give information as to the sequence of events that may
have occurred during an assault as well as identifying an area to tape for DNA. It was
determined that it was possible to collect DNA from VMD visualised marks which led to
partial and full profiles of those who touched and grabbed the test swatches or items
of clothing tested.
This study expanded on, yet, validated the previous work on VMD, but also
describes the new and novel process of combining multiple fingerprinting techniques to
determine their effectiveness. With sequential treatment, the optimum sequence was
VMD followed by CAF, due to enhancement of contrast between the metal deposits
and BY40 yellow stained background. CAF, then VMD, only led to extra detail being
observed on nylon-Lycra. Other techniques investigated were 1,8-diaza-9-fluorenone
(DFO), small particle reagent (SPR), ninhydrin, fluorescent powders and the use of a
sputter coater for alternative VMD metals.
It was also uncovered that both VMD and CAF processes were affected by the
addition of water to the surface of the fabrics being processed, and although marks
and ridge detail were still detected, CAF was less effective than VMD. The production
of carbon nanoparticles from different sources in an attempt to introduce and entirely
novel fingerprint reagent was unsuccessful but new knowledge was gained. Finally,
the issue of ridge detail being obscured by the fabric weave may have been resolved
by the use of IR photography or FFT processing.
Also, three papers (Appendix 16.2), based on the work described in this thesis, have
been published with a further paper on the collaborative DNA work with Ignacio
Quinones Garcia having been submitted to Forensic Science International Genetics. All
the papers were submitted to scientific peer review journals therefore their acceptance
and publication reinforces the previous statement of original contribution.

285
14. FUTURE WORK
There are many areas that need to be investigated, within the area of fingermark
recovery from fabrics, and possible further work could include:
To determine if the use of a one-step fluorescent cyanoacrylate (CA) will
be effective on fabric and solve the problem of background fluorescence
from the dye portion of the cyanoacrylate fuming (CAF) process.
The use of an alternative to basic yellow 40 (BY40) for the staining of
the CA polymer.
Lifting marks visualised on the fabrics using vacuum metal deposition
(VMD) or CAF or a combination of the two, to see if this can combat the
problem that the weave pattern of the fabric causes on the recording of
fingermark ridge detail observed.
Investigate and refine the use of fast Fourier transform (FFT) and
infrared (IR) imaging in relation to visualising fingermarks on fabric.
Examine, in much more detail the fingerprint residues themselves and
how they interact with the fabrics, how much they penetrate into the
surface of the fabric, as well as how they spread across the surface.
To investigate the use of the Adroit FC-300 and metal sublimation to
determine whether identifiable latent marks can be visualised on fabrics
14.1 To determine if the use of a one-step fluorescent cyanoacrylate will
be effective on fabric and solve the problem of back ground fluorescence
from the dye portion of the CAF process.
This one-step process would have two advantages, the first being, as the name
suggests that it is a one-step process, so the items only have to be placed in the CAF
cabinet and processed. Secondly, the items do not have to go through a separate
dyeing stage, which would provide additional benefits:
a decrease in time of visualisation of fingermarks;
the fabrics would not need to be submerged in a dye, which, in the case
of BY40, contains a solvent that could have a detrimental effect on the
fabric, such as shrinkage or warping and therefore effect the marks that
may be found on the fabric;

286
a possible reduction in the uptake of dye by the fabrics themselves,
which may result in a decrease in possible background fluorescence,
thus less obscuring of any possible marks.
The development of a fluorescent cyanoacrylate has previously been
investigated with varying levels of success. Weaver and Clary (1993) introduced a
portable Vapor Wand, which was developed in conjunction with 3M. This wand was
the size of a pen and could be used in the field, due to the use of “rechargeable
cartridges of cured cyanoacrylate” which also included a proprietary subliming dye
from 3M that was magenta in colour, thus visible marks could be developed within 20
seconds on multiple substrates. However, when they tried to scale up the equipment
they encountered a few problems, such as the polymer building up on the tubing
within the set-up causing them to become blocked. This was in part solved by the use
of larger replaceable tubing and the addition a petroleum jelly coating over the
fixtures. Gros, Spring and Deinet (1995) tried to alter the chemical structure of CA so
that it would fluorescent, but this was unsuccessful as they found that the ethyl ester
adduct produced from reacting anthracene with ethyl cyanoacrylate generally
decomposed and did not lead to a fluorescing CA. Similar problems were experienced
by the Israel National Police during their 2008 experiments (cited in Ramotowski 2012)
where they used Diels-Alder adducts of anthracene with ethyl cyanoacrylate, though
this time the compound covered the whole surface of the production as it sublimed too
fast, thus no fingermarks were developed. This work has continued and several
companies have come up with products, such as CN-Yellow, which is marketed by
Arrowhead Forensics (2010), and fluorescent CA monomers produced by Bentolila et
al. (2013) in Israel.
In Britain, there are two fluorescent CA formulations on the market at the
moment – PolyCyano UV from foster+freeman and LumiocyanoTM from Global
Forensics. The major difference between them being that PolyCyano needs a
modification to the CA cabinet so it heats to the required 230 ºC, whereas
LumiocyanoTM can be used in any CA cabinet without modification. On the
foster+freeman website (2013), they state that PolyCyano can be used to visualise
marks “without the need for further chemical treatment”. Thus, once the marks are
developed and removed from the cabinet they can be visualised using long wave UV
lighting at the wavelength of 365 nm and the marks recorded. The PolyCyano can be
used in a standard CAF cabinet, however a modification does need to be made as

287
material needs to be heated to 230 ºC, whereas as the standard cabinets only heat to
120 ºC. This increase in temperature is a concern, as heating CA to temperatures
above 200 ºC can lead to the production of toxic hydrogen cyanide fumes, therefore
health and safety issues (Mock 1985; Fung et al. 2011). The other product on the
market, LumiocyanoTM, does not have this issue as it is used at the standard
temperature of 120 ºC and works on porous and non-porous substrates. It and can be
viewed under UVA lighting at the optimum excitation of 325 nm, but can also be
viewed using alternative light sources with a blue green waveband of 425-530 nm
(Global Forensics 2013).
As both products are readily available they should both be investigated as to
their suitability of visualising fingermarks on fabrics, however the LumiocyanoTM would
be the easier product to start with as no modifications to the normal CAF cabinet
would be necessary.
14.2 The use of an alternative to BY40 for the staining of the CA polymer
Many dyes have been tested in the UK in conjunction with CAF and the
preferred and operational choice is BY40. As BY40 was originally a textile dye
(Wilkinson 1996) this causes many problems with the dyeing of fabric articles after CAF
processing. More dye will be absorbed by porous fabrics than non-porous therefore
background fluorescence often obscures any marks, marks and detail that may be on
the surface. Therefore, the investigation of alternative dyes, such as europium chelate
and ardrox, to be used after CAF could alleviate this problem as. Cummings, Hollars
and Trozzi (1995) examined several fluorescent dyes, including the aforementioned
ardrox, and suggested that there are many other dyes that have not been, but should
be, tested in fingerprinting as the best one may not have yet been found. Some of
these were examined in a small study that was carried out by a final year student at
Abertay University comparing BY40 to ardrox, rhodamine 6G and europium chelate
solutions but this resulted in little success. A study similar to that of Mazzella and
Lennard (1995), found that BY40 visualised more marks and they were of higher detail
than any of the other dyes. However this may be due to unsuitable light sources that
were not illuminating in the correct wavelength, thus it may be useful to repeat this
study (Aitken 2011. pers. comm., 22 April). Thus, europium chelate should be re-
examined in relation to recovery of fingermarks from fabrics. There is documented
evidence that it has been successful on other substrates such as human skin
(Wilkinson and Watkin 1993; Allred and Menzel 1997), a variety of plastic bags

288
(Wilkinson and Misner 1993), paper (Allred and Menzel 1997; Wilkinson 1999) and
metals (Lock, Mazzella and Margot 1995).
The use of such as food colourings and “festival powders” to highlight the
polymer rather than dyeing the fabric is also another possible alternative to BY40.
There have been several studies into the use of food colourings and spices as
visualisers for latent marks. For example, Garg, Kumari and Kaur (2011a) discussed
the use of turmeric to visualise fingermarks on paper (office, bond and thermal),
acetate sheets, foil, varnished wood, plastic, painted steel and CDs, all of which ranged
in porosity. The turmeric was milled to an extremely fine powder then sprinkled onto
the substrate and the excess tapped off to leave an obvious mark on all the substrates.
Later they described the use of orange red, lemon yellow and bright green synthetic
food colourants in, as well as red, green and pink “gulal” festival colours, in on paper,
foil, aluminium metal and CDs. These powders were again sprinkled onto the
substrates and excess removed by tapping. On paper the colourants were not as
successful as traditional fingerprint powders, however on the foil and CDs they were
better. There is of course the added benefit that these colourants were much more
readily available and cheaper to purchase (Kumari, Kaur and Garg 2011b). Thus, the
use of these powders after CAF or even on the fabric without previous treatment may
work well and should be investigated. However, like the fluorescent powders, they
may be deemed too messy a technique leading to a coloured fabric with no
visualisation. There may also be an impact on DNA recovery therefore this would also
need to be investigated.
14.3 Lifting marks visualised on fabrics using VMD or CAF or a combination
of the two, to see if this can combat the problem that the weave pattern of
the fabric causes on the recording of fingermark ridge detail observed
There is an issue with fingermarks on fabric in that the operator may see
excellent ridge detail on the fabric being examined, however once photographed the
ridge detail is obscured or disguised by the weave of the fabric. Therefore lifting the
visualised marks from the original substrate may solve, or at least reduce, this issue by
removing the effect of the weave. This was suggested by Collins, Coles and Stroud
(1973), however they unsuccessfully attempted lifts with adhesive tapes as the metals
did not completely separate from the fabrics. They also tried dampened photographic
paper with more success, leading to “very satisfactory print transfers”, therefore this
should be further investigated. Though this might be carried out operationally and a
289
small amount of research has been done (see Raymond section 3.23, p. 80-84) no
further work has been published. Therefore other types of lifts such as fingerprint
lifting tape and gelatine lifts that are used to obtain marks such footwear marks and
impressions in blood should also be investigated. These types of lifts may not have the
problem that the adhesive tapes have in that the remove the background as well as
the mark. If the gelatine lifters could just remove the visualised marks, the metals in
the case of VMD or the polymer in the case of CAF, the background weave of the fabric
would not be on the lift. Therefore, the effect of this on the ridge detail will be
diminished or removed all together leaving the level of detail normally observed by the
naked eye.
14.4 Investigate and refine the use of FFT and IR imaging in relation to
visualising fingermarks on fabric
As demonstrated in section 3.24 FFT and IR imaging successfully removed a
great deal of the fabric weave pattern from many of the photographs of VMD and CAF
enhanced marks, enabling the ridge detail to be more easily viewed therefore this is an
area that should be investigated further.
In a book chapter Kamei (2004) explained the use of FFT in the reduction of
noise and the removal of backgrounds to enhance and improve the contrast between
the ridges and valleys of a mark. Thus, by choosing the correct filters (frequency and
directional) based on image size and resolution, the minutiae, ridges and valleys
become clearer and this aids identification. With IR imaging CA is a good candidate as
the radiation will interact with carbon, triple bond, nitrogen (C≡N) functional group
within the CA and it is generally free from any interference within the 2000 cm-1 range
of the spectrum. Tahtouh et al. (2005) showed that IR chemical imaging on marks
deposited on plain glass (microscope slides), polymers, banknotes and ceramics
worked well. Items with patterned backgrounds, such as the polymer banknotes could
be processed with CAF, stained, then subjected to IR imaging which effectively
removed the background and thus reduced interference allowing the ridge detail to be
more easily observed.
Consequently, an in depth investigation on the use of FFT and IR imaging could
be very beneficial in enhancing marks on fabric. Many of the marks within the various
areas of this study have resulted in empty marks and through the work carried out by
collaborators (Paul Deacon on VMD and Jennifer Raymond CAF) both techniques have
proved useful in enhancing visual detail further.

290
14.5 Examine, in much more detail the fingerprint residues themselves and
how they interact with the fabrics, how much they penetrate into the
surface of the fabric, as well as how they spread across the surface
It would be interesting and helpful to work out exactly what was happening
with the fingermarks after they were deposited on to each fabric type, as this might
help the operator decide which visualisation technique would be most suitable to use
on the specific item being examined.
Almog et al. (2004) found that the print residues penetrated to different levels
depending on the paper type and chemical enhancement technique. With smooth
paper they tended to remain on the surface only penetrating to a depth of 18 - 36
microns, whereas with filter paper the residues penetrated deeper to between 99 and
138 microns. Therefore, in many cases, the chemical treatments used were actually
working within the paper and thus the visualisation was affected by how deep the
residues had penetrated and a correlation was observed with a depth of 40 – 60
microns deemed as the “optimum penetration depth” to produce the best prints. The
model used by Almog et al. on paper could be expanded to fabrics as they are thought
to behave in a similar fashion to the different types on paper. As discussed in chapter
8.6, some fabrics are more absorbent than others. Nylon tends to allow moisture to sit
on the surface, therefore it could be that the fingerprint residues are doing the same,
whereas linen tends to absorb water into and through its surface to the underside, so
would fingerprint residues do the same? Therefore if the fabrics were tested in a
similar way, as paper, it might help decide whether it would be useful or even
worthwhile to attempt the use of VMD, CAF or another technique to visualise latent
fingermarks on a certain fabric type.
14.6 To investigate the use of the Adroit FC-300 and metal sublimation to
determine whether identifiable latent marks can be visualised on fabrics.
The Adroit FC-300 latent mark development system has been successfully used
with aluminium to visualise high level ridge detail and identifiable latent marks on a
variety of substrates, such as apples, bottles, CDs and condoms (Knaggs, C. 2010.
pers. comm., 2 August). Some preliminary work has also been carried out on fabric
swatches using dye sublimation to visualise latent marks and grabs. As previously
stated in Section 11.1 these results were not as successful as those visualised with
aluminium though they did show promise. Therefore, as Knaggs, determined it was

291
possible to visualise identifiable marks on non-porous substrates, further work should
be carried out to determine whether metals other than aluminium, such as silver or
gold+zinc would be more successful in visualising latent marks on fabrics.

292
15. REFERENCES
1. Abe, S. 1978. Development of latent fingerprints by vacuum deposition
technique. National Research Institute of Police Science. 31 (4): pp. 377-379.
2. Abrahart, E. N. and Whewell, C. S. 2013. Textile Encyclopaedia Britannica.
[online]. Available from: http:// www.britannica.com/EBchecked/topic/589392/
textile/60776/Basic-weaves. [Accessed 20 March 2013].
3. Adolf, F. 1999. The structure of textiles: an introduction to the basics. In:
Robertson, J. Forensic examination of fibres. 2nd ed. London: CRC Press. 1999,
pp. 33-54.
4. Albinson, R. 1984. The development of latent fingerprints on fabric. Home
Office Scientific Research and Development Branch. Publication No. 72/84: pp.
1-25.
5. Alga, N. 2002. Pattern of minutiae. [online image]. Rolling Meadows:
Information Systems Audit and Control Association (ISACA). Available from:
http://www.isaca.org/Journal/Past-Issues/2002/Volume-2/Pages/Increasing-
Security-Levels.aspx . [Accessed 30 June 2013].
6. Al-Khairulla, H. 2009. Grade 4 fingerprint on silk. [Photograph]. Dundee:
University of Abertay Dundee.
7. Allred, C. E. and Menzel, E. R. 1997. A novel europium-bioconjugate method for
latent fingerprint detection. Forensic Science International. 85 (2): pp. 83-94.
8. Almog, J., Azoury, M. Elmaliah, Y. Berenstein, L and Zaban, A. 2004.
Fingerprints’ third dimension: the depth and shape of fingerprints penetration
into paper – cross section examination by fluorescence microscopy. Journal of
Forensic Science. 49 (5): pp. 1-5.
9. American Association of Textile Chemists and Colorists (AATCC). 2006. Water
resistance: rain test. AATCC test method 35-2006. [online pdf]. Available from:
http://elearning.zjff.net/suite/resource/download.do?key=454395. [Accessed
20 October 2013].
10. American Fiber Manufacturers Association / Fiber Economics Bureau
(AFMA/FEB). 2012a. Nylon fiber. [online]. Available from:
http://www.fibersource.com/f-tutor/nylon.htm [Accessed 3 May 2013].
11. American Fiber Manufacturers Association / Fiber Economics Bureau
(AFMA/FEB). 2012b. Rayon fiber (viscose). [online]. Available from:
http://www.fibersource.com/f-tutor/nylon.htm [Accessed 3 May 2013].

293
12. Anon. [no date]. Irish linen – The fabric of Ireland. Properties. [online].
Available from: http://www.irishlinenmills.com/Products/properties.htm
[Accessed 1 May 2013].
13. Anon. 2013. Latent fingerprint processing techniques – selection & sequencing
guide. Chesapeake Bay Division of the International Association for
Identification. Cited in: Czekanski, P., Fasola, M. and Allison, J. 2006. A
mechanism model for the superglue fuming of latent fingerprints. Journal of
Forensic Sciences. 5 (6): pp. 1323-1328.
14. Arrowhead Forensics. 2010. CN-Yellow Pellets. [online]. Available at:
http://www.crime-scene.com/store/A-CNYP-1.shtml [Accessed 21 June 2013].
15. Babler, W. J. 1987. Prenatal development of dermatoglyphic digital patterns:
associations with epidermal ridge, volar pad and bone morphology. Collegium
Antropologicum. 11(2): pp. 297-304.
16. Bandey, H. and Kent, T. 2003. Superglue treatment of crime scenes a trial of
the effectiveness of the Mason Vactron SUPERfume process. Home Office Police
Scientific Development Branch. Publication No. 30/03.
17. Barlow, A. 1879. The history and principles of weaving by hand and by power.
London: S. Low.
18. Barnes, J. G. 2011. History. In: McRoberts, A., ed. The fingerprint sourcebook.
National Institute of Justice; Washington DC. 2011, pp. 1-1 to 1-18.
19. Barnett, P. D. and Berger, R. A. 1977. The effects of temperature and humidity
on the permanency of latent fingerprints. Journal of Forensic Science Society.
16 (3): pp. 249-254.
20. Batey, G., Copeland, J., Donnelly, D., Hill, C., Laturnus, P., Miller, C., Misner, K.,
Tario, A. and Yamashita, A. 1998. Metal deposition for latent print
development. Journal of Forensic Identification. 48 (2): pp. 165-175.
21. BBC NEWS Magazine. 2012. Who What Why: How durable is a fingerprint? [online].
Available from: http://www.bbc.co.uk/news/magazine-19740979 [Accessed 10
June 2013].
22. Becue, A., Champod, C. and Margot, P. 2007. Use of gold particles as molecular
intermediates for the detection of fingermarks. Forensic Science International
168 (2-3): pp. 169-176.
23. Becue, A., Scoundrianos, A., Champod, C. and Margot, P. 2008. Fingermark
detection based on the in situ growth of luminescent nanoparticles – towards a

294
new generation of multimetal deposition. Forensic Science International. 179
(1): pp. 39-43.
24. Bentolila, A., Totre, J., Zozulia, I., Levin-Elad, M and Domb, A. J. 2013.
Fluorescent cyanoacrylate monomers and polymers for fingermark
development. Macromolecules. 46 (12): pp. 4822–4828.
25. Bhoelai, B., de Jong, B. J., de Puit, M. and Sijen, T. 2011. Effect of commom
fingerprint detection techniques on subsequent STR profiling. Forensic Science
International: Genetics Supplement Series. 3 (1): e429-430.
26. Bille, T. W., Cromartie, C. and Farr, M. 2009. Effects of cyanoacrylate fuming,
time after recovery, and location of biological material on the recovery and
analysis of DNA from post-blast pipe bomb fragments. Journal of Forensic
Sciences. 54 (5): pp. 1059-67.
27. Biometrics National Science and Technology Council (NSTC). 2006. Palm print
recognition. [online]. Available from: http://www.biometrics.gov/documents
/biohistory.pdf [Accessed: 27 March 2013].
28. Bleay, S. M., Sears, V. G., Bandey, H. L., Gibson, A. P., Bowman, V. J.,
Downham, R., Fitzgerald, L., Ciuksza, T., Ramadani, J. and Selway, C. 2012.
Home Office Fingerprint Source Book. Sandridge: Home Office.
29. Bowman, V. (ed) 2005. Fingerprint development handbook. 2nd ed. Home Office
Scientific Development Branch (HOSDB): St Albans.
30. Bowman, V. (ed.), 2009. Manual of fingerprint development techniques, 2nd ed,
3rd revision, Luton: White Crescent Press Ltd.
31. Bratton, R. and Juhala, J. 1995. DFO-Dry. Journal of Forensic Identification. 45
(2): pp. 196-172.
32. Champod, C., Lennard, C., Margot, P., and Stoilović, M. 2004. Fingerprints and
other ridge skin impressions. London: CRC Press LLC.
33. Choi, M. J., McBean, Ng, P. H. R., McDonagh, A. M., Maynard, P. J., Lennard, C.
and Roux, C. 2008a. An evaluation of nanostructured zinc oxide as a
fluorescent powder for fingerprint detection. Journal of Materials Science. (2)
43: pp. 732-737.
34. Choi, M. J., McDonagh, A.M., Maynard, P. and Roux, C. 2008b. Metal-containing
nanoparticles and nano-structured particles in fingerprint detection. Forensic
Science International. 179 (2): pp. 87-97.
35. Choi, M. J., Smoother, T., Martin, A. A., McDonagh, A.M., Maynard, P. J.,
Lennard, C. and Roux, C. 2007. Fluorescent TiO2 powders prepared using a

295
new perylene Diimide dye: Applications in latent fingermark detection. Forensic
Science international. 175 (2-3): pp. 154-160.
36. Collins, L. E., Coles, R. E. and Stroud, P. T. 1973. The development of finger-
prints on cloths. Nuclear Research Note. No. 12/73, pp:1-32.
37. CRIMTAC, Commonwealth of Australia. 2011. Fingerprint Services. [online]
Available from: www.crimtac.gov.au/our_service/Fingerprints.html [Accessed 9
January 2013].
38. Cummings, H., Hollars, M. and Trozzi, T. 1995. Getting the most from
cyanoacrylate dyes. Journal of Forensic Identification. 43 (1): pp. 38-43.
39. Czekanski, P., Fasola, M. and Allison, J. 2006. A mechanism model for the
superglue fuming of latent fingerprints. Journal of Forensic Sciences. 51 (6):
pp. 1323-1328.
40. Dai, X., Stoilović, M., Lennard, C. and Speers, N. 2006. Vacuum metal
deposition: visualisation of gold agglomerates using TEM imaging. Forensic
Science International. 168 (2-3): pp. 219-222.
41. Daly, D. J., Murphy, C., McDermott, S. D. 2012. The transfer of touch DNA from
hands to glass, fabric and wood. Forensic Science International Genetic. 6 (1):
pp.41-46.
42. Davey, A. 2003. The forensic bulletin. The Australian and New Zealand Forensic
Science Society Inc. [online] Available from: http://www.nifs.com.au
/Publications/June03/NIFS_June2003.pdf [Accessed 18 March 2013].
43. Davidson, K. 2013. The Effect of Washing on Cyanoacrylate Fuming
Visualisation of Fingerprints on Fabric. [4th year dissertation]. University of
Abertay Dundee.
44. Day, J. S., Edwards, H. G. M., Dobrowski, S. A., Voice, A. M. 2004. The
detection of drugs of abuse in fingerprints using Raman spectroscopy II:
cyanoacrylate-fumed fingerprints. Spectochimica Acta Part A. 60 (8-9): pp.
1725-1730.
45. Deacon, P. 2012a. CAF visualised silk donor A box 18 sample displaying poor
ridge detail (1) and the same sample after FFT (2) with ridge detail enhanced
[photograph]. Dundee: SPAFS.
46. Deacon, P. 2012b. CAF visualised silk donor C box 5 sample displaying poor
ridge detail (1) and the same sample after FFT (2) with ridge detail enhanced
[photograph]. Dundee: SPAFS.
47. Deacon, P. 2013a. Day 2, donor one, nylon VMD visualised swatch. Image on
296
left taken with Nikon D50 – palmar flexion creases visible, though all marks are
empty. Image on right after FFT – ridge detail can now be seen in the
fingertips [photograph]. Dundee: SPAFS.
48. Deacon, P. 2013b. Day 2, donor fifteen, nylon VMD visualised swatch. Image
on left taken with Nikon D50 – showing limited ridge detail. Image on right
after FFT – showing enhanced ridge detail in palm and on fingers [photograph].
Dundee: SPAFS.
49. Dhananjay, D. M., Guru Rao, C. V. and Muralikrishna. 2011. Automated PolyU
palmprint sample registration and coarse classification. International Journal of
Computer Science. 8 (6): pp. 186-191.
50. Downham, R. 2011. Introduction presentations: review and what’s new. Paper
presented at: VMD users group meeting minutes, Sandridge, 17th January
51. Droual, R. 2012. Chapter 4 - Integumentary system. [online]. Available from:
http://droualb.faculty.mjc.edu/Lecture%20Notes/Unit%201/Integumentary%20
with%20figures.htm [Accessed 03 May 2013].
52. Edwards, P. F. 1976. The use of sputtered thin films in the development of
latent fingerprints on glass and polythene. Technical Memorandum. 43/76: pp.
1-18.
53. Fairley, C., Bleay, S. M., Sears, V. G. and NicDaeid, N. 2012. A comparison of
multi-metal deposition processes utilising gold nanoparticles and an evaluation
of their application to ‘low yield’ surfaces for finger mark development. Forensic
Science International. 217 (1-3): pp. 5-18.
54. Feist, A., Ashe, J., Lawrence, J., McPhee, D. and Wilson, R. 2007.
Investigating and detecting recorded offences of rape. Home Office Online
Report.
55. Fieldhouse, S., 2011. Consistency and reproducibility in fingermark deposition.
Forensic Science International. 207 (1-3): pp. 96-100.
56. Food and Agriculture Organization of the United Nations (FAO). 2009. Natural
fibres cotton. [online]. Available from: http://www.naturalfibres2009.org
/en/fibres/cotton.html. [Accessed 5 May 2013].
57. foster+freeman. 2013. Fingerprint fuming using PolyCyano UV. [online].
Available from: http://www.fosterfreeman.com/index.php?option=com_
phocadownload& view=category&download=731:usin [Accessed 21 June
2013].
297
58. Fraser, J., Sturrock, K., Deacon, P., Bleay, S. and Bremner, D. 2011.
Visualisation of fingermarks and grab impressions on fabrics. Part 1: gold/zinc
vacuum metal deposition. Forensic Science International. 208 (1-3): pp. 74-78.
59. Fraser, J., Deacon, P., Bleay, S. and Bremner, D. H. [in press] A comparison of
the use of vacuum metal deposition versus cyanoacrylate fuming for
visualisation of fingermarks and grab impressions on fabrics. Science and
Justice [online]. Available from: doi.org/10.1016/j.scijus.2013.11.005 [Accessed
16 December 2013].
60. Fung, T. C, Grimwood, K., Shimmon, R., Spindler, X., Maynard, P., Lennard, C.
and Roux, Claude. 2011. Investigation of hydrogen cyanide generation from the
cyanoacrylate fuming process used for latent fingermark detection. Forensic
Science International. 212 (1): pp. 143-149.
61. Gaensslen, R. E., Harris, H. A. and Lee, H. C. 2008. Introduction to forensic
science and criminalistics. McGraw Hill: London.
62. Ganson, A. and Godsell, J. W. 1973. Technical Note No. 1/72. Cited in: Ganson,
A. 1973. Latent fingerprints on paper and fabrics. Identification News. XXIII
(2): pp. 3-5.
63. Gao, D., Li, F., Song, J., Xu, X., Zhang, Q. and Niu, L. 2009. One step to detect
the latent fingermarks with gold nanoparticles. Talanta. 80 (2): pp. 479-483.
64. Garg, R. K., Kumari, H. and Kaur, R. 2011. A new technique for visualization of
latent fingerprints on various surfaces using powder from turmeric: a
rhizomatous herbaceous plant (Curcuma longa). Egyptian Journal of Forensic
Sciences. 1 (1): pp. 53-57.
65. Geijer, A. 1979. A history of textile art. London: Sotheby Parke Bernet for the
Pasold Research Fund.
66. Geno J. 2013. What is polyester. [online]. Available from:
http://www.whatispolyester.com/uses.html. [Accessed 12 May 2007].
67. Girod, A., Ramotowski, R. and Weyermann, C. 2013. Composition of fingermark
residue: A qualitative and quantitative review. Forensic Science International.
223 (1-3): pp. 10-24.
68. Global Forensics. 2013. LumiocyanoTM. [online]. Available from:
http://www.globalforensics.co.uk/lumicyano.htm [Accessed 16 April 2013].
69. Godfrey, S. 1992. The principles and practice of electrical epilation. Oxford:
Butterworth-Heinemann Ltd.

298
70. Godsell, J. W. 1972. Fingerprints – use of radio-active gas and vacuum metal
deposition for the development of latent fingerprints on paper and fabrics.
Police Research Bulletin. 19 (Spring): pp. 16-21.
71. Goray, M., Mitchell, R. J. and van Oorschott, R. A. 2010. Invesitgation of
secondary DNA transfer of skin cells under controlled test conditions. Legal
Mediine (Tokyo). 12 (3): pp. 117-120.
72. Grant, H., Springer, E. and Ziv, Z. 1996. Vacuum metal deposition inhibition on
polythene bags. In: Proceedings of the International Symposium on Fingerprint
Detection and Identification, Ne’urim, Israel. 1996, pp. 203-215. Cited in:
Jones, N., Stoilović, M., Lennard, C. and Roux, C. 2001. Vacuum metal
deposition: factors affecting normal and reverse development of latent
fingerprints on polyethylene substrates. Forensic Science International. 155 (1-
2): pp. 73-88.
73. Gros, L., Spring, M. and Deinet, W. 1995. Visualisation of latent fingerprints
with cyanoacrylate. Wiesbaden: Bundeskriminalamt.
74. Gunaratne, A., Knaggs, C. and Stansbury, D. 2007. Vacuum metal deposition:
comparing conventional gold/zinc VMD to aluminium VMD. Identification
Canada. 30 (2): pp. 40-63.
75. Hall, P. and Innes, J. 2011. 3 violent and sexual crime (second edition).
[online]. GOV.UK Available from: https://www.gov.uk/government
/uploads/system/uploads/attachment_data/file/116352/hosb1210-chap3.pdf
[Accessed 20 October 2013].
76. Hambley, D. S. 1972. The physics of vacuum evaporation development of latent
fingerprints. [PhD thesis]. The Royal Holloway College.
77. Harmon, K. 2009. Can you lose your fingerprints? Scientific American May
[online]. Available from: http://www.scientificamerican.com/article.cfm?
id=lose-your-fingerprints [Accessed 02 May 2013].
78. Hazarika, P., Jickells, S. M. and Russell, D. A. 2008. Rapid detection of drug
metabolites in latent fingermarks. Analyst. 134 (1): pp. 93-96.
79. Hazarika, P., Jickells, S. M., Wolff, K. and Russell D.A. 2008. Imaging of latent
fingerprints through the detection of drugs and metabolites. Angewandte
Chemie International Edition. 2008. 47 (5): pp. 10167-10170.
80. Hazarika, P., Jickells, S. M., Wolff, K. and Russell D.A. 2010. Multiplexed
detection of metabolites of narcotic drugs from a single latent fingermark.
Analytical Chemistry. 82 (22): pp. 9150-9154.

299
81. Hegde, R. R., Dahiya, A., Kamath, M. G., Kannadaguli, M. and Kotra, R. 2004.
Nylon fibers. [online]. Available from: http://www.engr.utk.edu/mse/pages
/Textiles/Nylon%20fibers.htm . [Accessed 6 May 2013].
82. Herschel, W. J. 1916. The origin of fingerprinting. London: Oxford University
Press.
83. Holyst, B. 1987. Kriminalistische abschätzung des spurenalters bei
fingerpapillarlinien. Archiv für Kriminologie, 179 (3-4): pp. 94–103. Quoted in:
Champod, C., Lennard, C., Margot, P., and Stoilović, M. 2004. Fingerprints and
other ridge skin impressions. London: CRC Press LLC.
84. Home Office Scientific Development Branch (HOSDB). 2005a. Silver VMD.
Fingerprint Development and Imaging Newsletter. 47 (Oct): pp. 8.
85. Home Office Scientific Development Branch (HOSDB). 2005b. Treatment of
fabrics. Fingerprint Development and Imaging Newsletter. 20 (Apr): pp. 6.
86. Houck, M. M. and Siegel, J. A. 2006. Fundamentals of forensic science.
Burlington: Elsevier Academic Press.
87. Hurst, M. 2002. Public Service review:PPP-2002 Identification in hand [online]
Available from: www.publicservice.co.uk/article.asp?publication=PPP&id
=93&content_name=Documentmanagement&article=2315 [Accessed 29 March
2013].
88. Hueso, L., Sanmartin, O., Nagore, E., Botella-Estrada, R., Requena, C.,
Llombart, B., Serra-Guillen, C., Alfaro-Rubio, A. and Guillen, C. 2008.
Chemotherapy-induced acral erythema: A clinical and histopathologic study of
44 cases. Actas Dermosifiliogr. 99 (4): pp. 281-90.
89. Israel National Police, Division of Identification and Forensic Science (DIFS).
2008. White Paper, new fluorescent cyanoacrylate monomers for the
development of fingerprints on non-porous surfaces. Cited in: Ramotowski, R.
2012. An evaluation of a novel one-step fluorescent superglue process. In:
International Association for Identification, Phoenix 26 July 2012. pp. 1-43.
[online]. Available from: http://onin.com/fp/one-step_fluorescent_cyano_
ramotowski_2012july.pdf [Accessed 12 November 2012].
90. Jackson, A. R. W. and Jackson, J. M. Forensic science. 3rd ed. Prentice Hall:
Harlow.
91. Jain, A. K., Prabhakar, S. and Pankanti, S. 2002. On the similarity of identical
twin fingerprints. Pattern Recognition. 35 (11): pp. 2653-2663.
92. Jain, A., K. and Feng, J. 2009. Latent palmprint matching. IEEE Transactions on

300
pattern analysis and machine intelligence. 31 (6): pp. 1032-1047.
93. Jelly, R., Patton, E. L. T., Lennard, C., Lewis, S. W. and Lim, K. F. 2009. The
detection of latent fingermarks on porous surfaces using amino acid sensitive
reagents: A review. Analytica Chimica Acta 652 (1-2): pp. 128-142.
94. Johnson, P. L. 1973. Life of latents. Identification News. 4 (XXIII): pp. 10-13.
95. Jones, B., J., Downham, R. and Sear, V. G. 2012. Nanoscale analysis of the
interaction between cyanoacrylate and vacuum metal deposition in the
development of latent fingermarks on low-density polyethylene. Journal of
Forensic Sciences. 57 (1): pp. 196-200.
96. Jones, N., Stoilović, M., Lennard, C. and Roux, C. 2001a. Vacuum metal
deposition: factors affecting normal and reverse development of latent
fingerprints on polyethylene substrates. Forensic Science International. 115 (1-
2): pp. 73-88.
97. Jones, N., Stoilović, M., Lennard, C. and Roux, C. 2001b. Vacuum metal
deposition: developing latent fingerprints on polyethylene substrates after the
deposition of excess gold. Forensic Science International. 123 (1): pp. 5-12.
98. Jones, N., Mansour, D., Stoilović, M., Lennard, C. and Roux, C. 2001c. The
influence of polymer type, print donor and age on the quality of fingerprints
developed on plastic substrates using vacuum metal deposition. Forensic
Science International. 124 (2-3): pp. 167-177.
99. Jones, N. 2002. Metal deposition techniques for the detection and enhancement
of latent fingerprints on semi-porous surfaces. [PhD thesis]. University of
Technology Sydney.
100. Jones, R. J. and Clark, L. C. 1975. PSDB Home Office Research Note
34/75. Cited in: Knowles, A. M. 1978. Aspects of physicochemical methods for
the detection of latent fingerprints. Journal of Physics E: Scientific Instruments.
11 (8): pp. 713-721.
101. Kamei, T. 2004. Image filter design for fingerprint enhancement. In:
Ratha, N. and Bolle, R, eds. Automatic fingerprint recognition systems. New
York: Springer. 2004. pp. 453-458.
102. Kelly L., Lovett, J. and Regan, L. 2005. A gap or a chasm? Attrition in
reported rape cases. Home Office Research, Development and Statistics
Directorate. [online] Available from: http://library.npia.police.uk/docs
/hors/hors293.pdf). [Accessed 23 January 2012].

301
103. Kent, K. and Stoilović, M. 1995. Development of latent fingerprints using
preferential DC sputter deposition. Forensic Science International. 72 (1): pp.
35-42.
104. Kent, T., Thomas, G. L., Reynoldson, T. E. and East, H. W. 1976. A
vacuum coating technique for the development of latent fingerprints on
polythene. Journal of the Forensic Science Society. 16 (2): pp. 93-101.
105. Kent, T. 1981. Latent fingerprints and their detection. Journal of the
Forensic Science Society. 21 (July): pp. 15-22.
106. Kent, T. 1990. Recent research on superglue, vacuum metal deposition
and fluorescence examination. Police Scientific Development Branch Report
(July): pp. 1-4.
107. Kent, T. 2010. Standardizing protocols for fingerprint reagent testing.
Journal of Forensic Identification. 60 (3):pp. 371-379.
108. Knaggs, C. 2007. Fingermarks developed on an apple (1) and duct tape
(2) using aluminium metal in the Adroit FC-300 [photograph]. Mississauga:
Linde Canada.
109. Knaggs, C. 2012a. Grabs on nylon visualised with dye sublimation in the
Adroit FC-300. Donor one (1) has a full hand and palmar flexion creases, but
no ridge detail in the fingers while donor two (2) only contains a faint finger
and thumb mark [photograph]. Mississauga: Linde Canada.
110. Knaggs, C. 2012b. Grabs on silk and linen visualised with dye
sublimation in the Adroit FC-300. The silk sample is a full hand with palmar
flexion creases and empty marks, while the linen only contains faint finger and
thumb marks with little palm [photograph]. Mississauga: Linde Canada.
111. Knighting, S., Fraser, J., Sturrock, K., Deacon, P., Bleay, S. and
Bremner, D. H. 2013. Visualisation of fingermarks and grab impressions on dark
fabrics using silver vacuum metal deposition. Science & Justice. 53 (3): pp.
309-314.
112. Kong, A. W., Zhang, D. and Lu, G. 2006. A study of identical twins’
palmprints for personal verification. Pattern Recognition. 39 (11): pp. 2149-
2156.
113. Kucken, M. and Newell, A. C. 2005. Fingerprint formation. Journal of
Theoretical Biology. 235 (1): pp. 71-83.
302
114. Kumari, H., Kaur, R. and Garg, R. K. 2011. New visualizing agents for
latent fingerprints: synthetic food and festival colors. Egyptian Journal of
Forensic Sciences. 1 (3-4): pp. 133-139.
115. Lee, H. C. and Gaensslen, R. E. (Ed). 2001. Advances in Fingerprint
Technology, 2nd Ed. CRC Press: Boca Raton.
116. Leggett, R., Lee-Smith, E. E., Jickells, S., M. and Russell D, A. 2007.
“Intelligent” fingerprinting: Simultaneous identification of drug metabolites and
individuals by using antibody-functionalized nanoparticles. Communications
Angewandte Chemie International Edition. 119 (22): pp. 4178-4181.
117. Lennard, C., Margot, P., Neri, R. and Taroni, F. 1992. Fingerprint
detection techniques: vacuum metal deposition-cyanoacrylate fuming. Colloque
International de Police Scientifique, 10.
118. Lennard, C. 2001. The detection and enhancement of latent
fingerprints. In: 13th INTERPOL Forensic Science Symposium, Lyon, France.
October 16-19 2001.
119. Li, H., He, X., Liu, Y., Huang, H., Lian, S., Lee, S. and Kang, Z. 2011a.
One-step ultrasonic synthesis of water-soluble carbon nanoparticles with
excellent photoluminescent properties. Carbon. 49 (2): pp. 605-609.
120. Li, H., He, X., Liu, Y., Yu, H., Kang, Z. and Lee, S. 2011b. Synthesis of
fluorescent carbon nanoparticles directly from active carbon via a one-step
ultrasonic treatment. Materials Research Bulletin. 46 (1): pp. 147-151.
121. Linacre, A., Pekarek, V., Swaran, Y. C., Tobe, S. S. 2010. Generation of
DNA profiles from fabrics without DNA extraction. Forensic Science
International: Genetics. 4(2): pp. 137-141.
122. Lock, E. R. A., Mazzella, W. D. and Margot, P. 1995. A new europium
chelate as a fluorescent dye for cyanoacrylate pretreated fingerprints –
EuTTAPhen: europium thenoyltrifluoro-acetone ortho-phenanthroline. Journal
of Forensic Sciences. 40 (4): pp. 654-658.
123. Lowe, A. Murray, C., Richardson, P., Wivell, R., Gill, P., Tully, G. and
Whitaker, J. 2003. Use of low copy number DNA in forensic
inference. International Congress Series. 1239 (3): pp. 799-801.
124. Marsh, J. T. 1966. An introduction to textile finishing. 2nd ed. London:
Chapman and Hall Ltd.
125. Martijn. 2012. Friction ridge biology lesson. [online image]. Available
from: http://www.modernhandreadingforum.com/t1633p45-composites-loops-

303
whorls-central-pockets-lateral-pockets-twin-loops-accidentals. [Accessed 23
March 2012).
126. Masters, N. and DeHaan, J. 1996. Vacuum metal deposition (VMD) and
cyanoacrylate detection of older latent prints. Journal of Forensic Identification.
46 (1): pp. 32-45.
127. Mayo Clinic. 2013. Sweat glands. [online image]. Available from:
http://www.mayoclinic.com/health/medical/IM00027 [Accessed 30 April 2013].
128. Mazzella, W. and Lennard, C. 1995. An Additional Study of
Cyanoacrylate Stains. Journal of Forensic Identification. 5 (1): pp. 5-18.
129. Menzer, V. [no date]. Valerie Menzer’s mse222 nylon 66 webpage.
[online]. Available from: http://web.archive.org/web/20041230231859/
http://www.aml.arizona.edu/classes/mse222/1998/nylon66/mse222.htm
[Accessed 1 May 2013].
130. Misner, A. 1992. Latent fingerprint detection on low density
polyethylene comparing vacuum metal deposition to cyanoacrylate fuming and
fluorescence. Journal of Forensic Identification. 42 (1): pp. 26-33.
131. Misner, A. H. 1993. TM-15-93 Fingerprint detection using vacuum metal
deposition. [online] Available from: November. http://publications.gc.ca
/collections/collection_2007/ps-sp/PS63-1-1993-15E.pdf [Accessed 18 February
2006].
132. Mock, J. P. 1985. Cyanoacrylates and heat – a word of caution.
Fingerprint Whorld. 11 (41): pp. 16-17.
133. Murray, C., Lowe, A., Richardson, P., Wivell, R., Gill, P., Tully, G. and
Whitaker, J. [no date]. Use of low copy number (LCN) DNA in forensic
inference. Available from: http://www.promega.com/~/media/files/resources
/conference%20proceedings/ishi%2012/oral%20presentations/murray.pdf?la=e
n [Accessed 18 February 2010].
134. Murphy, M. P. 1991. A vacuum metal identification. Journal of Forensic
Identification. 5 (5): pp. 318-320.
135. Nanal, S., Y. 2012a. Textile technology::”Spinning” “Complete guide to
spinning mills” Cotton [online]. Available from:
http://textiletechinfo.com/spinning/WHATISCOTTON.htm [Accessed 5 May
2013].

304
136. Nanal, S., Y. 2012b. Textile technology::”Spinning” “Complete guide to
spinning mills” Polyester [online]. Available from: http://textiletechinfo.com
/spinning/POLYESTERmanu.htm [Accessed 5 May 2013].
137. National Cotton Council of America (NCCA). 2013. The story of cotton
History of cotton. [online]. Available from http://www.cotton.org
/pubs/cottoncounts/story/upload/The-Story-of-Cotton-Hi-Res-642k-PDF.pdf
[Accessed 5 May 2013].
138. Needles, H. L. 1981. Handbook of textile fibers, dyes, and finishes.
Garland STPM Press: London.
139. Ng, P. H. R., Walker, S., Tahtouh, M. and Reedy, B. 2009. Detection of
illicit substances in fingerprints by infrared spectral imaging. Analytical and
Bioanalytical Chemistry. 394 (8): pp. 2039-2048.
140. Nibouche, O., Jiang, J. and Trundle, P 2012. Analysis of performance of
palmprint matching with enforced sparsity. Digital Signal Processing. 22 (2): pp.
348-355.
141. Nibouche, O. and Jiang, J. 2013. Palmprint matching using feature
points and SVD factorisation. Digital Signal Processing. 23 (4): pp. 1154–1162.
142. Nousbeck, J., Burger, B., Fuchs-Telem, D., Pavlovsky, M., Fenig, S.
Sarig, O., Itin, P. and Sprecher, E. 2011. A mutation in a skin-specific isoform of
SMARCAD1 causes autosomal-dominant adermatoglyphia. The American
Journal of Human Genetics. 89 (2): pp. 302-307.
143. Odyseos, K. 2006. Police get full access to palm print records. [online]
Available from: www.sciencedirect.com/science/article/pii/SO96947650670
4994# [Accessed 29 March 2013].
144. Office for National Statistics. 2013. Statistical bulletin: focus on violent
crime and sexual offences, 2011/12. [online]. Office for National Statistics.
Available from: http://www.ons.gov.uk/ons/rel/crime-stats/crime-
statistics/focus-on-violent-crime/stb-focus-on--violent-crime-and-sexual-
offences-2011-12.html [Accessed 20 October 2013].
145. Paine, M., Bandey, H. L., Bleay, S. M and Wilson, H. 2011. The effect of
relative humidity on the effectiveness of the cyanoacrylate fuming process for
fingerprint development and on the microstructure of the developed marks.
Forensic Science International. 212 (1-3): pp. 130-142.
146. Pepper, I. K. 2010. Crime scene investigation. 2nd ed. Open University
Press: Berkshire.
305
147. Pesaresi, M., Buscemi, L., Alessandrini, F., Cecati, M. and Tagliabracci,
A. 2003. Qualitative and quantitative analysis of DNA recovered from
fingerprints. International Congress Series. 1239 (January): pp. 947-951.
148. Philipson, D. and Bleay, S. 2007. Alternative metal processes for vacuum
metal deposition. Journal of Forensic Identification. 57 (2): pp. 252–273.
149. Quinones Garcia, I. 2011. Properties and forensic applications of touch
DNA. [PhD thesis]. King’s College London.
150. Quinones, I. and Daniel, B. 2012. Cell free DNA as a component of
forensic evidence recovered from touched surfaces. Forensic Science
International Genetic. 6 (1): pp.26-30.
151. Ramotowski, R (Ed). 2013. Lee and Gaensslen's Advances in Fingerprint
Technology. Boca Raton: CRC Press.
152. Ramotowski, R. S. 2001. Composition of Latent Print Residue. In: H. C.
Lee, and R. E. Gaensslen, eds. Advances in fingerprint technology. 2nd ed. Boca
Raton: CRC Press LLC. 2001, pp. 63-104.
153. Ray, S C, Saha, A., Jana, N. R. and Sarkar, R. 2009. Fluorescent carbon
nanoparticles: synthesis, characterization, and bioimaging application. The
Journal of Physical Chemistry. 113 (43): pp. 18546-18551.
154. Raymond, J. J., van Oorschot, R., A., H., Gunn, P. R., Walsh, S., J. and
Roux, C. 2009. Trace evidence characteristics of DNA: A preliminary
investigation of the persistence of DNA at crime scenes. Forensic Science
International: Genetics. 4 (1): pp. 26-33.
155. Raymond, J. 2010a. Pink polyester fabric grab sample visualised using
VMD and photographed under white light, showing only a faint grab and limited
detail [photograph]. Sydney: NSW Police.
156. Raymond, J. 2010b. The same pink polyester fabric grab as in figure
3.33 photographed using cross-polarised lights, shows a clearer and more
obvious grab [photograph]. Sydney: NSW Police.
157. Raymond, J. 2010c. The same pink polyester fabric grab from figure
3.33 showing further enhancement by photographing using a FFT filter. Both
the hand and ridge detail is more obvious with FFT than with either white or
cross-polarised light [photograph]. Sydney: NSW Police.
158. Raymond, J. 2010d. Brown cotton fabric grab sample visualised using
VMD photographed with white light on white background, showing an
extremely faint hand mark with little detail [photograph]. Sydney: NSW Police.

306
159. Raymond, J. 2010e. Brown cotton fabric grab sample visualised using
VMD photographed with white light on black background. Here the hand
became a little more obvious with the introduction of a darker background
[photograph]. Sydney: NSW Police.
160. Raymond, J. 2010f. Brown cotton grab sample visualised using VMD
photographed with white light on black background after inverse FFT. This
combination of coloured background and FFT led to a more obvious hand mark
with clearer ridge detail [photograph]. Sydney: NSW Police.
161. Ryan, S. R. 2012. Touch DNA. What is it? Where is it? How much can be
found? Amd how can it impact my case. A question and answer guide to all
things touch DNA [online]. Available from: http://www.ryanforensicdna.com
/yahoo_site_admin/assets/docs/Touch_DNA_article.59101908.pdf [Accessed 17
February 2012].
162. Sametband, M., Itzhak, Banin, U., Mandler, D. and Almog, J. 2007.
Application of nanoparticles for the enhancement of latent fingerprints.
Chemical Communications. 11 (February): pp. 1142-1144.
163. SaskFlax. [no date]. Overview of World Fiber Markets. [online].
Available from: http://www.saskflax.com/worldfibermarket_overview.html
[Accessed 3 May 2013].
164. Saunders, K. J. 1998. Organic polymer chemistry an introduction to the
organic chemistry of adhesives, fibres, paints, plastics and rubbers. London:
Chapman and Hall.
165. Schnetz, B. and Margot P. 2001. Technical note: latent fingermarks,
colloidal gold and multimetal deposition (MMD) optimisation of the method.
Forensic Science International. 118 (1): pp. 21-28.
166. Schulz, M. M., Wehner, H. D., Reichert, W. and Graw, M. 2004.
Ninhydrin-dyed latent fingerprints as a DNA source in a murder case. Journal of
Clinical Forensic Medicine. 11 (4): pp. 202-204.
167. Scottish Police Services Authority (SPSA). 2006a. IDENT1 Technical
bulletin February 2006 [online]. Available from: http://www.spsa-
forensics.police.uk/about/current_projects/ident1 Accessed [28 May 2008].
168. Scottish Police Services Authority (SPSA). 2006b. IDENT1 Technical
bulletin. October 2006. [online]. Available from: http://www.spsa-
forensics.police.uk/about/current_projects/ident1 Accessed [28 May 2008].
169. Scottish Police Services Authority (SPSA). 2007. IDENT1 Technical
307
bulletin. March 2007. [online]. Available from: http://www.spsa-
forensics.police.uk/about/current_projects/ident1 Accessed [28 May 2008].
170. Sears, V. G, Bleay, S. M., Bandey, H.L. and Bowman, V. J. 2011. A
methodology for finger mark research. Science and Justice. 52 (3): pp. 145-
160.
171. Sedaris, D. 1997. Holidays on ice. London: Little, Brown and Company.
172. Sewell, J., Quinones, I., Ames, C., Multaney, B., Curtis, S., Seeboruth,
H., Moore, S. and Daniel, B. 2008. Recovery of DNA and fingerprints from
touched documents. Forensic Science International: Genetics. 2 (4): pp. 281-
285.
173. Shalhoub, R., Quinones, I., Ames, C., Multaney, B., Curtis, S.,
Seeboruth, H., Moore, S. and Daniel. B. 2008. The recovery of latent
fingermarks and DNA using a silicone-based casting material. Forensic Science
International. 178 (2-3): pp. 99-203.
174. Simmons, M. 1978. Dyes and dyeing. London: Van Nostrand Reinhold.
175. Smith, G. 1989. Thin film deposition for fingerprint detection in criminal
investigation. In: Proceedings of the Society of Vacuum Coaters 32nd Annual
Technology Conference Proceedings. April 24-28, St. Louis, USA pp.: 320-324.
176. Smith, J. A. [no date]. [online] Available from:
http://web.archive.org/web/20100331124255/http://ohioline.osu.edu/hyg-
fact/5000/5538.html [Accessed 6 May 2013].
177. Spindler, X., Hofstetter, O. McDonagh, A.M., Roux C. and Lennard C.
Enhancement of latent fingermarks on non-porous surfaces using anti-L-amino
acid antibodies conjugated to gold nanoparticles. Chemical Communications. 47
(April): pp. 5602-5604.
178. Stauffer, E., Becue, A., Singh, K. V., Thampi, K. R., Champod, C. and
Margot, P. 2007. Single-metal deposition (SMD) as a latent fingermark
enhancement technique: An alternative to multimetal deposition (MMD).
Forensic Science International. 168 (1): e5-e9.
179. Stein, C., Kyeck, S. H. and Henssge, C. 1996. DNA typing of fingerprint
reagent treated biological stains. Journal of Forensic Science. 41(6): pp. 1012-
1017.
180. Stokes, M. and Brennan, J. 1995. A free-standing cabinet for
cyanoacrylate fuming. Forensic Science International. 71 (3): pp. 181-190.
308
181. Streets, P. 2009. Example of a push deposition (A) on black cotton
visualised with CAF and BY40 and of a grab deposition (B) on black viscose
visualised with CAF and BY40, demonstrating the differences in appearance
between a push, with its straight thin fingers and a grab with the bend fingers
with their wider appearance. [Photograph]. Dundee: University of Abertay
Dundee.
182. Sun, Y., Zhou, B., Lin, Wang, W.W., Shiral Fernando, K A, Pathak, P.,
Meziani, M. J., Harruff, B.A., Wang, X., Luo, P. G., Yang, H., Kose, .E., Chen, B.,
Veca L. M. and Xie, S. 2006. Quantum-sized carbon dots for bright and
colourful photoluminescence. Journal of American Chemistry Society. 128 (24):
pp. 7756-7757.
183. Sutton, R., Glazzard, Z., Riley, D. and Buckley, K. 2013. Preliminary
analysis of the nature and processing of palm marks by a U.K. fingerprint
bureau. Journal of Forensic Sciences. 58 (6): pp. 1615-1620.
184. Swofford, H., Ballard, J., Beegle, C., Harbin, S. and Knaggs, C. 2012.
Latent print development using low pressure sublimation vapor deposition:
evaluation of a prototype system. Journal of Forensic Identification. 62 (6):pp.
642-659.
185. Tahtouh, M., Kalman, J. R., Roux, C., Lennard, C. and Reedy, B. J.
2005. The detection and enhancement of latent fingermarks using infrared
chemical imaging. Journal of Forensic Science. 20 (1): pp. 1-9.
186. Texwipe. 2011. Determination of basic weight, absorbency Texwipe
method 20. [online pdf]. Available from: http://www.texwipe.com/technical-
data/test-methods/test_method_20.aspx [Accessed 20 October 2013].
187. The Federal Bureau of Investigation (FBI). 2012. Fingerprint Pattern
type. [online image] Available from: http://www.fbi.gov/about-
us/cjis/fingerprints_biometrics/fingerprint-overview [Accessed 16 April 2013].
188. The Linde Group. 2013. Adroit FC-300 Features. Available from:
http://www.lindeadroit.com/en/features/adroit-features.html [Accessed 4
November 2013].
189. The Scottish Government. 2011. 3 the risk and characteristics of crime.
[online]. The Scottish Government. Available from:
http://www.scotland.gov.uk/Publications/2011/10/28142346/5 . [Accessed 20
October 2013].

309
190. Theaker, B. J., Hudson K. E and Frederick J. Rowell, F. J. 2008. Doped
hydrophobic silica nano- and micro-particles as novel agents for developing
latent fingerprints. Forensic Science International. 174 (1): pp. 26-34.
191. Theys, P., Turgis, Y., Lepareux, G. and Ceccaldi, P. F. 1968. New
technique for bringing out latent fingerprints on paper: vacuum metallization.
International Criminal Police Review Journal. 217 (April): pp. 106-108.
192. Thomas, G. L. 1973. The physics of fingerprints. The Criminologist. Vol
8, issue 30, pp. 21-38.
193. Thomas, G. L. 1978. The physics of fingerprints and their detection.
Journal of Physics E: Scientific Instruments. 11 (8): pp. 722-731.
194. Tian, L., Ghosh, D., Chen, W. Pradhan, S., Chang, X. and Chen, S. 2009.
Nanosized carbon particles from natural gas soot. Chemistry of materials. 21
(13): pp. 2803-2809.
195. Tikkanen, A. (ed). 2009. Encyclopaedia Britannica. Plain weave.
Available from: http://www.britannica.com/EBchecked/topic/462734/plain-
weave . [Accessed 23 March 2009].
196. Trevisan, A., A., Yuste, V., Hioellund, A. and Gelle, D. [no date]. Cocoon
silk: a natural architecture. [online]. Available from: http://www.senature.com
/research/publications/cocoon-silk-a-natural-architecture. [Accessed 22
February 2010].
197. Tri-Sis Inc. no date. Absorbent vs adsorbent. [online]. Available from:
http://www.tri-sis.ca/absorbent.html [Accessed 16 October 2013].
198. Trossarelli, L. 2010. The history of nylon [online]. Available from:
http://www.caimateriali.org/index.php?id=32 [Accessed 1 May 2013].
199. Turner, I. J., Burgess, M. A., Love, J. M and Lynch, P. T. 2010. Sputter
coating a viable alternative for the development of latent prints on non-porous
surfaces. Forensic Science Journal. 9 (1): pp. 19-24.
200. Vacca, J. R. 2007. Biometric technologies and verification systems.
Oxford: Elsevier Inc.
201. von Wurmb, N., Meissner, D. and Wegener, R. 2001. Influence of
cyanoacrylate on the efficiency of forensic PCRs. Forensic Science International.
124 (4): p. 11-16.
202. Wakelyn, P. J., Bertoniere, N., R., French, A. D., Thibodeaux, D. P.,
Triplett, B. A., Rousselle, M., Goynes, W. R., Edwards, J. V., Hunter, L.,
McAlister, D. D. and Gamble, G. R. 2007. Cotton Fibers. In: Lewin, L. ed.

310
Handbook of fiber chemistry. 3rd ed. London: Taylor and Francis. 2007, pp.
521-666.
203. Wargacki, S. P., Lewis, L. A. and Dadmun, M. D. 2007. Understanding
the chemistry of the development of latent fingerprints by superglue fuming.
Journal of Forensic Science. 52 (5): pp. 1057-1062.
204. Weaver, D. E. and Clary, E. J. 1993. A one step fluorescent
cyanoacrylate fingerprint development technology. Journal of Forensic
Identification. 43 (5): pp. 481-492.
205. Wertheim, K. 2011. Embryology and morphology of friction ridge skin.
In: McRoberts, A. The fingerprint sourcebook. National Institute of Justice;
Washington DC. 2011, pp. 1-3 to 3-26.
206. Wickenheiser, R. A and Challoner, C. M. (1999). Suspect DNA profiles
obtained from the handles of weapons recovered at crime scenes. In:
Proceedings of the 10th Annual Symposium on Human Identification, Lake
Buena Vista, Florida, October 1999. pp. 1-10. Available from:
https://www.promega.com/~/media/files/resources/conference%20proceeding
s/ishi%2010/oral%20presentations/09wickenheiser.pdf?la=en. [Accessed 22
April 2013].
207. Wilkinson, D. A. and Misner, A. H. 1993. TR-08-94 A comparison of
thenoyl europium chelate with ardrox and rhodamine 6G for the fluorescent
detection of cyanoacrylate fingerprints. [online] Available from:
http://publications.gc.ca/collections/collection_2008/ps-sp/PS63-2-1994-8E.pdf
[Accessed 09 July 2011].
208. Wilkinson, D. A. and Watkin, J. E. 1993. Europium aryl-β-diketone
complexes as fluorescent dyes for the detection of cyanoacrylate developed
fingerprints on human skin. Forensic Science International. 60 (1-2): pp. 67-79.
209. Wilkinson, D. 1996. TR-05-96 Advanced scientific research innovations
in cyanoacrylate stain technology. [online] Available from:
http://publications.gc.ca/collections/collection_2008/ps-sp/PS63-2-1996-5E.pdf
[Accessed 09 July 2011].
210. Wilkinson, D. 1999. A one-step fluorescent detection method for lipid
fingerprints; Eu(TTA)3·2TOPO. Forensic Science International. 99 (1): pp. 5-23.
211. Williams, G., Llwyd Dafydd, H. Watts, A. and McMurray, N. 2011. Latent
fingermark visualisation using reduced-pressure sublimation of copper
phthalocyanine. Forensic Science International. 204 (1-3): e28-e31.

311
212. Winter Silks. 2013. Silk Fabrics and Terms. [online]. Available from:
http://wintersilks.blair.com/custserv/custserv.jsp?pageName=SilkFabrics.
[Accessed 28 February 2009].
213. Wormack, C. 2012. In: Biometrics exhibition and conference 2011,
Identification as a service, Experiences of providing biometric services
nationally to policing and public safety in the United Kingdom 19 September
2012 [online] Available from: http://biometrics.org/bc2012/presentations
/Workshops/BCC2012Panel-NG-IDENT1Presentation.pdf . [Accessed 29 March
2013].
214. Yamashita, B. and French, M. 2011. Latent print development. In:
McRoberts, A. ed. The fingerprint source book. Washington: U.S. Department
of Justice. 2011, pp. 7-1 – 7-67.
215. Yoon, S., Feng, J. and Jain, A. K. 2012. Altered fingerprints: analysis
and detection. IEEE Transactions on Pattern Analysis and Machine Intelligence.
34 (3): pp. 451-464.
216. Young, P. 1980. Physics in police investigations. Physics Education. 15
(6): pp. 368-374.
217. Yu. I, Jou, S. Chen, C. Wang, K, Pang, L. and Liao, J. 2011.
Development of latent fingerprint by ZnO deposition. Forensic Science
International. 207 (1-3): pp. 14-18.
218. Zamir, A., Springer, E. and Glattstein, B. 2000. Fingerprints and DNA:
STR tying of DNA extracted from adhesive tape after processing for
fingerprints. Journal of Forensic Science. 45 (3): pp. 687-688.
219. Zamir, A. Oz, C. and Geller, B. 2000. Threat mail and forensic science:
DNA profiling from items of evidence after treatment with DFO. Journal of
Forensic Science. 45 (2): pp. 445-6.
220. Zhou, J., Chen, F., Wu, N. and Wu, C. 2009. Crease detection from
fingerprint images and its applications in elderly people. Pattern Recognition. 42
(5): pp. 896-906.

312
16. APPENDICES
16.1 Appendix 1 - DNA data from Ignacio Quinones Garcia
Table 16.1: SGM Plus DNA analysis of donor 2 containing DNA reference profile, analysis of treated sample (t2.1 and t2.2) as well as untreated sample (u2.1 and u2.2), along with dropin alleles (other).
2 t2.1 t2.2 u2.1 u2.2
Locus Allele
1 Allele
2 Allele
1 Allele
2 Other Allele
1 Allele
2 Other Allele
1 Allele
2 Other Allele
1 Allele
2 Other
D10S1248 14 15 14 15 13,16 14 15 14 15 13, 17 14 15 13, 16
vWA 17 19 17 19 14, 15 17 19 17 19 18 17 19 14, 18
D16S539 11 12 11 12 11 12 11 12 11 12
D2S1338 20 22 20 22 20 20 22 22
Amelogenin X X X X X X Y X X X X Y
D8S1179 12 13 12 13 11, 14 12 13 14 12 13 14 12 13 14
D2S11 31.2 32.2 31.2 28, 29 32.2 31.2 32.2 28 31.2 32.2
D18S51 15 15 15 15 15 15 15 15 15 15 18
D22S1045 15 16 15 16 16 15 16 15 16 11
D19S433 14 15.2 14 15.2 14 15.2 14 15.2 11, 12 14 15.2 12, 13
ThO1 9 9 9 9 9 9 9 9 9.3 9 9
FGA 21 21 21 21 20 21 21 21 21 20 21 21
D2S441 14 14 14 14 14 14 14 14 14 14
D3S1358 16 17 16 17 15 16 17 16 17 15 16 17 14
D1S1656 12 12 12 12 14.3 12 12 12 12 14 12 12 11
D1S391 18 18 18 18 18 18 18 18
31 11 27 2 32 11 31 12
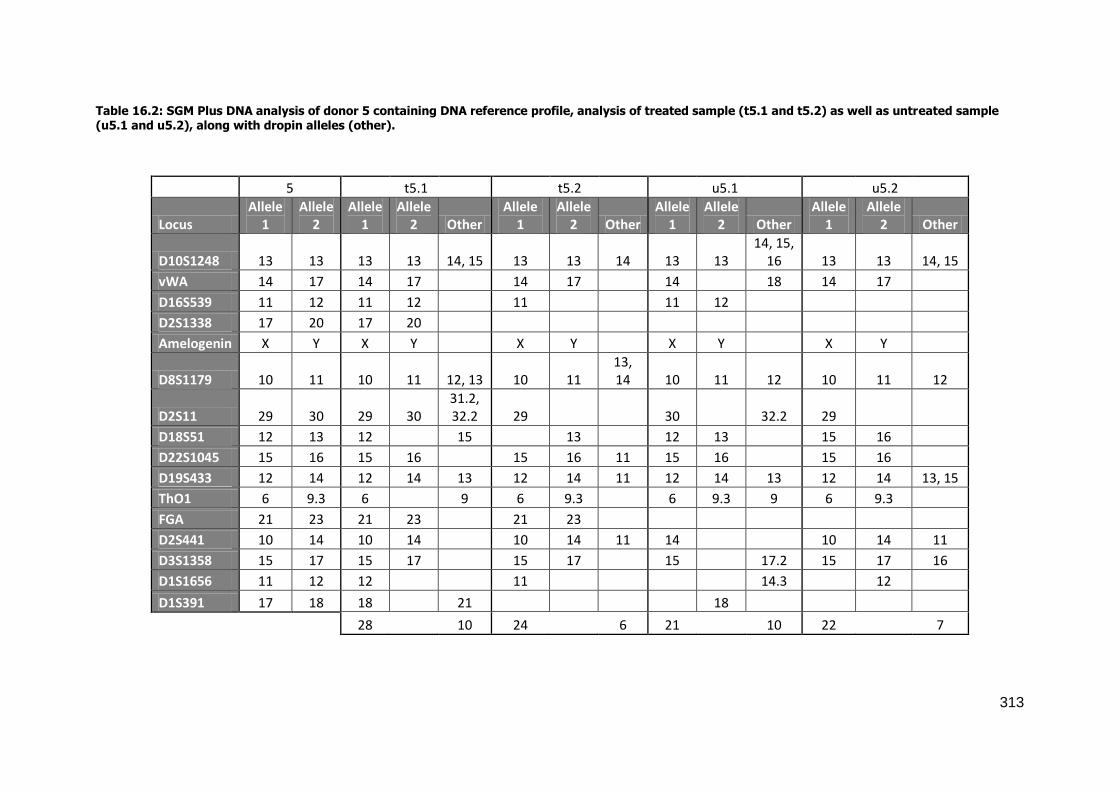
313
Table 16.2: SGM Plus DNA analysis of donor 5 containing DNA reference profile, analysis of treated sample (t5.1 and t5.2) as well as untreated sample (u5.1 and u5.2), along with dropin alleles (other).
5 t5.1 t5.2 u5.1 u5.2
Locus Allele
1 Allele
2 Allele
1 Allele
2 Other Allele
1 Allele
2 Other Allele
1 Allele
2 Other Allele
1 Allele
2 Other
D10S1248 13 13 13 13 14, 15 13 13 14 13 13 14, 15,
16 13 13 14, 15
vWA 14 17 14 17 14 17 14 18 14 17
D16S539 11 12 11 12 11 11 12
D2S1338 17 20 17 20
Amelogenin X Y X Y X Y X Y X Y
D8S1179 10 11 10 11 12, 13 10 11 13, 14 10 11 12 10 11 12
D2S11 29 30 29 30 31.2, 32.2 29 30 32.2 29
D18S51 12 13 12 15 13 12 13 15 16
D22S1045 15 16 15 16 15 16 11 15 16 15 16
D19S433 12 14 12 14 13 12 14 11 12 14 13 12 14 13, 15
ThO1 6 9.3 6 9 6 9.3 6 9.3 9 6 9.3
FGA 21 23 21 23 21 23
D2S441 10 14 10 14 10 14 11 14 10 14 11
D3S1358 15 17 15 17 15 17 15 17.2 15 17 16
D1S1656 11 12 12 11 14.3 12
D1S391 17 18 18 21 18
28 10 24 6 21 10 22 7

314
Table 16.3: SGM Plus DNA analysis of donor 6 containing DNA reference profile, analysis of treated sample (t6.1 and t6.2) as well as untreated sample (u6.1 and u6.2), along with dropin alleles (other).
6 t6.1 t6.2 u6.1 u6.2
Locus Allele
1 Allele
2 Allele
1 Allele
2 Other Allele
1 Allele
2 Other Allele
1 Allele
2 Other Allele
1 Allele
2 Other
D10S1248 15 16 15 16 13 16 15 16 15 16 14, 13
vWA 15 16 15 16 17 15 16 11, 17 15 16 17, 18
D16S539 11 11 11 11 11 11 11 11 11, 12
D2S1338 17 19 17 19 17 19 20, 22
Amelogenin X X X X X X X X Y X X Y
D8S1179 12 13 12 13 12 13 12 13 10
D2S11 29 31 29 31 32.2 31 24,
29.2 29 31 32.2
D18S51 16 17 16 17 9, 13 17 12
D22S1045 15 16 15 16 15 16 15 16 15 16
D19S433 13 14 13 14 13 14 15.2 13 14 13 14 15.2,
16
ThO1 9.3 9.3 9.3 9.3 9.3 9.3 9 9.3 9.3 9
FGA 19 22 19 22 19 21 20, 22
D2S441 11 12 11 12 11 12 11 12 14 11 12 14
D3S1358 16 17 16 17 16 17 16 17 15 16 17 15
D1S1656 11 16.3 11 16.3 12 16.3 17.3
D1S391 19 20 19 20 18
32 7 12 2 25 9 21 20

315
Table 16.4: SGM Plus DNA analysis of donor 9 containing DNA reference profile, analysis of treated sample (t9.1 and t9.2) as well as untreated sample (u9.1 and u9.2), along with dropin alleles (other).
9 t9.1 t9.2 u9.1 u9.2
Locus Allele
1 Allele
2 Allele
1 Allele
2 Other Allele
1 Allele
2 Other Allele
1 Allele
2 Other Allele
1 Allele
2 Other
D10S1248 14 15 14 15 13 14 14 15 13
vWA 17 17 17 17 19
D16S539 11 12 11 12 11
D2S1338 17 19 17 19 20
Amelogenin X X X X X X X X Y
D8S1179 11 11 13, 15
D2S11 27 30 30 30.2, 31.2
D18S51 12 18 15
D22S1045 11 11 16 11 11 14, 16
D19S433 14 14.2 14 13, 15 14
ThO1 9.3 9.3 7 9.3 9.3 9
FGA 21 22.2 14
D2S441 12 14 14 10, 11 12 14 11
D3S1358 15 17.2 16
D1S1656 12 14.3 12 12
D1S391 18 19.3 18
14 9 0 0 4 0 14 8

316
Table 16.5: SGM Plus DNA analysis of donor 11 containing DNA reference profile, analysis of treated sample (t11.1 and t11.2) as well as untreated sample (u11.1 and u11.2), along with dropin alleles (other).
11 t11.1 t11.2 u11.1 u11.2
Locus Allele
1 Allele
2 Allele
1 Allele
2 Other Allele
1 Allele
2 Other Allele
1 Allele
2 Other Allele
1 Allele
2 Other
D10S1248 15 17 15 17 14 15 17 15 16 15 17 13, 16
vWA 15 18 15 18 15 18 15 18 15 18 16
D16S539 10 12 10 12 10 12 10 12 10 12 11, 13
D2S1338 18 20 18 20 18 20 20 25
Amelogenin X Y X Y X Y X Y X X Y
D8S1179 13 13 13 13 14 13 13 13 13 12 13 13
D2S11 30 31 30 31 30 31 30 31 28,
32.2 30 31 29
D18S51 14 14 14 14 14 14 14 14 13, 15 14 14
D22S1045 15 15 15 15 15 15 15 15 16 15 15 16
D19S433 13 14 13 14 15.2 13 14 13 14 15.2 13 14
ThO1 7 9.3 7 9.3 7 9.3 9 7 9.3 9
FGA 23 25 23 25 21 23 25 20, 21 23 25 24
D2S441 10 13 10 14 10 13 10 13 12 10 13 14
D3S1358 15 15 15 15 16 15 15 15 15 17 15 15 16, 17
D1S1656 17 17.3 17 17.3 12 17 17.3 17 12 17 17.3 15.3
D1S391 19 21 19 21 18 19 21 20
29 7 32 0 22 15 31 15

317
Table 16.6: SGM Plus DNA analysis of donor 13 containing DNA reference profile, analysis of treated sample (t13.1 and t13.2) as well as untreated sample (u13.1 and u13.2), along with dropin alleles (other).
13 t13.1 t13.2 u13.1 u13.2
Locus Allele
1 Allele
2 Allele
1 Allele
2 Other Allele
1 Allele
2 Other Allele
1 Allele
2 Other Allele
1 Allele
2 Other
D10S1248 13 14 13 14 16 13 14 13 14 15 14
vWA 17 17 17 17 17 17 19 17 17 19 15
D16S539 10 11 10 11 10 11 11
D2S1338 17 17 17 17 20 17 17
Amelogenin X Y X Y X X Y X X Y
D8S1179 11 13 11 13 14 11 13 14 11 13 12 13 12
D2S11 29 31.2 29 31.2 29 31.2 31.2 29 27
D18S51 18 18 18 18 15 18 18 12 18 18 13
D22S1045 15 17 15 17 16 15 11 15 17 16 15 16
D19S433 12 13 12 13 14 12 13 14 12 13 15.2 13 14
ThO1 9 9.3 9 9.3 6 9 9.3 8 9 9.3
FGA 20 22 20 22 21 20 22 21 20 21 20 19
D2S441 10 11 10 11 14 10 11 14 10 11 14 14
D3S1358 16 17 16 17 15 16 17 16 17 16 15
D1S1656 15 15.3 15 15.3 17.3 15 15.3 12 12 13,
17.3
D1S391 20 21 20 21 18 17 18 20.3
32 13 28 11 20 9 11 11

318
Table 16.7: SGM Plus DNA analysis of donor 15 containing DNA reference profile, analysis of treated sample (t15.1 and t15.2) as well as untreated sample (u15.1 and u15.2), along with dropin alleles (other).
15 15.1t 15.2t 15.1u 15.2u
Locus Allele
1 Allele
2 Allele
1 Allele
2 Other Allele
1 Allele
2 Other Allele
1 Allele
2 Other Allele
1 Allele
2 Other
D10S1248 13 16 13 16 14, 17 13 13 16 14, 17 13 16 15
vWA 17 18 17 18 16, 15, 19 17 18 16, 19 17 18 19
D16S539 9 11 11 12, 14 12 9 11 12
D2S1338 21 24 21 24
Amelogenin X Y X Y X Y X Y X Y
D8S1179 12 14 12 14 10, 13 14 12 14 13 12 14 13
D2S11 30 30.2 30 28, 31.2 30 30.2 28 30 30.2 29
D18S51 14 15 14 15
D22S1045 14 16 14 16 15 14 16 16 11, 15,
17 14 16 15
D19S433 15 15 11, 12, 13,14 15 15 14 13, 14 15 15 14, 13
ThO1 6 9.3 9.3 9.3 6 9.3 9 6 9.3 9
FGA 18 24 21, 13 21 21 18 24 21
D2S441 10 14 10 14 11 10 14 10 14 11, 15 10 14 12
D3S1358 15 17 15 17 16, 18 17 15 17 16 15 17 16
D1S1656 13 13 12 12, 16.3 13 13 12
D1S391 18 24 18 17 18 20.3 17.3
18 20 12 2 19 19 30 14
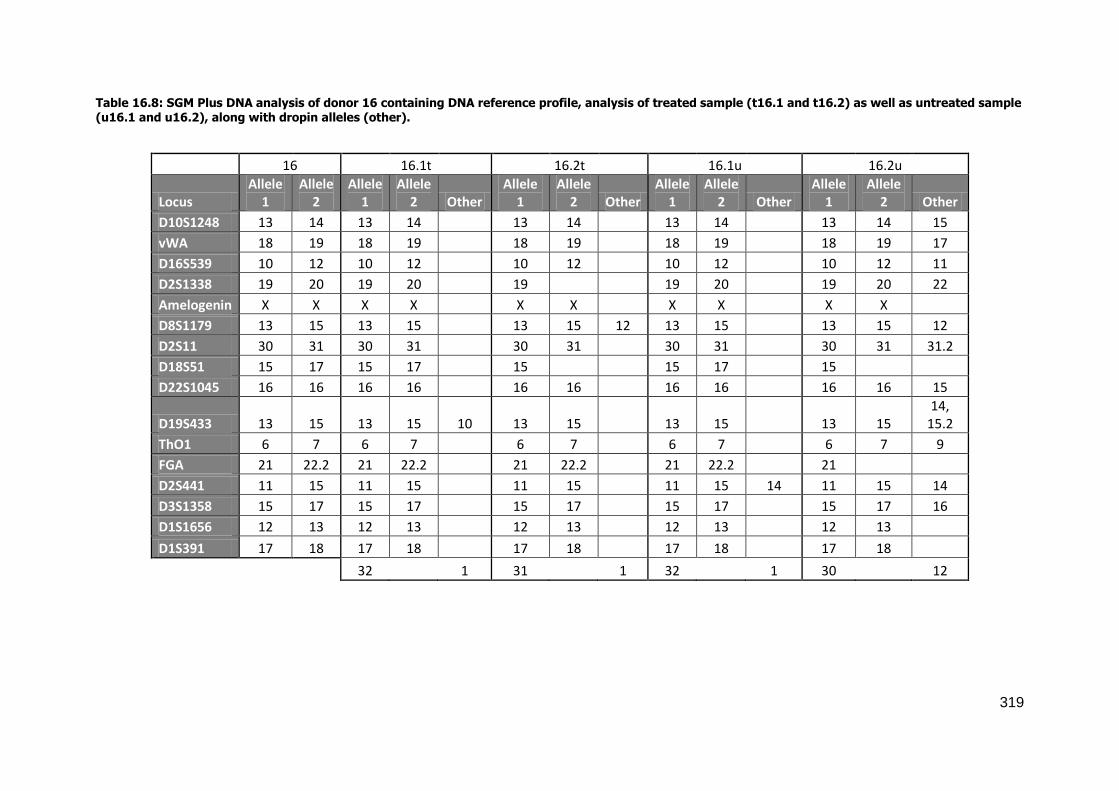
319
Table 16.8: SGM Plus DNA analysis of donor 16 containing DNA reference profile, analysis of treated sample (t16.1 and t16.2) as well as untreated sample (u16.1 and u16.2), along with dropin alleles (other).
16 16.1t 16.2t 16.1u 16.2u
Locus Allele
1 Allele
2 Allele
1 Allele
2 Other Allele
1 Allele
2 Other Allele
1 Allele
2 Other Allele
1 Allele
2 Other
D10S1248 13 14 13 14 13 14 13 14 13 14 15
vWA 18 19 18 19 18 19 18 19 18 19 17
D16S539 10 12 10 12 10 12 10 12 10 12 11
D2S1338 19 20 19 20 19 19 20 19 20 22
Amelogenin X X X X X X X X X X
D8S1179 13 15 13 15 13 15 12 13 15 13 15 12
D2S11 30 31 30 31 30 31 30 31 30 31 31.2
D18S51 15 17 15 17 15 15 17 15
D22S1045 16 16 16 16 16 16 16 16 16 16 15
D19S433 13 15 13 15 10 13 15 13 15 13 15 14,
15.2
ThO1 6 7 6 7 6 7 6 7 6 7 9
FGA 21 22.2 21 22.2 21 22.2 21 22.2 21
D2S441 11 15 11 15 11 15 11 15 14 11 15 14
D3S1358 15 17 15 17 15 17 15 17 15 17 16
D1S1656 12 13 12 13 12 13 12 13 12 13
D1S391 17 18 17 18 17 18 17 18 17 18
32 1 31 1 32 1 30 12

320
Table 16.9: SGM Plus DNA analysis of donor 20 containing DNA reference profile, analysis of treated sample (t20.1 and t20.2) as well as untreated sample (u20.1 and u20.2), along with dropin alleles (other).
20 20.1t 20.2t 20.1u 20.2u
Locus Allele
1 Allele
2 Allele
1 Allele
2 Other Allele
1 Allele
2 Other Allele
1 Allele
2 Other Allele
1 Allele
2 Other
D10S1248 16 17 16 17 15 16 17 14, 15 16 17 15
vWA 18 19 18 19 17 18 19 18 19 14, 15 18 19
D16S539 11 12 11 12 11 12 11 12 13 11 12
D2S1338 17 17 17 17 17 17 22 17 17 20 17 17
Amelogenin X Y X Y X Y X Y
D8S1179 10 14 10 14 13 10 14 12 10 14 12, 13 10 14 11, 13,
14
D2S11 27 29 27 29 27 29 27 29 31.2
D18S51 14 18 14 18 14 18 13 14 18
D22S1045 15 16 15 16 15 16 15 16 15 11
D19S433 13 14 13 14 12 13 14 13 14 12
ThO1 7 8 7 8 7 8 6 7 8 9
FGA 22 25 22 25 22 25 22 25 24
D2S441 11 15 11 15 14 11 15 14 11 15 14 11 15 14
D3S1358 15 16 15 16 15 16 15 16 17
D1S1656 14 17.3 14 17.3 14 17.3 14 17.3 16.3
D1S391 22 25 22 25 22 25 18 22 25 18
32 5 12 3 32 12 31 13

16.2 Appendix 2 - Publications
The published articles in Appendix 2 (pp. 321-337 ) have been removed to comply with UK Copyright Law. The article citations are listed below.
16.21
Fraser, J., Sturrock, K., Deacon, P., Bleay, S. and Bremner, D. H. 2011. Visualisation
of fingermarks and grab impressions on fabrics. Part 1: Gold/zinc vacuum metal
deposition. Forensic Science International. 208(1): pp. 74-78.
doi:10.1016/j.forsciint.2010.11.003
16.22
Knighting, S., Fraser, J., Sturrock, K., Deacon, P., Bleay, S and Bremner, D. 2013.
Visualisation of fingermarks and grab impressions on dark fabrics using silver
vacuum metal deposition. Science and Justice. 53(3): pp. 309-314.
doi:10.1016/j.scijus.2013.01.002
16.23
Fraser, J., Deacon, P., Bleay, S. and Bremner, D. H. 2014. A comparison of the use
of vacuum metal deposition versus cyanoacrylate fuming for visualisation of
fingermarks and grab impressions on fabrics. Science and Justice. 54(2): pp. 133-
140. doi:10.1016/j.scijus.2013.11.005
Copyright © 2022 FDOKUMEN