Electrokinetic properties of textile fabrics
7
© Color. Technol., 121 (2005) 221 Web ref: 20050408 Coloration Technology Society of Dyers and Colourists Electrokinetic properties of textile fabrics Ana Marija Grancaric,* Anita Tarbuk and Tanja Pusic University of Zagreb, Faculty of Textile Technology, Pierottijeva 6, 10000 Zagreb, Croatia Email: [email protected] Received: 1 March 2005; Accepted: 31 May 2005 This paper reports electrokinetic phenomena concerning the properties of textile fabrics that are crucial for dyeing and finishing processes. These interface phenomena influence the adsorption of surfactants, optical brighteners, dyes and finishing agents due to interaction forces between the fibre surface and solution. Zeta potential, isoelectric point, point of zero charge and the amount of surface charge of standard adjacent fabrics (cotton, wool, viscose rayon, polyamide, polyester and acrylic) have been determined. Electrokinetic potential was measured by a method involving streaming potential/current using an electrokinetic analyser. The specific amount of surface charge was calculated by a back- titration method. Introduction The electrokinetic properties of textile fabrics are important from a dyeing and finishing point of view. In these processes the zeta potential, i.e. the electrokinetic surface charge of the fabric, as well as the strength of fibre bonds play an important role. The electrokinetic potential is part of the total potential drop occurring in the intermediate surface layer at the boundary of the solid/liquid phases as a consequence of the ions distributing from the solid surface to the liquid mass. At the interface of an electrically charged textile fabric and an aqueous solution of electrolyte, surfactants or dyes form an electric double layer. Moving one of these two charged surfaces results in an electrokinetic (zeta) potential. Zeta () potential is not a constant value for textiles, but gives information about the nature and dissociation of functional groups, hydrophilicity or hydrophobicity of the fibre surface, as well as ions or water sorption. This potential plays an important role in the electrical characterisation of textiles in wet processing [1–17]. Fibre sorption properties are influenced by the molecular (chemical structure, molecular mass, number of functional groups) as well as the supramolecular structure of the fibre (molecular orientation, degree of crystallinity, crystallite dimensions, portion of amorphous regions, size and shape of voids, etc.). A significant influence on the sorption properties of fibres is the amount of accessible groups (i.e. hydroxy, carboxy, sulphate and amino groups) and the portion of amorphous regions where the adsorption processes take place [2–10,16,17]. In general, specific adsorption of ions or dissociation of surface groups in aqueous solution results in a surface charge. Fibre surface charge depends upon the molecular and supramolecular structure and swelling capacity, as well as upon ionogenity, structure and concentration of adsorbate. Wet treatments change the fibre surface charge as well as zeta potential and adsorption ability [2,5,17– 21]. There are a number of zeta potential measurement principles, including electrophoresis, sedimentation potential, electro-osmosis, streaming current/potential, potential of colloidal vibration and electrokinetic sound amplitude. In most cases, the methods of streaming current/ potential or electro-osmosis are used for fibres, whereas electrophoresis is used for dyes [1–8]. The streaming current/potential method is satisfactory and mostly used for measuring zeta potential of fibres because it linearly depends on pressure (both amount applied and direction), the results are reproducible, and changes in electrolyte solution do not have any effect [1,5]. Compared with streaming potential, electro-osmosis has been used less frequently for the measurement of fibre zeta potential, mainly because of the associated change of electrolyte solution properties. Nevertheless, methodical work was carried out during the 1970s achieving reproducible results [1,5–8]. Androsov et al. compared the electro-osmosis and streaming potential when determining the zeta potential of several fibres and different values were obtained under identical conditions [6–8]. Thus, the determination of zeta potential via a variety of methods can result in different values under the same conditions. It is interesting, however, that all methods give similar values of isoelectric point (IEP). The IEP is a numeric value of pH where the electrokinetic surface potential equals zero. For textile surfaces, where electrokinetic charge results from dissociation of e.g. hydroxy, carboxy and other fibre groups, the IEP differs from fibre to fibre, depending on pH, temperature and ion concentration in the electrolyte solution [1,5,21–24]. It is an important parameter in determining electrokinetic behaviour of solids and fibres in contact with electrolyte. The characterisation of textile fibre surfaces can also be carried out by point of zero charge (PZC). This represents
Transcript of Electrokinetic properties of textile fabrics

© Color. Technol., 121 (2005) 221Web ref: 20050408
ColorationTechnology
Society of Dyers and Colourists
Electrokinetic properties of textile fabricsAna Marija Grancaric,* Anita Tarbuk and Tanja PusicUniversity of Zagreb, Faculty of Textile Technology, Pierottijeva 6, 10000 Zagreb, CroatiaEmail: [email protected]
Received: 1 March 2005; Accepted: 31 May 2005
This paper reports electrokinetic phenomena concerning the properties of textile fabrics that are crucial for dyeing and fi nishing processes. These interface phenomena infl uence the adsorption of surfactants, optical brighteners, dyes and fi nishing agents due to interaction forces between the fi bre surface and solution. Zeta potential, isoelectric point, point of zero charge and the amount of surface charge of standard adjacent fabrics (cotton, wool, viscose rayon, polyamide, polyester and acrylic) have been determined. Electrokinetic potential was measured by a method involving streaming potential/current using an electrokinetic analyser. The specifi c amount of surface charge was calculated by a back-titration method.
IntroductionThe electrokinetic properties of textile fabrics are important from a dyeing and finishing point of view. In these processes the zeta potential, i.e. the electrokinetic surface charge of the fabric, as well as the strength of fi bre bonds play an important role. The electrokinetic potential is part of the total potential drop occurring in the intermediate surface layer at the boundary of the solid/liquid phases as a consequence of the ions distributing from the solid surface to the liquid mass. At the interface of an electrically charged textile fabric and an aqueous solution of electrolyte, surfactants or dyes form an electric double layer. Moving one of these two charged surfaces results in an electrokinetic (zeta) potential. Zeta () potential is not a constant value for textiles, but gives information about the nature and dissociation of functional groups, hydrophilicity or hydrophobicity of the fibre surface, as well as ions or water sorption. This potential plays an important role in the electrical characterisation of textiles in wet processing [1–17]. Fibre sorption properties are infl uenced by the molecular (chemical structure, molecular mass, number of functional groups) as well as the supramolecular structure of the fi bre (molecular orientation, degree of crystallinity, crystallite dimensions, portion of amorphous regions, size and shape of voids, etc.). A significant influence on the sorption properties of fi bres is the amount of accessible groups (i.e. hydroxy, carboxy, sulphate and amino groups) and the portion of amorphous regions where the adsorption processes take place [2–10,16,17]. In general, specifi c adsorption of ions or dissociation of surface groups in aqueous solution results in a surface charge. Fibre surface charge depends upon the molecular and supramolecular structure and swelling capacity, as well as upon ionogenity, structure and concentration of adsorbate. Wet treatments change the fi bre surface charge
as well as zeta potential and adsorption ability [2,5,17–21]. There are a number of zeta potential measurement principles, including electrophoresis, sedimentation potential, electro-osmosis, streaming current/potential, potential of colloidal vibration and electrokinetic sound amplitude. In most cases, the methods of streaming current/potential or electro-osmosis are used for fi bres, whereas electrophoresis is used for dyes [1–8]. The streaming current/potential method is satisfactory and mostly used for measuring zeta potential of fi bres because it linearly depends on pressure (both amount applied and direction), the results are reproducible, and changes in electrolyte solution do not have any effect [1,5]. Compared with streaming potential, electro-osmosis has been used less frequently for the measurement of fi bre zeta potential, mainly because of the associated change of electrolyte solution properties. Nevertheless, methodical work was carried out during the 1970s achieving reproducible results [1,5–8]. Androsov et al. compared the electro-osmosis and streaming potential when determining the zeta potential of several fi bres and different values were obtained under identical conditions [6–8]. Thus, the determination of zeta potential via a variety of methods can result in different values under the same conditions. It is interesting, however, that all methods give similar values of isoelectric point (IEP). The IEP is a numeric value of pH where the electrokinetic surface potential equals zero. For textile surfaces, where electrokinetic charge results from dissociation of e.g. hydroxy, carboxy and other fi bre groups, the IEP differs from fi bre to fi bre, depending on pH, temperature and ion concentration in the electrolyte solution [1,5,21–24]. It is an important parameter in determining electrokinetic behaviour of solids and fi bres in contact with electrolyte. The characterisation of textile fi bre surfaces can also be carried out by point of zero charge (PZC). This represents
20050408_j21-05.indd 120050408_j21-05.indd 1 04/08/2005 15:42:5804/08/2005 15:42:58
222 © Color. Technol., 121 (2005) Web ref: 20050408
the necessary amount of cationic surfactant added to electrolyte solution to achieve zero charge at a specifi c pH (pH > 9). PZC depends on chemical fi bre composition also [2,9,10,14,19,22]. Immersed in water (pH 6.5–7.0), textile fibres show negative values of the zeta potential. By increasing pH the zeta potential becomes more negative. It is important to consider that the zeta potential depends on polymer nature, impurities and added fi nishing agents. The zeta potential values for fi bres vary from –10 to –60 mV. It depends on chemical fi bre composition, surface polarity, microstructure, porosity, specifi c surface, fi bre swelling capacity, interaction energy of the fi bre and solution, pH of the solution, electrolyte addition, etc. [3–5]. The next important electric parameter is the density of surface charge (σ) [5,16,20], which can be calculated according to Eqn 1 [16]:
s ez
=⎛
⎝⎜⎜⎜⎜
⎞
⎠⎟⎟⎟⎟⎟−
⎡
⎣
⎢⎢⎢
⎤
⎦
⎥⎥⎥
⎧⎨⎪⎪⎪
⎩⎪⎪⎪
⎫⎬⎪
0∑2 1RF
RT N
Z
Tjj
j
e exp⎪⎪⎪
⎭⎪⎪⎪
12
(1)
where σ = density of surface charge (C m–2) R = gas constant (8.314 J mol–1 K–1) T = absolute temperature (K) ε = dielectric constant ε0 = vacuum permittivity (8.853 × 10⁻¹² F m–1) Nj = concentration of j cations or anions per unit of
volume in the bulk solution (mol·m–3) Zj = valence of j cation or anion F = Faraday constant (9.648 × 10⁴ C mol–1) = zeta potential (V)
The density of the surface fibre charge can also be calculated according to Eqn 2 [5,20,25]:
σ =qA
(2)
where σ = density of surface charge (C m–2) q = specifi c amount of charge (C g–1) A = specifi c surface (m2)
Eqn 2 may be used only for synthetic fi bres because in the case of natural fi bres it is very diffi cult to defi ne a specifi c surface area. Thus, fi bre charge is mostly expressed as the specifi c amount of fi bre charge per 1 g of fi bre. Changing the number of functional fi bre surface groups, e.g. by blocking treatments in dyeing and fi nishing processes, affects the distribution of surface charge, causing changes in the thickness and distribution of the electric double layer. It is necessary to point out the signifi cance of surface charge density on soiling and its removal from textile materials and the infl uence on sorption properties of fi bres [24]. The negative charge of the surface would reduce soiling, given the predominantly negative charge of naturally occurring soils. The appropriate treatment, i.e. fl uorocarbon treatment, works by reducing the surface energy of the fibre to render it both hydrophobic and oleophobic. Practically, the problem of textile materials soiling may be reduced, but not solved. As mentioned before, the textile fi bres immersed in neutral aqueous solutions have a negative charge, because
chemical functional groups dissociate in water producing or absorbing anions. It is not possible to determine the charge on the fi bre surface in the solution by a direct method, because textile fi bres are insoluble in water. If the fi bres are fragmented into colloidal particles it leads to fi bre disintegration. For this reason, the back titration method is convenient for determination of fi bre surface charge. Back titration is based on polyelectrolyte titration. The specifi c amount of fi bre charge per 1 g of fi bre can be calculated from the difference in anionic and cationic polyelectrolyte adsorption onto the fi bre [25–27]. The aim of this paper is to determine the electrokinetic properties of six standard fabrics for use in BS EN ISO 105 F02. The zeta potential and IEP of the standard fabrics were determined, as well as the PZC and the specifi c charge of the textile fabrics.
Table 1 Standard adjacent fabricsa used in this study
Fabric Characteristics of fabric
Cotton (limbric) 100% cotton cloth Mass per unit, 115 ± 5 g/m2
Degree of whiteness,b 70 ± 5 Fabric is desized, scoured and bleached
Wool 100% wool cloth Mass per unit, 125 ± 5 g/m2
Degree of whiteness,b 43 ± 1 Fat content, 0.5 ± 0.2% Stain removal with perchloroethylene
Viscose rayon 100% viscose cloth Mass per unit, 140 ± 5 g/m2
Degree of whiteness,b 70 ± 5 Fabric is desized, scoured and bleached
Polyamide (nylon 6.6) 100% polyamide cloth Mass per unit, 130 ± 5 g/m2
Degree of whiteness,b 70 ± 5 Residual oil content < 1%
Polyester (terylene) 100% polyester cloth Mass per unit, 130 ± 5 g/m2
Degree of whiteness,b 75 ± 5 Residual oil content < 0.5%
Acrylic 100% acrylic cloth Mass per unit, 135 ± 5 g/m2
Degree of whiteness,b 70 ± 5 Residual oil content < 1%
a BS EN ISO 105-F:1985b Determined spectrophotometrically according to Stephenson's equation
for degree of whiteness
ExperimentalMaterialsThe textile materials used in this study were provided by the SDC as standard adjacent when testing fabrics for colour fastness to washing and wet contact (ISO 105 Group C and Group E). The characteristics of each of the fabrics according to ISO 105 Group F are outlined in Table 1. All the fabrics were woven in a 1/1 plain weave, free from fi nish residual chemicals and chemically damaged fi bres treated at pH 7. For determination of zeta potential and the amount of surface charge, the fabrics were specially
20050408_j21-05.indd 220050408_j21-05.indd 2 04/08/2005 15:43:0804/08/2005 15:43:08
© Color. Technol., 121 (2005) 223Web ref: 20050408
prepared and rinsed to the conductivity of deionised water (2–4 µS/cm).
Streaming current methodIn the method of streaming current/potential, an electrolyte solution is forced through the capillary system in which the solid phase (textile) is stationary and the liquid phase (water, potassium chloride electrolyte) is mobile. Streaming potential (Up) and streaming current (Ip) arise due to the motion of ions and zeta potential can be quantitatively determined according to the Helmholtz-Smoluchowsky equations [1,2,5]:
UQR pL
U L
Q pp
p
or
R
=
=
0zeh
zh
e
e
e
D
D0
(3)
IQ pL
I L
Q pp
p
or
=
=
0zeh
zh
e
e
e
D
D0
(4)
where Up = streaming potential (mV) Ip = streaming current (mA) = zeta potential (mV) ε = dielectric constant ε0 = vacuum permittivity (8.853 × 10⁻¹² F m–1) η = dynamic viscosity of solution (Pa s) R = electrical resistance (Ω) Q = cross-section of capillary (m2) L = capillary length (m) ∆p = pressure difference between the inlet and
outlet of capillary system (Pa)
As the parameters L and Q are diffi cult to measure, this model was improved by Fairbrother and Mastin who replaced the expression L/Q by the expression Rpp resulting in Eqns 5 and 6:
zh c
e=
U R
R pp p p
e0 D (5)
zh c
e=
I R
pp p p
e0D (6)
where Rp = electrical resistance of the plug formed in the measuring cell
p = given conductivity of a strong electrolyte fi ling the cell at a resistance of Rp
The electrokinetic analyser EKA (Brookhaven-Paar) used in this study operates on this principle, and this apparatus was used to determine the zeta potential and IEP of the standard fabrics (0.001 M potassium chloride). A range of pH values of electrolyte solution was investigated up to a maximum of pH 11 with 0.1 M sodium hydroxide and this was altered (ca. 1 pH unit) by dosing 0.1 M hydrochloric acid. In this study, PZC was determined by addition of the cationic surfactant N-CPC (0.02 M) to the electrolyte at pH
Inlet Outlet
A
B
CElectrode Electrode
Fabric sample 2
Fabric sample 1
Streamingchannel
PTFE foil
A B C
(a)
(b)
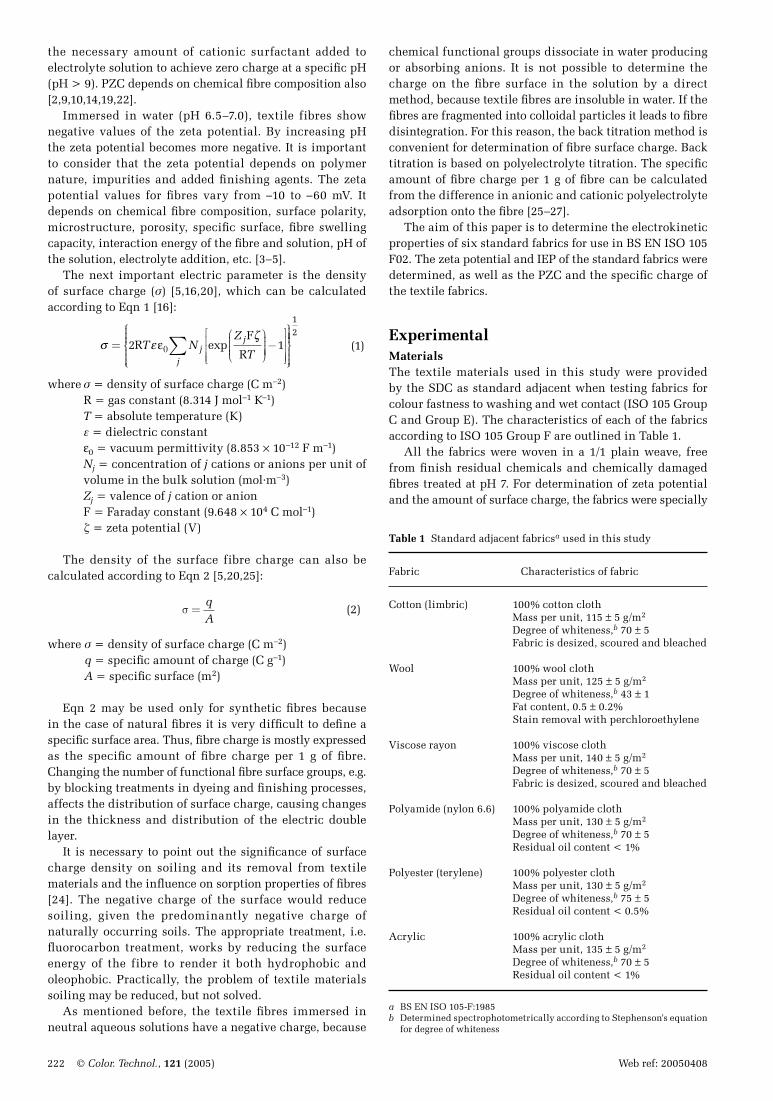
Figure 1 Rectangular cell for measuring the potential of textile materials: (a) cross-section of cell; (b) PTFE partition foils for cell
9–10 until positive zeta values of the standard fabrics were achieved. The rectangular cell used for determining the potential of foils and fl at materials, such as fabrics, is illustrated in Figure 1. The fabric samples must fi rst be cut according to the shapes A and C shown in Figure 1b. Hereupon a ‘sandwich’ is formed in the cell as follows (Figure 1a): polytetrafl uoroethylene (PTFE) foil of A shape (sealing foil); fabric of A shape turned upward with the fabric face; PTFE foil of B shape (to defi ne sample geometry), fabric of foil shape turned downward with the fabric face; and PTFE foil of C shape (used for sealing). In such a way there are two fabric samples turned face to face in the ‘sandwich’. It is important to measure zeta potential in the defi ned sample geometry (distance between the fabrics is exactly defi ned) on account of the reproducibility of results. If a deeper fl ow channel for electrolyte is desirable, more foils of B shape may be placed into the ‘sandwich’ during measurement. An Ag/AgCl electrode is fixed on each channel side. Under the infl uence of the given pressure ∆p, the electrolyte solution fl ows through the fl ow channel between the stationary sample faces. The hydrodynamic fl ow of the liquid between the samples causes streaming potential Up or streaming current Ip. Accordingly, the value of zeta potential may be calculated using Eqns 5 and 6 [1,2,5].
Method for determination of the specifi c amount of chargeIn 1987 the German company Mütek constructed a particle charge detector (PCD) for the determination of streaming potential to serve the needs of the paper industry. The deter-mination of charge by this method may be applied not only for cellulose, but for all textile fi bres [25–27]. Charge amount is measured by the PCD using polyelectrolyte titration.
20050408_j21-05.indd 320050408_j21-05.indd 3 04/08/2005 15:43:0804/08/2005 15:43:08

224 © Color. Technol., 121 (2005) Web ref: 20050408
PTFEpiston
PTFEcylinder
SampleElectrode
Electrode
Piston movement Particle movement
Adsorbed particle Unadsorbed particle
PTF
E p
isto
n
(a) (b)
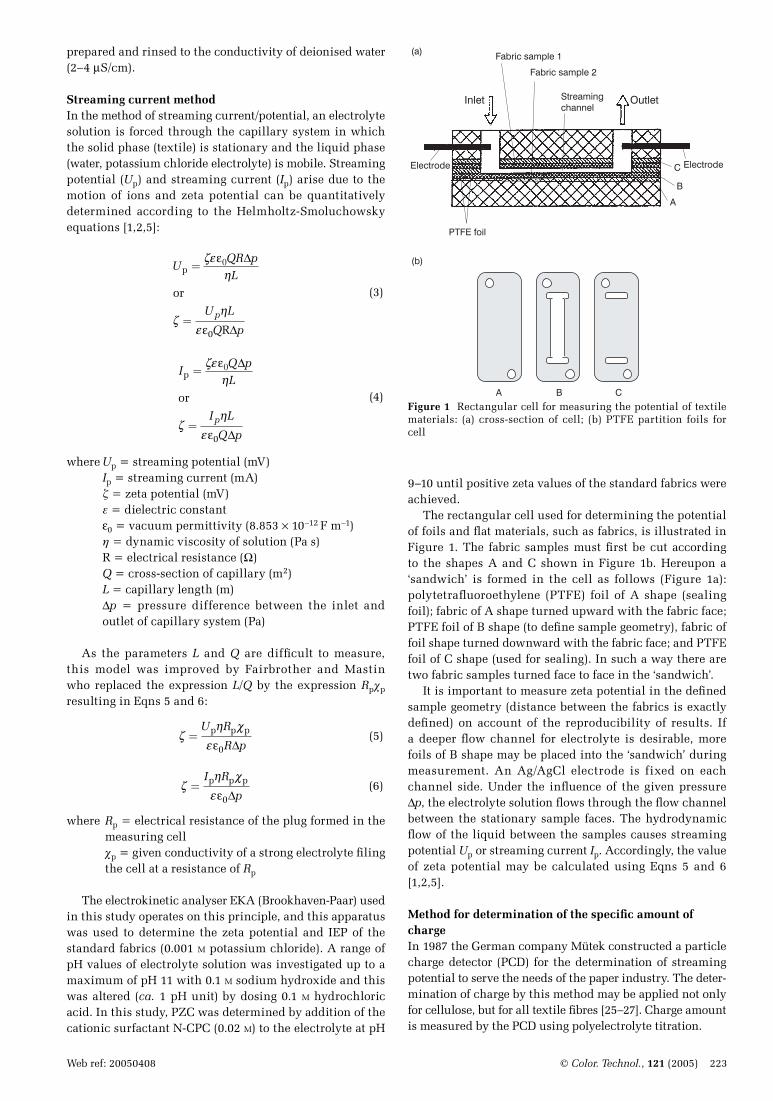
Figure 2 Design of the particle charge detector: (a) measuring unit; (b) measuring principle
The PCD operates on the principle of determining streaming potential. Within the PTFE cylinder containing a sample to be measured, the PTFE piston moves up and down at a constant frequency (Figure 2a). Due to the motion of the piston, the liquid phase (polyelectrolyte) moves between the piston and the cylinder wall. To retain the charge, particles and dissociated molecules are adsorbed on the piston and cylinder wall (Figure 2b). Depending on the piston motion a cloud of particle charge is directed up and down. Two electrodes inside the cylinder determine induced streaming potential. Due to the mechanism of infi nite adsorption, the only information about streaming potential is the polarity of the PCD signal. This information allows the calculation of surface charge [20,25–27]. As the information given by the PCD is limited, the useful application of this device is the determination of the end point of polyelectrolyte titration. The PCD gives the volume of polyelectrolyte solution to achieve zero potential [25,26]. Macromolecules containing ion or ionising groups along the chain or in the network are called polyelectrolytes. Polyelectrolyte titration is based on the generation of a polymer complex between polycations and polyanions. The endpoint of titration is the PZC of the sample. It is assumed that the stoichiometric ratio of polycations and polyanions in the complex is 1:1. These complexes are mostly insoluble in water and look like fl occules. By polyelectrolyte titration it is possible to determine surface charge density and specifi c charge amount. Standard polyelectrolyte solutions are used for polyelectrolyte titration. Quaternary ammonium compounds used include cationic DADMAC (polydialyldimethyl ammonium chloride), N-CPC (cetylpyridine chloride) or Hyamine 1622 (benzetonium chloride), and anionic PES-Na (sodium salt of polyethylenesulphonic acid) or SDS (sodium dodecylsulphate). DADMAC and PES-Na have a convenient molecular structure because their charge density does not depend on the pH so that they frequently change, although SDS and Hyamine 1622 are used more often because of prices and availability. Polyelectrolyte titration is used to determine specifi c charge amount of textile fibres by the back titration method at pH 7. A fi bre sample (1 g) is added to a 50 ml solution of cationic polyelectrolyte for 2 h with occasional
shaking. Afterwards the fibres are separated and the cationic polyelectrolyte solution is titrated with anionic polyelectrolyte. In parallel, a 1 g sample is added to a 50 ml solution of anionic polyelectrolyte for 2 h with occasional shaking. Afterwards the fibres are separated, and the anionic polyelectrolyte solution is titrated with cationic polyelectrolyte. Polyelectrolyte solution (0.0001 M) is used for soaking and titration. The titrant used for zero potential and standard polyelectrolyte solutions in the PZC is measured. The titration can be carried out automatically if the PCD is connected with the autotitrator and computer. The specifi c amount of charge of polyelectrolyte can be calculated according to Eqn 7:
qV V c V
Vpolyelectrolytew
F=
−( )0 χ (7)
where qpolyelectrolyte = amount of charge in a specific polyelectrolyte (mC)
V0 = used up volume of titrant (polyelectrolyte) for the titration of the starting solution (ml)
V = used up volume of titrant (polyelectrolyte) for the titration of the solution after the soaking process of fi bres (ml)
c = concentration of the titrant (polyelectrolyte) (M) F = Faraday constant (9.648 × 10⁴ C mol–1) Vx = total volume of the polyelectrolyte where fi bres
dwelt (ml) Vw = taken volume of the polyelectrolyte after
dwelling for the determination of charge (ml)
The specifi c amount of fi bre charge per 1 g of fi bre is calculated from the difference in anionic and cationic polyelectrolyte according to Eqn 8 [25]:
qq q
mfibrePES Na DADMAC
fibre=
−- (8)
where qfi bre = specifi c amount of charge on fi bre per 1 g of fi bre (C g–1)
qPES-Na and qDADMAC= amount of charge in the anionic and cationic polyelectrolyte, respectively (C)
mfi bre = mass of fi bre (g)
20050408_j21-05.indd 420050408_j21-05.indd 4 04/08/2005 15:43:0804/08/2005 15:43:08
© Color. Technol., 121 (2005) 225Web ref: 20050408
Since the PCD measures the charge of substances solved in water, this method discloses whether there are impurities or other auxiliaries on the fi bre surface and how to determine their charge. Moreover, after determining the total surface charge of the fi bres, it is possible to predict fi bre absorptiveness as well as the amounts of necessary fi nishing agents, dyes, etc.
0 2 4 6 8 10 12–90
–60
–30
0
30
pH
ζ-po
tent
ial,
mV
Cotton WoolPolyamideViscoseAcrylicPolyester
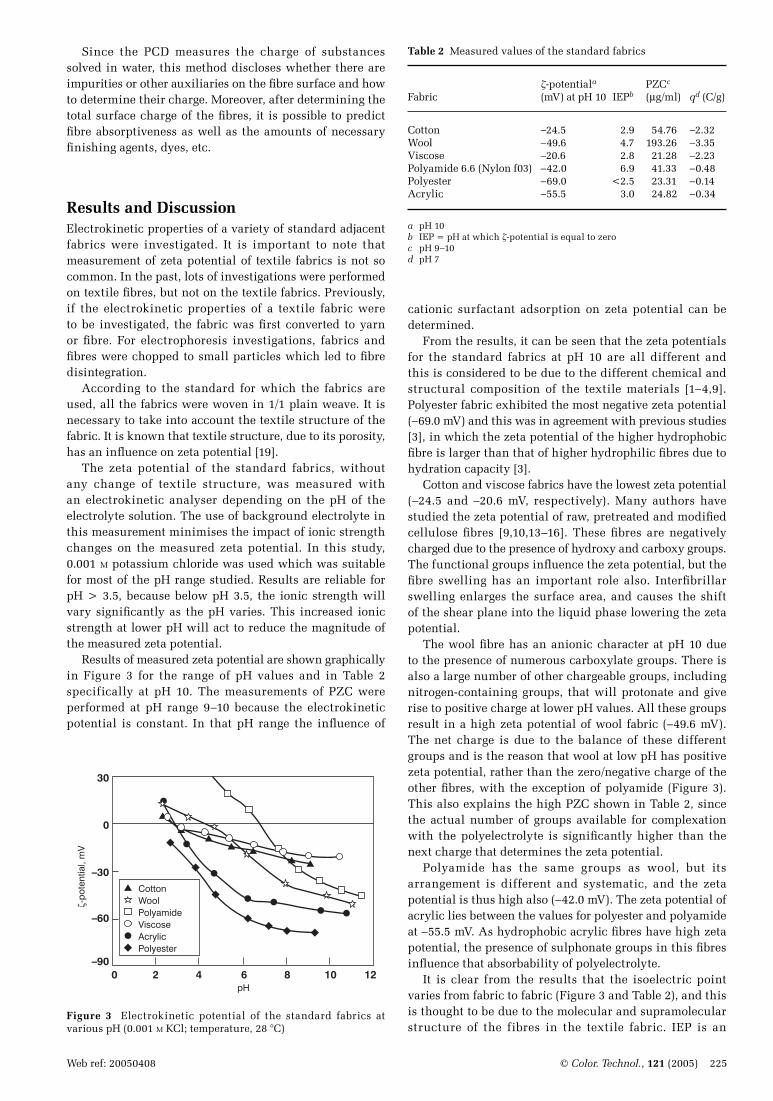
Figure 3 Electrokinetic potential of the standard fabrics at various pH (0.001 M KCl; temperature, 28 °C)
Table 2 Measured values of the standard fabrics
-potentiala PZCc Fabric (mV) at pH 10 IEPb (µg/ml) qd (C/g)
Cotton –24.5 2.9 54.76 –2.32Wool –49.6 4.7 193.26 –3.35Viscose –20.6 2.8 21.28 –2.23Polyamide 6.6 (Nylon f03) –42.0 6.9 41.33 –0.48Polyester –69.0 <2.5 23.31 –0.14Acrylic –55.5 3.0 24.82 –0.34
a pH 10b IEP = pH at which -potential is equal to zeroc pH 9–10d pH 7
cationic surfactant adsorption on zeta potential can be determined. From the results, it can be seen that the zeta potentials for the standard fabrics at pH 10 are all different and this is considered to be due to the different chemical and structural composition of the textile materials [1–4,9]. Polyester fabric exhibited the most negative zeta potential (–69.0 mV) and this was in agreement with previous studies [3], in which the zeta potential of the higher hydrophobic fi bre is larger than that of higher hydrophilic fi bres due to hydration capacity [3]. Cotton and viscose fabrics have the lowest zeta potential (–24.5 and –20.6 mV, respectively). Many authors have studied the zeta potential of raw, pretreated and modifi ed cellulose fi bres [9,10,13–16]. These fi bres are negatively charged due to the presence of hydroxy and carboxy groups. The functional groups infl uence the zeta potential, but the fi bre swelling has an important role also. Interfi brillar swelling enlarges the surface area, and causes the shift of the shear plane into the liquid phase lowering the zeta potential. The wool fi bre has an anionic character at pH 10 due to the presence of numerous carboxylate groups. There is also a large number of other chargeable groups, including nitrogen-containing groups, that will protonate and give rise to positive charge at lower pH values. All these groups result in a high zeta potential of wool fabric (–49.6 mV). The net charge is due to the balance of these different groups and is the reason that wool at low pH has positive zeta potential, rather than the zero/negative charge of the other fi bres, with the exception of polyamide (Figure 3). This also explains the high PZC shown in Table 2, since the actual number of groups available for complexation with the polyelectrolyte is signifi cantly higher than the next charge that determines the zeta potential. Polyamide has the same groups as wool, but its arrangement is different and systematic, and the zeta potential is thus high also (–42.0 mV). The zeta potential of acrylic lies between the values for polyester and polyamide at –55.5 mV. As hydrophobic acrylic fi bres have high zeta potential, the presence of sulphonate groups in this fi bres infl uence that absorbability of polyelectrolyte. It is clear from the results that the isoelectric point varies from fabric to fabric (Figure 3 and Table 2), and this is thought to be due to the molecular and supramolecular structure of the fibres in the textile fabric. IEP is an
Results and DiscussionElectrokinetic properties of a variety of standard adjacent fabrics were investigated. It is important to note that measurement of zeta potential of textile fabrics is not so common. In the past, lots of investigations were performed on textile fi bres, but not on the textile fabrics. Previously, if the electrokinetic properties of a textile fabric were to be investigated, the fabric was fi rst converted to yarn or fi bre. For electrophoresis investigations, fabrics and fi bres were chopped to small particles which led to fi bre disintegration. According to the standard for which the fabrics are used, all the fabrics were woven in 1/1 plain weave. It is necessary to take into account the textile structure of the fabric. It is known that textile structure, due to its porosity, has an infl uence on zeta potential [19]. The zeta potential of the standard fabrics, without any change of textile structure, was measured with an electrokinetic analyser depending on the pH of the electrolyte solution. The use of background electrolyte in this measurement minimises the impact of ionic strength changes on the measured zeta potential. In this study, 0.001 M potassium chloride was used which was suitable for most of the pH range studied. Results are reliable for pH > 3.5, because below pH 3.5, the ionic strength will vary signifi cantly as the pH varies. This increased ionic strength at lower pH will act to reduce the magnitude of the measured zeta potential. Results of measured zeta potential are shown graphically in Figure 3 for the range of pH values and in Table 2 specifically at pH 10. The measurements of PZC were performed at pH range 9–10 because the electrokinetic potential is constant. In that pH range the infl uence of
20050408_j21-05.indd 520050408_j21-05.indd 5 04/08/2005 15:43:0904/08/2005 15:43:09
226 © Color. Technol., 121 (2005) Web ref: 20050408
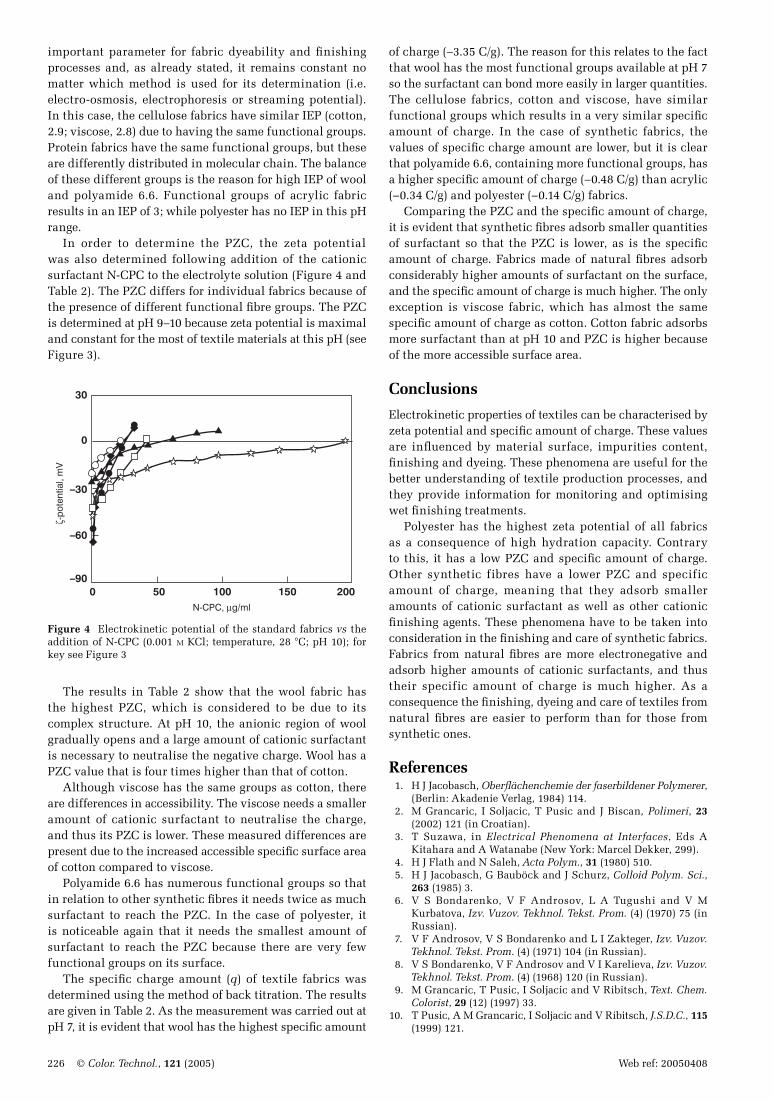
important parameter for fabric dyeability and fi nishing processes and, as already stated, it remains constant no matter which method is used for its determination (i.e. electro-osmosis, electrophoresis or streaming potential). In this case, the cellulose fabrics have similar IEP (cotton, 2.9; viscose, 2.8) due to having the same functional groups. Protein fabrics have the same functional groups, but these are differently distributed in molecular chain. The balance of these different groups is the reason for high IEP of wool and polyamide 6.6. Functional groups of acrylic fabric results in an IEP of 3; while polyester has no IEP in this pH range. In order to determine the PZC, the zeta potential was also determined following addition of the cationic surfactant N-CPC to the electrolyte solution (Figure 4 and Table 2). The PZC differs for individual fabrics because of the presence of different functional fi bre groups. The PZC is determined at pH 9–10 because zeta potential is maximal and constant for the most of textile materials at this pH (see Figure 3).
0 50 100 150 200–90
–60
–30
0
30
N-CPC, µg/ml
ζ-po
tent
ial,
mV
Figure 4 Electrokinetic potential of the standard fabrics vs the addition of N-CPC (0.001 M KCl; temperature, 28 °C; pH 10); for key see Figure 3
The results in Table 2 show that the wool fabric has the highest PZC, which is considered to be due to its complex structure. At pH 10, the anionic region of wool gradually opens and a large amount of cationic surfactant is necessary to neutralise the negative charge. Wool has a PZC value that is four times higher than that of cotton. Although viscose has the same groups as cotton, there are differences in accessibility. The viscose needs a smaller amount of cationic surfactant to neutralise the charge, and thus its PZC is lower. These measured differences are present due to the increased accessible specifi c surface area of cotton compared to viscose. Polyamide 6.6 has numerous functional groups so that in relation to other synthetic fi bres it needs twice as much surfactant to reach the PZC. In the case of polyester, it is noticeable again that it needs the smallest amount of surfactant to reach the PZC because there are very few functional groups on its surface. The specifi c charge amount (q) of textile fabrics was determined using the method of back titration. The results are given in Table 2. As the measurement was carried out at pH 7, it is evident that wool has the highest specifi c amount
of charge (–3.35 C/g). The reason for this relates to the fact that wool has the most functional groups available at pH 7 so the surfactant can bond more easily in larger quantities. The cellulose fabrics, cotton and viscose, have similar functional groups which results in a very similar specifi c amount of charge. In the case of synthetic fabrics, the values of specifi c charge amount are lower, but it is clear that polyamide 6.6, containing more functional groups, has a higher specifi c amount of charge (–0.48 C/g) than acrylic (–0.34 C/g) and polyester (–0.14 C/g) fabrics. Comparing the PZC and the specifi c amount of charge, it is evident that synthetic fi bres adsorb smaller quantities of surfactant so that the PZC is lower, as is the specifi c amount of charge. Fabrics made of natural fi bres adsorb considerably higher amounts of surfactant on the surface, and the specifi c amount of charge is much higher. The only exception is viscose fabric, which has almost the same specifi c amount of charge as cotton. Cotton fabric adsorbs more surfactant than at pH 10 and PZC is higher because of the more accessible surface area.
Conclusions
Electrokinetic properties of textiles can be characterised by zeta potential and specifi c amount of charge. These values are infl uenced by material surface, impurities content, fi nishing and dyeing. These phenomena are useful for the better understanding of textile production processes, and they provide information for monitoring and optimising wet fi nishing treatments. Polyester has the highest zeta potential of all fabrics as a consequence of high hydration capacity. Contrary to this, it has a low PZC and specifi c amount of charge. Other synthetic fibres have a lower PZC and specific amount of charge, meaning that they adsorb smaller amounts of cationic surfactant as well as other cationic fi nishing agents. These phenomena have to be taken into consideration in the fi nishing and care of synthetic fabrics. Fabrics from natural fi bres are more electronegative and adsorb higher amounts of cationic surfactants, and thus their specific amount of charge is much higher. As a consequence the fi nishing, dyeing and care of textiles from natural fi bres are easier to perform than for those from synthetic ones.
References 1. H J Jacobasch, Oberfl ächenchemie der faserbildener Polymerer,
(Berlin: Akadenie Verlag, 1984) 114. 2. M Grancaric, I Soljacic, T Pusic and J Biscan, Polimeri, 23
(2002) 121 (in Croatian). 3. T Suzawa, in Electrical Phenomena at Interfaces, Eds A
Kitahara and A Watanabe (New York: Marcel Dekker, 299). 4. H J Flath and N Saleh, Acta Polym., 31 (1980) 510. 5. H J Jacobasch, G Bauböck and J Schurz, Colloid Polym. Sci.,
263 (1985) 3. 6. V S Bondarenko, V F Androsov, L A Tugushi and V M
Kurbatova, Izv. Vuzov. Tekhnol. Tekst. Prom. (4) (1970) 75 (in Russian).
7. V F Androsov, V S Bondarenko and L I Zakteger, Izv. Vuzov. Tekhnol. Tekst. Prom. (4) (1971) 104 (in Russian).
8. V S Bondarenko, V F Androsov and V I Karelieva, Izv. Vuzov. Tekhnol. Tekst. Prom. (4) (1968) 120 (in Russian).
9. M Grancaric, T Pusic, I Soljacic and V Ribitsch, Text. Chem. Colorist, 29 (12) (1997) 33.
10. T Pusic, A M Grancaric, I Soljacic and V Ribitsch, J.S.D.C., 115 (1999) 121.
20050408_j21-05.indd 620050408_j21-05.indd 6 04/08/2005 15:43:1004/08/2005 15:43:10

© Color. Technol., 121 (2005) 227Web ref: 20050408
11. M Espinosa-Jiménez and A Cano-Suaréz, Text. Res. J., 63 (7) (1993) 379.
12. M D Teli and B R Rao, Text. Res. J., 65 (11) (1995) 693.13. K Stana-Kleinschek, T Kreze, V Ribitsch and S Strand,
Colloids Surf., A, 195 (2001) 275.14. K Stana-Kleinschek, S Strand and V Ribitsch, Polym. Eng. Sci.,
39 (1999) 1414.15. K Stana-Kleinschek and V Ribitsch, Colloids Surf., A, 140
(1998) 127.16. E Rybicki, Zjawiska elektokinetyczne we wlokiennicwie (Lodz:
Polska Akademia Nauk, 2003) (in Polish).17. H T Lokhande and A S Salvi, Colloid Polym. Sci., 254 (1976)
1030-1041.18. W E Morton and J W S Hearle, Physical Properties of Textile
Fibres (Manchester: Textile Institute, 1997).
19. M Grancaric, T Pusic, A Tarbuk and V Ribitsch, Proc. 18th Congress Chem. Technol., Ohrid, Macedonia (2004).
20. H T Lokhande and A S Salvi, Colloid Polym. Sci., 256 (1978) 1021.
21. H T Lokhande, V F Androsov and E N Golovanov, Indian J. Technol., 8 (1970) 89.
22. T Pusic, I Soljacic, A M Grancaric and A Tartuk, Proc. 3rd CEC 2003, Portorose, Slovenia (2003).
23. J S Capablanca and I C Watt, Text. Res. J., 56 (1) (1986) 49.24. G A Jakobi and A Lörh, Detergents and Textile Washing
(Dusseldorf: Henkel, 1987).25. Partikelladungsdetektor PCD 02, Bedienungsanleitung
(Herrsching: Mütek, Germany, 1988).26. L Bley, Paper Technol. (April) (1992).27. P Ay, A Hemme and K Pfl ug, Aufbereitungs-Technik, 33 (2)
(1992) 57.
20050408_j21-05.indd 720050408_j21-05.indd 7 04/08/2005 15:43:1004/08/2005 15:43:10