UNIVERSITY OF CALIFORNIA Establishing Correlations for Predicting Tensile Properties Based on the...
197
UNIVERSITY OF CALIFORNIA Santa Barbara Establishing Correlations for Predicting Tensile Properties Based on the Shear Punch Test and Vickers Microhardness data A Thesis submitted in partial satisfaction of the requirements for the degree Master of Science in Mechanical Engineering by Timothy S. Milot Committee in charge: Professor Robert Odette, Chair Professor Matt Begley Professor Keith Kedward March 2013
Transcript of UNIVERSITY OF CALIFORNIA Establishing Correlations for Predicting Tensile Properties Based on the...

UNIVERSITY OF CALIFORNIA
Santa Barbara
Establishing Correlations for Predicting Tensile Properties Based on the Shear Punch
Test and Vickers Microhardness data
A Thesis submitted in partial satisfaction of the
requirements for the degree Master of Science
in Mechanical Engineering
by
Timothy S. Milot
Committee in charge:
Professor Robert Odette, Chair
Professor Matt Begley
Professor Keith Kedward
March 2013
All rights reserved
INFORMATION TO ALL USERSThe quality of this reproduction is dependent upon the quality of the copy submitted.
In the unlikely event that the author did not send a complete manuscriptand there are missing pages, these will be noted. Also, if material had to be removed,
a note will indicate the deletion.
Microform Edition © ProQuest LLC.All rights reserved. This work is protected against
unauthorized copying under Title 17, United States Code
ProQuest LLC.789 East Eisenhower Parkway
P.O. Box 1346Ann Arbor, MI 48106 - 1346
UMI 1536555
Published by ProQuest LLC (2013). Copyright in the Dissertation held by the Author.
UMI Number: 1536555

The thesis of Timothy S. Milot is approved.
_____________________________________________ Keith Kedward
_____________________________________________ Matthew Begley
_____________________________________________ Robert Odette, Committee Chair
November 2012

iii
ACKNOWLEDGEMENTS
I wish to thank my advisor, Professor G.R. Odette, whose advice has been
invaluable in my work toward becoming a better engineer, and who afforded me the
freedom to pursue my research, while providing insightful and constructive feedback. I
would also like to thank my other committee members, Professor K. Kedward and
Professor M. Begley, for their patience and assistance in reviewing this work.
I also gratefully acknowledge the Advanced Test Reactor National Scientific
User Facility (ATR NSUF) Program at the Idaho National Laboratory (INL) for tuition,
salary and other support during my entire graduate program at UCSB, and visits to INL
and the Center for Advanced Energy Studies. The help I received from Ms. Mary
Catherine Thelen at NSUF was invaluable. INL researchers Dr. J. Cole, Dr. B. Sencer,
Dr. C. Knight and, especially, Dr. B. Miller, were critically important to my work. Mr.
Tim Williams and Dr. Kieth Wilford of Rolls Royce provided the large set of steel
alloys characterized in this study, and the major support for the testing program at
UCSB. Dr. Randy Nanstad at Oak Ridge National Laboratory also assisted in the
procurement and qualification of the Rolls Royce alloys.
This work was also made possible by assistance I received from colleagues at
UCSB, particularly those in the Odette research group. Thanks go to Dr. T. Yamamoto
for always being available to answer scientific questions, and to both Mr. D. Gragg and
Mr. D. Klingensmith, for providing incredibly knowledgeable advice on experimental
methods, as well as assistance on all aspects of my research. Thanks also go to K.

iv
Fields, whose mechanical testing expertise and assistance was of great benefit and who
provided the tensile test data.
Special thanks go out to my friends and family for their love and support.

v
ABSTRACT
Establishing Correlations for Predicting Tensile Properties Based on the Shear Punch
Test and Vickers Microhardness data
Timothy S. Milot
A series of mechanical tests was performed on a matrix of pressure vessel alloys to
establish correlations between shear punch tests (SPT), microhardness (Hv), and tensile
data. The purpose is to estimate tensile properties from SPT and Hv data. Small
specimen testing is central to characterization of irradiation-induced changes in alloys
used for nuclear applications. SPT have the potential for estimating tensile yield and
ultimate strengths, strain hardening and ductility data, by using TEM disks, for
example. Additional insight into SPT was gained by performing finite element analysis
(FEA) simulations.

vi
CONTENTS
LIST OF TABLES ..................................................................................................... viii
LIST OF FIGURES ..................................................................................................... ix
NOMENCLATURE .................................................................................................... xi
Chapter 1 Introduction ...................................................................................................1
Chapter 2 Background ...................................................................................................2
Shear Punch Testing and Previous Research ...............................................2
Vickers Microhardness ..............................................................................10
Chapter 3 Materials ......................................................................................................12
Shear Punch Testing ..................................................................................14
Microhardness Testing ...............................................................................15
Tensile Testing ...........................................................................................16
Chapter 4 Data Analysis ..............................................................................................17
Shear Punch Testing ..................................................................................17
Tensile Testing ...........................................................................................29
Chapter 5 Results .........................................................................................................32
Chapter 6 Establishing Predictive Relationships Between SPT, Tensile Test and
Microhardness Properties .............................................................................................38
Chapter 7 Finite Element Analysis (FEA) of the SPT .................................................48
Finite Element Model and Boundary Conditions ......................................50
SPT P-d Fits ...............................................................................................52
Results ........................................................................................................53

vii
Chapter 8 Discussion and Conclusions ........................................................................64
Chapter 9 Future Work ................................................................................................65
References ....................................................................................................................68
Appendix A ..................................................................................................................71
Appendix B ..................................................................................................................73

viii
LIST OF TABLES
Table 1 Observed Relations Between τy and σy. .........................................................5
Table 2 Summary of the Test Data Statistics (MPa). ................................................32
Table 3 Summary of the Tensile Data.* *Stress units are in MPa. ..........................33
Table 4 Summary of the SPT Data.* ........................................................................35
Table 5 Summary of the Microhardness Data.* .......................................................37
Table 6 UTS estimation based on nτ and Sm, as UTS = Sm/sf. ..................................45
Table 7 Correlation averages, standard deviations and average deviations. .............65
Table 8 Flow Stress and H measured and predicted values ......................................72
ix
LIST OF FIGURES
Figure 1 Schematic illustration of shear punch test fixture. .......................................2
Figure 2 A typical SPT curve ......................................................................................4
Figure 3 Tensile yield strength (σy) by material. ......................................................13
Figure 4 Shear punch test fixture diagram ................................................................14
Figure 5 SS-J2 tensile specimen drawing. ................................................................16
Figure 6 Typical SPT τ−d/t (or P-d) curve ...............................................................19
Figure 7 Enlarged SPT P-d curve .............................................................................20
Figure 8 τsp(εsp) and σf(εt) true-stress strain for RR1 alloy. ......................................22
Figure 9 Flow geometry during punching. ...............................................................23
Figure 10 Deformation during uniform shear. ..........................................................23
Figure 11 The Cy = σy/τy ratios versus the SPT offset (%). .....................................25
Figure 12 τy vs. punch-die clearance, wg, for selected alloys. ..................................27
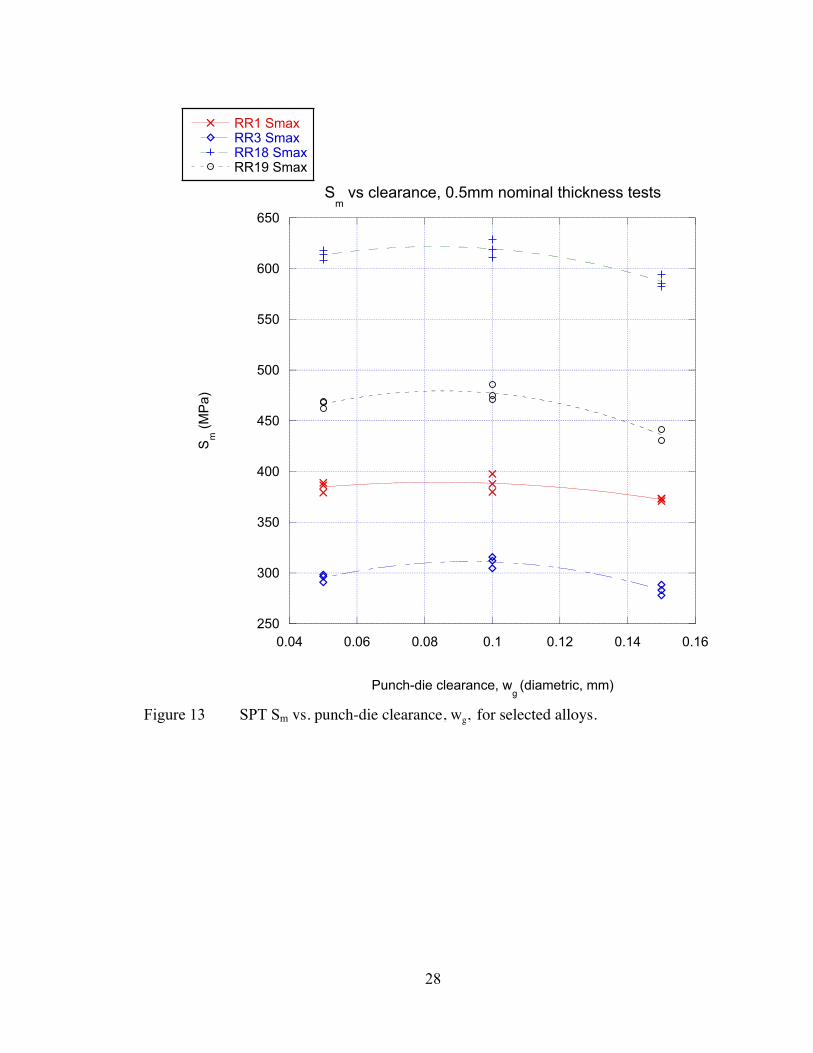
Figure 13 SPT Sm vs. punch-die clearance, wg, for selected alloys. ........................28
Figure 14 Tensile engineering stress-strain curve for RR7 alloy. ............................29
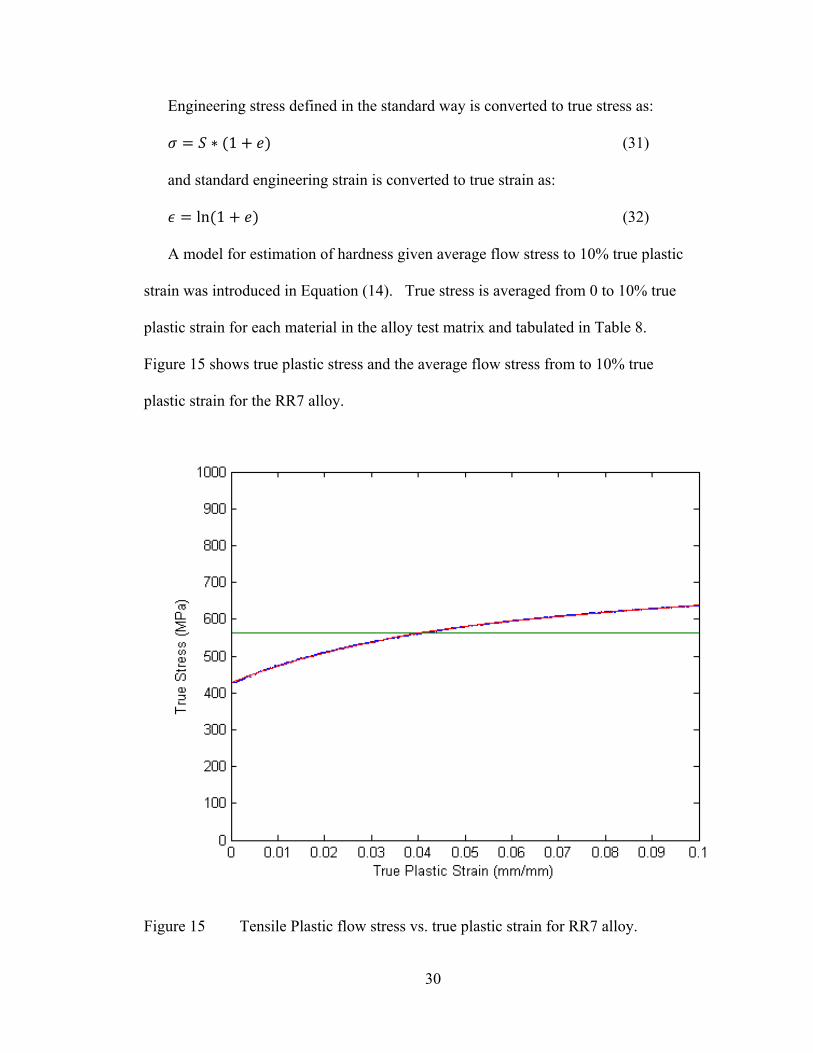
Figure 15 Tensile Plastic flow stress vs. true plastic strain for RR7 alloy. ..............30
Figure 16 Tensile σy versus shear SPT shear yield stress τy measurements and the
corresponding LSF line through the 0,0 origin. One SD error bars are shown for
the individual data points. ....................................................................................39
Figure 17 σy vs. Vickers microhardness. ..................................................................41
Figure 18 Tensile UTS vs. Vickers microhardness. .................................................42
Figure 19 The tensile UTS versus SPT Sm and corresponding LSF line. .................43

x
Figure 20 Flow stress vs. H. .....................................................................................45
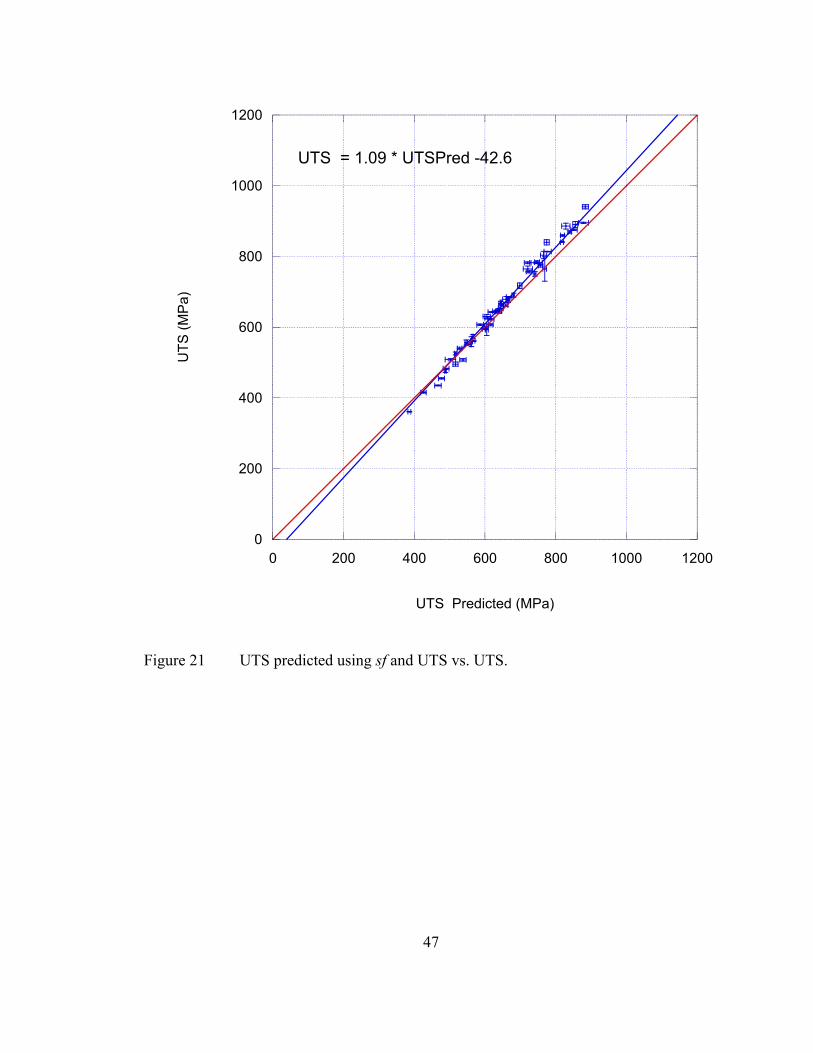
Figure 21 UTS predicted using sf and UTS vs. UTS. ...............................................47
Figure 22 The finite element model of the SPT and mesh. ......................................48
Figure 23 True stress-strain σfl(εp) curves used in the FEA simulation of the SPT P-d
curves: RR1 εf = 0.625, RR19 εf = 1, RR27 εf = 0.75. .......................................50
Figure 24 Linear fit to the lower fixture compliance. Typical SPT Py ≈ 1.5-2KN. .51
Figure 25 Map of the εpe at small d. ..........................................................................53
Figure 26 FEA and experimental Se (MPa) versus d/t curves for RR1. ....................54
Figure 27 FEA and experimental Se (MPa) versus d/t curves for RR19. ..................55
Figure 28 FEA and experimental Se (MPa) versus d/t curves for RR27. ..................56
Figure 29 FEA elements used for averaging εpe evaluated as a function of d/t. .......57
Figure 30 The engineering Se and average 〈εpe〉 vs. d/t for RR1. ..............................57
Figure 31 Maps of 〈εpe〉 for two d/t: a) soon after the initial element failure; and, b)
near Sm. ................................................................................................................58
Figure 32 The εe(Ramaekars) and 〈εpe〉 (FEA) as a function of d/t. εe is about two
times the 〈εpe〉 for RR1. ........................................................................................59
Figure 33 Comparison of the Ramaekars Se(t/d) model with the experimental and
FEA simulation results. ........................................................................................61
Figure 34 The tensile σfl(εp) and 1.77*τ(εp) vs. εp for RR1. ....................................62

xi
NOMENCLATURE
SP Shear Punch
SPT Shear Punch Test
Se Engineering Shear Stress
σy Tensile yield
UTS Ultimate tensile strength
d SPT displacement
df SPT Displacement at maximum load
t SP specimen thickness
P Punch load
D Average of punch and die diameter (Dp and Dd respectively)
τy SPT yield
SPM SPT maximum load
Sm SPT maximum engineering stress
LDC Load displacement curve
Hv Vicker’s microhardness
n Strain hardening coefficient
εu Uniform strain at UTS
εpl Plastic strain

1
Chapter 1 Introduction
Development of materials for nuclear applications requires testing in fission
reactors and high-energy neutron sources. Due to the large number of specimens
needed and post-irradiation handling limitations, efficient small test specimen
techniques are essential to characterizing these materials and minimizing irradiated
volumes. Small specimen size also facilitates better temperature control associated
with less nuclear heating as well as lower fluence gradients in accelerator based
neutron irradiations [4].
Shear punch test (SPT) techniques have been developed to compliment
microhardness and tensile tests. The SPT measures a load-displacement (P-d) curve
(LDC) analogous to that measured in tensile testing using simple disks or sheet
coupons typically ≈ 0.25~0.5mm thick. SPT and microhardness test data can be used
to estimate equivalent tensile yield and ultimate tensile stress, and strain hardening
rates.
The objective of this research is to establish correlations for predicting tensile
properties based on the SPT and Vickers microhardness data. A series of 56 so-called
Rolls Royce alloys were used to establish this correlation.

2
Chapter 2 Background
Shear Punch Testing and Previous Research
SP testing is a blanking operation wherein a cylindrical punch is driven through a
flat test material into a die at constant speed, typically in a screw-driven or hydraulic
load frame. A typical shear punch fixture is schematically illustrated in Figure 1.
The fixture is comprised of an upper guide assembly with precisely aligned pins and a
lower base assembly with a receiver die into which the test material is punched.
Displacement is typically measured either by measurement of: a) movement of the
lower surface of the disk; b) the load frame cross head; c) a proximity sensor attached
to the punch measuring displacement relative to lower fixture assembly.
Figure 1 Schematic illustration of shear punch test fixture.
SPT data is used to estimate tensile test yield and ultimate stress, strain hardening,
and ductility [1-9]. SPT samples can be obtained from existing thin sheet coupons,
such as TEM discs, large coupons typically used to punch TEM discs, the end tabs of

3
tensile specimens, or, for example, slices cut from Charpy V-Notched (CVN) or other
fracture specimens commonly used in reactor surveillance programs. During SPT
plastic deformation occurs primarily in a cylindrical zone between punch and die [1-
9]. Since this volume is larger than the volume deformed in microhardness testing,
the effects of non-uniform microstructure and grain size differences are mitigated. In
high-energy neutron irradiations there is typically a limited volume (<500 cm3),
motivating the development of miniaturized specimens [10].
The SPT load displacement curve has characteristics in common with a tensile
test, namely a linear elastic portion, onset of plasticity, a maximum stress, and
reduction of load with further displacement corresponding to a geometric plastic
instability and eventually damage development [1,2]. The SPT plastic instability
occurs at a maximum engineering shear stress, Sm, when the load on the remaining
ligament, t-d, decreases more rapidly than increases in load associated with flow
stress increases due to strain hardening. SPT displacement is normalized to specimen
thickness, d/t. Analogous to finding the 0.2% offset tensile yield strength, σy, an
offset line parallel to the linear portion of the SPT curve offset is used to determine
the yield stress, τy, as shown in Figure 2.

4
Figure 2 A typical SPT curve
The engineering shear stress Se is calculated based on punch load (P), the average
of punch and die diameter (D), and specimen thickness (t).
S! = !
!∗!∗! (1)
At small strains associated with shear yielding stress 𝜏! ≅ S!". For ideal shear
dominated conditions the theoretical relation between τy and the uniaxial yield stress,
σy, is given by:
σ! = τ! ∗ 3 (2)

5
where the Von Mises yield criteria Cst = √3.
Table 1 summarizes Cst found in previous studies with expressions in the form of:
σ! = C!"τ! + τ!" (3)
Here τyO represents deviations from ideal deformation conditions and in most
cases Cst ≈ √3 have been reported with τ!" ≈ 0. In two cases k was >2 accompanied
by a large negative τyO offset between -73 and -93 MPa. In one case k = 1.64 with
τ!" = 156.1MPa.
Table 1 Observed Relations Between τy and σy.
Cst τ!" Alloy class Tests Reference
1.85 0 Steel, SS, Cu, Al Alloys, Brass 24 [2]
2.6 -‐73 Aluminum – baseline and irradiated
8 [8],[9]
1.7 29 HT9 and SS316 10 [9]
1.76 0 Steel, SS, Cu, Al Alloys, Brass 13 [14]
1.73 0 Steel, SS, Cu, Al Alloys, Brass
14 [14]
1.73 Cu, Brass -‐ [15]
1.64 156.1 Inconel 718 -‐ [16]
2.06 -‐92.7 SS304 L -‐ [16]
1.73 0 Low Carbon Steel,
SS316, Model Alloys, Aluminum
-‐ [24]

6
During the SPT process the engineering plastic strain (esp) is:
𝑒!" =!!!!!
(4)
where d is the displacement, which at yield is d0, and thickness is t [2].
A nominal true plastic strain is defined as:
ε!" = 𝑙𝑛 !!!!!"
(5)
The true shear stress is defined as:
𝜏 = 𝑆!/(1− 𝑒!") (6)
Lucas et al. proposed [2] a power law model to estimate a strain hardening
coefficient, nτ, for a series of SPT on aluminum, brass, copper, steel and stainless as:
𝛆𝒔𝒑𝟎.𝟎𝟎𝟐
𝒏𝝉= 𝝉𝒎
𝝉𝒚 (7)
Here 𝜏! the maximum true shear stress and ε!" is the corresponding true shear strain.
Rearranged to solve for nτ:
𝑛! =!" !! !!"(!!)
!"(!!")!!!(!.!!") (8)
Later work by Hankin et al. found that the engineering uniform elongation strain
in tensile testing, eu, approximately equals the tensile strain hardening exponent nσ for
the materials tested in their study, qualitatively consistent with simple power law
strain hardening in Eq. 7. Further, the SPT strain hardening coefficient nτ (< 0.2) was
found to approximately linearly correlate with nσ [11]. Previous work by Lucas et al.
found ligament reduction at failure to have a 1:1 correlation with tensile reduction in
7
area [2]. Subsequently, Toloczko et al. investigated 316SS, HT9, Cu and Al based
alloys extending the upper range of strain hardening coefficient to ≈ 0.6.
Work by Ramaekers et al. introduced a relationship for maximum punch force for
a given ultimate tensile strength (UTS) and an equivalent tensile strain hardening
coefficient through a series of interrupted SPT and a microhardness based
characterization of nσ [27, 28]. This model estimates Sm from ultimate tensile
strength based on a shear factor (sf) determined by nσ [24]:
𝑆! = UTS ∗ 𝑠𝑓 (9)
𝑠𝑓 = !!∗ !
!
! (10)
Karthic et al. studied the relationship of UTS vs. Sm by using a simple linear fit as
well as the shear factor method. A linear fit of UTS = m * Sm yielded m = 1.29 with a
predicted UTS standard deviation of 45 MPa [24]. Estimation of UTS using shear
factor method based on Equations 9 and 10 resulted in a standard deviation of 14
MPa. This study noted the limitations of using the strain hardening approach because
the constitutive properties predicted by nσ from tensile tests do not involve large
deformations and strains incurred in the SPT.
SPT data are sensitive to fixture alignment and deformation. Previous work at
UCSB found that firmly clamping the shear specimen reduced the bending stresses
helping to ensure yielding is primarily shear stress [1-5,7]. Determination of
deviation from linearity in the LDC also depends both on a flat normal punch surface
and precise concentric alignment of the punch and die to facilitate precise alignment
of fixtures. Thus the previous UCSB studies used shims between the upper and lower
8
fixture to ensure parallelity of the upper and lower fixture face and uniform loading of
the SP specimen [1,2].
The flatness of the specimens obviously has strong affect on the accuracy of SPT.
Kullen et al found that wedged specimens (specimen edge thicknesses varied from
0.16-0.18mm, and from 0.21-0.24 mm over 3mm apart) resulted in 19% error in SPT
yield (τy) of 12Cr-1Mo specimens and 25% in 9Cr-1Mo specimens, since partial
penetration and yielding occurs at the thick side of the disk. The SPT fixture these
tests were performed on was unclamped, and the specimen average thicknesses were
between 0.15mm and 0.35mm. The τy for thinned specimens (t ≈ 0.15mm) deviated
from the others, possibly due to grain size effects, or the relatively large ratio of
punch to die clearance (wg) to thickness, wg/t, that varied by a factor of 2.33. Thus
gaining further insight on specimen thickness effects requires reducing gap in
proportion to thickness.
Load train compliance can affect the SPT results as well. Finite element analysis
(FEA) by Toloczko has shown that the compliance of the cross head has a significant
effect upon the measurement of τy[13]. This motivated efforts to develop a test
fixture capable of a more direct measurement of displacement to remove load train
cross head compliance from SPT load displacement curve data [14]. High
compliance generally requires a larger elastic curve offset to evaluate the τy. Guduru
et al. performed subsequent FEA simulations and proposed a linear offset
corresponding to the development of through thickness plasticity in the disk at d/t of
0.15% in simulations corresponding to d/t at 1% offset in their SPT data [21,23]. The
higher SPT experimental offset required to evaluate yield stress compared to FEA

9
was attributed to the rigid punch and die in the simulation, compared to the actual
compliant load train. The FEA results indicated that punch to die clearances of 5 µm
to 20 µm in 5 µm increments had little effect on τy.
Goyal et al. extended the FEA evaluation of punch-die clearance from 5 µm to 40
µm finding minimal effect on τy, note that wg falls in the lower range of clearances
[25]. The τy was found to be sensitive to the relatively large punch compliance. As a
result the fixture was modified to measure displacement from the lower disk surface,
effectively eliminating the load train compliance. The improved SPT fixture τy
results were found to best correlate to the theoretical Von Mises shear to tensile stress
relation σy = √3 τy, for a 0.15% offset.
The effects of die clearance, wg, have been studied in some depth in industrial
punching and blanking applications. Note in these cases there are other factors such
as impact energy, which do not apply to the SPT. Primary concerns in commercial
punching applications are burr height, the placement of the punched material and tool
life. In most commercial applications the coupon simply sits on top of the die.
Bowing of the punched plug can create a vacuum seal across the top section of the
disk, so some punches use an ejector pin to break this seal to avoid pulling the plug
back with the punch[17]. There are also significant dynamic effects due to the high
velocity punch loading.

10
Vickers Microhardness
Microhardness tests are a non-destructive measure of mechanical properties, in
that the plastically deformed area is small relative to the specimen. Vickers
microhardness test utilizes a diamond shaped indenter loaded to a constant load, 500g
in our measurements, driven into the material for 13 seconds.
Microhardness is calculated with P, the mass load in kilograms, and d the mean
diagonal length of the indentation, mm [26]:
H! = !.!"##∗!
!! ( !"
!!!) (11)
There is a significant body of literature on the relation between Hv and σy with
early work reported by Tabor [33]. The relationship is given by the general form:
σy = CHHv + σyo (12)
Here, the coefficient (CH) and intercept (σyo) are fitted or calculated. The reported
values range from about CH ≈ 2.7 to 3.6 for Hv in units of kg/mm2. Busby et al.
reviewed various experimental studies of both ferritic and martensitic steels. They
found average value CH ≈ 3.0 for unirradiated, irradiated and cold-worked austenitic
stainless steels, with substantial scatter and a large negative σyo averaging about -330.
These workers also reported the relation between ΔHv and Δσy due to irradiation.
They found for small
Δσy ≈ 3.63ΔHv for (ΔHv < 100 kg/mm2)
while
Δσy ≈ 2.13ΔHv+ 155 for (ΔHv > 100 kg/mm2)

11
The corresponding results for one unirradiated and 3 irradiated low alloy ferritic
steels showed scattered around CH ≈ 3 and scattered around and σyo average of ≈ 10
MPa. Note in two other irradiated low alloy steel cases CH was found to be much
lower (< 1). Odette et al. found for irradiation-induced Δσy assuming σyo ≈ 0, initially
CH ≈ 3.6 for a small data set and subsequently 3.3 for a larger data set.
These results are not very consistent and in part reflect the fact that hardness
probes a finite regime of plastic strain beyond yield. For example Tabor suggested
that hardness correlates more directly with flow stress at 8% strain.
Among other workers, Odette and He carried out extensive FEA simulations of
the indentation test using an extremely wide range of constitutive laws. The results
were analyzed to derive the most effective correlation between H (MPa units) and
Δσfl.
They found the best Hv correlation was for the average flow stress from 0% to 10%
plastic strain to Hv.
𝜎!"#$ = 𝜎! + ‹𝜎!!› (13)
where ‹𝜎!!› is the corresponding strain hardening. The FEA results could be fitted by
the expression:
𝐻 = 𝐶! 1+ 𝐶! ∗ 𝜎!"#$ 𝜎!"#$ (14)
Here H is in MPa and C1 = 4.05 and C2 = -34.6/E, where E is the modulus of
elasticity of 200 GPa. This can be inverted to predicted 𝜎!"#! as a function of H. A
fitted model for predicting flow stress given H = Hv * 9.81 m/s2 was proposed:
𝜎!"#$ = 𝐾! ∗ 𝐻! + 𝐾! ∗ 𝐻 (15)
Where K1 is 1.72*10-5 and K2 is 0.272.

12
Chapter 3 Materials
A series of 50 Rolls Royce RPV steels plus 6 heat treatment variations on a subset
of these alloys was provided in nominally 0.5mm sheet form to UCSB. Shear punch
tests, Vickers microhardness tests and tensile tests were performed on these alloys.
The alloy matrix covered a range of compositions including Ni (0-3.5%) and Mn (0-
2%). Six alloys with compositions close to SA 508 Class 3 and SA 508-4N were
selected for heat treatments. Material compositions are listed in the Appendix A.
Six heat treatments were performed at UCSB in a He environment:
• Alloy 22, (L2413) to be re-heat treated for 48 hours at 600°C.
• Alloy 23, (L2433) to be re-heat treated for 48 hours at 600°C.
• Alloy 26, (L2386) to be re-heat treated for 48 hours at 600°C.
• Alloy 27, (L2423 )to be re-heat treated for 48 hours at 600°C.
• Alloy 40 (L2428) to be re-heat treated for 5 hours at 625°C.
• Alloy 40 to be re-heat treated for 5 hours at 650°C.
Tensile test yield ordered from low to high is shown in Figure 3.

13
Figure 3 Tensile yield strength (σy) by material.

14
Shear Punch Testing
A shear punch test fixture was designed using commercially available punch,
dies, and bushings [17]. A section view of the SPT fixture is shown in Figure 4. The
upper and lower halves of the fixture are bolted together. The punch diameter is 2.95
mm, and die is 3.05 mm for a nominal 3mm punch. The load frame used in these
SPT is an MTS model 810 load frame with 2000 lb load cell. Displacements are
measured by a lever arm extensometer mounted on the fixture base assembly in
contact with the lower disk surface connected by a displacement pin.
Figure 4 Shear punch test fixture diagram

15
The sample thickness is measured 3 times around the disk surface with a ball
micrometer. Next the test material is centered over the die in the fixture. Typical
samples are either 8 mm disks or square coupons sheared from sheet, nominally
0.5mm thick. Three ¼-28 UNF bolts are torqued to 75 in-lbs around the perimeter of
the fixture. Alignment shims are placed between the upper and lower fixture that are
approximately 0.03mm thinner than the specimen to ensure flatness and uniform
loading. The SPT fixture is placed in the load frame and pre-loaded to 150-175N to
reduce set-in during the beginning of the load displacement curve. The punch is then
driven by the load frame at a rate of 0.25mm/minute. Force and displacement data
are sampled at ten times per second and recorded in computer data files. Force output
is monitored until loads have dropped significantly, indicating sample failure. Tests
were repeated at least three times for each material.
Microhardness Testing
Microhardness measurements were performed on an automated LECO 400 series
tester with digitized image analysis. Specimens were prepared by sanding and
polishing to create a flat surface for indentation. Five indents were taken per alloy at
a 500g load. If an indent occurred at a scratch or surface imperfection the
measurement was repeated.

16
Tensile Testing
Tensile tests were performed on the matrix of Rolls Royce alloys at room
temperature, with a minimum of three tests per alloy. Specimens were taken from the
nominally 0.5mm wafer, cut transverse to rolling direction in the normal plane, as
shown in Figure 5. They were displaced at 0.1mm/minute in a MTS model 810 load-
frame equipped with a 1000lb load cell. Displacement was recorded by internal
LVDT. A 0.2% offset was used to calculate yield stress. Tensile and SPT test
records are attached in Appendix B.
Figure 5 SS-J2 tensile specimen drawing.
17
Chapter 4 Data Analysis
Shear Punch Testing
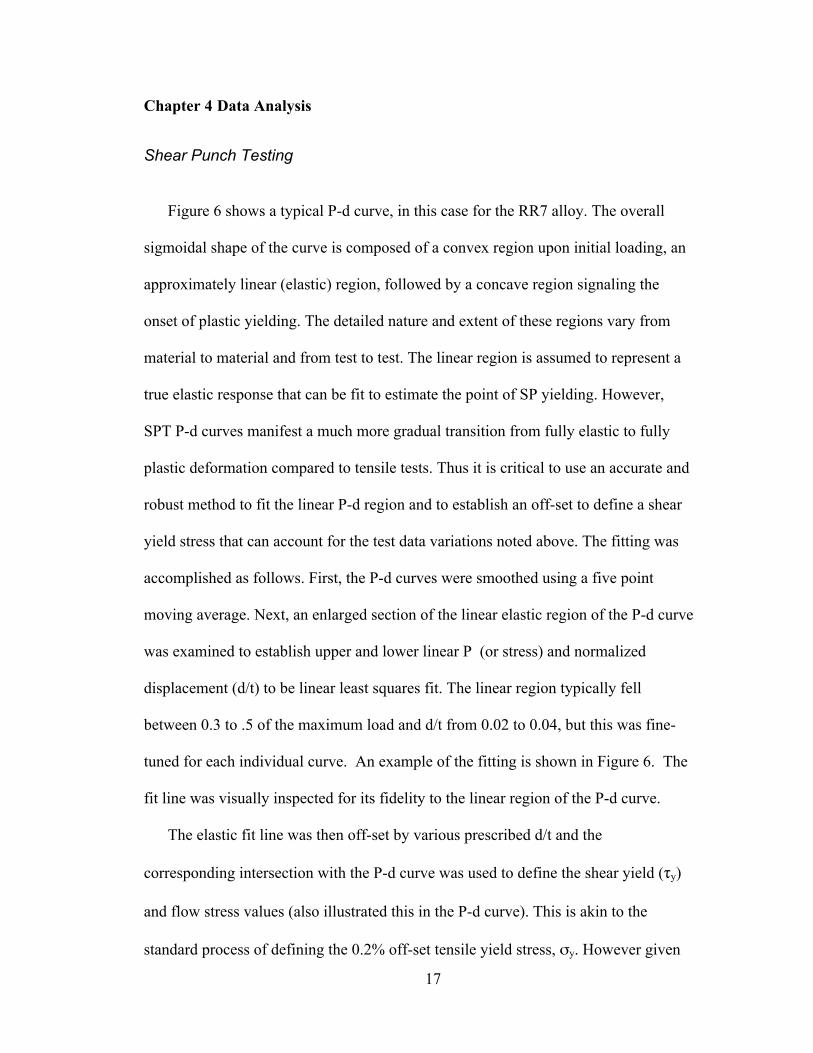
Figure 6 shows a typical P-d curve, in this case for the RR7 alloy. The overall
sigmoidal shape of the curve is composed of a convex region upon initial loading, an
approximately linear (elastic) region, followed by a concave region signaling the
onset of plastic yielding. The detailed nature and extent of these regions vary from
material to material and from test to test. The linear region is assumed to represent a
true elastic response that can be fit to estimate the point of SP yielding. However,
SPT P-d curves manifest a much more gradual transition from fully elastic to fully
plastic deformation compared to tensile tests. Thus it is critical to use an accurate and
robust method to fit the linear P-d region and to establish an off-set to define a shear
yield stress that can account for the test data variations noted above. The fitting was
accomplished as follows. First, the P-d curves were smoothed using a five point
moving average. Next, an enlarged section of the linear elastic region of the P-d curve
was examined to establish upper and lower linear P (or stress) and normalized
displacement (d/t) to be linear least squares fit. The linear region typically fell
between 0.3 to .5 of the maximum load and d/t from 0.02 to 0.04, but this was fine-
tuned for each individual curve. An example of the fitting is shown in Figure 6. The
fit line was visually inspected for its fidelity to the linear region of the P-d curve.
The elastic fit line was then off-set by various prescribed d/t and the
corresponding intersection with the P-d curve was used to define the shear yield (τy)
and flow stress values (also illustrated this in the P-d curve). This is akin to the
standard process of defining the 0.2% off-set tensile yield stress, σy. However given

18
the gradual nature of the development of plasticity (hence, the corresponding more
gradual non-linear deviation of the plastic P-d curve), this procedure is more difficult
in the case of the SPT. In general larger off-sets have less scatter in the plastic flow
shear stresses, but do not define yielding as well, since the loads include a degree of
strain hardening that increases with the d/t off-set. The effect of strain hardening is
reflected in a lower value of the coefficient (Cst) relating the SP to tensile yield stress
as
𝜎! = 𝐶!"𝜏! (16)
Analysis of many P-d curves suggests that d/t offsets between 0.15 and 0.2%
represent the best compromise and, as shown below, yield a Cst close to the
theoretical value of √3. While a bit arbitrary, an offset of 0.2% was used in this work.
In cases when the σy/τy varied significantly from the best-fit value (again ≈ √3), the P-
d curve was re-examined to in order to assure that the fitting procedure was done
properly. If not, the P-d data were reanalyzed. In some cases the P-d curves are
simply anomalous and, for example, may not have an extended linear region. In this
case the test was typically repeated. The average SD of τy (0.2% off-set) for at least 3
valid SP tests per specimen is 12.8 MPa.

19
Figure 6 Typical SPT τ−d/t (or P-d) curve

20
Figure 7 Enlarged SPT P-d curve

21
The post yield SPT P-d curve shows a region of strain hardening up to a
maximum load that is qualitatively analogous to the P-d curve in a tensile test. In both
cases the maximum load, Pm at dm, is defined by a plastic instability, which may or
may not be accompanied by internal damage. SPT engineering flow stress, Se, and
nominal plastic strain, esp, are simply defined as:
S! = !
!∗!∗! (17)
𝑒!" =!!!!!
(18)
Here do is the displacement at the P-d curve at the 0.2% offset. The maximum
engineering shear stress, Sm that is analogous to the tensile UTS, is:
S! = !!!∗!∗!
(19)
The corresponding SPT engineering strain analogous to the tensile uniform
elongation, εtu is:
𝑒!" =!!!!!
! (20)
Corresponding SPT true shear flow stress, τf, and plastic strain εs geometrically
analogous to those found in a tensile test are defined as
𝜏!(ε!") = 𝑆!/(1 − 𝑒!") (21)

22
ε!" = 𝑙𝑛 !!!!!"
(22)
A typical SPT τsp(εsp) curve up to peak load is shown in Figure 8 along with a
corresponding tensile σf(εt) curve. Note that SPT τsp(εsp) is a plot of stress versus a
geometric parameter, and not a true strain. True-stress strain relations for SPT are
shown in Figure 33 and Figure 34 below.
Figure 8 τsp(εsp) and σf(εt) true-stress strain for RR1 alloy.
The reason that the apparent SPT strain hardening rate is much larger than in a
tensile test is that these εsp cited above are nominal plastic strains accounting only for
the increasing reduction in the intact ligament with increasing deformation, d. While a
qualitative measure of degree of deformation, the εsp is not equivalent to the actual

23
plastic shear strains in the ligament itself, εp, which depend on the punch-die gap
dimension, wg = Dd - Dp. Assuming pure uniform shear, as illustrated in Figure 10,
γl is
γl ≈ d/wg (23)
For polycrystals ε ≈ 3γ thus the equivalent esp
εl ≈ d/3wg (24)
In this case, the nominal wg ≈ 0.1 mm and t = 0.5 mm. Thus for d/t = 0.25, εl ≈ 0.77,
which is much larger than the nominal εsp = 0.29.
Figure 9 Flow geometry during punching.
Figure 10 Deformation during uniform shear.
More generally, the use of εsp based on d/t is not a good representation of the
physical shear strain. More rigorous treatments require FEA simulations. Thus any
procedures that treat strain hardening in terms of the SPT and tensile P-d curves, such
as in Equation 7, are not strictly physically valid. However, SPT versus tensile stress
and strain measures, and especially ratios of these measures, may empirically and

24
simply correlate with one another, while reflecting a more complex underlying
physical relation.
Ramaekers developed a simple plastic instability model of a ligament in pure
shear [29]. For simple power law hardening:
σ!" = σ!(ε/ε! + 1)! (25)
this work gives the effective strain in the shear zone:
ε! = !! ln !
!!! (26)
The strain hardening exponent, n, is estimated from hardness measurements
converted to σfl in the highly strained shear zone. The relation between the
engineering shear stress Se and n is:
S! =!!!
!! !"(
!!!!!"
)!!!
!!
!
(27)
The maximum engineering shear stress, Sm, for small ε0 is given by:
S! ≈ !!!
!.!"!!!
!!
!
(28)
Assuming n is equal to the uniform strain εu in a tensile test Sm can be related to
the UTS. The relation can be expressed in terms of a so-called shear factor (sf) as
𝑆! = UTS ∗ 𝑠𝑓, where sf is defined as:
𝑠𝑓 = !!∗ !
!
! (29)
UTS are estimated based on the SPT nominal strain hardening coefficient, nτ. Here nτ
is calculated from stress-strain ratios at SPT yield stress τy and maximum stress τm,
and the corresponding nominal representation of strain, ε = .002 and εsp :
𝑛! =!" !! !!"(!!)
!"(!!")!!"(!.!!") (30)

25
For the purpose of calculating the shear factor, nτ is considered analogous to the strain
hardening coefficient, although failure in SPT is not by necking as in a tensile test,
and εsp is a geometric parameter and not a true strain.
SPT τy and tensile σy are least squares fit in the form of σy = Cyτy for SPT
stresses at d/t linear offsets of 0.1%, 0.15%, 0.2%, 0.25%, 0.5% and 1%. Figure 11
shows that Cy decreases with increasing offset between 0.1 and 1%. This trend is due
to the fact that an increased offset measures an increasing flow stress at higher plastic
strains and magnitudes of strain hardening. At 0.2% offset The Cy = 1.77 coefficient
is close to the Von Mises uniaxial to shear (τy) yield stress relationship, σy = √3τy.
Figure 11 The Cy = σy/τy ratios versus the SPT offset (%).

26
Figure 12 and Figure 13 show the effect of the punch-die gap (wg) on the SPT
τy and maximum engineering shear stress, Sm, respectively, for four alloys
representing a range of low to high strength. The lines are least square fit polynomials
meant to highlight the trends. The τy decreases significantly between the smallest and
larger gaps in the two lower strength alloys while τy increases with the gap dimension
in the highest strength steel. The effect of the gap size is minimal for the steel with τy
≈ 280 MPa. Overall the nominal (0.1 mm) and larger (0.15 mm) gaps produce the
most consistent results. The smallest gap size may increase friction effects, especially
in the softer alloys, while bending versus shear is favored by larger gaps. The Sm
generally decreases with increasing gap dimension and is most consistent between the
smallest (0.05 mm) and nominal (0.1 mm) gap. Overall these results support the
nominal 0.1mm gap used in this work.

27
Figure 12 τy vs. punch-die clearance, wg, for selected alloys.
100
150
200
250
300
350
400
450
500
0.04 0.06 0.08 0.1 0.12 0.14 0.16
τy vs clearance, 0.5mm nominal thickness tests
RR1 0.2% SPTyRR3 .2% SPTyRR18 .2% SPTyRR19 .2% SPTy
τ y (0.1
5% o
ffset
) (M
Pa)
Punch-die clearance, wg (diametric, mm)
28
Figure 13 SPT Sm vs. punch-die clearance, wg, for selected alloys.
250
300
350
400
450
500
550
600
650
0.04 0.06 0.08 0.1 0.12 0.14 0.16
Sm vs clearance, 0.5mm nominal thickness tests
RR1 SmaxRR3 SmaxRR18 SmaxRR19 Smax
Sm (M
Pa)
Punch-die clearance, wg (diametric, mm)

29
Tensile Testing
Figure 14 shows a typical engineering s-e tensile curve, in this case for the RR7
alloy. The linear fit region typically falls between 0.25 to .6 of the maximum load but
is adjusted as necessary. The elastic fit line is offset by 0.2% to find the tensile yield
stress, σy. Note engineering and trues stress and strain are effectively equal at yield.
The UTS is taken as the maximum stress from the stress-strain curve.
Figure 14 Tensile engineering stress-strain curve for RR7 alloy.
30
Engineering stress defined in the standard way is converted to true stress as:
𝜎 = 𝑆 ∗ (1+ 𝑒) (31)
and standard engineering strain is converted to true strain as:
𝜖 = ln(1+ 𝑒) (32)
A model for estimation of hardness given average flow stress to 10% true plastic
strain was introduced in Equation (14). True stress is averaged from 0 to 10% true
plastic strain for each material in the alloy test matrix and tabulated in Table 8.
Figure 15 shows true plastic stress and the average flow stress from to 10% true
plastic strain for the RR7 alloy.
Figure 15 Tensile Plastic flow stress vs. true plastic strain for RR7 alloy.

31
The strain hardening coefficient was calculated by power fit of the true plastic
stress-strain curve. The strain hardening coefficient, n, is used in the shear factor
calculation correlating UTS and Sm. The uniform elongation, εu, is taken as the true
strain at UTS.

32
Chapter 5 Results
Table 2 summarizes the average, standard deviation and percent of the deviation
of the SPT, tensile, and microhardness data. The results are excellent, for example,
with SD of < 10 MPa for the SPT and tensile results. The SD in the microhardness is
relatively larger, but not atypical of the lower load (500g) range of such tests. As
noted previously the SPT σy SD decreases with increasing offset, but the scatter at
0.15 and 0.2% is low and very acceptable.
Table 2 Summary of the Test Data Statistics (MPa).

33
Table 3 and Table 4 summarize tensile and SPT data, respectively. The
hardness data are summarized in Table 5. The test records for the SPT and tensile
tests are included in Appendix B.
Table 3 Summary of the Tensile Data.*
*Stress units are in MPa.

34
Table 3 Summary of the Tensile Data. (continued)
*Stress units are in MPa.

35
Table 4 Summary of the SPT Data.*
*Stress units are in MPa.

36
Table 4 Summary of the SPT Data. (continued)
*Stress units are in MPa.

37
Table 5 Summary of the Microhardness Data.*
*Hardness units in kg/mm2.
38
Chapter 6 Establishing Predictive Relationships Between SPT, Tensile Test and Microhardness Properties
The basic objective of this work is to use SPT and microhardness data to estimate
the properties typically measured in a tensile test. Developing predictive expressions
for the tensile properties is based either directly on least square fits of the primary
data or applications of model based relationships.
Figure 16 plots the tensile yield stress (σy) versus SPT shear yield stress (τy), both
as defined by 0.2% off-set lines. A least square fit gives σy = Cstτy. The Cst = 1.77
coefficient is close to the Von Mises uniaxial to shear yield (τy) stress relationship, σy
= √3τy. The reason that Cst is slightly higher than √3 is not known, but this seems to
be an acceptably small difference. The SD between σy estimated from τy and the
measured value is 16.9 MPa. Average predicted minus measured deviation of 0.2
MPa. These results are considered to be excellent and show the potential for
estimating σy using SPT

39
Figure 16 Tensile σy versus shear SPT shear yield stress τy measurements and the
corresponding LSF line through the 0,0 origin. One SD error bars are shown for the
individual data points.
Figure 17 plots the microhardness, Hv (kg/mm2) versus the tensile yield stress,
σy. In this case the LSF line is expected to have a negative intercept since the Hv
contains a contribution from strain hardening, σy = CHyHv + CHyo. The LSF yields
CHy = 2.82 and CHyo = -114 MPa. The predicted σy based on Hv versus the measured
value has a standard deviation of 22.8 MPa and the average predicted minus
0
100
200
300
400
500
600
700
800
0 100 200 300 400 500
σy =1.77τ
y
σy
(MP
a)
τy (MPa) (0.2% offset)

40
measured σy is -1.6 MPa. The SD is similar to that for the Hv measurements
themselves. The offset can be compared to the average strain hardening between 0
and 10% plastic strain, which is 136 MPa. The dashed line compares an earlier
correlation for other UCSB and RR steels to the current results, where it was
previously found that:
𝜎! = 9.56x10!!H!! + 2.85H! − 120. (33)
This correlation over-predicts the new data by ≈ 5-10%, but the agreement is not
unreasonable. Note the coefficients are influenced by the strain hardening variation
between different alloys, including irradiated conditions in the earlier data set. Note
there may also be small biases between the hardness data measured by different
people.

41
Figure 17 σy vs. Vickers microhardness.
Figure 18 plots the microhardness, Hv (kg/mm2) versus the ultimate tensile
strength, UTS. The LSF equation has the same form as for σy, as UTS = CHuHv +
CHuo. The LSF yields CHu = 2.95 and CHuo = 0.8 MPa. The predicted UTS based on
Hv versus the measured value has a standard deviation of 25.8 MPa and the average
predicted minus measured UTS is 3.7 MPa. Again, the UTS SD is similar to that for
0
200
400
600
800
1000
0 50 100 150 200 250 300 350
σy = 2.82*H
v - 114
σy (M
Pa)
Hv (kg/mm^2)

42
the Hv measurements. The dashed line shows the earlier UTS correlation for other
UCSB and RR steels, where it was previously found that:
𝑈𝑇𝑆 = 1.27x10!!H!! + 2.15H! + 86.1. The previous correlation under predicts
the tensile UTS for the higher strength steels. Coefficients in this case again do not
have a good physical basis and are also fit to steels in the irradiated condition.
Figure 18 Tensile UTS vs. Vickers microhardness.
Figure 19 plots the tensile UTS versus SPT Sm. The linear LSF line had a
slope of 1.75, intercept of -174 MPa. The predicted versus measured SD = 25.8 MPa
with an average deviation of -2.2 MPa. The slope is again close to √3, as expected
0
200
400
600
800
1000
0 50 100 150 200 250 300 350
UTS = 2.95*Hv +0.8
UTS
(MP
a)
Hv (kg/mm^2)

43
based on the uniaxial to shear yield stress relation. The large negative offset is due to
the higher strains and strain hardening flow stress level in the SPT compared to in a
tensile test.
Figure 19 The tensile UTS versus SPT Sm and corresponding LSF line.
Odette and He developed a model based on extensive FEM simulations to
relate microhardness to the tensile flow stress (σfl) for a very wide range of
constitutive laws with an expression with the form [20]:
0
200
400
600
800
1000
0 100 200 300 400 500 600 700
UTS = 1.85 Sm -174
UTS
(MP
a)
Sm (MPa)

44
σfl = K1H2 + K2H (34)
Here H is in units of MPa. These researchers also developed an extensive σfl - H
database to fine-tune the model. The FEM showed that the best universal fit was for
the average sfl between 0 and 10% plastic strain. Figure 20 plots the σfl versus H data
from the current study. The LSF to the data yielded K1 = 1.72x10⁻⁵ and K2 = 0.272.
Fits to the new data set yield 1.61x10⁻⁵ and K2 = 0.266, Thus the previous correlation
slightly over predicts σfl. The SD of σfl for the new of is 25 MPa with an average
deviation of -0.1 MPa.

45
Figure 20 Flow stress vs. H.
Table 6 summarizes UTS estimation based on SPT. Figure 21 shows UTS versus
UTS(Sm). The standard deviation for UTS from predicted was 22.8 MPa and the
average deviation of the estimation was -7.7 MPa. However, there is a systematic
bias with the UTS under predicted at lower stresses and over predicted at higher
stresses.
Table 6 UTS estimation based on nτ and Sm, as UTS = Sm/sf.
0
200
400
600
800
1000
1200
0 500 1000 1500 2000 2500 3000 3500
σ fl = 1.61*10 5 H 2 + 0.266 * H
Flow
Stre
ss (M
Pa)
H (MPa)
Published Correlation

46
47
Figure 21 UTS predicted using sf and UTS vs. UTS.
0
200
400
600
800
1000
1200
0 200 400 600 800 1000 1200
UTS = 1.09 * UTSPred -42.6U
TS (M
Pa)
UTS Predicted (MPa)

48
Chapter 7 Finite Element Analysis (FEA) of the SPT
Finite element analysis (FEA) simulations of shear punch testing (SPT) have been
carried out. Initial analysis used rigid body representations of the punch, die and
upper and lower fixtures. These exhibit a load displacement P-d curve with higher
slope than found in SPT data, in part due to the absence of load train compliance. In
the subsequent analysis the punch and die was modeled as elastic solids of tool steel
(E=205 GPa) and a clamping preload force was applied to the rigid upper fixture.
The compliance of the lower fixture and die was incorporated into the model by the
use of spring elements. The spring stiffness was based on a measured load-
displacement curve of the die and lower fixture up to near the peak load of a typical
SPT. The FEA model is shown in Figure 22.
Figure 22 The finite element model of the SPT and mesh.

49
The constitutive properties were derived from the tensile tests. The absolute units
are length in mm, force in N, and stress in MPa. An elastic modulus of 205 GPa is
used. The true-stress strain constitutive law was obtained fitting the flow stress (σfl)
up to the uniform elongation (typically εu ≈ 0.1) with the form:
𝜎!" = 𝜎!!!!! + 1
! (35)
Here, eo is the yield strain (0.002) and the n was found by linear fits to the
ln(σfl) vs. ln(ε) data. As shown in Figure 23, the fitted curve was extrapolated
assuming continuation of power law hardening up to a maximum saturation flow
stress at εp = 0.5. The subsequent flow stress is constant up to an assigned strain at
element failure (εf), nominally due to damage accumulation. Note the saturation σfl
and ductile damage parameter are relatively arbitrary and will be improved in the
future based on extended true stress strain curves derived from the tensile data
beyond necking using iterative FEA methods [30].

50
Figure 23 True stress-strain σfl(εp) curves used in the FEA simulation of the SPT
P-d curves: RR1 εf = 0.625, RR19 εf = 1, RR27 εf = 0.75.
Finite Element Model and Boundary Conditions
A 2D axisymmetric model of the shear punch tip, disk, die and upper clamping
assembly was created in Abaqus. The punch diameter is 2.95 mm, and die is 3.05
mm for a nominal 3mm punch. The punch and die are modeled as 0.5mm high linear
elastic elements. The upper surface of the punch is constrained to a single control
node, as is the lower surface of the die. The disk is 0.5mm thick disk and 8mm in
diameter.

51
The guide, punch and die were constrained both radially and against rotation. The
guide was connected to the lower fixture assembly by a spring element with the
compliance of three bolts. The lower fixture was connected to a fully constrained
node by a spring element with a compliance taken from measurement of the lower
fixture under load, as shown in Figure 24.
Figure 24 Linear fit to the lower fixture compliance. Typical SPT Py ≈ 1.5-2KN.
Contact elements were located between the punch and disk, guide and disk, and
die and disk. The elastic punch and die were modeled with relatively coarse elements
52
of 0.13mm length, since it was only necessary to incorporate their global stiffness.
The annular region in the disk between the punch and die, which is of prime interest,
was modeled with 12.5µm elements. The disk mesh coarsens away from this zone.
The FEA mesh is shown above in Figure 22.
SPT P-d Fits
The FEA SPT simulation was compared to the measured P-d or engineering stress
strain measurements. The only adjustable parameter in the simulation was the fracture
strain εf, found by iteration. The influence of εf occurs at a plastic equivalent strain εpe
near Sm and results in a peak load followed by a gradual decrease as observed in the
SPT. If the εf is not imposed the load continues to increase beyond Sm, up to a plastic
instability at a higher d/t. The stiffness of a material element increases to the
undamaged value over a small increment of elastic strain that it is very small
compared to the corresponding plastic strain, εpe. Note the elements do not reach a
highly distorted shape before their stiffness is significantly degraded. A color-coded
map of the plastic equivalent strain (εpe) is shown in Figure 25. Even at a small d the
shear zone is dominated by εpe > 0.2.
The FEA simulations were performed using Abaqus Explicit. A quasi-static
approach was used to minimize dynamic effects (inertia, vibrations) that are not
central to the study of the SPT simulation, and to enhance computational efficiency
[27]. This involved imposing the mass in the relatively fine disk elements to increase
the minimum time step required in the solution.

53
Figure 25 Map of the εpe at small d.
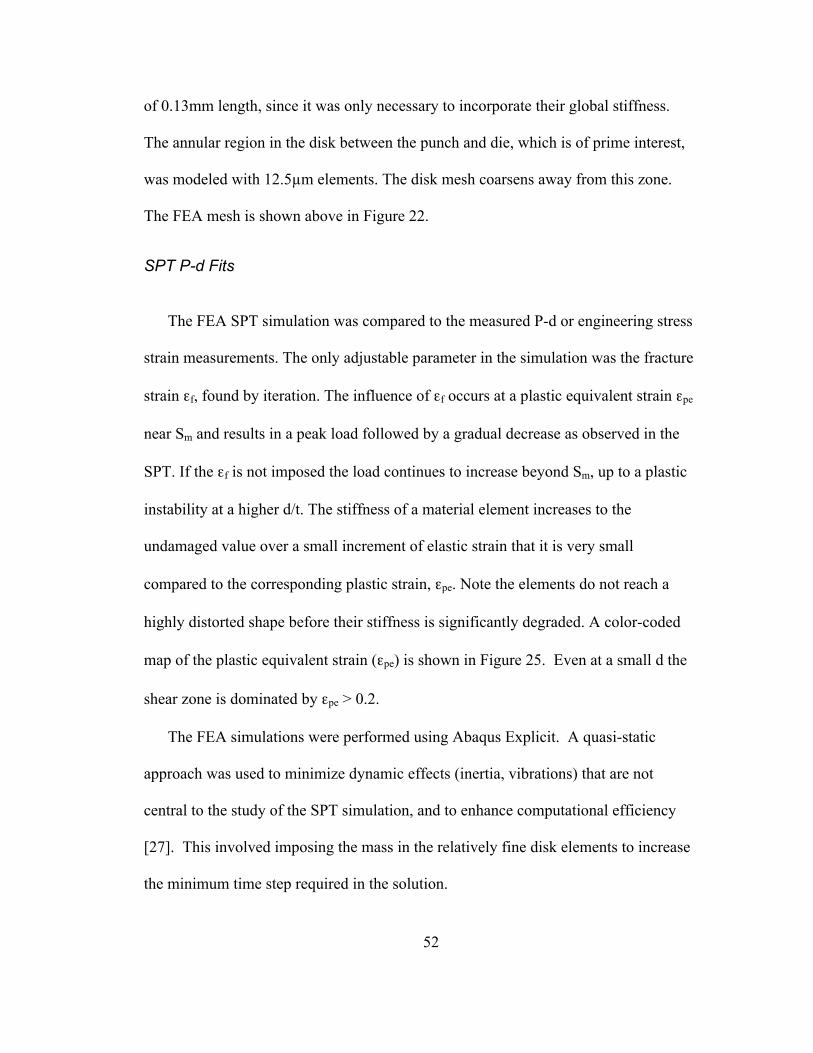
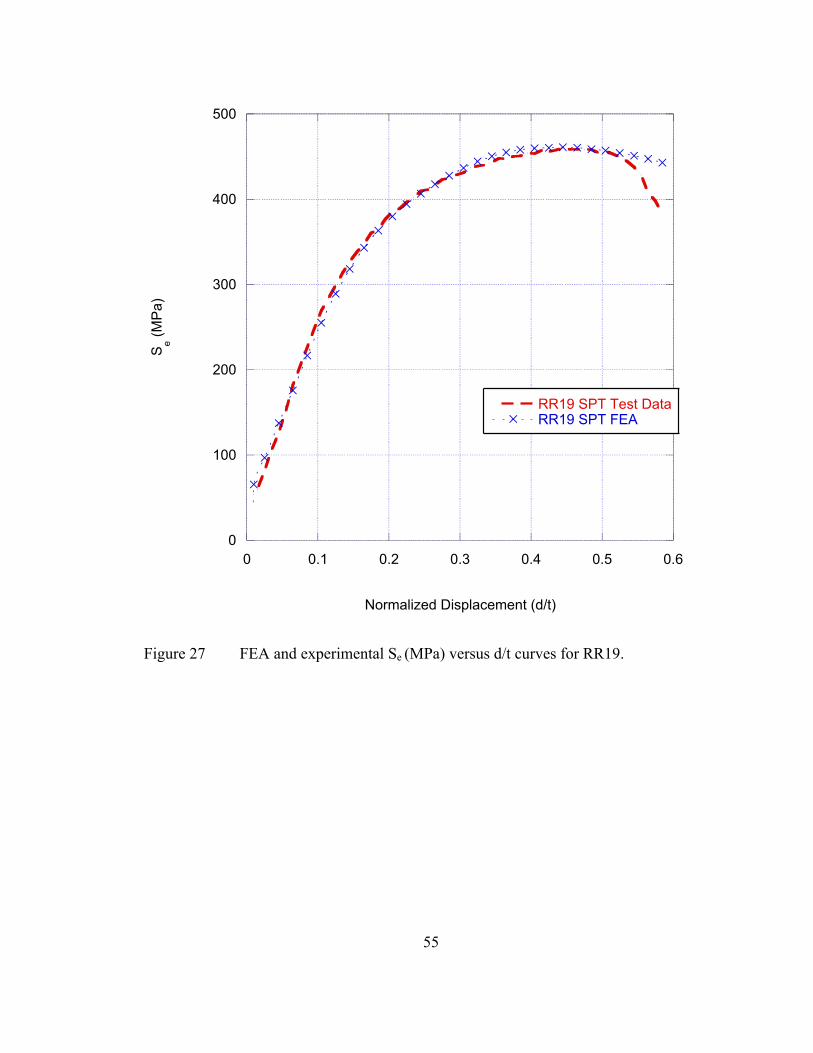
Results
Figure 26 through Figure 28 compare the FEA simulations with the experimental
results. Engineering shear stress, Se, was calculated from the simulation of the SPT
by tabulation of the reaction force at the master node of the elastic punch (P), and
calculated as:
S! = !
!∗!∗! (36)
The agreement up to Sm is excellent, although it is emphasized that the input σfl(εpe)
and εf data are not unique and will require further refinement and verification.
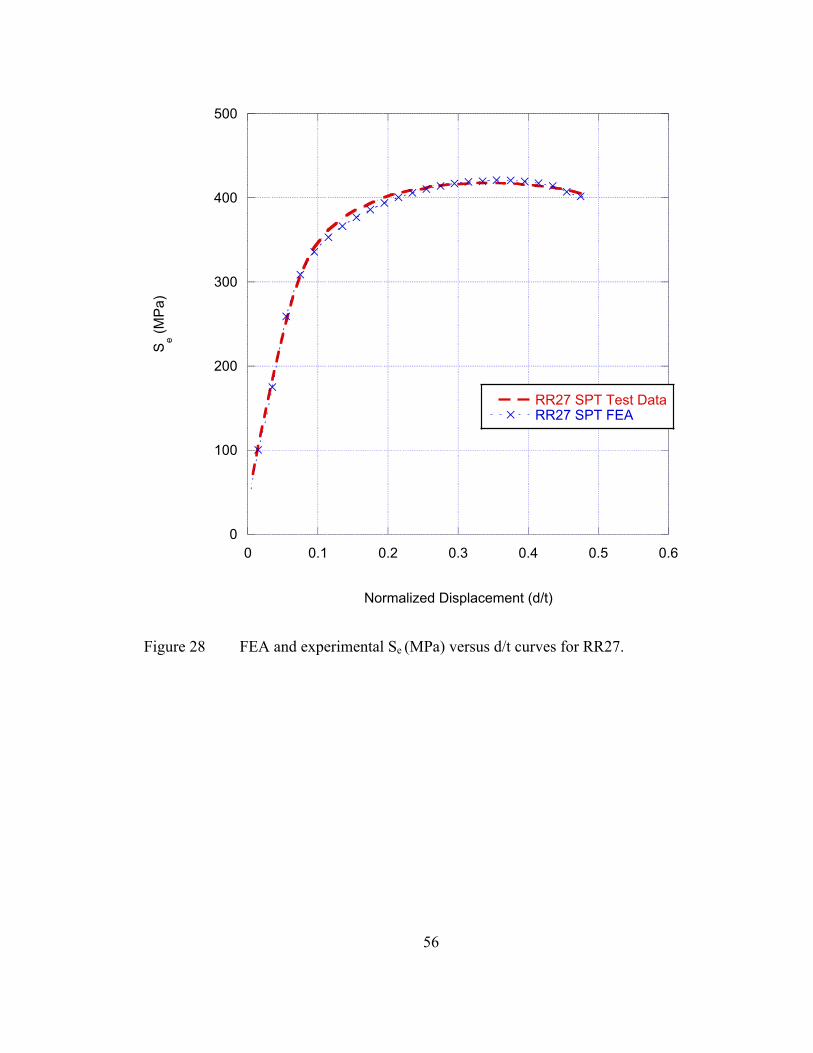
Figure 29 shows the elements selected in the annular area of plastic
deformation, which are used to correlate d/t with average equivalent strain. This
allows a true stress strain curve, τ vs. ε to be developed using SPT test data and the
ε to d/t relation from FEA. The LSF fit of FEA average PEEQ, 〈εpe〉, to d/t was found
as follows:

54
‹𝜀!"› = −3.4832 !!
!+ 4.0754 !
!
! + 1.7404 !
!− 0.0043 (37)
Figure 30 plots Se and 〈εpe〉 versus d/t for RR1 alloy.
Figure 26 FEA and experimental Se (MPa) versus d/t curves for RR1.
0
100
200
300
400
500
0 0.1 0.2 0.3 0.4 0.5 0.6
RR1 SPT Test DataRR1 SPT FEA
Se (M
Pa)
Normalized Displacement (d/t)
55
Figure 27 FEA and experimental Se (MPa) versus d/t curves for RR19.
0
100
200
300
400
500
0 0.1 0.2 0.3 0.4 0.5 0.6
RR19 SPT Test DataRR19 SPT FEA
Se (M
Pa)
Normalized Displacement (d/t)
56
Figure 28 FEA and experimental Se (MPa) versus d/t curves for RR27.
0
100
200
300
400
500
0 0.1 0.2 0.3 0.4 0.5 0.6
RR27 SPT Test DataRR27 SPT FEA
Se (M
Pa)
Normalized Displacement (d/t)
57
Figure 29 FEA elements used for averaging εpe evaluated as a function of d/t.
Figure 30 The engineering Se and average 〈εpe〉 vs. d/t for RR1.

58
Plastic equivalent strain maps for d shortly after initial failure of the top elements
and near Sm are shown in Figure 31, a) and b) respectively.
Figure 31 Maps of 〈εpe〉 for two d/t: a) soon after the initial element failure; and,
b) near Sm.
59
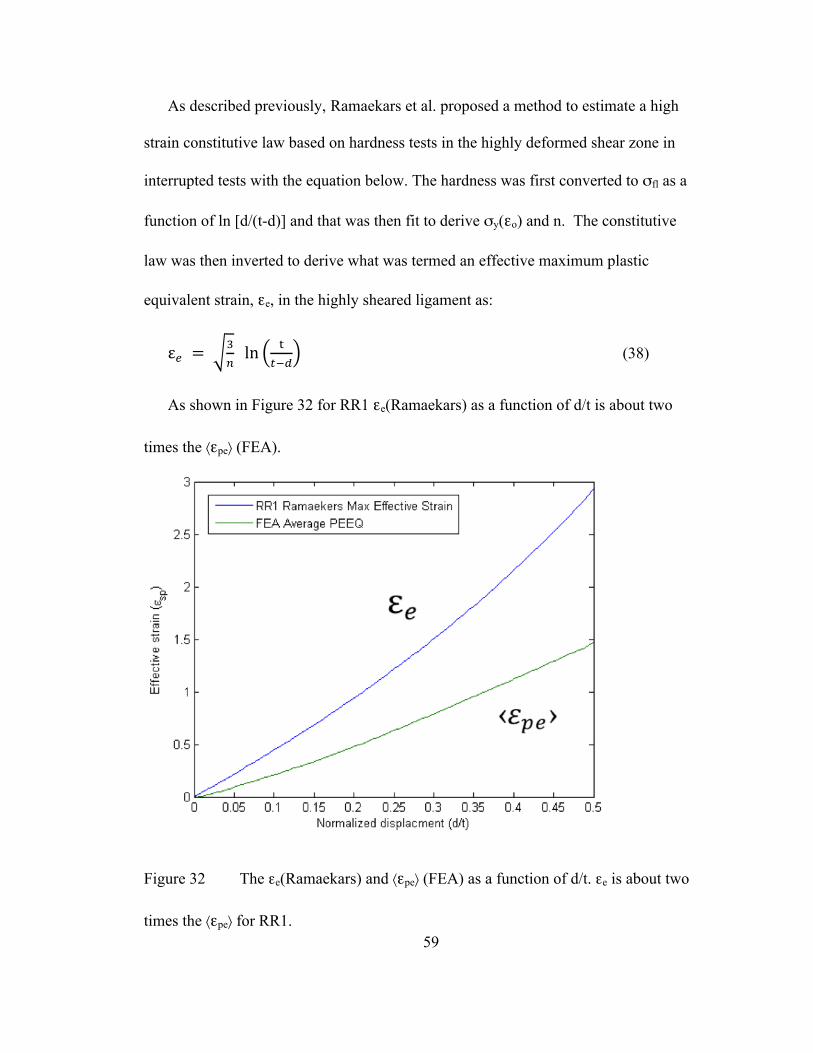
As described previously, Ramaekars et al. proposed a method to estimate a high
strain constitutive law based on hardness tests in the highly deformed shear zone in
interrupted tests with the equation below. The hardness was first converted to σfl as a
function of ln [d/(t-d)] and that was then fit to derive σy(εo) and n. The constitutive
law was then inverted to derive what was termed an effective maximum plastic
equivalent strain, εe, in the highly sheared ligament as:
ε! = !! ln !
!!! (38)
As shown in Figure 32 for RR1 εe(Ramaekars) as a function of d/t is about two
times the 〈εpe〉 (FEA).
Figure 32 The εe(Ramaekars) and 〈εpe〉 (FEA) as a function of d/t. εe is about two
times the 〈εpe〉 for RR1.

60
The Se(d/t) curve for Ramaekars is given by:
𝑆! =!!!
!! !"(
!!!!!"
)!!!
!!
!
(39)
The maximum shear stress, Sm, at a plastic instability was defined in an analogous
way to a tensile test: when the rate of decrease force with a decreasing ligament
exceeds the rate of increase in the force due to strain hardening. The relation for
maximum effective shear in the remaining ligament is:
S! ≈ !!!
!.!"!!!
!!
!
(40)
Figure 33 shows Se(d/t) for the Ramaekars model and both the experimental
curve and the FEA simulation. Note that instability occurs at lower d/t for Ramaekars
model than experimental and simulated SPT curves; this is likely due to an
overestimation of the strain in the ligament shifting the plastic instability point to
lower d/t. However, the Sm are similar for all 3 cases.

61
Figure 33 Comparison of the Ramaekars Se(t/d) model with the experimental and
FEA simulation results.
Figure 13a compares the σfl(εp) derived from the tensile test of RR1 to that from
the SPT using the εpe (d/t) derived in the FEA and the experimental τ Eq. (37)
converted to the equivalent σ using the empirical factor of 1.77. Figure 13b shows
the same plots on a ln-ln scale. While there are small differences in the magnitude of
the σfl, both curves can be fit with a power law model in the form of:
𝜎!" = 𝜎!!!!! + 1
! (41)
with similar nτ = 0.17 (SPT) and nσ = 0.18 (tensile test). While the values are not
expected to be identical, these results suggest a remarkable self-consistency between
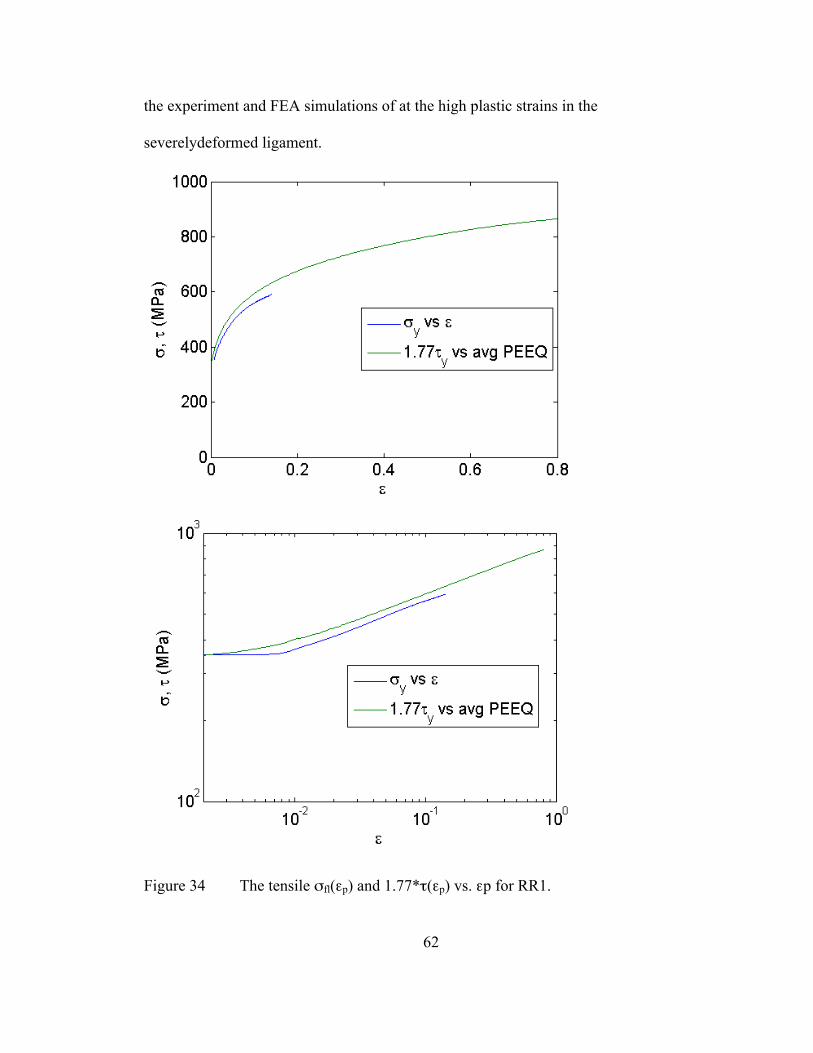
62
the experiment and FEA simulations of at the high plastic strains in the
severelydeformed ligament.
Figure 34 The tensile σfl(εp) and 1.77*τ(εp) vs. εp for RR1.

63
Note there have been a number of in-depth modeling studies relating constitutive
and damage models in commercial blanking operations, based on various analytic
methods and FEA approaches [27,30,31] and further examination of the pure shear
constitutive models from Ramaeker et al. [32]. But detailed discussion of this
literature is beyond the scope of this work.
Since the objective of this work is to determine tensile properties from SPT data,
the n in the previous expressions must be estimated from the latter. This was done by
mapping the equivalent stress, in the form of σ = τ∗1.77, to the average equivalent
strain, 〈εpe〉, to d/t by the using relation found in FEA of the SPT. A LSF of the ln-ln
relation of true-stress to average effective strain plotted in Figure 34 b was performed
for the tensile and SPT test curve. It is noted that for the purpose of calculating the
shear factor that nτ is considered analogous to the strain hardening coefficient,
although failure in SPT is not by necking as in a tensile test.
64
Chapter 8 Discussion and Conclusions
The objective of this work is to use shear punch and microhardness tests to
estimate the constitutive properties typically measured in tensile tests: yield stress,
ultimate stress (or strength), post yield flow stress and strain hardening rate. Table 7
summarizes the results for the strength properties, demonstrating that the SPT and
microhardness provide excellent small specimen test methods for this purpose. While
correlations derived in this work are empirical, the basic form of the equations and
fitted parameters are generally well understood. For example the fitted σy/τy was
1.77, versus a theoretical Von Mises value of √3 ≈ 1.73. Further, it has been shown
that the relations can be further refined using FEA simulations of the SPT (and, as
previously shown, tensile and hardness tests). The SPT is particularly valuable for
estimating the tensile yield, σy. Indeed, the predicted σy derived from SPT data had a
standard deviation that was only 3.2% of the mean. The corresponding value was
3.9% for the UTS. While these uncertainties are larger than the direct tensile
measurements in this study, they are similar to those expected for tensile data for a
large number of materials with a wide range of properties. And the uncertainties are
certainly consistent with the requirements for robust post irradiation examinations
(PIE) and the development of high quality irradiation effects databases. Finally, it
should be noted that both microhardness and SPT methods can be semi-automated,
permitting very high throughput PIE.
Another property typically extracted from tensile tests is the uniform
elongation, εu at the UTS. By the establishing the true stress strain constitutive law

65
over a moderate range of strain with SPD by FEA simulations or correlations (like d/t
with εpe) and microhardness tests, physically based estimates of εu can be obtained.
The values of εu decrease to very low values in highly irradiated alloys due to plastic
instabilities, often accompanied by flow localization. Thus it will be interesting to see
how this behavior maps onto SPT P-d curves. However, differences in the stress-
strain states and deformation patterns in tensile versus SPT and microhardness tests
preclude using these tests to estimate tensile failure ductility parameters like
reduction in area.
Table 7 Correlation averages, standard deviations and average deviations.
Correlation Std.
Deviation
Avg.
Deviation
Std.
Deviation (%)
σy(τy) 15.9 0.2 3.2%
σy(Hv) 22.8 -1.6 4.3%
UTS(Sm ) 25.8 -2.2 3.9%
UTS(Hv ) 25.82 3.7 3.9%
UTS(Sm , sf) 22.83 -7.7 3.9%
Chapter 9 Future Work
The results of this study are very encouraging. However, there is a long list of
needs and opportunities that remain. The following is a partial list that derives from
the experience of the research reported here:

66
1. More work should be done on the semi-empirical SPT-microhardness versus
tensile correlations. For example, combinations of both SPT and microhardness data
in fitting models guided by physical insight might provide better predictions of the
tensile properties that the correlations reported here.
2. Perform extensive FEA, especially for the SPT and to extend tensile test results to
higher post necking strains [34]. The FEA can be used to simulate the tests
themselves as well as to derive physical correlations between true stresses and strains
and test observables, again like that between d/t and εpe (and other measures of plastic
strain, like shear and principal strains). FEA should also be used to simulate the
effects of numerous test variables, such as the punch die gap, the flatness of the
coupon, clamping stresses, concentricity and so on. Finally, the role of damage
controlled failure parameters needs to be systematically evaluated.
3. Perform complementary experiments based on interrupted tests to experimentally
characterize and clarify details of the SPT, such as deformation patterns and strain
distributions in the shear zone and corresponding true flow stress values at high
strains based on hardness tests. These experiments should also characterize damage
development and failure mechanisms in SPT. Finally, experiments should
complement modeling of the test variables cited in item 1 above.
4. Apply and extend the combined testing to many more metals and alloys with a
wide range of σy and strain hardening behavior. This will include highly irradiated
materials consisting of various model alloys, RPV steels, tempered martensitic (8-
12Cr) steels, ODS steels and austenitic stainless steels.

67
5. Further develop a test protocols for SPT, including use of a set reference-
calibration alloys with uniform properties that are measured at the beginning and end
of a set of actual measurements on materials of interest. This is analogous to using
reference alloys for tensile tests [34] and calibrated test blocks for hardness testing.
Develop metrics for clamping-shimming, including the effects of alloy strength, as
well as coupon flatness. Further, it will be important to carefully assess individual
operator bias in hardness tests based on calibration materials. Finally, develop
procedures to measure and inspect punch die wear and its effect on SPT results, and
methods to qualify and calibrate replacement punch-die sets.
6. Extend the SPT method to smaller punch sizes of order 1 mm that can be used on
specimens such as 3 mm TEM discs.
7. Further optimize the SPT method, including:
a. Eliminate die set in loading displacements that result in an initial non-linear portion
of the P-d curves
b. Evaluate the effect of using a loaded follower pin below the punched disc to further
minimize bending and to enhance the flatness and overall shape of the punched disc.
c. Further examine the effects of the gap size and gap to coupon thickness ratio.
d. Develop and implement methods to minimize contamination and facilitate
decontamination in testing irradiated alloys.
8. Design, construct and qualify a stand-alone table-top automated SPT instrument for
high throughput PIE (underway).
9. Create a consensus ASTM standard for the SPT.
68
References
[1] LUCAS G.E. 1983. The development of Small specimen mechanical test techniques. Journal of Nuclear Materials 117: 323-332.
[2] G. E. Lucas, J. W. Sheckherd, G. R. Odette. Shear Punch and Microhardness Tests for Strength and Ductility Measurements. ASTM STP 888, American Society for Testing and Materials (1986) pp. 112-140.
[3] LUCAS G.E., SHECKHERD J.W., ODETTE G.R. & PANCHANADEESWARAN S. 1984. Shear punch tests for mechanical property measurements in TEM disc-sized specimens. Journal of Nuclear Materials 122: 429-434.
[4] LUCAS G.E. & ODETTE G.R. 1985. Methods for forecasting performance limits of fusion reactor structural materials. Nuclear Engineering and Design. Fusion 2: 145-173.
[5] W.R. Corwin and G.E. Lucas, ed., The Use of Small-Scale
Specimens for Testing Irradiated Material, ASTM-STP 888 (1986).
[6] P.S. Kullen, H.H. Smith, D.J. Michel, J. Nucl. Mater. 158 (1988) 57.
[7] LUCAS G. 1990. Review of Small specimen test techniques for irradiation testing. Metallurgical and Materials Transactions A 21: 1105-1119.
[8] HAMILTON M.L., TOLOCZKO M.B. & LUCAS G.E. 1994. Recent progress in shear punch testing. osti.gov
[9] HAMILTON M.L. & TOLOCZKO M.B. 1996. Correlation between shear punch and tensile data for neutron-irradiated aluminum alloys. ASTM special technical publication 11.
[10] P. J.A., A. HISHINUMA B, G.E. LUCAS C H. ULLMAIER 1996. Recommendation of miniaturized techniques for mechanical testing of fusion materials in an intense neutron source. Journal of Nuclear Materials 232: 196-205.
[11] HANKIN G.L., TOLOCZKO M.B., HAMILTON M.L. & FAULKNER R.G. 1998. Validation of the shear punch‚ correlation technique using irradiated materials. Journal of Nuclear Materials 258‚-263, Part 2: 1651-1656.
[12] TOLOCZKO M.B., HAMILTON M.L. & LUCAS G.E. 2000. Ductility correlations between shear punch and uniaxial tensile test data. Journal of Nuclear Materials 283-287, Part 2: 987-991.
69
[13] TOLOCZKO M.B., ABE K., HAMILTON M.L. & GARNER… F.A. 2000. The effect of test machine compliance on the measured shear punch yield stress as predicted using finite element analysis. Materials Transactions, JIM Vol. 41, No. 10. pp 1356-1359.
[14] TOLOCZKO M.B., KURTZ R.J., HASEGAWA A. & ABE K. 2002. Shear punch tests performed using a new low compliance test fixture. Journal of Nuclear Materials 307-311, Part 2: 1619-1623.
[15] DREW R.A.L. 2002. Small punch testing for assessing the tensile strength of gradient Al/NiSiC composites. Materials Letters 56: 812-816.
[16] HAMILTON M.L., GARNER F.A., TOLOCZKO M.B., MALOY S.A., SOMMER W.F., JAMES M.R., FERGUSON P.D. & LOUTHAN J., M.R 2000. Shear punch and tensile measurements of mechanical property changes induced in various austenitic alloys by high-energy mixed proton and neutron irradiation at low temperatures. Journal of Nuclear Materials 283‚-287, Part 1: 418-422.
[17] Dayton Progress Corporation, 500 Progress Rd. P.O. Box 39, Dayton, OH., 45449.
[18] G. R. ODETTE T.M.K.F., D. KLINGENSMITH 2012. Characterization of Rolls Royce Alloys in the UCSB National Scientific University Facility ATR-II Program: A High Fluence Embrittlement Database and ATR Irradiation Facility for Light Water Reactor Vessel-Life Extension. University of California, Santa Barbara
[19] JOHNSON K.L. 1970. The correlation of indentation experiments. Journal of the Mechanics and Physics of Solids 18: 115-126.
[20] HE M.Y., ODETTE G.R., YAMAMOTO T. & KLINGENSMITH D. 2007. A universal relationship between indentation hardness and flow stress. Journal of Nuclear Materials 367‚-370, Part A: 556-560.
[21] GUDURU R.K., DARLING K.A., KISHORE R., SCATTERGOOD R.O., KOCH C.C. & MURTY K.L. 2005. Evaluation of mechanical properties using shear punch testing. Materials Science and Engineering: A 395: 307-314.
[22] STEWART G.R., ELWAZRI A.M., VARANO R., POKUTYLOWICZ N., YUE S. & JONAS J.J. 2006. Shear punch testing of welded pipeline steel. Materials Science and Engineering: A 420: 115-121.
[23] GUDURU R.K., NAGASEKHAR A.V., SCATTERGOOD R.O., KOCH C.C. & MURTY K.L. 2007. Thickness and Clearance Effects in Shear Punch Testing. Advanced Engineering Materials Adv. Eng. Mater. 9: 157-160.

70
[24] KARTHIK V., VISWESWARAN P., VIJAYRAGHAVAN A., KASIVISWANATHAN K.V. & RAJ B. 2009. Tensile‚ shear correlations obtained from shear punch test technique using a modified experimental approach. Journal of Nuclear Materials 393: 425-432.
[25] GOYAL S., KARTHIK V., KASIVISWANATHAN K.V., VALSAN M., RAO K.B.S. & RAJ B. 2010. Finite element analysis of shear punch testing and experimental validation. Materials & Design 31: 2546-2552.
[26] LECO CORPORATION. 2006. INSTRUCTION MANUAL. LM-100, LM-300 and LM-700 DIGITAL MICROINDENTATION TESTER.
[27] TEKKAYA A.E. 2000. State-of-the-art of simulation of sheet metal forming. Journal of Materials Processing Technology 103: 14-22.
[28] J.A.H. Ramaekars, J.A.G. Kals, Strain, stresses and forces in blanking, in: Proceedings of the IMC Conference Galway, 1986, pp. 126–138.
[29] J.A.H. Ramaekers, P.C. Veenstra, The relation between effective deformation and microhardness in a state of large plastic deformation. Annals of the C.I.R.P., 18 (1970), p. 541
[30] NAHSHON K. & HUTCHINSON J.W. 2008. Modification of the Gurson Model for shear failure. European Journal of Mechanics - A/Solids 27: 1-17.
[31] XUE Z., PONTIN M.G., ZOK F.W. & HUTCHINSON J.W. 2010. Calibration procedures for a computational model of ductile fracture. Engineering Fracture Mechanics 77: 492-509.
[32] KLINGENBERG W. & SINGH U.P. 2005. Comparison of two analytical models of blanking and proposal of a new model. International Journal of Machine Tools and Manufacture 45: 519-527. [33] TABOR D. 1951. The hardness of metals. Clarendon Press. [34] T. Yamamoto, G. R. Odette, Y. Wu. 2011. Constitutive, Damage and Plasticity Laws for Candidate Fusion Alloys. DOE/ER-0313/51 Semiannual Progress Report 51:78-84.

71
Appendix A

72
Table 8 Flow Stress and H measured and predicted values

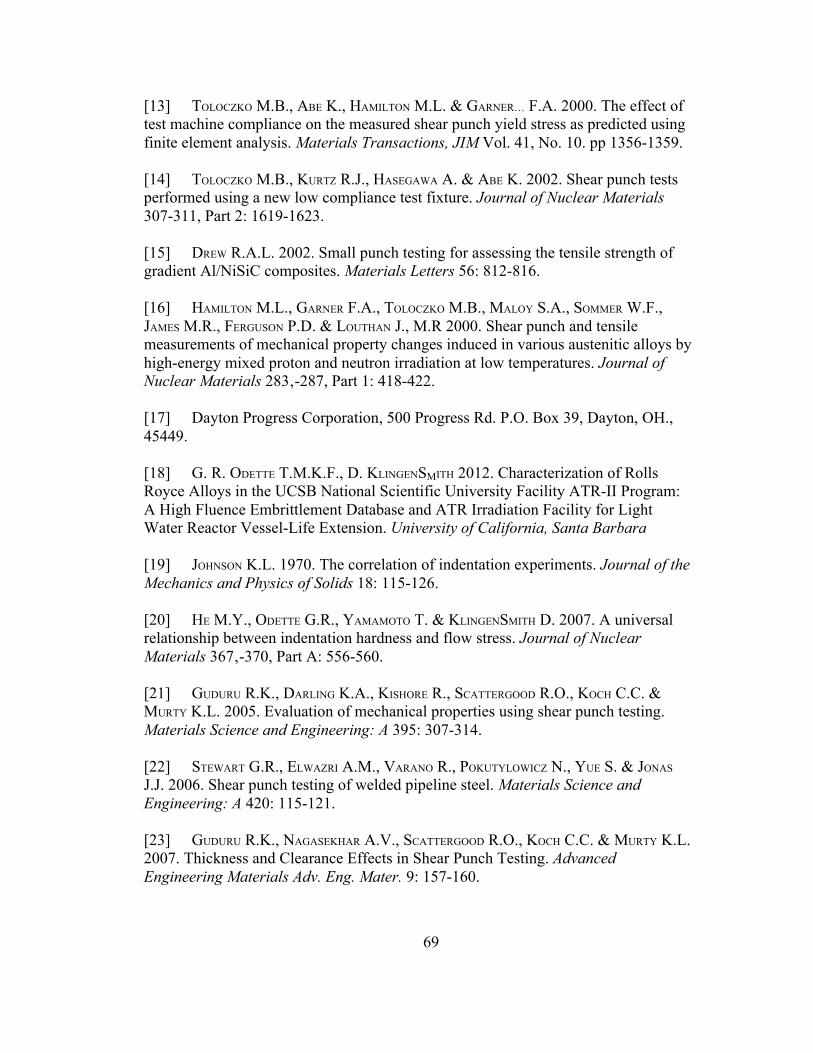
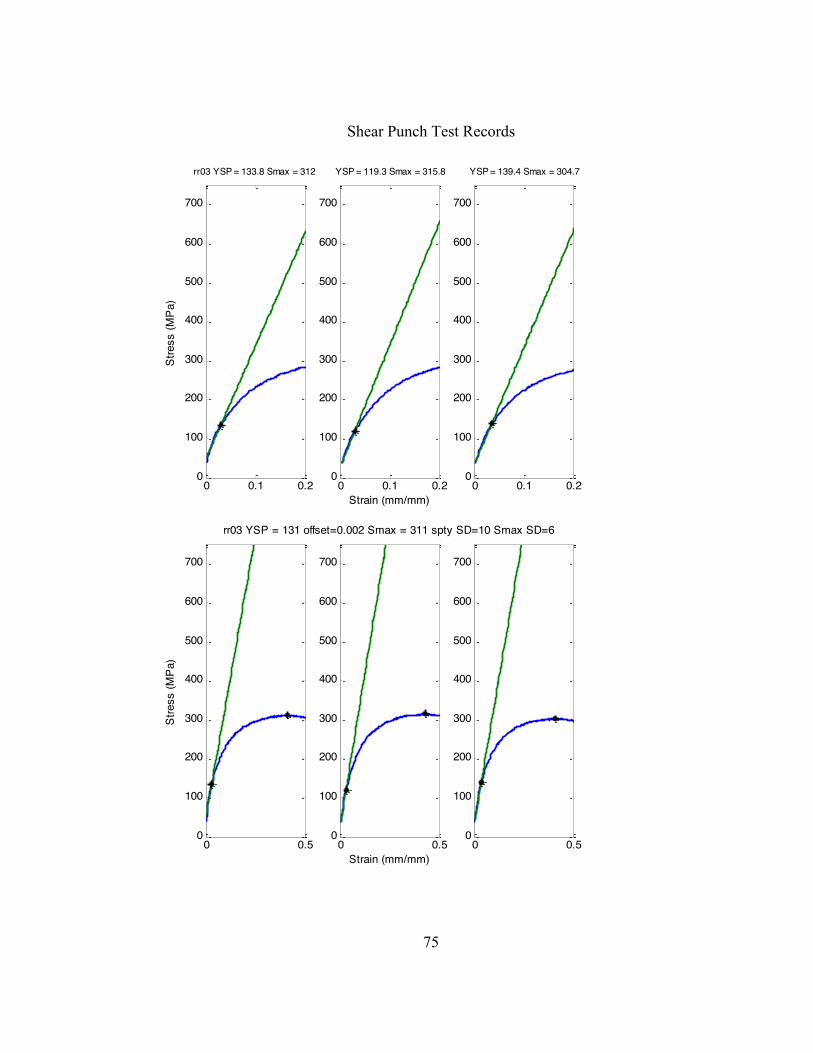
Shear Punch Test Records
73
Appendix B
0 0.1 0.20
100
200
300
400
500
600
700
rr01 YSP = 181.1 Smax = 387.8
Stre
ss (M
Pa)
0 0.1 0.20
100
200
300
400
500
600
700
YSP = 176.4 Smax = 379.9
Strain (mm/mm)0 0.1 0.2
0
100
200
300
400
500
600
700
YSP = 206 Smax = 397.7
0 0.50
100
200
300
400
500
600
700
Stre
ss (M
Pa)
0 0.50
100
200
300
400
500
600
700
rr01 YSP = 188 offset=0.002 Smax = 388 spty SD=16 Smax SD=9
Strain (mm/mm)0 0.5
0
100
200
300
400
500
600
700

Shear Punch Test Records
74
0 0.1 0.20
100
200
300
400
500
600
700
rr02 YSP = 155.3 Smax = 337.2St
ress
(MPa
)
0 0.1 0.20
100
200
300
400
500
600
700
YSP = 158.9 Smax = 324.9
Strain (mm/mm)0 0.1 0.2
0
100
200
300
400
500
600
700
YSP = 150.9 Smax = 346.8
0 0.50
100
200
300
400
500
600
700
Stre
ss (M
Pa)
0 0.50
100
200
300
400
500
600
700
rr02 YSP = 155 offset=0.002 Smax = 336 spty SD=4 Smax SD=1e+001
Strain (mm/mm)0 0.5
0
100
200
300
400
500
600
700
Shear Punch Test Records
75
0 0.1 0.20
100
200
300
400
500
600
700
rr03 YSP = 133.8 Smax = 312St
ress
(MPa
)
0 0.1 0.20
100
200
300
400
500
600
700
YSP = 119.3 Smax = 315.8
Strain (mm/mm)0 0.1 0.2
0
100
200
300
400
500
600
700
YSP = 139.4 Smax = 304.7
0 0.50
100
200
300
400
500
600
700
Stre
ss (M
Pa)
0 0.50
100
200
300
400
500
600
700
rr03 YSP = 131 offset=0.002 Smax = 311 spty SD=10 Smax SD=6
Strain (mm/mm)0 0.5
0
100
200
300
400
500
600
700

Shear Punch Test Records
76
0 0.1 0.20
100
200
300
400
500
600
700
rr04 YSP = 200.7 Smax = 410.4St
ress
(MPa
)
0 0.1 0.20
100
200
300
400
500
600
700
YSP = 208.8 Smax = 418.3
Strain (mm/mm)0 0.1 0.2
0
100
200
300
400
500
600
700
YSP = 206 Smax = 426.6
0 0.50
100
200
300
400
500
600
700
Stre
ss (M
Pa)
0 0.50
100
200
300
400
500
600
700
rr04 YSP = 205 offset=0.002 Smax = 418 spty SD=4.1 Smax SD=8
Strain (mm/mm)0 0.5
0
100
200
300
400
500
600
700

Shear Punch Test Records
77
0 0.1 0.20
100
200
300
400
500
600
700
rr05 YSP = 205.1 Smax = 371.4St
ress
(MPa
)
0 0.1 0.20
100
200
300
400
500
600
700
YSP = 199.7 Smax = 375.2
Strain (mm/mm)0 0.1 0.2
0
100
200
300
400
500
600
700
YSP = 213.1 Smax = 369.6
0 0.50
100
200
300
400
500
600
700
Stre
ss (M
Pa)
0 0.50
100
200
300
400
500
600
700
rr05 YSP = 206 offset=0.002 Smax = 372 spty SD=6.7 Smax SD=3
Strain (mm/mm)0 0.5
0
100
200
300
400
500
600
700

Shear Punch Test Records
78
0 0.1 0.20
100
200
300
400
500
600
700
rr06 YSP = 243.2 Smax = 394.4St
ress
(MPa
)
0 0.1 0.20
100
200
300
400
500
600
700
YSP = 230.1 Smax = 390.6
Strain (mm/mm)0 0.1 0.2
0
100
200
300
400
500
600
700
YSP = 221.7 Smax = 398.3
0 0.50
100
200
300
400
500
600
700
Stre
ss (M
Pa)
0 0.50
100
200
300
400
500
600
700
rr06 YSP = 232 offset=0.002 Smax = 394 spty SD=11 Smax SD=4
Strain (mm/mm)0 0.5
0
100
200
300
400
500
600
700

Shear Punch Test Records
79
0 0.1 0.20
100
200
300
400
500
600
700
rr07 YSP = 253.5 Smax = 426.5St
ress
(MPa
)
0 0.1 0.20
100
200
300
400
500
600
700
YSP = 237.4 Smax = 423.9
Strain (mm/mm)0 0.1 0.2
0
100
200
300
400
500
600
700
YSP = 243.2 Smax = 426.5
0 0.50
100
200
300
400
500
600
700
Stre
ss (M
Pa)
0 0.50
100
200
300
400
500
600
700
rr07 YSP = 245 offset=0.002 Smax = 426 spty SD=8.1 Smax SD=1
Strain (mm/mm)0 0.5
0
100
200
300
400
500
600
700

Shear Punch Test Records
80
0 0.1 0.20
100
200
300
400
500
600
700
rr08 YSP = 204.5 Smax = 405.6St
ress
(MPa
)
0 0.1 0.20
100
200
300
400
500
600
700
YSP = 186 Smax = 404.1
Strain (mm/mm)0 0.1 0.2
0
100
200
300
400
500
600
700
YSP = 192.4 Smax = 404.5
0 0.50
100
200
300
400
500
600
700
Stre
ss (M
Pa)
0 0.50
100
200
300
400
500
600
700
rr08 YSP = 194 offset=0.002 Smax = 405 spty SD=9.4 Smax SD=0.8
Strain (mm/mm)0 0.5
0
100
200
300
400
500
600
700

Shear Punch Test Records
81
0 0.1 0.20
100
200
300
400
500
600
700
rr09 YSP = 215.9 Smax = 418.9St
ress
(MPa
)
0 0.1 0.20
100
200
300
400
500
600
700
YSP = 227.6 Smax = 423.9
Strain (mm/mm)0 0.1 0.2
0
100
200
300
400
500
600
700
YSP = 225.7 Smax = 423
0 0.50
100
200
300
400
500
600
700
Stre
ss (M
Pa)
0 0.50
100
200
300
400
500
600
700
rr09 YSP = 223 offset=0.002 Smax = 422 spty SD=6.3 Smax SD=3
Strain (mm/mm)0 0.5
0
100
200
300
400
500
600
700

Shear Punch Test Records
82
0 0.1 0.20
100
200
300
400
500
600
700
rr10 YSP = 418.5 Smax = 608.2St
ress
(MPa
)
0 0.1 0.20
100
200
300
400
500
600
700
YSP = 409.7 Smax = 606.8
Strain (mm/mm)0 0.1 0.2
0
100
200
300
400
500
600
700
YSP = 418.4 Smax = 598.1
0 0.50
100
200
300
400
500
600
700
Stre
ss (M
Pa)
0 0.50
100
200
300
400
500
600
700
rr10 YSP = 416 offset=0.002 Smax = 604 spty SD=5.1 Smax SD=5
Strain (mm/mm)0 0.5
0
100
200
300
400
500
600
700
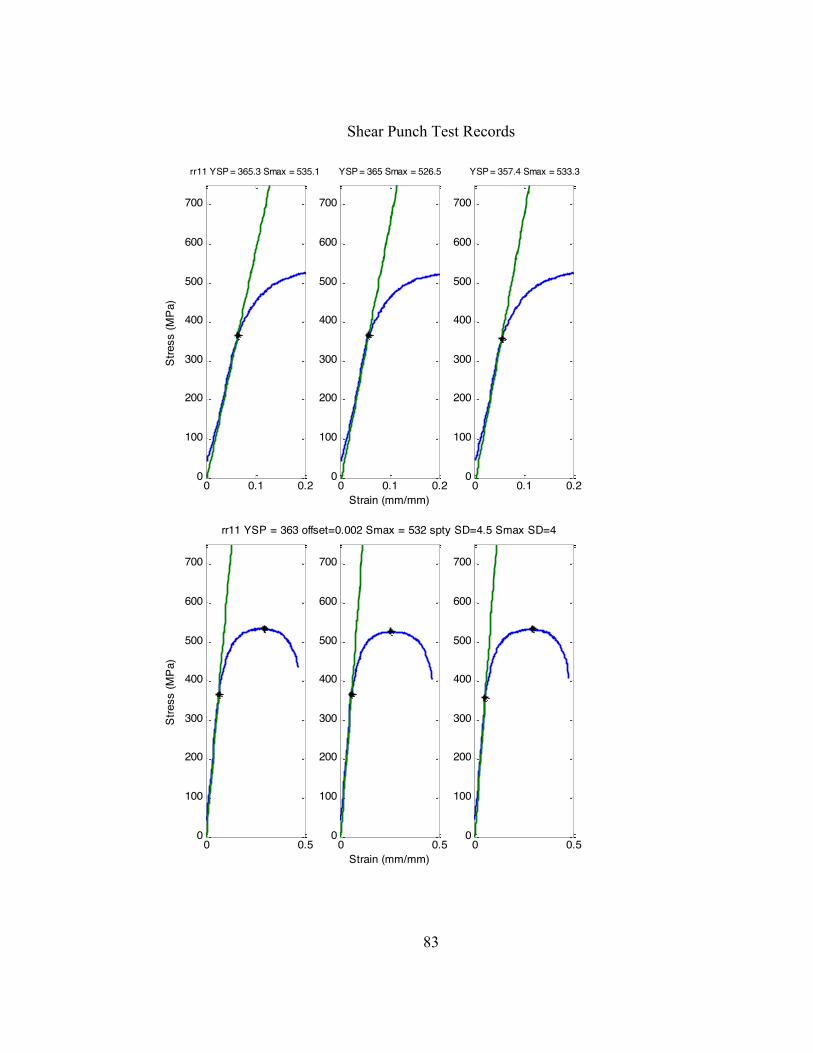
Shear Punch Test Records
83
0 0.1 0.20
100
200
300
400
500
600
700
rr11 YSP = 365.3 Smax = 535.1St
ress
(MPa
)
0 0.1 0.20
100
200
300
400
500
600
700
YSP = 365 Smax = 526.5
Strain (mm/mm)0 0.1 0.2
0
100
200
300
400
500
600
700
YSP = 357.4 Smax = 533.3
0 0.50
100
200
300
400
500
600
700
Stre
ss (M
Pa)
0 0.50
100
200
300
400
500
600
700
rr11 YSP = 363 offset=0.002 Smax = 532 spty SD=4.5 Smax SD=4
Strain (mm/mm)0 0.5
0
100
200
300
400
500
600
700

Shear Punch Test Records
84
0 0.1 0.20
100
200
300
400
500
600
700
rr12 YSP = 295.8 Smax = 473.2St
ress
(MPa
)
0 0.1 0.20
100
200
300
400
500
600
700
YSP = 284 Smax = 460.6
Strain (mm/mm)0 0.1 0.2
0
100
200
300
400
500
600
700
YSP = 285.4 Smax = 473.6
0 0.50
100
200
300
400
500
600
700
Stre
ss (M
Pa)
0 0.50
100
200
300
400
500
600
700
rr12 YSP = 288 offset=0.002 Smax = 469 spty SD=6.5 Smax SD=7
Strain (mm/mm)0 0.5
0
100
200
300
400
500
600
700

Shear Punch Test Records
85
0 0.1 0.20
100
200
300
400
500
600
700
rr13 YSP = 392.8 Smax = 618.8St
ress
(MPa
)
0 0.1 0.20
100
200
300
400
500
600
700
YSP = 414.4 Smax = 615.4
Strain (mm/mm)0 0.1 0.2
0
100
200
300
400
500
600
700
YSP = 402.3 Smax = 620.2
0 0.50
100
200
300
400
500
600
700
Stre
ss (M
Pa)
0 0.50
100
200
300
400
500
600
700
rr13 YSP = 403 offset=0.002 Smax = 618 spty SD=11 Smax SD=2
Strain (mm/mm)0 0.5
0
100
200
300
400
500
600
700

Shear Punch Test Records
86
0 0.1 0.20
100
200
300
400
500
600
700
rr14 YSP = 364.9 Smax = 540.1St
ress
(MPa
)
0 0.1 0.20
100
200
300
400
500
600
700
YSP = 354.1 Smax = 529.9
Strain (mm/mm)0 0.1 0.2
0
100
200
300
400
500
600
700
YSP = 368.3 Smax = 536.1
0 0.50
100
200
300
400
500
600
700
Stre
ss (M
Pa)
0 0.50
100
200
300
400
500
600
700
rr14 YSP = 362 offset=0.002 Smax = 535 spty SD=7.4 Smax SD=5
Strain (mm/mm)0 0.5
0
100
200
300
400
500
600
700

Shear Punch Test Records
87
0 0.1 0.20
100
200
300
400
500
600
700
rr15 YSP = 402.6 Smax = 589.1St
ress
(MPa
)
0 0.1 0.20
100
200
300
400
500
600
700
YSP = 407.5 Smax = 586
Strain (mm/mm)0 0.1 0.2
0
100
200
300
400
500
600
700
YSP = 404.8 Smax = 582.5
0 0.50
100
200
300
400
500
600
700
Stre
ss (M
Pa)
0 0.50
100
200
300
400
500
600
700
rr15 YSP = 405 offset=0.002 Smax = 586 spty SD=2.4 Smax SD=3
Strain (mm/mm)0 0.5
0
100
200
300
400
500
600
700

Shear Punch Test Records
88
0 0.1 0.20
100
200
300
400
500
600
700
rr16 YSP = 413.8 Smax = 588.5St
ress
(MPa
)
0 0.1 0.20
100
200
300
400
500
600
700
YSP = 420.6 Smax = 591.2
Strain (mm/mm)0 0.1 0.2
0
100
200
300
400
500
600
700
YSP = 422.6 Smax = 589.3
0 0.50
100
200
300
400
500
600
700
Stre
ss (M
Pa)
0 0.50
100
200
300
400
500
600
700
rr16 YSP = 419 offset=0.002 Smax = 590 spty SD=4.6 Smax SD=1
Strain (mm/mm)0 0.5
0
100
200
300
400
500
600
700
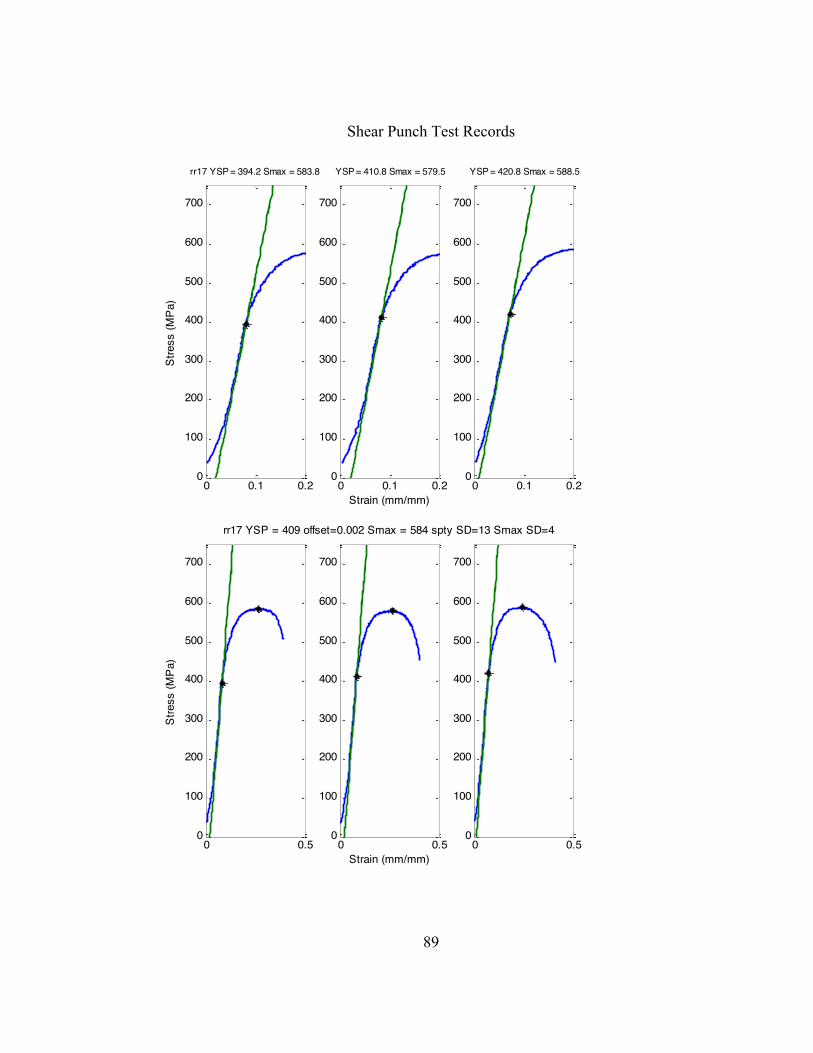
Shear Punch Test Records
89
0 0.1 0.20
100
200
300
400
500
600
700
rr17 YSP = 394.2 Smax = 583.8St
ress
(MPa
)
0 0.1 0.20
100
200
300
400
500
600
700
YSP = 410.8 Smax = 579.5
Strain (mm/mm)0 0.1 0.2
0
100
200
300
400
500
600
700
YSP = 420.8 Smax = 588.5
0 0.50
100
200
300
400
500
600
700
Stre
ss (M
Pa)
0 0.50
100
200
300
400
500
600
700
rr17 YSP = 409 offset=0.002 Smax = 584 spty SD=13 Smax SD=4
Strain (mm/mm)0 0.5
0
100
200
300
400
500
600
700

Shear Punch Test Records
90
0 0.1 0.20
100
200
300
400
500
600
700
rr18 YSP = 420.1 Smax = 618.9St
ress
(MPa
)
0 0.1 0.20
100
200
300
400
500
600
700
YSP = 437.5 Smax = 628.6
Strain (mm/mm)0 0.1 0.2
0
100
200
300
400
500
600
700
YSP = 430.1 Smax = 611.1
0 0.50
100
200
300
400
500
600
700
Stre
ss (M
Pa)
0 0.50
100
200
300
400
500
600
700
rr18 YSP = 429 offset=0.002 Smax = 620 spty SD=8.7 Smax SD=9
Strain (mm/mm)0 0.5
0
100
200
300
400
500
600
700

Shear Punch Test Records
91
0 0.1 0.20
100
200
300
400
500
600
700
rr19 YSP = 283.3 Smax = 458.2St
ress
(MPa
)
0 0.1 0.20
100
200
300
400
500
600
700
YSP = 278.7 Smax = 463.4
Strain (mm/mm)0 0.1 0.2
0
100
200
300
400
500
600
700
YSP = 269.1 Smax = 458.2
0 0.50
100
200
300
400
500
600
700
Stre
ss (M
Pa)
0 0.50
100
200
300
400
500
600
700
rr19 YSP = 277 offset=0.002 Smax = 460 spty SD=7.2 Smax SD=3
Strain (mm/mm)0 0.5
0
100
200
300
400
500
600
700
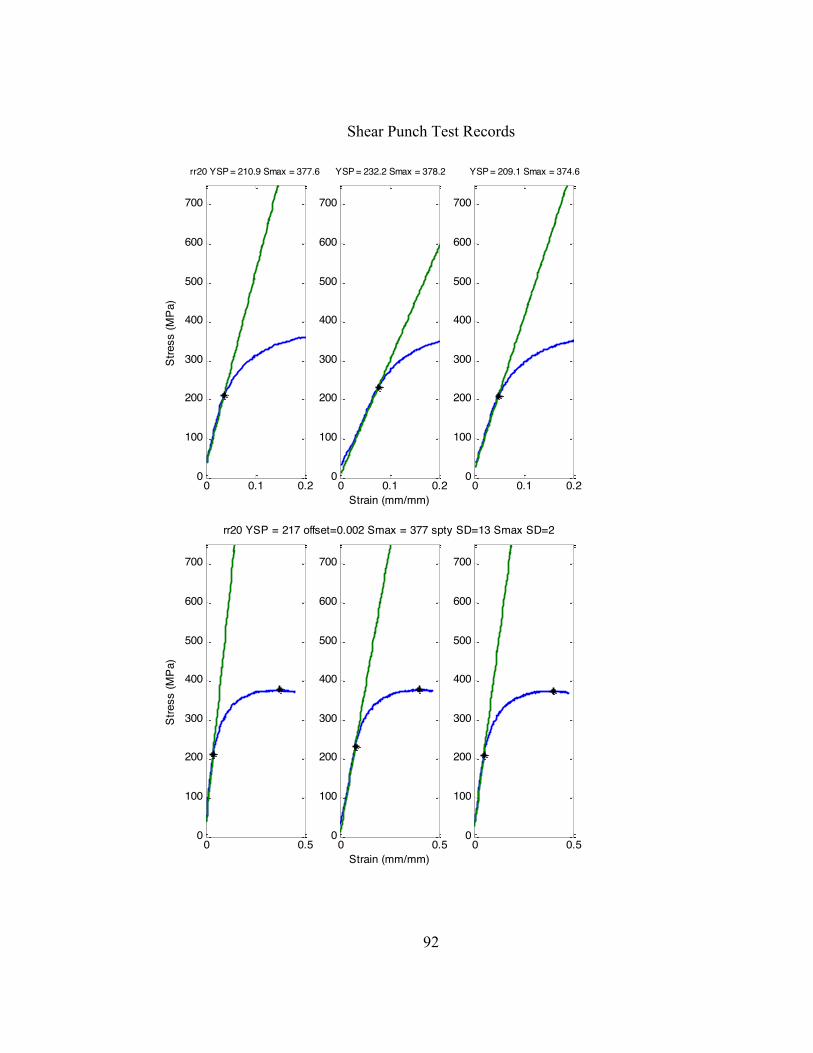
Shear Punch Test Records
92
0 0.1 0.20
100
200
300
400
500
600
700
rr20 YSP = 210.9 Smax = 377.6St
ress
(MPa
)
0 0.1 0.20
100
200
300
400
500
600
700
YSP = 232.2 Smax = 378.2
Strain (mm/mm)0 0.1 0.2
0
100
200
300
400
500
600
700
YSP = 209.1 Smax = 374.6
0 0.50
100
200
300
400
500
600
700
Stre
ss (M
Pa)
0 0.50
100
200
300
400
500
600
700
rr20 YSP = 217 offset=0.002 Smax = 377 spty SD=13 Smax SD=2
Strain (mm/mm)0 0.5
0
100
200
300
400
500
600
700
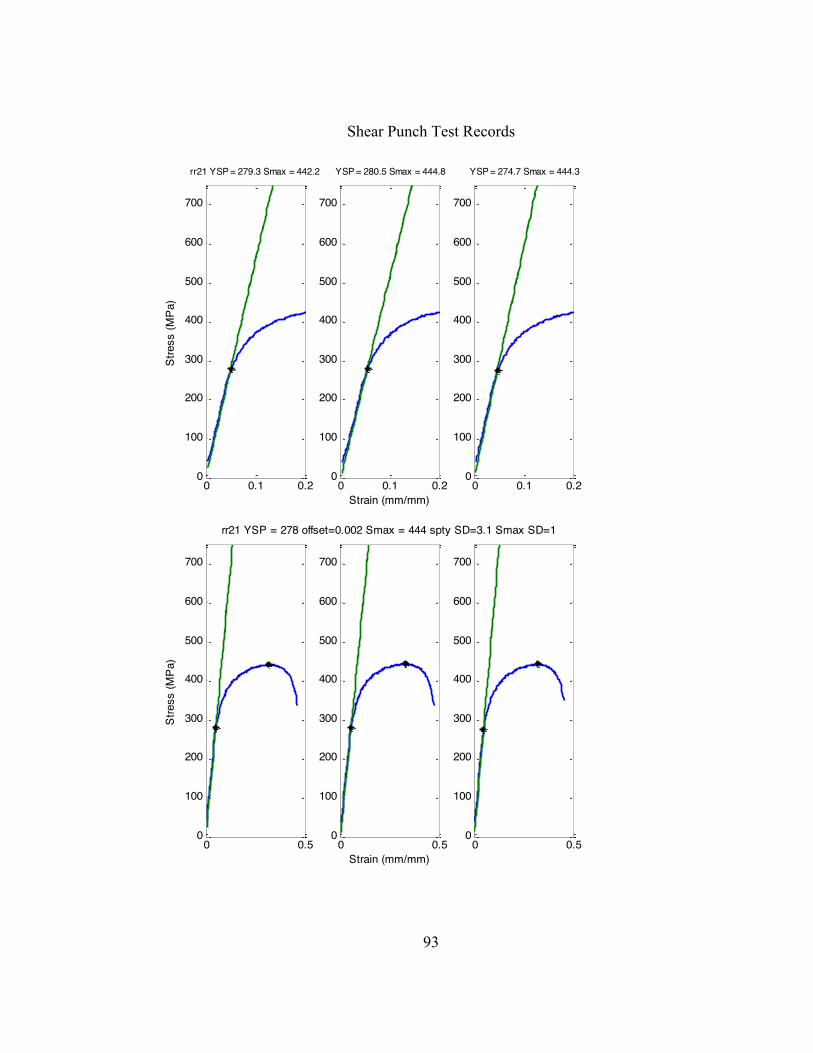
Shear Punch Test Records
93
0 0.1 0.20
100
200
300
400
500
600
700
rr21 YSP = 279.3 Smax = 442.2St
ress
(MPa
)
0 0.1 0.20
100
200
300
400
500
600
700
YSP = 280.5 Smax = 444.8
Strain (mm/mm)0 0.1 0.2
0
100
200
300
400
500
600
700
YSP = 274.7 Smax = 444.3
0 0.50
100
200
300
400
500
600
700
Stre
ss (M
Pa)
0 0.50
100
200
300
400
500
600
700
rr21 YSP = 278 offset=0.002 Smax = 444 spty SD=3.1 Smax SD=1
Strain (mm/mm)0 0.5
0
100
200
300
400
500
600
700

Shear Punch Test Records
94
0 0.1 0.20
100
200
300
400
500
600
700
rr22 YSP = 349.2 Smax = 538St
ress
(MPa
)
0 0.1 0.20
100
200
300
400
500
600
700
YSP = 346.5 Smax = 532.7
Strain (mm/mm)0 0.1 0.2
0
100
200
300
400
500
600
700
YSP = 335.4 Smax = 527.4
0 0.50
100
200
300
400
500
600
700
Stre
ss (M
Pa)
0 0.50
100
200
300
400
500
600
700
rr22 YSP = 344 offset=0.002 Smax = 533 spty SD=7.3 Smax SD=5
Strain (mm/mm)0 0.5
0
100
200
300
400
500
600
700

Shear Punch Test Records
95
0 0.1 0.20
100
200
300
400
500
600
700
rr23 YSP = 256.6 Smax = 418.3St
ress
(MPa
)
0 0.1 0.20
100
200
300
400
500
600
700
YSP = 260.4 Smax = 420.9
Strain (mm/mm)0 0.1 0.2
0
100
200
300
400
500
600
700
YSP = 263.1 Smax = 423.8
0 0.50
100
200
300
400
500
600
700
Stre
ss (M
Pa)
0 0.50
100
200
300
400
500
600
700
rr23 YSP = 260 offset=0.002 Smax = 421 spty SD=3.3 Smax SD=3
Strain (mm/mm)0 0.5
0
100
200
300
400
500
600
700

Shear Punch Test Records
96
0 0.1 0.20
100
200
300
400
500
600
700
rr24 YSP = 366 Smax = 560.4St
ress
(MPa
)
0 0.1 0.20
100
200
300
400
500
600
700
YSP = 370.1 Smax = 569
Strain (mm/mm)0 0.1 0.2
0
100
200
300
400
500
600
700
YSP = 371.1 Smax = 565.7
0 0.50
100
200
300
400
500
600
700
Stre
ss (M
Pa)
0 0.50
100
200
300
400
500
600
700
rr24 YSP = 369 offset=0.002 Smax = 565 spty SD=2.7 Smax SD=4
Strain (mm/mm)0 0.5
0
100
200
300
400
500
600
700

Shear Punch Test Records
97
0 0.1 0.20
100
200
300
400
500
600
700
rr25 YSP = 280.1 Smax = 461.4St
ress
(MPa
)
0 0.1 0.20
100
200
300
400
500
600
700
YSP = 292.5 Smax = 460
Strain (mm/mm)0 0.1 0.2
0
100
200
300
400
500
600
700
YSP = 279.4 Smax = 452.4
0 0.50
100
200
300
400
500
600
700
Stre
ss (M
Pa)
0 0.50
100
200
300
400
500
600
700
rr25 YSP = 284 offset=0.002 Smax = 458 spty SD=7.4 Smax SD=5
Strain (mm/mm)0 0.5
0
100
200
300
400
500
600
700
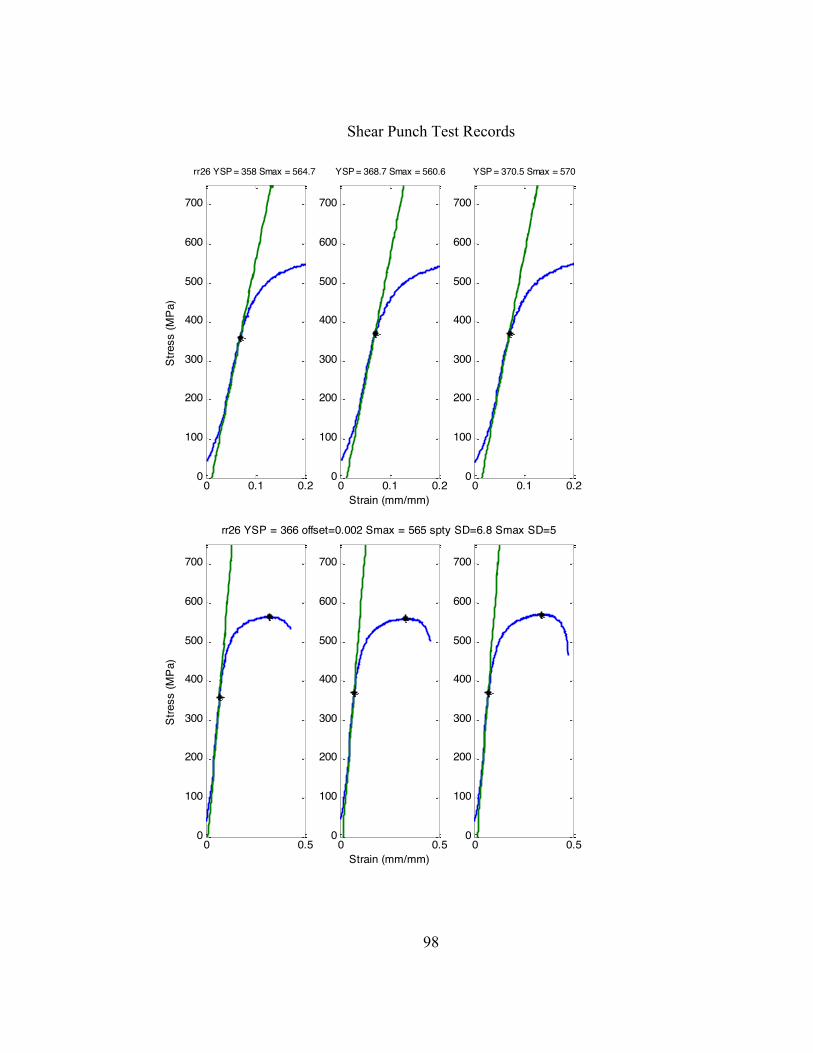
Shear Punch Test Records
98
0 0.1 0.20
100
200
300
400
500
600
700
rr26 YSP = 358 Smax = 564.7St
ress
(MPa
)
0 0.1 0.20
100
200
300
400
500
600
700
YSP = 368.7 Smax = 560.6
Strain (mm/mm)0 0.1 0.2
0
100
200
300
400
500
600
700
YSP = 370.5 Smax = 570
0 0.50
100
200
300
400
500
600
700
Stre
ss (M
Pa)
0 0.50
100
200
300
400
500
600
700
rr26 YSP = 366 offset=0.002 Smax = 565 spty SD=6.8 Smax SD=5
Strain (mm/mm)0 0.5
0
100
200
300
400
500
600
700

Shear Punch Test Records
99
0 0.1 0.20
100
200
300
400
500
600
700
rr27 YSP = 277.4 Smax = 418.6St
ress
(MPa
)
0 0.1 0.20
100
200
300
400
500
600
700
YSP = 267.6 Smax = 419.5
Strain (mm/mm)0 0.1 0.2
0
100
200
300
400
500
600
700
YSP = 270 Smax = 418.4
0 0.50
100
200
300
400
500
600
700
Stre
ss (M
Pa)
0 0.50
100
200
300
400
500
600
700
rr27 YSP = 272 offset=0.002 Smax = 419 spty SD=5.1 Smax SD=0.6
Strain (mm/mm)0 0.5
0
100
200
300
400
500
600
700

Shear Punch Test Records
100
0 0.1 0.20
100
200
300
400
500
600
700
rr28 YSP = 347 Smax = 551.7St
ress
(MPa
)
0 0.1 0.20
100
200
300
400
500
600
700
YSP = 337.3 Smax = 545.7
Strain (mm/mm)0 0.1 0.2
0
100
200
300
400
500
600
700
YSP = 332.2 Smax = 551.7
0 0.50
100
200
300
400
500
600
700
Stre
ss (M
Pa)
0 0.50
100
200
300
400
500
600
700
rr28 YSP = 339 offset=0.002 Smax = 550 spty SD=7.5 Smax SD=3
Strain (mm/mm)0 0.5
0
100
200
300
400
500
600
700

Shear Punch Test Records
101
0 0.1 0.20
100
200
300
400
500
600
700
rr29 YSP = 277.2 Smax = 450.7St
ress
(MPa
)
0 0.1 0.20
100
200
300
400
500
600
700
YSP = 294.2 Smax = 450
Strain (mm/mm)0 0.1 0.2
0
100
200
300
400
500
600
700
YSP = 278.2 Smax = 447.8
0 0.50
100
200
300
400
500
600
700
Stre
ss (M
Pa)
0 0.50
100
200
300
400
500
600
700
rr29 YSP = 283 offset=0.002 Smax = 450 spty SD=9.6 Smax SD=2
Strain (mm/mm)0 0.5
0
100
200
300
400
500
600
700

Shear Punch Test Records
102
0 0.1 0.20
100
200
300
400
500
600
700
rr30 YSP = 302.1 Smax = 474.1St
ress
(MPa
)
0 0.1 0.20
100
200
300
400
500
600
700
YSP = 293.8 Smax = 464.8
Strain (mm/mm)0 0.1 0.2
0
100
200
300
400
500
600
700
YSP = 293.3 Smax = 471.5
0 0.50
100
200
300
400
500
600
700
Stre
ss (M
Pa)
0 0.50
100
200
300
400
500
600
700
rr30 YSP = 296 offset=0.002 Smax = 470 spty SD=5 Smax SD=5
Strain (mm/mm)0 0.5
0
100
200
300
400
500
600
700

Shear Punch Test Records
103
0 0.1 0.20
100
200
300
400
500
600
700
rr31b YSP = 362.9 Smax = 534St
ress
(MPa
)
0 0.1 0.20
100
200
300
400
500
600
700
YSP = 359 Smax = 530.2
Strain (mm/mm)0 0.1 0.2
0
100
200
300
400
500
600
700
YSP = 371.2 Smax = 535.1
0 0.50
100
200
300
400
500
600
700
Stre
ss (M
Pa)
0 0.50
100
200
300
400
500
600
700
rr31b YSP = 364 offset=0.002 Smax = 533 spty SD=6.2 Smax SD=3
Strain (mm/mm)0 0.5
0
100
200
300
400
500
600
700

Shear Punch Test Records
104
0 0.1 0.20
100
200
300
400
500
600
700
rr32 YSP = 421.2 Smax = 578.1St
ress
(MPa
)
0 0.1 0.20
100
200
300
400
500
600
700
YSP = 416.7 Smax = 574
Strain (mm/mm)0 0.1 0.2
0
100
200
300
400
500
600
700
YSP = 394.9 Smax = 590.3
0 0.50
100
200
300
400
500
600
700
Stre
ss (M
Pa)
0 0.50
100
200
300
400
500
600
700
rr32 YSP = 411 offset=0.002 Smax = 581 spty SD=14 Smax SD=8
Strain (mm/mm)0 0.5
0
100
200
300
400
500
600
700

Shear Punch Test Records
105
0 0.1 0.20
100
200
300
400
500
600
700
rr33 YSP = 298.2 Smax = 490.1St
ress
(MPa
)
0 0.1 0.20
100
200
300
400
500
600
700
YSP = 305 Smax = 485.7
Strain (mm/mm)0 0.1 0.2
0
100
200
300
400
500
600
700
YSP = 298.9 Smax = 489.2
0 0.50
100
200
300
400
500
600
700
Stre
ss (M
Pa)
0 0.50
100
200
300
400
500
600
700
rr33 YSP = 301 offset=0.002 Smax = 488 spty SD=3.8 Smax SD=2
Strain (mm/mm)0 0.5
0
100
200
300
400
500
600
700

Shear Punch Test Records
106
0 0.1 0.20
100
200
300
400
500
600
700
rr34 YSP = 309.2 Smax = 473.8St
ress
(MPa
)
0 0.1 0.20
100
200
300
400
500
600
700
YSP = 290.4 Smax = 471.7
Strain (mm/mm)0 0.1 0.2
0
100
200
300
400
500
600
700
YSP = 305.9 Smax = 480.3
0 0.50
100
200
300
400
500
600
700
Stre
ss (M
Pa)
0 0.50
100
200
300
400
500
600
700
rr34 YSP = 302 offset=0.002 Smax = 475 spty SD=10 Smax SD=4
Strain (mm/mm)0 0.5
0
100
200
300
400
500
600
700

Shear Punch Test Records
107
0 0.1 0.20
100
200
300
400
500
600
700
rr35 YSP = 275.4 Smax = 475.1St
ress
(MPa
)
0 0.1 0.20
100
200
300
400
500
600
700
YSP = 280.8 Smax = 477.8
Strain (mm/mm)0 0.1 0.2
0
100
200
300
400
500
600
700
YSP = 278.3 Smax = 479.1
0 0.50
100
200
300
400
500
600
700
Stre
ss (M
Pa)
0 0.50
100
200
300
400
500
600
700
rr35 YSP = 278 offset=0.002 Smax = 477 spty SD=2.7 Smax SD=2
Strain (mm/mm)0 0.5
0
100
200
300
400
500
600
700

Shear Punch Test Records
108
0 0.1 0.20
100
200
300
400
500
600
700
rr36 YSP = 231.3 Smax = 386.9St
ress
(MPa
)
0 0.1 0.20
100
200
300
400
500
600
700
YSP = 233.9 Smax = 387.6
Strain (mm/mm)0 0.1 0.2
0
100
200
300
400
500
600
700
YSP = 234.3 Smax = 388
0 0.50
100
200
300
400
500
600
700
Stre
ss (M
Pa)
0 0.50
100
200
300
400
500
600
700
rr36 YSP = 233 offset=0.002 Smax = 388 spty SD=1.6 Smax SD=0.6
Strain (mm/mm)0 0.5
0
100
200
300
400
500
600
700

Shear Punch Test Records
109
0 0.1 0.20
100
200
300
400
500
600
700
rr37 YSP = 311.4 Smax = 513.8St
ress
(MPa
)
0 0.1 0.20
100
200
300
400
500
600
700
YSP = 325.6 Smax = 526.1
Strain (mm/mm)0 0.1 0.2
0
100
200
300
400
500
600
700
YSP = 326 Smax = 520.8
0 0.50
100
200
300
400
500
600
700
Stre
ss (M
Pa)
0 0.50
100
200
300
400
500
600
700
rr37 YSP = 321 offset=0.002 Smax = 520 spty SD=8.3 Smax SD=6
Strain (mm/mm)0 0.5
0
100
200
300
400
500
600
700

Shear Punch Test Records
110
0 0.1 0.20
100
200
300
400
500
600
700
rr38 YSP = 243.3 Smax = 408.7St
ress
(MPa
)
0 0.1 0.20
100
200
300
400
500
600
700
YSP = 246.2 Smax = 407.7
Strain (mm/mm)0 0.1 0.2
0
100
200
300
400
500
600
700
YSP = 249.7 Smax = 415.3
0 0.50
100
200
300
400
500
600
700
Stre
ss (M
Pa)
0 0.50
100
200
300
400
500
600
700
rr38 YSP = 246 offset=0.002 Smax = 411 spty SD=3.2 Smax SD=4
Strain (mm/mm)0 0.5
0
100
200
300
400
500
600
700
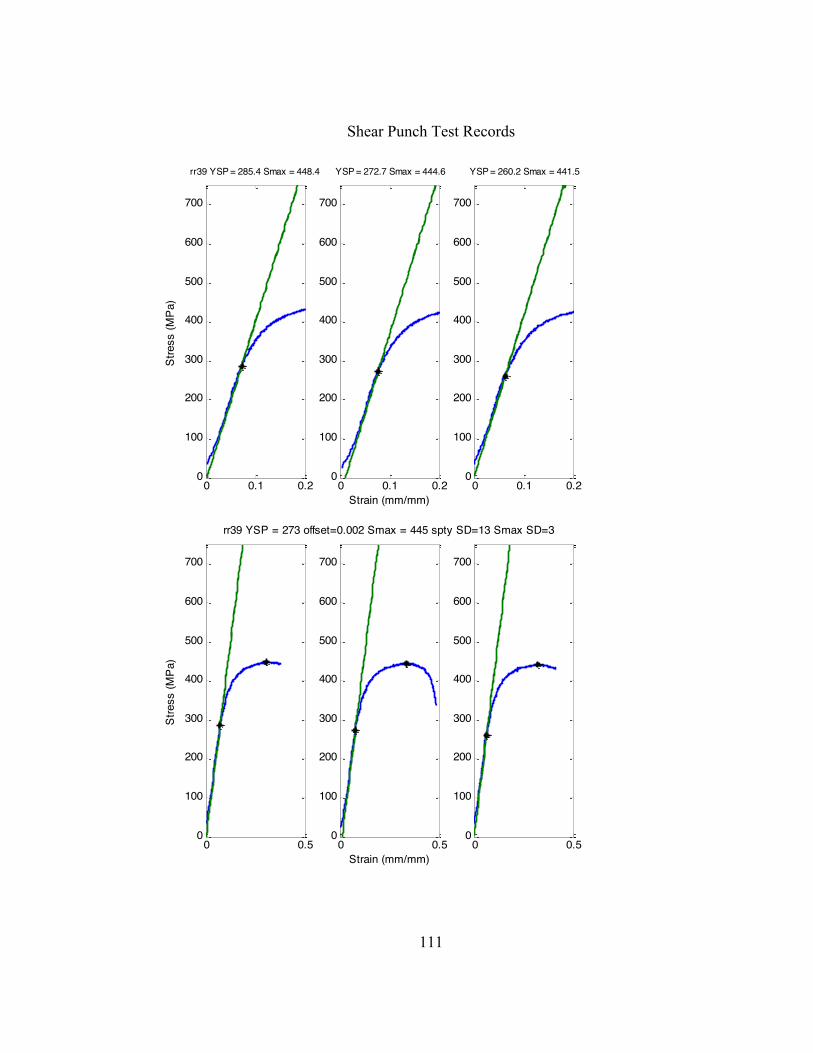
Shear Punch Test Records
111
0 0.1 0.20
100
200
300
400
500
600
700
rr39 YSP = 285.4 Smax = 448.4St
ress
(MPa
)
0 0.1 0.20
100
200
300
400
500
600
700
YSP = 272.7 Smax = 444.6
Strain (mm/mm)0 0.1 0.2
0
100
200
300
400
500
600
700
YSP = 260.2 Smax = 441.5
0 0.50
100
200
300
400
500
600
700
Stre
ss (M
Pa)
0 0.50
100
200
300
400
500
600
700
rr39 YSP = 273 offset=0.002 Smax = 445 spty SD=13 Smax SD=3
Strain (mm/mm)0 0.5
0
100
200
300
400
500
600
700

Shear Punch Test Records
112
0 0.1 0.20
100
200
300
400
500
600
700
rr40 YSP = 296.7 Smax = 482.4St
ress
(MPa
)
0 0.1 0.20
100
200
300
400
500
600
700
YSP = 295.8 Smax = 478.6
Strain (mm/mm)0 0.1 0.2
0
100
200
300
400
500
600
700
YSP = 302.6 Smax = 489.3
0 0.50
100
200
300
400
500
600
700
Stre
ss (M
Pa)
0 0.50
100
200
300
400
500
600
700
rr40 YSP = 298 offset=0.002 Smax = 483 spty SD=3.7 Smax SD=5
Strain (mm/mm)0 0.5
0
100
200
300
400
500
600
700

Shear Punch Test Records
113
0 0.1 0.20
100
200
300
400
500
600
700
rr41 YSP = 278.4 Smax = 477.8St
ress
(MPa
)
0 0.1 0.20
100
200
300
400
500
600
700
YSP = 282.6 Smax = 469
Strain (mm/mm)0 0.1 0.2
0
100
200
300
400
500
600
700
YSP = 288.4 Smax = 477.9
0 0.50
100
200
300
400
500
600
700
Stre
ss (M
Pa)
0 0.50
100
200
300
400
500
600
700
rr41 YSP = 283 offset=0.002 Smax = 475 spty SD=5.1 Smax SD=5
Strain (mm/mm)0 0.5
0
100
200
300
400
500
600
700

Shear Punch Test Records
114
0 0.1 0.20
100
200
300
400
500
600
700
rr42 YSP = 301.6 Smax = 487.8St
ress
(MPa
)
0 0.1 0.20
100
200
300
400
500
600
700
YSP = 314.3 Smax = 480.1
Strain (mm/mm)0 0.1 0.2
0
100
200
300
400
500
600
700
YSP = 304.9 Smax = 476.8
0 0.50
100
200
300
400
500
600
700
Stre
ss (M
Pa)
0 0.50
100
200
300
400
500
600
700
rr42 YSP = 307 offset=0.002 Smax = 482 spty SD=6.6 Smax SD=6
Strain (mm/mm)0 0.5
0
100
200
300
400
500
600
700

Shear Punch Test Records
115
0 0.1 0.20
100
200
300
400
500
600
700
rr43 YSP = 314 Smax = 488.5St
ress
(MPa
)
0 0.1 0.20
100
200
300
400
500
600
700
YSP = 325.1 Smax = 493.1
Strain (mm/mm)0 0.1 0.2
0
100
200
300
400
500
600
700
YSP = 306.3 Smax = 481.5
0 0.50
100
200
300
400
500
600
700
Stre
ss (M
Pa)
0 0.50
100
200
300
400
500
600
700
rr43 YSP = 315 offset=0.002 Smax = 488 spty SD=9.4 Smax SD=6
Strain (mm/mm)0 0.5
0
100
200
300
400
500
600
700

Shear Punch Test Records
116
0 0.1 0.20
100
200
300
400
500
600
700
rr44 YSP = 327.7 Smax = 495St
ress
(MPa
)
0 0.1 0.20
100
200
300
400
500
600
700
YSP = 323.5 Smax = 493.1
Strain (mm/mm)0 0.1 0.2
0
100
200
300
400
500
600
700
YSP = 323.5 Smax = 495.1
0 0.50
100
200
300
400
500
600
700
Stre
ss (M
Pa)
0 0.50
100
200
300
400
500
600
700
rr44 YSP = 325 offset=0.002 Smax = 494 spty SD=2.4 Smax SD=1
Strain (mm/mm)0 0.5
0
100
200
300
400
500
600
700
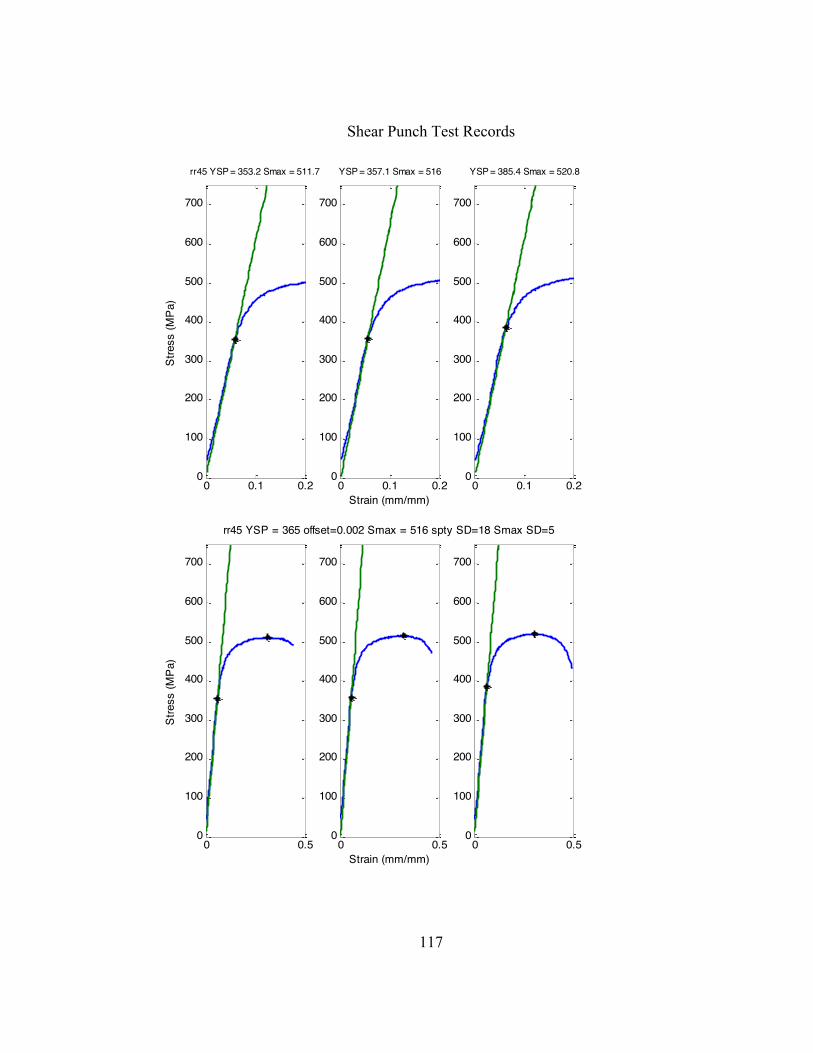
Shear Punch Test Records
117
0 0.1 0.20
100
200
300
400
500
600
700
rr45 YSP = 353.2 Smax = 511.7St
ress
(MPa
)
0 0.1 0.20
100
200
300
400
500
600
700
YSP = 357.1 Smax = 516
Strain (mm/mm)0 0.1 0.2
0
100
200
300
400
500
600
700
YSP = 385.4 Smax = 520.8
0 0.50
100
200
300
400
500
600
700
Stre
ss (M
Pa)
0 0.50
100
200
300
400
500
600
700
rr45 YSP = 365 offset=0.002 Smax = 516 spty SD=18 Smax SD=5
Strain (mm/mm)0 0.5
0
100
200
300
400
500
600
700

Shear Punch Test Records
118
0 0.1 0.20
100
200
300
400
500
600
700
rr46b YSP = 431.9 Smax = 618.6St
ress
(MPa
)
0 0.1 0.20
100
200
300
400
500
600
700
YSP = 406.6 Smax = 629.7
Strain (mm/mm)0 0.1 0.2
0
100
200
300
400
500
600
700
YSP = 442.8 Smax = 630
0 0.50
100
200
300
400
500
600
700
Stre
ss (M
Pa)
0 0.50
100
200
300
400
500
600
700
rr46b YSP = 427 offset=0.002 Smax = 626 spty SD=19 Smax SD=6
Strain (mm/mm)0 0.5
0
100
200
300
400
500
600
700

Shear Punch Test Records
119
0 0.1 0.20
100
200
300
400
500
600
700
rr47 YSP = 308.1 Smax = 492.8St
ress
(MPa
)
0 0.1 0.20
100
200
300
400
500
600
700
YSP = 317.5 Smax = 490.3
Strain (mm/mm)0 0.1 0.2
0
100
200
300
400
500
600
700
YSP = 288.1 Smax = 490.8
0 0.50
100
200
300
400
500
600
700
Stre
ss (M
Pa)
0 0.50
100
200
300
400
500
600
700
rr47 YSP = 305 offset=0.002 Smax = 491 spty SD=15 Smax SD=1
Strain (mm/mm)0 0.5
0
100
200
300
400
500
600
700
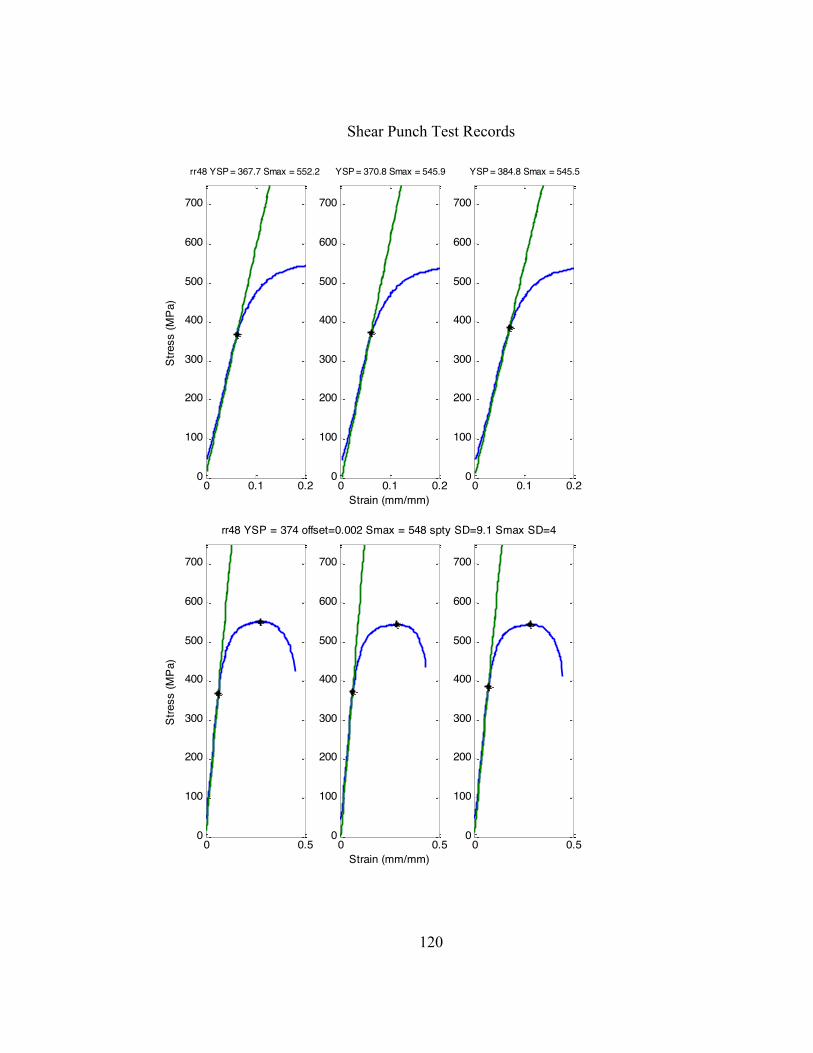
Shear Punch Test Records
120
0 0.1 0.20
100
200
300
400
500
600
700
rr48 YSP = 367.7 Smax = 552.2St
ress
(MPa
)
0 0.1 0.20
100
200
300
400
500
600
700
YSP = 370.8 Smax = 545.9
Strain (mm/mm)0 0.1 0.2
0
100
200
300
400
500
600
700
YSP = 384.8 Smax = 545.5
0 0.50
100
200
300
400
500
600
700
Stre
ss (M
Pa)
0 0.50
100
200
300
400
500
600
700
rr48 YSP = 374 offset=0.002 Smax = 548 spty SD=9.1 Smax SD=4
Strain (mm/mm)0 0.5
0
100
200
300
400
500
600
700

Shear Punch Test Records
121
0 0.1 0.20
100
200
300
400
500
600
700
rr49 YSP = 376.1 Smax = 526.1St
ress
(MPa
)
0 0.1 0.20
100
200
300
400
500
600
700
YSP = 334.5 Smax = 518.2
Strain (mm/mm)0 0.1 0.2
0
100
200
300
400
500
600
700
YSP = 343.3 Smax = 523.4
0 0.50
100
200
300
400
500
600
700
Stre
ss (M
Pa)
0 0.50
100
200
300
400
500
600
700
rr49 YSP = 351 offset=0.002 Smax = 523 spty SD=22 Smax SD=4
Strain (mm/mm)0 0.5
0
100
200
300
400
500
600
700

Shear Punch Test Records
122
0 0.1 0.20
100
200
300
400
500
600
700
rr50b YSP = 382.1 Smax = 553.6St
ress
(MPa
)
0 0.1 0.20
100
200
300
400
500
600
700
YSP = 380.8 Smax = 548.6
Strain (mm/mm)0 0.1 0.2
0
100
200
300
400
500
600
700
YSP = 371 Smax = 547.5
0 0.50
100
200
300
400
500
600
700
Stre
ss (M
Pa)
0 0.50
100
200
300
400
500
600
700
rr50b YSP = 378 offset=0.002 Smax = 550 spty SD=6.1 Smax SD=3
Strain (mm/mm)0 0.5
0
100
200
300
400
500
600
700
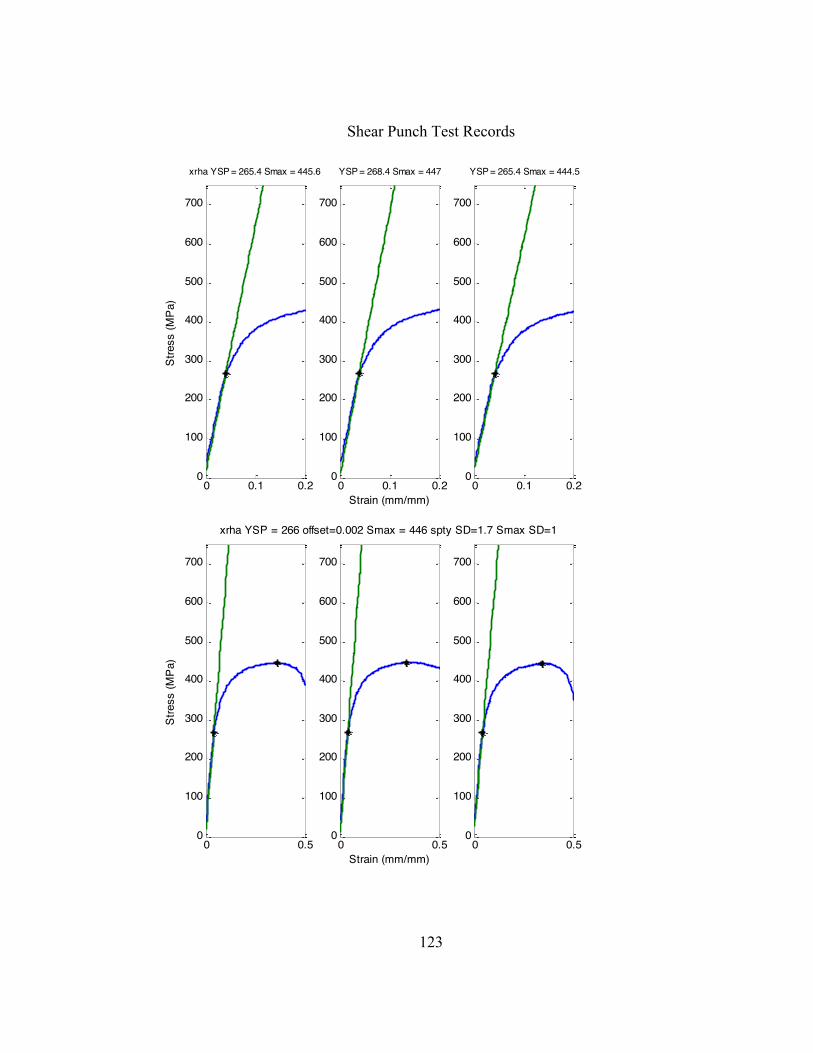
Shear Punch Test Records
123
0 0.1 0.20
100
200
300
400
500
600
700
xrha YSP = 265.4 Smax = 445.6St
ress
(MPa
)
0 0.1 0.20
100
200
300
400
500
600
700
YSP = 268.4 Smax = 447
Strain (mm/mm)0 0.1 0.2
0
100
200
300
400
500
600
700
YSP = 265.4 Smax = 444.5
0 0.50
100
200
300
400
500
600
700
Stre
ss (M
Pa)
0 0.50
100
200
300
400
500
600
700
xrha YSP = 266 offset=0.002 Smax = 446 spty SD=1.7 Smax SD=1
Strain (mm/mm)0 0.5
0
100
200
300
400
500
600
700

Shear Punch Test Records
124
0 0.1 0.20
100
200
300
400
500
600
700
xrhb YSP = 270.5 Smax = 459.9St
ress
(MPa
)
0 0.1 0.20
100
200
300
400
500
600
700
YSP = 273.8 Smax = 459.5
Strain (mm/mm)0 0.1 0.2
0
100
200
300
400
500
600
700
YSP = 286.6 Smax = 463.8
0 0.50
100
200
300
400
500
600
700
Stre
ss (M
Pa)
0 0.50
100
200
300
400
500
600
700
xrhb YSP = 277 offset=0.002 Smax = 461 spty SD=8.5 Smax SD=2
Strain (mm/mm)0 0.5
0
100
200
300
400
500
600
700
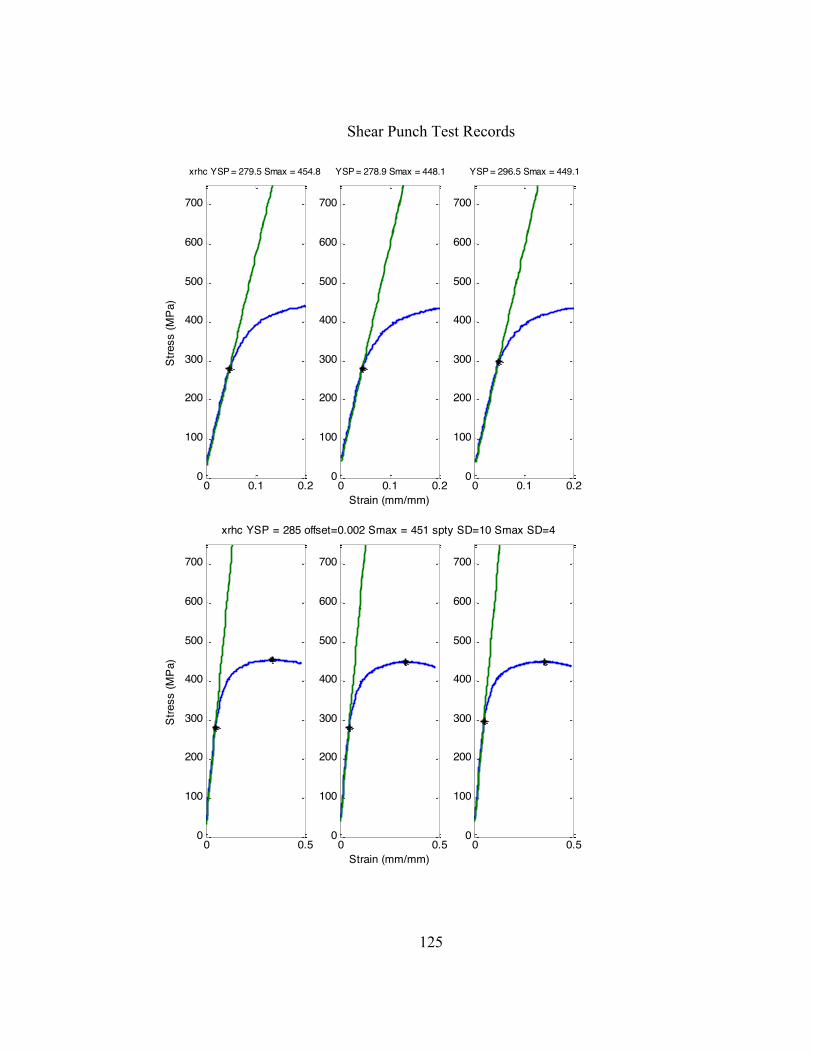
Shear Punch Test Records
125
0 0.1 0.20
100
200
300
400
500
600
700
xrhc YSP = 279.5 Smax = 454.8St
ress
(MPa
)
0 0.1 0.20
100
200
300
400
500
600
700
YSP = 278.9 Smax = 448.1
Strain (mm/mm)0 0.1 0.2
0
100
200
300
400
500
600
700
YSP = 296.5 Smax = 449.1
0 0.50
100
200
300
400
500
600
700
Stre
ss (M
Pa)
0 0.50
100
200
300
400
500
600
700
xrhc YSP = 285 offset=0.002 Smax = 451 spty SD=10 Smax SD=4
Strain (mm/mm)0 0.5
0
100
200
300
400
500
600
700

Shear Punch Test Records
126
0 0.1 0.20
100
200
300
400
500
600
700
xrhdb YSP = 217.3 Smax = 352.5St
ress
(MPa
)
0 0.1 0.20
100
200
300
400
500
600
700
YSP = 216.7 Smax = 344.2
Strain (mm/mm)0 0.1 0.2
0
100
200
300
400
500
600
700
YSP = 209.4 Smax = 341.5
0 0.50
100
200
300
400
500
600
700
Stre
ss (M
Pa)
0 0.50
100
200
300
400
500
600
700
xrhdb YSP = 214 offset=0.002 Smax = 346 spty SD=4.4 Smax SD=6
Strain (mm/mm)0 0.5
0
100
200
300
400
500
600
700
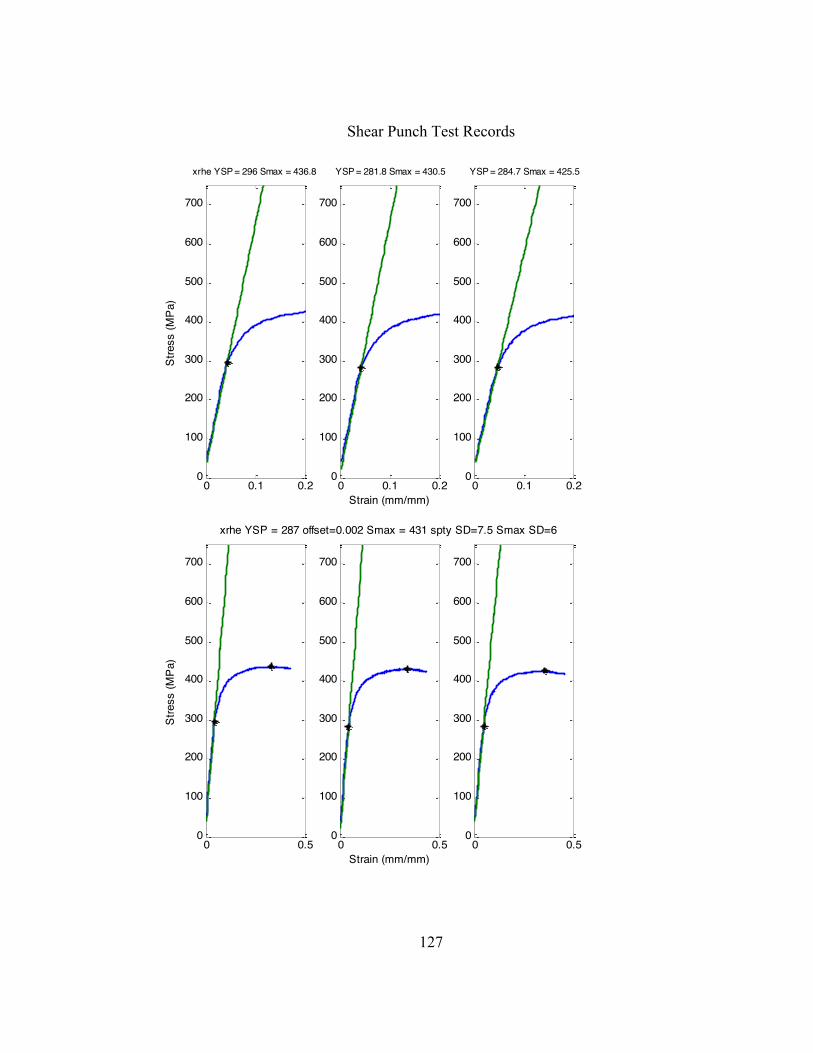
Shear Punch Test Records
127
0 0.1 0.20
100
200
300
400
500
600
700
xrhe YSP = 296 Smax = 436.8St
ress
(MPa
)
0 0.1 0.20
100
200
300
400
500
600
700
YSP = 281.8 Smax = 430.5
Strain (mm/mm)0 0.1 0.2
0
100
200
300
400
500
600
700
YSP = 284.7 Smax = 425.5
0 0.50
100
200
300
400
500
600
700
Stre
ss (M
Pa)
0 0.50
100
200
300
400
500
600
700
xrhe YSP = 287 offset=0.002 Smax = 431 spty SD=7.5 Smax SD=6
Strain (mm/mm)0 0.5
0
100
200
300
400
500
600
700

Shear Punch Test Records
128
0 0.1 0.20
100
200
300
400
500
600
700
xrhfb YSP = 210.7 Smax = 356.5St
ress
(MPa
)
0 0.1 0.20
100
200
300
400
500
600
700
YSP = 237.5 Smax = 355.8
Strain (mm/mm)0 0.1 0.2
0
100
200
300
400
500
600
700
YSP = 230.7 Smax = 348.6
0 0.50
100
200
300
400
500
600
700
Stre
ss (M
Pa)
0 0.50
100
200
300
400
500
600
700
xrhfb YSP = 226 offset=0.002 Smax = 354 spty SD=14 Smax SD=4
Strain (mm/mm)0 0.5
0
100
200
300
400
500
600
700

Tensile Test Records
129
0 0.1 0.20
100
200
300
400
500
600
700
800
900
1000RR01 ys = 352.7 UTS = 512.5
Stre
ss (M
Pa)
0 0.1 0.20
100
200
300
400
500
600
700
800
900
1000 ys = 353.3 UTS = 506.8
Strain (mm/mm)0 0.1 0.2
0
100
200
300
400
500
600
700
800
900
1000 ys = 340.2 UTS = 506.4
0 0.05 0.10
100
200
300
400
500
600
700
800
900
1000RR01 yflow avg = 479.8
True
Stre
ss (M
Pa)
0 0.05 0.10
100
200
300
400
500
600
700
800
900
1000 yflow avg = 473.2
True Plastic Strain (mm/mm)0 0.05 0.1
0
100
200
300
400
500
600
700
800
900
1000 yflow avg = 471.6

Tensile Test Records
130
0 0.1 0.20
100
200
300
400
500
600
700
800
900
1000RR02 ys = 267.4 UTS = 413.1
Stre
ss (M
Pa)
0 0.1 0.20
100
200
300
400
500
600
700
800
900
1000 ys = 273.3 UTS = 416.7
Strain (mm/mm)0 0.1 0.2
0
100
200
300
400
500
600
700
800
900
1000 ys = 273.7 UTS = 416.5
0 0.05 0.10
100
200
300
400
500
600
700
800
900
1000RR02 yflow avg = 365.7
True
Stre
ss (M
Pa)
0 0.05 0.10
100
200
300
400
500
600
700
800
900
1000 yflow avg = 370.6
True Plastic Strain (mm/mm)0 0.05 0.1
0
100
200
300
400
500
600
700
800
900
1000 yflow avg = 368.1

Tensile Test Records
131
0 0.1 0.20
100
200
300
400
500
600
700
800
900
1000RR03 ys = 232.9 UTS = 360.3
Stre
ss (M
Pa)
0 0.1 0.20
100
200
300
400
500
600
700
800
900
1000 ys = 236.4 UTS = 361.7
Strain (mm/mm)0 0.1 0.2
0
100
200
300
400
500
600
700
800
900
1000 ys = 235.2 UTS = 361.5
0 0.05 0.10
100
200
300
400
500
600
700
800
900
1000RR03 yflow avg = 305.5
True
Stre
ss (M
Pa)
0 0.05 0.10
100
200
300
400
500
600
700
800
900
1000 yflow avg = 311.3
True Plastic Strain (mm/mm)0 0.05 0.1
0
100
200
300
400
500
600
700
800
900
1000 yflow avg = 309.7

Tensile Test Records
132
0 0.1 0.20
100
200
300
400
500
600
700
800
900
1000RR04 ys = 339.9 UTS = 506.6
Stre
ss (M
Pa)
0 0.1 0.20
100
200
300
400
500
600
700
800
900
1000 ys = 336.4 UTS = 511.7
Strain (mm/mm)0 0.1 0.2
0
100
200
300
400
500
600
700
800
900
1000 ys = 340.1 UTS = 504.9
0 0.05 0.10
100
200
300
400
500
600
700
800
900
1000RR04 yflow avg = 467.7
True
Stre
ss (M
Pa)
0 0.05 0.10
100
200
300
400
500
600
700
800
900
1000 yflow avg = 473.6
True Plastic Strain (mm/mm)0 0.05 0.1
0
100
200
300
400
500
600
700
800
900
1000 yflow avg = 468.4
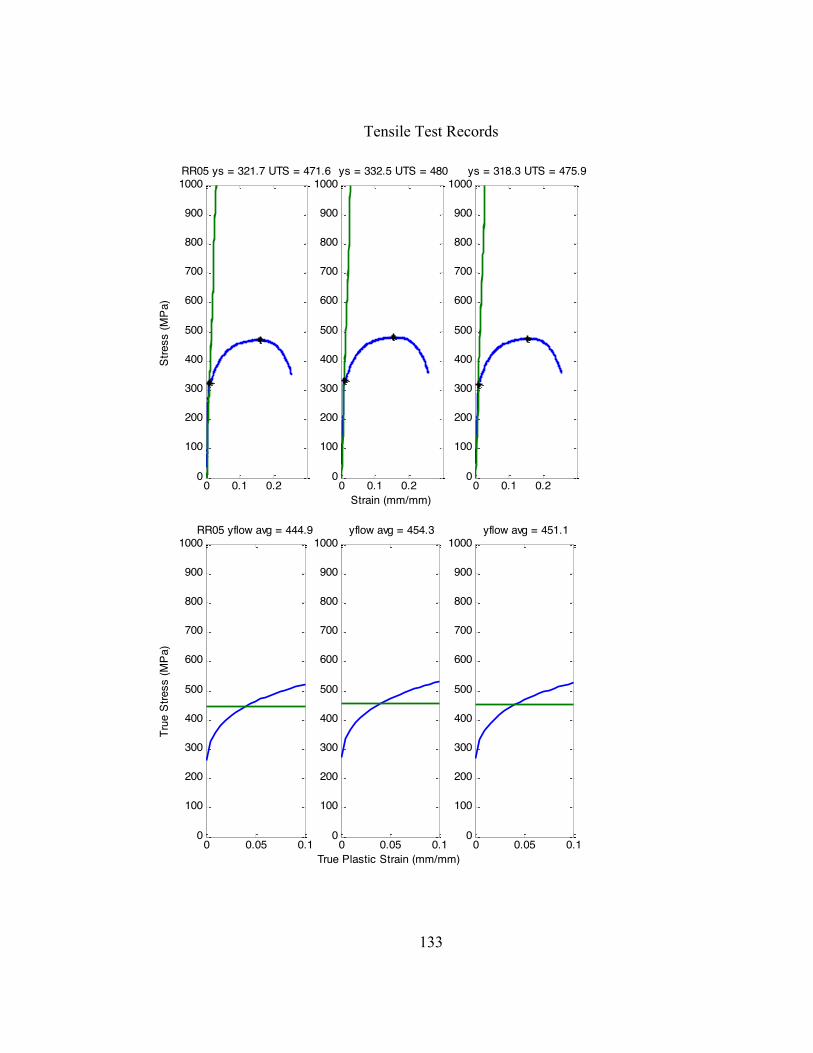
Tensile Test Records
133
0 0.1 0.20
100
200
300
400
500
600
700
800
900
1000RR05 ys = 321.7 UTS = 471.6
Stre
ss (M
Pa)
0 0.1 0.20
100
200
300
400
500
600
700
800
900
1000 ys = 332.5 UTS = 480
Strain (mm/mm)0 0.1 0.2
0
100
200
300
400
500
600
700
800
900
1000 ys = 318.3 UTS = 475.9
0 0.05 0.10
100
200
300
400
500
600
700
800
900
1000RR05 yflow avg = 444.9
True
Stre
ss (M
Pa)
0 0.05 0.10
100
200
300
400
500
600
700
800
900
1000 yflow avg = 454.3
True Plastic Strain (mm/mm)0 0.05 0.1
0
100
200
300
400
500
600
700
800
900
1000 yflow avg = 451.1

Tensile Test Records
134
0 0.1 0.20
100
200
300
400
500
600
700
800
900
1000RR06 ys = 377.6 UTS = 536.6
Stre
ss (M
Pa)
0 0.1 0.20
100
200
300
400
500
600
700
800
900
1000 ys = 387.4 UTS = 540.2
Strain (mm/mm)0 0.1 0.2
0
100
200
300
400
500
600
700
800
900
1000 ys = 392.5 UTS = 543.3
0 0.05 0.10
100
200
300
400
500
600
700
800
900
1000RR06 yflow avg = 520.9
True
Stre
ss (M
Pa)
0 0.05 0.10
100
200
300
400
500
600
700
800
900
1000 yflow avg = 521.9
True Plastic Strain (mm/mm)0 0.05 0.1
0
100
200
300
400
500
600
700
800
900
1000 yflow avg = 527.1

Tensile Test Records
135
0 0.1 0.20
100
200
300
400
500
600
700
800
900
1000RR07 ys = 424.3 UTS = 577.8
Stre
ss (M
Pa)
0 0.1 0.20
100
200
300
400
500
600
700
800
900
1000 ys = 411.7 UTS = 567.2
Strain (mm/mm)0 0.1 0.2
0
100
200
300
400
500
600
700
800
900
1000 ys = 414.6 UTS = 577.1
0 0.05 0.10
100
200
300
400
500
600
700
800
900
1000RR07 yflow avg = 567.4
True
Stre
ss (M
Pa)
0 0.05 0.10
100
200
300
400
500
600
700
800
900
1000 yflow avg = 558.1
True Plastic Strain (mm/mm)0 0.05 0.1
0
100
200
300
400
500
600
700
800
900
1000 yflow avg = 568.4

Tensile Test Records
136
0 0.1 0.20
100
200
300
400
500
600
700
800
900
1000RR08 ys = 308.2 UTS = 491
Stre
ss (M
Pa)
0 0.1 0.20
100
200
300
400
500
600
700
800
900
1000 ys = 339.3 UTS = 501.9
Strain (mm/mm)0 0.1 0.2
0
100
200
300
400
500
600
700
800
900
1000 ys = 328.9 UTS = 493.7
0 0.05 0.10
100
200
300
400
500
600
700
800
900
1000RR08 yflow avg = 448.6
True
Stre
ss (M
Pa)
0 0.05 0.10
100
200
300
400
500
600
700
800
900
1000 yflow avg = 453.2
True Plastic Strain (mm/mm)0 0.05 0.1
0
100
200
300
400
500
600
700
800
900
1000 yflow avg = 446.8

Tensile Test Records
137
0 0.1 0.20
100
200
300
400
500
600
700
800
900
1000RR09 ys = 393.3 UTS = 550
Stre
ss (M
Pa)
0 0.1 0.20
100
200
300
400
500
600
700
800
900
1000 ys = 391.3 UTS = 550.7
Strain (mm/mm)0 0.1 0.2
0
100
200
300
400
500
600
700
800
900
1000 ys = 388.2 UTS = 553.7
0 0.05 0.10
100
200
300
400
500
600
700
800
900
1000RR09 yflow avg = 523.9
True
Stre
ss (M
Pa)
0 0.05 0.10
100
200
300
400
500
600
700
800
900
1000 yflow avg = 522.4
True Plastic Strain (mm/mm)0 0.05 0.1
0
100
200
300
400
500
600
700
800
900
1000 yflow avg = 527.3

Tensile Test Records
138
0 0.1 0.20
100
200
300
400
500
600
700
800
900
1000RR10 ys = 757.3 UTS = 879.9
Stre
ss (M
Pa)
0 0.1 0.20
100
200
300
400
500
600
700
800
900
1000 ys = 765.3 UTS = 895.4
Strain (mm/mm)0 0.1 0.2
0
100
200
300
400
500
600
700
800
900
1000 ys = 782.5 UTS = 895.8
0 0.05 0.10
100
200
300
400
500
600
700
800
900
1000RR10 yflow avg = 907.1
True
Stre
ss (M
Pa)
0 0.05 0.10
100
200
300
400
500
600
700
800
900
1000 yflow avg = 919.2
True Plastic Strain (mm/mm)0 0.05 0.1
0
100
200
300
400
500
600
700
800
900
1000 yflow avg = 920.2

Tensile Test Records
139
0 0.1 0.20
100
200
300
400
500
600
700
800
900
1000RR11 ys = 638.8 UTS = 757.3
Stre
ss (M
Pa)
0 0.1 0.20
100
200
300
400
500
600
700
800
900
1000 ys = 634.4 UTS = 751.1
Strain (mm/mm)0 0.1 0.2
0
100
200
300
400
500
600
700
800
900
1000 ys = 622.3 UTS = 744.2
0 0.05 0.10
100
200
300
400
500
600
700
800
900
1000RR11 yflow avg = 771.8
True
Stre
ss (M
Pa)
0 0.05 0.10
100
200
300
400
500
600
700
800
900
1000 yflow avg = 765.5
True Plastic Strain (mm/mm)0 0.05 0.1
0
100
200
300
400
500
600
700
800
900
1000 yflow avg = 764

Tensile Test Records
140
0 0.1 0.20
100
200
300
400
500
600
700
800
900
1000RR12 ys = 510.8 UTS = 646.2
Stre
ss (M
Pa)
0 0.1 0.20
100
200
300
400
500
600
700
800
900
1000 ys = 499.5 UTS = 642.6
Strain (mm/mm)0 0.1 0.2
0
100
200
300
400
500
600
700
800
900
1000 ys = 511.2 UTS = 646.8
0 0.05 0.10
100
200
300
400
500
600
700
800
900
1000RR12 yflow avg = 653.5
True
Stre
ss (M
Pa)
0 0.05 0.10
100
200
300
400
500
600
700
800
900
1000 yflow avg = 651.4
True Plastic Strain (mm/mm)0 0.05 0.1
0
100
200
300
400
500
600
700
800
900
1000 yflow avg = 656.1

Tensile Test Records
141
0 0.1 0.20
100
200
300
400
500
600
700
800
900
1000RR13 ys = 703 UTS = 874.3
Stre
ss (M
Pa)
0 0.1 0.20
100
200
300
400
500
600
700
800
900
1000 ys = 676.8 UTS = 874.4
Strain (mm/mm)0 0.1 0.2
0
100
200
300
400
500
600
700
800
900
1000 ys = 662.4 UTS = 877.9
0 0.05 0.10
100
200
300
400
500
600
700
800
900
1000RR13 yflow avg = 894.3
True
Stre
ss (M
Pa)
0 0.05 0.10
100
200
300
400
500
600
700
800
900
1000 yflow avg = 892.1
True Plastic Strain (mm/mm)0 0.05 0.1
0
100
200
300
400
500
600
700
800
900
1000 yflow avg = 896.3

Tensile Test Records
142
0 0.1 0.20
100
200
300
400
500
600
700
800
900
1000RR14 ys = 617 UTS = 788.5
Stre
ss (M
Pa)
0 0.1 0.20
100
200
300
400
500
600
700
800
900
1000 ys = 626.6 UTS = 782.2
Strain (mm/mm)0 0.1 0.2
0
100
200
300
400
500
600
700
800
900
1000 ys = 586.5 UTS = 781.9
0 0.05 0.10
100
200
300
400
500
600
700
800
900
1000RR14 yflow avg = 801.4
True
Stre
ss (M
Pa)
0 0.05 0.10
100
200
300
400
500
600
700
800
900
1000 yflow avg = 797.7
True Plastic Strain (mm/mm)0 0.05 0.1
0
100
200
300
400
500
600
700
800
900
1000 yflow avg = 795.2
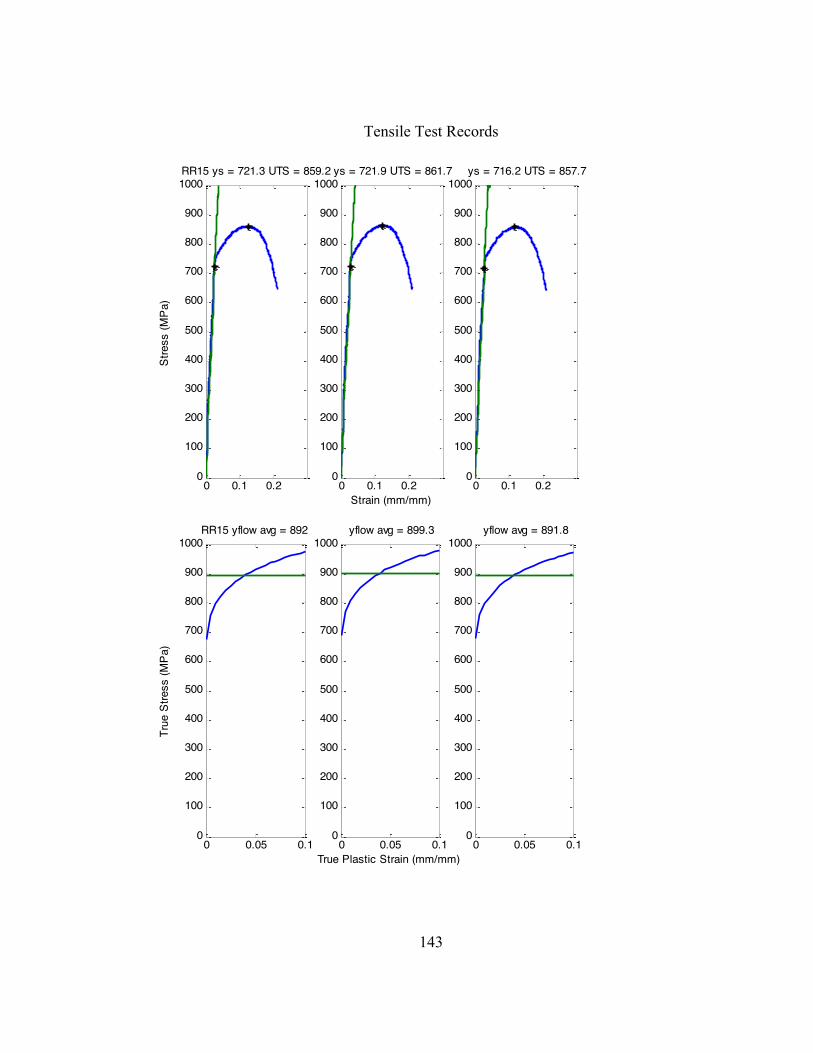
Tensile Test Records
143
0 0.1 0.20
100
200
300
400
500
600
700
800
900
1000RR15 ys = 721.3 UTS = 859.2
Stre
ss (M
Pa)
0 0.1 0.20
100
200
300
400
500
600
700
800
900
1000 ys = 721.9 UTS = 861.7
Strain (mm/mm)0 0.1 0.2
0
100
200
300
400
500
600
700
800
900
1000 ys = 716.2 UTS = 857.7
0 0.05 0.10
100
200
300
400
500
600
700
800
900
1000RR15 yflow avg = 892
True
Stre
ss (M
Pa)
0 0.05 0.10
100
200
300
400
500
600
700
800
900
1000 yflow avg = 899.3
True Plastic Strain (mm/mm)0 0.05 0.1
0
100
200
300
400
500
600
700
800
900
1000 yflow avg = 891.8
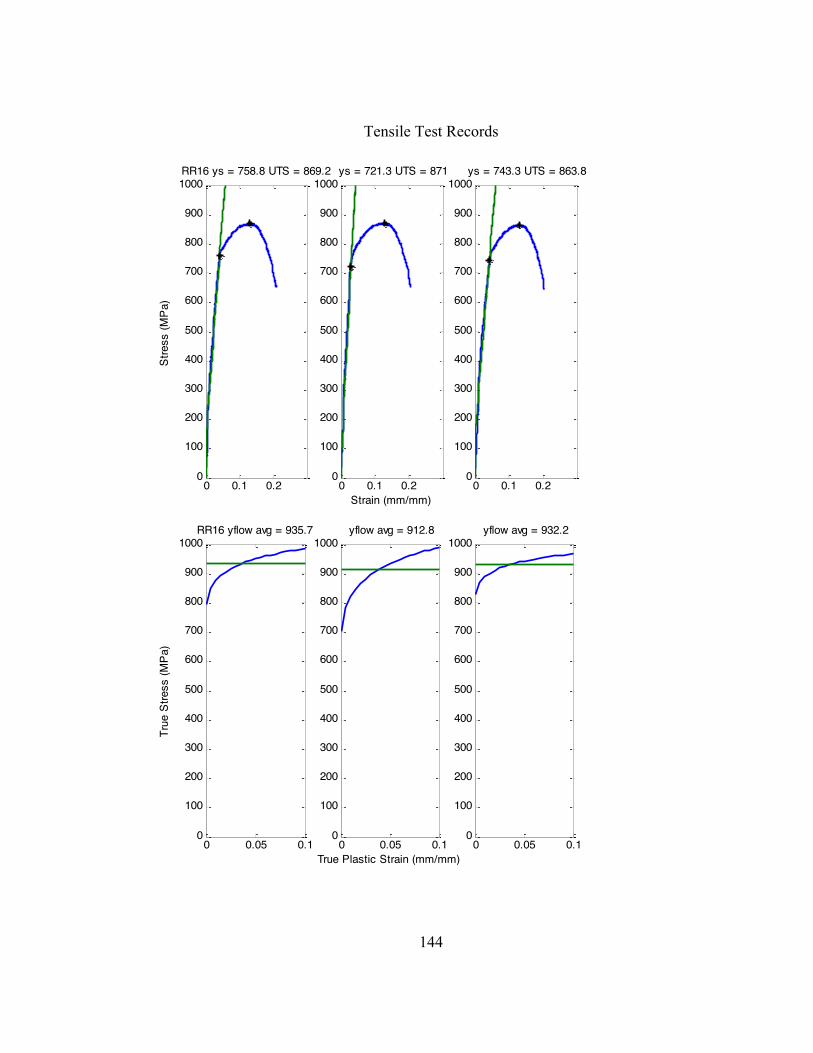
Tensile Test Records
144
0 0.1 0.20
100
200
300
400
500
600
700
800
900
1000RR16 ys = 758.8 UTS = 869.2
Stre
ss (M
Pa)
0 0.1 0.20
100
200
300
400
500
600
700
800
900
1000 ys = 721.3 UTS = 871
Strain (mm/mm)0 0.1 0.2
0
100
200
300
400
500
600
700
800
900
1000 ys = 743.3 UTS = 863.8
0 0.05 0.10
100
200
300
400
500
600
700
800
900
1000RR16 yflow avg = 935.7
True
Stre
ss (M
Pa)
0 0.05 0.10
100
200
300
400
500
600
700
800
900
1000 yflow avg = 912.8
True Plastic Strain (mm/mm)0 0.05 0.1
0
100
200
300
400
500
600
700
800
900
1000 yflow avg = 932.2
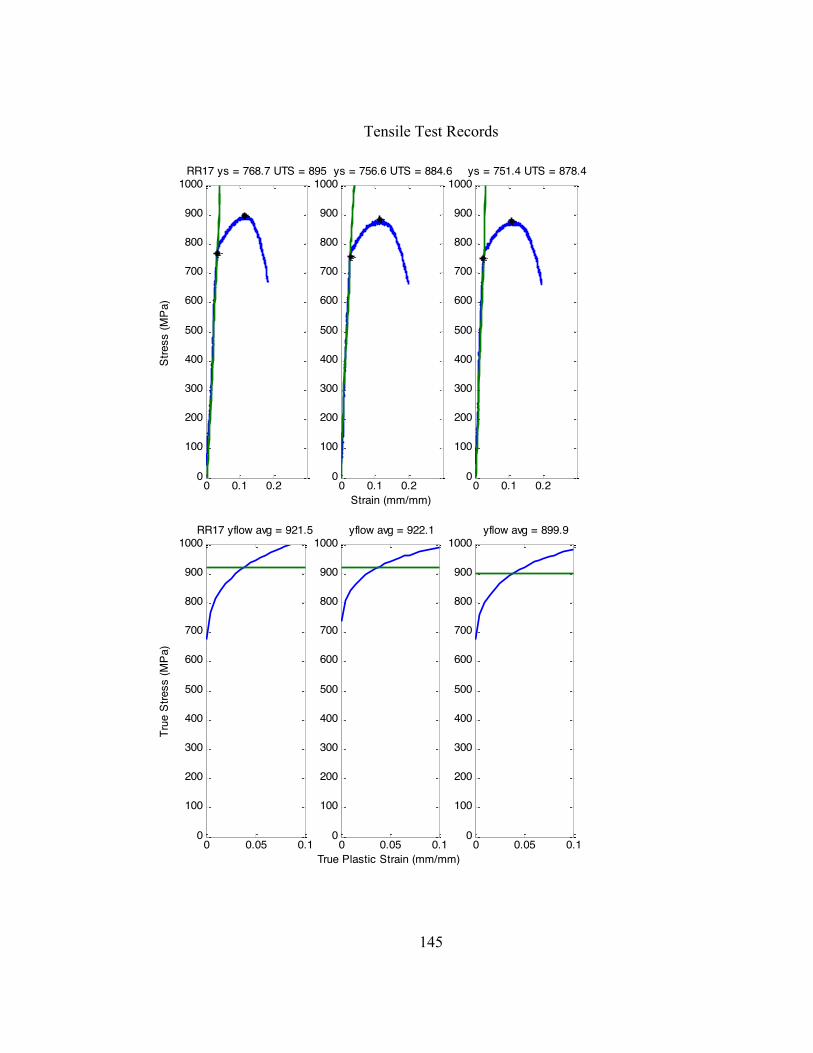
Tensile Test Records
145
0 0.1 0.20
100
200
300
400
500
600
700
800
900
1000RR17 ys = 768.7 UTS = 895
Stre
ss (M
Pa)
0 0.1 0.20
100
200
300
400
500
600
700
800
900
1000 ys = 756.6 UTS = 884.6
Strain (mm/mm)0 0.1 0.2
0
100
200
300
400
500
600
700
800
900
1000 ys = 751.4 UTS = 878.4
0 0.05 0.10
100
200
300
400
500
600
700
800
900
1000RR17 yflow avg = 921.5
True
Stre
ss (M
Pa)
0 0.05 0.10
100
200
300
400
500
600
700
800
900
1000 yflow avg = 922.1
True Plastic Strain (mm/mm)0 0.05 0.1
0
100
200
300
400
500
600
700
800
900
1000 yflow avg = 899.9

Tensile Test Records
146
0 0.1 0.20
100
200
300
400
500
600
700
800
900
1000RR18 ys = 797.3 UTS = 893.5
Stre
ss (M
Pa)
0 0.1 0.20
100
200
300
400
500
600
700
800
900
1000 ys = 774.4 UTS = 897
Strain (mm/mm)0 0.1 0.2
0
100
200
300
400
500
600
700
800
900
1000 ys = 775.6 UTS = 895.4
0 0.05 0.10
100
200
300
400
500
600
700
800
900
1000RR18 yflow avg = 936.7
True
Stre
ss (M
Pa)
0 0.05 0.10
100
200
300
400
500
600
700
800
900
1000 yflow avg = 939.3
True Plastic Strain (mm/mm)0 0.05 0.1
0
100
200
300
400
500
600
700
800
900
1000 yflow avg = 934

Tensile Test Records
147
0 0.1 0.20
100
200
300
400
500
600
700
800
900
1000RR19 ys = 519 UTS = 643
Stre
ss (M
Pa)
0 0.1 0.20
100
200
300
400
500
600
700
800
900
1000 ys = 517.6 UTS = 642.7
Strain (mm/mm)0 0.1 0.2
0
100
200
300
400
500
600
700
800
900
1000 ys = 517.3 UTS = 642.5
0 0.05 0.10
100
200
300
400
500
600
700
800
900
1000RR19 yflow avg = 676.9
True
Stre
ss (M
Pa)
0 0.05 0.10
100
200
300
400
500
600
700
800
900
1000 yflow avg = 676.3
True Plastic Strain (mm/mm)0 0.05 0.1
0
100
200
300
400
500
600
700
800
900
1000 yflow avg = 675.7

Tensile Test Records
148
0 0.1 0.20
100
200
300
400
500
600
700
800
900
1000RR20 ys = 386.5 UTS = 481.7
Stre
ss (M
Pa)
0 0.1 0.20
100
200
300
400
500
600
700
800
900
1000 ys = 391.5 UTS = 484.6
Strain (mm/mm)0 0.1 0.2
0
100
200
300
400
500
600
700
800
900
1000 ys = 390.3 UTS = 482.6
0 0.05 0.10
100
200
300
400
500
600
700
800
900
1000RR20 yflow avg = 507
True
Stre
ss (M
Pa)
0 0.05 0.10
100
200
300
400
500
600
700
800
900
1000 yflow avg = 510.5
True Plastic Strain (mm/mm)0 0.05 0.1
0
100
200
300
400
500
600
700
800
900
1000 yflow avg = 509.7

Tensile Test Records
149
0 0.1 0.20
100
200
300
400
500
600
700
800
900
1000RR21 ys = 457.2 UTS = 596.8
Stre
ss (M
Pa)
0 0.1 0.20
100
200
300
400
500
600
700
800
900
1000 ys = 463.8 UTS = 598.6
Strain (mm/mm)0 0.1 0.2
0
100
200
300
400
500
600
700
800
900
1000 ys = 462.5 UTS = 603.1
0 0.05 0.10
100
200
300
400
500
600
700
800
900
1000RR21 yflow avg = 595
True
Stre
ss (M
Pa)
0 0.05 0.10
100
200
300
400
500
600
700
800
900
1000 yflow avg = 601.8
True Plastic Strain (mm/mm)0 0.05 0.1
0
100
200
300
400
500
600
700
800
900
1000 yflow avg = 603.9

Tensile Test Records
150
0 0.1 0.20
100
200
300
400
500
600
700
800
900
1000RR22 ys = 591.1 UTS = 761
Stre
ss (M
Pa)
0 0.1 0.20
100
200
300
400
500
600
700
800
900
1000 ys = 585.6 UTS = 753.5
Strain (mm/mm)0 0.1 0.2
0
100
200
300
400
500
600
700
800
900
1000 ys = 567.5 UTS = 757.1
0 0.05 0.10
100
200
300
400
500
600
700
800
900
1000RR22 yflow avg = 779.5
True
Stre
ss (M
Pa)
0 0.05 0.10
100
200
300
400
500
600
700
800
900
1000 yflow avg = 766.3
True Plastic Strain (mm/mm)0 0.05 0.1
0
100
200
300
400
500
600
700
800
900
1000 yflow avg = 767.4

Tensile Test Records
151
0 0.1 0.20
100
200
300
400
500
600
700
800
900
1000RR23 ys = 433.9 UTS = 579.8
Stre
ss (M
Pa)
0 0.1 0.20
100
200
300
400
500
600
700
800
900
1000 ys = 432.2 UTS = 553
Strain (mm/mm)0 0.1 0.2
0
100
200
300
400
500
600
700
800
900
1000 ys = 445.4 UTS = 553
0 0.05 0.10
100
200
300
400
500
600
700
800
900
1000RR23 yflow avg = 550.1
True
Stre
ss (M
Pa)
0 0.05 0.10
100
200
300
400
500
600
700
800
900
1000 yflow avg = 553
True Plastic Strain (mm/mm)0 0.05 0.1
0
100
200
300
400
500
600
700
800
900
1000 yflow avg = 556.2

Tensile Test Records
152
0 0.1 0.20
100
200
300
400
500
600
700
800
900
1000RR24 ys = 632.5 UTS = 831.5
Stre
ss (M
Pa)
0 0.1 0.20
100
200
300
400
500
600
700
800
900
1000 ys = 650.6 UTS = 843.2
Strain (mm/mm)0 0.1 0.2
0
100
200
300
400
500
600
700
800
900
1000 ys = 652.5 UTS = 845.9
0 0.05 0.10
100
200
300
400
500
600
700
800
900
1000RR24 yflow avg = 853.6
True
Stre
ss (M
Pa)
0 0.05 0.10
100
200
300
400
500
600
700
800
900
1000 yflow avg = 864.2
True Plastic Strain (mm/mm)0 0.05 0.1
0
100
200
300
400
500
600
700
800
900
1000 yflow avg = 865.8

Tensile Test Records
153
0 0.1 0.20
100
200
300
400
500
600
700
800
900
1000RR25 ys = 463.6 UTS = 620.4
Stre
ss (M
Pa)
0 0.1 0.20
100
200
300
400
500
600
700
800
900
1000 ys = 462.1 UTS = 622.9
Strain (mm/mm)0 0.1 0.2
0
100
200
300
400
500
600
700
800
900
1000 ys = 458.6 UTS = 624.4
0 0.05 0.10
100
200
300
400
500
600
700
800
900
1000RR25 yflow avg = 623.8
True
Stre
ss (M
Pa)
0 0.05 0.10
100
200
300
400
500
600
700
800
900
1000 yflow avg = 622.9
True Plastic Strain (mm/mm)0 0.05 0.1
0
100
200
300
400
500
600
700
800
900
1000 yflow avg = 625

Tensile Test Records
154
0 0.1 0.20
100
200
300
400
500
600
700
800
900
1000RR26 ys = 629.2 UTS = 785
Stre
ss (M
Pa)
0 0.1 0.20
100
200
300
400
500
600
700
800
900
1000 ys = 627.2 UTS = 784.4
Strain (mm/mm)0 0.1 0.2
0
100
200
300
400
500
600
700
800
900
1000 ys = 579.4 UTS = 724.9
0 0.05 0.10
100
200
300
400
500
600
700
800
900
1000RR26 yflow avg = 802.9
True
Stre
ss (M
Pa)
0 0.05 0.10
100
200
300
400
500
600
700
800
900
1000 yflow avg = 803.1
True Plastic Strain (mm/mm)0 0.05 0.1
0
100
200
300
400
500
600
700
800
900
1000 yflow avg = 739.5

Tensile Test Records
155
0 0.1 0.20
100
200
300
400
500
600
700
800
900
1000RR27 ys = 457.5 UTS = 560.8
Stre
ss (M
Pa)
0 0.1 0.20
100
200
300
400
500
600
700
800
900
1000 ys = 459.4 UTS = 563.5
Strain (mm/mm)0 0.1 0.2
0
100
200
300
400
500
600
700
800
900
1000 ys = 453.6 UTS = 559.9
0 0.05 0.10
100
200
300
400
500
600
700
800
900
1000RR27 yflow avg = 568.9
True
Stre
ss (M
Pa)
0 0.05 0.10
100
200
300
400
500
600
700
800
900
1000 yflow avg = 572.1
True Plastic Strain (mm/mm)0 0.05 0.1
0
100
200
300
400
500
600
700
800
900
1000 yflow avg = 569.5

Tensile Test Records
156
0 0.1 0.20
100
200
300
400
500
600
700
800
900
1000RR28 ys = 584.6 UTS = 775
Stre
ss (M
Pa)
0 0.1 0.20
100
200
300
400
500
600
700
800
900
1000 ys = 584.7 UTS = 777
Strain (mm/mm)0 0.1 0.2
0
100
200
300
400
500
600
700
800
900
1000 ys = 561 UTS = 769.7
0 0.05 0.10
100
200
300
400
500
600
700
800
900
1000RR28 yflow avg = 787.1
True
Stre
ss (M
Pa)
0 0.05 0.10
100
200
300
400
500
600
700
800
900
1000 yflow avg = 790.2
True Plastic Strain (mm/mm)0 0.05 0.1
0
100
200
300
400
500
600
700
800
900
1000 yflow avg = 783.9

Tensile Test Records
157
0 0.1 0.20
100
200
300
400
500
600
700
800
900
1000RR29 ys = 495.1 UTS = 625
Stre
ss (M
Pa)
0 0.1 0.20
100
200
300
400
500
600
700
800
900
1000 ys = 486.9 UTS = 623.5
Strain (mm/mm)0 0.1 0.2
0
100
200
300
400
500
600
700
800
900
1000 ys = 486.1 UTS = 630.1
0 0.05 0.10
100
200
300
400
500
600
700
800
900
1000RR29 yflow avg = 633.5
True
Stre
ss (M
Pa)
0 0.05 0.10
100
200
300
400
500
600
700
800
900
1000 yflow avg = 632.8
True Plastic Strain (mm/mm)0 0.05 0.1
0
100
200
300
400
500
600
700
800
900
1000 yflow avg = 639.3
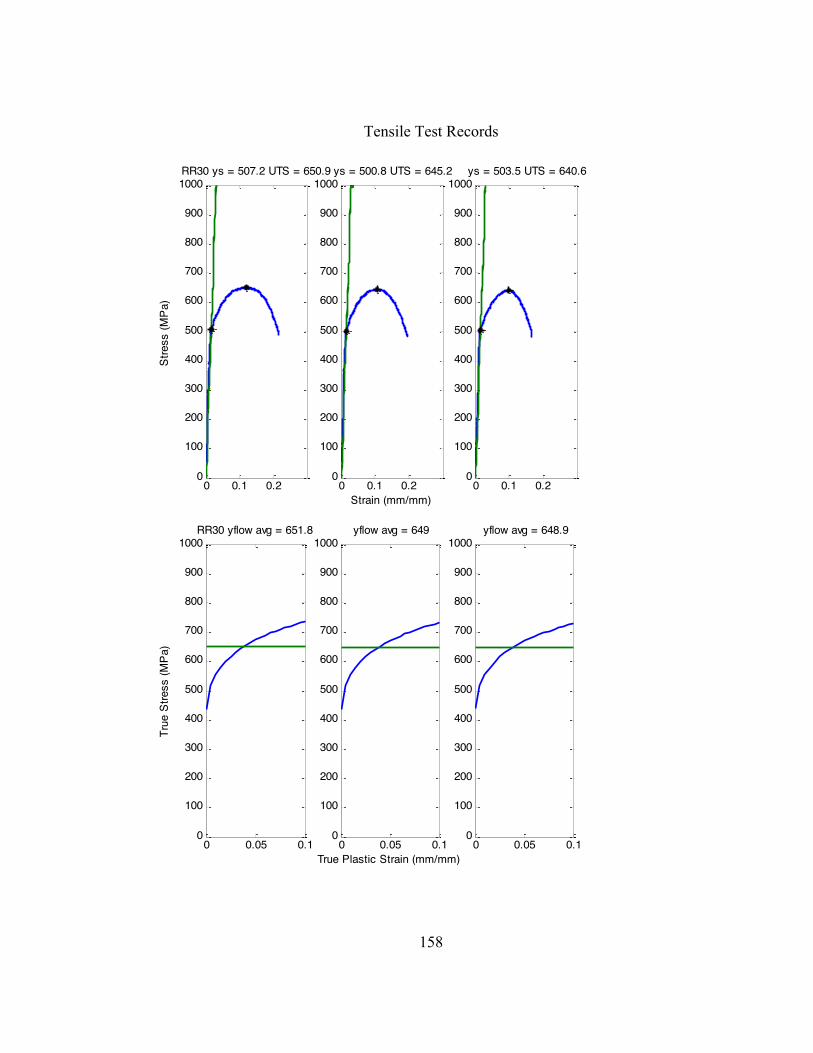
Tensile Test Records
158
0 0.1 0.20
100
200
300
400
500
600
700
800
900
1000RR30 ys = 507.2 UTS = 650.9
Stre
ss (M
Pa)
0 0.1 0.20
100
200
300
400
500
600
700
800
900
1000 ys = 500.8 UTS = 645.2
Strain (mm/mm)0 0.1 0.2
0
100
200
300
400
500
600
700
800
900
1000 ys = 503.5 UTS = 640.6
0 0.05 0.10
100
200
300
400
500
600
700
800
900
1000RR30 yflow avg = 651.8
True
Stre
ss (M
Pa)
0 0.05 0.10
100
200
300
400
500
600
700
800
900
1000 yflow avg = 649
True Plastic Strain (mm/mm)0 0.05 0.1
0
100
200
300
400
500
600
700
800
900
1000 yflow avg = 648.9

Tensile Test Records
159
0 0.1 0.20
100
200
300
400
500
600
700
800
900
1000RR31 ys = 645.6 UTS = 783.1
Stre
ss (M
Pa)
0 0.1 0.20
100
200
300
400
500
600
700
800
900
1000 ys = 635.4 UTS = 779.5
Strain (mm/mm)0 0.1 0.2
0
100
200
300
400
500
600
700
800
900
1000 ys = 646 UTS = 785
0 0.05 0.10
100
200
300
400
500
600
700
800
900
1000RR31 yflow avg = 801
True
Stre
ss (M
Pa)
0 0.05 0.10
100
200
300
400
500
600
700
800
900
1000 yflow avg = 791.5
True Plastic Strain (mm/mm)0 0.05 0.1
0
100
200
300
400
500
600
700
800
900
1000 yflow avg = 799.9
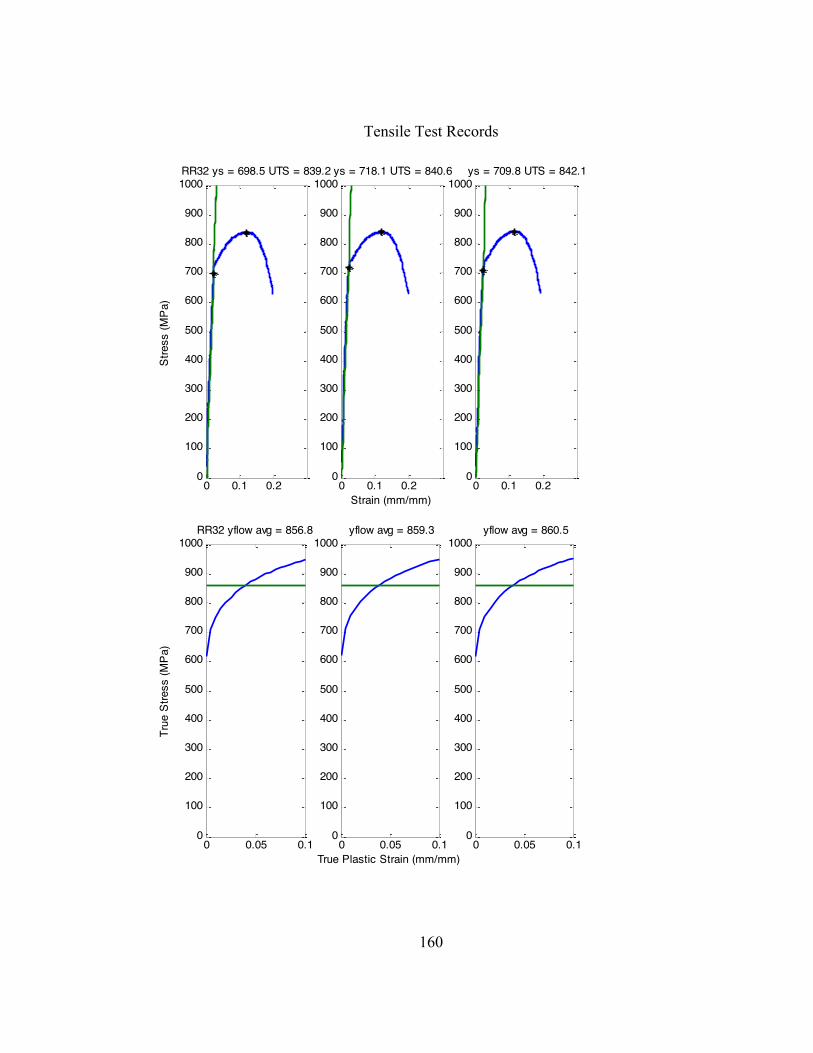
Tensile Test Records
160
0 0.1 0.20
100
200
300
400
500
600
700
800
900
1000RR32 ys = 698.5 UTS = 839.2
Stre
ss (M
Pa)
0 0.1 0.20
100
200
300
400
500
600
700
800
900
1000 ys = 718.1 UTS = 840.6
Strain (mm/mm)0 0.1 0.2
0
100
200
300
400
500
600
700
800
900
1000 ys = 709.8 UTS = 842.1
0 0.05 0.10
100
200
300
400
500
600
700
800
900
1000RR32 yflow avg = 856.8
True
Stre
ss (M
Pa)
0 0.05 0.10
100
200
300
400
500
600
700
800
900
1000 yflow avg = 859.3
True Plastic Strain (mm/mm)0 0.05 0.1
0
100
200
300
400
500
600
700
800
900
1000 yflow avg = 860.5
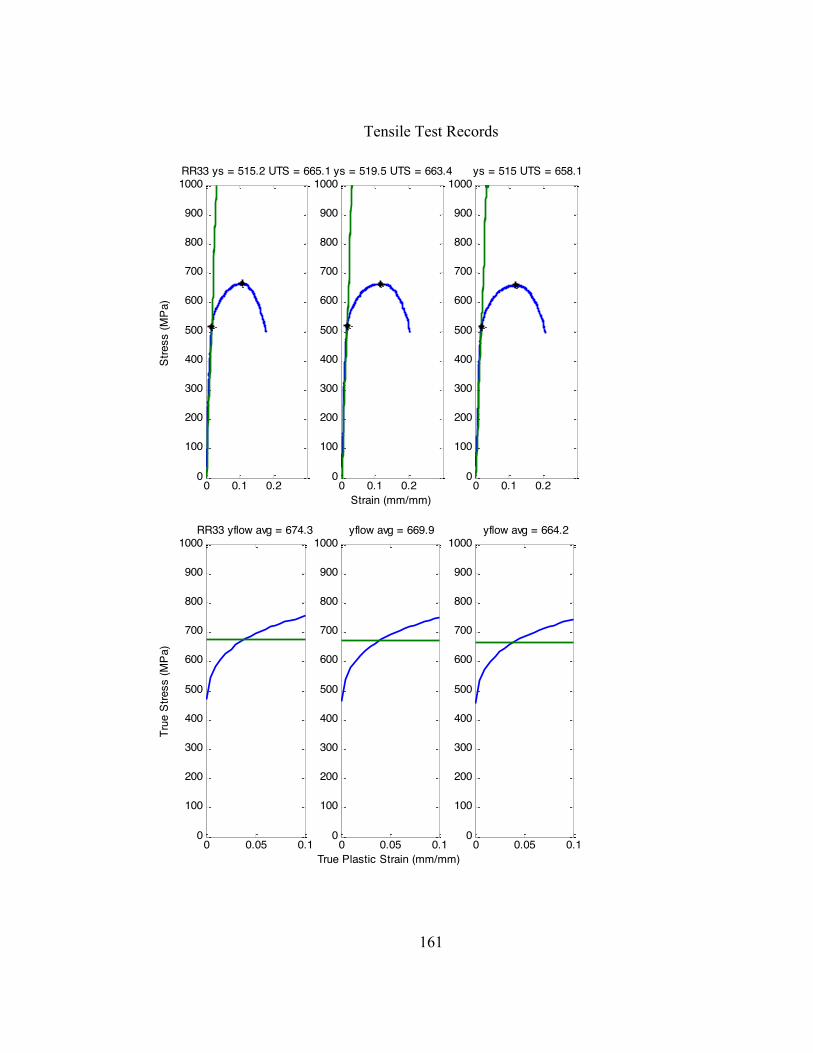
Tensile Test Records
161
0 0.1 0.20
100
200
300
400
500
600
700
800
900
1000RR33 ys = 515.2 UTS = 665.1
Stre
ss (M
Pa)
0 0.1 0.20
100
200
300
400
500
600
700
800
900
1000 ys = 519.5 UTS = 663.4
Strain (mm/mm)0 0.1 0.2
0
100
200
300
400
500
600
700
800
900
1000 ys = 515 UTS = 658.1
0 0.05 0.10
100
200
300
400
500
600
700
800
900
1000RR33 yflow avg = 674.3
True
Stre
ss (M
Pa)
0 0.05 0.10
100
200
300
400
500
600
700
800
900
1000 yflow avg = 669.9
True Plastic Strain (mm/mm)0 0.05 0.1
0
100
200
300
400
500
600
700
800
900
1000 yflow avg = 664.2

Tensile Test Records
162
0 0.1 0.20
100
200
300
400
500
600
700
800
900
1000RR34 ys = 517.5 UTS = 663
Stre
ss (M
Pa)
0 0.1 0.20
100
200
300
400
500
600
700
800
900
1000 ys = 520.7 UTS = 659.9
Strain (mm/mm)0 0.1 0.2
0
100
200
300
400
500
600
700
800
900
1000 ys = 529.2 UTS = 664.9
0 0.05 0.10
100
200
300
400
500
600
700
800
900
1000RR34 yflow avg = 669.4
True
Stre
ss (M
Pa)
0 0.05 0.10
100
200
300
400
500
600
700
800
900
1000 yflow avg = 672.3
True Plastic Strain (mm/mm)0 0.05 0.1
0
100
200
300
400
500
600
700
800
900
1000 yflow avg = 672.9

Tensile Test Records
163
0 0.1 0.20
100
200
300
400
500
600
700
800
900
1000RR35 ys = 508.7 UTS = 672.1
Stre
ss (M
Pa)
0 0.1 0.20
100
200
300
400
500
600
700
800
900
1000 ys = 506.8 UTS = 667.3
Strain (mm/mm)0 0.1 0.2
0
100
200
300
400
500
600
700
800
900
1000 ys = 505 UTS = 672.5
0 0.05 0.10
100
200
300
400
500
600
700
800
900
1000RR35 yflow avg = 678
True
Stre
ss (M
Pa)
0 0.05 0.10
100
200
300
400
500
600
700
800
900
1000 yflow avg = 671.9
True Plastic Strain (mm/mm)0 0.05 0.1
0
100
200
300
400
500
600
700
800
900
1000 yflow avg = 679.6
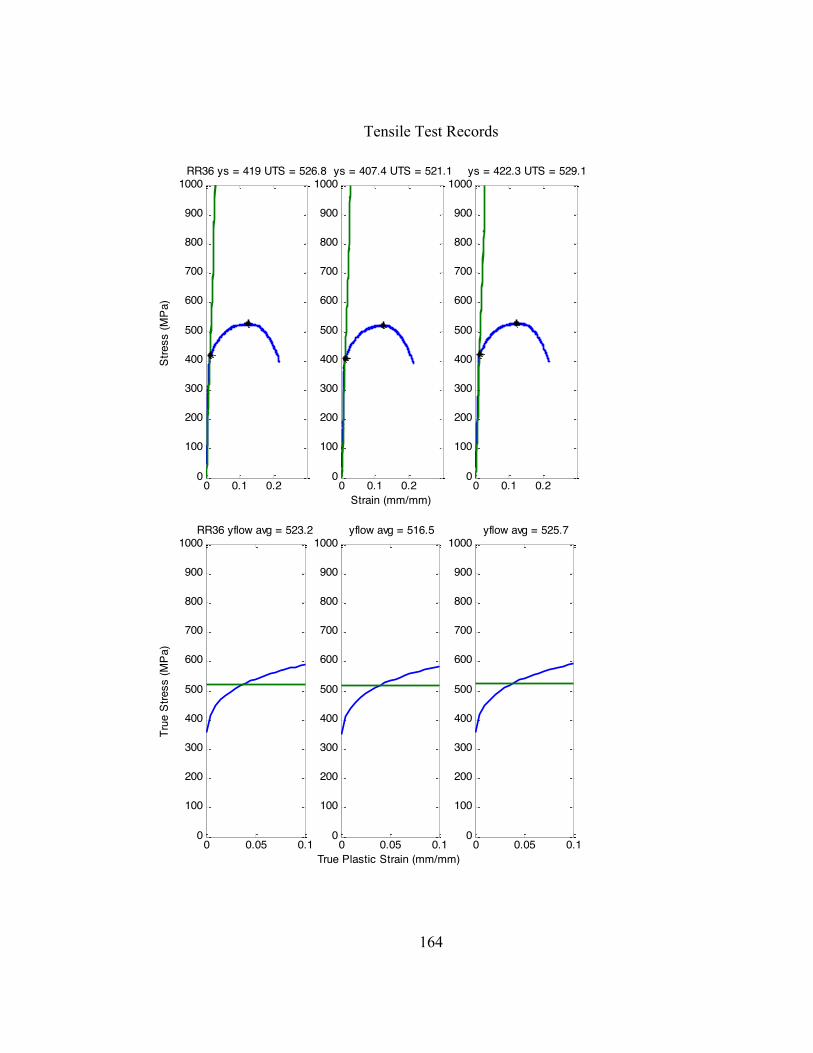
Tensile Test Records
164
0 0.1 0.20
100
200
300
400
500
600
700
800
900
1000RR36 ys = 419 UTS = 526.8
Stre
ss (M
Pa)
0 0.1 0.20
100
200
300
400
500
600
700
800
900
1000 ys = 407.4 UTS = 521.1
Strain (mm/mm)0 0.1 0.2
0
100
200
300
400
500
600
700
800
900
1000 ys = 422.3 UTS = 529.1
0 0.05 0.10
100
200
300
400
500
600
700
800
900
1000RR36 yflow avg = 523.2
True
Stre
ss (M
Pa)
0 0.05 0.10
100
200
300
400
500
600
700
800
900
1000 yflow avg = 516.5
True Plastic Strain (mm/mm)0 0.05 0.1
0
100
200
300
400
500
600
700
800
900
1000 yflow avg = 525.7
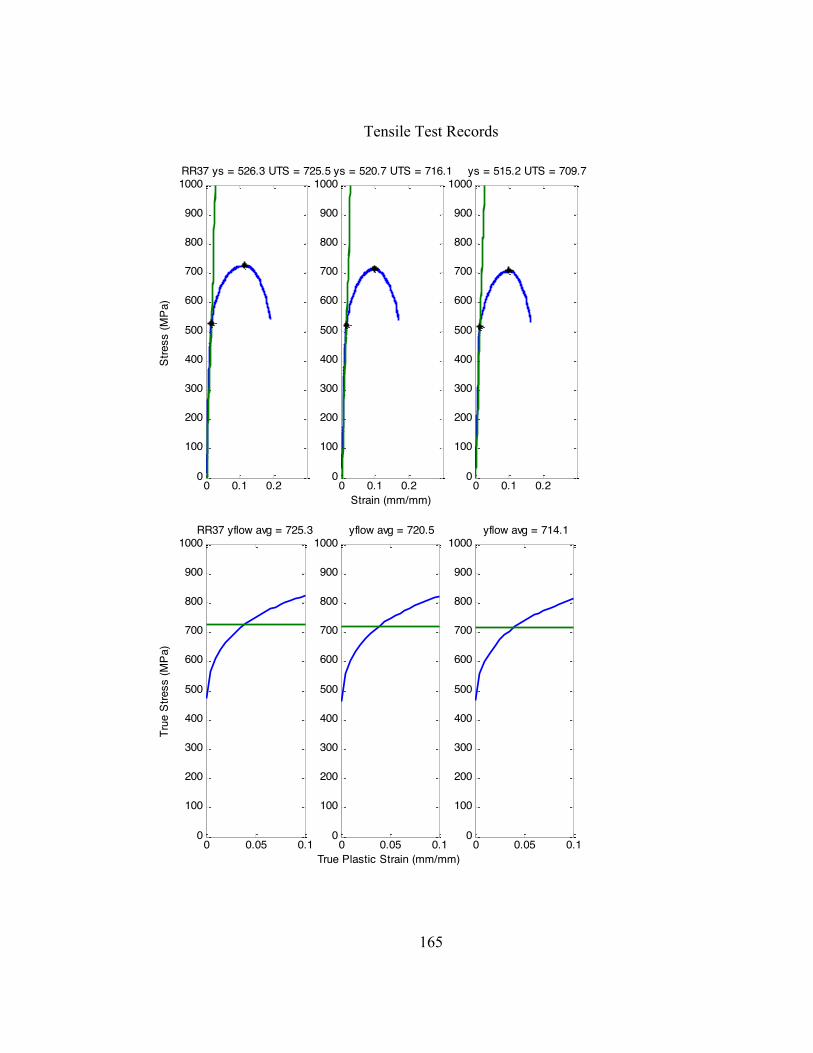
Tensile Test Records
165
0 0.1 0.20
100
200
300
400
500
600
700
800
900
1000RR37 ys = 526.3 UTS = 725.5
Stre
ss (M
Pa)
0 0.1 0.20
100
200
300
400
500
600
700
800
900
1000 ys = 520.7 UTS = 716.1
Strain (mm/mm)0 0.1 0.2
0
100
200
300
400
500
600
700
800
900
1000 ys = 515.2 UTS = 709.7
0 0.05 0.10
100
200
300
400
500
600
700
800
900
1000RR37 yflow avg = 725.3
True
Stre
ss (M
Pa)
0 0.05 0.10
100
200
300
400
500
600
700
800
900
1000 yflow avg = 720.5
True Plastic Strain (mm/mm)0 0.05 0.1
0
100
200
300
400
500
600
700
800
900
1000 yflow avg = 714.1

Tensile Test Records
166
0 0.1 0.20
100
200
300
400
500
600
700
800
900
1000RR38 ys = 408.8 UTS = 556.4
Stre
ss (M
Pa)
0 0.1 0.20
100
200
300
400
500
600
700
800
900
1000 ys = 405 UTS = 549.2
Strain (mm/mm)0 0.1 0.2
0
100
200
300
400
500
600
700
800
900
1000 ys = 422.6 UTS = 563.9
0 0.05 0.10
100
200
300
400
500
600
700
800
900
1000RR38 yflow avg = 548.4
True
Stre
ss (M
Pa)
0 0.05 0.10
100
200
300
400
500
600
700
800
900
1000 yflow avg = 537.6
True Plastic Strain (mm/mm)0 0.05 0.1
0
100
200
300
400
500
600
700
800
900
1000 yflow avg = 554.3

Tensile Test Records
167
0 0.1 0.20
100
200
300
400
500
600
700
800
900
1000RR39 ys = 488.8 UTS = 636.6
Stre
ss (M
Pa)
0 0.1 0.20
100
200
300
400
500
600
700
800
900
1000 ys = 486.1 UTS = 627.3
Strain (mm/mm)0 0.1 0.2
0
100
200
300
400
500
600
700
800
900
1000 ys = 485.6 UTS = 627.7
0 0.05 0.10
100
200
300
400
500
600
700
800
900
1000RR39 yflow avg = 642.5
True
Stre
ss (M
Pa)
0 0.05 0.10
100
200
300
400
500
600
700
800
900
1000 yflow avg = 633.5
True Plastic Strain (mm/mm)0 0.05 0.1
0
100
200
300
400
500
600
700
800
900
1000 yflow avg = 630.7

Tensile Test Records
168
0 0.1 0.20
100
200
300
400
500
600
700
800
900
1000RR40 ys = 506.3 UTS = 652.6
Stre
ss (M
Pa)
0 0.1 0.20
100
200
300
400
500
600
700
800
900
1000 ys = 505.9 UTS = 654.5
Strain (mm/mm)0 0.1 0.2
0
100
200
300
400
500
600
700
800
900
1000 ys = 509.9 UTS = 652.1
0 0.05 0.10
100
200
300
400
500
600
700
800
900
1000RR40 yflow avg = 653
True
Stre
ss (M
Pa)
0 0.05 0.10
100
200
300
400
500
600
700
800
900
1000 yflow avg = 655
True Plastic Strain (mm/mm)0 0.05 0.1
0
100
200
300
400
500
600
700
800
900
1000 yflow avg = 651.6

Tensile Test Records
169
0 0.1 0.20
100
200
300
400
500
600
700
800
900
1000RR41 ys = 497.8 UTS = 654
Stre
ss (M
Pa)
0 0.1 0.20
100
200
300
400
500
600
700
800
900
1000 ys = 494.5 UTS = 642.2
Strain (mm/mm)0 0.1 0.2
0
100
200
300
400
500
600
700
800
900
1000 ys = 489.3 UTS = 643.7
0 0.05 0.10
100
200
300
400
500
600
700
800
900
1000RR41 yflow avg = 655.2
True
Stre
ss (M
Pa)
0 0.05 0.10
100
200
300
400
500
600
700
800
900
1000 yflow avg = 644.8
True Plastic Strain (mm/mm)0 0.05 0.1
0
100
200
300
400
500
600
700
800
900
1000 yflow avg = 647.3

Tensile Test Records
170
0 0.1 0.20
100
200
300
400
500
600
700
800
900
1000RR42 ys = 534.6 UTS = 685.9
Stre
ss (M
Pa)
0 0.1 0.20
100
200
300
400
500
600
700
800
900
1000 ys = 533.1 UTS = 670.1
Strain (mm/mm)0 0.1 0.2
0
100
200
300
400
500
600
700
800
900
1000 ys = 540.1 UTS = 680.8
0 0.05 0.10
100
200
300
400
500
600
700
800
900
1000RR42 yflow avg = 692.7
True
Stre
ss (M
Pa)
0 0.05 0.10
100
200
300
400
500
600
700
800
900
1000 yflow avg = 679.7
True Plastic Strain (mm/mm)0 0.05 0.1
0
100
200
300
400
500
600
700
800
900
1000 yflow avg = 689.3
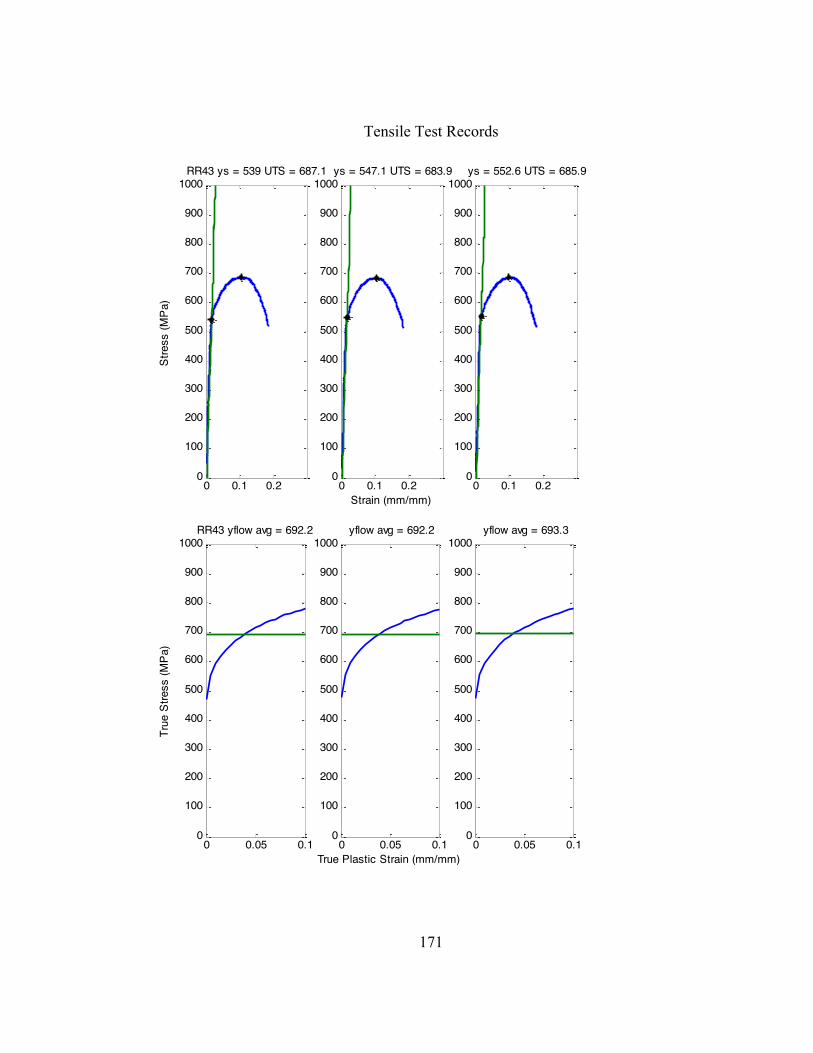
Tensile Test Records
171
0 0.1 0.20
100
200
300
400
500
600
700
800
900
1000RR43 ys = 539 UTS = 687.1
Stre
ss (M
Pa)
0 0.1 0.20
100
200
300
400
500
600
700
800
900
1000 ys = 547.1 UTS = 683.9
Strain (mm/mm)0 0.1 0.2
0
100
200
300
400
500
600
700
800
900
1000 ys = 552.6 UTS = 685.9
0 0.05 0.10
100
200
300
400
500
600
700
800
900
1000RR43 yflow avg = 692.2
True
Stre
ss (M
Pa)
0 0.05 0.10
100
200
300
400
500
600
700
800
900
1000 yflow avg = 692.2
True Plastic Strain (mm/mm)0 0.05 0.1
0
100
200
300
400
500
600
700
800
900
1000 yflow avg = 693.3

Tensile Test Records
172
0 0.1 0.20
100
200
300
400
500
600
700
800
900
1000RR44 ys = 560.5 UTS = 696.8
Stre
ss (M
Pa)
0 0.1 0.20
100
200
300
400
500
600
700
800
900
1000 ys = 562.1 UTS = 689
Strain (mm/mm)0 0.1 0.2
0
100
200
300
400
500
600
700
800
900
1000 ys = 552 UTS = 686.3
0 0.05 0.10
100
200
300
400
500
600
700
800
900
1000RR44 yflow avg = 705.5
True
Stre
ss (M
Pa)
0 0.05 0.10
100
200
300
400
500
600
700
800
900
1000 yflow avg = 702.7
True Plastic Strain (mm/mm)0 0.05 0.1
0
100
200
300
400
500
600
700
800
900
1000 yflow avg = 697.5

Tensile Test Records
173
0 0.1 0.20
100
200
300
400
500
600
700
800
900
1000RR45 ys = 645.3 UTS = 785.4
Stre
ss (M
Pa)
0 0.1 0.20
100
200
300
400
500
600
700
800
900
1000 ys = 646.5 UTS = 779.8
Strain (mm/mm)0 0.1 0.2
0
100
200
300
400
500
600
700
800
900
1000 ys = 649.1 UTS = 781.9
0 0.05 0.10
100
200
300
400
500
600
700
800
900
1000RR45 yflow avg = 813.3
True
Stre
ss (M
Pa)
0 0.05 0.10
100
200
300
400
500
600
700
800
900
1000 yflow avg = 805.5
True Plastic Strain (mm/mm)0 0.05 0.1
0
100
200
300
400
500
600
700
800
900
1000 yflow avg = 806.1

Tensile Test Records
174
0 0.1 0.20
100
200
300
400
500
600
700
800
900
1000RR46 ys = 710.5 UTS = 947.2
Stre
ss (M
Pa)
0 0.1 0.20
100
200
300
400
500
600
700
800
900
1000 ys = 705.9 UTS = 937.9
Strain (mm/mm)0 0.1 0.2
0
100
200
300
400
500
600
700
800
900
1000 ys = 699.3 UTS = 936.7
0 0.05 0.10
100
200
300
400
500
600
700
800
900
1000RR46 yflow avg = 973.3
True
Stre
ss (M
Pa)
0 0.05 0.10
100
200
300
400
500
600
700
800
900
1000 yflow avg = 972.3
True Plastic Strain (mm/mm)0 0.05 0.1
0
100
200
300
400
500
600
700
800
900
1000 yflow avg = 967.9

Tensile Test Records
175
0 0.1 0.20
100
200
300
400
500
600
700
800
900
1000RR47 ys = 515.3 UTS = 683.5
Stre
ss (M
Pa)
0 0.1 0.20
100
200
300
400
500
600
700
800
900
1000 ys = 513.9 UTS = 671.2
Strain (mm/mm)0 0.1 0.2
0
100
200
300
400
500
600
700
800
900
1000 ys = 515.7 UTS = 673.4
0 0.05 0.10
100
200
300
400
500
600
700
800
900
1000RR47 yflow avg = 687
True
Stre
ss (M
Pa)
0 0.05 0.10
100
200
300
400
500
600
700
800
900
1000 yflow avg = 673.5
True Plastic Strain (mm/mm)0 0.05 0.1
0
100
200
300
400
500
600
700
800
900
1000 yflow avg = 675.1

Tensile Test Records
176
0 0.1 0.20
100
200
300
400
500
600
700
800
900
1000RR48 ys = 627 UTS = 792.9
Stre
ss (M
Pa)
0 0.1 0.20
100
200
300
400
500
600
700
800
900
1000 ys = 640 UTS = 806.1
Strain (mm/mm)0 0.1 0.2
0
100
200
300
400
500
600
700
800
900
1000 ys = 646.7 UTS = 813.6
0 0.05 0.10
100
200
300
400
500
600
700
800
900
1000RR48 yflow avg = 805.6
True
Stre
ss (M
Pa)
0 0.05 0.10
100
200
300
400
500
600
700
800
900
1000 yflow avg = 817.9
True Plastic Strain (mm/mm)0 0.05 0.1
0
100
200
300
400
500
600
700
800
900
1000 yflow avg = 823.9

Tensile Test Records
177
0 0.1 0.20
100
200
300
400
500
600
700
800
900
1000RR49 ys = 622.2 UTS = 771.4
Stre
ss (M
Pa)
0 0.1 0.20
100
200
300
400
500
600
700
800
900
1000 ys = 623.2 UTS = 767.1
Strain (mm/mm)0 0.1 0.2
0
100
200
300
400
500
600
700
800
900
1000 ys = 617.7 UTS = 755.6
0 0.05 0.10
100
200
300
400
500
600
700
800
900
1000RR49 yflow avg = 794.1
True
Stre
ss (M
Pa)
0 0.05 0.10
100
200
300
400
500
600
700
800
900
1000 yflow avg = 789.3
True Plastic Strain (mm/mm)0 0.05 0.1
0
100
200
300
400
500
600
700
800
900
1000 yflow avg = 781.6

Tensile Test Records
178
0 0.1 0.20
100
200
300
400
500
600
700
800
900
1000RR50 ys = 674.1 UTS = 813.7
Stre
ss (M
Pa)
0 0.1 0.20
100
200
300
400
500
600
700
800
900
1000 ys = 671.8 UTS = 814.9
Strain (mm/mm)0 0.1 0.2
0
100
200
300
400
500
600
700
800
900
1000 ys = 669.7 UTS = 813.2
0 0.05 0.10
100
200
300
400
500
600
700
800
900
1000RR50 yflow avg = 840.4
True
Stre
ss (M
Pa)
0 0.05 0.10
100
200
300
400
500
600
700
800
900
1000 yflow avg = 845
True Plastic Strain (mm/mm)0 0.05 0.1
0
100
200
300
400
500
600
700
800
900
1000 yflow avg = 839.2

Tensile Test Records
179
0 0.1 0.20
100
200
300
400
500
600
700
800
900
1000XHTA ys = 454.5 UTS = 597.3
Stre
ss (M
Pa)
0 0.1 0.20
100
200
300
400
500
600
700
800
900
1000 ys = 448.6 UTS = 594
Strain (mm/mm)0 0.1 0.2
0
100
200
300
400
500
600
700
800
900
1000 ys = 453 UTS = 595.4
0 0.05 0.10
100
200
300
400
500
600
700
800
900
1000XHTA yflow avg = 589.1
True
Stre
ss (M
Pa)
0 0.05 0.10
100
200
300
400
500
600
700
800
900
1000 yflow avg = 583.3
True Plastic Strain (mm/mm)0 0.05 0.1
0
100
200
300
400
500
600
700
800
900
1000 yflow avg = 587.9

Tensile Test Records
180
0 0.1 0.20
100
200
300
400
500
600
700
800
900
1000XHTB ys = 468.6 UTS = 610.3
Stre
ss (M
Pa)
0 0.1 0.20
100
200
300
400
500
600
700
800
900
1000 ys = 465.4 UTS = 604.9
Strain (mm/mm)0 0.1 0.2
0
100
200
300
400
500
600
700
800
900
1000 ys = 467.4 UTS = 605.7
0 0.05 0.10
100
200
300
400
500
600
700
800
900
1000XHTB yflow avg = 604.9
True
Stre
ss (M
Pa)
0 0.05 0.10
100
200
300
400
500
600
700
800
900
1000 yflow avg = 599.6
True Plastic Strain (mm/mm)0 0.05 0.1
0
100
200
300
400
500
600
700
800
900
1000 yflow avg = 603.2

Tensile Test Records
181
0 0.1 0.20
100
200
300
400
500
600
700
800
900
1000XHTC ys = 486.2 UTS = 586.3
Stre
ss (M
Pa)
0 0.1 0.20
100
200
300
400
500
600
700
800
900
1000 ys = 497.9 UTS = 611.9
Strain (mm/mm)0 0.1 0.2
0
100
200
300
400
500
600
700
800
900
1000 ys = 481.3 UTS = 581.1
0 0.05 0.10
100
200
300
400
500
600
700
800
900
1000XHTC yflow avg = 589.8
True
Stre
ss (M
Pa)
0 0.05 0.10
100
200
300
400
500
600
700
800
900
1000 yflow avg = 614.6
True Plastic Strain (mm/mm)0 0.05 0.1
0
100
200
300
400
500
600
700
800
900
1000 yflow avg = 585

Tensile Test Records
182
0 0.1 0.20
100
200
300
400
500
600
700
800
900
1000XHTD ys = 345 UTS = 435.1
Stre
ss (M
Pa)
0 0.1 0.20
100
200
300
400
500
600
700
800
900
1000 ys = 342.3 UTS = 433.9
Strain (mm/mm)0 0.1 0.2
0
100
200
300
400
500
600
700
800
900
1000 ys = 354.6 UTS = 437.1
0 0.05 0.10
100
200
300
400
500
600
700
800
900
1000XHTD yflow avg = 439.2
True
Stre
ss (M
Pa)
0 0.05 0.10
100
200
300
400
500
600
700
800
900
1000 yflow avg = 438.3
True Plastic Strain (mm/mm)0 0.05 0.1
0
100
200
300
400
500
600
700
800
900
1000 yflow avg = 443.2
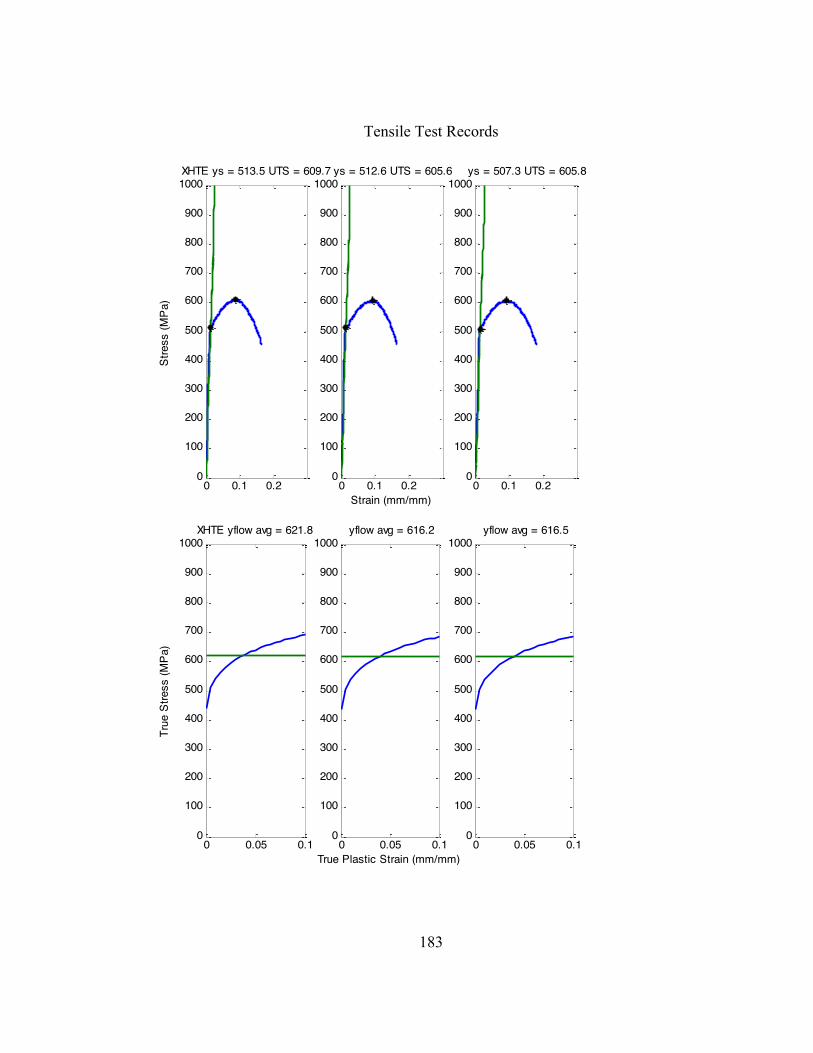
Tensile Test Records
183
0 0.1 0.20
100
200
300
400
500
600
700
800
900
1000XHTE ys = 513.5 UTS = 609.7
Stre
ss (M
Pa)
0 0.1 0.20
100
200
300
400
500
600
700
800
900
1000 ys = 512.6 UTS = 605.6
Strain (mm/mm)0 0.1 0.2
0
100
200
300
400
500
600
700
800
900
1000 ys = 507.3 UTS = 605.8
0 0.05 0.10
100
200
300
400
500
600
700
800
900
1000XHTE yflow avg = 621.8
True
Stre
ss (M
Pa)
0 0.05 0.10
100
200
300
400
500
600
700
800
900
1000 yflow avg = 616.2
True Plastic Strain (mm/mm)0 0.05 0.1
0
100
200
300
400
500
600
700
800
900
1000 yflow avg = 616.5

Tensile Test Records
184
0 0.1 0.20
100
200
300
400
500
600
700
800
900
1000XHTF ys = 369.9 UTS = 457.4
Stre
ss (M
Pa)
0 0.1 0.20
100
200
300
400
500
600
700
800
900
1000 ys = 375.9 UTS = 455.2
Strain (mm/mm)0 0.1 0.2
0
100
200
300
400
500
600
700
800
900
1000 ys = 372.1 UTS = 453.4
0 0.05 0.10
100
200
300
400
500
600
700
800
900
1000XHTF yflow avg = 455.8
True
Stre
ss (M
Pa)
0 0.05 0.10
100
200
300
400
500
600
700
800
900
1000 yflow avg = 455.9
True Plastic Strain (mm/mm)0 0.05 0.1
0
100
200
300
400
500
600
700
800
900
1000 yflow avg = 454.1

Tensile Test Records
185