Constitutive model for thermoplastics with structural applications
Upload
independentCategory
view
3download
0
Journal of Nuclear Materials 335 (2004) 366–378
www.elsevier.com/locate/jnucmat
Assessment of the constitutive properties from small ballpunch test: experiment and modeling
E.N. Campitelli a,*, P. Spatig b, R. Bonade b, W. Hoffelner a, M. Victoria b
a Laboratory for Materials Behavior, Nuclear Energy and Safety Research Department, Paul Scherrer Institute, 5232
Villigen PSI, Switzerlandb Fusion Technology – Materials, CRPP – EPFL, Association EURATOM – Confederation Suisse, 5232 Villigen PSI, Switzerland
Received 2 April 2004; accepted 20 July 2004
Abstract
An assessment of the true stress–true strain relationship has been done by means of tensile and small ball punch tests
on austenitic and tempered martensitic steel at room temperature. A finite element model was developed and validated
to calculate the force–deflection curve obtained from the ball punch experiment. The effects of the specimen thickness
and material properties on the overall shape of the ball punch test curve are discussed. The constitutive behavior
assigned to the specimen for the calculations was determined from the tensile test but we showed that assumptions have
to be done to extend it to large strains as those arising during the punch tests. Using an inverse methodology, it was
possible to show that a linear strain-hardening stage takes place at large strains. The potential for evaluating the evo-
lution of the strain-hardening capacity after irradiation is outlined.
� 2004 Elsevier B.V. All rights reserved.
PACS: 62.20.Fe; 83.20.�d
1. Introduction
The use of small-scale specimen techniques for
mechanical testing of irradiated materials is by now a
worldwide spread interest. Over the last decades, numer-
ous techniques applied on non-standard small specimens
have been developed to extract a host of mechanical and
physical properties. International symposia have been
organized starting in 1986 [1] while reviews and recom-
0022-3115/$ - see front matter � 2004 Elsevier B.V. All rights reserv
doi:10.1016/j.jnucmat.2004.07.052
* Corresponding author. Tel.: +41 56 310 21 89; fax: +41 56
310 45 29.
E-mail address: [email protected] (E.N.
Campitelli).
mendation for small specimen techniques have been con-
tinuously published e.g. [2–4]. There are mainly two
reasons that drive the effort to develop and standardize
this type of specimens, reasons that can be qualified as
intrinsic and extrinsic. The intrinsic ones arise from lim-
itations imposed by the standard scale testing tech-
niques, for example: the availability of space in the
irradiation facilities and the presence of fluence and/or
irradiation temperature gradients for large samples. An-
other example is the technical impossibility of machining
standard sized geometries out of commercial structural
components like tubes or grids that were irradiated in-
service and from which post-irradiation evaluation be-
comes mandatory. As example of the extrinsic reasons,
we stress the need to reduce as much as possible the dose
to personnel for post-irradiation testing.
ed.
E.N. Campitelli et al. / Journal of Nuclear Materials 335 (2004) 366–378 367
Among the test techniques employed to characterize
the constitutive behavior and the fracture properties of
irradiated materials, the ball punch test has been exten-
sively used [5–8]. For the time being, only test recom-
mendations for small punch tests have been issued
that are not always followed by the workers. Not even
the same geometry for the experimental setup was used,
and consequently, the resulting data sets are not di-
rectly comparable. In our opinion, the procedures for
standard punch test of sheet metals described in ASTM
standard E643-84 contain recommendations that can be
applied to the smaller scale specimens used in this work
(use of lubricant, etc.). On a phenomenological basis,
correlations have been proposed, to extract from the
punch tests, tensile test parameters like the yield stress,
the ultimate tensile stress, the uniform elongation [9] or
to estimate the ductile to brittle transition temperature
[10]. In the same vein, different deformation stages have
been associated to the ball punch curve but we shall
show that, under certain circumstances, they contrast
with the experimental results. To our judgment, there
still remains some lack of understanding of the underly-
ing mechanical processes that control the various cali-
bration factors as well as their material and
irradiation dependence. It has already been recognized
that modeling with finite element calculations should
become an inseparable tool for the correct interpreta-
tion of non-standard test curves [4] and a powerful
and trustable method to estimate the correct constitu-
tive parameters of the material. Finite element analysis
was also used to calculate the stress state in punch spec-
imen in order to interpret the crack appearance [11].
However, if one and the same FEM model is expected
to provide valid calculations over a broad range of
materials, it becomes mandatory to validate it perform-
ing simultaneously experiments and calculations on
materials exhibiting significant differences in their
mechanical behavior. A clear procedure along this line
is still lacking. With the goal of completing a self con-
sistent picture the following topics are addressed in this
article:
• A finite element model and its validation are
described.
• Results on tensile and punch tests on two types of
steels (austenitic and tempered martensitic) are pre-
sented. We discuss the issues mentioned above (stages
of deformation, validity of normalization proce-
dures) under the light of the comparison between
the calculated and the experimental force deflection
curves.
• The combined effects of sample thickness, friction
and material strength on the shape of the force deflec-
tion curves are discussed with the help of contour
plots for the equivalent plastic strain provided by
the FEM calculations.
• We show the adequacy of small ball punch testing in
the estimation of the material strength for large
deformations, an issue in which standard tensile tests
may be of reduced applicability due to necking, espe-
cially for irradiated materials. In the case of irradi-
ated materials where the plastic flow is often
observed to be localized in dislocation channels, we
discuss the possibility of using compression tests
instead of tensile test to validate the methodology
to determine the constitutive behavior.
2. Experimental procedures
2.1. Materials employed
Results of two technical stainless steels, with signifi-
cantly different tensile properties (yield strength, strain-
hardening and ductility) are presented in this study.
These materials are a commercial, AISI type, austenitic
316L, and a tempered martensitic steel of the 7–9Cr
class. The tempered martensitic alloy was produced in
the framework of material development for fusion struc-
tural applications. It is a reduced activation tempered
martensitic steel F82H-mod, heat E83697, produced by
Bohler AG. This steel contains 7.65Cr–2.0W–0.1C–
0.18V–0.04Ta and Fe for the balance. The steel was
heat-treated by normalizing at 1253 K for 0.5 h and tem-
pering at 1033 K for 1.5 h. The steel was fully marten-
sitic after quenching [12,13]. The commercial 316L is a
typical high creep strength, low corrosion austenitic steel
with low carbon content. The nominal composition is
17Cr–12Ni–2.5Mo–2Mn–1Si–0.045P–0.03S–0.03C. This
steel was provided by Stahag Stahl A.G, and was deliv-
ered in the standard �annealed and cold drawn bar�condition.
2.2. Tensile tests
Tensile and small ball punch tests were performed at
room temperature. DIN round specimens of 3 mm
diameter and 18 mm in gauge length were used for ten-
sile testing. The tensile tests were carried out with a
Schenck RMC100 electro-mechanical testing machine
at a constant crosshead velocity of 18 mm/min corre-
sponding to a nominal strain-rate of 1.6 · 10�2 s�1. Thisstrain-rate was chosen since it approximately represents
the averaged strain-rate that develops in the punch test
specimens deformed according to the condition de-
scribed below. Note that the strain-rate was found to
have a well quantifiable effect on the strain-hardening
rate of the tempered martensitic steel in particular [14],
so it is very important to characterize the constitutive
behavior with a strain-rate similar to that by which the
disk is deformed. From the load-elongation data, the
368 E.N. Campitelli et al. / Journal of Nuclear Materials 335 (2004) 366–378
true stress–true strain curves were calculated, so all the
stresses and strains presented in this paper are expressed
in true units. The elongation was measured with a clip
gauge attached to the specimens.
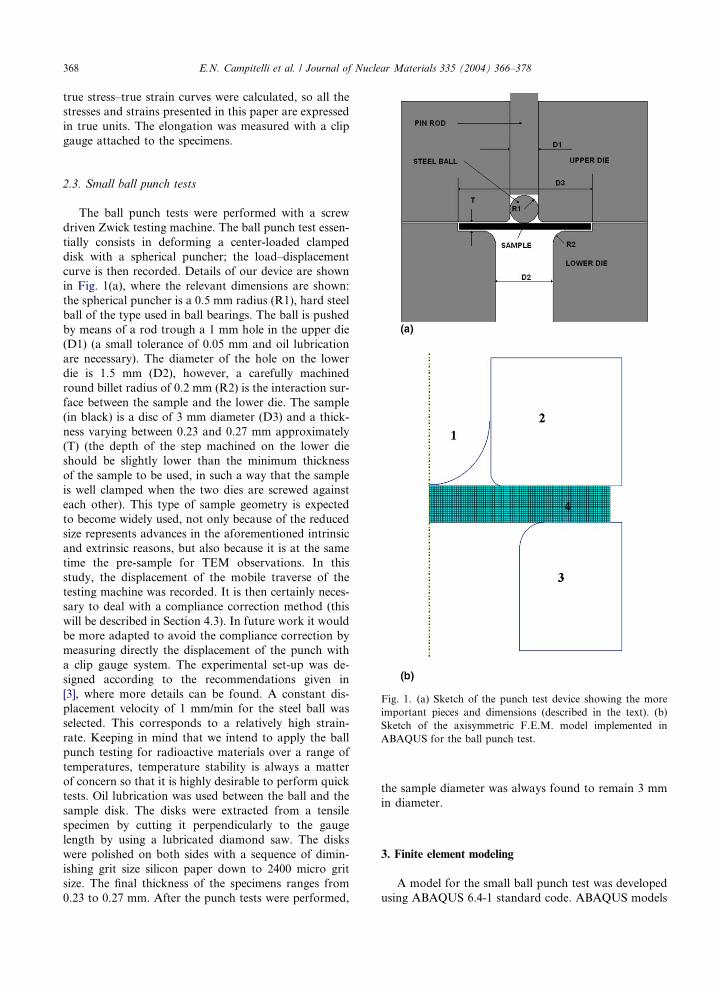
Fig. 1. (a) Sketch of the punch test device showing the more
important pieces and dimensions (described in the text). (b)
Sketch of the axisymmetric F.E.M. model implemented in
ABAQUS for the ball punch test.
2.3. Small ball punch tests
The ball punch tests were performed with a screw
driven Zwick testing machine. The ball punch test essen-
tially consists in deforming a center-loaded clamped
disk with a spherical puncher; the load–displacement
curve is then recorded. Details of our device are shown
in Fig. 1(a), where the relevant dimensions are shown:
the spherical puncher is a 0.5 mm radius (R1), hard steel
ball of the type used in ball bearings. The ball is pushed
by means of a rod trough a 1 mm hole in the upper die
(D1) (a small tolerance of 0.05 mm and oil lubrication
are necessary). The diameter of the hole on the lower
die is 1.5 mm (D2), however, a carefully machined
round billet radius of 0.2 mm (R2) is the interaction sur-
face between the sample and the lower die. The sample
(in black) is a disc of 3 mm diameter (D3) and a thick-
ness varying between 0.23 and 0.27 mm approximately
(T) (the depth of the step machined on the lower die
should be slightly lower than the minimum thickness
of the sample to be used, in such a way that the sample
is well clamped when the two dies are screwed against
each other). This type of sample geometry is expected
to become widely used, not only because of the reduced
size represents advances in the aforementioned intrinsic
and extrinsic reasons, but also because it is at the same
time the pre-sample for TEM observations. In this
study, the displacement of the mobile traverse of the
testing machine was recorded. It is then certainly neces-
sary to deal with a compliance correction method (this
will be described in Section 4.3). In future work it would
be more adapted to avoid the compliance correction by
measuring directly the displacement of the punch with
a clip gauge system. The experimental set-up was de-
signed according to the recommendations given in
[3], where more details can be found. A constant dis-
placement velocity of 1 mm/min for the steel ball was
selected. This corresponds to a relatively high strain-
rate. Keeping in mind that we intend to apply the ball
punch testing for radioactive materials over a range of
temperatures, temperature stability is always a matter
of concern so that it is highly desirable to perform quick
tests. Oil lubrication was used between the ball and the
sample disk. The disks were extracted from a tensile
specimen by cutting it perpendicularly to the gauge
length by using a lubricated diamond saw. The disks
were polished on both sides with a sequence of dimin-
ishing grit size silicon paper down to 2400 micro grit
size. The final thickness of the specimens ranges from
0.23 to 0.27 mm. After the punch tests were performed,
the sample diameter was always found to remain 3 mm
in diameter.
3. Finite element modeling
A model for the small ball punch test was developed
using ABAQUS 6.4-1 standard code. ABAQUS models
400
600
800
1000
F82H
316L
σ (M
Pa)
E.N. Campitelli et al. / Journal of Nuclear Materials 335 (2004) 366–378 369
the effect of the multi-axial stress state using the von
Mises stress potential and associated J2 flow law. The
model is shown in Fig. 1(b) and includes the ball (1),
the upper die (2), the lower die (3) and the sample disk
(4). Taking advantage of the rotational symmetry of
the experimental set-up, an axisymmetric finite element
model was developed. The ball and dies were imple-
mented as rigid bodies. The disk was modeled with
2000 axisymmetric linear reduced integration elements
(CAX4R). This element type was selected since it is
the most suitable in analysis that involves large strains
and strain gradients as well as in contact interaction
problems. The number of elements was shown by mesh
convergence analysis to be enough to reconstruct prop-
erly the load–displacement curves. A force was applied
between the upper and the lower dies during the defor-
mation, this prevents the specimen to slip. Friction be-
tween these dies and the disk constrains the latter in
the same way as in the actual experimental device. The
calculations were run by imposing the vertical displace-
ment of the ball. Calculations with frictionless contact
interactions as well with a friction coefficient equal to
0.05 between the ball and the disk were considered. Such
a friction coefficient is the upper value characterizing the
interaction between lubricated polished metal pieces
[15]. Finally, a constitutive behavior had to be assigned
to the disk. For both steels, the elastic properties, which
are the Young�s modulus E, the Poisson�s ratio m and theyield stress r0.2, defined at 0.2% plastic strain, are sum-marized in the Table 1. For the plastic behavior, ABA-
QUS code also requires the plastic behavior
represented by the flow stress, r, as a function of theplastic strain, epl, that is written as:
r ¼ r0:2 þ rplðeplÞ: ð1Þ
The rpl(epl) equation is derived from the uniaxial tensilebehavior. However, this equation can be easily obtained
only up to the strain at which the necking starts. How-
ever, the equivalent plastic strain at certain locations
of the punch disk can reach about 80% in the final stage
of the ball punch experiment, i.e., for a strain much lar-
ger than the true uniform strain. Hence, it is necessary to
extrapolate the tensile curves beyond necking to have
the appropriate constitutive behavior used as input in
the calculations. Since different extrapolation rpl(epl)equations were used in our calculations, we indicate
for each of them which constitutive behavior was
considered.
Table 1
Elastic parameters for the 316L and F82H-mod steels
Material E (MPa) m r0.2 (MPa)
F82H 207 · 103 0.33 532
316L 207 · 103 0.33 388
4. Results and discussion
4.1. Tensile behavior at room temperature
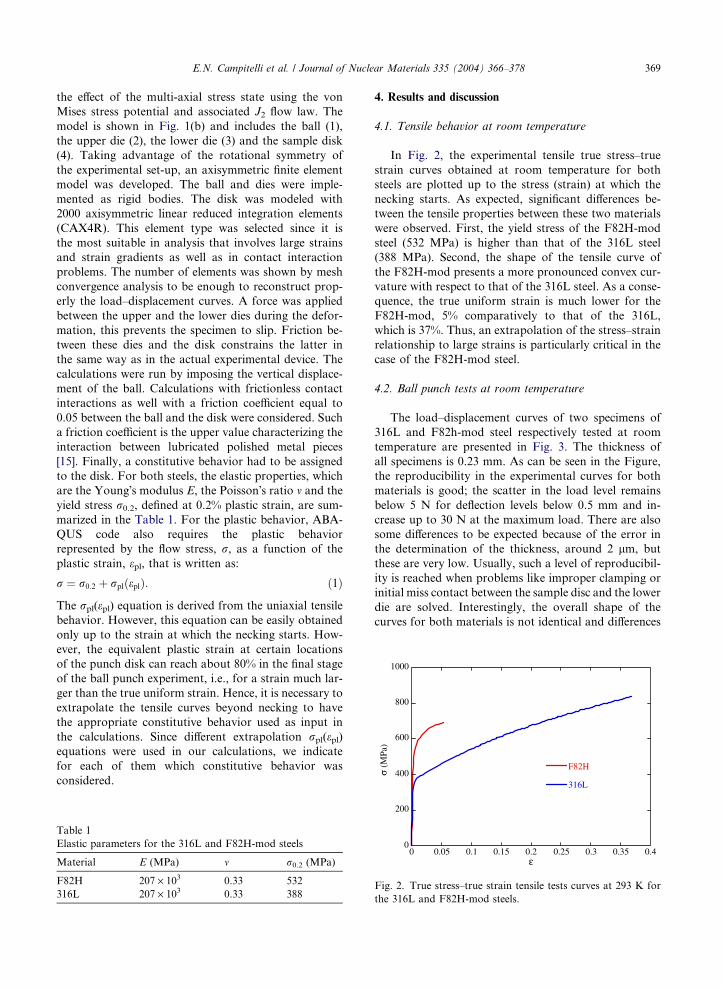
In Fig. 2, the experimental tensile true stress–true
strain curves obtained at room temperature for both
steels are plotted up to the stress (strain) at which the
necking starts. As expected, significant differences be-
tween the tensile properties between these two materials
were observed. First, the yield stress of the F82H-mod
steel (532 MPa) is higher than that of the 316L steel
(388 MPa). Second, the shape of the tensile curve of
the F82H-mod presents a more pronounced convex cur-
vature with respect to that of the 316L steel. As a conse-
quence, the true uniform strain is much lower for the
F82H-mod, 5% comparatively to that of the 316L,
which is 37%. Thus, an extrapolation of the stress–strain
relationship to large strains is particularly critical in the
case of the F82H-mod steel.
4.2. Ball punch tests at room temperature
The load–displacement curves of two specimens of
316L and F82h-mod steel respectively tested at room
temperature are presented in Fig. 3. The thickness of
all specimens is 0.23 mm. As can be seen in the Figure,
the reproducibility in the experimental curves for both
materials is good; the scatter in the load level remains
below 5 N for deflection levels below 0.5 mm and in-
crease up to 30 N at the maximum load. There are also
some differences to be expected because of the error in
the determination of the thickness, around 2 lm, butthese are very low. Usually, such a level of reproducibil-
ity is reached when problems like improper clamping or
initial miss contact between the sample disc and the lower
die are solved. Interestingly, the overall shape of the
curves for both materials is not identical and differences
0
200
0 0.05 0.1 0.15 0.2 0.25 0.3 0.35 0.4ε
Fig. 2. True stress–true strain tensile tests curves at 293 K for
the 316L and F82H-mod steels.
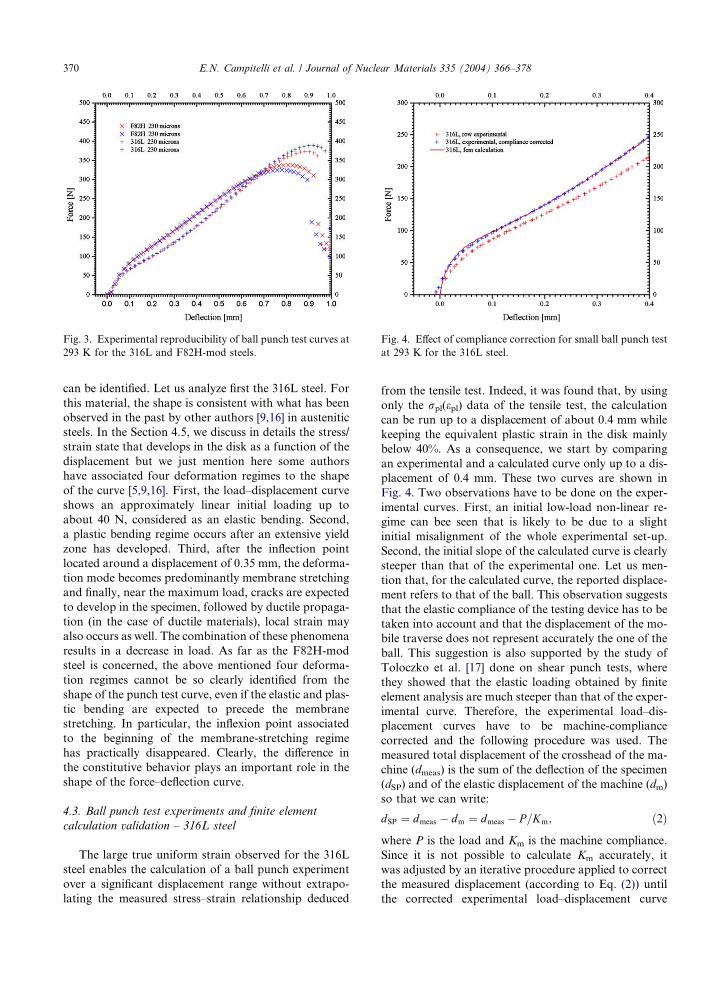
Fig. 3. Experimental reproducibility of ball punch test curves at
293 K for the 316L and F82H-mod steels.
Fig. 4. Effect of compliance correction for small ball punch test
at 293 K for the 316L steel.
370 E.N. Campitelli et al. / Journal of Nuclear Materials 335 (2004) 366–378
can be identified. Let us analyze first the 316L steel. For
this material, the shape is consistent with what has been
observed in the past by other authors [9,16] in austenitic
steels. In the Section 4.5, we discuss in details the stress/
strain state that develops in the disk as a function of the
displacement but we just mention here some authors
have associated four deformation regimes to the shape
of the curve [5,9,16]. First, the load–displacement curve
shows an approximately linear initial loading up to
about 40 N, considered as an elastic bending. Second,
a plastic bending regime occurs after an extensive yield
zone has developed. Third, after the inflection point
located around a displacement of 0.35 mm, the deforma-
tion mode becomes predominantly membrane stretching
and finally, near the maximum load, cracks are expected
to develop in the specimen, followed by ductile propaga-
tion (in the case of ductile materials), local strain may
also occurs as well. The combination of these phenomena
results in a decrease in load. As far as the F82H-mod
steel is concerned, the above mentioned four deforma-
tion regimes cannot be so clearly identified from the
shape of the punch test curve, even if the elastic and plas-
tic bending are expected to precede the membrane
stretching. In particular, the inflexion point associated
to the beginning of the membrane-stretching regime
has practically disappeared. Clearly, the difference in
the constitutive behavior plays an important role in the
shape of the force–deflection curve.
4.3. Ball punch test experiments and finite element
calculation validation – 316L steel
The large true uniform strain observed for the 316L
steel enables the calculation of a ball punch experiment
over a significant displacement range without extrapo-
lating the measured stress–strain relationship deduced
from the tensile test. Indeed, it was found that, by using
only the rpl(epl) data of the tensile test, the calculationcan be run up to a displacement of about 0.4 mm while
keeping the equivalent plastic strain in the disk mainly
below 40%. As a consequence, we start by comparing
an experimental and a calculated curve only up to a dis-
placement of 0.4 mm. These two curves are shown in
Fig. 4. Two observations have to be done on the exper-
imental curves. First, an initial low-load non-linear re-
gime can bee seen that is likely to be due to a slight
initial misalignment of the whole experimental set-up.
Second, the initial slope of the calculated curve is clearly
steeper than that of the experimental one. Let us men-
tion that, for the calculated curve, the reported displace-
ment refers to that of the ball. This observation suggests
that the elastic compliance of the testing device has to be
taken into account and that the displacement of the mo-
bile traverse does not represent accurately the one of the
ball. This suggestion is also supported by the study of
Toloczko et al. [17] done on shear punch tests, where
they showed that the elastic loading obtained by finite
element analysis are much steeper than that of the exper-
imental curve. Therefore, the experimental load–dis-
placement curves have to be machine-compliance
corrected and the following procedure was used. The
measured total displacement of the crosshead of the ma-
chine (dmeas) is the sum of the deflection of the specimen
(dSP) and of the elastic displacement of the machine (dm)
so that we can write:
dSP ¼ dmeas � dm ¼ dmeas � P=Km; ð2Þ
where P is the load and Km is the machine compliance.
Since it is not possible to calculate Km accurately, it
was adjusted by an iterative procedure applied to correct
the measured displacement (according to Eq. (2)) until
the corrected experimental load–displacement curve
E.N. Campitelli et al. / Journal of Nuclear Materials 335 (2004) 366–378 371
perfectly matches the calculated curve. The compliance
corrected curve is presented in Fig. 3, where it can be
seen that the calculated curve reproduces very well the
experimental one. To gain confidence in the Km value
and then in the correction, several punch test experi-
ments on various materials (austenitic steel, tempered
martensitic steels and also Zircaloys) as well as on spec-
imens with different thickness were performed. The
experimental curves were compliance corrected using
the previously calculated value of Km. It was found that
using the same Km value for each test, the compliance
correction technique shifts systematically all the experi-
mental curves over the calculated ones, independently
of the material and thickness. It has to be observed that
the initial non-linear low-load region remains poorly fit-
ted by the calculations. Since this non-linear regime is
attributed to slight misalignment that necessitates some
amount of loading to become negligible, the calculations
cannot be expected to yield good results in the initial
part of the deformation curve, unless the deflection of
the disk is measured with an extensometer touching
the bottom of the specimen for example.
Using the finite element model in conjunction with
the compliance correction method, three entire experi-
mental curves obtained with different specimen thickness
(0.230, 0.250 and 0.270 mm) were calculated. In order to
calculate the curves up to deflection larger than 0.4 mm,
it was necessary to assign to the disk an extended consti-
tutive behavior. Based upon the observation that the
strain-hardening of the 316L steel, defined as hp = dr/dep, has a very low curvature, the stress–strain curve
was simply extended linearly above the necking with a
strain-hardening rate equal to the value hp at the initia-tion of the necking. The results of the calculations are
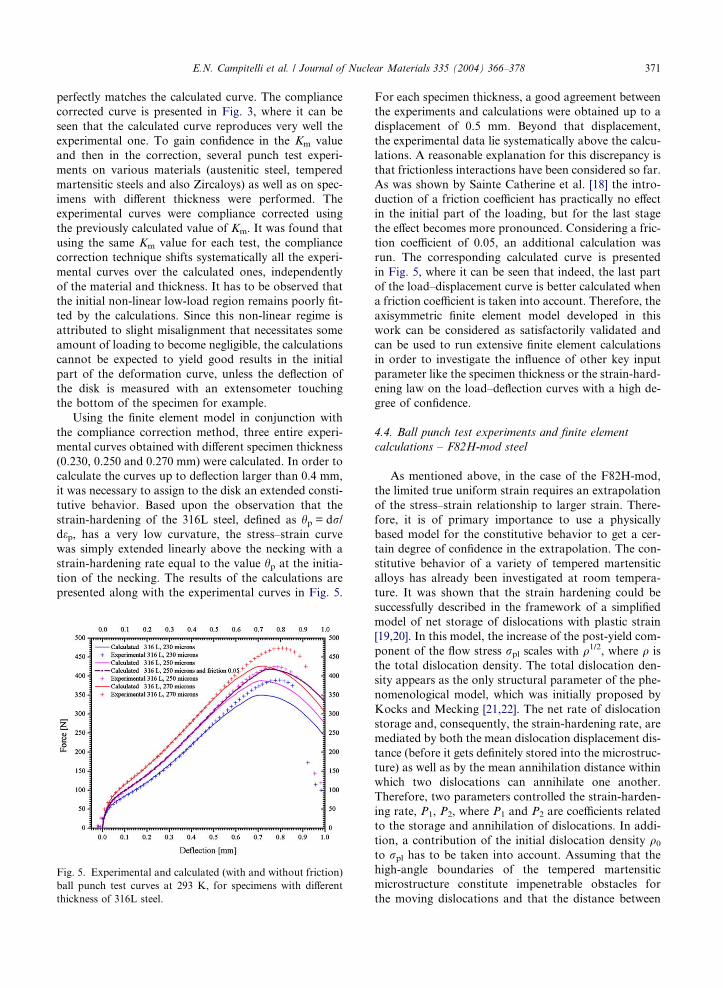
presented along with the experimental curves in Fig. 5.
Fig. 5. Experimental and calculated (with and without friction)
ball punch test curves at 293 K, for specimens with different
thickness of 316L steel.
For each specimen thickness, a good agreement between
the experiments and calculations were obtained up to a
displacement of 0.5 mm. Beyond that displacement,
the experimental data lie systematically above the calcu-
lations. A reasonable explanation for this discrepancy is
that frictionless interactions have been considered so far.
As was shown by Sainte Catherine et al. [18] the intro-
duction of a friction coefficient has practically no effect
in the initial part of the loading, but for the last stage
the effect becomes more pronounced. Considering a fric-
tion coefficient of 0.05, an additional calculation was
run. The corresponding calculated curve is presented
in Fig. 5, where it can be seen that indeed, the last part
of the load–displacement curve is better calculated when
a friction coefficient is taken into account. Therefore, the
axisymmetric finite element model developed in this
work can be considered as satisfactorily validated and
can be used to run extensive finite element calculations
in order to investigate the influence of other key input
parameter like the specimen thickness or the strain-hard-
ening law on the load–deflection curves with a high de-
gree of confidence.
4.4. Ball punch test experiments and finite element
calculations – F82H-mod steel
As mentioned above, in the case of the F82H-mod,
the limited true uniform strain requires an extrapolation
of the stress–strain relationship to larger strain. There-
fore, it is of primary importance to use a physically
based model for the constitutive behavior to get a cer-
tain degree of confidence in the extrapolation. The con-
stitutive behavior of a variety of tempered martensitic
alloys has already been investigated at room tempera-
ture. It was shown that the strain hardening could be
successfully described in the framework of a simplified
model of net storage of dislocations with plastic strain
[19,20]. In this model, the increase of the post-yield com-
ponent of the flow stress rpl scales with q1/2, where q isthe total dislocation density. The total dislocation den-
sity appears as the only structural parameter of the phe-
nomenological model, which was initially proposed by
Kocks and Mecking [21,22]. The net rate of dislocation
storage and, consequently, the strain-hardening rate, are
mediated by both the mean dislocation displacement dis-
tance (before it gets definitely stored into the microstruc-
ture) as well as by the mean annihilation distance within
which two dislocations can annihilate one another.
Therefore, two parameters controlled the strain-harden-
ing rate, P1, P2, where P1 and P2 are coefficients related
to the storage and annihilation of dislocations. In addi-
tion, a contribution of the initial dislocation density q0to rpl has to be taken into account. Assuming that thehigh-angle boundaries of the tempered martensitic
microstructure constitute impenetrable obstacles for
the moving dislocations and that the distance between
0
50
100
150
200
250
300
350
400
0 0.1 0.2 0.3 0.4 0.5
modified constitutive behavior (stage IV)
constitutive behavior with saturation law
σ pl (
MP
a)
εpl
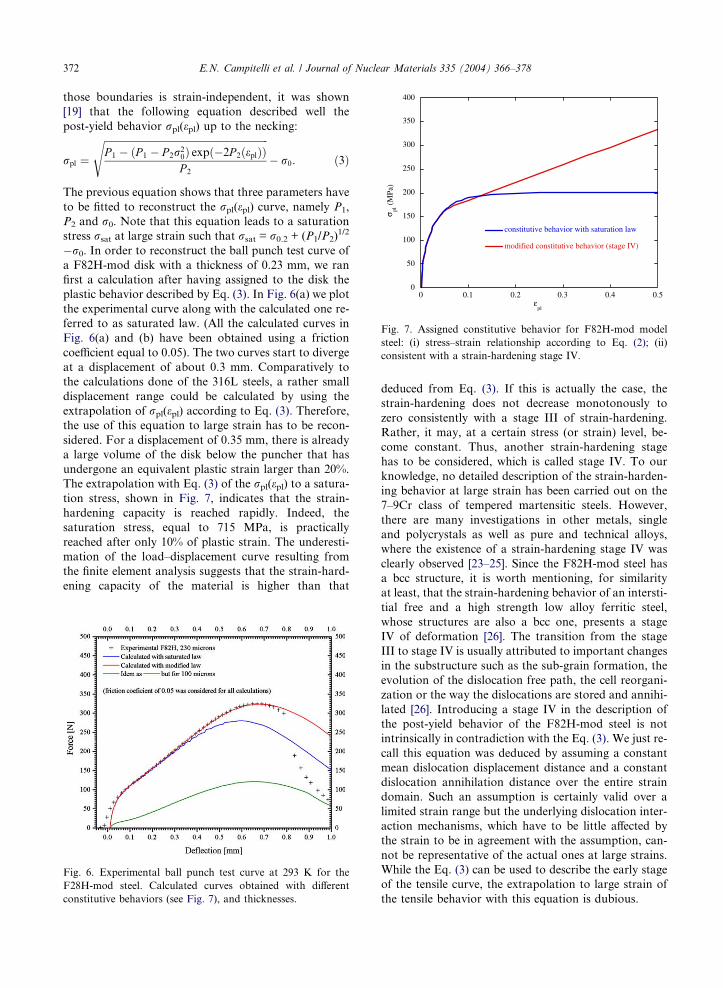
Fig. 7. Assigned constitutive behavior for F82H-mod model
steel: (i) stress–strain relationship according to Eq. (2); (ii)
consistent with a strain-hardening stage IV.
372 E.N. Campitelli et al. / Journal of Nuclear Materials 335 (2004) 366–378
those boundaries is strain-independent, it was shown
[19] that the following equation described well the
post-yield behavior rpl(epl) up to the necking:
rpl ¼
ffiffiffiffiffiffiffiffiffiffiffiffiffiffiffiffiffiffiffiffiffiffiffiffiffiffiffiffiffiffiffiffiffiffiffiffiffiffiffiffiffiffiffiffiffiffiffiffiffiffiffiffiffiffiffiffiffiffiffiffiffiffiffiffiffiffiP 1 � ðP 1 � P 2r20Þ expð�2P 2ðeplÞÞ
P 2
s� r0: ð3Þ
The previous equation shows that three parameters have
to be fitted to reconstruct the rpl(epl) curve, namely P1,
P2 and r0. Note that this equation leads to a saturationstress rsat at large strain such that rsat = r0.2 + (P1/P2)
1/2
�r0. In order to reconstruct the ball punch test curve ofa F82H-mod disk with a thickness of 0.23 mm, we ran
first a calculation after having assigned to the disk the
plastic behavior described by Eq. (3). In Fig. 6(a) we plot
the experimental curve along with the calculated one re-
ferred to as saturated law. (All the calculated curves in
Fig. 6(a) and (b) have been obtained using a friction
coefficient equal to 0.05). The two curves start to diverge
at a displacement of about 0.3 mm. Comparatively to
the calculations done of the 316L steels, a rather small
displacement range could be calculated by using the
extrapolation of rpl(epl) according to Eq. (3). Therefore,the use of this equation to large strain has to be recon-
sidered. For a displacement of 0.35 mm, there is already
a large volume of the disk below the puncher that has
undergone an equivalent plastic strain larger than 20%.
The extrapolation with Eq. (3) of the rpl(epl) to a satura-tion stress, shown in Fig. 7, indicates that the strain-
hardening capacity is reached rapidly. Indeed, the
saturation stress, equal to 715 MPa, is practically
reached after only 10% of plastic strain. The underesti-
mation of the load–displacement curve resulting from
the finite element analysis suggests that the strain-hard-
ening capacity of the material is higher than that
Fig. 6. Experimental ball punch test curve at 293 K for the
F28H-mod steel. Calculated curves obtained with different
constitutive behaviors (see Fig. 7), and thicknesses.
deduced from Eq. (3). If this is actually the case, the
strain-hardening does not decrease monotonously to
zero consistently with a stage III of strain-hardening.
Rather, it may, at a certain stress (or strain) level, be-
come constant. Thus, another strain-hardening stage
has to be considered, which is called stage IV. To our
knowledge, no detailed description of the strain-harden-
ing behavior at large strain has been carried out on the
7–9Cr class of tempered martensitic steels. However,
there are many investigations in other metals, single
and polycrystals as well as pure and technical alloys,
where the existence of a strain-hardening stage IV was
clearly observed [23–25]. Since the F82H-mod steel has
a bcc structure, it is worth mentioning, for similarity
at least, that the strain-hardening behavior of an intersti-
tial free and a high strength low alloy ferritic steel,
whose structures are also a bcc one, presents a stage
IV of deformation [26]. The transition from the stage
III to stage IV is usually attributed to important changes
in the substructure such as the sub-grain formation, the
evolution of the dislocation free path, the cell reorgani-
zation or the way the dislocations are stored and annihi-
lated [26]. Introducing a stage IV in the description of
the post-yield behavior of the F82H-mod steel is not
intrinsically in contradiction with the Eq. (3). We just re-
call this equation was deduced by assuming a constant
mean dislocation displacement distance and a constant
dislocation annihilation distance over the entire strain
domain. Such an assumption is certainly valid over a
limited strain range but the underlying dislocation inter-
action mechanisms, which have to be little affected by
the strain to be in agreement with the assumption, can-
not be representative of the actual ones at large strains.
While the Eq. (3) can be used to describe the early stage
of the tensile curve, the extrapolation to large strain of
the tensile behavior with this equation is dubious.
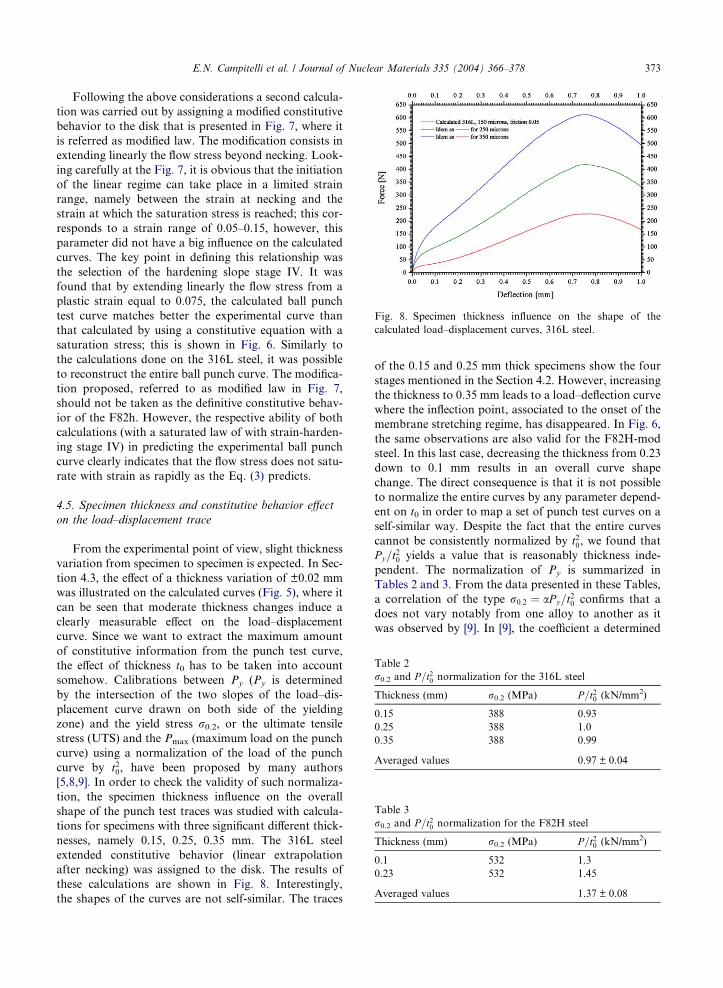
Fig. 8. Specimen thickness influence on the shape of the
calculated load–displacement curves, 316L steel.
Table 2
r0.2 and P=t20 normalization for the 316L steel
Thickness (mm) r0.2 (MPa) P=t20 (kN/mm2)
0.15 388 0.93
0.25 388 1.0
0.35 388 0.99
Averaged values 0.97 ± 0.04
Table 3
r0.2 and P=t20 normalization for the F82H steel
Thickness (mm) r0.2 (MPa) P=t20 (kN/mm2)
0.1 532 1.3
0.23 532 1.45
Averaged values 1.37 ± 0.08
E.N. Campitelli et al. / Journal of Nuclear Materials 335 (2004) 366–378 373
Following the above considerations a second calcula-
tion was carried out by assigning a modified constitutive
behavior to the disk that is presented in Fig. 7, where it
is referred as modified law. The modification consists in
extending linearly the flow stress beyond necking. Look-
ing carefully at the Fig. 7, it is obvious that the initiation
of the linear regime can take place in a limited strain
range, namely between the strain at necking and the
strain at which the saturation stress is reached; this cor-
responds to a strain range of 0.05–0.15, however, this
parameter did not have a big influence on the calculated
curves. The key point in defining this relationship was
the selection of the hardening slope stage IV. It was
found that by extending linearly the flow stress from a
plastic strain equal to 0.075, the calculated ball punch
test curve matches better the experimental curve than
that calculated by using a constitutive equation with a
saturation stress; this is shown in Fig. 6. Similarly to
the calculations done on the 316L steel, it was possible
to reconstruct the entire ball punch curve. The modifica-
tion proposed, referred to as modified law in Fig. 7,
should not be taken as the definitive constitutive behav-
ior of the F82h. However, the respective ability of both
calculations (with a saturated law of with strain-harden-
ing stage IV) in predicting the experimental ball punch
curve clearly indicates that the flow stress does not satu-
rate with strain as rapidly as the Eq. (3) predicts.
4.5. Specimen thickness and constitutive behavior effect
on the load–displacement trace
From the experimental point of view, slight thickness
variation from specimen to specimen is expected. In Sec-
tion 4.3, the effect of a thickness variation of ±0.02 mm
was illustrated on the calculated curves (Fig. 5), where it
can be seen that moderate thickness changes induce a
clearly measurable effect on the load–displacement
curve. Since we want to extract the maximum amount
of constitutive information from the punch test curve,
the effect of thickness t0 has to be taken into account
somehow. Calibrations between Py (Py is determined
by the intersection of the two slopes of the load–dis-
placement curve drawn on both side of the yielding
zone) and the yield stress r0.2, or the ultimate tensilestress (UTS) and the Pmax (maximum load on the punch
curve) using a normalization of the load of the punch
curve by t20, have been proposed by many authors
[5,8,9]. In order to check the validity of such normaliza-
tion, the specimen thickness influence on the overall
shape of the punch test traces was studied with calcula-
tions for specimens with three significant different thick-
nesses, namely 0.15, 0.25, 0.35 mm. The 316L steel
extended constitutive behavior (linear extrapolation
after necking) was assigned to the disk. The results of
these calculations are shown in Fig. 8. Interestingly,
the shapes of the curves are not self-similar. The traces
of the 0.15 and 0.25 mm thick specimens show the four
stages mentioned in the Section 4.2. However, increasing
the thickness to 0.35 mm leads to a load–deflection curve
where the inflection point, associated to the onset of the
membrane stretching regime, has disappeared. In Fig. 6,
the same observations are also valid for the F82H-mod
steel. In this last case, decreasing the thickness from 0.23
down to 0.1 mm results in an overall curve shape
change. The direct consequence is that it is not possible
to normalize the entire curves by any parameter depend-
ent on t0 in order to map a set of punch test curves on a
self-similar way. Despite the fact that the entire curves
cannot be consistently normalized by t20, we found thatPy=t20 yields a value that is reasonably thickness inde-pendent. The normalization of Py is summarized in
Tables 2 and 3. From the data presented in these Tables,
a correlation of the type r0:2 ¼ aPy=t20 confirms that adoes not vary notably from one alloy to another as it
was observed by [9]. In [9], the coefficient a determined
374 E.N. Campitelli et al. / Journal of Nuclear Materials 335 (2004) 366–378
for a variety of material was found equal to 360 MPa/
(kN/mm2). In our case, the a coefficients that are ob-
tained at room temperature for the 316L and F82H-
mod steel, respectively, are 400 ± 12 and 388 ± 22
MPa/(kN/mm2).
In order to check that Py is really mediated by the
yield stress, we ran two extra calculations; they are not
shown in Fig. 6 to avoid confusion. First, an �hybrid� cal-culation, where the constitutive behavior of the material
is such that the yield stress corresponds to that of the
F82H-mod steel and the rpl(epl) relationship is that ofthe 316L steel. The result of this calculation showed us
that, up to a displacement of about 0.3 mm, the punch
test curves are not strongly affected by the post-yield
behavior. However, its effect becomes noticeable at larger
displacements (the �hybrid� calculation lies on the top ofthe curve for the F82H up to deflections <0.3 mm and
then deviates to higher force levels). Second, in order to
show the difference between a strain-hardening material
and a material with a flow stress almost equal to the yield
stress, a calculation with an almost perfectly plastic mate-
rial (increase of 25 MPa over 100% plastic strain) was
done. The calculated curve, although possessing the same
Py, lies well below the other ones obtained with the
strain-hardening materials. So it can be concluded that
Py is only affected by the yield stress of the material.
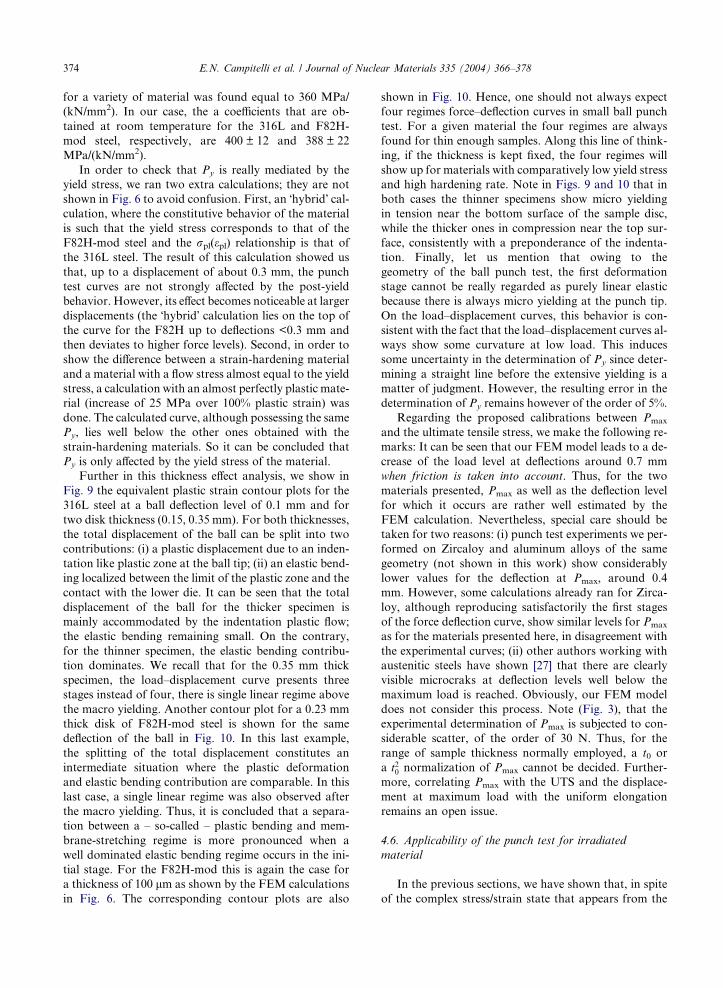
Further in this thickness effect analysis, we show in
Fig. 9 the equivalent plastic strain contour plots for the
316L steel at a ball deflection level of 0.1 mm and for
two disk thickness (0.15, 0.35 mm). For both thicknesses,
the total displacement of the ball can be split into two
contributions: (i) a plastic displacement due to an inden-
tation like plastic zone at the ball tip; (ii) an elastic bend-
ing localized between the limit of the plastic zone and the
contact with the lower die. It can be seen that the total
displacement of the ball for the thicker specimen is
mainly accommodated by the indentation plastic flow;
the elastic bending remaining small. On the contrary,
for the thinner specimen, the elastic bending contribu-
tion dominates. We recall that for the 0.35 mm thick
specimen, the load–displacement curve presents three
stages instead of four, there is single linear regime above
the macro yielding. Another contour plot for a 0.23 mm
thick disk of F82H-mod steel is shown for the same
deflection of the ball in Fig. 10. In this last example,
the splitting of the total displacement constitutes an
intermediate situation where the plastic deformation
and elastic bending contribution are comparable. In this
last case, a single linear regime was also observed after
the macro yielding. Thus, it is concluded that a separa-
tion between a – so-called – plastic bending and mem-
brane-stretching regime is more pronounced when a
well dominated elastic bending regime occurs in the ini-
tial stage. For the F82H-mod this is again the case for
a thickness of 100 lm as shown by the FEM calculations
in Fig. 6. The corresponding contour plots are also
shown in Fig. 10. Hence, one should not always expect
four regimes force–deflection curves in small ball punch
test. For a given material the four regimes are always
found for thin enough samples. Along this line of think-
ing, if the thickness is kept fixed, the four regimes will
show up for materials with comparatively low yield stress
and high hardening rate. Note in Figs. 9 and 10 that in
both cases the thinner specimens show micro yielding
in tension near the bottom surface of the sample disc,
while the thicker ones in compression near the top sur-
face, consistently with a preponderance of the indenta-
tion. Finally, let us mention that owing to the
geometry of the ball punch test, the first deformation
stage cannot be really regarded as purely linear elastic
because there is always micro yielding at the punch tip.
On the load–displacement curves, this behavior is con-
sistent with the fact that the load–displacement curves al-
ways show some curvature at low load. This induces
some uncertainty in the determination of Py since deter-
mining a straight line before the extensive yielding is a
matter of judgment. However, the resulting error in the
determination of Py remains however of the order of 5%.
Regarding the proposed calibrations between Pmaxand the ultimate tensile stress, we make the following re-
marks: It can be seen that our FEM model leads to a de-
crease of the load level at deflections around 0.7 mm
when friction is taken into account. Thus, for the two
materials presented, Pmax as well as the deflection level
for which it occurs are rather well estimated by the
FEM calculation. Nevertheless, special care should be
taken for two reasons: (i) punch test experiments we per-
formed on Zircaloy and aluminum alloys of the same
geometry (not shown in this work) show considerably
lower values for the deflection at Pmax, around 0.4
mm. However, some calculations already ran for Zirca-
loy, although reproducing satisfactorily the first stages
of the force deflection curve, show similar levels for Pmaxas for the materials presented here, in disagreement with
the experimental curves; (ii) other authors working with
austenitic steels have shown [27] that there are clearly
visible microcraks at deflection levels well below the
maximum load is reached. Obviously, our FEM model
does not consider this process. Note (Fig. 3), that the
experimental determination of Pmax is subjected to con-
siderable scatter, of the order of 30 N. Thus, for the
range of sample thickness normally employed, a t0 or
a t20 normalization of Pmax cannot be decided. Further-more, correlating Pmax with the UTS and the displace-
ment at maximum load with the uniform elongation
remains an open issue.
4.6. Applicability of the punch test for irradiated
material
In the previous sections, we have shown that, in spite
of the complex stress/strain state that appears from the
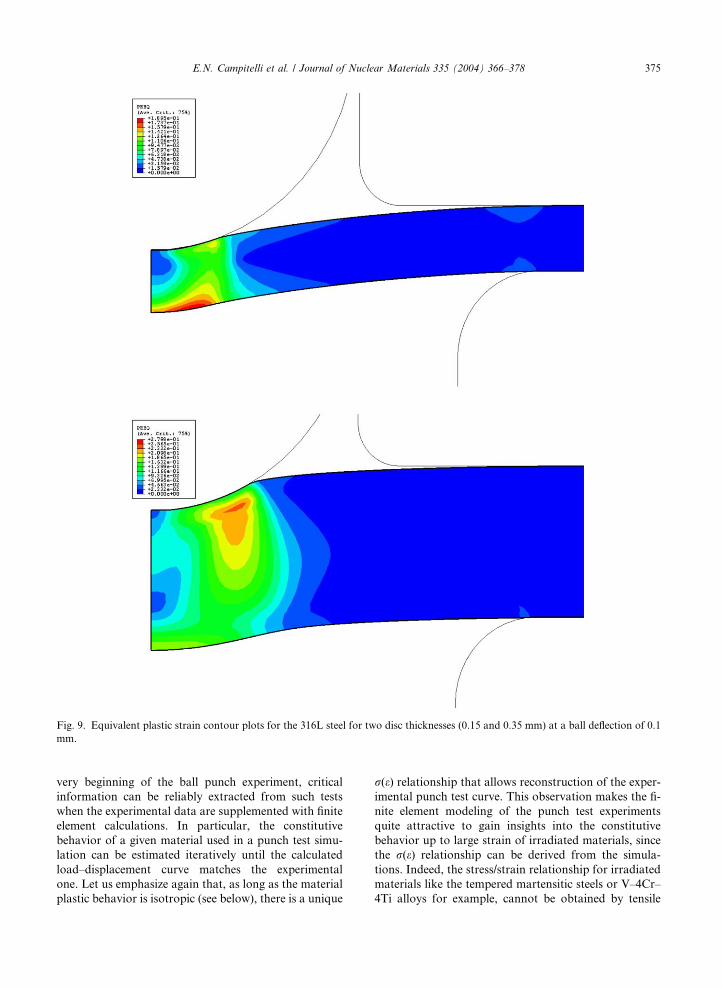
Fig. 9. Equivalent plastic strain contour plots for the 316L steel for two disc thicknesses (0.15 and 0.35 mm) at a ball deflection of 0.1
mm.
E.N. Campitelli et al. / Journal of Nuclear Materials 335 (2004) 366–378 375
very beginning of the ball punch experiment, critical
information can be reliably extracted from such tests
when the experimental data are supplemented with finite
element calculations. In particular, the constitutive
behavior of a given material used in a punch test simu-
lation can be estimated iteratively until the calculated
load–displacement curve matches the experimental
one. Let us emphasize again that, as long as the material
plastic behavior is isotropic (see below), there is a unique
r(e) relationship that allows reconstruction of the exper-imental punch test curve. This observation makes the fi-
nite element modeling of the punch test experiments
quite attractive to gain insights into the constitutive
behavior up to large strain of irradiated materials, since
the r(e) relationship can be derived from the simula-
tions. Indeed, the stress/strain relationship for irradiated
materials like the tempered martensitic steels or V–4Cr–
4Ti alloys for example, cannot be obtained by tensile
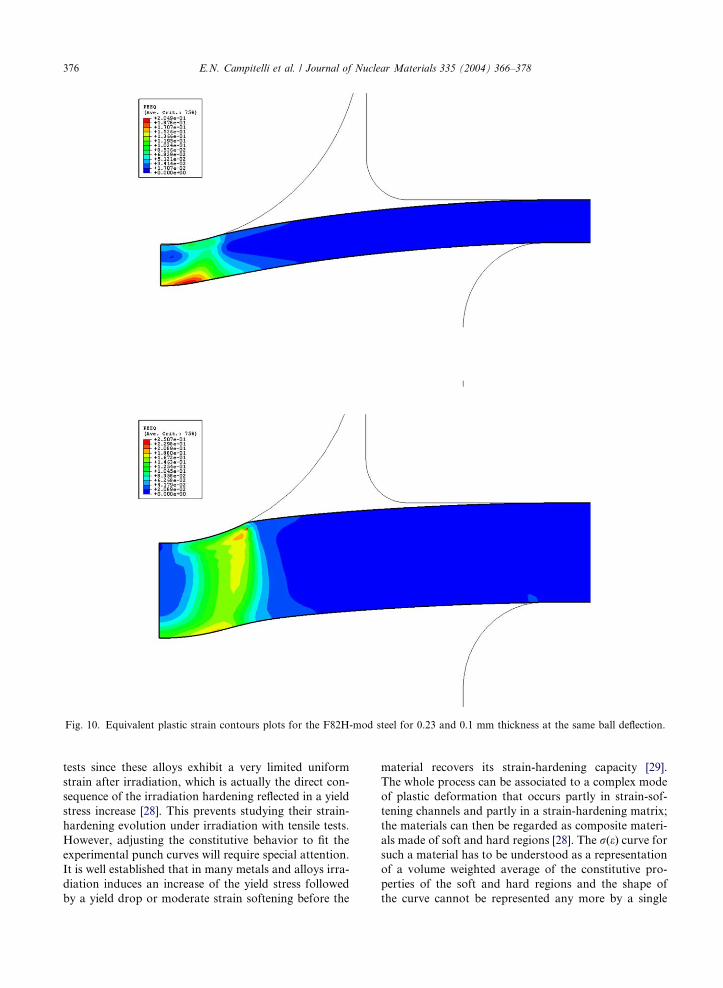
Fig. 10. Equivalent plastic strain contours plots for the F82H-mod steel for 0.23 and 0.1 mm thickness at the same ball deflection.
376 E.N. Campitelli et al. / Journal of Nuclear Materials 335 (2004) 366–378
tests since these alloys exhibit a very limited uniform
strain after irradiation, which is actually the direct con-
sequence of the irradiation hardening reflected in a yield
stress increase [28]. This prevents studying their strain-
hardening evolution under irradiation with tensile tests.
However, adjusting the constitutive behavior to fit the
experimental punch curves will require special attention.
It is well established that in many metals and alloys irra-
diation induces an increase of the yield stress followed
by a yield drop or moderate strain softening before the
material recovers its strain-hardening capacity [29].
The whole process can be associated to a complex mode
of plastic deformation that occurs partly in strain-sof-
tening channels and partly in a strain-hardening matrix;
the materials can then be regarded as composite materi-
als made of soft and hard regions [28]. The r(e) curve forsuch a material has to be understood as a representation
of a volume weighted average of the constitutive pro-
perties of the soft and hard regions and the shape of
the curve cannot be represented any more by a single
E.N. Campitelli et al. / Journal of Nuclear Materials 335 (2004) 366–378 377
relationship of the type of the Eq. (2). Therefore, adjust-
ing the r(e) curve to reconstruct the punch curve of irra-diated materials is a more complicated task than just
adjusting the parameters of the Eq. (3) and the slope
of the stage IV but the strain-softening domain after
the yield stress and the strain-hardening that follows
after a certain amount of strain have to be taken into ac-
count. Owing to this more complex nature of the plastic
flow properties in the irradiated material than in the
unirradiated one and to the many parameters to be fit-
ted, it is anticipated that additional testing is necessary
if the constitutive behavior at large strain has to be
established in a reliable manner. Typically, for irradiated
materials compression tests could be used to get the con-
stitutive behavior from low to moderate strains. Let us
finally mention that, if only the irradiation hardening
has to be measured (increase of the yield stress), the
calibration between Py=t20 and r0.2 done on the unir-radiated materials can still be used for the irradiated
materials since it was shown to be post-yield behavior
independent.
Regarding the assessment of the constitutive behav-
ior for anisotropic materials like zirconium or titanium
alloys, it will be shown in a continuation of this article
that the punch test force–deflection curve does not fol-
low uniquely from a given constitutive behavior, since
it is then possible to vary simultaneously the parameters
that model the hardening and the anisotropy in such a
way that the correct force deflection curve (up to the
experimental error) is reproduced for more than one
set of these parameters. However, in this case it is possi-
ble to complement the punch tests with other kind of
non-standard tests in order to reduce further the choice
of parameters that are able at reproducing both experi-
ments at the same time.
5. Concluding statements
Small ball punch tests and tensile tests have been car-
ried out at room temperature on a 316L steel, as well as
on the F82H-mod tempered martensitic steel. In order
to extract the constitutive behavior from the ball punch
test, a finite element model has been developed and val-
idated. The effects of load-train compliance, of the yield
stress, of the post-yield behavior, of the specimen thick-
ness, of the ball-specimen friction have been investi-
gated in details. The results can be summarized as
follows:
(i) Significant differences in the tensile behavior of the
two steels were found. The yield stress of the
F82H-mod steel is larger (532 MPa) than that of
the 316L steel (388 MPa) but the uniform elonga-
tion is much lower for the F82H-mod (5%) than
for the 316L (37%).
(ii) The finite element model for the small ball punch
test was validated with the 316L steel because the
constitutive behavior determined by tensile tests
allows calculations up to a relatively large displace-
ment of the ball, about 0.4 mm, without introduc-
ing additional assumption on the constitutive
behavior. Indeed, at such a displacement, the
equivalent plastic strain in the disk remains below
40%, i.e., almost the same as the true uniform
strain.
(iii) The calculations showed that the load–displace-
ment compliance is not negligible and has to be
taken into account. Since the experimental curves
were obtained by measuring the displacement of
the testing machine crosshead, they had to be com-
pliance corrected before comparison with the cal-
culations. It is then desirable to avoid the
compliance correction by measuring the deflection
of the specimen with an extensometer touching the
bottom part of the disk. Furthermore, this is par-
ticularly important in the case irradiated materials
for which the post-yield behavior cannot be
obtained over a broad range of strains by tensile
tests and where an inverse methodology to deter-
mine the true stress–true strain relationship will
have to be used to reconstruct the punch test
load–displacement curve.
(iv) In order to calculate properly the entire punch
curves up to the maximum load, it was necessary
to consider a small friction effect between the ball
and the disk. The friction effect becomes apparent
only for displacement larger than 0.5 mm and is
reflected by an increase of load with respect to cal-
culation where no friction is considered.
(v) The overall shape of the punch curve was discussed
as a function of the specimen thickness and of the
constitutive behavior. Depending on the combina-
tion of these last two parameters, three or four
deformation stage could be identified. The shape
of the punch curve results from a combination of
the micro-indentation at the ball tip, elastic + plas-
tic bending and membrane stretching. The relative
contribution of these various processes as deforma-
tion proceeds actually controls the shape of the
curve.
(vi) Based upon calculated punch curves on different
thicknesses for both steels, the usual correlation
between the thickness normalized yield load value
Py=t20 of the punch experiment and the yield stresswas verified. However, it was demonstrated that
the entire curve cannot be normalized by Py=t20. Fur-thermore, we do not believe that correlating the
maximum load to the ultimate tensile stress is really
representative of a physical mechanism since the
averaged equivalent stress/strain state at maximum
load is totally different from that at necking.
378 E.N. Campitelli et al. / Journal of Nuclear Materials 335 (2004) 366–378
(vii) The punch test calculations of the F82H-mod steel
were found to match the experimental curve only
when using a stress–strain relationship whose
strain-hardening is separated into two stages that
can be phenomenologically described as a stage
III and IV. As a matter of fact, this is a typical
example of the potential of the punch test in eval-
uating the strain-hardening at large strain. By
extension of the technique to the irradiated mate-
rial, it is expected to get a reasonable assessment
of the strain-hardening behavior after irradiation
by adjusting a rpl(epl) curve in the input of the cal-culation, using an inverse methodology.
Acknowledgments
The financial support of Swiss Nuclear and EURA-
TOM, respectively, is acknowledged, also the technical
support of A. Kramer and the assistance of many col-
leagues at PSI for valuable suggestions and discussion
on the manuscript.
References
[1] W.R. Corwin, G.E. Lucas (Eds.), The Use of Small-scale
Specimens for Testing Irradiated Material ASTM-STP
888, American Society for Testing and Materials, Phila-
delphia, PA, 1986.
[2] G.E. Lucas, J. Nucl. Mater. 177 (1983) 327.
[3] P. Jung, A. Hishinuma, G.E. Lucas, H. Ullmaier, J. Nucl.
Mater. 232 (1996) 186.
[4] G.E. Lucas, G.R. Odette, M. Sokolov, P. Spatig, T.
Yamamoto, P. Jung, J. Nucl. Mater. 301–311 (2002) 1600.
[5] E. Fleury, J.S. Ha, Inter. J. Pressure Vessels Piping 75
(1998) 699.
[6] J.S. Ha, E. Fleury, Inter. J. Pressure Vessels Piping 75
(1998).
[7] A.N. Sinclair, O. Lepik, M. Gabbani, B. Mukherjee, E.
Alberti, in: W.R. Corwin, F.M. Haggag, W.L. Server
(Eds.), Small Specimen Test Techniques Applied to
Nuclear Reactor Vessel Thermal Annealing and Plant Life
Extension, ASTM STP 1204, American Society for Testing
and Materials, Philadelphia, PA, 1993, p. 162.
[8] Y. Ruan, P. Spatig, M. Victoria, J. Nucl. Mater. 307–311
(2002) 236.
[9] X. Mao, H. Takahashi, J. Nucl. Mater. 150 (1987) 42.
[10] J. Kameda, X. Mao, J. Mater. Sci. 27 (1992) 983.
[11] J. Lee, I. Kim, A. Kimura, J. Nucl. Sci. Technol. 40 (2003)
664.
[12] P. Fernandez, et al., J. Nucl. Mater. 307–311 (2002)
495.
[13] A. Hishinuma, A. Kohyama, R.L. Klueh, D.S. Gelles, W.
Dietz, K. Ehrlich, J. Nucl. Mater. 258–263 (1998) 193.
[14] R. Bonade et al., to be published.
[15] A. Olza, F. Taillard, E. Vautravers, J.C. Diethelm, Tables
Numeriques et Formulaires, Ed. SPES, 1978, p. 243.
[16] G.E. Lucas, A. Okada, M. Kiritani, J. Nucl. Mater. 141–
143 (1986) 632.
[17] M. Toloczko, K. Abe, M.L. Hamilton, F.A. Garner, R.
Kurtz, Mater. Trans. JIM 41 (2000) 1356.
[18] C. Sainte Catherine, J. Messier, C. Poussard, S. Rosinski,
J. Foulds, in: M.A. Sokolov, J.D. Landes, G.E. Lucas,
(Eds.), Small Specimen Test Technique, vol. 4, ASTM STP
1418, American Society for Testing and Materials, West
Conshohoken PA, 2002, p. 350.
[19] R. Bonade, P. Spatig, R. Schaublin, M. Victoria, MSE A,
in press.
[20] R. Bonade, P. Spatig, M. Victoria, T. Yamamoto, G.R.
Odette, J. Nucl. Mater. 329–333 (2004) 278.
[21] U.F. Kocks, J. Eng. Mater. Tech. (ASM H) 98 (1976)
41.
[22] H. Mecking, U.F. Kocks, Acta Metall. 29 (1981) 1865.
[23] J. Gil-Sevillano, E. Aernoudt, Mater. Sci. Eng. 86 (1987)
31.
[24] M. Zehetbauer, V. Seumer, Acta Metall. 41 (1993) 577.
[25] P.N.B. Anongba, J. Bonneville, J.-L. Martin, Acta Metall.
Mater. 41 (1993) 2897.
[26] X.F. Fang, W. Dahl, Mater. Sci. Eng. A 203 (1995)
14.
[27] M.P. Manahan, A.E. Browning, A.S. Argon, O.K. Har-
ling, in: W.R. Corwin, G.E. Lucas (Eds.), The Use of
Small-scale Specimens for Testing Irradiated Material,
ASTM-STP 888, American Society for Testing and Mate-
rials, Philadelphia, PA, 1986, p. 17.
[28] G.R. Odette, M.Y. He, E.G. Donahue, P. Spatig, T.
Yamamoto, J. Nucl. Mater. 307–311 (2002) 171.
[29] B.N. Singh, N.M. Ghoniem, H. Trinkaus, J. Nucl. Mater.
307–311 (2002) 159.
Copyright © 2022 FDOKUMEN