Comparison of the anisotropic behaviour of undeformed sandstones under dry and saturated conditions
20
Comparison of the anisotropic behaviour of undeformed sandstones under dry and saturated conditions Laurent Louis * , Christian David, Philippe Robion CNRS-UMR 7072 ‘‘Laboratoire de Tectonique’’, De ´partement des Sciences de la Terre et de l’Environnement, Universite ´ de Cergy Pontoise, Avenue du Parc-Le Campus-Bat. I, F-95031 Cergy-Pontoise, France Accepted 31 March 2003 Abstract This article presents a systematic analysis of the anisotropic behaviours of the Bentheim and Rothbach sandstones using ultrasonic P-wave velocity, electrical conductivity and magnetic susceptibility measurements. For each sandstone, the data were obtained from three core samples drilled perpendicularly to each other and tested in dry- and water-saturated conditions. For acoustic and magnetic investigations, the same statistical analysis was applied in order to present the data on comparable stereoplots. Surprisingly, the Bentheim sandstone which appeared homogeneous at macroscopic scale showed a stronger elastic and electrical anisotropy than the Rothbach sandstone in which cross-laminations were clearly identified, as confirmed by a sedimentary magnetic fabric. A discussion on the velocity contrasts between dry and saturated samples led us to consider two different origins for the observed anisotropies. First, by comparing electrical and acoustic properties in the Bentheim sandstone, we conclude that the nature of the anisotropic behaviour is linked to the anisotropy of pore shape: the inclusion model developed by Kachanov (Kachanov, M., 1993. Elastic solids with many cracks and related problems. Advances in Applied Mechanics, vol. 30. Academic Press, Boston, MA, pp. 259 – 445) accounts for our observations if one considers that the pore space is made of parallel flat pores with moderate pore aspect ratio. Second, acoustic, electrical and magnetic properties indicate that the observed anisotropy in the Rothbach sandstone can be attributed to the matrix, and more specifically to cementation: we modified the Dvorkin and Nur (Geophysics 61 (5) (1996) 1363) model of cemented granular media by introducing a spatially variable contact length, and the model suggests that a very small variability of cemented contact length is enough to account for the observed P-wave velocity anisotropy. We emphasise the fact that combining several kinds of measurements is of great help in capturing the nature of the anisotropic behaviour of porous rocks. D 2003 Elsevier B.V. All rights reserved. Keywords: Anisotropic behaviour; Bentheim sandstone; Rothbach sandstone 1. Introduction The anisotropic behaviour of rocks with respect to a particular physical property (elasticity, magnetic susceptibility, electrical conductivity, permeability) is often determined by both matrix and pore space distributions (Lo et al., 1986). Such information is of great importance not only for inferring the micro- structural characteristics of a reservoir, but also for understanding weak deformations in sedimentary rocks. The matrix (or solid phase) of a rock can be 0040-1951/03/$ - see front matter D 2003 Elsevier B.V. All rights reserved. doi:10.1016/S0040-1951(03)00186-0 * Corresponding author. E-mail address: [email protected] (L. Louis). www.elsevier.com/locate/tecto Tectonophysics 370 (2003) 193– 212
Transcript of Comparison of the anisotropic behaviour of undeformed sandstones under dry and saturated conditions

www.elsevier.com/locate/tecto
Tectonophysics 370 (2003) 193–212
Comparison of the anisotropic behaviour of undeformed sandstones
under dry and saturated conditions
Laurent Louis*, Christian David, Philippe Robion
CNRS-UMR 7072 ‘‘Laboratoire de Tectonique’’, Departement des Sciences de la Terre et de l’Environnement, Universite de Cergy Pontoise,
Avenue du Parc-Le Campus-Bat. I, F-95031 Cergy-Pontoise, France
Accepted 31 March 2003
Abstract
This article presents a systematic analysis of the anisotropic behaviours of the Bentheim and Rothbach sandstones using
ultrasonic P-wave velocity, electrical conductivity and magnetic susceptibility measurements. For each sandstone, the data were
obtained from three core samples drilled perpendicularly to each other and tested in dry- and water-saturated conditions. For
acoustic and magnetic investigations, the same statistical analysis was applied in order to present the data on comparable
stereoplots. Surprisingly, the Bentheim sandstone which appeared homogeneous at macroscopic scale showed a stronger elastic
and electrical anisotropy than the Rothbach sandstone in which cross-laminations were clearly identified, as confirmed by a
sedimentary magnetic fabric. A discussion on the velocity contrasts between dry and saturated samples led us to consider two
different origins for the observed anisotropies. First, by comparing electrical and acoustic properties in the Bentheim sandstone,
we conclude that the nature of the anisotropic behaviour is linked to the anisotropy of pore shape: the inclusion model
developed by Kachanov (Kachanov, M., 1993. Elastic solids with many cracks and related problems. Advances in Applied
Mechanics, vol. 30. Academic Press, Boston, MA, pp. 259–445) accounts for our observations if one considers that the pore
space is made of parallel flat pores with moderate pore aspect ratio. Second, acoustic, electrical and magnetic properties indicate
that the observed anisotropy in the Rothbach sandstone can be attributed to the matrix, and more specifically to cementation: we
modified the Dvorkin and Nur (Geophysics 61 (5) (1996) 1363) model of cemented granular media by introducing a spatially
variable contact length, and the model suggests that a very small variability of cemented contact length is enough to account for
the observed P-wave velocity anisotropy. We emphasise the fact that combining several kinds of measurements is of great help
in capturing the nature of the anisotropic behaviour of porous rocks.
D 2003 Elsevier B.V. All rights reserved.
Keywords: Anisotropic behaviour; Bentheim sandstone; Rothbach sandstone
1. Introduction
The anisotropic behaviour of rocks with respect to
a particular physical property (elasticity, magnetic
0040-1951/03/$ - see front matter D 2003 Elsevier B.V. All rights reserve
doi:10.1016/S0040-1951(03)00186-0
* Corresponding author.
E-mail address: [email protected] (L. Louis).
susceptibility, electrical conductivity, permeability) is
often determined by both matrix and pore space
distributions (Lo et al., 1986). Such information is
of great importance not only for inferring the micro-
structural characteristics of a reservoir, but also for
understanding weak deformations in sedimentary
rocks. The matrix (or solid phase) of a rock can be
d.

L. Louis et al. / Tectonophysics 370 (2003) 193–212194
anisotropic because of layering or preferred mineral
orientation, associated, for example, with magmatic
flow in igneous rocks, water current during deposition
in sedimentary rocks, mineral growth or pressure
solution in response to an anisotropic stress field.
The pore space distribution can be anisotropic because
of the sedimentation processes controlled by gravity
which often result in transversely isotropic rock for-
mations, depositional processes driven by water cur-
rents, and the presence of preferentially oriented
cracks within or between the minerals. In the latter
case, the cracks appear mainly following nonisotropic
stress conditions or in the course of loading/unloading
episodes.
Rock anisotropy has been the object of extensive
laboratory investigation. Many studies have focused
on the seismic or elastic anisotropy of a wide range of
different rocks from sandstones (King, 1965) to
amphibolite (Kern et al., 1997) and other mantle
material (Mainprice et al., 2000), at different scales
(Crampin and Booth, 1985) and under different pres-
sure and temperature conditions (Kern, 1993). The
anisotropy of magnetic susceptibility has long been
used to analyse the rock fabric in sedimentary and
tectonic settings (Hrouda, 1982; Tarling and Hrouda,
1993; Borradaile and Henry, 1997). Transport proper-
ties like permeability and electrical conductivity are
also well-known anisotropic rock properties (Gueguen
and Palciauskas, 1994). Whereas many papers have
focused on one specific aspect of the rock anisotropy,
very little has been done so far to conduct integrated
studies in order to compare the rock anisotropy for
various properties. Such an integrated study could be
helpful in discriminating between the possible sources
for the anisotropic behaviour of the rock.
On the modelling side, numerous theoretical mod-
els of effective media have been developed for elastic
and acoustic properties, based on the assumption that
the wavelength is very long with respect to the
heterogeneity of the investigated material so that the
medium may be considered as homogeneous. For
example, the Hashin–Shtrickman bounds define the
theoretical limits of effective bulk and shear moduli
from the knowledge of the moduli and volume frac-
tion of each constituent (Hashin and Shtrickman,
1963). The effect of porosity is taken into account
in models derived from scattering theory analysis
(Kuster and Toksoz, 1974; Hudson, 1981). However,
these models involve some assumptions that are not
compatible with anisotropic rocks containing voids
with high aspect ratios (say between 0.5 and 1). For
example, Hudson’s model is valid only for very small
aspect ratios. To account for anisotropy, another
model originally proposed by Eshelby (1957) and
later developed by Cheng (Cheng and Toksoz, 1979;
Cheng, 1993) allows for the calculation of the full
stiffness tensor in the case of ellipsoidal inclusions of
arbitrary aspect ratio within an isotropic matrix. More
realistic models of reservoir rocks start from granular
mechanics and describe both uncemented materials
(Mindlin, 1949; Digby, 1981; Walton, 1987; Mavko et
al., 1995) and cemented materials (Dvorkin et al.,
1991, 1994; Dvorkin and Nur, 1996). However, these
models have not been developed to predict the aniso-
tropic behaviour for the acoustic and elastic proper-
ties.
In the present study, we measured several physical
properties (magnetic susceptibility, electrical conduc-
tivity and P-wave velocity) on two undeformed sand-
stones under dry and wet conditions. The experimental
study focuses on the anisotropic behaviour with the
aim of extracting from a comprehensive data set the
sources of anisotropy. For this purpose, a method is
proposed to present and analyse the data in the same
statistical and graphical way for the different kinds of
measurements. We show, for example, that by saturat-
ing the samples, we can distinguish between matrix-
related and void-related anisotropy by comparing dry
and saturated acoustic measurements. Because the two
sandstones show very different behaviours, two differ-
ent models are used to account for the experimental
data: an inclusion model (Kachanov, 1993) and a
cemented granular model (Dvorkin and Nur, 1996).
We emphasise that comparing several rock properties
can be very useful to characterise the sources of
anisotropy in reservoir rocks.
2. Description of the experiments
2.1. Testing material
To conduct our study, we selected two sandstones
which appear very different at first sight. The Ben-
theim sandstone is a quartz-rich sandstone sampled in
the Romberg quarry in Germany. It is the reservoir

L. Louis et al. / Tectonophysics 370 (2003) 193–212 195
sandstone of the onshore Schonebeek oilfield which is
part of the lower Cretaceous. This yellowish sand-
stone looks very homogeneous and is used as building
material. Mechanical experiments (Klein et al., 2001)
and petrologic analyses (Van Bareen et al., 1990) have
already been carried out on it. The second sandstone,
the Rothbach sandstone, from a quarry in the Vosges
mountains, eastern France, is a reddish Triassic sand-
stone, probably deposited in channel conditions as we
observe cross-laminations of about 1 cm height. The
presence of these laminations makes the Rothbach
sandstone look heterogeneous and anisotropic, with a
bedding clearly visible in the block. Permeability and
deformation studies on the Rothbach sandstone have
been carried out by David et al. (1994), Wong et al.
(1997) and Zhu and Wong (1997). Table 1 gives the
main petrophysical properties of both sandstones
(porosity, mean grain size and composition). As we
were interested in studying the anisotropic behaviour
of reservoir rocks, our choice was dictated by the
structural contrast between the sandstones. We
expected the Bentheim sandstone to be fairly isotropic
and the Rothbach sandstone to be significantly aniso-
tropic. The experimental results revealed a slightly
different picture.
2.2. Sample preparation
The best way to evaluate the anisotropy of any
physical property in the laboratory is to work on rock
samples with a spherical shape (Vickers and Thill,
1969; Hrouda et al., 1993) in order to avoid uncer-
tainties due to rock heterogeneity between multiple
Table 1
Main petrographical characteristics of the two sandstones
Porosity (%) Grain radius
(mm)
Mineralogy
Bentheim 24.5F 0.18 0.1–0.3 Quartz 95%
sandstone Kaolinite 3%
Feldspar 2%
Rothbach 21.7F 0.83 0.23 Quartz 68%
sandstone Feldspar 16%
Oxides and mica 3%
Clays (mostly illite)
f 12%
For the Bentheim sandstone, the mineralogical content was obtained
by X-ray diffraction (Van Bareen et al., 1990), and for the Rothbach
sandstone by thin-section analysis (Wong et al., 1997).
samples and to present always the same shape to the
measuring apparatus (geometry of contact, constant
volume or distance of investigation). However, due to
the difficulty of machining spheres from a block, it is
generally easier to work on cylindrical cores. In the
latter case, the optimal conditions only occur in the
plane perpendicular to the core axis (i.e. across
diameters): this makes, however, the dimension of
the problem fall to 2. Despite this limitation, the ease
of obtaining such a shape and its relevance with
regards to several kinds of measurements (magnetic
susceptibility, electrical conductivity, acoustic veloc-
ities) led us to work on cylinders. As our goal was to
study the spatial variations of rock properties in three
dimensions, we drilled in each block three samples in
orthogonal directions: one perpendicular to the bed-
ding and two within the bedding plane (the Bentheim
sandstone block was oriented in the field). As shown
in Fig. 1, samples are oriented with respect to the
block and to the bedding: the X and Y samples have
their core axis within the bedding plane whereas the Z
sample is perpendicular to it. The size of the drilled
cylinders is approximately 22.5 mm long� 25 mm
diameter which corresponds to the standard for the
measurement of magnetic susceptibility in our labo-
ratory. In a recent paper, Owens (2000) pointed out
the importance of using a well-designed measurement
design in order not to propagate and amplify statistical
errors. We have verified numerically that our design
showed in Fig. 1 gives accurate results since our
spatial distribution of oriented measurements is
improved with respect to the cases examined by
Owens (2000) in his paper. Some measurements were
done both on dry- and water-saturated samples. The
saturation is obtained by applying a primary vacuum
on samples in balance on top of a beaker filled with
water. Once the air is evacuated, samples are toppled
into the beakers. Porosity is calculated from the
weight of dry and saturated samples, and from the
apparent weight of samples immersed in water.
2.3. Acoustic velocity
The experimental device for the acoustic measure-
ments includes an ultrasonic pulse generator Pana-
metrics 5058 PR with a maximum output voltage up
to 900 V, several sets of ultrasonic P-wave transducers
of 1-MHz resonance frequency, and a numerical

Fig. 1. (a) Orientation of the three sampled elements. The bedding plane for each rock corresponds to the XYplane. (b) Stereographic plot (equal
area, lower hemispheric projection) of the 21 measured positions. Eight directions of measurement were chosen in each plane (XY, XZ, YZ).
The overlapping symbols show the directions which are common for each subset of two samples.
L. Louis et al. / Tectonophysics 370 (2003) 193–212196
oscilloscope HP54603B connected to a PC for data
acquisition and analysis. We could not study the
propagation of S-waves because the length of the
travel path in our samples was too small to be able
to discriminate accurately the S-wave arrival from the
P-wave signal: therefore, only P-wave velocity meas-
urements are available for the present study.
We measure the time of flight for acoustic waves
travelling from the transmitter to the receiver across
eight different diameters with an angular offset of
22.5j between each measurement. Taking into
account the error on the travel time readings on the
oscilloscope (which depends on the quality of the
signals) and the error on sample length, the standard
error for the measurements on dry samples is F 0.03
km s� 1, and F 0.02 km s� 1 for the measurements on
water-saturated samples. For the three orthogonal
samples, only 21 measurements out of the total 24
are independent because each sample has two com-
mon geographical directions with the others (Fig. 1).
We take advantage of these redundant directions to
‘‘level’’ the measured values in order to correct for the
small nonreproducibility of the measurements from
sample to sample, a well-known problem in rock
physics due to small-scale heterogeneity (Bourbie et
al., 1987). The levelling operation is the first stage of
treatment: it consists in slightly shifting the whole
data set for two samples so that common directions of
measurement give a common value of velocity. After
this procedure, we can virtually consider that all the
measurements have been made on a single sample.
In order to compare properly data obtained from
different kinds of measurements, a program was
written with Scilab (a free scientific software package
for numerical computations) that outputs equal-area
lower hemispheric stereoplots showing the directional
variation of any investigated physical property.
Assuming that the spatial variation of the amplitude
for all the physical properties investigated in this
study maps out an ellipsoid (which is rigorously true
for any second order symmetric tensor), we calculate
the principal axes of the ellipsoid with the following
procedure. The general equation for an arbitrary
ellipsoid in the Oxyz system of coordinates can be
defined by the equation
Ax2 þ By2 þ Cz2 þ Dxyþ Exzþ Fyz ¼ 1 ð1Þ
which alternatively can also be written as:
ð x y z Þ �
A D=2 E=2
D=2 B F=2
E=2 F=2 C
0BBBB@
1CCCCA
�
x
y
z
0BBBB@
1CCCCA
¼ 1
ð2Þ
To estimate the parameters A to F, we need at least
six independent measurements. Using the 24 avail-
able values from our measurements on all three
0BBBB@
L. Louis et al. / Tectonophysics 370 (2003) 193–212 197
oriented samples, the six parameters needed to define
the ellipsoid are then calculated with a least square
method. For an arbitrary number k of velocity
measurements!Vi with direction given by the unit
vector !ui (li, mi, ni), Eq. (1) leads to the following
system:
l21 m21 n21 l1m1 l1n1 m1n1
] ] ] ] ] ]
l2k m2k n2k lkyk lknk mknk
1CCCCA
�
A
B
C
D
E
F
0BBBBBBBBBBBBBBBB@
1CCCCCCCCCCCCCCCCA
¼
1=V 21
]
1=V 2k
0BBBB@
1CCCCA
ð3Þ
Let Q be the left-hand-side matrix, P the parameter
vector and W the inverse squared velocity vector. P
is estimated in the least square sense by:
P ¼ ðtQ �QÞ�1 � ðtQ �WÞ ð4Þ
In the last step, the parameters in P are replaced in
the square matrix in Eq. (2) which is then diagonal-
ized to give the three principal axes of the ellipsoid.
To calculate the confidence region around each
principal axis, we followed the Hext (1963) method.
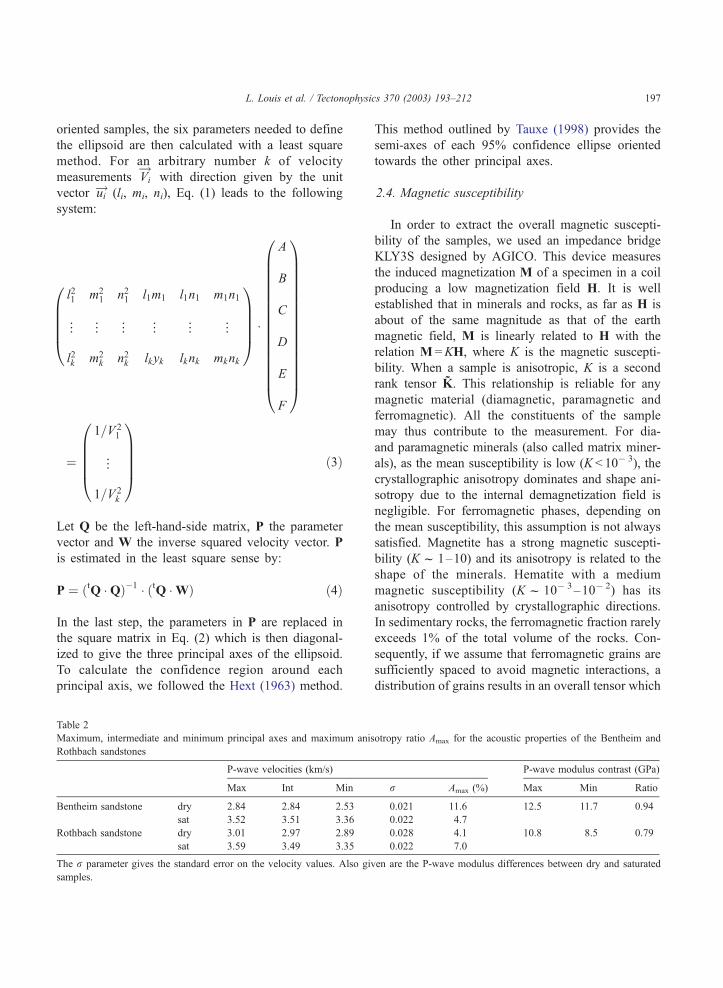
Table 2
Maximum, intermediate and minimum principal axes and maximum anis
Rothbach sandstones
P-wave velocities (km/s)
Max Int Min
Bentheim sandstone dry 2.84 2.84 2.53
sat 3.52 3.51 3.36
Rothbach sandstone dry 3.01 2.97 2.89
sat 3.59 3.49 3.35
The r parameter gives the standard error on the velocity values. Also giv
samples.
This method outlined by Tauxe (1998) provides the
semi-axes of each 95% confidence ellipse oriented
towards the other principal axes.
2.4. Magnetic susceptibility
In order to extract the overall magnetic suscepti-
bility of the samples, we used an impedance bridge
KLY3S designed by AGICO. This device measures
the induced magnetization M of a specimen in a coil
producing a low magnetization field H. It is well
established that in minerals and rocks, as far as H is
about of the same magnitude as that of the earth
magnetic field, M is linearly related to H with the
relation M =KH, where K is the magnetic suscepti-
bility. When a sample is anisotropic, K is a second
rank tensor K. This relationship is reliable for any
magnetic material (diamagnetic, paramagnetic and
ferromagnetic). All the constituents of the sample
may thus contribute to the measurement. For dia-
and paramagnetic minerals (also called matrix miner-
als), as the mean susceptibility is low (K < 10� 3), the
crystallographic anisotropy dominates and shape ani-
sotropy due to the internal demagnetization field is
negligible. For ferromagnetic phases, depending on
the mean susceptibility, this assumption is not always
satisfied. Magnetite has a strong magnetic suscepti-
bility (Kf 1–10) and its anisotropy is related to the
shape of the minerals. Hematite with a medium
magnetic susceptibility (Kf 10� 3–10� 2) has its
anisotropy controlled by crystallographic directions.
In sedimentary rocks, the ferromagnetic fraction rarely
exceeds 1% of the total volume of the rocks. Con-
sequently, if we assume that ferromagnetic grains are
sufficiently spaced to avoid magnetic interactions, a
distribution of grains results in an overall tensor which
otropy ratio Amax for the acoustic properties of the Bentheim and
P-wave modulus contrast (GPa)
r Amax (%) Max Min Ratio
0.021 11.6 12.5 11.7 0.94
0.022 4.7
0.028 4.1 10.8 8.5 0.79
0.022 7.0
en are the P-wave modulus differences between dry and saturated

L. Louis et al. / Tectonophysi198
is the sum of all the grain susceptibility tensors. To
measure anisotropy of magnetic susceptibility (AMS)
tensor, we applied a magnetic field in a given direc-
tion and measured the magnetization in the same
direction. Repeating this procedure in several direc-
tions gives rise to the full AMS tensor K. In order to
apply the same protocol as for acoustic measurements,
AMS is investigated in manual mode along three
orthogonal planes.
Fig. 2. Top: Velocity stereoplot in the dry Bentheim sandston
2.5. Electrical conductivity
Electrical measurements are performed with a
Radiometer CD210 conductimeter. The conductivities
can only be measured along the axis of the core
samples which are saturated successively with four
brines (NaCl solutions) with increasing conductivity
from nearly 0 to 3 S/meter. Following the procedure
given by David et al. (1993), the formation factor F
cs 370 (2003) 193–212
e. Bottom: Data and fit curves in samples X, Y and Z.

L. Louis et al. / Tectonophysics 370 (2003) 193–212 199
and the internal surface conductivity rs are calculated
by a linear regression on the plot of the saturated rock
conductivity rr as a function of the brine conductivity
rw (Fig. 9) according to the relation:
rr ¼1
Frw þ rs ð5Þ
Electrical conduction in brine-saturated rocks is con-
trolled by the geometry of the pore space: therefore,
Fig. 3. Top and bottom: Same as Fig. 2 fo
measuring the electrical conductivity in reservoir
rocks gives valuable information on the pore network,
but none on the solid phase. Indeed, the electrical
conductivity of the solid phase in reservoir rocks can
virtually be considered to be negligible compared to
the brine conductivity when the rocks are saturated
with a polar fluid like water or ion-rich aqueous
solutions. If the measurements reveal that the forma-
tion factor is anisotropic, this can without much doubt
r the saturated Bentheim sandstone.

L. Louis et al. / Tectonophysics 370 (2003) 193–212200
be associated with geometrical features within the
pore space as will be discussed later. However, one
has to consider also that anisotropic distributions of
conductive minerals such as clays, for example, would
also lead to formation factor anisotropy.
Fig. 4. Top: Stereoplot of the velocity difference between saturated and
Velocity difference and fit curves in the three samples X, Y and Z.
3. Experimental results
We present here the data obtained for Bentheim
and Rothbach sandstones: acoustic velocities in dry
and wet conditions measured on diameters, electrical
dry conditions (C parameter) in the Bentheim sandstone. Bottom:

L. Louis et al. / Tectonophysics 370 (2003) 193–212 201
conductivity along the core axes and magnetic sus-
ceptibility.
3.1. Acoustic measurements
Velocity measurements on dry and saturated sam-
ples are presented in Figs. 2–7, and the data are given
Fig. 5. Top and bottom: Same as Fig. 2
in Table 2. Notice that the range on the vertical axes for
both kinds of plots (absolute velocity and velocity dif-
ference) was kept constant for the Bentheim and the
Rothbach data plots, so that the anisotropy can easily be
compared from one sandstone to the other. Fig. 2 shows
the velocities measured in dry Bentheim sandstone. It
first can be seen on the stereoplot that maximum
for the dry Rothbach sandstone.

L. Louis et al. / Tectonophysics 370 (2003) 193–212202
velocities scatter in a subhorizontal plane, while the
minimum velocity axis stands vertical. Such a stereo-
plot can be described as a sedimentary fabric. Hrouda et
al. (1993) observed quite similar elastic behaviour in
unstrained sedimentary rocks and simply deduced that
the stiffness was weaker perpendicularly to the bedding
because of an anisotropy in the grain contacts distribu-
Fig. 6. Top and bottom: Same as Fig. 2 fo
tion. Microcracks appeared during unloading (erosion
and uplift) or sedimentary micropores could also gen-
erate this kind of anisotropy. Indeed, simple elastic
models of ellipsoidal weak material inclusions
(Eshelby, 1957; Walsh, 1965; Hudson, 1981) always
anticipate a maximum stiffness in the direction of
largest semi-axes. We also show the velocity data as a
r the saturated Rothbach sandstone.

L. Louis et al. / Tectonophysics 370 (2003) 193–212 203
function of azimuth for the three orthogonal samples.
The three superimposed curves are as follows: the
mean square ellipse calculated in the measurement
plane; the mean square ellipsoid projected back on
the plane; and the fitting curve from Thomsen (1986)
that allows an additional sin4h component in the
azimuth dependence that is consistent with the solu-
Fig. 7. Top and bottom: Same as Fig.
tions of the wave equation given by Love (1927).
Anisotropy is here obvious and surprisingly quite
intense (about 10%): such a behaviour was unexpected
in view of the homogeneous macroscopic aspect of the
sandstone. The data are in excellent agreement with the
three mathematical models used to describe anisotropy
except for sample Z in which the observed variations
4 for the Rothbach sandstone.

L. Louis et al. / Tectonophysics 370 (2003) 193–212204
are comparable to the experimental error bar. The
Thomsen fitting curves give the best result in all the
cases. Since the principal velocity values are identical
in the plane perpendicular to the Z sample core axis and
significantly larger than the velocity along the Z axis
(Table 2), the Bentheim sandstone can be considered as
transversely isotropic. The results for the saturated
Bentheim sandstone are presented in Fig. 3. As
expected, the P-wave velocity of the water-saturated
samples is higher than for the dry samples (about 25%
increase). Interestingly while the ‘stiffness fabric’
remains almost the same, the velocity anisotropy de-
creases significantly. Indeed the anisotropy of the
water-saturated samples is only about half of that of
the dry samples. It can be observed on the stereoplot
that after water saturation, data scatter gently. To further
analyse the velocity changes, we calculated for each
sample the velocity difference between saturated and
dry samples. This difference depends on the azimuth
angle hwithin the measuring plane. Let us call C(h) thevelocity difference Vp
sat�Vpdry. We can apply the same
statistical procedure as for the velocity in order to
determine the anisotropy of the C parameter. Fig. 4
shows the evolution of C(h) and the resulting stereo-
plot. We can see that the vertical direction in which the
velocity is the lowest suffered a greater increase in ve-
locity than in horizontal directions, in agreement with
the decrease of the anisotropy ratio already mentioned.
Fig. 8. AMS stereoplots for the Bentheim (a
Results for the Rothbach sandstone are very differ-
ent. The anisotropy observed in dry samples is shown
in Fig. 5. Surprisingly, the anisotropy is considerably
weaker than expected, considering the stratified mac-
roscopic aspect of the Rothbach block. Taking into
account the experimental error, the plane defined by
the maximum and intermediate axes can be consid-
ered as isotropic. However, the data are only weakly
in agreement with ellipsoidal variations, the most
peculiar case being the Y sample that seems to vary
in half the ellipse wavelength. Saturating the samples
with water resulted in a very well defined orthotropic
fabric (see Fig. 6; Table 2). Unlike for Bentheim
sandstone, the maximum velocity axis is here almost
vertical, and we observe an increase by a factor 1.6 of
the anisotropy ratio compared to the dry sample. The
corresponding fitting curves show a good agreement
with the data. Whereas this fabric is quite different
from the one in Bentheim, the stereoplot for the Cparameter (Fig. 7) remains geometrically similar with
a maximum difference in the vertical direction, in
good agreement with the increase in anisotropy ratio
from dry to saturated.
3.2. Magnetic measurements
AMS is a measurement of induced magnetization in
all minerals and combines the contribution of diamag-
) and for the Rothbach (b) sandstones.

Table 3
Magnitude of the principal axes for the magnetic susceptibility
tensor, with standard error r
Magnetic susceptibility (10� 6) r
Max Int Min
Bentheim sandstone � 1.04 � 1.20 � 1.28 0.169
Rothbach sandstone 27.92 27.58 26.6 0.158
The Bentheim sandstone is diamagnetic (negative values) whereas
the Rothbach sandstone has a significant paramagnetic component
(positive values).
L. Louis et al. / Tectonophysics 370 (2003) 193–212 205
netic, paramagnetic and ferromagnetic phases. The
resultant magnetic tensor at the scale of the sample is
thus the sum of individual intrinsic magnetic tensors
corresponding to each mineral in the rock. Fig. 8
shows the AMS stereoplots for both Bentheim and
Rothbach sandstones. The Bentheim sandstone
presents an almost isotropic susceptibility, as each
confidence ellipse fills the major part of the plot.
One can observe that the petrophysical data in Table
1 point out the dominant presence of quartz (95%)
which grains are considered to be isotropic (less than
1% anisotropy). As a matter of fact, the negative
susceptibility values (Table 3) measured in the samples
show clearly the predominant effect of the quartz–
feldspar part and the lack of more susceptible material
in a significant proportion. On the contrary, the AMS
Fig. 9. Electrical conductivity of the brine saturated samples vs. the brine
factor.
tensor obtained for Rothbach sandstone is quite well
defined. This sandstone shows a positive paramagnetic
mean susceptibility. Table 1 shows that both clays
(f 12%) and oxides (f 3%), considering their respec-
tive proportions, can carry such a susceptibility. The
three principal susceptibility values are given in Table
3, from which we derive the magnetic lineation factor
L=Kmax/Kint = 1.013 and the magnetic foliation factor
F =Kint/Kmin = 1.035. This means that the magnetic
fabric is planar with maximum and intermediate axes
parallel to the bedding. Confidence regions are poorly
defined in this plane, while minimum axis of suscept-
ibility reflecting the pole of bedding is surrounded by
small confidence area. This magnetic foliation parallel
to the bedding is typical for sedimentary fabrics which
is developed under sedimentary compaction (Hrouda,
1982). Lack of clear anisotropy in the bedding plane
can be simply due to the intrinsic planar anisotropy of
both hematite and clay minerals which are the main
contribution to the magnetic fabric. It is worth noting
that slight obliquity corroborates the presence of cross-
bedding in our samples.
3.3. Electrical measurements
In Fig. 9, we plotted the sample conductivity vs. the
brine conductivity, from which the respective forma-
conductivity. The slope of the linear fit gives the inverse formation

Table 4
Formation factor and surface conductivity data for the Bentheim and
Rothbach sandstones, with corresponding experimental errors
Sample Formation
factor
Surface
conductivity
(mS/m)
Bentheim sandstone X 11.5F 0.2 1.5F 2.3
Y
Z 13.4F 0.2 2.1F 2.1
Rothbach sandstone X 22.6F 0.5 9.5F 1.5
Y
Z
L. Louis et al. / Tectonophysics 370 (2003) 193–212206
tion factor and surface conductivity can be calculated.
The data are given in Table 4. Notice that because we
can only measure electrical parameters in the direction
of the core axis, we do not have enough information to
define the full tensor unlike our study on acoustic and
magnetic properties. Nevertheless, we can still com-
pare our results obtained for the X, Yand Z samples. In
the Bentheim sandstone, an isotropic subhorizontal
plane (X and Y conductivities) was identified with a
formation factor of 11.5F 0.2, while we measured
13.5F 0.2 in the vertical direction (Z sample). The
surface conductivity could only be roughly estimated,
which explains the large errors (Table 4): in fact, the
surface conductivity is very small in the Bentheim
sandstone. The formation factors in the Rothbach
sandstone are virtually all the same in all the samples
(Table 4), whereas the surface conductivity is mean-
ingful and significantly higher than in the Bentheim
sandstone due to the presence of clays. (Table 4). As
for the acoustic velocity results, the anisotropy in
electrical properties is weaker in the Rothbach sand-
stone compared to the Bentheim sandstone. Again, this
result was not expected.
4. Discussion
Let us first recall the main results from our exper-
imental study. We were interested in the comparative
study of acoustic, magnetic and electrical properties of
sandstones, with special focus on the anisotropy of
each physical property. A common method was
developed to statistically analyse the numerous meas-
urements in order to define the principal axes of the
ellipsoid describing the spatial variation for a given
rock property. Two sandstones were tested, one (Ben-
theim) that looked very homogeneous from visual
examination of the block, and another one (Rothbach)
with visible bedding which was suspected to be more
heterogeneous and anisotropic than the former. Our
results show that, against all expectations, the Ben-
theim sandstone is more anisotropic than the Roth-
bach sandstone. The acoustic measurements show that
the anisotropy factor for P-wave velocities is not the
same for the dry rock and for the water-saturated rock,
and interestingly, the trend is opposite for both sand-
stones: while a decrease is observed for the Bentheim
sandstone, the anisotropy factor for the Rothbach
sandstone increases when water is present in the pore
space. Another difference is that the Bentheim sand-
stone is clearly transversely isotropic whereas the
water-saturated Rothbach sandstone is not, although
in the latter case, a planar bedding was detected on the
block. Finally, there is some evidence in our data for
the Rothbach sandstone that the principal axes for the
ellipsoid relative to P-wave velocity rotate slightly
when comparing the results for the dry and for the
saturated samples. We will try in the following to
interpret these observations on the basis of several
theoretical models.
Before going further in the discussion, let us first
emphasise the following. When one tries to model the
physical properties of granular rocks, two different
approaches can be used. One possibility is to use
models based on pore or crack inclusions within a
solid matrix: doing so, one basically focuses on the
influence of porosity, pore geometry, crack density,
etc, whereas the solid fraction of the rock (i.e. the
grains) does only weakly come into such models. For
a review of effective medium models and mixture
theories, one can refer, for example, to Berryman
(1995). Another possibility is to use models which
intend to give a better description of the granular
framework and focus on parameters such as grain
contacts, cementation, coordination number of the
grain assembly, etc, but weakly take into account
the porosity (e.g. Digby, 1981). For sandstones like
the ones tested in the present study, both approaches
are relevant, and at some point, a choice has to be
made. For reasons that we will develop later on, we
used an inclusion model for the Bentheim sandstone
and a cemented granular medium model for the
Rothbach sandstone.
physics 370 (2003) 193–212 207
4.1. Pore space anisotropy in the Bentheim sandstone
Two main features (i.e. matrix and voids) can be
responsible of the anisotropy observed in sandstones:
the matrix and the voids, but a combination of both is
also possible. One of the major contributions of this
work is to show that comparing the anisotropy for
different rock properties on rock samples saturated
with different pore fluids helps to identify the nature
of the observed anisotropy. For example, if one
considers a rock made of a matrix which is anisotropic
and an equant porosity, saturating the pore space with
water should lead to three main observations for the
acoustic velocity evolution. First, the orientation of
the principal axes of the ellipsoid should not change,
since the added stiffness is isotropic. Second, the
direction of maximum velocity difference should be
that of the matrix. Third, we would expect an increase
of the whole anisotropy as the pores get stiffer. If
either one of these conditions is not respected, one
would conclude that the porosity is not isotropically
distributed. The velocity anisotropy presented by the
Bentheim sandstone after saturation is considerably
reduced, thus we believe that the porosity dominates
the anisotropic behaviour of this rock. This conclusion
is also supported by the fact that the formation factor
which is directly related to the rock porosity is
anisotropic in the Bentheim sandstone. If we stick to
this assumption, there is actually no need to appeal for
anisotropy in the matrix, although it cannot be ruled
out (Lo et al., 1986). One can then consider the simple
case of anisotropic pore inclusions within an isotropic
solid phase, and for this reason, we will focus our
discussion here on inclusion models. Taking into
account the angular variation of the P-wave velocity,
it is clear that the Bentheim sandstone is more com-
pliant in the vertical direction (Z) and stiffer in the
horizontal plane (XY). This tells us that the geometry
of the pores can be compared to that of oblate
ellipsoids, all of them with their short axis parallel
to the Z direction in order to get an overall anisotropic
medium (Eshelby, 1957). Two of our observations
support this conclusion: (1) the decrease in anisotropy
ratio when saturating the rock with water, and (2) the
electrical conductivity data. For the first point, any
inclusion model will predict that when filling the
anisotropic pores with a stiffer isotropic material
(e.g. when water replaces the air), the velocity aniso-
L. Louis et al. / Tectono
tropy will be reduced. In the extreme case when the
pores are filled with the matrix material, there will be
no anisotropy at all. A similar decrease of anisotropy
ratio with saturation was observed by Rathore et al.
(1994) on synthetic sandstone with controlled pore
anisotropy. Concerning the second point, the aniso-
tropy observed for the electrical properties favours the
inference of pore anisotropy. We found a higher value
for the formation factor in the vertical direction than in
the XY plane, which means that the transport of ions
is easier within that plane. This can be easily under-
stood if one considers the relation F = s2//, where s2
is the so-called tortuosity and / is the porosity. The
tortuosity is inversely correlated to the probability of
interconnection between pores or cracks (Gueguen
and Palciauskas, 1994): for parallel oblate ellipsoidal
pores, this probability is higher in the direction of
elongation and lower in the direction of the short axis,
which implies in our case a larger formation factor in
the vertical direction. This is what we observed. Other
conclusive tests would be to measure the pressure
dependence of P-wave velocity which is very sensi-
tive to pore geometry (Tao et al., 1995), and obviously
to analyse quantitatively the rock microstructure under
the microscope, which we plan to do.
The decrease in anisotropy observed in the Ben-
theim sandstone after saturation and the larger
increase of velocity perpendicular to the bedding
can be explained with a preferred orientation of
anisotropic pores. We decided to use the inclusion
model developed by Kachanov (1993) which gives
the expression for the Young’s modulus and the
Poisson ratio for a homogeneous solid containing
empty cavities of ellipsoidal shape. These relations
are derived from the elastic solution given by Savin
(1961) and can be written in 2D as a function of two
dimensionless parameters, p (a scalar) and b (a
second-rank tensor) which characterise the density
of voids with elliptical shape in the 2D medium:
p ¼ 1
SpXk
ab; bij ¼1
SpXk
ða2ninj þ b2titjÞ ð6Þ
Here, a and b are the semi-axes of the ellipse with
index k, S is the total surface used for the calculation,
k the summation index over all the cavities, t and n
two orthonormal vectors defining the semi-axes a and
b, respectively. To be consistent with our notations,

L. Louis et al. / Tectonophysics 370 (2003) 193–212208
we consider here elliptical inclusions embedded in a
2D solid within the OYZ plane. In the general case of
non-interacting cavities, one can calculate assuming
plane strain conditions and the application of a uni-
axial stress in the horizontal (Y) and vertical (Z)
directions, respectively, the Young’s moduli Eh and
Ev, and the Poisson ratio mh and mv as a function of the
void density parameters:
Eh ¼E0ð1� m20Þ
�1
1þ pþ 2bYY
; Ev ¼E0ð1� m20Þ
�1
1þ pþ 2bZZ
;
mh ¼m0ð1� m0Þ�1 þ p
1þ pþ 2bYY
; mv ¼m0ð1� m0Þ�1 þ p
1þ pþ 2bZZ
ð7Þ
where E0 and m0 are the Young’s modulus and Poisson
ratio of the isotropic matrix, respectively.
Considering one single family of elliptical voids
elongated in the Y direction, the p and bij parameters
can easily be calculated as a function of a = b/a, thepore aspect ratio: replacing p =/, bYY= a/U, and
bZZ =//a into Eq. (7), the final expressions for the
elastic moduli are obtained. The solid elastic moduli
have been calculated by the Voigt–Reuss–Hill aver-
age from the mineralogical composition data in Table
Fig. 10. Variations of the P-wave modulus anisotropy as a function of p
correspond to different pore aspect ratios. The model predicts a pore aspe
1 (E0 = 70.5 GPa, m0 = 0.09). We can now compare the
prediction of the model to our experimental data on
the dry Bentheim sandstone, as the Kachanov model
has been developed for dry inclusions. To do so, we
need to calculate the P-wave elastic modulus M =
qVP2 = E(1� m)(1 + m)� 1(1� 2m)� 1, where q is the
bulk density, and compare to our velocity data. In
Fig. 10, we plotted the prediction of the model for the
P-wave modulus anisotropy c = 2(Mh�Mv)/(Mh +Mv)
as a function of porosity and pore aspect ratio. Our
velocity data for the dry Bentheim sandstone give
cexp = 22.3% which corresponds according to the
Kachanov model to a pore aspect ratio between 0.7
and 0.75. Therefore, the Kachanov model predicts that
our data are consistent with a rather low anisotropy in
pore shape, which seems to be acceptable for a sand-
stone in that porosity range. Furthermore, this value is
close to the ratio of minimum to maximum formation
factor (equal to 0.86) which theoretically should be
linked to the pore anisotropy.
4.2. Matrix stiffness anisotropy in the Rothbach
sandstone
The same reasoning applied to the Rothbach sand-
stone leads to a more complicated interpretation.
While AMS results (Fig. 8) show clearly a sedimen-
orosity predicted by the Kachanov (1993) model. The plain curves
ct ratio between 0.7 and 0.75 for the Bentheim sandstone.

L. Louis et al. / Tectonophysics 370 (2003) 193–212 209
tary fabric, the stereoplot observed from acoustic
measurements in dry samples is not easily interpret-
able as mentioned above, because the acoustic signals
were rather weak and their interpretation did not lead
to a clear ellipsoidal shape. After saturating the
samples with water, a well-defined anisotropy of P-
wave velocities was obtained. In addition, we ob-
served that the principal axes rotate slightly to stand in
a geometry well related to the bedding with small
scattering ellipses, but which does not correspond to a
situation of transverse isotropy. The rotation of the
axes may indicate that the porosity in the Rothbach
sandstone is not equant. However, neither the elec-
trical conductivity data (no formation factor aniso-
tropy) nor the increase in P-wave anisotropy from dry
to saturated samples supports this conclusion. For this
reason, we do not consider as for the Bentheim
sandstone an inclusion model of anisotropic pores.
Another explanation can be some specific behaviour
of the clays. In his PhD thesis, Mertz (1989) points
out that the clays in the Rothbach sandstone are
mostly illite, but the presence of other clay minerals
is not ruled out, including swelling clays. The varia-
tion of the acoustic properties from dry to saturated
samples may be associated with the swelling proper-
ties of such clays. Swelling processes may lead to
anisotropic effects depending on the location and
distribution of clays in the rock. However, as we are
not experts in clays, we did not check further this
hypothesis which might be an interesting one. We will
rather favour the hypothesis of some anisotropic
property of the matrix. According to the petrophysical
data in Table 1, the matrix of the Rothbach sandstone
is mainly made of a mixture of quartz, feldspar and
clays. To infer some anisotropy among this composi-
tion, we have first to focus on a more realistic model
that takes into account the mechanical interactions
between grains. Dvorkin and Nur (1996) proposed a
model in order to compute the elastic parameters of a
cemented sphere packing, starting from the number of
contacts per sphere (or grain), the stiffness of each
grain, the porosity and the cement properties in terms
of elastic moduli (Kcement, Gcement), volumetric frac-
tion and location with respect to the grain contacts. If
one considers that the Rothbach sandstone is made of
a skeleton of quartz and feldspar, with the clays as the
cementing material, it is possible to estimate the bulk
elastic properties according to that model. To account
for the anisotropic behaviour found in the Rothbach
sandstone, we modified the cemented granular model
by assuming that the cement is not homogeneously
deposited at the grains contacts. By changing the
stiffness of the contacts depending on the direction
of investigation, we can introduce into the model an
anisotropic elastic behaviour. We have done this for
the Rothbach sandstone, computing an elliptic varia-
tion for the width of the cement layer. To be consistent
with the velocity anisotropy data, we need the largest
width for contacts joining two grains which centres
are aligned in the vertical direction. Let v be the ratio
of the minimum cement radius to the maximum
cement radius at grain contacts. This parameter will
be adjusted in order to fit to the shape of our velocity
anisotropy. The mean value of the cemented contact
width was fixed to 0.6 times the grain radius. Because
the original model of Dvorkin does not take into
account the effect of water, we tried to come up with
a method which allows the application of the model to
water-saturated granular media, as we had much
better results for the saturated Rothbach sandstone
than for the dry one. This was done by increasing step
by step the bulk modulus of the quartz–feldspar
skeleton. The underlying hypothesis made here is that
the porosity is randomly distributed and that the
mechanical effect of the water is just to increase the
solid bulk modulus in an homogeneous way. Doing
so, we clearly focus here on the effect of a non-
isotropic cementation on the elastic behaviour. We
started with an averaged value of 37.5 GPa for the
solid bulk modulus and 38.5 GPa for the solid shear
modulus calculated from Table 1. To get a mean P-
wave modulus value of 27.5 GPa, representative of
our measurements on the water-saturated Rothbach,
we need to increase the solid bulk modulus up to 45
GPa. The best fit obtained with the model is shown in
Fig. 11: it corresponds to a cement radius ratio
v= 0.85, in other words, a variation in the range
0.55–0.65 times the mean grain radius. Therefore, a
small anisotropy in cemented contact length is enough
to account for our velocity anisotropy data. Interest-
ingly, a clay distribution preferably oriented in the
horizontal plane as suggested by the anisotropic
cementing bonds model is consistent with the acquis-
ition of a sedimentary fabric revealed by the magnetic
susceptibility results (Fig. 8). Unfortunately, the
model cannot account for the increase of velocity

Fig. 11. Variation of the P-wave modulus for the saturated Rothbach sandstone vs. orientation. The solid line shows the prediction of the
modified cemented grain scheme of Dvorkin and Nur (1996). The anisotropy is obtained by applying a variable cement distribution. Parameters
for the simulation are as follows: number of contacts per grain C= 9, elastic moduli of the cement Kcement = 25 GPa and Gcement = 9 GPa, and
cement radius ratio v= 0.85 (see text for details).
L. Louis et al. / Tectonophysics 370 (2003) 193–212210
anisotropy ratio with water saturation for which we
have no satisfying explanation for the moment. The
anisotropic behaviour of the Rothbach sandstone has
been studied in a previous work by Wong et al.
(1997): they found in their mechanical tests under
triaxial conditions on samples cored either perpendic-
ular or parallel to the bedding that the static elastic
stiffness and the mechanical resistance were system-
atically higher (by about 10%) in the first case than in
the second one. The Rothbach sandstone has thus a
strong anisotropy in the mechanical behaviour, which
is qualitatively in agreement with the variation of
dynamic elastic moduli derived from our P-wave
velocity measurements.
5. Conclusion and perspectives
Investigating the overall variations of ultrasonic P-
wave velocities, magnetic susceptibility and electrical
conductivity in samples of Bentheim and Rothbach
sandstones, we observed two unexpectedly different
styles of behaviour. We compared the results using
both empirical considerations and effective media
schemes. Considering the important decrease in elas-
tic anisotropy and the greater electrical conductivity
parallel to the bedding, we inferred that the aniso-
tropy observed through velocity measurements in the
Bentheim sandstone was dominated by the shape of
the porosity. The Kachanov’s model for ellipsoidal
inclusions in an isotropic medium predicted a pore
shape ratio ranging between 0.7 and 0.75, which we
think to be realistic, considering that the electrical
conductivities, which are related to the shape of the
porosity, presented a minimum to maximum ratio in
the same order of magnitude (0.86). The elastic
anisotropy of the Rothbach sandstone increased con-
siderably after water saturation: we obtained a very
well defined set of principal axes with a maximum
velocity in a direction perpendicular to the bedding.
On the other hand, the electrical conductivity meas-
urements did not show any significant anisotropy.
Therefore, we conclude that the observed rock ani-
sotropy is inconsistent with an anisotropic pore shape
and must therefore be controlled by the matrix.
Using the granular cemented model of Dvorkin and
Nur (1996), we considered the clay as an unevenly
distributed cementing grain boundary component so
that the contact length presents an angular variability.
The model accounted for the observed anisotropy in
wet conditions for a ratio of minimum to maximum
contact length equal to 0.85, showing that a small
anisotropy of the grain contact length can considerably
modify the stiffness of a granular rock. Interestingly,
this result was confirmed by the AMS measurements
since clays are expected to be preferably oriented
along the bedding plane during sedimentary com-
paction. In addition, triaxial loading tests made by
L. Louis et al. / Tectonophysics 370 (2003) 193–212 211
Wong et al. (1997) gave evidence of a stronger
mechanical resistance in a direction perpendicular to
the bedding.
Finally, the sandstone that seemed to be the most
homogeneous (Bentheim) at macroscopic scale pre-
sented the most intense anisotropy with respect to the
acoustic and electric measurements, while the appa-
rently stratified one (Rothbach) was not transversely
isotropic. Although we think we have extracted from
each sandstone the first-order contribution to observed
anisotropies, some results remain unexplained, in
particular the dry P-wave velocities variation in half
the wavelength of the expected anisotropy in the
Rothbach sandstone (see Fig. 5). The rotation of the
principal axes between dry and saturated conditions
has also to be understood. A hypothesis to be tested is
that these measurements might express a mixed con-
tribution of matrix- and porosity-related anisotropies.
Recent work of Tsukrov and Kachanov (2000) pro-
vides full relations for an orthotropic matrix contain-
ing empty ellipsoidal cavities, which could be the
starting point for a new study. In this case, assuming
that several contributions are responsible for the
observed anisotropy, the traditional techniques of
computing directional trends and confidence regions
would be of little help. Indeed, such methods impose
not only an orthogonal geometry but also the direc-
tions of scattering for each axis. New statistical
analyses need to be developed in order to deal with
combined anisotropies. Finally, it is obviously neces-
sary to complete the present set of measurements with
permeability and microstructural studies, and to
extend our work on other reservoir rocks, in particular
on core samples retrieved from boreholes. This will be
investigated in future work.
Nevertheless, our current knowledge of these two
sandstones already allows to discriminate the principal
feature (i.e. voids or matrix), responsible for their
anisotropic behaviour with respect to several physical
properties.
This can be of great importance for reservoir
characterisation and more generally for the analysis
of folded sedimentary structures. Indeed, such studies
often take into account only fracture scale features,
which do not account for the possible complexity of
matrix permeability in reservoir rocks and for inter-
nal deformation during diagenetic and tectonic epi-
sodes.
Acknowledgements
It is our pleasure to dedicate this work to Prof. H.
Kern whose contribution in the field of Rock Physics
was constantly stimulating over the last decades. This
work was supported by Gaz de France within the
frame of a research contract with the University of
Cergy-Pontoise. We thank Peter Schuitjens and
Christian Lehr (Shell Rijswijk) for providing the
block of Bentheim sandstone, and Thierry Reuschle
(Univ. Strasbourg) for providing the block of
Rothbach sandstone. Yves Gueguen and Laurence
Jouniaux at ENS Paris gave us access to their drilling
machine to core our samples. Early acoustic measure-
ments were done at IPG Paris thanks to Maria
Zamora. Many thanks to Jean-Marc Siffre (CNRS)
who designed the sample assembly for the acoustic
measurements and provided technical support for the
experimental work. Finally, we thank both reviewers
for their constructive comments.
References
Berryman, J.G., 1995. Mixture theories for rock properties. Rock
Physics and Phase Relations—A Handbook of Physical Con-
stants. AGU Reference Shelf, vol. 3, pp. 205–228.
Borradaile, G.J., Henry, B., 1997. Tectonic applications of magnetic
susceptibility and its anisotropy. Earth-Sci. Rev. 42, 49–93.
Bourbie, T., Coussy, O., Zinszner, B., 1987. Acoustic of Porous
Media. Ed. Technip, Paris, 334 pp.
Cheng, C.H., 1993. Crack models for a transversely isotropic me-
dium. J. Geophys. Res. 98 (B1), 675–684.
Cheng, C.H., Toksoz, M.N., 1979. Inversion of seismic velocities
for the pore aspect ratio spectrum of a rock. J. Geophys. Res. 84
(B13), 7533–7543.
Crampin, S., Booth, D.C., 1985. Shear-wave polarization near the
North Anatolian fault. Interpretation in terms of crack-induced
anisotropy. Geophys. J. R. Astron. Soc. 83, 75–92.
David, C., Datot, M., Jeannette, D., 1993. Pore structures and trans-
port properties of sandstone. Transp. PorousMedia 11, 161–177.
David, C., Wong, T.-F., Zhu, W., Zhang, J., 1994. Laboratory meas-
urement of compaction induced permeability change in porous
rocks: implication for the generation and maintenance of pore
pressure excess in the crust. PAGEOPH 143, 425–456.
Digby, P.J., 1981. The effective elastic moduli of porous granular
rocks. J. Appl. Mech. 48, 803–808.
Dvorkin, J., Nur, A., 1996. Elasticity of high porosity sand-
stones: theory for two North Sea data sets. Geophysics 61
(5), 1363–1370.
Dvorkin, J., Mavko, G., Nur, A., 1991. The effect of cementation
on the elastic properties of granular materials. Mech. Mater. 12,
207–217.

L. Louis et al. / Tectonophysics 370 (2003) 193–212212
Dvorkin, J., Nur, A., Yin, H., 1994. Effective properties of ce-
mented granular materials. Mech. Mater. 18, 351–366.
Eshelby, J.D., 1957. The determination of the elastic field of an
ellipsoidal inclusion and related problems. Proc. R. Soc. A241
(1226), 376–396.
Gueguen, Y., Palciauskas, V.V., 1994. Introduction to the Physics of
Rocks. Princeton University Press, Princeton.
Hashin, Z., Shtrickman, S., 1963. A variational approach to the
elastic behaviour of multiphase materials. J. Mech. Phys. Solids
11, 127–140.
Hext, G.R., 1963. The estimation of second-order tensors, with
related tests and designs. Biometrika 50, 353–373.
Hrouda, F., 1982. Magnetic anisotropy of rocks and its application
in geology and geophysics. Geophys. Surv. 5, 37–82.
Hrouda, F., Zdenek, P., Wohlgemuth, J., 1993. Development of
magnetic and elastic anisotropies in slates during progressive
deformation. Phys. Earth Planet. Inter. 77, 251–265.
Hudson, J.A., 1981. Wave speed and attenuation of elastic waves in
material containing cracks. Geophys. J. R. Astron. Soc. 64,
133–150.
Kachanov, M., 1993. Elastic solids with many cracks and related
problems. Advances in Applied Mechanics, vol. 30. Academic
Press, Boston, MA, pp. 259–445.
Kern, H., 1993. P- and S-wave anisotropy and shear-wave splitting
at pressure and temperature in possible mantle rocks and their
relation to the rock fabric. Phys. Earth Planet. Inter. 78 (3–4),
245–256.
Kern, H., Liu, B., Popp, T., 1997. Relationship between anisotropy
of P- and S-wave velocities and anisotropy of attenuation in
serpentinite and amphibolite. J. Geophys. Res. 102 (B2),
3051–3065.
King, M.S., 1965. Wave velocities in rocks as a function of changes
in overburden pressure and pore fluid saturants. Geophysics 31,
50–73.
Klein, E., Baud, P., Reuschle, T., Wong, T.-F., 2001. Mechanical
behaviour and failure mode of Bentheim sandstone under triax-
ial compression. Phys. Chem. Earth, Part A 26 (1–2), 21–25.
Kuster, G.T., Toksoz, M.N., 1974. Velocity and attenuation of seis-
mic waves in two-phase media. Geophysics 39, 587–618.
Lo, T.-W., Coyner, K.B., Toksoz, M.N., 1986. Experimental deter-
mination of elastic anisotropy of Berea Sandstone, Chicopee
shale, and Chelmsford granite. Geophysics 51, 164–171.
Love, A.E.H., 1927. A Treatise on the Mathematical Theory of
Elasticity. Cambridge Univ. Press, New York.
Mainprice, D., Barruol, G., Ben Ismaıl, W., 2000. The seismic
anisotropy of the earth’s mantle: from single crystal to polycrys-
tal. Geophys. Monogr. 117, 237–264.
Mavko, G., Mukerji, T., Godfrey, N., 1995. Predicting stress-induced
velocity anisotropy in rocks. Geophysics 60 (4), 1081–1087.
Mertz, J.D., 1989. Role des structures de porosite dans des pro-
prietes de transport. Application aux gres du Bundsandstein et
du Brent (Alwyn, Mer du Nord). PhD thesis, University of
Strasbourg.
Mindlin, R.D., 1949. Compliance of elastic bodies in contact. J.
Appl. Mech. 16, 259–268.
Owens, W.H., 2000. Statistical applications to second-rank tensors
in magnetic fabric analysis. Geophys. J. Int. 142, 527–538.
Rathore, J.S., Fjaer, E., Holt, R.M., Renlie, L., 1994. P- and S-wave
anisotropy of a synthetic sandstone with controlled crack geom-
etry. Geophys. Prospect. 43, 711–728.
Savin, G.N., 1961. Stress Concentration Around Holes. Pergamon,
London, 430 pp.
Tao, G., King, M.S., Nabi-Bidhendi, M., 1995. Ultrasonic wave
propagation in dry and brine-saturated sandstones as a function
of effective stress: laboratory measurements and modelling.
Geophys. Prospect. 43, 299–327.
Tarling, D.H., Hrouda, F., 1993. The Magnetic Anisotropy of
Rocks. Chapman & Hall, London. 217 pp.
Tauxe, L., 1998. Paleomagnetic principles and practice. Modern
Approaches in Geophysics, vol. 17. Kluwer Academic Publish-
ing, Dordrecht, pp. 173–241.
Thomsen, L., 1986. Weak elastic anisotropy. Geophysics 51 (10),
1954–1966.
Tsukrov, I., Kachanov, M., 2000. Effective moduli of an anisotropic
material with elliptical holes of arbitrary orientational distribu-
tion. Int. J. Solids Struct. 37, 5919–5941.
Van Bareen, J.P., Vos, M.W., Heller, H.J.K., 1990. Selection of out-
crop samples. Internal report, Delft University of Technology.
Vickers, B.L., Thill, R.E., 1969. A new technique for preparing
rock spheres. J. Sci. Instrum. 2, 901–902.
Walsh, J.B., 1965. The effect of cracks on the uniaxial elastic com-
pression of rocks. J. Geophys. Res. 70 (2), 399–411.
Walton, K., 1987. The effective elastic moduli of a random packing
of sphere. J. Mech. Phys. Solids 35, 213–226.
Wong, T.-F., David, C., Zhu, W., 1997. The transition from brittle
faulting to cataclastic flow in porous sandstones: mechanical
deformation. J. Geophys. Res. 102, 3009–3025.
Zhu, W., Wong, T.-F., 1997. The transition from brittle faulting to
cataclastic flow in porous sandstones: permeability evolution.
J. Geophys. Res. 102, 3027–3041.