Differences between Archean and Proterozoic lithospheres: Assessment of the possible major role of...
26
Differences between Archean and Proterozoic lithospheres: Assessment of the possible major role of thermal conductivity S. Petitjean, M. Rabinowicz, M. Gre ´ goire, and S. Chevrot Laboratoire de Dynamique Terrestre et Plane ´taire, UMR-CNRS 5562, OMP, 14 Avenue E. Belin, F-31400 Toulouse, France ([email protected]; [email protected]) [1] We study heat transfer through the conductive lithosphere and convective mantle on the basis of a 2-D convection model in order to better understand the differences between Archean and Proterozoic lithospheres. The original improvement in the modeling consists of a precise track of the cutoff temperature between conduction and convection. The conductive lithosphere is undeformable, and the convective mantle has a constant viscosity. The conductive lithosphere in Archean cratons is assumed to have a lower radiogenic heat production in the crust and/or the conductive mantle, and/or a higher cutoff temperature (attributed to a stiffening of the more depleted mantle) relative to Proterozoic terrains. We also investigate the effect of a fourth factor never considered before: an enhancement of the vertical thermal conductivity in the conductive Archean mantle due to a vertical lineation. Our model successfully predicts the observations on the Canadian and South African shields. A high vertical thermal conductivity in the Archean lithospheric mantle possibly associated to a radiogenic crust depletion explains many observations: i.e., (1) the development of a thick Archean cold root, (2) a dipping cold convective plume beneath Archean cratons, (3) a uniform mantle heat flux along Archean and Proterozoic terrains, and (4) strong high seismic velocity anomalies over Archean cratons. In addition, a lower radiogenic heat production of the lithospheric mantle or a larger cutoff temperature in Archean cratons is not favored by our models. Finally, we investigate how a cold root and a sub-Archean cold mantle plume react to the shear induced by large-scale mantle flow and to the collision with a hot mantle plume. Models show that shear removes the cold plume from below the Archean craton, but cold dipping instabilities are periodically generated inside the convective boundary layer below the Archean cratonic lid. However, the thick Archean lithospheric root may survive several orogeneses. In addition, the models show that it takes at least 200 Myr for a hot mantle plume to erode the thick lithospheric root. This suggests that an Archean root may only disappear if the plate remains above a hot plume for a very long time. Components: 13,248 words, 12 figures, 11 tables. Keywords: Archean; craton; dehydration; heat production; lithosphere; thermal conductivity. Index Terms: 5418 Planetary Sciences: Solid Surface Planets: Heat flow; 8103 Tectonophysics: Continental cratons; 8120 Tectonophysics: Dynamics of lithosphere and mantle: general (1213). Received 23 June 2005; Revised 29 November 2005; Accepted 25 January 2006; Published 31 March 2006. Petitjean, S., M. Rabinowicz, M. Gre ´goire, and S. Chevrot (2006), Differences between Archean and Proterozoic lithospheres: Assessment of the possible major role of thermal conductivity, Geochem. Geophys. Geosyst., 7, Q03021, doi:10.1029/2005GC001053. 1. Introduction [2] Petrological, geothermal and seismological studies suggest that the Precambrian lithosphere displays large regional thickness variations. The lithosphere of Archean cratons can be as thick as 350 km, in contrast to old oceanic lithosphere (up to 150 km) and Proterozoic continental lithosphere (110 – 250 km) [Artemieva and Mooney , 2001]. Hot or cold mantle plumes generally do not erode G 3 G 3 Geochemistry Geophysics Geosystems Published by AGU and the Geochemical Society AN ELECTRONIC JOURNAL OF THE EARTH SCIENCES Geochemistry Geophysics Geosystems Article Volume 7, Number 3 31 March 2006 Q03021, doi:10.1029/2005GC001053 ISSN: 1525-2027 Copyright 2006 by the American Geophysical Union 1 of 26
Transcript of Differences between Archean and Proterozoic lithospheres: Assessment of the possible major role of...

Differences between Archean and Proterozoic lithospheres:Assessment of the possible major role of thermal conductivity
S. Petitjean, M. Rabinowicz, M. Gregoire, and S. ChevrotLaboratoire de Dynamique Terrestre et Planetaire, UMR-CNRS 5562, OMP, 14 Avenue E. Belin, F-31400 Toulouse,France ([email protected]; [email protected])
[1] We study heat transfer through the conductive lithosphere and convective mantle on the basis of a 2-Dconvection model in order to better understand the differences between Archean and Proterozoiclithospheres. The original improvement in the modeling consists of a precise track of the cutofftemperature between conduction and convection. The conductive lithosphere is undeformable, and theconvective mantle has a constant viscosity. The conductive lithosphere in Archean cratons is assumed tohave a lower radiogenic heat production in the crust and/or the conductive mantle, and/or a higher cutofftemperature (attributed to a stiffening of the more depleted mantle) relative to Proterozoic terrains. We alsoinvestigate the effect of a fourth factor never considered before: an enhancement of the vertical thermalconductivity in the conductive Archean mantle due to a vertical lineation. Our model successfully predictsthe observations on the Canadian and South African shields. A high vertical thermal conductivity in theArchean lithospheric mantle possibly associated to a radiogenic crust depletion explains manyobservations: i.e., (1) the development of a thick Archean cold root, (2) a dipping cold convectiveplume beneath Archean cratons, (3) a uniform mantle heat flux along Archean and Proterozoic terrains,and (4) strong high seismic velocity anomalies over Archean cratons. In addition, a lower radiogenic heatproduction of the lithospheric mantle or a larger cutoff temperature in Archean cratons is not favored byour models. Finally, we investigate how a cold root and a sub-Archean cold mantle plume react to the shearinduced by large-scale mantle flow and to the collision with a hot mantle plume. Models show that shearremoves the cold plume from below the Archean craton, but cold dipping instabilities are periodicallygenerated inside the convective boundary layer below the Archean cratonic lid. However, the thickArchean lithospheric root may survive several orogeneses. In addition, the models show that it takes atleast 200 Myr for a hot mantle plume to erode the thick lithospheric root. This suggests that an Archeanroot may only disappear if the plate remains above a hot plume for a very long time.
Components: 13,248 words, 12 figures, 11 tables.
Keywords: Archean; craton; dehydration; heat production; lithosphere; thermal conductivity.
Index Terms: 5418 Planetary Sciences: Solid Surface Planets: Heat flow; 8103 Tectonophysics: Continental cratons; 8120
Tectonophysics: Dynamics of lithosphere and mantle: general (1213).
Received 23 June 2005; Revised 29 November 2005; Accepted 25 January 2006; Published 31 March 2006.
Petitjean, S., M. Rabinowicz, M. Gregoire, and S. Chevrot (2006), Differences between Archean and Proterozoic
lithospheres: Assessment of the possible major role of thermal conductivity, Geochem. Geophys. Geosyst., 7, Q03021,
doi:10.1029/2005GC001053.
1. Introduction
[2] Petrological, geothermal and seismologicalstudies suggest that the Precambrian lithospheredisplays large regional thickness variations. The
lithosphere of Archean cratons can be as thick as350 km, in contrast to old oceanic lithosphere (upto 150 km) and Proterozoic continental lithosphere(110–250 km) [Artemieva and Mooney, 2001]. Hotor cold mantle plumes generally do not erode
G3G3GeochemistryGeophysics
Geosystems
Published by AGU and the Geochemical Society
AN ELECTRONIC JOURNAL OF THE EARTH SCIENCES
GeochemistryGeophysics
Geosystems
Article
Volume 7, Number 3
31 March 2006
Q03021, doi:10.1029/2005GC001053
ISSN: 1525-2027
Copyright 2006 by the American Geophysical Union 1 of 26

Archean cold roots. The survival of cold roots isnot clearly understood. It is the aim of the presentpaper to critically consider this problem.
[3] The seismological lithosphere corresponds tothe cold top layer of the Earth. Its bottom isdelimited by the adiabatic region of the mantle.From top to bottom, it includes: the crust, theconductive mantle layer and the top boundary layerof the mantle convection. Since the secular coolingof the Precambrian lithosphere is negligible, thesurface heat flow in Precambrian continents repre-sents the sum of the radiogenic heat produced inthe crust and mantle sections of the lithosphereplus that flowing through the convective mantle.The subtraction from the surface heat flow of theheat produced by crustal radiogenic sources yieldsto an estimate of the heat flowing through thecrust-mantle interface. This heat flow is apparentlythe same beneath Archean and Proterozoic regionsand ranges between 11–21 mW/m2 [Rudnick et al.,1998;Mareschal and Jaupart, 2004]. In the follow-ing, we designate it as the mantle heat flow. Forinstance, the Kalahari craton (South Africa) has amantle heat flow of 17 mW/m2 [Jaupart andMareschal, 1999]. In the Canadian shield, the man-tle heat flow is lower (11–15 mW/m2) [Jaupart andMareschal, 1999; Mareschal and Jaupart, 2004].The Archean and Proterozoic mantle heat flowrange is markedly smaller than the �40 mW/m2
generally observed below old oceanic lithospheres[Sclater et al., 1980]. The comparison is even moredramatic if we compare this average mantle heatflow in Precambrian continents to the 100 mW/m2
average surface heat flow in oceanic lithosphere[Pollack et al., 1993].
[4] Two different explanations have been proposedfor this contrast. The first one states that the Pre-cambrian lithosphere is buoyant and stiff[Ballard and Pollack, 1987; Doin et al., 1997;Lenardic, 1998; Shapiro et al., 1999]. Its lowdensity is attributed to a depleted mantle (primarilyin Ca, Al, Si, Mg, Fe) [Rudnick and Fountain, 1995;Taylor and McLennan, 1995; Jordan, 1978] and itsstiffness to devolatilization processes and a veryhigh Mg # of mantle peridotites (see discussion insection 2.4). Being lighter than the convectingmantle, the Precambrian lithosphere floats over it[Poudjom Djomani et al., 2001]. If the Precambrianlithosphere is also stiffer, the temperature whichmarks its transition with the convective part of themantle occurs along a higher isotherm compared tothe oceanic lithosphere. In the Earth’s mantle, thetemperature inside the convective cells is essentially
adiabatic and horizontally homogeneous. Mantletemperatures below the oceanic and continentallithospheres are therefore nearly the same [Doin etal., 1997]. Finally, the temperature contrast betweenthe bottom of the seismic lithosphere and the bottomof the conductive lithosphere (i.e., across the topconvective boundary layer of mantle convection)is smaller below Precambrian lithospheres thanbelow oceanic lithospheres [Turcotte et al., 2001].As a result, mantle heat flow crossing Precambrianlithospheres is much lower than below oceaniclithospheres.
[5] The other explanation to a reduced subcontinen-tal heat flow is related to heat advected by the wholemantle convection. The huge difference of heat flowprovided to oceanic plates (100 mW/m2) and toPrecambrian continents (20 mW/m2) implies thatthe bulk of the heat produced in the mantle belowcontinents is transferred toward the oceans by thewhole mantle convection. This flow is driven by thesubducting oceanic lithosphere [Rabinowicz et al.,1980; Lenardic, 1998] or by the lateral temperaturegradients due to the presence of a thick continentallithosphere [Guillou and Jaupart, 1995]. Currentmodels of the thermal state of the continentallithosphere include the convective circulation drivenby oceanic lithospheres and the lateral thermalgradients due to the anomalously thick continentallithosphere [Cooper et al., 2004].
[6] Three processes can thicken the Precambriancontinental lithospheres: a lower radiogenic heatproduction in the crust [Pinet et al., 1991; Guillouet al., 1994] or in the conductive mantle [Jordan,1988], and a higher cutoff temperature at thebottom of the conductive mantle associated to astiffer depleted mantle [Doin et al., 1997]. In thepresent paper, we investigate the effect of anotherfactor never considered before: a higher verticalthermal conductivity in the conductive mantle dueto a vertically frozen mantle lineation [Tommasi etal., 2001]. In section 2, we review the variability ofthese four factors. We successively present evalua-tions of the radiogenic sources in the mantle(section 2.1) and in the crust (section 2.2). Insection 2.3, we discuss the variations of thermalconductivity of the crust and mantle with a partic-ular emphasis on anisotropy. Finally, in section 2.4,we consider the rheology of the mantle within andbelow an Archean and a Proterozoic lithosphere.Then, by using quasi-steady convective models, weseparately estimate the possible thickness of thecold root triggered by the variation of each factorconsidered above. In section 3, we present our
GeochemistryGeophysicsGeosystems G3G3
petitjean et al.: archean craton thickness 10.1029/2005GC001053
2 of 26
numerical model. The quasi-steady models with ahorizontally homogeneous and a horizontally het-erogeneous conductive lithosphere are presented insections 4 and 5, respectively. In section 6, weshow two transient convective models to investi-gate how a cold root reacts (1) to shear induced bylarge-scale mantle flow and (2) to a collision with ahot mantle plume. In the last section, we discussthe parameter values that explain the differentPrecambrian shield data sets.
2. Heat Production, ThermalConductivity, and Temperature Datain the Crust and Mantle
2.1. Radiogenic Heat Production in theMantle Section of the ContinentalLithosphere
[7] Rudnick et al. [1998] analyzed lithosphericperidotites to explore the range of possible radio-genic heat produced in the continental mantle. Off-craton massifs peridotites display a mean mantleradiogenic heat production of 0.018 mW/m3. Peri-dotite xenoliths sampled in Archean cratons indi-cate a mean value of 0.028 mW/m3, whileextremely high values (0.1 mW/m3) are found insamples clearly contaminated by kimberlite melts.Finally, peridotites from the Phanerozoic Omanophiolite [Godard et al., 2000] display an extremelylow radiogenic heat production comparable toN-MORB-source mantle (0.002 mW/m3 [Jochumet al., 1983]). The scatter in the distribution ofradioelements is thus very strong, between 0 and8.5pW/kg(assumingamantledensityof3300kg/m3,and radiogenic sources ranging between 0 and0.028 mW/m3). Assuming a heat production forthe primitive mantle of 5 pW/kg [Jochum et al.,1983; McDonough and Sun, 1995; Palme andO’Neill, 2003], and subtracting the radioelementsnow included in the continental crust [Rudnick andFountain, 1995], we obtain a radiogenic heatproduction of 3.15 pW/kg for the present mantle(i.e., 0.01 mW/m3 for the upper mantle). As a result,we see that either the estimate derived fromRudnick et al. [1998] data is two to three timestoo large or radioelements accumulate in the con-tinental lithosphere, possibly during metasomaticprocesses. Archean mantle xenoliths are highlyrefractory, reflecting extraction of ultramaficliquids by partial melting [Poudjom Djomani etal., 2001;Boyd, 1989; Jordan, 1978]. Paradoxically,these peridotites also show a great enrichment inincompatible trace elements which is generally
attributed to local contamination during kimberlitemelt activity [Rudnick et al., 1998; Gregoire et al.,2002]. This high value is therefore not necessarilyrepresentative of the bulk of the lithospheric mantlein Archean domains. As a result it is likely thatbecause of its high melt depletion, the bulk of theArchean mantle is depleted in radiogenic sources.Accordingly, in the present study we consider caseswhere the radiogenic heat concentration within theconductive mantle ranges between about 0 and0.03 mW/m3.
2.2. Radiogenic Heat Production in theCrust Section of the ContinentalLithosphere
[8] Surface heat flow decreases with tectonic age[Nyblade and Pollack, 1993]. Surface heat flow inArchean cratons and early Proterozoic terrainswithin 400 km of the craton margin is 40–44 mW/m2, and increases to 54–58 mW/m2 inProterozoic terrains [Nyblade and Pollack, 1993].Estimates of surface heat flow in Phanerozoicregions give 63–76 mW/m2 [Sclater et al.,1980]. However, there is a notable exception tothis simple rule: the Canadian shield, where surfaceheat flow is the same in Archean (42 ± 10 mW/m2)and Proterozoic (43 ± 11 mW/m2) provinces[Mareschal and Jaupart, 2004; Rolandone et al.,2003; Jaupart and Mareschal, 1999]. The crustalradiogenic heat production in the continents ishighly heterogeneous. It ranges between 0.35–0.73 mW/m3 in Archean regions, 0.7–0.9 mW/m3
in Proterozoic regions and 0.96–1.38 mW/m3 inPhanerozoic regions [Jaupart and Mareschal,2003; Artemieva and Mooney, 2001; Rudnick andFountain, 1995]. These variations are mainlyexplained by the chemical heterogeneity of thecontinental crust. Archean crust tends to be dom-inated by Na-rich granitoids, as opposed to K-richgranitoids in younger crust [Martin, 1993]. Erosionprocesses amplify this contrast by removing theupper part of the crust which is rich in radioele-ments. As a result, in the present modeling weconsider cases of crustal radiogenic heating whichvaries laterally between 0 and 0.84 mW/m3.
2.3. Thermal Conductivity
[9] The modeling presented below suggests that ahigh thermal conductivity of Archean lithosphere isessential to produce a thick cold root. Thermalconductivity in rocks is complex and depends onmineralogy, chemical composition, temperature,pressure and crystallography. In this section we
GeochemistryGeophysicsGeosystems G3G3
petitjean et al.: archean craton thickness 10.1029/2005GC001053petitjean et al.: archean craton thickness 10.1029/2005GC001053
3 of 26

review the current knowledge on lateral variationsof thermal conductivity in the lithosphere.
2.3.1. Variations of Conductivity WithMineralogy and Chemical Composition
2.3.1.1. In the Crust
[10] Table 1 lists the thermal conductivities of themost abundant crustal minerals. Quartz is by far thebest heat conductor. As a result, quartz content has alarge influence on thermal conductivity of the crust[Pribnow and Umsonst, 1993]. For most crustalrocks, quartz content is positively correlated toSiO2 content when the latter is larger than 55%[Christensen, 1996]. The VP/VS ratio is also corre-lated to the SiO2 content of the crust [Chevrot andvan der Hilst, 2000; Christensen, 1996]. A detailedstudy of VP/VS ratio in the Siberian craton [Egorkin,1998] suggests that the SiO2 content decreases fromthe center to the periphery of the craton. Conse-quently, thermal conductivity of the craton nucleuscould be about 5% higher [Pribnow and Umsonst,1993].
[11] Seismic studies of Archean and Proterozoicprovinces throughout the world favor a somewhatthinner Archean crust (40 km) than early/middleProterozoic crust (45 km) [Mooney et al., 1998]. Atthese depths, the thermal conductivity is�2W/m/Kfor crustal rocks [Seipold, 2001] and 3–3.5 W/m/Kfor mantle rocks [Schatz and Simmons, 1972;Hofmeister, 1999; Seipold, 2001]. Accordingly,the thermal conductivity is 50–75% higher in a5 km thick layer of the Archean craton than in the
early/middle Proterozoic. This is an upper limitsince Rudnick and Fountain [1995] proposed iden-tical thicknesses for the Archean and the Proterozoiccrusts (43 km). But in any case these latter numbersincrease the vertical conductivity averaged throughthe crust and mantle of Archean cratons by less thana few percents. Moreover, xenoliths from the deepcrust and upper mantle often show evidence for agradual transition between the crust and the mantle[Griffin and O’Reilly, 1987]. As a result, seismo-logical and petrologicalMohomay differ and crustalthickness estimates should be considered with care.
2.3.1.2. In the Mantle
[12] Table 1 lists thermal conductivity of the mostabundant mantle minerals. Mean mineralogicalcompositions of Archean and Proterozoic mantlerocks differ, with [olivine/orthopyroxene/clinopyr-oxene/garnet] contents being [69/25/2/4] and[70/15/7/8], respectively [Poudjom Djomani etal., 2001]. However this difference in mineralog-ical composition has a negligible effect on thermalconductivity. Analysis of xenoliths shows a secularevolution from depleted Mg-rich Archean mantleto more fertile Proterozoic mantle [O’Reilly et al.,2001]. This is usually explained by a higher degreeof extraction of ultramafic and mafic melts from aninitially fertile peridotite. The Mg # in olivine andorthopyroxene is 2% higher in Archean than inProterozoic peridotites [Poudjom Djomani et al.,2001]. Using relations of Horai [1971], we esti-mate that a 1% increase in Mg # for olivine ororthopyroxene increases thermal conductivity by0.5–1%. As a result we see that the characteristicchemical composition of the Archean lithosphereonly weakly increases its thermal conductivity.
2.3.2. Variations of ConductivityWith Temperature
2.3.2.1. In the Crust
[13] An increase in temperature generally decreasesthe conductivity of minerals: for instance it reducesthat of the crust from about 3.3W/m/K at the surfacedown to 1.9 W/m/K at its base (with a mean of2.5 W/m/K) [Seipold, 2001]. This effect mainlyoccurs at low temperatures (i.e., in the upper crust)and becomes negligible in the lower crust [Seipold,2001]. As a result, the large Moho temperaturecontrast between Archean and Proterozoic (with amaximum value of about 150�C, according to pale-ogeotherms [O’Reilly et al., 2001]) can only en-hance the mean thermal conductivity of the Archeancrust by less than a few percents.
Table 1. Thermal Conductivity of the Most AbundantCrustal and Mantle Mineralsa
Mineral l
CrustalQuartz 7.7Amphibole 2.8Orthoclase 2.3Albite 2.3Biotite 2.0Anorthite 1.7
MantleForsterite 5.1Clinopyroxene 4.9Olivine 4.6Orthopyroxene 4.3Garnet 3.2Fayalite 3.2
aThermal conductivity is in l in W/m/K. Random mixture powder
at surface temperature and pressure conditions [Clauser and Huenge,1995; Horai, 1971].
GeochemistryGeophysicsGeosystems G3G3
petitjean et al.: archean craton thickness 10.1029/2005GC001053
4 of 26
2.3.2.2. In the Mantle
[14] Hofmeister [1999] suggests that the latticecontribution to thermal conductivity dominatestransport of heat up to 3000 K, which would favora lower radiative contribution than that found pre-viously by Schatz and Simmons [1972]. It resultsthat a thermal conductivity decrease with increasingtemperature in the upper mantle is also expected, butthis effect is only significant at shallow mantletemperatures, close to the crust-mantle interfacetemperature. There, a maximum drop of about150�C only increases the mantle thermal conduc-tivity by 5% and much less below [Hofmeister,1999]. As a matter of fact, this result is specific tothe upper mantle, since the large variations oftemperature in the lower mantle combined withthe strong sensibility of oxides to temperature pro-duces dramatic variations of the thermal conductiv-ity in the lower mantle [van den Berg et al., 2005].
2.3.3. Variation of ConductivityWith Anisotropy
2.3.3.1. In the Crust
[15] Crampin [1994] reviews evidence for crustalanisotropy and concludes that crustal anisotropy ismainly caused by cracks in the upper crust. Below,anisotropy disappears due to closure of cracks.Anisotropy may also be caused by the alignmentof minerals (mainly phyllosilicates [Pribnow andUmsonst, 1993]) in ductile flow. Foliation planeswithin the crust are usually found to be horizontal.However, some near-vertical foliation planes locallyoccur in the Archean crust [Choukroune et al.,1995]. The measured thermal anisotropy of crustalrocks (as in the KTB above 4 km depth) is weak(�1–1.5%) [Pribnow andUmsonst, 1993], suggest-ing that the anisotropy of conductivity in the crust isnegligible.
2.3.3.2. In the Mantle
[16] Experimental and theoretical studies indicatethat the main minerals of the upper mantle (olivineand pyroxene) are anisotropic. Lattice preferredorientations are observed in peridotites from ophio-lites [Nicolas and Christensen, 1987], subductionzones and kimberlites [Mainprice et al., 2000], aswell as in laboratory-deformed mantle samples[Zhang et al., 2000]. Both theoretical [Wenk andChristie, 1991] and experimental studies [Zhang etal., 2000] suggest that plastic deformation in poly-crystalline mantle aggregates generates strong fab-rics, which produce a significant anisotropy of
thermal conductivity [Tommasi et al., 2001]. Forconvection driven by internal heating, vorticitymainly occurred near the surface and along thecold downwellings [McKenzie, 1979], generatingstrong horizontal fabrics along the surface, andvertical ones in the dipping currents. It has beenproposed that nuclei of Archean cratons wereproduced by upwellings [Niu et al., 2003] ordownwellings [Davies, 1992]. They likely inducevertical lineations in Archean lithospheric mantle.Steep anisotropic structure may also be producedby a continental growth through accretion andsubduction [Babuska et al., 1993]. The thermalconductivity parallel to the flow direction can beup to 30% larger than that normal to the flow plane[Tommasi et al., 2001]. We hypothesize that anArchean craton can be a remnant of such verticalmotions in the primitive convective mantle. Astime elapses, the original fabrics remain frozen,except when it is destroyed by a major tectonicevent. It is plausible that the Archean subcrustallithosphere has a vertical fabric which enhances thevertical conductivity by 20–30% compared to thehorizontal conductivity. Some tomographic studieshave found evidence for vertical lineations in somecratons. For instance, a 20–30% thermal anisotropycorresponds to a seismic anisotropy of 8–10% forP-waves and 4–6% for S-waves. By studying thesubcrustal lithosphere, Babuska et al. [1998] showthat VSV � VSH in old shields and platforms whileVSV � VSH in Phanerozoic orogenic belts. Theyconclude that old shields and platforms are char-acterized by anisotropic structures plunging steep-ly, while less inclined anisotropies are found inPhanerozoic regions. In addition, Gung et al.[2003] found, by inverting VSV and VSH separately,that VSV � VSH at depths shallower than 200 kmand VSV � VSH up to 400 km below cratons. In thisstudy, VSV � VSH is explained by shear in themantle convective boundary layer. These resultsare consistent with our assumption of the occur-rence of a fossil vertical lineation in the conductivelithosphere of the Archean craton, while horizontallineations evidenced below are probably related topresent day flow. As a result, we see that it is verylikely that the Archean mantle lithosphere has avertical conductivity 20% to 30% larger than thehorizontal one.
[17] In summary, the physical processes responsi-ble for variations in conductivity all point to ahigher conductivity in the Archean lithosphere thanin the Proterozoic lithosphere. If we set aside theeffect of anisotropy, these enhancements altogetherdo increase the conductivity by less than 10%.
GeochemistryGeophysicsGeosystems G3G3
petitjean et al.: archean craton thickness 10.1029/2005GC001053
5 of 26

Only the vertical enhancement resulting from apossible vertically-frozen lineation can lead to abulk vertical increase of 20% to 30%. In thefollowing, we show that such an amplitude varia-tion along the continental lithosphere is needed toproduce a relatively thick cold cratonic root. As aresult, in our models, we consider a vertical con-ductivity which varies horizontally inside the lith-ospheric mantle from 0% up to 30%. In fact, thethickening due to conductivity is minimized in ourmodels, since it does not take into account theeffects of the other parameters which all combinedare significant while small in comparison to that ofanisotropy.
2.4. Rheology of the Mantle Within andBelow an Archean and a ProterozoicLithosphere
[18] The low geoid/topography ratio of swells overoceanic plates reveals that the mantle viscosity isvertically stratified [Monnereau et al., 1993]. Moreprecisely, the models imply a stratification includ-ing a low-viscosity channel below 200 km depth, alower section of the upper mantle with a relativelyhomogeneous viscosity of 1021 Pa.s and a lowermantle with a bulk viscosity one or two orders ofmagnitude greater than that of the upper mantle[Kaufmann and Lambeck, 2000]. The situation ismore puzzling when we consider the mantle belowshields (Archean and Proterozoic), where the gla-cial rebound data reveal the probable lack of a low-viscosity channel. Karato and Wu [1993] suggestthat, in the upper mantle, the volume of activationof dislocation creep is high, while that of diffusioncreep is low. Yet, they propose that the lack of alow viscosity layer results from the combination ofa relatively low temperature and high pressurebelow upper mantle shields (Archean and Protero-zoic) which inhibits dislocation creep and triggers aNabarro-Herring creep with a particularly lowactivation volume. As a result, the mantle belowshields likely has a viscosity with a weak ornegligible pressure dependence [Jaoul et al.,1995]. Convective laboratory experiments usinggolden syrup show that a fluid with a viscositydepending exponentially on temperature can beapproximated by a constant-viscosity fluid overlaidby a conductive lid [Richter et al., 1983]. Twoparameters control this system: the cutoff temper-ature between conduction and convection, and thebulk viscosity in the convective region. Accord-ingly, thermal lithosphere can be subdivided intotwo regions, one quasi-rigid, the other uniformlyviscous. A viscosity step of about one order of
magnitude occurs through the top convective layerlocated just below the cutoff interface, while theviscosity within the cells is constant [Monnereau etal., 1993; Ribe and Christensen, 1994]. The viscos-ity variation in the boundary layer likely enhancesthe resistance to flow due to the no-slip conditionalong the cutoff interface, and thus slightly increasesthe boundary layer thickness, and reduces thestrength of the convective flow. This effect, however,is much smaller than the effect of variation of thebulk viscosity within the interior of the cells. Clearlythe latter is one of the most important parameter forour model. We first take the usual viscosity valuederived from glacial rebound data: i.e., 1021 Pa.s,and then assess the effect of values ranging between1020 Pa.s and 1022 Pa.s. The last important param-eter is the cutoff temperature between conductionand convection. Text books of mantle rheology linkthis cutoff to �0.75 times the solidus temperature[Stocker and Ashby, 1977; Parsons and McKenzie,1978]. Moreover, numerical experiments run withan Arrhenius rheology and low activation volumeconfirm such a link [Doin et al., 1997]. Solidusmainly depends on mantle composition, pressureand water content. It increases with the Mg # (atconstant pressure) by 13–20�C per 1% Mg # (at3 GPa) [Hirschmann, 2000]. Takahashi et al. [1993]suggest that the solidus of a peridotite withoutclinopyroxene is about 80�C higher than the oneof a fertile peridotite. Solidus of a dry peridotiteincreases with pressure from�1100�C at the surfaceto �1750�C at 180 km depth [Hirschmann, 2000].Solidus of a wet peridotite decreases from 1100�C atthe surface to 1000�C at 70 km depth, and thenincreases again to 1100�C at 180 km depth [Hirthand Kohlstedt, 1996]. At all depth the dry solidusalways occurs at higher temperature than the wetsolidus. At a depth greater than 100 km, the differ-ence between dry and wet solidus reaches �600�C[Pollack, 1986]. Note that the CO2 content has aneffect on the solidus similar but weaker than that ofwater [Pollack, 1986]. Accordingly, temperature atthe bottom of the quasi-rigid lithosphere rangesfrom about 700�C (at 100 km depth) to 850�C (at250 km depth) for a wet mantle, and from about1100�C (at 100 km depth) to 1300�C (at 250 kmdepth) for a dry mantle. According to Doin et al.[1997], all continental roots have a depleted litho-spheric mantle. Hence, as a first application we canconsider that the bottom of a continent is an iso-therm, close to 1200�C. However, it is still conceiv-able that the rate of depletion in volatiles, the Mg #and/or chemical differentiation during melting pro-cesses increase from the Phanerozoic mantle litho-sphere up to the Archean one. As a result, a
GeochemistryGeophysicsGeosystems G3G3
petitjean et al.: archean craton thickness 10.1029/2005GC001053
6 of 26
progressive increase of the cutoff temperature be-tween these two domains is possible [De Smet et al.,2000]. In section 5.5, we test two hypothesesassuming that (1) the cutoff temperature at thebottom of the lithosphere jumps from 1000�C forthe Proterozoic up to 1200�C for the Archean ifthe depletion of rocks results from a progressivereduction of the amount of volatiles or (2) thatthis jump is much weaker (50�C) if depletion isdue to an increase of the Mg # or a chemicaldifferentiation.
3. Modeling the Thermal Fields inArchean Cratons and SurroundingTerrains
3.1. Introduction
[19] Some studies have suggested that the radio-genic mantle heat production was twice as large inArchean times compared to nowadays, whileothers have shown that present and Archean con-tinental geotherms were the same [England andBickle, 1984; Boyd et al., 1985]. These apparentlycontradictory results can be reconciled if the lateralheat transfer from the continental mantle towardthe oceanic mantle was more active in the past thanit is today [Lenardic, 1998]. Boundary layer anal-ysis of convection shows that the temperaturecontrast between the bottom of the conductivelayer and the interior of the convective cells con-strains the mean heat flow transferred by convec-tion [Turcotte et al., 2001]. Thus a quasi steadytemperature implies a quasi-steady heat flow. Ac-cordingly, the 11 to 21 mW/m2 range estimate forthe mantle heat flow through stable continentalplatforms may hold back to Archean times.
[20] Free convection is driven by instabilities occur-ring within boundary layers. Because of viscositystratification, spherical geometry and variation ofthermal expansion and conductivity with depth, hotmantle plumes are much stronger than cold mantleplumes. Moreover, the lower mantle viscosity beingone to two orders of magnitude greater than that ofthe upper mantle [Kaufmann and Lambeck, 2000],the cold plumes remain trapped in the upper mantle[Dubuffet et al., 2000]. The horizontal distancebetween hot plumes and cold plumes thereforediffers by a factor of 5 (6000 km for the hot plumesand about 1200 km for the cold ones). Because oftheir weakness, cold plumes are destroyed whenthey collide with hot plumes. Those located a fewthousand kilometers from a hot plume are simplysheared by the large-scale mantle flow.
[21] Lenardic and Moresi [2001] studied the role ofthe thickness ratio between the conductive litho-sphere and the convective mantle on surface heatflow variations. Their models use a constant vis-cosity, a constant lithosphere thickness and aconstant bottom temperature. They reveal thatlithospheric thickness variations lead to significantcontinental heat flow variations when the thicknessof the convective layer is that of the upper mantle.These results indicate that small-scale convectionwithin the upper mantle has a much strongerimpact on the lithosphere than the whole mantleconvection.
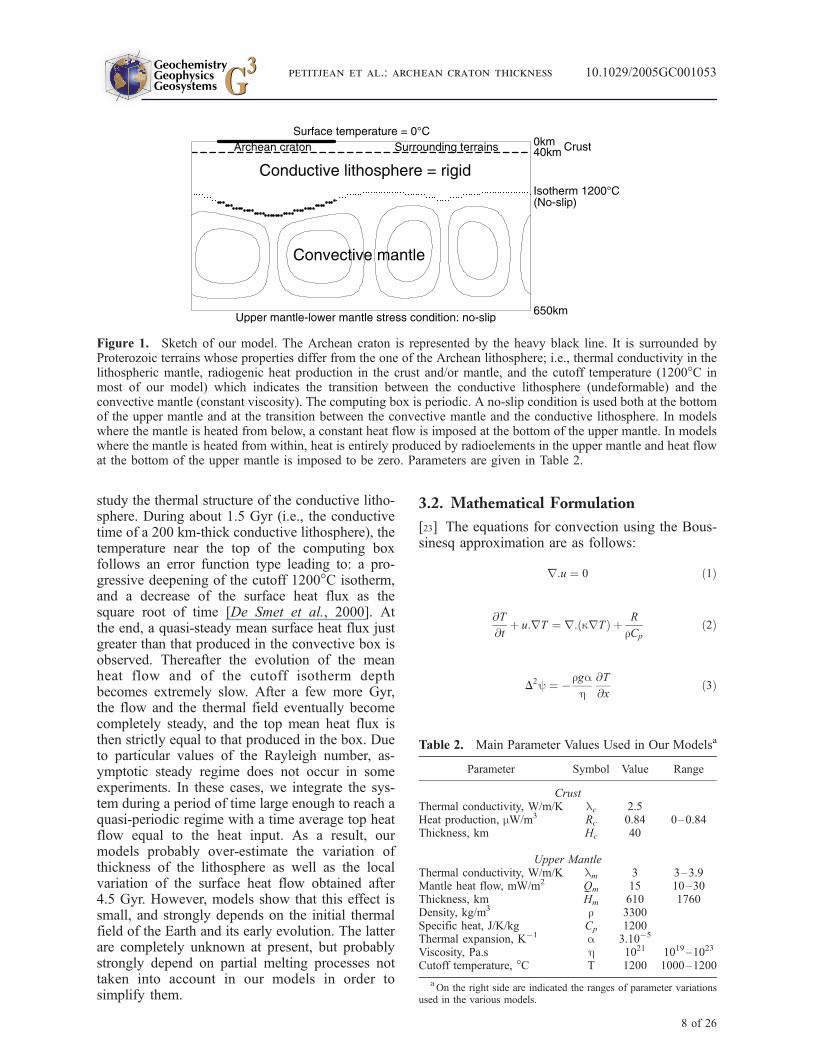
[22] We define an Archean craton as a part of theconductive lithosphere whose properties differfrom those of the surrounding terrains (Figure 1).In our models, the width of the Archean craton is460 km. The vertical and horizontal sizes of thecomputing box are 650 km and 2600 km, respec-tively, which allows the formation of two down-wellings and the comparison between the thermalfields in Archean cratons and surrounding terrains.The crust is 40 km thick (Table 2), and we imposea 0�C surface temperature. The bottom of theconductive lithosphere follows an isotherm (e.g.,1200�C). We make the approximation that theviscosity becomes infinite when temperature islower than this isotherm. At higher temperatureswe assume a constant viscosity and an incompress-ible mantle. Beneath the Precambrian lithosphere,partial melting is unlikely so that a no-slip condi-tion along the bottom of the conductive lithosphereis appropriate. The large viscosity jump betweenthe upper and the lower mantle [Kaufmann andLambeck, 2000] slows the flow along their inter-face. This leads us to consider a no-slip conditionat the bottom of the upper mantle in the model. Weassume a periodicity of flow and temperature in thehorizontal direction in order to avoid edge effects.The thermal conductivities of the crust and mantleare fixed to 2.5 W/m/K and 3 W/m/K, respectively.The amount of radioelements in the conductivemantle being poorly understood, we consider twotypes of models: (1) a first type in which the mantleheat production is homogeneous and (2) a secondone in which the heat production is confined to theconvective mantle (i.e., no radioelement in theconductive mantle). We simplify the problem byassuming that in the convective mantle the sum ofthe heat production related to radioelements (pres-ent and past) and the secular cooling is constantand independent of time. We initially impose arandom temperature field in the convective mantleand a 150 km-thick conductive lithosphere, and
GeochemistryGeophysicsGeosystems G3G3
petitjean et al.: archean craton thickness 10.1029/2005GC001053
7 of 26
study the thermal structure of the conductive litho-sphere. During about 1.5 Gyr (i.e., the conductivetime of a 200 km-thick conductive lithosphere), thetemperature near the top of the computing boxfollows an error function type leading to: a pro-gressive deepening of the cutoff 1200�C isotherm,and a decrease of the surface heat flux as thesquare root of time [De Smet et al., 2000]. Atthe end, a quasi-steady mean surface heat flux justgreater than that produced in the convective box isobserved. Thereafter the evolution of the meanheat flow and of the cutoff isotherm depthbecomes extremely slow. After a few more Gyr,the flow and the thermal field eventually becomecompletely steady, and the top mean heat flux isthen strictly equal to that produced in the box. Dueto particular values of the Rayleigh number, as-ymptotic steady regime does not occur in someexperiments. In these cases, we integrate the sys-tem during a period of time large enough to reach aquasi-periodic regime with a time average top heatflow equal to the heat input. As a result, ourmodels probably over-estimate the variation ofthickness of the lithosphere as well as the localvariation of the surface heat flow obtained after4.5 Gyr. However, models show that this effect issmall, and strongly depends on the initial thermalfield of the Earth and its early evolution. The latterare completely unknown at present, but probablystrongly depend on partial melting processes nottaken into account in our models in order tosimplify them.
3.2. Mathematical Formulation
[23] The equations for convection using the Bous-sinesq approximation are as follows:
r:u ¼ 0 ð1Þ
@T
@tþ u:rT ¼ r: krTð Þ þ R
rCp
ð2Þ
D2y ¼ rgah
@T
@xð3Þ
Figure 1. Sketch of our model. The Archean craton is represented by the heavy black line. It is surrounded byProterozoic terrains whose properties differ from the one of the Archean lithosphere; i.e., thermal conductivity in thelithospheric mantle, radiogenic heat production in the crust and/or mantle, and the cutoff temperature (1200�C inmost of our model) which indicates the transition between the conductive lithosphere (undeformable) and theconvective mantle (constant viscosity). The computing box is periodic. A no-slip condition is used both at the bottomof the upper mantle and at the transition between the convective mantle and the conductive lithosphere. In modelswhere the mantle is heated from below, a constant heat flow is imposed at the bottom of the upper mantle. In modelswhere the mantle is heated from within, heat is entirely produced by radioelements in the upper mantle and heat flowat the bottom of the upper mantle is imposed to be zero. Parameters are given in Table 2.
Table 2. Main Parameter Values Used in Our Modelsa
Parameter Symbol Value Range
CrustThermal conductivity, W/m/K lc 2.5Heat production, mW/m3 Rc 0.84 0–0.84Thickness, km Hc 40
Upper MantleThermal conductivity, W/m/K lm 3 3–3.9Mantle heat flow, mW/m2 Qm 15 10–30Thickness, km Hm 610 1760Density, kg/m3 r 3300Specific heat, J/K/kg Cp 1200Thermal expansion, K1 a 3.105
Viscosity, Pa.s h 1021 1019–1023
Cutoff temperature, �C T 1200 1000–1200
aOn the right side are indicated the ranges of parameter variations
used in the various models.
GeochemistryGeophysicsGeosystems G3G3
petitjean et al.: archean craton thickness 10.1029/2005GC001053
8 of 26
and the equation of state is
r ¼ r0 1 aTð Þ ð4Þ
where u is the velocity field, T the temperature, tthe time, y the stream function, r the density, g thegravity acceleration, a the coefficient of thermalexpansion, R the heat production, Cp the specificheat, h the dynamic viscosity and k the thermaldiffusivity. The parameter values are listed inTable 2. We use the following expression for theRayleigh number:
Ra ¼ gaRH5
Cpk2hð5Þ
where H is the upper mantle thickness. Using theparameter values of Table 2, Ra = 9.105. In the heatequation, the adiabatic and frictional heating areignored, and calculated temperatures inside theconvective mantle actually correspond to potentialtemperatures.
3.3. Numerical Technique
[24] We use a two-step procedure to discretize themomentum equation. First, assuming that the fluidfills up the whole rectangular computing box, theequation is discretized using the alternating direc-tion scheme developed byConte andDames [1960].Second, in the discretized system of equations, weconstrain the stream function to be zero for the gridpoints located inside the conductive lithosphere. Weuse 65 points vertically in the 650 km-thick layer.The same�10 km grid spacing is used horizontally.We have benchmarked our code comparing the flowin a constant lithospheric thickness model withthe one obtained after a Fourier inversion of themomentum equation. We resolve the temperatureequation using the finite difference scheme ofDouglas and Rachford [1956]. The resolution ofthe temperature equation has been benchmarked inprevious studies [Rabinowicz et al., 1980; Dubuffetet al., 2000; Monnereau and Quere, 2001].
4. Results for a HorizontallyHomogeneous Proterozoic Lithosphere
[25] We consider a first model in which heatproduction and thermal conductivity are horizon-tally homogeneous in the crust and mantle(Table 2). The bottom of the conductive lithospherefollows an isotherm. It is thinner above upwellingsand thicker above downwellings. We investigatehow the 2D structure of the conductive lithosphere
depends on (1) heating mode, (2) mantle heat flow,and (3) mantle viscosity.
4.1. Role of the Heating Mode
[26] Models 1 and 2 (Figures 2a and 2b) displaythe thermal structure of the conductive lithospherewhen the mantle is entirely heated from below andfrom within, respectively. Both models generate amantle heat flow of 15 mW/m2.
[27] In Model 1, two thermal boundary layersdevelop (Figure 2a). The bottom boundary layergenerates narrow upwellings, while the top bound-ary layer produces narrow downwellings. Theconvective velocity reaches a maximum of0.9 cm/yr in the hot mantle plumes and 0.7 cm/yrin the cold plumes. Topography at the bottom ofthe conductive lithosphere reaches 132 km inamplitude (Table 3, top section), and induces heatflow variations of 8 mW/m2 along the Moho.Above hot mantle plumes, the conductive litho-sphere is strongly but slowly eroded. Therefore it isvery unlikely that hot mantle plumes have enoughtime to erode a lithosphere moving relative to thelower mantle (see section 6.2).
[28] In Model 2, since there is no bottom heating,only a top thermal boundary layer is generated.Therefore the downwellings are narrow and fastand upwellings are very broad and slow (Figure 2b).The convective velocity reaches a maximum of0.6 cm/yr in the cold plumes. The conductive litho-sphere has a mean thickness of 194 km, and peak tobottom variations in thickness of 50 km (Table 3,middle section), inducing a top heat flow variation of2 mW/m2 along the Moho, a value within the errorbar of heat flow measurements [Mareschal andJaupart, 2004].
[29] In both models the potential temperature insidethe convective cells is �1400�C. This is consistentwith the temperature derived from olivine-spineltransition at 410 km depth [Katsura et al., 2004].When the mantle is heated from within and frombelow the potential temperatures at 650 km depthare 1470�C and 1840�C, respectively. The lattervalue is probably too high as estimates give 1600 ±50�C at the 660 km discontinuity (i.e., a potentialtemperature �1400 ± 50�C) [Katsura et al., 2004].In the following sections, we will therefore focus onan upper mantle heated from within.
4.2. Role of Mantle Heat Flow
[30] We first develop a set of models with ahorizontally homogeneous mantle heat production.
GeochemistryGeophysicsGeosystems G3G3
petitjean et al.: archean craton thickness 10.1029/2005GC001053
9 of 26
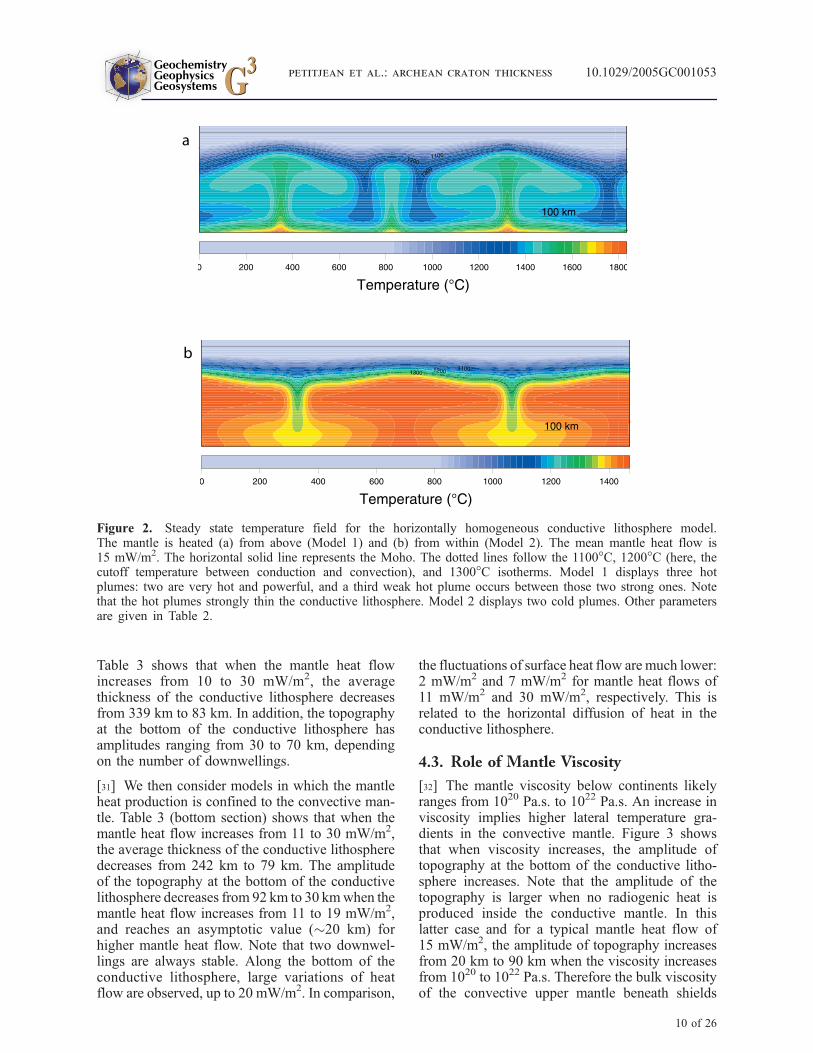
Table 3 shows that when the mantle heat flowincreases from 10 to 30 mW/m2, the averagethickness of the conductive lithosphere decreasesfrom 339 km to 83 km. In addition, the topographyat the bottom of the conductive lithosphere hasamplitudes ranging from 30 to 70 km, dependingon the number of downwellings.
[31] We then consider models in which the mantleheat production is confined to the convective man-tle. Table 3 (bottom section) shows that when themantle heat flow increases from 11 to 30 mW/m2,the average thickness of the conductive lithospheredecreases from 242 km to 79 km. The amplitudeof the topography at the bottom of the conductivelithosphere decreases from 92 km to 30 kmwhen themantle heat flow increases from 11 to 19 mW/m2,and reaches an asymptotic value (�20 km) forhigher mantle heat flow. Note that two downwel-lings are always stable. Along the bottom of theconductive lithosphere, large variations of heatflow are observed, up to 20 mW/m2. In comparison,
the fluctuations of surface heat flow are much lower:2 mW/m2 and 7 mW/m2 for mantle heat flows of11 mW/m2 and 30 mW/m2, respectively. This isrelated to the horizontal diffusion of heat in theconductive lithosphere.
4.3. Role of Mantle Viscosity
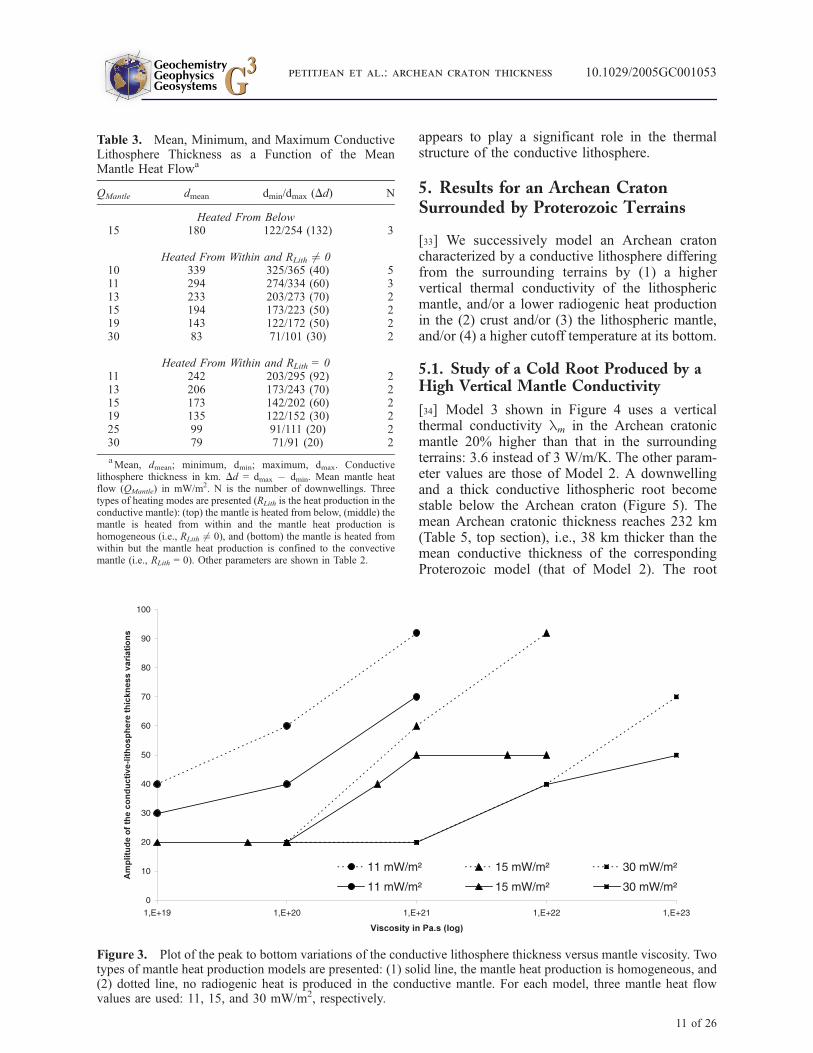
[32] The mantle viscosity below continents likelyranges from 1020 Pa.s. to 1022 Pa.s. An increase inviscosity implies higher lateral temperature gra-dients in the convective mantle. Figure 3 showsthat when viscosity increases, the amplitude oftopography at the bottom of the conductive litho-sphere increases. Note that the amplitude of thetopography is larger when no radiogenic heat isproduced inside the conductive mantle. In thislatter case and for a typical mantle heat flow of15 mW/m2, the amplitude of topography increasesfrom 20 km to 90 km when the viscosity increasesfrom 1020 to 1022 Pa.s. Therefore the bulk viscosityof the convective upper mantle beneath shields
Figure 2. Steady state temperature field for the horizontally homogeneous conductive lithosphere model.The mantle is heated (a) from above (Model 1) and (b) from within (Model 2). The mean mantle heat flow is15 mW/m2. The horizontal solid line represents the Moho. The dotted lines follow the 1100�C, 1200�C (here, thecutoff temperature between conduction and convection), and 1300�C isotherms. Model 1 displays three hotplumes: two are very hot and powerful, and a third weak hot plume occurs between those two strong ones. Notethat the hot plumes strongly thin the conductive lithosphere. Model 2 displays two cold plumes. Other parametersare given in Table 2.
GeochemistryGeophysicsGeosystems G3G3
petitjean et al.: archean craton thickness 10.1029/2005GC001053
10 of 26
appears to play a significant role in the thermalstructure of the conductive lithosphere.
5. Results for an Archean CratonSurrounded by Proterozoic Terrains
[33] We successively model an Archean cratoncharacterized by a conductive lithosphere differingfrom the surrounding terrains by (1) a highervertical thermal conductivity of the lithosphericmantle, and/or a lower radiogenic heat productionin the (2) crust and/or (3) the lithospheric mantle,and/or (4) a higher cutoff temperature at its bottom.
5.1. Study of a Cold Root Produced by aHigh Vertical Mantle Conductivity
[34] Model 3 shown in Figure 4 uses a verticalthermal conductivity lm in the Archean cratonicmantle 20% higher than that in the surroundingterrains: 3.6 instead of 3 W/m/K. The other param-eter values are those of Model 2. A downwellingand a thick conductive lithospheric root becomestable below the Archean craton (Figure 5). Themean Archean cratonic thickness reaches 232 km(Table 5, top section), i.e., 38 km thicker than themean conductive thickness of the correspondingProterozoic model (that of Model 2). The root
Table 3. Mean, Minimum, and Maximum ConductiveLithosphere Thickness as a Function of the MeanMantle Heat Flowa
QMantle dmean dmin/dmax (Dd) N
Heated From Below15 180 122/254 (132) 3
Heated From Within and RLith 6¼ 010 339 325/365 (40) 511 294 274/334 (60) 313 233 203/273 (70) 215 194 173/223 (50) 219 143 122/172 (50) 230 83 71/101 (30) 2
Heated From Within and RLith = 011 242 203/295 (92) 213 206 173/243 (70) 215 173 142/202 (60) 219 135 122/152 (30) 225 99 91/111 (20) 230 79 71/91 (20) 2
aMean, dmean; minimum, dmin; maximum, dmax. Conductive
lithosphere thickness in km. Dd = dmax dmin. Mean mantle heatflow (QMantle) in mW/m2. N is the number of downwellings. Threetypes of heating modes are presented (RLith is the heat production in theconductive mantle): (top) the mantle is heated from below, (middle) themantle is heated from within and the mantle heat production ishomogeneous (i.e., RLith 6¼ 0), and (bottom) the mantle is heated fromwithin but the mantle heat production is confined to the convectivemantle (i.e., RLith = 0). Other parameters are shown in Table 2.
Figure 3. Plot of the peak to bottom variations of the conductive lithosphere thickness versus mantle viscosity. Twotypes of mantle heat production models are presented: (1) solid line, the mantle heat production is homogeneous, and(2) dotted line, no radiogenic heat is produced in the conductive mantle. For each model, three mantle heat flowvalues are used: 11, 15, and 30 mW/m2, respectively.
GeochemistryGeophysicsGeosystems G3G3
petitjean et al.: archean craton thickness 10.1029/2005GC001053
11 of 26
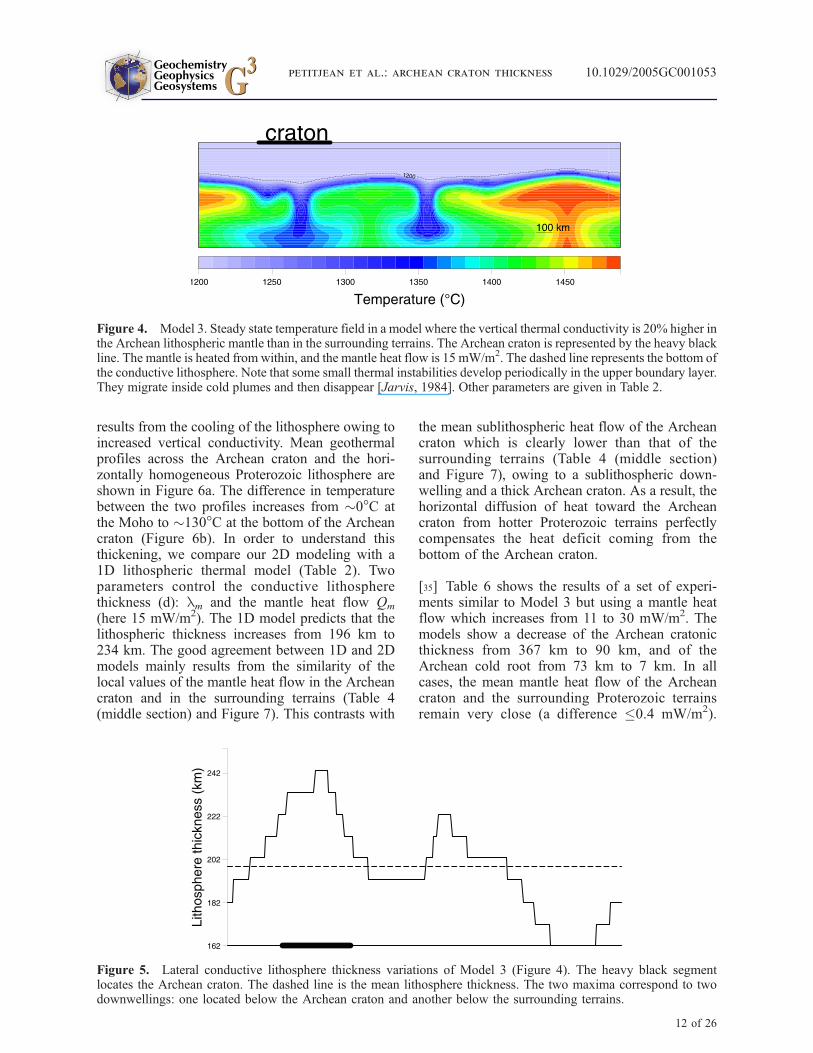
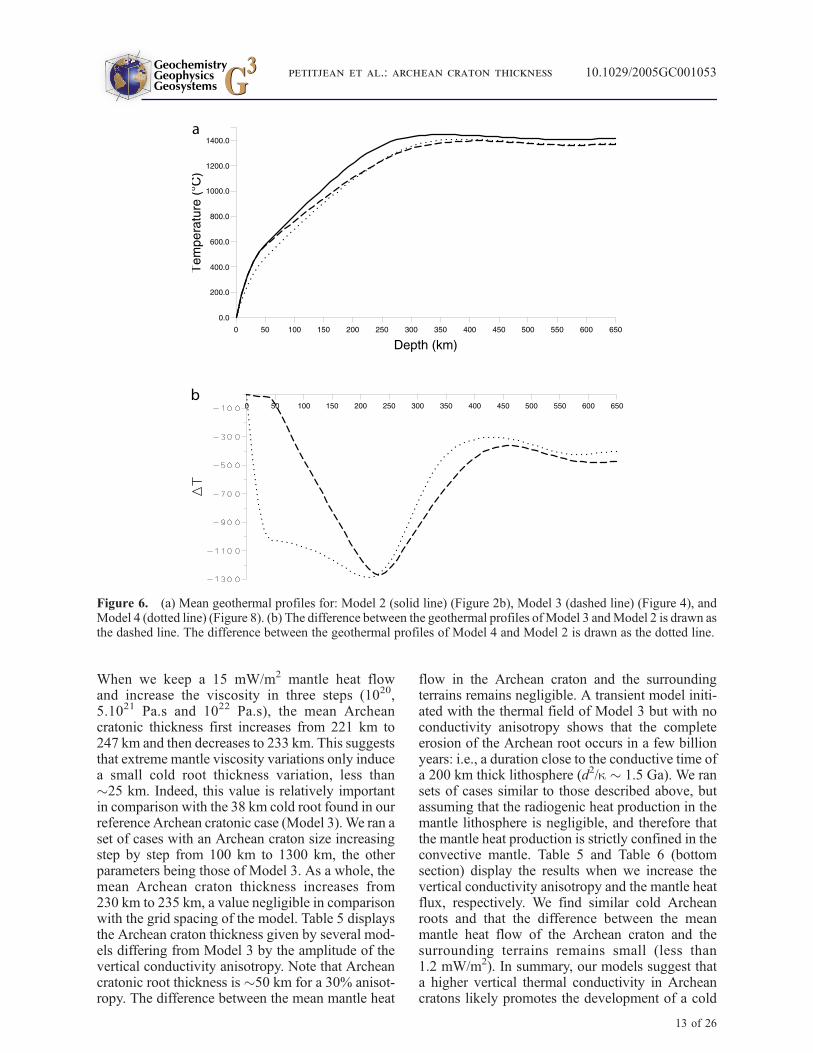
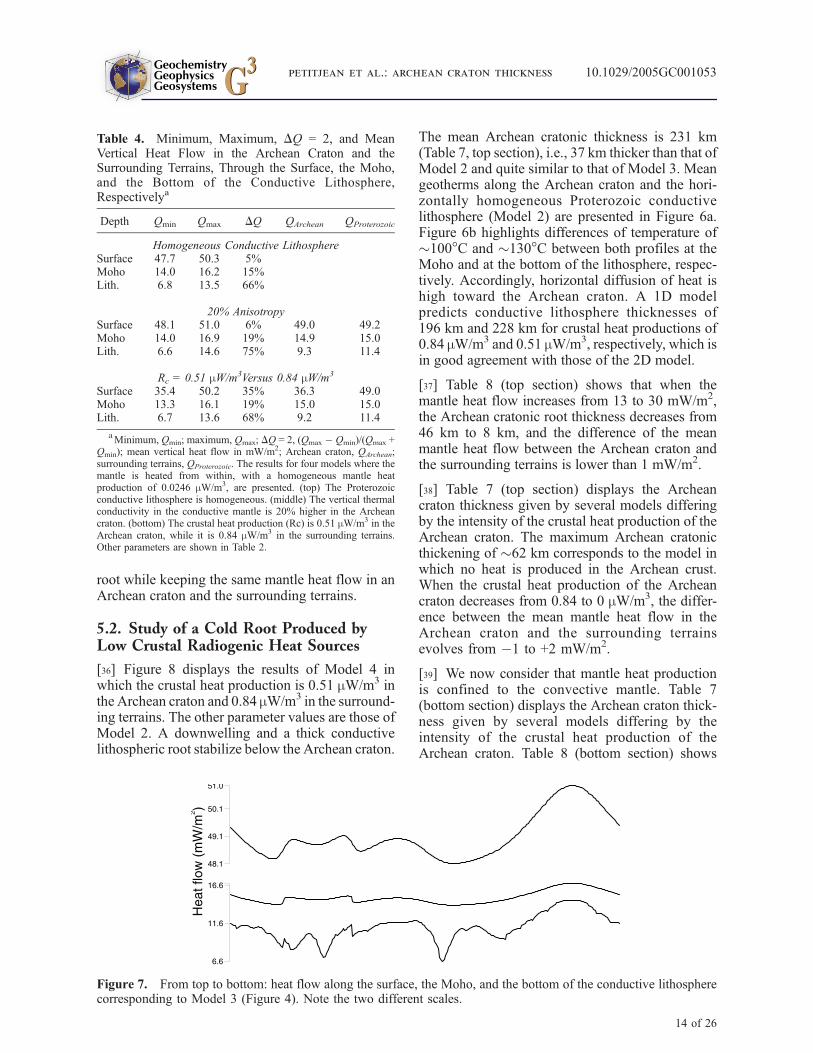
results from the cooling of the lithosphere owing toincreased vertical conductivity. Mean geothermalprofiles across the Archean craton and the hori-zontally homogeneous Proterozoic lithosphere areshown in Figure 6a. The difference in temperaturebetween the two profiles increases from �0�C atthe Moho to �130�C at the bottom of the Archeancraton (Figure 6b). In order to understand thisthickening, we compare our 2D modeling with a1D lithospheric thermal model (Table 2). Twoparameters control the conductive lithospherethickness (d): lm and the mantle heat flow Qm
(here 15 mW/m2). The 1D model predicts that thelithospheric thickness increases from 196 km to234 km. The good agreement between 1D and 2Dmodels mainly results from the similarity of thelocal values of the mantle heat flow in the Archeancraton and in the surrounding terrains (Table 4(middle section) and Figure 7). This contrasts with
the mean sublithospheric heat flow of the Archeancraton which is clearly lower than that of thesurrounding terrains (Table 4 (middle section)and Figure 7), owing to a sublithospheric down-welling and a thick Archean craton. As a result, thehorizontal diffusion of heat toward the Archeancraton from hotter Proterozoic terrains perfectlycompensates the heat deficit coming from thebottom of the Archean craton.
[35] Table 6 shows the results of a set of experi-ments similar to Model 3 but using a mantle heatflow which increases from 11 to 30 mW/m2. Themodels show a decrease of the Archean cratonicthickness from 367 km to 90 km, and of theArchean cold root from 73 km to 7 km. In allcases, the mean mantle heat flow of the Archeancraton and the surrounding Proterozoic terrainsremain very close (a difference �0.4 mW/m2).
Figure 4. Model 3. Steady state temperature field in a model where the vertical thermal conductivity is 20% higher inthe Archean lithospheric mantle than in the surrounding terrains. The Archean craton is represented by the heavy blackline. The mantle is heated from within, and the mantle heat flow is 15 mW/m2. The dashed line represents the bottom ofthe conductive lithosphere. Note that some small thermal instabilities develop periodically in the upper boundary layer.They migrate inside cold plumes and then disappear [Jarvis, 1984]. Other parameters are given in Table 2.
Figure 5. Lateral conductive lithosphere thickness variations of Model 3 (Figure 4). The heavy black segmentlocates the Archean craton. The dashed line is the mean lithosphere thickness. The two maxima correspond to twodownwellings: one located below the Archean craton and another below the surrounding terrains.
GeochemistryGeophysicsGeosystems G3G3
petitjean et al.: archean craton thickness 10.1029/2005GC001053
12 of 26
When we keep a 15 mW/m2 mantle heat flowand increase the viscosity in three steps (1020,5.1021 Pa.s and 1022 Pa.s), the mean Archeancratonic thickness first increases from 221 km to247 km and then decreases to 233 km. This suggeststhat extreme mantle viscosity variations only inducea small cold root thickness variation, less than�25 km. Indeed, this value is relatively importantin comparison with the 38 km cold root found in ourreference Archean cratonic case (Model 3).We ran aset of cases with an Archean craton size increasingstep by step from 100 km to 1300 km, the otherparameters being those of Model 3. As a whole, themean Archean craton thickness increases from230 km to 235 km, a value negligible in comparisonwith the grid spacing of the model. Table 5 displaysthe Archean craton thickness given by several mod-els differing from Model 3 by the amplitude of thevertical conductivity anisotropy. Note that Archeancratonic root thickness is �50 km for a 30% anisot-ropy. The difference between the mean mantle heat
flow in the Archean craton and the surroundingterrains remains negligible. A transient model initi-ated with the thermal field of Model 3 but with noconductivity anisotropy shows that the completeerosion of the Archean root occurs in a few billionyears: i.e., a duration close to the conductive time ofa 200 km thick lithosphere (d2/k � 1.5 Ga). We ransets of cases similar to those described above, butassuming that the radiogenic heat production in themantle lithosphere is negligible, and therefore thatthe mantle heat production is strictly confined in theconvective mantle. Table 5 and Table 6 (bottomsection) display the results when we increase thevertical conductivity anisotropy and the mantle heatflux, respectively. We find similar cold Archeanroots and that the difference between the meanmantle heat flow of the Archean craton and thesurrounding terrains remains small (less than1.2 mW/m2). In summary, our models suggest thata higher vertical thermal conductivity in Archeancratons likely promotes the development of a cold
Figure 6. (a) Mean geothermal profiles for: Model 2 (solid line) (Figure 2b), Model 3 (dashed line) (Figure 4), andModel 4 (dotted line) (Figure 8). (b) The difference between the geothermal profiles ofModel 3 andModel 2 is drawn asthe dashed line. The difference between the geothermal profiles of Model 4 and Model 2 is drawn as the dotted line.
GeochemistryGeophysicsGeosystems G3G3
petitjean et al.: archean craton thickness 10.1029/2005GC001053
13 of 26
root while keeping the same mantle heat flow in anArchean craton and the surrounding terrains.
5.2. Study of a Cold Root Produced byLow Crustal Radiogenic Heat Sources
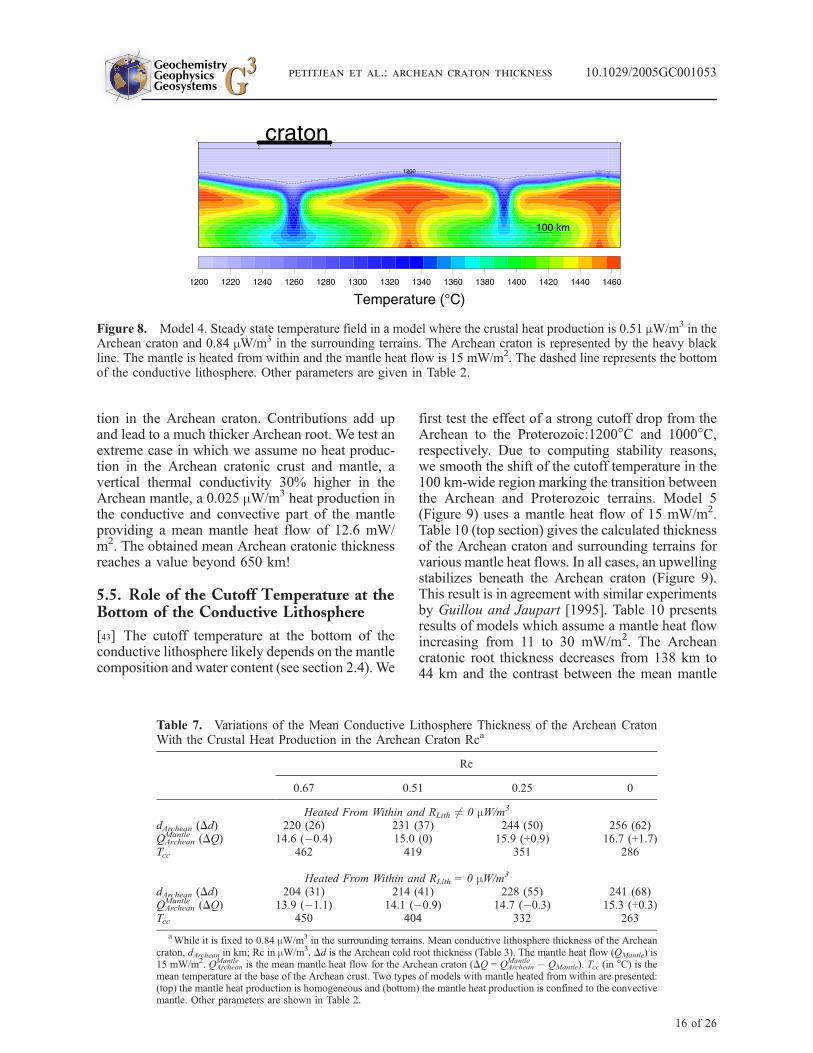
[36] Figure 8 displays the results of Model 4 inwhich the crustal heat production is 0.51 mW/m3 inthe Archean craton and 0.84 mW/m3 in the surround-ing terrains. The other parameter values are those ofModel 2. A downwelling and a thick conductivelithospheric root stabilize below the Archean craton.
The mean Archean cratonic thickness is 231 km(Table 7, top section), i.e., 37 km thicker than that ofModel 2 and quite similar to that of Model 3. Meangeotherms along the Archean craton and the hori-zontally homogeneous Proterozoic conductivelithosphere (Model 2) are presented in Figure 6a.Figure 6b highlights differences of temperature of�100�C and �130�C between both profiles at theMoho and at the bottom of the lithosphere, respec-tively. Accordingly, horizontal diffusion of heat ishigh toward the Archean craton. A 1D modelpredicts conductive lithosphere thicknesses of196 km and 228 km for crustal heat productions of0.84 mW/m3 and 0.51 mW/m3, respectively, which isin good agreement with those of the 2D model.
[37] Table 8 (top section) shows that when themantle heat flow increases from 13 to 30 mW/m2,the Archean cratonic root thickness decreases from46 km to 8 km, and the difference of the meanmantle heat flow between the Archean craton andthe surrounding terrains is lower than 1 mW/m2.
[38] Table 7 (top section) displays the Archeancraton thickness given by several models differingby the intensity of the crustal heat production of theArchean craton. The maximum Archean cratonicthickening of �62 km corresponds to the model inwhich no heat is produced in the Archean crust.When the crustal heat production of the Archeancraton decreases from 0.84 to 0 mW/m3, the differ-ence between the mean mantle heat flow in theArchean craton and the surrounding terrainsevolves from 1 to +2 mW/m2.
[39] We now consider that mantle heat productionis confined to the convective mantle. Table 7(bottom section) displays the Archean craton thick-ness given by several models differing by theintensity of the crustal heat production of theArchean craton. Table 8 (bottom section) shows
Table 4. Minimum, Maximum, DQ = 2, and MeanVertical Heat Flow in the Archean Craton and theSurrounding Terrains, Through the Surface, the Moho,and the Bottom of the Conductive Lithosphere,Respectivelya
Depth Qmin Qmax DQ QArchean QProterozoic
Homogeneous Conductive LithosphereSurface 47.7 50.3 5%Moho 14.0 16.2 15%Lith. 6.8 13.5 66%
20% AnisotropySurface 48.1 51.0 6% 49.0 49.2Moho 14.0 16.9 19% 14.9 15.0Lith. 6.6 14.6 75% 9.3 11.4
Rc = 0.51 mW/m3Versus 0.84 mW/m3
Surface 35.4 50.2 35% 36.3 49.0Moho 13.3 16.1 19% 15.0 15.0Lith. 6.7 13.6 68% 9.2 11.4
aMinimum, Qmin; maximum, Qmax; DQ = 2, (Qmax Qmin)/(Qmax +
Qmin); mean vertical heat flow in mW/m2; Archean craton, QArchean;surrounding terrains, QProterozoic. The results for four models where themantle is heated from within, with a homogeneous mantle heatproduction of 0.0246 mW/m3, are presented. (top) The Proterozoicconductive lithosphere is homogeneous. (middle) The vertical thermalconductivity in the conductive mantle is 20% higher in the Archeancraton. (bottom) The crustal heat production (Rc) is 0.51 mW/m3 in theArchean craton, while it is 0.84 mW/m3 in the surrounding terrains.Other parameters are shown in Table 2.
Figure 7. From top to bottom: heat flow along the surface, the Moho, and the bottom of the conductive lithospherecorresponding to Model 3 (Figure 4). Note the two different scales.
GeochemistryGeophysicsGeosystems G3G3
petitjean et al.: archean craton thickness 10.1029/2005GC001053
14 of 26

results of models in which the mantle heat flowincreases from 11 to 30 mW/m2. Note that ourresults are very similar to those obtained when themantle lithosphere has radiogenic heat sources.
[40] In summary, all the models above suggest that alow heat production in Archean crust could thickenthe Archean craton, but also that this effect stronglydecreases when the mantle heat flow increases.Finally, weak variations of the mean mantle heatflow between the Archean craton and its surround-ing Proterozoic terrains are also observed.
5.3. Study of a Cold Root Produced byLow Radiogenic Heat Sources in theConductive Mantle
[41] We assume a horizontally homogeneous ther-mal conductivity and a crustal heat production.Radiogenic heat production in the conductive man-
tle is fixed to 0 mW/m3 in the Archean craton and0.03 mW/m3 in the surrounding terrains, a clearlyextreme contrast. When the mantle heat flowincreases from 12.2 mW/m2 to 31 mW/m2, theArchean cratonic root thickness decreases from175 km to 2 km, and the difference between themean mantle heat flow in the Archean craton and inthe surrounding terrains decreases from 4.7 mW/m2 to 1 mW/m2 (Table 9). Thus the lack of heatproduction in the Archean lithospheric mantle maystrongly thicken the Archean craton, but it alsoimplies a drop of the mean mantle heat flow in theArchean craton. This drop should be detectable bysurface heat flow measurements.
5.4. Combined Effects to Produce aCold Root
[42] We combine a higher vertical thermal conduc-tivity and a lower crustal and mantle heat produc-
Table 5. Variations of the Mean Conductive Lithosphere Thickness of the Archean CratonWith the Thermal Conductivity Anisotropy in the Conductive Mantle of the Archean Cratona
Dl
10% 20% 25% 30%
Heated From Within and RLith 6¼ 0 mW/m3
dArchean (Dd) 223 (29) 232 (38) 239 (45) 243 (49)QArcheanMantle (Dd) 14.5 (0.5) 14.9 (0.1) 15.0 (0) 15.2 (+0.2)
Heated From Within and RLith = 0 mW/m3
dArchean (Dd) 201 (28) 211 (38) 227 (54) 231 (58)QArcheanMantle (Dd) 14.0 (1) 14.3 (0.7) 13.9 (1.1) 14.0 (1)
aMean conductive lithosphere thickness of the Archean craton, dArchean in km. Dl = lvertical/lhorizontal 1. Dd is the
Archean cold root thickness, i.e., the difference between dArchean and the mean thickness of a homogeneous Proterozoicconductive lithosphere (Table 3). The mantle heat flow (QMantle) is 15 mW/m2. QArchean
Mantle is the mean mantle heat flowfor the Archean craton (DQ = QArchean
Mantle QMantle). Two types of models with mantle heated from within are presented:(top) the mantle heat production is homogeneous and (bottom) the mantle heat production is confined to the convectivemantle. Other parameters are shown in Table 2.
Table 6. Variations of the Mean Conductive Lithosphere Thickness of the Archean CratonWith the Mantle Heat Flowa
QMantleb
11 13 15 19 30
Heated From Within and RLith 6¼ 0 mW/m3
dArchean (Dd) 367 (73) 286 (53) 232 (38) 167 (24) 90 (7)QArcheanMantle (DQ) 11.2 (+0.2) 13.0 (0) 14.9 (0.1) 18.9 (0.1) 29.6 (0.4)
Heated From Within and RLith = 0 mW/m3
dArchean (Dd) 330 (88) 259 (53) 211 (38) 160 (25) 88 (9)QArcheanMantle (DQ) 9.8 (1.2) 12.0 (1) 14.3 (0.7) 18.3 (0.7) 30.1 (+0.1)
aMean conductive lithosphere thickness of the Archean craton, dArchean in km; mantle heat flow, QMantle. Dd is the
Archean cold root thickness (Table 3). The mantle heat flow (QMantle) is 15 mW/m2. QArcheanMantle is the mean mantle heat
flow for the Archean craton (DQ = QArcheanMantle QMantle). The vertical thermal conductivity is 20% higher in the
conductive mantle of the Archean craton. Two types of models with mantle heated from within are presented: (top) themantle heat production is homogeneous and (bottom) the mantle heat production is confined to the convective mantle.Other parameters are shown in Table 2.
b20% anisotropy.
GeochemistryGeophysicsGeosystems G3G3
petitjean et al.: archean craton thickness 10.1029/2005GC001053
15 of 26
tion in the Archean craton. Contributions add upand lead to a much thicker Archean root. We test anextreme case in which we assume no heat produc-tion in the Archean cratonic crust and mantle, avertical thermal conductivity 30% higher in theArchean mantle, a 0.025 mW/m3 heat production inthe conductive and convective part of the mantleproviding a mean mantle heat flow of 12.6 mW/m2. The obtained mean Archean cratonic thicknessreaches a value beyond 650 km!
5.5. Role of the Cutoff Temperature at theBottom of the Conductive Lithosphere
[43] The cutoff temperature at the bottom of theconductive lithosphere likely depends on the mantlecomposition and water content (see section 2.4). We
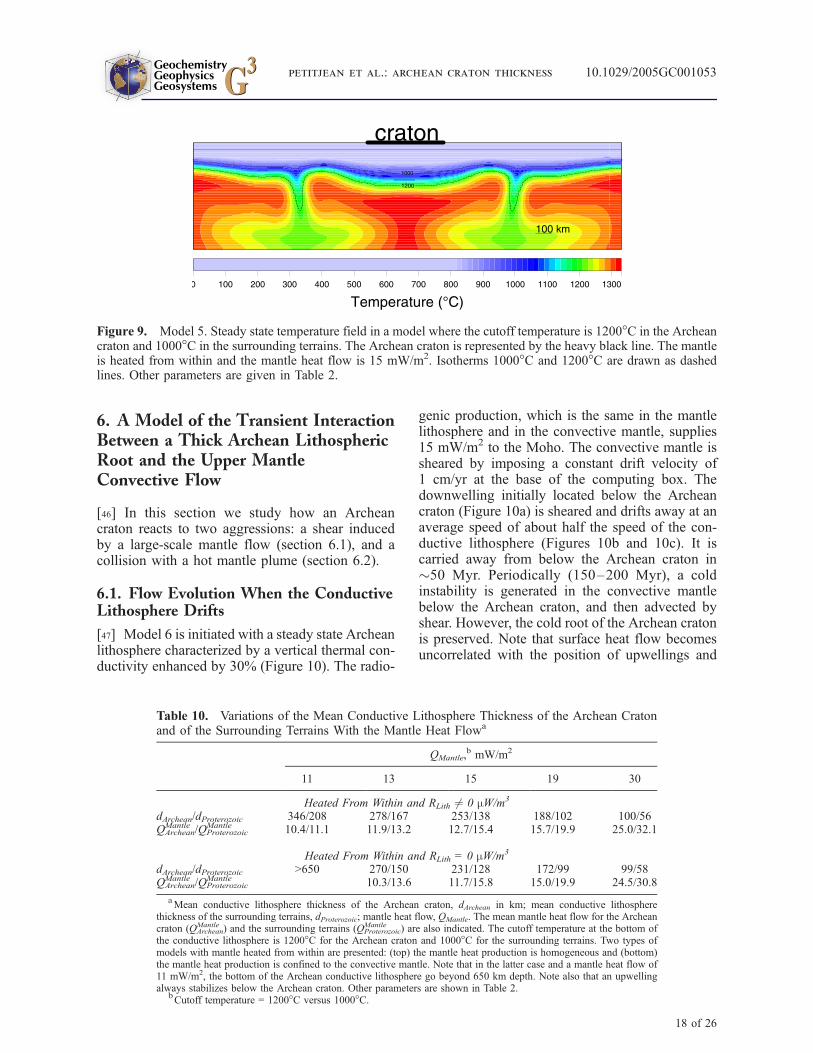
first test the effect of a strong cutoff drop from theArchean to the Proterozoic:1200�C and 1000�C,respectively. Due to computing stability reasons,we smooth the shift of the cutoff temperature in the100 km-wide region marking the transition betweenthe Archean and Proterozoic terrains. Model 5(Figure 9) uses a mantle heat flow of 15 mW/m2.Table 10 (top section) gives the calculated thicknessof the Archean craton and surrounding terrains forvarious mantle heat flows. In all cases, an upwellingstabilizes beneath the Archean craton (Figure 9).This result is in agreement with similar experimentsby Guillou and Jaupart [1995]. Table 10 presentsresults of models which assume a mantle heat flowincreasing from 11 to 30 mW/m2. The Archeancratonic root thickness decreases from 138 km to44 km and the contrast between the mean mantle
Figure 8. Model 4. Steady state temperature field in a model where the crustal heat production is 0.51 mW/m3 in theArchean craton and 0.84 mW/m3 in the surrounding terrains. The Archean craton is represented by the heavy blackline. The mantle is heated from within and the mantle heat flow is 15 mW/m2. The dashed line represents the bottomof the conductive lithosphere. Other parameters are given in Table 2.
Table 7. Variations of the Mean Conductive Lithosphere Thickness of the Archean CratonWith the Crustal Heat Production in the Archean Craton Rca
Rc
0.67 0.51 0.25 0
Heated From Within and RLith 6¼ 0 mW/m3
dArchean (Dd) 220 (26) 231 (37) 244 (50) 256 (62)QArcheanMantle (DQ) 14.6 (0.4) 15.0 (0) 15.9 (+0.9) 16.7 (+1.7)
Tcc 462 419 351 286
Heated From Within and RLith = 0 mW/m3
dArchean (Dd) 204 (31) 214 (41) 228 (55) 241 (68)QArcheanMantle (DQ) 13.9 (1.1) 14.1 (0.9) 14.7 (0.3) 15.3 (+0.3)
Tcc 450 404 332 263
aWhile it is fixed to 0.84 mW/m3 in the surrounding terrains. Mean conductive lithosphere thickness of the Archean
craton, dArchean in km; Rc in mW/m3. Dd is the Archean cold root thickness (Table 3). The mantle heat flow (QMantle) is15 mW/m2. QArchean
Mantle is the mean mantle heat flow for the Archean craton (DQ = QArcheanMantle QMantle). Tcc (in �C) is the
mean temperature at the base of the Archean crust. Two types of models with mantle heated from within are presented:(top) the mantle heat production is homogeneous and (bottom) the mantle heat production is confined to the convectivemantle. Other parameters are shown in Table 2.
GeochemistryGeophysicsGeosystems G3G3
petitjean et al.: archean craton thickness 10.1029/2005GC001053
16 of 26

heat flow in the Archean craton and the surroundingterrains increases from 0.7 to 7.1 mW/m2. Wethen consider models with a mantle radiogenic heatconfined to the convective mantle. Table 10 (bottomsection) shows that this choice does not notablyaffect the thickness of the cold root as well as thesurface heat flows.
[44] In a last set of models, we decrease the cutofftemperature contrast between Archean and Prote-rozoic terrains by successive steps (Table 11).When the cutoff contrast is reduced to 50�C, asub-Archean upwelling develops if we assume thatthe heat production is uniform in the mantle. If weconsider a heat production restricted to the con-vective mantle, however, a sub-Archean downwel-ling occurs. In the former case the Archean cratonis thinned, and in the latter it is thickened. Whenthe cutoff temperature exceeds 50�C, an upwellingstabilizes below the Archean craton, and the Ar-
chean craton evidences a thick cold root. Thereforewe conclude that when the cutoff temperaturecontrast is weak, the localization of a downwellingbeneath the Archean lithosphere controls the litho-sphere thickening and not the thermal gradientsoccurring within the conductive lithosphere.
[45] In summary, we see that a cutoff temperaturejump of about 200�C is able to drastically thicken theArchean lithosphere although upwellings developbeneath it. In that last case, the mean mantle heatflux is much lower in the Archean lithosphere than inthe surrounding Proterozoic one. Alternatively, whenthe cutoff temperature contrast is weak (50�C) thethickening effect is balanced by the localization of anupwelling beneath the Archean craton. We recall thatin section 2.4, we attribute the 200�C contrast ofcutoff temperature to a progressive H2O-depletionwhile the 50�C-one could be related to a progressivechemical depletion of the mantle.
Table 8. Variations of the Mean Conductive Lithosphere Thickness of the Archean CratonWith the Mantle Heat Flowa
QMantle,b mW/m2
11 13 15 19 30
Heated From Within and RLith 6¼ 0 mW/m3
dArchean (Dd) 324 (30) 279 (46) 231 (37) 167 (24) 91 (8)QArcheanMantle (DQ) 11.8 (+0.8) 13.2 (+0.2) 15.0 (0) 18.8 (0.2) 30.5 (+0.5)
Heated From Within and RLith = 0 mW/m3
dArchean (Dd) 317 (75) 256 (50) 214 (41) 160 (25) 92 (13)QArcheanMantle (DQ) 10.2 (0.8) 12.2 (0.8) 14.1 (0.9) 18.1 (0.9) 29.9 (0.1)
aMean conductive lithosphere thickness of the Archean craton, dArchean in km. Dd is the Archean cold root thickness
(Table 3). The mantle heat flow (QMantle) is 15 mW/m2. QArcheanMantle is the mean mantle heat flow for the Archean craton
(DQ = QArcheanMantle QMantle). The crustal heat production is 0.51 mW/m3 in the Archean craton and 0.84 mW/m3 in the
surrounding terrains. Two types of models with mantle heated from within are presented: (top) the mantle heatproduction is homogeneous and (bottom) the mantle heat production is confined to the convective mantle. Note that inthe latter case and for a mantle heat flow of 11 mW/m2, the Archean cold root thickness is only 30 km because threedownwellings are stable instead of two downwellings in all other cases. Other parameters are shown in Table 2.
bRc = 0.51 mW/m3 versus 0.84 mW/m3.
Table 9. Variations of the Mean Conductive Lithosphere Thickness of the Archean Cratonand the Archean Cold Root Thickness With the Mean Mantle Heat Flow Crossing the Base ofthe Conductive Lithospherea
QL,b mW/m2
7 11 15 19 30
QMantle 12.2 14.7 17.7 21.0 31.0dArchean (Dd) 424 (175) 251 (62) 186 (38) 138 (18) 79 (2)QArcheanMantle (DQ) 8.3 (4.7) 11.2 (4.2) 14.3 (4.1) 18.3 (3.3) 30.2 (1.0)
aMean conductive lithosphere thickness of the Archean craton, dArchean in km; Archean cold root thickness, Dd;
mean mantle heat flow crossing the base of the conductive lithosphere, QL. The radiogenic heat production inside theconductive mantle is 0 mW/m3 in the Archean craton and 0.03 mW/m3 in the surrounding terrains. The mean mantle heatflow crossing the Moho (QMantle) and the Archean Moho (QArchean
Mantle ), and the difference of mean mantle heat flowcrossing the Archean and Proterozoic Moho (DQ) are indicated. Other parameters are shown in Table 2.
bRLith. = 0 mW/m3 versus 0.03 mW/m3.
GeochemistryGeophysicsGeosystems G3G3
petitjean et al.: archean craton thickness 10.1029/2005GC001053
17 of 26
6. A Model of the Transient InteractionBetween a Thick Archean LithosphericRoot and the Upper MantleConvective Flow
[46] In this section we study how an Archeancraton reacts to two aggressions: a shear inducedby a large-scale mantle flow (section 6.1), and acollision with a hot mantle plume (section 6.2).
6.1. Flow Evolution When the ConductiveLithosphere Drifts
[47] Model 6 is initiated with a steady state Archeanlithosphere characterized by a vertical thermal con-ductivity enhanced by 30% (Figure 10). The radio-
genic production, which is the same in the mantlelithosphere and in the convective mantle, supplies15 mW/m2 to the Moho. The convective mantle issheared by imposing a constant drift velocity of1 cm/yr at the base of the computing box. Thedownwelling initially located below the Archeancraton (Figure 10a) is sheared and drifts away at anaverage speed of about half the speed of the con-ductive lithosphere (Figures 10b and 10c). It iscarried away from below the Archean craton in�50 Myr. Periodically (150–200 Myr), a coldinstability is generated in the convective mantlebelow the Archean craton, and then advected byshear. However, the cold root of the Archean cratonis preserved. Note that surface heat flow becomesuncorrelated with the position of upwellings and
Figure 9. Model 5. Steady state temperature field in a model where the cutoff temperature is 1200�C in the Archeancraton and 1000�C in the surrounding terrains. The Archean craton is represented by the heavy black line. The mantleis heated from within and the mantle heat flow is 15 mW/m2. Isotherms 1000�C and 1200�C are drawn as dashedlines. Other parameters are given in Table 2.
Table 10. Variations of the Mean Conductive Lithosphere Thickness of the Archean Cratonand of the Surrounding Terrains With the Mantle Heat Flowa
QMantle,b mW/m2
11 13 15 19 30
Heated From Within and RLith 6¼ 0 mW/m3
dArchean/dProterozoic 346/208 278/167 253/138 188/102 100/56QArcheanMantle /QProterozoic
Mantle 10.4/11.1 11.9/13.2 12.7/15.4 15.7/19.9 25.0/32.1
Heated From Within and RLith = 0 mW/m3
dArchean/dProterozoic >650 270/150 231/128 172/99 99/58QArcheanMantle /QProterozoic
Mantle 10.3/13.6 11.7/15.8 15.0/19.9 24.5/30.8
aMean conductive lithosphere thickness of the Archean craton, dArchean in km; mean conductive lithosphere
thickness of the surrounding terrains, dProterozoic; mantle heat flow, QMantle. The mean mantle heat flow for the Archeancraton (QArchean
Mantle ) and the surrounding terrains (QProterozoicMantle ) are also indicated. The cutoff temperature at the bottom of
the conductive lithosphere is 1200�C for the Archean craton and 1000�C for the surrounding terrains. Two types ofmodels with mantle heated from within are presented: (top) the mantle heat production is homogeneous and (bottom)the mantle heat production is confined to the convective mantle. Note that in the latter case and a mantle heat flow of11 mW/m2, the bottom of the Archean conductive lithosphere go beyond 650 km depth. Note also that an upwellingalways stabilizes below the Archean craton. Other parameters are shown in Table 2.
bCutoff temperature = 1200�C versus 1000�C.
GeochemistryGeophysicsGeosystems G3G3
petitjean et al.: archean craton thickness 10.1029/2005GC001053
18 of 26
downwellings. This model shows that Archean coldroots are very stable.
6.2. Destruction of the ConductiveLithosphere by Hot Mantle Plumes
[48] Model 7 is initiated with the same initialparameters and temperature field as those of Model6 (Figure 11). We then impose a hot temperature(2000�C) at the base of the convective mantle, on a460 km-large region centered below the Archeancraton. The hot region generates two hot plumes(Figure 11a) which migrate toward the surface onboth side of the sub-Archean cold plume. It takes110 Myr for the hot plumes to reach the conductivelithosphere. In the meantime, the conductive litho-sphere remains unaffected (Figure 11c). Thereafter,the hot plumes collide with the conductive litho-sphere and progressively thin the Archean craton. Ittakes 210Myr to erode the Archean cold lithosphericroot (Figure 11c). Note that the cold plume remainsstable below the Archean craton during at least750 Myr (Figure 11b). This model shows that thedestruction of an Archean craton by a hot plume isonly possible when the craton is anchored above theplume for a long period of time.
7. Discussion and Conclusion
[49] When associated to a low mantle heat flow of11–21 mW/m2 (typical of Precambrian continents),a higher vertical thermal conductivity, a lowercrustal and mantle radiogenic heat productions,and a higher cutoff temperature at the bottom of
the Archean craton in comparison to those of itssurrounding terrains may strongly thicken its litho-sphere (Figure 12a). When the mantle heat flow ishigher (>30 mW/m2), the thickening is negligibleexcept in the case with a higher cutoff temperature.But in this latter case the mantle heat flow contrastbetween the Archean craton and the surroundingterrains becomes strong enough to be easily detectedby surface heat flow measurements (>7 mW/m2;Figure 12b). If we assume a dry base for an oldcontinental lithosphere and a wet base for an oldoceanic lithosphere [Hirth et al., 2000], a hugecontrast of the cutoff temperature occurs for thesetwo types of conductive lithosphere (see discussionin 2.4). Our models suggest that such a contrastcould explain the mantle heat flow differenceobserved between an old oceanic lithosphere(�40 mW/m2) and an old continental lithosphere(�15 mW/m2). This result is consistent with con-clusions of previous studies [Doin et al., 1997;Lenardic, 1998]. In addition, our models show thatthe other parameters which affect the thermal stateof the lithosphere are completely unable to give analternative explanation. We therefore conclude thatthe explanation proposed by previous studies [Doinet al., 1997; Lenardic, 1998] and our study is veryrobust.
[50] A 200�C cutoff temperature contrast due to amore depleted nature of the bottom of the litho-sphere of the Archean terrain in comparison to theProterozoic terrains could also explain the existenceof Archean roots (Figure 12), although such a modelhardly explains the homogeneity of the mantle heat
Table 11. Variations of the Mean Conductive Lithosphere Thickness of the Archean CratonWith the Cutoff Temperature at the Bottom of the Conductive Lithosphere Below theSurrounding Terraina
TProterozoic
1000�C 1050�C 1100�C 1150�C
Heated From Within and RLith 6¼ 0 mW/m3
dArchean (Dd) 253 (115) 209 (58) 246 (83) 181 (0)QArcheanMantle /QProterozoic
Mantle 12.7/15.4 14.1/15.0 13.3/15.4 15.6/14.8upwelling upwelling downwelling upwelling
Heated From Within and RLith = 0 mW/m3
dArchean (Dd) 231 (103) 202 (61) 191 (43) 206 (48)QArcheanMantle /QProterozoic
Mantle 11.7/15.8 12.1/15.1 13.8/15.3 13.0/15.5upwelling upwelling upwelling downwelling
aMean conductive lithosphere thickness of the Archean craton, dArchean in km; cutoff temperature at the bottom of
the conductive lithosphere below the surrounding terrain, TProterozoic. The cutoff temperature below the Archean cratonis 1200�C. The Archean cold root thickness (Dd) and the presence of a upwelling or downwelling beneath the Archeancraton is indicated. The mean mantle heat flow for the Archean craton (QArchean
Mantle ) and the surrounding terrains(QProterozoic
Mantle ) are also indicated. The mean mantle heat flow is 15 mW/m2. Two types of models with mantle heated fromwithin are presented: (top) the mantle heat production is homogeneous and (bottom) the mantle heat production isconfined to the convective mantle. Other parameters are shown in Table 2.
GeochemistryGeophysicsGeosystems G3G3
petitjean et al.: archean craton thickness 10.1029/2005GC001053
19 of 26
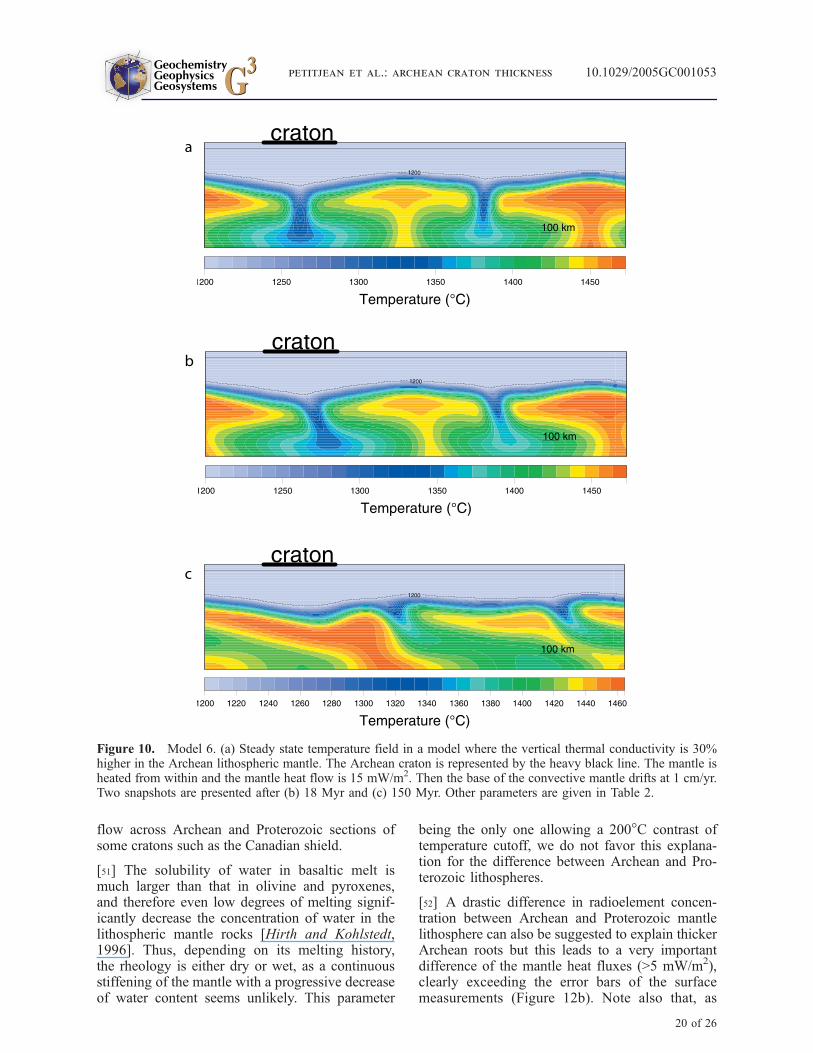
flow across Archean and Proterozoic sections ofsome cratons such as the Canadian shield.
[51] The solubility of water in basaltic melt ismuch larger than that in olivine and pyroxenes,and therefore even low degrees of melting signif-icantly decrease the concentration of water in thelithospheric mantle rocks [Hirth and Kohlstedt,1996]. Thus, depending on its melting history,the rheology is either dry or wet, as a continuousstiffening of the mantle with a progressive decreaseof water content seems unlikely. This parameter
being the only one allowing a 200�C contrast oftemperature cutoff, we do not favor this explana-tion for the difference between Archean and Pro-terozoic lithospheres.
[52] A drastic difference in radioelement concen-tration between Archean and Proterozoic mantlelithosphere can also be suggested to explain thickerArchean roots but this leads to a very importantdifference of the mantle heat fluxes (>5 mW/m2),clearly exceeding the error bars of the surfacemeasurements (Figure 12b). Note also that, as
Figure 10. Model 6. (a) Steady state temperature field in a model where the vertical thermal conductivity is 30%higher in the Archean lithospheric mantle. The Archean craton is represented by the heavy black line. The mantle isheated from within and the mantle heat flow is 15 mW/m2. Then the base of the convective mantle drifts at 1 cm/yr.Two snapshots are presented after (b) 18 Myr and (c) 150 Myr. Other parameters are given in Table 2.
GeochemistryGeophysicsGeosystems G3G3
petitjean et al.: archean craton thickness 10.1029/2005GC001053
20 of 26
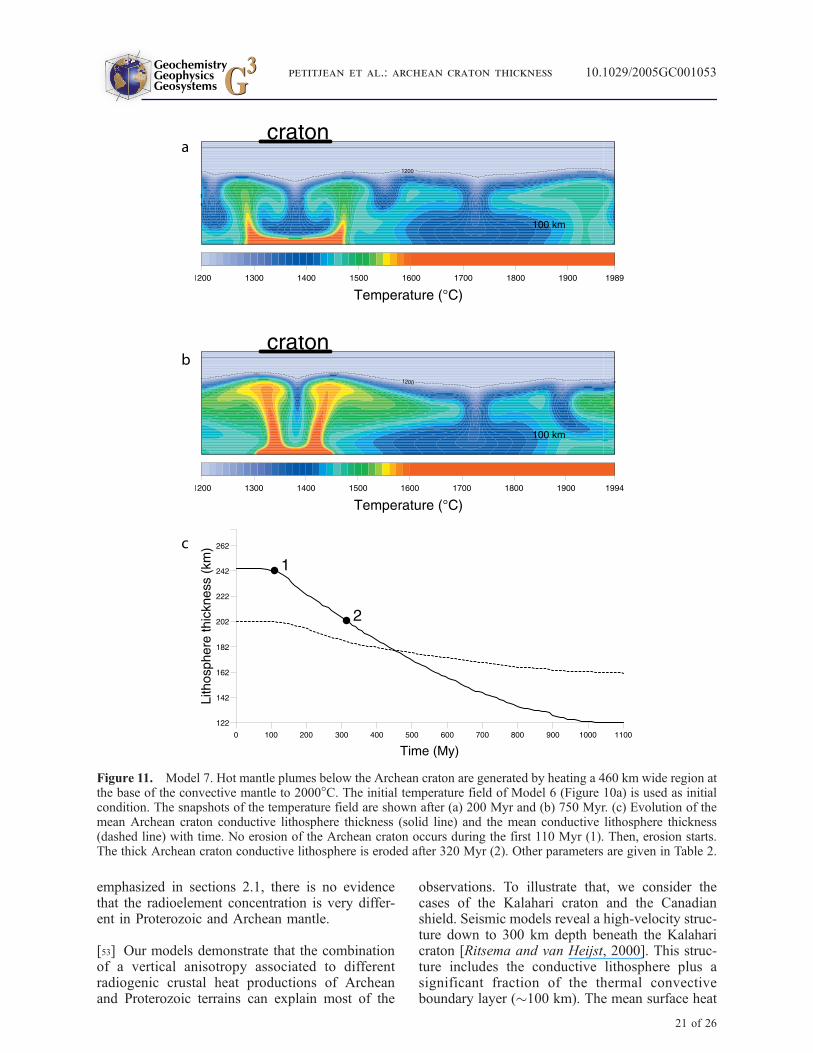
emphasized in sections 2.1, there is no evidencethat the radioelement concentration is very differ-ent in Proterozoic and Archean mantle.
[53] Our models demonstrate that the combinationof a vertical anisotropy associated to differentradiogenic crustal heat productions of Archeanand Proterozoic terrains can explain most of the
observations. To illustrate that, we consider thecases of the Kalahari craton and the Canadianshield. Seismic models reveal a high-velocity struc-ture down to 300 km depth beneath the Kalaharicraton [Ritsema and van Heijst, 2000]. This struc-ture includes the conductive lithosphere plus asignificant fraction of the thermal convectiveboundary layer (�100 km). The mean surface heat
Figure 11. Model 7. Hot mantle plumes below the Archean craton are generated by heating a 460 km wide region atthe base of the convective mantle to 2000�C. The initial temperature field of Model 6 (Figure 10a) is used as initialcondition. The snapshots of the temperature field are shown after (a) 200 Myr and (b) 750 Myr. (c) Evolution of themean Archean craton conductive lithosphere thickness (solid line) and the mean conductive lithosphere thickness(dashed line) with time. No erosion of the Archean craton occurs during the first 110 Myr (1). Then, erosion starts.The thick Archean craton conductive lithosphere is eroded after 320 Myr (2). Other parameters are given in Table 2.
GeochemistryGeophysicsGeosystems G3G3
petitjean et al.: archean craton thickness 10.1029/2005GC001053
21 of 26
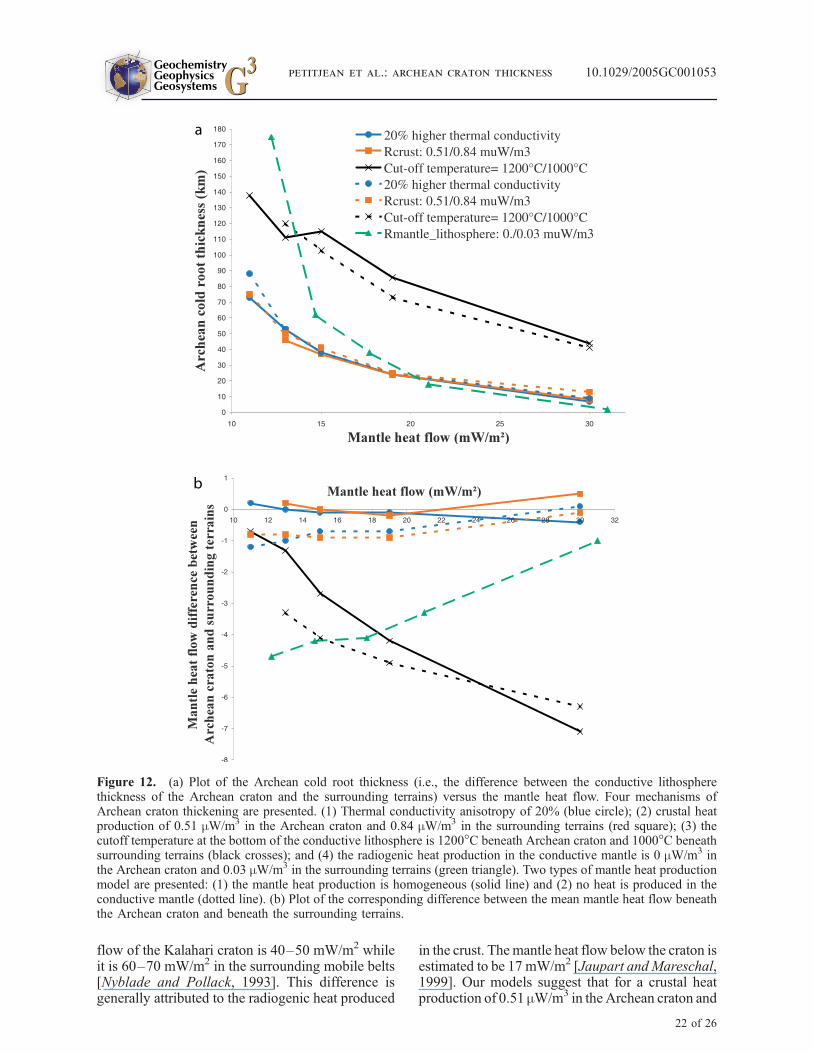
flow of the Kalahari craton is 40–50 mW/m2 whileit is 60–70 mW/m2 in the surrounding mobile belts[Nyblade and Pollack, 1993]. This difference isgenerally attributed to the radiogenic heat produced
in the crust. Themantle heat flow below the craton isestimated to be 17 mW/m2 [Jaupart and Mareschal,1999]. Our models suggest that for a crustal heatproduction of 0.51 mW/m3 in the Archean craton and
Figure 12. (a) Plot of the Archean cold root thickness (i.e., the difference between the conductive lithospherethickness of the Archean craton and the surrounding terrains) versus the mantle heat flow. Four mechanisms ofArchean craton thickening are presented. (1) Thermal conductivity anisotropy of 20% (blue circle); (2) crustal heatproduction of 0.51 mW/m3 in the Archean craton and 0.84 mW/m3 in the surrounding terrains (red square); (3) thecutoff temperature at the bottom of the conductive lithosphere is 1200�C beneath Archean craton and 1000�C beneathsurrounding terrains (black crosses); and (4) the radiogenic heat production in the conductive mantle is 0 mW/m3 inthe Archean craton and 0.03 mW/m3 in the surrounding terrains (green triangle). Two types of mantle heat productionmodel are presented: (1) the mantle heat production is homogeneous (solid line) and (2) no heat is produced in theconductive mantle (dotted line). (b) Plot of the corresponding difference between the mean mantle heat flow beneaththe Archean craton and beneath the surrounding terrains.
GeochemistryGeophysicsGeosystems G3G3
petitjean et al.: archean craton thickness 10.1029/2005GC001053
22 of 26
0.84 mW/m3 in the surrounding terrains, the Archeancratonic lithosphere may be thickened by 30–40 km. A higher crustal heat production contrast isunlikely. Therefore another mechanism is necessaryto explain the thickening of the Kalahari cratoniclithosphere by �100 km compared to the surround-ing terrains. A 20% higher vertical thermal conduc-tivity in the Archean lithospheric mantle would alsothicken the Archean craton by up to 30–40 km. Thecombination of these two parameters may thickenthe Archean craton by up to 80 km, a value clearlycompatible with seismic and petrological data, and itwill produce no mantle heat flux contrast betweenArchean and Proterozoic part of the craton.
[54] In the Canadian shield, seismic tomographyreveals a high-velocity structure down to 350 kmdepth in the Archean core and not deeper than250 km in the surrounding terrains [van der Leeand Nolet, 1997]. The mean surface heat flow isthe same in the Archean and Proterozoic provincesof the Canadian Shield (i.e., the difference issmaller than the detection limit of heat flow mea-surements techniques) [Jaupart and Mareschal,1999]. As shown by Rolandone et al. [2003], themean crustal heat production in these provinces isnearly uniform. Therefore variations of crustal heatproduction cannot explain the thicker Archeanlithospheric root. Moreover, the mantle heat flowis the same below the two types of provinces and isestimated to range from 11 to 15 mW/m2 [Jaupartand Mareschal, 1999; Mareschal and Jaupart,2004]. Our models suggest that a higher verticalthermal conductivity in the Archean core is themost likely mechanism that could explain both theArchean craton thickening and the small variationsof the mantle heat flow measured over the Canadianshield. A vertical thermal conductivity 20% higherin the Archean lithospheric mantle may thicken theArchean craton by up to�90 km and imply a mantleheat flow contrast lower than 1.5 mW/m2. Seismictomography can potentially lead to better estimatesof the temperature, composition and anisotropy ofcontinents. Indeed, vertical anisotropy, temperaturecontrast, Mg # and water content of mantle rockshave an impact on shear wave velocity (Vs). Watercontent only has a negligible effect on Vs in thedepth range 80–250 km [Karato and Jung, 1998].An increase in Mg # by 2–3 units as proposed byPoudjom Djomani et al. [2001] implies a �0.5%increase in Vs [Lee, 2003]. A temperature contrastof 150�C between Archean craton and the surround-ing terrains, as recorded in the conductive litho-sphere of ourmodels, imply a�0.7% increase in Vs.Finally, a vertical thermal anisotropy of 20–30% is
associated to a 4–6% increase in Vs [Tommasi et al.,2001]. Some tomographic models evidence a highvelocity structure beneath cratons with shear veloc-ity anomalies up to +6% extending to about 250 kmdepth [Ritsema and van Heijst, 2000]. Besides, aclear decrease in Vs velocity is observed from thecenter toward the periphery of cratons, with awavelength of about 1000 km [Poupinet et al.,2003]. A 6% increase in Vs requires a temperaturecontrast of �1300�C or a 30 units Mg # increase,both values being unrealistic. Temperature in theconvective mantle at 410 km depth is estimated to be1490 ± 45�C [Katsura et al., 2004], a value consis-tent with the potential temperature found in ourmodels (�1400�C). At 150 km depth beneath anArchean craton, the temperature is �900�C. There-fore a maximum contrast of 600�C between theArchean craton and the mantle below the convectiveboundary layer is likely to occur at this depth,leading to a Vs anomaly of �3%. This estimateof the contrast is consistent with the results ofArtemieva and Mooney [2001]. Therefore it seemsdifficult to try to explain the observed Vs anomalieswithout invoking a vertical anisotropy. These resultsstrongly support our assumption of a fossil verticallineation occurring in the conductive lithosphere ofthe Archean craton.
[55] The evolution of Archean cratons throughoutthe Earth’s history is clearly more complex than inour simple models. During Archean times, thenuclei of cratons were probably made of a depletedlithospheric mantle possibly characterized by astrong vertical fabric. The positive buoyancy dueto the depletion of the cratonic mantle likelybalances the effect of a cold cratonic lithosphere[Poudjom Djomani et al., 2001]. Lateral thermalgradient combined with the shear induced by thecold plume generates compression and uplift of thecratons [Zoback, 1992]. The radiogenic depletionof the Archean cratonic crust could partly resultfrom the erosion induced by that uplift. Moreover,the erosion may also explain the 5 km thicknessdifference observed between Archean and Early/midProterozoic crusts [Mooney et al., 1998]. The plasticdeformation induced by the compression likely en-hanced the vertical lineations of the Archean sub-crustal lithosphere. In addition, the lithospherethickening supplies a depleted mantle with a lowdensity and a low heat production to the base of thelithosphere. Consequently, the radioelement deple-tion and the amplitude of vertical conductivity in-crease during the whole life of the Archean craton.They likely trigger a continuous thickening of theArchean craton, but at an extremely slow rate
GeochemistryGeophysicsGeosystems G3G3
petitjean et al.: archean craton thickness 10.1029/2005GC001053
23 of 26
[Schmeling and Marquart, 1991; Pysklywec et al.,2002]. A hot mantle plume can slightly erode theArchean craton for a while, but when it is removedthe lithosphere thickeningmay eventually start again.
[56] Lateral variations of heat production and/orthermal conductivity in the lithosphere likely con-cerns regions other than Archean cratons. Forinstance, the Kerguelen plateau initiated by a hotmantle plume likely has a vertical fabric, a depletedsubcrustal lithosphere, and a 20–30 km thick crustwith low heat production compared to that of thecontinental crust. This plateau could thicken andbecome a craton in a few billion years.
[57] A further improvement of the modeling wouldbe to introduce a highly viscous lithosphere whichparticipates to the convection but at a velocityseveral orders of magnitude lower than that ofthe convective mantle [Schmeling and Marquart,1991; Pysklywec et al., 2002]. As pointed outabove, the resulting plastic deformation woulddynamically thicken the cold lithosphere at a timescale of a few billion years. It would enhance thethermal thickening of the lithosphere evidenced inour models which simply assume a rigid litho-sphere. It would also be interesting to develop 3Dmodeling. Indeed, in 2D models the downwellingsappear as cold sheets, but they would be cylindricalin 3D. This would likely decrease the heat flowtransported at the top of the downwelling andincrease the thickness of Archean cratons. In ad-dition, the speed of the downwelling flow would behigher and the effects of the shear applied toremove the cold plume will be weaker.
[58] Finally, we believe that future high-resolutiontomographic models will allow to distinguish thecontribution of anisotropy, temperature and Mg #.As a result, convective flows below continents aregoing to be precisely constrained by models.
Acknowledgments
[59] We thank J. C. Mareschal for a review of a first draft of
this paper which has strongly contributed to the improvement
of the present study. Discussions of this work with L. Fleitout,
A. Davaille, J. L. Vigneresse, and A. Briais clearly benefited
the present study. The paper also greatly benefited from the
reviews of W. D. Mooney and A. P. Van den Berg and the
editorial work of P. van Keken.
References
Artemieva, I. M., and W. D. Mooney (2001), Thermal thick-ness and evolution of Precambrian lithosphere: A globalstudy, J. Geophys. Res., 106(B8), 16,387–16,414.
Babuska, V., J. Plomerova, and J. Sileny (1993), Models ofseismic anisotropy in the deep continental lithosphere, Phys.Earth Planet. Int., 78, 167–191.
Babuska, V., J. P. Montagner, J. Plomerova, and N. Girardin(1998), Age-dependent large scale fabric of the mantle litho-sphere as derived from surface-wave velocity anisotropy,Pure Appl. Geophys., 151, 257–280.
Ballard, S., and H. N. Pollack (1987), Diversion of heat byArchean cratons: A model for southern Africa, Earth Planet.Sci. Lett., 85, 253–264.
Boyd, F. R. (1989), Compositional distinction between oceanicand cratonic lithosphere, Earth Planet. Sci. Lett., 96, 15–26.
Boyd, F. R., J. J. Gurney, and S. H. Richardson (1985), Evi-dence for a 150–200 km thick Archaean lithosphere fromdiamond inclusion thermobarometry, Nature, 315, 387–389.
Chevrot, S., and R. van der Hilst (2000), The Poisson ratio ofthe Australian crust: Geological and geophysical implica-tions, Earth Planet. Sci. Lett., 183, 121–132.
Choukroune, P., H. Bouhallier, and N. T. Arndt (1995), Softlithosphere during periods of Archaean crustal growth orcrustal reworking, in Early Precambrian Processes, Geol.Soc. Spec. Publ., 95, 67–86.
Christensen, N. I. (1996), Poisson’s ratio and crustal seismol-ogy, J. Geophys. Res., 101(B2), 3139–3156.
Clauser, C., and E. Huenge (1995), Rock physics and phaserelations, in Handbook of Physical Constants, pp. 105–126,AGU, Washington, D. C.
Conte, S. D., and R. T. Dames (1960), An alternating directionmethod for solving the plate problem with mixed boundaryconditions, J. Assoc. Comput. Mach., 7, 264–273.
Cooper, C. M., A. Lenardic, and L. Moresi (2004), The ther-mal structure of stable continental lithosphere within a dy-namic mantle, Earth Planet. Sci. Lett., 222, 807–817.
Crampin, S. (1994), The fracture criticality of crustal rocks,Geophys. J. Int., 118, 428–438.
Davies, G. F. (1992), On the emergence of plates tectonics,Geology, 20, 963–966.
De Smet, J., A. P. van den Berg, and N. J. Vlaar (2000), Earlyformation and long-term stability of continents resultingfrom decompression melting in a convecting mantle, Tecto-nophysics, 322, 19–33.
Doin, M. P., L. Fleitout, and U. Christensen (1997), Mantleconvection and stability of depleted and undepleted conti-nental lithosphere, J. Geophys. Res., 102, 2771–2787.
Douglas, J., and G. G. Rachford (1956), On the numericalsolution of heat conduction problems in two and three spacevariables, Trans. Am. Math. Soc., 82, 421–439.
Dubuffet, F., M. Rabinowicz, and M. Monnereau (2000),Multiple-scales in mantle convection, Earth Planet. Sci.Lett., 178, 351–366.
Egorkin, A. V. (1998), Velocity structure, composition anddiscrimination of crustal provinces in the former Sovietunion, Tectonophysics, 2978, 395–404.
England, P., and M. Bickle (1984), Continental thermal andtectonic regimes during the Archean, J. Geol., 92, 353–367.
Godard, M., D. Jousselin, and J. L. Bodinier (2000), Relation-ships between geochemistry and structure beneath a paleo-spreading centre: A study of the mantle section in the Omanophiolite, Earth Planet. Sci. Lett., 180, 133–148.
Gregoire, M., D. R. Bell, and A. P. Le Roex (2002), Traceelement geochemistry of glimmerite and marid mantle xeno-liths: Their classification and their relationship to kimberlitesand to phlogopite-bearing peridotites revisited, Contrib.Mineral. Petrol., 142, 603–625.
Griffin, W. L., and S. Y. O’Reilly (1987), Is the continentalMoho the crust-mantle boundary?, Geology, 15, 241–244.
GeochemistryGeophysicsGeosystems G3G3
petitjean et al.: archean craton thickness 10.1029/2005GC001053
24 of 26
Guillou, L., and C. Jaupart (1995), On the effect of continenton mantle convection, J. Geophys. Res., 100(B2), 24,217–24,238.
Guillou, L., J. C. Mareschal, C. Jaupart, C. Gariepy, G. Bienfait,and R. Lapointe (1994), Heat flow, gravity and structure of theabitibi belt, Superior Province, Canada: Implications for man-tle heat flow, Earth. Planet. Sci. Lett., 122, 103–123.
Gung, Y., M. Panning, and B. Romanowicz (2003), Globalanisotropy and the thickness of continents, Nature, 422,707–710.
Hirschmann, M. M. (2000), Mantle solidus: Experimental con-straints and the effects of peridotite composition, Geochem.Geophys. Geosyst., 1(10), doi:10.1029/2000GC000070.
Hirth, G., and D. L. Kohlstedt (1996), Water in the oceanicupper mantle: Implications for rheology, melt extraction andthe evolution of the lithosphere, Earth Planet. Sci. Lett., 144,93–108.
Hirth, G., R. L. Evans, and A. D. Chave (2000), Comparisonof continental and oceanic mantle electrical conductivity: Isthe Archean lithosphere dry?, Geochem. Geophys. Geosyst.,1(12), doi:10.1029/2000GC000048.
Hofmeister, A. M. (1999), Mantle values of thermal conduc-tivity and the geotherm from phonon lifetimes, Science, 283,1699–1705.
Horai, K. I. (1971), Thermal conductivity of rock-formingminerals, J. Geophys. Res., 76(5), 1278–1308.
Jaoul, O., Y. Bertran-Alvarez, R. C. Liebermann, and G. D.Price (1995), Fe-Mg interdiffusionin olivine up to 9 Gpa atT = 600–900C: Experimental data and comparison withdefect calculations, Phys. Earth. Planet. Inter., 89, 199–218.
Jarvis, G. T. (1984), Time dependent convection in the Earth’smantle, Phys. Earth Planet. Inter., 36, 305–327.
Jaupart, C., and J. C. Mareschal (1999), The thermal structureand thickness of continental roots, Lithos, 48, 93–114.
Jaupart, C., and J. C. Mareschal (2003), Constraints on crustalheat production from heat flow data, in Treatise of Geochem-istry, vol. 3, pp. 65–84, Elsevier, New York.
Jochum, K. P., A. W. Hofmann, E. Ito, H. M. Seufert, andW. M. White (1983), K, U and Th in mid-ocean ridge basaltglasses and heat production, K/U and K/Rb in the mantle,Nature, 306, 431–436.
Jordan, T. H. (1978), Composition and development of thecontinental tectosphere, Nature, 274, 544–548.
Jordan, T. H. (1988), Structure and formation of the continen-tal tectosphere, J. Petrol., 29, 11–37.
Karato, S., and H. Jung (1998), Water, partial melting and theorigin of the seismic low velocity and high attenuationzone in the upper mantle, Earth Planet. Sci. Lett., 157,193–207.
Karato, S. I., and P. Wu (1993), Rheology of the upper mantle:A synthesis, Science, 260, 771–778.
Katsura, T., et al. (2004), Olivine-wadsleyite transition in thesystem (Mg,Fe)2SiO4, J. Geophys. Res., 109, B02209,doi:10.1029/2003JB002438.
Kaufmann, G., and K. Lambeck (2000), Mantle dynamics,postglacial rebound and the radial viscosity profile, Phys.Earth Planet. Int., 121, 301–324.
Lee, C. A. (2003), Compositional variation of density andseismic velocities in natural peridotites at STP conditions:Implications for seismic imaging of compositional heteroge-neities in the upper mantle, J. Geophys. Res., 108(B9), 2441,doi:10.1029/2003JB002413.
Lenardic, A. (1998), On the partitioning of mantle heatloss below oceans and continents over time and its relation-ship to the Archaean paradox, Geophys. J. Int., 134, 706–720.
Lenardic, A., and L. Moresi (2001), Heat flow scaling formantle convection below a conducting lid: Resolving see-mingly inconsistent modeling results regarding continentalheat flow, Geophys. Res. Lett., 28(7), 1311–1314.
Mainprice, D., G. Barruol, and W. Ben Ismael (2000), Theseismic anisotropy of the Earth’s mantle: From single crystalto polycrystal, in Earth’s Deep Interior: Mineral Physics andSeismic Tomography From the Atomic Scale to the GlobalScale, Geophys. Monogr. Ser., vol. 117, edited by S. I.Karato et al., pp. 237–264, AGU, Washington, D. C.
Mareschal, J. C., and C. Jaupart (2004), Variations of surfaceheat flow and lithospheric thermal structure beneath theNorth American craton, Earth Planet. Sci. Lett., 223, 65–77.
Martin, H. (1993), The mechanisms of petrogenesis of theArchaean continental crust-Comparison with modern pro-cesses, Lithos, 30, 373–388.
McDonough, W. F., and S. S. Sun (1995), The composition ofthe Earth, Chem. Geol., 120, 223–253.
McKenzie, D. (1979), Finite deformation during fluid flow,Geophys. J. R. Astron. Soc., 58, 689–715.
Monnereau, M., and S. Quere (2001), Spherical shell modelsof mantle convection with tectonics plates, Earth Planet. Sci.Lett., 184(3–4), 575–587.
Monnereau, M., M. Rabinowicz, and E. Arquis (1993), Me-chanical erosion and reheating of the lithosphere: A numer-ical model for hotspot swells, J. Geophys. Res., 98(B1),809–823.
Mooney, W. D., G. Laske, and T. G. Masters (1998), CRUST5.1: A global crustal model at 5� � 5�, J. Geophys. Res.,103(B1), 727–747.
Nicolas, A., and N. I. Christensen (1987), Formation of aniso-tropy in upper mantle peridotites: A review, in Composition,Structure, and Dynamics of the Lithosphere-AsthenosphereSystem, Geodyn. Ser., vol. 16, edited by K. Fuchs andC. Froidevaux, pp. 111–123, AGU, Washington, D. C.
Niu, Y., M. J. O’Hara, and J. A. Pearce (2003), Initiation ofsubduction zones as a consequence of lateral compositionalbuoyancy contrast within the lithosphere: A petrological per-spective, J. Petrol., 44(5), 851–866.
Nyblade, A. A., and H. N. Pollack (1993), A global analysis ofheat flow from precambrian terrains: Implications for thethermal structure of Archean and proterozoic lithosphere,J. Geophys. Res., 98(B7), 12,207–12,218.
O’Reilly, S. Y., W. L. Grifin, Y. H. Poudjom Djomani, andP. Morgan (2001), Are lithospheres forever? Trackingchanges in subcontinental lithospheric mantle through time,GSA Today, 11, 4–9.
Palme, H., and H. S. C. O’Neill (2003), Cosmochemical esti-mates of mantle composition, in Treatise on Geochemistry,vol. 2, pp. 1–38, Elsevier, New York.
Parsons, B., and D. McKenzie (1978), Mantle convection andthe thermal structure of the plates, J. Geophys. Res., 83(B9),4485–4496.
Pinet, C., C. Jaupart, J. C. Marescal, C. Gariepy, G. Bienfait,and R. Lapointe (1991), Heat flow and structure of the litho-sphere in the Eastern Canadian Shield, J. Geophys. Res.,96(B12), 19,941–19,963.
Pollack, H. N. (1986), Cratonization and thermal evolution ofthe mantle, Earth Planet. Sci. Lett., 80, 175–182.
Pollack, H. N., S. J. Hurter, and J. R. Johnson (1993), Heatflow from the Earth’s interior: Analysis of the global data set,Rev. Geophys., 31, 267–280.
Poudjom Djomani, Y. H., S. Y. O’Reilly, W. L. Griffin, andP. Morgan (2001), The density structure of subcontinentallithosphere through time, Earth Planet. Sci. Lett., 184,605–621.
GeochemistryGeophysicsGeosystems G3G3
petitjean et al.: archean craton thickness 10.1029/2005GC001053
25 of 26
Poupinet, G., N. Arndt, and P. Vacher (2003), Seismic tomo-graphy beneath stable tectonic regions and the origin andcomposition of the continental lithospheric mantle, EarthPlanet. Sci. Lett., 212, 89–101.
Pribnow, D., and T. Umsonst (1993), Estimation of thermalconductivity from the mineral composition: Influence offabric and anisotropy, Geophys. Res. Lett., 20(20), 2199–2202.
Pysklywec, R. N., C. Beaumont, and P. Fullsack (2002), Litho-spheric deformation during the early stages of continentalcollision: Numerical experiments and comparison with SouthIsland, New Zealand, J. Geophys. Res., 107(B7), 2133,doi:10.1029/2001JB000252.
Rabinowicz, M., B. Lago, and C. Froideveaux (1980), Thermaltransfer between the continental asthenosphere and theoceanic subducting lithosphere: Its effect on subcontinentalconvection, J. Geophys. Res., 85(B4), 1839–1853.
Ribe, N. M., and U. Christensen (1994), Three-dimensionalmodeling of a mantle plume-lithosphere interaction, J. Geo-phys. Res., 99, 669–682.
Richter, F. M., H. C. Nataf, and S. F. Daly (1983), Heat transferand horizontally averaged temperature of convectionwith large viscosity variations, J. Fluid Mech., 129, 173–192.
Ritsema, J., and H. van Heijst (2000), New seismic modelof the upper mantle beneath Africa, Geology, 28(1), 63–66.
Rolandone, F., J. C. Mareschal, C. Jaupart, C. Gosselin,G. Bienfait, and R. Lapointe (2003), Heat flow in the westernSuperior Province of the Canadian shield, Geophys. Res.Lett., 30(12), 1637, doi:10.1029/2003GL017386.
Rudnick, R. L., and D. M. Fountain (1995), Nature and com-position of the continental crust: A lower crustal perspective,Rev. Geophys., 33, 267–309.
Rudnick, R. L., W. F. McDonough, and R. J. O’Connell(1998), Thermal structure, thickness and composition of con-tinental lithosphere, Chem. Geol., 145, 395–411.
Schatz, J. F., and G. Simmons (1972), Thermal conductivity ofEarth materials at high temperature, J. Geophys. Res.,77(35), 6966–6983.
Schmeling, H., and G. Marquart (1991), The influence of sec-ond scale convection on the thickness of continental litho-sphere and crust, Tectonophysics, 189, 281–306.
Sclater, J. G., C. Jaupart, and D. Galson (1980), The heat flowthrough oceanic and continental crust and the heat loss of theEarth, Rev. Geophys., 18(1), 269–311.
Seipold, U. (2001), Der Warmetransport in kristallinen Gestei-nen unter den Bedingungen der kontinentalen Kruste (inGerman), Tech. Rep. STR01/13, GFZ Potsdam, Potsdam,Germany.
Shapiro, S. S., B. H. Hager, and T. H. Jordan (1999), Stabilityand dynamics of the continental tectosphere, Lithos, 48,115–133.
Stocker, R. L., and M. F. Ashby (1977), On the rheology of theupper mantle, Rev. Geophys., 11, 391–426.
Takahashi, E., T. Shimazaki, Y. Tsuzaki, and H. Yoshida(1993), Melting study of a peridotite KLB-1 to 6.5 GPa,and the origin of basaltic magmas, Philos. Trans. R. Soc.London, Ser. A, 342, 105–120.
Taylor, S. R., and S. M. McLennan (1995), The geochemicalevolution of the continental crust, Rev. Geophys., 33(2), 241–265.
Tommasi, A., B. Gibert, U. Seipold, and D. Mainprice (2001),Anisotropy of thermal diffusivity in the upper mantle,Nature, 411, 783–786.
Turcotte, D. L., G. Schubert, and P. Olson (2001), MantleConvection in the Earth and Planets, pp. 128–131, Cam-bridge Univ. Press, New York.
van den Berg, A. P., E. S. G. Rainey, and D. A. Yuen (2005),The combined influences of variable thermal conductivity,temperature and pressure-dependent viscosity and core-mantle coupling on thermal evolution, Phys. Earth Planet.Inter., 149, 259–278.
van der Lee, S., and G. Nolet (1997), Upper mantle S velocitystructure of North America, J. Geophys. Res., 102(B10),22,815–22,838.
Wenk, H. R., and J. M. Christie (1991), Comments on theinterpretation of deformation texture in rocks, J. Struct.Geol., 13, 1091–1110.
Zhang, S., S. I. Karato, J. F. Gerald, U. H. Faul, and Y. Zhou(2000), Simple shear deformation of olivine aggregates, Tec-tonophysics, 316, 133–152.
Zoback, M. L. (1992), First and second order patterns of stressin the lithosphere: The World Stress Map Project, J. Geo-phys. Res., 97(B8), 11,703–11,728.
GeochemistryGeophysicsGeosystems G3G3
petitjean et al.: archean craton thickness 10.1029/2005GC001053
26 of 26