sedimentology and geochemistry of core sediments ... - Dyuthi

Precambrian Research 113 (2002) 43–63
Carbon, oxygen and strontium isotope geochemistry ofProterozoic carbonate rocks of the Vindhyan Basin, central
India
B. Kumar a,*, S. Das Sharma a, B. Sreenivas a, A.M. Dayal a, M.N. Rao a,N. Dubey b, B.R. Chawla c
a National Geophysical Research Institute, Council of Scientific and Industrial Research, Uppal Road, Hyderabad 500 007, Indiab Department of Geology, Banaras Hindu Uni�ersity, Varanasi 221 005, India
c KDM Institute of Petroleum Exploration, Dehradun 248 195, India
Received 23 February 2000; accepted 23 May 2001
Abstract
Carbon, oxygen and strontium isotope compositions of carbonate rocks of the Proterozoic Vindhyan Supergroup,central India suggest that they can be correlated with the isotope evolution curves of marine carbonates during thelatter Proterozoic. The carbonate rocks of the Lower Vindhyan Supergroup from eastern Son Valley and centralVindhyan sections show �13C values of �0‰ (V-PDB) and those from Rajasthan section are enriched up to +2.8‰.In contrast, the carbonate rocks of the Upper Vindhyan succession record both positive and negative shifts in �13Ccompositions. In the central Vindhyan section, the carbonates exhibit positive �13C values up to +5.7‰ and thosefrom Rajasthan show negative values down to –5.2‰. The �18O values of most of the carbonate rocks from theVindhyan Supergroup show a narrow range between –10 and –5‰ (V-PDB) and are similar to the ‘best preserved’18O compositions of the Proterozoic carbonate rocks. In the central Vindhyan and eastern Son Valley sections,carbonates from the Lower Vindhyan exhibit best-preserved 87Sr/86Sr compositions of 0.7059�6, which are lowercompared to those from Rajasthan (0.7068�4). The carbonates with positive �13C values from Upper Vindhyan arecharacterized by lower 87Sr/86Sr values (0.7068�2) than those with negative �13C values (0.7082�6). A comparisonof C and Sr isotope data of carbonate rocks of the Vindhyan Supergroup with isotope evolution curves of the latterProterozoic along with available geochronological data suggest that the Lower Vindhyan sediments were depositedduring the Mesoproterozoic Eon and those from the Upper Vindhyan represent a Neoproterozoic interval ofdeposition. © 2002 Elsevier Science B.V. All rights reserved.
Keywords: Proterozoic; Carbon isotopes; Strontium isotopes; Vindhyan Supergroup; India
www.elsevier.com/locate/precamres
1. Introduction
The Vindhyan basin with an estimated arealextent of �105 km2 is the largest among the
* Corresponding author. Tel: +91-40-7170141; Fax: +91-40-7171564.
E-mail address: [email protected] (B. Kumar).
0301-9268/02/$ - see front matter © 2002 Elsevier Science B.V. All rights reserved.
PII: S 0301 -9268 (01 )00199 -1

B. Kumar et al. / Precambrian Research 113 (2002) 43–6344
‘Purana’ (Proterozoic) basins of the Indian sub-continent. Although the stratigraphy of the Vind-hyan Supergroup has been studied by severalworkers, interbasinal correlation of spatially dis-tributed stratigraphic units has only been estab-lished on the basis of lithological similarity(Prasad, 1984; Sastry and Moitra, 1984; Soni et al.,1987; Bhattacharyya, 1996). Carbonate rocks oc-cur at several stratigraphic horizons within theVindhyan Supergroup. This offers an excellentopportunity to establish correlation based on car-bon and strontium isotope compositions of unal-tered marine carbonates (Brasier et al., 1990;Kaufman et al., 1991; Magaritz et al., 1991; Derryet al., 1992; Narbonne et al., 1994; Kaufman andKnoll, 1995; Kumar and Tewari, 1995; Kumar etal., 1999). In addition, such a study has addedimportance in light of recent fossil discoveriesfrom Lower Vindhyan sediments made by Sei-lacher et al. (1998) and Azmi (1998). The availableradiometric age data coupled with evidence fortriploblastic animal trace fossils within Lower Vin-dhyan sandstones was used by Seilacher et al.(1998) to suggest an early evolution of metazoansat approximately 1100 Ma. On the other hand,based on his findings of small shelly fossils fromMaihar and Rohtas areas of Lower Vindhyans,Azmi (1998) questioned the validity of the reportedradiometric ages. According to him, the Vindhyansediments represent a Vendian–early Palaeozoicdepositional event. In view of these contradictions,the study of carbon, oxygen and strontium isotopesystematics was undertaken on stratigraphicallycontrolled carbonate sequences from three spa-tially distributed sections in the eastern, central,and western part of the Vindhyan basin. The mainobjectives of the present study are:
1. To obtain primary isotopic trends of carbonand strontium isotopes in seawater during thedeposition of Vindhyan carbonate sediments.
2. To compare the isotopic data from Vindhyansequence with those of carbonate successionsworldwide and hence to evaluate the possibledepositional age. The impetus to this study isto provide an age constraint independent ofthe poor geochronometric determinations andthe putative trace and body fossils found inthe Vindhyan basin.
2. Geological setting
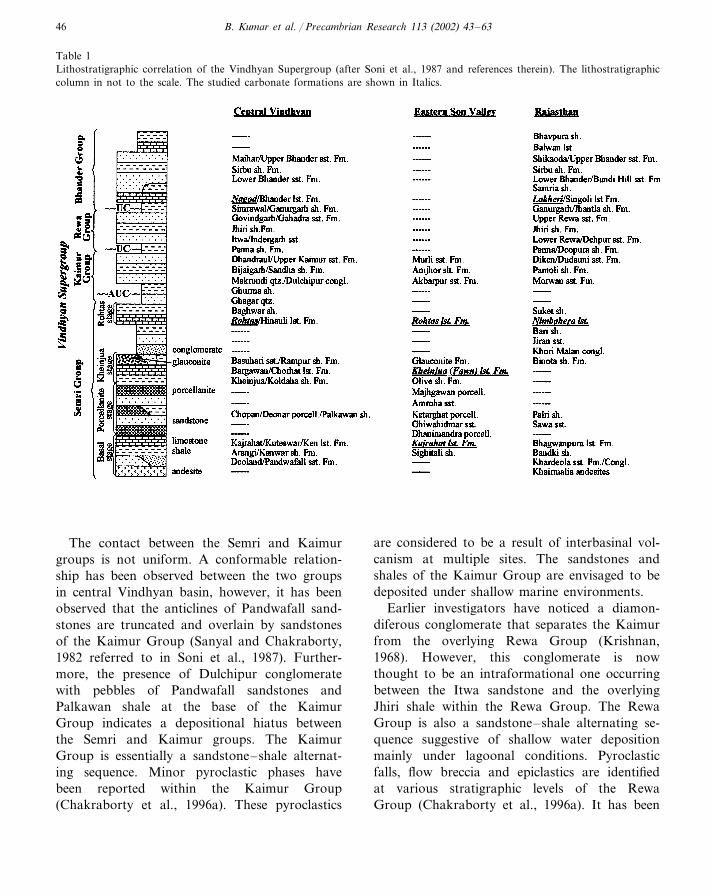
The Vindhyan Supergroup occupies a vast areaextending from Chittorgarh in Rajasthan toSasaram in Bihar. The northern limit is the Indo-gangetic alluvium near Dholpur, whileHoshangabad represents the south-western limit ofthe Vindhyan sediments (Fig. 1). The VindhyanSupergroup also extends beneath the Indo-gangetic alluvium as determined from boreholeand subsurface data (Sengupta, 1996). Sedimentsof the Vindhyan Supergroup predominantly com-prise shale, sandstone, and limestone horizonswith an estimated maximum apparent thickness of�4300 m (Krishnan and Swaminath, 1959). Mostof the Vindhyan units are unmetamorphosed. TheVindhyan Supergroup has been subdivided intofour groups namely, the Semri, Kaimur, Rewa andBhander (Pascoe, 1959; Krishnan, 1968). TheSemri Group is referred to as the Lower Vindhyanand the Kaimur, Rewa and Bhander groups as theUpper Vindhyan. Based on lithological similari-ties, Prasad (1984), Sastry and Moitra (1984) andSoni et al. (1987) attempted an interbasinal corre-lation of units within the Vindhyan Supergroup. Acomprehensive summary of this correlation is pre-sented in Table 1. A lithostratigraphic columnrepresenting the Vindhyan Supergroup as in cen-tral Vindhyan, eastern Son Valley and Rajasthansections is also given in Table 1.
The basement rocks of the Vindhyan Super-group are the Archean Bundelkhand Granite andthe Paleoproterozoic Bijawar, Sidhi and AravalliSupergroups. The initiation of sedimentation inthe Vindhyan basin is marked by volcanic activityas evidenced from the presence of Khairmaliaandesites at the base in south-eastern Rajasthan.The lowermost Semri Group consists of repetitivesuccessions of sandstone–shale–carbonate associ-ation, typical of stable cratonic setting. The sedi-ments of the Semri Group are considered to bedeposited under shallow water conditions (Baner-jee, 1974). However, shale, carbonate and pyro-clastic sequence at the base has been suggested tobe deposited under relatively deeper conditions —below the storm wave base (Chakraborty et al.,1996b). Evidence have also been put forth forfluvial origin of sandstones of the basal Deoland

B. Kumar et al. / Precambrian Research 113 (2002) 43–63 45
Formation in central Vindhyan region(Chakraborty and Bhattacharyya, 1996). Theearliest carbonate unit in the Semri Group is thestromatolitic Kajrahat limestone Formation.This formation is widespread occurring through-out the Vindhyan basin and deposited undersubtidal to supratidal environments (Banerjee,1974). The intraformational conglomerates inthese limestones indicate several cycles of trans-gression and regression. The limestones of theKheinjua Formation better known as ‘Fawn’limestones represent the next phase of carbonatesedimentation in the Semri Group. These car-bonates are also stromatolitic and are depositedunder intertidal to supratidal environments. TheRohtas and Nimbahera limestone formations ofthe Son Valley and Rajasthan, respectively, arethe last phases of the carbonate sedimentation
during the Semri period. These two formationsare considered to be stratigraphic equivalents.While some poorly developed columnar stroma-tolites are reported in limestones of Rohtas For-mation (Kumar, 1977), the Nimbahera lime-stones are massive and devoid of any stromato-lites. These younger carbonates are suggested tobe deposited under subtidal to intertidal condi-tions. The Semri Group also contains a porcel-lanite bearing formation overlying the Kajrahatlimestone and glauconite bearing sandstone overthe Kheinjua limestone. The porcellanites are as-sociated with pyritiferous black shales indicatingeuxinic conditions. Glauconites are also noticedin the lowermost sandstone unit suggesting thatthe oxidation conditions of depositional environ-ment have oscillated during the sedimentation ofthe Semri Group.
Fig. 1. Geological map of Vindhyan Basin (after Soni et al., 1987), showing three studied sections, namely (1) Jabera–Damoh–Panna–Satna–Maihar–Badanpur; Central Vindhyan (2) Chopan–Robertsganj; eastern Son Valley and (3) Bundi–Kota–Jhalawar;Rajasthan.
B. Kumar et al. / Precambrian Research 113 (2002) 43–6346
Table 1Lithostratigraphic correlation of the Vindhyan Supergroup (after Soni et al., 1987 and references therein). The lithostratigraphiccolumn in not to the scale. The studied carbonate formations are shown in Italics.
The contact between the Semri and Kaimurgroups is not uniform. A conformable relation-ship has been observed between the two groupsin central Vindhyan basin, however, it has beenobserved that the anticlines of Pandwafall sand-stones are truncated and overlain by sandstonesof the Kaimur Group (Sanyal and Chakraborty,1982 referred to in Soni et al., 1987). Further-more, the presence of Dulchipur conglomeratewith pebbles of Pandwafall sandstones andPalkawan shale at the base of the KaimurGroup indicates a depositional hiatus betweenthe Semri and Kaimur groups. The KaimurGroup is essentially a sandstone–shale alternat-ing sequence. Minor pyroclastic phases havebeen reported within the Kaimur Group(Chakraborty et al., 1996a). These pyroclastics
are considered to be a result of interbasinal vol-canism at multiple sites. The sandstones andshales of the Kaimur Group are envisaged to bedeposited under shallow marine environments.
Earlier investigators have noticed a diamon-diferous conglomerate that separates the Kaimurfrom the overlying Rewa Group (Krishnan,1968). However, this conglomerate is nowthought to be an intraformational one occurringbetween the Itwa sandstone and the overlyingJhiri shale within the Rewa Group. The RewaGroup is also a sandstone–shale alternating se-quence suggestive of shallow water depositionmainly under lagoonal conditions. Pyroclasticfalls, flow breccia and epiclastics are identifiedat various stratigraphic levels of the RewaGroup (Chakraborty et al., 1996a). It has been

B. Kumar et al. / Precambrian Research 113 (2002) 43–63 47
suggested that the volcaniclastic deposits of bothKaimur and Rewa groups adhere to regressioncycles and upliftment of basin floor or the prove-nance (ibid).
The Bhander Group is the youngest in theVindhyan basin and occupies the largest area.This group can be separated from the RewaGroup because of the presence of diamondiferousconglomerate between the Simrawal shale and theupper Rewa sandsonte at Panna. In other places aconformable relationship between these twogroups has been noticed. The Bhander Groupshows maximum thickness near Kota-Bundi areaof Rajasthan. This has been attributed to thedifferential sinking of the Vindhayn basin. Thelowermost member of the Bhander Group is theGanurgarh shale Formation. This shale is de-posited under tidal flat environment. Overlyingthis shale a limestone formation occurs, which hasbeen named as Nagod Formation in the centraland eastern Vindhyan basins and as Lakheri For-mation in the Rajasthan area. This carbonateformation is overlain by shale (Samria shale) inRajasthan and by Lower Bhander sandstone inthe eastern and central regions. The Lower Bhan-der sandstone is deposited under stable condi-tions. The overlying Sirbu shale is depositedunder intertidal to supratidal conditions. The Up-per Bhander sandstone overlies the Sirbu shale.This sandstone shows profuse development ofsedimentary structures such as ripple marks, cur-rent bedding, and loads casts and are suggested tobe deposited as near shore littoral deposits. Flu-vial and deltaic environments have also been sug-gested as environments of deposition for theUpper Bhander sandstones at least in parts of thebasin (Soni et al., 1987). The Upper Bhandersandstone marks the culmination of the sedimen-tation in most parts of the eastern and centralVidhyan basin. However, the sedimentation con-tinued with the deposition of Balwan stromatoliticlimestone and Bhavpura shale in Rajasthan area.These younger lithounits are deposited undershallow water conditions.
2.1. Age of the Vindhyan Supergroup
The depositional age of Vindhyan Supergroup
is poorly constrained. Most of the available radio-metric age data were generated either by K–Ar orby fission track methods, which have inherentlimitations. These data are presented in Table 2and show that there exists large discrepancies inages of the same formation and also stratigraphi-cally older formation gives younger ages. Recentlyfollowing the controversial findings of small shellyfossils in the Lower Vindhyan sediments by Azmi(1998), Banerjee and Frank (1999) and Banerjee(2000) reported Ar–Ar data on volcanic ash bedsfrom the basal Semri Group. They obtained twoplateau ages at 617 and 900–1500 Ma. While thelower age of 617 Ma was inferred by these au-thors as the depositional age of the Lower Vind-hyans, the ages between 900 and 1500 Ma wereinterpreted as the ages related to source rock.
3. Sampling and petrography
In the present study carbonates were sampledfrom three sections including the (i) Jabera–Damoh–Panna–Satna–Maihar–Badanpur (cen-tral Vindhyan section); (ii) Chopan–Robertsganj(eastern Son Valley section); and (iii) Bundi–Kota–Jhalawar (Rajsthan section).
3.1. Central Vindhyan section
This section runs through the central part ofthe basin and exposes the entire Vindhyan se-quence (Fig. 1). In the Jabera–Damoh–Panna–Satna segment the Kaimur, Rewa and Bhandergroups are encountered, and the main carbonatehorizon— the Nagod Formation (BhanderGroup) has been sampled. The Nagod village onthe Panna–Satna road provides a type area forthe Nagod limestone. These limestones were col-lected from four localities around Panna, Jaberaand Damoh. In the Nagod village (40 km SE ofPanna) the sampled limestone horizon is �10 mthick and eight samples (VBL-22–29) were col-lected at 1-m intervals. The Nagod Formation isunderlain by the Ganurgarh shale Formation. Thelimestones are massive with well-developed bed-ding planes at the base and stromatolitic towardsthe upper part. Nagod limestones in Jabera area

B. Kumar et al. / Precambrian Research 113 (2002) 43–6348
were collected from two locations namely Patnavillage (VBL-1-10; n=10; interval of 0.6 m) anda quarry near Pondi (VBL-12–16; n=5; interval2 m). In the Pondi quarry section it has beenfound that the limestone at the base was flaggyand towards the central part a transition tostromatolitic facies occurs. The Nagod lime-stones of Patna village show alternating layersof flaggy and massive varieties. In the Damohregion the Nagod limestones were collected nearHatta village, where the thickness of this forma-tion is �50 m. Five samples (VBL-17–21) atan interval of 10 m were collected. It has gener-ally been observed that the Nagod Formationbegins with oolitic phase with interlayers ofmudstone followed by a stromatolitic facies.This stromatolitic facies is impersistent and of-ten laterally grades into a shaly, intraclastic,
cross-striated facies. Facies variations within theNagod Formation indicate transgressive and re-gressive cycles during its deposition. Mud cracksare often seen indicating shallow levels of depo-sition and exposure to subaerial conditions.Thin section studies of Nagod limestones showthat they are mostly micritic. Some samplesshow preservation of primary depositional fea-tures such as oolitic textures.
The carbonates of the Rohtas Formation werecollected from Kakra village in the Maihar–Badanpur sector (VSL-3–16; n=12; sample in-terval of �4 m). The Rohtas Formation is�50 m thick with stromatolitic facies near thebottom. It grades into a shaly, massive andargillaceous forms successively. The Rohtaslimestone appears to have been deposited undershallow and quiet water conditions. Slight pro-
Table 2Summary of available geochronological data on different members of Semri, Kaimur and Rewa groups of the Vindhyan Supergroup
Member Age (Ma) Method Reference
Fission track710�120Sandstone Srivastava and Rajagopalan (1988)(Rewa Group) 690�125
Kumar et al. (1993)Rb–Sr1067�31MajhgawanLamproiteintruded inKaimur sandstone
Crawford and Compston (1970)1140�12 Rb–SrMajhgawanKimberlitepipe intrudedin Kaimur Group
1100�60Rohtas Limestone K–Ar Vinogradov et al. (1964)(Semri Group) 1125�175 Fission track Srivastava and Rajagopalan (1988)
Tugarinov et al. (1965)K–Ar10601145�40Chorhat K–Ar Vinogradov et al. (1964)
Sandstone 1070�401115�45(Semri Group)1115�44
Fawn Limestone 1110�44 K–Ar Vinogradov and Tugarinov (1964)(Semri Group) 1160�46
1175�45990�50 Rajagopalan and Maithy (1993)Fission track
Srivastava and Rajagopalan (1986)Fission trackKoldaha Shale 1219�183(Semri Group) 1205�234 Fission track Srivastava et al. (1985)Porcellanite 617�3.5 Ar–Ar Banerjee and Frank (1999)
Banerjee (2000)Ar–ArFormation 900–1500(Semri Group)

B. Kumar et al. / Precambrian Research 113 (2002) 43–63 49
gressive deepening of the depositional environ-ment can be envisaged as the basal stromatoliticfacies grades into a more shaly variety. Rohtaslimestones exhibit generally micritic nature un-der the microscope.
3.2. Eastern Son Valley section
This section runs through the eastern part ofthe basin where the Semri Group of rocks areexposed (Fig. 1). Conglomerate, quartzite, chertylimestone, dolomite, sandstone and porcellanitedeposits in a transgressive shallow marine envi-ronment are characteristic of the area. Here theoldest carbonate member is the Kajrahat lime-stone with a maximum thickness of �600 m.The thickness is highly variable. The limestonesof the Kajrahat Formation were sampled fromDala quarry, 3 km west of Kajrahat (VK-1–16;n=8) and from Bari village 5 km east of Kajra-hat (VK-17B to VK-24; n=9). While the sam-ples from Dala quarry represent lower members,those from Bari village represent upper mem-bers. The Kajrahat Formation overlies the car-bonaceous and pyritiferous Arangi shale.Isolated occurrences of stromatolites are noticednear the contact with shale. The transition fromshale to limestone thus marks a change in depthand oxidation condition of the depositional en-vironment. Approximately 12 members were rec-ognized in Kajrahat limestone, out of whichlower eight members comprising a thickness of�400 m were sampled in the Dala quarry withinterval of �50 m. In the Bari village upperfour members comprising a thickness of �200m were sampled at an interval of �20 m. Thethickness of limestone beds is variable in thelower part with more dolomitic interlayers. Thislower facies transforms into a thinly beddedshaly horizon. The upper part consists of mas-sive limestones with minor shale laminations.Stylolites are commonly observed in the lowerfour members. In the succeeding four membersalternating layers of thinly bedded limestone andshale are observed. These members show flutecasts and stylolitic structures. The stromatoliticfacies in the Kajrahat Formation occurs at ahigher level (10th member). This facies contains
oolitic and graded bedding structures. The up-permost members are mostly dolomitic and atsome places fenestral structures are noticed.Samples of this formation contain coarser grainsthan rest of the formations.
The next younger carbonate unit is the Khein-jua Formation. The Kheinjua Formation lime-stones were sampled from Salkhan hill betweenChopan and Robertsganj. The Kheinjua lime-stone popularly known as fawn limestone be-cause of its pale brownish color overlies theOlive shale Formation in the Salkhan hill re-gion. This limestone unit is �150 m thick.Veins of crystalline dolomite and quartz havebeen observed in these limestones. Stromatolitesoccur mainly in the central parts of the section,which are dark gray in color and associatedwith chert. The stromatolite columns attain amaximum height of �50 cm and are at rightangles to the bedding planes. A supratidal flatenvironment of deposition can be envisaged forthese limestones. Three samples of stromatoliticfacies were collected at an interval of �4 m(VKH-1–3). VKH-4 was collected approxi-mately 30 m above the stromatolitic horizon.The Kheinjua limestone is overlain by glau-conitic sandstone.
The limestones of the Rohtas Formation werecollected from Ghurma village, 10 km south ofRobertsgunj. The maximum thickness of theRohtas Formation here is �360 m. The lime-stones of the Rohtas Formation overlies theglauconite bearing sandstones of the Kheinjuastage. In the basal section these limestones arelight gray in color and the beds are usuallythick. The Rohtas Formation is mainly carbon-ate–shale alternating sequence with a horizon inthe middle part that is dominated by shale withcalcareous nodules. The lower section of �60m was sampled at an interval of �5 m (VR-2-11; n=7).
3.3. Rajasthan section
This section lies in the western part of theVindhyan basin in south-east Rajasthan (Fig. 1).Limestones of Nimbahera and Lakheri forma-tions belonging to the Semri and Bhander

B. Kumar et al. / Precambrian Research 113 (2002) 43–6350
groups, respectively, have been collected from thissection. These two formations of Rajasthan areconsidered to be equivalents of Rohtas andNagod formations of the Son Valley. However,certain subtle differences can be noticed in thestratigraphic successions in the two regionsbetween the suggested equivalents. While theRohtas Formation directly overlies the glauc-onitic sandstone of Kheinjua stage in the SonValley, the Nimbahera Formation is separatedfrom the Kheinjua stage by Khori Malanconglomerates, Jiran sandstone and Bari shale.The limestones of the Lakheri Formation areobserved to be sandwiched between two shalyhorizons, whereas the Nagod Formation occursbetween shale and sandstone units.
The Nimbahera limestones were collected fromMorak mines (VSL-1K–8K(A); n=8; interval�3 m) and Kukda quarry (VSL-9K–25K; n=12,interval �2 m), both of which are located �35km west of Jhalawar. The aggregate thickness ofthis limestone formation is �150 m. The lowermembers of �20 m thick are found to beargillaceous with thickness of individual bedsranging from 10 cm to 1 m. The upper �130 mis grayish and interbedded with thin shale layers.Flute casts and mud cracks are observed at someplaces on upper bedding planes. At Morak minesthe thickness of limestones is 20 m and these bedsbelong to the upper section of the NimbaheraFormation. The limestone section is �25 m thickin the Kukda quarry and represents a relativelylower level of the Nimbahera Formation. Herethe limestones are found in an alternatingsequence of flaggy and massive varieties. TheNimbahera limestone overlies the Bari shale,which is calcareous towards the top.
The Lakheri limestones were collected fromSatur (VBL-1K–4K; n=4) and Dalelpura(VBL-5K–10K; n=6) villages near Bundi.Lakheri limestone occurs in between Ganurgarhand Samria shale formations. At Dalelpura partof the section constituting 22 m thick with aninterval of �4 m was sampled. Near Satur a 9-mthick section with an interval of �2 m wassampled. The thickness of Lakheri limestonevaries from 30 to 150 m. This limestone unit isnon-stromatolitic and highly calcitic. Intra-
formational conglomerates are noticed at the baseof the Lakheri Formation with sharp contactbetween the two. Near Lakheri village (�60 kmeast of Bundi) conglomerate beds measuring up to2 m have been observed. Here the conglomeratescontain pebbles of variable sizes ranging from 1 to50 cm. The pebbles are mainly sandstones. Theyare subangular set in a clayey matrix and appearto be tilloids. Such thick conglomerates are highlyimpersistent and laterally grade into very thinvarieties. In some other places the Ganurgarhshale grades into pink colored calcareous shaleand shows a conformable relationship with graycolored Lakheri limestones. The limestones of theLakheri Formation show distinct bedding withvariable thickness (15 cm to 1 m). They aremainly micritic with minor ferroan/non-ferroancalcite and sparite veins. Thin bands of argill-aceous matter are noticed within the limestones.Mud cracks of polygonal nature especially in theupper bedding planes are observed.
4. Analytical procedure
Carbon and oxygen isotope ratio measurementswere done on bulk carbonate powders. Care wastaken to avoid veins, recrystallized and weatheredportions during crushing. A sample weighing 10–15 mg was then reacted in vacuum with 5 ml of�100% orthophosphoric acid at 25° C for 2–3days following the method described by McCrea(1950). Isotopic ratios of the released carbondioxide were determined using a VG Micromass903 mass spectrometer and data are presented interms of the standard ‘�’ notation relative toV-PDB. The precision for �13C is better than�0.2‰. NBS-19 analyzed during the course ofstudy gave �13C= +1.93�0.1‰ and �18O=–2.19�0.1‰.
For Sr-isotope analyses, crushed carbonateswere washed with Milli-Q water three times andleached in 0.25 N HCl at room temperature in anultrasonic bath (Veizer et al., 1990). Insolubleresidues were removed by centrifugation. Out of20, 14 samples were spiked with 87Rb and 84Srtracers before separation of Rb and Sr by conven-tional ion exchange chromatography. The remain-

B. Kumar et al. / Precambrian Research 113 (2002) 43–63 51
ing six samples were not spiked. 87Sr/86Sr ratiomeasurements were carried out on a VG-354 Emass spectrometer in single collector mode. Totalprocess blank was less than 1 ng for Rb and 2 ngfor Sr. NBS 987 measured during the course ofthe study gave 87Sr/86Sr=0.710172�14 (2�),which is lower by approximately 0.00007 com-pared to the reported value. An offset correctionhas therefore been applied for all the 87Sr/86Srmeasurements.
Hydrochloric acid digested sample solutions(Hall and Veizer, 1996) were made into twoaliquots. Manganese concentrations of representa-tive samples were determined on first aliquot byatomic absorption spectrometer (Varian-SpectraA220). Three international carbonate rock stan-dards (NBS 88a, CCH1, GSR-6) run along withsamples yielded Mn concentrations of 220, 55,474, respectively as against reported values of 232,54 and 465 ppm. The Sr concentrations weremeasured on second aliquot by an inductivelycoupled plasma-atomic emission spectrometer atthe Central Forensic Research Laboratory,Hyderabad. GSR-6 measured along with samplesgave 898 ppm Sr as against a reported value of913 ppm. Blank runs for Mn and Sr were lessthan 1 ppm.
5. Results
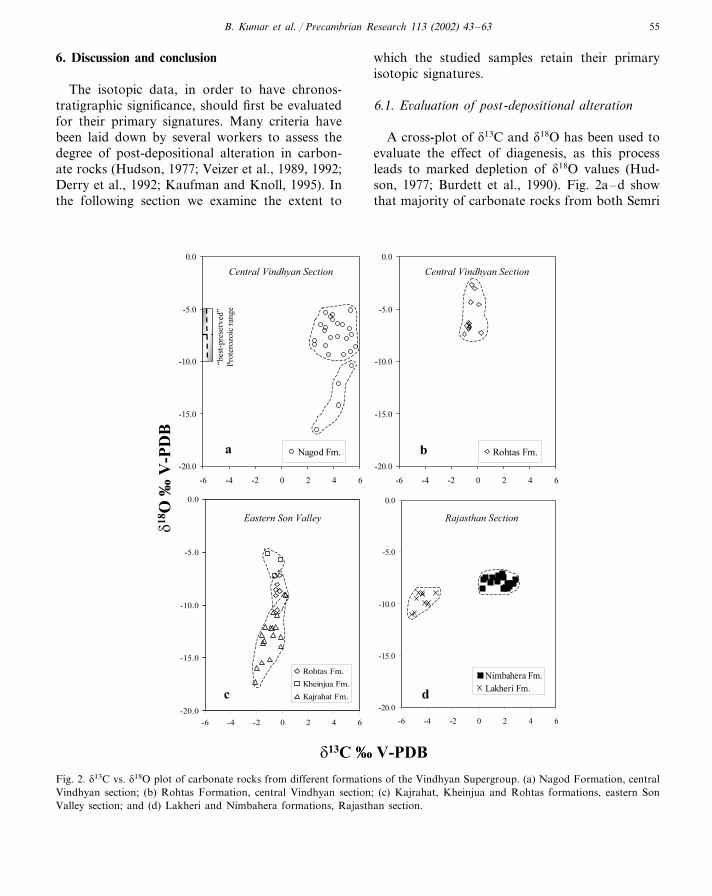
The �13C and �18O values of carbonates fromthree different sections of the Semri and Bhandergroups along with the rock type and approximatetotal carbonate contents in wt.% are given inTables 3–5. The �13C versus �18O cross-plots ofall the formations are given in Fig. 2a–d. Theconcentrations of Rb, Sr, and Mn along with87Sr/86Sr values are presented in Table 6.
5.1. Carbon isotope compositions
The Bhander Group carbonates analyzed in thepresent study belong to the Nagod Formation incentral Vindhyan section and the Lakheri Forma-tion in Rajasthan section. Two distinct ranges inisotopic compositions can be observed for thesecarbonates. While the carbonates belonging to the
Nagod Formation are characterized by positive�13C values in the range from +2.6 to +5.7‰(Table 3), those represented by Lakheri Forma-tion exhibit a marked depletion in the range be-tween –3.3 and –5.2‰ (Table 5).
The carbonates of the Semri Group have beenanalyzed from three different sections in thepresent study. The �13C values of Rohtas Forma-tion range from –1.0 to +0.3‰ in central Vind-hyan section (Table 3) and from –0.5 to +0.3‰in eastern Son Valley section (Table 4). Recently,Kumar and Schidlowski (1999) have reported�13C values of Rohtas carbonates from the SonValley section. These values range from –2.3 to–0.1‰ and are comparable to data presentedhere. The 13C compositions of carbonates of theKheinjua and Kajrahat formations are also simi-lar to those of Rohtas Formation. However, somesamples of the Kajrahat Formation are relativelydepleted in 13C compared to those of Rohtas andKheinjua formations. The �13C values of carbon-ates belonging to the Nimbahera Formation ofRajasthan section range from +0.3 to +2.8‰(Table 5) and are relatively enriched than rest ofthe carbonates of the Semri Group.
5.2. Oxygen isotope compositions
The oxygen isotope record of carbonates be-longing to the Bhander Group of central Vind-hyan section are restricted in a narrow range from–10.4 to –5.2‰ with the exception of three sam-ples (Fig. 2a) and those from Semri Group varyfrom –7.4 to –2.7‰ (Fig. 2b). In eastern SonValley section, the �18O values of carbonates fromRohtas and Kheinjua formations range between–10.5 and –5.2‰, and those from Kajrahat For-mation are depleted (ranging from –17.3 to–9.0‰) compared to the Rohtas and Kheinjuaformations (Fig. 2c). The �18O values of carbon-ates of the Lakheri and Nimbahera formationsrange from –11.1 to –7.1‰ and are comparableto �18O values of other formations (Fig. 2d).
5.3. 87Sr/86Sr ratios
A total of 20 selected carbonate samples fromthe Lakheri and Nagod formations (Bhander

B. Kumar et al. / Precambrian Research 113 (2002) 43–6352
Table 3�13C and �18O values of Bhander and Semri Group carbonates from Jabera–Damoh–Panna–Satna–Maihar–Badanpur section ofcentral Vindhyan region
Total carbonateSample no. �13CRock type �18O% (‰ V-PDB) (‰ V-PDB)
Nagod formationPatna �illage
53VBL-1 3.3Arg. Lst −7.178 3.9Dol. Lst −6.0VBL-292 3.4VBL-3 −8.5Dol. Lst79 2.6Flag. Lst −8.4VBL-4
Flag. LstVBL-5 84 2.6 −8.174 3.4Dol. Lst −6.8VBL-6
Dol. LstVBL-7 79 4.3 −6.4VBL-8 Dol. Lst 87 3.8 −7.8
93 4.3Dol. Lst −7.7VBL-990 2.7VBL-10 −16.5Calcite vein
Pondi quarryDol. LstVBL-12 96 3.6 −9.3
91 3.8Strom. Lst −5.7VBL-13Strom. LstVBL-14 ND 4.0 −5.3Strom. LstVBL-15 ND 3.9 −5.5
94 3.4Flag. Lst −5.4VBL-16Hatta �illage
66 3.0VBL-17 −6.5Mass. Lst95 5.3Mass. Lst −9.1VBL-18
Mass. LstVBL-19 90 5.7 −8.6VBL-20 33Arg. Lst 4.4 −14.2
99 5.4Dol. Lst −10.4VBL-21Nagod �illage
96 5.4Dol. Lst −7.5VBL-22Flag. LstVBL-23 91 4.7 −6.5
74 5.3Dol. Lst −5.2VBL-24Dol. LstVBL-25 ND 5.4 −8.9Arg. LstVBL-26 38 4.4 −12.1
91 5.0Mass. Lst −7.9VBL-27Mass. LstVBL-28 93 5.2 −6.9
36 4.8VBL-29 −9.3Arg. Lst
Rohtas FormationKakra �illage
91 −0.6 −6.7VSL-3 Arg. Lst95 −1.0Mass.Dol. Lst −7.4VSL-494 −0.8VSL-5 −6.6Dol. Lst75 −0.7Dol. Lst −6.3VSL-6
Dol. LstVSL-8 82 −0.6 −6.893 −0.7Dol. Lst −6.9VSL-9
Arg. LstVSL-11 46 −0.2 −3.046VSL-12 −0.5Cal. Shale −4.441 −0.4Cal. Shale −2.7VSL-1387 0.3VSL-14 −7.3Strom. Lst84 0.1Dol. Lst −4.6VSL-15
VSL-16 Dol. Lst 81 −0.6 −6.4
Arg., Argillaceous; Flag., Flaggy; Mass., Massive; Lst., Limestone; Strom., Stromatolitic; Dol., Dolomitic; Cal., Calcareous; ND,not determined.

B. Kumar et al. / Precambrian Research 113 (2002) 43–63 53
Group) and Nimbahera, Rohtas and Kajrahatformations (Semri Group) were analyzed for their87Sr/86Sr ratios. It can be seen that within theSemri Group, the carbonates of the NimbaheraFormation exhibit higher values of 87Sr/86Sr(0.7064–0.7073) than those from Rohtas (0.7052–0.7067) and Kajrahat (0.7061) formations. Thecarbonates of the Nagod (0.7065–0.7071) and
Lakheri (0.70747–0.709) formations of the Bhan-der Group are generally higher than the carbon-ates of the Semri Group. It is pertinent to notethat both �13C and 87Sr/86Sr records of supposedlystratigraphic equivalents, namely Nimbahera andRohtas formations of the Semri Group andNagod and Lakheri formations of the BhanderGroup are distinct.
Table 4�13C and �18O values of Semri Group carbonates from Chopan–Robertsganj section of eastern Son Valley
Rock typeSample Total carbonate �13C �18O% (‰ V-PDB) (‰ V-PDB)
Rohtas Formation−8.1−0.481VR-2 Dol. Lst
Dol. Lst ND −0.5 −8.5VR-3Dol. Lst NDVR-4 −0.5 −9.1
VR-6 −7.2−0.2NDMass. Dol. Lst−0.294 −8.6Mass. Dol. LstVR-8
VR-10 −10.5−0.4NDArg. Dol. LstNDVR-11 +0.2Arg. Dol. Lst −9.0
Kheinjua FormationVKH-1 Strom. Dol. Lst 74 −0.6 −7.2
−5.7Strom. Dol. LstVKH-2 −0.1NDAlgal. Dol. Lst −7.2VKH-3 −0.660
−1.1 −5.2VKH-4 Impure Cal. Sst 26
Kajrahat FormationDala mines
−9.00.382VK-1 Mass. Dol. LstVK-2 88Lst −1.0 −15.1
−2.019 −15.9Arg. Dol. LstVK-369 −15.4−1.6VK-4B Arg. Dol. Lst
−0.474 −11.0Mass. Dol. LstVK-7BVK-9 −10.7−0.791Dol. LstVK-14 88Dol. Lst −0.5 −12.0
83 −0.1VK-16 −13.9Arg. Dol. LstBari �illageVK-17B Mass. Dol. Lst 83 −0.1 −13.0
85VK-19B −0.7Mass. Dol. Lst −12.8VK-19D −12.1−0.987Mass. Dol. Lst
−2.198 −17.3Dol. LstVK-19G85VK-20 −0.8Dol. Lst −12.1
Arg. Dol. Lst 69VK-21 −1.4 −13.4−1.389Dol. LstVK-22 −12.0
Dol. LstVK-23 −12.898 −1.6−1.579Dol. LstVK-24 −13.6
Arg., Argillaceous; Flag., Flaggy; Mass., Massive; Lst., Limestone; Strom., Stromatolitic; Dol., Dolomitic; Cal., Calcareous; ND,not determined.

B. Kumar et al. / Precambrian Research 113 (2002) 43–6354
Table 5�13C and �18O values of Bhander and Semri Group carbonates from Bundi–Kota–Jhalawar section of Rajasthan area
Sample Total carbonateRock type �13C �18O% (‰ V-PDB) (‰ V-PDB)
Bhander Group (Lakheri Formation)Satur
81 −3.3Dol. Lst −8.9VBL-1KDol. LstVBL-2K 78 −3.9 −9.9
79 −4.0VBL-3K −10.0Dol. Lst80 −4.2Dol. Lst −9.9VBL-4K
DalelpuraDol. LstVBL-5K 78 −4.4 −9.1
81 −5.0Mass. Dol. Lst −10.9VBL-6KMass. Dol. LstVBL-7K 82 −5.2 −11.1Dol. Lst.VBL-8K ND −4.7 −8.9
ND −4.8Dol. Lst −9.5VBL-9K79 −4.7 −8.9VBL-10K Dol. Lst.
Semri Group (Nimbahera Formation)Morak mines
70 0.5 −7.4VSL-1K Arg. Dol. LstND 1.9Arg. Dol. Lst −7.4VSL-2K
Mass. Dol. LstVSL-3K ND 1.4 −7.8VSL-5K 79Arg. Dol. Lst 1.8 −7.1
80 1.5Mass. Dol. Lst −7.3VSL-6K(B)Mass. Dol. LstVSL-7K(B) ND 0.4 −7.7
ND 0.9VSL-8K −7.9Arg. Dol. Lst24 0.3Arg. Dol. Lst −8.5VSL-8K(A)
Kukda quarryDol. LstVSL-9K 86 1.0 −7.5
54 2.2Flag. Dol. Lst −8.1VSL-11KFlag. Dol. LstVSL-12K 78 2.4 −8.0Mass. Dol. LstVSL-13K 82 2.8 −7.7
ND 2.7Mass. Dol. Lst −8.1VSl-14KVSL-15K 76Mass. Dol. Lst 2.4 −8.3
ND 2.6Mass. Dol. Lst −8.1VSL-17KFlag. Dol. LstVSL-21K 62 2.0 −8.5Flag. Dol. LstVSL-22K ND 2.2 −8.4
ND 2.1Flag. Dol. Lst −8.4VSL-23K65 2.3 −8.2VSL-24K Flag. Dol. LstND 1.9 −8.5Flag. Dol. LstVSL-25K
Arg., Argillaceous; Flag., Flaggy; Mass., Massive; Lst., Limestone; Strom., Stromatolitic; Dol., Dolomitic; Cal., Calcareous; ND,not determined.
5.4. Elemental concentrations
The concentration of Mn on 26 samples be-longing to various formations of the VindhyanSupergroup vary from 50 to 1489 ppm. The Srcontent of 25 samples range between 32 and1546 ppm (Table 6). The Mn/Sr ratios of sam-
ples belonging to Kajrahat, Rohtas, Nimbahera,Nagod and Lakheri formations vary between 0.1and 5.6 with the exception of one sample(cVBL-2). The Rb contents of 14 selected sam-ples are less (0.07–1.14 ppm) with Rb/Sr ratiogenerally �3×10⁻³ (except VSL-11K, Table6).
B. Kumar et al. / Precambrian Research 113 (2002) 43–63 55
6. Discussion and conclusion
The isotopic data, in order to have chronos-tratigraphic significance, should first be evaluatedfor their primary signatures. Many criteria havebeen laid down by several workers to assess thedegree of post-depositional alteration in carbon-ate rocks (Hudson, 1977; Veizer et al., 1989, 1992;Derry et al., 1992; Kaufman and Knoll, 1995). Inthe following section we examine the extent to
which the studied samples retain their primaryisotopic signatures.
6.1. E�aluation of post-depositional alteration
A cross-plot of �13C and �18O has been used toevaluate the effect of diagenesis, as this processleads to marked depletion of �18O values (Hud-son, 1977; Burdett et al., 1990). Fig. 2a–d showthat majority of carbonate rocks from both Semri
Fig. 2. �13C vs. �18O plot of carbonate rocks from different formations of the Vindhyan Supergroup. (a) Nagod Formation, centralVindhyan section; (b) Rohtas Formation, central Vindhyan section; (c) Kajrahat, Kheinjua and Rohtas formations, eastern SonValley section; and (d) Lakheri and Nimbahera formations, Rajasthan section.

B. Kumar et al. / Precambrian Research 113 (2002) 43–6356
Table 6Elemental and 87Sr/86Sr isotope compositions of carbonates ofthe Bhander and Semri groups. Least radiogenic value of eachformation is shown in bold
MnSample No. Rb Sr 87Sr/86Sr
BhanderGroup
LakheriFormation
–VBL-1K –257 0.7090VBL-2K 258 0.16 189 0.70768�7a
0.42VBL-3K 215250 0.70765�7a
– 151264 0.7087VBL-4K241VBL-5K 0.23 264 0.70747�1a
0.21 159 0.70840�1aVBL-7K 888Nagod
FormationVBL-2 1373 – 63 0.7070
0.42VBL-7 349320 0.70650.18 104496 0.7067VBL-16
840VBL-18 0.13 354 0.70710.07 539VBL-21 0.7069501
Semri GroupNimbahera
Formation–VSL-1K 3001489 0.70640.45 191564 0.7066VSL-3K
412VSL-5K 0.26 239 0.70681.14 104 0.7073VSL-11K 171– 133 –VSL-17K 474
RohtasFormation
0.16VSL-4 136181 0.70560.65 22272 0.7052VSL-9
142VSL-12 – 42 –– 32VSL-13 –1240.22 98253 0.7067VSL-14
625VSL-15 – 1546 0.7061Kajrahat
Formation–VK-1 44165 –
VK-2 60 – 699 –– 134VK-9 0.706150– 18165 –VK-14
a Average of replicate analyses.
Veizer et al., 1992; Hall and Veizer, 1996). Car-bonate rocks from the Kajrahat Formation ineastern Son Valley section (Fig. 2c), however, arecharacterized by variable �18O values (–17.3 to–9.0‰) and some of the samples are depleted upto approximately 10‰ compared to those of theKheinjua and Rohtas formations. Three samplesfrom the Nagod Formation of central Vindhyanregion are also depleted considerably (Fig. 2a). Itis interesting to note that the samples character-ized by low �18O values, however, are representedby �13C values typical of their respective forma-tions, indicating that although a few samplesmight have undergone oxygen isotope exchange,their �13C values have remained largely unaf-fected. This view is supported by the fact that the�13C record of carbonate rocks is robust and doesnot get altered in general (Hudson, 1977; Ma-garitz et al., 1991).
The concentration of trace elements (Fe, Mnand Sr) in carbonate rocks offers a powerful toolto assess the degree of diagenesis (Veizer et al.,1989, 1992; Derry et al., 1992). It has been shownthat during diagenesis Fe and Mn contents incarbonates increase and Sr shows depletion. Ingeneral, Mn/Sr�10 and �18O= –4 to –8‰ char-acterizes the least altered carbonate rocks (Kah etal., 1999). Jacobsen and Kaufman (1999) havemodeled the trace element behaviors and depictedthe isotopic evolution trends of 87Sr/86Sr and �13Cwith varying amounts of Mn/Sr and �18O foropen and closed system diagenesis of carbonaterocks. Their calculations show that except for�13C versus Mn/Sr, highly non-linear trends areresulted between other variables due to diagenesis.According to these authors, the primary isotopicsignatures are retained by those carbonates whichare characterized by Mn/Sr�2, �18O= –5 to–10‰, Rb/Sr�5×10−3 and Sr concentrationranging from 150 to 2500 ppm. All the samples ofthe Vindhyan Supergroup analyzed for their traceelement concentration show Mn/Sr values �6except for one sample of the Nagod Formation(cVBL-2). Their �18O values also fall in therange between –4 and –10‰. Fig. 3a–d show thecross-plots of Mn/Sr-�13C, Mn/Sr-�18O, Mn/Sr-87Sr/86Sr, and �18O-87Sr/86Sr, respectively. It canbe seen that the best-preserved carbonate rocks of
and Bhander groups are characterized by a rangeof �18O values from –10 to –5‰. This range iscomparable to the ‘best-preserved’ �18O value ofapproximately –7.5�2‰ reported for most ofthe Proterozoic-early Cambrian carbonate rocksfrom different parts of the world (Brasier et al.,1990; Burdett et al., 1990; Kaufman et al., 1991;

B. Kumar et al. / Precambrian Research 113 (2002) 43–63 57
Lakheri Formation are characterized by �13C=–4‰ and least radiogenic 87Sr/86Sr value of0.70747. Likewise, the Nagod Formation exhibits�13C= +5‰ and 87Sr/86Sr=0.7065. The carbon-ates of Nimbahera, Rohtas and Kajrahat forma-tions of the Semri Group show best-preserved�13C of � +2, 0 and 0‰ with 87Sr/86Sr values of0.7064, 0.7052 and 0.7061, respectively. The eval-uation of post-depositional alteration in carbon-ates of the Vindhyan Supergroup (Figs. 2 and 3)clearly suggests that generally no diagenetic trends
are noticed for samples belonging to various for-mations, giving credence to use C and Sr isotopesas chronostratigraphic tools.
6.2. Comparison of carbon isotope data
Kah et al. (1999) have presented a global car-bon isotope profile for the Mesoproterozoic toNeoproterozoic carbonate successions. They sug-gested that these periods can be divided into threedistinct isotopic intervals: (i) an isotopically in-
Fig. 3. (a–c) Cross-plots of Mn/Sr vs. �13C, �18O and 87Sr/86Sr, respectively. Note that most of the analyzed samples showMn/Sr�6 without diagenetic trend. (d) �18O vs. 87Sr/86Sr plot showing feeble negative trends in the case of carbonates of the Nagodand Lakheri formations, other formations show scatter indicating that the effect of post-depositional alteration may not besignificant.

B. Kumar et al. / Precambrian Research 113 (2002) 43–6358
variant (�13C=0.0�1‰) period between 1600 and1300 Ma; (ii) an interval with subdued variationranging from approximately –1 to +3.5‰ during1300–800 Ma, and; (iii) the later Neoproterozoicsuccessions (�800 Ma) with extreme positive andnegative �13C values. The third interval has beenstudied with excellent resolution and is well con-strained in terms of geochronological data. Thepositive fluctuations during this interval went ashigh as +10‰ globally, and in some cases evenmuch higher locally up to +16‰ (Iyer et al., 1995).The negative excursions down to –5‰ are predom-inantly associated with cap carbonates immediatelyoverlying the glacial deposits of the Vendian period(Jacobsen and Kaufman, 1999). The Phanerozoicalso exhibit variable �13C values, however, themagnitude of isotope fluctuations are muted rela-tive to those of the Neoproterozoic (Veizer et al.,1999). Fig. 4a shows the generalized trend ofcarbon isotope record of carbonate carbon duringthe period between 1600 and 500 Ma (after Kah etal., 1999). The �13C record obtained on the carbon-ates of the Vindhyan Supergroup has been com-pared with the generalized profile to assignprobable depositional ages for various formations.Approximate age ranges of 1450–1100 Ma hasbeen assigned to the Semri Group, whereas, 700–570 Ma range is envisaged to be the depositionalage of the Bhander Group. It is to be noted thatthe generalized carbon isotope profile presented byKah et al. (1999) shows that the period between1300 and 800 Ma is characterized by �13C varia-tions in the range from –1 to +3.5‰. Present datafrom the Semri Group, however, shows that exceptfor the carbonate rocks of the Nimbahera Forma-tion (�13C up to +2.8‰), the other formations arecharacterized by 13C compositions close to 0‰.Since the data set presented here does not permitus to resolve the periods of deposition of carbonaterocks from Kajrahat, Kheinjua and Rohtas forma-tions, they have been shown together rangingbetween 1450 and 1225 Ma (Fig. 4a). The lower agelimit of approximately 1450 Ma for the lowermostVindhyan carbonates is based on the suggestionmade by Venkatachala et al. (1996), who made acritical review of the biogeochronological data ofthe Vindhyan Supergroup. In addition, one conjec-ture which may help in placing the base of lower
Fig. 4. (a) �13C curve of Mesoproterozoic to Neoproterozoicworldwide carbonate successions (after Kah et al., 1999). Theaverage �13C values for the carbonates of various formations ofthe Vindhyan Supergroup are shown by different symbols.While the vertical bar represents the standard deviation, thehorizontal bar indicates the probable depositional age range forvarious formations. (b) 87Sr/86Sr profile for Mesoproterozoic toNeoproterozoic. Compilation of 800–540 Ma and 900 Ma87Sr/86Sr data sets are after Jacobsen and Kaufman (1999) andVeizer et al. (1983). The Mesoproterozoic curve is constructedusing data from McArthur Group (1600 Ma; 0.7061; Veizer andCompston, 1976), Belt Supergroup (1450 Ma; 0.7048; Hall andVeizer, 1996), Kotujsk Formation (1400 Ma; 0.705; Pokrovskijand Vinogradov, 1991), Bengamall Group (1250 Ma; 0.706;Veizer and Compston, 1976), Bitter Spring Formation (1000Ma; 0.7068; Veizer and Compston, 1976). The least radiogenic87Sr/86Sr values obtained on samples of Rohtas, Nimbahera,Nagod and Lakheri formations are plotted exactly at similarpositions as in Fig. 4a. Note good matching between plottedpoints and the generalized curve. The vertical bar represents theactual range of 87Sr/86Sr compositions and the horizontal barindicates the probable depositional age ranges of variousformations of the Vindhyan Supergroup.
Vindhyan at �1450 Ma is that, a large part of thecrust in the eastern part of Paleoproterozoic Ar-avalli Mountain Belt was cratonized at �1450 Ma,which is the age of closing of Delhi Orogeny (seeRoy, 1988). This may suggest that the opening ofthe Vindhyan Basin on stable Aravalli–Bun-delkhand craton perhaps immediately post-datedthe Delhi Orogenic Cycle. The assignment of �1150 Ma for the Nimbahera Limestone Formation

B. Kumar et al. / Precambrian Research 113 (2002) 43–63 59
is based on the Rb–Srisochron age of phlogopiteseparated from Majhgawan lamproite (1067�31Ma), which intrudes the Kaimur sandstone in SonValley (Kumar et al., 1993). As far as the deposi-tional age of the Bhander Group is concerned, noradiometric ages have so far been reported fromthis group. The �13C values of carbonates of theNagod (up to +5.7‰) and Lakheri (up to –5.2‰) are in consonance with the record of theNeoproterozoic period, especially post-Sturtian toVedian supporting the assigned age range of 700–570 Ma. Srivastava and Rajagopalan (1988) havereported fission track ages of glauconite sandstonebeds from the Rewa Group, which conformablyunderlies the Bhander Group. Their fission trackages range from 710�120 to 690�125 Ma andare well within the Neoproterozoic period.
6.3. Comparison of strontium isotope data
Very little is known about the strontium isotopesystematics of the Mesoproterozoic, although theNeoproterozoic has been well studied. The ‘bestpreserved’ 87Sr/86Sr compositions in Mesoprotero-zoic carbonate rocks from Kotujsk and Yusmas-tach Formations, Anabar uplift (Pokrovskij andVinogradov, 1991), Belt Supergroup, USA (Halland Veizer, 1996), Bitter Spring Formation andBangemall Group, Australia (Veizer and Comp-ston, 1976) range between 0.7048 and 0.7068.According to Mirota and Veizer (1994), the 87Sr/86Sr compositions of Mesoproterozoic Ocean wereprobably oscillating between these extreme values.The Early Neoproterozoic period (�900 Ma) ismarked by a hydrothermal event as indicated bylow 87Sr/86Sr values of �0.7058 for the carbon-ates of the Adrar Supergroup (Veizer et al., 1983).Jacobsen and Kaufman (1999) have compiled thesecular variation of strontium isotopes during theNeoproterozoic period showing that the periodbetween 800 and 750 Ma is characterized by87Sr/86Sr values ranging from 0.7056 to 0.7068,with lowest value corresponding to 775 Ma hy-drothermal event (Asmerom et al., 1991). Theperiod from 750 to 600 Ma exhibits oscillating87Sr/86Sr values between 0.7065 and 0.7074. Asudden rise up to 0.7085 has been observed inmany ‘cap carbonates’ overlying the Vendian
glacial deposits (Kennedy et al., 1998; Jacobsenand Kaufman, 1999) compared to the low valuesof �0.7065 in the pre-Vendian carbonates. ThePhanerozoic Sr isotopic record shows variable87Sr/86Sr values. Most of the Phanerozoic periodis characterized by strontium isotopic composi-tions, which are lower compared to that recordedduring the Precambrian–Cambrian boundary(Veizer et al., 1999). The generalized trend ofstrontium isotope record of the carbonate rocksduring the period between 1600 and 540 Ma isshown in Fig. 4b. In this diagram the periodbetween 800 and 540 Ma is represented by solidline following Jacobsen and Kaufman (1999). The�800 Ma period has been shown by dashed line,because of the paucity of the data.
The 87Sr/86Sr data of carbonate rocks belongingto the Nimbahera, Rohtas and Kajrahat forma-tions of Semri Group and those from the Nagodand Lakheri formations of Bhander Group areplotted in the same age range as that of thecarbon isotope trend (Fig. 4b). The plotted pointsrepresent the least radiogenic 87Sr/86Sr values ofrespective formations, whereas, the vertical barsshow their actual ranges. The 87Sr/86Sr values ofcarbonates of Rohtas and Kajrahat formationsrange from 0.7052 to 0.7067. The best preservedvalue of 0.7052 for the Rohtas Formation is closeto the least radiogenic 87Sr/86Sr value of 0.705obtained on 1300–1500 Ma old carbonates(Pokrovskij and Vinogradov, 1991; Mirota andVeizer, 1994). The high 87Sr/86Sr values of carbon-ates of the Nimbahera Formation (0.7064–0.7073) resemble those obtained on carbonates ofthe 1100–1000-Ma-old Bitter Spring Formation(0.7068, Veizer and Compston, 1976). It needs tobe mentioned here that the age range proposedfor the Semri Group is at present tentative be-cause (i) coupled carbon and strontium isotopetrends for the Mesoproterozoic are poorly con-strained; and (ii) lack of robust geochronologicaldata such as U–Pb zircon ages on the VindhyanSupergroup.
The carbonates of the Bhander Group generallyshow higher 87Sr/86Sr values compared to theSemri Group. The high 87Sr/86Sr values (0.7075–0.709) of carbonates of Lakheri Formation areclearly in consonance with the observed rise in the

B. Kumar et al. / Precambrian Research 113 (2002) 43–6360
Fig. 5. �13C and 87Sr/86Sr records of carbonates of various formations of the Bhander and Semri groups (generalized stratigraphiccolumn shown is not to the scale). The supposedly stratigraphic equivalents such as Rohtas and Nimbahera as well as Nagod andLakheri formations depict distinct C and Sr isotope compositions indicating that they may not be coeval. Assigned youngerstratigraphic positions of Nimbahera and Lakheri formations are based on comparison of isotopic data with generalized C and Srcurves of Fig. 4a, b (see text).
‘cap carbonates’ overlying the Vendian glacialdeposits. The highly negative �13C values of thesecarbonates further corroborate this observationsuggesting that the Lakheri limestone may serveas the Indian example of Vendian ‘cap carbon-ates’. Further studies are needed for proving aglacial origin for the tilloids underlying theLakheri limestones near Lakheri. The limestonesof Nagod Formation being characterized byhighest �13C of +5.7‰ with least radiogenic 87Sr/86Sr value of 0.7065 are similar to the worldwidepost-Sturtian (�750 Ma) carbonate sequences.Thus the combined carbon and strontium isotoperecords of the Vindhyan Supergroup presented inthis study demonstrate that the Bhander Group isa definite Neoproterozoic sequence probably de-posited between �700 and �540 Ma.
From the foregoing it appears that the deposi-tion of sediments belonging to the Vindhyan Su-pergroup took a long time span between �1450and �540 Ma. The Majhgawan kimberlite,
which intrudes the Kaimur sandstone sets an up-per age limit for the Semri and Kaimur groups at�1000 Ma. Therefore the Rewa and Bhandergroups should represent the Neoproterozoic pe-riod of deposition. It may be mentioned here thatunconformities observed within the Rewa Groupand in between Rewa and Bhander groups (seeSection 2) may account for �400 Ma period ofdeposition of these sediments.
6.4. Implication of isotopic data on supposedlystratigraphic equi�alent formations
The carbon isotopic data of samples belongingto the same formation but from different localitiesare similar as evidenced by samples of Nagod andRohtas formations (Tables 3 and 4). Further-more, the �13C values of carbonates of the RohtasFormation belonging to eastern Son Valley andcentral Vindhyan sections are also similar. Thissuggests the validity of �13C record for inter- and

B. Kumar et al. / Precambrian Research 113 (2002) 43–63 61
intra-basinal correlation. However, C and Sr iso-topic data of the present study clearly indicatethat the proposed stratigraphic correlation be-tween Nimbahera and Rohtas formations of theSemri Group as well as Lakheri and Nagod for-mations of the Bhander Group do not hold good.Distinct �13C and 87Sr/86Sr compositions of thesesupposedly equivalent formations of both Semriand Bhander groups suggest that they are notcoeval (see Fig. 5). C and Sr isotopic recordssupport the placement of Lakheri and Nimbaheraformations younger to their respective equivalents(Fig. 4a, b). Subtle differences observed in thelithological association of each of these forma-tions in Rajasthan and Son Valley sections (pre-sented in Section 3.3) corroborate the aboveinference. Furthermore, it may be worthwhile tomention that the sedimentation pattern in theRajasthan area is distinct when compared to theSon Valley. Reliable geochronological data arewarranted to resolve the stratigraphicdiscrepancies.
6.5. Small shelly fossils and triploblastic metazoansfrom the Lower Vindhyans
Recently, the Vindhyan Supergroup has at-tained great significance because of paleontologi-cal findings of animal burrows in the Chorhatsandstone (Seilacher et al., 1998) and small shellyfossils in the Rohtas Formation (Azmi, 1998) ofthe Semri Group. While the former finding hasraised questions about the pattern and timing ofmetazoan evolution, the later led to the suggestionthat the sediments of the Vindhyan Supergroupwere deposited during Vendian to EarlyPaleozoic.
The report of small shelly faunas and bra-chiopods of Cambrian affinity from the RohtasFormation by Azmi (1998) is debatable (see J.Geol. Soc. India, 1999, 53, 120–130 and 481–500;Brasier, 1999). In subsequent publications, Azmi(1999a,b) has withdrawn the claim of presence ofbrachiopods but defended the occurrence of shellyfauna in cherty limestone. However, Bhatt et al.(1999) have reported that the cherty limestonefrom which the celebrated trace fossils were recov-ered is actually a cherty shale. Therefore, unless
some authentic details regarding lithology andlithostratigraphic relationships of the rocks host-ing the small shelly faunas are available, it ismeaningless to discuss the age implications of theVindhyan Supergroup based on this ‘new discov-ery’. It is important to stress that marine fossilstypical of the Lower Paleozoic, which are com-mon world over, have not been reported from anyformation of the Vindhyan Supergroup. This isthe strongest evidence against Vindhyan sedimen-tation being continued up to Paleozoic. In thiscontext it is important to note that the inferreddepositional age of 617 Ma for the Lower Vind-hyan by Banerjee and Frank (1999) and Banerjee(2000) is ambiguous.
The authenticity of occurrence of triploblasticmetazoans by Seilacher et al. (1998) has beenquestioned because of the absence of firm evi-dence for biogenecity (Brasier, 1999; Kumar,1999). Seilacher et al. (2000) recently have shownthat the earliest animal fossil of USA Vermiformaantiqua Cloud reported by Cloud et al. (1976) isactually a tectonic artifact, which they term as atectograph. We believe that a similar origin forthese most crucial findings of animal burrowsfrom the Chorhat sandstone should be ruled out,before firmly attributing biogenecity to these in-triguing structures. However, if the structures ob-served by Seilacher et al. (1998) are indeedbiogenic in origin, the present study clearly sug-gests that the metazoan evolution took place atleast �750 Ma.
Acknowledgements
This study forms a part of collaborative projectsponsored by K.D. Malviya Institute ofPetroleum Exploration (KDMIPE), Dehradun(Grant c Rch. Proj./2(366)/94). The authors arethankful to Dr Harsh K. Gupta, Director, Na-tional Geophysical Research India (NGRI),Hyderabad and Mr Kuldeep Chandra, ExecutiveDirector, KDMIPE for taking keen interest inthis study, and granting permission to publish thiswork. Special thanks are due to Mr D.J. Patil,NGRI for useful discussions. BS acknowledgesResearch Associateship of the Council of Scien-

B. Kumar et al. / Precambrian Research 113 (2002) 43–6362
tific and Industrial Research, India. Authors arehighly grateful to Drs Alan J. Kaufman, JuhaKarhu and Ken Eriksson for their valuable sug-gestions, which have immensely helped in improv-ing the manuscript.
References
Asmerom, Y., Jacobsen, S.B., Knoll, A.H., Butterfield, N.J.,Swett, K., 1991. Strontium isotopic variations ofNeoproterozoic seawater: implications for crustal evolu-tion. Geochim. Cosmochim. Acta 55, 2883–2894.
Azmi, R.J., 1998. Discovery of Lower Cambrian small shellyfossils and brachiopods from the Lower Vindhyan of theSon Valley, Central India. J. Geol. Soc. India 52, 381–389.
Azmi, R.J., 1999a. Discovery of Lower Cambrian small shellyfossils and brachiopods from the Lower Vindhyan of theSon Valley, Central India. Discussion. J. Geol. Soc. India53, 125–130.
Azmi, R.J., 1999b. Discovery of Lower Cambrian small shellyfossils and brachiopods from the Lower Vindhyan of theSon Valley, Central India. Discussion. J. Geol. Soc. India53, 488–500.
Banerjee, D.M., 2000. How old is the Vindhyan basin? Abst.IGC Rio, Brazil.
Banerjee, D.M., Frank, W., 1999. Preliminary 40Ar/39Ar datesof porcellanite and detrital mica from the Vindhyan ofCentral India. Workshop on Vindhyan Stratigraphy andPaleobiology, Univ. of Lucknow, Lucknow, p. 5.
Banerjee, I., 1974. Barrier coast line sedimentation model andthe Vindhyan example. In: De, A. (Ed.), Contributions tothe Earth and Planetary Sciences (Golden Jubilee volume),vol. 46. Geol. Min. Met. Soc, India, pp. 101–127.
Bhatt, D.K., Singh, G., Gupta, S., Soni, M.K., Moitra, A.K.,Das, D.P., et al., 1999. Fossil report from Semri Group,Lower Vindhyan. J. Geol. Soc. India 53, 717–723.
Bhattacharyya, A., 1996. Recent advances in Vindhyan Geol-ogy. Mem. Geol. Soc. India 36 pp. iii–viii.
Brasier, M., 1999. Comment on ‘Discovery of Lower Cam-brian small shelly fossils and brachiopods from the LowerVindhyan of the Son Valley, Central India. J. Geol. Soc.India 53, 727–730.
Brasier, M.D., Magaritz, M., Corfield, R., Huilin, L., Xiche,Wu., Zhiwer, J., et al., 1990. The carbon and oxygenisotope record of the Precambrian–Cambrian boundaryinterval in China and Iran and their correlation. Geol.Mag. 127, 319–332.
Burdett, J.W., Grotzinger, J.P., Arthur, M.A., 1990. Didmajor changes in the stable isotope composition ofProterozoic seawater occur? Geology 18, 227–230.
Chakraborty, C., Bhattacharyya, A., 1996. Fan-delta sedimen-tation in a foreland moat: Deoland formation, VindhyanSupergroup, Son Valley. In: Bhattacharyya, A. (Ed.), Re-cent Advances in Vindhyan Geology, vol. 36. Mem. Geol.Soc, India, pp. 27–48.
Chakraborty, P.P., Banerjee, S., Das, N.G., Sarkar, S., Bose,P.K., 1996a. Volcaniclastics and their sedimentologicalbearing in Proterozoic Kaimur and Rewa groups in centralIndia. In: Bhattacharyya, A. (Ed.), Recent Advances inVindhyan Geology, vol. 36. Mem. Geol. Soc, India, pp.59–75.
Chakraborty, T., Sarkar, S., Chaudhuri, A.K., Das Gupta, S.,1996b. Depositional environment of Vindhyan and otherPurana basins: A reappraisal in the light of recent findings.In: Bhattacharyya, A. (Ed.), Recent Advances in VindhyanGeology, vol. 36. Mem. Geol. Soc, India, pp. 101–126.
Cloud, P.E., Wright, J., Glover, L., 1976. Traces of animal lifefrom 620 million-year old rocks in North Carolina. Am.Sci. 64, 396–406.
Crawford, A.R., Compston, W., 1970. The age of VindhyanSystem of peninsular India. J. Geol. Soc. Lond. 125,351–371.
Derry, L.A., Kaufman, A.J., Jacobsen, S.B., 1992. Sedimen-tary cycling and environmental change in the Late Protero-zoic: evidence from stable and radiogenic isotopes.Geochim. Cosmochim. Acta 56, 1317–1329.
Hall, S.M., Veizer, J., 1996. Geochemistry of Precambriancarbonates: VII. Belt Supergroup, Montana and Idaho,USA. Geochim. Cosmochim. Acta 60, 667–677.
Hudson, J.D., 1977. Stable isotopes and limestone lithification.J. Geol. Soc. Lond. 133, 637–660.
Iyer, S.S., Babinski, M., Krouse, H.R., Chemale, F.J., 1995.Highly 13C-enriched carbonate and organic matter in theNeoproterozoic sediments of the Bambui Group, Brazil.Precambrian Res. 73, 271–282.
Jacobsen, S.B., Kaufman, A.J., 1999. The Sr, C and O isotopicevolution of Neoproterozoic seawater. Chem. Geol. 161,37–57.
Kah, L.C., Sherman, A.G., Narbonne, G.M., Knoll, A.H.,Kaufman, A.J., 1999. 13C stratigraphy of the ProterozoicBylot Supergroup, Baffin Island, Canada: implications forregional lithostratigraphic correlations. Can. J. Earth Sci.36, 313–332.
Kaufman, A.J., Knoll, A.H., 1995. Neoproterozoic variationsin the C-isotopic composition of seawater: stratigraphicand biogeochemical implications. Precambrian Res. 73,27–49.
Kaufman, A.J., Hayes, J.M., Knoll, A.H., Germs, G.J.B.,1991. Isotopic compositions of carbonates and organiccarbon from upper Proterozoic successions in Namibia:stratigraphic variation and the effects of diagenesis andmetamorphism. Precambrian Res. 49, 301–327.
Kennedy, M.J., Runnegar, B., Prave, A.R., Hoffmann, K.-H.,Arthur, A., 1998. Two or four Neoproterozoic glaciations?Geology 26, 1059–1063.
Krishnan, M.S., 1968. Geology of India and Burma. Higgin-bothams Pvt. Ltd, Madras, India 536 pp.
Krishnan, M.S., Swaminath, J., 1959. The Great VindhyanBasin of northern India. J. Geol. Soc. India 1, 10–30.
Kumar, A., Padma Kumari, V.M., Dayal, A.M., Murthy,D.S.N., Gopalan, K., 1993. Rb–Sr ages of Proterozoickimberlites of India: evidence for contemporaneous em-placement. Precambrian Res. 62, 227–237.

B. Kumar et al. / Precambrian Research 113 (2002) 43–63 63
Kumar, B., Tewari, V.C., 1995. Carbon and oxygen isotopetrends in late Precambrian–Cambrian carbonates from theLesser Himalaya, India. Curr. Sci. 69, 929–931.
Kumar, B., Das Sharma, S., Shukla, M., Sharma, M., 1999.Chronostratigraphic implication of carbon and oxygen iso-topic compositions of the Proterozoic Bhima carbonates. J.Geol. Soc. India 53, 593–600.
Kumar, S., 1977. Stromatolites and phosphorite in the Tiro-han Limestone of Chitrakut area, Satna District, M.P.Curr. Sci. 46, 341–342.
Kumar, S., 1999. Siliceous sponge spicule-like forms from theNeoproterozoic Bhander limestone, Maihar area, Madhyapradesh. J. Palaeont. Soc. India 44, 141–148.
Kumar, S., Schidlowski, M., 1999. Carbon and oxygen iso-topes of the Rohtas Formation, Son Valley-Maihar area,Central India: A preliminary report. Workshop on Vind-hyan Stratigraphy and Paleobiology, Univ. of Lucknow,Lucknow, pp. 21–24.
Magaritz, M., Kirschvink, J.L., Latham, A.J., Zhuravlev,A.Yu., Rozanov, A.Yu., 1991. Precambrian–Cambrianboundary problem: Carbon isotope correlations for Ven-dian and Tommotian time between Siberia and Morocco.Geology 19, 847–856.
McCrea, J.M., 1950. On the isotope chemistry of carbonatesand a paleo-temperature scale. J. Chem. Phys. 18, 849–857.
Mirota, M.D., Veizer, J., 1994. Geochemistry of Precambriancarbonates: VI. Aphebian Albanel Formations, Quebec,Canada. Geochim. Cosmochim. Acta 58, 1735–1745.
Narbonne, G.M., Kaufman, A.J., Knoll, A.H., 1994. Inte-grated chemostratigraphy and biostratigraphy of theWindemere Supergroup, northwestern Canada: Implica-tions for Neoproterozoic correlations and early evolutionof animals. Bull. Geol. Soc. Am. 106, 1281–1292.
Pascoe, E.H., 1959. A Manual of the Geology of India andBurma. Geol. Surv. India Publ 1343 pp.
Pokrovskij, B.G., Vinogradov, V.I., 1991. Isotopic composi-tion of strontium, oxygen and carbon in the Upper Pre-cambrian carbonates of the western slope of the AnabarUplift (Kotuikan River). Doklady Akad. Nauk. USSR320, 1245–1250.
Prasad, B., 1984. Geology, sedimentation and palaeogeogra-phy of the Vindhyan Supergroup, southeastern Rajasthan(Part I) Mem. Geol. Surv. India 116, 1–107.
Rajagopalan, G., Maithy, P.K., 1993. Group Discussion onVindhyans, Jadavpur Univ., Calcutta, pp. 35–36.
Roy, A.B., 1988. Stratigraphic and tectonic framework of theAravalli Mountain Range. In: Roy, A.B. (Ed.), Precam-brian of Aravalli Mountain Rajasthan, vol. 7. India Mem.Geol. Soc, India, pp. 3–31.
Sanyal, S., Chakraborty, S., 1982. Report on Geological Map-ping of the Vindhyan Supergroup of in Parts of Satnadistrict, M.P. Unpubl. Rep. of Geol. Surv. India.
Sastry, M.V.A., Moitra, A.K., 1984. Vindhyan stratigraphy— A review. Mem. Geol. Surv. India (Part II) 116, 109–148.
Seilacher, A., Bose, P.K., Pfluger, F., 1998. Triploblastic ani-
mals more than 1 billion years ago: Trace fossil evidencefrom India. Science 282, 80–83.
Seilacher, A., Meschede, M., Bolton, E.W., Luginsland, H.,2000. Precambrian ‘fossil’ Vermiforma is a tectograph.Geology 28, 235–238.
Sengupta, S.N., 1996. The Vindhyan under the north IndianPlains. In: Bhattacharyya, A. (Ed.), Recent Advances inVindhyan Geology, vol. 36. Mem. Geol. Soc, India, pp.257–265.
Soni, M.K., Chakraborty, S., Jain, V.K., 1987. VindhyanSupergroup: A Review, vol. 6. Mem. Geol. Soc, India, pp.87–118.
Srivastava, A.P., Rajagopalan, G., 1986. F-T dating of Pre-cambrian deposits of Vindhyan Group at Chitrakut,Banda district (UP-MP). In: Sharma, K.K. (Ed.), NuclearTracts. Govt. of India, New Delhi, pp. 41–52.
Srivastava, A.P., Rajagopalan, G., 1988. F-T ages of Vind-hyan glauconite sandstone beds exposed around Rowatb-hata area, S.W. Rajasthan. J. Geol. Soc. India 32,527–529.
Srivastava, A.P., Rajagopalan, G., Nagpaul, K.K., 1985. Fis-sion track ages of lower Vindhyan Glauconitic beds atMirzapur, U.P. Indian J. Earth Sci. 12, 89–92.
Tugarinov, A.I., Shanin, L.L., Kazakov, G.A., Arakelyants,M.M., 1965. On the glauconitic ages of the Vindhyansystem (India). Geokhimiya 6, 652–660.
Veizer, J., Compston, W., 1976. 87Sr/86Sr in Precambriancarbonates as an index of crustal evolution. Geochim.Cosmochim. Acta 40, 905–915.
Veizer, J., Compston, W., Clauer, N., Schidlowski, M., 1983.87Sr/86Sr in Late Proterozoic carbonates: Evidence for a‘mantle event’ at 900 Ma ago. Geochim. Cosmoschim.Acta 47, 295–302.
Veizer, J., Hoefs, J., Lowe, D.R., Thurston, P.C., 1989. Geo-chemistry of Precambrian carbonates: II. Archaean green-stone belts and Archaean seawater. Geochim. Cosmochim.Acta 53, 859–871.
Veizer, J., Clayton, R.N., Hinton, R.W., Von Brunn, V.,Mason, T.R., Buck, S.G., et al., 1990. Geochemistry ofPrecambrian carbonates: III. Shelf seas and non-marineenvironments of the Archean. Geochim. Cosmochim. Acta54, 2717–2729.
Veizer, J., Clayton, R.N., Hinton, R.W., 1992. Geochemistryof Precambrian carbonates: Early Paleoproterozoic(2.25�0.25 Ga) seawater. Geochim. Cosmochim. Acta 56,875–885.
Veizer, J., et al., 1999. 87Sr/86Sr, �13C and �18O evolution ofPhanerozoic seawater. Chem. Geol. 161, 37–57.
Venkatachala, B.S., Sharma, M., Shukla, M., 1996. Age andlife of the Vindhyans — facts and conjectures. In: Bhat-tacharyya, A. (Ed.), Recent Advances in Vindhyan Geol-ogy, vol. 36. Mem. Geol. Soc, India, pp. 137–165.
Vinogradov, A.P., Tugarinov, A.I., 1964. Geochronology ofIndian Precambrian. Proc. 22nd Int. Geol. Congr. 10 NewDelhi, p. 652.
Vinogradov, A.P., Tugarinov, A.I., Zhikov, C.I., Stanikova,N.I., Bibikova, E.V., Khorre, K., 1964. Geochronology ofIndian Precambrian. Report 22nd Intl. Geol. Congr. NewDelhi 10, pp. 553–567.
Copyright © 2022 FDOKUMEN