Physical properties of tuffs from a scientific borehole at Alban hills volcanic district (central...
9
Physical properties of tuffs from a scientific borehole at Alban hills volcanic district (central Italy) S. Vinciguerra a, ⁎, P. Del Gaudio a , M.T. Mariucci a , F. Marra a , P.G. Meredith b , P. Montone a , S. Pierdominici a , P. Scarlato a a Istituto Nazionale di Geofisica e Vulcanologia, Sezione di Roma1, I-00143 Rome, Italy b Department of Earth Sciences, University College London, WC1E 6BT London, UK abstract article info Article history: Received 24 April 2008 Received in revised form 8 July 2008 Accepted 7 August 2008 Available online 22 August 2008 Keywords: Scientific borehole Volcanic rocks Physical properties Recent seismic swarms and hydrothermal activity suggest that the Quaternary volcanic complex of the Alban Hills may pose a threat to the city of Rome. A 350 m scientific borehole was therefore drilled into this volcanic area to elucidate its inner structure for the first time. Wire-line logs were run in the borehole in order to characterize the physical properties of the rocks and their variations with depth. In particular, a detailed sonic log was run to measure the P-wave velocity from the well-head down to110 m. To further investigate velocity changes, we carried out laboratory measurements of P and S elastic wave velocities and fluid permeability at effective pressures up to 70 MPa during both increasing and decreasing pressure cycles on selected core samples representative of the main volcanic units. Specifically, we studied samples from two pyroclastic units representative of two classes of volcanic deposits that are representative of the whole succession: (i) a coarse-grained, well-lithified facies (Pozzolane Rosse unit), containing abundant mm-to-cm lava clasts and crystals; and (ii) a fine-grained, matrix-supported pyroclastic deposit (Tufo Pisolitico di Trigoria unit), with rare lithic lava clasts and sparse pumice. Elastic wave velocities reveal significant differences between units and indicate how, within the same lithology, the different degree of lithification and presence of clasts can affect significantly physical property values. The mean laboratory value of the P- wave velocity for Pozzolane Rosse and Tufo Pisolitico di Trigoria units is respectively of 3.75 and 3.2 km/s at an effective pressure equivalent to that at the depth at which the sonic velocity was measured. Under increasing effective pressure a profound influence on the transport properties is observed. Permeability ranges from the order of 10 -18 m 2 for the Pozzolane Rosse unit to the order of 10 -15 m 2 for the Tufo Pisolitico di Trigoria unit, in good agreement with the shallow aquifer circulating in the shallower units. © 2008 Elsevier B.V. All rights reserved. 1. Introduction The Alban Hills form part of the 200-km-long, Roman Magmatic Province (Washington, 1906), a chain of ultra-potassic, mainly explosive volcanic districts and small eruptive centres that developed along the Tyrrhenian margin of central Italy since the Middle Pleistocene. The regional structural trend follows the main NW–SE oriented extensional faults characterizing the Apennines and the Tyrrhenian Sea margin, and it is crossed by a local N–S, right-lateral fault system developed behind the Olevano–Antrodoco thrust front (Fig. 1a). This latter feature represents a major geodynamic boundary, along which the Umbria–Marche–Sabina pelagic/transitional series of the northern Apennines over thrusts the Latium–Abruzzi carbonate platform of the central Apennines. The Alban Hills are located where recognized N–S strike–slip structural trends meet the NW–SE extensional ones. The present-day stress field in the area is not well constrained, and its interpretation is the subject of current debate (e.g. Faccenna et al., 1994; Montone et al., 1995; Marra, 1999). In particular, it is not clear whether a still-standing extensional regime characterized by a vertical σ 1 and a NE-oriented σ 3 affects this area, or a substantial similarity of σ 1 –σ 2 –σ 3 causes the frequent permutation of the stress tensor, allowing for repeated superimposition of two competitive tectonic regimes (Marra, 2001). Enhanced deformation (Amato and Chiarabba, 1995; Salvi et al., 2004) and seismic activity (Amato et al., 1994; Feuillet et al., 2004) have both been reported in the area of the most recent volcanic activity. In particular, instrumental records of the 1989–1990 seismic swarm, that struck the western flank of the volcano, suggest that the main faults are active under a NE extensional regime (Fig. 1b). In contrast, both recent and historical deformations of the surrounding Acque Albule travertine basin (Fig. 1a) have been interpreted as the effect of strike–slip tectonics under a NE trending σ 1 (Faccenna et al., Tectonophysics 471 (2009) 161–169 ⁎ Corresponding author. Tel.: +39 06 51860478; fax: +39 06 51860507. E-mail address: [email protected] (S. Vinciguerra). 0040-1951/$ – see front matter © 2008 Elsevier B.V. All rights reserved. doi:10.1016/j.tecto.2008.08.010 Contents lists available at ScienceDirect Tectonophysics journal homepage: www.elsevier.com/locate/tecto
Transcript of Physical properties of tuffs from a scientific borehole at Alban hills volcanic district (central...
Tectonophysics 471 (2009) 161–169
Contents lists available at ScienceDirect
Tectonophysics
j ourna l homepage: www.e lsev ie r.com/ locate / tecto
Physical properties of tuffs from a scientific borehole at Alban hills volcanicdistrict (central Italy)
S. Vinciguerra a,⁎, P. Del Gaudio a, M.T. Mariucci a, F. Marra a, P.G. Meredith b, P. Montone a,S. Pierdominici a, P. Scarlato a
a Istituto Nazionale di Geofisica e Vulcanologia, Sezione di Roma1, I-00143 Rome, Italyb Department of Earth Sciences, University College London, WC1E 6BT London, UK
⁎ Corresponding author. Tel.: +39 06 51860478; fax:E-mail address: [email protected] (S. Vinciguerra).
0040-1951/$ – see front matter © 2008 Elsevier B.V. Adoi:10.1016/j.tecto.2008.08.010
a b s t r a c t
a r t i c l e i n f oArticle history:
Recent seismic swarms and Received 24 April 2008Received in revised form 8 July 2008Accepted 7 August 2008Available online 22 August 2008Keywords:Scientific boreholeVolcanic rocksPhysical properties
hydrothermal activity suggest that the Quaternary volcanic complex of the AlbanHills may pose a threat to the city of Rome. A 350 m scientific borehole was therefore drilled into this volcanicarea to elucidate its inner structure for the first time. Wire-line logs were run in the borehole in order tocharacterize the physical properties of the rocks and their variations with depth. In particular, a detailedsonic log was run to measure the P-wave velocity from the well-head down to 110 m. To further investigatevelocity changes, we carried out laboratory measurements of P and S elastic wave velocities and fluidpermeability at effective pressures up to 70 MPa during both increasing and decreasing pressure cycles onselected core samples representative of the main volcanic units. Specifically, we studied samples from twopyroclastic units representative of two classes of volcanic deposits that are representative of the wholesuccession: (i) a coarse-grained, well-lithified facies (Pozzolane Rosse unit), containing abundant mm-to-cmlava clasts and crystals; and (ii) a fine-grained, matrix-supported pyroclastic deposit (Tufo Pisolitico diTrigoria unit), with rare lithic lava clasts and sparse pumice. Elastic wave velocities reveal significantdifferences between units and indicate how, within the same lithology, the different degree of lithificationand presence of clasts can affect significantly physical property values. The mean laboratory value of the P-wave velocity for Pozzolane Rosse and Tufo Pisolitico di Trigoria units is respectively of 3.75 and 3.2 km/s atan effective pressure equivalent to that at the depth at which the sonic velocity was measured.Under increasing effective pressure a profound influence on the transport properties is observed. Permeabilityranges from the order of 10−18 m2 for the Pozzolane Rosse unit to the order of 10−15 m2 for the Tufo Pisolitico diTrigoria unit, in good agreement with the shallow aquifer circulating in the shallower units.
© 2008 Elsevier B.V. All rights reserved.
1. Introduction
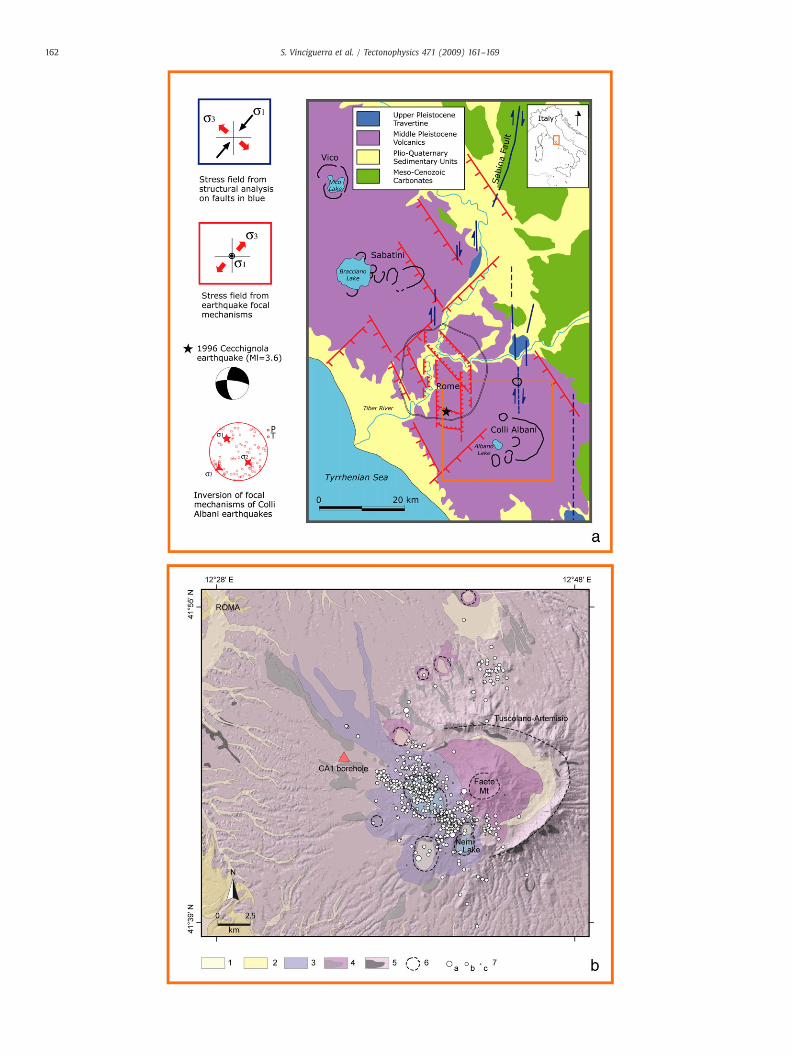
The Alban Hills form part of the 200-km-long, Roman MagmaticProvince (Washington, 1906), a chain of ultra-potassic, mainlyexplosive volcanic districts and small eruptive centres that developedalong the Tyrrhenian margin of central Italy since the MiddlePleistocene. The regional structural trend follows the main NW–SEoriented extensional faults characterizing the Apennines and theTyrrhenian Sea margin, and it is crossed by a local N–S, right-lateralfault system developed behind the Olevano–Antrodoco thrust front(Fig. 1a). This latter feature represents a major geodynamic boundary,along which the Umbria–Marche–Sabina pelagic/transitional series ofthe northern Apennines over thrusts the Latium–Abruzzi carbonateplatform of the central Apennines. The Alban Hills are located where
+39 06 51860507.
ll rights reserved.
recognized N–S strike–slip structural trends meet the NW–SEextensional ones.
The present-day stress field in the area is not well constrained,and its interpretation is the subject of current debate (e.g. Faccennaet al., 1994; Montone et al., 1995; Marra, 1999). In particular, it is notclear whether a still-standing extensional regime characterized by avertical σ1 and a NE-oriented σ3 affects this area, or a substantialsimilarity of σ1–σ2–σ3 causes the frequent permutation of the stresstensor, allowing for repeated superimposition of two competitivetectonic regimes (Marra, 2001).
Enhanced deformation (Amato and Chiarabba, 1995; Salvi et al.,2004) and seismic activity (Amato et al., 1994; Feuillet et al., 2004)have both been reported in the area of the most recent volcanicactivity. In particular, instrumental records of the 1989–1990 seismicswarm, that struck the western flank of the volcano, suggest that themain faults are active under a NE extensional regime (Fig. 1b). Incontrast, both recent and historical deformations of the surroundingAcque Albule travertine basin (Fig. 1a) have been interpreted as theeffect of strike–slip tectonics under a NE trending σ1 (Faccenna et al.,
162 S. Vinciguerra et al. / Tectonophysics 471 (2009) 161–169
163S. Vinciguerra et al. / Tectonophysics 471 (2009) 161–169
1994;Marra et al., 2004). Furthermore, twomain fracture systems, SWand NW dipping, have been recognized from recent down-holemeasurements in the volcanic units close to the Tuscolano–Artemisiocaldera rim (Mariucci et al., in press), and interpreted as occurringfrom the superimposition of the two tectonic styles in the area.However, analysis of borehole breakouts defined an active stress fieldwith an approximately E–W oriented minimum horizontal compo-nent, which may be interpreted as evidence of strain-partitioningalong the local N–S structures due to their re-activation under a NE-striking extensional regime (Mariucci et al., in press).
The scientific community has recently increased its efforts tounderstand the internal structure of the volcano through tomographicstudies based on inversion of seismicity from local earthquakes (Feuilletet al., 2004; Chiarabba et al., 1994).While high velocity zones have beeninterpreted as either solidified magma reservoirs or uplifted basement,the observed low velocity anomalies on thewesternflank suggest eitherthe presence of molten material or fluid overpressure (Chiarabba et al.,1997). The documented unrest episodes of enhanced seismic activityand deformation are also accompanied by anomalous gas emissions(CO2, 222Radon, H2S) (Pizzino et al., 2002; Carapezza et al., 2003)controlled by the interplay between a shallow aquifer (less than 1 kmofdepth), hosted within the volcanic pile, and a reservoir buried in thecarbonate basement, separated by low permeability Plio-Quaternarydeposits (Boni et al.,1995; Di Filippo and Toro,1995; Capelli et al., 2001).
As a consequence, unraveling thevelocity structure and theconditionscontrolling fluid flow within the volcanic complex, and their evolutionwith depth, have been primary drivers of scientific investigation.
Hence, a 350 m deep scientific borehole was recently drilled inthe western sector of the volcanic complex, allowing both wire-linelogging and continuous core recovery to be carried out. Herewe presentresults from a joint study in which (i) the results of laboratory mea-surements of porosity, P and S elastic wave velocities and fluidpermeability on recovered cores under simulated in situ conditionsare integrated with (ii) in situmeasurements of P and S wave velocitiesfrom down-hole sonic logs. This integration of multi-scale measure-ments of physical properties allowsus to constrain the velocity structureof the volcanic complex and highlight the physical mechanismscontrolling the fluid circulationwithin the different volcanic lithologies.
2. Volcanic stratigraphy
The volcanic history of Alban Hills may be roughly divided into threemain phases, marked by different eruptive mechanisms and magmavolumes (De Rita et al., 1988, 1995; Giordano et al., 2006). The earlyTuscolano–Artemisio Phase (c. 561–366 ka; Karner et al., 2001; Marraet al., in press) was the most explosive and voluminous, and is char-acterized by five large pyroclastic-flow forming eruptions with volumesof the order of tens of km3 andminor effusive activity. Each one of thesecycles ended with caldera collapse followed by intra- and peri-calderaeffusive and strombolian activity. The last cycle originated the so-calledTuscolano–Artemisio caldera and its ring of scoria cones in the periodc. 366–351 ka. After a c. 40 kyr-long dormancy, the less energetic FaetePhase of activity occurred (c. 308–250 ka; Marra et al., 2003). This phasestarted with peripheral effusive eruptions coupled with subordinatehydromagmatic activity, and encompassed the formation of the Faetecentral edifice and several minor scoria cones within the older intra-caldera area. A further c. 50 kyr-long dormancy thenpreceded the start ofthe Late Hydromagmatic Phase (c. 200–36 ka; Marra et al., 2003; Fredaet al., 2006; Giaccio et al., 2007), which was dominated by pyroclastic-surge eruptions with the formation of several monogenetic or multiplemaars and/or tuff rings clustered southwest of the Mt. Faete edifice.
Fig.1.Overview of the geological and geophysical characters of the area. a) Regional tectonic struwithCA1borehole location andseismicity (modified afterMariucci et al. inpress): 1)Holocene al36 ky); 4)deposits of “Faete phase” andrelated lavaflows (308–250ky); 5) “Tuscolano–ArtemisioFeuillet et al., 2004).
The products of the Tuscolano–Artemisio phase represent by farthe largest portion of the erupted deposits and constitute the greaterportion of the volcanic substrate of the area of Rome. These depositsmaybe grouped into two main classes, based on their petrographiccharacteristics and their eruptive mechanism (Marra et al., in press).The earlier eruptive units (Tufo Pisolitico di Trigoria, 561±1 ka; Tufo delPalatino, 528±1 ka; Tufo di Acque Albule, 526±1 ka; Marra et al., inpress) are the result of hydromagmatic eruptions and are characterizedby prevalently fine-grained, pyroclastic ash-flowdeposits. The later units(Pozzolane Rosse, 456±3 ka; Pozzolane Nere, 407±2 ka; Villa Senni,365 ±4 ka; (Marra et al., in press) are the result of dry eruptions and arecharacterized bycoarse-grained, pyroclastic scoria and ash-flowdeposits.
3. The drilling project
As reported above, a 350 m scientific borehole was drilled in thewestern sector of the Alban Hills area (Fig. 1a), where seismic swarms(Fig. 1b), enhanced ground deformation and high gas concentration inwater hadbeen observed. The aimwas to elucidate the internal structureand determine the stress field by means of down-hole measurements(seeMariucci et al., inpress). Froma tectonic pointof view, data from theborehole allowed twomain fracture systems (dippingSWandNW) to berecognized, indicating a prevalent strike–slip component of faultmovement. By contrast borehole breakout analysis defined an activestress field with an approximately E–W oriented minimum horizontalcomponent (Fig. 1a). Geochemical analysis of deep fluids from theborehole revealed water of meteoric origin which had a long residencetime in the aquifer, and gas dominated by CO2 content. The gas exhibitedone of the highest magmatic components from the Alban Hills, whichwas partly deriving from amagmatic source andpartly from the thermaldecarbonizationof carbon-richbasement rocks (Mariucci et al., inpress).
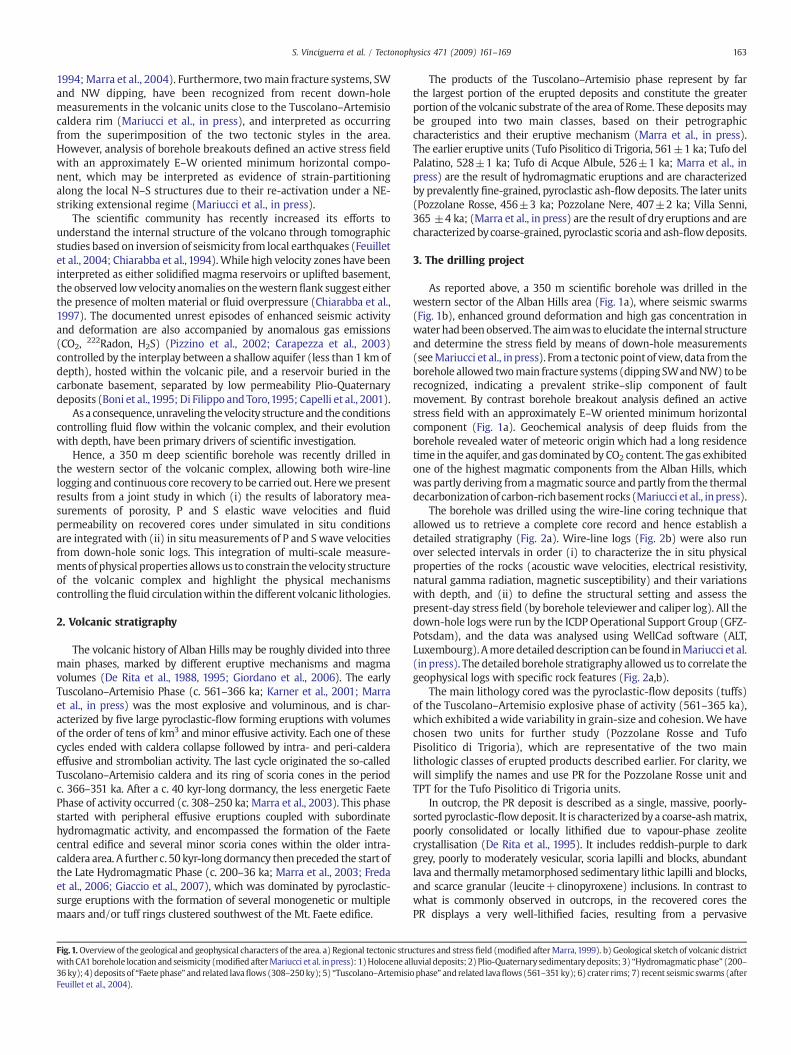
The borehole was drilled using the wire-line coring technique thatallowed us to retrieve a complete core record and hence establish adetailed stratigraphy (Fig. 2a). Wire-line logs (Fig. 2b) were also runover selected intervals in order (i) to characterize the in situ physicalproperties of the rocks (acoustic wave velocities, electrical resistivity,natural gamma radiation, magnetic susceptibility) and their variationswith depth, and (ii) to define the structural setting and assess thepresent-day stress field (by borehole televiewer and caliper log). All thedown-hole logs were run by the ICDP Operational Support Group (GFZ-Potsdam), and the data was analysed using WellCad software (ALT,Luxembourg).Amoredetaileddescription canbe found inMariucci et al.(in press). The detailed borehole stratigraphy allowed us to correlate thegeophysical logs with specific rock features (Fig. 2a,b).
The main lithology cored was the pyroclastic-flow deposits (tuffs)of the Tuscolano–Artemisio explosive phase of activity (561–365 ka),which exhibited awide variability in grain-size and cohesion.We havechosen two units for further study (Pozzolane Rosse and TufoPisolitico di Trigoria), which are representative of the two mainlithologic classes of erupted products described earlier. For clarity, wewill simplify the names and use PR for the Pozzolane Rosse unit andTPT for the Tufo Pisolitico di Trigoria units.
In outcrop, the PR deposit is described as a single, massive, poorly-sorted pyroclastic-flowdeposit. It is characterized bya coarse-ashmatrix,poorly consolidated or locally lithified due to vapour-phase zeolitecrystallisation (De Rita et al., 1995). It includes reddish-purple to darkgrey, poorly to moderately vesicular, scoria lapilli and blocks, abundantlava and thermally metamorphosed sedimentary lithic lapilli and blocks,and scarce granular (leucite+clinopyroxene) inclusions. In contrast towhat is commonly observed in outcrops, in the recovered cores thePR displays a very well-lithified facies, resulting from a pervasive
ctures and stress field (modified afterMarra,1999). b) Geological sketch of volcanic districtluvial deposits; 2)Plio-Quaternarysedimentary deposits; 3) “Hydromagmaticphase” (200–phase” andrelated lavaflows (561–351ky); 6) crater rims; 7) recent seismic swarms (after
Fig. 2. a) CA1 borehole stratigraphy of the volcanic units, belonging to the Tuscolano–Artemisio Phase (ca. 561–351 ky). Legend: P— “Pozzolanelle” (366±4 Ka); PN— “PozzolaneNere” (407±4 Ka); FL— “Fioranello Lava”; PR— “Pozzolane Rosse” (457±4 Ka); VL— “Vallerano Lava” (460±4 Ka); AFS— “Air Fall Sequence” (488±2 Ka); TAA— “Tufo di AcqueAlbule” (526±1Ka); TP— “Tufo del Palatino” (528±1Ka); TPT— “Tufo Pisolitico di Trigoria” (561±1Ka). Small grey intervals (not to scale) are paleosols. Ages are after Karner etal. (2001). b) P-wave velocity from down-hole sonic log.
164 S. Vinciguerra et al. / Tectonophysics 471 (2009) 161–169
zeolitization of the ashmatrix. Abundantmm-to-cm lava clasts andmm-sized pyroxene and biotite crystals are embedded within the coarse-ashmatrix. The observed strong cementation that occurs in the intermediate,scoriaceous volcanic deposits (Pozzolane Rosse) is the likely result ofsecondary process of transformation of primary volcanic particles intoauthigenic minerals, due to the chemical action of the ground water.
The outcropping deposits of the TPT occur as a light gray, indurate,matrix-supported, stratified coarse-ash deposit (Palladino et al., 2001).It includes altered leucite and abundant mm-to-cm-sized, poorlyvesiculated gray scoria lapilli, and subordinate lava, carbonate and tufflithics. Up to cm-sized accretionary lapilli (pisoliti) are frequent. In therecovered cores, the TPT occurs as a fine-grained, matrix-supported,lithified pyroclastic deposit. It contains rare mm-sized lithic lava clasts,sparse pumice and carbonatic clasts, and accretionary lapilli.
4. Laboratory petrophysical investigation
4.1. Methodology
All measurements were carried out on cylindrical sub-coresamples 38 mm in diameter by 40 mm long, taken from the recovered
borehole cores. Initial porosities were determined gravimetrically byweighing samples of known volume both dry and water saturated.Initial elastic wave velocity measurements were made on dry samplesunder ambient laboratory conditions. Measurements were maderadially at azimuthal steps of 10°.
In order to understand the variation of rock properties withincreasing effective pressure, we then carried out simultaneousmeasurements of ultrasonic P and S wave velocities and fluidpermeability in a servo-controlled, steady-state-flow permeameter.The permeameter comprises a hydrostatic pressure vessel, usingsilicone oil as the pressure medium, equipped with two 70MPa servo-controlled fluid pressure intensifiers (volumometers) to provide porefluid pressure independently to each end of the sample and piezo-electric ultrasonic transducers for P and S wave velocity measure-ments (Fig. 3, plus see also Benson et al., 2003, for further details).Rubber-jacketed samples are placed inside the pressure vessel, locatedbetween two steel end-caps. Measurements were made at effectivepressures from 5 to 80 MPa, during both increasing and decreasingpressure cycles. The effective pressure was increased in steps of 5 MPafrom 5 MPa to 40 MPa and then in steps of 10 MPa from 40 MPa to70 MPa.
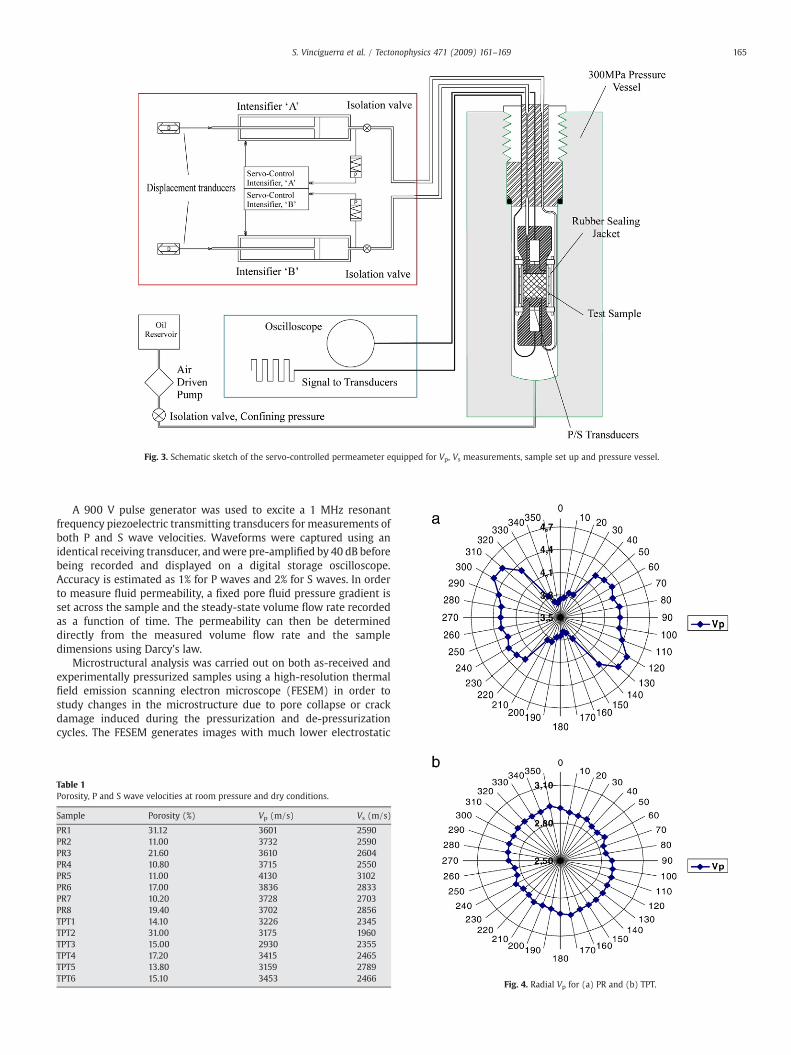
Fig. 3. Schematic sketch of the servo-controlled permeameter equipped for Vp, Vs measurements, sample set up and pressure vessel.
165S. Vinciguerra et al. / Tectonophysics 471 (2009) 161–169
A 900 V pulse generator was used to excite a 1 MHz resonantfrequency piezoelectric transmitting transducers for measurements ofboth P and S wave velocities. Waveforms were captured using anidentical receiving transducer, andwere pre-amplified by 40 dB beforebeing recorded and displayed on a digital storage oscilloscope.Accuracy is estimated as 1% for P waves and 2% for S waves. In orderto measure fluid permeability, a fixed pore fluid pressure gradient isset across the sample and the steady-state volume flow rate recordedas a function of time. The permeability can then be determineddirectly from the measured volume flow rate and the sampledimensions using Darcy's law.
Microstructural analysis was carried out on both as-received andexperimentally pressurized samples using a high-resolution thermalfield emission scanning electron microscope (FESEM) in order tostudy changes in the microstructure due to pore collapse or crackdamage induced during the pressurization and de-pressurizationcycles. The FESEM generates images with much lower electrostatic
Table 1Porosity, P and S wave velocities at room pressure and dry conditions.
Sample Porosity (%) Vp (m/s) Vs (m/s)
PR1 31.12 3601 2590PR2 11.00 3732 2590PR3 21.60 3610 2604PR4 10.80 3715 2550PR5 11.00 4130 3102PR6 17.00 3836 2833PR7 10.20 3728 2703PR8 19.40 3702 2856TPT1 14.10 3226 2345TPT2 31.00 3175 1960TPT3 15.00 2930 2355TPT4 17.20 3415 2465TPT5 13.80 3159 2789TPT6 15.10 3453 2466
Fig. 4. Radial Vp for (a) PR and (b) TPT.
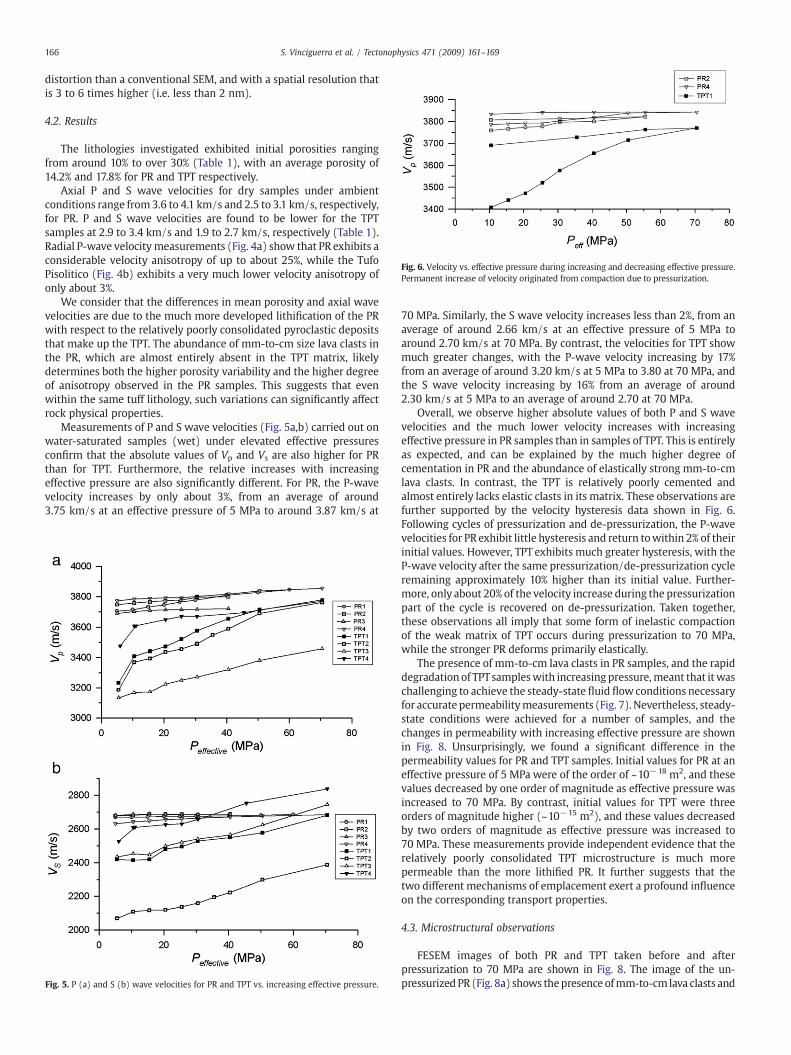
Fig. 6. Velocity vs. effective pressure during increasing and decreasing effective pressure.Permanent increase of velocity originated from compaction due to pressurization.
166 S. Vinciguerra et al. / Tectonophysics 471 (2009) 161–169
distortion than a conventional SEM, and with a spatial resolution thatis 3 to 6 times higher (i.e. less than 2 nm).
4.2. Results
The lithologies investigated exhibited initial porosities rangingfrom around 10% to over 30% (Table 1), with an average porosity of14.2% and 17.8% for PR and TPT respectively.
Axial P and S wave velocities for dry samples under ambientconditions range from3.6 to 4.1 km/s and 2.5 to 3.1 km/s, respectively,for PR. P and S wave velocities are found to be lower for the TPTsamples at 2.9 to 3.4 km/s and 1.9 to 2.7 km/s, respectively (Table 1).Radial P-wave velocity measurements (Fig. 4a) show that PR exhibits aconsiderable velocity anisotropy of up to about 25%, while the TufoPisolitico (Fig. 4b) exhibits a very much lower velocity anisotropy ofonly about 3%.
We consider that the differences in mean porosity and axial wavevelocities are due to the much more developed lithification of the PRwith respect to the relatively poorly consolidated pyroclastic depositsthat make up the TPT. The abundance of mm-to-cm size lava clasts inthe PR, which are almost entirely absent in the TPT matrix, likelydetermines both the higher porosity variability and the higher degreeof anisotropy observed in the PR samples. This suggests that evenwithin the same tuff lithology, such variations can significantly affectrock physical properties.
Measurements of P and S wave velocities (Fig. 5a,b) carried out onwater-saturated samples (wet) under elevated effective pressuresconfirm that the absolute values of Vp and Vs are also higher for PRthan for TPT. Furthermore, the relative increases with increasingeffective pressure are also significantly different. For PR, the P-wavevelocity increases by only about 3%, from an average of around3.75 km/s at an effective pressure of 5 MPa to around 3.87 km/s at
Fig. 5. P (a) and S (b) wave velocities for PR and TPT vs. increasing effective pressure.
70 MPa. Similarly, the S wave velocity increases less than 2%, from anaverage of around 2.66 km/s at an effective pressure of 5 MPa toaround 2.70 km/s at 70 MPa. By contrast, the velocities for TPT showmuch greater changes, with the P-wave velocity increasing by 17%from an average of around 3.20 km/s at 5 MPa to 3.80 at 70 MPa, andthe S wave velocity increasing by 16% from an average of around2.30 km/s at 5 MPa to an average of around 2.70 at 70 MPa.
Overall, we observe higher absolute values of both P and S wavevelocities and the much lower velocity increases with increasingeffective pressure in PR samples than in samples of TPT. This is entirelyas expected, and can be explained by the much higher degree ofcementation in PR and the abundance of elastically strong mm-to-cmlava clasts. In contrast, the TPT is relatively poorly cemented andalmost entirely lacks elastic clasts in its matrix. These observations arefurther supported by the velocity hysteresis data shown in Fig. 6.Following cycles of pressurization and de-pressurization, the P-wavevelocities for PR exhibit little hysteresis and return towithin 2% of theirinitial values. However, TPT exhibits much greater hysteresis, with theP-wave velocity after the same pressurization/de-pressurization cycleremaining approximately 10% higher than its initial value. Further-more, only about 20% of the velocity increase during the pressurizationpart of the cycle is recovered on de-pressurization. Taken together,these observations all imply that some form of inelastic compactionof the weak matrix of TPT occurs during pressurization to 70 MPa,while the stronger PR deforms primarily elastically.
The presence of mm-to-cm lava clasts in PR samples, and the rapiddegradation of TPTsampleswith increasing pressure,meant that itwaschallenging to achieve the steady-state fluid flow conditions necessaryfor accurate permeabilitymeasurements (Fig. 7). Nevertheless, steady-state conditions were achieved for a number of samples, and thechanges in permeability with increasing effective pressure are shownin Fig. 8. Unsurprisingly, we found a significant difference in thepermeability values for PR and TPT samples. Initial values for PR at aneffective pressure of 5 MPa were of the order of ~10−18 m2, and thesevalues decreased by one order of magnitude as effective pressure wasincreased to 70 MPa. By contrast, initial values for TPT were threeorders of magnitude higher (~10−15 m2), and these values decreasedby two orders of magnitude as effective pressure was increased to70 MPa. These measurements provide independent evidence that therelatively poorly consolidated TPT microstructure is much morepermeable than the more lithified PR. It further suggests that thetwo different mechanisms of emplacement exert a profound influenceon the corresponding transport properties.
4.3. Microstructural observations
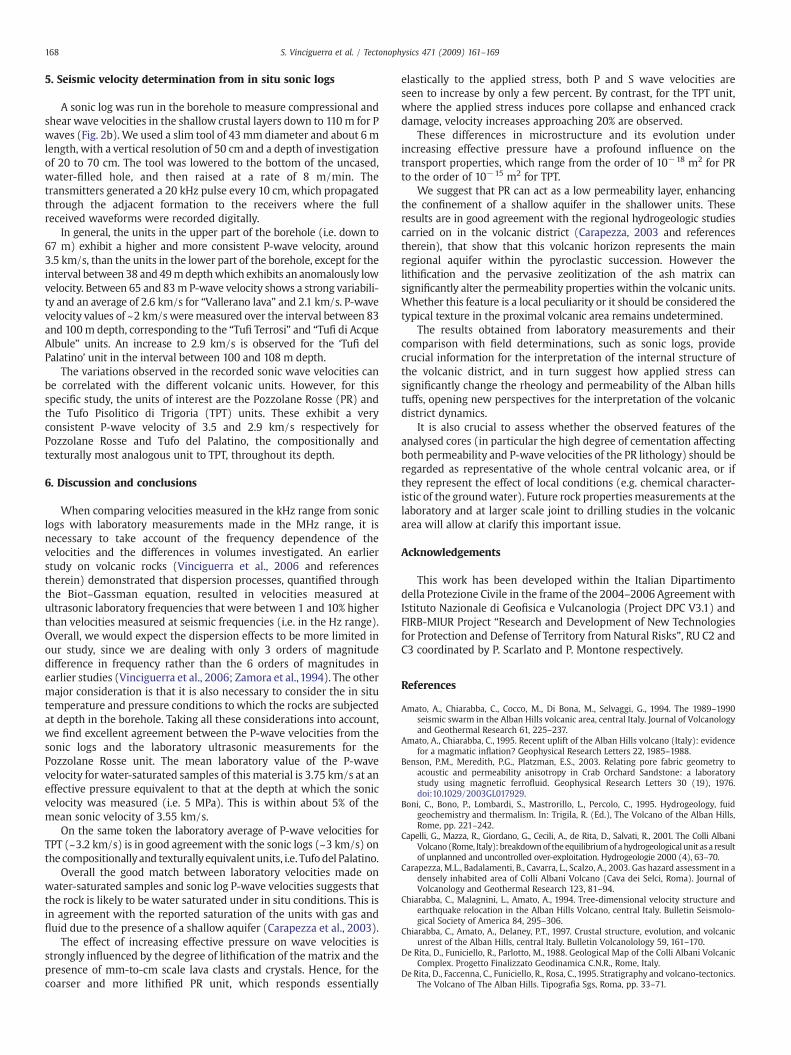
FESEM images of both PR and TPT taken before and afterpressurization to 70 MPa are shown in Fig. 8. The image of the un-pressurized PR (Fig. 8a) shows thepresence ofmm-to-cm lava clasts and
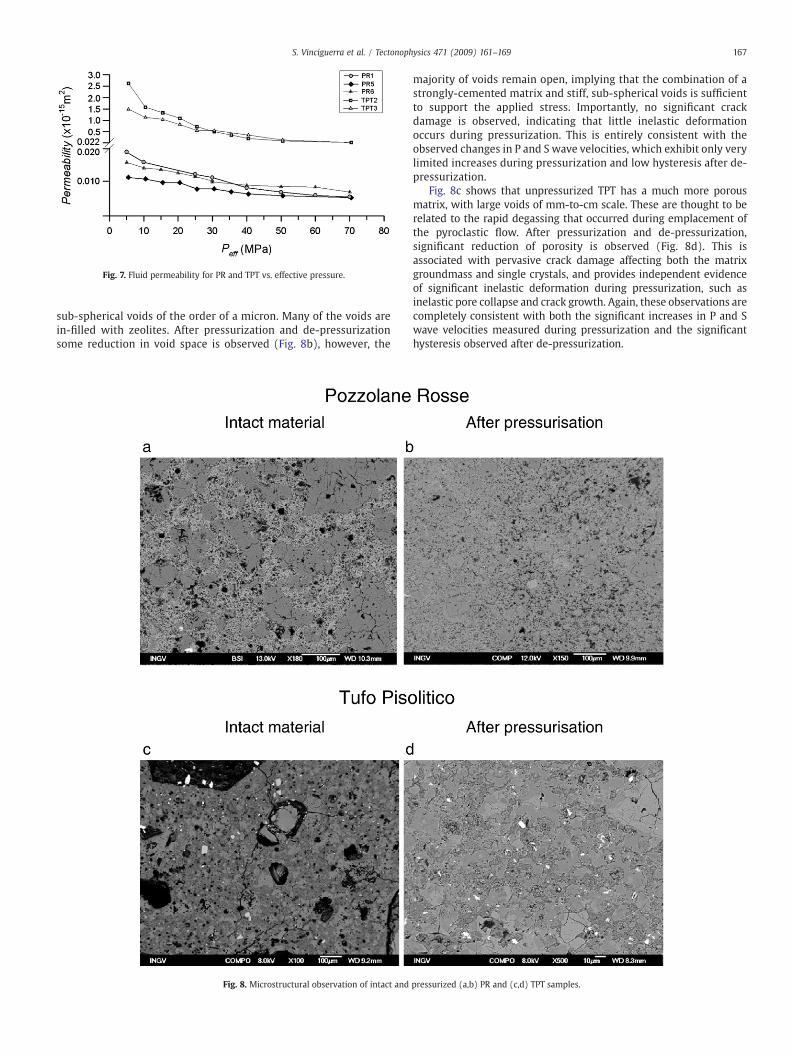
Fig. 7. Fluid permeability for PR and TPT vs. effective pressure.
167S. Vinciguerra et al. / Tectonophysics 471 (2009) 161–169
sub-spherical voids of the order of a micron. Many of the voids arein-filled with zeolites. After pressurization and de-pressurizationsome reduction in void space is observed (Fig. 8b), however, the
Fig. 8. Microstructural observation of intact and
majority of voids remain open, implying that the combination of astrongly-cemented matrix and stiff, sub-spherical voids is sufficientto support the applied stress. Importantly, no significant crackdamage is observed, indicating that little inelastic deformationoccurs during pressurization. This is entirely consistent with theobserved changes in P and S wave velocities, which exhibit only verylimited increases during pressurization and low hysteresis after de-pressurization.
Fig. 8c shows that unpressurized TPT has a much more porousmatrix, with large voids of mm-to-cm scale. These are thought to berelated to the rapid degassing that occurred during emplacement ofthe pyroclastic flow. After pressurization and de-pressurization,significant reduction of porosity is observed (Fig. 8d). This isassociated with pervasive crack damage affecting both the matrixgroundmass and single crystals, and provides independent evidenceof significant inelastic deformation during pressurization, such asinelastic pore collapse and crack growth. Again, these observations arecompletely consistent with both the significant increases in P and Swave velocities measured during pressurization and the significanthysteresis observed after de-pressurization.
pressurized (a,b) PR and (c,d) TPT samples.
168 S. Vinciguerra et al. / Tectonophysics 471 (2009) 161–169
5. Seismic velocity determination from in situ sonic logs
A sonic log was run in the borehole to measure compressional andshear wave velocities in the shallow crustal layers down to 110 m for Pwaves (Fig. 2b). We used a slim tool of 43mm diameter and about 6 mlength, with a vertical resolution of 50 cm and a depth of investigationof 20 to 70 cm. The tool was lowered to the bottom of the uncased,water-filled hole, and then raised at a rate of 8 m/min. Thetransmitters generated a 20 kHz pulse every 10 cm, which propagatedthrough the adjacent formation to the receivers where the fullreceived waveforms were recorded digitally.
In general, the units in the upper part of the borehole (i.e. down to67 m) exhibit a higher and more consistent P-wave velocity, around3.5 km/s, than the units in the lower part of the borehole, except for theinterval between 38 and 49mdepthwhich exhibits an anomalously lowvelocity. Between 65 and 83m P-wave velocity shows a strong variabili-ty and an average of 2.6 km/s for “Vallerano lava” and 2.1 km/s. P-wavevelocity values of ~2 km/s weremeasured over the interval between 83and 100m depth, corresponding to the “Tufi Terrosi” and “Tufi di AcqueAlbule” units. An increase to 2.9 km/s is observed for the ‘Tufi delPalatino’ unit in the interval between 100 and 108 m depth.
The variations observed in the recorded sonic wave velocities canbe correlated with the different volcanic units. However, for thisspecific study, the units of interest are the Pozzolane Rosse (PR) andthe Tufo Pisolitico di Trigoria (TPT) units. These exhibit a veryconsistent P-wave velocity of 3.5 and 2.9 km/s respectively forPozzolane Rosse and Tufo del Palatino, the compositionally andtexturally most analogous unit to TPT, throughout its depth.
6. Discussion and conclusions
When comparing velocities measured in the kHz range from soniclogs with laboratory measurements made in the MHz range, it isnecessary to take account of the frequency dependence of thevelocities and the differences in volumes investigated. An earlierstudy on volcanic rocks (Vinciguerra et al., 2006 and referencestherein) demonstrated that dispersion processes, quantified throughthe Biot–Gassman equation, resulted in velocities measured atultrasonic laboratory frequencies that were between 1 and 10% higherthan velocities measured at seismic frequencies (i.e. in the Hz range).Overall, we would expect the dispersion effects to be more limited inour study, since we are dealing with only 3 orders of magnitudedifference in frequency rather than the 6 orders of magnitudes inearlier studies (Vinciguerra et al., 2006; Zamora et al., 1994). The othermajor consideration is that it is also necessary to consider the in situtemperature and pressure conditions to which the rocks are subjectedat depth in the borehole. Taking all these considerations into account,we find excellent agreement between the P-wave velocities from thesonic logs and the laboratory ultrasonic measurements for thePozzolane Rosse unit. The mean laboratory value of the P-wavevelocity for water-saturated samples of this material is 3.75 km/s at aneffective pressure equivalent to that at the depth at which the sonicvelocity was measured (i.e. 5 MPa). This is within about 5% of themean sonic velocity of 3.55 km/s.
On the same token the laboratory average of P-wave velocities forTPT (~3.2 km/s) is in good agreementwith the sonic logs (~3 km/s) onthe compositionallyand texturally equivalentunits, i.e. Tufodel Palatino.
Overall the good match between laboratory velocities made onwater-saturated samples and sonic log P-wave velocities suggests thatthe rock is likely to be water saturated under in situ conditions. This isin agreement with the reported saturation of the units with gas andfluid due to the presence of a shallow aquifer (Carapezza et al., 2003).
The effect of increasing effective pressure on wave velocities isstrongly influenced by the degree of lithification of the matrix and thepresence of mm-to-cm scale lava clasts and crystals. Hence, for thecoarser and more lithified PR unit, which responds essentially
elastically to the applied stress, both P and S wave velocities areseen to increase by only a few percent. By contrast, for the TPT unit,where the applied stress induces pore collapse and enhanced crackdamage, velocity increases approaching 20% are observed.
These differences in microstructure and its evolution underincreasing effective pressure have a profound influence on thetransport properties, which range from the order of 10−18 m2 for PRto the order of 10−15 m2 for TPT.
We suggest that PR can act as a low permeability layer, enhancingthe confinement of a shallow aquifer in the shallower units. Theseresults are in good agreement with the regional hydrogeologic studiescarried on in the volcanic district (Carapezza, 2003 and referencestherein), that show that this volcanic horizon represents the mainregional aquifer within the pyroclastic succession. However thelithification and the pervasive zeolitization of the ash matrix cansignificantly alter the permeability properties within the volcanic units.Whether this feature is a local peculiarity or it should be considered thetypical texture in the proximal volcanic area remains undetermined.
The results obtained from laboratory measurements and theircomparison with field determinations, such as sonic logs, providecrucial information for the interpretation of the internal structure ofthe volcanic district, and in turn suggest how applied stress cansignificantly change the rheology and permeability of the Alban hillstuffs, opening new perspectives for the interpretation of the volcanicdistrict dynamics.
It is also crucial to assess whether the observed features of theanalysed cores (in particular the high degree of cementation affectingboth permeability and P-wave velocities of the PR lithology) should beregarded as representative of the whole central volcanic area, or ifthey represent the effect of local conditions (e.g. chemical character-istic of the groundwater). Future rock propertiesmeasurements at thelaboratory and at larger scale joint to drilling studies in the volcanicarea will allow at clarify this important issue.
Acknowledgements
This work has been developed within the Italian Dipartimentodella Protezione Civile in the frame of the 2004–2006 Agreement withIstituto Nazionale di Geofisica e Vulcanologia (Project DPC V3.1) andFIRB-MIUR Project “Research and Development of New Technologiesfor Protection and Defense of Territory from Natural Risks”, RU C2 andC3 coordinated by P. Scarlato and P. Montone respectively.
References
Amato, A., Chiarabba, C., Cocco, M., Di Bona, M., Selvaggi, G., 1994. The 1989–1990seismic swarm in the Alban Hills volcanic area, central Italy. Journal of Volcanologyand Geothermal Research 61, 225–237.
Amato, A., Chiarabba, C., 1995. Recent uplift of the Alban Hills volcano (Italy): evidencefor a magmatic inflation? Geophysical Research Letters 22, 1985–1988.
Benson, P.M., Meredith, P.G., Platzman, E.S., 2003. Relating pore fabric geometry toacoustic and permeability anisotropy in Crab Orchard Sandstone: a laboratorystudy using magnetic ferrofluid. Geophysical Research Letters 30 (19), 1976.doi:10.1029/2003GL017929.
Boni, C., Bono, P., Lombardi, S., Mastrorillo, L., Percolo, C., 1995. Hydrogeology, fuidgeochemistry and thermalism. In: Trigila, R. (Ed.), The Volcano of the Alban Hills,Rome, pp. 221–242.
Capelli, G., Mazza, R., Giordano, G., Cecili, A., de Rita, D., Salvati, R., 2001. The Colli AlbaniVolcano(Rome, Italy): breakdownof theequilibriumof ahydrogeologicalunit asa resultof unplanned and uncontrolled over-exploitation. Hydrogeologie 2000 (4), 63–70.
Carapezza, M.L., Badalamenti, B., Cavarra, L., Scalzo, A., 2003. Gas hazard assessment in adensely inhabited area of Colli Albani Volcano (Cava dei Selci, Roma). Journal ofVolcanology and Geothermal Research 123, 81–94.
Chiarabba, C., Malagnini, L., Amato, A., 1994. Tree-dimensional velocity structure andearthquake relocation in the Alban Hills Volcano, central Italy. Bulletin Seismolo-gical Society of America 84, 295–306.
Chiarabba, C., Amato, A., Delaney, P.T., 1997. Crustal structure, evolution, and volcanicunrest of the Alban Hills, central Italy. Bulletin Volcanolology 59, 161–170.
De Rita, D., Funiciello, R., Parlotto, M., 1988. Geological Map of the Colli Albani VolcanicComplex. Progetto Finalizzato Geodinamica C.N.R., Rome, Italy.
De Rita, D., Faccenna, C., Funiciello, R., Rosa, C., 1995. Stratigraphy and volcano-tectonics.The Volcano of The Alban Hills. Tipografia Sgs, Roma, pp. 33–71.
169S. Vinciguerra et al. / Tectonophysics 471 (2009) 161–169
Di Filippo, M., Toro, B., 1995. Gravity features. Stratigraphy and volcano-tectonics. In:Trigila, R. (Ed.), The Volcano of the Alban Hills, Rome, pp. 213–219.
Faccenna, C., Funiciello, R., Mattei, M., 1994. Late Pleistocene N–S shear zones along theLatium Tyrrhenian margin: structural characters and volcanological implications.Bollettino di Geofisica Teorica Applicata 36, 507–522.
Feuillet, N., Nostro, C., Chiarabba, C., Cocco, M., 2004. Coupling between earthquakeswarms and volcanic unrest at the Alban Hills volcano (Italy) through elastic stresstransfer. Journal of Geophysical Research 109 (B02308). doi:10.1029/2003JB002419.
Freda, C., Gaeta, M., Karner, D.B., Marra, F., Renne, P.R., Taddeucci, J., Scarlato, P.,Christensen, J.N., Dallai, L., 2006. Eruptive history and petrologic evolution of theAlbano multiple maar (Alban Hills, Central Italy). Bulletin of Volcanology 68,567–591.
Giaccio, B., Sposato, A., Gaeta, M., Marra, F., Palladino, D.M., Taddeucci, J., Barbieri, M.,Messina, P., Rolfo, M.F., 2007. Mid-distal occurrences of the Albano Maar pyroclasticdeposits and their relevance for reassessing the eruptive scenarios of the mostrecent activity at the Colli Albani Volcanic District, Central Italy. QuaternaryInternational 171/172, 160–178. doi:10.1016/j.quaint.2006.10.013.
Giordano, G., De Benedetti, A.A., Diana, A., Diano, G., Gaudioso, F., Marasco, F., Miceli, M.,Mollo, S., Cas, R.A.F., Funiciello, R., 2006. The Colli Albani mafic caldera (Roma,Italy): stratigraphy, structure and petrology. Journal of Volcanology and Geother-mal Research. doi:10.1016/j.jvolgeores.2006.02.009.
Karner, D.B., Marra, F., Renne, P.R., 2001. The history of the Monti Sabatini and AlbanHills volcanoes: groundwork for assessing volcanic-tectonic hazards for Rome.Journal of Volcanology and Geothermal Research 107, 185–219.
Mariucci, M.T., Pierdominici, S., Pizzino, L., Marra, F. and Montone, P., in press. Looking into avolcanic area: an overview on the 350 m scientific drilling at Colli Albani (Rome, Italy),Journal of Volcanology and Geothermal Research. doi:10.1016/j.jvolgeores.2008.04.007.
Marra, F., 1999. Low-magnitude earthquakes in Rome: structural interpretation andimplications for local stress-field. Geophysical Journal International 138, 231–243.
Marra, F., 2001. Strike–slip faulting and block rotation: a possible triggering mechanismfor lava flows in the Alban Hills? Journal of Structural Geology 23 (1), 127–141.
Marra, F., Freda, C., Scarlato, P., Taddeucci, J., Karner, D.B., Renne, P.R., Gaeta, M.,Palladino, D.M., Trigila, R., Cavarretta, G., 2003. 40Ar/39Ar Geochronology of therecent phase of activity of the Alban Hills Volcanic District (Rome, Italy):implications for seismic and volcanic hazards. Bulletin of Volcanology 65, 227–247.
Marra, F., Montone, P., Pirro, M., Boschi, E., 2004. Evidence of active tectonics on aRoman Aqueduct System (II–III Century A.D.) near Rome, Italy. Journal of StructuralGeology 26, 679–690.
Marra, F., Karner, D.B., Freda, C., Gaeta, M., and Renne, P.R., in press. Large maficeruptions at Alban Hills Volcanic District (Central Italy): chronostratigraphy,petrography and eruptive behavior, Journal of Volcanology and GeothermalResearch.
Montone, P., Amato, A., Chiarabba, C., Buonasorte, G., Fiordelisi, A., 1995. Evidence ofactive extension in Quaternary volcanoes of Central Italy from breakout analysisand seismicity. Geophysical Research Letters 22, 1909–1912.
Palladino, D.M., Gaeta, M., Marra, F., 2001. A large K-foiditic hydromagmatic eruptionfrom the early activity of the Alban Hills volcanic district, Italy. Bulletinvolcanologique 63, 345–359.
Pizzino, L., Galli, G., Mancini, C., Quattrocchi, F., Scarlato, P., 2002. Natural Gas Hazard(CO2 , 222Radon) within a quiescent volcanic region and its relations withseismotectonics: the case of the Ciampino–Marino area (Colli Albani volcano,Rome). Natural Hazards 27 (3), 257–287.
Salvi, S., Atzori, S., Tolomei, C., Allievi, J., Ferretti, A., Rocca, F., Prati, C., Stramondo, S.,Feuillet, N., 2004. Inflation rate of the Colli Albani volcanic complex retrieved by thepermanent scatterers SAR interferometry technique. Geophysical Research letters31 (L12606). doi:10.1029/2004GL020253.
Vinciguerra, S., Trovato, C., Meredith, P.G., Benson, P.M., Troise, C., De Natale, G., 2006.Understanding the seismic velocity structure of Campi Flegrei caldera (Italy): fromthe laboratory to the field scale. Pure Applied Geophysics 163, 2205–2221.
Washington, H.S., 1906. The Roman Comagmatic Region. Publ no. 57. Carnegie Institute.Zamora, M., Sartoris, G., Chelini, W., 1994. Laboratory measurements of ultrasonic wave
velocities in rocks from the Campi Flegrei volcanic system and their relation toother field data. Journal of Geophysical Research 99 (B7), 13553–13562.