Cyclic sedimentation of the Barren Measures Formation (Damuda Group), Talchir Gondwana basin:...
11
0016-7622/2010-75-3-549/$ 1.00 © GEOL. SOC. INDIA JOURNAL GEOLOGICAL SOCIETY OF INDIA Vol.75, March 2010, pp.549-559 Cyclic Sedimentation of the Barren Measures Formation (Damuda Group), Talchir Gondwana Basin: Statistical Appraisal from Borehole Logs RABINDRA NATH HOTA and BIJAY KUMAR DAS P.G. Department of Geology, Utkal University, Bhubaneswar - 751 004 Email: [email protected]; [email protected] Abstract: The succession of lithofacies of a part of the Barren Measures Formation of the Talchir Gondwana basin has been studied by statistical techniques. The lithologies have been grouped under five facies states viz coarse-, medium-, and fine-grained sandstones, shale and coal for statistical analyses. Markov chain analysis indicates the arrangement of Barren Measures lithofacies in the form of fining upward cycles. A complete cycle consists of conglomerate or coarse- grained sandstone at the base sequentially succeeded by medium-and fine-grained sandstones, shales and coal at the top. The entropy analysis puts the Barren Measures cycles into A-4 type cyclicity, which consists of different proportions of lower, upper and side truncated cycles of lithologic states. Regression analysis indicates a sympathetic relationship between total thickness of strata (net subsidence) and number of cycles and an antipathic relationship between average thickness and number of sedimentary cycles. The cyclic sedimentation of the Barren Measures Formation was controlled by autocyclic process which occurred due to the lateral migration of streams triggered by intrabasinal differential subsidence. In many instances, the clastic sediments from the laterally migrating rivers interrupted the cyclic sedimentation resulting in thinner cycles in areas where the number of cycles are more. Principal component and multivariate regression analyses suggest that the net subsidence of the basin is mostly controlled by the thickness of sandstones, shale beds and coal stringers. Keywords: Cyclic sedimentation, Markov chain analysis, Entropy analysis, Regression analysis, Principal component analysis, Barren Measures Formation, Talchir Gondwana basin. cyclicity of the Barren Measures Formation with eight borehole sections and revealed only the cyclic arrangement of Barren Measures strata. They did not study the relationship between net subsidence and parameters of sedimentary cycles, most of which do not contain coal. In the present study a segment of the Barren Measures Formation of the Damuda Group located in the south- eastern part of the Talchir Gondwana basin (Fig.2) has been selected. The aims of the present study are: (a) to study the cyclic arrangement of various lithofacies by Markov chain analysis; (b) to evaluate the degree of ordering of lithofacies using entropy functions; (c) to establish the relationship between net subsidence (total thickness of strata) and number and average thickness of sedimentary cycles using bivariate regression analysis; (d) to establish the relationship between net subsidence of the depositional basin and different parameters like INTRODUCTION Out of eight Gondwana basins in Orissa, the Talchir Basin (Figs.1 and 2) is the main coal bearing sedimentary succession in the state. Due to its vast coal resources, it has been extensively explored generating voluminous data on the subsurface geology. Examination of borehole logs indicates the repetition of different lithologies. Statistical methods like Markov chain and entropy analyses reveal the cyclic arrangement of lithofacies and their degree of ordering (Billingsley, 1961; Harbough and Bonham Carter, 1970; Hattori, 1976). These methods have been extensively used for analysis of coal measure cyclothems as well as alluvial, deltaic and marine successions of various periods throughout the world (Miall, 1973; Casshyap, 1975; Kumar, 1990; Shukla et al. 1996; Hota et al. 2003). Quantitative relationship between net subsidence and sedimentary cycles may reveal the cause of cyclic sedimentation (Duff, 1967; Johnson and Cook, 1973; Casshyap, 1975; Read and Dean, 1976). Earlier, Hota and Maejima (2004) studied the
-
Upload
independent -
Category
Documents
-
view
1 -
download
0
Transcript of Cyclic sedimentation of the Barren Measures Formation (Damuda Group), Talchir Gondwana basin:...

0016-7622/2010-75-3-549/$ 1.00 © GEOL. SOC. INDIA
JOURNAL GEOLOGICAL SOCIETY OF INDIAVol.75, March 2010, pp.549-559
Cyclic Sedimentation of the Barren Measures Formation(Damuda Group), Talchir Gondwana Basin: Statistical
Appraisal from Borehole Logs
RABINDRA NATH HOTA and BIJAY KUMAR DAS
P.G. Department of Geology, Utkal University, Bhubaneswar - 751 004Email: [email protected]; [email protected]
Abstract: The succession of lithofacies of a part of the Barren Measures Formation of the Talchir Gondwana basin hasbeen studied by statistical techniques. The lithologies have been grouped under five facies states viz coarse-, medium-,and fine-grained sandstones, shale and coal for statistical analyses. Markov chain analysis indicates the arrangement ofBarren Measures lithofacies in the form of fining upward cycles. A complete cycle consists of conglomerate or coarse-grained sandstone at the base sequentially succeeded by medium-and fine-grained sandstones, shales and coal at the top.The entropy analysis puts the Barren Measures cycles into A-4 type cyclicity, which consists of different proportions oflower, upper and side truncated cycles of lithologic states. Regression analysis indicates a sympathetic relationshipbetween total thickness of strata (net subsidence) and number of cycles and an antipathic relationship between averagethickness and number of sedimentary cycles. The cyclic sedimentation of the Barren Measures Formation was controlledby autocyclic process which occurred due to the lateral migration of streams triggered by intrabasinal differentialsubsidence. In many instances, the clastic sediments from the laterally migrating rivers interrupted the cyclic sedimentationresulting in thinner cycles in areas where the number of cycles are more. Principal component and multivariate regressionanalyses suggest that the net subsidence of the basin is mostly controlled by the thickness of sandstones, shale beds andcoal stringers.
Keywords: Cyclic sedimentation, Markov chain analysis, Entropy analysis, Regression analysis, Principal componentanalysis, Barren Measures Formation, Talchir Gondwana basin.
cyclicity of the Barren Measures Formation with eightborehole sections and revealed only the cyclic arrangementof Barren Measures strata. They did not study therelationship between net subsidence and parameters ofsedimentary cycles, most of which do not contain coal. Inthe present study a segment of the Barren MeasuresFormation of the Damuda Group located in the south-eastern part of the Talchir Gondwana basin (Fig.2) has beenselected. The aims of the present study are:(a) to study the cyclic arrangement of various lithofacies
by Markov chain analysis;(b) to evaluate the degree of ordering of lithofacies using
entropy functions;(c) to establish the relationship between net subsidence
(total thickness of strata) and number and averagethickness of sedimentary cycles using bivariateregression analysis;
(d) to establish the relationship between net subsidence ofthe depositional basin and different parameters like
INTRODUCTION
Out of eight Gondwana basins in Orissa, the TalchirBasin (Figs.1 and 2) is the main coal bearing sedimentarysuccession in the state. Due to its vast coal resources, it hasbeen extensively explored generating voluminous data onthe subsurface geology. Examination of borehole logsindicates the repetition of different lithologies. Statisticalmethods like Markov chain and entropy analyses revealthe cyclic arrangement of lithofacies and their degree ofordering (Billingsley, 1961; Harbough and Bonham Carter,1970; Hattori, 1976). These methods have been extensivelyused for analysis of coal measure cyclothems as well asalluvial, deltaic and marine successions of various periodsthroughout the world (Miall, 1973; Casshyap, 1975; Kumar,1990; Shukla et al. 1996; Hota et al. 2003). Quantitativerelationship between net subsidence and sedimentary cyclesmay reveal the cause of cyclic sedimentation (Duff, 1967;Johnson and Cook, 1973; Casshyap, 1975; Read andDean, 1976). Earlier, Hota and Maejima (2004) studied the

JOUR.GEOL.SOC.INDIA, VOL.75, MARCH 2010
550 RABINDRA NATH HOTA AND BIJAY KUMAR DAS
Fig.1. Gondwana basins of Orissa (modified after Pandya, 2006).
number and thickness of sandstone, shale and coal,which constitute the Barren Measures Formation byprincipal component and multiple regression analysismethods.
(e) to analyse the cause of cyclicity vis-à-vis BarrenMeasures sedimentation during Middle Permian.
GEOLOGICAL SETTING
The study area is located in the southeastern part of theTalchir Gondwana basin (Fig. 2). The Gondwana sedimentsof the study area (Fig. 3) represent a part of Barakar andBarren Measures Formations. The Barakar Formationcomprises cyclothemic succession of sandstonse, shales andcoal seams. The Barren Measures Formation comprises
pebble beds, fine- to coarse-grained sandstones, shales andcoal stringers. The sandstones and the shales are oftenferruginous and workable coal seams are absent. TheBarren Measures rocks are disposed in a homoclinal trendstriking east-west and dipping towards north at lowangles ranging from 4 to 8 degrees (Fig. 3). The averagethickness of Barren Measures strata is about 150 m andare composed of thin conglomerates and sandstones ofdifferent textures (80.87%), grey and ferruginous shales(18.68%) with subordinate carbonaceous shale and coalstringers (0.45%). Predominance of coarse clastics andabundance of tabular and trough cross beddings suggest apossible braided stream origin of the Barren MeasuresFormation (Pettijohn, 1984; Tewari, 1995; Prothero andSchwab, 1996 and Nichols, 1999). This is supported by the

JOUR.GEOL.SOC.INDIA, VOL.75, MARCH 2010
CYCLIC SEDIMENTATION OF THE BARREN MEASURES FORMATION, TALCHIR GONDWANA BASIN 551
presence of cut and fill structures, channeling and lenticularbeds.
METHODS OF STUDY
Fieldwork was carried out to study the Barren Measuresrocks exposed in the sections of the easterly and north-easterly flowing streams. Due to erratic nature anddiscontinuous exposures, vertical relationship betweendifferent lithofacies could not be ascertained from surficialstudies. Twenty three borehole sections (Fig.3) drilled andlogged by Central Mining Planning and Design Institute andDirectorate of Geology, Govt. of Orissa are used in thepresent study.
There is disagreement among different workers regardingthe scale and boundary of a sedimentary cycle. While Udden(1912) advocated a cycle to commence from the base ofcoal seam, Weller (1930) opined that each cycle starts withsandstone at the base. Read and Dean (1967 and 1976)suggested the minimum thickness of a cycle to be 0.3 m andCasshyap (1975) put it to be 1 m. In the present study, thesequence of strata of more than 1 m thickness with basalcoarse member (conglomerate or sandstone) and terminatingwith shale bed or coal seam has been considered to constitutea cycle. This is in conformity with the definition of finingupward cycle of Allen (1965a) for the alluvial sedimentsand coal cycle of Casshyap (1970). Both types correspondto complete cycles of stream system in fluvial environment
Fig.2. Geological sketch map of the Talchir Gondwana basin showing the study area (modified after Raja Rao, 1982).
Fig.3. Geological map of the study area with location of boreholes.

JOUR.GEOL.SOC.INDIA, VOL.75, MARCH 2010
552 RABINDRA NATH HOTA AND BIJAY KUMAR DAS
in accordance with the concept of Strahler (1963) that thecoal-forming environment is apparently not a normal featureof the alluvial flood plain.
To make the data analysis simple and to avoid the riskof error the lithologies observed in the surface exposureswere condensed into five facies states on the basis oflithology and texture as observed in the borehole records(Miall, 1973 and Casshyap, 1975). These are:Facies-A: Coarse-grained sandstones that include massive
conglomerates, pebbly sandstones, flat-beddedpebbly and coarse-grained sandstones, trough-and tabular cross-bedded coarse-grainedsandstones.
Facies-B: Medium-grained sandstones that include trough-and tabular cross-bedded coarse to medium- andmedium-grained sandstones.
Facies-C: Fine-grained sandstones that include parallel andripple-drift cross-laminated medium to fine- andfine-grained sandstones.
Facies-D: Shales that include interbedded sandstone-shalesand grey and ferruginous shales.
Facies-E: Coal that includes carbonaceous shale, shaly-coal and coal, which commonly constitute a coalseam in Talchir coalfield.
Concept of five lithofacies seems reasonable as A and Brepresent mid- and distal-channel bar deposits respectively;C is characteristic of bar-top and abandoned-channeldeposits; D represents proximal flood plain, abandonedchannel fill and over bank deposit and E is the deposit inthe peat swamps (Allen, 1965b; Casshyap, 1970; Miall,1977; Cant and Walker, 1978 and Sengupta, 2007).
The upward facies transition data of twenty threeboreholes (Fig. 3) were added to form a transition countmatrix (fij), which was processed into transition probability(pij) independent trial/random probability (rij) and difference(dij) matrices by the methods outlined by Miall (1973) andCasshyap (1975). The cyclicity (Markovian property) offacies states was tested by chi-square statistics proposed byBillingsley (1961) and Harbaugh and Bonham-Carter(1970). The degree and nature of ordering of facies stateswere investigated by the concept of entropy (Hattori, 1976).The entropies of each facies states after deposition E(post)
were computed from the Markov matrix (pij).The entropiesof each facies states before deposition E(pre) were computedfrom the probability matrix (Q) obtained from the frequencymatrix (fij) by dividing each transition frequency by thecorresponding column total. Since the entropy values aredependent on the number of states under consideration, theywere normalised before plotting in the graph. Entropy ofthe sedimentation process was computed to know the
depositional environment of the Barren MeasuresFormation.
Relationship between total thickness of strata (netsubsidence), number and thickness of sedimentary cycleswere studied by regression analysis. Since the dip of theBarren Measures Formation is very low, there is notperceptible difference between the strata cut by bore andtheir true thickness. The data of 23 boreholes shown in Fig.3 were used in the present case. The length of each boreholesection was taken into consideration for the calculation oftotal thickness of strata and number of cycles. Total thicknessof strata (x in m), number of cycles (y) and average thicknessof cycle (z in m) were computed for all the twenty threesections. The methods of linear and curvilinear regressionanalysis outlined by Davis (2002) were used in the presentcase. First- and second-degree polynomial regression lineswere fitted to the data sets by least-square criteria.Percentages of goodness of fit of each regression line and95% confidence (fiducial) limits were calculated. Analysisof variance was performed using the F-test to verify thesignificance of each regression line and whether eachsecond-degree polynomial line is making a significantadditional contribution to the regression variance alreadyexplained by the first degree line or not. Correlationcoefficients between pairs of variables were computed.Their significance was tested by the Student’s t-test. Theprincipal component and multiple regression analyseshave been done by SPSS and Statistica software.
RESULTS AND DISCUSSION
Markov Chain Analysis
The transition count (fij), transition probability (pij),random probability (rij) and difference (dij) matrices of theBarren Measures Formation facies states are summarisedin Table 1. The computed values of chi-square exceed thelimiting value at the 0.1% significance level suggesting thepresence of Markovity and cyclic arrangement of faciesstates. The facies relationship diagram (Fig. 4) is constructedfrom the difference matrix results. It suggests that the BarrenMeasures cycles are fining-upward asymmetric type. Eachcomplete cycle starts with a conglomerate or pebbly tocoarse-grained sandstone (facies A) at the base and issucceeded by medium- to fine-grained sandstone (facies Band C), interbedded sandstone-shale and grey and/orferruginous shales (facies D) and in some cases terminateswith a carbonaceous shale or coal stringers (facies E) at thetop. Predominance of truncated fining upward cycles withabrupt changes in lithology at the top suggests depositionof Barren Measures sediments by rapidly shifting braided

JOUR.GEOL.SOC.INDIA, VOL.75, MARCH 2010
CYCLIC SEDIMENTATION OF THE BARREN MEASURES FORMATION, TALCHIR GONDWANA BASIN 553
streams. Had the deposition been in meandering streamdepositional environment, then the cycles would have beengradually fining upward as in case of Barakar Formation(Prothero and Schwab, 1996; Hota and Maejima, 2004).
The excess of probability of transition of A to B and Bto A over random transition are 0.31 and 0.05 respectively,which indicate frequent braiding of the stream channels thatlead to the superposition and interfingering of proximalchannel facies by distal channel facies and vice versa as
visualized by Das and Pandya (1995). The excess ofprobability of bar-top and abandoned-channel deposits(facies C) overlying facies A and B are 0.07 and 0.22respectively, which suggest that the channels were morefrequently abandoned, a feature generally common inbraided streams than sidewise migration of meanderingstream and deposition of fine-grained sandstones. Thisindicates dominance of braided stream regime during BarrenMeasures sedimentation. The fine-grained sandstones (faciesC) are succeeded by interbedded sandstone-shale and/or greyand/or ferruginous shales (facies D) with differenceprobability of 0.13. In many instances, the cycles terminatewith facies D at the top. In a few cases, thin carbonaceousshale or coal stringer (facies E) are present at the top of thecycles. In the later case, the facies E is overlain by facies Dwith a relatively larger value of difference probability (0.45),which is succeeded by facies C by difference probability of0.10. These features suggest that many of the abandonedchannels received fine clastics during the periods of greaterdischarge while a few of them were converted to short livedpeat swamps for temporary period. The peat swamps werequickly covered by sidewise migrating over bank (D) andbar top (C) facies.
Entropy Analysis
E(pre) > E(post) relationship (Table 2) in case of sandstone
Table 1. Markov matrices and χ2 test statistics of facies states of the Barren Measures Formation
Transition count matrix (fij) Transition probability matrix (pij)
A B C D E A B C D E
A 0 15 17 4 0 A 0.00 0.42 0.47 0.11 0.00B 7 0 37 15 0 B 0.12 0.00 0.63 0.25 0.00C 15 32 0 161 5 C 0.07 0.15 0.00 0.76 0.02D 14 16 163 0 34 D 0.06 0.07 0.72 0.00 0.15E 0 0 5 33 0 E 0.00 0.00 0.13 0.87 0.00
Random probability matrix (rij) Dif ference matrix (dij)
A B C D E A B C D E
A 0.00 0.11 0.40 0.42 0.07 A 0.00 0.31 0.07 -0.31 -0.07B 0.07 0.00 0.41 0.44 0.07 B 0.05 0.00 0.22 -0.19 -0.07C 0.10 0.16 0.00 0.63 0.11 C -0.03 -0.01 0.00 0.13 -0.09D 0.10 0.17 0.62 0.00 0.11 D -0.04 -0.10 0.10 0.00 0.04E 0.07 0.11 0.40 0.42 0.00 E -0.07 -0.11 -0.27 0.45 0.00
Test of significance
Test equation Computed Degrees of Limiting value of χ2 atvalue of χ2 freedom 0.1% significance level
Billingslay (1961) 136.54 15 37.70Harbaugh and Bonham-Carter (1970) 376.78 11 31.26
Legend: A: Coarse-grained sandstone, B: Medium-grained sandstone, C: Fine-grained sandstone,D: Shale, E: Coal. For each transition pair, the row letter represents the lower facies and the columnletter, the upper facies.
Fig.4. Facies relationship diagram of the Barren MeasuresFormation of the study area.

JOUR.GEOL.SOC.INDIA, VOL.75, MARCH 2010
554 RABINDRA NATH HOTA AND BIJAY KUMAR DAS
facies indicates that these facies exert strong influence ontheir successors but are relatively uninfluenced by theirprecursors. Coarse-grained sandstone (facies A), medium-grained sandstone (facies B) and fine-grained sandstone(facies C) are succeeded by medium-grained sandstone(facies B), fine-grained sandstone (facies C) and shale(facies D) with dij values of 0.31, 0.22 and 0.13 respectively.E(pre) < E(post) relationship in case of shale (facies D) suggeststhat this facies does not show strong memory for succeedinglithological state but is dependent on the preceding state inthe succession. In the present study, the differenceprobabilities of facies D underlain by fine-grained sandstoneand overlain by coal are 0.13 and 0.04 respectively (Fig. 4).The E(pre) = E(post) relationship in case of coal suggests thatthis facies is equally influenced by its successor andprecursor. The probability of coal underlain and overlainby shale is 0.87 (pij and qij). The Barren Measures cyclesare asymmetric and truncated. The entropy sets for faciesstates (Fig. 5) belong to the A-4 of Hattori, 1976, whichconsists of different proportions of lower, upper and side
truncated cycles of lithologic states. The facies relationshipdiagram (Fig.4) suggests that very often the Barren Measurescycles terminate with a shale facies at the top and thus areupper truncated. Some of the cycles which develop inabandoned channel areas start with fine-grained sandstoneand are C – D – E type i.e. bottom truncated. Though thefacies A, B, C and D are overlain by these facies in differentfrequencies (Table 1), they are not represented in the faciesrelationship diagram (Fig. 4) excluding A – C transition,which occur in very low frequency.
The entropy of the Barren Measures sedimentationsystem as shown in Fig.6 plots below the coal measureand alluvial-fluvial successions fields in the succession
Table.2. Entropy values of facies states of the Barren Measures Formation
Facies E(Pre) E(Post) R(Pre) R(Post) Relationship
Coarse-grained sandstone (A) 1.51 1.38 0.76 0.69 E(Pre) > E(Post)
Medium-grained sandstone (B)1.49 1.29 0.74 0.64 E(Pre) > E(Post)
Fine-grained sandstone (C) 1.17 1.09 0.59 0.55 E(Pre) > E(Post)
Shale (D) 1.09 1.26 0.55 0.63 E(Pre) < E(Post)
Coal (E) 0.56 0.56 0.28 0.28 E(Pre) = E(Post)
E(Max) = 2.00 E(System) = 3.08
E(Pre): Entropy before deposition R(Pre): Normalised entropy before depositionE(Post): Entropy after deposition R(Post) :Normalised entropy after depositionE(Max): Maximum possible entropy for every state in the systemE(System) : Entropy of the sedimentation process for the Barren Measures Formation
Fig.5. Entropy sets for facies states of the Barren MeasuresFormation. A: Coarse-grained sandstone, B: Medium-grained sandstone, C: Fine-grained sandstone, D: Shale,E: Coal.
Fig.6. Relationship between entropy and depositional environmentof lithological sequences (after Hattori, 1976). 1-Maximumentropy, 2-Entropies for the coal-measure successions,3-Entropies for fluvial-alluvial successions, 4-Entropies forneritic successions, 5-Entropies for flysch sediments,6-Minimun entropy, *: Entropy for the Barren MeasuresFormation.

JOUR.GEOL.SOC.INDIA, VOL.75, MARCH 2010
CYCLIC SEDIMENTATION OF THE BARREN MEASURES FORMATION, TALCHIR GONDWANA BASIN 555
discrimination diagram of Hattori (1976, Fig.16). This isdue to lower degree of randomness of the Barren Measuressedimentation system as indicated by lower value of E(System)
(3.08) (Table 2) in comparison to the Barakar sedimentationsystem (3.799 in Hota et al. 2003) and Barren MeasuresFormation (3.567 in Hota and Maejima, 2004). This maybe due to congregation of both coal and non-coal cycles inthe present study.
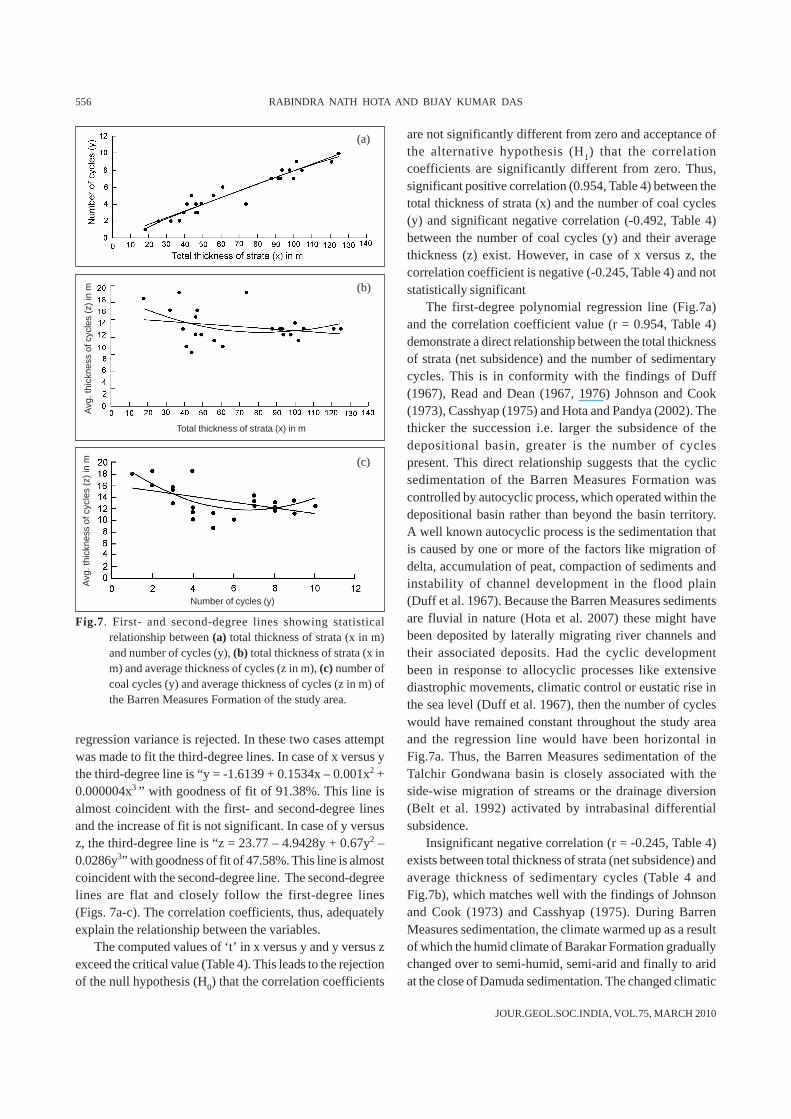
Regression Analysis
The equations of first- and second-degree polynomialregression lines along with the 95% confidence (fiducial)limits and F-test results are given in Table 3 and thecorresponding lines are plotted in Figs.7a-c. The lines arecomparable with each other and with those given by Duff(1967), Read and Dean (1967, 1976), Johnson and Cook(1973), Casshyap (1975) and Hota and Pandya (2002). It isinteresting to note that the second-degree polynomialregression lines are divisible into two categories. In case ofx versus y, (Table 3a) the coefficient of the first-degree termis positive and that of second-degree term is negative. Thisline (Fig. 7a) shows upward convexity. In the remaining twocases (x versus z and y versus z, Table 3b and c) thecoefficient of the first-degree terms are negative and that ofthe second-degree terms are positive. Such curves (Figs.7band 7c) when superimposed on the first-degree lines,display upward concavity. It is to be noted that the second-degree line is a parabola with general regression equation
“y = a + bx + cx2 ” the second derivative (d2y/dx2) of whichis 2c. Depending on the positive or negative sign of c (thecoefficient of second-degree term), the curve shows upwardconcavity or convexity with base line (X-axis). Thecomputed values of ‘F’ in case of first- and second-degreelines (x versus y and y versus z) exceed the critical valueat the 5% significance level (Table 3). Thus, the nullhypothesis (H0) that the variance about the regression lineis not different from the variance in the observation isrejected and the alternate hypothesis (H1) that there issignificant difference of variance about the regression lineand the variance in the observation is accepted. These fourlines are statistically significant at the 5% significance level.The computed values of ‘F’ in case of first- and second-degree lines of x versus z are less than the critical value atthe 5% significance level (Table 3). Thus, the null hypothesis(H0) that the variance about the regression line is not differentfrom the variance in the observation is accepted.
The percentage of total sum of squares satisfied(percentage of goodness of fit) by first- and second-degreelines in case of x versus y are reasonably high, moderate incase of y versus z, and low in case of data sets x versus z(Table 4). The computed values of ‘F’ to test the significanceof increase of fit of second-degree line over the first-degreeline in former two cases are greater than the critical valuesat the 5% significance level (Table 4). In these two cases,the null hypothesis (H0) that the added term in the regressionequation does not make a significant contribution to the
Table 3. Equations of first- and second-degree polynomial regression lines and F-test results
First-degree polynomial F-test result Second-degree polynomial F-test result
(a) Total thickness of strata (x in m) versus number of cycles (y)y = - 0.0009 + 0.0784x (± 1.47) Y 214.10* y = - 0.5076+ 0.0954x – 0.0001x2 (±0.85) 321.36§
(b) Total thickness of strata (x in m) versus average thickness of cycles (z in m)z = 14.834 - 0.0213x (± 5.06) 1.31* z = 18.81 - 0.1548x + 0.0009x2 (± 4.83) 1.71§
(c) Number of cycles (y) versus average thickness of cycles (z in m)z = 16.087 - 0.5011y (± 4.29) 6.98* z = 20.862 – 2.6912y + 0.1987y2 (± 3.65) 8.38§
Y95% confidence (fiducial) limits are given in brackets; *F[(n1 = 1, n2 = 21), a = 0.05] = 4.32; §F[(n1 = 2, n2 = 20), a = 0.05] = 3.49
Table 4. Correlation coefficients between variable pairs, percentages of goodness of fit of regression lines and F-testresults of increase of fit of 2nd degree line over 1st degree line
Variables Correlation Computed Percentage of goodness of fit of Test of significance of increasecoefficient (r) value of ‘t’
1st degree line 2nd degree line of fit of 2nd degree line over1st degree line (F-test result)
x vs y 0.954 14.607* 91.04 91.17 39.36§
x vs z -0.245 -1.156* 5.98 13.14 2.00§
y vs z -0.492 -2.593* 24.24 44.43 7.60§
Legend: x = Total thickness of strata in m, y = number of cycles and z = average thickness of cycle in m.*t (n = 21, a = 0.05) = 1.721; §F[(n1 = 1, n2 = 20), a = 0.05] = 4.35
JOUR.GEOL.SOC.INDIA, VOL.75, MARCH 2010
556 RABINDRA NATH HOTA AND BIJAY KUMAR DAS
regression variance is rejected. In these two cases attemptwas made to fit the third-degree lines. In case of x versus ythe third-degree line is “y = -1.6139 + 0.1534x – 0.001x2 +0.000004x3 ” with goodness of fit of 91.38%. This line isalmost coincident with the first- and second-degree linesand the increase of fit is not significant. In case of y versusz, the third-degree line is “z = 23.77 – 4.9428y + 0.67y2 –0.0286y3” with goodness of fit of 47.58%. This line is almostcoincident with the second-degree line. The second-degreelines are flat and closely follow the first-degree lines(Figs. 7a-c). The correlation coefficients, thus, adequatelyexplain the relationship between the variables.
The computed values of ‘t’ in x versus y and y versus zexceed the critical value (Table 4). This leads to the rejectionof the null hypothesis (H0) that the correlation coefficients
are not significantly different from zero and acceptance ofthe alternative hypothesis (H1) that the correlationcoefficients are significantly different from zero. Thus,significant positive correlation (0.954, Table 4) between thetotal thickness of strata (x) and the number of coal cycles(y) and significant negative correlation (-0.492, Table 4)between the number of coal cycles (y) and their averagethickness (z) exist. However, in case of x versus z, thecorrelation coefficient is negative (-0.245, Table 4) and notstatistically significant
The first-degree polynomial regression line (Fig.7a)and the correlation coefficient value (r = 0.954, Table 4)demonstrate a direct relationship between the total thicknessof strata (net subsidence) and the number of sedimentarycycles. This is in conformity with the findings of Duff(1967), Read and Dean (1967, 1976) Johnson and Cook(1973), Casshyap (1975) and Hota and Pandya (2002). Thethicker the succession i.e. larger the subsidence of thedepositional basin, greater is the number of cyclespresent. This direct relationship suggests that the cyclicsedimentation of the Barren Measures Formation wascontrolled by autocyclic process, which operated within thedepositional basin rather than beyond the basin territory.A well known autocyclic process is the sedimentation thatis caused by one or more of the factors like migration ofdelta, accumulation of peat, compaction of sediments andinstability of channel development in the flood plain(Duff et al. 1967). Because the Barren Measures sedimentsare fluvial in nature (Hota et al. 2007) these might havebeen deposited by laterally migrating river channels andtheir associated deposits. Had the cyclic developmentbeen in response to allocyclic processes like extensivediastrophic movements, climatic control or eustatic rise inthe sea level (Duff et al. 1967), then the number of cycleswould have remained constant throughout the study areaand the regression line would have been horizontal inFig.7a. Thus, the Barren Measures sedimentation of theTalchir Gondwana basin is closely associated with theside-wise migration of streams or the drainage diversion(Belt et al. 1992) activated by intrabasinal differentialsubsidence.
Insignificant negative correlation (r = -0.245, Table 4)exists between total thickness of strata (net subsidence) andaverage thickness of sedimentary cycles (Table 4 andFig.7b), which matches well with the findings of Johnsonand Cook (1973) and Casshyap (1975). During BarrenMeasures sedimentation, the climate warmed up as a resultof which the humid climate of Barakar Formation graduallychanged over to semi-humid, semi-arid and finally to aridat the close of Damuda sedimentation. The changed climatic
Fig.7. First- and second-degree lines showing statisticalrelationship between (a) total thickness of strata (x in m)and number of cycles (y), (b) total thickness of strata (x inm) and average thickness of cycles (z in m), (c) number ofcoal cycles (y) and average thickness of cycles (z in m) ofthe Barren Measures Formation of the study area.
Number of cycles (y)
Total thickness of strata (x) in m
Avg
. thi
ckne
ss o
f cyc
les
(z)
in m
Avg
. thi
ckne
ss o
f cyc
les
(z)
in m
(a)
(b)
(c)

JOUR.GEOL.SOC.INDIA, VOL.75, MARCH 2010
CYCLIC SEDIMENTATION OF THE BARREN MEASURES FORMATION, TALCHIR GONDWANA BASIN 557
condition inhibited the growth of vegetation and alsocontrolled the stream migration (Hota et al. 2007).
Significant negative correlation (r = -0.492, Table 4)exists between the number and average thickness of cycles(Table 4 and Fig. 7c). This inverse relationship matches wellwith the findings of Johnson and Cook (1973) and Casshyap(1975). This is attributed to the fact that the accumulationof fine-grained over bank and bar-top sediments as well aspeat accumulations were disrupted by clastic sedimentsissued from the laterally migrating rivers that resulted inthinning of the coal and non-coal cycles and in increasingtheir number. Sporadic occurrence of coal stringers andabundance of truncated cycles support this conclusion.
Multivariate Analysis
The principal component and multiple regressionanalyses are multivariate statistical techniques, which havebeen recommended to find out interrelationships betweenseveral variables simultaneously (Davis, 2002). The firstmethod has been used to quantify the variation of lithic fillof Scottish Namurian basin (Read and Dean, 1972, 1982)as well as interrelationship between lithologic variables ofcoal-bearing sediments of Indian coalfields (Tewari, 2008).The second method has been applied to know the role ofdifferent lithologic variables of coal and non-coal cycles inbasin subsidence in the present work.
In the present study the sequence of strata comprisingof a basal coarse member (conglomerate or sandstone) andterminating with a shale bed and / or coal stringer has beenconsidered to constitute a cycle. The lithologic parametersare total thickness and number of constituent lithologies likesandstone, shale and coal stringers. It has been recommendedthat only those principal components, in which the eigenvalues are greater than unity, are statistically significant andcan be used for geological interpretation (Read and Dean,
1972). The analytical results are presented in Table 5. It isseen that the communality of all the variables are appreciablyhigh and only two of the principal components arestatistically significant. The principal component – 1 witheigen value of 3.717 explains 53.107% of the total variance.It includes total thickness of strata as well as number andthickness of sand and shale beds. The principal component– 2 with eigen value of 1.672 explains 23.880 of totalvariance. It is strongly loaded on number and thickness ofcoal stringers. Thus, the number and thickness of sandstoneand shale beds largely contribute to the total thicknessof strata (net subsidence) during Barren Measuressedimentation.
While principal component analysis classifies thevariables into different groups, the multiple regressionanalysis combines all the independent variables in apolynomial form to estimate the dependent variablequantitatively. In the present case total thickness of strata(net subsidence) of the basin has been taken as the dependentvariable and the sedimentary cycle parameters (totalthickness and number of sandstones, shales and coalstringers) as the independent variables. The F-test resultsare given in Table 6. The analysis of variance confirms thestatistical significance of the regression equation (Totalthickness of strata = - 0.212 + 1.002 thickness of sandstone+ 0.995 thickness of shale + thickness of coal stringers+ 0.0107 number of sandstone + 0.0256 number of shale– 0.0962 number of coal stringers) for the Barren MeasuresFormation at 0.05 significance level. The contributions ofthe thickness of sandstones, shales and coal stringers to the
Table 5. Matrix of the two components for the seven lithologic variablesof the Barren Measures Formation of Talchir Gondwana basin
Lithologic variables Principal components Communality
1 2
Total thickness of strata 0.814* -0.539 0.913Total thickness of sandstone 0.744* -0.594 0.651Total thickness of shale 0.722* -0.271 0.927Total thickness of coal stringers 0.353 0.627* 0.838Total number of sandstone bed 0.821* 0.267 0.989Total number of shale bed 0.915* 0.285 0.776Total number of coal stringers 0.586 0.639* 0.779Eigenvalues 3.717 1.672Percentage of total variance 53.107 23.880Cumulative percentage oftotal variance
53.107 76.987
* Highest positive value of principal component loading
Table 6. Completed ANOVA for testing the significance of regression ofindividual lithologic variables on the total thickness of strata ofthe Barren Measures Formation
Source of variation Sum of Degrees of Mean F-Testsquares freedom squares
Regression 79144.81 6 13190.80 131908.02*Total thickness of
sandstone beds 34616.95 1 34616.95 346169.50*Total thickness of
shale beds 1042.80 1 1042.80 10428.00*Total thickness of
coal stringers 232.26 1 232.26 2322.60*Total number of
sandstone beds 0.01 1 0.01 0.10Total number of
shale beds 0.02 1 0.02 0.20Total number of
coal stringers 0.11 1 0.11 1.10Deviation 1.63 16 0.10Total variation 79146.44 22
*F values significant at 0.05 significance level; F(6,16), 0.05 = 2.74;F(1,16), 0.05 = 4.49

JOUR.GEOL.SOC.INDIA, VOL.75, MARCH 2010
558 RABINDRA NATH HOTA AND BIJAY KUMAR DAS
total thickness of strata are significant at 5% significant level(Table 6) and corroborate the results of principal componentanalysis.
CONCLUSIONS
Following conclusions have been drawn from thepresent study:1. Markov chain analysis suggests the preferential
arrangement of facies states and their organisation inthe form of fining-upward cycles. Each complete cycleexhibits upward decrease of grain size, which is possiblydue to decline of flow intensity and current velocitycoupled with lateral migration of streams duringdeposition of each cycle.
2. The lithofacies constituting the fining-upward cyclescan be linked with different sub-environments ofbraided channel fluvial system and their organizationmay be attributed to lateral migration of streams inresponse to intrabasinal differential subsidence.Each complete cycle with basal conglomerate or sand-stone and terminating with shale or coal seam, suggestthe establishment of some kind of channel systemand subsequently its abandonment by stream andburial under peat swamp or freshly deposited coarseclastics.
3. The Barren Measures cycles belong to the A-4 typecyclic sequences of Hattori (1976), which consists ofdifferent proportions of lower, upper and side truncatedcycles of lithologic states. The deposition of sandstonesrepresents the most random event, which was possiblybrought about by unsystematic change in thedepositional mechanism activated by differentialsubsidence of the depositional area. Intrabasinaldif ferential subsidence is responsible for therejuvenation and lateral migration of the river systemand consequent initiation of new cycles with freshlytransported sediments.
4. Linear relationship between the total thickness of
strata and sedimentary cycles worked out by differentworkers for the cyclic sedimentation at other places isalso applicable to the fluvial sediments of BarrenMeasures Formation of Talchir Gondwana basin. Thenumber of cycles closely relates to the total thicknessof strata. Since the Barren Measures Formation isessentially fluvial and the cycles are autocyclic innature, the sedimentary distributive mechanism, bylateral migration (or diversion) of streams, might havebeen the probable means for the development ofsedimentary cycles. Thus, the cyclic sedimentation ofBarren Measures Formation could have resulted due tointrabasinal differential subsidence of the depositionalsurface. Poor correlation between total thickness ofstrata and average thickness of cycle suggestsinconsistent relationship between subsidence andvegetation growth in case of coal cycles and irregularityof channel migration in case of non-coal sedimentarycycles, which is due to changes in climate during BarrenMeasures sedimentation. The inverse relationshipbetween number and average thickness of cycles mightbe due to frequent disruption of deposition of fine-grained over bank and bar-top sediments as well aspeat accumulations by clastic sediments issued fromlaterally migrating streams.
5. The multivariate methods of principal component andmultiple regression analyses suggest that thickness ofsandstones and shale beds largely account for thesubsidence of the basin during Barren Measuressedimentation.
Acknowledgements: The authors are thankful to theauthorities of the Central Mine Planning and Design Institute,Bhubaneswar and the Directorate of Geology, Govt. ofOrissa, Bhubaneswar for providing the borehole data usedin the present study. The authors are also thankful to theanonymous reviewer of the Geological society of India forhis critical and constructive suggestions that enhanced thequality of the paper.
References
ALLEN, J.R.L. (1965a) Fining upward cycles in alluvial successions.Geol. Jour., v.4, pp.229-246.
ALLEN, J.R.L. (1965b) A review of the origin and characteristicsof recent alluvial sediments. Sedimentology, v.5, pp.89-191.
BELT, E.S., SAKIMOT O, S.E.H. and Rockwell, B.W. (1992) Adrainage diversion hypothesis for the origin of widespreadcoal beds in the williston basin: Examples from Palaeocenestrata, eastern Montana. In: M.A. Sholes (Ed.), Coal geology
of Montana, Mon. Bureau of Mines and Geology Spec Publ.,v.102, pp.21-60.
BILLINGSLEY , P. (1961) Statistical methods in chains, Arm. Math.Statist., v.32, pp.12-40.
CANT, J.C. and WALKER, R.G. (1978) Fluvial processes and faciessequences in sandy braided South Saskatchewan river, Canada.Sedimentology, v.25, pp.625-468.
CASSHYAP, S.M. (1970) Sedimentary cycles and environment of

JOUR.GEOL.SOC.INDIA, VOL.75, MARCH 2010
CYCLIC SEDIMENTATION OF THE BARREN MEASURES FORMATION, TALCHIR GONDWANA BASIN 559
deposition of the Barakar coal measures of Lower Gondwana,India. Jour. Sed. Petrol., v.40, pp.1302-1317.
CASSHYAP, S.M. (1975) Cyclic characteristics of coal-bearingsediments in the Bochumer Formation (westphal A 2)Ruhrgebiet, Germany. Sedimentology, v.22, pp.237-255.
DAS, R. and PANDYA, K.L. (1995) Lithofacies and environment ofdeposition of a part of Damuda Group, Talchir basin, Orissa.Vistas in Geological Research, Spec. Publ. Geology UtkalUniversity, Bhubaneswar, v.1, pp.152-159.
DAVIS, J.C. (2002) Statistics and Data Analysis in Geology. JohnWiley and Sons, 639p.
DUFF, P. Mc. L.D. (1967) Cyclic sedimentation in the permiancoal measures of New South Wales. Jour. Geol. Soc. Australia,v. 14, pp. 293-307.
DUFF, P. MC. L, HALLAM , D. and WALTON, E.K. (1967) Cyclicsedimentation. Development in Sedimentology No.10,Elsevier, 280p.
HARBAUGH, J.W. and BONHAM-CARTER, G. (1970) Computersimulation in Geology. Wiley Interscience, New York, 575p.
HATTORI, I. (1976) Entropy in Markov chain and discriminationof cyclic pattern in lithologic successions. Math. Geol., v.8,pp. 477-497.
HOTA, R.N. and MAEJIMA, W. (2004) Comparative study of cyclicityof lithofacies in Lower Gondwana formations of Talchir basin,Orissa, India: A statistical analysis of subsurface logs.Gondwana Res., v.7 (No.2), pp.353-362.
HOTA, R.N. and PANDYA, K.L. (2002) Quantitative relationshipbetween net subsidence and coal cycles in Barakar Formation,Talchir coalfield, Orissa. Jour. Geol. Soc. India, v.60, pp.203-211.
HOTA, R.N., PANDYA, K.L. and MAEJIMA, W. (2003) Cyclicsedimentation and facies organization of the coal bearingBarakar Formation, Talchir Gondwana basin, Orissa, India: astatistical analysis of subsurface logs. Jour. Geoscience, OsakaCity Univ., Osaka, v.46, pp.1-11.
HOTA , R. N., MAEJIMA, W. and M ISHRA, B (2007) Rivermetamorphosis during Damuda sedimentation: a case studyfrom Talchir Gondwana basin, Orissa. Jour. Geol. Soc. India,v.69, pp.1351-1360.
JOHNSON, K.R. and COOK, A.C. (1973) Cyclic characteristics ofsediments in the Moon Island Beach Subgroup, New Castlecoal measures, New South Wales. Math. Geol., v.5, pp.91-110.
KUMAR, R. (1990) Lithofacies association and quantitative analysisof the Upper Siwalik Subgroup in a part of PunjabSubhimalays. Jour. Indian Earth Sci., v.17, pp.180-193.
M IALL , A. D. (1973) Markov Chain analysis applied to an alluvialplain succession. Sedimentology, v.20, pp.347-364.
M IALL , A. D. (1977) A review of the braided-river depositionalenvironment, Earth-Science Rev., v.13, pp.1-62.
NICHOLS, G. (1999) Sedimentology and Stratigraphy. BlackwellScience Ltd., 355p.
PANDYA, K.L. (2006) Gondwanas. In: N.K. Mahalik, H.K. Sahoo,R.N. Hota, B.P. Mishra, J.K. Nanda, and A.B. Panigrahi (Eds.),Geology and mineral resources of Orissa, Society ofGeoscientists and Allied Technologists, Bhubaneswar, pp.91-103.
PETTIJOHN, F.J. (1984) Sedimentary rocks. CBS Publishers andDistributers, New Delhi, 628p.
PROTHERO, D.R. and SCHWAB, F. (1996) Sedimentary Geology. W.H.Freeman and Co., New York, 573p.
RAJA RAO, C.S. (1982) Coal resources of Tamilnadu, AndhraPradesh, Orissa and Maharastra. Bull. Geol. Surv. India, No.45,pt.II, pp.41-52.
READ, W.A. and DEAN, J.M. (1967) A quantitative study of asequence of coal bearing cycles in the Namurian of CentralScotland. Sedimentology, v.9, pp.137-156.
READ, W.A. and DEAN, J.M. (1972) Principal component analysisof lithologic variables from some Namurian (E2) paralicsediments in Central Scotland. Bull. Geol. Surv. Great Britain,v.40, pp.83-99
READ, W.A. and DEAN, J.M. (1976) Cycles of subsidence: theirrelationship in different sedimentary and tectonic environmentsin the Scottish Carboriferous. Sedimentology, v.23, pp.107-120.
READ, W.A. and DEAN, J.M. (1982) Quantitative relationshipsbetween numbers of fluvial cycles, bulk lithologicalcomposition and net subsidence in a Scottish Namurian basin.Sedimentology, v.29, pp.181-200.
SENGUPTA , S. (2007) Introduction to Sedimentology. CBSPublishers and Distributors, New Delhi, 314p.
STRAHLER, A. N. (1963) The earth sciences. Harper and RowPublishers, New York, 681p.
SHUKLA , U.K., KHAN, Z.A. and SINGH, I.B. (1996) Markov chainanalysis of the shallow marine Bhuj sandstone of EarlyCretaceous age, Kachchh basin, India. Jour. Geol. Soc. India,v.48, pp.567-578.
TEWARI, R.C. (1995) Braided-fluvial depositional model of LateTriassic Gondwana (Mahadeva) rocks of the Son valley,Central India: Tectonic and Paleogeographic implications Jour.Geol. Soc. India, v.45, pp.65-73.
TEWARI, R.C. (2008) Net subsidence and evolution of coal swampsin Early Permian coal measures of eastern India Gondwanabasins using principal component analysis, Jour Geosciences,Osaka City University, Japan, v.51, pp.27-34.
UDDEN, J.A. (1912) Geology and mineral resources of PeoriaQuadrangle, Illinois. U.S. Geol. Surv. Bull. No.506, 103p.
WELLER J.M. (1930) Cyclical sedimentation of the Permsylvanianperiod and its significance. Jour. Geol., v.38, pp.97-135.
(Received: 19 September 2009; Revised form accepted: 16 November 2009)