Supporting the Perpetuation and Reproducibility of Numerical Method Publications
Upload
khangminh22Category
view
0download
0
nutrients
Article
Reproducibility and Validity of a Food FrequencyQuestionnaire (FFQ) Developed for Middle-Aged and OlderAdults in Semarang, Indonesia
Ahmad Syauqy 1,2 , Diana Nur Afifah 1,2 , Rachma Purwanti 1,2 , Choirun Nissa 1,2, Deny Yudi Fitranti 1,2
and Jane C.-J. Chao 3,4,5,*
�����������������
Citation: Syauqy, A.; Afifah, D.N.;
Purwanti, R.; Nissa, C.; Fitranti, D.Y.;
Chao, J.C.-J. Reproducibility and
Validity of a Food Frequency
Questionnaire (FFQ) Developed for
Middle-Aged and Older Adults in
Semarang, Indonesia. Nutrients 2021,
13, 4163. https://doi.org/10.3390/
nu13114163
Academic Editor: Patrick R.M.
Lauwers
Received: 27 October 2021
Accepted: 19 November 2021
Published: 20 November 2021
Publisher’s Note: MDPI stays neutral
with regard to jurisdictional claims in
published maps and institutional affil-
iations.
Copyright: © 2021 by the authors.
Licensee MDPI, Basel, Switzerland.
This article is an open access article
distributed under the terms and
conditions of the Creative Commons
Attribution (CC BY) license (https://
creativecommons.org/licenses/by/
4.0/).
1 Department of Nutrition Science, Faculty of Medicine, Diponegoro University, Jl. Prof. H. Soedarto, S.H.,Tembalang, Semarang 50275, Indonesia; [email protected] (A.S.);[email protected] (D.N.A.); [email protected] (R.P.);[email protected] (C.N.); [email protected] (D.Y.F.)
2 Center of Nutrition Research (CENURE), Diponegoro University, Jl. Prof. H. Soedarto, S.H., Tembalang,Semarang 50275, Indonesia
3 School of Nutrition and Health Sciences, College of Nutrition, Taipei Medical University,250 Wu-Hsing Street, Taipei 11031, Taiwan
4 Master Program in Global Health and Development, College of Public Health, Taipei Medical University,250 Wu-Hsing Street, Taipei 11031, Taiwan
5 Nutrition Research Center, Taipei Medical University Hospital, 252 Wu-Hsing Street, Taipei 11031, Taiwan* Correspondence: [email protected]; Tel.: +886-2-2736-1661 (ext. 6548); Fax: +886-2-2737-3112
Abstract: We assessed the reproducibility and validity of a food frequency questionnaire (FFQ)among middle-aged and older adults in Semarang, Indonesia. A total of 259 subjects aged 40–80 yearscompleted two FFQs (nine-month apart) and nine 24 h dietary recalls (24HDRs, as a reference method).The reproducibility of the FFQ was analyzed using correlation coefficient, intra-class correlationcoefficient (ICC), weighted kappa statistics and misclassification analysis. The validity was estimatedby comparing the data acquired from FFQ1 and 24HDRs. The crude Pearson’s correlation coefficientsand ICC for total energy and nutrients between FFQ1 and FFQ2 ranged from 0.50 to 0.81 and 0.44 to0.78, respectively. Energy adjustment decreased the correlation coefficients for most nutrients. Thecrude, energy-adjusted and de-attenuated correlation coefficients for FFQ1 and 24HDRs ranged from0.41 to 0.70, 0.31 to 0.89 and 0.54 to 0.82, respectively. The agreement rates for the same or adjacentquartile classifications were 81.1–94.6% for two FFQs and 80.7–89.6% for FFQ1 and 24HDRs. Theweighted kappa values were 0.21 to 0.42 for two FFQs and 0.20 to 0.34 for FFQ1 and 24HDRs. Apositive mean difference was found in the Bland–Altman analyses for energy and macronutrients.The FFQ could be acceptable for nutritional epidemiology study among Indonesians.
Keywords: reproducibility; validity; dietary assessment; dietary recalls; food frequency question-naire; methodological study; middle-age and older adults; Indonesia
1. Introduction
The prevalence of chronic diseases is growing rapidly and have become public healthburden worldwide [1]. Certain chronic diseases such as diabetes and cardiovasculardisease may be preventable with diet and lifestyle modification [2]. Previous evidencehas suggested that diet and nutrients were correlated with the development of chronicdiseases [3,4]. Hence, it is necessary to accurately evaluate dietary and nutrient intakes.Evaluation of dietary intake requires a valid assessment instrument.
Food frequency questionnaires (FFQs) have been extensively used to evaluate dietaryand nutrient intakes in most epidemiological studies [5–7]. This questionnaire is easy toadminister and inexpensive to conduct in a major population and gives valuable data ondietary intake over a long period of time [8]. Nevertheless, the implementation of FFQ
Nutrients 2021, 13, 4163. https://doi.org/10.3390/nu13114163 https://www.mdpi.com/journal/nutrients

Nutrients 2021, 13, 4163 2 of 11
is susceptible to the socio-cultural background and ethnicity of the study population [9].Therefore, it is important to assess the reproducibility and validity of a FFQ among aspecific population for studies. The most frequently used reference method to validate FFQis 24 h dietary recall (24HDR) [10–12].
Although a number of FFQs have been developed in some countries including the Asiaregion [13–15], to the best of our knowledge, the reproducibility and validity of nutritionsurveys conducted in Indonesia have not been reported. It is important to precisely measurethe dietary assessment tools among Indonesians since Indonesia is the most populatedcountry in Southeast Asia, typically characterized by many mixed dishes and foods withseveral different cooking methods that affect the composition of nutrients [16,17]. Therefore,the objective of the study was to evaluate the reproducibility and validity of a FFQ to beused for epidemiological studies in Indonesia.
2. Materials and Methods2.1. Study Population
The subjects were recruited using a multi-stage cluster random sampling in Semarang(Figure 1). First, three out of sixteen subdistricts were chosen randomly. Then, twosuburbs/villages within the three subdistricts were randomly elected as the final areas.Finally, we randomly recruited 300 eligible individuals to join this study. The inclusioncriteria were healthy local residents aged between 40 and 80 years and lived in Semarangfor at least two years, not following a specific diet such as a weight loss diet and notpregnant. Among the 300 chosen subjects, 265 individuals were approved to join our studyand conducted the study (response rate = 88.3%). Some subjects did not participate in ourstudy because of refusal, poor health, or not attending during the study period. Semarang,the capital city of Central Java in Indonesia, is divided into lowland and highland areas andslum areas in the urban region. Semarang represents Indonesian characteristics, includingdemographics and lifestyle and provides a good overview of Indonesian people [18].
Nutrients 2021, 13, 4163 3 of 13
Figure 1. Flow diagram of subject recruitment.
2.2. Assessment of Dietary Intake All subjects completed their usual dietary intake twice using the same FFQ. Two
FFQs (FFQ1 and FFQ2) surveys were assessed nine months apart. The FFQ contained 137 food items and 24 food categories based on the Indonesian Food Composition Data and the eating habits of Indonesian people (Table 1) [7,19]. The subjects gave information about the frequency of consumption (never, daily, weekly, monthly or yearly) and the portion size of all food items they had eaten. The reported consumption of each food item was converted to grams per day for further evaluation.
Table 1. Food groups and food items used in the food frequency questionnaire.
Food Groups Food Items Rice/flour products Rice, noodles, vermicelli, plain bread
Root crops Boiled/steamed potato, taro, cassava Whole grains Whole grains, whole wheat, mixed grains, brown rice, oatmeal
Staples cook with oil Fried rice, fried noodle, kwetiau, uduk rice, kebuli rice, yellow rice Legumes and nuts Peas, nuts, beans, peanuts coated with flour
Soybeans Steamed tempe, tahu, tofu Milk and dairy products Milk, cheese, yoghurt
Light-colored vegetables Cabbage, Chinese cabbage, cucumber, pechay, chayote, squash, radish, bean sprouts,
pumpkin, mushroom
Dark-colored vegetables Spinach, carrots, kale, buncis, caisin, lotus root leaves, papaya leaves, long beans, mustard
greens, glossy nightshade Eggs Chicken eggs, duck eggs, quail eggs
Fish and seafood Fish, squid, shrimp, octopus, crab Meat Beef, veal, lamb, goat, pork
Figure 1. Flow diagram of subject recruitment.

Nutrients 2021, 13, 4163 3 of 11
2.2. Assessment of Dietary Intake
All subjects completed their usual dietary intake twice using the same FFQ. Two FFQs(FFQ1 and FFQ2) surveys were assessed nine months apart. The FFQ contained 137 fooditems and 24 food categories based on the Indonesian Food Composition Data and theeating habits of Indonesian people (Table 1) [7,19]. The subjects gave information about thefrequency of consumption (never, daily, weekly, monthly or yearly) and the portion size ofall food items they had eaten. The reported consumption of each food item was convertedto grams per day for further evaluation.
Table 1. Food groups and food items used in the food frequency questionnaire.
Food Groups Food Items
Rice/flour products Rice, noodles, vermicelli, plain bread
Root crops Boiled/steamed potato, taro, cassava
Whole grains Whole grains, whole wheat, mixed grains, brown rice, oatmeal
Staples cook with oil Fried rice, fried noodle, kwetiau, uduk rice, kebuli rice, yellow rice
Legumes and nuts Peas, nuts, beans, peanuts coated with flour
Soybeans Steamed tempe, tahu, tofu
Milk and dairy products Milk, cheese, yoghurt
Light-colored vegetables Cabbage, Chinese cabbage, cucumber, pechay, chayote, squash, radish, beansprouts, pumpkin, mushroom
Dark-colored vegetables Spinach, carrots, kale, buncis, caisin, lotus root leaves, papaya leaves, long beans,mustard greens, glossy nightshade
Eggs Chicken eggs, duck eggs, quail eggs
Fish and seafood Fish, squid, shrimp, octopus, crab
Meat Beef, veal, lamb, goat, pork
Poultry Chicken, duck, goose, pigeon
Fast food Instant noodles, chicken nugget, pizza, hamburger, doughnut, martabak, bakso
Processed food Sausage, canned food, instant food
Fried food Fried chicken, dried fish-tofu (batagor), bakwan, risol, cakwe, pastel, cireng, gorengan,fried fish (pempek), fried banana, chips, cassava chips
Organs of animals Liver, kidney, heart, intestines
FruitsBanana, orange, pear, mango, papaya, avocado, watermelon, apple, grape,
starfruit, dragon fruit, duku, rambutan, rose apple, lemon, coconut, mangosteen,giant granadilla, jack fruit, snack fruit, soursop, breadfruit
Processed fruit Canned fruit, rujak, asinan
Traditional snacks Gethuk, serabi cake, putu cake, gemblong, pukis
Jam/honey Jam, honey
Sugary drinks Soft drinks, soda, energy drinks, flavored fruit drinks
Sweet dessert Butter bread, sweet bread, cake, cookies, biscuit, crackers
Tea and coffee Green tea, black tea, black coffee, traditional coffee
Nine multiple pass 24HDRs were collected every month for successive nine months.Nine 24HDRs contained three days of the weekend and six days of the weekdays. The first24HDR was accomplished one month after the administration of the first FFQ (in August2020) and the last 24HDR was recorded one month before the administration of the secondFFQ (in April 2021). We asked the subjects to recall their consumption of all foods andbeverages, including the names and quantities, during the previous 24 h. The previous 24 h

Nutrients 2021, 13, 4163 4 of 11
was defined as subsequent 24 h from the bedtime to the following bedtime in a day before24HDR assessment. We then calculated the mean intake from 24HDR data for each subject.
The FFQ and 24HDR data were collected by the trained nutritionists at the subjects’homes. The trained nutritionists assisted the subjects to evaluate the portion size of foodconsumption using a book of photographs containing each food item with different portionsizes and kitchen utensils (i.e., spoons, tablespoons, scoops, glasses and cups). We usedthe Indonesian Food Composition Data to estimate the daily intakes of energy, macro- andmicro-nutrients [19]. Additionally, we also used the food composition data of the UnitedStates Department of Agriculture database for few specific micronutrients due to lackinginformation from the Indonesian Food Composition Data [20].
2.3. Other Variables
We collected demographic and lifestyle characteristics including age, gender (maleand female), marital status (married and not married/divorce) and smoking status (currentsmoker, ex-smoker and never smoke). We also measured body weight and height. Bodymass index (BMI) was determined as weight (kg) divided by height squared (m2).
2.4. Statistical Analysis
We used the SPSS statistical software package version 25 (SPSS Inc., Chicago, IL, USA)for statistical analyses. The normality of distributions of dietary data was analyzed by theKolmogorov–Smirnov test. Variables not normally distributed (carbohydrate, cholesterol,vitamin A, thiamin, vitamin E, sodium and potassium) were natural log-transformed toreach a normal distribution and to allow the use of parametric tests. Means and standarddeviations were counted for energy, nutrients and food group intakes for both FFQ and24HDR. Reproducibility was evaluated by comparing the intakes between FFQ1 and FFQ2.We compared the data of FFQ1 with the mean of 24HDRs to assess the validity of the FFQ.
The reproducibility was assessed to compare the intakes between two FFQs usingpaired t-test, Pearson’s correlation coefficient, intra-class correlation coefficient (ICC),weighted kappa statistic and misclassification analysis. The validity of the FFQ1 com-parable with the mean of 24HDRs was analyzed by paired t-test, Pearson’s correlationcoefficient, ICC, weighted kappa statistic and misclassification analysis. We calculated thepercentages of agreement (classification in the same or adjacent quartile) and disagree-ment (classification in one quartile apart or opposite quartile). De-attenuated correlationcoefficients were counted using Rosner and Willett’s formula to improve within-personvariation in the mean of 24HDRs [21,22]. We analyzed Bland–Altman plots to comparethe differences between FFQ1 and the mean of 24HDRs across energy, carbohydrate, fatand protein intakes. The differences between FFQ1 and the mean of 24HDR were plotted(FFQ1—the mean of 24HDRs; y-axis) against the mean of the two methods for energy,carbohydrate, fat and protein intakes [(FFQ1 + the mean of 24HDRs)/2]; x-axis) [23].
3. Results
Among 265 subjects who initially participated in our study, 16 subjects were excludedbecause they did not complete two FFQs or nine 24HDRs. Therefore, a total of 259 subjectswere included in the final analysis. Total energy intake of all subjects in our study rangedbetween 500 and 5000 kcal. Table 2 shows the characteristics of the subjects. There were57.9% male subjects and 55.2% current smokers. The mean age was 54.8 ± 9.6 years andthe mean body mass index was 24.0 ± 3.2 kg/m2.

Nutrients 2021, 13, 4163 5 of 11
Table 2. Characteristics of the subjects (n = 259) 1.
Characteristics All Subjects
Age, years 54.8 ± 9.6
Gender, %Male 57.9
Female 42.1
Marital status, %Married 81.5
Not married/divorce 18.5
Smoking status, %Current smoker 55.2
Ex-smoker 17.0Never smoke 27.8
Body mass index, kg/m2 24.0 ± 3.21 Data are presented as means ± SD for continuous variables or % for categorical variables.
Table 3 describes the mean intakes of total energy and nutrients derived from twoFFQs and the mean of 24HDRs, the comparisons from the paired t-test and the percentage ofmean differences between two FFQs and between FFQ1 and the mean of 24HDRs. A pairedt-test indicated that the intakes of energy and most nutrients, except for monounsaturatedfatty acids (MUFA), β-carotene, niacin, sodium and copper, assessed by two FFQs weresignificantly different. The mean intakes for energy and nutrients evaluated by FFQ1 werehigher than the data acquired by FFQ2 and the differences in mean intakes ranged from1.7% for niacin to 27.8% for thiamin. The paired t-test also showed that the intakes ofenergy and all nutrients evaluated by FFQ1 were statistically different from the intakesevaluated by the mean of 24HDRs. Compared with the mean of 24HDRs as a referencemethod, the data of FFQ1 tended to overestimate intakes of all nutrients and food groups.
Table 4 illustrates the crude and energy-adjusted correlation coefficients for FFQ1 andFFQ2. These results gave the evaluation of the reproducibility of two FFQs. The crudePearson’s correlation coefficients for total energy and nutrients ranged from 0.50 for fiberto 0.81 for potassium and the crude ICC ranged from 0.44 for fiber to 0.78 for sodium andphosphorus. However, the correlation coefficients were changed after adjusting for energy.The energy-adjusted Pearson’s correlation coefficients ranged from 0.30 for fiber to 0.78for calcium and energy-adjusted ICC ranged from 0.31 for fiber to 0.66 for retinol andcalcium. Table 4 also describes the crude and energy-adjusted and de-attenuated Pearson’scorrelation coefficients between FFQ1 and the mean of 24HDRs to evaluate the validity ofthe FFQ. The crude Pearson’s correlation coefficients for FFQ1 and the mean of 24HDRsranged from 0.41 for thiamin to 0.70 for β-carotene. The energy-adjusted coefficients rangedfrom 0.31 for phosphorus to 0.89 for copper, while the de-attenuated coefficients rangedfrom 0.54 for thiamin to 0.82 for zinc.
Table 5 shows the misclassification and weighted kappa values between FFQ1 andFFQ2 and between FFQ1 and the mean of 24HDRs. After we categorized the intakes intoquartiles, the ranges of the agreement rates for the same or adjacent quartile classificationswere from 81.1% for thiamin to 94.6% for carbohydrate as compared between FFQ1 andFFQ2 and 80.7% for vitamin D to 89.6% for β-carotene as compared between FFQ1 andthe mean of 24HDRs. Extreme misclassification into opposite quartile was <6% for energyand all nutrients. The weighted kappa values described moderate conformity, rangingfrom 0.21 (fiber, cholesterol and riboflavin) to 0.42 (retinol and iron) between two FFQsand 0.20 (carbohydrate and phosphorus) to 0.34 (vitamin C) between FFQ1 and the meanof 24HDRs.

Nutrients 2021, 13, 4163 6 of 11
Table 3. Comparisons of nutrient intakes between two FFQs and between FFQ1 and the mean of 24HDRs.
Variables
FFQ1 FFQ2 24HDRs p-Value 1 Percentage of MeanDifference
Mean SD Mean SD Mean SD FFQ1 vs.FFQ2
FFQ1 vs.24HDRs
FFQ1 vs.FFQ2
FFQ1 vs.24HDRs
Energy (kcal) 2 1921 423 1877 386 1751 413 0.008 <0.001 2.4 9.7Carbohydrate (g) 2 288 67 282 64 264 66 <0.001 <0.001 2.0 8.8
Fiber (g) 2 18 4 16 3 15 3 <0.001 <0.001 8.9 19.5
Fat (g) 2 61 14 59 12 55 13 0.015 <0.001 2.5 11.0MUFA (g) 3 22 6 21 5 21 6 0.055 <0.001 2.9 6.5PUFA (g) 3 11 2 10 2 8 2 <0.001 <0.001 8.1 31.3
Cholesterol (mg) 3 129 33 123 32 109 29 0.002 <0.001 5.4 19.0
Protein (g) 2 55 13 52 11 50 12 0.005 <0.001 2.7 8.6
Retinol (µg) 2 438 121 405 142 331 131 <0.001 <0.001 7.9 32.1β-Carotene (µg) 2 1884 531 1834 530 1716 502 0.08 <0.001 2.7 9.8Vitamin C (mg) 2 116 41 112 33 90 34 0.038 <0.001 3.7 29.0Vitamin D (µg) 3 2.81 0.56 2.59 0.66 2.49 0.73 <0.001 <0.001 8.5 12.9Vitamin E (mg) 3 2.29 0.63 2.11 0.64 2.03 0.58 <0.001 <0.001 8.5 12.8Thiamin (mg) 2 1.15 0.58 0.90 0.54 0.75 0.50 <0.001 <0.001 27.8 53.3
Riboflavin (mg) 2 1.87 0.60 1.76 0.40 1.64 0.41 <0.001 <0.001 6.3 14.0Niacin (mg) 2 13.5 3.3 13.3 3.7 12.7 3.6 0.203 <0.001 1.7 6.6
Sodium (mg) 2 1705 466 1674 443 1580 453 0.09 <0.001 1.9 7.9Potassium (mg) 2 3795 948 3538 945 3328 968 <0.001 <0.001 7.3 14.0Calcium (mg) 2 579 122 540 124 477 127 <0.001 <0.001 7.2 21.4
Phosphorus (mg) 2 623 141 590 124 536 137 <0.001 <0.001 5.6 16.3Magnesium (mg) 3 377 91 370 100 364 101 <0.001 <0.001 1.9 3.5
Iron (mg) 2 11.8 3.3 10.7 3.4 10.2 3.3 <0.001 <0.001 10.1 16.2Copper (mg) 2 634 183 619 135 578 163 0.06 <0.001 2.5 9.6
Zinc (mg) 2 10.1 2.3 8.4 1.8 6.9 1.8 <0.001 <0.001 20.1 46.2
FFQ: food frequency questionnaire, 24HDR: 24 h dietary recall, MUFA: monounsaturated fatty acids, PUFA: polyunsaturated fatty acids.1 Differences were tested by using paired t-test. 2 Nutrient intakes were analyzed using the Indonesian Food Composition Data. 3 Nutrientintakes were analyzed using the United States Department of Agriculture (USDA).
Table 4. Correlation coefficients for nutrient and food group intakes between FFQ1 and FFQ2 and between FFQ1 and themean of 24HDRs.
Variables
FFQ1 vs. FFQ2 FFQ1 vs. 24HDRs
PCC ICC PCC
Crude EnergyAdjust Crude Energy
Adjust Crude EnergyAdjust
De-Attenuated
Energy (kcal) 0.78 - 0.77 - 0.63 - 0.70
Carbohydrate (g) 0.76 0.47 0.76 0.48 0.56 0.49 0.67Fiber (g) 0.50 0.30 0.44 0.31 0.51 0.33 0.69
Fat (g) 0.71 0.43 0.70 0.45 0.53 0.76 0.65MUFA (g) 0.60 0.41 0.59 0.44 0.58 0.68 0.67PUFA (g) 0.67 0.50 0.62 0.34 0.46 0.35 0.58
Cholesterol (mg) 0.58 0.56 0.55 0.52 0.52 0.46 0.71
Protein (g) 0.74 0.42 0.71 0.43 0.54 0.39 0.66

Nutrients 2021, 13, 4163 7 of 11
Table 4. Cont.
Variables
FFQ1 vs. FFQ2 FFQ1 vs. 24HDRs
PCC ICC PCC
Crude EnergyAdjust Crude Energy
Adjust Crude EnergyAdjust
De-Attenuated
Retinol (µg) 0.72 0.70 0.70 0.66 0.57 0.58 0.74β-Carotene (µg) 0.64 0.44 0.63 0.38 0.70 0.66 0.78Vitamin C (mg) 0.70 0.72 0.68 0.65 0.60 0.59 0.73Vitamin D (µg) 0.65 0.44 0.58 0.44 0.46 0.46 0.60Vitamin E (mg) 0.69 0.67 0.66 0.64 0.56 0.56 0.68Thiamin (mg) 0.60 0.72 0.75 0.56 0.41 0.50 0.54
Riboflavin (mg) 0.66 0.62 0.60 0.54 0.55 0.70 0.68Niacin (mg) 0.62 0.62 0.61 0.63 0.56 0.73 0.67
Sodium (mg) 0.61 0.44 0.78 0.53 0.65 0.59 0.74Potassium (mg) 0.81 0.53 0.69 0.42 0.67 0.52 0.77Calcium (mg) 0.78 0.78 0.74 0.66 0.60 0.83 0.76
Phosphorus (mg) 0.79 0.48 0.78 0.45 0.61 0.31 0.74Magnesium (mg) 0.60 0.58 0.58 0.38 0.43 0.40 0.55
Iron (mg) 0.62 0.63 0.59 0.60 0.48 0.48 0.59Copper (mg) 0.71 0.70 0.67 0.62 0.69 0.89 0.78
Zinc (mg) 0.55 0.53 0.57 0.55 0.48 0.48 0.82
FFQ: food frequency questionnaire, 24HDR: 24 h dietary recall, ICC: intra-class correlation coefficient, PCC: Pearson’s correlation coefficient,MUFA: monounsaturated fatty acids, PUFA: polyunsaturated fatty acids.
Table 5. Agreement rates (%) for the same quartile or adjacent quartile classifications, disagreement rates (%) for onequartile apart or opposite quartile classifications and weighted kappa values between FFQ1 and FFQ2 and between FFQ1and the mean of 24HDRs.
Variables
FFQ1 vs. FFQ2 FFQ1 vs. 24HDRs
SameQuartile
AdjacentQuartile
OneQuartile
Apart
OppositeQuartile
WeightedKappa
SameQuartile
AdjacentQuartile
OneQuartile
Apart
OppositeQuartile
WeightedKappa
Energy (kcal) 50.6 42.1 7.0 0.4 0.34 42.1 44.0 10.4 3.5 0.23
Carbohydrate (g) 51.4 43.2 4.6 0.8 0.35 39.3 45.2 11.2 4.3 0.20Fiber (g) 41.6 48.8 7.7 1.9 0.21 43.3 42.9 10.4 3.5 0.24
Fat (g) 52.1 39.4 7.0 1.5 0.37 44.4 40.5 10.8 4.3 0.26MUFA (g) 50.6 36.3 9.3 3.9 0.34 49.4 37.1 10.8 2.7 0.32PUFA (g) 43.6 50.2 4.6 1.5 0.25 46.7 37.8 11.2 4.3 0.29
Cholesterol (mg) 40.5 49.8 7.7 1.9 0.21 43.3 42.9 10.4 3.5 0.24
Protein (g) 48.7 42.1 8.9 0.4 0.30 44.8 38.2 15.8 1.2 0.25
Retinol (µg) 56.8 35.1 7.7 0.4 0.42 43.3 37.8 18.5 0.4 0.24β-Carotene (µg) 50.6 36.3 9.3 3.9 0.34 49.8 39.8 6.9 3.5 0.33Vitamin C (mg) 55.2 35.5 8.5 0.8 0.40 50.6 36.3 10.4 2.7 0.34Vitamin D (µg) 54.1 34.4 8.8 2.7 0.39 45.6 35.1 13.5 5.8 0.27Vitamin E (mg) 55.2 34.4 9.7 0.8 0.41 49.1 37.1 9.7 4.2 0.32Thiamin (mg) 44.8 36.3 17.8 1.2 0.26 44.0 41.3 11.2 3.5 0.25
Riboflavin (mg) 40.5 49.8 7.7 1.9 0.21 43.3 42.9 10.4 3.5 0.24Niacin (mg) 42.1 40.5 16.6 0.8 0.22 44.0 41.3 11.2 3.5 0.25
Sodium (mg) 55.2 37.1 7.0 0.8 0.40 47.9 41.7 7.7 2.7 0.32Potassium (mg) 49.0 44.0 6.6 0.4 0.33 44.8 44.4 8.5 2.3 0.27Calcium (mg) 46.8 42.9 7.0 3.4 0.39 44.8 44.0 10.4 0.8 0.24
Phosphorus (mg) 50.6 42.5 6.6 0.4 0.32 43.3 43.2 11.2 2.3 0.20Magnesium (mg) 55.2 32.4 8.1 4.3 0.39 43.6 44.0 6. 6 5.8 0.24
Iron (mg) 56.8 31.3 9.3 2.7 0.42 47.9 33.2 14.3 4.6 0.30Copper (mg) 52.9 31.3 14.7 1.2 0.37 44.0 43.6 8.9 3.5 0.25
Zinc (mg) 42.9 42.1 13.9 1.2 0.22 42.5 39.4 13.1 5.0 0.23
FFQ: food frequency questionnaire, 24HDR: 24 h dietary recall, MUFA: monounsaturated fatty acids, PUFA: polyunsaturated fatty acids.

Nutrients 2021, 13, 4163 8 of 11
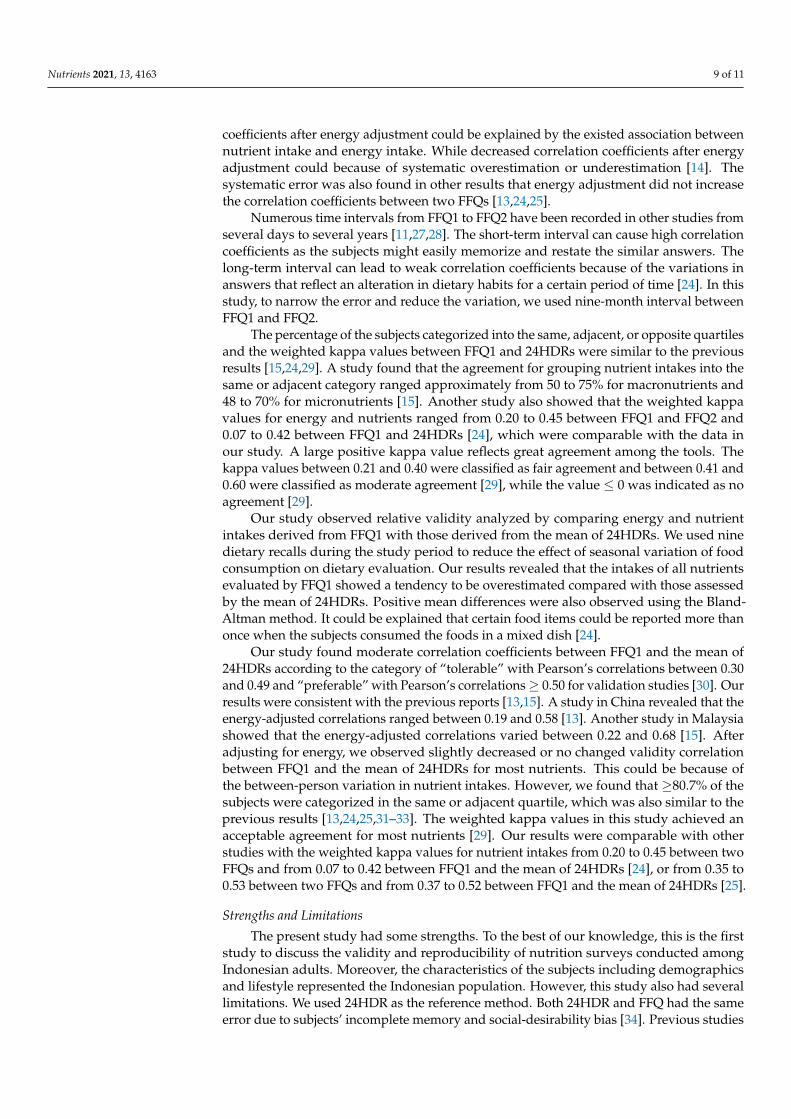
Figure 2 describes the level of discrepancy for energy and macronutrient intakes usingthe Bland-Altman plot method. A positive mean difference was shown in the analyses forenergy and macronutrients. We also found that less than 10% of the subjects were outsidethe confidence intervals for all nutrients.
Nutrients 2021, 13, 4163 9 of 13
Figure 2. Bland-Altman plots for the intakes of energy (kcal) (a), carbohydrate (g) (b), fat (g) (c) and protein (g) (d). The difference between the mean estimate of energy and macronutrient intakes by two dietary assessment methods (y-axis) was plotted against the mean of nutrients measured by two dietary assessment methods (x-axis). FFQ: food frequency questionnaire, 24HDR: 24 h dietary recall.
4. Discussion The reproducibility and validity of a 137-item FFQ with Indonesian dietary patterns
were investigated in our study. Based on a previous study, the number of food items in FFQ might vary between 5 and 350 [8]. Our results indicated that the reproducibility and validity of the FFQ could be acceptable in relation to the reference method for nutritional epidemiology study among Indonesians.
The mean intakes for all nutrients from FFQ1 were higher compared to the data from FFQ2. This could be elucidated by the learning effect of the subjects. The subjects might estimate dietary intake more accurately after the survey of FFQ1 [24]. Crude Pearson’s correlations and crude ICC for reproducibility between FFQ1 and FFQ2 in this study ranged between 0.50 and 0.81 and between 0.44 and 0.78, respectively. The coefficient cor-relation in our study was higher compared to that with a range of 0.20 to 0.80 in the pre-vious studies [24–26]. Our results may reflect that this FFQ was relatively stable to assess dietary habits among the subjects. After energy adjustment, the correlation coefficients were higher only for few nutrients, but lower for most nutrients. The reason for increased correlation coefficients after energy adjustment could be explained by the existed associ-ation between nutrient intake and energy intake. While decreased correlation coefficients after energy adjustment could because of systematic overestimation or underestimation [14]. The systematic error was also found in other results that energy adjustment did not increase the correlation coefficients between two FFQs [13,24,25].
(a) (b)
(c) (d)
Figure 2. Bland-Altman plots for the intakes of energy (kcal) (a), carbohydrate (g) (b), fat (g) (c) and protein (g) (d). Thedifference between the mean estimate of energy and macronutrient intakes by two dietary assessment methods (y-axis)was plotted against the mean of nutrients measured by two dietary assessment methods (x-axis). FFQ: food frequencyquestionnaire, 24HDR: 24 h dietary recall.
4. Discussion
The reproducibility and validity of a 137-item FFQ with Indonesian dietary patternswere investigated in our study. Based on a previous study, the number of food items inFFQ might vary between 5 and 350 [8]. Our results indicated that the reproducibility andvalidity of the FFQ could be acceptable in relation to the reference method for nutritionalepidemiology study among Indonesians.
The mean intakes for all nutrients from FFQ1 were higher compared to the data fromFFQ2. This could be elucidated by the learning effect of the subjects. The subjects mightestimate dietary intake more accurately after the survey of FFQ1 [24]. Crude Pearson’scorrelations and crude ICC for reproducibility between FFQ1 and FFQ2 in this study rangedbetween 0.50 and 0.81 and between 0.44 and 0.78, respectively. The coefficient correlationin our study was higher compared to that with a range of 0.20 to 0.80 in the previousstudies [24–26]. Our results may reflect that this FFQ was relatively stable to assess dietaryhabits among the subjects. After energy adjustment, the correlation coefficients were higheronly for few nutrients, but lower for most nutrients. The reason for increased correlation
Nutrients 2021, 13, 4163 9 of 11
coefficients after energy adjustment could be explained by the existed association betweennutrient intake and energy intake. While decreased correlation coefficients after energyadjustment could because of systematic overestimation or underestimation [14]. Thesystematic error was also found in other results that energy adjustment did not increasethe correlation coefficients between two FFQs [13,24,25].
Numerous time intervals from FFQ1 to FFQ2 have been recorded in other studies fromseveral days to several years [11,27,28]. The short-term interval can cause high correlationcoefficients as the subjects might easily memorize and restate the similar answers. Thelong-term interval can lead to weak correlation coefficients because of the variations inanswers that reflect an alteration in dietary habits for a certain period of time [24]. In thisstudy, to narrow the error and reduce the variation, we used nine-month interval betweenFFQ1 and FFQ2.
The percentage of the subjects categorized into the same, adjacent, or opposite quartilesand the weighted kappa values between FFQ1 and 24HDRs were similar to the previousresults [15,24,29]. A study found that the agreement for grouping nutrient intakes into thesame or adjacent category ranged approximately from 50 to 75% for macronutrients and48 to 70% for micronutrients [15]. Another study also showed that the weighted kappavalues for energy and nutrients ranged from 0.20 to 0.45 between FFQ1 and FFQ2 and0.07 to 0.42 between FFQ1 and 24HDRs [24], which were comparable with the data inour study. A large positive kappa value reflects great agreement among the tools. Thekappa values between 0.21 and 0.40 were classified as fair agreement and between 0.41 and0.60 were classified as moderate agreement [29], while the value ≤ 0 was indicated as noagreement [29].
Our study observed relative validity analyzed by comparing energy and nutrientintakes derived from FFQ1 with those derived from the mean of 24HDRs. We used ninedietary recalls during the study period to reduce the effect of seasonal variation of foodconsumption on dietary evaluation. Our results revealed that the intakes of all nutrientsevaluated by FFQ1 showed a tendency to be overestimated compared with those assessedby the mean of 24HDRs. Positive mean differences were also observed using the Bland-Altman method. It could be explained that certain food items could be reported more thanonce when the subjects consumed the foods in a mixed dish [24].
Our study found moderate correlation coefficients between FFQ1 and the mean of24HDRs according to the category of “tolerable” with Pearson’s correlations between 0.30and 0.49 and “preferable” with Pearson’s correlations ≥ 0.50 for validation studies [30]. Ourresults were consistent with the previous reports [13,15]. A study in China revealed that theenergy-adjusted correlations ranged between 0.19 and 0.58 [13]. Another study in Malaysiashowed that the energy-adjusted correlations varied between 0.22 and 0.68 [15]. Afteradjusting for energy, we observed slightly decreased or no changed validity correlationbetween FFQ1 and the mean of 24HDRs for most nutrients. This could be because ofthe between-person variation in nutrient intakes. However, we found that ≥80.7% of thesubjects were categorized in the same or adjacent quartile, which was also similar to theprevious results [13,24,25,31–33]. The weighted kappa values in this study achieved anacceptable agreement for most nutrients [29]. Our results were comparable with otherstudies with the weighted kappa values for nutrient intakes from 0.20 to 0.45 between twoFFQs and from 0.07 to 0.42 between FFQ1 and the mean of 24HDRs [24], or from 0.35 to0.53 between two FFQs and from 0.37 to 0.52 between FFQ1 and the mean of 24HDRs [25].
Strengths and Limitations
The present study had some strengths. To the best of our knowledge, this is the firststudy to discuss the validity and reproducibility of nutrition surveys conducted amongIndonesian adults. Moreover, the characteristics of the subjects including demographicsand lifestyle represented the Indonesian population. However, this study also had severallimitations. We used 24HDR as the reference method. Both 24HDR and FFQ had the sameerror due to subjects’ incomplete memory and social-desirability bias [34]. Previous studies

Nutrients 2021, 13, 4163 10 of 11
stated that biomarkers could be considered as an alternative reference method [14,34].However, no biomarkers were measured in this study. Some studies showed that thecorrelation of food intake with nutrient status and its biomarker was not exactly directbecause the absorption of the nutrients in the body should also be considered [35,36].Moreover, 24HDR was often used in the validity study of FFQ [10–12,24,34] because 24HDRestimated dietary intake more precisely than FFQ [10,37]. In addition, this analysis wasrestricted only to middle-aged and older adults aged 40–80 years. It is uncertain whetherour FFQ can also be appropriate for dietary assessment among children or younger adults.
5. Conclusions
In conclusion, the 137-item FFQ designed for this study shows acceptable reproducibil-ity and validity. Hence, the FFQ can be utilized as a reliable tool in epidemiological studiesamong middle-aged and older adults in different settings in Indonesia. Further evaluationand modifications of food items in the proposed FFQ are needed to improve its validityand reproducibility for some nutrients.
Author Contributions: Conceptualization and methodology, A.S., D.N.A., R.P., C.N., D.Y.F. andJ.C.-J.C.; formal analysis, A.S. and R.P.; investigation, A.S., C.N. and D.Y.F.; writing—original draftpreparation, A.S.; writing—review and editing, A.S. and J.C.-J.C. All authors have read and agreed tothe published version of the manuscript.
Funding: This research was funded by Institute for Research and Community Services (LPPM-RPIBT), Diponegoro University (233-36/UN7.6.1/PP/2020).
Institutional Review Board Statement: The study was conducted according to the guidelines of theDeclaration of Helsinki and approved by the Health Research Ethics Committee of Medical Facultyof Diponegoro University (No.172/EC/KEPK/FK-UNDIP/VII/2020).
Informed Consent Statement: Informed consent was obtained from all subjects involved in the study.
Data Availability Statement: The data presented in this study are available from the first author onreasonable request.
Acknowledgments: The authors are grateful to the subjects who took part in this study and theresearch team for their cooperation and assistance.
Conflicts of Interest: The authors declare no conflict of interest. The funders had no roles in thedesign of the study, the collection, analyses, or interpretation of data, the writing of the manuscript,or the decision to publish the results.
References1. Yach, D.; Hawkes, C.; Gould, C.L.; Hofman, K.J. The global burden of chronic diseases: Overcoming impediments to prevention
and control. JAMA 2004, 291, 2616–2622. [CrossRef] [PubMed]2. Ng, R.; Sutradhar, R.; Yao, Z.; Wodchis, W.P.; Rosella, L.C. Smoking, drinking, diet and physical activity-modifiable lifestyle risk
factors and their associations with age to first chronic disease. Int. J. Epidemiol. 2020, 49, 113–130. [CrossRef] [PubMed]3. Syauqy, A.; Hsu, C.Y.; Lee, H.A.; Rau, H.H.; Chao, J.C.J. Association between dietary patterns and kidney function parameters in
adults with metabolic syndrome: A cross-sectional study. Nutrients 2020, 13, 40. [CrossRef] [PubMed]4. Ramos-Lopez, O.; Milagro, F.I.; Allayee, H.; Chmurzynska, A.; Choi, M.S.; Curi, R.; De Caterina, R.; Ferguson, L.R.; Goni, L.;
Kang, J.X.; et al. Guide for current nutrigenetic, nutrigenomic, and nutriepigenetic approaches for precision nutrition involvingthe prevention and management of chronic diseases associated with obesity. J. Nutr. Nutr. 2017, 10, 43–62. [CrossRef]
5. Shim, J.S.; Oh, K.; Kim, H.C. Dietary assessment methods in epidemiologic studies. Epidemiol. Health 2014, 36, e2014009.[CrossRef] [PubMed]
6. Syauqy, A.; Hsu, C.Y.; Rau, H.H.; Chao, J.C.J. Association of dietary patterns with components of metabolic syndrome andinflammation among middle-aged and older adults with metabolic syndrome in Taiwan. Nutrients 2018, 10, 143. [CrossRef]
7. Syauqy, A.; Noer, E.R.; Fajrani, A.M.; Kurniawati, D.M.a.; Purwanti, R.; Rahadiyanti, A.; Rahma, D.E. Dietary patterns wereassociated with obesity parameters among healthy women. J. Nutr. Coll. 2020, 9, 6. [CrossRef]
8. Cade, J.; Thompson, R.; Burley, V.; Warm, D. Development, validation and utilisation of food-frequency questionnaires—A review.Public Health Nutr. 2002, 5, 567–587. [CrossRef]
9. Cui, Q.; Xia, Y.; Wu, Q.; Chang, Q.; Niu, K.; Zhao, Y. A meta-analysis of the reproducibility of food frequency questionnaires innutritional epidemiological studies. Int. J. Behav. Nutr. Phys. Act. 2021, 18, 12. [CrossRef]

Nutrients 2021, 13, 4163 11 of 11
10. Dehghan, M.; Ilow, R.; Zatonska, K.; Szuba, A.; Zhang, X.; Mente, A.; Regulska-Ilow, B. Development, reproducibility and validityof the food frequency questionnaire in the Poland arm of the Prospective Urban and Rural Epidemiological (PURE) study. J. Hum.Nutr. Diet. 2012, 25, 225–232. [CrossRef]
11. Xue, Y.; Yang, K.; Wang, B.; Liu, C.; Mao, Z.; Yu, S.; Li, X.; Wang, Y.; Sun, H.; Wang, C.; et al. Reproducibility and validity of anFFQ in the Henan Rural Cohort Study. Public Health Nutr. 2020, 23, 34–40. [CrossRef]
12. Visser, M.; Elstgeest, L.E.M.; Winkens, L.H.H.; Brouwer, I.A.; Nicolaou, M. Relative validity of the HELIUS food frequencyquestionnaire for measuring dietary intake in older adult participants of the longitudinal aging study Amsterdam. Nutrients 2020,12, 1998. [CrossRef] [PubMed]
13. Ye, Q.; Hong, X.; Wang, Z.; Yang, H.; Chen, X.; Zhou, H.; Wang, C.; Lai, Y.; Sun, L.; Xu, F. Reproducibility and validity of an FFQdeveloped for adults in Nanjing, China. Br. J. Nutr. 2016, 115, 887–894. [CrossRef] [PubMed]
14. Doustmohammadian, A.; Amini, M.; Esmaillzadeh, A.; Omidvar, N.; Abtahi, M.; Dadkhah-Piraghaj, M.; Nikooyeh, B.; Neyestani,T.R. Validity and reliability of a dish-based semi-quantitative food frequency questionnaire for assessment of energy and nutrientintake among Iranian adults. BMC Res. Notes 2020, 13, 95. [CrossRef] [PubMed]
15. Nurul-Fadhilah, A.; Teo, P.S.; Foo, L.H. Validity and reproducibility of a food frequency questionnaire (FFQ) for dietary assessmentin Malay adolescents in Malaysia. Asia Pac. J. Clin. Nutr. 2012, 21, 97–103.
16. Ramadhani, P.P.; Dieny, F.F.; Kurniawati, D.; Sandi, H.; Fitranti, D.Y.; Rahadiyanti, A.; Tsani, A.F.A. Household food security anddiet quality with chronic energy deficiency among preconception women. Indones. J. Nutr. 2021, 9, 111–122. [CrossRef]
17. Herningtyas, E.H.; Ng, T.S. Prevalence and distribution of metabolic syndrome and its components among provinces and ethnicgroups in Indonesia. BMC Public Health 2019, 19, 377. [CrossRef]
18. Statistics of Semarang Municipality. Available online: https://semarangkota.bps.go.id/ (accessed on 1 August 2021).19. Indonesian Food Composition Data. Available online: https://www.panganku.org/en-EN/beranda (accessed on 1 August 2021).20. United States Department of Agriculture. Available online: https://ndb.nal.usda.gov/ndb/search/list (accessed on
1 August 2021).21. Rosner, B.; Willett, W.C. Interval estimates for correlation coefficients corrected for within-person variation: Implications for
study design and hypothesis testing. Am. J. Epidemiol. 1988, 127, 377–386. [CrossRef]22. Willett, W. Nutritional Epidemiology; Oxford University Press: Oxford, UK, 2012; Volume 40.23. Bland, J.M.; Altman, D. Statistical methods for assessing agreement between two methods of clinical measurement. Lancet 1986,
327, 307–310. [CrossRef]24. Zhuang, M.; Yuan, Z.; Lin, L.; Hu, B.; Wang, X.; Yang, Y.; Chen, X.; Jin, L.; Lu, M.; Ye, W. Reproducibility and relative validity of a
food frequency questionnaire developed for adults in Taizhou, China. PLoS ONE 2012, 7, e48341. [CrossRef]25. Xia, W.; Sun, C.; Zhang, L.; Zhang, X.; Wang, J.; Wang, H.; Wu, L. Reproducibility and relative validity of a food frequency
questionnaire developed for female adolescents in Suihua, North China. PLoS ONE 2011, 6, e19656. [CrossRef]26. Marques-Vidal, P.; Ross, A.; Wynn, E.; Rezzi, S.; Paccaud, F.; Decarli, B. Reproducibility and relative validity of a food-frequency
questionnaire for French-speaking Swiss adults. Food Nutr. Res. 2011, 55, 5905. [CrossRef] [PubMed]27. De la Fuente-Arrillaga, C.; Ruiz, Z.V.; Bes-Rastrollo, M.; Sampson, L.; Martinez-González, M.A. Reproducibility of an FFQ
validated in Spain. Public Health Nutr. 2010, 13, 1364–1372. [CrossRef] [PubMed]28. Vereecken, C.A.; Maes, L. A Belgian study on the reliability and relative validity of the health behaviour in school-aged children
food-frequency questionnaire. Public Health Nutr. 2003, 6, 581–588. [CrossRef] [PubMed]29. McHugh, M.L. Interrater reliability: The kappa statistic. Biochem. Med. 2012, 22, 276–282. (In Zagreb) [CrossRef]30. Masson, L.F.; McNeill, G.; Tomany, J.O.; Simpson, J.A.; Peace, H.S.; Wei, L.; Grubb, D.A.; Bolton-Smith, C. Statistical approaches
for assessing the relative validity of a food-frequency questionnaire: Use of correlation coefficients and the kappa statistic. PublicHealth Nutr. 2003, 6, 313–321. [CrossRef] [PubMed]
31. Deschamps, V.; de Lauzon-Guillain, B.; Lafay, L.; Borys, J.M.; Charles, M.A.; Romon, M. Reproducibility and relative validity of afood-frequency questionnaire among French adults and adolescents. Eur. J. Clin. Nutr. 2009, 63, 282–291. [CrossRef]
32. Zhang, C.X.; Ho, S.C. Validity and reproducibility of a food frequency questionnaire among Chinese women in Guangdongprovince. Asia Pac. J. Clin. Nutr. 2009, 18, 240–250.
33. Villegas, R.; Yang, G.; Liu, D.; Xiang, Y.B.; Cai, H.; Zheng, W.; Shu, X.O. Validity and reproducibility of the food-frequencyquestionnaire used in the Shanghai men’s health study. Br. J. Nutr. 2007, 97, 993–1000. [CrossRef]
34. Praagman, J.; Adolphs, A.P.; van Rossum, C.T.; Sluijs, I.; van der Schouw, Y.T.; Beulens, J.W. Reproducibility and relative validityof a FFQ to estimate the intake of fatty acids. Br. J. Nutr. 2016, 115, 2154–2161. [CrossRef]
35. Cade, J.E.; Burley, V.J.; Warm, D.L.; Thompson, R.L.; Margetts, B.M. Food-frequency questionnaires: A review of their design,validation and utilisation. Nutr. Res. Rev. 2004, 17, 5–22. [CrossRef] [PubMed]
36. Noor Hafizah, Y.; Ang, L.C.; Yap, F.; Nurul Najwa, W.; Cheah, W.L.; Ruzita, A.T.; Jumuddin, F.A.; Koh, D.; Lee, J.A.C.; Essau, C.A.;et al. Validity and reliability of a food frequency questionnaire (FFQ) to assess dietary intake of preschool children. Int. J. Environ.Res. Public Health 2019, 16, 4722. [CrossRef] [PubMed]
37. Haftenberger, M.; Heuer, T.; Heidemann, C.; Kube, F.; Krems, C.; Mensink, G.B. Relative validation of a food frequencyquestionnaire for national health and nutrition monitoring. Nutr. J. 2010, 9, 36. [CrossRef] [PubMed]
Copyright © 2022 FDOKUMEN