Structural and Convergent Validity of Intelligence Composites
211
Structural and Convergent Validity of Intelligence Composites: Integrating Evidence From Three Analysis Levels Inauguraldissertation zur Erlangung der Würde einer Doktorin der Philosophie vorgelegt der Fakultät für Psychologie der Universität Basel von Silvia Grieder aus Thürnen, BL Basel, 2021 Originaldokument gespeichert auf dem Dokumentenserver der Universität Basel edoc.unibas.ch
-
Upload
khangminh22 -
Category
Documents
-
view
0 -
download
0
Transcript of Structural and Convergent Validity of Intelligence Composites

Structural and Convergent Validity of Intelligence Composites: Integrating Evidence From Three Analysis Levels
Inauguraldissertation zur Erlangung der Würde einer Doktorin der Philosophie vorgelegt der Fakultät für Psychologie der Universität Basel von
Silvia Grieder
aus Thürnen, BL
Basel, 2021
Originaldokument gespeichert auf dem Dokumentenserver der Universität Baseledoc.unibas.ch

Genehmigt von der Fakultät für Psychologie auf Antrag von
Prof. Dr. Alexander Grob
Prof. Dr. Sakari Lemola
Datum des Doktoratsexamen: 26.05.2021
DekanIn der Fakultät für Psychologie

Erklärung zur wissenschaftlichen Lauterkeit
Ich erkläre hiermit, dass die vorliegende Arbeit ohne die Hilfe Dritter und ohne Benutzung
anderer als der angegebenen Hilfsmittel selbstständig verfasst habe. Zu Hilfe genommene
Quellen sind als solche gekennzeichnet. Die veröffentlichten oder zur Veröffentlichung in
Zeitschriften eingereichten Manuskripte wurden in Zusammenarbeit mit den Koautoren erstellt
und von keinem der Beteiligten an anderer Stelle publiziert, zur Publikation eingereicht, oder
einer anderen Prüfungsbehörde als Qualifikationsarbeit vorgelegt. Es handelt sich dabei um
folgende Manuskripte:
• Grieder, S. & Grob, A. (2020). Exploratory factor analyses of the Intelligence and Development Scales–2: Implications for theory and practice. Assessment, 27(8),
1853–1869. https://doi.org/10.1177/1073191119845051
• Grieder, S., Timmerman, M. E., Visser, L., Ruiter, S. A. J., & Grob, A. (2021). Factor structure of the Intelligence and Development Scales–2: Measurement invariance
across the Dutch and German versions, sex, and age. Manuscript submitted for
publication. PsyArXiv Preprint. https://doi.org/10.31234/osf.io/vtw3g
• Canivez, G. L., Grieder, S., & Bünger, A. (2021). Construct validity of the German Wechsler Intelligence Scale for Children–Fifth Edition: Exploratory and confirmatory
factor analyses of the 15 primary and secondary subtests. Assessment, 28(2), 327–
352. https://doi.org/10.1177/1073191120936330
• Bünger, A., Grieder, S., Schweizer, F., & Grob, A. (2021). The comparability of intelligence test results: Group- and individual-level comparisons of seven intelligence
tests. Manuscript submitted for publication.
• Grieder, S., Bünger, A., Odermatt, S. D., Schweizer, F., & Grob, A. (in press). Limited internal score comparability of general intelligence composites: Impact on external
validity, possible predictors, and practical remedies. Assessment.
Basel, 22.03.2021
Silvia Grieder

VALIDITY OF INTELLIGENCE COMPOSITES IV
ACKNOWLEDGMENTS
I would like to express my gratitude to the following people for supporting me throughout my PhD:
To Prof. Dr. Alexander Grob for your continuous support and guidance and for the numerous
stimulating and insightful scientific discussions.
To Prof. Dr. Sakari Lemola for serving as a supervisor and for awakening my interest in the study of
intelligence in the first place through your inspiring teaching.
To Prof. Dr. Rainer Greifeneder for serving as chair on the dissertation committee.
To the PEP team for your numerous helpful comments and discussions and for providing a welcoming
and congenial working atmosphere.
To my colleagues and coauthors for your continued support and valuable comments and discussions.
Special thanks go to Prof. Dr. Gary L. Canivez, for your guidance and for an inspiring and continued
exchange, to Dr. Anette Bünger, for enthusiastic discussions and for your understanding and supportive
nature, to Dr. Florine Schweizer, for brightening up my darkest mood with your unshakeable optimism
and humor, and—most of all—to Salome Odermatt, for sharing emotional burdens and laughter, for
your invaluable support, and for bearing with me all the way through.
To my partner, Markus Steiner, for always being there, for enduring my airs and graces, and for sharing
uncountable precious intellectual and emotional moments with me.
To my family, for always believing in me, for encouraging and supporting me through ups and downs,
and for your unconditional love.

VALIDITY OF INTELLIGENCE COMPOSITES V
TABLE OF CONTENTS
ACKNOWLEDGMENTS ................................................................................................................. IV
ABSTRACT ....................................................................................................................................... VI
1. Introduction ...................................................................................................................................... 1
2. Theoretical Background ................................................................................................................... 2
2.1 Definition and Theoretical Models of Intelligence .................................................................. 2
2.2 Measurement of Intelligence ................................................................................................... 4
2.3 Validity of Intelligence Test Score Interpretations .................................................................. 6
3. Research Questions ........................................................................................................................... 9
3.1 Structural Validity Evidence .................................................................................................... 9
3.2 Convergent Validity Evidence ................................................................................................. 9
4. Method ............................................................................................................................................. 10
4.1 Studies and Samples .............................................................................................................. 10
4.2 Measures ................................................................................................................................ 10
4.3 Statistical Analyses ................................................................................................................ 11
5. Synopsis of Results .......................................................................................................................... 12
5.1 Structural Validity Evidence .................................................................................................. 12
5.2 Convergent Validity Evidence ............................................................................................... 12
6. General Discussion ......................................................................................................................... 13
6.1 Structural Validity Evidence .................................................................................................. 13
6.2 Convergent Validity Evidence ............................................................................................... 13
6.3 Future Directions for Intelligence Assessment ...................................................................... 14
6.4 Conclusion ............................................................................................................................. 20
7. References ........................................................................................................................................ 21
APPENDIX A: Study 1 ...................................................................................................................... 33
APPENDIX B: Study 2 ....................................................................................................................... 62
APPENDIX C: Study 3 ...................................................................................................................... 92
APPENDIX D: Study 4 .................................................................................................................... 137
APPENDIX E: Study 5 ..................................................................................................................... 171
APPENDIX F: Curriculum Vitae ................................................................................................... 202

VALIDITY OF INTELLIGENCE COMPOSITES VI
ABSTRACT
Despite extensive evidence of the reliability and validity of general intelligence (g) composites,
current theoretical intelligence models—and with them also recent intelligence tests—de-emphasize g
and instead focus more on broad abilities, such as fluid reasoning and processing speed. This although
broad ability composites have been shown to be much less reliable and valid compared to g composites.
In practice, both g and broad ability composites are interpreted for individuals and used to inform high-
stakes decisions. Therefore, it is important to further clarify the validity of their interpretation for current
intelligence tests not only at the group level, but also at the individual level. This dissertation thus aims
to determine to what extent structural and convergent validity evidence provided at different analysis
levels (i.e., the total sample, subgroup, and individual level) supports the interpretation of (a) g
composites and (b) broad ability composites.
Structural validity evidence provided by Studies 1, 2, and 3 supports a strong and predominant
g factor and weak broad ability factors for two concurrent intelligence tests at the total sample level as
well as—for one of these tests—at the level of subgroups differing in sex and age (Study 2). Most of
the postulated broad abilities were confirmed for these tests, but Visual Processing and Fluid Reasoning
collapsed to one factor in all three studies. Of the confirmed broad ability composites, however, only
two were (sometimes) reliable enough to justify their interpretation. Convergent validity evidence
provided by Studies 4 and 5 reveals high correlations and small mean differences in g composites of
multiple tests at the total sample level, but the g and broad ability composites from different intelligence
tests (Study 4) and different g composites from the same tests (Study 5) sometimes showed large score
differences at the individual level. These were predicted by IQ level and age, suggesting systematic
differences across subgroups that differ in these characteristics. Even after taking measurement error
into account by investigating the overlap of confidence intervals (CIs), there was still considerable
incomparability. In Study 5, we thus examined if using more accurate reliability coefficients for CIs
could increase comparability. Indeed, comparability was substantially improved if test–retest
reliabilities or age- and IQ-level-specific internal consistencies were used for 95% CIs instead of one
overall internal consistency. Finally, results from Study 5 suggested that the number, g factor loadings,
and content of subtests might also influence the comparability of g composites.
The studies of this dissertation provide further support for the validity of the interpretation of g
composites—but only if 95% CIs based on accurate reliability estimates are used—and against the
validity of the interpretation of most broad ability composites from concurrent intelligence tests.
Consequently, score interpretation should focus primarily, if not exclusively, on the g composite, which
should consist of a sufficient number of subtests of heterogeneous content and with high g factor
loadings. Moreover, especially for high-stakes decisions, at least two tests should be administered that
are selected and interpreted with respect to testee characteristics and test content. Explanations and
further implications of the findings of this dissertation as well as future directions for intelligence
assessment are discussed in light of the goals pursued with intelligence assessments.

VALIDITY OF INTELLIGENCE COMPOSITES 1
1. Introduction
General intelligence (g)1 is defined as a general mental ability to reason, plan, solve problems,
comprehend complex ideas, and learn from experience (Gottfredson, 1997a). It is a universal
phenomenon in humans (Warne & Burningham, 2019) and highly predictive for a wide range of
important life outcomes, including academic achievement (e.g., Deary et al., 2007; Roth et al., 2015),
occupational success (e.g., Hunter & Hunter, 1984; Schmidt & Hunter, 2004), socioeconomic status
and income (e.g., Gottfredson, 2004; Murray, 1998), relationship success (e.g., Aspara et al., 2018),
political attitudes and participation (e.g., Deary et al., 2008a, 2008b), and health and longevity (e.g.,
Calvin et al., 2010; Gottfredson & Deary, 2004).
Despite this extensive evidence for the importance of g, several influential intelligence models,
starting with Thurstone’s (1938b) theory of primary mental abilities and culminating in the Cattell–
Horn–Carroll (CHC) model (McGrew, 1997, 2009; Schneider & McGrew, 2018), have de-emphasized
g and instead focused more on broad abilities, such as visual processing or processing speed. One major
reason for this is that the information on individual strengths and weaknesses provided by broad abilities
was deemed more useful than one g estimate. Consequently, there has been an increase in the number
of broad abilities purportedly measured by intelligence tests over the last 70 years (Beaujean & Benson,
2019; Frazier & Youngstrom, 2007), and many concurrent intelligence tests focus more on the
assessment of broad abilities than on that of g (Canivez & Youngstrom, 2019).
This development is problematic for at least two reasons: (a) There are numerous studies
supporting the validity and utility of g composites2 (e.g., Canivez & Youngstrom, 2019; Deary, 2014;
Gottfredson, 1997b; Roth et al., 2015; Schmidt & Hunter, 2004), and (b) evidence is accumulating that
broad ability composites are less reliable, less valid, less useful for diagnostics and treatment planning,
and often possess little incremental validity for important life outcomes compared to g composites
(Brown et al., 2006; Canivez & Youngstrom, 2019; McGill et al., 2018; Schmidt & Hunter, 2004).
Despite this evidence, a focus on broad abilities is still common in practice (Kranzler et al.,
2020), where intelligence tests are frequently used as a basis for high-stakes decisions (Goldstein et al.,
2015), for example, in school psychology to identify students with special needs, or in personnel
psychology to identify promising candidates. It is therefore important to further clarify the validity of
both g and broad ability estimates from concurrent intelligence tests. As intelligence test scores are
interpreted for individuals, evidence should be provided not only at the group level (i.e., total samples
or subgroups), but also at the individual level.
The aim of this dissertation thus was to determine to what extent validity evidence provided at
different analysis levels supports the interpretation of (a) g composites and (b) broad ability composites.
1 Throughout this dissertation, I use g merely as an abbreviation of the term “general intelligence” and not to refer to general intelligence as conceptualized by specific theories, such as the two-factor theory (Spearman, 1904). 2 Throughout this dissertation, I use the term “composite” as shorthand for “composite score” to refer to a test score composed of (usually unitarily weighted) subtest scores.

VALIDITY OF INTELLIGENCE COMPOSITES 2
To this end, I present evidence on two aspects of validity—the structural and convergent aspect
(American Educational Research Association [AERA] et al., 2014)—at three different analysis levels—
the total sample, subgroup, and individual level. Study 1 (Grieder & Grob, 2020), Study 2 (Grieder et
al., 2021), and Study 3 (Canivez et al., 2021) investigate the structural validity aspect for two concurrent
intelligence tests for children and adolescents, one of them in two language versions, at the total sample
level with large representative samples. Study 2 additionally investigates the structural validity aspect
for one of these tests at the level of relevant subgroups from the reference populations that differ in sex
and age. Study 4 (Bünger et al., 2021) and Study 5 (Grieder et al., in press) investigate the convergent
validity aspect at all three analysis levels for multiple tests for children, adolescents, and adults, with
Study 5 additionally exploring ways to improve the validity of the interpretation of g composites.
In Section 2 of this dissertation, I present relevant intelligence models and the fundamentals of
intelligence measurement, introduce the concept of validity, and review empirical validity evidence. In
Section 3, I introduce the research questions. In Section 4, I outline the methods of the studies included
in this dissertation, and in Section 5, I provide a synopsis of the study results. Finally, in Section 6, I
discuss the results and their implications and suggest future directions for intelligence assessment.
2. Theoretical Background
2.1 Definition and Theoretical Models of Intelligence
Research on intelligence has a long and prolific history that dates back as far as Plato (Beaujean,
2019), but it was Charles Spearman (1904) who developed the first formal definition and theoretical
model of intelligence. In an attempt to explain the positive manifold (i.e., all-positive correlations) of
cognitive test outcomes, Spearman’s (1904) two-factor or g theory postulates that each cognitive task
measures g as well as something specific to the task that is independent of g, which he termed S. In
addition to a mathematical definition, Spearman verbally defined g as “the one great common
Intellective Function” (Spearman, 1904, p. 272). He refrained from providing a more detailed verbal
definition until research would reveal more about the nature of g (Spearman, 1905).
In the years to follow, intelligence research has grown rapidly and intelligence has become one
of the best-researched constructs in psychology to date (Rost, 2009). Although there is still no
universally accepted definition of intelligence, there is a widely accepted verbal definition of g agreed
upon by 52 leading intelligence scholars that was published by Gottfredson (1997a) and more recently
reiterated by Nisbett et al. (2012):
Intelligence is a very general mental capability that, among other things, involves the ability to
reason, plan, solve problems, think abstractly, comprehend complex ideas, learn quickly and
learn from experience. It is not merely book learning, a narrow academic skill, or test-taking
smarts. Rather, it reflects a broader and deeper capability for comprehending our
surroundings—“catching on”, “making sense” of things, or “figuring out” what to do.
(Gottfredson, 1997a, p. 13)

VALIDITY OF INTELLIGENCE COMPOSITES 3
In contrast to g, the specific factors played a lesser role in Spearman’s two-factor theory.
Spearman defined these as everything that is measured with a specific cognitive task apart from g. If
the tasks are sufficiently diverse, the specific factors should all be independent of each other (Spearman,
1904). If any tasks do share variance beyond g, then they may “be brought together as a more or less
unitary power” (Krueger & Spearman, 1906, p. 103). Spearman was thus aware of other possible
attributes in the intelligence domain that we now call group factors or broad abilities and also devoted
some time to study them (e.g., Krueger & Spearman, 1906). However, he thought most of these broad
abilities were too unstable to represent unitary attributes (Beaujean, 2019).
A major opponent of Spearman’s theory was Louis Thurstone. In contrast to Spearman,
Thurstone thought that g was too unstable across studies (Beaujean, 2019) and attempted to explain the
intercorrelations of cognitive tasks with a set of seven independent factors he called primary mental
abilities (Thurstone, 1938b). As it became clear that the independence of the factors in Thurstone’s
analysis was an artefact of his exclusive use of orthogonal factor rotation methods and a variance-
restricted sample (Thurstone, 1938a), he later allowed correlations between the factors and found that
a higher-order factor could be extracted to account for the factors’ intercorrelations (Thurstone &
Thurstone, 1941). This marked the birth of the era of hierarchical intelligence models, which are still
the dominant conception of intelligence to date.
Thurstone’s adoption of a higher-order g factor is often regarded as reconciliation of his theory
with Spearman’s (Thurstone, 1947). However, it is important to note that this higher-order g factor is
not interpreted the same as Spearman’s g factor. In the two-factor theory, specific factors (and their
systematic clusters, the broad abilities) are thought of as independent of g and of each other (Krueger
& Spearman, 1906; Spearman, 1904). In the presence of broad abilities, this conception is best
represented by a bifactor model (Holzinger & Swineford, 1937; Reise, 2012), where each task is
influenced by (a) a g factor common to all tasks, (b) a broad ability common to a subset of the tasks that
is independent of the other broad abilities and of the g factor, and (c) a unique variance term. In higher-
order models, on the other hand, the g factor does not represent an attribute that is independent of the
broad abilities but instead represents whatever the broad abilities have in common. Thus, in higher-
order models, g’s influence on the tasks is fully mediated by the broad abilities, while, in a bifactor
model, it directly influences the tasks. Which type of model best represents intelligence structure is still
controversial, and I revisit the current state of research on this below.
Since Thurstone’s work, many intelligence theories and models have been developed. Two
theories that are still highly influential to date are Cattell and Horn’s extended Gf-Gc theory (Cattell,
1941; Horn, 1991; Horn & Cattell, 1966) and Carroll’s three-stratum theory (Carroll, 1993). Both of
these theories include a number of highly comparable broad abilities at Stratum II and narrow abilities
at Stratum I, but they again differ with respect to the status of g; while Carroll’s model includes a g
factor at Stratum III, Cattell and Horn’s model does not. Cattell and Horn argued that “a concept of g
does not provide a sound basis for understanding human cognitive functioning because different

VALIDITY OF INTELLIGENCE COMPOSITES 4
intellectual abilities have different patterns of change in adulthood” (Horn, 1991, p. 224). While some
broad abilities (e.g., Fluid Reasoning [Gf]) decline with age in adulthood, others (e.g., Comprehension–
Knowledge [Gc]) remain stable or increase (Horn, 1991; see also investment theory by Cattell, 1963).
Despite this major difference, Gf-Gc theory and the three-stratum theory have been integrated
into a comprehensive framework—the CHC model (McGrew, 1997, 2009; Schneider & McGrew,
2018). The CHC model is a higher-order model3 with over 80 narrow abilities on Stratum I and at least
14 broad abilities on Stratum II, including Gf, Gc, Visual Processing (Gv), Processing Speed (Gs),
Working Memory Capacity (Gwm), Auditory Processing (Ga), Learning Efficiency (Gl), Retrieval
Fluency (Gr), Quantitative Knowledge (Gq), and Reading and Writing (Grw; Schneider & McGrew,
2018). Reflecting the disagreement of Cattell–Horn and Carroll, a g factor is usually included at Stratum
III, but g is de-emphasized and not regarded as a useful construct (Schneider & McGrew, 2018). This
ambiguous status and de-emphasis of g constitute major criticisms of the CHC model, together with
failures to replicate the CHC structure in independent studies, lack of parsimony and falsifiability,
insufficient neurobiological underpinnings, and lack of evidence for the reliability and validity of CHC
broad ability profiles (see Wasserman, 2019, for an overview).
The theories and models discussed so far are largely grounded in psychometric and factor-
analytic evidence. However, there exist alternative theories that are more process based and deal with
some of the criticisms introduced above. A popular example of such theories is the planning, attention–
arousal, simultaneous and successive (PASS) theory (Das et al., 1994). PASS theory is grounded in
evidence from neuroscience and cognitive psychology and holds that intelligence is best viewed as a
set of independent but related systems and processes. It challenges the idea of g and, in this respect,
agrees with alternative explanations of the positive manifold, as provided by the mutualism model (van
der Maas et al., 2006) or by process overlap theory (Kovacs & Conway, 2016, 2019). These theories
back up the CHC theorists’ claim of g not being a real construct and seem to contradict the extensive
evidence of the usefulness of g composites (e.g., Canivez & Youngstrom, 2019). I revisit and try to
tackle this paradox in the Discussion, as it has important implications for how to proceed with
intelligence assessment in the future.
Still, despite criticism and the presence of plausible alternative models, the CHC model is
currently the one most widely referred to in intelligence research and test construction (Alfonso et al.,
2005; McGill & Dombrowski, 2019; Schneider & McGrew, 2018) and was also the basis for most tests
included in the studies of this dissertation. Having established the history and current theoretical status
of intelligence, I now elaborate how intelligence measurement has evolved up to now.
2.2 Measurement of Intelligence
The first modern intelligence test was developed by Binet and Simon (1905) as a means to
identify children with intellectual disabilities who needed special education, which is still a major
3 This although Carroll’s model is best represented through a bifactor model (Beaujean, 2015).

VALIDITY OF INTELLIGENCE COMPOSITES 5
reason for the application of intelligence tests to date. They developed a set of cognitive tasks and soon
realized that the probability of solving a task increased not only with lower levels of “abnormality” (as
they assumed) but also with a child’s age. As we now know, the latter reflects the development of
abilities due to brain maturation and increasing knowledge during childhood and adolescence (Rost,
2009).4 Considering this, Binet and Simon ordered the tasks by increasing difficulty, and a child’s
“score” consisted of the discrepancy between their chronological and mental age, the latter being
estimated with the level of tasks usually completed by children at that age (Binet & Simon, 1907).
Since then, psychometrics has developed, but the core idea has remained unchanged.
Contemporary intelligence tests use composites of age-standardized subtest scores that are determined
with large representative samples and scaled onto an IQ metric. IQ scores are normally distributed in
the population (M = 100, SD = 15) and are estimates of the relative intelligence level compared to other
individuals of the same age (Rost, 2009; Wechsler, 1939). These scores are used for both g and broad
abilities and are often classified into categories, with values between 85 and 115 (M ± 1 SD) classified
as average, values between 71 and 84, and 116 and 129 as below and above average, respectively,
values 70 and below (≤ M – 2 SDs) as intellectual disability (World Health Organization, 2020), and
values 130 and above (≥ M + 2 SDs) as intellectual giftedness (Carman, 2013).
While the first intelligence tests (e.g., Binet–Simon, Army Alpha, and Army Beta; Yoakum &
Yerkes, 1920) were designed to measure some form of g, there has been a growing emphasis on broad
abilities and profile analysis since Thurstone introduced his primary mental abilities (Thurstone,
1938b), and this is also where the major emphasis lies in many contemporary intelligence tests (Canivez
& Youngstrom, 2019). The main idea behind this is that rather than the interindividual position in
relation to individuals of the same age, an intraindividual perspective (e.g., using profile analyses and
difference scores) would be more informative for diagnostics and treatment planning, as this enables
the identification of an individual’s relative strengths and weaknesses (McGill et al., 2018).
An example of this development is provided by the Wechsler scales, which are among the most-
administered psychological tests in the world to date (Evers et al., 2012; Oakland et al., 2016; Rabin et
al., 2016). David Wechsler’s first intelligence test—the Wechsler–Bellevue Intelligence Scale
(Wechsler, 1939)—was intended for administration to adults. It includes a full scale encompassing all
10 subtests, and two subscales—a Verbal and a Performance Scale—which consist of five subtests each
and which Wechsler thought of as measuring different aspects of g (Goldstein et al., 2015). Since these
beginnings, different age versions have been developed and adapted, and the latest version of the
Wechsler Intelligence Scale for Children, the WISC-V (Wechsler, 2014), refers to the CHC model and
includes 16 subtest scores on which are based a g composite, five broad ability composites, five
ancillary composites, three complementary composites, 10 process scores, and 31 difference scores at
4 Despite this lack in mean-level stability, however, g estimates exhibit high rank-order stability from childhood on (correlations between .50 and .80 from around 11 years to old age; Deary, 2014).

VALIDITY OF INTELLIGENCE COMPOSITES 6
the subtest and composite score level. This plethora of scores most likely violates the rule that “there
should never be more scores to interpret than there are attributes being measured” (Beaujean & Benson,
2019, p. 134) and raises the question of which of these scores can be interpreted validly.
In practice, the main emphasis typically lies on the interpretation of broad ability and g
composites (Kranzler et al., 2020). Given that these scores are often used for diagnostic purposes and
as a basis for high-stakes decisions, it is crucial to ensure they are reliable and that their interpretation—
be it inter- or intraindividual—is valid for the intended purposes.
2.3 Validity of Intelligence Test Score Interpretations
Multiple guidelines exist for the use and evaluation of psychological tests (e.g., AERA et al.,
2014; Diagnostik- und Testkuratorium, 2018; Geisinger et al., 2013; International Test Commission,
2001), and all of them include validity as a criterion that needs to be established for any test. It can be
defined as “the degree to which evidence and theory support the interpretations of test scores for
proposed uses of tests” (AERA et al., 2014, p. 11; see also Messick, 1989).5 Thus, validity is not a
property of the test itself, but an evaluative judgment of the meaning of test scores (Messick, 1989).
Although validity is a unitary concept, there are different types of validity evidence, namely,
evidence based on test content, response processes, internal structure, and relations to other variables,
the latter including convergent and discriminant evidence and evidence from test–criterion
relationships (AERA et al., 2014). Which of those aspects are relevant depends on the claims regarding
the interpretation of a test score. For example, imagine that one makes the claim that a g composite of
a specific test can be used to determine the need for special education because it is a measure of g,
which in turn is known to be predictive of their future learning success and academic achievement. In
this case, evidence should be provided that (a) the composite is indeed a measure of g (test content
evidence, but also convergent and discriminant evidence), (b) the subtests of which the score is
composed are indeed good indicators of g (internal structure evidence, henceforth: structural validity
evidence), and (c) the composite is predictive of future learning success and achievement. On the other
hand, it is less important which cognitive processes underlie test performance, and thus evidence based
on response processes is not necessary in this case. Often, test scores are used for multiple different
purposes, requiring a variety of validity evidence.
The present dissertation focuses on two types of validity evidence—namely, structural and
convergent—for the most commonly interpreted intelligence test scores—namely, g and broad ability
composites. Providing these types of evidence is necessary (although not sufficient) to justify the
interpretation of g and broad ability composites for most applied purposes.
Because intelligence test scores are interpreted for individuals and results from the group level
are not necessarily transferable to the individual level (e.g., Molenaar & Campbell, 2009), validity
5 There exist other definitions of validity, for example, by Borsboom et al. (2004), which I come back to in the Discussion. However, the definition mentioned here represents a broader consensus in the measurement literature and is therefore adopted in the present dissertation.

VALIDITY OF INTELLIGENCE COMPOSITES 7
evidence should whenever possible be provided not only at the group but also at the individual level.
Establishing structural validity evidence at the individual level is difficult, however, as it requires many
administrations of the test in question to the same individuals (see Borkenau & Ostendorf, 1998, for an
example). To still be able to judge generalizability across individuals of the reference population,
structural validity evidence should also be established at the level of relevant subgroups of the reference
population differing in characteristics that might influence the validity of test score interpretations, such
as age, sex, or language skills (AERA et al., 2014). Convergent validity evidence, however, can be
established at both the group and individual level. Establishing convergent validity evidence at the
individual level is especially important because intelligence test scores are typically used
interchangeably. That is, a practitioner selects one intelligence test and interprets its scores as if they
had been the same (or at least very similar, considering measurement error) on any other test purporting
to measure the same construct. The present dissertation thus considers validity evidence at three
different analysis levels, namely, two group levels (i.e., the total sample and relevant subgroups) and
the individual level.
Of course, test score interpretations cannot be valid if the scores are not reliable. Therefore,
reliability (i.e., the proportion of true score variance in the observed score variance) and its different
estimations (Cronbach, 1947; McDonald, 1999; Schmidt et al., 2003) are also considered in the present
dissertation as a prerequisite for valid test score interpretations. In particular, it includes examinations
of model-based reliability estimates (e.g., Gignac, 2014; Reise, 2012; see below for details), which are
related to structural validity evidence, and internal consistency and test–retest reliability estimates
(Schmidt et al., 2003) as influencers of convergent validity evidence. Just like structural validity
evidence, reliability estimates can and should also be provided at the level of relevant subgroups of the
reference population (AERA et al., 2014), which is what some studies of this dissertation did.
Structural Validity Evidence. This type of evidence refers to “the degree to which the
relationships among test items and test components conform to the construct on which the proposed
test score interpretations are based” (AERA et al., 2014, p. 16). Structural validity evidence for
intelligence tests is usually provided using exploratory and/or confirmatory factor analyses (EFA and
CFA, respectively) of age-standardized subtest scores. Previous studies on major intelligence tests
consistently confirmed a hierarchical structure that sometimes (e.g., Canivez et al., 2020; Canivez &
Watkins, 2010) but not always (e.g., Canivez et al., 2017; Dombrowski, McGill, & Canivez, 2018)
conformed with the theoretically proposed structure. Often, not all proposed broad abilities are
confirmed (e.g., Canivez, 2008; Canivez et al., 2016, 2017; Keith & Reynolds, 2010), and/or the
allocation of subtests to broad ability factors is not as proposed by the theoretical model (e.g.,
Dombrowski, 2014; Dombrowski, Beaujean, et al., 2018). In these cases, the interpretation of at least
some broad ability composites is not supported on the basis of structural validity evidence. In contrast,
the interpretation of a g composite is virtually always supported.

VALIDITY OF INTELLIGENCE COMPOSITES 8
Since the revival of the bifactor model (Reise, 2012), bifactor structures have been increasingly
tested and found to fit best for many intelligence tests (Cucina & Byle, 2017). Some have also argued
that the bifactor model was superior because it was theoretically more parsimonious than the higher-
order model (e.g., Gignac, 2008). Thus, it is likely that g and broad abilities are best conceptualized as
independent of each other. I revisit this controversy in the discussion of directions for future intelligence
assessment. However, as the conceptualization of intelligence as higher-order or bifactor is not
important for answering the research questions of this dissertation, I do not go into further detail here.
Given that both g and broad abilities seem to influence subtest scores, it is important to clarify
the unique contributions of the two. For this purpose, model-based reliability estimates, such as
McDonald’s omegas (Gignac, 2014; McDonald, 1985, 1999; Reise, 2012; Zinbarg et al., 2006), are
well suited. They make it possible to partition a composite’s true score variance (estimated with ωt) into
variance explained by the g factor (estimated with ωh) and variance explained by its respective broad
ability factor (for broad ability composites) or by all broad ability factors (for the g composite; estimated
with ωs). Many authors caution against universal thresholds for ω, but a preliminary suggestion of .50—
with .75 being preferred—has been made for ωh for the whole scale (here: the g composite) and for ωs for the subscales (here: the broad ability composites; Reise et al., 2013). For most major intelligence
tests, model-based reliability analyses provided evidence of a strong, dominant g factor (ωh > .75) and
weak broad ability factors (ωs < .50 for most of them; e.g., Canivez et al., 2017; Cucina & Howardson,
2017; Dombrowski, McGill, & Canivez, 2018; Watkins, 2017). Thus, model-based reliability evidence
virtually always supports the interpretation of the g composite as the primary estimate of g, but not the
interpretation of most broad ability composites as primary estimates of the respective broad abilities.
Although structural validity evidence—and model-based reliability estimates that draw on it—
converges for many different intelligence tests, validity evidence needs to be established for the scores
of any new test, which was one aim in Studies 1, 2, and 3. All three studies examined this validity aspect
at the total sample level, and Study 2 also at the subgroup level. Finally, model-based reliabilities have
typically been investigated for whole (standardization) samples but, to my knowledge, not for relevant
subgroups of the reference population, which was another aim in Study 2.
Convergent Validity Evidence. This type of evidence refers to “relationships between test
scores and other measures intended to assess the same or similar constructs” (AERA et al., 2014, pp.
16–17). Convergent validity evidence for intelligence tests typically stems from examining the
correlations of scores from different intelligence tests (i.e., from group-level analyses). Correlations are
usually high (around .50–.80) and highest for the g composites (e.g., Floyd et al., 2008; Grob et al.,
2019b; Grob & Hagmann-von Arx, 2018b). However, as argued above, convergent validity evidence
should also be provided at the individual level.
The few studies that did this provided evidence for limited convergent validity at the individual
level (i.e., limited score comparability) for both g (Floyd et al., 2008; Hagmann-von Arx et al., 2018)
and broad ability (Floyd et al., 2005) composites across different intelligence tests, even after

VALIDITY OF INTELLIGENCE COMPOSITES 9
controlling for measurement error (e.g., by comparing confidence intervals [CIs]). These results suggest
that either the reliability estimates used did not sufficiently capture measurement error and/or at least
some of the test scores did not provide valid estimates of the construct they purportedly measured. All
three studies concluded that any two intelligence tests do not render comparable g or broad ability
composites at the individual level, even if they are highly correlated at the group level.
In sum, convergent validity has almost exclusively been established at the group level and rarely
at the individual level. We thus further investigated the individual-level comparability, with a larger
focus on predictors of incomparability, for g composites (Studies 4 and 5), and two types of broad
ability composites (Study 4). Analogous to previous studies, Study 4 compared composites from
different tests, while Study 5 used a new approach and compared composites within the same tests to
rule out between-test variability. Additionally, Study 5 examined ways to improve the interpretation of
g composites for individuals by using more accurate reliability estimates.
3. Research Questions
The aim of this dissertation is to integrate evidence from three analysis levels (i.e., the total
sample, subgroup, and individual level) to evaluate the validity of the interpretation of g and broad
ability composites and seek ways to improve validity. Table 1 illustrates the dissertation concept and
how the studies relate to it. The research questions (RQs) are listed below.
Table 1. Dissertation Concept: Structural and Convergent Validity Evidence at Three Analysis Levels
Total Sample Subgroup Individual
Structural Convergent Structural Convergent Structural Convergent
General Intelligence RQ1a: (1) (2) (3) RQ3: (4) (5) RQ2a: (2) RQ4: (4) (5) RQ5a: (4) (5) RQ6: (5)
Broad Abilities RQ1b: (1) (2) (3) RQ2b: (2) RQ5b: (4)
Note. The numbers refer to the studies included in the present dissertation: (1): Grieder & Grob, 2020; (2): Grieder et al., 2021; (3): Canivez et al., 2021; (4): Bünger et al., 2021; (5): Grieder et al., in press. RQ = research question.
3.1 Structural Validity Evidence
RQ1. Does structural validity evidence at the total sample level, based on the standardization
samples from the German and Dutch versions of the Intelligence and Development Scales–2 (IDS-2;
Studies 1 and 2) and from the German WISC-V (Study 3), support the interpretation of (a) g composites
and (b) broad ability composites?
RQ2. Does structural validity evidence at the level of subgroups that differ in age and sex
support the interpretation of (a) g composites and (b) broad ability composites from the German and
Dutch IDS-2 (Study 2)?
3.2 Convergent Validity Evidence
RQ3. Does convergent validity evidence at the total sample level support the interpretation of
g composites from multiple tests (Studies 4 and 5)?

VALIDITY OF INTELLIGENCE COMPOSITES 10
RQ4. Does convergent validity evidence at the level of subgroups differing in age,
bilingualism, IQ level (Studies 4 and 5), sex, and attention-deficit(/hyperactivity) disorder (AD[H]D)
diagnostic status (Study 5) support the interpretation of g composites from multiple tests?
RQ5. Does convergent validity evidence at the individual level support the interpretation of (a)
g composites and (b) broad ability composites from multiple tests (Studies 4 and 5)?
RQ6. How could the validity of the interpretation of g composites be improved (Study 5)?
4. Method
4.1 Studies and Samples
Study 1. This study included the standardization and validation sample of the German IDS-2
(Grob & Hagmann-von Arx, 2018a). Data on the intelligence domain (g and seven broad abilities) were
available for 1,991 participants aged between 5 and 20 years, and data on the intelligence and basic
skills domains (+ two broad abilities) were available for 1,741 participants aged between 7 and 20 years.
Study 2. This study included the standardization samples of the German and Dutch IDS-2
(Grob et al., 2018; Grob & Hagmann-von Arx, 2018a; final N = 1,405 and 1,423, respectively), with
participants aged between 7 and 20 years and 7 and 21 years, respectively.
Study 3. This study included the standardization sample of the German WISC-V (Wechsler,
2017; N = 1,087), with participants aged between 6 and 16 years.
Study 4. This study included the validation samples of the German IDS-2 and the German
version of the Stanford–Binet Intelligence Scales–Fifth Edition (SB5; Grob et al., 2019a; N = 383), with
participants aged between 4 and 20 years. Besides the IDS-2 and/or the SB5, participants were also
administered a subset of the German versions of other intelligence tests (see below).
Study 5. This study included the standardization samples of the German IDS-2, SB5, and
Reynolds Intellectual Assessment Scales (RIAS; Hagmann-von Arx & Grob, 2014; final N = 1,622,
1,829, and 2,145, respectively), with participants aged between 5 and 20 years, 4 and 83 years, and 3
and 99 years, respectively.
4.2 Measures
In the following, the relevant measures used in the five studies are briefly introduced. All these
measures are individually administered tests rendering multiple age-standardized subtest scores that are
integrated in multiple unit-weighted composites.
IDS-2. The German and Dutch IDS-2 assess cognitive (intelligence and executive functions)
and developmental (psychomotor skills, social-emotional skills, basic skills, and motivation and
attitude) functions with 30 subtests. The intelligence domain includes 14 subtests used to create three
different g composites—an Extended Battery IQ (EBIQ), a Full-Scale IQ (FSIQ), and an Abbreviated
Battery IQ (ABIQ)—as well as seven broad ability composites. The latter correspond to Gv, Gs,
auditory and visual-spatial Gwm (in the CHC model, these are differentiated at the level of narrow
abilities), Gf, Gc, and Glr (a combination of Gl and Gr, as in prior versions of the CHC model; Schneider
& McGrew, 2012). The basic skills domain includes four subtests, of which one corresponds to Gq, two

VALIDITY OF INTELLIGENCE COMPOSITES 11
correspond to Grw, and one contains aspects of Ga. Studies 1 and 2 included the 14 intelligence subtests
and the three basic skills subtests tapping Gq and Grw, Study 4 included the FSIQ and the Gf and Gc
composites, and Study 5 included the EBIQ, FSIQ, and ABIQ.
WISC-V. The German WISC-V assesses intelligence with 15 primary and secondary subtests
and postulates a g composite and five broad ability composites corresponding to Gc, Gv, Gf, Gwm, and
Gs.6 Study 3 included all 15 primary and secondary subtests.
SB5. The German SB5 assesses intelligence with 10 subtests used to create two g composites—
an FSIQ and an ABIQ—a verbal and a nonverbal intelligence index (VI and NVI, respectively), and
five broad ability composites corresponding to Gf, Gc, Gq, Gv, and Gwm. Study 4 included the FSIQ,
VI, and NVI, and Study 5 included the FSIQ and ABIQ.
RIAS. The German RIAS assesses intelligence with four subtests and memory with two
subtests. The four intelligence subtests are used to create a VI and an NVI (corresponding to Gc and
Gf, respectively), and two g composites—an FSIQ and an ABIQ. Study 4 included the FSIQ, VI, and
NVI, and Study 5 included the FSIQ and ABIQ.
Other Intelligence Tests. The following other tests are relevant for the present dissertation:
the German versions of the Snijders Oomen Nonverbal Intelligence Test 6–40 (SON-R 6-40; Tellegen
et al., 2012), the Wechsler Adult Intelligence Scale–Third Edition (WAIS-III; von Aster et al., 2006),
the Wechsler Intelligence Scale for Children–Fourth Edition (WISC-IV; Petermann & Petermann,
2011), and the Wechsler Preschool and Primary Scale of Intelligence–Third Edition (WPPSI-III;
Petermann, 2009). Of all these tests, Study 4 used the FSIQ and (if available) a VI and/or an NVI.
4.3 Statistical Analyses
Studies 1, 2, and 3. In these studies, we examined structural validity with factor-analytical
methods. We used EFA in Studies 1 and 3 and CFA in Studies 2 and 3. In all three studies, analyses
were performed at the total sample level, and in Study 2, additional measurement invariance analyses
were performed across language versions and sex with multiple group CFAs (e.g., Steenkamp &
Baumgartner, 1998), and across age with local structural equation modeling (Hildebrandt et al., 2009,
2016). Moreover, McDonald’s omegas (McDonald, 1985, 1999) were calculated for the total sample in
all three studies, and across language versions, sex, and age in Study 2.
Studies 4 and 5. In these studies, we examined convergent validity at the total sample,
subgroup, and individual level. While g composites (i.e., FSIQs), VIs, and NVIs from different tests
were compared in Study 4, different g composites of the same tests (i.e., EBIQ, FSIQ, and ABIQ) were
compared in Study 5. For the total sample-level analyses, we calculated mean differences and
correlations. For the individual-level analyses, we calculated intraindividual absolute differences in IQ
points and overlaps of CIs and nominal IQ categories. For the subgroup-level analyses, we performed
6 Note that the composites used in practice are created from subsets of these 15 subtests, namely, of the 10 primary subtests for the broad ability composites and of seven primary subtests for the g composite (the FSIQ).

VALIDITY OF INTELLIGENCE COMPOSITES 12
regression analyses to explore possible predictors of IQ differences, including age, bilingualism, IQ
level (i.e., below average, average, above average), sex, and AD(H)D diagnostic status.
5. Synopsis of Results
5.1 Structural Validity Evidence
The postulated factor structures for the German and Dutch IDS-2 (Studies 1 and 2) and for the
German WISC-V (Study 3) were partly supported. All studies supported a g factor. For the IDS-2, the
Gs and auditory and visual-spatial Gwm factors were confirmed in Studies 1 and 2, and the Gc and Glr
factors in Study 2. For the WISC-V, the Gc, Gwm, and Gs factors were confirmed. In all three studies,
however, the Gf and Gv factors were not separable. The intelligence and basic skills domains were also
not separable for the IDS-2 in Studies 1 and 2, resulting in an additional Grw factor and the subtest
Logical-Mathematical Reasoning loading on the collapsed Gf/Gv factor. Notably, the factor structure
identified in Study 2 was shown to be invariant across the German and Dutch IDS-2 versions.
Model-based reliability analyses revealed a strong g factor for all three tests (ωh > .75 for the g
composites) and weak broad ability factors (ωs < .50 for all broad ability composites, except the Gs
composite for the WISC-V). For some broad ability composites (especially Gf/Gv and Glr), the error
variance was even larger than the true score variance explained by the broad ability factor (1 – ωt > ωs).
Regarding subgroup-level analyses (Study 2), the factor structure identified for the German and
Dutch IDS-2 was also largely supported across sex and an age span of 7 to 20 years. McDonald’s
omegas varied somewhat across sex and age, but ωh was consistently above .75 for the g composites,
and ωs was below .50 for all broad ability composites, with the exception of auditory Gwm exceeding
.50 for females for the German IDS-2.
5.2 Convergent Validity Evidence
Despite high correlations and small mean differences in test scores at the total sample level, the
g composites, VIs, and NVIs from different intelligence tests (Study 4) and different g composites from
the same tests (Study 5) sometimes showed large score differences at the individual level. These
differences were predicted by IQ level (i.e., larger at the tails of the IQ distribution; Studies 4 and 5)
and age (i.e., larger for younger individuals; Study 5), or their interaction (Study 5), suggesting some
systematic differences in reliability and/or validity across subgroups that differ in these characteristics.
Even after taking measurement error into account by investigating the overlap of CIs, there was still
considerable incomparability. In Study 5, we therefore investigated if the use of more accurate
reliability coefficients for CIs could increase comparability. We found that this was indeed the case;
Comparability was substantially improved if 95% CIs based on test–retest reliabilities or age- and IQ-
level-specific internal consistencies instead of 95% CIs based on one overall internal consistency or
nominal IQs were used. However, these improvements came at the cost of precision, as the CIs were
often much larger because of lower reliabilities. Finally, results from Study 5 suggested that higher
numbers of highly g-loaded subtests and a greater overlap in subtest content might also increase
comparability of g composites.

VALIDITY OF INTELLIGENCE COMPOSITES 13
Table 2. Support (Yes) or Lack of Support (No) for the Interpretation of General Intelligence and Broad Ability Composites From Structural and Convergent Validity Evidence at Three Analysis Levels
Total Sample Subgroup Individual
Structural Convergent Structural Convergent Structural Convergent
General Intelligence RQ1a: Yes RQ3: Yes RQ2a: Yes RQ4: No RQ5a: No RQ6: Yes
Broad Abilities RQ1b: No RQ2b: No RQ5b: No
Note. RQ = research question.
6. General Discussion
6.1 Structural Validity Evidence
Structural validity evidence at the level of large, representative samples (Studies 1, 2, and 3) as
well as of relevant subgroups of the reference populations (Study 2) supports the interpretation of g
composites (see Table 2 for simplified answers to the RQs). In contrast, the little true score variance
due to the broad ability factors calls into question the utility of most broad ability composites, with the
possible exceptions of Gs and auditory Gwm. These findings are in line with previous studies on other
major intelligence tests that have also found evidence for a valid interpretation of g composites and
against one for most broad ability composites from a structural validity perspective (Canivez et al.,
2016, 2017, 2019; Canivez & Watkins, 2010; Canivez & Youngstrom, 2019; Cucina & Howardson,
2017; Dombrowski, 2014; Dombrowski, McGill, & Canivez, 2018; Fenollar-Cortés & Watkins, 2019;
Lecerf & Canivez, 2018; Nelson et al., 2013; Watkins, 2017; Watkins et al., 2018). These results speak
against the focus on broad ability composites and the de-emphasis of g composites proposed by CHC
theorists (e.g., Schneider & McGrew, 2018) and suggest a risk of misinterpretation of factor profiles.
Consequently, score interpretation for most contemporary intelligence tests—including those examined
in this dissertation—should focus mainly, if not exclusively, on the g composite.
The finding of collapsed Gv and Gf factors for the German and Dutch IDS-2 and the German
WISC-V is also in line with previous research on other major intelligence tests, including the U.S.,
U.K., Canadian, French, and Spanish WISC-V (Canivez et al., 2016, 2017, 2019; Fenollar-Cortés &
Watkins, 2019; Lecerf & Canivez, 2018; Watkins et al., 2018), the SB5 (Canivez, 2008; DiStefano &
Dombrowski, 2006), the Woodcock–Johnson III (WJ-III; Dombrowski, 2013), the Kaufman
Assessment Battery for Children–Second Edition (KABC-II; Keith & Reynolds, 2010; McGill, 2020),
and cross-battery assessments of the WJ-III with the Differential Ability Scales and with the KABC-II
(Keith & Reynolds, 2010). This collapse of Gv and Gf contradicts the CHC model, where these two are
defined as separate constructs. I discuss possible explanations for this finding and the usefulness of the
CHC model for further research and test development below.
6.2 Convergent Validity Evidence
Convergent validity evidence (Studies 4 and 5) at the total sample level supports the
interpretation of g composites, but subgroup- and individual-level evidence casts doubt on it. Results
on VIs and NVIs (corresponding to Gc and Gf for most, but not all tests; Study 4) suggest that it is

VALIDITY OF INTELLIGENCE COMPOSITES 14
similar for broad ability composites. This is in line with results from previous studies investigating
individual-level convergent validity that also speak against the interpretation of exact scores, and even
traditional 90% and 95% CIs, for g and broad ability composites (Floyd et al., 2005, 2008; Hagmann-
von Arx et al., 2018). Broad ability and g composites from different tests, and g composites from the
same test, are thus not necessarily exchangeable for individuals, even if they are highly correlated at
the group level. Consequently, individual interpretation of exact scores should be avoided, and CIs
should be interpreted instead. Moreover, for high-stakes decisions, at least two tests should be used that
are selected and interpreted in light of individual testee characteristics and test content (see below).
The fact that satisfactory score comparability at the individual level was not achieved even after
controlling for measurement error by comparing CIs suggests that either the reliability estimates used
did not sufficiently capture measurement error and/or at least some of the test scores did not provide
valid estimates of the construct they purportedly measured. Our results suggest that both may be the
case. The use of one overall internal consistency coefficient for CIs misses certain kinds of measurement
error (Schmidt et al., 2003) and does not consider that measurement error varies with certain individual
characteristics, such as age and IQ level. Therefore, CIs based on this overall reliability estimate are too
small for many individuals, and they get wider and comparability thus increases if more accurate
reliability coefficients (e.g., test–retest reliability or the coefficient of equivalence and stability;
Cronbach, 1947; Schmidt et al., 2003; or at least age- and IQ-level-specific internal consistencies) are
used (Study 5). Consequently, these more accurate CIs should be interpreted in practice. Test developers
should provide and promote such CIs for interpretation in future tests and update CIs for existing tests
accordingly. Especially for tests using a digital scoring program, more appropriate CIs that are
conditional on individual characteristics of the testee could easily be implemented.
Besides inappropriate reliability estimates, overlap in subtest content, g loadings, and the
number of subtests likely also influenced individual-level score comparability. These aspects have also
been shown to affect the accuracy of g factors (Farmer et al., 2020; Floyd et al., 2009; Major et al.,
2011). Consequently, g composites should consist of a sufficient number of subtests of heterogeneous
content and with high g factor loadings to achieve psychometrically sound estimates of g (Farmer et al.,
2020; Jensen & Weng, 1994; Major et al., 2011). Composites of two or three subtests are likely not
accurate enough and should not even be used for screening purposes (Study 5, Farmer et al., 2020).
Four subtests might be enough, but accuracy seems to increase up to 12 to 13 subtests (Farmer et al.,
2020). More important than the sheer number of subtests, however, is adequate and diverse content
sampling (Farmer et al., 2020; Floyd et al., 2009; Major et al., 2011). I further discuss possible reasons
for the variability and limited comparability of g composites and g factors below.
6.3 Future Directions for Intelligence Assessment
Although a focus on the g composite and on more accurate CIs is recommended as an immediate
practical remedy for the highlighted problems in existing intelligence tests, the long-term goal must be
to tackle the validity issues revealed in the present dissertation and related research by creating more

VALIDITY OF INTELLIGENCE COMPOSITES 15
reliable and valid intelligence measures. To discuss how this could be achieved, I would like to fall
back on two stances in philosophy of science that differ in how they define the ultimate goals of science
and in the implications for how measures should be designed so that they are valid for these goals,
namely, realism and instrumentalism.
Scientific realism refers to the view that there are entities in the world that exist independent of
one’s thoughts, language, or point of view and that it is a goal of science to understand and describe
these real entities (Godfrey-Smith, 2003). In contrast, instrumentalism holds that the purpose of science
is not to describe the hidden structures responsible for patterns of observations, as one can never be sure
to have accurately described the actual world and causal structures, but to predict observations. In this
view, it is not important whether an entity really exists in the real world, as long as it is useful for
describing observations (Godfrey-Smith, 2003). Historically, these opposing views have influenced
scientific inquiries in different fields within and outside psychology, including intelligence research.
For example, Spearman held a realist view of intelligence and devoted much of his research to the
nature of intelligence, while Thurstone held an instrumentalist view and thought that a construct (such
as his primary mental abilities) should be useful to summarize and describe observations, and not
necessarily be part of the real world (Beaujean, 2019).
Yarkoni and Westfall (2017) resume this distinction in the form of explanation (compatible
with a realist stance) versus prediction (compatible with an instrumentalist stance). The common view
is that theories and models that help explain the processes underlying a behavior will also lead to better
predictions of future behavior. However, this is not necessarily the case (Yarkoni & Westfall, 2017).
Especially in psychology, where we study complex cognitive, emotional, and behavioral phenomena,
the causal processes underlying these phenomena might never be fully understood using models that
are comprehensible to humans. Scientists thus have to choose between explaining some processes
underlying the outcome—at the cost of limited predictive value—and accurately predicting outcomes
of interest—at the cost of limited explanatory value. In the following, I discuss the relevance of these
two stances or goals for the future of intelligence assessment.
Realist View. First, I focus on the realist stance and on the goal of explaining behavior. This is
the major goal that most research in psychology, including intelligence research, has been and still is
pursuing. We pursue this goal, for example, when we look for neurological or cognitive processes
underlying intelligence, or when we test which structural model best fits intelligence test data. Hence,
the construct of intelligence is typically interpreted in a realist sense. In this case, however, we have to
rethink our definition of validity. Borsboom et al. (2004) argue that, if we accept a realist stance, a
measure is valid if and only if (a) the construct it intends to measure exists in the real world and (b)
variations in this construct causally produce variations in the measurement outcome. They explicitly
reject validity definitions such as the one adopted in this dissertation (i.e., an evaluative judgment
regarding score interpretation; AERA et al., 2014; Messick, 1989) and instead view validity as a
property of the test. Validation should thus be concerned with providing evidence for points (a) and (b)

VALIDITY OF INTELLIGENCE COMPOSITES 16
introduced above, which is mainly achieved by substantive theory. If we adopt a strict realist view,
empirical evidence such as that presented in this dissertation, and in most of intelligence research so
far, is not useful to establish validity (Borsboom et al., 2004).
Instead, validation should start from the question: Are g and the broad abilities reflective
constructs (i.e., entities that exist in the real world)? As Borsboom et al. (2004) argue, the answer to
this question requires substantive theories with narrow, process-based definitions of the constructs to
measure that can guide the development of tasks to measure them (cf. Beaujean & Benson, 2019). The
CHC model that is widely referred to for test construction (Schneider & McGrew, 2018) likely cannot
live up to this, as it is a framework largely developed with factor analysis (which is inappropriate
validity evidence according to Borsboom et al., 2004) and because it provides only verbal (as opposed
to technical/mathematical) definitions of the constructs that are not narrow enough to guide test
construction and that are not sufficiently linked to (neurocognitive) processes (Beaujean & Benson,
2019; Wasserman, 2019). Instead, research on neural correlates and cognitive processes underlying g
and the broad abilities could help clarify their status as real constructs.
Neural correlates identified for g include, for example, brain volume, cortical thickness, and
white matter tract integrity (Colom et al., 2006, 2010; Gignac et al., 2003; Haier et al., 2004; McDaniel,
2005; Schubert & Frischkorn, 2020). Jung and Haier (2007) integrated such evidence and developed
the parieto-frontal integration theory (P-FIT) that states that both structural components of a network
of specific frontal and parietal brain regions and more efficient communication between these regions
provide a neurobiological foundation for g (but also for Gf and Gwm). Cognitive processes underlying
g have also been studied, with attention or executive control processes (Burgoyne & Engle, 2020;
Kovacs & Conway, 2016) and higher-order information processing speed (Schubert et al., 2017) as
promising candidates for explaining interindividual differences in g. Linking evidence on cognitive
processes and neural correlates, Schubert and Frischkorn (2020) proposed a model where (in line with
the P-FIT) differences in brain structure give rise to differences in network structures, which in turn
give rise to differences in the speed of higher-order information processing and evidence accumulation
as a basis for g differences. These are all promising avenues for a deeper understanding of the
neurocognitive processes underlying g.
Evidence for the processes underlying broad abilities is less extensive. A few studies suggest
that there might be some brain correlates that are unique to certain broad abilities (Colom et al., 2013;
Johnson et al., 2008; Tang et al., 2010), but part of the evidence is weak (Tang et al., 2010) and others
found no correlates independent of g (Karama et al., 2011). Hence, the neurocognitive roots of most
broad abilities are weak (Wasserman, 2019) and clearly more research is needed in this area.
This kind of research brings us closer to the process-based understanding of g and the broad
abilities needed to establish them as reflective constructs, but there are still some issues that need to be
addressed. First, most of the evidence reviewed above is correlational and thus cannot reveal the causal
processes involved in task performance (as Borsboom et al.’s, 2004, definition of validity requires). To

VALIDITY OF INTELLIGENCE COMPOSITES 17
this end, experimental research is needed. Second (and relatedly), there seems to be a substantial overlap
in the processes involved in g, Gf, Gwm, and executive function tasks (e.g., Colom et al., 2010; Kovacs
& Conway, 2016; Schubert & Frischkorn, 2020), and more research is needed on the separability of
these constructs. And third, although all these findings are consistent with an interpretation of g as a
reflective construct in a realist sense (i.e., a unitary process or set of processes that causally influence
performance in all cognitive tasks and lead to the positive manifold), they are also consistent with an
interpretation of g as a formative construct (i.e., a consequence rather than the cause of the positive
manifold). If the latter were true, however, what would then cause the positive manifold?
Two theories that provide possible answers to this question are the mutualism model by van der
Maas et al. (2006) and process overlap theory by Kovacs and Conway (2016, 2019). The mutualism
model explains the positive manifold with positive reciprocal interactions between initially independent
cognitive processes during development. Process overlap theory explains it with overlapping subsets of
a small set of domain-general executive processes that are tapped by cognitive tasks (but not necessarily
the same subset is tapped by every task). Both theories are mathematically formalized and can explain
many findings in intelligence research, such as age and ability differentiation, the Flynn effect, and the
worst performance rule (Kovacs & Conway, 2016; van der Maas et al., 2006). Conceptualizing g as a
formative variable also explains why g composites (Studies 4 and 5, Floyd et al., 2008; Hagmann-von
Arx et al., 2018), g factors (Farmer et al., 2020; Floyd et al., 2009; Major et al., 2011), and even neural
correlates (Haier et al., 2009) sometimes vary considerably between different tests. If g were reflective,
subtests that tap g should be interchangeable to a large degree and still result in comparable g factors.
If it were formative, however, subtest content would have a greater influence on the resulting g factors
in that it determines which domain-general executive processes are tapped. Consequently, the more
diverse the subtests included in a g composite, the more likely it is that many of these domain-general
executive processes are tapped and thus the more comparable the g composites are.
The two theories are not necessarily mutually exclusive, and neither has been falsified yet, but
process overlap theory has more support from neurobiology and cognitive psychology, and it can also
explain the high interrelations between g, Gf, Gwm, and executive functions (Kovacs & Conway, 2016).
It might also explain the common finding of Gf and Gv not being separable in hierarchical intelligence
models where Gf is measured exclusively with visual-spatial tasks (e.g., Studies 1, 2, and 3,
Dombrowski, 2013; Keith & Reynolds, 2010; McGill, 2020). Typical Gf tasks, such as matrices, largely
tap domain-general executive processes (Kovacs & Conway, 2016) and additionally some visual
processes, while Gv tasks tap mainly visual processes but also some domain-general executive
processes.
Hence, both theories support the criticism put forth by Cattell–Horn and CHC theorists that g
is not a construct in a realist sense. However, some broad abilities could be, and Kovacs and Conway
(2019) argue that interpretation and research should focus on these. Although little is known about the
neurocognitive processes underlying most broad abilities, preliminary evidence suggests that the neural
VALIDITY OF INTELLIGENCE COMPOSITES 18
correlates of some broad abilities overlap more strongly across tests than those for g (Haier et al., 2009).
Thus, a realist interpretation might more likely be justified for broad abilities. Before their potential can
be further explored, however, they need to be measured more accurately.
To achieve this, we have to challenge the notion of intelligence as hierarchically structured, as
this precludes a satisfactory measure of both g and broad abilities. Because subtests need to be indicators
of both, the minimal threshold of 50% (preferably 75%) true score variance (Reise et al., 2013) cannot
be achieved for both g and broad ability composites in any test, even if measurement error is minimal.
Consequently, we should try to measure g and the broad abilities as independently of each other as
possible to maximize the true score variance for all of them (Beaujean & Benson, 2019; Luecht et al.,
2006). This only makes sense, of course, if we understand g and the broad abilities as independent
components of intelligence (i.e., a bifactor conception of intelligence, as adopted by Spearman or
Carroll: see Beaujean, 2015, 2019). This conception has also been suggested as a more reasonable
alternative to a higher-order conception (e.g., Gignac, 2008) because a realist interpretation of higher-
order factors is problematic and because there is no evidence or reasonable argument for why the
influence of g on task performance should be fully mediated by the broad abilities (Gignac, 2008).
Thus, we should try to come up with more distinct definitions and purer measures of g and
broad abilities. Given previous findings, I would predict that, in doing so, a separation of what we now
call g and Gf would become less and less evident. The two are usually highly, and often even perfectly,
correlated (Kan et al., 2011; Kovacs & Conway, 2016; Matzke et al., 2010). Even their verbal
definitions are highly overlapping ([abstract] reasoning, solving [novel] problems, independence from
prior knowledge; Gottfredson, 1997a; Schneider & McGrew, 2018). Process overlap theory offers an
explanation of these findings in that Gf most purely measures the domain-general executive processes
that give rise to the positive manifold, rendering it a good candidate for what we actually aspire to
measure with g composites (see also Reynolds, 2013). Future studies should therefore explore if Gf
could be measured more diversely (e.g., also with verbal analogies instead of only with visual tasks)
and test the psychometric properties and usefulness of such diverse Gf measures compared to traditional
g measures. Such Gf measures might also enable a better separation of Gf and Gv, and they could more
likely be interpreted in a realist sense compared to g composites (Kovacs & Conway, 2019).
To conclude, from a realist stance, the validity of neither g nor broad ability composites has
been sufficiently established to date. Furthermore, if we accept a formative interpretation of g, its
measures can never be valid in a realist sense (Borsboom et al., 2004). However, if we approach the
study of intelligence from a strict realist view only, then it is likely that we have a long way to go until
we arrive at valid intelligence assessments (if valid assessments in this sense can be achieved at all for
any but the narrowest psychological constructs; cf. Yarkoni & Westfall, 2017). Does this mean we
should stop using intelligence tests? I would argue that it does not, if we adopt an instrumentalist stance.
Instrumentalist View. In an instrumentalist view, where constructs are judged according to
their usefulness in predicting real-world outcomes, the definition of validity adopted in the present
VALIDITY OF INTELLIGENCE COMPOSITES 19
dissertation is valid, and validity evidence as presented in the included studies is important to determine
the usefulness of a measure. There are good reasons to believe that, despite an incomplete understanding
of the processes underlying intelligence test performance, intelligence tests can still be useful, namely,
to predict real-world behavior and external criteria. After all, this was also the goal with which the first
intelligence test—the Binet–Simon (1905)—was developed, and with which current intelligence tests
are usually applied in practice.
The extensive external validity evidence alluded to in the Introduction (e.g., Gottfredson &
Deary, 2004; Roth et al., 2015; Schmidt & Hunter, 2004) supports the usefulness of current g
composites, while current broad ability composites have been shown to demonstrate little diagnostic
and treatment utility (McGill et al., 2018) and little incremental external validity for academic
achievement (e.g., Canivez et al., 2014; Freberg et al., 2008; Nelson et al., 2013; Youngstrom et al.,
1999), although there is some evidence that they could be useful for gifted individuals (e.g., Breit &
Preckel, 2020). These findings support conclusions from the structural and convergent validity evidence
presented in this dissertation and in related research and suggest that, from an instrumentalist view and
for current intelligence tests, it is usually best to focus on the interpretation of g composites.
For future test construction, in this view, we should try to further enhance predictive validity
by developing and selecting indicators based on their ability to out-of-sample predict outcomes we are
interested in (cf. Yarkoni & Westfall, 2017). Proceeding this way, future studies could use machine
learning techniques (see Kuhn & Johnson, 2013, for an introduction) to find models that maximize
predictive power for individual life outcomes. These could be any variables we are interested in, for
example, indicators of academic, occupational, or treatment success. Characteristics that define relevant
subgroups of the reference population, such as sex, age, and skills in the test language, could also be
included as predictors in the model, as could any other variables that are relevant for the outcome of
interest. As a consequence, practitioners would no longer interpret test scores directly, but rather
predicted outcomes. This would reduce their burden, as they would no longer have to choose between
the many scores provided by contemporary intelligence tests for interpretation (see the example of the
WISC-V above, with over 40 different scores), and likely lead to better diagnostic and treatment
decisions (Canivez, 2013; Dawes et al., 1989; Meehl, 1954; see Grove et al., 2000, for a meta-analysis).
With this approach, we would not learn much about the causal processes leading to test
outcomes (see Borsboom et al., 2004) but would instead focus on a test’s predictive value or utility.
Similarly, theories would be developed and judged not on the basis of their (seeming) explanatory value
but on their ability to accurately predict future outcomes. Disadvantages of this approach include the
risk of introducing social biases into the model (O’Neil, 2016) and the large sample sizes and amounts
of data needed to develop and validate the complex machine learning models often required to obtain
accurate out-of-sample predictions. Still, given the chances for better decision making in practice and
the prospects for a better understanding of the determinants of real-life outcomes (Yarkoni & Westfall,
2017), such an approach could well be worthwhile to pursue.

VALIDITY OF INTELLIGENCE COMPOSITES 20
Summary. In sum, we have to decide on the goals we want to pursue with intelligence
assessment in the long run so that we can design and apply measures that are valid for these purposes.
If our goal is to learn more about the causal processes underlying intelligence test outcomes (i.e., to
maximize verisimilitude), we should aim for more process-based measures, for example, using a
neurocognitive psychometrics approach (Schubert & Frischkorn, 2020). In this vein, we should
probably also abandon g in favor of Gf, as the latter might be more likely to be interpreted in a realist
sense than the former. If, on the other hand, our goal is to maximize the practical utility of intelligence
tests (i.e., to maximize predictive validity), we should select and design tasks that are most predictive
for the real-world outcomes we are interested in and combine these with other sources of information
in statistical models, the outcomes of which practitioners can use for better-informed decisions.
There have been attempts at combining the two goals in test construction, for example,
automatic item generation (Gierl & Haladyna, 2013), or the Cognitive Assessment System–Second
Edition (Naglieri et al., 2014) guided by PASS theory. However, it is arguably difficult to optimize both
goals at the same time. The more narrowly defined and process based the constructs are, the more likely
they are to be interpretable in a realist sense, but the less predictive their measures usually are for real-
world outcomes (Yarkoni & Westfall, 2017). On the other hand, if predictive validity is maximized, we
likely learn little about the underlying cognitive processes, and the test scores are not interpretable in a
realist sense. I would therefore argue that the best avenue for future intelligence assessment is to focus
on one goal at a time to arrive at more valid intelligence score interpretations for both of these purposes.
6.4 Conclusion
This dissertation integrates validity evidence for intelligence test score interpretations from
different analysis levels—from the total sample through the subgroup to the individual level—that has
immediate practical implications. It provides further support for the validity of the interpretation of g
composites—but only if they are based on a sufficient number of diverse and highly g-loaded subtests,
and only if appropriate 95% CIs are used—and does not find support for the validity of the interpretation
of most broad ability composites from concurrent intelligence tests. Individual-level results also suggest
that intelligence test scores are not as interchangeable as is often assumed and that subtest content might
have a larger influence on composites than previously thought. In the long run, we should thus create
intelligence assessments in a way that ensures valid test score interpretations for individuals. I argue
that to achieve this, we should tailor the construction of intelligence tests to the goal we want to achieve
with them, that is, either to get a more basic understanding of the cognitive processes underlying test
performance or to optimize the prediction of real-world outcomes and diagnostic and treatment
decisions. Psychometric models such as the CHC model will probably not be sufficient to achieve any
of these goals. Instead, we will likely have to abandon hierarchical measures of intelligence altogether
and create more distinctive measures of g (or, for the former goal, Gf) and broad abilities. Ultimately,
more separable tasks are important for both the study of underlying processes and potential incremental
validity for real-world outcomes.

VALIDITY OF INTELLIGENCE COMPOSITES 21
7. References
Alfonso, V. C., Flanagan, D. P., & Radwan, S. (2005). The impact of the Cattell-Horn-Carroll theory
on test development and interpretation of cognitive and academic abilities. In D. P. Flanagan &
P. L. Harrison (Eds.), Contemporary intellectual assessment: Theories, tests, and issues (2nd
ed., pp. 185–202). Guilford Press.
American Educational Research Association, American Psychological Association, & National Council
on Measurement in Education. (2014). Standards for educational and psychological testing.
American Educational Research Association.
Aspara, J., Wittkowski, K., & Luo, X. (2018). Types of intelligence predict likelihood to get married
and stay married: Large-scale empirical evidence for evolutionary theory. Personality and
Individual Differences, 122, 1–6. https://doi.org/10.1016/j.paid.2017.09.028
Beaujean, A. A. (2015). John Carroll’s views on intelligence: Bi-factor vs. higher-order models. Journal
of Intelligence, 3(4), 121–136. https://doi.org/10.3390/jintelligence3040121
Beaujean, A. A. (2019). General and specific intelligence attributes in the two-factor theory: A historical
review. In D. J. McFarland (Ed.), General and specific mental abilities (pp. 25–58). Cambridge
Scholars Publishing.
Beaujean, A. A., & Benson, N. F. (2019). Theoretically-consistent cognitive ability test development
and score interpretation. Contemporary School Psychology, 23, 126–137.
https://doi.org/10.1007/s40688-018-0182-1
Binet, A., & Simon, T. (1905). Méthodes nouvelles pour le diagnostic du niveau intellectuel des
anormaux. [New methods for the diagnosis of the intellectual level of subnormals]. L’Année
Psychologique, 11, 191–244. https://doi.org/10.3406/psy.1904.3675
Binet, A., & Simon, T. (1907). Le développement de l’intelligence chez les enfants. [The development
of intelligence in children]. L’Année Psychologique, 14, 1–94. https://doi.org/10.3406/
psy.1907.3737
Borkenau, P., & Ostendorf, F. (1998). The Big Five as states: How useful is the five-factor model to
describe intraindividual variations over time? Journal of Research in Personality, 32(2), 202–
221. https://doi.org/10.1006/jrpe.1997.2206
Borsboom, D., Mellenbergh, G. J., & Van Heerden, J. (2004). The concept of validity. Psychological
Review, 111(4), 1061–1071. https://doi.org/10.1037/0033-295X.111.4.1061
Breit, M., & Preckel, F. (2020). Incremental validity of specific cognitive abilities beyond general
intelligence for the explanation of students’ school achievement. Gifted and Talented
International. Advance online publication. https://doi.org/10.1080/15332276.2020.1799454
Brown, K. G., Le, H., & Schmidt, F. L. (2006). Specific aptitude theory revisited: Is there incremental
validity for training performance? International Journal of Selection and Assessment, 14(2),
87–100. https://doi.org/10.1111/j.1468-2389.2006.00336.x
Bünger, A., Grieder, S., Schweizer, F., & Grob, A. (2021). The comparability of intelligence test results:

VALIDITY OF INTELLIGENCE COMPOSITES 22
Group- and individual-level comparisons of seven intelligence tests. Manuscript submitted for
publication.
Burgoyne, A. P., & Engle, R. W. (2020). Attention control: A cornerstone of higher-order cognition.
Current Directions in Psychological Science, 29(6), 624–630. https://doi.org/10.1177/
0963721420969371
Calvin, C. M., Deary, I. J., Fenton, C., Roberts, B. A., Der, G., Leckenby, N., & Batty, G. D. (2010).
Intelligence in youth and all-cause-mortality: Systematic review with meta-analysis.
International Journal of Epidemiology, 40(3), 626–644. https://doi.org/10.1093/ije/dyq190
Canivez, G. L. (2008). Orthogonal higher order factor structure of the Stanford–Binet Intelligence
Scales–Fifth Edition for children and adolescents. School Psychology Quarterly, 23(4), 533–
541. https://doi.org/10.1037/a0012884
Canivez, G. L. (2013). Psychometric versus actuarial interpretation of intelligence and related aptitude
batteries. In D. H. Saklofske, C. R. Reynolds, & V. L. Schwean (Eds.), Oxford library of
psychology. The Oxford handbook of child psychological assessment (pp. 84–112). Oxford
University Press.
Canivez, G. L., Grieder, S., & Bünger, A. (2021). Construct validity of the German Wechsler
Intelligence Scale for Children–Fifth Edition: Exploratory and confirmatory factor analyses of
the 15 primary and secondary subtests. Assessment, 28(2), 327–352. https://doi.org/10.1177/
1073191120936330
Canivez, G. L., McGill, R. J., & Dombrowski, S. C. (2020). Factor structure of the Differential Ability
Scales–Second Edition core subtests: Standardization sample confirmatory factor analyses.
Journal of Psychoeducational Assessment, 38(7), 791–815. https://doi.org/10.1177/
0734282920914792
Canivez, G. L., & Watkins, M. W. (2010). Investigation of the factor structure of the Wechsler Adult
Intelligence Scale–Fourth Edition (WAIS-IV): Exploratory and higher order factor analyses.
Psychological Assessment, 22(4), 827–836. https://doi.org/10.1037/a0020429
Canivez, G. L., Watkins, M. W., & Dombrowski, S. C. (2016). Factor structure of the Wechsler
Intelligence Scale for Children–Fifth Edition: Exploratory factor analyses with the 16 primary
and secondary subtests. Psychological Assessment, 28(8), 975–986. https://doi.org/10.1037/
pas0000238
Canivez, G. L., Watkins, M. W., & Dombrowski, S. C. (2017). Structural validity of the Wechsler
Intelligence Scale for Children–Fifth Edition: Confirmatory factor analyses with the 16 primary
and secondary subtests. Psychological Assessment, 29(4), 458–472. https://doi.org/10.1037/
pas0000358
Canivez, G. L., Watkins, M. W., James, T., Good, R., & James, K. (2014). Incremental validity of
WISC–IVUK factor index scores with a referred Irish sample: Predicting performance on the
WIAT–IIUK. British Journal of Educational Psychology, 84(4), 667–684. https://doi.org/

VALIDITY OF INTELLIGENCE COMPOSITES 23
10.1111/bjep.12056
Canivez, G. L., Watkins, M. W., & McGill, R. J. (2019). Construct validity of the Wechsler Intelligence
Scale For Children – Fifth UK Edition: Exploratory and confirmatory factor analyses of the 16
primary and secondary subtests. British Journal of Educational Psychology, 89(2), 195–224.
https://doi.org/10.1111/bjep.12230
Canivez, G. L., & Youngstrom, E. A. (2019). Challenges to the Cattell–Horn–Carroll theory: Empirical,
clinical, and policy implications. Applied Measurement in Education, 32(3), 232–248.
https://doi.org/10.1080/08957347.2019.1619562
Carman, C. A. (2013). Comparing apples and oranges: Fifteen years of definitions of giftedness in
research. Journal of Advanced Academics, 24(1), 52–70. https://doi.org/10.1177/
1932202X12472602
Carroll, J. B. (1993). Human cognitive abilities: A survey of factor-analytic studies. Cambridge
University Press.
Cattell, R. B. (1941). Some theoretical issues in adult intelligence testing. Psychological Bulletin, 38,
592.
Cattell, R. B. (1963). Theory of fluid and crystallized intelligence: A critical experiment. Journal of
Educational Psychology, 54(1), 1–22. https://doi.org/10.1037/h0046743
Colom, R., Burgaleta, M., Román, F. J., Karama, S., Álvarez-Linera, J., Abad, F. J., Martínez, K.,
Quiroga, M. Á., & Haier, R. J. (2013). Neuroanatomic overlap between intelligence and
cognitive factors: Morphometry methods provide support for the key role of the frontal lobes.
NeuroImage, 72, 143–152. https://doi.org/10.1016/j.neuroimage.2013.01.032
Colom, R., Jung, R. E., & Haier, R. J. (2006). Distributed brain sites for the g-factor of intelligence.
NeuroImage, 31(3), 1359–1365. https://doi.org/10.1016/j.neuroimage.2006.01.006
Colom, R., Karama, S., Jung, R. E., & Haier, R. J. (2010). Human intelligence and brain networks.
Dialogues in Clinical Neuroscience, 12(4), 489–501. https://doi.org/10.31887/
DCNS.2010.12.4/rcolom
Cronbach, L. J. (1947). Test reliability: Its meaning and determination. Psychometrika, 12, 1–16.
https://doi.org/10.1007/BF02289289
Cucina, J. M., & Byle, K. (2017). The bifactor model fits better than the higher-order model in more
than 90% of comparisons for mental abilities test batteries. Journal of Intelligence, 5(3), Article
27. https://doi.org/10.3390/jintelligence5030027
Cucina, J. M., & Howardson, G. N. (2017). Woodcock–Johnson–III, Kaufman Adolescent and Adult
Intelligence Test (KAIT), Kaufman Assessment Battery for Children (KABC), and Differential
Ability Scales (DAS) support Carroll but not Cattell–Horn. Psychological Assessment, 29(8),
1001–1015. https://doi.org/10.1037/pas0000389
Das, J. P., Naglieri, J. A., & Kirby, J. R. (1994). Assessment of cognitive processes: The PASS theory
of intelligence. Allyn & Bacon.

VALIDITY OF INTELLIGENCE COMPOSITES 24
Dawes, R. M., Faust, D., & Meehl, P. E. (1989). Clinical versus actuarial judgment. Science, 243(4899),
1668–1674. https://doi.org/10.1126/science.2648573
Deary, I. J. (2014). The stability of intelligence from childhood to old age. Current Directions in
Psychological Science, 23(4), 239–245. https://doi.org/10.1177/0963721414536905
Deary, I. J., Batty, G. D., & Gale, C. R. (2008a). Bright children become enlightened adults.
Psychological Science, 19(1), 1–6. https://doi.org/10.1111/j.1467-9280.2008.02036.x
Deary, I. J., Batty, G. D., & Gale, C. R. (2008b). Childhood intelligence predicts voter turnout, voting
preferences, and political involvement in adulthood: The 1970 British Cohort Study.
Intelligence, 36(6), 548–555. https://doi.org/10.1016/j.intell.2008.09.001
Deary, I. J., Strand, S., Smith, P., & Fernandes, C. (2007). Intelligence and educational achievement.
Intelligence, 35(1), 13–21. https://doi.org/10.1016/j.intell.2006.02.001
Diagnostik- und Testkuratorium. (2018). TBS-DTK. Testbeurteilungssystem des Diagnostik- und
Testkuratoriums der Föderation Deutscher Psychologenvereinigungen. Revidierte Fassung
vom 03. Jan. 2018. [Test assessment system of the Diagnostic and Test Board of Trustees of
the Federation of German Psychological Associations. Revised version of Jan. 03, 2018].
Psychologische Rundschau, 69(2), 109–116. https://doi.org/10.1026/0033-3042/a000401
DiStefano, C., & Dombrowski, S. C. (2006). Investigating the theoretical structure of the Stanford-
Binet. Journal of Psychoeducational Assessment, 24(2), 123–136. https://doi.org/10.1177/
0734282905285244
Dombrowski, S. C. (2013). Investigating the structure of the WJ-III Cognitive at school age. School
Psychology Quarterly, 28(2), 154–169. https://doi.org/10.1037/spq0000010
Dombrowski, S. C. (2014). Investigating the structure of the WJ-III Cognitive in early school age
through two exploratory bifactor analysis procedures. Journal of Psychoeducational
Assessment, 32(6), 483–494. https://doi.org/10.1177/0734282914530838
Dombrowski, S. C., Beaujean, A. A., McGill, R. J., & Benson, N. F. (2018). The Woodcock–Johnson
IV Tests of Achievement provides too many scores for clinical interpretation. Journal of
Psychoeducational Assessment, 37(7), 819–836. https://doi.org/10.1177/0734282918800745
Dombrowski, S. C., McGill, R. J., & Canivez, G. L. (2018). Hierarchical exploratory factor analyses of
the Woodcock–Johnson IV Full Test Battery: Implications for CHC application in school
psychology. School Psychology Quarterly, 33(2), 235–250. https://doi.org/10.1037/
spq0000221
Evers, A., Muñiz, J., Bartram, D., Boben, D., Egeland, J., Fernández-Hermida, J. R., Frans, Ö.,
Gintiliené, G., Hagemeister, C., Halama, P., Iliescu, D., Jaworowska, A., Jiménez, P.,
Manthouli, M., Matesic, K., Schittekatte, M., Sümer, H. C., & Urbánek, T. (2012). Testing
practices in the 21st century. European Psychologist, 17(4), 300–319. https://doi.org/10.1027/
1016-9040/a000102
Farmer, R., Floyd, R., Berlin, K. S., & Reynolds, M. (2020). How can general intelligence composites

VALIDITY OF INTELLIGENCE COMPOSITES 25
more accurately index psychometric g and what might be good enough? Contemporary School
Psychology, 24, 52–67. https://doi.org/10.1007/s40688-019-00244-1
Fenollar-Cortés, J., & Watkins, M. W. (2019). Construct validity of the Spanish version of the Wechsler
Intelligence Scale for Children Fifth Edition (WISC-VSpain). International Journal of School &
Educational Psychology, 7(3), 150–164. https://doi.org/10.1080/21683603.2017.1414006
Floyd, R. G., Bergeron, R., McCormack, A. C., Anderson, J. L., & Hargrove-Owens, G. L. (2005). Are
Cattell–Horn–Carroll broad ability composite scores exchangeable across batteries? School
Psychology Review, 34(3), 329–357. https://doi.org/10.1080/02796015.2005.12086290
Floyd, R. G., Clark, M. H., & Shadish, W. R. (2008). The exchangeability of IQs: Implications for
professional psychology. Professional Psychology: Research and Practice, 39(4), 414–423.
https://doi.org/10.1037/0735-7028.39.4.414
Floyd, R. G., Shands, E. I., Rafael, F. A., Bergeron, R., & McGrew, K. S. (2009). The dependability of
general-factor loadings: The effects of factor-extraction methods, test battery composition, test
battery size, and their interactions. Intelligence, 37(5), 453–465. https://doi.org/10.1016/
j.intell.2009.05.003
Frazier, T. W., & Youngstrom, E. A. (2007). Historical increase in the number of factors measured by
commercial tests of cognitive ability: Are we overfactoring? Intelligence, 35(2), 169–182.
https://doi.org/10.1016/j.intell.2006.07.002
Freberg, M. E., Vandiver, B. J., Watkins, M. W., & Canivez, G. L. (2008). Significant factor score
variability and the validity of the WISC-III Full Scale IQ in predicting later academic
achievement. Applied Neuropsychology, 15(2), 131–139. https://doi.org/10.1080/
09084280802084010
Geisinger, K. F., Bracken, B. A., Carlson, J. F., Hansen, J.-I. C., Kuncel, N. R., Reise, S. P., &
Rodriguez, M. C. (Eds.). (2013). APA handbook of testing and assessment in psychology, Vol.
3: Testing and assessment in school psychology and education. American Psychological
Association.
Gierl, M. J., & Haladyna, T. M. (Eds.). (2013). Automatic item generation: Theory and practice.
Routledge.
Gignac, G. E. (2008). Higher-order models versus direct hierarchical models: g as superordinate or
breadth factor? Psychology Science Quarterly, 50(1), 21–43.
Gignac, G. E. (2014). On the inappropriateness of using items to calculate total scale score reliability
via coefficient alpha for multidimensional scales. European Journal of Psychological
Assessment, 30(2), 130–139. https://doi.org/10.1027/1015-5759/a000181
Gignac, G. E., Vernon, P. A., & Wickett, J. C. (2003). Factors influencing the relationship between
brain size and intelligence. In H. Nyborg (Ed.), The scientific study of general intelligence:
Tribute to Arthur R. Jensen (pp. 93–106). Elsevier.
Godfrey-Smith, P. (2003). Theory and reality: An introduction to the philosophy of science. University

VALIDITY OF INTELLIGENCE COMPOSITES 26
of Chicago Press.
Goldstein, S., Princiotta, D., & Naglieri, J. A. (Eds.). (2015). Handbook of intelligence: Evolutionary
theory, historical perspective, and current concepts. Springer.
Gottfredson, L. S. (1997a). Mainstream science on intelligence: An editorial with 52 signatories, history
and bibliography. Intelligence, 24(1), 13–23. https://doi.org/10.1016/S0160-2896(97)90011-8
Gottfredson, L. S. (1997b). Why g matters: The complexity of everyday life. Intelligence, 24(1), 79–
132. https://doi.org/10.1016/S0160-2896(97)90014-3
Gottfredson, L. S. (2004). Intelligence: Is it the epidemiologists’ elusive “fundamental cause” of social
class inequalities in health? Journal of Personality and Social Psychology, 86(1), 174–199.
https://doi.org/10.1037/0022-3514.86.1.174
Gottfredson, L. S., & Deary, I. J. (2004). Intelligence predicts health and longevity, but why? Current
Directions in Psychological Science, 13(1), 1–4. https://doi.org/10.1111/j.0963-
7214.2004.01301001.x
Grieder, S., Bünger, A., Odermatt, S. D., Schweizer, F., & Grob, A. (in press). Limited internal
comparability of general intelligence composites: Impact on external validity, possible
predictors, and practical remedies. Assessment.
Grieder, S., & Grob, A. (2020). Exploratory factor analyses of the Intelligence and Development
Scales–2: Implications for theory and practice. Assessment, 27(8), 1853–1869.
https://doi.org/10.1177/1073191119845051
Grieder, S., Timmerman, M. E., Visser, L., Ruiter, S. A. J., & Grob, A. (2021). Factor structure of the
Intelligence and Development Scales–2: Measurement invariance across the Dutch and
German versions, sex, and age. Manuscript submitted for publication. PsyArXiv Preprint.
https://doi.org/10.31234/osf.io/vtw3g
Grob, A., Gygi, J. T., & Hagmann-von Arx, P. (2019a). The Stanford–Binet Intelligence Scales–Fifth
Edition (SB5)–German version. Hogrefe.
Grob, A., Gygi, J. T., & Hagmann-von Arx, P. (2019b). The Stanford–Binet Intelligence Scales–Fifth
Edition (SB5)–German version. Test manual. Hogrefe.
Grob, A., & Hagmann-von Arx, P. (2018a). Intelligence and Development Scales–2 (IDS-2).
Intelligenz- und Entwicklungsskalen für Kinder und Jugendliche. [Intelligence and
Development Scales for Children and Adolescents]. Hogrefe.
Grob, A., & Hagmann-von Arx, P. (2018b). Intelligence and Development Scales–2 (IDS-2).
Intelligenz- und Entwicklungsskalen für Kinder und Jugendliche. Manual zu Theorie,
Interpretation und Gütekriterien. [Intelligence and Development Scales for Children and
Adolescents. Manual on theory, interpretation, and psychometric criteria]. Hogrefe.
Grob, A., Hagmann-von Arx, P., Ruiter, S. A. J., Timmerman, M. E., & Visser, L. (2018). Intelligence
and Development Scales–2 (IDS-2). Intelligentie- en ontwikkelingsschalen voor kinderen en
jongeren. [Intelligence and Development Scales for children and adolescents]. Hogrefe.

VALIDITY OF INTELLIGENCE COMPOSITES 27
Grove, W. M., Zald, D. H., Lebow, B. S., Snitz, B. E., & Nelson, C. (2000). Clinical versus mechanical
prediction: A meta-analysis. Psychological Assessment, 12(1), 19–30. https://doi.org/10.1037/
1040-3590.12.1.19
Hagmann-von Arx, P., & Grob, A. (2014). Reynolds Intellectual Assessment Scales and Screening
(RIAS)TM. German adaptation of the Reynolds Intellectual Assessment Scales (RIAS)TM & the
Reynolds Intellectual Screening Test (RIST)TM from Cecil R. Reynolds and Randy W.
Kamphaus. Test manual. Hans Huber.
Hagmann-von Arx, P., Lemola, S., & Grob, A. (2018). Does IQ = IQ? Comparability of intelligence
test scores in typically developing children. Assessment, 25(6), 691–701.
https://doi.org/10.1177/1073191116662911
Haier, R. J., Colom, R., Schroeder, D. H., Condon, C. A., Tang, C., Eaves, E., & Head, K. (2009). Gray
matter and intelligence factors: Is there a neuro-g? Intelligence, 37(2), 136–144.
https://doi.org/10.1016/j.intell.2008.10.011
Haier, R. J., Jung, R. E., Yeo, R. A., Head, K., & Alkire, M. T. (2004). Structural brain variation and
general intelligence. NeuroImage, 23(1), 425–433. https://doi.org/10.1016/
j.neuroimage.2004.04.025
Hildebrandt, A., Lüdtke, O., Robitzsch, A., Sommer, C., & Wilhelm, O. (2016). Exploring factor model
parameters across continuous variables with local structural equation models. Multivariate
Behavioral Research, 51(2–3), 257–258. https://doi.org/10.1080/00273171.2016.1142856
Hildebrandt, A., Wilhelm, O., & Robitzsch, A. (2009). Complementary and competing factor analytic
approaches for the investigation of measurement invariance. Review of Psychology, 16(2), 87–
102.
Holzinger, K. J., & Swineford, F. (1937). The bi-factor method. Psychometrika, 2, 41–54.
https://doi.org/10.1007/BF02287965
Horn, J. L. (1991). Measurement of intellectual capabilities: A review of theory. In K. S. McGrew, J.
Werder, & R. W. Woodcock (Eds.), WJ-R technical manual (pp. 197–232). Riverside.
Horn, J. L., & Cattell, R. B. (1966). Refinement and test of the theory of fluid and crystallized general
intelligences. Journal of Educational Psychology, 57(5), 253–270. https://doi.org/10.1037/
h0023816
Hunter, J. E., & Hunter, R. F. (1984). Validity and utility of alternative predictors of job performance.
Psychological Bulletin, 96(1), 72–98. https://doi.org/10.1037/0033-2909.96.1.72
International Test Commission. (2001). International guidelines for test use. International Journal of
Testing, 1(2), 93–114. https://doi.org/10.1207/S15327574IJT0102_1
Jensen, A. R., & Weng, L.-J. (1994). What is a good g? Intelligence, 18(3), 231–258.
https://doi.org/10.1016/0160-2896(94)90029-9
Johnson, W., Jung, R. E., Colom, R., & Haier, R. J. (2008). Cognitive abilities independent of IQ
correlate with regional brain structure. Intelligence, 36(1), 18–28. https://doi.org/10.1016/

VALIDITY OF INTELLIGENCE COMPOSITES 28
j.intell.2007.01.005
Jung, R. E., & Haier, R. J. (2007). The parieto-frontal integration theory (P-FIT) of intelligence:
Converging neuroimaging evidence. Behavioral and Brain Sciences, 30(2), 135–187.
https://doi.org/10.1017/S0140525X07001185
Kan, K.-J., Kievit, R. A., Dolan, C., & van der Maas, H. (2011). On the interpretation of the CHC factor
Gc. Intelligence, 39(5), 292–302. https://doi.org/10.1016/j.intell.2011.05.003
Karama, S., Colom, R., Johnson, W., Deary, I. J., Haier, R., Waber, D. P., Lepage, C., Ganjavi, H.,
Jung, R., & Evans, A. C. (2011). Cortical thickness correlates of specific cognitive performance
accounted for by the general factor of intelligence in healthy children aged 6 to 18. NeuroImage,
55(4), 1443–1453. https://doi.org/10.1016/j.neuroimage.2011.01.016
Keith, T. Z., & Reynolds, M. R. (2010). Cattell–Horn–Carroll abilities and cognitive tests: What we’ve
learned from 20 years of research. Psychology in the Schools, 47(7), 635–650.
https://doi.org/10.1002/pits.20496
Kovacs, K., & Conway, A. R. A. (2016). Process overlap theory: A unified account of the general factor
of intelligence. Psychological Inquiry, 27(3), 151–177. https://doi.org/10.1080/
1047840X.2016.1153946
Kovacs, K., & Conway, A. R. A. (2019). A unified cognitive/differential approach to human
intelligence: Implications for IQ testing. Journal of Applied Research in Memory and
Cognition, 8(3), 255–272. https://doi.org/10.1016/j.jarmac.2019.05.003
Kranzler, J. H., Maki, K. E., Benson, N. F., Eckert, T. L., Floyd, R. G., & Fefer, S. A. (2020). How do
school psychologists interpret intelligence tests for the identification of specific learning
disabilities? Contemporary School Psychology, 24(4), 445–456. https://doi.org/10.1007/
s40688-020-00274-0
Krueger, F., & Spearman, C. (1906). Die Korrelation zwischen verschiedenen geistigen
Leistungsfähigkeiten. [The correlation between different mental abilities]. Zeitschrift Für
Psychologie/Journal of Psychology, 44, 50–114.
Kuhn, M., & Johnson, K. (2013). Applied predictive modeling. Springer.
Lecerf, T., & Canivez, G. L. (2018). Complementary exploratory and confirmatory factor analyses of
the French WISC–V: Analyses based on the standardization sample. Psychological Assessment,
30(6), 793–808. https://doi.org/10.1037/pas0000526
Luecht, R. M., Gierl, M. J., Tan, X., & Huff, K. (2006, April). Scalability and the development of useful
diagnostic scales. [Paper presentation]. Annual meeting of the National Council on
Measurement in Education, San Francisco, CA.
Major, J. T., Johnson, W., & Bouchard, T. J. (2011). The dependability of the general factor of
intelligence: Why small, single-factor models do not adequately represent g. Intelligence, 39(5),
418–433. https://doi.org/10.1016/j.intell.2011.07.002
Matzke, D., Dolan, C. V., & Molenaar, D. (2010). The issue of power in the identification of “g” with

VALIDITY OF INTELLIGENCE COMPOSITES 29
lower-order factors. Intelligence, 38(3), 336–344. https://doi.org/10.1016/j.intell.2010.02.001
McDaniel, M. (2005). Big-brained people are smarter: A meta-analysis of the relationship between in
vivo brain volume and intelligence. Intelligence, 33(4), 337–346. https://doi.org/10.1016/
j.intell.2004.11.005
McDonald, R. P. (1985). Factor analysis and related methods. Lawrence Erlbaum Associates.
McDonald, R. P. (1999). Test theory: A unified treatment. Taylor & Francis.
McGill, R. J. (2020). An instrument in search of a theory: Structural validity of the Kaufman
Assessment Battery for Children–Second Edition normative update at school-age. Psychology
in the Schools, 57(2), 247–264. https://doi.org/10.1002/pits.22304
McGill, R. J., & Dombrowski, S. C. (2019). Critically reflecting on the origins, evolution, and impact
of the Cattell–Horn–Carroll (CHC) Model. Applied Measurement in Education, 32(3), 216–
231. https://doi.org/10.1080/08957347.2019.1619561
McGill, R. J., Dombrowski, S. C., & Canivez, G. L. (2018). Cognitive profile analysis in school
psychology: History, issues, and continued concerns. Journal of School Psychology, 71, 108–
121. https://doi.org/10.1016/j.jsp.2018.10.007
McGrew, K. S. (1997). Analysis of the major intelligence batteries according to a proposed
comprehensive Gf-Gc framework. In D. P. Flanagan, J. L. Genshaft, & P. L. Harrison (Eds.),
Contemporary intellectual assessment: Theories, tests, and issues (pp. 151–179). Guilford
Press.
McGrew, K. S. (2009). CHC theory and the human cognitive abilities project: Standing on the shoulders
of the giants of psychometric intelligence research. Intelligence, 37(1), 1–10.
https://doi.org/10.1016/j.intell.2008.08.004
Meehl, P. E. (1954). Clinical versus statistical prediction: A theoretical analysis and review of the
evidence. University of Minnesota Press.
Messick, S. (1989). Validity. In R. L. Linn (Ed.), Educational measurement (3rd ed., pp. 13–103).
Macmillan.
Molenaar, P. C. M., & Campbell, C. G. (2009). The new person-specific paradigm in psychology.
Current Directions in Psychological Science, 18(2), 112–117. https://doi.org/10.1111/j.1467-
8721.2009.01619.x
Murray, C. (1998). Income inequality and IQ. American Enterprise Institute.
Naglieri, J. A., Das, J. P., & Goldstein, S. (2014). Cognitive Assessment System–Second Edition. PRO-
ED.
Nelson, J. M., Canivez, G. L., & Watkins, M. W. (2013). Structural and incremental validity of the
Wechsler Adult Intelligence Scale–Fourth Edition with a clinical sample. Psychological
Assessment, 25(2), 618–630. https://doi.org/10.1037/a0032086
Nisbett, R. E., Aronson, J., Blair, C., Dickens, W., Flynn, J., Halpern, D. F., & Turkheimer, E. (2012).
Intelligence: New findings and theoretical developments. American Psychologist, 67(2), 130–

VALIDITY OF INTELLIGENCE COMPOSITES 30
159. https://doi.org/10.1037/a0026699
Oakland, T., Douglas, S., & Kane, H. (2016). Top ten standardized tests used internationally with
children and youth by school psychologists in 64 countries: A 24-year follow-up study. Journal
of Psychoeducational Assessment, 34(2), 166–176. https://doi.org/10.1177/0734282915595303
O’Neil, C. (2016). Weapons of math destruction: How big data increases inequality and threatens
democracy. Broadway Books.
Petermann, F. (2009). Wechsler Preschool and Primary Scale of Intelligence–Third Edition (WPPSI-
III)–German version. Pearson.
Petermann, F., & Petermann, U. (2011). Wechsler Intelligence Scale for Children–Fourth Edition
(WISC-IV)–German version. Pearson.
Rabin, L. A., Paolillo, E., & Barr, W. B. (2016). Stability in test-usage practices of clinical
neuropsychologists in the United States and Canada over a 10-year period: A follow-up survey
of INS and NAN members. Archives of Clinical Neuropsychology, 31(3), 206–230.
https://doi.org/10.1093/arclin/acw007
Reise, S. P. (2012). The rediscovery of bifactor measurement models. Multivariate Behavioral
Research, 47(5), 667–696. https://doi.org/10.1080/00273171.2012.715555
Reise, S. P., Bonifay, W. E., & Haviland, M. G. (2013). Scoring and modeling psychological measures
in the presence of multidimensionality. Journal of Personality Assessment, 95(2), 129–140.
https://doi.org/10.1080/00223891.2012.725437
Reynolds, M. R. (2013). Interpreting the g loadings of intelligence test composite scores in light of
Spearman’s law of diminishing returns. School Psychology Quarterly, 28(1), 63–76.
https://doi.org/10.1037/spq0000013
Rost, D. (2009). Intelligenz: Fakten und Mythen. [Intelligence: Facts and myths]. Beltz.
Roth, B., Becker, N., Romeyke, S., Schäfer, S., Domnick, F., & Spinath, F. M. (2015). Intelligence and
school grades: A meta-analysis. Intelligence, 53, 118–137. https://doi.org/10.1016/
j.intell.2015.09.002
Schmidt, F. L., & Hunter, J. (2004). General mental ability in the world of work: Occupational
attainment and job performance. Journal of Personality and Social Psychology, 86(1), 162–
173. https://doi.org/10.1037/0022-3514.86.1.162
Schmidt, F. L., Le, H., & Ilies, R. (2003). Beyond alpha: An empirical examination of the effects of
different sources of measurement error on reliability estimates for measures of individual-
differences constructs. Psychological Methods, 8(2), 206–224. https://doi.org/10.1037/1082-
989X.8.2.206
Schneider, W. J., & McGrew, K. S. (2012). The Cattell–Horn–Carroll model of intelligence. In D. P.
Flanagan & P. L. Harrison (Eds.), Contemporary intellectual assessment: Theories, tests, and
issues (3rd ed., pp. 99–144). Guilford Press.
Schneider, W. J., & McGrew, K. S. (2018). The Cattell–Horn–Carroll theory of cognitive abilities. In

VALIDITY OF INTELLIGENCE COMPOSITES 31
D. P. Flanagan & E. M. McDonough (Eds.), Contemporary intellectual assessment: Theories,
tests, and issues (4th ed., pp. 73–163). Guilford Press.
Schubert, A.-L., & Frischkorn, G. T. (2020). Neurocognitive psychometrics of intelligence: How
measurement advancements unveiled the role of mental speed in intelligence differences.
Current Directions in Psychological Science, 29(2), 140–146. https://doi.org/10.1177/
0963721419896365
Schubert, A.-L., Hagemann, D., & Frischkorn, G. T. (2017). Is general intelligence little more than the
speed of higher-order processing? Journal of Experimental Psychology: General, 146(10),
1498–1512. https://doi.org/10.1037/xge0000325
Spearman, C. (1904). “General Intelligence,” objectively determined and measured. The American
Journal of Psychology, 15(2), 201–292. https://doi.org/10.2307/1412107
Spearman, C. (1905). Proof and disproof of correlation. The American Journal of Psychology, 16(2),
228–231. https://doi.org/10.2307/1412129
Steenkamp, J.-B. E. M., & Baumgartner, H. (1998). Assessing measurement invariance in cross-
national consumer research. Journal of Consumer Research, 25(1), 78–90.
https://doi.org/10.1086/209528
Tang, C. Y., Eaves, E. L., Ng, J. C., Carpenter, D. M., Mai, X., Schroeder, D. H., Condon, C. A., Colom,
R., & Haier, R. J. (2010). Brain networks for working memory and factors of intelligence
assessed in males and females with fMRI and DTI. Intelligence, 38(3), 293–303.
https://doi.org/10.1016/j.intell.2010.03.003
Tellegen, P. J., Laros, J. A., & Petermann, F. (2012). SON-R 6-40. Snijders–Oomen Nonverbaler
Intelligenztest. [Snijders–Oomen Nonverbal Intelligence Test]. Hogrefe.
Thurstone, L. L. (1938a). A new rotational method in factor analysis. Psychometrika, 3(4), 199–218.
https://doi.org/10.1007/BF02287928
Thurstone, L. L. (1938b). Primary mental abilities. University of Chicago Press.
Thurstone, L. L. (1947). Multiple factor analysis. University of Chicago Press.
Thurstone, L. L., & Thurstone, T. G. (1941). Factorial studies of intelligence. University of Chicago
Press.
van der Maas, H., Dolan, C. V., Grasman, R. P., Wicherts, J. M., Huizenga, H. M., & Raijmakers, M.
E. (2006). A dynamical model of general intelligence: The positive manifold of intelligence by
mutualism. Psychological Review, 113(4), 842–861. https://doi.org/10.1037/0033-
295X.113.4.842
von Aster, M. G., Neubauer, A. C., & Horn, R. (2006). Wechsler Intelligenztest für Erwachsene (WIE).
[German version of the Wechsler Adult Intelligence Scale–Third Edition (WAIS-III)].
Harcourt.
Warne, R. T., & Burningham, C. (2019). Spearman’s g found in 31 non-Western nations: Strong
evidence that g is a universal phenomenon. Psychological Bulletin, 145(3), 237–272.

VALIDITY OF INTELLIGENCE COMPOSITES 32
https://doi.org/10.1037/bul0000184
Wasserman, J. D. (2019). Deconstructing CHC. Applied Measurement in Education, 32(3), 249–268.
https://doi.org/10.1080/08957347.2019.1619563
Watkins, M. W. (2017). The reliability of multidimensional neuropsychological measures: From alpha
to omega. Clinical Neuropsychology, 31(6–7), 1113–1126. https://doi.org/10.1080/
13854046.2017.1317364
Watkins, M. W., Dombrowski, S. C., & Canivez, G. L. (2018). Reliability and factorial validity of the
Canadian Wechsler Intelligence Scale for Children–Fifth Edition. International Journal of
School & Educational Psychology, 6(4), 252–265. https://doi.org/10.1080/
21683603.2017.1342580
Wechsler, D. (1939). The measurement of adult intelligence. Williams and Wilkins.
Wechsler, D. (2014). Wechsler Intelligence Scale for Children–Fifth Edition (WISC-V). Pearson.
Wechsler, D. (2017). Wechsler Intelligence Scale for Children–Fifth Edition (WISC-V)–German
version. Pearson.
World Health Organization. (2020). International classification of diseases and related health problems
(11th ed.). https://icd.who.int/
Yarkoni, T., & Westfall, J. (2017). Choosing prediction over explanation in psychology: Lessons from
machine learning. Perspectives on Psychological Science, 12(6), 1100–1122. https://doi.org/
10.1177/1745691617693393
Yoakum, C. S., & Yerkes, R. M. (1920). Army mental tests. Henry Holt and Company.
Youngstrom, E. A., Kogos, J. L., & Glutting, J. J. (1999). Incremental efficacy of Differential Ability
Scales factor scores in predicting individual achievement criteria. School Psychology
Quarterly, 14(1), 26–39. https://doi.org/10.1037/h0088996
Zinbarg, R. E., Yovel, I., Revelle, W., & McDonald, R. P. (2006). Estimating generalizability to a latent
variable common to all of a scale’s indicators: A comparison of estimators for omega h. Applied
Psychological Measurement, 30(2), 121–144. https://doi.org/10.1177/0146621605278814

APPENDIX A: Study 1 33
APPENDIX A: Study 1
Grieder, S. & Grob, A. (2020). Exploratory factor analyses of the Intelligence and Development Scales–
2: Implications for theory and practice. Assessment, 27(8), 1853–1869. https://doi.org/10.1177/
1073191119845051

APPENDIX A: Study 1 34
Please note that this is the author’s version of a work that was accepted for publication in Assessment.
Changes resulting from the publishing process, such as editing, corrections, structural formatting, and
other quality control mechanisms may not be reflected in this document. This article may be used for
noncommercial purposes in accordance with the journal’s conditions.
Exploratory Factor Analyses of the Intelligence and Development Scales–2: Implications for
Theory and Practice
Silvia Grieder and Alexander Grob
Department of Psychology, University of Basel
Author Note
We thank an anonymous reviewer for numerous valuable inputs and comments. We also thank
Anita Todd for proofreading and copyediting and Florine Schweizer and Salome D. Odermatt for
valuable comments on an earlier version of this manuscript. We declare the following potential conflicts
of interest: Alexander Grob is recipient of royalties for the Intelligence and Development Scales–2
(IDS-2). Supplemental material for this article is available at https://journals.sagepub.com/doi/suppl/
10.1177/1073191119845051.
Correspondence concerning this article should be addressed to Silvia Grieder, Division of
Developmental and Personality Psychology, Department of Psychology, University of Basel,
Missionsstrasse 62, 4055 Basel, Switzerland. Email: [email protected]

APPENDIX A: Study 1 35
Abstract
The factor structure of the intelligence and scholastic skills domains of the Intelligence and
Development Scales–2 was examined using exploratory factor analyses with the standardization and
validation sample (N = 2,030, aged 5 to 20 years). Results partly supported the seven proposed
intelligence group factors. However, the theoretical factors Visual Processing and Abstract Reasoning
as well as Verbal Reasoning and Long-Term Memory collapsed, resulting in a five-factor structure for
intelligence. Adding the three scholastic skills subtests resulted in an additional factor Reading/Writing
and in Logical–Mathematical Reasoning showing a loading on Abstract Visual Reasoning and the
highest general factor loading. A data-driven separation of intelligence and scholastic skills is not
evident. Omega reliability estimates based on Schmid–Leiman transformations revealed a strong
general factor that accounted for most of the true score variance both overall and at the group factor
level. The possible usefulness of factor scores is discussed.
Keywords: Cattell-Horn-Carroll, Intelligence and Development Scales–2, exploratory factor
analysis, Schmid–Leiman transformation, omega coefficient, general factor

APPENDIX A: Study 1 36
Introduction
Intelligence is one of the best researched constructs in psychology (Lubinski, 2004) and is
highly predictive for a wide range of important outcomes, including academic achievement (Lubinski,
2004; Roth et al., 2015), occupational success, socioeconomic status, and income (Batty, Gale,
Tynelius, Deary, & Rasmussen, 2009; Gottfredson, 2004; Lubinski, 2004) as well as health and
longevity (Batty et al., 2009; Gottfredson & Deary, 2004). One major line of research focuses on the
structure of intelligence. The long and fruitful research history on intelligence structure spans from
Spearman’s (1904) momentous two-factor or g theory to the most recent attempt to integrate two
influential intelligence models—Cattell and Horn’s Gf–Gc theory (Cattell, 1941; Horn, 1991; Horn &
Cattell, 1966) and Carroll’s (1993) three-stratum theory—into the Cattell–Horn–Carroll (CHC) model
(McGrew, 1997, 2009). The CHC model postulates a hierarchical intelligence structure with over 80
narrow abilities or subtests on stratum I and 10 broad abilities or group factors on stratum II, namely,
Fluid Reasoning, Comprehension–Knowledge, Short-Term Memory, Visual Processing, Auditory
Processing, Long-Term Storage and Retrieval, Cognitive Processing Speed, Decision and Reaction
Speed, Reading and Writing, and Quantitative Knowledge. As Carroll (1993) and Cattel and Horn
(Cattell, 1941; Horn & Cattell, 1966) disagreed on the matter, the existence of a general factor on
stratum III is left open to debate in CHC (McGrew, 2009). The CHC model is largely invariant across
sex and culture (Keith, 2005) as well as across the life span (Keith & Reynolds, 2010). Since its
introduction in the late 1990s, the CHC model has been widely referred to as a comprehensive
framework in intelligence research and test construction (Alfonso, Flanagan, & Radwan, 2005;
McGrew, 2009). Despite CHC’s popularity, however, the combining of Cattell–Horn’s and Carroll’s
theories into one framework is not universally accepted and there is increasing evidence against the
usefulness of this integration.
In a recent article, Canivez and Youngstrom (in press) point out several challenges to the CHC
model, mainly concerning its focus on group factors and its de-emphasis on g. They review evidence
on the poor reliability, (incremental) validity, and diagnostic value of group factor scores of prominent
intelligence tests purposed to measure CHC broad abilities and highlight that the general factor accounts
for the major part of true score variance in almost all of these group factor scores. Like Cucina and
Howardson (2017), Canivez and Youngstrom (in press) conclude that Cattell–Horn’s and Carroll’s
theories are incongruent and that the abundant evidence on the dominance of the general factor over
broad abilities is more in line with Carroll than Cattell-Horn. These caveats notwithstanding, the CHC
model is still widely regarded as the current state-of-the-art of intelligence structure.
A recently developed test battery that is partly based on the CHC model are the Intelligence
and Development Scales–2 (IDS-2; Grob & Hagmann-von Arx, 2018a). The IDS-2 is the completely
revised and extended successor of the Intelligence and Development Scales (IDS; Grob, Meyer, &
Hagmann-von Arx, 2009) and assesses cognitive (intelligence, executive functions) and developmental
(psychomotor skills, socioemotional competence, scholastic skills, and attitude toward work) functions
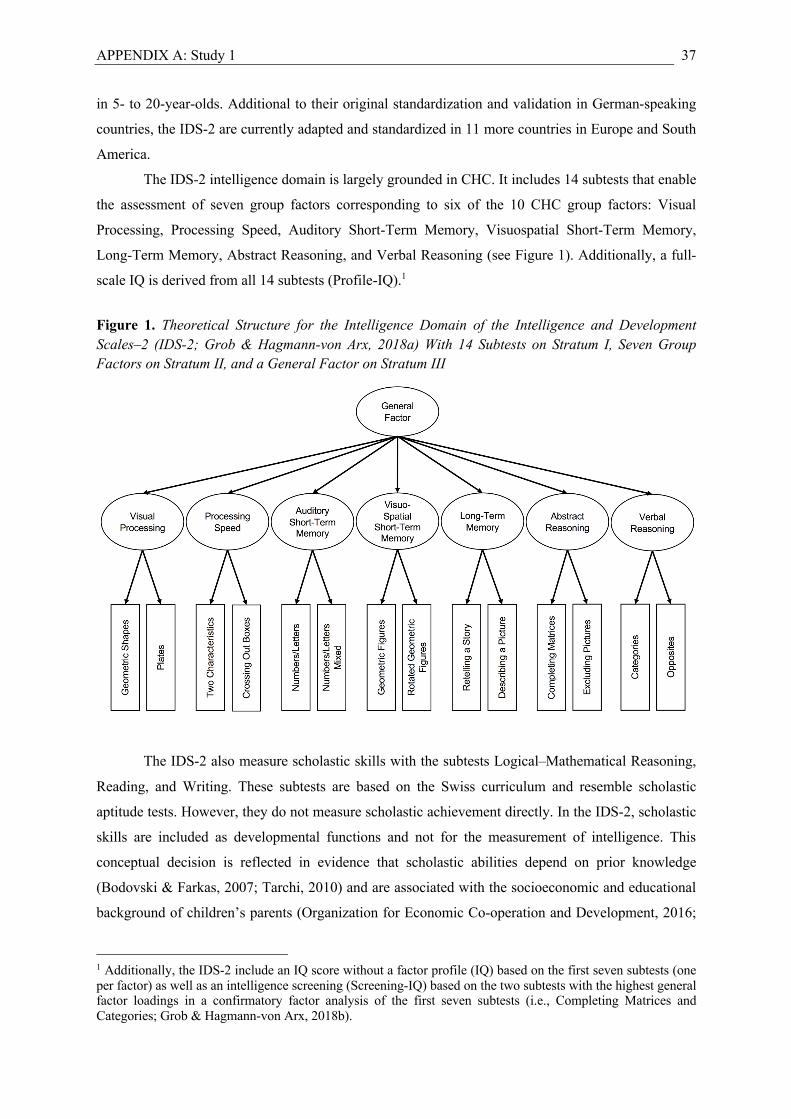
APPENDIX A: Study 1 37
in 5- to 20-year-olds. Additional to their original standardization and validation in German-speaking
countries, the IDS-2 are currently adapted and standardized in 11 more countries in Europe and South
America.
The IDS-2 intelligence domain is largely grounded in CHC. It includes 14 subtests that enable
the assessment of seven group factors corresponding to six of the 10 CHC group factors: Visual
Processing, Processing Speed, Auditory Short-Term Memory, Visuospatial Short-Term Memory,
Long-Term Memory, Abstract Reasoning, and Verbal Reasoning (see Figure 1). Additionally, a full-
scale IQ is derived from all 14 subtests (Profile-IQ).1
Figure 1. Theoretical Structure for the Intelligence Domain of the Intelligence and Development Scales–2 (IDS-2; Grob & Hagmann-von Arx, 2018a) With 14 Subtests on Stratum I, Seven Group Factors on Stratum II, and a General Factor on Stratum III
The IDS-2 also measure scholastic skills with the subtests Logical–Mathematical Reasoning,
Reading, and Writing. These subtests are based on the Swiss curriculum and resemble scholastic
aptitude tests. However, they do not measure scholastic achievement directly. In the IDS-2, scholastic
skills are included as developmental functions and not for the measurement of intelligence. This
conceptual decision is reflected in evidence that scholastic abilities depend on prior knowledge
(Bodovski & Farkas, 2007; Tarchi, 2010) and are associated with the socioeconomic and educational
background of children’s parents (Organization for Economic Co-operation and Development, 2016;
1 Additionally, the IDS-2 include an IQ score without a factor profile (IQ) based on the first seven subtests (one per factor) as well as an intelligence screening (Screening-IQ) based on the two subtests with the highest general factor loadings in a confirmatory factor analysis of the first seven subtests (i.e., Completing Matrices and Categories; Grob & Hagmann-von Arx, 2018b).

APPENDIX A: Study 1 38
Sirin, 2005). Nevertheless, scholastic skills represent important cognitive skills and are included as
group factors in the CHC model. We therefore decided to integrate the intelligence and scholastic skills
subtests in the subsequent analyses.
Validation of a test is crucial to determine its usefulness and ability to measure the assumed
construct. One important aspect of validity is factorial or structural validity, that is, the presence of a
theoretically postulated factor structure. This can be tested using exploratory and/or confirmatory factor
analysis (EFA and CFA, respectively). Especially for new test batteries the use of both EFA and CFA
is useful (Brown, 2015; Carroll, 1993; Reise, 2012; Schmitt, 2011). Information on the factor structure
obtained by EFA can subsequently be used for informed CFA (Reise, 2012). Hence, a reasonable
strategy for structural validation of a test is first to conduct EFA and then to test the factor structure
found in EFA against possible alternative models using CFA.
Adopting this strategy, Canivez, Watkins, and Dombrowski (2016, 2017) recently examined
the factor structure of the Wechsler Intelligence Scale for Children–Fifth Edition (WISC-V; Wechsler,
2014), using the correlation matrix for the whole standardization sample reported in the WISC-V
manual. In their first study, EFA was used to determine the optimal number of factors and to investigate
the variance portions explained by the general factor versus the group factors (Canivez et al., 2016).
Contrary to the CFA results published in the WISC-V manual favoring a five-factor structure, EFA
results suggested a four-factor solution as being most appropriate. The theoretical factors Visual Spatial
and Fluid Reasoning were not separable and converged to a single factor Perceptual Reasoning. The
resulting structure thus corresponded to that of the WISC-V precursor: the WISC-IV (Wechsler, 2003).
Additionally, omega (ω) reliability analyses revealed that the general factor explained most of the true
score variance in the indicators, while the reliable group-factor variance was presumably too small for
individual interpretation. Canivez et al. (2017) subsequently sought to replicate results from EFA and
test alternative models using CFA. Results from CFA confirmed those from EFA. The bifactor model
with four group factors had the best fit, outperforming simpler models with fewer factors as well as the
theoretical five-factor model. In fact, different versions of the five-factor model produced inadmissible
or otherwise unsatisfactory solutions (e.g., negative variance for Fluid Reasoning). With the
information from previous EFAs, these results were readily understood and the solution (combining the
Visual Spatial and Fluid Reasoning factors) was obvious.
This finding of indistinct Fluid Reasoning and Visual-Spatial factors is consistent with other
studies on the US WISC-V (Dombrowski, Canivez, & Watkins, 2018; Dombrowski, Canivez, Watkins,
& Beaujean, 2015; M. R. Reynolds & Keith, 2017) as well as on other WISC-V versions (French:
Lecerf & Canivez, 2018, Canadian: Watkins, Dombrowski, & Canivez, 2017, Spanish: Fenollar-Cortés
& Watkins, 2018). As an alternative to a combined Perceptual Reasoning factor, M. R. Reynolds and
Keith (2017), exclusively relying on CFA, found a bifactor model with five factors and correlated Fluid
Reasoning and Visual-Spatial factors to be the best-fitting model and argued against combining these
two factors. They assumed an intermediate Nonverbal Reasoning factor that accounts for the

APPENDIX A: Study 1 39
correlation. Watkins et al. (2017) and Fenollar-Cortés and Watkins (2018) replicated the finding of this
modified five-factor model being the best-fitting one. However, they argued against adopting this as
the final model and instead interpreted a bifactor model with four factors and a combined Perceptual
Reasoning factor, as this model was more parsimonious (had simple structure), is easier to interpret,
and showed good global fit. In fact, in all three studies (Fenollar-Cortés & Watkins, 2018; M. R.
Reynolds & Keith, 2017; Watkins et al., 2017) there was no substantial difference in fit between the
modified five-factor model and the four-factor model (Burnham & Anderson, 2004; Chen, 2007;
Cheung & Rensvold, 2002; Gignac, 2007).
This debate indicates that even for tests with a clearly hypothesized structure such as the WISC-
V additional factor analytical studies (exploratory and confirmatory) are useful to get further insights
in the factor structure. Especially, independent EFA can help avoiding confirmation bias due to
adopting a well-fitting but less parsimonious model by finding the best data-driven model.
There are several studies that applied EFA to examine the structural validity of various other
intelligence test batteries, including the Kaufman Assessment Battery for Children (KABC; Kaufman,
1993; Kaufman & Kaufman, 1983), the Kaufman Adolescent and Adult Intelligence Test (KAIT;
Kaufman, 1993; Kaufman & Kaufman, 1993), the Reynolds Intellectual Assessment Scales (RIAS; C.
R. Reynolds & Kamphaus, 2003; Dombrowski, Watkins, & Brogan, 2009), the Stanford–Binet
Intelligence Scales–Fifth Edition (SB5; Roid, 2003; Canivez, 2008), the Wechsler Adult Intelligence
Scale–Fourth Edition (WAIS-IV; Wechsler, 2008; Canivez & Watkins, 2010a, 2010b), the Woodcock–
Johnson III (WJ-III; Woodcock, McGrew, & Mather, 2001; Dombrowski, 2014; Dombrowski &
Watkins, 2013), and the WJ-IV (Schrank, McGrew, Mather, & Woodcock, 2014; Dombrowski, McGill,
& Canivez, 2017, 2018b). For most of these test batteries, only CFAs are reported in the manual.
However, results from independent EFA studies as those mentioned above often diverge from CFA
results (Canivez, 2008; Dombrowski, 2014; Dombrowski et al., 2017; Dombrowski & Watkins, 2013)
and, in line with the findings of Frazier and Youngstrom (2007), indicate substantial overfactoring for
major intelligence test batteries.
Some of the above studies computed ω coefficients. Omega is a model-based reliability estimate
used to determine the relative importance of the general factor versus group factors and has been
suggested as a more appropriate alternative to coefficient alpha for estimating factor reliability of
multidimensional scales (Crutzen & Peters, 2017; Gignac, 2014). It makes it possible to divide a
composite’s true score variance into general-factor variance (ω hierarchical [ωh]) and group-factor
variance (ω subscale [ωs]). ωh is the squared correlation of a composite with the general factor, and ωs
is the squared correlation of a composite with the group factor, net of general-factor variance. The total
true score variance of a group factor composite or the whole scale, ω total, is denoted ωt and refers to
the squared correlation of a composite with the corresponding factor without removing unrelated factor
variance (for the whole scale: including group-factor variance and for the group factor composites:
including general-factor variance). Many authors caution against universal benchmarks for ω (Crutzen

APPENDIX A: Study 1 40
& Peters, 2017; Gignac, 2014; Reise, Bonifay, & Haviland, 2013). A preliminary suggestion has been
made for a minimum of .50—with .75 being preferred—for ωh as well as ωs (Reise et al., 2013).
However, especially for ωs, it is still unclear from which level individual interpretations of factor scores
are supported (Gignac, 2014). Notably, ωs has been found to be far less than .70 for factor scores of
major intelligence test batteries (Canivez et al., 2016; Cucina & Howardson, 2017; Dombrowski, 2014;
Nelson, Canivez, & Watkins, 2013; Watkins, 2017).
Structural validity evidence in the IDS-2 manual on theory, interpretation, and psychometric
criteria (Grob & Hagmann-von Arx, 2018b) is given for the intelligence domain only and is based on
CFA with the standardization sample (N = 1,672). Both the Profile-IQ model (see Figure 1) and the IQ
model with seven subtests loading directly on a general factor displayed good fit (comparative fit index
[CFI] = .97, Gamma Hat [GH] = .98, McDonald’s noncentrality index [NCI] = .93, root mean square
error of approximation [RMSEA] = .04, and CFI = .97, GH = .99, NCI = .98, RMSEA = .05,
respectively). However, no alternative models (i.e., simpler models with fewer group factors or bifactor
models) were tested and no EFAs were conducted. Moreover, the structure of the other (cognitive) IDS-
2 domains and their (structural) interrelations were not examined in the manual.
To close this gap, in the present study we examined the factor structure of two IDS-2 domains—
intelligence (14 subtests) and scholastic skills (three subtests)—using EFA. Four research questions
were addressed: (1) How many factors should be extracted for the IDS-2 intelligence domain? (2) How
many factors should be extracted for an integrative analysis of the IDS-2 domains intelligence and
scholastic skills? (3) Does the theoretical separation of the IDS-2 domains intelligence and scholastic
skills hold true? (4) How much (true score) variance is explained by the general factor versus the group
factors? We expected results to be consistent with theoretical considerations on the IDS-2. Additionally,
taking previous evidence from conceptual validation studies into account, we expected higher
proportions of true score variance due to the general factor compared to the group factors.
Method
Participants
Data from the whole IDS-2 standardization and validation sample (N = 2,030) were used.
German-speaking participants were from Switzerland (n = 1,097), Germany (n = 806), Austria (n = 83),
Liechtenstein (n = 1), and France (n = 1). The subsamples for (a) intelligence and (b) intelligence and
scholastic skills are described below.
Data on intelligence were available for 1,991 participants (Mage = 12.22 years, age range: 5.02–
20.97 years, 52.0% female). About one third (36.0%) of participants’ mothers had a university degree.
Data on intelligence and scholastic skills were available for 1,741 participants (Mage = 13.24,
age range: 7.01–20.97 years, 51.9% female). This age range is restricted because the minimum age of
7 years was required for completing the Reading and Writing subtests. About one third (35.8%) of
participants’ mothers had a university degree.

APPENDIX A: Study 1 41
Materials and Procedure
The IDS-2 is an individually administered test battery that assesses cognitive (intelligence,
executive functions) as well as developmental (psychomotor skills, socioemotional competence,
scholastic skills, and attitude toward work) functions in 5- to 20-year-olds with 30 subtests. Brief
descriptions of the 14 subtests for intelligence and three subtests for scholastic skills can be found in
Table S1 in the online supplemental material.
Participants were recruited via schools and psychosocial institutions for children and
adolescents in Switzerland, Germany, and Austria. Administration took between 3.5 and 4.5 h and, if
necessary, could be split into two sessions no more than 1 week apart. Written consent was obtained
from children and adolescents (for 10- to 20-year-olds) and/or their parents (for 5- to 15-year-olds).
Demographics were obtained from parents or adolescents using a personally administered questionnaire
at the beginning of the (first) session. Participants received a gift card of their own choice worth 30
Swiss francs (Switzerland) or 25 euros in cash (Germany and Austria) for participation. Ethical approval
was obtained from the Ethikkommission Nordwest- und Zentralschweiz [Ethics Commission Northwest
and Central Switzerland] and from the responsible local ethics committees in Switzerland, Germany,
and Austria.
Statistical Analyses
Analyses were conducted with adapted versions of functions from the psych package in R (R
Core Team, 2016; Revelle, 2017), using the EFAdiff package (Grieder & Steiner, 2019b), following
the suggestions of Grieder and Steiner (2019a). A stepwise procedure was adopted. First, only subtests
from the intelligence domain were included. In a second step, the scholastic skills subtests were added.
Multiple criteria are available for determining the number of factors to extract. However, not
all criteria are equally accurate. The Kaiser criterion (eigenvalue ≥ 1; Kaiser, 1960) and the scree test
(Cattell, 1966), although frequently used, have been found to be arbitrary (Kaiser criterion), subjective
(scree test), and often inaccurate (Fabrigar, Wegener, MacCallum, & Strahan, 1999; Hayton, Allen, &
Scarpello, 2004) and therefore were not used in the present study. In contrast, Horn’s parallel analysis
(HPA; Horn, 1965) has been suggested as one of the most accurate extraction criteria (Hayton et al.,
2004) and was therefore applied. Additionally, RMSEA (Browne & Cudeck, 1992; Steiger & Lind,
1980) and the Bayesian information criterion (BIC; Schwarz, 1978) were considered. For the RMSEA,
it has been proposed that one should retain the solution with the lowest number of factors with RMSEA
< .05 (Preacher, Zhang, Kim, & Mels, 2013). For the BIC, the smallest value indicates the best model.
In addition to statistical criteria, factor solutions should always be interpreted in light of theory and
current research (Fabrigar et al., 1999; Preacher et al., 2013; Watkins, 2018).
Principal axis (PA) factor analyses with promax rotation were conducted with the suggested
number of factors. To account for the hierarchical data structure, Schmid–Leiman transformations
(Schmid & Leiman, 1957) were subsequently performed. As a first step in this procedure, a second-
order factor analysis is conducted on the factor correlations of the oblique solution of the PA factor

APPENDIX A: Study 1 42
analysis. The factors from the second-order factor solution are then orthogonalized, which results in a
factor solution with proportionality constraints. This makes it possible to determine the relative
importance and reliability of the general factor versus the group factors. For this purpose, ωt, ωh, and ωs
were computed using the psych package in R (R Core Team, 2016; Revelle, 2017).
Figure 2. Initial Eigenvalues and Factor Extraction Criteria for Exploratory Factor Analyses of the Intelligence and Development Scales–2 (IDS-2) Subtests for (a) Intelligence and (b) Intelligence and Scholastic Skills
Note. Root mean square error of approximation (RMSEA) was multiplied by 10 to display it on a common scale with the eigenvalues. The gray dashed line indicates an eigenvalue of 1, and the black dashed line indicates the cutoff value for the RMSEA (.05 × 10). HPA = Horn’s parallel analysis; BIC = Bayesian information criterion.

APPENDIX A: Study 1 43
Results
We first report results for the intelligence domain and then for the intelligence and scholastic
skills domains. Subtest intercorrelations, means, standard deviations, and reliabilities can be found in
the Appendix (see Tables A1 and A2). Initial eigenvalues (Table S2) as well as results for the nonfinal
PA solutions (Tables S3 to S6) are included in the online supplemental material. For simplicity, we
refer to pattern coefficients of the rotated solutions as loadings.
Intelligence Domain
Seven intelligence group factors are postulated in the IDS-2 manual. Of the statistical criteria,
HPA and BIC suggested six factors, and RMSEA suggested five factors (see Figure 2a). We therefore
examined the seven-, six-, and five-factor PA solutions.
Table 1. Five-Factor Solution of a Principal Axis Factor Analysis With Promax Rotation for the IDS-2 Intelligence Domain (N = 1,991)
Subtest General Factor a
Semantic Long-Term Memory
Visuospatial Short-Term Memory
Auditory Short-Term Memory
Processing Speed
Abstract Visual
Reasoning h2 u2
Geometric Shapes .629 .021 (.483) -.049 (.472) -.018 (.400) .024 (.473) .757 (.743) .553 .447 Plates .473 .017 (.370) .105 (.405) -.002 (.306) -.006 (.338) .442 (.517) .274 .726 Two Characteristics .601 .013 (.452) -.033 (.444) .040 (.358) .828 (.806) -.043 (.483) .652 .348 Crossing Out Boxes .597 -.062 (.425) -.036 (.445) -.014 (.334) .733 (.774) .164 (.550) .610 .390 Numbers/Letters .731 .004 (.564) .003 (.513) .926 (.944) .022 (.426) .009 (.543) .893 .107 Numbers/Letters Mixed .682 .085 (.555) .082 (.514) .736 (.817) .006 (.398) -.026 (.497) .680 .320 Geometric Figures .521 -.085 (.396) .707 (.651) .029 (.344) -.047 (.336) .020 (.421) .429 .571 Rotated Geometric Figures
.604 -.107 (.456) .815 (.753) .020 (.390) -.032 (.403) .029 (.491) .574 .426
Completing Matrices .637 .077 (.517) .190 (.561) -.017 (.400) .052 (.478) .450 (.649) .456 .544 Excluding Pictures .564 .138 (.482) .171 (.497) .012 (.371) .010 (.399) .333 (.548) .342 .658 Categories .654 .752 (.743) -.158 (.449) .016 (.449) -.060 (.398) .188 (.543) .573 .427 Opposites .674 .770 (.765) -.132 (.471) .066 (.487) -.049 (.408) .114 (.533) .600 .400 Retelling a Story .610 .703 (.703) .131 (.519) -.048 (.374) .077 (.428) -.161 (.405) .512 .488 Describing a Picture .408 .312 (.426) .331 (.437) -.100 (.208) .080 (.311) -.147 (.269) .242 .758 % Variance 36.56 13.17 9.84 10.66 9.07 10.04 52.78 47.22
Factor correlations
Semantic Long-Term Memory
1.000
Visuospatial Short-Term Memory
.676 1.000
Auditory Short-Term Memory
.582 .528 1.000
Processing Speed .564 .575 .425 1.000
Abstract Visual Reasoning
.650 .664 .557 .625 1.000
Note. Pattern (and structure) coefficients are displayed. Factor loadings ≥ .30 are in bold. Model fit: Bayesian information criterion = -52.61 and root mean square error of approximation = .050, 90% confidence interval [.043, .057]. IDS-2 = Intelligence and Development Scales–2; h2 = communality; u2 = uniqueness. a First factor from an unrotated solution.

APPENDIX A: Study 1 44
The seven-factor solution did not converge after 1,000,000 iterations. It resulted in a Heywood
case and contained two factors with only one substantial loading each (Rotated Geometric Figures and
Geometric Shapes), hence showing symptoms of overfactoring (see Table S3). The six-factor solution
resulted in two Heywood cases as well and was therefore rejected (see Table S4). The five-factor
solution was plausible and showed a minimum of two substantial loadings for each factor (see Table
1). The theoretically postulated factors Auditory Short-Term Memory, Processing Speed, and
Visuospatial Short-Term Memory emerged. The theoretical factors Visual Processing and Abstract
Reasoning merged into one factor, called Abstract Visual Reasoning, and the theoretical factors Verbal
Reasoning and Long-Term Memory also collapsed to one factor, called Semantic Long-Term Memory.
Describing a Picture showed a cross-loading on Visuospatial Short-Term Memory. High factor
intercorrelations (.425-.676, median = .579) and loadings on the first factor from an unrotated solution
(.408-.731, median = .607) suggest a strong general factor. Total variance explained by the factors
ranged from 9.07% (Processing Speed) to 13.17% (Semantic Long-Term Memory). The whole model
explained 52.78% of the variance. Thus, we proceeded with the five-factor solution for S–L
transformation.
S–L transformation yielded the same loading pattern as above, but Excluding Pictures and
Describing a Picture only showed near-substantial loadings on their factors. The loading of Excluding
Pictures on Abstract Visual Reasoning was .185, the loading of Describing a Picture on Semantic Long-
Term Memory was .178 and on Visuospatial Short-Term Memory .194. A strong general factor
explained 32.25% of total and 61.06% of common variance (see Table 2). Total variance explained by
the group factors ranged from 2.67% (Abstract Visual Reasoning) to 5.68% (Auditory Short-Term
Memory). The whole model explained 52.82% of the variance.
We found that ωt ranged from .652 for Visuospatial Short-Term Memory to .914 for the whole
scale, ωh for the general factor was .809, and ωs for the group factors ranged from .140 (Abstract Visual
Reasoning) to .436 (Auditory Short-Term Memory). For all composites, a higher proportion of true
score variance was due to the general factor than to the respective group factor itself.

APPENDIX A: Study 1 45
Table 2. Schmid–Leiman Solution With Five Group Factors for the IDS-2 Intelligence Domain (N = 1,991)
General Factor
Semantic Long-Term Memory
Visuospatial Short-Term Memory
Auditory Short-Term Memory
Processing Speed
Abstract Visual
Reasoning
Subtest b b2 b b2 b b2 b b2 b b2 b b2 h2 u2
Geometric Shapes .611 .373 .012 .000 -.029 .001 -.013 .000 .017 .000 .421 .177 .552 .448 Plates .459 .211 .010 .000 .062 .004 -.002 .000 -.005 .000 .246 .061 .275 .725 Two Characteristics .557 .310 .007 .000 -.020 .000 .030 .001 .588 .346 -.024 .001 .658 .342 Crossing Out Boxes .562 .316 -.036 .001 -.021 .000 -.011 .000 .521 .271 .091 .008 .598 .402 Numbers/Letters .643 .413 .003 .000 .002 .000 .693 .480 .016 .000 .005 .000 .894 .106 Numbers/Letters Mixed
.607 .368 .049 .002 .048 .002 .551 .304 .004 .000 -.015 .000 .676 .324
Geometric Figures .505 .255 -.049 .002 .415 .172 .022 .000 -.034 .001 .011 .000 .432 .568 Rotated Geometric Figures
.587 .345 -.061 .004 .478 .228 .015 .000 -.023 .001 .016 .000 .577 .423
Completing Matrices .616 .379 .044 .002 .111 .012 -.013 .000 .037 .001 .250 .063 .457 .543 Excluding Pictures .542 .294 .079 .006 .100 .010 .009 .000 .007 .000 .185 .034 .345 .655 Categories .613 .376 .430 .185 - .093 .009 .012 .000 -.043 .002 .105 .011 .583 .417 Opposites .628 .394 .440 .194 - .077 .006 .049 .002 -.035 .001 .064 .004 .602 .398 Retelling a Story .572 .327 .402 .162 .077 .006 -.036 .001 .055 .003 -.089 .008 .507 .493 Describing a Picture .391 .153 .178 .032 .194 .038 -.075 .006 .057 .003 -.082 .007 .238 .762 % Total variance 32.25 4.22 3.49 5.68 4.50 2.67 52.82 47.18
% Common variance 61.06 7.99 6.61 10.75 8.53 5.06
Omega hierarchical .809 .537 .390 .440 .385 .571
Omega subscale .090 .233 .261 .436 .379 .140
Omega total .914 .770 .652 .876 .765 .710
Note. Group factor loadings ≥ .20 are in bold. Excluding Pictures and Describing a Picture had no substantial loading on any group factor, although the loadings were near .20 for Factor 5 (Excluding Pictures) and Factors 1 and 2 (Describing a Picture; indicated in italics). For the calculation of omegas, Excluding Pictures was assigned to Abstract Visual Reasoning and Describing a Picture was assigned to Verbal Reasoning and Long-Term Memory. IDS-2 = Intelligence and Development Scales–2; h2 = communality; u2 = uniqueness.
Intelligence and Scholastic Skills Domains
Eight factors should emerge based on information in the IDS-2 manual: seven group factors for
intelligence and one factor for scholastic skills. Of the statistical criteria, BIC suggested seven factors
and HPA and RMSEA suggested six (see Figure 2b). We therefore examined the eight-, seven-, and
six-factor PA solutions.
The eight- and seven-factor solutions both resulted in two Heywood cases and were therefore
rejected (see Tables S5 and S6). The six-factor solution was plausible and the loading pattern was
similar to the five-factor solution above, with two exceptions: (a) the cross-loading of Describing a
Picture on Visuospatial Short-Term Memory was no longer substantial and (b) Categories and
Opposites both showed a cross-loading on Abstract Visual Reasoning (see Table 3).
A Reading/Writing factor emerged. Logical–Mathematical Reasoning loaded on the Abstract
Visual Reasoning factor and had an additional small but insubstantial loading on the Reading/Writing

APPENDIX A: Study 1 46
factor. High factor intercorrelations (.390-.677, median = .581) and loadings on the first factor from an
unrotated solution (.423-.724, median = .635) suggest a strong general factor. Total variance explained
by the factors ranged from 7.07% (Visuospatial Short-Term Memory) to 13.41% (Abstract Visual
Reasoning). The whole model explained 55.75% of the variance. Thus, we proceeded with the six-
factor solution for S–L transformation.
Table 3. Six-Factor Solution of a Principal Axis Factor Analysis With Promax Rotation for the IDS-2 Domains Intelligence and Scholastic Skills (N = 1,741)
Subtest General Factor a
Abstract Visual
Reasoning
Auditory Short-Term Memory
Reading/ Writing
Semantic Long-Term Memory
Processing Speed
Visuospatial Short-Term Memory h2 u2
Geometric Shapes .618 .827 (.720) - .021 (.409) - .085 (.381) - .096 (.439) .060 (.448) - .011 (.437) .533 .467 Plates .486 .471 (.523) - .038 (.321) .014 (.319) - .029 (.371) .013 (.330) .127 (.396) .283 .717 Two Characteristics .615 .009 (.525) .048 (.388) .055 (.426) .032 (.455) .778 (.819) - .045 (.413) .680 .320 Crossing Out Boxes .598 .187 (.556) - .014 (.348) - .008 (.381) - .013 (.427) .719 (.790) - .048 (.412) .639 .361 Numbers/Letters .724 .023 (.592) .929 (.924) - .022 (.570) - .035 (.517) .032 (.383) .004 (.472) .856 .144 Numbers/Letters Mixed
.698 -.020 (.562) .791 (.848) .028 (.560) .033 (.529) .000 (.357) .066 (.479) .725 .275
Geometric Figures .507 .036 (.444) .018 (.371) .049 (.280) - .018 (.408) - .066 (.310) .670 (.675) .461 .539 Rotated Geometric Figures
.581 .077 (.517) .026 (.421) .023 (.319) .008 (.471) - .040 (.372) .685 (.739) .553 .447
Completing Matrices .637 .582 (.679) - .046 (.414) - .033 (.400) .018 (.500) .058 (.457) .161 (.528) .483 .517 Excluding Pictures .545 .460 (.570) .028 (.381) - .102 (.330) .124 (.459) .003 (.355) .109 (.447) .345 .655 Categories .689 .359 (.649) .025 (.496) .106 (.604) .528 (.719) - .093 (.339) - .177 (.356) .594 .406 Opposites .693 .303 (.638) .062 (.517) .113 (.606) .518 (.719) - .102 (.334) - .129 (.380) .583 .417 Retelling a Story .635 -.096 (.503) - .039 (.407) .043 (.503) .724 (.740) .062 (.401) .081 (.468) .556 .444 Describing a Picture .423 -.169 (.319) - .049 (.243) - .107 (.245) .529 (.502) .114 (.326) .236 (.433) .313 .687 Logical-Mathematical Reasoning
.721 .464 (.709) .049 (.536) .224 (.601) .020 (.576) .065 (.477) .031 (.468) .547 .453
Reading .670 -.093 (.517) - .027 (.509) .814 (.829) .064 (.590) .105 (.419) .008 (.314) .697 .303 Writing .641 .020 (.520) - .003 (.513) .787 (.791) - .014 (.547) - .056 (.318) .075 (.328) .630 .370 % Variance 38.69 13.41 9.18 8.99 9.49 7.62 7.07 55.75 44.25 Factor correlations Abstract Visual Reasoning 1.000
Auditory Short-Term Memory .631 1.000
Reading/Writing .633 .630 1.000 Semantic Long-Term Memory .704 .573 .677 1.000
Processing Speed .587 .390 .423 .486 1.000 Visuospatial Short- Term Memory .623 .501 .354 .581 .501 1.000
Note. Pattern (and structure) coefficients are displayed. Factor loadings ≥ .30 are in bold. Model fit: Bayesian information criterion = -175.46 and root mean square error of approximation = .041, 90% confidence interval [.035, .047]. IDS-2 = Intelligence and Development Scales–2; h2 = communality; u2 = uniqueness. a First factor from an unrotated solution.

APPENDIX A: Study 1 47
The S–L solution resulted in the same loading pattern as above, except that Categories and
Opposites no longer showed cross-loadings (see Table 4). The general factor explained 34.86% of total
and 62.51% of common variance. The group factors explained between 2.54% (Semantic Long-Term
Memory) and 4.32% (Processing Speed) of total variance. The whole model explained 55.77% of the
variance.
We found that ωt ranged from .670 for Visuospatial Short-Term Memory to .936 for the whole
scale, ωh for the general factor was .842, and ωs for the group factors ranged from .130 (Abstract Visual
Reasoning) to .417 (Processing Speed). Except for Processing Speed, a higher proportion of true score
variance was due to the general factor than to the respective group factor itself.
Table 4. Schmid–Leiman Solution With Six Group Factors for the IDS-2 Domains Intelligence and Scholastic Skills (N = 1,741)
General Factor
Abstract Visual
Reasoning
Auditory Short-Term Memory
Reading/ Writing
Semantic Long-Term Memory
Processing Speed
Visuospatial Short-Term Memory
Subtest b b2 b b2 b b2 b b2 b b2 b b2 b b2 h2 u2
Geometric Shapes .602 .362 .388 .151 -.015 .000 -.058 .003 -.054 .003 .047 .002 -.008 .000 .521 .479 Plates .469 .220 .221 .049 -.026 .001 .009 .000 -.016 .000 .010 .000 .094 .009 .278 .722 Two Characteristics .562 .316 .004 .000 .033 .001 .037 .001 .018 .000 .611 .373 -.033 .001 .693 .307 Crossing Out Boxes .552 .305 .088 .008 -.009 .000 -.005 .000 -.007 .000 .565 .319 -.035 .001 .633 .367 Numbers/Letters .676 .457 .011 .000 .635 .403 -.015 .000 -.019 .000 .025 .001 .003 .000 .862 .138 Numbers/Letters Mixed
.652 .425 - .009 .000 .541 .293 .019 .000 .018 .000 .000 .000 .049 .002 .721 .279
Geometric Figures .476 .227 .017 .000 .012 .000 .033 .001 -.010 .000 -.052 .003 .495 .245 .476 .524 Rotated Geometric Figures
.547 .299 .036 .001 .018 .000 .016 .000 .005 .000 -.031 .001 .506 .256 .558 .442
Completing Matrices .615 .378 .273 .075 -.032 .001 -.023 .001 .010 .000 .046 .002 .119 .014 .471 .529 Excluding Pictures .529 .280 .216 .047 .019 .000 -.069 .005 .069 .005 .002 .000 .081 .007 .343 .657 Categories .674 .454 .168 .028 .017 .000 .072 .005 .295 .087 -.073 .005 -.131 .017 .597 .403 Opposites .675 .456 .142 .020 .043 .002 .077 .006 .289 .084 -.080 .006 -.096 .009 .583 .417 Retelling a Story .611 .373 -.045 .002 -.026 .001 .029 .001 .405 .164 .049 .002 .060 .004 .547 .453 Describing a Picture .405 .164 -.079 .006 -.034 .001 -.072 .005 .295 .087 .090 .008 .175 .031 .302 .698 Logical–Mathematical Reasoning
.688 .473 .218 .048 .033 .001 .152 .023 .011 .000 .051 .003 .023 .001 .548 .452
Reading .619 .383 -.044 .002 -.019 .000 .553 .306 .036 .001 .082 .007 .006 .000 .699 .301 Writing .596 .355 .009 .000 -.002 .000 .535 .286 -.008 .000 -.044 .002 .055 .003 .647 .353 % Total variance 34.86 2.57 4.15 3.79 2.54 4.32 3.53 55.77 44.23 % Common variance 62.51 4.60 7.45 6.80 4.56 7.75 6.33 Omega hierarchical .842 .633 .494 .446 .605 .374 .342 Omega subscale .071 .130 .388 .357 .178 .417 .328 Omega total .936 .763 .882 .803 .784 .791 .670
Note. Group factor loadings ≥ .20 are in bold. IDS-2 = Intelligence and Development Scales–2; h2 = communality; u2 = uniqueness.

APPENDIX A: Study 1 48
Discussion
The aim of this study was to examine the factor structure of the IDS-2 intelligence and
scholastic skills domains with EFA. Three of the seven theoretically proposed group factors for the
IDS-2 intelligence domain are supported. However, Visual Processing and Abstract Reasoning as well
as Verbal Reasoning and Long-Term Memory are not separable, rendering a five-factor structure for
intelligence with Abstract Visual Reasoning, Processing Speed, Auditory Short-Term Memory,
Visuospatial Short-Term Memory, and Semantic Long-Term Memory. Adding scholastic skills resulted
in a six-factor structure with an additional factor Reading/Writing. Logical–Mathematical Reasoning
had a loading on Abstract Visual Reasoning and the highest general factor loading. A strong general
factor counters a strict separation of the intelligence and scholastic skills domains, and ω reliability
estimates based on S–L solutions confirmed our assumption that for most group factor composites a
higher proportion of true score variance is actually due to the general factor.
Intelligence
Three of the seven theoretically proposed intelligence group factors emerged in all analyses.
Auditory Short-Term Memory, Visuospatial Short-Term Memory, and Processing Speed were
confirmed as group factors in the IDS-2.
In line with Baddeley’s (2003) working memory model, Auditory and Visuospatial Short-Term
Memory were separate factors in all analyses. This may indicate that the traditional measurement with
digit span tasks misses an important aspect of short-term memory (see also Alloway, Gathercole, &
Pickering, 2006) and reflects the finding that visual memory tasks often fail to load on a common short-
term memory factor with verbal memory tasks (Keith & Reynolds, 2010).
Contrary to theoretical assumptions, the factors Abstract Reasoning and Visual Processing
collapsed to a single factor throughout all analyses, providing evidence that the four corresponding
subtests could in fact tap the same construct. This finding is in line with previous research on major
intelligence test batteries (Canivez et al., 2016, 2017; Keith & Reynolds, 2010). For example, as stated
earlier, EFAs conducted by Canivez et al. (2016) for the WISC-V did not support the theoretically
proposed separation of a Visual Spatial and a Fluid Reasoning factor.
Additionally, the factors Verbal Reasoning and Long-Term Memory collapsed to one factor as
well. This is not in line with theoretical expectations, but it is plausible given the nature of the subtests
involved. The Long-Term Memory subtests both require memorization and recall of verbal information,
and the Verbal Reasoning subtests require retrieval of verbal information from long-term memory. The
higher loading of Retelling a Story on Semantic Long-Term Memory reflects its exclusively verbal
content. Describing a Picture had a weaker loading on Semantic Long-Term Memory, and it showed a
cross-loading of approximately the same size on Visuospatial Short-Term Memory in some of the
analyses. This subtest requires memorization and recall of both verbal and visuospatial information,
therefore tapping both verbal and visuospatial memory. It would be interesting to see if, analogous to
the separation of Auditory and Visuospatial Short-Term Memory, Verbal and Visuospatial Long-Term

APPENDIX A: Study 1 49
Memory could be separated on stratum II as well. A separate Visuospatial Long-Term Memory measure
could be especially beneficial for the measurement of long-term memory in individuals with language
disorder, insufficient knowledge of the test language, and dual-language learners; provided that
incremental validity to the general factor and the other group factors is demonstrated. However, we
were not able to further examine this possibility since only one subtest each assessed the verbal and
visuospatial components of Long-Term Memory. Finally, the low number of subtests per factor and
strong general factor may have contributed to the collapse of theoretically meaningful factors here, as
we discuss later.
Adding Scholastic Skills
As expected based on the CHC model, a homogenous factor Reading/Writing emerged that
(together with g) explained most of the variance in the two subtests. The relatively high general factor
loadings of these subtests and high factor intercorrelations in the PA solution suggest Reading/Writing
and the intelligence group factors are part of the same overreaching domain.
Logical–Mathematical Reasoning showed a substantial loading on Abstract Visual Reasoning.
This is in line with CHC, where Quantitative Reasoning is a narrow ability under Fluid Intelligence
(McGrew, 2009). Although the CHC model includes Quantitative Knowledge (the acquired store of
mathematical knowledge) as a separate group factor, reasoning with this knowledge is not part of this
broad ability (McGrew, 2009). Additionally, Logical–Mathematical Reasoning displayed the highest
general factor loading of all subtests in the S–L solution and did not show particularly high uniqueness.
This finding of high general factor and relatively low group factor influence on a mathematical subtest
is consistent with studies on the WISC-V (Canivez et al., 2016, 2017; M. R. Reynolds & Keith, 2017;
Watkins et al., 2017), the WAIS-IV (Canivez & Watkins, 2010b), the SB5 (Canivez, 2008), and the WJ
IV (Dombrowski, McGill, et al., 2018b) for example. Hence, Logical–Mathematical Reasoning is a
potent indicator of general mental ability. However, we were not able to test the possibility of a separate
Quantitative Reasoning factor due to the fact of a single subtest on mathematical skills.
Finally, in both the PA and S–L solutions, Logical–Mathematical Reasoning showed a small
but insubstantial loading on the Reading/Writing factor, suggesting a small additional clustering of the
curriculum-based scholastic skills subtests.
Factor Reliability
We found that ωh is above .80 for the general factor for both S–L solutions; thus, the true score
variance due to the general factor is probably sufficient to build a full-scale IQ. In contrast, ωs is below
.50 for all group factors in both analyses, leaving doubts about the justification of factor scores (Reise
et al., 2013). In fact, a comparison of ωh and ωs for the group factor composites shows that an
important—and in most cases even larger—amount of true score variance is actually due to the general
factor and not the group factor itself. These results are in line with findings on major intelligence test
batteries, for example, the Differential Ability Scales (DAS; Elliott, 1990; Cucina & Howardson, 2017),
the KABC (Kaufman & Kaufman, 2004; Cucina & Howardson, 2017), the KAIT (Cucina &

APPENDIX A: Study 1 50
Howardson, 2017), the WAIS-IV (Nelson et al., 2013; Watkins, 2017), the WISC-V (Canivez et al.,
2016), the WJ-III (Cucina & Howardson, 2017; Dombrowski, 2014), and the WJ-IV (Dombrowski et
al., 2017; Dombrowski, McGill, & Canivez, 2018a). In these studies, ωh for the general factor ranged
from .74 for the WAIS-IV (Nelson et al., 2013) to .91 for the WJ-III (Cucina & Howardson, 2017).
However, with the exceptions of Processing Speed for the WAIS-IV (.64; Nelson et al., 2013) and
WISC-V (.51; Canivez et al., 2016) and Long-Term Memory for the WJ-III (.52; Dombrowski, 2014),
ωs was below .50 for all group factors in the aforementioned studies.
To further determine the usefulness and justification of group factors, future studies should
systematically vary sample heterogeneity as well as age and mean level of intelligence. It has been
found that a general factor explains more variance in more heterogeneous samples and at lower levels
of abilities (Kan, Kievit, Dolan, & van der Maas, 2011; Kovacs & Conway, 2016; Tucker-Drob, 2009).
Thus, factor differentiation could have a profound influence on the amount of true score variance
attributable to the general factor versus the group factors. Another approach to this would be to examine
the effect of intraindividual variability in factor scores directly, assuming that the higher the
intraindividual variability in a particular sample, the higher the group-factor reliability.
Heywood Cases
The seven- and six-factor solutions for the intelligence domain and the eight- and seven-factor
solutions for the intelligence and scholastic skills domains all resulted in Heywood cases. The solutions
with the theoretically proposed number of factors (seven and eight, respectively) not only showed
Heywood cases, but the seven-factor model for intelligence did not convergence after 1,000,000
iterations, and both solutions had factors with only one substantial loading. Hence, these solutions are
not plausible. The solutions with one factor less than hypothesized, however (i.e., the six- and seven-
factor solutions, respectively), both converged and had a minimum of two substantial loadings on each
factor. Both consistently showed a collapse of Abstract Reasoning and Visual Processing, but a
separation of Long-Term Memory and Verbal Reasoning, although with a cross-loading of Retelling a
Story on Verbal Reasoning. Nevertheless, there were Heywood cases for Crossing Out Boxes and
Numbers/Letters (six-factor intelligence) and for Numbers/Letters and Rotated Geometric Figures
(seven-factor intelligence and scholastic skills).
Simulation studies showed that Heywood cases can indicate both model misspecification (in
this case a wrong number of factors) and poor factor recovery (Briggs & MacCallum, 2003; de Winter
& Dodou, 2012; Kolenikov & Bollen, 2012; Ximénez, 2009). At least two potential issues could have
influenced the performance of factor analysis in our study: the presence of weak factors and a low
number of indicators (two per factor).
It has been shown that PA factor analysis is better able to recover weak factors and with this is
less prone to Heywood cases compared to, for example, maximum likelihood (Briggs & MacCallum,
2003; de Winter & Dodou, 2012; Fabrigar et al., 1999; Ximénez, 2009). Thus, this might have been
less of an issue here.

APPENDIX A: Study 1 51
Concerning the second issue, simulation studies found that a low number of indicators per factor
can lead to unstable solutions or underidentification and can prevent a correct factor recovery (Costello
& Osborne, 2005; de Winter & Dodou, 2012; MacCallum, Widaman, Zhang, & Hong, 1999; Velicer &
Fava, 1998). For these reasons, a minimum number of three (Costello & Osborne, 2005; Velicer &
Fava, 1998) or four (Fabrigar et al., 1999) indicators per factor has been recommended.
To conclude, one should be careful not to overinterpret the collapse of potentially meaningful
(if weak) factors in this study in terms of the underlying theory. It could be useful to adapt the current
instrument to achieve higher overdetermination of factors and then reinvestigate its factor structure. Of
course, the resulting expansion of the test would have to be justified by a substantial gain in information
on a group factor level.
Implications
The present results based on the IDS-2 standardization and validation sample provide evidence
for some of the CHC-based group factors. However, as stated above, a strong general factor and the
low group factor reliabilities are more consistent with Carroll’s (1993) conception of the general factor-
to-broad abilities relationship than with Cattell–Horn’s model (Cattell, 1941; Horn & Cattell, 1966).
This result, together with findings on several other major intelligence test batteries, therefore challenges
the usefulness of the CHC model over and above Carroll’s model (Canivez & Youngstrom, in press;
Cucina & Howardson, 2017).
Inspection of model-based reliabilities suggests that individual interpretation should be based
primarily on the full-scale IQ and that factor scores should be interpreted with caution. Further studies
are needed to determine the circumstances under which factor profiles could still be particularly useful,
for example, for individuals with expected strong intraindividual variability in factor scores. To achieve
this, diagnostic and treatment utility as well as incremental validity of factor scores should be
determined. Additionally, Latent Profile Analysis of various normative groups might deliver further
insights into the potential usefulness of factor profiles. Finally, the domination of the general factor for
this test suggests that an additional IQ based on a small number of subtests (e.g. four, as in the RIAS-
2; C. R. Reynolds & Kamphaus, 2015) could be useful for a reliable and valid, but time-saving
measurement of general mental ability.
Strengths and Limitations
A strength of this study is the large representative sample. Second, the IDS-2 include a large
number of group factors, enabling a comprehensive estimate of cognitive abilities and a fair test of the
underlying CHC model. Third, ω reliability analyses allowed for a separation of the true score variance
of the group factor composites as well as the whole scale in general-factor and group-factor variance.
Despite these advantages and despite growing evidence of its superiority over Cronbach’s alpha as a
reliability estimate of multidimensional scales (Crutzen & Peters, 2017; Gignac, 2014; Reise et al.,
2013; Watkins, 2017), ω is still less reported (Padilla & Divers, 2016; Reise et al., 2013).

APPENDIX A: Study 1 52
Our study has at least two limitations. First, the hypothesized intelligence factors are
represented by only two subtests each, which is suboptimal (Costello & Osborne, 2005; Fabrigar et al.,
1999; Watkins, 2018). However, from a practical perspective, to reduce the time investment of the
participant, only a limited number of subtests can be included in a test. While constructing the IDS-2,
it was decided that a higher number of factors with a lower number of indicators was more beneficial
for a holistic measurement of intelligence than a low number of factors with more indicators. However,
as stated above, developing more subtests per factor should be a goal for future adaptations of the test.
Second, we used exploratory (i.e., data driven) methods, which made it impossible to test between
theoretically specified models as, for example, with CFA. However, the benefit of EFA is precisely that
it is unaffected by prior theoretical considerations of the investigator. It is therefore useful to use EFA
as well as CFA to determine the factor structure of a given construct. Hence, as a next step, the EFA-
based structure found here will be tested against possible alternative models using CFA, and age and
sex invariance will be examined.
Conclusion
In conclusion, the theoretical structure of the IDS-2 intelligence domain was partly supported,
but the hypothesized factors Visual Processing and Abstract Reasoning collapsed to Abstract Visual
Reasoning and Verbal Reasoning and Long-Term Memory collapsed to Semantic Long-Term Memory.
Additionally, a data-driven separation of the intelligence and scholastic skills domains did not hold, as
the related subtests were encompassed by a strong general factor explaining most of the true score
variance. For most group factor composites, the true score variance explained by the group factor was
considerably smaller than that explained by the general factor. Thus, it remains to be empirically
investigated under which circumstances (e.g., high intraindividual variability due to developmental
abnormalities) the interpretation of individual factor scores could still be useful.

APPENDIX A: Study 1 53
References
Alfonso, V. C., Flanagan, D. P., & Radwan, S. (2005). The impact of the Cattell–Horn–Carroll Theory
on test development and interpretation of cognitive and academic abilities. In D. P. Flanagan
& P. L. Harrison (Eds.), Contemporary intellectual assessment: Theories, tests, and issues (2nd
ed., pp. 185–202). New York, NY: Guilford Press.
Alloway, T. P., Gathercole, S. E., & Pickering, S. J. (2006). Verbal and visuospatial short-term and
working memory in children: Are they separable? Child Development, 77, 1698–1716.
doi:10.1111/j.1467-8624.2006.00968.x
Baddeley, A. (2003). Working memory and language: An overview. Journal of Communication
Disorders, 36, 189–208. doi:10.1016/S0021-9924(03)00019-4
Batty, G. D., Gale, C. R., Tynelius, P., Deary, I. J., & Rasmussen, F. (2009). IQ in early adulthood,
socioeconomic position, and unintentional injury mortality by middle age: A cohort study of
more than 1 million Swedish men. American Journal of Epidemiology, 169, 606–615.
doi:10.1093/aje/kwn381
Bodovski, K., & Farkas, G. (2007). Mathematics growth in early elementary school: The roles of
beginning knowledge, student engagement, and instruction. The Elementary School Journal,
108, 115–130. doi:10.1086/525550
Briggs, N. E., & MacCallum, R. C. (2003). Recovery of weak common factors by maximum likelihood
and ordinary least squares estimation. Multivariate Behavioral Research, 38, 25–56.
doi:10.1207/S15327906MBR3801_2
Brown, T. A. (2015). Confirmatory factor analysis for applied research (2nd ed.). New York, NY:
Guilford Press.
Browne, M. W., & Cudeck, R. (1992). Alternative ways of assessing model fit. Sociological Methods
and Research, 21, 230–258. doi:10.1177/0049124192021002005
Burnham, K. P., & Anderson, D. R. (2004). Multimodel Inference: Understanding AIC and BIC in
Model Selection. Sociological Methods and Research, 33, 261–304.
doi:10.1177/0049124104268644
Canivez, G. L. (2008). Orthogonal higher order factor structure of the Stanford–Binet Intelligence
Scales–Fifth edition for children and adolescents. School Psychology Quarterly, 23, 533–541.
doi:10.1037/a0012884
Canivez, G. L., & Watkins, M. W. (2010a). Exploratory and higher-order factor analyses of the
Wechsler Adult Intelligence Scale–Fourth Edition (WAIS-IV) adolescent subsample. School
Psychology Quarterly, 25(4), 223–235. doi:10.1037/a0022046
Canivez, G. L., & Watkins, M. W. (2010b). Investigation of the factor structure of the Wechsler Adult
Intelligence Scale–Fourth Edition (WAIS-IV): Exploratory and higher order factor analyses.
Psychological Assessment, 22, 827–836. doi:10.1037/a0020429

APPENDIX A: Study 1 54
Canivez, G. L., Watkins, M. W., & Dombrowski, S. C. (2016). Factor structure of the Wechsler
Intelligence Scale for Children–Fifth Edition: Exploratory factor analyses with the 16 primary
and secondary subtests. Psychological Assessment, 28, 975–986. doi:10.1037/pas0000238
Canivez, G. L., Watkins, M. W., & Dombrowski, S. C. (2017). Structural validity of the Wechsler
Intelligence Scale for Children–Fifth Edition: Confirmatory factor analyses with the 16 primary
and secondary subtests. Psychological Assessment, 29, 458–472. doi:10.1037/pas0000358
Canivez, G. L., & Youngstrom, E. A. (in press). Challenges to Cattell–Horn–Carroll theory: Empirical,
clinical, and policy implications. Applied Measurement in Education.
Carroll, J. B. (1993). Human cognitive abilities: A survey of factor-analytic studies. New York, NY:
Cambridge University Press.
Cattell, R. B. (1941). Some theoretical issues in adult intelligence testing. Psychological Bulletin, 38,
592.
Cattell, R. B. (1966). The scree test for the number of factors. Multivariate Behavioral Research, 1,
245–276. doi:10.1207/s15327906mbr0102_10
Chen, F. F. (2007). Sensitivity of goodness of fit indexes to lack of measurement invariance. Structural
Equation Modeling: A Multidisciplinary Journal, 14, 464–504. doi:10.1080/
10705510701301834
Cheung, G. W., & Rensvold, R. B. (2002). Evaluating goodness-of-fit indexes for testing measurement
invariance. Structural Equation Modeling, 9(2), 233–255.
Costello, A. B., & Osborne, J. W. (2005). Best practices in exploratory factor analysis: Four
recommendations for getting the most from your analysis. Practical Assessment Research &
Evaluation, 10, 1–9.
Crutzen, R., & Peters, G. Y. (2017). Scale quality: Alpha is an inadequate estimate and factor-analytic
evidence is needed first of all. Health Psychological Review, 11, 242–247.
doi:10.1080/17437199.2015.1124240
Cucina, J. M., & Howardson, G. N. (2017). Woodcock–Johnson–III, Kaufman Adolescent and Adult
Intelligence Test (KAIT), Kaufman Assessment Battery for Children (KABC), and Differential
Ability Scales (DAS) support Carroll but not Cattell–Horn. Psychological Assessment, 29,
1001–1015. doi:10.1037/pas0000389
de Winter, J. C. F., & Dodou, D. (2012). Factor recovery by principal axis factoring and maximum
likelihood factor analysis as a function of factor pattern and sample size. Journal of Applied
Statistics, 39, 695–710. doi:10.1080/02664763.2011.610445
Dombrowski, S. C. (2014). Investigating the structure of the WJ-III Cognitive in early school age
through two exploratory bifactor analysis procedures. Journal of Psychoeducational
Assessment, 32, 483–494. doi:10.1177/0734282914530838

APPENDIX A: Study 1 55
Dombrowski, S. C., Canivez, G. L., & Watkins, M. W. (2018). Factor Structure of the 10 WISC–V
Primary Subtests Across Four Standardization Age Groups. Contemporary School Psychology,
22(1), 90-104. doi:10.1007/s40688-017-0125-2
Dombrowski, S. C., Canivez, G. L., Watkins, M. W., & Beaujean, A. A. (2015). Exploratory bifactor
analysis of the Wechsler Intelligence Scale for Children—Fifth Edition with the 16 primary
and secondary subtests. Intelligence, 53, 194–201. doi:10.1016/j.intell.2015.10.009
Dombrowski, S. C., McGill, R. J., & Canivez, G. L. (2017). Exploratory and hierarchical factor analysis
of the WJ-IV Cognitive at school age. Psychological Assessment, 29, 394–407.
doi:10.1037/pas0000350
Dombrowski, S. C., McGill, R. J., & Canivez, G. L. (2018a). An alternative conceptualization of the
theoretical structure of the Woodcock–Johnson IV tests of cognitive abilities at school age: A
confirmatory factor analytic investigation. Archives of Scientific Psychology, 6, 1–13.
doi:10.1037/arc0000039
Dombrowski, S. C., McGill, R. J., & Canivez, G. L. (2018b). Hierarchical exploratory factor analyses
of the Woodcock–Johnson IV full test battery: Implications for CHC application in school
psychology. School Psychology Quarterly, 33, 235–250. doi:10.1037/spq0000221
Dombrowski, S. C., & Watkins, M. W. (2013). Exploratory and higher order factor analysis of the WJ-
III full test battery: A school-aged analysis. Psychological Assessment, 25, 442–455.
doi:10.1037/a0031335
Dombrowski, S. C., Watkins, M. W., & Brogan, M. J. (2009). An exploratory investigation of the factor
structure of the Reynolds Intellectual Assessment Scales (RIAS). Journal of Psychoeducational
Assessment, 27, 494–507. doi:10.1177/0734282909333179
Elliott, C. D. (1990). Differential Ability Scales. San Antonio, TX: Psychological Corporation.
Fabrigar, L. R., Wegener, D. T., MacCallum, R. C., & Strahan, E. J. (1999). Evaluating the use of
exploratory factor analysis in psychological research. Psychological Methods, 4, 272–299.
doi:10.1037//1082-989X.4.3.272
Fenollar-Cortés, J., & Watkins, M. W. (2018). Construct validity of the Spanish Version of the Wechsler
Intelligence Scale for Children Fifth Edition (WISC-V Spain). International Journal of School
& Educational Psychology, 1–15. doi:10.1080/21683603.2017.1414006
Frazier, T. W., & Youngstrom, E. A. (2007). Historical increase in the number of factors measured by
commercial tests of cognitive ability: Are we overfactoring? Intelligence, 35, 169–182.
doi:10.1016/j.intell.2006.07.002
Gignac, G. E. (2007). Multi-factor modeling in individual differences research: Some recommendations
and suggestions. Personality and Individual Differences, 42, 37–48. doi:10.1016/
j.paid.2006.06.019

APPENDIX A: Study 1 56
Gignac, G. E. (2014). On the inappropriateness of using items to calculate total scale score reliability
via coefficient alpha for multidimensional scales. European Journal of Psychological
Assessment, 30, 130–139. doi:10.1027/1015-5759/a000181
Gottfredson, L. S. (2004). Intelligence: Is it the epidemiologists’ elusive “fundamental cause” of social
class inequalities in health? Journal of Personality and Social Psychology, 86, 174–199.
doi:10.1037/0022-3514.86.1.174
Gottfredson, L. S., & Deary, I. J. (2004). Intelligence predicts health and longevity, but why? Current
Directions in Psychological Science, 13, 1–4. doi:10.1111/j.0963-7214.2004.01301001.x
Grieder, S., & Steiner, M. D. (2019a). Algorithmic Jingle Jungle: Comparison of implementations of
an EFA procedure in R psych versus SPSS, MacOrtho, and Omega. Manuscript in preparation.
Grieder, S., & Steiner, M. D. (2019b). EFAdiff: Implementation of an exploratory factor analysis
procedure to reproduce R psych, SPSS, MacOrtho, and Omega results. Available at:
https://github.com/mdsteiner/EFAdiff.
Grob, A., & Hagmann-von Arx, P. (2018a). Intelligence and Development Scales–2 (IDS-2).
Intelligenz- und Entwicklungsskalen für Kinder und Jugendliche. [Intelligence and
Development Scales for Children and Adolescents.]. Bern, Switzerland: Hogrefe.
Grob, A., & Hagmann-von Arx, P. (2018b). Intelligence and Development Scales–2 (IDS-2).
Intelligenz- und Entwicklungsskalen für Kinder und Jugendliche. Manual zu Theorie,
Interpretation und Gütekriterien [Intelligence and Development Scales for Children and
Adolescents. Manual on theory, interpretation and psychometric criteria]. Bern, Switzerland:
Hogrefe.
Grob, A., Meyer, C. S., & Hagmann-von Arx, P. (2009). Intelligence and Development Scales (IDS).
Intelligenz- und Entwicklungsskalen für Kinder von 5-10 Jahren [Intelligence and
Development Scales (IDS) for children from 5 to 10 years of age]. Bern, Switzerland: Hans
Huber.
Hayton, J. C., Allen, D. G., & Scarpello, V. (2004). Factor retention decisions in exploratory factor
analysis: A tutorial on parallel analysis. Organizational Research Methods, 7, 191–205.
doi:10.1177/1094428104263675
Horn, J. L. (1965). A rationale and test for the number of factors in factor analysis. Psychometrika, 32,
179–185. doi:10.1007/BF02289447
Horn, J. L. (1991). Measurement of intellectual capabilities: A review of theory. In K. S. McGrew, J.
Werder, & R. W. Woodcock (Eds.), WJ-R technical manual (pp. 197–232). Chicago, IL:
Riverside.
Horn, J. L., & Cattell, R. B. (1966). Refinement and test of the theory of fluid and crystallized general
intelligences. Journal of Educational Psychology, 57, 253–270. doi:10.1037/h0023816
Kaiser, H. F. (1960). The application of electronic computers to factor analysis. Educational and
Psychological Measurement, 20, 141–151. doi:10.1177/001316446002000116

APPENDIX A: Study 1 57
Kan, K.-J., Kievit, R. A., Dolan, C., & van der Maas, H. (2011). On the interpretation of the CHC factor
Gc. Intelligence, 39, 292–302. doi:10.1016/j.intell.2011.05.003
Kaufman, A. S. (1993). Joint exploratory factor analysis of the Kaufman Assessment Battery for
Children and the Kaufman Adolescent and Adult Intelligence Test for 11- and 12-year-olds.
Journal of Clinical Child Psychology, 22, 355–364. doi:10.1207/s15374424jccp2203_6
Kaufman, A. S., & Kaufman, N. L. (1983). Kaufman Assessment Battery for Children. Circle Pines,
MN: American Guidance Service.
Kaufman, A. S., & Kaufman, N. L. (1993). Kaufman Adolescent & Adult Intelligence Test. Circle Pines,
MN: American Guidance Service.
Kaufman, A. S., & Kaufman, N. L. (2004). Kaufman Assessment Battery for Children (2nd ed.). Circle
Pines, MN: American Guidance Service.
Keith, T. Z. (2005). Using confirmatory factor analysis to aid in understanding the constructs measured
by intelligence tests. In D. P. Flanagan & P. L. Harrison (Eds.), Contemporary Intellectual
Assessment: Theories, Tests, and Issues (2nd ed., pp. 581–614). New York, NY: Guilford Press.
Keith, T. Z., & Reynolds, M. R. (2010). Cattell–Horn–Carroll abilities and cognitive tests: What we've
learned from 20 years of research. Psychology in the Schools, 47, 635–650.
doi:10.1002/pits.20496
Kolenikov, S., & Bollen, K. (2012). Testing negative error variances: Is a Heywood case a symptom of
misspecification? Sociological Methods and Research, 41, 124–167.
doi:10.1177/0049124112442138
Kovacs, K., & Conway, A. R. A. (2016). Process overlap theory: A unified account of the general factor
of intelligence. Psychological Inquiry, 27, 151–177. doi:10.1080/1047840X.2016.1153946
Lecerf, T., & Canivez, G. L. (2018). Complementary exploratory and confirmatory factor analyses of
the French WISC-V: Analyses based on the standardization sample. Psychological Assessment,
30, 793–808. doi:10.1037/pas0000526
Lubinski, D. (2004). Introduction to the special section on cognitive abilities: 100 years after
Spearman’s (1904) “‘General intelligence,’ objectively determined and measured”. Journal of
Personality and Social Psychology, 86, 96–111. doi:10.1037/0022-3514.86.1.96
MacCallum, R. C., Widaman, K. F., Zhang, S., & Hong, S. (1999). Sample size in factor analysis.
Psychological Methods, 4, 84–99. doi:10.1037/1082-989X.4.1.84
McGrew, K. S. (1997). Analysis of the major intelligence batteries according to a proposed
comprehensive Gf–Gc framework. In D. P. Flanagan, J. L. Genshaft, & P. L. Harrison (Eds.),
Contemporary intellectual assessment: Theories, tests, and issues (pp. 151–179). New York,
NY: Guilford Press.
McGrew, K. S. (2009). CHC theory and the human cognitive abilities project: Standing on the shoulders
of the giants of psychometric intelligence research. Intelligence, 37, 1–10.
doi:10.1016/j.intell.2008.08.004

APPENDIX A: Study 1 58
Nelson, J. M., Canivez, G. L., & Watkins, M. W. (2013). Structural and incremental validity of the
Wechsler Adult Intelligence Scale–Fourth Edition with a clinical sample. Psychological
Assessment, 25, 618–630. doi:10.1037/a0032086
Organization for Economic Co-operation and Development (2016). PISA 2015 results (Volume I):
Excellence and equity in education. Paris, France: OECD Publishing.
Padilla, M. A., & Divers, J. (2016). A comparison of composite reliability estimators: Coefficient
omega confidence intervals in the current literature. Educational and Psychological
Measurement, 76, 436–453. doi:10.1177/0013164415593776
Preacher, K. J., Zhang, G., Kim, C., & Mels, G. (2013). Choosing the optimal number of factors in
exploratory factor analysis: A model selection perspective. Multivariate Behavioral Research,
48, 28–56. doi:10.1080/00273171.2012.710386
R Core Team (2016). R: A language and environment for statistical computing. Vienna, Austria: R
Foundation for Statistical Computing.
Reise, S. P. (2012). The rediscovery of bifactor measurement models. Multivariate Behavioral
Research, 47, 667–696. doi:10.1080/00273171.2012.715555
Reise, S. P., Bonifay, W. E., & Haviland, M. G. (2013). Scoring and modeling psychological measures
in the presence of multidimensionality. Journal of Personality Assessment, 95, 129–140.
doi:10.1080/00223891.2012.725437
Revelle, W. (2017). psych: Procedures for personality and psychological research (Version 1.7.8).
Evanston, IL: Northwestern University. Retrieved from https://CRAN.R-
project.org/package=psych
Reynolds, C. R., & Kamphaus, R. W. (2003). Reynolds Intellectual Assessment Scales: Professional
manual. Lutz, FL: PAR.
Reynolds, C. R., & Kamphaus, R. W. (2015). Reynolds Intellectual Assessment Scales–2. Lutz, FL:
PAR.
Reynolds, M. R., & Keith, T. Z. (2017). Multi-group and hierarchical confirmatory factor analysis of
the Wechsler Intelligence Scale for Children—Fifth Edition: What does it measure?
Intelligence, 62, 31–47. doi:10.1016/j.intell.2017.02.005
Roid, G. (2003). Stanford–Binet Intelligence Scales (5th ed.). Itasca, IL: Riverside.
Roth, B., Becker, N., Romeyke, S., Schäfer, S., Domnick, F., & Spinath, F. M. (2015). Intelligence and
school grades: A meta-analysis. Intelligence, 53, 118–137. doi:10.1016/j.intell.2015.09.002
Schmid, J., & Leiman, J. M. (1957). The development of hierarchical factor solutions. Psychometrika,
22, 53–61.
Schmitt, T. A. (2011). Current methodological considerations in exploratory and confirmatory factor
analysis. Journal of Psychoeducational Assessment, 29, 304–321. doi:10.1177/
0734282911406653

APPENDIX A: Study 1 59
Schrank, F. A., McGrew, K. S., Mather, N., & Woodcock, R. W. (2014). Woodcock–Johnson IV.
Rolling Meadows, IL: Riverside Publishing.
Schwarz, G. (1978). Estimating the dimension of a model. Annals of Statistics, 6, 461–464.
doi:10.1214/aos/1176344136
Sirin, S. R. (2005). Socioeconomic status and academic achievement: A meta-analytic review of
research. Review of Educational Research, 75, 417–753. doi:10.3102/00346543075003417
Spearman, C. (1904). "General Intelligence," objectively determined and measured. The American
Journal of Psychology, 15, 201–292. doi:10.2307/1412107
Steiger, J. H., & Lind, J. C. (1980). Statistically based tests for the number of common factors. Paper
presented at the annual meeting of the Psychometric Society, Iowa City, IA.
Tarchi, C. (2010). Reading comprehension of informative texts in secondary school: A focus on direct
and indirect effects of reader's prior knowledge. Learning and Individual Differences, 20, 415–
420. doi:10.1016/j.lindif.2010.04.002
Tucker-Drob, E. M. (2009). Differentiation of cognitive abilities across the lifespan. Developmental
Psychology, 45, 1097–1118. doi:10.1037/a0015864
Velicer, W. F., & Fava, J. L. (1998). Effects of variable and subject sampling on factor pattern recovery.
Psychological Methods, 3, 231–251. doi:10.1037/1082-989X.3.2.231
Watkins, M. W. (2017). The reliability of multidimensional neuropsychological measures: From alpha
to omega. Clinical Neuropsychology, 31, 1113–1126. doi:10.1080/13854046.2017.1317364
Watkins, M. W. (2018). Exploratory factor analysis: A guide to best practice. Journal of Black
Psychology, 44, 219–246. doi:10.1177/0095798418771807
Watkins, M. W., Dombrowski, S. C., & Canivez, G. L. (2017). Reliability and factorial validity of the
Canadian Wechsler Intelligence Scale for Children–Fifth Edition. International Journal of
School & Educational Psychology, 1–14. doi:10.1080/21683603.2017.1342580
Wechsler, D. (2003). Wechsler Intelligence Scale for Children (4th ed.). San Antonio, TX: NCS
Pearson.
Wechsler, D. (2008). Wechsler Adult Intelligence Scale (4th ed.). San Antonio, TX: NCS Pearson.
Wechsler, D. (2014). Wechsler Intelligence Scale for Children (5th ed.). San Antonio, TX: NCS
Pearson.
Woodcock, R. W., McGrew, K. S., & Mather, N. (2001). Woodcock–Johnson III. Chicago, IL:
Riverside.
Ximénez, C. (2009). Recovery of weak factor loadings in confirmatory factor analysis under conditions
of model misspecification. Behavior Research Methods, 41, 1038–1052.
doi:10.3758/BRM.41.4.1038

APPENDIX A: Study 1 60
Appendix
Table A1. Intercorrelations of Scaled Subtest Scores for the IDS-2 Intelligence Domain (N = 1,991)
Subtest 1 2 3 4 5 6 7 8 9 10 11 12 13 14
1. Geometric Shapes - .40 .35 .43 .39 .36 .31 .35 .47 .38 .41 .40 .31 .18
2. Plates .40 - .26 .28 .30 .29 .23 .29 .36 .30 .27 .28 .25 .22
3. Two Characteristics .35 .26 - .62 .35 .33 .26 .31 .38 .31 .33 .33 .33 .24
4. Crossing Out Boxes .43 .28 .62 - .34 .30 .27 .33 .38 .32 .31 .32 .31 .22
5. Numbers/Letters .39 .30 .35 .34 - .77 .34 .37 .40 .37 .43 .46 .37 .21
6. Numbers/Letters Mixed
.36 .29 .33 .30 .77 - .32 .38 .37 .33 .41 .45 .38 .22
7. Geometric Figures .31 .23 .26 .27 .34 .32 - .53 .34 .30 .28 .29 .29 .24
8. Rotated Geometric Figures
.35 .29 .31 .33 .37 .38 .53 - .40 .35 .31 .34 .33 .29
9. Completing Matrices .47 .36 .38 .38 .40 .37 .34 .40 - .44 .39 .38 .36 .26 10. Excluding Pictures .38 .30 .31 .32 .37 .33 .30 .35 .44 - .37 .36 .33 .25
11. Categories .41 .27 .33 .31 .43 .41 .28 .31 .39 .37 - .63 .48 .25
12. Opposites .40 .28 .33 .32 .46 .45 .29 .34 .38 .36 .63 - .51 .25
13. Retelling a Story .31 .25 .33 .31 .37 .38 .29 .33 .36 .33 .48 .51 - .40 14. Describing a Picture .18 .22 .24 .22 .21 .22 .24 .29 .26 .25 .25 .25 .40 -
M 10.07 10.06 9.95 9.96 10.38 10.40 10.17 10.09 10.26 10.23 10.33 10.35 10.06 10.27
SD 3.20 3.18 3.13 3.15 3.20 3.11 3.06 3.07 3.14 3.18 3.22 3.16 3.16 3.08
Skewness -0.11 -0.14 -0.31 -0.18 -0.20 -0.24 0.28 0.11 0.01 -0.08 -0.49 -0.47 -0.40 0.07
Kurtosis 0.34 0.30 0.81 0.79 0.51 0.63 0.43 0.91 -0.04 0.31 0.59 0.52 0.45 0.34
Cronbach’s alpha .97 .97 .97 .96 .96 .96 .92 .93 .98 .96 .98 .98 .96 .95
McDonald’s omega .97 .97 .97 .97 .96 .96 .92 .93 .98 .96 .98 .98 .96 .95
Note. The highest correlations (row-wise) are in bold. Correlations of related intelligence subtests are highlighted in gray. All correlations are significant with p < .001. IDS-2 = Intelligence and Development Scales–2.
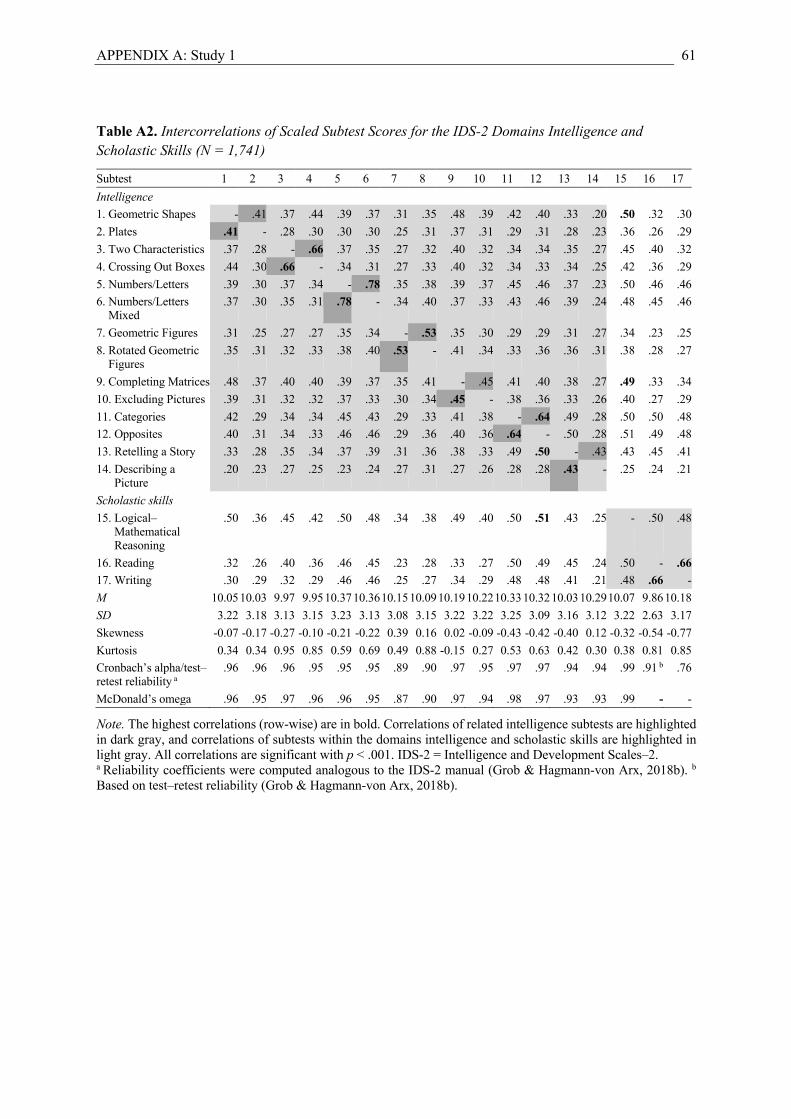
APPENDIX A: Study 1 61
Table A2. Intercorrelations of Scaled Subtest Scores for the IDS-2 Domains Intelligence and Scholastic Skills (N = 1,741)
Subtest 1 2 3 4 5 6 7 8 9 10 11 12 13 14 15 16 17 Intelligence 1. Geometric Shapes - .41 .37 .44 .39 .37 .31 .35 .48 .39 .42 .40 .33 .20 .50 .32 .30 2. Plates .41 - .28 .30 .30 .30 .25 .31 .37 .31 .29 .31 .28 .23 .36 .26 .29 3. Two Characteristics .37 .28 - .66 .37 .35 .27 .32 .40 .32 .34 .34 .35 .27 .45 .40 .32 4. Crossing Out Boxes .44 .30 .66 - .34 .31 .27 .33 .40 .32 .34 .33 .34 .25 .42 .36 .29 5. Numbers/Letters .39 .30 .37 .34 - .78 .35 .38 .39 .37 .45 .46 .37 .23 .50 .46 .46 6. Numbers/Letters Mixed
.37 .30 .35 .31 .78 - .34 .40 .37 .33 .43 .46 .39 .24 .48 .45 .46
7. Geometric Figures .31 .25 .27 .27 .35 .34 - .53 .35 .30 .29 .29 .31 .27 .34 .23 .25 8. Rotated Geometric Figures
.35 .31 .32 .33 .38 .40 .53 - .41 .34 .33 .36 .36 .31 .38 .28 .27
9. Completing Matrices .48 .37 .40 .40 .39 .37 .35 .41 - .45 .41 .40 .38 .27 .49 .33 .34 10. Excluding Pictures .39 .31 .32 .32 .37 .33 .30 .34 .45 - .38 .36 .33 .26 .40 .27 .29 11. Categories .42 .29 .34 .34 .45 .43 .29 .33 .41 .38 - .64 .49 .28 .50 .50 .48 12. Opposites .40 .31 .34 .33 .46 .46 .29 .36 .40 .36 .64 - .50 .28 .51 .49 .48 13. Retelling a Story .33 .28 .35 .34 .37 .39 .31 .36 .38 .33 .49 .50 - .43 .43 .45 .41 14. Describing a Picture
.20 .23 .27 .25 .23 .24 .27 .31 .27 .26 .28 .28 .43 - .25 .24 .21
Scholastic skills 15. Logical– Mathematical Reasoning
.50 .36 .45 .42 .50 .48 .34 .38 .49 .40 .50 .51 .43 .25 - .50 .48
16. Reading .32 .26 .40 .36 .46 .45 .23 .28 .33 .27 .50 .49 .45 .24 .50 - .66 17. Writing .30 .29 .32 .29 .46 .46 .25 .27 .34 .29 .48 .48 .41 .21 .48 .66 - M 10.05 10.03 9.97 9.95 10.37 10.36 10.15 10.09 10.19 10.22 10.33 10.32 10.03 10.29 10.07 9.86 10.18 SD 3.22 3.18 3.13 3.15 3.23 3.13 3.08 3.15 3.22 3.22 3.25 3.09 3.16 3.12 3.22 2.63 3.17 Skewness -0.07 -0.17 -0.27 -0.10 -0.21 -0.22 0.39 0.16 0.02 -0.09 -0.43 -0.42 -0.40 0.12 -0.32 -0.54 -0.77 Kurtosis 0.34 0.34 0.95 0.85 0.59 0.69 0.49 0.88 -0.15 0.27 0.53 0.63 0.42 0.30 0.38 0.81 0.85 Cronbach’s alpha/test–retest reliability a
.96 .96 .96 .95 .95 .95 .89 .90 .97 .95 .97 .97 .94 .94 .99 .91 b .76
McDonald’s omega .96 .95 .97 .96 .96 .95 .87 .90 .97 .94 .98 .97 .93 .93 .99 - -
Note. The highest correlations (row-wise) are in bold. Correlations of related intelligence subtests are highlighted in dark gray, and correlations of subtests within the domains intelligence and scholastic skills are highlighted in light gray. All correlations are significant with p < .001. IDS-2 = Intelligence and Development Scales–2. a Reliability coefficients were computed analogous to the IDS-2 manual (Grob & Hagmann-von Arx, 2018b). b
Based on test–retest reliability (Grob & Hagmann-von Arx, 2018b).

APPENDIX B: Study 2 62
APPENDIX B: Study 2
Grieder, S., Timmerman, M. E., Visser, L., Ruiter, S. A. J., & Grob, A. (2021). Factor structure of the
Intelligence and Development Scales–2: Measurement invariance across the Dutch and German
versions, sex, and age. Manuscript submitted for publication. PsyArXiv Preprint.
https://doi.org/10.31234/osf.io/vtw3g

APPENDIX B: Study 2 63
Factor Structure of the Intelligence and Development Scales–2: Measurement Invariance
Across the Dutch and German Versions, Sex, and Age
Silvia Grieder1, Marieke E. Timmerman2, Linda Visser3, Selma A. J. Ruiter4, and Alexander Grob1
1 Department of Psychology, University of Basel 2 Heymans Institute for Psychological Research, University of Groningen
3 Department of Education and Human Development, DIPF | Leibniz Institute for Research and
Information in Education 4 De Kinder Academie Groningen, Centre of Expertise for Child Development Care and Research
Author Note
We thank Anita Todd for proofreading and copyediting. We declare the following potential
conflicts of interest: Marieke E. Timmerman, Linda Visser, Selma A. J. Ruiter, and Alexander Grob
are recipients of royalties for the Dutch Intelligence and Development Scales–2 (IDS-2), and Alexander
Grob is recipient of royalties for the German IDS-2.
Correspondence concerning this article should be addressed to Silvia Grieder, Division of
Developmental and Personality Psychology, Department of Psychology, University of Basel,
Missionsstrasse 62, 4055 Basel, Switzerland. Email: [email protected]

APPENDIX B: Study 2 64
Abstract
We examined the factor structure of the intelligence and basic skills domains of the German and Dutch
versions of an international test battery with 13 representative national standardizations (among others,
Italian, Polish, U.K.)—the Intelligence and Development Scales–2 (IDS-2)—with confirmatory factor
analyses (CFA) of the standardization samples. This included measurement invariance analyses across
the Dutch and German versions and sex using multiple-group CFA, and across age using local structural
equation modeling (LSEM). We tested several a priori theoretically (mostly following the Cattell–
Horn–Carroll and verbal–perceptual–image rotation models) and empirically (with EFA) determined
models and found a second-order model with six first-order factors best represented the Dutch IDS-2
structure. Five IDS-2 factors were confirmed, but Visual Processing and Abstract Reasoning and the
intelligence and basic skills domains were not separable. This final model displayed full invariance
across the Dutch and German versions and partial scalar invariance across sex, and it was largely
invariant across ages 7 to 20 years. Thus, scores derived according to this final model will be
comparable across these language versions, sex, and age. The strong general intelligence factor and
weak broad ability factors suggest clinical interpretation should mainly be based on the full-scale IQ.
We discuss the importance of testing multiple plausible models and adhering to a strict model selection
procedure in CFA and implications for intelligence theory and clinical practice.
Keywords: Intelligence and Development Scales–2, intelligence, structural validity,
confirmatory factor analysis, measurement invariance, local structural equation modeling, age, sex,
language
APPENDIX B: Study 2 65
Introduction
Validation of a test is crucial to determine its usefulness and ability to measure the intended
constructs. If the interpretation of the test’s scores is based on a hypothesized internal structure,
evidence concerning this structure should be provided as part of the validation process, for example,
using factor analysis (American Educational Research Association et al., 2014). Especially for new
tests, it is useful to consider both data- and theory-driven approaches to determine a test’s factor
structure. A reasonable strategy for structural validation of a test is first to conduct an EFA and then to
test the factor structure found in the EFA against theorized alternative models using CFA on a new
sample (e.g., Brown, 2015; Reise, 2012). Once the most useful factor structure has been determined
with a large, representative sample, measurement invariance should be tested across subgroups differing
in important demographic characteristics such as native language, ethnicity, sex, and age. If this is
demonstrated, the factor structure and thus the score interpretation will be consistent across these
different groups. In the present study, we adopted the procedure outlined above for the structural
validation of a new test—the Intelligence and Development Scales–2 (IDS-2; Grob & Hagmann-von
Arx, 2018).
Topical Intelligence Theories
One of the most popular intelligence models to date is the Cattell–Horn–Carroll (CHC) model
(McGrew, 1997; Schneider & McGrew, 2018). The CHC model is an integration of Cattell and Horn’s
fluid–crystallized model (Cattell, 1941; Horn, 1991) and Carroll’s (1993) three-stratum model. It
postulates a higher-order intelligence structure with over 80 narrow abilities on Stratum I and, in its
most recent version (Schneider & McGrew, 2018), at least 14 broad abilities on Stratum II (see Table
S1). Although general intelligence is most often included on Stratum III (consistent with Carroll’s
model), the CHC authors themselves are skeptical about it being a useful construct (Schneider &
McGrew, 2018).
The CHC model has been widely used as a comprehensive framework in intelligence research
and test construction, but it has also faced criticism. Especially its de-emphasis of general intelligence
in favor of broad abilities has been criticized, given extensive evidence for the dominance of general
intelligence and often small incremental validity of broad abilities (e.g., Canivez & Youngstrom, 2019;
Cucina & Howardson, 2017). Further criticism concerns insufficient tests of plausible alternative
models in CHC research with either EFA or CFA (Canivez & Youngstrom, 2019).
The CHC model is not without alternatives. In fact, the verbal–perceptual–image rotation
(VPR) model, proposed by Johnson and Bouchard (2005), has been shown to outperform Cattell–
Horn’s and Carroll’s models (Johnson et al., 2007; Johnson & Bouchard, 2005) as well as the CHC
model (Major et al., 2012). The VPR model is an adaptation and extension of one of the first hierarchical
models introduced by Vernon (1950). It features a four-stratum structure with numerous specific factors
on Stratum I, several minor group factors on Stratum II, three major group factors—verbal, perceptual,
and image rotation—on Stratum III, and a general intelligence factor on Stratum IV. Johnson and

APPENDIX B: Study 2 66
Bouchard (2005) argued that the categorization of human intelligence into verbal, perceptual, and image
rotation is theoretically superior to the categorization into fluid and crystallized, and the research cited
above suggests that the VPR model might be empirically superior to other popular intelligence models
as well. The present study aimed to test and compare multiple theory-driven intelligence models—in
particular ones based on the VPR and CHC models—for the structural validation of the IDS-2.
The IDS-2
The IDS-2 (Grob & Hagmann-von Arx, 2018) assesses cognitive and developmental functions
in 5- to 20-year-olds. The original form of the IDS-2 is the German version. Based on this version,
international adaptations and standardizations of 12 additional language versions—namely, Brazilian,
Danish, Dutch, Finnish, French, Italian, Norwegian, Polish, Swedish, Spanish, U.K., and U.S.—have
been or are being developed. One of these versions for which the standardization is completed is the
Dutch IDS-2 (Grob et al., 2018). Results of the present study are based on both the German and Dutch
IDS-2 versions.
For the intelligence and basic skills domains, the IDS-2 largely complies with the CHC
taxonomy (Schneider & McGrew, 2018; see Figure 1 for a representation of the IDS-2 model). The
intelligence domain includes 14 subtests that enable the assessment of seven broad abilities largely
corresponding to the CHC broad abilities (e.g., Visual Processing [VP] and Processing Speed [PS]; see
Table S1). Deviations from current CHC broad abilities include the separation of short-term memory
into an auditory and a visual–spatial component (narrow abilities of Working Memory Capacity [Gwm]
in the CHC model), and the combination of long-term storage and retrieval (corresponding to the former
CHC broad ability of the same name [Glr]). Furthermore, general intelligence is measured with a full-
scale IQ consisting of all 14 intelligence subtests. The basic skills subtests Language Skills (LS),
Logical–Mathematical Reasoning (LMR), Reading (RE), and Spelling (SPE) can also be integrated in
the CHC framework: LS partly (but not exclusively) measures Auditory Processing (Ga), LMR contains
aspects of Fluid Reasoning (Gf) and Quantitative Knowledge (Gq), and RE and SPE measure Reading
and Writing (Grw). The reason these subtests were not included in the intelligence domain is their
dependence on prior knowledge (Bodovski & Farkas, 2007; Tarchi, 2010). In the present study, we
focused on all 14 intelligence subtests and the three basic skills subtests LMR, RE, and SPE. We
excluded LS, because it predominantly measures language skills and not Ga.
Factor Structure
Structural validation is crucial to determine the appropriateness of test score interpretations that
are based on a hypothesized internal structure. The structural validity evidence included in the IDS-2
manuals is based on CFAs with the standardization samples and is restricted to the intelligence domain
(Grob et al., 2018; Grob & Hagmann-von Arx, 2018). For both the German and the Dutch IDS-2
version, the theoretical model—with all 14 subtests on Stratum I, seven broad abilities on Stratum II,
and general intelligence on Stratum III (see the IDS-2 model in Figure 1, without basic skills)—
displayed good fit (comparative fit index [CFI] = .97 and .98, and root mean square error of

APPENDIX B: Study 2 67
approximation [RMSEA] = .04 and .04 for the German and Dutch IDS-2, respectively). Still, further
evidence for structural validity is needed for at least two reasons. First, no alternative models (including
bifactor models; Reise, 2012) were examined, neither with EFAs nor with CFAs; and second, no
structural validity evidence was provided for the IDS-2 domains other than the intelligence domain. To
address some of these shortcomings, Grieder and Grob (2020) examined the factor structures for the
IDS-2 intelligence domain as well as for the intelligence and basic skills domains combined with EFA,
using the German standardization and validation sample. Results supported the theoretical IDS-2
structure for intelligence, with the exceptions of VP and Abstract Reasoning (AR) collapsing to one
factor named Abstract Visual Reasoning (AVR), and Long-Term Memory (LM) and Verbal Reasoning
(VR) collapsing to one factor named Semantic Long-Term Memory (SLM), resulting in a five-factor
model. Adding the three basic skills subtests LMR, RE, and SPE resulted in a six-factor structure with
an additional factor Reading and Writing (RW), and with LMR showing a substantial loading on AVR
and the highest general intelligence factor loading in a Schmid–Leiman solution (see EFA-Based Model
1 in Figures 1 and S1). A model with separate LM and VR factors, but with a cross-loading of Story
Recall (SR) on VR, was also plausible, but it showed Heywood cases and was therefore discarded (see
EFA-Based Model 2 in Figures 1 and S1). The explained variances and McDonald’s omegas
(McDonald, 1985, 1999) based on a Schmid–Leiman solution revealed a strong general intelligence
factor and weak broad ability factors. To conclude, the EFA results partly supported the IDS-2 model.
A separation of intelligence and basic skills domains did not hold empirically, because there was a
strong general intelligence factor encompassing all subtests. In the present study, we tested this EFA-
based factor structure, as well as the second plausible model that displayed Heywood cases in Grieder
and Grob (2020), against the IDS-2 model, and against plausible alternative models using CFA with a
new sample (i.e., the Dutch standardization sample).
Measurement Invariance
After determining the most plausible factor structure, measurement invariance of this structure
across subgroups differing in important demographic characteristics should be investigated to ensure
test scores can be interpreted equally across these groups. Invariance analyses are usually performed
with multiple-group CFAs (MGCFAs; e.g., Steenkamp & Baumgartner, 1998), where a series of models
with parameters increasingly constrained to be equal across groups is fitted. Invariance testing usually
starts with configural invariance (i.e., the same factor model is fitted without equality constraints) and
continues with metric invariance (i.e., invariance of loadings), scalar invariance (i.e., additional
invariance of intercepts), and strict invariance (i.e., additional invariance of residuals).
For the IDS-2, no evidence exists as yet for invariance across the different language versions,
and we examined measurement invariance of the intelligence and basic skills domains across the Dutch
and German IDS-2 using MGCFAs. In contrast, there is evidence for measurement invariance across
sex and age for the IDS-2 intelligence domain. Results from MGCFAs reported in the manuals
supported full invariance for the Dutch IDS-2 and partial scalar invariance for the German IDS-2 across

APPENDIX B: Study 2 68
sex, and full invariance across the age groups of 5–8 years, 9–12 years, and 13–20 years for both the
German and the Dutch IDS-2 for the theoretical IDS-2 model (Grob et al., 2018; Grob & Hagmann-von
Arx, 2018). Nevertheless, it is still useful to test sex and age invariance on the final model in the present
study, as this does not necessarily correspond to the theoretical IDS-2 model, and as it also contains the
basic skills subtests, for which no sex and age invariance results exist as yet. We therefore investigated
measurement invariance of the IDS-2 intelligence and basic skills domains across sex using MGCFAs.
Regarding age invariance, most previous studies—as the ones reported in the IDS-2 manuals—used
MGCFAs with defined age groups to investigate measurement invariance. Meanwhile, however, more
sophisticated methods have become available that take the continuous nature of age explicitly into
account. One such method is local structural equation modeling (LSEM; Hildebrandt et al., 2009, 2016),
where each value of a predefined moderator variable is evaluated. As in nonparametric regression
models, observations near a focal point—at which the model is evaluated—obtain higher weights, and
more distant observations obtain lower weights. We therefore investigated age invariance of the IDS-2
intelligence and basic skills domains using LSEM in the present study.
Figure 1. Higher-Order Models for the Intelligence and Basic Skills Domains
Note. The double-headed arrow indicates a latent correlation. g = general intelligence; V–P = Verbal–Perceptual; EFA = exploratory factor analysis; IDS-2 = Intelligence and Development Scales–2; VPR = Verbal–Perceptual–Image Rotation; CHC = Cattell–Horn–Carroll; V = Verbal; P = Perceptual; Gv = Visual Processing; Gs = Cognitive Processing Speed; Gwm = Working Memory Capacity; Gf = Fluid Reasoning; Gc = Comprehension–Knowledge; Glr = Long-Term Storage and Retrieval; Grw = Reading and Writing; Gq = Quantitative Knowledge; AVR = Abstract Visual Reasoning; PS = Processing Speed; ASM = Auditory Short-Term Memory; VSM = Visual–Spatial Short-Term Memory; (S)LM = (Semantic) Long-Term Memory; RW = Reading and Writing; VR = Verbal Reasoning; VP = Visual Processing; AR = Abstract Reasoning; BS = Basic Skills; VE = Verbal; SCH = Scholastic; FL = Fluency; NU = Number; SP = Spatial; PES = Perceptual Speed; CM = Content Memory; Wa = Auditory Short-Term Storage; Wv = Visual–Spatial Short-Term Storage; SDE = Shape Design; WD = Washer Design; PA = Parrots; BO = Boxes; DLS = Digit and Letter Span; MDLS = Mixed Digit and Letter Span; SM = Shape Memory; RSM = Rotated Shape Memory; MC = Matrices: Completion; MO = Matrices: Odd One Out; NC = Naming Categories; NO = Naming Opposites; SR = Story Recall; PR = Picture Recall; LMR = Logical–Mathematical Reasoning; RE = Reading; SPE = Spelling.
Stratum / Subtest
g Model
IVIII Gs Gf Gc Glr Gs Gf Gc Glr Gq GrwII g PS ASMVSM SLM PS ASMVSM VR LM PS ASMVSM AR VR LM BS SCH FL SP PES Wa Wv Wa WvSDE ● ●WD ● ●PA ● ● ● ● ● ● ●BO ● ● ● ● ● ● ●DLS ● ● ● ● ● ● ●MDLS ● ● ● ● ● ● ●SM ● ● ● ● ● ●RSM ● ● ● ● ● ●MC ● ● ● ● ●MO ● ● ● ● ●NC ● ● ● ● ● ●NO ● ● ● ● ● ●SR ● ● ● ● ● ● ●PR ● ● ● ● ● ●LMR ● ● ● ●RE ● ● ● ●SPE ● ● ● ●
g g
●●
RW
●●
●●●●
●●●●
●
●●●
●
EFA-Based Model 1
AVR●●
●●
V–P Model
V Pg g
● ●●●
AVR●●
●●
●●
EFA-Based Model 2
RW
IDS-2 Model
VP●●
VPR Model
NUVEV
g
CM
●●
●●
P
●
CHC Model 1
Gv
●●
Gwmg
●●
●●
Grw
CHC Model 2
Gv
●●
Gwmg

APPENDIX B: Study 2 69
Present Study
The present study had four goals: (1) to examine the factor structure of the intelligence and
basic skills domains for the Dutch IDS-2, using its standardization sample; (2) to test measurement
invariance of the resulting final model across the Dutch and German IDS-2 versions; (3) to test
measurement invariance of this final model (or models, if configural invariance does not hold across
language versions) across sex and age for the Dutch and the German IDS-2; and (4) to examine the
relative importance of the general intelligence factor versus the broad ability factors across language
versions, sex, and age using model-based reliability estimates.
The models we tested are based on topical intelligence theories and on EFA results from the
German IDS-2 standardization and validation sample (Grieder & Grob, 2020). For all models, we tested
higher-order (see Figure 1) as well as bifactor (see Figure S1) versions (see supplemental material for
model descriptions). We examined the following research questions and hypotheses: (1) Which of
several theoretically and empirically determined models best represents the structure of the intelligence
and basic skills domains for the Dutch IDS-2? Given the results for the German IDS-2 (Grieder & Grob,
2020), we expected EFA-Based Model 1 to fit best for the Dutch IDS-2. (2) Is measurement invariance
across the Dutch and German IDS-2 versions supported for the final model for the Dutch IDS-2? (3) Is
measurement invariance across (a) sex (females and males1) and (b) age (7 to 20 years) supported for
the final model(s) for the Dutch and German IDS-2? (4) Given the results from Grieder and Grob
(2020), we expected the general intelligence factor to account for the largest share of true score variance
for the final model.
For comparison with results reported in the IDS-2 manuals, we also performed all analyses on
the intelligence domain alone, excluding the basic skills subtests. The methods, results, and a brief
discussion of these analyses are included in the supplemental material. Together with all analysis
scripts, this is available at https://osf.io/azep6/.
Method
Participants
Data from the standardization samples of the Dutch and German IDS-2 (N = 1,665 and N =
1,672, respectively) were used. The samples are described below.
Dutch Sample
For the Dutch IDS-2, 204 participants younger than 7 years of age had to be excluded due to
the minimum age of 7 years required for conducting the RE and SPE subtests. Another 38 were excluded
because more than 50% of the subtest scores were missing, resulting in a final sample of 1,423
participants who were all from the Netherlands. The mean age for this sample was 13.08 years (SD =
3.98, range: 7.00–21.89 years) and 52% were female. The Dutch standardization sample is
1 We use the terms females and males to refer to persons self-identifying as girls and/or women and boys and/or men, respectively.

APPENDIX B: Study 2 70
approximately representative for the Dutch population of children and adolescents aged 5 to 20 years
in terms of sex, ethnic background of the parents, educational background of the mother, degree of
urbanization, region, education type (for secondary school students), and common diagnoses according
to information from Statistics Netherlands (2020) for 2015 to 2016.
German Sample
For the German IDS-2, 254 participants younger than 7 years of age had to be excluded.
Another 13 participants were excluded because more than 50% of the subtest scores were missing. The
final sample therefore consisted of 1,405 participants from Switzerland (n = 812), Germany (n = 517),
and Austria (n = 76). The mean age for this sample was 13.12 years (SD = 3.90, range: 7.01–20.98
years) and 51% were female. The subsamples for Switzerland, Germany, and Austria are approximately
representative for the Swiss, German, and Austrian population of children and adolescents aged 5 to 20
years in terms of sex, educational background of the mother, and education type according to
information from the Swiss Federal Statistical Office (2020), the German Federal Statistical Office
(2020), and Statistics Austria (2020) for 2015 to 2017, respectively.
Materials and Procedure
The IDS-2 is an individually administered test for 5- to 20-year-olds that enables the assessment
of cognitive (intelligence, executive functions) and developmental (psychomotor skills, socioemotional
competence, basic skills, and attitude toward work) functions with 30 subtests. The 14 subtests for
intelligence and three subtests for basic skills are described in Table S1 (see Table S2 for descriptive
statistics). For the German standardization, participants were recruited via schools and psychosocial
institutions for children and adolescents in Switzerland, Germany, and Austria. The Dutch children
were recruited via schools, organizations, personal contacts, and social media. Administration time was
between 3.5 and 4.5 hr, which, if necessary, could be split into two sessions no more than 1 week apart.
Children and adolescents (10- to 20-year-olds) and/or their parents (for 5- to 15-year-olds) provided
written consent prior to testing. Parents or adolescents provided demographic information using a
personally administered questionnaire at the beginning of the first session. Participants received a gift
card of their own choice worth 30 Swiss francs (Switzerland) or 10 euros (The Netherlands), or 25 euros
in cash (Germany, Austria) as reimbursement. Ethical approval was obtained from the Ethics
Commission Northwest and Central Switzerland and from the responsible local ethics committees in
the Netherlands.
Statistical Analyses
All analyses were conducted in R using age-standardized subtest scores (M = 10, SD = 3) as
these are the scores used in practice and for the analyses reported in the IDS-2 manuals. CFAs were
conducted with the lavaan package, version 0.60–7 (Rosseel, 2012) using the full information maximum
likelihood method. McDonald’s omegas were calculated with the EFAtools package, version 0.3.0
(Steiner & Grieder, 2020), and LSEMs were conducted with the Sirt package (Robitzsch, 2020).

APPENDIX B: Study 2 71
Analysis Procedure
The analysis was done stepwise, as follows:
1. We tested the competing models listed in Figures 1 and S1 for the Dutch IDS-2, identified
the best fitting model, and computed McDonald’s omegas for this.
2. Following recommendations from Steenkamp and Baumgartner (1998), we first tested for
equality of covariance matrices and mean vectors between the Dutch and German IDS-2
versions (Step 2a) using Box’s M test (Box, 1949) and the procedure proposed by Nel and
Van der Merwe (1986), respectively. If equality was not supported, we continued with an
MGCFA, testing measurement invariance across the Dutch and German IDS-2 for the best
fitting model identified in Step 1 (Step 2b). To this end, we followed the sequence of
increasingly constrained models and model comparisons suggested in F. F. Chen et al.
(2005; see supplemental material for details).
3. If configural invariance did hold, we fitted the final model from Step 1 for the German IDS-
2 as well and again computed McDonald’s omegas. Otherwise, we performed Step 1 also
for the German IDS-2 to find the best fitting model for the German IDS-2 and proceeded
from there.
4. We then tested sex invariance for the final model(s) separately for the two IDS-2 versions,
adopting the same two-step process as for the invariance analyses across language versions.
First, we tested for equality of covariance matrices and mean vectors (Step 4a) and then, if
these were not equal, we tested for invariance of the model parameters across sex (Step 4b).
5. As a last step, we examined age invariance for the final model(s) separately for the two
IDS-2 versions using LSEM (Hildebrandt et al., 2009, 2016; see supplemental materials for
details).
Model Identification
The models were standardized by fixing the variances of all latent variables to unity. For factors
with only one indicator, we fixed the single indicator’s residual variance to (1 − %) ∗ ()! (e.g., Brown, 2015, p. 139), where α is the indicator’s reliability (estimated as Cronbach’s alpha) and SD is
the indicator’s standard deviation in the respective sample. For bifactor models, loadings of factors with
only two indicators were constrained to be equal to be able to fit the model. Note that for models where
all broad ability factors have only two indicators, the bifactor version is mathematically equivalent to
the higher-order version.
Fit Indices and Model Selection
We considered CFI ≥ .95, RMSEA ≤ .06, and standardized root mean square residual (SRMR)
≤ .08 as indices of good overall fit (Hu & Bentler, 1999). We deemed fit to be acceptable if the SRMR
and at least one of the two other fit indices met the cutoff criteria (Hu & Bentler, 1998, 1999). In
addition, a model had to be free of local fit problems, such as nonsignificant or near-unity factor
loadings, inflated standard errors, or negative variances.

APPENDIX B: Study 2 72
If more than one model displayed acceptable fit, model comparisons were conducted between
the well-fitting models. We first identified the best fitting model with the lowest Akaike information
criterion (AIC) and more complex models with higher AICs were discarded from the start. This model
was then compared to more parsimonious models using the following delta fit criteria and cutoffs
suggested by F. F. Chen (2007): ΔCFI < -.01, ΔRMSEA < .015, and ΔSRMR < .03. If a more
parsimonious model displayed no substantial worsening in fit according to all these criteria, the more
complex model was discarded. For the MGCFAs, we used the same criteria, except of using ΔSRMR
< .01 for invariance of intercepts and residuals (see Chen, 2007). The χ2 and Δχ2 values were not
interpreted because of their sensitivity for large sample sizes (Barrett, 2007).
Model-Based Reliability Estimates
McDonald’s omegas (McDonald, 1985, 1999) are model-based reliability estimates that allow
partitioning a composite’s true score variance into variance explained by the general factor (omega
hierarchical, ωh), and variance explained by the subscale factors (omega subscale, ωs). The total true
score variance can be estimated with omega total (ωt). There are no universal benchmarks for omega,
but a preliminary suggestion has been made for a minimum of .50, with .75 being preferred, for ωh for
the full scale as well as for ωs for the subscales (Reise et al., 2013). We calculated each of these
coefficients (ωt, ωh, and ωs) for the general intelligence composite as well as for all broad ability
composites for the final models. We did this either directly, for a bifactor model, or from a Schmid–
Leiman transformed higher-order model (Schmid & Leiman, 1957).
Results
Step 1: Model Selection for the Dutch IDS-2
In the first step, the models for the intelligence and basic skills domains introduced in Figures
1 and S1 were fitted for the Dutch IDS-2. The fit for all tested models is displayed in Table 1. Multiple
models displayed good fit, and some models were discarded owing to unacceptable local or global fit
(see Table S3 for local fit problems). Of the remaining models, we first identified the bifactor version
of the EFA-Based Model 2 as the best fitting model according to the AIC. However, the more
parsimonious higher-order version—the EFA-Based Model 2—did not show substantially worse fit,
and the bifactor version was therefore discarded. The simpler EFA-Based Model 1 showed substantially
worse fit than the EFA-Based Model 2 and was therefore discarded as well. The other more
parsimonious models all displayed unacceptable global or local fit and were therefore discarded, too.
Thus, the EFA-Based Model 2 was selected as the final model for the Dutch IDS-2 (see Figure 2a).

APPENDIX B: Study 2 73
Table 1. Fit Indices and Model Comparisons for the Intelligence and Basic Skills Domains for the Dutch IDS-2
Model/Comparison (Δ)χ2 (Δ)df (Δ)CFI (Δ)RMSEA [90% CI] (Δ)SRMR (Δ)AIC 1. VPR bifactor a 333.02*** 99 .970 .041 [.036, .046] .027 111,364.23 2. V–P bifactor b 656.63*** 102 .928 .062 [.057, .066] .038 111,681.85 3. EFA 2 bifactor 401.60*** 106 .962 .044 [.040, .049] .033 111,418.81 4. EFA 1 bifactor 479.99*** 106 .952 .050 [.045, .054] .037 111,497.20 5. CHC 1 bifactor a 466.88*** 108 .953 .048 [.044, .053] .035 111,480.09 6. CHC 2 469.12*** 110 .953 .048 [.043, .052] .035 111,478.33 7. CHC 2 bifactor 469.42*** 110 .953 .048 [.044, .052] .035 111,478.63 8. CHC 1 485.26*** 110 .951 .049 [.045, .053] .036 111,494.47 9. VPR 519.43*** 110 .947 .051 [.047, .056] .036 111,528.64 10. EFA 2 445.63*** 111 .957 .046 [.042, .051] .034 111,452.84 11. IDS-2 / IDS-2 bifactor a 496.21*** 111 .950 .049 [.045, .054] .036 111,503.42 12. EFA 1 551.63*** 113 .943 .052 [.048, .057] .038 111,554.84 13. V–P b 1429.29*** 117 .830 .089 [.085, .093] .051 112,424.50 14. g b 1728.78*** 119 .791 .098 [.093, .102] .059 112,719.99 10 versus 3 44.03*** 5 -.0051 .0018 .0011 34.03 12 versus 10 106.00 cxx 2 -.0135 .0062 .0033 102.00
Note. N = 1,423. Fit indices and degrees of freedom are displayed for Models 1 to 14, and delta fit indices and change in degrees of freedom for model comparisons (last two rows). The thresholds for good global fit are SRMR ≤ .08, together with CFI ≥ .95 or RMSEA ≤ .06. The cutoffs for the delta fit criteria are ΔCFI < -.01, ΔRMSEA < .015, and ΔSRMR < .03. The final adopted model is in bold; models for which either the global or the local fit was unacceptable are in gray. VPR = Verbal–Perceptual–Image Rotation; EFA = exploratory factor analysis; IDS-2 = Intelligence and Development Scales–2; CHC = Cattell–Horn–Carroll; V–P = Verbal–Perceptual; g = general intelligence; CFI = comparative fit index; RMSEA = root mean square error of approximation; CI = confidence interval; SRMR = standardized root mean square residual; AIC = Akaike information criterion. a Local fit not acceptable (see Table S3). b Global fit not acceptable. c Nonnested models, no χ2-difference test performed. ***p < .001.
Steps 2 and 3: Invariance Analyses Across the Dutch and German IDS-2 Versions
To test for measurement invariance across the Dutch and German IDS-2 versions, we first tested
for the equivalence of covariance matrices and mean vectors. We found that neither the covariance
matrices, Box’s M test: χ2(153) = 269.94, p < .001, nor the mean vectors, Nel and Van der Merwe’s
test: F(17, 2808) = 4.06, p < .001, were equivalent. Therefore, we performed MGCFAs with the final
model identified in Step 1. These revealed full invariance of all tested model parameters (i.e., first- and
second-order loadings, intercepts, first-order factor means, residuals, and first-order factor
disturbances) across the Dutch and German IDS-2 versions (see Table 2). Therefore, we fitted the final
model for the Dutch IDS-2 also on the German IDS-2 (see Figure 2b).
McDonald’s omegas were highly similar across the two IDS-2 versions. While ωh was above
the threshold of .75 for the general intelligence composite, ωs was below the threshold of .50 for all
broad ability composites (see Figure 2).

APPENDIX B: Study 2 74
Table 2. Results From Invariance Analyses Across the Dutch and German IDS-2 Versions for the Final Model for the Intelligence and Basic Skills Domains
Model χ2 df CFI RMSEA [90% CI] SRMR Comp. Δχ2 Δdf ΔCFI ΔRMSEA ΔSRMR A. Configural 913.16*** 222 .957 .047 [.044, .050] .035 B1. First-order
loadings 940.97*** 232 .956 .046 [.043, .050] .038 vs. A 27.81**x 10 -.0011 -.0004 .0024
B2. Second-order loadings
960.07*** 239 .955 .046 [.043, .049] .041 vs. B1 19.09**x 7 -.0008 -.0003 .0029
C1. Intercepts 989.80*** 249 .954 .046 [.044, .049] .041 vs. B2 29.73*** 10 -.0012 -.0003 .0004
C2. First-order factor means
1023.55*** 256 .952 .046 [.043, .049] .042 vs. C1 33.75*** 7 -.0017 .0002 .0007
D1. Residuals 1097.85*** 273 .948 .047 [.044, .049] .043 vs. C2 74.30*** 17 -.0036 .0002 .0009
D2. First-order factor disturbances
1106.01*** 281 .948 .046 [.043, .048] .043 vs. D1 8.17xxx 8 -.0000 -.0007 .0004
Note. N = 2,828. Results from multiple-group confirmatory factor analyses testing increasingly constrained models are displayed. The models are as follows: (A) Configural invariance; (B1) and (B2) metric invariance of first-order and second-order loadings; (C1) and (C2) scalar invariance at the manifest and first-order factor level; (D1) and (D2) strict invariance at the manifest and first-order factor level. The thresholds for good global fit are SRMR ≤ .08, together with CFI ≥ .95 or RMSEA ≤ .06. The cutoffs for the delta fit criteria are ΔCFI < -.01, ΔRMSEA < .015, and ΔSRMR < .01 for invariance of intercepts and residuals, or ΔSRMR < .03 for all other forms of invariance. CFI = comparative fit index; RMSEA = root mean square error of approximation; CI = confidence interval; SRMR = standardized root mean square residual; Comp. = model comparison; IDS-2 = Intelligence and Development Scales–2. **p < .01. ***p < .001.
Step 4: Sex Invariance
For both the Dutch and the German IDS-2, we tested for measurement invariance across sex.
We found no equivalence of covariance matrices and mean vectors, neither for the Dutch nor for the
German IDS-2, Box’s M test: χ2(153) = 242.54, p < .001 and χ2(153) = 250.20, p < .001, respectively;
Nel and Van der Merwe’s test: F(17, 1389) = 11.29, p < .001 and F(17, 1364) = 17.62, p < .001,
respectively. We therefore conducted MGCFAs with the final model to further investigate sex
invariance.
The first- and second-order loadings were invariant across sex for both IDS-2 versions, and
thus metric invariance was supported (see Table 3). However, only partial scalar invariance was
supported. For the Dutch IDS-2, the intercepts of PR and SDE had to be freed to achieve a
nonsubstantial worsening in fit. Females scored higher in PR (estimated intercepts 10.93 vs. 9.77), and
males scored higher in SDE (estimated intercepts 10.54 vs. 9.79). For the German IDS-2, the intercepts
of PR and SPE had to be freed, with females scoring higher in both subtests (estimated intercepts 11.04
vs. 9.72 and 10.74 vs. 9.50, respectively). The first-order factor means were again invariant for both
IDS-2 versions. Finally, based on the partial scalar invariance, strict invariance was supported for both
IDS-2 versions, with residuals and first-order factor disturbances being invariant. Parameter estimates
and McDonald’s omegas for females and males based on the configural invariance model are displayed
in Figure S2.

APPENDIX B: Study 2 75
Figure 2. Standardized Parameter Estimates, Model Fit, and McDonald’s Omegas for the Final Model (EFA-Based Model 2) for the Intelligence and Basic Skills Domains of the Dutch (Panel A) and German (Panel B) Intelligence and Development Scales–2
Note. NDutch = 1,423; NGerman = 1,405. All parameters were significant with p < .001. g = general intelligence; AVR = Abstract Visual Reasoning; PS = Processing Speed; ASM = Auditory Short-Term Memory; VSM = Visual–Spatial Short-Term Memory; VR = Verbal Reasoning; LM = Long-Term Memory; RW = Reading and Writing; SDE = Shape Design; WD = Washer Design; MC = Matrices: Completion; MO = Matrices: Odd One Out; LMR = Logical–Mathematical Reasoning; PA = Parrots; BO = Boxes; DLS = Digit and Letter Span; MDLS = Mixed Digit and Letter Span; SM = Shape Memory; RSM = Rotated Shape Memory; NC = Naming Categories; NO = Naming Opposites; SR = Story Recall; PR = Picture Recall; RE = Reading; SPE = Spelling; CFI = comparative fit index; RMSEA = root mean square error of approximation; CI = confidence interval; SRMR = standardized root mean square residual; AIC = Akaike information criterion; ωt = omega total; ωh = omega hierarchical; ωs = omega subscale.
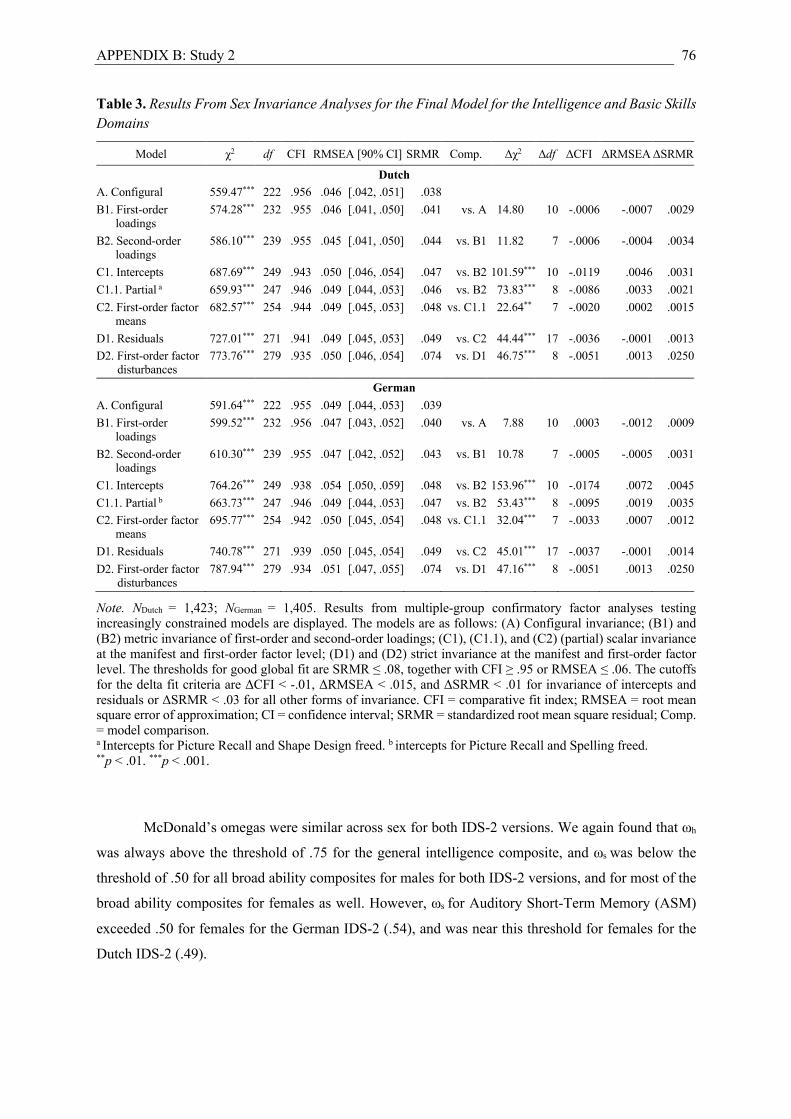
APPENDIX B: Study 2 76
Table 3. Results From Sex Invariance Analyses for the Final Model for the Intelligence and Basic Skills Domains
Model χ2 df CFI RMSEA [90% CI] SRMR Comp. Δχ2 Δdf ΔCFI ΔRMSEA ΔSRMR
Dutch A. Configural 559.47*** 222 .956 .046 [.042, .051] .038
B1. First-order loadings
574.28*** 232 .955 .046 [.041, .050] .041 vs. A 14.80xxx 10 -.0006 -.0007 .0029
B2. Second-order loadings
586.10*** 239 .955 .045 [.041, .050] .044 vs. B1 11.82xxx 7 -.0006 -.0004 .0034
C1. Intercepts 687.69*** 249 .943 .050 [.046, .054] .047 vs. B2 101.59*** 10 -.0119 .0046 .0031
C1.1. Partial a 659.93*** 247 .946 .049 [.044, .053] .046 vs. B2 73.83*** 8 -.0086 .0033 .0021
C2. First-order factor means
682.57*** 254 .944 .049 [.045, .053] .048 vs. C1.1 22.64**x 7 -.0020 .0002 .0015
D1. Residuals 727.01*** 271 .941 .049 [.045, .053] .049 vs. C2 44.44*** 17 -.0036 -.0001 .0013 D2. First-order factor disturbances
773.76*** 279 .935 .050 [.046, .054] .074 vs. D1 46.75*** 8 -.0051 .0013 .0250
German A. Configural 591.64*** 222 .955 .049 [.044, .053] .039
B1. First-order loadings
599.52*** 232 .956 .047 [.043, .052] .040 vs. A 7.88xxx 10 .0003 -.0012 .0009
B2. Second-order loadings
610.30*** 239 .955 .047 [.042, .052] .043 vs. B1 10.78xxx 7 -.0005 -.0005 .0031
C1. Intercepts 764.26*** 249 .938 .054 [.050, .059] .048 vs. B2 153.96*** 10 -.0174 .0072 .0045
C1.1. Partial b 663.73*** 247 .946 .049 [.044, .053] .047 vs. B2 53.43*** 8 -.0095 .0019 .0035 C2. First-order factor
means 695.77*** 254 .942 .050 [.045, .054] .048 vs. C1.1 32.04*** 7 -.0033 .0007 .0012
D1. Residuals 740.78*** 271 .939 .050 [.045, .054] .049 vs. C2 45.01*** 17 -.0037 -.0001 .0014
D2. First-order factor disturbances
787.94*** 279 .934 .051 [.047, .055] .074 vs. D1 47.16*** 8 -.0051 .0013 .0250
Note. NDutch = 1,423; NGerman = 1,405. Results from multiple-group confirmatory factor analyses testing increasingly constrained models are displayed. The models are as follows: (A) Configural invariance; (B1) and (B2) metric invariance of first-order and second-order loadings; (C1), (C1.1), and (C2) (partial) scalar invariance at the manifest and first-order factor level; (D1) and (D2) strict invariance at the manifest and first-order factor level. The thresholds for good global fit are SRMR ≤ .08, together with CFI ≥ .95 or RMSEA ≤ .06. The cutoffs for the delta fit criteria are ΔCFI < -.01, ΔRMSEA < .015, and ΔSRMR < .01 for invariance of intercepts and residuals or ΔSRMR < .03 for all other forms of invariance. CFI = comparative fit index; RMSEA = root mean square error of approximation; CI = confidence interval; SRMR = standardized root mean square residual; Comp. = model comparison. a Intercepts for Picture Recall and Shape Design freed. b intercepts for Picture Recall and Spelling freed. **p < .01. ***p < .001.
McDonald’s omegas were similar across sex for both IDS-2 versions. We again found that ωh
was always above the threshold of .75 for the general intelligence composite, and ωs was below the
threshold of .50 for all broad ability composites for males for both IDS-2 versions, and for most of the
broad ability composites for females as well. However, ωs for Auditory Short-Term Memory (ASM)
exceeded .50 for females for the German IDS-2 (.54), and was near this threshold for females for the
Dutch IDS-2 (.49).

APPENDIX B: Study 2 77
Step 5: Age Invariance
Finally, we investigated age invariance for model fit, first- and second-order loadings, and
residuals from the final model for both the Dutch and the German IDS-2. For both IDS-2 versions,
model fit in terms of CFI, RMSEA, and SRMR tended to become worse at older ages (see Figure 3).
For the Dutch IDS-2, model fit was acceptable for ages 7 to 16 years, but no longer acceptable for ages
17 to 20 years. For the German IDS-2, fit was acceptable for ages 7 to 12 years, but no longer for ages
13 to 20 years.
For both IDS-2 versions, most first-order loadings were invariant, that is, there were no
significant pointwise tests (see Figure 4). For the Dutch IDS-2, five of 18 first-order loadings had
significant pointwise tests. The loading of Mixed Digit and Letter Span (MDLS) on ASM was
significantly lower than the average from the permutated data sets at ages 7 to 10 years, and significantly
higher than this average at ages 15 to 19 years. Moreover, there was a drop in the loading of Parrots on
PS at ages 12 and 13 years and in the loading of Rotated Shape Memory on Visual–Spatial Short-Term
Memory (VSM) at ages 7 and 8 years, while the loadings of Naming Categories (NC) and Naming
Opposites on VR were significantly higher than average for ages 20 and 15 to 16 years, respectively.
For the German IDS-2, significant pointwise tests occurred for only one of 18 first-order loadings. The
loading of NC on VR was lower than average at age 7 years and higher than average at ages 17 and 18
years. The second-order loadings were completely invariant for both IDS-2 versions (see Figure 5).
Finally, for residuals, results from pointwise tests displayed the same pattern of significance as
described for the first-order loadings above, but with the opposite direction of effects (see Figure S3).
McDonald’s omegas varied somewhat across age for both IDS-2 versions (see Figure S4), but
ωh was again above the threshold of .75 for the general intelligence composite, and ωs was below the
threshold of .50 for all broad ability composites for both IDS-2 versions at all ages, although ωs for
ASM was near .50 for ages 19 and 20 years for the Dutch IDS-2.

APPENDIX B: Study 2 78
Figure 3. Fit Measures for the Final Model for the Dutch and German Intelligence and Development Scales–2 (EFA-Based Model 2) for the Intelligence and Basic Skills Domains Across Age, Determined With Local Structural Equation Modeling
Note. Blue and black dots indicate significantly lower and not significantly different values, respectively, compared to the average from the permutated data sets. The gray-shaded areas indicate values beyond the thresholds of the displayed fit indices: CFI ≥ .95, RMSEA ≤ .06, and SRMR ≤ .08. CFI = comparative fit index; RMSEA = root mean square error of approximation; CI = confidence interval; SRMR = standardized root mean square residual.

APPENDIX B: Study 2 79
Figure 4. Standardized First-Order Factor Loadings for the Final Model for the Dutch and German Intelligence and Development Scales–2 (EFA-Based Model 2) for the Intelligence and Basic Skills Domains Across Age, Determined With Local Structural Equation Modeling
Note. Red, blue, and black dots indicate significantly higher, lower, and not significantly different values, respectively, compared to the average from the permutated data sets. The dashed lines indicate the upper and lower levels of bootstrapped confidence intervals with 1,000 samples. SDE = Shape Design; AVR = Abstract Visual Reasoning; WD = Washer Design; MC = Matrices: Completion; MO = Matrices: Odd One Out; LMR = Logical–Mathematical Reasoning; PA = Parrots; PS = Processing Speed; BO = Boxes; DLS = Digit and Letter Span; ASM = Auditory Short-Term Memory; MDLS = Mixed Digit and Letter Span; SM = Shape Memory; VSM = Visual–Spatial Short-Term Memory; RSM = Rotated Shape Memory; NC = Naming Categories; VR = Verbal Reasoning; NO = Naming Opposites; SR = Story Recall; LM = Long-Term Memory; PR = Picture Recall; RE = Reading; RW = Reading and Writing; SPE = Spelling.

APPENDIX B: Study 2 80
Figure 5. Standardized Second-Order Loadings for the Final Model for the Dutch and German Intelligence and Development Scales–2 (EFA-Based Model 2) for the Intelligence and Basic Skills Domains Across Age, Determined With Local Structural Equation Modeling
Note. Black dots indicate values that are not significantly different from the average from the permutated data sets. The dashed lines indicate the upper and lower levels of bootstrapped confidence intervals with 1,000 samples. g = general intelligence; AVR = Abstract Visual Reasoning; PS = Processing Speed; ASM = Auditory Short-Term Memory; VSM = Visual–Spatial Short-Term Memory; VR = Verbal Reasoning; LM = Long-Term Memory; RW = Reading and Writing.

APPENDIX B: Study 2 81
Discussion
We examined the factor structure of the IDS-2 intelligence and basic skills domains with CFA.
Applying a predefined model selection procedure, we found that, of several theoretically and
empirically determined models, a model comparable to the one found with EFA for the German IDS-2
(Grieder & Grob, 2020) is the best representation of the structure of these two domains for the Dutch
IDS-2. This model includes the five theoretical IDS-2 broad ability factors PS, ASM, VSM, VR, and
LM, as well as the factors AVR (including the VP and AR subtests and LMR) and RW, and a second-
order general intelligence factor. Full measurement invariance of this final model was established across
the Dutch and German IDS-2 versions. For both the Dutch and German IDS-2, full metric invariance,
partial scalar invariance, and—based on that—strict invariance was supported across sex. Across an
age span of 7 to 20 years, most first-order loadings and residuals, and all second-order loadings, were
invariant, but model fit was not acceptable for (older) adolescents. As expected, the general intelligence
factor always accounted for the largest share of true score variance across the two IDS-2 versions, sex,
and age, while the true score variance explained by the broad ability factors rarely exceeded the
threshold of .50. The IDS-2 subtests are thus indicators of a strong general intelligence factor and weak
broad ability factors.
Factor Structure
The final model for the IDS-2 intelligence and basic skills domains was the higher-order version
of an empirically determined model suggested from a prior EFA study, but it was not, as we had
expected, the final model from this study (Grieder & Grob, 2020). Although the bifactor version fitted
better than the higher-order version, the fit of the more parsimonious higher-order version was not
substantially worse, and the bifactor version was therefore discarded. This is in contrast to many other
intelligence tests, where bifactor models clearly outperformed their higher-order counterparts (e.g.,
Cucina & Byle, 2017). One explanation for the small differences in fit between the bifactor and higher-
order versions of most models tested here might be that, due to the availability of only two indicators
for many factors, additional constraints were necessary for the bifactor models that rendered them more
similar to the higher-order versions.
In line with results from Grieder and Grob (2020), the theoretical IDS-2 factors PS, ASM, VSM,
VR, and LM were supported for the Dutch and German IDS-2 versions. The only difference between
the final model from the present study and the final model from Grieder and Grob (2020) is that the
theoretical factors VR and LM were separable in this study. However, in contrast to the theoretical IDS-
2 model, SR showed a cross-loading on VR, suggesting that, besides long-term memory, this subtest
also captures verbal abilities through the memorization and recall of exclusively verbal information.
In line with Baddeley’s (2003) working memory model and empirical findings (Alloway et al.,
2006), but in contrast to the CHC model, our results suggest that ASM and VSM can be separated at
the broad ability level and not only at the narrow ability level (e.g., Schneider & McGrew, 2018). This

APPENDIX B: Study 2 82
finding is supportive of the IDS-2 structure and might explain why visual memory tasks often do not
load on a common factor with verbal memory tasks (Keith & Reynolds, 2010).
Our results provide further evidence against the separability of visual processing and fluid
reasoning abilities, as the theoretical IDS-2 factors VP and AR—corresponding to the CHC broad
abilities Visual Processing (Gv) and Gf—collapsed to one factor, AVR, in the present study. This is in
line with results from Grieder and Grob (2020) and from previous studies on other intelligence tests
(e.g., Canivez et al., 2017, 2021; Keith & Reynolds, 2010), and is in contrast to the CHC model. The
collapse of these two factors may be due to the content of Gf subtests often being exclusively visual
(e.g., matrices). However, in the rare cases where both Gv and Gf were measured with both verbal and
nonverbal/visual content, the factors were also often not separable (e.g., DiStefano & Dombrowski,
2006). Thus, these two presumed abilities are (1) not measured validly in the aforementioned tests,
and/or (2) so highly correlated that it is hard to measure them separately, or (3) in fact one ability. If (1)
is true, then more valid tests of both abilities are needed, which requires clear, technical definitions of
these abilities (Beaujean & Benson, 2019). If (2) or (3) are true, then it is not useful to create separate
scores for Gv and Gf.
In line with the CHC model and with results from Grieder and Grob (2020), the basic skills
domain (mathematical, reading, and writing skills) was not separable from the intelligence domain. In
the theoretical IDS-2 model, the Basic Skills factor correlated to .97 with the general intelligence factor.
The final model included an RW factor that had a high loading on the general intelligence factor, and
LMR as the highest-loading subtest on AVR. The latter suggests that it is mainly reasoning abilities, as
opposed to knowledge, that create between-subjects variance in LMR (cf. Wasserman, 2019). These
findings draw into question the separation of intelligence and basic skills in the IDS-2. However,
although general intelligence and general academic achievement have been found to be highly
correlated also for other tests (e.g., Kaufman et al., 2012), there are still good reasons to create separate
scores for the two, as influences of noncognitive variables and the learning history are more likely for
academic achievement as opposed to intelligence scores on an individual level (Bodovski & Farkas,
2007; Kaufman et al., 2012; Tarchi, 2010).
Measurement Invariance
Invariance Across Language Versions
Full measurement invariance was supported for the final model across the Dutch and German
IDS-2 versions. This means that the standardized scores that are used in practice are comparable
between the Dutch and German populations and that the two IDS-2 versions measure the same
constructs with comparable reliability for the intelligence and basic skills domains.
Sex Invariance
Full metric invariance was supported; hence, the same constructs are measured across sex. The
fact that only partial scalar invariance was supported is in line with previous results on other tests (e.g.,
Irwing, 2012; Schweizer et al., 2018) and on the German IDS-2 (Grob & Hagmann-von Arx, 2018).

APPENDIX B: Study 2 83
Females scored between 0.39 and 0.44 SD higher in a subtest measuring visual long-term memory (i.e.,
PR) for the Dutch and the German IDS-2, respectively, which is in line with previous evidence (e.g.,
Schweizer et al., 2018; see Born et al., 1987, for a meta-analysis), while males scored 0.25 SD higher
in a subtest on visual–spatial abilities (i.e., SDE) for the Dutch IDS-2, also in line with previous
evidence (see Born et al., 1987 and Voyer et al., 1995, for meta-analyses). The fact that females scored
0.41 SD higher in SPE for the German IDS-2 is also in line with previous findings on a female advantage
in reading and writing skills (see Roivainen, 2011, for a review). Based on the partial invariance of
intercepts, the invariance of first-order factor means, and strict invariance was also supported. This
means that the constructs’ reliabilities are also comparable across sex. The demonstration of at least
partial measurement invariance for both IDS-2 versions implies that it is not necessary to split the
sample into males and females when examining these IDS-2 domains, or to create separate norms for
males and females (cf. Steenkamp & Baumgartner, 1998).
Age Invariance
Results from LSEM with the final model demonstrated invariance for most model parameters
across age, with more invariant parameters for the German compared to the Dutch IDS-2. The
parameters that were most variable across age were the loading of MDLS on ASM and the residual of
MDLS for the Dutch IDS-2, with the former tending to increase and the latter tending to decrease up to
age 16 years. Thus, MDLS becomes a better indicator of ASM with increasing age, and its unique
variance decreases. One reason for this could be the increasing reliability, and thus decreasing
measurement error, of MDLS with age.
Moreover, model fit was not acceptable across the whole age range. While the model fitted well
for children and younger adolescents, fit was no longer acceptable for older adolescents. Possible
explanations for this finding include a change in the relationship between intelligence and basic skills
with age, for example, due to a change in tasks or schooling, the decrease in the cross-loading of SR on
VR with age, or ceiling effects at older ages. Further analyses ruled out these explanations, though, and
modification indices did not provide any further insights into possible sources of misfit. However, a
subsequent EFA indicated that the nonsalient loadings (i.e., loadings < .30) were larger at specific ages
compared to for the whole sample. For example, 60% of the absolute nonsalient loadings were larger
for 17- to 20-year-olds (sum of loadings = 6.54) compared to for the whole sample (sum of loadings =
4.87) for the German IDS-2. Setting these larger nonzero loadings to zero in the CFA might explain
why model fit was worse at specific ages compared to for the whole sample.
The large bootstrapped confidence intervals for some parameters show that there may be
determination problems at some points of the model, probably due to the few indicators per factor (often
only two; Marsh et al., 1998). This is especially pronounced for the loadings of SR, PR, and LM,
probably due to the cross-loading of SR. These determination problems are ameliorated if the cross-
loading of SR on VR is omitted, but at the cost of worse model fit (see results for intelligence domain
alone in the supplemental material).

APPENDIX B: Study 2 84
In general, there was more noninvariance across age than across language versions and sex.
However, the criteria for invariance we applied for LSEM results (i.e., the pointwise tests for all focal
points for all parameters of a kind need to be nonsignificant) are much stricter than the criteria applied
for MGCFA results (i.e., the drop in fit when constraining all parameters of a kind to be equal across
groups needs to be nonsubstantial). We further discuss this issue below. Finally, the determination
problems that occurred for some parameters and at some ages could probably be avoided if a larger
number of strong indicators were included per factor (cf. Fabrigar et al., 1999; Marsh et al., 1998). In
particular, this would help better distinguish LM and VR.
Despite these caveats, our results demonstrate that the identified factor structure was largely
invariant across an age span of 7 to 20 years, and especially the full invariance of all second-order
loadings suggests neither age differentiation nor age dedifferentiation (i.e., a decline or increase in
general intelligence factor loadings over age, respectively; see, e.g., Tucker-Drob, 2009).
Relative Importance of General Intelligence Versus Broad Abilities
Model-based reliability analyses with McDonald’s omegas revealed a strong general
intelligence factor and weak broad ability factors for the IDS-2 intelligence and basic skills domains.
This is in line with previous findings from Grieder and Grob (2020) and with findings on other major
intelligence tests (e.g., Canivez et al., 2017, 2021; Cucina & Howardson, 2017). Although there was
some variation in omegas across the Dutch and German IDS-2 versions, sex, and age, the main
conclusions are the same: The true score variance due to general intelligence seems sufficient for
interpretation of a full-scale IQ, while the little true score variance due to the broad abilities casts doubt
on the justification of broad ability composites, with the possible exception of ASM, whose ωs
sometimes exceeded the threshold of .50.
Implications
Our results have implications for theory, future research, and practice. The fact that many
different models displayed good global fit points to the importance of testing and comparing multiple
plausible models for the structural validation of a test. In particular, it is useful to test both theoretically
driven and empirically derived (e.g., with EFA) models and compare them based on a predefined model
selection procedure. Testing a single or a few preferred models, or failing to follow a predetermined
model selection strategy, bears the risk of confirmation bias and thus failure to find the most useful
representation of a test’s structure (e.g., MacCallum & Austin, 2000).
The present study provides further evidence for the difficult separability of Gf and Gv. The
accumulating evidence against their separability challenges the CHC model and calls for further
research clarifying their status in the structure of intelligence. For the IDS-2, this suggests that the scores
for VP and AR should best be combined to one score for interpretation. Furthermore, the relationship
between intelligence and academic achievement should be studied further, also with specific samples
(e.g., with specific learning disabilities or with irregular learning history), to investigate if and for what
subgroups common scores for indicators of the two could be valid.

APPENDIX B: Study 2 85
Results from the invariance analyses suggest that scores derived according to the final model
identified here will be comparable across language versions, sex, and age, but more indicators per factor
would help get better defined factors at all ages, especially for VR and LM. Finally, model-based
reliabilities indicate that carefulness is required when interpreting broad ability composites and
intelligence profiles, and that individual interpretation should focus primarily on the full-scale IQ. This
finding, which has now been replicated for many intelligence tests, also challenges the usefulness of
the CHC model, with its emphasis on broad abilities, for the development of individually administered
intelligence tests (cf. Beaujean & Benson, 2019). It needs to be determined if and under what
circumstances broad ability composites and, consequently, profile analyses could still be useful.
Limitations
One limitation of our study is that the theory-driven models we tested were not comprehensive
operationalizations of the underlying theories. This was mostly due to the limited number of indicators
and not all abilities from all theories being represented in the IDS-2. For example, for the CHC models,
Learning Efficiency (Gl) and Retrieval Fluency (Gr) were not separable, Gq was represented by only
one indicator, and narrow ability factors were only possible for Gwm. Moreover, the inclusion of an
image rotation factor for the VPR model was not possible. Our study should not be seen as a test of
intelligence theories.
We chose to use age-standardized subtest scores for our analyses because these are the scores
used in practice and for comparability to previous factor analyses on the IDS-2 (Grieder & Grob, 2020;
Grob et al., 2018; Grob & Hagmann-von Arx, 2018). Hence, analyses of differential item functioning
were not possible, nor analyses of mean-level differences across language versions and age. The study
of differential item functioning across language versions and the application of LSEM for age using
raw subtest scores are interesting prospects for future research. So are invariance analyses on other
participant characteristics, such as language skills or intelligence level.
Finally, the criteria used to determine invariance were not the same for LSEM and MGCFA.
They were much stricter for the former than for the latter. An alternative to the pointwise tests we used
would have been a procedure developed by Hartung et al. (2018) that performs MGCFAs for all possible
focal point combinations based on the LSEM results. However, this would have come with the
downside of losing the more detailed information for each parameter at each focal point. Moreover,
there are no studies yet to determine for how many of the focal point combinations noninvariance was
acceptable for invariance across a continuous moderator to hold. The same is true for the number of
significant pointwise tests. Simulation studies are needed to develop useful criteria and thresholds for
invariance testing with LSEM.
Conclusion
The theoretically proposed structure for the intelligence and basic skills domains of the Dutch
and the German IDS-2 was partly supported, as some factors collapsed and the two domains were not
separable. The final model selected here was an empirically determined model suggested by prior EFA

APPENDIX B: Study 2 86
of the German IDS-2. This final model was fully invariant across the Dutch and the German IDS-2, and
largely invariant across sex and age, suggesting that IDS-2 scores corresponding to the factors in the
final model are comparable across these populations. Finally, the IDS-2 subtests were indicators of a
strong general intelligence factor and weak broad ability factors, suggesting that clinical interpretation
should focus on the full-scale IQ. Our results demonstrate the importance of testing multiple plausible
models and following a strict model selection procedure when examining structural validity with CFA,
and they illustrate the prospects of up-to-date methods for invariance analyses across continuous
variables.

APPENDIX B: Study 2 87
References
Alloway, T. P., Gathercole, S. E., & Pickering, S. J. (2006). Verbal and visuospatial short-term and
working memory in children: Are they separable? Child Development, 77(6), 1698–1716.
https://doi.org/10.1111/j.1467-8624.2006.00968.x
American Educational Research Association, American Psychological Association, & National Council
on Measurement in Education. (2014). Standards for educational and psychological testing.
American Educational Research Association.
Baddeley, A. (2003). Working memory and language: An overview. Journal of Communication
Disorders, 36(3), 189–208. https://doi.org/10.1016/S0021-9924(03)00019-4
Barrett, P. (2007). Structural equation modelling: Adjudging model fit. Personality and Individual
Differences, 47(5), 815–824. https://doi.org/10.1016/j.paid.2006.09.018
Beaujean, A. A., & Benson, N. F. (2019). Theoretically-consistent cognitive ability test development
and score interpretation. Contemporary School Psychology, 23, 126–137. https://doi.org/
10.1007/s40688-018-0182-1
Bodovski, K., & Farkas, G. (2007). Mathematics growth in early elementary school: The roles of
beginning knowledge, student engagement, and instruction. The Elementary School Journal,
108(2), 115–130. https://doi.org/10.1086/525550
Born, M. P., Bleichrodt, N., & van der Flier, H. (1987). Cross-cultural comparison of sex-related
differences on intelligence tests: A meta-analysis. Journal of Cross-Cultural Psychology, 18(3),
283–314. https://doi.org/10.1177/0022002187018003002
Box, G. E. P. (1949). A general distribution theory for a class of likelihood criteria. Biometrika, 36(3/4),
317–346. https://doi.org/10.2307/2332671
Brown, T. A. (2015). Confirmatory factor analysis for applied research (2nd ed.). Guilford Press.
Canivez, G. L., Grieder, S., & Bünger, A. (2021). Construct validity of the German Wechsler
Intelligence Scale for Children–Fifth Edition: Exploratory and confirmatory factor analyses of
the 15 primary and secondary subtests. Assessment, 28(2), 327–352. https://doi.org/10.1177/
1073191120936330
Canivez, G. L., Watkins, M. W., & Dombrowski, S. C. (2017). Structural validity of the Wechsler
Intelligence Scale for Children–Fifth Edition: Confirmatory factor analyses with the 16 primary
and secondary subtests. Psychological Assessment, 29(4), 458–472. https://doi.org/10.1037/
pas0000358
Canivez, G. L., & Youngstrom, E. A. (2019). Challenges to the Cattell–Horn–Carroll theory: Empirical,
clinical, and policy implications. Applied Measurement in Education, 32(3), 232–248.
https://doi.org/10.1080/08957347.2019.1619562
Carroll, J. B. (1993). Human cognitive abilities: A survey of factor-analytic studies. Cambridge
University Press.
Cattell, R. B. (1941). Some theoretical issues in adult intelligence testing. Psychological Bulletin, 38,

APPENDIX B: Study 2 88
592.
Chen, F. F. (2007). Sensitivity of goodness of fit indexes to lack of measurement invariance. Structural
Equation Modeling: A Multidisciplinary Journal, 14(3), 464–504. https://doi.org/10.1080/
10705510701301834
Chen, F. F., Sousa, K. H., & West, S. G. (2005). Teacher’s corner: Testing measurement invariance of
second-order factor models. Structural Equation Modeling, 12(3), 471–492. https://doi.org/
10.1207/s15328007sem1203_7
Cucina, J. M., & Byle, K. (2017). The bifactor model fits better than the higher-order model in more
than 90% of comparisons for mental abilities test batteries. Journal of Intelligence, 5(3), Article
27. https://doi.org/10.3390/jintelligence5030027
Cucina, J. M., & Howardson, G. N. (2017). Woodcock–Johnson–III, Kaufman Adolescent and Adult
Intelligence Test (KAIT), Kaufman Assessment Battery for Children (KABC), and Differential
Ability Scales (DAS) support Carroll but not Cattell–Horn. Psychological Assessment, 29(8),
1001–1015. https://doi.org/10.1037/pas0000389
DiStefano, C., & Dombrowski, S. C. (2006). Investigating the theoretical structure of the Stanford–
Binet. Journal of Psychoeducational Assessment, 24(2), 123–136. https://doi.org/10.1177/
0734282905285244
Fabrigar, L. R., Wegener, D. T., MacCallum, R. C., & Strahan, E. J. (1999). Evaluating the use of
exploratory factor analysis in psychological research. Psychological Methods, 4(3), 272–299.
https://doi.org/10.1037//1082-989X.4.3.272
German Federal Statistical Office. (2020). Society and environment. https://www.destatis.de/EN/
Home/_node.html
Grieder, S., & Grob, A. (2020). Exploratory factor analyses of the Intelligence and Development
Scales–2: Implications for theory and practice. Assessment, 27(8), 1853–1869.
https://doi.org/10.1177/1073191119845051
Grob, A., & Hagmann-von Arx, P. (2018). Intelligence and Development Scales–2 (IDS-2). Intelligenz-
und Entwicklungsskalen für Kinder und Jugendliche. Manual zu Theorie, Interpretation und
Gütekriterien. [Intelligence and Development Scales for children and adolescents. Manual on
theory, interpretation, and psychometric criteria]. Hogrefe.
Grob, A., Hagmann-von Arx, P., Ruiter, S. A. J., Timmerman, M. E., & Visser, L. (2018). Intelligence
and Development Scales–2 (IDS-2). Intelligentie- en ontwikkelingsschalen voor kinderen en
jongeren. Verantwoording en psychometrie. [Intelligence and Development Scales for children
and adolescents. Justification and psychometrics]. Hogrefe.
Hartung, J., Doebler, P., Schroeders, U., & Wilhelm, O. (2018). Dedifferentiation and differentiation
of intelligence in adults across age and years of education. Intelligence, 69, 37–49.
https://doi.org/10.1016/j.intell.2018.04.003
Hildebrandt, A., Lüdtke, O., Robitzsch, A., Sommer, C., & Wilhelm, O. (2016). Exploring factor model

APPENDIX B: Study 2 89
parameters across continuous variables with local structural equation models. Multivariate
Behavioral Research, 51(2–3), 257–258. https://doi.org/10.1080/00273171.2016.1142856
Hildebrandt, A., Wilhelm, O., & Robitzsch, A. (2009). Complementary and competing factor analytic
approaches for the investigation of measurement invariance. Review of Psychology, 16(2), 87–
102.
Horn, J. L. (1991). Measurement of intellectual capabilities: A review of theory. In K. S. McGrew, J.
Werder, & R. W. Woodcock (Eds.), WJ-R technical manual (pp. 197–232). Riverside.
Hu, L., & Bentler, P. M. (1998). Fit indices in covariance structure modeling: Sensitivity to
underparameterized model misspecification. Psychological Methods, 3(4), 424–453.
https://doi.org/10.1037/1082-989X.3.4.424
Hu, L., & Bentler, P. M. (1999). Cutoff criteria for fit indexes in covariance structure analysis:
Conventional criteria versus new alternatives. Structural Equation Modeling: A
Multidisciplinary Journal, 6(1), 1–55. https://doi.org/10.1080/10705519909540118
Irwing, P. (2012). Sex differences in g: An analysis of the US standardization sample of the WAIS-III.
Personality and Individual Differences, 53(2), 126–131. https://doi.org/10.1016/
j.paid.2011.05.001
Johnson, W., & Bouchard, T. J. (2005). The structure of human intelligence: It is verbal, perceptual,
and image rotation (VPR), not fluid and crystallized. Intelligence, 33(4), 393–416.
https://doi.org/10.1016/j.intell.2004.12.002
Johnson, W., te Nijenhuis, J., & Bouchard, T. J. (2007). Replication of the hierarchical visual–
perceptual–image rotation model in de Wolff and Buiten’s (1963) battery of 46 tests of mental
ability. Intelligence, 35(1), 69–81. https://doi.org/10.1016/j.intell.2006.05.002
Kaufman, S. B., Reynolds, M. R., Liu, X., Kaufman, A. S., & McGrew, K. S. (2012). Are cognitive g
and academic achievement g one and the same g? An exploration on the Woodcock–Johnson
and Kaufman tests. Intelligence, 40(2), 123–138. https://doi.org/10.1016/j.intell.2012.01.009
Keith, T. Z., & Reynolds, M. R. (2010). Cattell–Horn–Carroll abilities and cognitive tests: What we’ve
learned from 20 years of research. Psychology in the Schools, 47(7), 635–650.
https://doi.org/10.1002/pits.20496
MacCallum, R. C., & Austin, J. T. (2000). Applications of structural equation modeling in
psychological research. Annual Review of Psychology, 51(1), 201–226. https://doi.org/10.1146/
annurev.psych.51.1.201
Major, J. T., Johnson, W., & Deary, I. J. (2012). Comparing models of intelligence in Project TALENT:
The VPR model fits better than the CHC and extended Gf–Gc models. Intelligence, 40(6), 543–
559. https://doi.org/10.1016/j.intell.2012.07.006
Marsh, H. W., Hau, K.-T., Balla, J. R., & Grayson, D. (1998). Is more ever too much? The number of
indicators per factor in confirmatory factor analysis. Multivariate Behavioral Research, 33(2),
181–220. https://doi.org/10.1207/s15327906mbr3302_1

APPENDIX B: Study 2 90
McDonald, R. P. (1985). Factor analysis and related methods. Lawrence Erlbaum Associates.
McDonald, R. P. (1999). Test theory: A unified treatment. Taylor & Francis.
McGrew, K. S. (1997). Analysis of the major intelligence batteries according to a proposed
comprehensive Gf-Gc framework. In D. P. Flanagan, J. L. Genshaft, & P. L. Harrison (Eds.),
Contemporary intellectual assessment: Theories, tests, and issues (pp. 151–179). Guilford
Press.
Nel, D. G., & Van der Merwe, C. A. (1986). A solution to the multivariate Behrens-Fisher problem.
Communications in Statistics - Theory and Methods, 15(12), 3719–3735. https://doi.org/
10.1080/03610928608829342
Reise, S. P. (2012). The rediscovery of bifactor measurement models. Multivariate Behavioral
Research, 47(5), 667–696. https://doi.org/10.1080/00273171.2012.715555
Reise, S. P., Bonifay, W. E., & Haviland, M. G. (2013). Scoring and modeling psychological measures
in the presence of multidimensionality. Journal of Personality Assessment, 95(2), 129–140.
https://doi.org/10.1080/00223891.2012.725437
Robitzsch, A. (2020). Sirt: Supplementary item response theory models. R package version 3.10.-31.
https://CRAN.R-project.org/package=sirt
Roivainen, E. (2011). Gender differences in processing speed: A review of recent research. Learning
and Individual Differences, 21(2), 145–149. https://doi.org/10.1016/j.lindif.2010.11.021
Rosseel, Y. (2012). lavaan: An R package for structural equation modeling. Journal of Statistical
Software, 48(2), 1–36. https://doi.org/10.18637/jss.v048.i02
Schmid, J., & Leiman, J. M. (1957). The development of hierarchical factor solutions. Psychometrika,
22, 53–61. https://doi.org/10.1007/BF02289209
Schneider, W. J., & McGrew, K. S. (2018). The Cattell–Horn–Carroll theory of cognitive abilities. In
D. P. Flanagan & E. M. McDonough (Eds.), Contemporary intellectual assessment: Theories,
tests, and issues (4th ed., pp. 73–163). Guilford Press.
Schweizer, F., Hagmann-von Arx, P., Ledermann, T., & Grob, A. (2018). Geschlechtsinvarianz und
Geschlechtsdifferenzen in der Intelligenzeinschätzung mit den Intelligence and Development
Scales. [Sex invariance and sex differences in intelligence assessments with the Intelligence
and Development Scales]. Diagnostica, 64(4), 203–214. https://doi.org/10.1026/0012-
1924/a000207
Statistics Austria. (2020). People & society. http://www.statistik.at/web_en/statistics/index.html
Statistics Netherlands. (2018). Statline database. http://statline.cbs.nl
Steenkamp, J.-B. E. M., & Baumgartner, H. (1998). Assessing measurement invariance in cross-
national consumer research. Journal of Consumer Research, 25(1), 78–90. https://doi.org/
10.1086/209528
Steiner, M., & Grieder, S. (2020). EFAtools: An R package with fast and flexible implementations of
exploratory factor analysis tools. Journal of Open Source Software, 5(53), Article 2521.

APPENDIX B: Study 2 91
https://doi.org/10.21105/joss.02521
Swiss Federal Statistical Office. (2020). Look for statistics. https://www.bfs.admin.ch/bfs/en/
home.html
Tarchi, C. (2010). Reading comprehension of informative texts in secondary school: A focus on direct
and indirect effects of reader’s prior knowledge. Learning and Individual Differences, 20(5),
415–420. https://doi.org/10.1016/j.lindif.2010.04.002
Tucker-Drob, E. M. (2009). Differentiation of cognitive abilities across the lifespan. Developmental
Psychology, 45(4), 1097–1118. https://doi.org/10.1037/a0015864
Vernon, P. E. (1950). The structure of human abilities. Methuen.
Voyer, D., Voyer, S., & Bryden, M. P. (1995). Magnitude of sex differences in spatial abilities: A meta-
analysis and consideration of critical variables. Psychological Bulletin, 117(2), 250–270.
https://doi.org/10.1037/0033-2909.117.2.250
Wasserman, J. D. (2019). Deconstructing CHC. Applied Measurement in Education, 32(3), 249–268.
https://doi.org/10.1080/08957347.2019.1619563

APPENDIX C: Study 3 92
APPENDIX C: Study 3
Canivez, G. L., Grieder, S., & Bünger, A. (2021). Construct validity of the German Wechsler
Intelligence Scale for Children–Fifth Edition: Exploratory and confirmatory factor analyses of the 15
primary and secondary subtests. Assessment, 28(2), 327–352. https://doi.org/10.1177/
1073191120936330

APPENDIX C: Study 3 93
Please note that this is the author’s version of a work that was accepted for publication in Assessment.
Changes resulting from the publishing process, such as editing, corrections, structural formatting, and
other quality control mechanisms may not be reflected in this document. This article may be used for
noncommercial purposes in accordance with the journal’s conditions.
Construct Validity of the German Wechsler Intelligence Scale for Children–Fifth Edition:
Exploratory and Confirmatory Factor Analyses of the 15 Primary and Secondary Subtests
Gary L. Canivez1, Silvia Grieder2, and Anette Bünger2
1 Department of Psychology, Eastern Illinois University
2 Department of Psychology, University of Basel
Author Note
Preliminary results were presented at the 41st Annual Conference of the International School
Psychology Association, Basel, Switzerland and the 2019 Annual Convention of the American
Psychological Association, Chicago, IL. This research was partially supported by a 2019 Summer
Research Grant from the Council on Faculty Research, Eastern Illinois University to the first author.
We have no conflicts of interests to declare. Supplemental material for this article is available at
https://journals.sagepub.com/doi/suppl/10.1177/1073191120936330.
Correspondence concerning this article should be addressed to Gary L. Canivez, Department of
Psychology, Eastern Illinois University, 600 Lincoln Avenue, Charleston, IL 61920-3099, USA. Email:

APPENDIX C: Study 3 94
Abstract
The latent factor structure of the German Wechsler Intelligence Scale for Children–Fifth edition
(German WISC-V) was examined using complementary hierarchical exploratory factor analyses
(EFAs) with Schmid and Leiman transformation and confirmatory factor analyses (CFAs) for all
reported models from the German WISC-V Technical Manual and rival bifactor models using the
standardization sample (N = 1,087) correlation matrix of the 15 primary and secondary subtests. EFA
results did not support a fifth factor (Fluid Reasoning). A four-factor model with the dominant general
intelligence (g) factor resembling the WISC-IV was supported by EFA. CFA results indicated the best
representation was a bifactor model with four group factors, complementing EFA results. Present EFA
and CFA results replicated other independent assessments of standardization and clinical samples of
the United States and international versions of the WISC-V and indicated primary, if not exclusive,
interpretation of the Full Scale IQ as an estimate of g.
Keywords: German WISC-V, exploratory factor analysis, confirmatory factor analysis,
bifactor model, hierarchical CFA, intelligence
APPENDIX C: Study 3 95
Introduction
Worldwide popularity of Wechsler scales has resulted in numerous translations, adaptations,
and norms for many different countries, languages, and cultures (Georgas et al., 2003; Oakland et al.,
2016); and H. Chen et al. (2010) reported latent factor structure invariance of the Wechsler Intelligence
Scale for Children–Fourth edition (WISC-IV) across cultures. The Wechsler Intelligence Scale for
Children–Fifth edition (WISC-V; Wechsler, 2014a) is the most recent version and purports to measure
five first-order factors (Verbal Comprehension [VC], Visual Spatial [VS], Fluid Reasoning [FR],
Working Memory [WM], Processing Speed [PS]) and a higher-order general intelligence (g) factor.
This is consistent with contemporary conceptualizations of intelligence influenced by Carroll, Cattell,
and Horn (Carroll, 1993, 2003; Cattell & Horn, 1978; Horn, 1991; Horn & Blankson, 2005; Horn &
Cattell, 1966), often referred to as the so-called Cattell–Horn–Carroll (CHC) theory (Schneider &
McGrew, 2012, 2018), and was also influenced by neuropsychological constructs (Wechsler, 2014c).
A major revision goal in constructing the WISC-V was to separate subtests from the former Perceptual
Reasoning (PR) factor into distinct VS and FR factors for better match to CHC. Similar attempts were
previously made with the WAIS-IV (Weiss et al., 2013a) and WISC-IV (Weiss et al., 2013b), but
Canivez and Kush (2013) highlighted numerous psychometric problems with the proposed higher-order
models that included five group factors in both the WAIS-IV and the WISC-IV. Among the problems
noted by Canivez and Kush (2013) were selective reporting of extant literature, creating intermediary
factors that make models appear statistically better, post hoc model modifications, neglecting rival
bifactor models, and lack of disclosure of decomposed variance estimates. WISC-V adaptations and
norms are available for Canada, Spain, France, the United Kingdom, and Germany; and a version for
Japan is forthcoming.
Canivez and Watkins (2016) criticized the publisher’s claimed supportive evidence for the
preferred higher-order measurement model (Model 5e) presented in the U.S. WISC-V Technical and
Interpretive Manual (Wechsler, 2014c) that included numerous methodological and statistical problems
including failure to report results of exploratory factor analyses (EFAs), use of weighted least squares
(WLS) estimation in confirmatory factor analyses (CFA) without explicit justification (Kline, 2016),
failure to fully disclose details of CFA, abandoning parsimony of simple structure (Thurstone, 1947)
by cross-loading Arithmetic [AR] on three group factors, empirical redundancy of FR and g due to the
standardized path coefficient of 1.0 between g and the FR factor, no consideration or testing of rival
bifactor models, omission of decomposed variance sources between the higher-order g and lower order
group factors, and absence of model-based reliability/validity estimates for g (omega-hierarchical [ωH])
and the lower-order group (omega-hierarchical subscale [ωHS]) factors (Watkins, 2017). Furthermore,
degrees of freedom often do not add up to what is expected based on freely estimated parameters of
stated models that suggests undisclosed fixing parameters to not go beyond permissible bounds. These
problems cast substantial doubt for the viability of the publisher preferred “confirmatory” model
(Beaujean, 2016; Canivez & Watkins, 2016).

APPENDIX C: Study 3 96
German WISC-V
The German adaptation of the U.S. Wechsler Intelligence Scale for Children–Fifth edition
(German WISC-V; Wechsler, 2017a), was reported to follow “contemporary intelligence theories,
factor analytic studies, and clinical research” (Wechsler, 2017b, p. 15). However, while the U.S. WISC-
V explicitly noted CHC theory (Wechsler, 2014c) the German WISC-V does not. Instead, a hierarchical
two- or three-stratum intelligence structure (with or without narrow abilities) is assumed without
references to specific intelligence theories or models and devoid of bifactor consideration. References
to reviews in Flanagan and Harrison (2012) and Sattler (2008a, 2008b) are provided for the German
WISC-V for different interpretation models because detailing descriptions of all intelligence theories
was reported not to be within the scope of the chapter (Wechsler, 2014c). While a detailed U.S. WISC-
V review (Canivez & Watkins, 2016) and several published independent analyses of the U.S. WISC-V
were available prior to publication of the German WISC-V (Canivez et al., 2016; Canivez & Watkins,
2016; Dombrowski et al., 2015) none were referenced and it is unknown if they were reviewed or
considered by the publisher in developing the German WISC-V. The German WISC-V includes all
primary and secondary subtests from the U.S. version, except Picture Concepts, which also was not
included in the versions for France and Spain (but was included in the Canadian and U.K. versions).
German WISC-V subtests are composed of items retained from the German WISC-IV
(Petermann & Petermann, 2011), items adapted and modified from the U.S. WISC-V, and newly
developed items. The German WISC-V Technical Manual does not provide a rationale for this mixture
of kept, adapted, and newly developed items and there is no presentation of equivalence with subtests
from the U.S. version. Specific guidelines or standards on which the adaptation and translation process
was based were not provided; however, reference to standards applied for the standardization program
of the U.S. version, namely the Standards for Educational and Psychological Testing (American
Educational Research Association [AERA], American Psychological Association [APA], & National
Council on Measurement in Education [NCME], 1999; Wechsler, 2017b, p. 57) was noted; although a
more recent version of the Standards was published in 2014 (AERA, APA, & NCME, 2014).
Psychometric properties and understanding of instructions were empirically tested in a pilot study prior
to the standardization process, but only for the verbal subtests (Similarities [SI], Vocabulary [VC],
Information [IN], Comprehension [CO], and AR). Internal consistency (split-half reliability)
coefficients based on the standardization sample were high for all German WISC-V subtests and index
scores (ranging from .80 for Cancellation [CA] to .96 for the Full Scale IQ [FSIQ]), and short-term
test–retest reliabilities with a mean retest interval of 26 days (SD = 19, range: 7-116 days) for a
subsample of 94 individuals ranged from .72 (Picture Span [PS]) to .90 (IN), with a stability coefficient
of .89 for the FSIQ. Validity evidence reported in the German WISC-V Technical Manual includes
factorial validity (described in detail below), convergent and discriminant validity, and distinct group
differences validity. The subtests and indexes showed medium to strong relationships with
corresponding subtests and indexes from the German adaptations of the WISC-IV, WPPSI-III

APPENDIX C: Study 3 97
(Wechsler Preschool and Primary Scale of Intelligence–Third edition; Petermann et al., 2014), WAIS-
IV (Petermann, 2012), and Kaufman Assessment Battery for Children–Second edition (KABC-II;
Kaufman & Kaufman, 2015). Furthermore, a subsample of gifted individuals obtained significantly
higher scores on all subtests, except for PS and some WM subtests, and had higher mean index scores
compared with matched controls; while a subsample of intellectually disabled individuals obtained
significantly lower scores on all subtests and had lower mean index scores and FSIQ compared with
matched controls.
Figure 1 presents the publisher preferred structural measurement model for the German WISC-
V as a basis for creation of standardized factor scores and interpretation. This is the identical model
proffered for the United States, Canadian, the United Kingdom, French, and Spanish versions. The
publisher claimed the German WISC-V “enables an estimation of general intelligence which is
represented by five cognitive domains” (Wechsler, 2017b, p. 102). This five-factor model was preferred
over the four-factor model based on reported better global fit, but like the U.S. WISC-V, this preferred
model includes problems of the standardized path coefficient of 1.0 from the higher-order g factor to
FR and includes three cross-loadings for the AR subtest (VC [.02], FR [.40], WM [.36]). Pauls et al.
(2020) used multi-group confirmatory factor analysis (MGCFA) to examine the latent factor structure
invariance of the publisher preferred German WISC-V measurement model across gender [sic] and
reported configural, first-order and second-order metric invariance. Unlike the German WISC-V
Technical Manual, Pauls et al. explicitly used maximum likelihood estimation with the reported
normally distributed subtests scores. Oddly, the reported df for baseline models was one higher than
would be expected based on the tested measurement model. Full scalar invariance was not supported,
but partial scalar invariance showed subtest intercepts for IN, Figure Weights (FW), Coding (CD), and
CA were not invariant across gender [sic], but invariance was observed for the other German WISC-V
subtests. Error variances were also reported to be invariant. In contrast to the German WISC-V
Technical Manual, Pauls et al. (2020) reported decomposed sources of variance in the German WISC-
V according to a Schmid and Leiman (1957) orthogonalized higher-order model and found that while
g had ample unique variance as reflected by high ωH (.798) and construct replicability index (H = .896)
values, the five group factors did not contain minimally acceptable unique variance. This led Pauls et
al. (2020) to conclude primary interpretation of the FSIQ as an estimate of g and cautious interpretation
of factor index scores, if at all.

APPENDIX C: Study 3 98
Figure 1. Publisher Preferred Higher-Order Measurement Model 5e With Standardized Coefficients (Adapted From Figure 5.1 [Wechsler, 2017b, p. 107]) for the German WISC-V Standardization Sample (N = 1,087)
Note. SI = Similarities, VC = Vocabulary, IN = Information, CO = Comprehension, BD = Block Design, VP = Visual Puzzles, MR = Matrix Reasoning, FW = Figure Weights, AR = Arithmetic, DS = Digit Span, PS = Picture Span, LN = Letter-Number Sequencing, CD = Coding, SS = Symbol Search, CA = Cancellation.
German WISC-V Concerns
The same major concerns and shortcomings observed in the U.S. WISC-V reported by Canivez
and Watkins (2016) were also observed in the German WISC-V Technical Manual (Wechsler, 2017b).
EFA were not reported, opting for exclusive use of CFA despite the complementary nature of EFA and
CFA (Brown, 2015; Gorsuch, 1983; Kline, 2016). Also, given the adaptations and modifications of
subtests, creation of new item content, proposed change in factor structure (separation of VS and FR),
and a new standardization sample; it cannot be assumed that the factor structure would be unchanged
and thus appropriate and necessary to use EFA to inform plausible CFA models to test. The method of
estimation was not disclosed nor was the method for setting scales. While maximum likelihood
estimation would customarily be used with tests like the German WISC-V given continuous variables
and reasonably normally distributed data, WLS estimation was used with other WISC-V versions
(Wechsler, 2014b, 2014c, 2015a, 2015b, 2016a, 2016c) but without specific justification (see Canivez
& Watkins, 2016). There was no report of the estimator used in German WISC-V CFA and model
comparisons relied solely on the χ2 difference despite reporting Akaike information criterion (AIC) and
Bayesian information criterion (BIC) estimates. It was stated in the German WISC-V Technical Manual
that nested models can be compared using the χ2 difference test, but “when models are not nested,
change in fit is assessed through subjective evaluation rather than statistical comparisons in model fit”
(p. 105). More troubling is the continued observation that there are fewer degrees of freedom reported
than expected, that is, they are not consistent with the number of freely estimated parameters suggested
by specified models. This suggests that parameters may have been fixed (without disclosure) to allow
model estimation by not allowing parameters to go beyond permissible bounds as was apparently done
SI VC IN CO BD VP MR FW DS PS LN CD SS CA
Verbal Comprehension
VisualSpatial
WorkingMemory
Processing Speed
General Intelligence
FluidReasoning
.83
.82 .78 .69 .74 .40 .77 .61 .78 .80.73 .50
.87 1.00 .87 .44
AR
.70 .36.69.76
.02
.77

APPENDIX C: Study 3 99
with the U.S. WISC-V (Beaujean, 2016). This calls into question reported global model fit indexes as
“supportive.” Additionally, bifactor measurement models were apparently disregarded and variance
estimates for contributions of first- and second-order factors remain absent. Bifactor models have
several advantages: (a) direct influences of the general factor are more easily interpretable, (b)
influences of both general and specific factors on indicators (subtests) are simultaneously examined,
and (c) the psychometric properties necessary for determining scoring and interpretation of subscales
(i.e., ωH and ωHS estimations) are directly examined (Canivez, 2016; Cucina & Byle, 2017; Reise, 2012).
Gignac (2006) also noted that the direct hierarchical (i.e., bifactor) model can be considered more
parsimonious because it specifies a unidimensional general factor. Furthermore, a major local fit
problem—a standardized path coefficient of 1.0 between higher-order g and the FR group factor—was
dismissed as a common finding in current studies on intelligence tests, without further discussion.
Another German WISC-V local fit problem included the standardized path coefficient of .02 from VC
to AR, which was not addressed at all in the manual. Finally, no statistical significances are reported in
the German WISC-V Technical Manual for any of the parameters from the final model, thus hampering
the examination of local fit problems.
WISC-V Research
Exploratory Factor Analyses
While EFAs were not reported in the WISC-V Technical and Interpretive Manual (Wechsler,
2014c), best practices (Watkins, 2018) applied in independent EFA of the U.S. WISC-V did not support
the existence of five group factors in the total WISC-V standardization sample (Canivez et al., 2016) or
in four age groups (6-8, 9-11, 12-14, and 15-16 years) within the WISC-V standardization sample
(Canivez, Dombrowski, et al., 2018; Dombrowski, Canivez, et al., 2018), as the fifth extracted factor
included only one salient subtest loading. Instead, a four-factor solution consistent with the WISC-IV
was found to best represent the standardization data. Schmid and Leiman (1957) orthogonalization of
the second-order EFA for the total U.S. WISC-V standardization sample and the four age groups found
substantial portions of variance apportioned to g and substantially smaller portions of variance
apportioned to the group factors (VC, PR, WM, and PS). ωH coefficients for g (Reise, 2012; Rodriguez
et al., 2016) ranged from .817 (Canivez et al., 2016) to .847 (Dombrowski, Canivez, et al., 2018) and
exceeded the preferred level (.75) for clinical interpretation (Reise, 2012; Reise et al., 2013; Rodriguez
et al., 2016). ωHS coefficients for the four U.S. WISC-V group factors (Reise, 2012) ranged from .131
to .530, but no ωHS coefficients for VC, PR, or WM approached or exceeded the minimum criterion
(.50) for clinical interpretation (Reise, 2012; Reise et al., 2013; Rodriguez et al., 2016). ωHS coefficients
for PS, however, approached or exceeded the .50 criterion for possible clinical interpretation.
Dombrowski et al. (2015) also failed to find support for five-factors in the total U.S. WISC-V
standardization sample using exploratory bifactor analysis through the bifactor rotation criterion
(Jennrich & Bentler, 2011). Furthermore, EFA did not support five group factors with a large U.S.
clinical sample (Canivez, McGill, et al., 2018). Recent independent research with the French WISC-V

APPENDIX C: Study 3 100
(Wechsler, 2016a) and the WISC-V U.K. edition (WISC-VUK; Wechsler, 2016b) found identical EFA
results supporting four first-order factors (not five), dominant general intelligence, and poor unique
measurement of the four group factors (Canivez et al., 2019; Lecerf & Canivez, 2018).
Confirmatory Factor Analyses
Independent CFA conducted with the 16 U.S. WISC-V primary and secondary subtests
(Canivez, Watkins, & Dombrowski, 2017) found all five of the higher-order models that included five
first-order group factors (including the final U.S. WISC-V measurement model presented in the U.S.
WISC-V Technical and Interpretative Manual as the preferred model) resulted in inadmissible
solutions (i.e., negative variance estimates for the FR factor) potentially caused by misspecification of
the models. A bifactor model that included five first-order factors produced an admissible solution and
fit the standardization data well, but examination of local fit indicated problems where the Matrix
Reasoning (MR), FW, and Picture Concepts subtests did not have statistically significant loadings on
the FR group factor. The bifactor model with four group factors (VC, PR, WM, and PS) was selected
as best based on the combination of statistical fit, local fit, and theory. This was consistent with previous
EFA results (Canivez et al., 2016) showing a dominant general intelligence dimension and weak group
factors with limited unique measurement beyond g. One study, however, (H. Chen et al., 2015) reported
factorial invariance of the final publisher preferred WISC-V higher-order model with five group factors
across gender [sic], although they did not examine invariance for alternative rival higher-order or
bifactor models.
Reynolds and Keith (2017) suggested U.S. WISC-V invariance across age groups, but the
model they examined for invariance was an oblique five-factor model, which ignores general
intelligence altogether. Then they used CFA to explore numerous post hoc model modifications for
first-order models with five-factors and then for both higher-order and bifactor models with five group
factors in an attempt to better understand U.S. WISC-V measurement. While such explorations are
possible, they may capitalize on chance and sample size. The final best fitting U.S. WISC-V higher-
order model produced by Reynolds and Keith was different from the publisher preferred model in that
AR was given a direct loading from g and a “cross-loading” on WM, and they also added correlated
disturbances for the VS and FR group factors (.77) to represent an intermediate nonverbal general
reasoning factor between the broad abilities and g. Yet the model still produced a standardized path
coefficient of .97 from g to FR suggesting inadequate discriminant validity. Another concern was
reliance on statistically significant χ2 difference tests for model improvement despite the large sample
and multiple comparisons but no meaningful changes in global fit. Researchers preferring higher-order
Wechsler scale structures often introduce post hoc cross-loadings and correlated disturbance and error
terms in altered CFA models; however, such procedures may capitalize on chance and sample size
(MacCallum et al., 1992; Schreiber et al., 2006; Ullman, 2001) and it is rare when such parameters are
specified a priori. Typically, previously unmodelled complexities are post hoc model adjustments
iteratively added to improve model fit and/or remedy local fit problems, but specification of such
APPENDIX C: Study 3 101
parameters may be problematic due to lack of conceptual grounding in previous theoretical work, may
be unlikely to replicate, and increase the dangers of hypothesizing after results are known (HARKing)
as noted by Cucina and Byle (2017). Preregistration would help address this potential problem.
Furthermore, decomposed variance estimates of the Reynolds and Keith higher-order model showed
the U.S. WISC-V subtests primarily reflected general intelligence variance with small portions of
unique group factor variance (except for the PS subtests). Their best U.S. WISC-V bifactor model
included a covariance estimate between VS and FR (.62), which appears necessary in order to salvage
five group factors that EFA (Canivez et al., 2016) failed to locate. Watkins et al. (2018) also tested a
similar bifactor model with the Canadian WISC-V (WISC-VCDN), but this bifactor model with five
group factors and VS–FR covariance estimate was not superior to the bifactor model with four group
factors, so the Wechsler-based bifactor model with four group factors (VC, PR, WM, and PS) was
preferred and Reynolds and Keith’s findings failed replication. Independent research regarding the
factor structure of international versions of the WISC-V replicated both EFA and CFA findings yielded
by independent assessments of the U.S. WISC-V version (cf. Canivez et al., 2016; Canivez, Watkins,
& Dombrowski, 2017), all failing to support five group factors (Canivez et al., 2019; Fenollar-Cortés
& Watkins, 2019; Lecerf & Canivez, 2018; Watkins et al., 2018).
Higher-Order Versus Bifactor Models
Publisher references to Carroll’s (1993) three stratum theory are provided in WISC-V technical
manuals, but repeatedly fail to report EFA findings and decomposed variance estimates using the
Schmid and Leiman transformation (SLT; Schmid & Leiman, 1957) which Carroll (1995) insisted on;
or use more recently developed exploratory bifactor analysis (Jennrich & Bentler, 2011, 2012). SLT
(sometimes referred to as an approximate bifactor solution; Reise, 2012) of EFA loadings apportion
subtest variance to the first-order and higher-order dimensions because intelligence test subtests are
influenced by both first-order factors and the higher-order g factor in a higher-order model.
Interpretation of higher-order models requires this partitioning of variance in EFA, as well as CFA, so
the relative influence of the first-order factors in comparison with the higher-order factor(s) may be
determined. However, the SLT is just a reparameterization of the higher-order (second-order) model
and may not be equivalent to a bifactor model (Beaujean, 2015b).
Higher-order representation of intelligence test structure is an indirect hierarchical model
(Gignac, 2005, 2006, 2008) where the g factor influences subtests indirectly through full mediation
through the first-order factors (Yung et al., 1999). The higher-order model conceptualizes g as a
superordinate factor and an abstraction from abstractions (Thompson, 2004). While higher-order
models have been commonly applied to assess intelligence test “construct-relevant psychometric
multidimensionality” (Morin, Arens, & Marsh, 2016, p. 117), the bifactor model predated widespread
use of higher-order models and was originally specified by Holzinger and Swineford (1937) and
referred to as a direct hierarchical (Gignac, 2005, 2006, 2008) or nested factors model (Gustafsson &
Balke, 1993). In bifactor models, g is conceptualized as a breadth factor (Gignac, 2008) because both

APPENDIX C: Study 3 102
the g and the group factors directly and independently influence the subtest indicators. This means that
both g and first-order group factors are at the same level of inference constituting a less complicated
(more parsimonious) conceptual model (Cucina & Byle, 2017; Gignac, 2008). Carroll (1993) and his
three stratum theory appear to reflect bifactor intelligence structure (Beaujean, 2015b) and there are
major theoretical differences between higher-order and bifactor models. In the higher-order model, g is
what the broad first-order factors have in common, whereas in the bifactor model, g is what is common
among a diverse set of tasks or indicators which is how Spearman and Carroll thought of g (Beaujean,
2019). Cucina and Byle (2017) illustrated superiority of bifactor representations among a variety of
cognitive tests and, given such results and the advantages of bifactor modeling for understanding test
structure (Canivez, 2016; Cucina & Byle, 2017; Gignac, 2008; Reise, 2012), bifactor model
comparisons should be routinely examined in addition to higher-order models for structural validation
of cognitive tests.
Purpose
Understanding the structural validity of tests is crucial for evaluating interpretability of
provided scores (AERA, APA, & NCME, 2014) and the German WISC-V Technical Manual lacks
sufficient and necessary information regarding evidence of the German WISC-V structure to properly
interpret test results. Numerous unanswered questions and incomplete information regarding the
German WISC-V structure prohibits users of the German WISC-V to exercise good judgment about
which scores have acceptable evidence of construct validity. Beaujean (2015a) indicated that a revised
test should be treated like a new test as it cannot be assumed that scores from the revision would be
directly comparable to the previous version without supporting evidence. Given the absence of EFA,
questionable CFA methods identified in the German WISC-V Technical Manual (Wechsler, 2017b),
and the lack of details regarding structural validity evidence, the present study (a) used best practices
in EFA (Watkins, 2018) to examine the German WISC-V factor structure suggested by the 15 primary
and secondary subtest relationships; (b) examined the German WISC-V factor structure using CFA with
customary maximum likelihood estimation; (c) compared bifactor models with higher-order models as
rival explanations; (d) decomposed factor variance sources in EFA and CFA; and (e) examined model-
based reliability/validity (Watkins, 2017). Answers to these questions are essential for users of the
German WISC-V to determine the interpretive value of the plethora of scores and score comparisons
provided in the German WISC-V and interpretive guidelines promulgated by the publisher.
Methods
Participants
To conduct independent EFA and CFA with the German WISC-V, standardization sample raw
data were requested from the publisher (NCS Pearson, Inc.) but access was denied without rationale.
Absent raw data, the present analyses required use of summary statistics (correlations, means, and
standard deviations) provided in the German WISC-V Technical Manual (Wechsler, 2017b, Table 5.1,

APPENDIX C: Study 3 103
pp. 96-97). The published correlation matrix includes correlations rounded to only 2 decimals, but
Carroll (1993) stated, “Little precision is lost by using two-decimal values” (p. 82). These correlations
were reportedly produced by participants who were members of the full German WISC-V
standardization sample (N = 1,087) who ranged in age from 6 to 16 years. The sample was stratified
according to the key variables indicated by the Federal Statistical Office of the Federal Republic of
Germany (2014): age, sex, migration background, parental education (age groups 6-9 years, four
education levels), and children’s school level (age groups 10-16 years, five school levels). Institutional
review board review and approval of methods were obtained by the first author although no data were
directly collected in this study.
Instrument
The German WISC-V (Wechsler, 2017a) is a general intelligence test composed of 15 subtests
with scaled scores (M = 10, SD = 3). Like the United States and other versions there are 10 primary
subtests (SI, VC, Block Design [BD], Visual Puzzles [VP], MR, FW, Digit Span [DS], PS, CD, Symbol
Search [SS]) that are used for the measurement of five factor-based Primary Index scales: Verbal
Comprehension Index (VCI), Visual Spatial Index (VSI), Fluid Reasoning Index (FRI), Working
Memory Index (WMI), and Processing Speed Index (PSI). Seven of the primary subtests are used to
produce the FSIQ. Ancillary index scales (pseudo-composites) are provided and include Quantitative
Reasoning Index (QRI), Auditory Working Memory Index (AWMI), Nonverbal Index (NVI), General
Ability Index (GAI), and Cognitive Proficiency Index (CPI), but are not factorially derived. Index
scores and FSIQ are standard score (M = 100, SD = 15) metrics. Secondary subtests (IN, CO, AR,
Letter–Number Sequencing [LN], CA) are used for substitution in FSIQ estimation when one subtest
is spoiled or for use in estimating newly created (QR, AWM, and NV) or previously existing (General
Ability and Cognitive Proficiency) Ancillary index scores. Ancillary index scores are not factorially
derived composite scores, but logically or theoretically constructed. Picture Concepts, a subtest present
in the U.S. WISC-V (and Canadian and U.K. versions) was not included in the German WISC-V.
Analyses
Exploratory Factor Analyses
The 15 German WISC-V primary and secondary subtest correlation matrix was used to conduct
EFAs. Several criteria were examined and compared for their recommendation of the number of factors
that might be extracted and retained (Gorsuch, 1983) and included eigenvalues >1 (Kaiser, 1960), the
scree test (Cattell, 1966), standard error of scree (SEscree; Zoski & Jurs, 1996), parallel analysis (PA;
Horn, 1965), Glorfeld’s (1995) modified PA (see Figure 2), and minimum average partials (MAP;
Frazier & Youngstrom, 2007; Velicer, 1976). Statistics were estimated with SPSS 24 for Macintosh or
with specific software where noted. The Watkins (2007) SEscree program was used as SEscree reportedly
is the most accurate objective scree method (Nasser et al., 2002). Random data and resulting eigenvalues
for PA using both mean and 95% confidence intervals (Glorfeld, 1995) were produced using the
O’Connor (2000) SPSS syntax with 100 replications to provide stable eigenvalue estimates. PA

APPENDIX C: Study 3 104
frequently suggests retaining too few factors (underextraction) in the presence of a strong general factor
(Crawford et al., 2010) so it was not the exclusive criterion. MAP was also conducted using the
O’Connor (2000) SPSS syntax.
Figure 2. Scree Plots for Horn’s Parallel Analysis for the German WISC-V Standardization Sample (N = 1,087)
Principal axis EFAs were conducted to analyze the factor structure of the German WISC-V
using SPSS 24 for Macintosh. Retained factors were obliquely rotated with promax (k = 4; Gorsuch,
1983) and viable factors required a minimum of two subtests with salient factor pattern coefficients (≥
.30; Child, 2006). Because the German WISC-V explicitly adopted a higher-order structure, the SLT
(Schmid & Leiman, 1957) procedure was applied to disentangle the contribution of 1st and 2nd order
factors, as advocated by Carroll (1993) and Gignac (2005). The SLT has been used in numerous EFA
studies with the WISC-IV (Watkins, 2006; Watkins et al., 2006), WISC-V (Canivez, Dombrowski, et
al., 2018; Canivez et al., 2016; Dombrowski, Canivez, et al., 2018), RIAS (Dombrowski et al., 2009;
Nelson et al., 2007), Wechsler Abbreviated Scale of Intelligence (WASI) and Wide Range Intelligence
Test (WRIT; Canivez et al., 2009), SB5 (Canivez, 2008), WISC-IV Spanish (McGill & Canivez, 2016),
French WAIS-III (Golay & Lecerf, 2011), French WISC-IV (Lecerf et al., 2010), French WISC-V
(Lecerf & Canivez, 2018), and WISC-VUK (Canivez et al., 2019). The SLT allows for deriving a
hierarchical factor model from higher-order models and decomposes the variance of each subtest score
0.00
1.00
2.00
3.00
4.00
5.00
6.00
7.00
1 2 3 4 5 6 7 8 9 10 11 12 13 14 15
Random Data 95% CI
German WISC-V Standardization Data (6-16) N=1,087
Eige
nvalue
Factor

APPENDIX C: Study 3 105
into general factor variance first and then first-order factor variance. The first-order factors are modeled
orthogonally to each other and to the general factor (Gignac, 2006; Gorsuch, 1983). The SLT was
produced using the MacOrtho program (Watkins, 2004). This procedure disentangles the common
variance explained by the general factor and the residual common variance explained by the first-order
factors.
Confirmatory Factor Analyses
CFA with maximum likelihood estimation was conducted using EQS 6.3 (Bentler & Wu, 2016).
Covariance matrices were reproduced for CFA using the correlation matrix, means, and standard
deviations obtained from the German WISC-V standardization sample. As with other similar studies
(e.g., Canivez, Watkins, & Dombrowski, 2017; Watkins et al., 2018) identification of latent variable
scales set a reference indicator to 1.0 in higher-order models and in bifactor models, by setting the
variance of latent variables to 1.0 (Brown, 2015; Byrne, 2006). As with other versions of the WISC-V,
the VS factor and FR factor are underidentified in some of the five-factor models because they are
measured by only two subtests (BD and VP, MR, and FW). Thus, in specifying the VS factor and FR
factor (in some five-factor models) in CFA bifactor models, the two subtests’ path coefficients on their
group factors were constrained to equality prior to estimation to ensure identification (Little et al.,
1999).
The structural models specified in Table 5.2 of the German WISC-V Technical Manual
(Wechsler, 2017b) were also examined in present CFA analyses and are reproduced in Table 1 and
Table 2 with the addition of alternative bifactor models that were not included in analyses reported in
the German WISC-V Technical Manual. Although there are no universally accepted cutoff values for
approximate fit indices (McDonald, 2010), overall global model fit was evaluated using the comparative
fit index (CFI), Tucker–Lewis index (TLI), standardized root mean squared residual (SRMR), and the
root mean square error of approximation (RMSEA). Higher CFI and TLI values indicate better fit
whereas lower SRMR and RMSEA values indicate better fit. Hu and Bentler (1999) combinatorial
heuristics indicated adequate model fit with CFI and TLI ≥ .90 along with SRMR ≤ .09 and RMSEA ≤
.08. Good model fit required CFI and TLI ≥ 0.95 with SRMR and RMSEA ≤ 0.06 (Hu & Bentler, 1999).
Additionally, the AIC was considered. AIC does not have a meaningful scale; the model with the
smallest AIC value is most likely to replicate (Kline, 2016) and would be preferred. Superior model fit
required adequate to good overall fit and display of meaningfully better fit. Meaningful differences
between well-fitting models were assessed using ΔCFI > .01 and ΔRMSEA > .015 (F. F. Chen, 2007;
Cheung & Rensvold, 2002) and ΔAIC > 10 (Burnham & Anderson, 2004). In addition to assessing
global fit, local fit assessment was conducted as models should never be retained “solely on global fit
testing” (Kline, 2016, p. 461).

APPENDIX C: Study 3 106
Table 1. German WISC-V Primary and Secondary Subtest Configuration for CFA Models With 1–4 Factors
Model 1 Model 2 Model 3 Model 4a Model 4a Bi-factor Model 4b Model 4c Model 4d
Subtest g F1 F2 F1 F2 F3 F1 F2 F3 F4 g F1 F2 F3 F4 F1 F2 F3 F4 F1 F2 F3 F4 F1 F2 F3 F4
SI ! ! ! ! ! ! ! ! !
VC ! ! ! ! ! ! ! ! !
IN ! ! ! ! ! ! ! ! !
CO ! ! ! ! ! ! ! ! !
BD ! ! ! ! ! ! ! ! ! VP ! ! ! ! ! ! ! ! ! MR ! ! ! ! ! ! ! ! ! FW ! ! ! ! ! ! ! ! ! AR ! ! ! ! ! ! ! ! ! ! ! ! DS ! ! ! ! ! ! ! ! ! PS ! ! ! ! ! ! ! ! ! LN ! ! ! ! ! ! ! ! ! CD ! ! ! ! ! ! ! ! !
SS ! ! ! ! ! ! ! ! !
CA ! ! ! ! ! ! ! ! !
Note. All models include a higher-order general factor except for the bifactor model. SI = Similarities; VC = Vocabulary; IN = Information; CO = Comprehension; BD = Block Design; VP = Visual Puzzles; MR = Matrix Reasoning; FW = Figure Weights; AR = Arithmetic; DS = Digit Span; PS = Picture Span; LN = Letter–Number Sequencing; CD = Coding; SS = Symbol Search; CA = Cancellation.
Table 2. German WISC-V Primary and Secondary Subtest Configurations for CFA Models With 5 Factors
Model 5a Model 5a Bifactor Model 5b Model 5c Model 5d Model 5e
Subtest F1 F2 F3 F4 F5 g F1 F2 F3 F4 F5 F1 F2 F3 F4 F5 F1 F2 F3 F4 F5 F1 F2 F3 F4 F5 F1 F2 F3 F4 F5
SI ! ! ! ! ! ! !
VC ! ! ! ! ! ! !
IN ! ! ! ! ! ! !
CO ! ! ! ! ! ! !
BD ! ! ! ! ! ! !
VP ! ! ! ! ! ! !
MR ! ! ! ! ! ! !
FW ! ! ! ! ! ! !
AR ! ! ! ! ! ! ! ! ! ! !
DS ! ! ! ! ! ! !
PS ! ! ! ! ! ! !
LN ! ! ! ! ! ! !
CD ! ! ! ! ! ! !
SS ! ! ! ! ! ! !
CA ! ! ! ! ! ! !
Note. All models include a higher-order general factor except for the bifactor model. SI = Similarities; VC = Vocabulary; IN = Information; CO = Comprehension; BD = Block Design; VP = Visual Puzzles; MR = Matrix Reasoning; FW = Figure Weights; AR = Arithmetic; DS = Digit Span; PS = Picture Span; LN = Letter–Number Sequencing; CD = Coding; SS = Symbol Search; CA = Cancellation.

APPENDIX C: Study 3 107
Model-based reliabilities/validities were estimated with coefficients ωH and ωHS, which
estimate reliability of unit-weighted scores produced by the indicators (Reise, 2012; Rodriguez et al.,
2016). ωH is the model-based reliability estimate for the general intelligence factor with variability of
group factors removed. ωHS is the model-based reliability estimate of a group factor with all other group
and general factors removed (Brunner et al., 2012; Reise, 2012). Omega estimates (ωH and ωHS) may be
obtained from CFA bifactor solutions or decomposed variance estimates from higher-order models and
were produced using the Omega program (Watkins, 2013), which is based on the tutorial by Brunner et
al. (2012) and the work of Zinbarg et al. (2005) and Zinbarg et al. (2006). Omega coefficients should
at a minimum exceed .50, but .75 is preferred (Reise, 2012; Reise et al., 2013).
Omega coefficients were supplemented with the H coefficient (Hancock & Mueller, 2001), a
construct reliability or construct replicability coefficient, and the correlation between a factor and an
optimally weighted composite score. H represents how well the latent factor is represented by the
indicators and a criterion value of .70 (Hancock & Mueller, 2001; Rodriguez et al., 2016) was used. H
coefficients were produced by the Omega program (Watkins, 2013).
Results
Exploratory Factor Analyses
The Kaiser–Meyer–Olkin Measure of Sampling Adequacy of .931 far exceeded the .60
minimum standard (Kaiser, 1974; Tabachnick & Fidell, 2007) and Bartlett’s Test of Sphericity (Bartlett,
1954), χ2 = 6,987.57, p < .0001; indicated that the German WISC-V correlation matrix was not random.
The correlation matrix was thus deemed appropriate for factor analysis. Without standardization sample
raw data, it was not possible to estimate univariate subtest skewness or kurtosis or multivariate
normality, but principal axis extraction does not require normality. While univariate and multivariate
skewness and kurtosis were not reported in the German WISC-V Technical Manual (Wechsler, 2017b),
Pauls et al. (2020) reported reasonably normally distributed subtest scores for the 15 German WISC-V
subtests within the two gender [sic] groups based on univariate estimates (Male sample skewness
ranged −.39 to .12, kurtosis ranged −.35 to .60, Female sample skewness ranged −.34 to .09 and kurtosis
ranged −.26 to .71); however, multivariate estimates were not provided.
Figure 2 illustrates the scree plots from Horn’s parallel analysis for the German WISC-V total
standardization sample. Scree, PA, and Glorfeld’s modified PA criteria suggested two factors, while
eigenvalues > 1 and SEscree criteria suggested 3 factors. The MAP criterion suggested only one factor.
In contrast, the German WISC-V publisher desired and claimed five latent factors. EFA began by
extracting five factors to examine subtest associations based on the publisher’s desired and promoted
structure to allow examination of the performance of smaller factors because Wood et al. (1996) noted
that it is better to overextract than underextract. Models with four, three, and two factors were
subsequently examined for adequacy.

APPENDIX C: Study 3 108
Results of a five-factor extraction with promax rotation presented in Table 3 include a fifth
factor with only one salient factor pattern coefficient (SI). This extraction and rotation also produced
Factor 1 (WM) that included salient pattern coefficients for theoretically related subtests (AR, DS, PS,
LN) but also included salient pattern coefficients for MR and FW. Factor 2 (VC) included salient pattern
coefficients for VC, IN, and CO. Factor 3 (VS [formerly PR]) included salient pattern coefficients for
BD, VP, and MR. However, MR also cross-loaded on Factor 1 (WM) which indicated a lack of simple
structure. Factor 4 (PS) included salient subtest pattern coefficients by the theoretically consistent
subtests (CD, SS, and CA). Thus, MR and FW did not share sufficient common variance to constitute a
FR dimension as specified by the publisher. This pattern of psychometrically unsatisfactory results is
indicative of overextraction (Gorsuch, 1983; Wood et al., 1996) and the five-factor model was judged
inadequate.
Table 3. German Wechsler Intelligence Scale for Children–Fifth Edition (WISC-V) Exploratory Factor Analysis: Five Oblique Factor Solution for the Total Standardization Sample (N = 1,087)
Subtest General
F1: Working Memory
F2: Verbal Comprehension
F3: Visual Spatial
F4: Processing Speed
F5: Inadequate
S P S P S P S P S P S h2 SI .749 .020 .611 .173 .708 .013 .633 -.004 .275 .736 .877 .787 VC .741 -.030 .578 .821 .856 .026 .581 -.015 .276 .063 .630 .736 IN .716 .056 .592 .526 .739 .186 .622 -.057 .239 .103 .614 .587 CO .633 .069 .508 .822 .752 -.137 .434 .098 .327 -.084 .469 .586 BD .645 -.009 .543 -.079 .462 .713 .732 .073 .325 .076 .514 .544 VP .668 .018 .569 .022 .502 .780 .764 .013 .293 -.072 .481 .586 MR .640 .341 .622 -.006 .471 .455 .651 -.036 .247 -.059 .448 .471 FW .666 .323 .631 .158 .559 .277 .619 -.050 .239 .025 .512 .464 AR .719 .532 .724 .065 .559 .157 .625 .045 .341 .022 .522 .546 DS .688 .832 .777 -.067 .489 -.005 .562 -.037 .272 .013 .479 .607 PS .579 .507 .601 .029 .447 .024 .476 .031 .270 .070 .436 .368 LN .698 .834 .779 .073 .536 -.082 .538 -.006 .300 -.065 .458 .614 CD .400 .123 .338 -.077 .243 -.097 .263 .727 .737 .080 .245 .553 SS .438 -.014 .335 .001 .285 .085 .337 .772 .789 -.031 .236 .626 CA .287 -.141 .183 .143 .235 .082 .221 .509 .516 -.054 .155 .280 Eigenvalue 6.41 1.58 1.04 .85 .67 % Variance 39.91 7.37 4.33 2.71 1.37 Factor Correlations F1: WM F2: VC F3: PR F4: PS F5 Working Memory (WM) – Verbal Comprehension (VC)
.676 –
Perceptual Reasoning (PR)
.740
.658 –
Processing Speed (PS) .396 .336 .366 – F5 .633 .698 .670 .283 –
Note. General structure coefficients are based on the first unrotated factor coefficients (g loadings). Salient pattern coefficients (≥ .30) presented in bold. German WISC-V subtests: SI = Similarities; VC = Vocabulary; IN = Information; CO = Comprehension; BD = Block Design; VP = Visual Puzzles; MR = Matrix Reasoning; FW = Figure Weights; AR = Arithmetic; DS = Digit Span; PS = Picture Span; LN = Letter–Number Sequencing; CD = Coding; SS = Symbol Search; CA = Cancellation; S = structure coefficient; P = pattern coefficient; h2 = communality.

APPENDIX C: Study 3 109
Table 4 presents the results of extracting four factors with promax rotation. The g loadings (first
unrotated factor structure coefficients) ranged from .287 (CA) to .744 (VC) and—except CD, SS, and
CA—were within the fair to good range based on Kaufman’s (1994) criteria (≥ .70 = good, .50-.69 =
fair, < .50 = poor). Table 4 illustrates robust VC (SI, VC, IN, and CO) and PS (CD, SS, and CA) factors
with theoretically consistent subtest associations. The WM factor included the four theoretically related
subtests (AR, DS, PS, and LN) but also included salient pattern coefficients of MR and FW. The VS
(formerly PR) factor included salient pattern coefficients of BD, VP, and MR, but FW did not have a
salient loading on this factor. Overall the four-factor model resembled WISC-IV structure but was not
a perfect match. MR had primary loading on the VS factor but cross-loaded on WM. The moderate to
high factor correlations presented in Table 4 (.341 to .747) suggested the presence of a general
intelligence factor (Gorsuch, 1983) requiring explication.
Table 4. German Wechsler Intelligence Scale for Children–Fifth Edition (WISC-V) Exploratory Factor Analysis: Four Oblique Factor Solution for the Total Standardization Sample (N = 1,087)
Subtest
General F1: Working Memory
F2: Verbal Comprehension
F3: Visual Spatial
F4: Processing Speed
S P S P S P S P S h2 Similarities .723 .090 .609 .522 .729 .215 .639 -.018 .273 .568 Vocabulary .744 -.051 .575 .919 .868 -.018 .579 -.011 .276 .756 Information .718 .041 .590 .621 .758 .184 .625 -.057 .238 .596 Comprehension .630 .065 .506 .778 .725 -.196 .433 .108 .327 .547 Block Design .648 -.029 .542 -.041 .495 .768 .742 .068 .322 .556 Visual Puzzles .668 .017 .570 -.007 .523 .738 .752 .017 .290 .566 Matrix Reasoning .641 .332 .622 -.034 .491 .438 .650 -.033 .245 .466 Figure Weights .668 .314 .630 .186 .580 .276 .621 -.050 .237 .465 Arithmetic .720 .526 .724 .085 .580 .161 .629 .045 .339 .547 Digit Span .690 .832 .777 -.057 .512 .000 .568 -.038 .269 .607 Picture Span .580 .506 .601 .074 .468 .043 .483 .029 .268 .367 Letter–Number Sequencing
.699 .826 .778 .045 .549 -.106 .541 -.002 .299 .609
Coding .400 .126 .337 -.036 .254 -.060 .270 .715 .731 .540 Symbol Search .439 -.014 .335 -.020 .289 .078 .337 .776 .792 .631 Cancellation .287 -.141 .183 .114 .230 .058 .218 .511 .516 .277 Eigenvalue 6.41 1.58 1.04 .85 % Variance 39.77 7.33 4.23 2.66 Promax-Based Factor Correlations F1: WM F2: VC F3: PR F4: PS F1: Working Memory (WM) – F2: Verbal Comprehension (VC) .700 – F3: Visual Spatial (VS) .747 .695 – F4: Processing Speed (PS) .392 .341 .364 –
Note. General structure coefficients are based on the first unrotated factor coefficients (g loadings). Salient pattern coefficients (≥ .30) presented in bold. Italic type denotes salient cross-loading. S = structure coefficient; P = pattern coefficient; h2 = communality.

APPENDIX C: Study 3 110
Table 5 presents results from the three- and two-factor extractions with promax rotation. For
the three-factor model, the VS/PR and WM factors merged, leaving fairly distinct VC and PS factors.
Oddly, SI cross-loaded on the VS/PR/WM factor. The two-factor model showed merging of VC,
VS/PR, and WM factors, leaving only the separate PS factor. No subtest cross-loadings were observed
in the two-factor model. The two- and three-factor models clearly displayed fusion of potentially
theoretically meaningful constructs that is symptomatic of underextraction, thereby rendering them
unsatisfactory (Gorsuch, 1983; Wood et al., 1996).
Table 5. German Wechsler Intelligence Scale for Children–Fifth Edition (WISC-V) Exploratory Factor Analysis: Two and Three Oblique Factor Solutions for the Total Standardization Sample (N = 1,087)
Subtest
Two Oblique Factors Three Oblique Factors
g a F1: g F2: PS h2 g a F1: PR/WM F2: VC F3: PS h2
SI .725 .751 (.735) -.036 (.295) .541 .725 .304 (.667) .509 (.724) -.018 (.288) .566 VC .722 .748 (.732) -.035 (.294) .537 .748 -.035 (.620) .904 (.875) -.009 (.289) .766 IN .716 .765 (.731) -.077 (.260) .538 .720 .233 (.650) .604 (.755) -.056 (.252) .593 CO .616 .583 (.613) .069 (.326) .380 .629 -.051 (.515) .712 (.713) .108 (.333) .517 BD .636 .595 (.632) .083 (.346) .405 .634 .584 (.644) .041 (.491) .071 (.335) .420 VP .658 .643 (.659) .037 (.320) .435 .656 .613 (.669) .062 (.518) .025 (.308) .449 MR .640 .653 (.647) -.012 (.275) .419 .642 .720 (.679) -.036 (.477) -.035 (.260) .463 FW .673 .706 (.684) -.049 (.262) .470 .670 .577 (.675) .166 (.568) -.053 (.251) .470 AR .723 .697 (.722) .057 (.364) .524 .722 .686 (.738) .047 (.562) .042 (.351) .547 DS .679 .687 (.685) -.005 (.298) .469 .683 .809 (.731) -.086 (.492) -.035 (.281) .539 PS .582 .565 (.582) .039 (.288) .340 .580 .557 (.594) .035 (.451) .026 (.277) .355 LN .689 .683 (.693) .021 (.322) .480 .690 .713 (.717) .006 (.526) .001 (.308) .514 CD .403 .004 (.322) .723 (.724) .525 .400 .062 (.333) -.047 (.245) .713 (.723) .525 SS .445 .001 (.355) .802 (.803) .644 .441 .033 (.360) -.015 (.282) .790 (.799) .639 CA .289 .010 (.233) .505 (.509) .260 .288 -.098 (.212) .121 (.229) .516 (.517) .274 Eigenvalue 6.41 1.58 6.41 1.58 1.04 % Variance 39.20 7.26 39.55 7.31 4.06 Factor Correlations F1 F2 F1 F2 F3
F1 – F1 – F2 .441 – F2 .730 – F3 .427 .346 –
Note. Factor pattern coefficients (structure coefficients) based on principal factors extraction with promax rotation (k = 4). Salient pattern coefficients (≥ .30) presented in bold. German WISC-V subtests: SI = Similarities; VC = Vocabulary; IN = Information; CO = Comprehension; BD = Block Design; VP = Visual Puzzles; MR = Matrix Reasoning; FW = Figure Weights; AR = Arithmetic; DS = Digit Span; PS = Picture Span; LN = Letter–Number Sequencing; CD = Coding; SS = Symbol Search; CA = Cancellation; g = general intelligence; PS = Processing Speed; PR = Perceptual Reasoning; WM = Working Memory; VC = Verbal Comprehension; h2 = communality. a General structure coefficients based on first unrotated factor coefficients (g loadings).
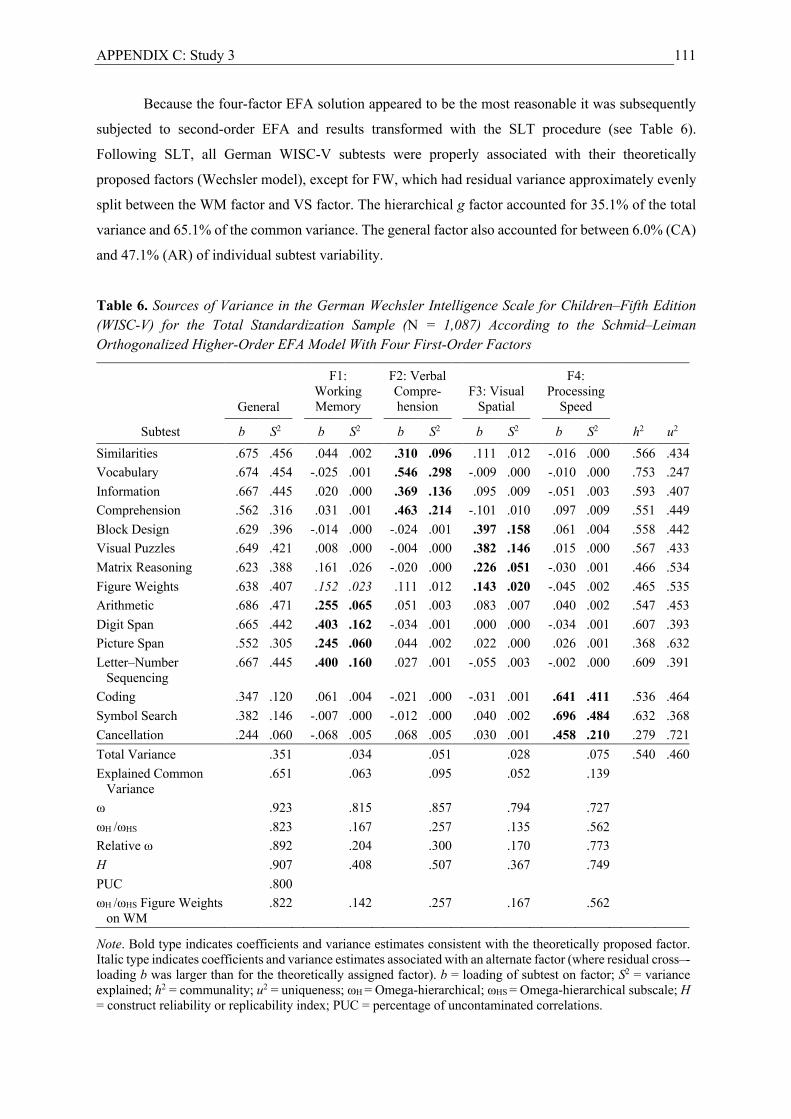
APPENDIX C: Study 3 111
Because the four-factor EFA solution appeared to be the most reasonable it was subsequently
subjected to second-order EFA and results transformed with the SLT procedure (see Table 6).
Following SLT, all German WISC-V subtests were properly associated with their theoretically
proposed factors (Wechsler model), except for FW, which had residual variance approximately evenly
split between the WM factor and VS factor. The hierarchical g factor accounted for 35.1% of the total
variance and 65.1% of the common variance. The general factor also accounted for between 6.0% (CA)
and 47.1% (AR) of individual subtest variability.
Table 6. Sources of Variance in the German Wechsler Intelligence Scale for Children–Fifth Edition (WISC-V) for the Total Standardization Sample (N = 1,087) According to the Schmid–Leiman Orthogonalized Higher-Order EFA Model With Four First-Order Factors
Subtest
General
F1: Working Memory
F2: Verbal Compre-hension
F3: Visual Spatial
F4: Processing Speed
b S2 b S2 b S2 b S2 b S2 h2 u2 Similarities .675 .456 .044 .002 .310 .096 .111 .012 -.016 .000 .566 .434 Vocabulary .674 .454 -.025 .001 .546 .298 -.009 .000 -.010 .000 .753 .247 Information .667 .445 .020 .000 .369 .136 .095 .009 -.051 .003 .593 .407 Comprehension .562 .316 .031 .001 .463 .214 -.101 .010 .097 .009 .551 .449 Block Design .629 .396 -.014 .000 -.024 .001 .397 .158 .061 .004 .558 .442 Visual Puzzles .649 .421 .008 .000 -.004 .000 .382 .146 .015 .000 .567 .433 Matrix Reasoning .623 .388 .161 .026 -.020 .000 .226 .051 -.030 .001 .466 .534 Figure Weights .638 .407 .152 .023 .111 .012 .143 .020 -.045 .002 .465 .535 Arithmetic .686 .471 .255 .065 .051 .003 .083 .007 .040 .002 .547 .453 Digit Span .665 .442 .403 .162 -.034 .001 .000 .000 -.034 .001 .607 .393 Picture Span .552 .305 .245 .060 .044 .002 .022 .000 .026 .001 .368 .632 Letter–Number Sequencing
.667 .445 .400 .160 .027 .001 -.055 .003 -.002 .000 .609 .391
Coding .347 .120 .061 .004 -.021 .000 -.031 .001 .641 .411 .536 .464 Symbol Search .382 .146 -.007 .000 -.012 .000 .040 .002 .696 .484 .632 .368 Cancellation .244 .060 -.068 .005 .068 .005 .030 .001 .458 .210 .279 .721 Total Variance .351 .034 .051 .028 .075 .540 .460
Explained Common Variance
.651 .063 .095 .052 .139
ω .923 .815 .857 .794 .727
ωH /ωHS .823 .167 .257 .135 .562
Relative ω .892 .204 .300 .170 .773
H .907 .408 .507 .367 .749
PUC .800
ωH /ωHS Figure Weights on WM
.822 .142 .257 .167 .562
Note. Bold type indicates coefficients and variance estimates consistent with the theoretically proposed factor. Italic type indicates coefficients and variance estimates associated with an alternate factor (where residual cross–-loading b was larger than for the theoretically assigned factor). b = loading of subtest on factor; S2 = variance explained; h2 = communality; u2 = uniqueness; ωH = Omega-hierarchical; ωHS = Omega-hierarchical subscale; H = construct reliability or replicability index; PUC = percentage of uncontaminated correlations.

APPENDIX C: Study 3 112
At the group factor level, WM accounted for an additional 3.4%, VC for an additional 5.1%,
VS for an additional 2.8%, and PS for an additional 7.5% of the total variance. Of the common variance,
WM accounted for an additional 6.3%, VC for an additional 9.5%, VS for an additional 5.2%, and PS
for an additional 13.9%. The general and group factors combined to measure 54.0% of the total variance
in German WISC-V scores, leaving 46.0% unique variance (combination of specific and error
variance).
ωH and ωHS coefficients were estimated based on the SLT results and presented in Table 6,
assigning FW to the VS factor. The ωH coefficient for general intelligence (.823) was high and sufficient
for scale interpretation of a unit-weighted composite score based on the indicators; however, the ωHS
coefficients for the four German WISC-V group factors (WM, VC, VS, and PS) were considerably
lower (.135-.562). Thus, unit-weighted composite scores based on all subtest indicators of the four
German WISC-V group factors, likely possess too little true score variance for confident clinical
interpretation, with the possible exception of PS (Reise, 2012; Reise et al., 2013). ωH and ωHS were also
estimated with FW assigned to the WM factor (see Table 6) and coefficients showed a slight decrease
in ωHS for WM but a slight increase for VS, but still well below the .50 criterion. H indexes indicated
an optimally weighted composite score for g accounted for 90.7% of g variance but WM, VC, and VS
group factors were not well defined by their optimally weighted indicators (Hs < .70). The H index of
.749 for PS indicated that it was well defined by optimal weighting of its three indicators.
Confirmatory Factor Analyses
Global Fit
Results from CFAs for the 15 German WISC-V primary and secondary subtests are presented
in Table 7. Combinatorial heuristics of Hu and Bentler (1999) indicated that Models 1 (g) and 2 (Verbal
and Performance) were inadequate due to too low CFI and TLI and too high SRMR and RMSEA values.
Model 3 was adequate but all models (higher-order and bifactor) that included four or five group factors
produced global fit statistics that indicated good model fit to these data, better than one-, two-, or three-
factor models. Bifactor versions of models with four and five group factors where AR was not cross-
loaded were meaningfully better than higher-order versions in CFI and AIC, but meaningful differences
in RMSEA were observed only for Model 4a bifactor and the EFA suggested bifactor compared with
the higher-order version. All bifactor models were superior to higher-order versions (ΔAIC > 10) and
thus more likely to replicate.
Local Fit
While all models with four or five group factors achieved good global fit, assessment of local
fit identified numerous problems. Table 8 presents each of the models that contained local fit problems
(i.e., nonstatistically significant standardized path coefficients, negative standardized path coefficients,
and standardized path coefficients of 1.0). Most of these models were thus considered inadequate.

APPENDIX C: Study 3 113
Table 7. Maximum Likelihood CFA Fit Statistics for the 15 German WISC-V Primary and Secondary Subtests for the Standardization Sample (N = 1,087)
Model a χ2 df CFI ∆CFI TLI SRMR RMSEA ∆RMSEA RMSEA 90% CI AIC ∆AIC
1 General Intelligence
1,242.69 90 .833 -.157 .806 .072 .109 .080 [.103, .114] 76,177.08 1069.43
2 Higher-Order b 1,155.06 88 .846 -.144 .816 .071 .106 .077 [.100, .111] 76,093.45 985.80 3 Higher-Order c 651.33 87 .918 -.072 .902 .044 .077 .048 [.072, .083] 75,591.72 484.07 4a Higher-Order d 276.83 86 .972 -.018 .966 .030 .045 .016 [.039, .051] 75,219.21 111.56 4a Bifactor e 143.26 75 .990 .000 .986 .023 .029 .000 [.022, .036] 75,107.65 0.00
4a Bifactor (no FW–VS path)*
143.27 76 .990 .000 .987 .023 .029 .000 [.021, .036] 75,105.66 -1.99
4b Higher-Order f 279.23 86 .972 -.018 .966 .030 .045 .016 [.040, .051] 75,221.62 113.97 4c Higher-Order g 259.36 85 .975 -.015 .969 .030 .043 .014 [.037, .049] 75,203.75 96.10 4d Higher-Order h 257.51 84 .975 -.015 .969 .030 .044 .015 [.038, .050] 75,203.90 96.25 EFA Suggested Bifactor i
143.25 75 .990 .000 .986 .023 .029 .000 [.022, .036] 75,107.63 -0.02
5a Higher-Order j 237.98 85 .978 -.012 .973 .029 .041 .012 [.035, .047] 75,182.36 74.71 5a Bifactor k 153.60 77 .989 -.001 .985 .024 .030 .001 [.023, .037] 75,117.98 10.33 5b Higher-Order l 236.19 85 .978 -.012 .973 .029 .040 .011 [.034, .047] 75,180.57 72.92 5c Higher-Order m 217.47 84 .981 -.009 .976 .028 .038 .009 [.032, .044] 75,163.86 56.21 5d Higher-Order n 228.20 84 .979 -.011 .974 .029 .040 .011 [.034, .046] 75,174.59 66.94 5e Higher-Order o 217.25 83 .981 -.009 .975 .028 .039 .010 [.032, .045] 75,165.63 57.98
Note. Bold text illustrates best fitting models. CFI = comparative fit index; TLI = Tucker–Lewis index (nonnormed fit index); SRMR = standardized root mean square (not available in robust estimation); RMSEA = root mean square error of approximation; AIC = Akaike’s information criterion; FW = Figure Weights; VS = Visual Spatial. a Model numbers correspond to those reported in the German WISC-V Technical Manual Table 5.2 and are higher-order models (unless otherwise specified) when more than one first-order factor was specified. Subtest assign-ments to latent factors are specified in Tables 1 and 2. b-o Models with local fit problems specified in Table 8. *Best model.
Model Selection
According to the ΔAIC > 10 criterion, the models most likely to generalize were Models 4a
bifactor and the EFA suggested bifactor. These were also identified best by ΔCFI and ΔRMSEA criteria.
However, local fit difficulties with Models 4a bifactor and EFA suggested bifactor (see Table 8)
weighed against their selection without modification. Thus, Model 4a bifactor (Figure 3) and EFA
suggested bifactor (Figure 4) and their modifications show remarkable similarity. Differences between
these models are with which group factor FW is placed, and in both instances, FW had a negative and
not-statistically significant standardized path coefficient with the assigned group factor. Figures 3 and
4 also illustrate modification where the FW group factor path was dropped and the model reestimated,
which resulted in an identical model with theoretical alignment of all subtests but FW having only a
path from g.

APPENDIX C: Study 3 114
Table 8. Local Fit Problems Identified Within Specified Models
CFA Model a Local Fit Problem
2 Higher-Order b V factor and higher-order g factor linearly dependent on other parameters, g factor standardized path coefficient with V factor = 1.0
3 Higher-Order c g factor standardized path coefficients with V factor (.943) and P factor (.964) were high 4a Higher-Order d g factor standardized path coefficients with VS factor (.946) and WM factor (.919) were
high
4a Bifactor e FW standardized path coefficient with VS factor (-.005) was not statistically significant; and the MR standardized path coefficient with VS factor (.136), PS standardized path coefficient with WM (.200), and AR standardized path coefficient with WM (.169) were statistically significant but low
4b Higher-Order f g factor standardized path coefficients with FR and WM factor (.945) were high 4c Higher-Order g g factor standardized path coefficients with VS+AR factor (.947) was high 4d Higher-Order h g factor standardized path coefficients with VS factor (.947) was high, AR standardized path
coefficient with VC (.069) not statistically significant, AR standardized path coefficient on VS (.262) was low, removing AR path from VC produces Model 4c
EFA Suggested Bifactor i
FW standardized path coefficient with WM factor (-.007) was not statistically significant; MR standardized path coefficient with VS (.138), PS standardized path coefficient with WM (.198), and AR standardized path coefficient with WM (.167) were statistically significant but low; removal of WM–FW path produces same model as 4a Bifactor (without VS–FW path)
5a Higher-Order j FR standardized path coefficient with g (.995) extremely high 5a Bifactor k MR (.090) and FW (.090) had low standardized path coefficients with FR and not
statistically significant, removal of MR and FW group factor paths eliminates the FR factor
5b Higher-Order l FR standardized path coefficient from g = 1.0 5c Higher-Order m FR standardized path coefficient from g = 1.0 5d Higher-Order n FR standardized path coefficient from g = 1.0, AR standardized path coefficient with VC
(.151) was low
5e Higher-Order o FR standardized path coefficient from g = 1.0, AR standardized path coefficient (.029) with VC not statistically significant, removal of AR loading with VC produces Model 5d
Note. Model number indicates the number of group factors included in the model and model number and letter correspond to those reported in the German WISC-V Technical Manual. Bifactor models were added for comparison. Subtest assignments to latent factors are specified in Tables 1 and 2. g = general intelligence; V = Verbal; P = Performance; VC = Verbal Comprehension; WM = Working Memory; VS = Visual Spatial; FR = Fluid Reasoning; FW = Figure Weights; MR = Matrix Reasoning; PS = Picture Span; AR = Arithmetic. a CFA model corresponding to Table 7. b-o Superscripts correspond model superscript designating local fit problem from Table 7.
Variance and Reliability: Modified Model 4a Bifactor
Table 9 presents sources of variance for the modified Model 4a bifactor (see Figure 3) from the
15 German WISC-V primary and secondary subtests where the group factor path for FW was dropped.
This model is identical to the EFA suggested bifactor model with the group factor path for FW dropped
(see Figure 4). Most subtest variance was associated with the general intelligence dimension and
substantially smaller portions of variance were uniquely associated with the four German WISC-V
group factors. ωH and ωHS coefficients were estimated based on the bifactor results from Table 9 and
the ωH coefficient for general intelligence (.836) was high and sufficient for confident scale
interpretation. The ωHS coefficients for the four German WISC-V factors (VC, VS, WM, and PS),
however, were considerably lower, ranging from .086 (VS) to .575 (PS). Thus, three German WISC-V

APPENDIX C: Study 3 115
group factors (VC, VS, and WM) likely possess too little unique true score variance in a unit-weighted
composite score to support confident clinical interpretation (Reise, 2012; Reise et al., 2013); however,
the PS group factor exceeded the minimum criterion for possible interpretation. H indexes indicated an
optimally weighted composite score for g accounted for 90.7% of g variance, but the four group factors
were not well defined by their optimally weighted indicators (Hs < .70). For comparison purposes,
Table A1 (see online supplement) presents sources of variance for Model 4a bifactor (see Figure 3)
from the 15 German WISC-V primary and secondary subtests including FW group factor path and
results of explained variances, ωH and ωHS, and H indexes were virtually identical to the modified Model
4a bifactor.
Figure 3. Bifactor Measurement Model (4a Bifactor), with Standardized Coefficients, for the German WISC-V Standardization Sample (N = 1,087) 15 Subtests, With and Without the VS–FW Path
Note. SI = Similarities, VC = Vocabulary, IN = Information, CO = Comprehension, BD = Block Design, VP = Visual Puzzles, MR = Matrix Reasoning, FW = Figure Weights, AR = Arithmetic, DS = Digit Span, PS = Picture Span, LN = Letter-Number Sequencing, CD = Coding, SS = Symbol Search, CA = Cancellation. *p < .05.
General Intelligence
SI VC IN CO BD VP MR FW
Verbal Comprehension
VisualSpatial
.288* .592* .333* .462* .379* .136*.401* -.005
.697* .658* .684* .548* .659* .660* .704*.634*
AR DS LN PS CD SS CA
Working Memory
Processing Speed
.169* .409* .405* .200* .643* .715* .456*
.726* .666* .668* .572* .331* .363* .232*
General Intelligence
SI VC IN CO BD VP MR FW
Verbal Comprehension
VisualSpatial
.287* .592* .333* .461* .377* .138*.405*
.697* .659* .684* .548* .658* .660* .703*.634*
AR DS LN PS CD SS CA
Working Memory
Processing Speed
.169* .409* .405* .199* .643* .715* .456*
.726* .666* .669* .573* .331* .363* .232*

APPENDIX C: Study 3 116
Figure 4. Bifactor Measurement Model (EFA Suggested Bifactor), With Standardized Coefficients, for the German WISC-V Standardization Sample (N = 1,087) 15 Subtests, With and Without the VS–FW Path
Note. SI = Similarities, VC = Vocabulary, IN = Information, CO = Comprehension, BD = Block Design, VP = Visual Puzzles, MR = Matrix Reasoning, FW = Figure Weights, AR = Arithmetic, DS = Digit Span, PS = Picture Span, LN = Letter-Number Sequencing, CD = Coding, SS = Symbol Search, CA = Cancellation. *p < .05.
General Intelligence
SI VC IN CO BD VP MR FW
Verbal Comprehension
VisualSpatial
.288* .592* .333* .462* .378* .138*.405* -.007
.697* .658* .683* .548* .658* .660* .704*.633*
AR DS LN PS CD SS CA
Working Memory
Processing Speed
.167* .407* .403* .198* .643* .715* .456*
.727* .667* .670* .573* .331* .363* .232*
General Intelligence
SI VC IN CO BD VP MR FW
Verbal Comprehension
VisualSpatial
.287* .592* .333* .461* .377* .138*.405*
.697* .659* .684* .548* .658* .660* .703*.634*
AR DS LN PS CD SS CA
Working Memory
Processing Speed
.169* .409* .405* .199* .643* .715* .456*
.726* .666* .669* .573* .331* .363* .232*

APPENDIX C: Study 3 117
Table 9. Sources of Variance in the 15 German Wechsler Intelligence Scale for Children-Fifth Edition (WISC-V) Primary and Secondary Subtests for the Standardization Sample (N = 1,087) According to a Bifactor Model With Four Group Factors With Visual Spatial to Figure Weights Path Removed
Subtest
General Verbal Com-prehension
Visual
Spatial Working Memory
Processing Speed
b S2 b S2 b S2 b S2 b S2 h2 u2 ECV Similarities .697 .486 .287 .082 .568 .432 .855
Vocabulary .659 .434 .592 .350 .785 .215 .553
Information .684 .468 .333 .111 .579 .421 .808
Comprehension .548 .300 .461 .213 .513 .487 .586
Block Design .634 .402 .377 .142 .544 .456 .739
Visual Puzzles .658 .433 .405 .164 .597 .403 .725
Matrix Reasoning .660 .436 .138 .019 .455 .545 .958
Figure Weights .703 .494 .494 .506 .999
Arithmetic .726 .527 .169 .029 .556 .444 .949
Digit Span .666 .444 .409 .167 .611 .389 .726
Picture Span .573 .328 .199 .040 .368 .632 .892
Letter–Number Sequencing
.669 .448 .405 .164 .612 .388 .732
Coding .331 .110 .643 .413 .523 .477 .209
Symbol Search .363 .132 .715 .511 .643 .357 .205
Cancellation .232 .054 .456 .208 .262 .738 .206 Total Variance .366 .050 .022 .027 .076 .541 .459
ECV .678 .093 .040 .049 .140
ω .926 .859 .805 .818 .725
ωH /ωHS .836 .253 .086 .137 .575
Relative ω .903 .295 .107 .168 .793
Factor Correlation .914 .503 .294 .370 .758
H .907 .506 .276 .319 .668
PUC .800
Note. b = loading of subtest on factor; S2 = variance explained; h2 = communality; u2 = uniqueness; ECV = explained common variance; ωH = Omega-hierarchical (general factor); ωHS = Omega-hierarchical subscale (group factors); H = construct reliability or replicability index; PUC = percentage of uncontaminated correlations. Illustrated in Figure 5.
Discussion
Results from the present independent EFA and CFA substantially challenge the German WISC-
V structure promoted in the German WISC-V Technical Manual on which standard scores and
interpretive guidelines are provided. EFA results failed to support a five-factor model as only the SI
subtest had a salient loading on the fifth factor which was inadequate and indicative of overfactoring.
As with other versions of the WISC-V, there appears to be no separate FR factor and EFA results from
both five- and four-factor models show the AR subtest to only saliently load on the WM factor. Given
this result, including AR in the pseudocomposite QRI appears misguided. Four first-order factors better
represented the German WISC-V structure, but FW saliently loaded on the WM and not VS (formerly
PR). The SLT of the four-factor oblique solution showed the primary subtest contribution was related

APPENDIX C: Study 3 118
mostly to g rather than to the first-order group factors (except for the PS subtests that poorly measure
g). The present results replicate the outcomes of two WISC-V EFA studies with international WISC-V
versions, the French WISC-V (Lecerf & Canivez, 2018) and the WISC-VUK (Canivez et al., 2019); two
EFA studies with the full U.S. WISC-V standardization sample data (Canivez et al., 2016; Dombrowski
et al., 2015), and two EFA studies examining the U.S. WISC-V standardization sample normative data
partitioned into four age-groups (Canivez, Dombrowski, et al., 2018; Dombrowski, Canivez, et al.,
2018). All found a lack of empirical support for five first-order factors and in all these studies the g
factor accounted for substantially greater common variance and there was strong support for
interpretation of composite score estimates of g. Also, these studies all showed inadequate portions of
unique group factor variance apart from g necessary for confident interpretation of factor index scores,
except, perhaps, for PS. These results were also observed in a large U.S. clinical sample (Canivez,
McGill, et al., 2018).
Present CFA results also failed to support the publisher’s preferred measurement model (Model
5e) and instead better supported a bifactor representation of German WISC-V structure with four group
factors similar to the present EFA results. When modeling five first-order factors and one higher-order
factor with all 15 primary and secondary subtests as promoted by the publisher (including Model 5e),
approximate fit statistics appeared to support the models, unlike CFA results of five group-factor
higher-order models with the U.S. WISC-V that produced model specification errors with negative FR
variance (see Canivez, Watkins, & Dombrowski, 2017). However, assessment of local fit identified
numerous problems of nonstatistically significant standardized path coefficients, negative standardized
path coefficients, and standardized g to FR paths of 1.0 or approaching 1.0. The publisher preferred
German WISC-V model (Model 5e) included three cross-loadings of AR on VC, FR, and WM identical
to the U.S. WISC-V, but present results found the standardized path coefficient of VC to AR (.029) was
not statistically significant and the standardized path coefficient from g to FR was 1.0 indicating
empirical redundancy, thereby indicating Model 5e was not the best model when one considers local
fit. A similar result was observed with the French WISC-V where the AR subtest also failed to yield a
statistically significant standardized path coefficient from VC, and thus the publisher preferred Model
5e was also not the best model with the French WISC-V (Lecerf & Canivez, 2018). A bifactor
representation of the German WISC-V with g and five group factors (Model 5a bifactor) produced
admissible global fit results, but MR and FW did not have statistically significant standardized path
coefficients on the FR group factor, thereby challenging FR viability. Removal of nonstatistically
significant MR and FW group factor paths eliminated the FR group factor. Thus, in both the higher-
order and bifactor representations of the German WISC-V, FR is empirically indistinguishable from
psychometric g.
These German WISC-V results are not unique and quite similar to EFA and CFA results
observed in studies of the WISC-IV (Bodin et al., 2009; Canivez, 2014; Keith, 2005; Styck & Watkins,
2016; Watkins, 2006, 2010; Watkins et al., 2006) and with other Wechsler scale versions (Canivez &

APPENDIX C: Study 3 119
Watkins, 2010a, 2010b; Canivez, Watkins, Good, et al., 2017; Gignac, 2005, 2006; Golay et al., 2013;
Golay & Lecerf, 2011; Lecerf & Canivez, 2018; McGill & Canivez, 2016, 2018; Nelson et al., 2013;
Watkins & Beaujean, 2014; Watkins et al., 2013). The present results showing dominance of g variance
and small portions of group factor variance are also not unique to Wechsler scales as similar results
have also been observed with the Woodcock–Johnson III (Cucina & Howardson, 2016; Dombrowski,
2013, 2014a, 2014b; Dombrowski & Watkins, 2013; Strickland et al., 2015), the Woodcock–Johnson
IV Cognitive and full battery (Dombrowski et al., 2017; Dombrowski, McGill, et al., 2018a, 2018b),
the Differential Ability Scale (DAS; Cucina & Howardson, 2016), the DAS–II (Canivez et al., 2020;
Canivez & McGill, 2016; Dombrowski et al., 2019), the Kaufman Adolescent and Adult Intelligence
Test (Cucina & Howardson, 2016), the KABC (Cucina & Howardson, 2016), the SB5 (Canivez, 2008),
the WASI and WRIT (Canivez et al., 2009), and the RIAS (Dombrowski et al., 2009; Nelson & Canivez,
2012, Nelson et al., 2007).
Practical Considerations
The present results have major practical implications in clinical assessment where the FRI is
provided yet is not empirically supported by German standardization sample data in either EFA or CFA.
This was also observed in the other WISC-V versions (Canivez et al., 2016; Canivez, Watkins, &
Dombrowski, 2017; Canivez et al., 2019; Fenollar-Cortés & Watkins, 2019; Lecerf & Canivez, 2018;
Watkins et al., 2018). The FR variance is essentially psychometric g variance, but this is obfuscated in
higher-order models unless variance sources are decomposed (something the publisher has never
provided in any WISC-V version) and thus, interpretation of a FR score most likely results in faulty
inferences. Furthermore, VCI, VSI, and WMI are scores based on subtests that measure more g variance
than group factor variance and the unique portions of true score variance provided by VC, VS, and WM
are also seemingly inadequate for confident interpretation of scores provided by either unit-weighted
or optimally weighted indexes as indicated by low ωHS and H coefficients, respectively (Brunner et al.,
2012; Reise, 2012; Reise et al., 2013; Rodriguez et al., 2016). Thus, “much of the reliable variance of
the subscale scores can be attributable to the general factor, and not what is unique to the group factors”
(Rodriguez et al., 2016, p. 225). Factor index scores, as provided by the publisher, conflate g variance
and group factor variance which cannot be disentangled at the individual level. This too was observed
in other WISC-V versions (Canivez et al., 2016; Canivez et al., 2019; Canivez, Watkins, &
Dombrowski, 2017; Fenollar-Cortés & Watkins, 2019; Lecerf & Canivez, 2018; Watkins et al., 2018).
Users of the German WISC-V can be confident in their individual clinical inferences regarding FSIQ
results, but inferences from index scores beyond the FSIQ are likely overinterpretations or
misinterpretations as also noted by Pauls et al. (2020). If it is important to generate scores for constructs
represented by the group factors, and distinction between VS and FR, then it appears there is much
work to be done to create tasks that accomplish this (if that is even possible). As Beaujean and Benson
(2019) argue based on the work of Luecht et al. (2006), to achieve this, “publishers should not attempt
to create instruments that concurrently measure some unitary attribute (e.g., a general attribute) and

APPENDIX C: Study 3 120
then try to spread out the same information across multiple scores of more specific attributes” (p. 130).
Thus, it might be necessary to refrain from creating multidimensional measures of intelligence
altogether and instead trying to develop multiple unidimensional tests, each designed to measure a
single, theoretically well-defined attribute. Furthermore, because the German WISC-V appears to only
measure g well and provides group factor scores with inadequate interpretive value beyond g, it may be
time and cost effective to use a measure like the German version of the Reynolds Intellectual
Assessment Scales (RIAS; Hagmann-von Arx & Grob, 2014) as a more efficient assessment of g.
Because the German RIAS includes only four (two verbal, two nonverbal) intelligence subtests
representing verbal and nonverbal group factors there are fewer scores and comparisons that might be
misused.
Theoretical Considerations
In addition to practical implications there are also theoretical implications for the present
results. The superiority of the bifactor model observed with the German WISC-V which allows the
general intelligence dimension to directly influence subtest indicators, while simultaneously allowing
group factor influences on subtests, is consistent with Spearman’s (1927) conceptualization of
intelligence as well as Carroll’s (1993; Beaujean, 2015b; Brunner et al., 2012; Frisby & Beaujean, 2015;
Gignac, 2006, 2008; Gignac & Watkins, 2013; Gustafsson & Balke, 1993). Beaujean (2015b) noted
Spearman’s conceptualization of general intelligence was of a factor “that was directly involved in all
cognitive performances, not indirectly involved through, or mediated by, other factors” (p. 130) and he
also opined that “Carroll was explicit in noting that a bi-factor model best represents his theory” (p.
130). This conceptualizes g as a breadth factor that permits multidimensionality by determining how
broad abilities perform independent of the g factor and was also preferred by Gignac (2008). Bifactor
representation of g is less complicated and can be considered more parsimonious (Cucina & Byle, 2017;
Gignac, 2008) with g and group factors at the same level of inference (see also Canivez, 2013b;
Thompson, 2004). This is in contrast to the superordinate conceptualization of g represented by the
publisher preferred higher-order model where the influence of psychometric g is fully mediated by the
first-order group factors.
The theoretical appropriateness of bifactor models of intelligence was questioned by Reynolds
and Keith (2013) who argued “we believe that higher-order models are theoretically more defensible,
more consistent with relevant intelligence theory (e.g., Jensen, 1998), than are less constrained
hierarchical [bifactor] models” (p. 66). Gignac (2006, 2008) alternatively suggested that because g was
the most substantial factor it should be directly modeled and that full mediation of g in the higher-order
model was what required explicit theoretical justification. Carroll (1993, 1995) pointed out that subtest
scores reflect variation of both a general and more specific group factor but because they generally
contain larger portions of g variance the subtest scores reliability is primarily a function of the general
factor, not the specific group factor. Other researchers have also argued that Spearman’s (1927) and
Carroll’s (1993) conceptualizations of intelligence are better represented by the bifactor model and not

APPENDIX C: Study 3 121
the higher-order model (Beaujean, 2015b; Brunner et al., 2012; Frisby & Beaujean, 2015; Gignac, 2006,
2008; Gignac & Watkins, 2013; Gustafsson & Balke, 1993).
Murray and Johnson (2013), Gignac (2016), and Mansolf and Reise (2017) determined that
bifactor models might be found superior in fit due to unmodeled complexities such as small cross-
loadings of indicators on multiple factors, proportionality constraint, or tetrad constraints; so the
bifactor model may not be statistically better. Analyses of simulations of bifactor and higher-order
models by Morgan et al. (2015) confirmed that regardless of the true structure, both types of models
exhibited good model fit. Mansolf and Reise (2017) admitted that presently there is no technical solution
to resolve the problem that bifactor and higher-order models cannot be distinguished by fit indices.
Given this problem, Watkins et al. (2018) suggested requiring “a parsimonious, substantively
meaningful model that fits observed data adequately well” (MacCallum & Austin, 2000, p. 218) and
that fulfills the purpose of measurement; while Murray and Johnson (2013) concluded that when
estimating or accounting for domain-specific abilities, the “bifactor model factor scores should be
preferred” (p. 420). In the case of the German WISC-V, and all Wechsler scales, factor index scores
and the numerous factor index score comparisons (ipsative and pairwise) and inferences made from
such comparisons beyond the FSIQ is focusing on domain-specific abilities, so a bifactor model is
necessary. Researchers and clinicians must know how well German WISC-V group factor scores
perform independent of the g factor score (F. F. Chen et al., 2006; F. F. Chen et al., 2012).
Reise et al. (2010) also concluded that a bifactor model, which contains a general factor but
permits multidimensionality, is better than the higher-order model so that relative contribution of group
factors independent of the general factor (i.e., general intelligence) may be determined. This has also
been recommended by others (Brunner et al., 2012; DeMars, 2013; Morin et al., 2016; Reise, 2012;
Reise et al., 2013; Rodriguez et al., 2016). Given the absence of the FR factor and poor ωHS and H
coefficients for VC, VS, and WM, interpretation of these German WISC-V index scores “as
representing the precise measurement of some latent variable that is unique or different from the general
factor, clearly, is misguided” (Rodriguez et al., 2016, p. 225).
A final theoretical implication of present German WISC-V results relates to the so-called CHC
theory (McGrew, 2009; Schneider, & McGrew, 2018). While several group factors (broad abilities)
could be located, but not FR, the dominance of the g factor in explaining common variance in the
German WISC-V is consistent with Carroll’s three stratum theory and not with the Cattell–Horn
extended Gf-Gc theory. Cucina and Howardson (2017) offered the same conclusion in their analyses.
Given the volume of evidence regarding preeminence of g variance in Wechsler scales and other
intelligence tests, an annulment of the unhappy arranged marriage of the theories of Cattell–Horn and
Carroll appears warranted (Canivez & Youngstrom, 2019; Wasserman, 2019).
Limitations
The present study examined EFA and CFA for the full German WISC-V standardization sample
but it is possible that different age groups within the German WISC-V standardization sample might
APPENDIX C: Study 3 122
produce somewhat different results. EFA and CFA with different age subgroups should be conducted
to examine structural invariance across age. Other demographic variables where invariance should be
examined include sex and socioeconomic status. While Pauls et al. (2020) reported factor structure
invariance for the publisher preferred German WISC-V measurement model (Model 5e) across gender
[sic] and reported configural, first-order and second-order metric invariance, this only shows that the
inadequate measurement model did not vary between groups. Invariance of the better represented
bifactor model with four group factors identified in the present study should be examined. Structural
invariance across gender [sic] was also reported for the U.S. WISC-V (H. Chen et al., 2015) but bifactor
models and models with fewer group factors were also not examined. Because the publisher denied
access to the German WISC-V standardization sample raw data, we are unable to independently conduct
such analyses.
The present analyses were of the standardization sample and results may not generalize to other
populations such as clinical groups or other independent samples of nonclinical groups, participants of
different races/ethnicities, immigration status, or language minorities. Finally, the results of the present
study only consider the latent factor structure and cannot fully test the construct validity of the German
WISC-V. Examinations of German WISC-V relationships with external criteria (e.g., scholastic
achievement) are needed. Examinations of incremental predictive validity (Canivez, 2013a; Canivez et
al., 2014; Glutting et al., 2006) to determine if reliable achievement variance is incrementally accounted
for by the German WISC-V factor index scores beyond that accounted for by the FSIQ (or through use
of latent factor scores, see Kranzler et al., 2015) and diagnostic utility (see Canivez, 2013b) studies
should also be conducted. However, the small portions of true score variance uniquely contributed by
the four group factors identified here with the German WISC-V standardization sample makes it
unlikely that German WISC-V factor index scores would provide meaningful additive interpretive
value. Finally, while the present findings show dominance of general intelligence this does not mean
that psychometric g is a single psychological attribute and perhaps, as indicated by Kovacs and Conway
(2016) and Kan et al. (2019), the g factor may be a formative variable rather than a reflective variable;
although Gottfredson (2016) argued the Kovacs and Conway Process Overlap Theory actually can be
considered support for g. The present results (and Pauls et al., 2020) suggest clinicians should interpret
with caution the factor index scores, if at all, due to low amounts of unique contributions of the broad
abilities. However, that does not mean that broad abilities do not exist, they just may not be adequately
measured by the German WISC-V or other intelligence tests.
Conclusion
Based on the present results, the German WISC-V as presented in the German WISC-V
Technical Manual appears to be overfactored and the strong replication of previous EFA and CFA
findings with the U.S. WISC-V and other international versions further indicates primary, if not
exclusive, focus of interpretation on the German WISC-V FSIQ. The attempt to divide the PR factor
into separate VS and FR factors was again unsuccessful by not producing a viable FR factor. Therefore,

APPENDIX C: Study 3 123
generating standard scores and comparisons for FR is potentially misleading and users likely
misinterpreting scores. If FR cannot be located and does not make a unique contribution then the
publisher should provide normative scores for four (VC, VS, WM, and PS) rather than five first-order
factors, but the small portions of unique variance contribution by VC, VS, and WM likely render them
of little utility; and the poor measurement of g by PS subtests might call for elimination from a test of
general intelligence. The present results will help users of the German WISC-V make informed
decisions about whether, when, and how to use the German WISC-V and which scores have adequate
psychometric support for confident interpretation. Researchers and clinicians must rely on more than
the test technical manuals to appropriately use test scores and their comparisons because test users bear
“the ultimate responsibility for appropriate test use and interpretation” (AERA, APA, & NCME, 2014,
p. 141). This will also allow professionals ethically using the German WISC-V to “know what their
tests can do and act accordingly” (Weiner, 1989, p. 829).

APPENDIX C: Study 3 124
References
American Educational Research Association, American Psychological Association, & National Council
on Measurement in Education (Eds.). (1999). Standards for educational and psychological
testing. American Educational Research Association.
American Educational Research Association, American Psychological Association, & National Council
on Measurement in Education. (2014). Standards for educational and psychological testing.
American Educational Research Association.
Bartlett, M. S. (1954). A further note on the multiplying factors for various chi-square approximations
in factor analysis. Journal of the Royal Statistical Society: Series B, 16(2), 296–298.
https://doi.org/10.1111/j.2517-6161.1954.tb00174.x
Beaujean, A. A. (2015a). Adopting a new test edition: Psychometric and practical considerations.
Research and Practice in the Schools, 3(1), 51–57.
Beaujean, A. A. (2015b). John Carroll’s views on intelligence: Bi-factor vs. higher-order models.
Journal of Intelligence, 3(4), 121–136. http://doi.org/10.3390/jintelligence3040121
Beaujean, A. A. (2016). Reproducing the Wechsler Intelligence Scale for Children–Fifth Edition:
Factor model results. Journal of Psychoeducational Assessment, 34(4), 404–408.
http://doi.org/10.1177/0734282916642679
Beaujean, A. A. (2019). General and specific intelligence attributes in the two-factor theory: A historical
review. In D. J. McFarland (Ed.), General and specific mental abilities (pp. 25–58). Cambridge
Scholars.
Beaujean, A. A., & Benson, N. F. (2019). Theoretically-consistent cognitive ability test development
and score interpretation. Contemporary School Psychology, 23(2), 126–137.
http://doi.org/10.1007/s40688-018-0182-1
Bentler, P. M., & Wu, E. J. C. (2016). EQS for Windows. Multivariate Software.
Bodin, D., Pardini, D. A., Burns, T. G., & Stevens, A. B. (2009). Higher order factor structure of the
WISC-IV in a clinical neuropsychological sample. Child Neuropsychology, 15(5), 417–424.
http://doi.org/10.1080/09297040802603661
Brown, T. A. (2015). Confirmatory factor analysis for applied research (2nd ed.). Guilford Press.
Brunner, M., Nagy, G., & Wilhelm, O. (2012). A tutorial on hierarchically structured constructs.
Journal of Personality, 80(4), 796–846. http://doi.org/10.1111/j.1467-6494.2011.00749.x
Burnham, K. P., & Anderson, D. R. (2004). Multimodel inference: Understanding AIC and BIC in
model selection. Sociological Methods & Research, 33(2), 261–304. http://doi.org/10.1177/
0049124104268644
Byrne, B. M. (2006). Structural equation modeling with EQS (2nd ed.). Lawrence Erlbaum.
Canivez, G. L. (2008). Orthogonal higher-order factor structure of the Stanford–Binet Intelligence
Scales–Fifth Edition for children and adolescents. School Psychology Quarterly, 23(4), 533–
541. http://doi.org/10.1037/a0012884

APPENDIX C: Study 3 125
Canivez, G. L. (2013a). Incremental validity of WAIS–IV factor index scores: Relationships with
WIAT-II and WIAT-III subtest and composite scores. Psychological Assessment, 25(2), 484–
495. http://doi.org/10.1037/a0032092
Canivez, G. L. (2013b). Psychometric versus actuarial interpretation of intelligence and related aptitude
batteries. In D. H. Saklofske, C. R. Reynolds, & V. L. Schwean (Eds.), Oxford handbook of
child psychological assessments (pp. 84–112). Oxford University Press.
Canivez, G. L. (2014). Construct validity of the WISC-IV with a referred sample: Direct versus indirect
hierarchical structures. School Psychology Quarterly, 29(1), 38–51. http://doi.org/10.1037/
spq0000032
Canivez, G. L. (2016). Bifactor modeling in construct validation of multifactored tests: Implications for
understanding multidimensional constructs and test interpretation. In K. Schweizer, & C.
DiStefano (Eds.), Principles and methods of test construction: Standards and recent
advancements (pp. 247–271). Hogrefe.
Canivez, G. L., Dombrowski, S. C., & Watkins, M. W. (2018). Factor structure of the WISC-V for four
standardization age groups: Exploratory and hierarchical factor analyses with the 16 primary
and secondary subtests. Psychology in the Schools, 55(7), 741–769.
http://doi.org/10.1002/pits.22138
Canivez, G. L., Konold, T. R., Collins, J. M., & Wilson, G. (2009). Construct validity of the Wechsler
Abbreviated Scale of Intelligence and Wide Range Intelligence Test: Convergent and structural
validity. School Psychology Quarterly, 24(4), 252–265. http://doi.org/10.1037/a0018030
Canivez, G. L., & Kush, J. C. (2013). WISC-IV and WAIS-IV structural validity: Alternate methods,
alternate results: Commentary on Weiss et al. (2013a) and Weiss et al. (2013b). Journal of
Psychoeducational Assessment, 31(2), 157–169. http://doi.org/10.1177/0734282913478036
Canivez, G. L., & McGill, R. J. (2016). Factor structure of the Differential Ability Scales–Second
Edition: Exploratory and hierarchical factor analyses with the core subtests. Psychological
Assessment, 28(11), 1475–1488. http://doi.org/10.1037/pas0000279
Canivez, G. L., McGill, R. J., & Dombrowski, S. C. (2020). Factor structure of the Differential Ability
Scales–Second Edition core subtests: Standardization sample confirmatory factor analyses.
Journal of Psychoeducational Assessment, 38(7), 791–815. https://doi.org/10.1177/
0734282920914792
Canivez, G. L., McGill, R. J., Dombrowski, S. C., Watkins, M. W., Pritchard, A. E., & Jacobson, L. A.
(2018). Construct validity of the WISC-V in clinical cases: Exploratory and confirmatory factor
analyses of the 10 primary subtests. Assessment, 27(2), 274–296. https://doi.org/10.1177/
1073191118811609
Canivez, G. L., & Watkins, M. W. (2010a). Exploratory and higher-order factor analyses of the
Wechsler Adult Intelligence Scale–Fourth Edition (WAIS–IV) adolescent subsample. School
Psychology Quarterly, 25(4), 223–235. http://doi.org/10.1037/a0022046

APPENDIX C: Study 3 126
Canivez, G. L., & Watkins, M. W. (2010b). Investigation of the factor structure of the Wechsler Adult
Intelligence Scale– Fourth Edition (WAIS-IV): Exploratory and higher order factor analyses.
Psychological Assessment, 22(4), 827–836. http://doi.org/10.1037/a0020429
Canivez, G. L., & Watkins, M. W. (2016). Review of the Wechsler Intelligence Scale for Children–
Fifth Edition: Critique, commentary, and independent analyses. In A. S. Kaufman, S. E.
Raiford, & D. L. Coalson (Eds.), Intelligent testing with the WISC-V (pp. 683–702). Wiley.
Canivez, G. L., Watkins, M. W., & Dombrowski, S. C. (2016). Factor structure of the Wechsler
Intelligence Scale for Children–Fifth Edition: Exploratory factor analyses with the 16 primary
and secondary subtests. Psychological Assessment, 28(8), 975–986. http://doi.org/10.1037/
pas0000238
Canivez, G. L., Watkins, M. W., & Dombrowski, S. C. (2017). Structural validity of the Wechsler
Intelligence Scale for Children–Fifth Edition: Confirmatory factor analyses with the 16 primary
and secondary subtests. Psychological Assessment, 29(4), 458–472. http://doi.org/10.1037/
pas0000358
Canivez, G. L., Watkins, M. W., Good, R., James, K., & James, T. (2017). Construct validity of the
Wechsler Intelligence Scale for Children–Fourth UK Edition with a referred Irish sample:
Wechsler and Cattell–Horn–Carroll model comparisons with 15 subtests. British Journal of
Educational Psychology, 87(3), 383–407. http://doi.org/10.1111/bjep.12155
Canivez, G. L., Watkins, M. W., James, T., James, K., & Good, R. (2014). Incremental validity of
WISC-IVUK factor index scores with a referred Irish sample: Predicting performance on the
WIAT-IIUK. British Journal of Educational Psychology, 84(4), 667–684. http://doi.org/
10.1111/ bjep.12056
Canivez, G. L., Watkins, M. W., & McGill, R. J. (2019). Construct validity of the Wechsler Intelligence
Scale for Children–Fifth UK Edition: Exploratory and confirmatory factor analyses of the 16
primary and secondary subtests. British Journal of Educational Psychology, 89(2), 195–224.
http://doi.org/10.1111/bjep.12230
Canivez, G. L., & Youngstrom, E. A. (2019). Challenges to the Cattell–Horn–Carroll theory: Empirical,
clinical, and policy implications. Applied Measurement in Education, 32(3), 232–248.
https://doi.org/10.1080/08957347.2019.1619562
Carroll, J. B. (1993). Human cognitive abilities. Cambridge University Press.
Carroll, J. B. (1995). On methodology in the study of cognitive abilities. Multivariate Behavioral
Research, 30(3), 429–452. http://doi.org/10.1207/s15327906mbr3003_6
Carroll, J. B. (2003). The higher-stratum structure of cognitive abilities: Current evidence supports g
and about ten broad factors. In H. Nyborg (Ed.), The scientific study of general intelligence:
Tribute to Arthur R. Jensen (pp. 5–21). Pergamon Press.
Cattell, R. B. (1966). The scree test for the number of factors. Multivariate Behavioral Research, 1(2),
245–276. http://doi.org/10.1207/s15327906mbr0102_10

APPENDIX C: Study 3 127
Cattell, R. B., & Horn, J. L. (1978). A check on the theory of fluid and crystallized intelligence with
description of new subtest designs. Journal of Educational Measurement, 15(3), 139–164.
https://doi.org/10.1111/j.1745-3984.1978.tb00065.x
Chen, F. F. (2007). Sensitivity of goodness of fit indexes to lack of measurement invariance. Structural
Equation Modeling, 14(3), 464–504. http://doi.org/10.1080/10705510701301834
Chen, F. F., Hayes, A., Carver, C. S., Laurenceau, J.-P., & Zhang, Z. (2012). Modeling general and
specific variance in multifaceted constructs: A comparison of the bifactor model to other
approaches. Journal of Personality, 80(1), 219–251. http://doi.org/10.1111/j.1467-
6494.2011.00739.x
Chen, F. F., West, S. G., & Sousa, K. H. (2006). A comparison of bifactor and second-order models of
quality of life. Multivariate Behavioral Research, 41(2), 189–225. http://doi.org/10.1207/
s15327906mbr4102_5
Chen, H., Keith, T. Z., Weiss, L., Zhu, J., & Li, Y. (2010). Testing for multigroup invariance of second-
order WISC-IV structure across China, Hong Kong, Macau, and Taiwan. Personality and
Individual Differences, 49(7), 677–682. http://doi.org/10.1016/j.paid.2010.06.004
Chen, H., Zhang, O., Raiford, S. E., Zhu, J., & Weiss, L. G. (2015). Factor invariance between gender
on the Wechsler Intelligence Scale for Children–Fifth Edition. Personality and Individual
Differences, 86(November), 1–5. http://doi.org/10.1016/j.paid.2015.05.020
Cheung, G. W., & Rensvold, R. B. (2002). Evaluating goodness-of-fit indexes for testing measurement
invariance. Structural Equation Modeling, 9(2), 233–255. http://doi.org/10.1207/
S15328007SEM0902_5
Child, D. (2006). The essentials of factor analysis (3rd ed.). New York, NY: Continuum.
Crawford, A. V., Green, S. B., Levy, R., Lo, W. J., Scott, L., Svetina, D., & Thompson, M. S. (2010).
Evaluation of parallel analysis methods for determining the number of factors. Educational and
Psychological Measurement, 70(6), 885–901. http://doi.org/10.1177/0013164410379332
Cucina, J. M., & Byle, K. (2017). The bifactor model fits better than the higher-order model in more
than 90% of comparisons for mental abilities test batteries. Journal of Intelligence, 5(27), 1–
21. http://doi.org/10.3390/jintelligence5030027
Cucina, J. M., & Howardson, G. N. (2017). Woodcock–Johnson–III, Kaufman Adolescent and Adult
Intelligence Test (KAIT), Kaufman Assessment Battery for Children (KABC), and Differential
Ability Scales (DAS) support Carroll but not Cattell–Horn. Psychological Assessment, 29(8),
1001–1015. http://doi.org/10.1037/pas0000389
DeMars, C. E. (2013). A tutorial on interpreting bifactor model scores. International Journal of Testing,
13(4), 354–378. http://doi.org/10.1080/15305058.2013.799067
Dombrowski, S. C. (2013). Investigating the structure of the WJ-III Cognitive at school age. School
Psychology Quarterly, 28(2), 154–169. http://doi.org/10.1037/spq0000010
Dombrowski, S. C. (2014a). Exploratory bifactor analysis of the WJ-III Cognitive in adulthood via the

APPENDIX C: Study 3 128
Schmid–Leiman procedure. Journal of Psychoeducational Assessment, 32(4), 330–341.
http://doi.org/10.1177/0734282913508243
Dombrowski, S. C. (2014b). Investigating the structure of the WJ-III cognitive in early school age
through two exploratory bifactor analysis procedures. Journal of Psychoeducational
Assessment, 32(6), 483–494. http://doi.org/10.1177/0734282914530838
Dombrowski, S. C., Canivez, G. L., & Watkins, M. W. (2018). Factor structure of the 10 WISC-V
primary subtests across four standardization age groups. Contemporary School Psychology,
22(1), 90–104. http://doi.org/10.1007/s40688-017-0125-2
Dombrowski, S. C., Canivez, G. L., Watkins, M. W., & Beaujean, A. (2015). Exploratory bifactor
analysis of the Wechsler Intelligence Scale for Children–Fifth Edition with the 16 primary and
secondary subtests. Intelligence, 53(November), 194–201. http://doi.org/10.1016/
j.intell.2015.10.009
Dombrowski, S. C., McGill, R. J., & Canivez, G. L. (2017). Exploratory and hierarchical factor analysis
of the WJ IV Cognitive at school age. Psychological Assessment, 29(4), 394–407.
http://doi.org/10.1037/pas0000350
Dombrowski, S. C., McGill, R. J., & Canivez, G. L. (2018a). An alternative conceptualization of the
theoretical structure of the Woodcock–Johnson IV Tests of Cognitive Abilities at school age:
A confirmatory factor analytic investigation. Archives of Scientific Psychology, 6(1), 1–13.
http://doi.org/10.1037/arc0000039
Dombrowski, S. C., McGill, R. J., & Canivez, G. L. (2018b). Hierarchical exploratory factor analyses
of the Woodcock–Johnson IV Full Test Battery: Implications for CHC application in school
psychology. School Psychology Quarterly, 33(2), 235–250. http://doi.org/10.1037/spq0000221
Dombrowski, S. C., McGill, R. J., Canivez, G. L., & Peterson, C. H. (2019). Investigating the theoretical
structure of the Differential Ability Scales–Second Edition through hierarchical exploratory
factor analysis. Journal of Psychoeducational Assessment, 37(1), 94–104.
http://doi.org/10.1177/ 0734282918760724
Dombrowski, S. C., & Watkins, M. W. (2013). Exploratory and higher order factor analysis of the WJ-
III full test battery: A school aged analysis. Psychological Assessment, 25(2), 442–455.
http://doi.org/10.1037/a0031335
Dombrowski, S. C., Watkins, M. W., & Brogan, M. J. (2009). An exploratory investigation of the factor
structure of the Reynolds Intellectual Assessment Scales (RIAS). Journal of Psychoeducational
Assessment, 27(6), 494–507. http://doi.org/10.1177/0734282909333179
Federal Statistical Office of the Federal Republic of Germany. (Eds.). (2014). Statistisches Jahrbuch
Deutschland und Internationales [Statistical yearbook]. Statistisches Bundesamt.
Fenollar-Cortés, J., & Watkins, M. W. (2019). Construct validity of the Spanish version of the Wechsler
Intelligence Scale for Children–Fifth Edition (WISC-VSpain). International Journal of School &
Educational Psychology, 7(3), 150–164. http://doi.org/10.1080/21683603.2017.1414006

APPENDIX C: Study 3 129
Flanagan, D. P., & Harrison, D. (Eds.). (2012). Contemporary intellectual assessment: Theories, tests,
and issues (3rd ed.). Guilford Press.
Frazier, T. W., & Youngstrom, E. A. (2007). Historical increase in the number of factors measured by
commercial tests of cognitive ability: Are we overfactoring? Intelligence, 35(2), 169–182.
http://doi.org/10.1016/j.intell.2006.07.002
Frisby, C. L., & Beaujean, A. A. (2015). Testing Spearman's hypotheses using a bi-factor model with
WAIS-IV/WMS-IV standardization data. Intelligence, 51(July), 79–97. http://doi.org/10.1016/
j.intell.2015.04.007
Georgas, J., van de Vijver, F. J. R., Weiss, L. G., & Saklofske, D. H. (2003). A cross-cultural analysis
of the WISC-III. In J. Georgas, L. G. Weiss, & F. J. R. van de Vijver (Eds.), Culture and
children’s intelligence (pp. 277–313). Academic Press. http://doi.org/10.1016/B978-
012280055-9/50021-7
Gignac, G. E. (2005). Revisiting the factor structure of the WAIS-R: Insights through nested factor
modeling. Assessment, 12(3), 320–329. http://doi.org/10.1177/1073191105278118
Gignac, G. E. (2006). The WAIS-III as a nested factors model: A useful alternative to the more
conventional oblique and higher-order models. Journal of Individual Differences, 27(2), 73–
86. http://doi.org/10.1027/1614-0001.27.2.73
Gignac, G. E. (2008). Higher-order models versus direct hierarchical models: g as superordinate or
breadth factor? Psychology Science Quarterly, 50(1), 21–43.
Gignac, G. E. (2016). The higher-order model imposes a proportionality constraint: That is why the
bifactor model tends to fit better. Intelligence, 55(March–April), 57–68.
http://doi.org/10.1016/j.intell.2016.01.006
Gignac, G. E., & Watkins, M. W. (2013). Bifactor modeling and the estimation of model-based
reliability in the WAIS-IV. Multivariate Behavioral Research, 48(5), 639–662.
http://doi.org/10.1080/00273171.2013.804398
Glorfeld, L. W. (1995). An improvement on Horn’s parallel analysis methodology for selecting the
correct number of factors to retain. Educational and Psychological Measurement, 55(3), 377–
393. http://doi.org/10.1177/0013164495055003002
Glutting, J. J., Watkins, M. W., Konold, T. R., & McDermott, P. A. (2006). Distinctions without a
difference: The utility of observed versus latent factors from the WISC-IV in estimating reading
and math achievement on the WIAI-II. Journal of Special Education, 40(2), 103–114.
http://doi.org/10.1177/00224669060400020101
Golay, P., & Lecerf, T. (2011). Orthogonal higher order structure and confirmatory factor analysis of
the French Wechsler Adult Intelligence Scale (WAIS-III). Psychological Assessment, 23(1),
143–152. http://doi.org/10.1037/a0021230
Golay, P., Reverte, I., Rossier, J., Favez, N., & Lecerf, T. (2013). Further insights on the French WISC-
IV factor structure through Bayesian structural equation modeling (BSEM). Psychological

APPENDIX C: Study 3 130
Assessment, 25(2), 496–508. http://doi.org/10.1037/a0030676
Gorsuch, R. L. (1983). Factor analysis (2nd ed.). Lawrence Erlbaum.
Gottfredson, L. S. (2016). A g theorist on why Kovacs and Conway’s process overlap theory amplifies,
not opposes, g theory. Psychological Inquiry, 27(3), 210–217. http://doi.org/10.1080/
1047840X.2016.1203232
Gustafsson, J.-E., & Balke, G. (1993). General and specific abilities as predictors of school
achievement. Multivariate Behavioral Research, 28(4), 407–434. http://doi.org/10.1207/
s15327906mbr2804_2
Hagmann-von Arx, P., & Grob, A. (2014). Reynolds Intellectual Assessment Scales and Screening
(RIAS)TM: German adaptation of the Reynolds Intellectual Assessment Scales (RIAS)TM & the
Reynolds Intellectual Screening Test (RIST)TM from Cecil R. Reynolds and Randy W.
Kamphaus. Hans Huber.
Hancock, G. R., & Mueller, R. O. (2001). Rethinking construct reliability within latent variable systems.
In R. Cudeck, S. Du Toit, & D. Sorbom (Eds.), Structural equation modeling: Present and
future (pp. 195–216). Scientific Software International.
Holzinger, K. J., & Swineford, F. (1937). The bi-factor method. Psychometrika, 2(1), 41–54.
http://doi.org/10.1007/BF02287965
Horn, J. L. (1965). A rationale and test for the number of factors in factor analysis. Psychometrica,
30(2), 179–185. http://doi.org/10.1007/BF02289447
Horn, J. L. (1991). Measurement of intellectual capabilities: A review of theory. In K. S. McGrew, J.
K. Werder, & R. W. Woodcock (Eds.), Woodcock–Johnson technical manual (Rev. ed., pp.
197–232). Riverside.
Horn, J. L., & Blankson, N. (2005). Foundations for better understanding of cognitive abilities. In D.
P. Flanagan, & P. L. Harrison (Eds.), Contemporary intellectual assessment: Theories, tests,
and issues (2nd ed., pp. 41–68). Guilford Press.
Horn, J. L., & Cattell, R. B. (1966). Refinement and test of the theory of fluid and crystallized general
intelligence. Journal of Educational Psychology, 57(5), 253–270. https://doi.org/10.1037/
h0023816
Hu, L.-T., & Bentler, P. M. (1999). Cutoff criteria for fit indexes in covariance structure analysis:
Conventional criteria versus new alternatives. Structural Equation Modeling, 6(1), 1–55.
http://doi.org/10.1080/10705519909540118
Jensen, A. R. (1998). The g factor: The science of mental ability. Westport, CT: Praeger.
Jennrich, R. I., & Bentler, P. M. (2011). Exploratory bi-factor analysis. Psychometrika, 76(4), 537–549.
http://doi.org/10.1007/s11336-011-9218-4
Jennrich, R. I., & Bentler, P. M. (2012). Exploratory bi-factor analysis: The oblique case.
Psychometrika, 77(3), 442–454. http://doi.org/10.1007/s11336-012-9269-1
Kaiser, H. F. (1960). The application of electronic computers to factor analysis. Educational and

APPENDIX C: Study 3 131
Psychological Measurement, 20, 141–151. http://doi.org/10.1177/001316446002000116
Kaiser, H. F. (1974). An index of factorial simplicity. Psychometrika, 39(1), 31–36.
http://doi.org/10.1007/BF02291575
Kan, K.-J., van der Maas, H. L. J., & Levine, S. Z. (2019). Extending psychometric network analysis:
Empirical evidence against g in favor of mutualism? Intelligence, 73(March–April), 52–62.
http://doi.org/10.1016/j.intell.2018.12.004
Kaufman, A. S. (1994). Intelligent testing with the WISC-III. Wiley.
Kaufman, A. S., & Kaufman, N. L. (2015). Kaufman Assessment Battery for Children–II (German
Version of P. Melchers & M. Melchers). Pearson Assessment.
Keith, T. Z. (2005). Using confirmatory factor analysis to aid in understanding the constructs measured
by intelligence tests. In D. P. Flanagan, & P. L. Harrison (Eds.), Contemporary intellectual
assessment: Theories, tests, and issues (2nd ed., pp. 581–614). Guilford Press.
Kline, R. B. (2016). Principles and practice of structural equation modeling (4th ed.). Guilford Press.
Kovacs, K., & Conway, A. R. A. (2016). Process overlap theory: A unified account of the general factor
of intelligence. Psychological Inquiry, 27(3), 151–177. http://doi.org/10.1080/
1047840X.2016.1153946
Kranzler, J. H., Benson, N., & Floyd, R. G. (2015). Using estimated factor scores from a bifactor
analysis to examine the unique effects of the latent variables measured by the WAIS-IV on
academic achievement. Psychological Assessment, 27(4), 1402–1416.
http://doi.org/10.1037/pas0000119
Lecerf, T., & Canivez, G. L. (2018). Complementary exploratory and confirmatory factor analyses of
the French WISC-V: Analyses based on the standardization sample. Psychological Assessment,
30(6), 793–808. http://doi.org/10.1037/pas0000526
Lecerf, T., Rossier, J., Favez, N., Reverte, I., & Coleaux, L. (2010). The four- vs. alternative six-factor
structure of the French WISC-IV. Swiss Journal of Psychology, 69(4), 221–232.
http://doi.org/10.1024/1421-0185/a000026
Little, T. D., Lindenberger, U., & Nesselroade, J. R. (1999). On selecting indicators for multivariate
measurement and modeling with latent variables: When “good” indicators are bad and “bad”
indicators are good. Psychological Methods, 4(2), 192–211. http://doi.org/10.1037/1082-
989X.4.2.192
Luecht, R. M., Gierl, M. J., Tan, X., & Huff, K. (2006, April). Scalability and the development of useful
diagnostic scales [Paper presentation]. Annual meeting of the National Council on
Measurement in Education, San Francisco, CA.
MacCallum, R. C., & Austin, J. T. (2000). Applications of structural equation modeling in
psychological research. Annual Review of Psychology, 51(1), 201–226. https://doi.org/
10.1146/annurev.psych.51.1.201
MacCallum, R. C., Roznowski, M., & Necowitz, L. B. (1992). Model modifications in covariance

APPENDIX C: Study 3 132
structure analysis: The problem of capitalizing on chance. Psychological Bulletin, 111, 490–
504. https://doi.org/10.1037/0033-2909.111.3.490
Mansolf, M., & Reise, S. P. (2017). When and why the second-order and bifactor models are
distinguishable. Intelligence, 61(March–April), 120–129. http://doi.org/10.1016/
j.intell.2017.01.012
McDonald, R. P. (2010). Structural models and the art of approximation. Perspectives on Psychological
Science, 5(6), 675–686. http://doi.org/10.1177/1745691610388766
McGill, R. J., & Canivez, G. L. (2016). Orthogonal higher order structure of the WISC-IV Spanish
using hierarchical exploratory factor analytic procedures. Journal of Psychoeducational
Assessment, 34(6), 600–606. http://doi.org/10.1177/0734282915624293
McGill, R. J., & Canivez, G. L. (2018). Confirmatory factor analyses of the WISC-IV Spanish core and
supplemental Subtests: Validation evidence of the Wechsler and CHC models. International
Journal of School and Educational Psychology, 6(4), 239–351. http://doi.org/10.1080/
21683603.2017.1327831
McGrew, K. S. (2009). CHC theory and the human cognitive abilities project: Standing on the shoulders
of the giants of psychometric intelligence research. Intelligence, 37, 1–10.
http://doi.org/10.1016/j.intell.2008.08.004
Morgan, G. B., Hodge, K. J., Wells, K. E., & Watkins, M. W. (2015). Are fit indices biased in favor of
bi-factor models in cognitive ability research? A comparison of fit in correlated factors, higher-
order, and bi-factor models via Monte Carlo simulations. Journal of Intelligence, 3(1), 2–20.
http://doi.org/10.3390/jintelligence3010002
Morin, A. J. S., Arens, A. K., & Marsh, H. W. (2016). A bifactor exploratory structural equation
modeling framework for the identification of distinct sources of construct-relevant
psychometric multidimensionality. Structural Equation Modeling, 23, 116–139.
http://doi.org/10.1080/10705511.2014.961800
Morin, A. J. S., Arens, A. K., Tran, A., & Caci, H. (2016). Exploring sources of construct-relevant
multidimensionality in psychiatric measurement: A tutorial and illustration using the composite
scale of morningness. International Journal of Methods in Psychiatric Research, 25(4), 277–
288. http://doi.org/10.1002/mpr.1485
Murray, A. L., & Johnson, W. (2013). The limitations of model fit in comparing the bi-factor versus
higher-order models of human cognitive ability structure. Intelligence, 41(5), 407–422.
http://doi.org/10.1016/j.intell.2013.06.004
Nasser, F., Benson, J., & Wisenbaker, J. (2002). The performance of regression-based variations of the
visual scree for determining the number of common factors. Educational and Psychological
Measurement, 62(3), 397–419. http://doi.org/10.1177/00164402062003001
Nelson, J. M., & Canivez, G. L. (2012). Examination of the structural, convergent, and incremental
validity of the Reynolds Intellectual Assessment Scales (RIAS) with a clinical sample.

APPENDIX C: Study 3 133
Psychological Assessment, 24(1), 129–140. http://doi.org/10.1037/a0024878
Nelson, J. M, Canivez, G. L, Lindstrom, W., & Hatt, C. (2007). Higher-order exploratory factor analysis
of the Reynolds Intellectual Assessment Scales with a referred sample. Journal of School
Psychology, 45(4), 439–456. http://doi.org/10.1016/j.jsp.2007.03.003
Nelson, J. M., Canivez, G. L., & Watkins, M. W. (2013). Structural and incremental validity of the
Wechsler Adult Intelligence Scale–Fourth Edition (WAIS-IV) with a clinical sample.
Psychological Assessment, 25(2), 618–630. http://doi.org/10.1037/a0032086
Oakland, T., Douglas, S., & Kane, H. (2016). Top ten standardized tests used internationally with
children and youth by school psychologists in 64 countries: A 24-year follow-up study. Journal
of Psychoeducational Assessment, 34(2), 166–176. http://doi.org/10.1177/0734282915595303
O’Connor, B. P. (2000). SPSS and SAS programs for determining the number of components using
parallel analysis and Velicer’s MAP test. Behavior Research Methods, Instruments, &
Computers, 32(3), 396–402. http://doi.org/10.3758/BF03200807
Pauls, F., Daseking, M., & Petermann, F. (2020). Measurement invariance across gender on the second-
order five-factor model of the German Wechsler Intelligence Scale for Children–Fifth Edition.
Assessment, 27(8), 1836–1852. https://doi.org/10.1177/1073191119847762
Petermann, F. (Ed.). (2012). Wechsler Adult Intelligence Scale–Fourth Edition (WAIS-IV): German
Adaptation. Pearson Assessment.
Petermann, F., & Petermann, U. (Eds.). (2011). Wechsler Intelligence Scale for Children–Fourth
Edition (WISC-IV). Pearson Assessment.
Petermann, F., Ricken, G., Fritz, A., Schuck, K. D., & Preuß, U. (Eds.). (2014). Wechsler Preschool
and Primary Scale of Intelligence–Third Edition (WPPSI-III): German Adaptation. Pearson
Assessment.
Reise, S. P. (2012). The rediscovery of bifactor measurement models. Multivariate Behavioral
Research, 47(5), 667–696. http://doi.org/10.1080/00273171.2012.715555
Reise, S. P., Bonifay, W. E., & Haviland, M. G. (2013). Scoring and modeling psychological measures
in the presence of multidimensionality. Journal of Personality Assessment, 95(2), 129–140.
http://doi.org/10.1080/00223891.2012.725437
Reise, S. P., Moore, T. M., & Haviland, M. G. (2010). Bifactor models and rotations: Exploring the
extent to which multidimensional data yield univocal scale scores. Journal of Personality
Assessment, 92(6), 544–559. http://doi.org/10.1080/00223891.2010.496477
Reynolds, M. R., & Keith, T. Z. (2013). Measurement and statistical issues in child assessment research.
In D. H. Saklofske, V. L. Schwean, & C. R. Reynolds (Eds.), Oxford handbook of child
psychological assessment (pp. 48–83). Oxford University Press.
Reynolds, M. R., & Keith, T. Z. (2017). Multi-group and hierarchical confirmatory factor analysis of
the Wechsler Intelligence Scale for Children–Fifth Edition: What does it measure? Intelligence,
62(May), 31–47. http://doi.org/10.1016/j.intell.2017.02.005
APPENDIX C: Study 3 134
Rodriguez, A., Reise, S. P., & Haviland, M. G. (2016). Applying bifactor statistical indices in the
evaluation of psychological measures. Journal of Personality Assessment, 98(3), 223–237.
http://doi.org/10.1080/00223891.2015.1089249
Sattler, J. (2008a). Assessment of children: Cognitive foundations (5th ed.). Author.
Sattler, J. (2008b). Resource guide to accompany assessment of children (5th ed.). Author.
Schmid, J., & Leiman, J. M. (1957). The development of hierarchical factor solutions. Psychometrika,
22(1), 53–61. http://doi.org/10.1007/BF02289209
Schneider, W. J., & McGrew, K. S. (2012). The Cattell–Horn–Carroll model of intelligence. In D. P.
Flanagan, & P. L. Harrison (Eds.), Contemporary intellectual assessment: Theories, tests, and
issues (3rd ed., pp. 99–144). Guilford Press.
Schneider, W. J., & McGrew, K. S. (2018). The Cattell–Horn–Carroll theory of cognitive abilities. In
D. P. Flanagan, & E. M. McDonough (Eds.), Contemporary intellectual assessment: Theories,
tests, and issues: Fourth Edition (pp. 73–163). Guilford Press.
Schreiber, J. B., Stage, F. K., King, J., Nora, A., & Barlow, E. A. (2006). Reporting structural equation
modeling and confirmatory factor analysis results: A review. Journal of Educational Research,
99(6), 323–337. https://doi.org/10.3200/JOER.99.6.323-338
Spearman, C. (1927). The abilities of man. Cambridge.
Strickland, T., Watkins, M. W., & Caterino, L. C. (2015). Structure of the Woodcock–Johnson III
cognitive tests in a referral sample of elementary school students. Psychological Assessment,
27(2), 689–697. http://doi.org/10.1037/ pas0000052
Styck, K. M., & Watkins, M. W. (2016). Structural validity of the WISC-IV for students with learning
disabilities. Journal of Learning Disabilities, 49(2), 216–224. http://doi.org/10.1177/
0022219414539565
Tabachnick, B. G., & Fidell, L. S. (2007). Using multivariate statistics (5th ed.). Boston: Allyn &
Bacon.
Thompson, B. (2004). Exploratory and confirmatory factor analysis: Understanding concepts and
applications. American Psychological Association.
Thurstone, L. L. (1947). Multiple-factor analysis. University of Chicago Press.
Ullman, J. B. (2001). Structural equation modeling. In B. G. Tabachnick, & L. S. Fidell (Eds.), Using
multivariate statistics (4th ed.). Allyn & Bacon.
Velicer, W. F. (1976). Determining the number of components from the matrix of partial correlations.
Psychometrika, 41(3), 321–327. http://doi.org/10.1007/BF02293557
Wasserman, J. D. (2019). Deconstructing CHC. Applied Measurement in Education, 32, 249–268.
https://doi.org/10.1080/08957347.2019.1619563
Watkins, M. W. (2004). MacOrtho. [Computer software]. Ed & Psych Associates.
Watkins, M. W. (2006). Orthogonal higher order structure of the Wechsler Intelligence Scale for
Children–Fourth Edition. Psychological Assessment, 18(1), 123–125. http://doi.org/10.1037/

APPENDIX C: Study 3 135
1040-3590.18.1.123
Watkins, M. W. (2007). SEscree [Computer software]. Ed & Psych Associates.
Watkins, M. W. (2010). Structure of the Wechsler Intelligence Scale for Children–Fourth Edition
among a national sample of referred students. Psychological Assessment, 22(4), 782–787.
http://doi.org/10.1037/a0020043
Watkins, M. W. (2013). Omega [Computer software]. Ed & Psych Associates.
Watkins, M. W. (2017). The reliability of multidimensional neuropsychological measures: From alpha
to omega. The Clinical Neuropsychologist, 31(6–7), 1113–1126. http://doi.org/10.1080/
13854046.2017.1317364
Watkins, M. W. (2018). Exploratory factor analysis: A guide to best practice. Journal of Black
Psychology, 44(3), 219–246. http://doi.org/10.1177/0095798418771807
Watkins, M. W., & Beaujean, A. A. (2014). Bifactor structure of the Wechsler Preschool and Primary
Scale of Intelligence–Fourth Edition. School Psychology Quarterly, 29(1), 52–63.
http://doi.org/10.1037/spq0000038
Watkins, M. W., Canivez, G. L., James, T., Good, R., & James, K. (2013). Construct validity of the
WISC-IV-UK with a large referred Irish sample. International Journal of School & Educational
Psychology, 1(2), 102–111. http://doi.org/10.1080/21683603.2013.794439
Watkins, M. W., Dombrowski, S. C., & Canivez, G. L. (2018). Reliability and factorial validity of the
Canadian Wechsler Intelligence Scale for Children–Fifth Edition. International Journal of
School & Educational Psychology, 6(4), 252–265. https://doi.org/10.1080/
21683603.2017.1342580
Watkins, M. W., Wilson, S. M., Kotz, K. M., Carbone, M. C., & Babula, T. (2006). Factor structure of
the Wechsler Intelligence Scale for Children–Fourth Edition among referred students.
Educational and Psychological Measurement, 66(6), 975–983. http://doi.org/10.1177/
0013164406288168
Wechsler, D. (2014a). Wechsler Intelligence Scale for Children–Fifth Edition. NCS Pearson.
Wechsler, D. (2014b). Wechsler Intelligence Scale for Children–Fifth Edition: Canadian manual.
Pearson Canada Assessment.
Wechsler, D. (2014c). Wechsler Intelligence Scale for Children–Fifth Edition: Technical and
interpretive manual. NCS Pearson.
Wechsler, D. (2015a). Escala de inteligencia de Wechsler para niños–V. Pearson Educación.
Wechsler, D. (2015b). Escala de inteligencia de Wechsler para niños–V: Manual técnico y de
interpretación. Pearson Educación.
Wechsler, D. (2016a). Echelle d’intelligence de Wechsler pour enfants–5e édition. Pearson France-
ECPA.
Wechsler, D. (2016b). Wechsler Intelligence Scale for Children–Fifth UK Edition. Harcourt
Assessment.

APPENDIX C: Study 3 136
Wechsler, D. (2016c). Wechsler Intelligence Scale for Children–Fifth UK Edition: Administration and
scoring manual. Harcourt Assessment.
Wechsler, D. (2017a). Wechsler Intelligence Scale for Children–Fifth Edition (WISC-V).
Durchführungs- und Auswertungsmanual (German version of F. Petermann). Pearson.
Wechsler, D. (2017b). Wechsler Intelligence Scale for Children–Fifth Edition (WISC-V): Technisches
Manual. (German version of F. Petermann). Pearson.
Weiner, I. B. (1989). On competence and ethicality in psychodiagnostic assessment. Journal of
Personality Assessment, 53(4), 827–831. https://doi.org/10.1207/s15327752jpa5304_18
Weiss, L. G., Keith, T. Z., Zhu, J., & Chen, H. (2013a). WAIS-IV and clinical validation of the four-
and five-factor interpretative approaches. Journal of Psychoeducational Assessment, 31(2), 94–
113. http://doi.org/10.1177/0734282913478030
Weiss, L. G., Keith, T. Z., Zhu, J., & Chen, H. (2013b). WISC-IV and clinical validation of the four-
and five-factor interpretative approaches. Journal of Psychoeducational Assessment, 31(2),
114–131. http://doi.org/10.1177/0734282913478032
Wood, J. M., Tataryn, D. J., & Gorsuch, R. L. (1996). Effects of under- and overextraction on principal
axis factor analysis with varimax rotation. Psychological Methods, 1(4), 254–265.
http://doi.org/10.1037/1082-989X.1.4.354
Yung, Y.-F., Thissen, D., & McLeod, L. D. (1999). On the relationship between the higher-order factor
model and the hierarchical factor model. Psychometrika, 64(2), 113–128.
http://doi.org/10.1007/BF02294531
Zinbarg, R. E., Revelle, W., Yovel, I., & Li, W. (2005). Cronbach’s α, Revelle’s β, and McDonald’s
ωH: Their relations with each other and two alternative conceptualizations of reliability.
Psychometrika, 70(1), 123–133. http://doi.org/10.1007/s11336-003-0974-7
Zinbarg, R. E., Yovel, I., Revelle, W., & McDonald, R. P. (2006). Estimating generalizability to a latent
variable common to all of a scale’s indicators: A comparison of estimators for ωh. Applied
Psychological Measurement, 30(2), 121–144. http://doi.org/10.1177/0146621605278814
Zoski, K. W., & Jurs, S. (1996). An objective counterpart to the visual scree test for factor analysis:
The standard error scree. Educational and Psychological Measurement, 56(3), 443–451.
http://doi.org/10.1177/0013164496056003006

APPENDIX D: Study 4 137
APPENDIX D: Study 4
Bünger, A., Grieder, S., Schweizer, F., & Grob, A. (2021). The comparability of intelligence test results:
Group- and individual-level comparisons of seven intelligence tests. Manuscript submitted for
publication.

APPENDIX D: Study 4 138
The Comparability of Intelligence Test Results: Group- and Individual-Level Comparisons of
Seven Intelligence Tests
Anette Bünger, Silvia Grieder, Florine Schweizer, and Alexander Grob
Department of Psychology, University of Basel
Author Note
This work was supported by the Suzanne and Hans Biäsch Foundation for the Enhancement of
Applied Psychology. We have no conflicts of interests to declare.
Correspondence concerning this article should be addressed to Anette Bünger, Division of
Developmental and Personality Psychology, Department of Psychology, University of Basel,
Missionsstrasse 62, 4055 Basel, Switzerland, Email: [email protected]

APPENDIX D: Study 4 139
Abstract
A large body of research shows that IQs obtained from different intelligence tests substantially correlate
on the group level. Yet, there is little research investigating whether different intelligence tests yield
comparable results for individuals. This is, however, paramount to the application of intelligence tests
in practice, as high-stakes decisions are based on individual test results. We therefore investigated
whether seven current and widely used intelligence tests yield comparable results for individuals aged
4–20 years. We found mostly substantial correlations, though several significant mean differences on
the group level. Results on individual-level comparability indicate that the interpretation of exact IQ
scores does not hold. Even the 95% confidence intervals could not be reliably replicated with different
intelligence tests. Similar patterns appeared for the individual-level comparability of nonverbal and
verbal intelligence factor scores as well. Further, the nominal level of intelligence systematically
predicted IQ differences between tests, with above- and below-average IQ associated with larger
differences compared to average IQ. Analyses based on continuous data confirmed that differences
seem to increase toward the above-average IQ range. These findings are critical, as these are the ranges
in which diagnostic questions most often arise in practice. Implications for test interpretation and test
construction are discussed.
Keywords: intelligence tests, IQ, comparability, individual-level, children and adolescents

APPENDIX D: Study 4 140
Introduction
In the field of applied educational, learning, and school psychology, psychometric test batteries
are often applied to assess the developmental status and abilities of a child or adolescent. These test
results provide the basis for far-reaching decisions concerning educational support, interventions, and
therapy (e.g., curative education, special education programs, support for gifted children, attention
training). When making an educational decision, one of the most frequently assessed domains is an
individual’s cognitive ability, measured by intelligence tests. This might be because many diagnoses
that are relevant in the field of school psychology can only be given in relation to a standardized
intelligence test, as recommended by the current versions of the International Statistical Classification
of Diseases and Related Health Problems (ICD; World Health Organization [WHO], 2018) and the
Diagnostic and Statistical Manual of Mental Disorders (American Psychiatric Association, 2013). In
addition, intelligence is one of the most investigated constructs of psychology and numerous tests are
available in many languages to provide age-standardized intelligence scores, that is, IQs (Lubinski,
2004). Furthermore, numerous studies have confirmed the association between intelligence and central
areas of life, such as educational success (Deary, Strand, Smith, & Fernandes, 2007), professional
success and income (Damian, Su, Shanahan, Trautwein, & Roberts, 2015), success in interpersonal
relationships (Aspara, Wittkowski, & Luo, 2018), health (Wrulich et al., 2014), and even longevity
(Calvin et al., 2011).
Group- and Individual-Level Comparability
Currently, a large number of different intelligence tests are available to diagnosticians. For
example, according to a keyword search, there are 39 intelligence tests available for purchase via
Testzentrale (http://www.testzentrale.ch), an official distributor of German psychometric tests. As
German tests are often adaptations of U.S. originals, there are probably even more widely used
intelligence tests available in the United States. The opportunity to choose between different
intelligence tests has several advantages. For example, learning effects can be minimized by selecting
an alternative test battery when testing multiple times. Moreover, additional test batteries can be used
to confirm the results of one test. Finally, special characteristics of an individual or of a specific
counseling situation can be taken into account by, for instance, providing nonnative speakers with tests
that are not specific to any one culture (Hagmann-von Arx, Petermann, & Grob, 2013), or by using a
short test (screening) when intelligence is assessed as a control variable (Hagmann-von Arx & Grob,
2014). Apart from these advantages of having several intelligence tests at our disposition, it also raises
the central question whether the various tests provide comparable results. This is what is assumed and
expected. Interestingly, despite controversial debates and theories about the psychometric structure of
intelligence (Beaujean & Benson, 2019a, 2019b; Gignac, 2008; Kovacs & Conway, 2019), most
contemporary and well validated intelligence tests relate to the same intelligence theory, the Cattell–
Horn–Carroll (CHC) theory of cognitive abilities (McGrew, 1997, 2005, 2009). In CHC theory,
intelligence is modeled as a multidimensional construct consisting of a number of different abilities that

APPENDIX D: Study 4 141
are hierarchically structured on three strata: A general intelligence factor g is on the top Stratum III,
broad abilities are on Stratum II, and more narrow abilities are on Stratum I. Tests relating to CHC
theory usually provide not only a Full-Scale IQ (FSIQ) representing g but also a varying number of
factor index scores (group factors) representing the more specific broad abilities and subtests
representing more narrow abilities. Factor index scores are used to identify specific strengths and
difficulties (cognitive profile analysis) by about 49% to 55% of school psychologists in the United
States (Benson, Floyd, Kranzler, Eckert, & Fefer, 2018), despite growing evidence against their
usefulness (McGill, Dombrowski, & Canivez, 2018). The fact that most contemporary intelligence tests
relate to CHC theory strengthens the assumption that not only IQs but also CHC factor scores derived
from different test batteries are comparable ostensibly. Furthermore, diagnosticians are advised to
exclusively apply intelligence tests with strong evidence for reliability and validity (American
Educational Research Association, American Psychological Association, & National Council on
Measurement in Education, 2014; International Test Commission, 2001) in terms of content, construct
(i.e., convergent and divergent), and criterion (i.e., concurrent and predictive power) validity. Tests that
meet these criteria are assumed to render reliable and valid results, and IQs obtained in different test
batteries are expected to be comparable (Floyd, Clark, & Shadish, 2008) if they are composed of
multiple, diverse, and reliable subtests with high loadings on a general intelligence (g) factor (Jensen &
Weng, 1994). This assumption is supported by the principle of aggregation (Rushton, Brainerd, &
Pressley, 1983), which states that the sum of multiple measurements (IQ based on multiple subtests)
represents a more stable predictor than a single measurement (IQ based on a single subtest) because
measurement error is averaged out. Moreover, a large body of research has confirmed that many
intelligence test batteries are highly correlated (Allen, Stolberg, Thaler, Sutton, & Mayfield, 2014;
Baum, Shear, Howe, & Bishop, 2015; Hagmann-von Arx, Grob, Petermann, & Daseking, 2012;
Hagmann-von Arx, Lemola, & Grob, 2018), which can be seen as an indication of convergent validity,
that is, that the test batteries measure the same constructs (Neukrug & Fawcett, 2014). These results are
based on group-level comparisons.
Yet, the fact that different intelligence tests correlate highly on the group level is a necessary
but not a sufficient criterion for comparability, because diagnoses are given to individuals and because
decisions are made based on individual intelligence test results. To ensure that these decisions and
diagnoses are valid, the tests must also be comparable on the individual level. The importance of
expecting comparable results across intelligence tests on an individual level gets evident when
considering that diagnoses are often based on cut-off values. For instance, intellectual disability or
giftedness is defined as two or more standard deviations below or above the mean, respectively,
obtained on normed and standardized tests. Furthermore, the current valid version of the ICD, the ICD-
10 (World Health Organization [WHO], 1990) requires a significant discrepancy (usually 1.2 to 1.5
SDs) between below-average school performance (e.g., reading, writing, or mathematical skills) and IQ
for the diagnosis of a learning disorder (e.g., dyslexia or dyscalculia). These types of diagnoses often

APPENDIX D: Study 4 142
determine if a child is eligible for educational resource allocation related to special education. It is
therefore crucial to have very accurate intelligence measures to ensure that the presence or absence of
a diagnosis does not vary with the use of different tests. Currently, it is still a common practice to
determine the presence or absence of such diagnoses based on rigid (also called fixed) cut-offs
(McNicholas et al., 2018). That means, if individual scored only one point above (intellectual disability)
or below (intellectual giftedness) the cut-off, the criteria for the specific diagnosis would not be met.
Consequently, the presence or absence of a diagnosis would change depending on the chosen test if two
tests do not exactly produce the same score for the same individual in the vicinity of the cut-off (e.g.,
69 in one and 71 in another test). However, it is widely known that psychometric tests cannot measure
intelligence with pinpoint accuracy and always contain measurement error. Instead of using fixed cut-
offs, most diagnostic guidelines therefore recommend applying flexible cut-offs by considering a
confidence interval around the obtained score (Farmer & Floyd, 2018). In this regard, it is important to
investigate whether the confidence intervals of two obtained IQ scores overlap to indicate individual-
level comparability. This means that it should not matter which test is used to assess an individual’s
intelligence, as the IQ should always be equal given a certain error tolerance. Floyd et al. (2008) referred
to this type of comparability as the exchangeability of IQs. As yet, there is surprisingly little research
on this, with only two studies available that investigated the comparability of IQs on the individual level
(Floyd et al., 2008; Hagmann-von Arx et al., 2018) and one study that investigated the comparability
of CHC broad abilities on the individual level (Floyd, Bergeron, McCormack, Anderson, & Hargrove-
Owens, 2005). All three studies used the overlap of the 90% confidence intervals (CIs) of each
intelligence test pair as criterion for comparability. The advantage of using CIs is that it takes the
unreliability of measurements into account. However, when using CIs, the definition of comparability
varies across test comparisons, as reliability and CIs differ between tests. Floyd et al. (2005, 2008)
therefore used an absolute difference between two scores less than or equal to 10 IQ points as a second
criterion for comparability. This is in line with guidelines that recommend considering 5 IQ points
above and below the obtained IQ when diagnosing intellectual disability, consequently considering the
presence of this diagnosis up to an IQ of 75 (e.g., American Association on Intellectual and
Developmental Disabilities, 2020; American Psychiatric Association, 2017; Bergeron, Floyd, &
Shands, 2008). In the first study, Floyd et al. (2008) compared seven English intelligence tests with
standardization years between 1987 and 2003 for an age range of 8 to 16 years, with one sample also
covering undergraduate students. Findings showed that the IQs differed in about 36% of intelligence
test pairs when considering the 90% CI, and in about 28% when considering the 10-point IQ criterion.
In the second study, Hagmann-von Arx et al. (2018) compared five German intelligence tests for 6- to
11-year-old children and with standardization years between 2003 and 2012. The authors found that
IQs differed in about 24% of intelligence test pairs when considering the 90% CI. The two studies
indicate that for 64% to 76% of schoolchildren, the IQs obtained from different tests can be considered
comparable on the individual level. In the third study, Floyd et al. (2005) compared four CHC broad

APPENDIX D: Study 4 143
abilities scores (crystallized intelligence, fluid reasoning, visual processing and processing speed)
obtained in seven English intelligence tests with standardization years between 1989 and 2004 for an
age range of 3 to 16 years, with one sample also covering undergraduate students. Findings showed that
the CHC broad abilities scores differed in 14%–22% when considering the 90% CI and in 29–38%
when considering the 10-point IQ criterion.
Overall, these findings indicate that decisions, diagnoses, and cognitive profile interpretation
based on a single test are of questionable validity for a fourth to a third of children.
Reasons for (In-)Comparability
To better understand this relatively high percentage of incomparability, it is important to
consider potential sources of variability in intelligence test scores that do not stem from true ability of
the examinees. In addition to unsystematic random errors, these sources include specific test
characteristics, characteristics of the test situation (environmental influences), personal characteristics
of the examinees, and examiner’s influence (National Research Council, 2002).
Test batteries that are applied for important decisions must provide reliable test results, that is,
have reliability coefficients of at least .90 (Aiken & Groth-Marnat, 2005; Evers, 2001; Nunnally &
Bernstein, 1994). This means that even if the composite score of a particular test fulfills this criterion,
it always contains an unsystematic random error component. This is usually taken into account with the
CI plotted around the obtained IQ. Furthermore, it is possible that test batteries lead to inconsistent test
results because of differences in standardization. For example, the historical time of standardization
may be an influential aspect, as demonstrated by Flynn (1987, 2009). The Flynn effect refers to the fact
that the average intelligence of a population increases between 3 and 5 IQ points per decade. In contrast,
since the end of the 1990s, there have also been studies showing a negative or so- called anti-Flynn
effect. Authors of these studies postulate that average IQs have been declining again since the 1990s
(Dutton & Lynn, 2014; Lynn & Harvey, 2008; Sundet, Barlaug, & Torjussen, 2004). Regardless of
whether there is an increase or decrease in average intelligence, performance on intelligence tests
appears to be influenced by culture and cohort effects. This issue can play an important role in the
comparability of test results, especially if the standardization years of two tests are far apart. Moreover,
IQs are not a pure representation of an individual’s true cognitive ability (intelligence construct or true
g). Therefore, it is important to consider test characteristics that affect measurement accuracy and that
vary across intelligence tests (Farmer, Floyd, Reynolds, & Berlin, 2020). For instance, although most
contemporary intelligences tests relate to the CHC theory, the composite score of an intelligence test,
which is considered an indicator of g, may be calculated based on different sets of subtests that vary in
number as well as heterogeneity of content. Especially for IQs that are based on only a few subtests,
inadequate content sampling poses a risk for inflation or deflation of IQs and may therefore reduce their
comparability (Farmer et al., 2020). In addition, systematic differences in task format may occur (e.g.,
verbal or nonverbal, paper-and-pencil or computer based; Floyd et al., 2008). This may interact with
conditions and characteristics of individual examinees such as limited language skills, for example, due

APPENDIX D: Study 4 144
to migration background (Daseking, Lipsius, Petermann, & Waldmann, 2008), or any type of speech or
language disorder (Gallinat & Spaulding, 2014; Miller & Gilbert, 2008), as well as impaired fine motor
skills (Yin Foo, Guppy, & Johnston, 2013). Regarding characteristics of a specific test situation, the
order of test administration with practice or fatigue effects (Hausknecht, Halpert, Di Paolo, & Moriarty
Gerrard, 2007), the time interval between two or more tests, or the time of day (Gupta, 1991) in
combination with “morningness” and “eveningness” of examinees (Goldstein, Hahn, Hasher,
Wiprzycka, & Zelazo, 2007) as well as general motivation in the specific test situation (Duckworth,
Quinn, Lynam, Loeber, & Stouthamer-Loeber, 2011) may cause variance in intelligence test scores that
does not reflect an examinee’s true ability. To investigate to what extent intelligence test scores are
influenced by individuals and test procedures, Hagmann-von Arx et al. (2018) and Floyd et al. (2008)
applied generalizability theory analyses (Briesch, Swaminathan, Welsh, & Chafouleas, 2014;
Cronbach, Gleser, Nanda, & Rajaratnam, 1972). Both studies showed that no more than 4% of the
variance in IQs could be attributed to specific test characteristics. The largest part of the variance (7%–
27%, Floyd et al., 2008; 29%–42%, Hagmann-von Arx et al., 2018) was attributable to interactions
between the examinees and the test situation. However, only Hagmann-von Arx et al. (2018) explored
the impact of specific variables, such as time interval between two tests, the order of test administration,
or qualitative nominal intelligence levels, on intelligence test differences and they could not detect any
significant systematic effect.
Limitations of Previous Studies
The three previous studies that focused on individual-level comparability of intelligence tests
results show several limitations. First, they did not cover the whole age span in which questions relevant
to school psychology tend to arise. Furthermore, age was not investigated as a possible predictor of test
score differences, and although Hagmann-von Arx et al. (2018) discussed language skills and migration
background as a possible influence on test comparability, they did not include any language or cultural
background variable in their analyses. Moreover, to investigate the possible impact of intelligence level
on test comparability, Hagmann-von Arx et al. (2018) calculated a mean IQ across all intelligence tests
that they carried out. This practice is problematic as it obfuscates the influence of systematic errors on
the specific test results (Schneider & McGrew, 2011). Another limitation is that both studies
investigated the overlap of the 90% CIs, whereas in practice it is most often the 95% CI that is used for
interpretation.
The Present Study
Despite previous findings that question the exchangeability of IQs and broad ability scores on
an individual level, diagnostic guidelines in the context of school psychology are often still based on
cut-off scores what implies the assumption of score exchangeability. This shows that more research
investigating individual-level comparability of intelligence test scores is necessary. The aim of our
study was therefore to gain further insight into the comparability of intelligence test scores with a main
focus on individual-level comparability, addressing the aforementioned limitations from previous

APPENDIX D: Study 4 145
studies. In our study, we addressed the following two directional hypotheses and four open research
questions:
Hypothesis 1: We expected substantial correlations between IQs obtained in seven different
intelligence tests.
Hypothesis 2: We expected comparable mean scores on the group level.
Research Question 1: We explored the comparability of IQs on an individual level using several
criteria for comparability including criteria that consider reliability (i.e., overlap of the 90% and 95%
CIs) as well as criteria that are independent of reliability and therefore invariant across test batteries
(i.e., maximum absolute difference of 10 IQ points and nominal intelligence level).
Research Question 2: We explored whether the year of standardization (with respect to a
possible Flynn or anti-Flynn effect) influenced comparability such that tests with earlier standardization
years revealed higher IQs than tests with a more recent standardization or vice versa.
Research Question 3: We investigated the individual-level comparability for nonverbal
(nonverbal intelligence; NI) and verbal (verbal intelligence; VI) factor indexes of each intelligence test
and examined whether individual-level comparability was significantly higher or lower for NI and VI
versus IQ.
Research Question 4: Last, we investigated whether age, bilingualism, time interval between
two tests, order of test administration, and nominal intelligence level were significantly related to IQ
differences as an indicator of comparability. We think providing precise evidence on these questions
will have vast consequences for theory and practice in intelligence testing.
To investigate these hypotheses and research questions, we assessed seven current and widely
used intelligence tests across childhood and adolescence in German-speaking countries. The wide age
range of participants in our sample (4–20 years) covers the preschool, primary, and secondary school
years as well as the years after high school graduation, representing the entire age range of development
in which school-psychology issues arise.
Method
Participants
The sample was a subsample of the standardization and validation study of the Intelligence and
Development Scales–2 (IDS-2; Grob & Hagmann-von Arx, 2018) as well as of the German adaptation
of the Stanford–Binet Intelligence Scales–Fifth Edition (SB5; Grob, Gygi, & Hagmann-von Arx, 2019).
We included 383 children and adolescents (Mage = 10.31 years, SDage = 3.96; age range: 4 to 20 years;
47% boys). The percentage of bilingual and nonnative speakers was 32%. All participants spoke
German well enough to understand instructions and to give oral answers. None of the participants had
a speech or language disorder. According to parent and self-reports, 10 of the included participants were
diagnosed with a learning disorder (e.g., dyslexia or dyscalculia), one was diagnosed with Asperger’s
syndrome, and 15 were diagnosed with attention-deficit/hyperactivity disorder. The pattern of test

APPENDIX D: Study 4 146
comparability did not change with the inclusion of these participants; hence they were not excluded
from the study. Forty-eight percent of the participants’ mothers held a university degree.
Measures
For the intelligence test comparisons, we applied the IDS-2 (Grob & Hagmann-von Arx, 2018),
the German adaptations of the SB5 (Grob et al., 2019), the Reynolds Intellectual Assessment Scales
(RIAS; Hagmann-von Arx & Grob, 2014), the Snijders Oomen Nonverbal Intelligence Test 6-40 (SON-
R 6-40; Tellegen, Laros, & Petermann, 2012), the Wechsler Adult Intelligence Scale–Third Edition
(WAIS-III; von Aster, Neubauer, & Horn, 2006), the Wechsler Intelligence Scales for Children–Fourth
Edition (WISC-IV; Petermann & Petermann, 2011), and the Wechsler Preschool and Primary Scale of
Intelligence–Third Edition (WPPSI-III; Petermann, 2009). Details on the intelligence tests such as age
range, latent factors measured, year of standardization, and reliability (internal consistencies), as well
as indications of which latent factors were classified as IQ, NI, and VI, can be found in Table 1.
Table 1. Test Characteristics
Test
Age range (Years; months) Factors and indices
Standardiza-tion years
Internal consistency a
FSIQ NI VI
IDS-2 5;0 to 20;11 Visual processing, processing speed, auditory short-term memory, visuospatial short-term memory, long-term memory, abstract reasoning b, verbal reasoning c, general intelligence d
2015–2017 .98 .94 .96
SB5 4;0 to 80;11 Fluid reasoning, knowledge, quantitative reasoning, visuospatial processing, working memory, verbal intelligencec, nonverbal intelligence b, general intelligence d
2015–2017 .99 .98 .99
RIAS 3;0 to 99;11 Verbal intelligence c, nonverbal intelligence b, general intelligence d 2011–2012 .95 .93 .94 SON-R 6-40 6;0 to 40;11 Nonverbal intelligence b,d 2009–2011 .95 .95 N/A WAIS-III 16;0 to 89;11 Verbal intelligence c (verbal comprehension, working memory),
performance intelligence b (perceptual organization, processing speed), general intelligence d
1999–2005 .97 .94 .96
WISC-IV 6;0 to 16;11 Verbal comprehension c, perceptual reasoning b, working memory, processing speed, general intelligence d
2005–2006 .97 .93 .94
WPPSI-III 3;0 to 7;2 Verbal intelligence c, performance intelligence b, processing speed, general language, general intelligence d
2001–2002 .95 .91 .92
Note. FSIQ = Full-scale IQ; NI = Nonverbal Intelligence Index; VI = Verbal Intelligence Index; IDS-2 = Intelligence and Development Scales–2; SB5 = Stanford–Binet Intelligence Scales–Fifth Edition, German adaptation; RIAS = Reynolds Intellectual Assessment Scales, German adaptation; SON-R 6-40 = Snijders–Oomen Nonverbal Intelligence Test 6-40, German adaptation; WAIS-III = Wechsler Adult Intelligence Scale–Third Edition, German adaptation; WISC-IV = Wechsler Intelligence Scales for Children–Fourth Edition, German adaptation; WPPSI-III = Wechsler Preschool and Primary Scale of Intelligence–Third Edition, German adaptation. a Reliability is reported as internal consistency coefficients. According to the corresponding test manuals, coefficients of the IDS-2, RIAS, and WISC-IV are Cronbach’s α and coefficients of the SB5, WAIS-III, and WPPSI-III are split-half reliabilities. b Index used for nonverbal intelligence analyses. c Index used for verbal intelligence analyses. d Index used for FSIQ analyses.

APPENDIX D: Study 4 147
Procedure
Recruitment was carried out for preschoolers via day-care centers, nursery schools, and
kindergartens and for school-aged children and adolescents via schools, institutions, and private
contacts. All participants were assessed with the IDS-2 and/or the SB5 and with one or more of the
above-mentioned intelligence tests that were suitable for their age (as described in Table 1). Due to
restrictions in testing time, some participants could not be assessed with all measures that were suitable
for their age. Of the 383 participants, 50 (13.1%) were assessed with two, 114 (29.8%) were assessed
with three, 202 (52.7%) were assessed with four, and 17 (4.4%) were assessed with five intelligence
tests. The exact numbers of participants per test and test combination are listed in Tables 2 and 3. The
assessments were conducted between June 2015 and February 2018 in individual settings by trained
psychology major students. The tests took place at participants’ homes or at the Department of
Psychology of the University of Basel. The participants (16- to 20-year-olds) or their parents (4- to 15-
year-olds) received written feedback on the test results, where standard scores were available (i.e.,
RIAS, SON-R 6-40, WAIS-III, WISC-IV, WPPSI-III). For the standardization study, participants
received a voucher worth CHF 30 (for a 3 to 3.5-h test; i.e., IDS-2) or CHF 20 (for a 2-h test; i.e., SB5)
instead of written feedback, as standard scores were not available for these tests at that time. The
Ethikkommission Nordwest- und Zentralschweiz [Ethics Commission Northwest and Central
Switzerland] approved the study protocol. Parents gave written informed consent for their child to
participate and participants gave oral (children) or written (adolescents) informed assent.
Statistical Analyses
In a preliminary step, the raw test scores of the intelligence tests were transformed into the
respective IQs (M = 100, SD = 15) using the test manuals. The assumption of normal distribution was
tested using the Shapiro–Wilk test. The IQs of the IDS-2, SB5, RIAS, SON- R 6-40, WAIS-III, and
WPPSI-III were normally distributed (W = .959–.994, p > .05). The distribution of the WISC-IV scores
deviated significantly from a normal distribution (W = .967, p < .001), and therefore nonparametric
methods were used for the intelligence test comparisons involving the WISC-IV. We tested whether
the mean IQs in our sample differed from the expected mean of 100 using single-sample t tests and a
single-sample Wilcoxon signed-rank test for the WISC-IV. The analyses described in the following
refer to the comparison of all intelligence test pairs, except the Wechsler scales (i.e., WAIS-III, WISC-
IV, and WPPSI-III). They were not compared among each other, since these each apply to different age
ranges. Pearson’s product-moment correlations and Spearman’s rank-order correlations were calculated
for all intelligence test pairs (Hypothesis 1). Due to the restricted standard deviations, correlation
coefficients were corrected not only for attenuation but also for range restriction, according to the
formula proposed by Alexander, Carson, Alliger, and Carr (1987, p. 312).
To test for group-level comparability of the intelligence test scores, t tests for dependent
samples or Wilcoxon signed-rank tests were calculated (Hypothesis 2). As effect sizes, Cohen’s d was
calculated for t tests and r for Wilcoxon signed-rank tests. Group-level analyses were two-tailed and

APPENDIX D: Study 4 148
group-level differences were interpreted as substantial if statistical significance was given at p < .05
and an effect of d ≥ 0.20 or r ≥ .10 was reached.
Following Research Question 1, we explored how comparable IQs obtained with different test
batteries are at the individual level. As individual-level score comparability is not a technical concept,
there are many ways that scores can be considered comparable. Therefore, we applied five different
criteria to define comparability. First, and in line with previous research (Floyd et al., 2005, 2008;
Hagmann-von Arx et al., 2018), we considered two IQs of the same individual comparable if the 90%
CIs of the two test scores overlapped (Criterion CI90). The maximum difference two IQs could have to
be considered comparable on criterion CI90 is indicated as critical difference. This critical difference
was defined as the sum of half of each test’s 90% confidence interval in intelligence test scores.
As a second criterion, we considered two IQs of the same individual comparable if the 95% CIs
of the two test scores overlapped (Criterion CI95). This criterion is of high practical relevance, since in
practice it is often the 95% CI and not the 90% CI that is interpreted. To be able to compare our results
to findings from previous studies (Floyd et al., 2008; Hagmann- von Arx et al., 2018), we plotted the
90% CIs around the obtained test scores using the standard error of the mean. However, following
recommendations of Atkinson (1989), most intelligence tests use the estimated true score instead of the
obtained test score as well as the standard error of estimation to plot the CI, as is the case for the seven
intelligence tests we investigated in this study. This procedure produces asymmetrical CIs that are larger
toward the mean, thus largely accounting for the regression toward the mean. Therefore, we adhered to
this procedure for the calculation of 95% CIs. Both, the 90% and the 95% CIs were calculated based on
statistics reported in the technical test manuals.
As a third criterion, following Floyd et al. (2005, 2008), we assumed comparability if the
absolute difference between two IQs of an individual was less than or equal to 10 points (Criterion
IQ10). This approach is useful as it uses the same standard to compare all IQ pairs (the critical difference
of 10 IQ points is invariant across all test batteries), yet it does not consider the actual reliability of each
test score (Floyd et al., 2005).
As fourth and fifth criterion, we calculated the correspondence of the nominal intelligence level
(lower extreme IQ: < 70; below average IQ: 70–84; average IQ: 85–115; above average IQ: 116–130;
upper extreme IQ: 130; Criterion Nominal IQ) as well as the correspondence of the nominal intelligence
levels for the 95% CIs (e.g., average to above average; Criterion Nominal CI95). These nominal criteria
are again of special practical relevance as the categorization of scores into average, below or above
average are often chosen by practitioners to communicate and explain intelligence test results to
laypeople.
Following Research Question 2, we investigated if there was an effect of standardization time
(with respect to a possible Flynn or anti-Flynn effect). We therefore calculated the percentage of
participants who scored higher on the more recently standardized intelligence test and the percentage

APPENDIX D: Study 4 149
of participants who scored lower on the more recently standardized intelligence test at Criterion CI90
for each pair of intelligence tests.
Following Research Question 3, we examined the individual-level comparability of NI and VI
analogous to Research Question 1. Yet we focused on just two of the five comparability criteria, namely
the CI95 that considers test reliability as well as the IQ10 that is independent of test reliability and
therefore invariant across all test batteries. We then conducted χ2 tests of proportions to examine
whether individual-level comparability was significantly higher or lower in NI and VI versus IQ.
Finally, following Research Question 4, we analyzed whether age, bilingualism, time interval
between two tests, order of test administration, and nominal intelligence level significantly predicted
the comparability of test results. We therefore ran simple linear regressions with the described variables
as independent variables and absolute IQ differences between each test pair as separate dependent
variables. A power analysis revealed that to detect large effects (β = .50) with a power of .80 and an
alpha level of .05, a sample size of at least 26 was necessary. We therefore excluded comparisons that
were available for less than 26 individuals from the regression analyses, that is, the IDS-2 and WPPSI-
III, SB5 and WAIS-III, SON-R 6-40 and WAIS-III, and SON-R 6-40 and WPPSI-III comparisons. Age
and time interval between two tests were included as continuous variables and bilingualism and order
of test administration as binary variables. In contrast to the Criterion Nominal IQ (as described above),
nominal intelligence level was defined here as a three-level categorical variable (i.e., below average IQ:
< 85; average IQ: 85–115; above average IQ: > 115) due to small sample sizes at the tails. For each test
comparison, a participant was classified as below average or above average if at least one of the two
intelligence test scores fell within the defined range. Regression analyses were two-tailed and statistical
significance was defined at the .05 alpha level. To counter possible alpha inflation due to multiple
testing, all p-values were corrected using the Hommel (1988) correction.
Results
Preliminary Analyses
Table 2 shows the distribution of the intelligence test scores collected in our study. Single-
sample t tests revealed that the means of all IQs (M = 102.46–115.29, p = .007 to p < .001) were
significantly higher than the expected mean (M = 100). Further, the standard deviations of all
intelligence tests (SD = 9.64–12.80) except for the SON-R 6-40 (SD = 15.17) were smaller compared
to the expected standard deviation (SD = 15).

APPENDIX D: Study 4 150
Table 2. Descriptive Statistics and One-Sample t Tests
Test N Minimum Maximum M SD Skewness Kurtosis t/Z a d/r b IDS-2 231 69 133 102.46 12.05 -0.129 -0.001 3.11**x 0.20 SB5 202 55 134 102.47 12.80 -0.397 0.721 2.74**x 0.19 RIAS 327 76 132 105.03 9.64 -0.057 0.305 9.44*** 0.52 SON-R 6-40 269 60 145 113.91 15.17 -0.120 -0.023 15.03*** 0.92 WAIS-III 34 77 136 115.29 12.57 -0.685 1.351 7.09*** 1.22 WISC-IV 226 60 142 112.49 11.59 -0.711 2.255 11.37*** 1.46 WPPSI-III 46 78 134 105.70 12.13 0.028 -0.141 3.19**x 0.47
Note. IDS-2 = Intelligence and Development Scales–2; SB5 = Stanford–Binet Intelligence Scales–Fifth Edition, German adaptation; RIAS = Reynolds Intellectual Assessment Scales, German adaptation; SON-R 6-40 = Snijders–Oomen Nonverbal Intelligence Test 6-40, German adaptation; WAIS-III = Wechsler Adult Intelligence Scale–Third Edition, German adaptation; WISC-IV = Wechsler Intelligence Scales for Children–Fourth Edition, German adaptation; WPPSI-III = Wechsler Preschool and Primary Scale of Intelligence–Third Edition, German adaptation. a Comparisons including the WISC-IV were analyzed with the Wilcoxon sign-ranked test (Z). b Effect sizes including the WISC-IV were indicated as r = Z/√". All other effect sizes are indicated as Cohen’s d. **p < .01; ***p < .001.
Group-Level Comparisons
Table 3 shows the results of all 18 intelligence test comparisons on the group level (Hypotheses
1 and 2). The first of each pair of intelligence tests is the one with the more recent standardization year,
except for the IDS-2 and the SB5, which were standardized within the same time period. Sixteen of 18
correlations were significant and ranged from moderate to strong. Only the correlations between the
SB5 and the WAIS-III (r = .38, p = .25) and between the SON-R 6-40 and the WAIS-III (r = .37, p =
.08) were rather weak and did not reach statistical significance. However, as for these pairs of tests,
samples sizes were small, the lack of significance could be due to insufficient power. A power analysis
with an alpha of .05 and a power of .80 revealed that with a sample size of 11 (as for the SB5 and
WAIS-III pair) only correlations larger than or equal to .52 could have been detected.
Further, t tests for dependent samples and Wilcoxon tests showed that the means at the group
level were substantially lower for the first-listed test with more recent standardization years in 13 of the
18 comparisons (Mdiff = 2.81 to -13.43, d = -0.27 to -1.29, r = -.23 to -.81). Only regarding the
comparisons between the SON-R 6-40 and the WPPSI-III (Mdiff = 9.28, d = 0.73) was the mean score
higher for the SON-R 6-40 with more recent standardization years. The comparisons between the IDS-
2 and the SB5, between the SB5 and the RIAS, between the SB5 and the WAIS-III, and between the
RIAS and the WPPSI-III did not reveal substantial differences.

APPENDIX D: Study 4 151
Table 3. Group-Level Comparison of IQs
Test comparison
Difference in standardization
years N r/ρ a rVarRel b Mean differences
(SD) t/Z c d/r d
IDS-2 and SB5 0 55 .73*** .82*** 0.62 (9.90) 0.46xxx 0.05 IDS-2 and RIAS 5 196 .65*** .81*** -3.04 (9.58) -4.44*** -0.27 IDS-2 and SON-R 6-40 6 154 .67*** .74*** -10.44 (11.02) -11.75*** -0.77 IDS-2 and WAIS-III 12 30 .46*xx .59*** -15.33 (12.39) -6.78*** -1.29 IDS-2 and WISC-IV 11 113 .65*** .78*** -8.66 (9.31) -7.52*** -0.71 IDS-2 and WPPSI-III 15 24 .87*** .94*** -4.54 (5.96) -3.74**x -0.39 SB5 and RIAS 5 167 .60*** .76*** -2.00 (10.42) -2.48*xx -0.17 SB5 and SON-R 6-40 6 139 .71*** .76*** -12.63 (11.09) -13.43*** -0.87 SB5 and WAIS-III 12 11 .28xxx .38xxx -8.55 (12.91) -2.20xxx -0.80 SB5 and WISC-IV 11 138 .75*** .84*** -10.32 (7.90) -9.49*** -0.81 SB5 and WPPSI-III 15 29 .68*** .78*** -4.34 (10.10) -2.32*xx -0.35 RIAS and SON-R 6-40 1 248 .48*** .63*** -8.59 (13.16) -10.28*** -0.67 RIAS and WAIS-III 7 28 .56**x .74*** -10.43 (11.24) -4.91*** -0.87 RIAS and WISC-IV 6 199 .66*** .83*** -7.34 (8.59) -9.32*** -0.66 RIAS and WPPSI-III 10 30 .51**x .71*** 1.23 (11.76) 0.57xxx 0.10 SON-R 6-40 and WAIS-III 6 24 .31xxx .37xxx -7.00 (15.57) -2.20*xx -0.53 SON-R 6-40 and WISC-IV 5 171 .61*** .70*** 2.81 (10.86) -3.05**x -0.23 SON-R 6-40 and WPPSI-III 9 18 .41xxx .49*xx 9.28 (13.79) 2.85*xx 0.73
Note. IDS-2 = Intelligence and Development Scales–2; SB5 = Stanford–Binet Intelligence Scales–Fifth Edition, German adaptation; RIAS = Reynolds Intellectual Assessment Scales, German adaptation; SON-R 6-40 = Snijders–Oomen Nonverbal Intelligence Test 6-40, German adaptation; WAIS-III = Wechsler Adult Intelligence Scale–Third Edition, German adaptation; WISC-IV = Wechsler Intelligence Scales for Children–Fourth Edition, German adaptation; WPPSI-III = Wechsler Preschool and Primary Scale of Intelligence–Third Edition, German adaptation. a Comparisons including the WISC-IV were analyzed using the nonparametric Spearman rank-order correlation (ρ). All other comparisons were analyzed using the Pearson product-moment correlation (r). b Correlations corrected for range restriction and attenuation. c Comparisons including the WISC-IV were analyzed with the Wilcoxon test (Z). All other comparisons were analyzed with the dependent t test (t). d Effect sizes including the WISC-IV were indicated as r = Z/√". All other effect sizes are indicated as Cohen’s d. *p < .05. **p < .01. ***p < .001.
Individual-Level Comparisons
Table 4 shows the results of the intelligence test comparisons on the individual level (Research
Question 1). A total of 1,774 test comparisons were analyzed across all seven intelligence tests and 383
subjects. Since the number of possible comparisons between the different test pairs varied considerably,
the total percentage of comparability was calculated across all 1,774 test comparisons. The total
comparability regarding the Criteria CI90, IQ10, CI95, Nominal IQ, and Nominal CI95 was 49.8%,
58.1%, 61.9%, 61.9%, and 89.4%, respectively. Regarding Research Question 2, in 39.9% of all cases
a lower IQ was achieved in the more recent (first-mentioned) test and in only 9.6% of all cases was a
higher IQ achieved in the more recent test. The comparison between the IDS-2 and the SB5 was
excluded from this analysis as these tests were standardized within the same time period.

APPENDIX D: Study 4 152
Table 4. Individual-Level Comparison of IQs
Test comparison N Mdiff Critical difference a
CI90 b (%)
Higher intelligence c
(%)
Lower intelligence d
(%) IQ10 e (%)
CI95 f (%)
Nominal IQ g (%)
Nominal CI95 h (%)
IDS-2 and SB5 55 7.31 5.94 52.7 30.9 16.4 78.2 61.8 69.1 89.1 IDS-2 and RIAS 196 7.99 8.98 63.8 9.2 27.0 72.4 74.5 76.0 96.9 IDS-2 and SON-R 6-40 154 12.36 8.98 40.3 4.5 55.2 48.7 53.2 55.8 85.1 IDS-2 and WAIS-III 30 15.60 8.40 30.0 0.0 70.0 33.3 33.3 53.3 90.0 IDS-2 and WISC-IV 113 10.26 7.74 43.4 3.5 53.1 59.3 56.6 63.7 92.0 IDS-2 and WPPSI-III 24 6.13 8.98 79.2 4.2 16.6 87.5 91.7 75.0 100.0 SB5 and RIAS 167 8.17 7.96 55.7 16.8 27.5 70.7 67.7 77.2 92.2 SB5 and SON-R 6-40 139 13.78 7.96 33.1 2.9 64.0 41.7 41.7 53.2 79.9 SB5 and WAIS-III 11 11.09 7.38 36.4 9.1 54.5 63.6 45.5 63.6 81.8 SB5 and WISC-IV 138 11.07 6.72 29.0 2.2 68.8 53.6 43.5 55.8 89.9 SB5 and WPPSI-III 29 9.59 7.96 31.0 20.7 48.3 58.6 62.1 65.5 96.6 RIAS and SON-R 6-40 248 12.38 11.00 54.0 7.3 38.7 50.0 64.1 56.5 85.1 RIAS and WAIS-III 28 12.79 10.42 39.3 7.1 53.6 39.3 67.9 46.4 89.3 RIAS and WISC-IV 199 9.44 9.76 55.3 4.0 40.7 59.8 68.8 57.8 93.5 RIAS and WPPSI-III 30 9.03 11.00 76.7 16.7 6.6 70.0 80.0 66.7 93.3 SON-R 6-40 and WAIS-III 24 12.67 10.42 58.3 12.5 29.2 58.3 62.5 50.0 83.3 SON-R 6-40 and WISC-IV 171 9.10 9.76 57.3 28.7 14.0 60.2 71.3 60.8 92.4 SON-R 6-40 and WPPSI-III 18 13.61 11.00 44.4 44.4 11.2 38.9 61.1 55.6 88.9 Total sample 1,774 10.45 8.96 49.8 i 9.6 i 39.9 58.1 61.9 61.9 89.9
Note. IDS-2 = Intelligence and Development Scales–2; SB5 = Stanford–Binet Intelligence Scales–Fifth Edition, German adaptation; RIAS = Reynolds Intellectual Assessment Scales, German adaptation; SON-R 6-40 = Snijders–Oomen Nonverbal Intelligence Test 6-40, German adaptation; WAIS-III = Wechsler Adult Intelligence Scale–Third Edition, German adaptation; WISC-IV = Wechsler Intelligence Scales for Children–Fourth Edition, German adaptation; WPPSI-III = Wechsler Preschool and Primary Scale of Intelligence–Third Edition, German adaptation; CI = confidence interval. a The sum of half of each test’s 90% confidence interval in intelligence test scores. b The percentage of participants who reached a difference between each pair of intelligence test scores of less than or equal to the critical difference. c The percentage of participants who scored higher on the first-listed and more recently standardized intelligence test of each pair of intelligence tests. d The percentage of participants who scored lower on the first-listed and more recently standardized intelligence test of each pair of intelligence tests. e The percentage of participants who reached a difference between each pair of intelligence test scores of less than or equal to 10 IQ points. f The percentage of participants with overlapping 95% CIs. g The percentage of participants who scored on the same qualitative nominal intelligence level in both tests (< 70: lower extreme; 70–84: below average; 85–115: average; 116–130: above average; > 130: upper extreme). h The percentage of participants who scored on the same qualitative nominal intelligence level in both tests when considering both qualitative nominal intelligence levels if the 95% CI spanned two levels (e.g., above average to average). i This mean percentage was calculated without the comparison of the IDS-2 and SB5, as they were standardized within the same period.
Detailed results on the individual-level comparability of NI and VI (Research Question 3) are
reported in Tables A1 and A2. For NI, a total of 1,780 test comparisons were analyzed across all seven
test batteries, including the IQ of the SON-R 6- 40, as it is officially classified as NI. For VI, a total of
1,020 test comparisons were analyzed across all tests except the SON-R 6-40, as this test does not
provide any verbal index score. Regarding Criterion IQ10, χ2 tests revealed that with 49.3%, the total
comparability of NI was significantly lower than the total comparability of IQ, with 58.1% (χ2 = 27.62,
p < .001) and the total comparability of VI with 62.2% was significantly higher than the total
comparability of IQ (χ2 = 6.02, p < .05). When considering Criterion CI95, the total comparability of

APPENDIX D: Study 4 153
NI increased to 62.2% and did not differ significantly from the total comparability of IQ, with 61.9%
(χ2 = 0.03, p > .05). The total comparability of VI also increased to 68.6% and was significantly higher
than the total comparability of IQ (χ2 = 12.60, p < .001).
Predictors of Incomparability
Results of linear regressions with age, bilingualism, time interval between two tests, order of
test administration, and nominal intelligence level as predictors of IQ differences (Research Question
4) are reported in Table 5. Age was a significant positive predictor (higher IQ differences for older
participants) for only 1 of 14 IQ differences, and a significant negative predictor (lower IQ differences
for older participants) for 2 of 14 test comparisons. Bilingualism, time interval between tests, and order
of test administration did not significantly predict IQ differences for any of the test comparisons.
Regarding nominal intelligence level, having an IQ in the below-average range in at least one
intelligence test was significantly associated with higher IQ differences in six test comparisons. Having
an IQ in the above-average range in at least one intelligence test was significantly associated with higher
IQ differences in 13 test comparisons (β = .18 to .70).
Table 5. Linear Regressions With Age, Bilingualism, Time Interval Between Tests, Order of Test Administration, and Nominal Intelligence Level as Predictors of IQ Differences Between Two Intelligence Tests
Test comparison
IDS-2 with
SB5 with RIAS with
SON-R 6-40 with
SB5 RIAS SON-R 6-40
WAIS-III
WISC-IV
RIAS
SON-R 6-40
WISC-IV
WPPSI-III
SON-R 6-40
WAIS-III
WISC-IV
WPPSI-III
WISC-IV
Age .20 .01 -.08 .25 .14 -.05 -.16 .26 * -.55 * -.20 * .07 -.10 -.35 -.16 Bilingualism -.19 -.06 .02 -.29 .01 .16 .16 -.07 .45 .03 -.19 -.04 .04 .18 Time interval between tests
-.06 .07 .07 .20 .19 .13 .14 -.08 .14 -.03 -.02 .13 .09 .05
Order of test administration
.09 .09 .17 .12 .19 .11 .03 -.03 .15 .02 .32 -.02 .13 .05
Nominal intelli- gence level
Below average .45 ** .29 *** .14 .18 .14 .39 *** .26 ** .37 *** .57 ** .02 .39 .06 .06 -.01 Above average .24 .18 * .50 *** .70 *** .25 * .31 *** .54 *** .22 * .46 * .56 *** .53 * .41 *** .45 * .32 ***
Note. The significance levels reported are corrected for alpha inflation using the Hommel correction. IDS-2 = Intelligence and Development Scales–2; SB5 = Stanford–Binet Intelligence Scales–Fifth Edition, German adaptation; RIAS = Reynolds Intellectual Assessment Scales, German adaptation; SON-R 6-40 = Snijders–Oomen Nonverbal Intelligence Test 6-40, German adaptation; WAIS-III = Wechsler Adult Intelligence Scale–Third Edition, German adaptation; WISC-IV = Wechsler Intelligence Scales for Children–Fourth Edition, German adaptation; WPPSI-III = Wechsler Preschool and Primary Scale of Intelligence–Third Edition, German adaptation. Coefficients are standardized beta regression coefficients. Bilingualism was coded as follows: 1 = female; 0 = male. Order of test administration was coded as follows: 1 = the first listed test was conducted earlier; 0 = the first listed test was conducted later. Nominal level: below average = IQ < 85; above average = IQ > 115; average (IQ 85–115) was the reference category. *p < .05. **p < .01. ***p < .001.

APPENDIX D: Study 4 154
Post Hoc Analyses
The systematic effect of the nominal intelligence level on IQ differences revealed in the
regression analyses leads to the hypothesis that comparability decreases toward the ends of the IQ
distribution, the specific ranges in which diagnostic questions most often arise in practice. Yet, due to
the particular trichotomization procedure used for the independent variable (nominal IQ levels), results
of the regression analyses may potentially be biased towards finding higher IQ differences in the above-
and below-average ranges.1 Therefore, to further scrutinize this hypothesis, we additionally ran post
hoc analyses based on continuous data. More specifically, we plotted the mean IQs of two tests (x-axis)
for each individual against the absolute difference of the two tests (y-axis) which resulted in a total of
18 plots for all possible test comparisons (single plots, Figure 1). We then fitted local polynomial (loess)
regressions to determine the relationships between mean IQ and IQ differences. We thereby assumed
that the regression curve increased towards the extreme ends of the IQ distribution if differences are
higher in these ranges. Whereas some of the curves indeed indicated greater differences toward the end
of the IQ distribution, some curves also showed different patterns. We then additionally combined all
the data of the 18 single plots in a combined plot in order to generate a more powerful representation
of the effect in question (Figure 2). Whereas in this combined curve greater differences toward the
upper bound of the IQ distribution were clearly visible, the curve flattened toward the average and
below-average range, indicating that IQ differences in these ranges were of comparable size.
1 We thank two anonymous reviewers for the fruitful discussions of this issue and possible solutions to it.

APPENDIX D: Study 4 155
Figure 1. Mean of the Two IQ Scores for Each Individual Plotted Against the Absolute Difference Between the Two IQ Scores
Note. IDS-2 = Intelligence and Development Scales–2; SB5 = Stanford–Binet Intelligence Scales–Fifth Edition, German adaptation; RIAS = Reynolds Intellectual Assessment Scales, German adaptation; SON-R 6-40 = Snijders–Oomen Nonverbal Intelligence Test 6-40, German adaptation; WAIS-III = Wechsler Adult Intelligence Scale–Third Edition, German adaptation; WISC-IV = Wechsler Intelligence Scales for Children–Fourth Edition, German adaptation; WPPSI-III = Wechsler Preschool and Primary Scale of Intelligence–Third Edition, German adaptation; Abs Diff = absolute difference between the two IQ scores.
0
10
20
30
55 70 85 100 115 130 145
Abs
Diff
IDS−2 and SB5
0
10
20
55 70 85 100 115 130 145
Abs
Diff
IDS−2 and RIAS
0
10
20
30
40
55 70 85 100 115 130 145
Abs
Diff
IDS−2 and SON−R 4−60
−20
0
20
40
55 70 85 100 115 130 145
Abs
Diff
IDS−2 and WAIS−III
−10
0
10
20
30
55 70 85 100 115 130 145
Abs
Diff
IDS−2 and WISC−IV
−5
0
5
10
15
55 70 85 100 115 130 145Mean IQ
Abs
Diff
IDS−2 and WPPSI−III
0
10
20
30
55 70 85 100 115 130 145
Abs
Diff
SB5 and RIAS
−10
0
10
20
30
55 70 85 100 115 130 145
Abs
Diff
SB5 and SON−R 4−60
−50
0
50
55 70 85 100 115 130 145
Abs
Diff
SB5 and WAIS−III
0
10
20
30
55 70 85 100 115 130 145
Abs
Diff
SB5 and WISC−IV
0
10
20
30
55 70 85 100 115 130 145
Abs
Diff
SB5 and WPPSI−III
0
10
20
30
40
55 70 85 100 115 130 145Mean IQ
Abs
Diff
RIAS and SON−R 4−60
0
10
20
30
55 70 85 100 115 130 145
Abs
Diff
RIAS and WAIS−III
0
10
20
30
55 70 85 100 115 130 145
Abs
Diff
RIAS and WISC−IV
−10
0
10
20
55 70 85 100 115 130 145
Abs
Diff
RIAS and WPPSI−III
−20
0
20
55 70 85 100 115 130 145
Abs
Diff
SON−R 4−60 and WAIS−III
−10
0
10
20
30
55 70 85 100 115 130 145
Abs
Diff
SON−R 4−60 and WISC−IV
0
10
20
30
40
55 70 85 100 115 130 145Mean IQ
Abs
Diff
SON−R 4−60 and WPPSI−III

APPENDIX D: Study 4 156
Figure 2. Mean of the Two IQ Scores for Each Individual Plotted Against the Absolute Difference Between the Two IQ Scores: Data From All Test Comparisons Combined
Note. Each individual is represented here with one data point for each test comparison that was available for this individual (i.e., between one and five data points per individual). Tests included are: Intelligence and Development Scales–2; Stanford–Binet Intelligence Scales–Fifth Edition, German adaptation; Reynolds Intellectual Assessment Scales, German adaptation; Snijders–Oomen Nonverbal Intelligence Test 6-40, German adaptation; Wechsler Adult Intelligence Scale–Third Edition, German adaptation; Wechsler Intelligence Scales for Children–Fourth Edition, German adaptation; Wechsler Preschool and Primary Scale of Intelligence–Third Edition, German adaptation.
Discussion
The main objective of the present study was to investigate comparability between IQs from
seven widely used intelligence tests on the group level and in particular on the individual level. In line
with Hypothesis 1, we found mainly substantial correlations between intelligence tests on the group
level. Only 2 of 18 correlations were not significant, and these should be interpreted with caution, as
sample sizes in these two cases were low. However, contrary to our Hypothesis 2 and to Hagmann-von
Arx et al. (2018), we found that in 14 of 18 comparisons, the mean IQ differed significantly between
two test scores. Investigating whether IQs obtained from different tests could be classified as
comparable (exchangeable) on an individual level, we found that this was true for a relatively low
percentage that varied across the different criteria from 49.8% (criterion CI90) to 89.9% (criterion
Nominal CI95). Within the percentage of incomparability, tests with earlier standardization years
yielded higher IQs than tests with more recent standardization years, which we interpret as an indicator
of the Flynn effect (Research Question 2). The pattern of individual-level comparability of nonverbal
and verbal factor scores was similar to that found for the IQs (Research Question 3). Beyond that, the
nominal intelligence level (below- or above-average vs. average range) was the only systematic
predictor of intelligence score differences between tests (Research Question 4). More specifically,
0
10
20
30
40
55 70 85 100 115 130 145Mean IQ
Abso
lute
IQ D
iffer
ence

APPENDIX D: Study 4 157
having an IQ in the above-average range was related to greater IQ differences in almost all test
comparisons and having an IQ in the below average range was related to greater IQ differences in almost
half of all test comparisons. Additional post-hoc analyses based on continuous data confirmed the
previous finding of greater IQ differences toward the upper, but not toward the lower bound of the IQ
distribution. This finding is in line with Spearman’s law of diminishing returns (SLODR; Spearman,
1927) or ability differentiation, which states that the influence of general intelligence on test results
decreases with increasing ability level. Consequently, differences in content sampling are expected to
have a large influence in these ranges, providing a possible explanation for larger differences for
individuals with higher IQs. Yet, few individuals scored in the below-average range in our sample and
further research with more children scoring in this range is needed to scrutinize whether comparability
is or is not reduced in the below average IQ range, as suggested by our regression analysis results.
Individual-Level Comparisons
Before taking a closer look at the various criteria of comparability on the individual level, we
would like to point out that we neither interpret nor compare comparability of specific test combinations
(e.g., whether the comparability between the IDS-2 and the RIAS is higher than the comparability
between the IDS-2 and the WISC-IV) because sample sizes varied considerably between test
comparisons. Instead, we focus on the overall comparability in order to compare and discuss the
advantages and disadvantages of the different criteria.
Our results show that comparability was lowest for the criterion CI90, as this interval was
narrowest. With a between-test comparability about 50%, using the 90% CI for test interpretation does
not seem to be useful. With the criterion proposed, for example, by Bergeron et al. (2008) to consider
5 IQ points above and below the exact point score when diagnosing intellectual ability (criterion IQ10),
test comparability was higher, although still quite low with about 58%. Yet, this criterion seems
somewhat arbitrary as the considered range of 10 IQ points around the obtained IQ does not consider
test-specific unreliability nor the regression toward the mean. CI95 and nominal IQ have revealed the
same percentage of comparability with slightly over 60%. The nominal IQ has practical relevance, as
it allows for clear classification and may thus be used for diagnosis and classification (e.g., of
intellectual disability or intellectual giftedness). However, like the criterion IQ10, the Nominal IQ also
disregards the fact that tests might differ with regard to their measurement accuracy. Given that
comparability was equally low as in criterion CI95, the CI95 should hence be preferred to the Nominal
IQ. Last, the comparability between tests is maximized and approaches 90% when interpreted on the
Nominal CI95 criterion. However, one must bear in mind that the IQs of two tests could differ by up to
45 points and still be classified as “comparable” according to this criterion. Given such a wide IQ range,
hardly any useful decisions or conclusions can be made. For this reason, and even though this criterion
may best represent the extent to which intelligence tests are incomparable, the Nominal CI95 does not
provide a diagnostically useful interpretation of test results. Consequently, it seems very difficult to
find a criterion that allows for both a reasonably narrow IQ range and a high probability that a

APPENDIX D: Study 4 158
comparable result would be achieved with another intelligence test. Overall, we conclude that for the
IQ, the CI95 criterion has the best trade-off between comparability and accuracy. Still, the percentage
of comparability is disconcertingly low on this criterion, too.
For the investigation of individual-level comparability of first-order factor scores, our results
show that the comparability of NIs is lower compared to the comparability of IQs when reliability is
not considered (criterion IQ10) and that the comparability of NIs does not differ from the comparability
of IQs when reliability is considered (criterion CI95). However, the comparability of VIs was—
although still quite low—significantly higher than that of IQs on both criteria, IQ10 and CI95. If the
comparability of VI was only higher on criterion CI95, one might assume that this is explained by the
fact that VI has generally slightly lower reliability coefficients, what widens their CIs resulting in a
higher chance for overlap. Yet, this assumption is rejected by the finding that comparability is also
higher on criterion IQ10 which is independent of reliability and therefore invariant across all
comparisons. A possible explanation for the higher comparability of VIs could therefore be that there
is greater content overlap between the subtests of the different test batteries that constitute the VI
compared to the NI and IQ. Although content overlap should be neglectable for the measurement of g
due to the principle of aggregation (Jensen & Weng, 1994; Rushton et al., 1983), it does play an
important role when the number of subtests is lower (Farmer et al., 2020), as it is in VI and NI. This
could now lead to the conclusion that the VI is to be preferred to the IQ as an intelligence estimate.
However, there is a large body of research with at least two widely supported counterarguments: First,
IQ is a more accurate representation of g and first-order factor scores are usually less reliable than the
IQ (Jensen, 1981, 1998; Kranzler & Floyd, 2013). In this sense, the finding that comparability is higher
for VI than for IQ does not make VI a better representation of g. Second, factor scores contain only a
little unique variance compared to the IQ (Canivez & Youngstrom, 2019; McGill et al., 2018).
Consequently, we do not know to what extent this comparability is caused by shared variance of g and
to what extent it is caused by more specific verbal reasoning. Furthermore, individual-level
comparability is only slightly higher for VI compared to IQ and our results indicate that cognitive profile
scores cannot be reliably replicated across test batteries. Therefore, we recommend interpreting NI as
well as VI only with extreme caution, if at all, although it is a common practice among school
psychologists (e.g., McGill et al., 2018). This goes in line with previous literature that heavily questions
the usefulness of any kind of cognitive profile interpretation (e.g., to identify patterns of specific
learning disorders) for school psychology practice (e.g., McGill et al., 2018).
Given the high relevance of having comparable IQs across intelligence tests, it is important to
discuss potential factors that might have reduced comparability. Some of these, that were also included
in the regression analyses, are characteristics of the testee, such as age or bilingualism, which were both
not systematically associated with IQ differences. Other possible explanations concern characteristics
of the tests themselves, such as their overlap in content (see above) or the presence of naming fallacies
(i.e., subtests from different tests purported to measure the same constructs, when they in fact measure
APPENDIX D: Study 4 159
different constructs, or vice versa; Thorndike, 1904). Moreover, consequences of multiple testing, such
as the time interval between tests as well as the order of test administration might also systematically
influence IQ differences due to potential effects of temporal stability (see discussion on transient effects
below) and practice effects, respectively. However, we found no support for these influences in our
regression analyses. As stated above, it is likely that other variables not considered here influenced the
comparability, for example, differences in the standardization samples between the test batteries (e.g.,
over- or undersampling of individuals with particularly high or low ability). Either way, it needs to be
discussed what practitioners as well as test developers can do to deal with potential sources of
incomparability.
Implications for the Application and Construction of Intelligence Tests
A common recommendation to deal with this comparability issue is to apply more than one
intelligence test, especially for high-stakes decisions. From a pure statistical perspective, this
recommendation is reasonable as the reliability of a score increases when enhancing the number of
items and subtests that measure the same construct (i.e., intelligence). In line with this, previous results
from generalizability theory analyses showed that up to five intelligence tests need to be applied to
achieve a reliability of at least .90 (Hagmann-von Arx et al., 2018). As this is obviously not feasible in
practice, the authors suggested using at least two tests for high-stakes decisions. Yet, whereas the
interpretation of a test result and subsequent diagnoses and decisions are strengthened if IQs obtained
in two different tests are comparable, the question of what to do if they lie far apart remains unanswered.
Whereas it seems to be common practice to average composite scores from different tests to gain a more
reliable and valid estimation of intelligence, we do not support this practice as it may cause additional
measurement error and biases the averaged score toward the mean (Schneider & McGrew, 2011).
Moreover, even if this bias toward the mean were considered, there are numerous reasons for possible
underachievement (e.g., fatigue, sleep quality, motivational factors, test anxiety, environmental
distractions, etc.) but rather few reasons for possible overachievement (e.g., guessing, learning effects,
inappropriate help from the examiner) on intelligence tests. Measurement error can therefore not be
averaged arithmetically. Furthermore, as stated above, differences in content between the tests might
also cause systematic differences in global IQ scores in interaction with characteristics of the testee
(e.g., Irby & Floyd, 2017). Instead of averaging IQs across tests, it may be tempting for practitioners to
consider the more extreme of two scores to set a diagnosis (if only one of the two reaches the cut-off),
especially when the presence of a diagnosis is associated with financial and educational resource
allocation. Yet, especially in the below-average range, we do not recommend this practice either and
certainly not without checking for a potential underachievement, as the drawbacks of a false diagnosis
of intellectual disability (e.g., stigmatization, Golem effect) may exceed the positive effect of
educational support. Overall, the practical benefit of applying two or more intelligence tests seems to
be somewhat limited as long as there is no coherent evidence-based strategy of interpreting scores that
diverge widely. What we do recommend is, as already proposed in diagnostic guidelines and previous

APPENDIX D: Study 4 160
studies, to only interpret scores with adequate reliability and with evidence-based support of validity
and utility (e.g., American Educational Research Association et al., 2014; McGill et al., 2018).
Furthermore, we recommend to consider anamnestic information such as language and cultural
background and personal characteristic (e.g., interaction difficulties) as well as environmental
conditions to determine if a child’s and adolescent’s abilities are accurately measured (American
Psychological Association, 2017; International Test Commission, 2001; National Research Council,
2002). This might be a necessary step both prior to test administration for an adaptive test selection as
well as after test administration for a careful test interpretation. Investigating some of these possible
influences (i.e., bilingualism, age, and test interval) on test comparability, we could not detect any
systematic effect. However, it is possible that additional factors that have not been examined in this
study may have impacted test comparability on the individual level. Further, it is also possible that some
potential factors influenced test comparability for certain individuals under certain circumstances, but
not for others. If this was the case, we must assume that incomparability and measurement inaccuracy
is increased by random variations (e.g., a temporary state of an individual or random circumstances) in
addition to systematic effects. This type of error variance is often called transient error (Schmidt, Le, &
Ilies, 2003). The National Research Council (2002) provided a comprehensive list of possible
systematic and transient error sources (threats) including characteristics of the examinee, examiner’s
influence, and environmental influences as well as psychometric test characteristics and stated that “all
of them can be controlled to some considerable degree” (p. 100). Nevertheless, we note that this is a
considerable challenge for practitioners, not only because of the multitude of potential threats but also
because of time pressure, that often plays a crucial role in the diagnostic process. Our results show the
extent of incomparability across test scores when potential transient error sources are not considered.
With this in mind, our results indicate how prone intelligence test scores are to interference, and how
high the risk of misdiagnosis may be if the diagnostic process is not carried out with the utmost
thoroughness. It thus seems important to explore what not only test administrators but also test
developers can do to reduce potential sources of incomparability.
In this context, we consider it important to discuss the use of internal consistency coefficients
for the calculation of CIs. This practice should be reconsidered for mainly two reasons: First, the
specific internal consistency coefficient used for the calculation of CIs differs among tests (i.e.,
Cronbach’s α or split-half reliability), which influences the width of the CI and with that also the
comparability between tests. Second, internal consistency coefficients do not take into account the
previously described transient errors. Yet, ignoring such transient errors leads to an overestimation of
the reliability (Schmidt et al., 2003). Thus, it is important to investigate whether other reliability
coefficients—such as the test–retest reliability that does consider transient errors—would provide an
alternative and more accurate estimate and basis for the calculation of CIs. Nevertheless, this does not
solve the problem of comparability seeming to be especially low in the above-average intelligence range
(and potentially also in the below-average range). If this finding is replicated in future research, it will

APPENDIX D: Study 4 161
be of interest to explore how and to what extent the IQ level should be considered within the calculation
of reliability coefficients and CIs. Our suggestion is that technical test manuals should provide
conditional (e.g., IQ-level specific) reliability coefficients and standard errors. For if measurement error
is generally higher in the vicinity of cut-off scores, the risk for error of classification and misdiagnosis
increases, too (American Educational Research Association et al., 2014). This potential risk and its
implications must be made visible, not only in research articles but also test manuals that provide
recommendations on test interpretation. This will allow practitioners to engage in an informed
discussion about the utility of rigid versus flexible cut-off scores when making high-stakes decisions.
Generally, it is essential to ensure that comparability of intelligence test results is not reduced
by sampling error, and that test developers proceed according to the current state of research. This
includes making sure that the IQ is based on an adequate number of subtests (see Farmer et al., 2019),
that the IQ consists of a heterogeneous set of subtests in order to average out measurement error, and
that only subtests with a high g loading are included (Farmer et al., 2020; Jensen & Weng, 1994).
Further research is needed to investigate whether and how individual-level comparability might be
enhanced with an optimal balance of these three aspects.
Finally, practitioners as well as test developers should remember that simply putting the results
from two tests purported to measure the same construct on the same scale by standardization does not
necessarily mean that their scores will be interchangeable. Test developers should consider applying
and communicating explicit score equating practices (see, for example, Dorans & Holland, 2000;
Holland, 2007; Livingston, 2014), and assure that the prerequisites for score equating are met (see
Dorans & Holland, 2000). Only if the prerequisites of score equation are met and if scores are equated
explicitly (using a specific linking function), then the expectation of interchangeable scores many
practitioners and researchers already hold may be really justified.
Limitations
Our study has several limitations. First, mean IQs of our sample were higher than the
standardization means. This bias may have been caused by participants being allowed to decide whether
they wanted to do more tests after having taken either the IDS-2 or the SB5. It is likely that participants
with lower results on one of the first tests had less joy and were therefore less motivated to participate
in further tests. If it is true that comparability decreases toward the upper end of the IQ distribution, this
circumstance may limit the generalizability of our findings in a way that overall comparability might
be higher in a sample with mean IQs closer to the standardization mean. Moreover, the relatively low
number of individuals with below-average intelligence also prevented us from drawing reliable
conclusions regarding comparability in this particular intelligence range. Second, our sample sizes
varied considerably between test comparisons. We therefore did not explicitly compare or interpret
comparability of specific test combinations. Third, we had relatively small sample sizes for some
comparisons, and especially the youngest (4–6 years) and oldest (16–20 years) participants. This has
reduced the power to detect small and medium effects for the group- level correlation analyses as well

APPENDIX D: Study 4 162
as for the regression analyses, especially those with age as a possible predictor of IQ differences
between tests. It also led to the exclusion of half of the comparisons involving the WPPSI-III and WAIS-
III. For the regression analyses in particular, all comparisons with sample sizes smaller than 82 (that is,
5 of the 14 comparisons for which regression analyses were performed) would have required at least
medium effect sizes (β = .30) to be detected with an alpha of .05 and a power of .80, and were therefore
likely underpowered for some predictors. Further research including larger samples and more
individuals in all age ranges might shed further light on the possible impact of age and other predictors
on test score comparability. Fourth, the combination of all test comparisons in one single plot and loess
regression analysis for the investigation of the relationship between individual mean IQ and IQ
differences (Figure 2) might be biased due to an enmeshment of within- and between-individual data
(each individual contributed one to five data points) and of different test comparisons that might differ
systematically (e.g., two tests with lower content overlap might result in higher differences in general).
Finally, information about mono- or bilingualism was collected via self- or parent report. An
examination of actual language skills by using performance-based tests could provide valuable
information on whether and to what extent they influence test comparability.
Conclusion
We conclude that the interpretation of an exact IQ from a single intelligence test does not hold
empirically, which strongly questions the use of rigid cut-off values for diagnosis and related
educational resource allocation and favors the use of flexible cut-offs that consider the test-specific
measurement error. At least the 95% CI must be considered when making high- stakes decisions. Even
then, and especially in the upper (and probably also in the lower) bounds of the IQ scores, there is a
considerable risk that diagnosis and resource allocation for special education will be based largely on
test-specific characteristics and measurement error and less on the individual’s true ability. To reduce
this risk and to enhance between-test comparability, diagnosticians are encouraged to consider possible
factors that interfere with an individual’s ability. Hence, test administrators need to be well trained and
informed about the limitations of conventional intelligence tests. Further, our results point to the fact
that current intelligence tests may have relied too much on results derived from group-level analyses
while excluding individual-level analyses to determine psychometric test quality. Future research is
needed to generate effective approaches to enhancing accuracy and with this also individual-level
comparability between tests.
APPENDIX D: Study 4 163
References
Aiken, L. R., & Groth-Marnat, G. (2005). Psychological testing and assessment (12th ed.). Needham
Heights, M.A.: Allyn & Bacon.
Alexander, R. A., Carson, K. P., Alliger, G. M., & Carr, L. (1987). Correcting doubly truncated
correlations: An improved approximation for correcting the bivariate normal correlation when
truncation has occurred on both variables. Educational and Psychological Measurement, 47,
309–315. https://doi.org/10.1177/0013164487472002
Allen, D. N., Stolberg, P. C., Thaler, N. S., Sutton, G., & Mayfield, J. (2014). Validity of the RIAS for
assessing children with traumatic brain injury: Sensitivity to TBI and comparability to the
WISC-III and WISC-IV. Applied Neuropsychology: Child, 3, 83–93. https://doi.org/
10.1080/21622965.2012.700531
American Association on Intellectual and Developmental Disabilities. (2020). Frequently asked
questions on intellectual disability. Retrieved from https://www.aaidd.org/intellectual-
disability/definition/faqs-on-intellectual-disability
American Educational Research Association, American Psychological Association, & National Council
on Measurement in Education. (2014). Standards for educational and psychological testing.
Washington, DC: American Educational Research Association.
American Psychiatric Association. (2013). Diagnostic and statistical manual of mental disorders (5th
ed.). Arlington, VA: American Psychiatric Publishing.
American Psychiatric Association. (2017). What is intellectual disability? Retrieved from
https://www.psychiatry.org/patients-families/intellectual-disability/what-is-intellectual-
disability
American Psychological Association. (2017). Ethical principles of psychologists and code of conduct,
including 2010 and 2016 amendments. Retrieved from http://www.apa.org/ethics/code/
index.aspx
Aspara, J., Wittkowski, K., & Luo, X. (2018). Types of intelligence predict likelihood to get married
and stay married: Large-scale empirical evidence for evolutionary theory. Personality and
Individual Differences, 122, 1–6. https://doi.org/10.1016/j.paid.2017.09.028
Atkinson, L. (1989). Three standard errors of measurement and the Stanford–Binet Intelligence Scale,
Fourth Edition. Psychological Assessment, 1, 242–244. https://doi.org/10.1037/1040-
3590.1.3.242
Baum, K. T., Shear, P. K., Howe, S. R., & Bishop, S. L. (2015). A comparison of WISC-IV and SB5
intelligence scores in adolescents with autism spectrum disorder. Autism, 19, 736–745.
https://doi.org/10.1177/1362361314554920
Beaujean, A. A., & Benson, N. F. (2019a). The one and the many: Enduring legacies of Spearman and
Thurstone on intelligence test score interpretation. Applied Measurement in Education, 32,
198–215. https://doi.org/10.1080/08957347.2019.1619560
APPENDIX D: Study 4 164
Beaujean, A. A., & Benson, N. F. (2019b). Theoretically-consistent cognitive ability test development
and score interpretation. Contemporary School Psychology, 23, 126–137. https://doi.org/
10.1007/s40688-018-0182-1
Benson, N., Floyd, R. G., Kranzler, J. H., Eckert, T. L., & Fefer, S. (2018). Contemporary assessment
practices in school psychology: National survey results. Paper presented at the Meeting of the
National Association of School Psychologists, Chicago, IL.
Bergeron, R., Floyd, R. G., & Shands, E. I. (2008). States’ eligibility guidelines for mental retardation:
An update and consideration of part scores and unreliability of IQs. Education and Training in
Developmental Disabilities, 43, 123–131.
Briesch, A. M., Swaminathan, H., Welsh, M., & Chafouleas, S. M. (2014). Generalizability theory: A
practical guide to study design, implementation, and interpretation. Journal of School
Psychology, 52, 13–35. https://doi.org/10.1016/j.jsp.2013.11.008
Calvin, C. M., Deary, I. J., Fenton, C., Roberts, B. A., Der, G., Leckenby, N., & Batty, G. D. (2011).
Intelligence in youth and all-cause-mortality: Systematic review with meta-analysis.
International Journal of Epidemiology, 40, 626–644. https://doi.org/10.1093/ije/dyq190
Canivez, G. L., & Youngstrom, E. A. (2019). Challenges to the Cattell–Horn–Carroll theory: Empirical,
clinical, and policy implications. Applied Measurement in Education, 32, 232–248.
https://doi.org/10.1080/08957347.2019.1619562
Cronbach, L. J., Gleser, G. C., Nanda, H., & Rajaratnam, N. (1972). The dependability of behavioral
measurements. New York, NY: Wiley.
Damian, R. I., Su, R., Shanahan, M., Trautwein, U., & Roberts, B. W. (2015). Can personality traits
and intelligence compensate for background disadvantage? Predicting status attainment in
adulthood. Journal of Personality and Social Psychology, 109, 473–489. https://doi.org/
10.1037/pspp0000024
Daseking, M., Lipsius, M., Petermann, F., & Waldmann, H. C. (2008). Differenzen im Intelligenzprofil
bei Kindern mit Migrationshintergrund: Befunde zum HAWIK-IV. [Intelligence and cultural
influences: Differences in the intelligence profile of children with a migration background:
Findings on WISC-IV]. Kindheit und Entwicklung, 17, 76–89. https://doi.org/10.1026/0942-
5403.17.2.76
Deary, I. J., Strand, S., Smith, P., & Fernandes, C. (2007). Intelligence and educational achievement.
Intelligence, 35, 13–21. https://doi.org/10.1016/j.intell.2006.02.001
Dorans, N. J., & Holland, P. W. (2000). Population invariance and the equatability of tests: Basic theory
and the linear case. Journal of Educational Measurement, 37, 281–306. https://doi.org/10.1111/
j.1745-3984.2000.tb01088.x
Duckworth, A. L., Quinn, P. D., Lynam, D. R., Loeber, R., & Stouthamer-Loeber, M. (2011). Role of
test motivation in intelligence testing. Proceedings of the National Academy of Sciences, 108,
7716–7720. https://doi.org/10.1073/pnas.1018601108
APPENDIX D: Study 4 165
Dutton, E., & Lynn, R. (2014). A negative Flynn effect in Finland, 1997–2009. Intelligence, 41(6),
817–820. https://doi.org/10.1016/j.intell.2013.05.008
Evers, A. (2001). Improving test quality in the Netherlands: Results of 18 years of test ratings.
International Journal of Testing, 1, 137–153. https://doi.org/10.1207/S15327574IJT0102
Farmer, R. L., & Floyd, R. G. (2018). Use of intelligence tests in the identification of children and
adolescents with intellectual disability. In Dawn P. Flanagan & E. M. McDonough (Eds.),
Contemporary intellectual assessment: Theories, tests, and issues (4th ed., pp. 643–661). New
York, NY: Guilford Press.
Farmer, R. L., Floyd, R. G., Reynolds, M. R., & Berlin, K. S. (2020). How can general intelligence
composites most accurately index psychometric g and what might be good enough?
Contemporary School Psychology, 24, 52–67. https://doi.org/10.1007/s40688- 019-00244-1
Floyd, R. G., Bergeron, R., McCormack, A. C., Anderson, J. L., & Hargrove-Owens, G. L. (2005). Are
Cattell–Horn–Carroll broad ability composite scores exchangeable across batteries? School
Psychology Review, 34, 329–357. https://doi.org/10.1080/02796015.2005.12086290
Floyd, R. G., Clark, M. H., & Shadish, W. R. (2008). The exchangeability of IQs: Implications for
professional psychology. Professional Psychology: Research and Practice, 39, 414–423.
https://doi.org/10.1037/0735-7028.39.4.414
Flynn, J. R. (1987). Massive IQ gains in 14 nations: What IQ tests really measure. Psychological
Bulletin, 101, 427–427. https://doi.org/10.1037/h0090408
Flynn, J. R. (2009). Requiem for nutrition as the cause of IQ gains: Raven’s gains in Britain 1938–
2008. Economics and Human Biology, 7, 18–27. https://doi.org/10.1016/j.ehb.2009.01.009
Gallinat, E., & Spaulding, T. J. (2014). Differences in the performance of children with specific
language impairment and their typically developing peers on nonverbal cognitive tests: A meta-
analysis. Journal of Speech, Language, and Hearing Research, 57, 1363–1382.
https://doi.org/10.1044/2014_JSLHR-L-12-0363
Gignac, G. E. (2008). Higher-order models versus direct hierarchical models: g as superordinate or
breadth factor? Psychology Science Quarterly, 50, 21–43.
Goldstein, D., Hahn, C. S., Hasher, L., Wiprzycka, U. J., & Zelazo, P. D. (2007). NIH Public Access.
Personality and Individual Differences, 42, 431–440. https://doi.org/doi:10.1016/
j.paid.2006.07.008
Grob, A., Gygi, J. T., & Hagmann-von Arx, P. (2019). The Stanford–Binet Intelligence Scales, Fifth
Edition (SB5)—German Adaptation. Bern, Switzerland: Hogrefe.
Grob, A., & Hagmann-von Arx, P. (2018). Intelligence and Development Scales–2 (IDS-2). Intelligenz-
und Entwicklungsskalen für Kinder und Jugendliche. [Intelligence and Development Scales for
children and adolescents]. Bern, Switzerland: Hogrefe.

APPENDIX D: Study 4 166
Grob, A., Reiman, G., Gut, J., & Frischknecht, M. C. (2013). Intelligence and Development Scales–
Preschool (IDS-P). Intelligenz- und Entwicklungsskalen für das Vorschulalter. [Intelligence
and Development Scales for Children from 5-10 years of age]. Bern: Hans Huber.
Gupta, S. (1991). Effects of time of day and personality on intelligence test scores. Personality and
Individual Differences, 12, 1227–1231. https://doi.org/10.1016/0191-8869(91)90089-T
Hagmann-von Arx, P., & Grob, A. (2014). Reynolds Intellectual Assessment Scales (RIAS)—German
adaptation. Bern, Switzerland: Hans Huber.
Hagmann-von Arx, P., Grob, A., Petermann, F., & Daseking, M. (2012). Konkurrente Validität des
HAWIK-IV und der Intelligence and Development Scales (IDS). [Concurrent validity of the
HAWIK-IV and the Intelligence and Development Scales (IDS)]. Zeitschrift für Kinder- und
Jugendpsychiatrie und Psychotherapie, 40, 41–50. https://doi.org/10.1024/1422-4917/a000148
Hagmann-von Arx, P., Lemola, S., & Grob, A. (2018). Does IQ = IQ? Comparability of intelligence
test scores in typically developing children. Assessment, 25, 691–701. https://doi.org/10.1177/
1073191116662911
Hagmann-von Arx, P., Petermann, F., & Grob, A. (2013). Konvergente und diskriminante Validität der
WISC-IV und der Intelligence and Development Scales (IDS) bei Kindern mit
Migrationshintergrund. [Convergent and discriminant validity of the WISC-IV and the
Intelligence and Development Scales (IDS) in children with migration background].
Diagnostica, 59, 170–182. https://doi.org/10.1026/0012-1924/a000091
Hausknecht, J. P., Halpert, J. A., Di Paolo, N. T., & Moriarty Gerrard, M. O. (2007). Retesting in
selection: A meta-analysis of practice effects for tests of cognitive ability. Journal of Applied
Psychology, 92, 373–385.
Holland, P. W. (2007). A framework and history for score linking. In N. J. Dorans, M. Pommerich, &
P. W. Holland (Eds.), Linking and aligning scores and scales (pp. 5–30). New York, NY:
Springer.
Hommel, G. (1988). A stagewise rejective multiple test procedure based on a modified Bonferroni test.
Biometrika, 75, 383–386. https://doi.org/https://doi.org/10.1093/biomet/75.2.383
International Test Commission. (2001). International guidelines for test use. International Journal of
Testing, 1, 93–114.
Irby, S. M., & Floyd, R. G. (2017). Exchangeability of brief intelligence tests: Illuminating error
variance components’ influence on IQs for children with intellectual giftedness. Psychology in
the Schools, 43, 1064–1078. https://doi.org/https://doi.org/10.1002/pits.22068
Jensen, A. R. (1981). Straight talk about mental tests. New York, NY: Free Press.
Jensen, A. R. (1998). The g factor: The science of mental ability. Westport, CT: Praeger.
Jensen, A. R., & Weng, L.-J. (1994). What is a good g? Intelligence, 258, 231–258.

APPENDIX D: Study 4 167
Kovacs, K., & Conway, A. R. A. (2019). A unified cognitive/differential approach to human
intelligence: Implications for IQ testing. Journal of Applied Research in Memory and
Cognition, 8, 255–272. https://doi.org/10.1016/j.jarmac.2019.05.003
Kranzler, J. H., & Floyd, R. G. (2013). Assessing intelligence in children and adolescents: A practical
guide. New York, NY: Guilford Press.
Livingston, S. A. (2014). Equating test scores (without IRT) (2nd ed.). Princeton, NJ: Educational
Testing Service.
Lubinski, D. (2004). Introduction to the special section on cognitive abilities: 100 years after
Spearman’s (1904) “‘General Intelligence,’ objectively determined and measured.” Journal of
Personality and Social Psychology, 86, 96–111. https://doi.org/10.1037/0022-3514.86.1.96
Lynn, R., & Harvey, J. (2008). The decline of the world’s IQ. Intelligence, 36, 112–120.
https://doi.org/10.1016/j.intell.2007.03.004
McGill, R. J., Dombrowski, S. C., & Canivez, G. L. (2018). Cognitive profile analysis in school
psychology: History, issues, and continued concerns. Journal of School Psychology, 71, 108–
121. https://doi.org/10.1016/j.jsp.2018.10.007
McGrew, K. S. (1997). Analysis of the major intelligence batteries according to a proposed
comprehensive Gf–Gc framework. In D. P. Flanagan, J. L. Genshaft, & P. L. Harrison (Eds.),
Contemporary intellectual assessment: Theories, tests, and issues (pp. 151–181). New York,
NY: Guilford Press.
McGrew, K. S. (2005). The Cattell–Horn–Carroll theory of cognitive abilities: Past, present, and future.
In D. P. Flanagan & P. L. Harrison (Eds.), Contemporary intellectual assessment: Theories,
tests, and issues (2nd ed., pp. 136–182). New York, NY: Guilford Press.
McGrew, K. S. (2009). CHC theory and the human cognitive abilities project: Standing on the shoulders
of the giants of psychometric intelligence research. Intelligence, 37, 1–10.
McNicholas, P. J., Floyd, R. G., Woods, I. L., Singh, L. J., Manguno, M. S., & Maki, K. E. (2018).
State special education criteria for identifying intellectual disability: A review following revised
diagnostic criteria and Rosa’s Law. School Psychology Quarterly, 33, 75–82.
Miller, C. A., & Gilbert, E. (2008). Comparison of performance on two nonverbal intelligence tests by
adolescents with and without language impairment. Journal of Communication Disorders, 41,
358–371. https://doi.org/10.1016/j.jcomdis.2008.02.003
National Research Council. (2002). Mental retardation: Determining eligibility for social security
benefits. Washington, DC: National Academy Press.
Neukrug, E., & Fawcett, C. (2014). Essentials of testing and assessment: A practical guide for
counselors, social workers, and psychologists. Belmont, CA: Thomson Brooks/Cole.
Nunnally, J. C., & Bernstein, L. H. (1994). Psychometric theory (3rd ed.). New York, NY: McGraw-
Hill.
APPENDIX D: Study 4 168
Petermann, F. (2009). Wechsler Preschool and Primary Scale of Intelligence–Third Edition (WPPSI-
III; German Adaptation). Frankfurt am Main, Germany: Pearson Assessment.
Petermann, F., & Petermann, U. (2011). Wechsler Intelligence Scale for Children–Fourth Edition
(WISC-IV; German adaptation). Frankfurt am Main, Germany: Pearson Assessment.
Rushton, J. P., Brainerd, C. J., & Pressley, M. (1983). Behavioral development and construct validity:
The principle of aggregation. Psychological Bulletin, 94, 18–38. https://doi.org/10.1037/0033-
2909.94.1.18
Schmidt, F. L., Le, H., & Ilies, R. (2003). Beyond alpha: An empirical examination of the effects of
different sources of measurement error on reliability estimates for measures of individual
differences constructs. Psychological Methods, 8, 206–224. https://doi.org/10.1037/1082-
989X.8.2.206
Schneider, W. J., & McGrew, K. S. (2011). Just say no” to averaging IQ subtest scores (applied
psychometrics 101, Technical Report #10). https://doi.org/10.13140/RG.2.2.19863.37289
Spearman, C. E. (1927). The abilities of man: Their nature and measurement. New York, NY:
Blackburn Press.
Sundet, J. M., Barlaug, D. G., & Torjussen, T. M. (2004). The end of the Flynn effect? A study of
secular trends in mean intelligence test scores of Norwegian conscripts during half a century.
Intelligence, 32, 349–362. https://doi.org/10.1016/j.intell.2004.06.004
Tellegen, P. J., Laros, J. A., & Petermann, F. (2012). SON-R 6-40. Snijders–Oomen Nonverbaler
Intelligenztest. [SON-R 6-40 Snijders–Oomen Nonverbal Intelligence Test]. Göttingen,
Germany: Hogrefe.
Thorndike, E. L. (1904). An introduction to the theory of mental and social measurements. Science
Press.
von Aster, M. G., Neubauer, A., & Horn, R. (2006). Wechsler Intelligenztest für Erwachsene (WIE-III).
[German adaptation of the Wechsler Adult Intelligence Scale III]. Frankfurt am Main,
Germany: Harcourt Test Services.
World Health Organization [WHO]. (1990). The International Statistical Classification of Diseases and
Related Health Problems (10th ed.). Geneva, Switzerland: Author.
World Health Organization [WHO]. (2018). International Classification of Diseases for Mortality and
Morbidity Statistics (11th rev.). Retrieved from https://icd.who.int/browse11/l-m/en
Wrulich, M., Brunner, M., Stadler, G., Schalke, D., Keller, U., & Martin, R. (2014). Forty years on:
Childhood intelligence predicts health in middle adulthood. Health Psychology, 33, 292–296.
https://doi.org/10.1037/a0030727
Yin Foo, R., Guppy, M., & Johnston, L. M. (2013). Intelligence assessments for children with cerebral
palsy: A systematic review. Developmental Medicine and Child Neurology, 55, 911–918.
https://doi.org/10.1111/dmcn.12157

APPENDIX D: Study 4 169
Appendix
Table A1. Individual-Level Comparison of Nonverbal Factor Scores
Test comparison N Mdiff SDdiff Diffmin Diffmax IQ10 a (%) CI95 b (%) IDS-2AR and SB5NI 55 11.9 9.5 0 38 52.7 58.2 IDS-2AR and RIASNI 196 11.0 8.1 0 46 53.1 72.4 IDS-2AR and SON-R 6-40 154 13.0 10.3 0 46 50.0 59.7 IDS-2AR and WAIS-IIIPI 30 19.7 12.1 2 44 26.7 33.3 IDS-2AR and WISC-IVPR 114 14.3 10.2 0 46 43.9 58.8 IDS-2AR and WPPSI-IIIPI 24 14.3 9.4 1 34 41.7 41.7 SB5NI and RIASNI 168 11.4 9.1 0 51 56.5 63.1 SB5NI and SON-R 6-40 140 14.6 9.8 0 47 37.9 40.0 SB5NI and WAIS-IIIPI 11 12.5 14.6 1 46 63.6 63.6 SB5NI and WISC-IVPR 139 15.4 10.1 0 43 36.7 42.4 SB5NI and WPPSI-IIIPI 29 11.5 10.1 0 39 55.2 58.6 RIASNI and SON-R 6-40 248 13.1 10.0 0 53 49.6 64.1 RIASNI and WAIS-IIIPI 28 15.4 10.9 0 47 39.3 60.7 RIASNI and WISC-IVPR 200 12.2 8.8 0 42 48.0 71.5 RIASNI and WPPSI-IIIPI 30 11.6 8.9 1 33 60.0 66.7 SON-R 6-40 and WAIS-IIIPI 24 11.9 12.0 1 43 66.7 66.7 SON-R 6-40 and WISC-IVPR 172 9.0 6.3 0 33 61.0 83.1 SON-R 6-40 and WPPSI-IIIPI 18 11.9 8.5 1 28 44.4 66.7 Total sample 1,780 12.61 9.29 0 53 49.3 62.2
Note. IDS-2AR = Intelligence and Development Scales–2, abstract reasoning; SB5NI = Stanford–Binet Intelligence Scales–Fifth Edition, German adaptation, nonverbal intelligence; RIASNI = Reynolds Intellectual Assessment Scales, German adaptation, nonverbal intelligence; SON-R 6-40 = Snijders–Oomen Nonverbal Intelligence Test 6-40, German adaptation; WAIS-IIIPI = Wechsler Adult Intelligence Scale, German adaptation, performance intelligence; WISC-IVPR = Wechsler Intelligence Scales for Children–Fourth Edition, German adaptation, perceptual reasoning; WPPSI-IIIPI = Wechsler Preschool and Primary Scale of Intelligence–Third Edition, German adaptation, performance intelligence; CI = confidence interval. a The percentage of sample participants who reached a difference between each pair of intelligence test scores of less than or equal to 10 IQ points. b The percentage of sample participants with overlapping 95% confidence intervals.

APPENDIX D: Study 4 170
Table A2. Individual-Level Comparison of Verbal Factor Scores
Test comparison N Mdiff SDdiff Diffmin Diffmax IQ10 a (%) CI95 b (%) IDS-2VR and SB5VI 55 8.42 7.09 0 32 70.9 61.8 IDS-2VR and RIASVI 196 8.41 6.63 0 30 69.4 79.1 IDS-2VR and WAIS-IIIVI 30 13.17 7.41 0 29 43.3 53.3 IDS-2VR and WISC-IVVC 113 10.60 8.41 0 45 56.6 64.6 IDS-2VR and WPPSI-IIIVI 24 7.50 7.33 1 27 83.3 83.3 SB5VI and RIASVI 167 8.72 6.21 0 27 66.5 66.5 SB5VI and WAIS-IIIVI 11 11.64 7.24 0 25 45.5 45.5 SB5VI and WISC-IVVC 138 11.37 8.25 0 42 53.6 53.6 SB5VI and WPPSI-IIIVI 29 9.07 6.09 0 22 58.6 62.1 RIASVI and WAIS-IIIVI 28 9.86 6.46 1 25 60.7 71.4 RIASVI and WISC-IVVC 199 9.82 8.12 0 46 62.3 73.9 RIASVI and WPPSI-IIIVI 30 8.10 5.67 0 24 70.0 90.0 Total sample 1,020 9.58 7.29 0 46 62.8 68.6
Note. IDS-2VR = Intelligence and Development Scales–2, verbal reasoning; SB5VI = Stanford–Binet Intelligence Scales–Fifth Edition, German adaptation, verbal intelligence; RIASVI = Reynolds Intellectual Assessment Scales, German adaptation, verbal intelligence; WAIS-IIIVI = Wechsler Adult Intelligence Scale, German adaptation, verbal intelligence; WISC-IVVC = Wechsler Intelligence Scales for Children–Fourth Edition, German adaptation, verbal comprehension; WPPSI-IIIVI = Wechsler Preschool and Primary Scale of Intelligence–Third Edition, German adaptation, verbal intelligence; CI = confidence interval. a The percentage of sample participants who reached a difference between each pair of intelligence test scores of less than or equal to 10 IQ points. b The percentage of sample participants with overlapping 95% confidence intervals.

APPENDIX E: Study 5 171
APPENDIX E: Study 5
Grieder, S., Bünger, A., Odermatt, S. D., Schweizer, F., & Grob, A. (in press). Limited internal score
comparability of general intelligence composites: Impact on external validity, possible predictors, and
practical remedies. Assessment.

APPENDIX E: Study 5 172
Please note that this is the author's version of a work that was accepted for publication in Assessment.
Changes resulting from the publishing process, such as editing, corrections, structural formatting, and
other quality control mechanisms may not be reflected in this document. This article may be used for
noncommercial purposes in accordance with the journal’s conditions.
Limited Internal Comparability of General Intelligence Composites: Impact on External
Validity, Possible Predictors, and Practical Remedies
Silvia Grieder, Anette Bünger, Salome D. Odermatt, Florine Schweizer, and Alexander Grob
Department of Psychology, University of Basel
Author Note
Silvia Grieder provided conceptualization, methodology, formal analysis, writing–original draft,
writing–review and editing, and visualization; Anette Bünger provided conceptualization and writing–
review and editing; Salome D. Odermatt provided writing–review and editing; Florine Schweizer
provided writing–review and editing; Alexander Grob provided conceptualization, resources, writing–
review and editing, and supervision. We have no conflicts of interest to declare. We thank Anita Todd
for copy editing.
Correspondence concerning this article should be addressed to Silvia Grieder, Division of
Developmental and Personality Psychology, Department of Psychology, University of Basel,
Missionsstrasse 62, 4055 Basel, Switzerland. Email: [email protected]

APPENDIX E: Study 5 173
Abstract
Research on comparability of general intelligence composites (GICs) is scarce and has focused
exclusively on comparing GICs from different test batteries, revealing limited individual-level
comparability. We add to these findings, investigating the group- and individual-level comparability of
different GICs within test batteries (i.e., internal score comparability), thereby minimizing transient
error and ruling out between-battery variance completely. We (a) determined the magnitude of
intraindividual IQ differences, (b) investigated their impact on external validity, (c) explored possible
predictors for these differences, and (d) examined ways to deal with incomparability. Results are based
on the standardization samples of three intelligence test batteries, spanning from early childhood to late
adulthood. Despite high group-level comparability, individual-level comparability was often
unsatisfactory, especially towards the tails of the IQ distribution. This limited comparability has
consequences for external validity, as GICs were differentially related to and often less predictive for
school grades for individuals with high IQ differences. Of several predictors, only IQ level and age were
systematically related to comparability. Consequently, findings challenge the use of overall internal
consistencies for CIs and suggest using CIs based on test–retest reliabilities or age- and IQ-specific
internal consistencies for clinical interpretation. Implications for test construction and application are
discussed.
Keywords: general intelligence, IQ, screening, individual level, reliability, validity

APPENDIX E: Study 5 174
Introduction
General intelligence is defined as the broad mental capacity to reason, solve problems,
comprehend complex ideas, and learn quickly (Gottfredson, 1997). It predicts numerous important life
outcomes, including academic achievement (Lubinski, 2004; Roth et al., 2015), occupational success,
socioeconomic status, income (Batty et al., 2009; Gottfredson, 2004; Lubinski, 2004), health, and
longevity (Batty et al., 2009; Gottfredson & Deary, 2004).
The concept of general intelligence was first introduced by Charles Spearman as a common
factor explaining the positive manifold of cognitive test outcomes—psychometric g (Spearman, 1904).
Since Spearman, research on intelligence structure has moved to hierarchical models, but the majority
of these models still includes a general intelligence factor. The currently perhaps most influential
intelligence model, the Cattell–Horn–Carroll (CHC) model (McGrew, 1997, 2009; Schneider &
McGrew, 2018), assumes a three-stratum structure with narrow abilities at the bottom that are indicators
of broad abilities (such as fluid reasoning, comprehension–knowledge, perceptual speed), which are in
turn influenced by a general factor. Although the existence of a general factor is open to debate in the
CHC taxonomy (e.g., McGrew, 2009), virtually all intelligence tests whose development was based on
the CHC model—and almost all intelligence tests in general—include a Full-Scale IQ (FSIQ) as an
indicator of general intelligence that typically is a composite score of many diverse or of all subtests
from a test battery. To avoid an intertwining of the theoretical construct of general intelligence and its
measurement, we refer to the theoretical construct as general intelligence, to the latent measure of
general intelligence as general factor, and to a (unit-weighted) subtest composite intended to measure
general intelligence as general intelligence composite (GIC).
As most intelligence tests include a GIC, a major question in test construction concerns the
determinants of a reliable and valid measurement of general intelligence. A recent study by Farmer et
al. (2020) investigated such determinants by comparing the reliability and accuracy of different
intelligence composites from two test batteries. They systematically varied the heterogeneity, general
factor loadings (both separately and in combination), and number of subtests and found that, as a single
criterion, high general factor loadings were more important than heterogeneity for an accurate
composite. The most accurate composites were those derived from numerous (12 to 13) diverse subtests
with high general factor loadings, but the gains in reliability and accuracy began to flatten out from
about four subtests on. Yet, as the authors pointed out, small gains in reliability are of practical
relevance, as they can have substantial effects on confidence intervals (CIs) and hence on comparability
on an individual level (i.e., overlap of CIs). It is therefore important to investigate individual-level in
addition to group-level comparability to learn more about the accuracy of different composites.
There are different kinds of score comparability or score linking, all of which technically
require the application of a specific linking function (Dorans & Holland, 2000; Holland, 2007).
However, the composite scores from intelligence tests are seldomly linked directly using an explicit
linking function. Rather, the different composites are standardized separately and it is presumed that

APPENDIX E: Study 5 175
different composites intended to measure the same construct, for example, general intelligence, will be
equal or exchangeable. At least this is how these scores are applied in practice, where often one test is
selected from a variety of different tests purporting to measure the same construct(s) and the resulting
test score is interpreted as if it would have been the same (or at least very similar, considering
measurement error) on any of the other tests. However, for scores to be regarded equal, at least five
requirements have to be fulfilled that not necessarily hold for different GICs: (a) the same construct
requirement, (b) the equal reliability requirement, (c) the symmetry requirement, (d) the equity
requirement, and (e) the population invariance requirement (Dorans & Holland, 2000).
The same construct requirement holds that two tests need to measure the same theoretical
construct, which requires this to be carefully defined based on a sound theory providing clear guidance
for test development at the item level (Beaujean & Benson, 2019; Maul et al., 2019). We would assume
that most concurrent intelligence tests will fail this requirement, at least for GICs. The equal reliability
requirement is also often violated, especially when comparing scales of different length, but violations
of this requirement are less important if reliabilities are high (Dorans & Holland, 2000). For intelligence
tests, internal consistencies are usually very high and unreliability is often addressed using CIs.
However, the question remains whether internal consistencies sufficiently capture the tests’
measurement error (see below). The symmetry requirement is usually met by definition (Dorans &
Holland, 2000) and therefore not of interest for our study. The equity requirement concerns the
exchangeability of test results and holds that an individual test outcome should be the same no matter
which of the compared tests is used. It is this requirement that prior studies on individual-level
comparability of GICs were most concerned with and that we mostly focus on in our study as well.
Finally, the population invariance requirement holds that the compared scores should be equally
comparable across all different (sub-)populations the tests are intended for use. Violations of this
requirement can be indicative of violations of the same construct and/or the equal reliability
requirements (Dorans & Holland, 2000). It is tested by comparing the comparability of test results
across specific subgroups of the whole population, which is what we did in the present study. To clarify
whether it is justified to regard different GICs to be equal in the sense of Dorans and Holland (2000)—
henceforth called comparable—it is thus important to investigate the degree to which the
aforementioned requirements are fulfilled for these GICs.
The few studies we know of that dealt with the comparability of GICs in this sense performed
individual-level comparisons between GICs derived from different test batteries (Bünger et al., 2021;
Floyd et al., 2008; Hagmann-von Arx et al., 2018). These revealed substantial intraindividual absolute
differences in GICs on an IQ scale—henceforth called IQ differences—and limited comparability of
CIs and IQs in nominal categories. All three of the aforementioned studies concluded that any two
intelligence tests do not necessarily render comparable FSIQs on the individual level, even if they show
high correlations and no mean differences on the group level. Results from all three studies thus indicate
violations of the equity requirement.

APPENDIX E: Study 5 176
We add to these previous findings with the present study, in which we investigated the
individual-level internal comparability of different GICs, that is, of different composites derived from
the same test battery that are all intended to measure general intelligence. Proceeding this way, transient
error (i.e., error due to variations in mood, information-processing efficiency, etc. over time; see
Schmidt et al., 2003) as well as differences in examiner influences are kept to a minimum as all scores
stem from a single test session, and between-battery variance (i.e., the standardization sample and
differences in global test characteristic, such as general instructions, type of presentation) is held
constant. Internal comparability analyses also have the advantage that they practically eliminate
carryover effects, that is, the influence of practice effects on scores on a second test if this includes very
similar tasks to the first test. For the purpose of internal comparability analyses, the comparison between
the FSIQ and an Abbreviated Battery IQ (ABIQ) from the same test battery is well suited. While the
FSIQ is typically based on many or all subtests, an ABIQ is based on a subset of subtests and is thus
typically less reliable than the FSIQ and intended as a screening. After practitioners have administered
an ABIQ, their decision as to whether the rest of the test battery will also be administered is often based
on the screening results (Thompson et al., 2004). It is therefore important to investigate the individual-
level comparability of FSIQ and ABIQ.
In the present study, we examined this internal comparability of GICs—mainly FSIQ and
ABIQ—in four steps. First, we determined the magnitude of intraindividual IQ differences between the
GICs; second, we investigated the impact of these differences by comparing the GICs’ external validity;
third, we examined possible predictors of these differences; and fourth, we sought ways to deal with
incomparability.
Given imperfect reliability and results from Floyd et al. (2008), Hagmann-von Arx et al. (2018),
and Bünger et al. (2021), we expected to find at least some IQ differences. To examine the possible
impact of such differences on external validity, we determined the GICs’ differential relationships with
school grades. As general intelligence measures are strong predictors of scholastic achievement and
academic success (Deary et al., 2007; Gygi et al., 2017; Roth et al., 2015; Watkins et al., 2007), these
criteria are typically used for external validation of intelligence tests. In our study, we focused not on
the absolute magnitude of relationships between GICs and school grades but rather on possible
differences in magnitude of relationships between the FSIQ and school grades and the ABIQ and school
grades. While the former has been studied extensively (see above), to our knowledge, effect sizes of
the FSIQ and the ABIQ have never been compared explicitly, which is what we did in the present study.
After having determined the magnitude and impact of IQ differences, we were interested in
possible predictors of these. Results from previous studies suggest that most of the error variance in IQs
is systematic (Irby & Floyd, 2016, 2017). To learn more about the sources of systematic variation in IQ
differences, we explored several possible predictors of IQ differences. These include variables already
considered in previous studies (Bünger et al., 2021; Hagmann-von Arx et al., 2018), such as IQ level
and age, as well as other, not yet examined characteristics of the testee and their behavior in the test

APPENDIX E: Study 5 177
situation. If characteristics of the testee should explain some variation in IQ differences, this would
indicate a failure of the population invariance requirement. Characteristics of the composite, such as
the number, general factor loadings, and content of subtests involved, might also predict IQ differences,
as these characteristics influence the accuracy of composites (see Farmer et al., 2020). Because these
characteristics are invariant between individuals, inclusion in quantitative analyses was not possible
here. Hence, we address them in a descriptive manner only.
As a last step, we explored possible ways to deal with incomparability. To this end, we
examined alternative ways of describing intelligence test results other than exact IQ scores, aiming to
achieve more reliable and stable estimates that may meet the equality requirements to a greater extent.
Obvious candidates that were also examined in previous studies (Bünger et al., 2021; Floyd et al., 2008;
Hagmann-von Arx et al., 2018) are CIs and nominal categories (e.g., “average” for an IQ between 85
and 115). In all three studies mentioned above, however, CIs were computed solely on the basis of an
overall internal consistency, which reflects the most common use in practice. Results from these studies
suggest that using such CIs still does not lead to satisfactory comparability. As an extension to these
previous studies, we therefore varied the reliability coefficients used for the calculation of CIs. It is
known that test–retest reliability tends to be lower at younger ages (Watkins & Smith, 2013) and toward
the tails of the IQ distribution (due to regression to the mean; Campbell & Kenny, 1999). Considering
floor and ceiling effects, the same might also be true for internal consistency. If this was the case, using
CIs based on separate internal consistency coefficients for age and IQ groups—henceforth called age-
and IQ-specific internal consistencies—should lead to higher rates of comparability between IQs
compared to using CIs based on the same overall internal consistency for all participants. This
assumption is supported by results from Bünger et al. (2021), who found that IQ level was a significant
predictor of IQ differences. A possible influence of age on comparability was not investigated by Floyd
et al. (2008) and Hagmann-von Arx et al. (2018), and age was no systematic predictor for IQ differences
in regression analyses reported in Bünger et al. (2021). However, as Bünger et al. (2021) concluded,
further analyses with larger age groups are warranted to learn more about IQ comparability across age,
which was possible in the present study. Hence, we investigated comparability across IQ level and age
for all criteria, and we examined comparability for CIs based on age- and IQ-specific internal
consistencies. Moreover, using internal consistency as a reliability estimate bears the danger of
overestimating reliability, as it misses transient error (see above; Schmidt et al., 2003). This source of
error is, however, assessed in test–retest reliability, which is why we also considered CIs based on test–
retest reliability coefficients in our study.
Present Study
The primary objective of this study was to investigate the individual-level internal
comparability of different GICs. For this purpose, we compared GICs (mostly FSIQ vs. ABIQ) derived
from the same test battery for participants from the standardization samples of three test batteries,
spanning from early childhood to late adulthood: The Intelligence and Development Scales–2 (IDS-2;

APPENDIX E: Study 5 178
Grob & Hagmann-von Arx, 2018a), and the German adaptations of the Stanford–Binet Intelligence
Scales–Fifth Edition (SB5; Grob et al., 2019b) and the Reynolds Intellectual Assessment Scales (RIAS;
Hagmann-von Arx & Grob, 2014a). Since comparisons of GICs from different intelligence tests were
not an aim of this study, we exclusively compared GICs within these test batteries. To learn more about
the impact of, possible predictors for, and ways to deal with incomparability, secondary objectives of
this study were to examine the differential external validity of GICs, to identify predictors of IQ
differences, and to see if individual-level comparability could be enhanced by varying reliability
coefficients for the calculation of 95% CIs.
We addressed the following hypotheses and research questions: First, we expected that (a) the
GICs for each test battery would be highly intercorrelated, and (b) there would be no significant mean
differences between GICs. Second, we examined the magnitude of intraindividual differences in IQ
points (both overall and across IQ level and age). Third, we hypothesized that relationships of school
grades with the ABIQ would be smaller compared to those with the FSIQ. Fourth, we examined whether
certain characteristics of the testee (e.g., age) or their behavior in the test situation (e.g., understanding
of instructions) were associated with IQ differences. Finally, we examined how many participants
would achieve comparable intelligence estimates (again both overall and across IQ level and age)
determined with different criteria (i.e., different 95% CIs and nominal categories). We expected higher
comparability for CIs based on age- and IQ-specific internal consistencies and test–retest reliabilities
compared to CIs based on one overall internal consistency coefficient. Supplementary material to this
study, including analysis scripts, is available at https://osf.io/hfqe5/.
Method
Participants
The IDS-2 standardization sample consists of 1,672 participants from Switzerland, Germany,
and Austria. Complete data on all GICs were available for 1,622 participants (50.9% girls and women;
age in years: M = 12.06, SD = 4.40, range: 5.02–20.97). About one third (31.4%) of participants’
mothers had a university degree, 16.5% of participants were bilingual (German and at least one other
native language), 7.6% were nonnative speakers (German not their native language), and 3.4% reported
having an attention-deficit/hyperactivity disorder (ADHD) or attention-deficit disorder (ADD)
diagnosis (hereafter called AD[H]D). For a subsample of 414 individuals (50.7% girls and women; age
in years: M = 12.07, SD = 2.59, range: 5.42–19.37), there were additional cross-sectional data on school
grades.
The SB5 standardization sample consists of 1,829 participants from Switzerland, Germany,
Austria, and Liechtenstein. Complete data on all GICs were available for all 1,829 participants (51.4%
girls and women; age in years: M = 23.46, SD = 20.02, range: 4.00–83.96). Around one third (29.4%)
of participants—or for children and adolescents, their mothers—had a university degree, 8.8% of
participants were bilingual (German and at least one other native language), 7.8% were nonnative

APPENDIX E: Study 5 179
speakers (German not their native language), and 2.9% reported having an AD(H)D diagnosis. For a
subsample of 249 individuals (47.4% girls; age in years: M = 11.31, SD = 2.38, range: 5.79–17.68),
there were additional cross-sectional data on school grades.
The RIAS standardization sample consists of 2,145 participants from Switzerland and
Germany. Complete data on all GICs were available for 2,109 participants (49.5% girls and women;
age in years: M = 19.84, SD = 20.28, range: 3.00–99.96). About one fifth (20.7%) of participants—or
for children and adolescents, their mothers—had a university degree, and 17.9% of participants were
nonnative speakers (German not their native language). For a subsample of 64 individuals, there were
additional data on school grades collected 2 to 4 years after the intelligence assessment (51.6% girls;
age in years at T1: M = 9.02, SD = 1.02, range: 6.07–11.22, and at T2: M = 11.41, SD = 0.99, range:
9.00–14.00).
Materials
Intelligence Test Batteries
The IDS-2 assess cognitive (intelligence, executive functions) as well as developmental
(psychomotor skills, socioemotional skills, basic skills, and motivation and attitude) in 5- to 20-year-
olds with a total of 30 subtests (Grob & Hagmann-von Arx, 2018a; see Table S1 for descriptions). The
IDS-2 allow for the estimation of three different GICs. The Profile IQ (an Extended Battery IQ,
henceforth called IDS-2EBIQ(14)) is based on all 14 subtests that also constitute a profile of the following
seven broad abilities, each estimated by two subtests: Visual Processing, Processing Speed, Auditory
Short-Term Memory, Visual-Spatial Short-Term Memory, Long-Term Memory, Abstract Reasoning,
and Verbal Reasoning. The first seven subtests (one per broad ability) constitute a GIC without a factor
profile–the FSIQ (IDS-2FSIQ(7)). Additionally, the two subtests with the highest general factor loadings
in a confirmatory factor analysis of the first seven subtests—Completing Matrices and Naming
Categories—constitute the ABIQ (IDS-2ABIQ(2)).1 Finally, the IDS-2 include a rating of the participation
of the testee during testing with 12 questions answered by the test administrator at the end of the
intelligence, executive functions, and developmental functions assessments. Here, we used the answers
on the intelligence assessment only.
The SB5 are an intelligence test battery for 4- to 83-year-olds that include a total of 10 subtests
(Grob et al., 2019b; see Table S1 for descriptions). The following five broad abilities can be estimated
based on one verbal and one nonverbal subtest each: Fluid Reasoning, Knowledge, Quantitative
Reasoning, Visual-Spatial Processing, and Working Memory. Additionally, the five verbal and five
1 This distinction of an extended battery (in the IDS-2: 14 subtests), a standard battery (in the IDS-2: seven
subtests), and an abbreviated battery (in the IDS-2: two subtests) is also made in other test batteries, for example
the Woodcock–Johnson IV (WJIV, Schrank et al., 2014) and the Universal Nonverbal Intelligence Test 2 (UNIT
2; Bracken & McCallum, 2016). The abbreviated battery is typically intended for screening purposes, the standard
battery as an accurate and yet time efficient measure for diagnostic purposes, and the extended battery as a
comprehensive measure that typically enables more or better-defined subscale scores (e.g., Schrank et al.,
2014) and/or a more reliable and valid measure of general intelligence to be used for high-stakes decisions
(e.g., Bracken & McCallum, 2016).

APPENDIX E: Study 5 180
nonverbal subtests are used for a Verbal and a Nonverbal IQ. All 10 subtests are used for an FSIQ
(SB5FSIQ(10)) and the two routing subtests—Nonverbal Fluid Reasoning and Verbal Knowledge—
constitute the ABIQ (hereafter called the SB5ABIQ(2)). Finally, the SB5 include a rating of the
participant’s understanding of instructions and cooperation in the test situation with one question each
answered by the test administrator at the end of the test session.
The RIAS measure verbal and nonverbal intellectual abilities as well as memory with two
subtests each (six in total) in 3- to 99-year-olds (Hagmann-von Arx & Grob, 2014a; see Table S1 for
descriptions). The two corresponding subtests are used to form a Verbal Intelligence Index, a Nonverbal
Intelligence Index, and a Memory Index. All four intelligence subtests are used for an FSIQ
(RIASFSIQ(4)). Additionally, one verbal and one nonverbal intelligence subtest—Guess What and Odd-
Item Out—constitute the Reynolds Intellectual Screening Test (RIST; hereafter called the RIASABIQ(2)).
Having seven available GICs thus enabled five comparisons: three for the IDS-2, one for the
SB5, and one for the RIAS. The FSIQs from all three test batteries differ from each other in terms of
number and content of subtests, whereas all ABIQs consist of one subtest each measuring fluid
reasoning and comprehension knowledge (see Table 1). For the IDS-2EBIQ(14) and IDS-2FSIQ(7), as well
as for the RIASFSIQ(4) and RIASABIQ(2), only the number of subtests, and not the content, differs, as the
corresponding GICs tap the same broad abilities in equal shares. In contrast, for the IDS-2EBIQ(14)/IDS-
2FSIQ(7) and IDS-2ABIQ(2), as well as for the SB5FSIQ(10) and SB5ABIQ(2), content and number of subtests
differ.
Participant and Parent Questionnaires
Adolescent and adult participants and/or—for children and adolescents—their parents reported
on demographic variables, including age, sex, education (additionally for children and adolescents:
education of the parents), native language, and psychological and physical abnormalities (including
AD[H]D). In an additional questionnaire, some parents reported their child’s school grades in German
(instructional language), mathematics, social studies, geography and history (combined), and science
from the last two school semesters.
Procedure
Participants were recruited through schools and psychosocial institutions for children and
adolescents in Switzerland, Germany, and Austria. For the IDS-2, administration of the whole test
battery took between 3 and 4 h and, if necessary, could be split into two sessions no more than 1 week
apart. Administration of the intelligence part alone took approximately 1.5 h and was completed within
one test session. For the SB5, administration took 1.5 to 2 h and for the RIAS it took around 30 to 40
min. Written consent was obtained from children and adolescents (10 years and older) and/or from their
parents (5- to 15-year-olds). The demographic questionnaire was administered at the beginning of the
first session. The parental report of school grades was completed at home either within weeks after the
session (IDS-2 and SB5) or as part of a follow-up study 2 to 4 years after the intelligence assessment
(RIAS). Participants from Switzerland received a gift card of their own choice worth 30 (IDS-2) or 20

APPENDIX E: Study 5 181
(SB5 and RIAS) Swiss francs and participants from Germany and Austria received 25 (IDS-2) or 12
(SB5 and RIAS) euros in cash for participation.
Table 1. Number, Position, and Content of Subtests, and Reliabilities and Widths of 95% CIs for Each GIC
Internal consistency Width of 95% CI
GIC # of Subt.
Pos. in Test Seq.
Content Overlap (%)
CHC Broad Abilities Tapped Overall a
Age-specific a
Age- and IQ-level-specific b rtt a 95CI 95CIage 95CIageIQ 95CIrtt
IDS-2EBIQ(14) 14 1–14 100 Gf, Gc, Gsm, Gv, Glr, Gs .98 .95–.97 .67–.98 .85 8 10–13 8–28 21
IDS-2FSIQ(7) 7 1–7 44 Gf, Gc, Gsm, Gv, Glr, Gs .97 .92–.95 .54–.97 .89 10 12–16 10–30 19
IDS-2ABIQ(2) 2 6, 7 38 Gf, Gc .95 .83–.90 .53–.92 .86 13 17–23 15–30 21
SB5FSIQ(10) 10 1–10 50 Gf, Gc, Gsm, Gv, Gq .99 .93–.98 .45–.96 .94 6 8–16 10–30 14
SB5ABIQ(2) 2 1, 2 Gf, Gc .97 .76–.93 .30–.93 .86 10 15–26 15–30 21
RIASFSIQ(4) 4 1–4 100 Gf, Gc .95 .93–.97 .55–.96 .88 13 10–16 11–30 19
RIASABIQ(2) 2 1, 2 Gf, Gc .93 .90–.94 .51–.96 .87 15 13–18 12–30 20
Note. Content overlap was calculated by dividing the number of subtests tapping the same broad abilities for both GICs by the total number of subtests over both GICs and multiplying this decimal by 100. Each content overlap
percentage concerns the respective GIC and the one in the row below (for the IDS-2ABIQ(2): the IDS-2EBIQ(14)).
CHC broad ability assignments are based on information in the test manuals and descriptions in McGrew (2009,
Table 1). Mean test–retest intervals were 24 days (IDS-2), 22 days (SB5), and 19 days (RIAS). Age- and IQ-
level-specific internal consistencies: IQ groups: <85, 85–115, >115; age groups: IDS-2: 5–6, 7–8, 9–12, 13–15,
16–20 years, SB5: <7, 7–8, 9–12, 13–15, 16–20, 21–29, 30–59, ≥ 60 years, RIAS: 3–4, 5–6, 7–8, 9–12, 13–15,
16–20, 21–59, ≥ 60 years. GIC = general intelligence composite; CI = confidence interval; # of Subt. = number
of subtests; Pos. in Test Seq. = position in test sequence; CHC = Cattell–Horn–Carroll; rtt = test–retest reliability; 95CI = 95% CI with overall internal consistencies; 95CIage = 95% CI with age-specific internal consistencies;
95CIageIQ = 95% CI with age- and IQ-level-specific internal consistencies; 95CIrtt = 95% CI with test–retest
reliability; EBIQ = Extended Battery IQ; FSIQ = Full-Scale IQ; ABIQ = Abbreviated Battery IQ; IDS-2 =
Intelligence and Development Scales–2; SB5 = Stanford–Binet Intelligence Scales–Fifth Edition, German
adaptation; RIAS = Reynolds Intellectual Assessment Scales, German adaptation; Gf = fluid reasoning; Gc =
comprehension knowledge; Gsm = short-term memory; Gv = visual processing; Glr = long-term memory and
retrieval; Gs = cognitive processing speed; Gq = quantitative knowledge. a Derived from manuals. Based on Cronbach’s alphas (IDS-2 and RIAS) or split-half reliabilities (SB5). b Computed according to the manuals with a formula provided by Lienert and Raatz (1998, p. 330) based on
Cronbach’s alphas (IDS-2 and RIAS) or split-half reliabilities (SB5).
Statistical Analyses
All analyses were conducted in R (R Core Team, 2020). The complete analysis code is available
at https://osf.io/hfqe5/. Within each test battery, we first inspected group-level comparability of GICs
with Pearson correlations (both uncorrected and corrected for unreliability of both GICs) and paired
samples t tests. For individual-level comparability, we then calculated intraindividual absolute
differences in IQ points. To compare the GICs’ external validity, we performed linear regressions of
school grades on GICs. All grades were transformed into Swiss school grades, ranging from 1 (lowest)
to 6 (highest). In our study, we focused on grades in German and mathematics as well as on the grade
point average (GPA). The GPA was computed as the average of all reported grades for each participant.
As the GICs were expected to be highly correlated, we included them in separate models and compared
the resulting R2s and 95% CIs for standardized regression coefficients (betas). Because the models were

APPENDIX E: Study 5 182
not nested, we could not determine the significance of the change in R2. Instead, following Cumming
(2009), we regarded two betas as significantly different from one another if their 95% CIs overlapped
to a degree of 50% or less.
We explored several possible predictors of IQ differences, specifically, age, sex, AD(H)D (yes
vs. no), native language (monolingual German [reference] vs. bilingual and vs. other native language),
IQ level (average [85 ≤ IQ ≤ 115, reference] vs. below average [IQ < 85] and vs. above average [IQ >
115]), education of the participant or—for children and adolescents—of their mother (university degree
vs. no university degree), participation in the test situation (for IDS-2; age-standardized scores with M
= 10 and SD = 3), cooperation in the test situation (for SB5; yes vs. no/partly), understanding of
instructions (for SB5; yes vs. no/partly), and the interaction between IQ level and age. We used gamma
generalized linear models with a log link function to model IQ differences. In contrast to a classic linear
regression, with a normally distributed dependent variable (Gaussian family) and an identity link
function (g(u) = u), the generalized linear models we used model a gamma-distributed dependent
variable (Gamma family) with a log link function (g(u) = log(u); see, for example, McElreath, 2015 for
more information on generalized linear models). Using such gamma generalized linear models, we
could best account for the strongly right-skewed, non-negative and continuous distribution of the
dependent variables of absolute IQ differences (see Figure S1). Following suggestions from Gelman
(2008), we standardized all predictor variables by dividing by 2 SDs. This way, regression coefficients
are directly comparable in size between continuous and binary predictors. We deemed an effect
significant if both the overall model (determined with a likelihood ratio test) and the predictor were
significant at an alpha level of .05. To illustrate the variation of IQ differences across IQ level and age,
we compared the resulting difference scores across IQ level (including six IQ groups: < 70, 70–84, 85–
99, 100–114, 115–129, ≥ 130; see Figure S3) and across age (including different age groups depending
on the test battery; see Figure S4). The IQ groups were based on the GIC with the largest number of
subtests for each test battery (i.e., the IDS-2EBIQ(14), SB5FSIQ(10), and RIASFSIQ(4)). The same GICs were
used for the predictor of IQ level in regression analyses.
To explore ways to deal with incomparability, we computed 95% CIs using the standard error
of estimate together with the estimated true score (Lord & Novick, 1968; see also Dudek, 1979). For
each test battery, we then calculated the percentage of participants for whom the 95% CIs for the IQs
overlapped. We varied the reliability coefficients used for the calculation of 95% CIs to investigate their
influence on individual-level comparability. The 95% CIs were based on overall internal consistencies
(95CI; for IDS-2 and RIAS: Cronbach’s alphas and for SB5: split-half reliabilities), age-specific
internal consistencies (95CIage; see Table S9 for age groups), and test–retest reliabilities (95CIrtt)
obtained from the test manuals (Grob & Hagmann-von Arx, 2018b; Grob et al., 2019a; Hagmann-von
Arx & Grob, 2014b; see Table 1 for reliabilities and CIs).
Additionally, we calculated 95% CIs based on age- and IQ-specific internal consistencies
according to the manuals using a formula provided by Lienert and Raatz (1998, p. 330; 95CIageIQ; e.g.,

APPENDIX E: Study 5 183
for 5- to 6-year-olds with IQ < 85; see Table 1 for IQ and age groups). Finally, we investigated the
comparability of the IQs’ corresponding nominal categories (NomIQ; < 70 = lower extreme, 70–84 =
below average, 85–115 = average, 116–130 = above average, > 130 = upper extreme; see also Grob et
al., 2013) as well as the comparability of the 95% CIs with overall internal consistencies in nominal
categories (NomCI; e.g., average to above average for an interval of 112 to 120). For each of these six
resulting criteria—95CI, 95CIage, 95CIageIQ, 95CIrtt, NomIQ, and NomCI—two IQs were deemed
comparable on an individual level if their intervals overlapped. Just as for IQ differences, we compared
the percentages of participants with overlapping intervals across IQ level and age using the same groups.
Results
Group-Level Analyses
The seven GICs considered were normally distributed; their means were close to 100 (99.53 to
100.11) and standard deviations close to 15 (14.49 to 15.11, see Table 2). The IDS-2FSIQ(7) had the
narrowest range with 55 to 142, and the RIASABIQ(2) had the widest range with 40 to 160. We compared
the GICs within each test battery using t tests and Pearson correlations and found very small mean
differences that were non-significant in all but one case (d = -0.002 for the IDS-2FSIQ(7) vs. the IDS-
2ABIQ(2) to d = 0.031 for the RIASFSIQ(4) vs. the RIASABIQ(2); the latter being significant, t(2108) = 3.73,
p < .001). Intercorrelations both uncorrected and corrected for unreliability of both IQs were all
significant and high to very high (r = .76 for the SB5FSIQ(10) and the SB5ABIQ(2) to r = .95 for the IDS-
2EBIQ(14) and the IDS-2FSIQ(7), and rcorr = .77 for the SB5FSIQ(10) and the SB5ABIQ(2) to rcorr = .99 for the
RIASFSIQ(4) and the RIASABIQ(2), all with p < .001).
Table 2. Descriptive Statistics, Paired-Samples t Tests and Pearson Correlations, and Intraindividual Absolute Differences in IQs
GIC M SD Range Skewness Kurtosis t Cohen’s d r rcorr Mdiff Mddiff Rangediff
IDS-2EBIQ(14) 100.04 14.70 55–145 -0.49 0.65 -0.61 -0.01 .95 *** .98 *** 3.68 3 0–20
IDS-2FSIQ(7) 100.11 14.79 55–142 -0.44 0.48 -0.12 -0.00 .82 *** .86 *** 7.00 6 0–39
IDS-2ABIQ(2) 100.08 15.11 55–144 -0.30 0.10 -0.12 -0.00 .77 *** .80 *** 7.94 7 0–37
SB5FSIQ(10) 99.96 14.80 55–145 -0.02 0.22 -0.18 -0.00 .76 *** .77 *** 8.12 7 0–38
SB5ABIQ(2) 99.92 14.95 55–145 -0.06 0.00
RIASFSIQ(4) 99.53 14.77 45–158 -0.49 0.91 3.73 *** 0.03 .93 *** .99 *** 4.37 4 0–20
RIASABIQ(2) 99.98 14.49 40–160 -0.79 1.63
Note. IDS-2: N = 1,622; SB5: N = 1,829; RIAS: N = 2,109. The last six columns refer to the comparison between the respective GIC and the one in the row below it (for the IDS-2ABIQ(2): with the IDS-2EBIQ(14)). Cohen’s d was calculated using the formula from Dunlap, Cortina, Vaslow, and Burke (1996) for paired samples. GIC = general
intelligence composite; EBIQ = Extended Battery IQ; FSIQ = Full-Scale IQ; ABIQ = Abbreviated Battery IQ;
IDS-2 = Intelligence and Development Scales–2; SB5 = Stanford–Binet Intelligence Scales–Fifth Edition,
German adaptation; RIAS = Reynolds Intellectual Assessment Scales, German adaptation; rcorr = Pearson correlation corrected for unreliability of both GICs; Mdiff/Mddiff/Rangediff = Mean/Median/Range of intraindividual absolute IQ difference. ***p < .001.

APPENDIX E: Study 5 184
Intraindividual Differences
The mean (and median) intraindividual absolute differences ranged between 3.68 (Mdn = 3) IQ
points for the IDS-2EBIQ(14) versus the IDS-2FSIQ(7) and 8.12 (Mdn = 7) IQ points for the SB5FSIQ(10) versus
the SB5ABIQ(2), with ranges between 0 and 20 (IDS-2EBIQ(14) vs. IDS-2FSIQ(7) and RIASFSIQ(4) vs.
RIASABIQ(2)) and 0 and 39 IQ points (IDS-2FSIQ(7) vs. IDS-2ABIQ(2); see Table 2). The relative differences
were normally distributed around 0 (see Figure S2). Absolute differences across IQ groups and age are
displayed in Figures S3 and S4, respectively (see also Table S2). For most comparisons, differences
tended to increase with higher IQs and for the IDS-2EBIQ(14) versus the IDS-2FSIQ(7) and the RIASFSIQ(4)
versus the RIASABIQ(2), they tended to decrease with lower IQs. Regarding age, differences were lowest
for middle childhood for the SB5FSIQ(10) versus the SB5ABIQ(2), but highest for the same age period for
the RIASFSIQ(4) versus the RIASABIQ(2). Otherwise, differences showed little variation across age.
Differential Relationships With School Grades
To compare the GICs’ external validity, we investigated their differential relationships with
school grades in German and mathematics, and with the GPA. Comparisons of 95% CIs for the betas
revealed that the relationship with the FSIQ was significantly higher than that with the ABIQ only for
the SB5 and mathematics (see Figure S5 and Table S3).
In a post hoc analysis, we repeated the external validity analyses for subsamples with small
(below median) and large (above median) IQ differences to see how incomparability might affect
external validity (see Figure 1 and Table S4). For individuals with small IQ differences, we found small
to medium relationships that were all highly significant (β = .29 for the IDS-2FSIQ(7) and German to β =
.52 for the RIASABIQ(2) and German, all with p < .001), and there were no significant differences in betas
between the GICs. For individuals with large IQ differences, however, betas were still significant for
the IDS-2 and SB5 (β = .18, p = .008 for the IDS-2ABIQ(2) and mathematics to β = .46, p < .001 for
SB5FSIQ(10) and mathematics), but lower for the SB5 and no longer significant for the RIAS (β = .01, p
= .965 for the RIASFSIQ(4) and mathematics to β = .12, p = .483 for the RIASABIQ(2) and mathematics).
For the IDS-2 and SB5, relationships with the ABIQ were also consistently smaller compared to those
with the FSIQ and the EBIQ, although for both, this difference in betas was only significant for
mathematics (see Figure 1).

APPENDIX E: Study 5 185
Figure 1. Comparison of 95% Confidence Intervals for Standardized Beta Coefficients for General Intelligence Composites Predicting School Grades in German and Mathematics and Grade Point
Average (GPA)
Note. The samples were split into subsamples with participants with intraindividual absolute differences in IQs below (IDS-2: n = 203, SB5: n = 122, RIAS: n = 29) and above (IDS-2: n = 211, SB5: n = 127, RIAS: n = 35) the median. A difference in betas was deemed significant if confidence intervals overlapped to a maximum of 50%
(indicated in red). Significant betas are in black, nonsignificant betas in gray. Data for the IDS-2 and SB5 are
cross-sectional; data for the RIAS are longitudinal. IDS-2 = Intelligence and Development Scales–2; SB5 =
Stanford–Binet Intelligence Scales–Fifth Edition, German adaptation; RIAS = Reynolds Intellectual Assessment
Scales, German adaptation; EBIQ = Extended Battery IQ; FSIQ = Full-Scale IQ; ABIQ = Abbreviated Battery
IQ.
IDS−2: Below Median
−.40
−.20
.00
.20
.40
.60
.80
German Mathematics GPAEBIQ EBIQ EBIQFSIQ FSIQ FSIQABIQ ABIQ ABIQ
b
IDS−2: Above Median
−.40
−.20
.00
.20
.40
.60
.80
German Mathematics GPAEBIQ EBIQ EBIQFSIQ FSIQ FSIQABIQ ABIQ ABIQ
b
SB5: Below Median
−.40
−.20
.00
.20
.40
.60
.80
German Mathematics GPAFSIQ FSIQ FSIQABIQ ABIQ ABIQ
b
SB5: Above Median
−.40
−.20
.00
.20
.40
.60
.80
German Mathematics GPAFSIQ FSIQ FSIQABIQ ABIQ ABIQ
b
RIAS: Below Median
−.40
−.20
.00
.20
.40
.60
.80
German Mathematics GPAFSIQ FSIQ FSIQABIQ ABIQ ABIQ
b
RIAS: Above Median
−.40
−.20
.00
.20
.40
.60
.80
German Mathematics GPAFSIQ FSIQ FSIQABIQ ABIQ ABIQ
b

APPENDIX E: Study 5 186
Possible Predictors of IQ Differences
Next, we investigated possible predictors of IQ differences. Only the models for the
comparisons of the IDS-2EBIQ(14) versus the IDS-2ABIQ(2), the SB5FSIQ(10) versus the SB5ABIQ(2), and the
RIASFSIQ(4) versus the RIASABIQ(2) were significant. Therein, IQ level and age and/or their interaction
were the only consistent predictors (see Table 3; see Table S5 for results for all comparisons). Larger
differences occurred for younger individuals for the SB5 and the RIAS, for individuals with a below-
average IQ for the IDS-2 and the RIAS, and for individuals with an above-average IQ for the RIAS.
Finally, there was a significant interaction effect for age and below-average IQ for the IDS-2 and for
age and above-average IQ for the SB5 (see Figure S6). For the former, age was negatively associated
with differences for individuals with below-average IQ, but not for individuals with average or above-
average IQ. For the latter, although there was no main effect of IQ level, age was positively associated
with differences for individuals with an above-average IQ, but negatively associated with differences
for individuals with an average or below-average IQs (see supplementary material for a detailed
description of results).
Table 3. Gamma Generalized Linear Models With Possible Predictors of Absolute Differences in IQs
Predictor
IDS-2 SB5 RIAS
EBIQ vs. ABIQ FSIQ vs. ABIQ FSIQ vs. ABIQ
Age -0.00 -0.15 ** -0.08 *
Sex 0.00 0.03 0.03
AD(H)D 0.12 0.14
Native language
Bilingual -0.14 0.00 -0.01
Other language -0.04 ** 0.07 -0.01
Education 0.06 0.05 0.05
IQ level
Below-Average IQ 0.01 *** 0.07 0.27 ***
Above-Average IQ 0.06 0.26 0.17 **
Participation 0.00
Cooperation 0.05
Understanding 0.05
Age*Below-Average IQ -0.59 *** 0.12 -0.07
Age*Above-Average IQ -0.10 0.31 ** -0.16
Likelihood 24.04 * 27.45 ** 29.52 ***
Note. IDS-2: N = 1,566, SB5: N = 1,775, RIAS: N = 1,979. Displayed are regression coefficients standardized by dividing by two standard deviations (Gelman, 2008). Sex: 0 = male, 1 = female; AD(H)D: 0 = no, 1 = yes;
Bilingual: 0 = German, 1 = bilingual; Other language: 0 = German, 1 = other native language; Education (of
participants or their mothers): 0 = no university degree; 1 = university degree; Below average IQ: 0 = 85 ≤ IQ ≤
115, 1 = IQ < 85; Above average IQ: 0 = 85 ≤ IQ ≤ 115, 1 = IQ >115; Cooperation (in the test situation) and
Understanding (of instructions): 0 = yes, 1 = partly/no. AD(H)D = attention deficit/hyperactivity disorder or
attention deficit disorder; Participation = participation in the test situation; IDS-2 = Intelligence and Development
Scales–2; SB5 = Stanford–Binet Intelligence Scales–Fifth Edition, German adaptation; RIAS = Reynolds
Intellectual Assessment Scales, German adaptation; EBIQ = Extended Battery IQ; FSIQ = Full-Scale IQ; ABIQ
= Abbreviated Battery IQ. *p <.05. **p <.01. ***p <.001.

APPENDIX E: Study 5 187
Comparability Using Different Criteria
Table 1 shows the reliabilities and widths of the corresponding 95% CIs for all seven GICs.
The width of the 95% CIs based on overall internal consistencies ranged between 6 (SB5FSIQ(10)) and 15
(RIASABIQ(2)) IQ points. Those based on age-specific internal consistencies and test–retest reliabilities
were considerably larger, and those based on age- and IQ-specific internal consistencies reached up to
30 IQ points for some combinations of IQ > 115 and different age groups. The lowest age- and IQ-
specific internal consistencies, resulting in the largest CIs, were found exclusively in groups with IQ >
115 and did not coincide with the lowest sample sizes for any of the IQs.
Figure 2. Percentage of Participants With Comparable IQs (i.e., Overlapping Intervals) Determined by Six Criteria
Note. The percentage of participants with comparable IQs both overall (black dots) and across IQ and age groups (color palette) are displayed. Numbers are displayed for the IQ and age group with the lowest percentage of
participants with comparable IQs for each comparison. Ages given in years. NomIQ = IQ in nominal categories
(e.g., “average” for IQ 85–115); 95CI = 95% CI with overall internal consistencies; 95CIage = 95% CI with age-
specific internal consistencies; NomCI = 95% CIs with overall internal consistencies in nominal categories; 95CIrtt
= 95% CI with test–retest reliabilities; 95CIageIQ = 95% CI with age- and IQ-specific internal consistencies; IDS-
2 = Intelligence and Development Scales–2; SB5 = Stanford–Binet Intelligence Scales–Fifth Edition, German
adaptation; RIAS = Reynolds Intellectual Assessment Scales, German adaptation; EBIQ = Extended Battery IQ;
FSIQ = Full-Scale IQ; ABIQ = Abbreviated Battery IQ; CI = confidence interval.
IDS−2 SB5 RIASEBIQ vs. ABIQ FSIQ vs. ABIQ EBIQ vs. FSIQ FSIQ vs. ABIQ FSIQ vs. ABIQ
Nom
IQ
IQ
Age74.0%ll llll
lllll
33.3%
69.4%
76.9%ll lllllllll
51.9%
74.4%
87.5%ll lllllllll
63.0%
84.0%
69.9%ll llll
llllllll llll
41.7%
61.8%
84.6%ll lllllllllllllll l
46.2%
81.3%
95C
I IQ
Age73.7%
l lllllll lll
44.4%
69.2%
84.3%lllllllllll
74.1%
82.0%
96.1%lllllllllll
88.9%
94.4%
60.5%lllllllllll lll lll l
27.8%
50.7%
98.7%llllllllllllllllll
88.5%
97.5%
95C
I age IQ
Age91.3%
l llllllllll
79.6%
88.2%
96.5%lllllllllll
95.8%
95.0%
99.7%lllllllllll
98.1%
99.0%
92.6%l lllllllllllllllll
66.7%
80.2%
98.7%llllllllllllllllll
88.5%
97.2%
Nom
CI IQ
Age95.9%
l l lllllllll
83.3%
92.1%
97.8%lllllllllll
90.7%
95.5%
99.7%lllllllllll
96.3%
99.2%
91.3%ll llll
llllllllllll
63.9%
86.8%
100.0%llllllllllllllllll
99.6%
99.8%
95C
I rtt IQ
Age98.4%
lllllllllll
96.3%
97.9%
98.8%lllllllllll
96.3%
98.1%
100.0%lllllllllll
100.0%
100.0%
94.3%llllllllllllllllll
69.4%
89.3%
100.0%llllllllllllllllll
100.0%
100.0%
95C
I ageI
Q IQ
Age96.7%
ll lllllllll
88.9%
94.5%
99.2%lllllllllll
96.9%
98.3%
99.9%lllllllllll
99.4%
99.8%
98.0%l lllllllllllllllll
80.6%
89.5%
99.3%llllllllllllllllll
88.5%
97.1%
0% 100% 0% 100% 0% 100% 0% 100% 0% 100%
IQ groups < 70 70−84 85−99 100−114 115−129 ³ 130 Age groups IDS−2 5−6 7−8 9−12 13−15 16−20
Age groups SB5 and RIAS 4 (SB5) / 3−4 (RIAS) 5−6 7−8 9−12 13−15 16−20 21−29 30−39 40−49 50−59 60−69 ³ 70
APPENDIX E: Study 5 188
The percentage of participants with comparable IQs (i.e., overlapping intervals) varied
considerably across the different criteria and across IQ and age groups (see Figure 2 and Tables S6 to
S11). With the 95CI criterion, overall comparability was between 60.5% and 98.7%. Across IQ groups
it ranged between 27.8% and 99.6% and across age groups between 50.7% and 100%. The overall
comparability was lowest for the NomIQ (69.9% to 87.5%) and the 95CI (60.5% to 98.7%) criteria and
highest for the 95CIrtt (94.3% to 100.0%) and the 95CIageIQ (96.7% to 99.9%) criteria. The same pattern
was evident across IQ and age groups, with the lowest comparability for the NomIQ and the 95CI and
highest comparability for the 95CIrtt and the 95CIageIQ. In general, comparability was lowest for the
comparison of the SB5FSIQ(10) versus the SB5ABIQ(2) and highest for the comparison of the RIASFSIQ(4)
versus the RIASABIQ(2).
Discussion
The primary objective of this study was to investigate the individual-level internal
comparability of different GICs. As expected, all GICs were highly intercorrelated and—with one
exception—there were no significant mean differences. Despite this high correspondence on the group
level, individual-level comparability was not always satisfactory. Intraindividual absolute differences
reached up to 39 IQ points and tended to be larger for above-average IQ and younger ages. With respect
to external validity, the EBIQ and FSIQ explained more variance in school grades compared to the
ABIQ only for individuals with large IQ differences and only for the IDS-2 and SB5, with significant
differences only for mathematics. Regarding possible predictors, IQ level and age, and/or their
interaction, were the only consistent predictors of IQ differences. Finally, regarding ways to deal with
incomparability, comparability varied considerably across criteria and again across both IQ level and
age both within and between comparisons. While comparability for the NomIQ and 95CI was often
unsatisfactory, it was very high for the 95CIrtt and 95CIageIQ.
Group-Level Comparability and Intraindividual Differences
On the group level, all GICs within each test battery were highly comparable, with the
exception of the RIASFSIQ(4) and RIASABIQ(2), where we found a significant mean difference despite a
very high correlation. However, the effect size was very small, suggesting the effect is negligible.
Despite high comparability on the group level, intraindividual absolute differences between GICs varied
considerably, from 0 to more than 2.5 SDs (M between 0.25–0.53 SDs), depending on the comparison.
There were no systematic differences in one direction; the relative differences were normally distributed
around 0 for all comparisons. The mean IQ differences were slightly lower than those found in previous
studies investigating individual-level comparability of FSIQs between test batteries (Bünger et al.,
2021; Floyd et al., 2008; Hagmann-von Arx et al., 2018). Still, the size of the differences seems
remarkable, given that the subtests used for the GICs overlap, that transient error is kept to a minimum,
that the GICs were standardized on the same individuals, and that between-battery variance in general
is ruled out completely. Revisiting the requirements introduced above that need to be fulfilled as a

APPENDIX E: Study 5 189
prerequisite for equal scores (Dorans & Holland, 2000), these findings indicate that the equity
requirement is violated for the compared GICs, and thus the scores are not exchangeable.
Differential External Validity
Analyses on differential external validity revealed that, as could be expected due to its lower
reliability, the ABIQ tended to show weaker relationships with school grades compared to the FSIQ
and EBIQ for most comparisons. However, this discrepancy in relationships with school grades was
only significant for participants with large IQ differences and only for the IDS-2 and SB5 and
mathematics. The two comparisons with the largest discrepancies also featured the largest IQ
differences.
Apparently, the ABIQs miss aspects of intelligence that are contained in the EBIQ and FSIQs
that are especially important for mathematical achievement. For the IDS-2, this probably concerns
additional working memory aspects and visual-spatial skills known to be especially important for
mathematical achievement (e.g., Bull & Lee, 2014; Kahl et al., 2021; McCrink & Opfer, 2014), that are
included in the FSIQ and EBIQ, but not the ABIQ. For the SB5, the incremental validity of the FSIQ
is probably mostly due to the quantitative knowledge subtests, and the working memory and visual-
spatial processing subtests as well. Moreover, relationships were smaller for individuals with large
compared to small IQ differences for the SB5 and RIAS, to the point that, for the RIAS (longitudinal
analysis), they were no longer significant for individuals with large IQ differences.
From these findings we conclude that a GIC based on more subtests is not necessarily a better
predictor for school grades compared to one based on fewer subtests, especially for individuals with
low IQ differences. We also conclude that larger IQ differences do have consequences for external
validity, as the GICs for which larger intraindividual differences occurred were also the ones with larger
disparities in relationships with school grades, and as relationships tended to be lower in general for
individuals with high IQ differences. Finally, differences in content seem to be more important than
differences in the number of subtests per se for differential external validity.
Possible Predictors of IQ Differences
Given results from previous studies showing that most error variance in IQs was systematic
(Floyd et al., 2008; Irby & Floyd, 2016, 2017), it is likely that the IQ differences we found are not
entirely due to random error. Our results suggest that characteristics of the testee are likely one
systematic influence, as IQ differences varied across IQ level and age, and those two and/or their
interaction were the only systematic predictors in regression analyses. These results are in line with
Hagmann-von Arx et al. (2018) and Bünger et al. (2021), where, for some comparisons, IQ differences
were larger for younger participants and at the tails of the IQ distribution as well.
With respect to age, younger participants had higher IQ differences for the SB5 and the RIAS
(age range: early childhood to late adulthood) but not for the IDS-2 (age range: early childhood to late
adolescence). In Bünger et al. (2021), age was also not systematically linked to IQ differences,
indicating that the effect of age might also depend on individual test characteristics. With respect to IQ

APPENDIX E: Study 5 190
level, the finding of larger differences toward the tails of the IQ distribution is to be expected due to
regression to the mean (Campbell & Kenny, 1999). In Hagmann-von Arx et al. (2018), IQ level was a
significant predictor of IQ differences also only for some comparisons, while in Bünger et al. (2021), it
was for all included comparisons. In both studies, all effects went in the direction of larger differences
toward the tails of the IQ distribution as well.
Besides regression to the mean, floor and ceiling violations could also explain larger differences
at the tails of the IQ distribution and at younger ages (e.g., Irby & Floyd, 2017). The raw scores are
usually not scaled homogenously across the full spectrum of scores, such that small differences in the
number of correct responses will have a disproportionate effect on scaled scores at the extremes of the
ability spectrum (i.e., very high or very low ability, or very young age).2 This disproportionate influence
at the extremes is more pronounced the fewer subtests/items are included in a composite, further
questioning the use of really short measures (cf. Irby & Floyd, 2016, 2017).
A third and related explanation for larger differences towards the tails of the IQ distribution is
the composite score extremity effect (Schneider, 2016), that is, the fact that a composite score tends to
be more extreme than the average of the subtest scores it is composed of. This effect is larger the more
subtests are included in a composite. Hence, a GIC composed of more subtests should render higher
scores for above-average IQ, and lower scores for below-average IQ, compared to a GIC composed of
less subtests. Table S12 illustrates this effect for our comparisons. However, this influence was less
pronounced, as absolute IQ differences were not necessarily larger for comparisons of GICs with larger
differences in the number of subtests (see below).
Fourth and lastly, larger IQ differences at the upper extreme of the IQ distribution are probably
also in part due to Spearman’s law of diminishing returns (SLODR, Spearman, 1927). In line with
SLODR, it has been shown that the general factor loadings of CHC broad ability factors decreased, and
their specific variance increased with increasing IQ level (e.g., Reynolds, 2013; Tucker-Drob, 2009).
Consequently, the validity of a GIC from the five broad ability composites also decreased with
increasing IQ level. It can therefore be expected that GICs that sample different broad abilities (or the
same, but to varying extents) will differ more for individuals with higher IQ. Thus, the effect of SLODR
might cumulate with the abovementioned factors decreasing comparability at high IQ levels, and at the
same time might diminish the effect of said other factors at low IQ levels. Our results of slightly larger
differences at the upper tail of the IQ distribution compared to the lower tail support this notion.
In our study (and not investigated in previous studies) there were also significant interaction
effects between IQ level and age. From the above considerations follows that the disproportionate
influence of few items should be especially pronounced for older individuals with high IQ and for
younger individuals with low IQ. Regression results support this in that the significant interaction
2 For tests that only cover an age span in childhood, typically the same is true for individuals at the upper tail of
the age distribution of the standardization sample. This was not the case for any of the test batteries in our study.

APPENDIX E: Study 5 191
effects went in the expected direction. All in all, our findings indicate that these two variables—IQ level
and age—should be considered in conjunction with each other when calculating reliability coefficients.
Finally, the included predictors explained a significant amount of variance for only three of the
five comparisons. It is likely that other variables that could not be sufficiently considered in the present
study contribute to systematic variance in IQ differences, for example (achievement) motivation,
attention span, or alertness.
Thus, there are at least two characteristics of the testee (i.e., IQ level and age) that explain some
of the variance in IQ differences. These findings indicate that the population invariance requirement is
violated, possibly due at least in part to violations of the same construct and equal reliability
requirements (Dorans & Holland, 2000).
A second source of systematic variability, characteristics of the composites, likely played a role
as well. Three such characteristics are number, general factor loadings, and content of subtests included
in the composites. Farmer et al. (2020) showed that the most accurate composites are those derived
from numerous (12 to 13) diverse subtests with high general factor loadings, where high general factor
loadings are more important compared to heterogeneity. Their results also suggest that including fewer
than four subtests results in substantial losses of accuracy. In line with common practice, the ABIQs
included in our study are all composed of only two subtests. Further, although all three ABIQs fulfill
the heterogeneity criterion with the two subtests representing different broad abilities, only the subtests
for the IDS-2ABIQ(2) were chosen based on the highest general factor loadings. The SB5ABIQ(2) is
composed of the subtests with the lowest (Nonverbal Fluid Reasoning) and third lowest (Verbal
Knowledge) general factor loading (Grob et al., 2019a), which might at least partly explain the larger
differences we found for the SB5 compared to the IDS-2 and the RIAS.
Subtest content may also play a role. In this regard, it is especially interesting to compare the
comparisons of IDS-2EBIQ(14) versus IDS-2FSIQ(7) and RIASFSIQ(4) versus RIASABIQ(2). Both comparisons
have the same degree of overlap in content (100%, see Table 1) and the same ratio of subtests (2:1) but
different absolute numbers of subtests (4 and 2 vs. 14 and 7) and different numbers of broad abilities
tapped (2 vs. 7). Differences for IDS-2EBIQ(14) versus IDS-2FSIQ(7) are slightly lower than for RIASFSIQ(4)
versus RIASABIQ(2), but both are considerably lower compared to the other comparisons.
To conclude, the same construct requirement is likely also violated, and larger overlap in
content and high general factor loadings—thus, the fulfilment of the same construct requirement—
seems to be more important than the sheer number of subtests for individual-level comparability.
However, as our set of comparisons is very limited, these findings clearly need replication, ideally with
comparisons of composites systematically varied in content, general factor loadings, and number of
subtests.
Ways to Deal with Incomparability
We explored several alternatives to exact IQ scores—namely, nominal categories and 95% CIs
based on different reliability coefficients—with the aim of achieving a more dependable intelligence

APPENDIX E: Study 5 192
estimate. Results on percentages of participants with overlapping 95% CIs or nominal IQs reflect results
on IQ differences in that they varied both between the different comparisons and across IQ level and
age. Although all investigated criteria consider unreliability in some way, comparability still tended to
be lower at younger ages and toward the tails of the IQ distribution.
Furthermore, comparability varied considerably between the different criteria. Although the
overall percentages of participants with overlap of the 95CI and the NomIQ tended to be higher
compared to those found in previous studies on between-battery comparisons (Bünger et al., 2021;
Hagmann-von Arx et al., 2018), they were still unsatisfactory. Especially when calculated separately
for IQ and age groups, the percentage of participants with comparable IQs was sometimes very low,
down to 28%. Rates of comparability were higher for the 95CIage and the NomCI criteria but the highest
rates were achieved with the 95CIrtt or the 95CIageIQ criteria. This is to be expected, given that the
intervals were also often widest for these criteria. Which of the two—95CIrtt or 95CIageIQ—provides a
better trade-off between comparability and precision (interval width) is difficult to pin down as this
varies across GICs and across GIC comparisons. It is important to note here that we had to rely on fairly
rough groups for IQ (< 85, 85–115, and > 115) and for age in adulthood (e.g., age 30–59 years for the
SB5 and age 21–59 years for the RIAS). Additionally, group sizes varied considerably and were
sometimes very low (IDS-2: n = 31 to n = 352; SB5: n = 15 to n = 222; RIAS: n = 23 to n = 175). The
comparability versus precision trade-off could probably be improved for the 95CIageIQ if larger, more
fine-graded groups were considered, which would necessitate sampling more participants of diverse
ages at the tails of the IQ distribution. Finally, both internal consistency and test–retest reliability miss
certain kinds of measurement error. While internal consistency does not consider transient error, test–
retest reliability does not consider specific factor error (i.e., errors due to individual interpretation of
items; Schmidt et al., 2003). Therefore, other approaches may be even more beneficial. The coefficient
of equivalence and stability (Cronbach, 1947), for example, considers both specific factor error and
transient error. As this coefficient requires the administration of two parallel test forms on two different
measurement occasions, we were not able to consider it in our study.
Finally, given the numerous equality requirements that are violated, more accurate CIs can be
only part of the solution to incomparability, mainly as a means for practitioners to deal with
incomparability of results from existing intelligence tests. Given the substantial differences we found,
the consequences they have for validity, and the large intervals needed to achieve satisfactory
individual-level comparability, the long-term goal must be to create more reliable and valid intelligence
measures. To achieve a higher individual-level comparability, it might be necessary to question our
current understanding of general intelligence and to refrain from multidimensional measures (i.e.,
subtests intended to measure both general intelligence and a broad ability; see also Beaujean & Benson,
2019). Instead, test developers could try to create unidimensional measures of specific broad abilities
with a firmer theoretical and neurological basis (e.g., Beaujean & Benson, 2019; Kovacs & Conway,
2019). In this vein, using fluid reasoning measures instead of GICs composed of multiple broad abilities

APPENDIX E: Study 5 193
might be beneficial for diagnostic utility, especially at the upper end of the IQ distribution, as Reynolds
(2013) found fluid reasoning to be the only composite not influenced by SLODR and being the best
indicator for general intelligence across IQ levels and all investigated age levels (except 5-6 year-olds,
where Comprehension–Knowledge was slightly better). For IQ > 115, it was even better than a GIC
composed of all five broad abilities. More narrowly defined constructs and carefully developed, theory-
driven instruments to measure these constructs as reliably and validly as possible are a prerequisite for
the same construct requirement—and with this also the equity and population invariance requirements
(Dorans & Holland, 2000)—to be fulfilled and for the interpretation of test results to have meaning
beyond the particular test that was used.
Implications
Our findings have implications for the construction, validation, and application of intelligence
tests. First, they raise awareness that choosing the subtests with the highest general factor loadings for
a short form does not necessarily result in comparable results to those for the full test battery. However,
it is certainly better than choosing subtests with lower general factor loadings (see also Farmer et al.,
2020).
Second, our results indicate that in terms of both individual-level comparability and external
validity there are no large gains between the 7- and 14-subtest composites (the FSIQ and the EBIQ,
respectively) for the IDS-2. In line with results from Farmer et al. (2020), this suggests a diminishing
marginal utility of additional subtests—especially if they do not introduce other broad abilities—from
a certain number of subtests on.
Third, our results speak against using one internal consistency coefficient derived from the
whole sample for the calculation of CIs. Instead, we recommend the use of test–retest reliabilities, age-
and IQ-specific internal consistencies or, probably even better, the coefficient of equivalence and
stability (Schmidt et al., 2003). The additional resources spent on the construction and application of a
parallel test form would be compensated for by more accurate reliability estimates and by a test battery
that could be administered twice to the same testee without introducing learning effects. Ideally, the
test–retest sample should also be large enough to permit at least a rough division into IQ and age groups
to enable the use of age- and IQ-specific test–retest reliabilities or coefficients of equivalence and
stability for the calculation of CIs.
Fourth, we encourage test developers to reconsider the current understanding of general
intelligence, and to try to develop purer (i.e., unidimensional) measures guided by formal theories (e.g.,
Beaujean & Benson, 2019), as clearly defined constructs are a prerequisite for individual-level
comparability of test scores.
Fifth, exact IQ scores should not be used for the interpretation or communication of test results.
Indeed, in line with Bünger et al. (2021), our results show that even the 95% CI might not necessarily
be valid enough for clinical interpretation, but it is certainly more appropriate than an exact IQ score.
As done before (Bünger et al., 2021), we again call for a paradigm shift away from exact IQ scores

APPENDIX E: Study 5 194
toward intervals that consider the unreliability of intelligence composites in clinical interpretation.
Instead of requiring an IQ score to fall above or below a certain threshold, the upper and lower levels
of the 95% CI should be considered.
Sixth, our results demonstrate that the differences between the FSIQ and the ABIQ are largest
especially in those ranges where most clinical questions arise—namely, at the tails of the IQ
distribution. This is true even if 95% CIs are based on the expected true score, thus accounting for
regression to the mean. To avoid the risk of missing diagnostically meaningful information, we suggest
using a short test of at least four subtests (see Farmer et al., 2020) instead of an ABIQ with less subtests
for screening purposes. A context, gaining importance in many Western countries, in which very short
measures should be especially avoided, is for testees with low familiarity with (standardized) testing or
test content as well as with difficulties in understanding task instructions. Following insights from
dynamic testing (Beckmann, 2014; Beckmann & Dobat, 2000; Cho & Compton, 2015; Guthke &
Wiedl, 1996), test performance for these testees increases in predictive validity with increasing time
spent with the tasks. For example, it was shown that in a test–retest design, performance in the posttest
was a better predictor for scholastic achievement compared to performance in the pretest, especially for
disadvantaged children (Guthke & Wiedl, 1996). The use of a screening instrument thus bears the risk
of underestimating an individual’s intellectual potential especially in these contexts.
Finally, IQ differences are linked to the prediction of school grades. For individuals with higher
IQ differences, relationships with school grades tended to be lower in general, and especially for the
ABIQ. In the long run, GICs might not even be predictive at all for school grades for these individuals.
It is therefore important to identify these individuals, for example, through multiple testing, and to be
aware of the possibility of reduced reliability and (external) validity of GICs in these cases.
Future research should determine to what extent the present results are applicable to broad
ability composites as well. If two subtests are likely not enough for a GIC, this should be even less
appropriate for a broad ability composite, given the small unique variance over and above the general
factor such broad ability composites already capture (e.g., Cucina & Howardson, 2017). At the same
time, content overlap should be larger for broad ability composites, raising the possibility of higher
comparability of these scores compared to more heterogeneous GICs, at least after unreliability is taken
into account. Interestingly, this is exactly what Bünger et al. (2021) found for verbal index scores from
different intelligence test batteries. Comparability of CIs for broad ability composites reported in Floyd
et al. (2005) also tended to be larger compared to the comparability of GICs reported in Bünger et al.
(2021), Floyd et al. (2008), and Hagmann-von Arx et al. (2018), despite often larger absolute differences
in IQ points for broad ability composites.
We also advocate the use of individual-level comparisons in addition to group-level analyses
for validation of a test procedure intended for individual diagnostics. More research is needed to further
investigate characteristics of both the testee and the test itself that are associated with individual-level
incomparability of intelligence composites. Finally, in addition to internal and structural validation, a

APPENDIX E: Study 5 195
greater emphasis should be placed on external validation, but also on diagnostic and treatment utility,
of test scores to determine their usefulness as a diagnostic instrument in practice.
Strengths and Limitations
We investigated group- and individual-level internal comparability of GICs for a set of three
test batteries based on large, representative samples covering a large age span from early childhood to
late adulthood. In comparing GICs within test batteries, we were able to eliminate all kinds of variance
between test batteries or test situations (including carryover effects, differences in standardization
samples and global test characteristics, and transient errors), leaving characteristics of the testee and the
test itself as the primary systematic sources of variance.
A limitation of this study is that we could form only broad IQ groups for age- and IQ-specific
95% CIs (i.e., below average, average, above average) due to small sample sizes within age groups.
Greater oversampling of participants of different ages at the tails of the IQ distribution is needed to
achieve more fine-graded groups and with this to ensure reliability and validity at the extremes.
Furthermore, we used school grades as a single criterion of external validity. Although school
grades are strongly related to general intelligence (Roth et al., 2015), future research should consider
differential relationships of GICs based on different numbers of subtests with additional criteria for
scholastic achievement, such as scholastic aptitude tests or teacher ratings of school performance, as
well as with criteria that are also valid for adults, for example, educational attainment or occupational
success.
Finally, we could include only a limited number of test batteries and composites in our study.
Systematic comparisons of the kind performed in Farmer et al. (2020)—comparisons of composites
systematically varied in characteristics such as number, general factor loadings, and content of
subtests—but on an individual level and within multiple test batteries are needed to further clarify the
number and nature of subtests necessary to achieve more reliable and valid measures of general
intelligence.
Conclusion
Our findings raise awareness of the limitations of ABIQs as a means to get a first impression
of an individual’s intellectual potential. Despite high comparability on the group level, individual-level
comparability of GICs derived from the same test battery was often unsatisfactory. We therefore
advocate to acknowledge a lower reliability of GICs to achieve more accurate intelligence assessments.
One step in that direction would be to refrain from using internal consistencies and to instead use test–
retest reliabilities or, probably even better, the coefficient of equivalence and stability (Cronbach, 1947)
as a basis for CIs. The systematic effects of IQ level and age on IQ differences we found suggest that
reliabilities should also be computed separately for age and IQ groups. Most importantly, our results
demonstrate that the interpretation of exact IQ scores should be avoided. However, despite limited
comparability with the FSIQ, we found that ABIQs did not necessarily display less external validity.

APPENDIX E: Study 5 196
But GICs in general, and especially ABIQs, tended to be worse predictors of school grades, especially
in mathematics, for individuals with large intraindividual IQ differences.
To conclude, our results point to substantial intraindividual IQ differences that have
consequences for external validity and are at least in part explained by IQ level and age. Our results
demonstrate that a focus on CIs based on reasonable reliability coefficients is one way to deal with
incomparability. Yet, further research is needed to learn more about the number and kind of subtests
necessary to achieve an accurate measurement of general intelligence on the individual level.

APPENDIX E: Study 5 197
References
Batty, G. D., Gale, C. R., Tynelius, P., Deary, I. J., & Rasmussen, F. (2009). IQ in early adulthood,
socioeconomic position, and unintentional injury mortality by middle age: A cohort study of
more than 1 million Swedish men. American Journal of Epidemiology, 169, 606–615.
https://doi.org/10.1093/aje/kwn381
Beaujean, A. A., & Benson, N. F. (2019). Theoretically-consistent cognitive ability test development
and score interpretation. Contemporary School Psychology, 23, 126–137.
https://doi.org/10.1007/s40688-018-0182-1
Beckmann, J. F. (2014). The umbrella that is too wide and yet too small: Why dynamic testing has still
not delivered on the promise that was never made. Journal of Cognitive Education and
Psychology, 13, 308–323. https://doi.org/10.1891/1945-8959.13.3.308
Beckmann, J. F., & Dobat, H. (2000). Zur Validierung der Diagnostik intellektueller Lernfähigkeit [On
the validation of intellectual learning ability diagnostics]. Zeitschrift Für Pädagogische
Psychologie, 14, 96–105. https://doi.org/10.1024//1010-0652.14.23.96
Bracken, B. A., & McCallum, R. S. (2016). Universal Nonverbal Intelligence Test–Second Edition
(UNITTM 2). WPS.
Bull, R., & Lee, K. (2014). Executive functioning and mathematics achievement. Child Development
Perspectives, 8, 36–41. https://doi.org/10.1111/cdep.12059
Bünger, A., Grieder, S., Schweizer, F., & Grob, A. (2021). The comparability of intelligence test results:
Group- and individual-level comparisons of seven intelligence tests. Manuscript submitted for
publication.
Campbell, D. T., & Kenny, D. A. (1999). A primer on regression artifacts. Guilford Press.
Cho, E., & Compton, D. L. (2015). Construct and incremental validity of dynamic assessment of
decoding within and across domains. Learning and Individual Differences, 37, 183–196.
https://doi.org/10.1016/j.lindif.2014.10.004
Cronbach, L. J. (1947). Test reliability: Its meaning and determination. Psychometrika, 12, 1–16.
https://doi.org/10.1007/BF02289289
Cucina, J. M., & Howardson, G. N. (2017). Woodcock–Johnson–III, Kaufman Adolescent and Adult
Intelligence Test (KAIT), Kaufman Assessment Battery for Children (KABC), and Differential
Ability Scales (DAS) support Carroll but not Cattell–Horn. Psychological Assessment, 29,
1001–1015. https://doi.org/10.1037/pas0000389
Cumming, G. (2009). Inference by eye: Reading the overlap of independent confidence intervals.
Statistics in Medicine, 28, 205–220. https://doi.org/10.1002/sim.3471
Deary, I. J., Strand, S., Smith, P., & Fernandes, C. (2007). Intelligence and educational achievement.
Intelligence, 35, 13–21. https://doi.org/10.1016/j.intell.2006.02.001

APPENDIX E: Study 5 198
Dorans, N. J., & Holland, P. W. (2000). Population invariance and the equatability of tests: Basic theory
and the linear case. Journal of Educational Measurement, 37, 281–306. https://doi.org/10.2307/
1435242
Dudek, F. J. (1979). The continuing misinterpretation of the standard error of measurement.
Psychological Bulletin, 86, 335–337. https://doi.org/10.1037/0033-2909.86.2.335
Dunlap, W. P., Cortina, J. M., Vaslow, J. B., & Burke, M. J. (1996). Meta-analysis of experiments with
matched groups or repeated measures designs. Psychological Methods, 1, 170–177.
https://doi.org/10.1037//1082-989X.1.2.170
Farmer, R., Floyd, R., Berlin, K. S., & Reynolds, M. (2020). How can general intelligence composites
more accurately index psychometric g and what might be good enough? Contemporary School
Psychology, 24, 52–67. https://doi.org/10.1007/s40688-019-00244-1
Floyd, R. G., Bergeron, R., McCormack, A. C., Anderson, J. L., & Hargrove-Owens, G. L. (2005). Are
Cattell–Horn–Carroll broad ability composite scores exchangeable across batteries? School
Psychology Review, 34, 329–357. https://doi.org/10.1080/02796015.2005.12086290
Floyd, R. G., Clark, M. H., & Shadish, W. R. (2008). The exchangeability of IQs: Implications for
professional psychology. Professional Psychology: Research and Practice, 39, 414–423.
https://doi.org/10.1037/0735-7028.39.4.414
Gelman, A. (2008). Scaling regression inputs by dividing by two standard deviations. Statistics in
Medicine, 27, 2865–2873. https://doi.org/10.1002/sim.3107
Gottfredson, L. S. (1997). Mainstream science on intelligence: An editorial with 52 signatories, history
and bibliography. Intelligence, 24, 13–23. https://doi.org/10.1016/S0160-2896(97)90011-8
Gottfredson, L. S. (2004). Intelligence: Is it the epidemiologists’ elusive “fundamental cause” of social
class inequalities in health? Journal of Personality and Social Psychology, 86, 174–199.
https://doi.org/10.1037/0022-3514.86.1.174
Gottfredson, L. S., & Deary, I. J. (2004). Intelligence predicts health and longevity, but why? Current
Directions in Psychological Science, 13, 1–4. https://doi.org/10.1111/j.0963-
7214.2004.01301001.x
Grob, A., Gygi, J. T., & Hagmann-von Arx, P. (2019a). The Stanford–Binet Intelligence Scales–Fifth
Edition (SB5)–German adaptation. Test manual. Hogrefe.
Grob, A., Gygi, J. T., & Hagmann-von Arx, P. (2019b). The Stanford–Binet Intelligence Scales–Fifth
Edition (SB5)–German version. Hogrefe.
Grob, A., & Hagmann-von Arx, P. (2018a). Intelligence and Development Scales–2 (IDS-2).
Intelligenz- und Entwicklungsskalen für Kinder und Jugendliche. [Intelligence and
Development Scales for children and adolescents]. Hogrefe.
Grob, A., & Hagmann-von Arx, P. (2018b). Intelligence and Development Scales–2 (IDS-2).
Intelligenz- und Entwicklungsskalen für Kinder und Jugendliche. Manual zu Theorie,

APPENDIX E: Study 5 199
Interpretation und Gütekriterien. [Intelligence and Development Scales for children and
adolescents. Manual on theory, interpretation, and psychometric criteria]. Hogrefe.
Grob, A., Meyer, C. S., & Hagmann-von Arx, P. (2013). Intelligence and Development Scales (IDS).
Intelligenz- und Entwicklungsskalen für Kinder von 5–10 Jahren. Manual. [Intelligence and
Development Scales for Children from 5–10 years of age. Manual]. Hans Huber.
Guthke, J., & Wiedl, K. H. (1996). Dynamisches Testen: Zur Psychodiagnostik der intraindividuellen
Variabilität. [Dynamic testing: On the psychodiagnostics of intraindividual variability].
Hogrefe.
Gygi, J. T., Hagmann-von Arx, P., Schweizer, F., & Grob, A. (2017). The predictive validity of four
intelligence tests for school grades: A small sample longitudinal study. Frontiers in
Psychology, 8. https://doi.org/10.3389/fpsyg.2017.00375
Hagmann-von Arx, P., & Grob, A. (2014a). Reynolds Intellectual Assessment Scales and Screening
(RIAS)TM. German adaptation of the Reynolds Intellectual Assessment Scales (RIAS)TM & the
Reynolds Intellectual Screening Test (RIST)TM from Cecil R. Reynolds and Randy W.
Kamphaus. Hans Huber.
Hagmann-von Arx, P., & Grob, A. (2014b). Reynolds Intellectual Assessment Scales and Screening
(RIAS)TM. German adaptation of the Reynolds Intellectual Assessment Scales (RIAS)TM & the
Reynolds Intellectual Screening Test (RIST)TM from Cecil R. Reynolds and Randy W.
Kamphaus. Test manual. Hans Huber.
Hagmann-von Arx, P., Lemola, S., & Grob, A. (2018). Does IQ = IQ? Comparability of intelligence
test scores in typically developing children. Assessment, 25, 691–701.
https://doi.org/10.1177/1073191116662911
Holland, P. W. (2007). A framework and history for score linking. In N. J. Dorans, M. Pommerich, &
P. W. Holland (Eds.), Linking and aligning scores and scales (pp. 5–30). Springer.
Irby, S. M., & Floyd, R. G. (2016). The exchangeability of brief and abbreviated intelligence tests:
Illuminating the influence of error variance components on IQs. Unpublished manuscript.
Irby, S. M., & Floyd, R. G. (2017). The exchangeability of brief intelligence tests for children with
intellectual giftedness: Illuminating error variance components’ influence on IQs. Psychology
in the Schools, 54(9), 1064–1078. https://doi.org/10.1002/pits.22068
Kahl, T., Grob, A., Segerer, R., & Möhring, W. (2021). Executive functions and visual-spatial skills
predict mathematical achievement: Asymmetrical associations across age. Psychological
Research, 85, 36–46. https://doi.org/10.1007/s00426-019-01249-4
Kovacs, K., & Conway, A. R. A. (2019). A unified cognitive/differential approach to human
intelligence: Implications for IQ testing. Journal of Applied Research in Memory and
Cognition, 8, 255–272. https://doi.org/10.1016/j.jarmac.2019.05.003
Lienert, G. A., & Raatz, U. (1998). Testaufbau und Testanalyse (6th ed.). Beltz.
Lord, F. M., & Novick, M. R. (1968). Statistical theories of mental test scores. Addison-Wesley.

APPENDIX E: Study 5 200
Lubinski, D. (2004). Introduction to the special section on cognitive abilities: 100 years after
Spearman’s (1904) “`General intelligence,’ objectively determined and measured.” Journal of
Personality and Social Psychology, 86, 96–111. https://doi.org/10.1037/0022-3514.86.1.96
Maul, A., Mari, L., & Wilson, M. (2019). Intersubjectivity of measurement across the sciences.
Measurement, 131, 764–770. https://doi.org/10.1016/j.measurement.2018.08.068
McCrink, K., & Opfer, J. E. (2014). Development of spatial–numerical associations. Psychological
Science, 23, 439–445. https://doi.org/10.1177/0963721414549751
McElreath, R. (2015). Statistical rethinking: A bayesian course with examples in R and Stan. CRC
Press.
McGrew, K. S. (1997). Analysis of the major intelligence batteries according to a proposed
comprehensive Gf-Gc framework. In D. P. Flanagan, J. L. Genshaft, & P. L. Harrison (Eds.),
Contemporary intellectual assessment: Theories, tests, and issues (pp. 151–179). Guilford
Press.
McGrew, K. S. (2009). CHC theory and the human cognitive abilities project: Standing on the shoulders
of the giants of psychometric intelligence research. Intelligence, 37, 1–10.
https://doi.org/10.1016/j.intell.2008.08.004
R Core Team. (2020). R: A language and environment for statistical computing (Version 4.0.3). R
Foundation for Statistical Computing. https://www.R-project.org/
Reynolds, M. R. (2013). Interpreting the g loadings of intelligence test composite scores in light of
Spearman’s law of diminishing returns. School Psychology Quarterly, 28, 63.
https://doi.org/10.1037/spq0000013
Roth, B., Becker, N., Romeyke, S., Schäfer, S., Domnick, F., & Spinath, F. M. (2015). Intelligence and
school grades: A meta-analysis. Intelligence, 53, 118–137. https://doi.org/10.1016/
j.intell.2015.09.002
Schmidt, F. L., Le, H., & Ilies, R. (2003). Beyond alpha: An empirical examination of the effects of
different sources of measurement error on reliability estimates for measures of individual-
differences constructs. Psychological Methods, 8, 206–224. https://doi.org/10.1037/1082-
989X.8.2.206
Schneider, W. J. (2016). Why are WJ IV cluster scores more extreme than the average of their parts?
A gentle explanation of the composite score extremity effect (Woodcock–Johnson IV
Assessment Service Bulletin No. 7). Houghton Mifflin Harcourt.
Schneider, W. J., & McGrew, K. S. (2018). The Cattell–Horn–Carroll theory of cognitive abilities. In
D. P. Flanagan & E. M. McDonough (Eds.), Contemporary intellectual assessment: Theories,
tests, and issues (4th ed., pp. 73–163). Guilford Press.
Schrank, F. A., McGrew, K. S., & Mather, N. (2014). Woodcock–Johnson IV. Riverside.
Spearman, C. (1904). “General Intelligence,” objectively determined and measured. The American
Journal of Psychology, 15, 201–292. https://doi.org/10.2307/1412107

APPENDIX E: Study 5 201
Spearman, C. (1927). The abilities of man: Their nature and measurement. Macmillan.
Thompson, A. P., LoBello, S. G., Atkinson, L., Chisholm, V., & Ryan, J. J. (2004). Brief intelligence
testing in Australia, Canada, the United Kingdom, and the United States. Professional
Psychology: Research and Practice, 35, 286–290. https://doi.org/10.1037/0735-7028.35.3.286
Tucker-Drob, E. M. (2009). Differentiation of cognitive abilities across the lifespan. Developmental
Psychology, 45, 1097–1118. https://doi.org/10.1037/a0015864
Watkins, M. W., Lei, P.-W., & Canivez, G. L. (2007). Psychometric intelligence and achievement: A
cross-lagged panel analysis. Intelligence, 35, 59–68. https://doi.org/10.1016/
j.intell.2006.04.005
Watkins, M. W., & Smith, L. G. (2013). Long-term stability of the Wechsler Intelligence Scale for
Children–Fourth Edition. Psychological Assessment, 25, 477–483. https://doi.org/10.1037/
a0031653

APPENDIX F: Curriculum Vitae 202
APPENDIX F: Curriculum Vitae
Academic Background 08/2017 – present PhD in Psychology
Division of Developmental and Personality Psychology | Department of Psychology | University of Basel
08/2015 – 07/2017 Master of Science in Psychology Major in Developmental and Personality Psychology University of Basel (Grade: 6.0/6.0) Master’s thesis: “Factor structure of the cognitive functions of the Intelligence and Development Scales for children and adolescents” (Grade: 6.0/6.0)
08/2012 – 07/2015 Bachelor of Science in Psychology University of Basel (Grade: 5.8/6.0) Bachelor’s thesis: “Parental risk factors prospectively associated with conduct disorder in children and adolescents” (Grade: 5.5/6.0)
Professional Activities 08/2017 – present Assistant
Division of Developmental and Personality Psychology | Department of Psychology | University of Basel
02/2019 – present Instructor Hogrefe AG | Bern and Göttingen
02/2015 – 07/2017 Student Assistant Dean of Students Office | Department of Psychology | University of Basel
06/2016 – 08/2016 Intern 06/2015 – 08/2015 University of Basel and Psychiatrie Baselland | Liestal
06/2014 – 07/2014 Administrative Assistant 01/2013 – 12/2013 Facility Management | Psychiatrie Baselland | Liestal

APPENDIX F: Curriculum Vitae 203
Teaching and Supervision Seminars
2017 – 2021 Master’s Colloquium in Personality and Developmental Psychology | Master | University of Basel
2017 – 2021 Journal Club | Master | University of Basel
2019 – 2020 Test Diagnostics | Bachelor | University of Basel
2020 SON-R and CFT: Language Free and Culture Fair Intelligence Diagnostics | Hogrefe AG, Bern
2019 IDS-2: Intelligence and Development Diagnostics | Hogrefe Verlag GmbH & Co. KG, Göttingen
2018 Development in Families With Migration Background: Risks and Opportunities | Master | University of Basel
2018 Intelligence as the Key to Success in Life? | Master | University of Basel
Supervision
2017 – 2021 Three Bachelor’s Theses | University of Basel
2018 – 2019 Three Master’s Theses | University of Basel
Publications Grieder, S. & Steiner, M. D. (in press). Algorithmic jingle jungle: A comparison of implementations
of principal axis factoring and promax rotation in R and SPSS. Behavior Research Methods. PsyArXiv Preprint. https://doi.org/10.31234/osf.io/7hwrm
Grieder, S., Bünger, A., Odermatt, S. D., Schweizer, F., & Grob, A. (in press). Limited internal score comparability of general intelligence composites: Impact on external validity, possible predictors, and practical remedies. Assessment.
Grieder, S., Timmerman, M. E., Visser, L., Ruiter, S. A. J., & Grob, A. (2021). Factor structure of the Intelligence and Development Scales–2: Measurement invariance across the Dutch and German versions, sex, and age. Manuscript submitted for publication. PsyArXiv Preprint. https://doi.org/10.31234/osf.io/vtw3g
Bünger, A., Grieder, S., Schweizer, F., & Grob, A. (2021). The comparability of intelligence test results: Group- and individual-level comparisons of seven intelligence tests. Manuscript submitted for publication.
Canivez, G. L., Grieder, S., & Bünger, A. (2021). Construct validity of the German Wechsler Intelligence Scale for Children–Fifth Edition: Exploratory and confirmatory factor analyses of the 15 primary and secondary subtests. Assessment, 28(2), 327–352. https://doi.org/10.1177/1073191120936330

APPENDIX F: Curriculum Vitae 204
Schweizer, F., Grieder, S., Bünger, A., & Grob, A. (2021). Vergleich von Intelligenztestleistungen bei monolingualen und bilingualen Kindern und Jugendlichen in den Intelligence and Development Scales–2 (IDS-2) [Comparison of intelligence test performance of monolingual and bilingual children and adolescents in the Intelligence and Development Scales–2 (IDS-2)]. Diagnostica, 67(1), 36–46. https://doi.org/10.1026/0012-1924/a000260
Steiner, M. D. & Grieder, S. (2020). EFAtools: An R package with fast and flexible implementations of exploratory factor analysis tools. Journal of Open Source Software, 5(53), Article 2521. https://doi.org/10.21105/joss.02521
Grieder, S. & Grob, A. (2020). Exploratory factor analyses of the Intelligence and Development Scales–2: Implications for theory and practice. Assessment, 27(8), 1853–1869. https://doi.org/10.1177/1073191119845051
Conference Presentations Grieder, S., Bünger, A., & Canivez, G. L. (2020, July). Confirmatory factor analyses with the 10
German WISC–V primary subtests. In G. L. Canivez (Chair). Construct validity of international WISC-V versions: Informing evidence based assessment. Symposium accepted at the 12th International Test Commission (ITC) Conference, Esch-sur-Alzette, Luxembourg (postponed).
Grieder, S. & Steiner, M. D. (2020, July). Algorithmic jingle jungle: comparison of implementations of an EFA procedure in R psych versus SPSS. Poster accepted at the 12th ITC Conference, Esch-sur-Alzette, Luxembourg (postponed).
Grieder, S., Bünger, A., & Canivez, G. L. (2019, July). Hierarchical exploratory factor analysis of the German WISC-V primary and secondary subtests. In G. L. Canivez (Chair). Validity investigations for international versions of the WISC-V: Informing evidence based assessment. Symposium conducted at the 41st International School Psychology Association Conference (ISPA), Basel, Switzerland.
Grieder, S., Odermatt, S. D., Bünger, A., Schweizer, F., & Grob, A. (2019, July). Are we overestimating IQ reliability? Intraindividual comparability of screening IQ and full-scale IQ for three test batteries. Poster presented at the 41st ISPA Conference, Basel, Switzerland.
Grieder, S., Odermatt, S. D., Bünger, A., Schweizer, F., & Grob, A. (2019, May). Are we overestimating IQ reliability? Intraindividual comparability of screening IQ and full-scale IQ for three test batteries. Poster presented at the 31st Annual Convention of the Association for Psychological Science (APS), Washington D.C., USA.
Grob, A. & Grieder, S. (2018, September). Die Struktur sozial-emotionaler Kompetenzen und deren Zusammenhang mit relevanten Entwicklungsfunktionen im Kindes- und Jugendalter [The structure of socioemotional skills and their relationship with relevant developmental functions in childhood and adolescence]. In K. Voltmer (Chair). Emotionale Kompetenzen im Kindesalter Teil I: Methoden der Erfassung [Emotional skills in childhood part I: Assessment methods]. Symposium conducted at the 51st Deutsche Gesellschaft für Psychologie (DGPs) Congress, Frankfurt, Germany.

APPENDIX F: Curriculum Vitae 205
Further Education and Training 10/2020 Thesis Defense Training | Seminar | University of Basel
09/2020 Learning How to Lead and to Build a Successful Work Environment | Transferable Skills | University of Basel
02/2020 Exploratory Data Analysis With R | The R Bootcamp | University of Basel
12/2018 Cultural Sensitivity | Course part of the Master of Advanced Studies in Child and Adolescent Psychology | University of Basel
11/2018 Python for Psychologists | Seminar | University of Basel
10/2018 Writing to Be Published: Academic Writing Conventions and Style | Transferable Skills | University of Basel
10/2018 Writing Productivity: Tools and Techniques | Transferable Skills | University of Basel
05/2018 Advanced Quantitative Methods Summer School | University of Oxford
12/2017 Teaching Methods for Seminar, Workshops, and Block Courses That Promote Learning | University Didactics | University of Basel
12/2017 Hands-On Practical Organization Semester Planning | University Didactics | University of Basel
Academic Skillset R Proficient | Author of the EFAtools package that implements exploratory factor
analyses tools; Data preparation, analysis, visualization, and reporting
SPSS, Amos Advanced | Data preparation and analysis Python Basic | Data wrangling and visualization MS Office Advanced | Word: Writing scientific articles, project-related work, admin;
Excel: Tables, advanced formulas, plotting; PowerPoint: Teaching and scientific presentations
LaTeX Intermediate | Writing scientific articles