esfaf1115.pdf - Engineered Science Publisher
12
ES Food Agrofor., 2020, 1, 94-105 94 | ES Food Agrofor., 2020, 1, 94-105 © Engineered Science Publisher LLC 2020 ES Food & Agroforestry DOI https://dx.doi.org/10.30919/esfaf1115 Comparative Classification Efficiency of Self-organizing Map, Principal Component Analysis, and Hierarchical Cluster Analysis for Normal Dairy and Differently Pineapple Fortified Rasgulla Tanmay Sarkar, Molla Salauddin, Sudipta Kumar Hazra and Runu Chakraborty * Abstract Rasgulla, the popular Indian dairy-based dessert, was fortified by using pineapple to improve its nutritional and different physical parameters like color, texture and sensory attributes. Being a highly nutritious, palatable fruit with excellent flavor and visual color characteristics, pineapple fortification provides an edge over normal dairy rasgulla. Comparative analysis of nutritional, X-ray diffraction, texture and sensory characteristics for normal rasgulla sample and pineapple with different drying process (pulp (PP), convective (PH), microwave (PMW), microwave convective (PMWC), and freeze-dried (PF)) fortified rasgulla samples were done. PH was found with maximum carbohydrate (40.60±2.04) and minimum protein content (5.91±0.95). PMWC was found with the maximum total color difference (ΔE = 48.79±3.33). Pineapple fortification did not alter the crystal characteristics of the rasgulla samples. Normal rasgulla showed the lowest hardness value while PMWC was the hardest one. The results obtained from the analysis were further comparatively segregated with the help of principal component analysis, hierarchical cluster analysis and self-organizing map to optimize the analysis frequency towards a more accurate result. It was found that more or less the same trends in results were obtained by all three analysis tools. It can be concluded that machine learning-based self-organizing map can be more sophistically used for classification between different parameters even in case of complex non-linear problems also. Among the entire samples microwave, convective dried pineapple rasgullawas found to be the best in terms of all the observed parameters. Keywords: Machine learning; Food fortification; Dairy; Neural network; Nutrition; Clustering. Received: 10 August 2020; Accepted date: 30 September 2020. Article type: Research Article . 1. Introduction Rasgulla or sweetened cheese ball is a very popular dairy- based dessert in all over India. Fortification is one kind of approach to improve the nutritional and physical attributes (sensory, color, texture) of rasgulla, which makes it more attractive and healthy. Pineapple is a tropical seasonal fruit that is well known for its excellent nutritional characteristics and can be used as a fortifying agent in rasgulla. Pineapple is rich in beta carotene, which results in excellent yellowish color. Due to fortification, yellow color is transferred into normal rasgulla and makes it more attractive. [1] Pineapple is a rich source of minerals like phosphorus, zinc, and manganese; phytochemicals like coumarins, flavonoids, and phenols; and vitamins like ascorbic acid, and vitamin B6. Pineapple is available only from June to November, which is the main concern with pineapple industry. Dehydration may be the option to overcome the problem and the dehydrated pineapple can be in use over the year. From previous studies, it has been substantiated that pineapple fortification improves the textural, sensory and color attributes of dairy products. [1] Also due to pineapple fortification, the nutritional qualities of rasgulla get enriched. Other physical attributes of rasgulla like sensory and texture were also improved due to pineapple fortification. [1] By X-ray diffraction (XRD) analysis, more information was obtained about the effects of pineapple fortification on sensory qualities like crystal formation. For comparative studies, four types of dried pineapple pulp (convective (PH), microwave (MR), microwave convective (MCR) and freeze (PF) dried) along with raw pineapple pulp were used for fortification. The Department of Food Technology and Biochemical Engineering, Faculty of Engineering and Technology, Jadavpur University, Jadavpur, Kolkata - 700032, India. * E-mail: [email protected] (R. Chakraborty)
-
Upload
khangminh22 -
Category
Documents
-
view
4 -
download
0
Transcript of esfaf1115.pdf - Engineered Science Publisher
ES Food Agrofor., 2020, 1, 94-105
94 | ES Food Agrofor., 2020, 1, 94-105 © Engineered Science Publisher LLC 2020
ES Food & Agroforestry DOI https://dx.doi.org/10.30919/esfaf1115
Comparative Classification Efficiency of Self-organizing Map, Principal Component Analysis, and Hierarchical Cluster Analysis for Normal Dairy and Differently Pineapple Fortified Rasgulla
Tanmay Sarkar, Molla Salauddin, Sudipta Kumar Hazra and Runu Chakraborty *
Abstract
Rasgulla, the popular Indian dairy-based dessert, was fortified by using pineapple to improve its nutritional and different physical parameters like color, texture and sensory attributes. Being a highly nutritious, palatable fruit with excellent flavor and visual color characteristics, pineapple fortification provides an edge over normal dairy rasgulla. Comparative analysis of nutritional, X-ray diffraction, texture and sensory characteristics for normal rasgulla sample and pineapple with different drying process (pulp (PP), convective (PH), microwave (PMW), microwave convective (PMWC), and freeze-dried (PF)) fortified rasgulla samples were done. PH was found with maximum carbohydrate (40.60±2.04) and minimum protein content (5.91±0.95). PMWC was found with the maximum total color difference (ΔE = 48.79±3.33). Pineapple fortification did not alter the crystal characteristics of the rasgulla samples. Normal rasgulla showed the lowest hardness value while PMWC was the hardest one. The results obtained from the analysis were further comparatively segregated with the help of principal component analysis, hierarchical cluster analysis and self-organizing map to optimize the analysis frequency towards a more accurate result. It was found that more or less the same trends in results were obtained by all three analysis tools. It can be concluded that machine learning-based self-organizing map can be more sophistically used for classification between different parameters even in case of complex non-linear problems also. Among the entire samples microwave, convective dried pineapple rasgullawas found to be the best in terms of all the observed parameters. Keywords: Machine learning; Food fortification; Dairy; Neural network; Nutrition; Clustering.
Received: 10 August 2020; Accepted date: 30 September 2020.
Article type: Research Article .
1. Introduction
Rasgulla or sweetened cheese ball is a very popular dairy-
based dessert in all over India. Fortification is one kind of
approach to improve the nutritional and physical attributes
(sensory, color, texture) of rasgulla, which makes it more
attractive and healthy. Pineapple is a tropical seasonal fruit
that is well known for its excellent nutritional characteristics
and can be used as a fortifying agent in rasgulla. Pineapple is
rich in beta carotene, which results in excellent yellowish color.
Due to fortification, yellow color is transferred into normal
rasgulla and makes it more attractive.[1] Pineapple is a rich
source of minerals like phosphorus, zinc, and manganese;
phytochemicals like coumarins, flavonoids, and phenols; and
vitamins like ascorbic acid, and vitamin B6. Pineapple is
available only from June to November, which is the main
concern with pineapple industry. Dehydration may be the
option to overcome the problem and the dehydrated pineapple
can be in use over the year. From previous studies, it has been
substantiated that pineapple fortification improves the textural,
sensory and color attributes of dairy products.[1] Also due to
pineapple fortification, the nutritional qualities of rasgulla get
enriched.
Other physical attributes of rasgulla like sensory and
texture were also improved due to pineapple fortification.[1] By
X-ray diffraction (XRD) analysis, more information was
obtained about the effects of pineapple fortification on sensory
qualities like crystal formation. For comparative studies, four
types of dried pineapple pulp (convective (PH), microwave
(MR), microwave convective (MCR) and freeze (PF) dried)
along with raw pineapple pulp were used for fortification. The
Department of Food Technology and Biochemical Engineering, Faculty of
Engineering and Technology, Jadavpur University, Jadavpur, Kolkata -
700032, India.
* E-mail: [email protected] (R. Chakraborty)
ES Food & Agroforestry Research article
© Engineered Science Publisher LLC 2020 ES Food Agrofor., 2020, 1, 94-105 | 95
mathematical model design of artificial neural network (ANN)
was enlivened by the bio-inspired algorithm or network and
the model consisting of basic processing units, which was
worked out by following a leaning methodology to store
scientific knowledge. Among several types, self-organizing
maps (SOM), which are often represented as SOM or denoted
as per the name of “Kohonen Map”, is a kind of artificial
neural network (ANN) that works through unsupervised
learning.[2] Application of SOM was reported for the
classification and identification of vegetable oils.[3-5]
Multivariate data principal component analysis (PCA)
generally was followed for analyses. To mitigate the
classification and clustering problems more accurately, SOM
can be used for multivariate data analysis. SOM is constructed
through a data matrix, and arranged spatially following a
specific kind of definite topology, commonly a two-
dimensional hexagonal or rectangular grid. The input space
and the weight vector share the same dimension.[6-9] Through
the relevancy of metric relations and topological
representation obtained from the data, SOM constricts the data.
For its non-linear characteristic, SOM could be extensively
used even for complex problems also. Dimension reduction is
generally conducted with PCA, whereas SOM is generally
used for clustering purposes. In food processing industries,
SOM is not in practice widely, though it is a very efficient
clustering tool and may have immense importance in the field
of food-related research with a large amount of data set.
This study aims to investigate about the effects of
pineapple fortification on the nutritional, textural, color and
sensory profile of normal dairy rasgulla. Apart from this, the
main aim of the study is to classify normal dairy rasgulla and
differently fortified rasgulla based on their nutritional, textural,
color and sensory attributes through linear PCA and HCA
method along with non-linear machine learning process of
SOM.
2. Experimental section
2.1 Materials and methods
The pineapple was procured from local market of Kolkata,
India. The quality and ripeness of the procured materials were
ascertained by physical verification. Milk was procured from
HACCP and ISO 9622:2013 certified dairy industry. The
pineapple drying was conducted per our previous work.[10]
Normal rasgulla (NR), fresh pulp (PP), convective (PH),
microwave (PMW), microwave convective (PMWC) and
freeze-dried (PF) pineapple fortified rasgulla were processed
as per our previous work.[10]
2.2 Nutritional analysis
By following AOAC 2000, crude protein content and moisture
content (MC) of the normal dairy and pineapple fortified
rasgullas were estimated.[11] By following Sarkar et al., 2020
carbohydrate, fat and ash content were measured.[12]
2.3 Texture and color analysis
L or lightness, b or yellow-blue and a or green-red values, ∆E
or the net difference in color, hue and chroma were estimated
following by Granato et al., 2010.[13] The analysis of textural
parameters was accompanied by Omolola et al., 2015 process
with the P5 probe and the TA.HD Plus Texture Analyzer,
USA.[14] The probe was allowed to penetrate at a speed of 25
mm/s and the sample was placed over stainless steel (SS-305)
platform with a hole at the center (1.25 cm diameter). The
rasgulla sample was placed over the platform, the centroid of
rasgulla, center of the hole and the center of the probe was
aligned at 180° vertical straight line.
∆E= √(LNR − LPR)2 + (aNR − aPR)2 + (bNR − bPR)2 ())
Chroma = √aR2 + bR
2 ( 2 )
Hue angle = tan−1 bR
aR ( 3 )
Browning Index (IB) = 100 ×(x−0.31)
0.17 ( 4 )
x = (a + ).75 LPR) / (5.645 LPR + aPR – 3.0)2 bPR) (5) where, LNR, bNR, aNR, LPR, bPR and aPR stands for the value of
lightness, yellow-blue and green-red values for normal
rasgulla and pineapple rasgullas respectively.
2.4 Analysis of sensory attributes
For sensory analysis, a 30-member (19 male and 11 female
members in the age group of 22-58 years) semi-trained panel
(the entire panelists were regular consumers of rasgulla) of the
institute was formed and the evaluation was carried out in the
laboratory itself. Color, flavor, texture, mouthfeel, overall
acceptability, and after taste were assigned as per our previous
work.[10] The entire panel was chosen in a manner that they
were familiar with both the rasgulla and pineapple. Panelists
were given 15 g of each sample (the samples were supplied
thrice and the mean score was considered) with a randomly
generated three-digit code. The seating arrangement for each
panelist was separated with wooden partitions, between two
successive consumptions by the panel members rinsed their
mouth with potable water and took extruded rice for
neutralisation of taste buds.
2.5 X-ray diffraction (XRD)
By using the Rigaku MiNiflex diffractometer, XRD behaviors
of entire rasgulla samples (normal dairy and fortified ones)
were carried out. A quartz slide was prepared to place rasgulla
samples with a 0.5 × 100 × 50 mm grove in the middle. The
input current was set at 30 mA, while the potential difference
was 35 kV and the wavelength was 0.15 nm. 0.02° of step
angle was maintained while the rate of the scan was 1 second
for each step and the diffraction angle was varied from 5° to
50°.[12]
2.6 Data analysis

Research article ES Food & Agroforestry
96 | ES Food Agrofor., 2020, 1, 94-105 © Engineered Science Publisher LLC 2020
One-way analysis of variance (ANOVA) followed by Tukey’s
test was performed considering 95% confidence level. All the
data were taken as the average of the discrete experimental
analysis performed in triplicate. Correlation analysis, principal
component analysis (PCA) and hierarchical cluster analysis
(HCA) were carried out with R Studio software version 3.4.4
(2018-03-15). The SOM operations were performed based on
the selected 6×6 neuron layers. MATLAB R2014b (Math
Works Inc., USA) was the software selected to conduct the
SOM. Fig. 1 represents the SOM model constructed for data
analysis.
Fig. 1 Representative model for shelf organizing map (SOM),
which consist of six input and thirty-six numbers of neurons.
3. Results and discussion
3.1Nutritional composition
The proximate composition of all the rasgulla samples was
reported in Table 1. From Table 1, it has been clear that the
amount of moisture present in NR has been significantly (p <
0.05) lower than the amount of moisture present in the
pineapple fortified rasgulla samples. But PP and rasgulla
fortified with differently dried pineapple were statistically
insignificantly varied in terms of moisture content. This might
be due to the incorporation of relatively higher moisture from
pineapple fruit pulp (80.78±3.2 %) compared to chhana
(51.70-53.41 %), which is the raw material for rasgulla. All the
pineapple fortified rasgulla samples absorbed more or less
similar amount of sugar syrup during soaking, which may be
the reason behind the insignificant difference in the moisture
content for differently fortified rasgullas.
Ash content of normal rasgulla was varied in a range of
0.75±0.005-1.04±0.03 % as reported by different literature
and in this study, the ash content of NR was found
1.19±0.03 %.[15-16] The pineapple was reported to have an ash
content as (0.45±0.002) %, which might differ with respect to
different cultivar.[17] Insignificant changes (p > 0.05) were
observed in the ash content of all the pineapple fortified
rasgulla samples as minerals remained unaffected by any kind
of drying treatment.[18]
Similar to the case of fat content, insignificant changes
were observed between all the pineapple fortified rasgulla
samples though NR was found to have a significantly higher
amount of fat content due to the high amount of channa in it.
NR and pineapple fruit was reported to have a fat content
2.72±0.10 - 14.41±6.43 % and 0.956 %, respectively.[15-17]
Table 1 Nutritional composition of normal and differently fortified rasgulla
Sample MC (%) Ash (%) Protein (%) Fat (%) Carbohydrat
e (%)
Total solids (%)
NR 44.23±1.56b 1.01±0.05b 8.73±0.80a 8.01±0.79a 38.02±1.15c 52.91±2.36a
PP 45.45±1.09a 1.03±0.01b 7.32±0.89b 6.58±0.81b 39.62±1.08b 42.33±1.07b
PF 45.39±1.60a 1.03±0.03b 7.33±0.21b 6.04±0.57c 40.21±0.96a 54.29±1.44a
PH 45.11±1.72a 1.08±0.09b 7.30±0.85b 5.91±0.95c 40.60±2.04a 52.26±1.87a
PMW 45.85±1.12a 1.12±0.15a 7.22±0.49c 6.09±0.58c 39.72±1.19a 52.92±2.05a
PMWC 45.40±1.33a 1.09±0.01b 7.34±0.75b 6.18±0.77c 40.03±1.20a 53.88±1.96a
[Results are expressed as mean ±standard deviation. Where, NR-normal rasgulla, PP-pulp rasgulla, PH-hot air, PF-freeze, PMW-
microwave, PMWC-microwave convective dried pineapple fortified rasgulla. MC- moisture content. Same superscripted letters in a
column represented the insignificant difference].

ES Food & Agroforestry Research article
© Engineered Science Publisher LLC 2020 ES Food Agrofor., 2020, 1, 94-105 | 97
The protein contents of all the pineapple fortified rasgulla
samples were significantly decreased with respect to NR and
this was due to different drying processes, which caused
severe damages to the hydrogen bond and different
hydrophobic interactions in the protein structure. This resulted
in the denaturation of the protein. Hassan et al., 2007 reported
a decrease in protein content of hot air dried Capparaceae
compared to fresh;[19] Amezquita et al., 2018 reported a higher
amount of protein content in freeze dried pear-peel compared
to hot air drying.[20] NR and pineapple fruit were reported to
have a protein content (3.91±0.12 - 8.24±0.05) % and
(1.19±0.03) % respectively.[15-17]
The Carbohydrate content of NR (37.02±1.03 %) was
found higher than PP (29.616±1.12 %) due to the higher
carbohydrate content of NR than raw pineapple fruit pulp. But
in the case of differently dried pineapple fortified rasgulla
samples, carbohydrate content was found significantly higher
than PP and NR as well. This phenomenon occurred due to the
different drying treatment which caused an increase in the dry
matter content of pineapple thus caused a higher carbohydrate
amount in all dried pineapple pulp. Ajayi et al., 2017 reported
an increase in carbohydrate content of microwave and oven
dried ginger than raw ginger sample.[21] NR and pineapple
fruits were reported to have a protein content (36.57±0.51 -
50.74±0.49) % and (13.04±2.03) % respectively.[15-17] The total
solid content of all the dried pineapple fortified rasgulla
samples were significantly (p < 0.05) increased compared to
PP due to the removal of moisture from pineapple fruit pulp.
3.2 Color
To enhance any product’s aesthetic appeal towards consumer
acceptability, color is primarily one of the key parameters. One
of the prime objectives of pineapple fortification of normal
rasgulla is to incorporate pineapple’s characteristic yellow
color in normal rasgulla. The major color pigments present in
pineapple were carotenoids especially β- carotene and
xanthophyll, which were well known as one of the major
natural color pigment groups.[1] The total color difference in
all the pineapple fortified rasgulla samples is found in the
following order – PMWC (ΔE = 48.79±3.33) > PMW (ΔE =
15.9±1.99) > PH (ΔE = 8.62±1.03) > PF (ΔE = 7.41±0.93) >
PP (ΔE = 6.26±0.89). The development of color in pineapple
fortified rasgulla might be due to the color incorporation
through carotenoid pigment from pineapple, non-enzymatic
browning reaction during different drying processes of
pineapple, Maillard reaction during cooking of different
rasgulla in sugar syrup. Bandyopadhyay et al., 2008 also
reported the development of color by using carrot in normal
rasgulla.[23] Maillard reaction, the characteristic reaction for
non-enzymatic browning process, is referred to a group of
reactions that follows a very complex reaction pathway
starting with the reaction of aldose sugars and amino acid of
casein and then following by amadori arrangements. It further
underwent through several pathways, all of which finally
resulted in the formation of melanoidins, a nitrogenous
colored polymer.[23] Several studies reported that the rate of
Maillard reaction was increased with an increase in
temperature.[24] It was seen that the color difference was
significantly increased with respect to different drying
treatments and the highest color difference was observed in the
case of PMWC followed by PMW, PH, and PF. Izli et al., 2018
reported a similar trend of color difference in the case of
microwave, convective and freeze-dried pineapple slices
compared to fresh pineapple slices.[25] Ramallo et al., 2012
also reported an increase in the yellowish color of pineapple
in the convective drying process.[26] Pham et al., 2018 also
reported a higher change in color values in microwave
convective drying compared to convective dried kiwi fruit.[27]
Higher temperature drying treatment such as PMWC and
PMW caused an increase in total carotene content compared
to mild and low drying treatment such as PH and PF. This
might be due to the better extraction of carotene at higher
temperature treatment that was also considered as an
important reason for the color difference trend in pineapple
fortified rasgulla. Also, the presence of lysine in channa in a
higher amount favored the browning reaction rate during the
boiling of rasgulla into sugar syrup.[28]
The color difference in pineapple fortified rasgulla might be
due to the browning reaction and the Maillard reaction during
the drying and cooking process. With browning, the ‘L’ values
of the pineapple fortified samples were decreased, resulting in
a decrease in the denominator of IB, leading to an increase in
the IB values. A significantly higher IB was observed for PH,
PMW and PMWC compared to NR. Similar to the trend of
total color difference, IB showed the highest value for PMWC
followed by PMW, PH and PF.
3.3 Texture
The texture is considered as one of the most important quality
parameters that is determined through the values of a set of
parameters like chewiness, adhesiveness, gumminess,
hardness, cohesiveness, springiness and stiffness obtained
from texture profile analysis. There are several studies on the
texture of rasgulla with respect to different characteristics and
other conditions as well.[29-33]
Hardness values (expressed in Newton (N)) of all the
rasgulla samples were observed in the following order – NR
(5.26±0.29 N) <PP (5.31±0.19 N) <PF (5.38±0.27 N) <PH
(5.41±0.23 N) <PMW (5.49±0.37 N) <PMWC (5.55±0.49 N).
From all these values, it can be seen that as the fat content of
rasgulla samples (Table 1) is decreased as the hardness value
is increased. Chavan et al., 2011 also reported a similar trend
of hardness increasing with a decrease in fat content.[29] Also,
integrity in protein structure has an important factor for the
hardness of rasgulla.[30-32] It was observed that the hardness of
rasgulla decreased as the degree of denaturation of protein was
decreased, or the protein content was increased. Also, an
increase in the total solid content might have a little bit effect
on the hardness trend of all the rasgulla samples.[5]
An opposite trend was observed in the case of cohesiveness

Research article ES Food & Agroforestry
98 | ES Food Agrofor., 2020, 1, 94-105 © Engineered Science Publisher LLC 2020
as compared to hardness. Cohesiveness values of all the
rasgulla samples were found as the following order – NR
(0.66±0.09) > PP (0.59±0.08) > PF (0.55±0.01) > PH
(0.51±0.03) > PMWC (0.49±0.02) > PMW (0.47±0.01).
Kumar et al., 2003 reported that an increase in fat content
resulted in a decrease in the cohesiveness value of all the
rasgulla samples and this observation was consistent with our
study.[30] Fat dispersion and protein matrix may influence the
cohesiveness of all the rasgulla samples.[32]
Fig. 2 Texture parameters for different rasgulla samples [Where,
NR-Normal rasgulla, PH-Hot air dried pineapple rasgulla, PF-
Freeze dried [pineapple rasgulla, PMW-Microwave dried
pineapple rasgulla, PMWC-Microwave convective dried
pineapple rasgulla].
Springiness is considered as the most vital parameter for
the texture of rasgulla. In this study, springiness values of all
the rasgulla samples were found as follows – PH (5.91±0.55
mm) > PMW (5.89±0.44 mm) > PMWC (5.87±0.41 mm) >PF
(5.84±0.69 mm) > PP (5.83±0.51 mm)> NR (5.81±0.58 mm).
It was observed that a higher fat content resulted in a lower
springiness value, which is similar to the findings reported by
Kumar et al., 2003.[29]
Adhesiveness of all the rasgulla samples were found as
follows – NR (0.093±0.003 N-mm) > PP (0.088±0.002 N-
mm) > PF (0.085±0.002 N-mm) > PMWC (0.082±0.001 N-
mm) > PMW (0.081±0.002 N-mm) > PH (0.078±0.000 N-
mm). In the case of adhesiveness, protein content was found
as the most predominant factor. A higher protein content
resulted in a higher adhesiveness value.[30] The texture
characteristics of different rasgulla samples were shown in Fig.
2. Gumminess was found to be the highest in PP followed by
PF. PH, PMW and PMWC showed lower gumminess values
and they were statistically insignificantly different (p > 0.05).
3.4.X-ray diffraction (XRD) analysis
From the structural aspects point of view, XRD is very much
helpful to get an idea about the crystalline -amorphous nature
of any sample structure. In XRD, the presence of any crystal
in the structure is validated by the characteristic peaks output
in the diffractogram. On the other side, the absence of any
characteristic peaks in the diffractogram indicates the
amorphous nature of the product structure. The Diffractogram
of all the samples were reported in Fig. 3. It is obvious from
Fig. 3 that in all the samples, no observed sharp peak signifies
their amorphous nature.
Lower molecular weight compounds like sugars (lactose,
sucrose, fructose, glucose), and organic acids were mainly
responsible for the formation of amorphous structure in all the
rasgulla samples. In all the rasgulla samples, no crystal was
formed due to two reasons - low molecular weight sugar in the
rasgulla samples was unable to form any crystalline structure
and Jaya et al., 2009 reported the same phenomena for normal
yogurt;[35] the rapid drying treatment of pineapple pulp in PH,
PMW, PMWC, which was insufficient to form any crystal.
Crystal formation generally takes place at a temperature of
more than 50 °C. In freeze-drying, the lower drying
temperature is also inhibited to form any crystalline structure
in PF. In the case of PP, similar diffractometric characteristics
in line PH, PMW, PMWC were observed. Low operating
temperature (< 50 °C) and low lactose sugar concentration
might inhibit any crystal formation in the case of NR and PP.
All freeze dried rasgulla samples had shown a similar kind of
diffractogram patterns though significant variation in their
respective intensities was observed in Fig. 3. PMW, PMWC
and PH resulted in higher intensities, and on the other side
gentle drying treatment like FD resulted in a lower intensity.
Prolonged drying time in hot air drying operation caused the
absorption of higher energy that resulted in the higher intensity
of the PH sample among all. Jaya et al. 2009 and Sengupta et
al., 2017 reported similar results in the case of convective,
microwave vacuum and freeze, drying of normal yogurt and
Spirulina platensis enriched soy yogurt.[34-35]
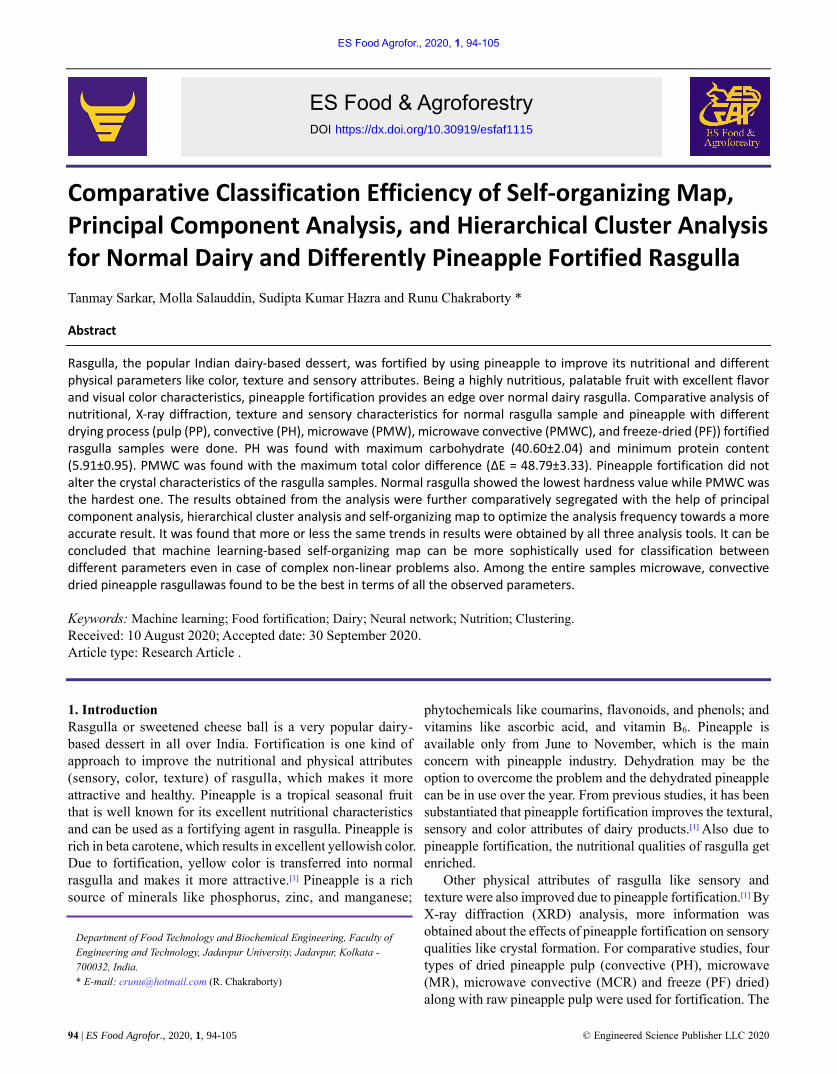
3.5 Sensory analysis
In a new product development, sensory characteristics
analysis is the last lap of the whole process which gives an
instant feedback about the final product with respect to
different parameters. In this study, sensory analysis of all the
rasgulla samples were carried out by using a 0-9 point hedonic
scale on total twelve parameters: color, mouthfeel, texture,
flavor, chewiness, overall acceptability, visual appearance,
sweetness, sourness, juiciness, bitterness, and aftertaste (Fig.
4).
For the color attribute, all the sensory scores were given
based on the development of yellow color in fortified
pineapple rasgulla samples and for flavor also all the sensory
scores were given on the basis of the development of
pineapple flavor in fortified pineapple rasgulla samples Color
is considered as a very first impression of the consumer for the
newly developed product and it was observed that PMWC got
the highest score for color followed by PMW, PH, PF, and PP.
In PMWC, the higher degree of incorporation of characteristic

ES Food & Agroforestry Research article
© Engineered Science Publisher LLC 2020 ES Food Agrofor., 2020, 1, 94-105 | 99
Fig. 3 XRD diffractogram of NR-normal rasgulla, PP-pulp rasgulla, PH-hot air, PF-freeze, PMW-microwave, and PMWC-microwave
convective dried pineapple fortified rasgulla.
yellow color from pineapple led to the scored highest among
all. Bandyopadhyay et al., 2008 reported color development
in normal rasgulla by using carrot.[22]
On the other side, for mouthfeel and texture, NR was found
with the highest score followed by the pineapple fortified
rasgulla as the hardness values of all the pineapple fortified
rasgulla samples were found higher than that of the NR.
Among the fortified rasgulla samples, PP was found with the
highest score for mouthfeel. While the PH, PF, PP were found
with the highest scores for texture.
For chewiness, opposite result was observed where PMWC
and PH were adjudged to get the highest scores followed by
PP, PF, PMW and NR. On the basis of pineapple’s
characteristics, flavor incorporation in fortified rasgulla
samples PP was adjudged to get the highest score followed by
PF, PH, PMW and PMWC. Heat treatment might be a reason
for the trend of flavor development in pineapple rasgulla
samples. From an overall accessibility point of view, PH, PF
and NR were scored highest followed by PP, PMW and
PMWC. The PP, PMW and PMWC were insignificantly
different in terms of flavor attributes.
3.6 SOM, PCA and HCA analysis
Definite integral form B (β) of the local stimulation of a single-
dimensional neural field can be represented as follows.
𝐵(𝛽) = ∫ 𝛽(𝑠)𝑑𝑠
𝛽
0
(6)
The equation (6) evidenced that, for an input parameter with a
non-zero value inconsistent with a specific active neural zone
accepting maximum input of s unit. B is the width of the active
neural zone.
SOM was proposed by Kohonen 1990, which was
somewhat identical to Amari’s self-arranging neural network
though an array of 2D units.[2] A high-pitched auto on-off
edgeways interconnected neural net of the proposed model
was constructed, the specific unit with the highest stimulation
emerged as the operating unit while the others were in the
dormant stage. The unit weight jth vector for learning is
represented as follows.
𝑊𝑣 = [𝑦 − 𝛿𝑊𝑗𝑐] ∑ 𝑖𝑗𝑚
𝑚
𝑧𝑚 (7)
where m represents a constant value, which is a positive
integer, ∑ 𝑖𝑗𝑚𝑚 𝑧𝑚 represents a regular adjacent function.
𝑧𝑚 represents neighbor neuron output activity, which depicts
the winning capacity of unit mover unit j; ijm represents the
dis tance function within neuron j and neuron m.
−𝛿𝑊𝑗 ∑ 𝑊𝑗𝑠𝑠 𝑦𝑠 stands for steady-state maintenance term for
adjacent neuron synaptic effect. The Wj, weight of j neuron is
directly proportional to the noise or disturbance of the model
itself. Model disturbance from s is intervened by the
Research article ES Food & Agroforestry
100 | ES Food Agrofor., 2020, 1, 94-105 © Engineered Science Publisher LLC 2020
Fig. 4 Hedonic ratings of sensory scores for different rasgulla samples. [Where, NR-Normal rasgulla, PH-Hot air dried pineapple
rasgulla, PF- Freeze dried [pineapple rasgulla, PMW-Microwave dried pineapple rasgulla, PMWC-Microwave convective dried
pineapple rasgulla.]
potentiality of deferred synaptic effect and Wjsys is proportional
to the forgetting effect, which can be modelled through ∑ 𝑊𝑗𝑠𝑠 𝑦𝑠 using the forgetting effect. We assumed that index s
varied for all input parameter y and ∑ 𝑖𝑗𝑚𝑚 𝑧𝑚= β, where β is
a scalar component and positive quantity which does not
depend on the values of Wjs and ys. Equation (7) can be
represented on its vector form as follows.
𝑊 = 𝛽𝑦 − 𝛾𝑊[𝑊𝑈𝑦] (8)
To form a differential equation, Equation (8) is multiplied
with 2W^U, which ultimately resulted in Equation (9):
2𝑊𝑈𝑊 = 𝑑‖𝑊‖2
𝑑𝑢= 2𝑊𝑈𝑦[𝛽 − 𝛾‖𝑊‖2] (9)
Therefore, from SOM, it is anticipated that W can be
spontaneously normalized and does not depend on input
parameter y, W pivots within the 2D space and the directed in
accordance with the mean value of input parameter (Fig. 2) for
unvarying neighbor function.
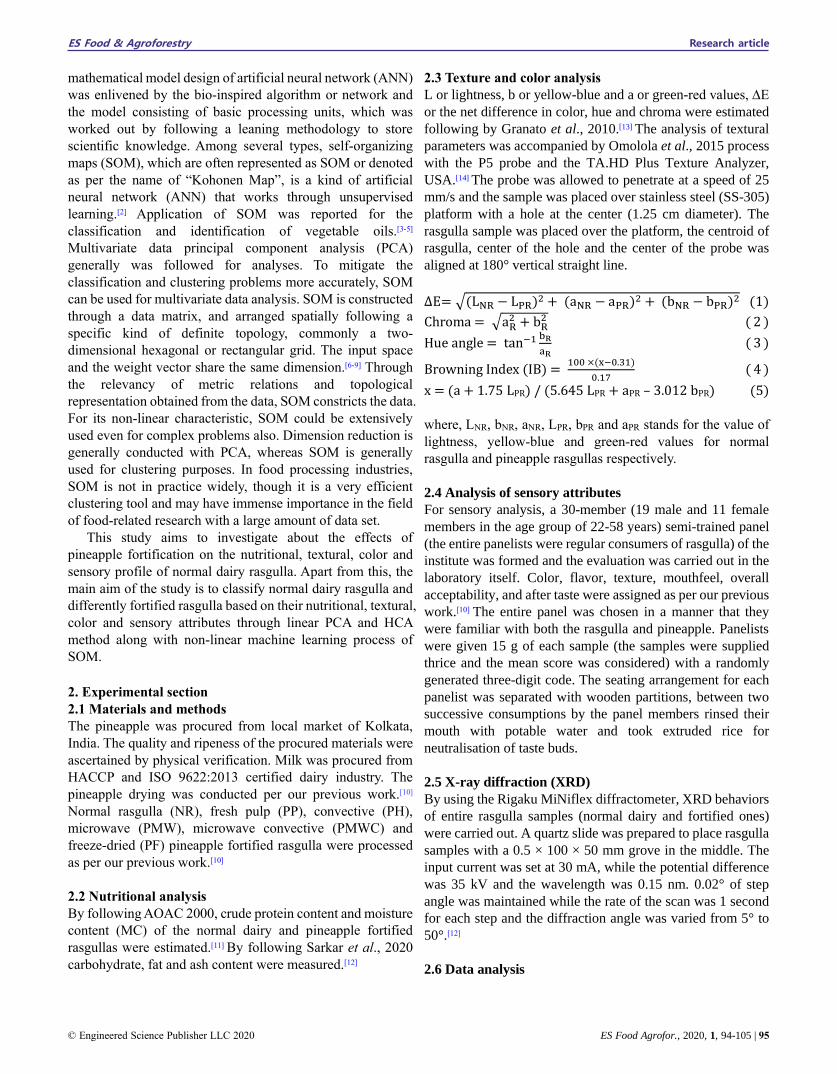
From Fig. 8 principal component analysis of all the
nutritional, textural and sensory parameters can be observed
where all the parameters were divided along with two-
component namely principal component 1 (PC 1) and
principal component 2 (PC 2). These two components
cumulatively contributed about 75.18 % of the total variance.
Among the six types of rasgulla samples – PMW, PH was
found in the positive co-ordinate of PC 2; PMWC was found
on the negative co-ordinate of PC 1; PF was found on positive
co-ordinate of PC 1; PP, NR was found on the negative co-
ordinate of PC 2. Distribution arrangement of all the observed
parameter (moisture content (MC), protein, carbohydrate, fat,
ash, colour (C), total colour difference (Del E), texture (T),
flavour (F), mouthfeel (MF), overall acceptability (OA),
adhesiveness, springiness, chewiness, gumminess, hardness
(H), cohesiveness, chroma, L, a, b, hue, fracturability, visual
appearance (VA), sweetness, sourness, juiciness, bitterness,
aftertaste) of all the rasgulla samples were found in Fig. 8.
Total six clusters were formed by all the parameters and those
were – cluster 1 (springiness, gumminess, chewiness, H, VA,
carbohydrate, Del E, aftertaste), cluster 2 (sourness, bitterness,
b, chroma), cluster 3 (OA, L, hue, ash), cluster 4 (cohesiveness,
fracturability, T, protein, fat, adhesiveness, MF), cluster 5
(sweetness, juiciness), cluster 6 (MC). From PCA model,
PMW scored the highest (0.4524) followed by PMWC
(0.3822), PH (0.1452), PF (-0.1936), PP (-0.2825) and NR (-
0.5037). Therefore, from the PCA it can be concluded that
PMW was the best sample in terms of the analyzed parameters
followed by PMWC, PH, PF, PP and NR.
ES Food & Agroforestry Research article
© Engineered Science Publisher LLC 2020 ES Food Agrofor., 2020, 1, 94-105 | 101
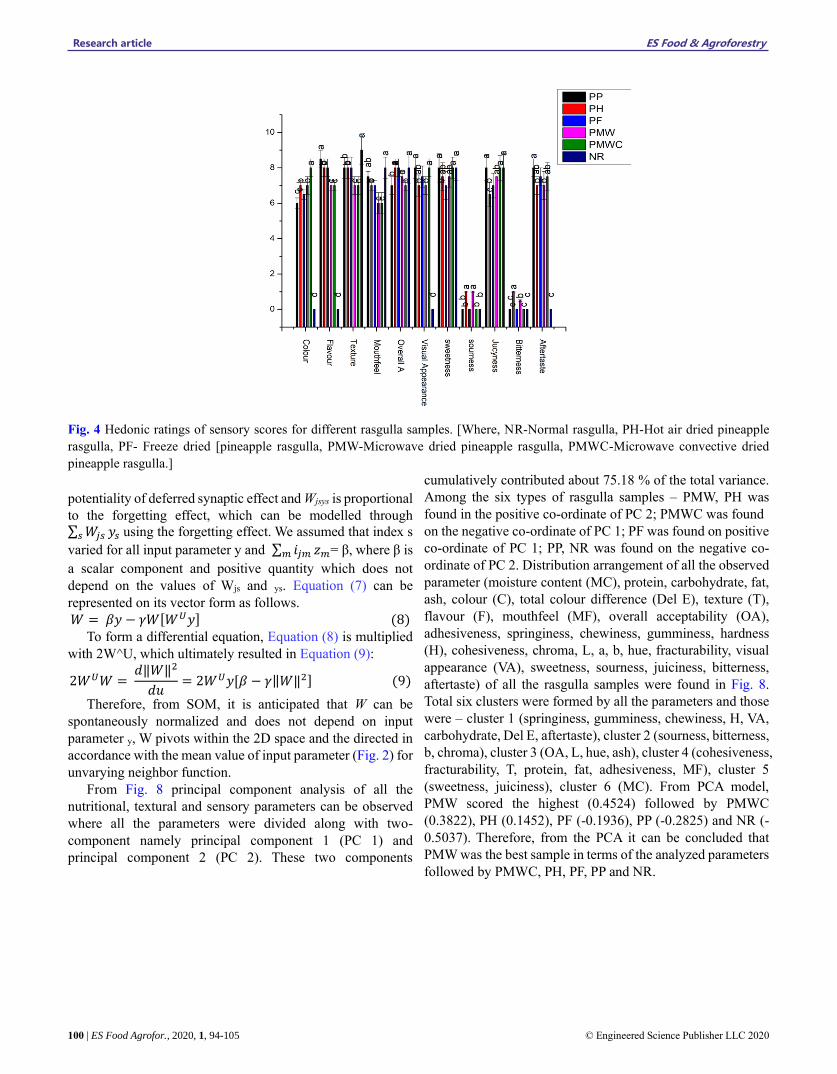
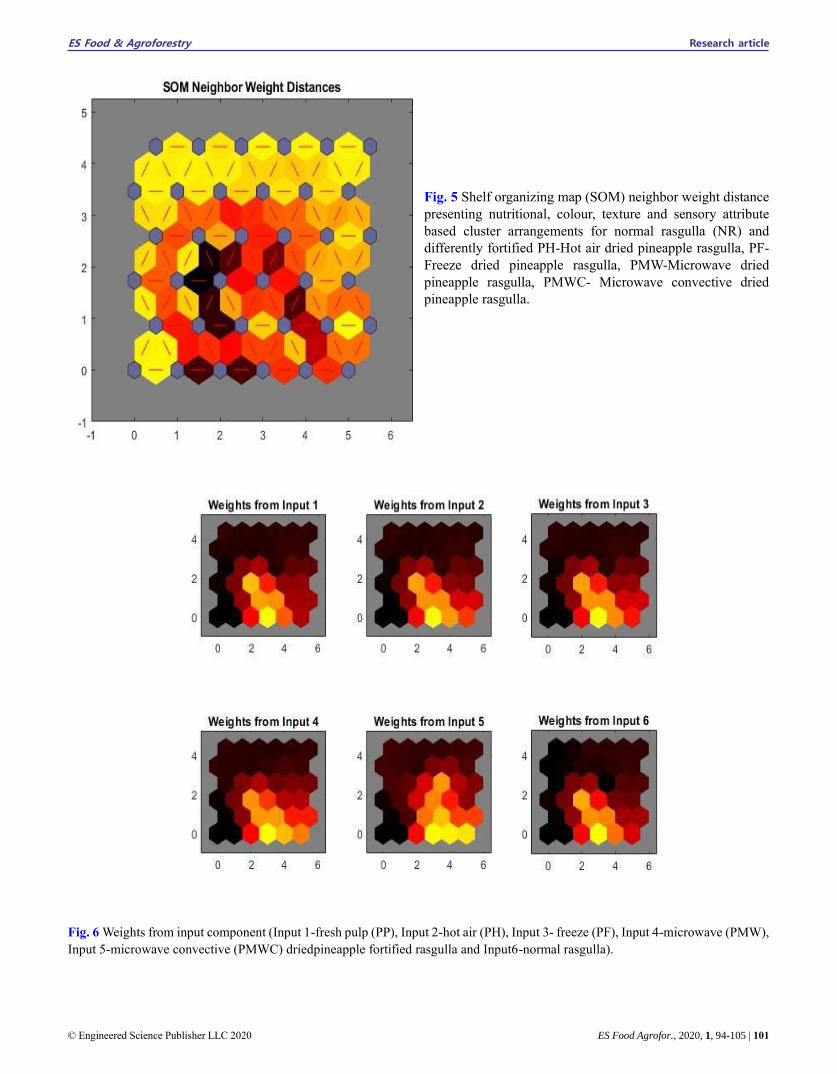
Fig. 5 Shelf organizing map (SOM) neighbor weight distance
presenting nutritional, colour, texture and sensory attribute
based cluster arrangements for normal rasgulla (NR) and
differently fortified PH-Hot air dried pineapple rasgulla, PF-
Freeze dried pineapple rasgulla, PMW-Microwave dried
pineapple rasgulla, PMWC- Microwave convective dried
pineapple rasgulla.
Fig. 6 Weights from input component (Input 1-fresh pulp (PP), Input 2-hot air (PH), Input 3- freeze (PF), Input 4-microwave (PMW),
Input 5-microwave convective (PMWC) driedpineapple fortified rasgulla and Input6-normal rasgulla).

Research article ES Food & Agroforestry
102 | ES Food Agrofor., 2020, 1, 94-105 © Engineered Science Publisher LLC 2020
Fig. 7 Co-relation diagram of protein, fat, MC (moisture content), Carb (carbohydrate) and ash content with sensory attributes like
Chew (chewiness), Co (cohesiveness), Fr (fracturability), Gum (gumminess), Hard (hardness), Ad (adhesiveness) and Sp
(springiness).
Fig. 8 Principal component analysis (PCA) bi-plot for different
rasgulla and the features analysed Where, NR-Normal rasgulla,
PH-Hot air dried pineapple rasgulla, PF- Freeze dries [pineapple
rasgulla, PMW-Microwave dried pineapple rasgulla, PMWC-
Microwave convective dried pineapple rasgulla, springiness,
gumminess, chewiness, hardness (H), visual appearance (VA),
carbohydrate, total colour difference (Del E), aftertaste, sourness,
bitterness, b, chroma), overall acceptability (OA), L, hue, ash,
cohesiveness, fracturability, texture (T), protein, fat, adhesiveness,
mouthfeel (MF), sweetness, juiciness, moisture content.
Also from Fig. 9 where HCA analysis with heat map showed
a clear indication of six different clusters of all the observed
parameters. From HCA, it is obvious that NR formed a totally
different cluster, while on a broader view, the pineapple
fortified rasgulla samples shared the same cluster. In the HCA
model (agglomerative), the clusters were generally developed
depending on the similarity or dissimilarity of the analyzed
parameters. The PP and PF shared the same sub-cluster while
the PH and PMW shared the other sub-cluster, pretending a
similarity in the characteristics for these products. Though
PMWC formed a separate sub-cluster within the purview of
the cluster by all the pineapple fortified samples, this might be
due to the distinctive features that appeared for the PMWC in
terms of the parameters studied.
Earlier, several authors reported SOM for describing the
features of food materials particularly in the field of sensory
analysis. Sanchez et al., 2019 and Milovanovic et al., 2019
had studied the hydrogenation of soybean oil and the
classification of different wine products based on organic acid
respectively.[36-37,3] Though it is the first kind of approach, in
terms of classification by food compositional analysis, sensory
attributes and physical characterization like textural and color
analysis through SOM. In the SOM Fig. 5, the small blue
colored hexagons are the representative of neighbor weight
dis tance topology neurons. The red-colored l ines

ES Food & Agroforestry Research article
© Engineered Science Publisher LLC 2020 ES Food Agrofor., 2020, 1, 94-105 | 103
Fig. 9 Hierarchical cluster analysis (HCA) with heat map. Where, NR-Normal rasgulla, PH-Hot air dried pineapple rasgulla, PF-
Freeze dried [pineapple rasgulla, PMW-Microwave dried pineapple rasgulla, PMWC- Microwave convective dried pineapple
rasgulla, springiness, gumminess, chewiness, hardness (H), visual appearance (VA), carbohydrate, total colour difference (Del
E),aftertaste, sourness, bitterness, b, chroma), overall acceptability (OA), L, hue, ash, cohesiveness, fracturability, texture (T), protein,
fat, adhesiveness, mouthfeel (MF), sweetness, juiciness, moisture content.
generally attached adjacent neurons with a weight value. In the
map, the light color represents lesser distance and the darker
color indicates for larger distances in between different
parameters. Both the light color and dark color indicated the
clusters formed by the different parameters. From Fig. 6, a
total of six light color spots were found. This indicated a total
of six clusters which were formed by different parameters, and
positioned nearby of each other. From HCA and PCA analysis,
we have already found six major clusters formed by different
parameters. Milovanovic et al., 2019, found the same result
for rose, white and red wine.[3] From Fig. 6 we can observe the
weighted position. Among all the samples, it was found that
PMWC was the most significant for classification in this study.
Also, NR was found to significantly affect the classification
pattern. Fig. 7 describes the co-relation interference of all the
samples along with all the parameters.
4. Conclusions
From the analysis of results of all the rasgulla samples, it can
be seen that fortification of pineapple in normal dairy rasgulla
successfully enriched the normal rasgulla nutritionally. Higher
carbohydrate (58.03%) content was observed for PMWC
while NR was found with the highest fat content (8.01±0.79).
PH possessed maximum springiness values (5.91 mm) and the
lowest fracturability (N) was found for PMWC (2.51 N).
PMWC showed a maximum ΔE of 48.79±3.33) compared to
other samples. A significantly higher IB was observed for PH,
PMW and PMWC compared to NR. PP and PMWC were
ranked similarly for sensory attributes like visual appearance,
overall acceptability, flavor and color. PP was found the best
in terms of sensory attributes (color and flavor) among all the
samples. From the XRD analysis results, it was found that
there was no adequate production of sugar crystals during the
process of pineapple drying that may alter the sensory quality
of the fortified products. The multivariate analysis (PCA and
HCA) proves how and why the pineapple fortification
improves the scientific status of rasgulla processing. The PCA
model elucidated that the PMW was the best sample in terms
of the analyzed parameters followed by PMWC, PH, PF, and
PP. Similar results are obtained from all the SOM, PCA and
HCA and it can be concluded that SOM may be an alternative
method in the data analysis segment of food science for easier
understanding of a large amount of data acquired.
Supporting information
Not applicable
Conflict of interest
There are no conflicts to declare.
References [1] T. Sarkar, M. Salauddin, S.K. Hazra, R. Chakraborty, SN Appl.
Sci., 2020, 2, 1621, doi:10.1007/s42452-020-03455-x.
Research article ES Food & Agroforestry
104 | ES Food Agrofor., 2020, 1, 94-105 © Engineered Science Publisher LLC 2020
[2] T. Kohonen, Proc. IEEE, 1990, 78, 1464–1480, doi:
10.1109/5.58325.
[3] M. Milovanovic, J. Žeravík, M. Obořil, M. Pelcová, K. Lacina,
U. Cakar, A. Petrovic, Z. Glatz, P. Skládal, Food Chem., 2019,
284, 296–302, doi:10.1016/j.foodchem.2019.01.113.
[4] F. Marini, A.L. Magrì, R. Bucci, A.D. Magrì, Anal. Chim.
Acta., 2007, 599, 232–240, doi:10.1016/j.aca.2007.08.006.
[5] J. S. Torrecilla, E. Rojo, M. Oliet, J.C. Domínguez, F.
Rodríguez, J. Agric. Food Chem., 2009, 57, 2763–2769
doi:10.1021/jf803520u.
[6] E. Bona, R.S. dos Santos Ferreira da Silva, D. Borsato, D.G.
Bassoli, Acta Sci. - Technol., 2012, 34, 111–119, doi:
10.4025/actascitechnol.v34i1.10892.
[7] J.V. Link, A.L. GuimarãesLemes, I. Marquetti, M.B. dos
Santos Scholz, E. Bona, Food Res. Int., 2014, 59, 1–7, doi:
10.1016/j.foodres.2014.01.063.
[8] W. Melssen, R. Wehrens, L. Buydens, Chemom. Intell. Lab.
Syst., 2006, 83, 99–113. 10.1016/j.chemolab.2006.02.003.
[9] T. Sarkar, M. Salauddin, S.K. Hazra, R. Chakraborty, Int. J.
Intell. Networks, 2020, 1, 17–31. 10.1016/j.ijin.2020.06.001.
[10] T. Sarkar, R. Bhattacharjee, M. Salauddin, A. Giri, R.
Chakraborty, Procedia Comput. Sci., Elsevier B.V., 2020, 167,
779–787, doi: 10.1016/j.procs.2020.03.410.
[11] AOAC, official methods of analysis of the association of the
official analytical chemists, AOAC International 2000,
Washington, DC, USA, 17th edition.
[12] T. Sarkar, M. Salauddin, S. Kumar Hazra, R. Chakraborty,
Int. J. Intell. Networks, 2020, 1, 59–66, doi:
10.1016/j.ijin.2020.07.003.
[13] D. Granato, I.A. de Castro, F.V.B.W. Piekarski, C. Benincá,
M.L. Masson, Biol. Technol., 2011, 54, 149–159. doi:
10.1590/S1516-89132011000100020.
[14] T. Sarkar, M. Salauddin, S.K. Hazra, R. Chakraborty, J.
Agric. Food Res., 2020, 2, doi: 10.1016/j.jafr.2020.100074.
[15] S. Sengupta, J. Bhowal, LWT - Food Sci. Technol., 2017,
86, 473–482. 10.1016/j.lwt.2017.08.033.
[16] U.K. Prodhan, M. Jahangir Alam, A. Sultana, M. Harun-Ar
Rashid, T. Das, N. Akter, M. Mahfuzur Rahman, IOSR J. Environ.
Sci., 2017, 11, 6–11, doi: 10.9790/2402-1107010611.
[17] G.M. Sun, X.M. Zhang, A. Soler, P.A. Marie- Alphonsine,
Nutr. Compos. Fruit Cultiv., Elsevier Inc., 2015, 609–637, doi:
10.1016/B978-0-12-408117-8.00025-8.
[18] S. Gupta, B.S. Gowri, A.J. Lakshmi, J. Prakash, J. Food Sci.
Technol., 2013, 50, 918–925, doi:10.1007/s13197-011-0407-z.
[19] S.W. Hassan, R.A. Umar, H.M. Maishanu, I.K. Matazu, U.Z.
Faruk, A.A. Sani, Asian Journal of Biochemistry, 2007, 2, 349–
353, doi:10.3923/ajb.2007.349.353.
[20] L.E. Garcia-Amezquita, V. Tejada-Ortigoza, O.H.
Campanella, J. Welti-Chanes, J. Food Qual., 2018 , 2018,
doi:10.1155/2018/9105237.
[21] O.A. Ajayi, O.O. Ola, O.O. Akinwunmi, Int. Food Res. J.,
2017, 24, 614–620.
[22] M. Bandyopadhyay, R. Chakraborty, U. Raychaudhuri, Int.
J. Dairy Technol., 2008, 61, 290–299, doi:10.1111/j.1471-
0307.2008.00412.x.
[23] D. Ruan, H. Wang, F. Cheng, Springer Cham, 2018, 1–21.
doi:10.1007/978-3-030-04777-1_1.
[24] S. I. F. S. Martins, W. M. F. Jongen, M. A. J. S. Van Boekel,
Trends Food Sci. Technol., 2000, 11, 364–373, doi: doi:
10.1016/S0924-2244(01)00022-X.
[25] N. Izli, G. Izli, O. Taskin, CYTA - J. Food., 2018, 16, 213–
221, doi: 10.1080/19476337.2017.1381174.
[26] L.A. Ramallo, R.H. Mascheroni, Food Bioprod. Process,
2012, 90, 275–283, doi:10.1016/j.fbp.2011.06.001.
[27] N.D. Pham, W. Martens, M.A. Karim, M.U.H. Joardder,
Food Nutr. Res., 2018, 62, doi:10.29219/fnr.v62.1292.
[28] S. Sengupta, J. Bhowal, LWT - Food Sci. Technol., 2017, 86,
473–482, doi: 10.1016/j.lwt.2017.08.033.
[29] R.S. Chavan, P.S. Prajapati, S.R. Chavan, Sens. Instrum.
Food Qual. Saf., 2011, 5, 33–42, doi: 10.1007/s11694-011-9109-
5.
[30] P. Kumar, H.N. Mishra, J. Texture Stud., 2003, 34, 249–269,
doi: 10.1111/j.1745-4603.2003.tb01060.x.
[31] A.K. Adhikari, O.N. Mathur, G.R. Patil, J. Dairy Res., 1992,
59, 413–424, doi:10.1017/S0022029900030685.
[32] H.K. Desai, S. Gupta, G.R. Patil, A.A. Patel, Indian J. Dairy
Sci., 1993 ,46, 123–127.
[33] K. Ten Hove, H. Das, J. Food Sci. Technol., 1995, 32, 109–
114.
[34] S. Sengupta, J. Bhowal, J. Microbiol. Biotechnol. Food Sci.,
2017, 6, 1001–1006, doi: 10.15414/jmbfs.2017.6.4.1001-1006.
[35] S. Jaya, Int. J. Food Prop., 2009, 12, 469–481, doi:
10.1080/10942910701772071.
[36] W. A. L. Alves, S. A. de Araújo, J. H. Pessota, R. A. B. O.
dos Santos, Appl. Mech. Mater., Trans Tech Publications Ltd,
2013, 2191–2194, doi:10.4028/www.scientific.net/AMM.263-
266.2191.
[37] J. L. Sanchez, S. B. G. Pereira, A. Tanamati, A. A. C.
Tanamati, E. Bona, Emirates J. Food Agric., 2019, 31, 779–787,
doi: 10.9755/ejfa.2019.v31.i10.2019.
Author information
Tanmay Sarkar received his
bachelor’s degree in Chemistry
from Calcutta University, Kolkata, India (2009), Bachelor of
Technology (2012) and Master of
Technology (2014) both in Food Technology and Biochemical
Engineering from Jadavpur University, Kolkata, India. He has
submitted his PhD thesis (2020) in
the field of food process technology in Jadavpur University, Kolkata, India. He is working as a Lecturer in dept. of Food
Processing Technology at Malda Polytechnic, West Bengal State Council of Technical Education, Govt. of West Bengal
since 2018. His areas of interests include Optimisation,
Mathematical modelling, Phytochemicals, Data science and
traditional food.
Molla Salauddin has completed his M.Tech (2020) under the
supervision of Prof. Runu Chakraborty from Department of
Food Technology and Biochemical
Engineering, Jadavpur University. He received his B.E (Bachelor of
Engineering) degree in 2018 from the Department of Food Technology

ES Food & Agroforestry Research article
© Engineered Science Publisher LLC 2020 ES Food Agrofor., 2020, 1, 94-105 | 105
and Biochemical Engineering, Jadavpur University. He is now working as a Food Safety officer under Kolkata
Municipal Corporation, Govt. of West Bengal, India. His
current research focuses on the Functional food product development and application of advance methods in the area
of food engineering.
Sudipta Kumar Hazra is a final
year undergraduate student in the Department of Food Technology
and Biochemical Engineering at Jadavpur University since 2017.
His research interests include the
applications of machine learning, predictive analytics, and
metaheuristic optimization in the
field of food process engineering,
food safety, and sensory sciences.
Professor Runu Chakraborty
joined the department of food
technology and biochemical
engineering if Jadavpur University in July, 1991 as
lecturer. She became reader in the year 1997 and professor in
2004. She is working in the same
department till date. She has completed two terms as Head of
the Department from 2001-2003 and 2015-2017. 21 students have been awarded PhD under her supervision. She has
published more than 100 research papers in international
and national journals and 2 patents. Her research interest is food fortification, food engineering and mathematical
modelling.
Publisher’s Note: Engineered Science Publisher remains neutral
with regard to jurisdictional claims in published maps and
institutional affiliations.