
Fission Product Behavior in the Mclten Salt Reactor Experiment
BioMed CentralBMC Genomics
ss
Open AcceResearch articleWhole-genome microarrays of fission yeast: characteristics, accuracy, reproducibility, and processing of array dataRachel Lyne†1,2, Gavin Burns†1, Juan Mata1, Chris J Penkett1, Gabriella Rustici1, Dongrong Chen1, Cordelia Langford1, David Vetrie1 and Jürg Bähler*1Address: 1The Wellcome Trust Sanger Institute, Hinxton, Cambridge CB10 1SA, U.K and 2Present address: Department of Genetics, University of Cambridge, Cambridge CB2 3EH, U.K
Email: Rachel Lyne - [email protected]; Gavin Burns - [email protected]; Juan Mata - [email protected]; Chris J Penkett - [email protected]; Gabriella Rustici - [email protected]; Dongrong Chen - [email protected]; Cordelia Langford - [email protected]; David Vetrie - [email protected]; Jürg Bähler* - [email protected]
* Corresponding author †Equal contributors
AbstractBackground: The genome of the fission yeast Schizosaccharomyces pombe has recently beensequenced, setting the stage for the post-genomic era of this increasingly popular model organism.We have built fission yeast microarrays, optimised protocols to improve array performance, andcarried out experiments to assess various characteristics of microarrays.
Results: We designed PCR primers to amplify specific probes (180–500 bp) for all known andpredicted fission yeast genes, which are printed in duplicate onto separate regions of glass slidestogether with control elements (~13,000 spots/slide). Fluorescence signal intensities depended onthe size and intragenic position of the array elements, whereas the signal ratios were largelyindependent of element properties. Only the coding strand is covalently linked to the slides, andour array elements can discriminate transcriptional direction. The microarrays can distinguishsequences with up to 70% identity, above which cross-hybridisation contributes to the signalintensity. We tested the accuracy of signal ratios and measured the reproducibility of array datacaused by biological and technical factors. Because the technical variability is lower, it is best to usesamples prepared from independent biological experiments to obtain repeated measurements withswapping of fluorochromes to prevent dye bias. We also developed a script that discards unreliabledata and performs a normalization to correct spatial artefacts.
Conclusions: This paper provides data for several microarray properties that are rarelymeasured. The results define critical parameters for microarray design and experiments andprovide a framework to optimise and interpret array data. Our arrays give reproducible andaccurate expression ratios with high sensitivity. The scripts for primer design and initial dataprocessing as well as primer sequences and detailed protocols are available from our website.
BackgroundDNA microarrays are currently one of the most powerful
and widespread technologies for functional genomics,allowing the study of genome-wide gene expression and
Published: 10 July 2003
BMC Genomics 2003, 4:27
Received: 20 March 2003Accepted: 10 July 2003
This article is available from: http://www.biomedcentral.com/1471-2164/4/27
© 2003 Lyne et al; licensee BioMed Central Ltd. This is an Open Access article: verbatim copying and redistribution of this article are permitted in all media for any purpose, provided this notice is preserved along with the article's original URL.
Page 1 of 15(page number not for citation purposes)

BMC Genomics 2003, 4 http://www.biomedcentral.com/1471-2164/4/27
other global DNA-dependent processes (for reviews see[1–3]). Glass microarray slides contain thousands ofnucleic acid features that can be interrogated in parallel.In the popular two-colour assay, fluorescently labelledsamples prepared from RNA of two different cell popula-tions are co-hybridised onto the microarray to measurerelative gene expression levels [4,5]. In the following, wewill refer to the known features spotted on the microarrayas 'array elements' and to the labelled cDNA hybridised tothe microarray as 'samples'.
Although becoming increasingly routine, DNA microar-rays are still not a 'plug-and-play' technology, requiringsubstantial optimisation for reliable performance. A widerange of factors can affect data quality, and it is importantto understand various parameters involved [6–9]. Thisincludes conditions that lead to unwanted changes ingene expression before RNA extraction, such as variationsin the environment (e.g., temperature shocks) or in thegenotype (e.g., auxotrophic markers). Other parameters,including array and experimental design, protocols anddata processing procedures, can affect array data inde-pendently of biological processes. To use microarrays totheir full potential, it also helps to know the performancecharacteristics of a microarray platform. Important prop-erties are data reproducibility within and between arrays,effects of dye biases and other artefacts in the data struc-ture, as well as the accuracy, specificity and sensitivity ofsignal intensity measurements.
The fission yeast Schizosaccharomyces pombe is a popularmodel organism whose genome has been fully sequenced[10]. The genome is well annotated and contains some-what less than 5000 predicted genes [11,12]. Fission yeasthas a low-complexity genome and similar experimentaladvantages as the budding yeast Saccharomyces cerevisiae,which has been widely used to pioneer functional genom-ics approaches (reviewed in [13,14]). Experimental condi-tions for yeast can be tightly controlled, and it isstraightforward to study homogeneous populations ofcells and to combine findings from global studies withgenetic data. Fission and budding yeasts are only distantlyrelated and separated >1000 million years ago accordingto recent estimates [15]. S. pombe therefore provides a val-uable complementary model system, and it should beinsightful to compare and contrast global datasetsobtained in these two unicellular eukaryotes.
We have recently reported genome-wide expression pro-files during sexual differentiation and stress responses infission yeast [16,17]. Here we describe the design of thefission yeast microarrays together with experimental pro-cedures and data evaluation pipeline. Various propertiesand performance characteristics of our microarray system
were measured, which help to understand the nature andlimitations of array data.
Results and DiscussionEffects of array element properties on fluorescence signals and ratiosWe have built a DNA microarray containing elements forall the known and predicted open reading frames (ORFs)of the fission yeast genome (see Methods). For each ORF,we amplified 180–500 bp of exon sequence by PCR. Totest the effect of array element size on fluorescence signalintensities, PCR products of a wider size range were usedfor some genes (80–1500 bp). Although the signalstended to increase with increasing element size, there wasonly a ~2-fold difference between the lowest and highestsignal intensities (Figure 1A). Array elements larger than~500 bp did not lead to increased signals, similar to whathas been reported before [18,19]. Importantly, the signalratios were independent of array element size, and theywere much less variable than the signal intensities, differ-ing by only a few percents (Figure 1A).
The position of an array element within a gene alsoaffected the signal intensities. Figure 1B shows that tiles ofequal length selected closer to the 3' end of genes tend togive higher signals than those closer to the 5' end, andthere was a ~3-fold difference between lowest and highestsignal intensities. This reflects the efficiency of reversetranscription, which is primed from the polyA-tail of themRNAs. Again, the signal ratios showed little variationand were independent of signal intensities, suggestingthat both fluorescence dyes are equally incorporated dur-ing labelling and independently of array element posi-tions (Figure 1B). Because signal intensities can affectreproducibility, we maximized signals by selecting arrayelements that were less than 2.5 kbp from the gene ends(see Methods).
For each array element, we performed two rounds of PCR,using gene-specific primer pairs for the first round andgene-specific reverse primers in combination with a uni-versal forward primer containing a 5'-aminolink for thesecond round. This allowed covalent linkage of the codingstrand to the modified glass slides, thus providing a sin-gle-stranded array element that is specific for transcrip-tional direction. Available data strongly suggest that ourarray elements are indeed strand-specific. For example,mek1 transcripts did not give any microarray signals abovebackground in timecourse experiments of cells undergo-ing meiosis and sporulation [16], although mek1 isinduced during meiosis [20]; we later realized that theprimers for mek1 had been designed the wrong way roundand that our microarray had included only the anti-sensestrand of this gene. Moreover, the rec7 transcript showeda different gene expression profile during the meiotic
Page 2 of 15(page number not for citation purposes)

BMC Genomics 2003, 4 http://www.biomedcentral.com/1471-2164/4/27
timecourse experiments compared to the overlappingtos1, tos2, and tos3 that are transcribed from the oppositestrand [16,21]. The strand specificity was also evidentwith genes for non-coding RNAs where we selected arrayelements for both orientations (Table 1). In all cases, theelements containing the coding strands produced strongsignals, whereas the signals from the non-coding strandswere too close to the background signals to pass our cutoffcriteria. We conclude that only the amino-modified
strands bind significantly to the slides. This allowed thedesign of strand-specific array elements that can discrimi-nate transcriptional directions and that minimize theinterference of complementary strands during hybridiza-tion. Accordingly, single-stranded array elements givehigher signals than double-stranded elements of the samesize and sequence on Codelink slides (D.V., unpublishedobservations).
Effects of array element size and position on fluorescence signals and ratiosFigure 1Effects of array element size and position on fluorescence signals and ratios. (A) PCR products of varying sizes (80–1500 bp) were used as array elements for two genes (mid1 and cdc12). In all cases, the 3' ends of the array elements were kept constant (~50 bp upstream of the stop codon). Top: fluorescence signals (local background subtracted) relative to array element size; the means and standard deviations of eight signal measurements are shown (two self-self experiments with two replicate meas-urements of both Cy3 and Cy5 each). Bottom: normalized ratios of signals (Cy5/Cy3) relative to array element size; the means and standard deviations of four measurements are shown (two self-self experiments with two replicate measurements each). (B) PCR products from varying positions within two genes (ags1 and tif471) were used as array elements. In all cases, the sizes of array elements were similar (~500 bp). Top: fluorescence signals (local background subtracted) relative to array element position (measured as distance of 3'ends of elements to stop codon); the means and standard deviations of eight signal meas-urements are shown (two self-self experiments with two replicate measurements of both Cy3 and Cy5 each). Bottom: normal-ized ratios of signals (Cy5/Cy3) relative to array element position; the means and standard deviations of four measurements are shown (two self-self experiments with two replicate measurements each).
Page 3 of 15(page number not for citation purposes)

BMC Genomics 2003, 4 http://www.biomedcentral.com/1471-2164/4/27
Initial data processing and normalizationWe developed a script for data pre-processing and normal-ization (for details, see Methods). To filter out unreliabledata, we only use signals from those spots with more than50% of the pixels greater than two standard deviations(SD) above local background signal in both channels.Data from spots showing more than 95% of the pixelsgreater than 2 SD above local background in one channelare retained, even if the other channel does not pass thenormal cutoff. This prevents the elimination of data fromgenes that are not or very weakly expressed in one condi-tion, but show reliable expression in the other condition.Although the absolute ratio values from such spots willnot be accurate, it is valuable to identify these genes asthey are expected to be clearly differentially expressed. Thescript also provides a quality control report indicating thenumber and percentages of discarded spots as well as dataof genes with low correlation between replicate spots.
DNA microarray data are based on signal ratios, and therelative fluorescence intensities between the scannedchannels must be normalized to adjust for systematicbiases such as differences in RNA levels, dye incorpora-tion, and detection efficiencies. To visualize the globalstructure of microarray data, it is popular to use ratio-intensity plots (also referred to as MA plots) [22,23].These plots can reveal signal intensity-dependent biases inratio measurements caused by non-linear effects of fluo-rescence dyes at extreme signals. Figure 2A shows that thelog signal ratios deviate from zero in the low signal range.A proposed way to correct for such effects is by Lowessnormalization [8,24], although the actual reasons for theimbalances that Lowess corrects are not well understood[25]. After filtering out data from weak signals asdescribed above, the remaining signals do not appear toshow intensity-dependent biases (blue spots in Figure2A). Moreover, results were very similar either with or
without Lowess normalization using GeneSpring (datanot shown). We therefore do not apply this type of nor-malization to our data.
The positions of the spots on the array, unlike the signalintensities, did have a pronounced effect on the signalratios in many of our arrays (Figure 3A). The pattern andstrength of these spatial effects varies from slide to slide.For the purpose of illustration, we show an extreme caseof this phenomenon, but the effects we normally observeare much milder. These spatial artifacts could be caused byuneven slide surface or differences in hybridization condi-tions across the array, by the scanning process, or by acombination of all (unpublished observations; see also[26]). The spatial effects varied continuously from regionto region and did not correlate with sub-grids of the arraythat are printed with different spotting pins. It is thereforeunlikely that the observed irregularities are caused by thespotting pins, although pin variations can lead to localdifferences in signal ratios in some cases [24]. These spa-tial artifacts cannot be corrected with a global normaliza-tion, and our script therefore uses a local normalizationscheme. For each spot on the array, we apply a slidingwindow of neighboring spots (see Methods for details).Assuming that the median ratio of all spots showingmeasurable signals within the sliding window should be1, the script calculates a normalization factor for the signalratio of the central spot. The array elements are orderedrandomly on the array with regard to chromosomeposition, minimizing the probability that our normaliza-tion scheme masks any biological effects caused bygenome rearrangements such as deletions or duplications.
The application of this local normalization scheme leadsto ratios that are well balanced over the entire measurablesignal range (Figure 2B,2C) and that no longer show anyposition-dependent effects (Figure 3B,3C). To further test
Table 1: Strand-specific array elements report direction of transcription
Gene [Reference] Array element direction a) Mean signal +/- SD b)
meiRNA [42] forward 2790 +/- 850reverse 30 +/- 17
meu3 [37] forward 25440 +/- 12210reverse 40 +/- 37
meu11 [37] forward 1040 +/- 250reverse 8 +/- 5
meu19 [37] forward 35960 +/- 13470reverse 70 +/- 40
meu20 [37] forward 5100 +/-1050reverse 30 +/- 20
a) forward: coding strand contains 5'-amino modification; reverse: non-coding strand contains 5'-amino modification. b) Mean and standard deviation of six fluorescence signals (3 experiments with two replicate measurements each) from meiotic pat1 timecourse at 5 hr timepoint [16].
Page 4 of 15(page number not for citation purposes)

BMC Genomics 2003, 4 http://www.biomedcentral.com/1471-2164/4/27
Ratio-intensity plots before and after normalizationFigure 2Ratio-intensity plots before and after normalization. (A) log-transformed signal ratios (Cy3/Cy5) are plotted against the log-transformed products of signal intensities. Grey spots: discarded data that were filtered out by initial data processing (see text for details); blue spots: data used for further evaluation. Left side: temperature experiment with sample from cells grown at 25°C labelled with Cy5 and sample from cells grown at 30°C labelled with Cy3. Right side: identical sample labelled with Cy3 and Cy5 and hybridised on same array ('self-self' hybridisation): all signal ratios are expected to be 1, and the absence of differ-ential gene expression is reflected by a tighter distribution of the spots. The number of the blue spots that were retained for data evaluation is 9161 (left) and 8560 (right). (B) As in (A) after normalization of the data using our local normalization scheme. (C) Overlay of spots before (blue) and after (red) normalization.
Page 5 of 15(page number not for citation purposes)

BMC Genomics 2003, 4 http://www.biomedcentral.com/1471-2164/4/27
Correction of spatial artifacts by local normalizationFigure 3Correction of spatial artifacts by local normalization. (A) Distribution of signal ratios along the Y- (left) and X-axis (right) of the microarray slide before normalization. The data are from the same array as in Figure 2 (left side). Only spots giving usable data are shown. The groups of spots separated by small gaps reflect the 12 × 4 sub-grids of the array, each printed with a dif-ferent spotting pin. (B) Distribution of signal ratios as in (A) after local normalization of the data. (C) Overlay of the data from (A) and (B).
Page 6 of 15(page number not for citation purposes)

BMC Genomics 2003, 4 http://www.biomedcentral.com/1471-2164/4/27
whether our normalization scheme improves the data, wecompared data from replicate spots on an array before andafter normalization. Indeed, replicate data are in betteragreement with each other after local normalization, con-sistent with higher data quality (Figure 4). While our nor-malization performs well in most biological conditions,the assumption that the median of ratios is 1 may not bevalid in some cases (e.g., in quiescent cells where much oftranscription is shut down). If there are large differences ingene expression between the samples, it should be prefer-able to use external controls for normalization.
Sensitivity, specificity, and accuracy of microarray dataThe fission yeast microarrays contain a range of controlspots including elements for five bacterial genes (seeMethods). Spots with these bacterial genes do not pick upany measurable signals when hybridized with fissionyeast cDNA (negative controls). Spiking of known quanti-ties of the corresponding bacterial mRNAs into the label-ling mix allows to estimate the linear range and sensitivityof our arrays (Figure 5). The signal readout is linear over awide range of at least 3–3000 pg amount of transcript. Wecan easily measure fluorescence signals from transcriptamounts as low as 3 pg (in a complex sample of 20 µg of
total RNA). This should allow detection of one mRNAmolecule in a population of at least 400,000, thus allow-ing the measurement of very weakly expressed genes,given the low-complexity fission yeast genome. Thenumber of genes that produce measurable signalsdepends on biological conditions and on array quality.For exponentially growing cells, we typically measure 80–90% of all genes. Some 350 genes did not give measurablesignals in any of six self-self experiments of cells vegeta-tively growing in rich (4 experiments) or minimalmedium (2 experiments), suggesting that these genes arenot or very lowly expressed in vegetative cells. There wasno significant difference in the number of measurablegenes between cells grown in rich vs minimal medium.Although we cannot directly correlate these data with thenumber of genes actually being expressed, it appears thatthe majority of genes show at least a basal level of expres-sion during exponential vegetative growth, given that neg-ative control genes do not give any signals abovebackground. In humans fewer genes appear to beexpressed in a given cell line [27], although it can be ashigh as 80% for some tissue culture samples [22].
Replicate data are more similar to each other after local normalizationFigure 4Replicate data are more similar to each other after local normalization. The ratios of signal ratios from corresponding pairs of replicate spots on the same array were determined for all array elements (Ratio 1 / Ratio 2). Increased agreement between replicate measurements leads to ratios of signal ratios closer to 1. The data are from the same array as in Figure 2 (left side) and Figure 3. Left histogram: replicate data distribution before normalization; right histogram: replicate data distribution after normalization.
Page 7 of 15(page number not for citation purposes)

BMC Genomics 2003, 4 http://www.biomedcentral.com/1471-2164/4/27
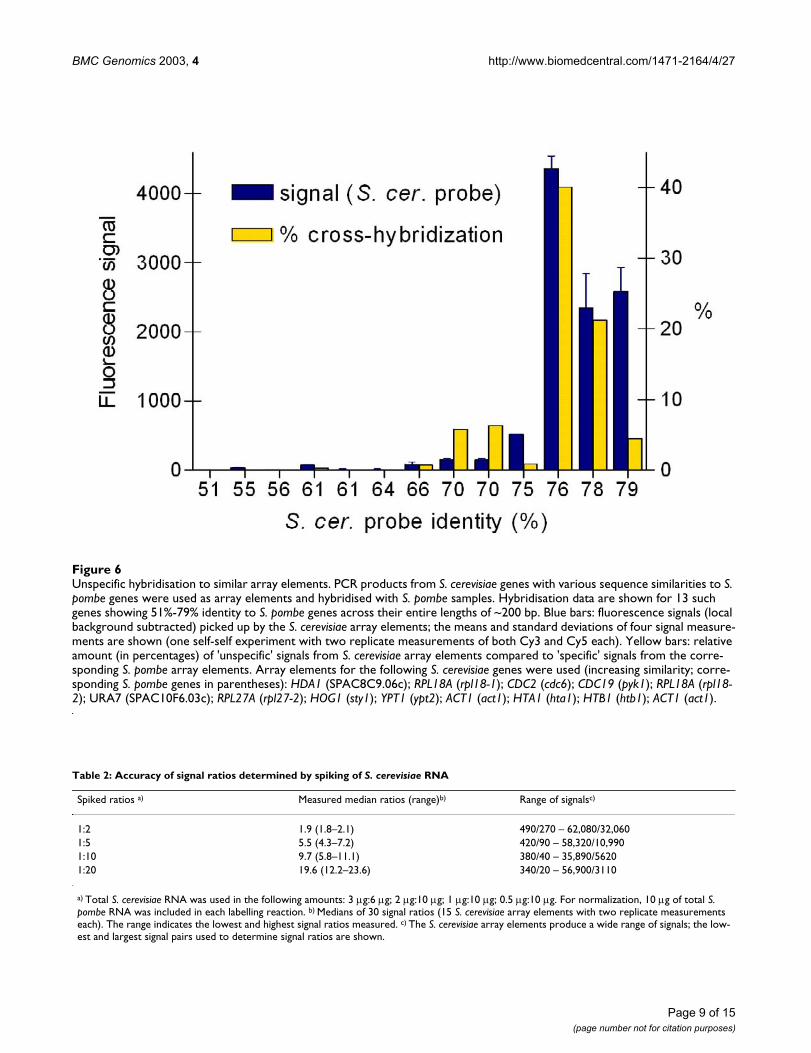
The arrays also contain elements for a range of buddingyeast genes that show varying degrees of DNA sequenceidentity to specific fission yeast genes (22 array elementsranging from 30–79% identity to S. pombe elements). Thisallows to estimate the level of sequence diversity requiredbetween two genes to give specific signals. Figure 6 showshybridization data of the 13 array elements with the high-est similarity to S. pombe genes. Both the absolute'unspecific' signal intensities and the percentages of'unspecific' relative to 'specific' signals are shown, becausehighly expressed genes are expected to result in higherabsolute 'unspecific' signal intensities. Cross-hybridiza-tion becomes apparent with array element sequence iden-tities higher than ~70% under our optimizedhybridization and washing conditions. Array elementswith lower than 70% identity had very weak signals with-out exception that would not pass our cutoff criteria. TheS. pombe array elements were selected to be less than~70% identical to other regions in the genome whereverpossible (see Methods). We therefore expect that therewill be only few skewed data due to cross-hybridization.
We also determined the accuracy of the signal ratios meas-ured with our arrays using the S. cerevisiae elements. Tothis end, we spiked S. cerevisiae RNA in various amounts
into the labelling reactions and compared expected withmeasured signal ratios after microarray hybridization(Table 2). The median signal ratios were close to theexpected ratios in all cases and for a wide range of signalintensities; the least accurate measurements were ~40%lower than expected. S. cerevisiae array elements withmore than 70% homology to S. pombe genes gave lowerthan expected ratios (probably due to competitive hybrid-ization from S. pombe samples) and were not included inthe data of Table 2. We conclude that our arrays give accu-rate data for signal ratios within the range tested.
Reproducibility of array dataInformation from repeatedly spotted array elements andrepeatedly hybridised experiments help to assess dataquality and reliability. Reproducibility can be measured atdifferent levels: 1) duplicate spots within an array, 2)hybridisation of an identical sample to different arrays(technical repeats), and 3) hybridisation of independentsamples from two identical experiments (biologicalrepeats). As measures for reproducibility, we have calcu-lated the standard deviation (SD) and coefficient of varia-tion (CV) between repeatedly measured signal ratios(Table 3). Generally, the microarrays give highly repro-ducible results with typically no or very few genes
Linear readout range and detection limit of spiked RNA samplesFigure 5Linear readout range and detection limit of spiked RNA samples. 20 µg of S. pombe total RNA was spiked with five Bacillus sub-tilis mRNAs at various concentrations. Left side: lysA (3 pg), pheB (15 pg), thrB (30 pg), dapB (150 pg), and trpC (300 pg); right side: lysA (60 pg), pheB (300 pg), thrB (600 pg), and dapB (3000 pg). The median fluorescence intensities above local back-ground of the B. subtilis control spots (determined from ~100 spots/transcript distributed evenly across the array) were plot-ted as a function of transcript concentration.
Page 8 of 15(page number not for citation purposes)
BMC Genomics 2003, 4 http://www.biomedcentral.com/1471-2164/4/27
Unspecific hybridisation to similar array elementsFigure 6Unspecific hybridisation to similar array elements. PCR products from S. cerevisiae genes with various sequence similarities to S. pombe genes were used as array elements and hybridised with S. pombe samples. Hybridisation data are shown for 13 such genes showing 51%-79% identity to S. pombe genes across their entire lengths of ~200 bp. Blue bars: fluorescence signals (local background subtracted) picked up by the S. cerevisiae array elements; the means and standard deviations of four signal measure-ments are shown (one self-self experiment with two replicate measurements of both Cy3 and Cy5 each). Yellow bars: relative amount (in percentages) of 'unspecific' signals from S. cerevisiae array elements compared to 'specific' signals from the corre-sponding S. pombe array elements. Array elements for the following S. cerevisiae genes were used (increasing similarity; corre-sponding S. pombe genes in parentheses): HDA1 (SPAC8C9.06c); RPL18A (rpl18-1); CDC2 (cdc6); CDC19 (pyk1); RPL18A (rpl18-2); URA7 (SPAC10F6.03c); RPL27A (rpl27-2); HOG1 (sty1); YPT1 (ypt2); ACT1 (act1); HTA1 (hta1); HTB1 (htb1); ACT1 (act1).
Table 2: Accuracy of signal ratios determined by spiking of S. cerevisiae RNA
Spiked ratios a) Measured median ratios (range)b) Range of signalsc)
1:2 1.9 (1.8–2.1) 490/270 – 62,080/32,0601:5 5.5 (4.3–7.2) 420/90 – 58,320/10,9901:10 9.7 (5.8–11.1) 380/40 – 35,890/56201:20 19.6 (12.2–23.6) 340/20 – 56,900/3110
a) Total S. cerevisiae RNA was used in the following amounts: 3 µg:6 µg; 2 µg:10 µg; 1 µg:10 µg; 0.5 µg:10 µg. For normalization, 10 µg of total S. pombe RNA was included in each labelling reaction. b) Medians of 30 signal ratios (15 S. cerevisiae array elements with two replicate measurements each). The range indicates the lowest and highest signal ratios measured. c) The S. cerevisiae array elements produce a wide range of signals; the low-est and largest signal pairs used to determine signal ratios are shown.
Page 9 of 15(page number not for citation purposes)

BMC Genomics 2003, 4 http://www.biomedcentral.com/1471-2164/4/27
showing greater than 2-fold differences between differentmeasurements (Figure 7A). Technical and biologicalrepeats were compared after averaging data from dupli-cate spots within one array, which produces more accuratemeasurements and reduces variability. Forstraightforward biological experiments (such as the com-parison of cells logarithmically growing in differentmedia, Figure 7A), biological repeats gave similar repro-ducibility to technical repeats. However, the variability ofbiological repeats tended to be higher than for technicalrepeats in many experiments where biological conditionscould not be as tightly controlled (Table 3). Because thetechnical variability is consistently low in our arrays, wealways use samples prepared from independent biologicalexperiments to obtain repeated measurements on differ-ent arrays. This is the most effective use of microarrays asthe biological variability, which is the source of the great-est noise in most cases, is included in the repeated meas-urements (see also [6]).
To check for systematic biases in fluorescent dye incorpo-ration, we performed a series of self-self hybridisations,i.e., an identical sample was labelled with both the Cy3and Cy5 fluorochrome and hybridised on the same array.A typical scatter plot of such a hybridisation is shown inFigure 7B. The great majority of genes appeared to be sim-ilarly labelled with both dyes, and amongst the spots withgood data (blue) no signal intensities were greater than 2-fold different in the two channels. The average SD of sig-nal ratios from self-self experiments was 0.08. However, ifself-self experiments were repeated using the same sam-ple, a number of genes appeared as significantlydifferentially expressed. For example, using significanceanalysis of microarrays (SAM) allowing one false positive[28], no genes appeared as differentially expressed withup to three technical repeats, but 108 genes were identi-fied as 'differentially expressed' with four technical
repeats. If the signal ratios from two of these self-selfexperiments were inverted, no differentially expressedgenes were found by SAM. This indicates that the 108 'sig-nificant' genes do not reflect a stochastic process but a sys-tematic bias for some genes, most likely in dyeincorporation. This bias is too subtle to be evident withfew repeats, but became statistically significant if theexperiment was repeated more than three times. To pre-vent this dye bias, we routinely swap the dyes duringlabelling for repeated hybridisations.
ConclusionsWe present a complete description of our microarray plat-form for fission yeast together with various data on arrayperformance and properties that are rarely reported. Thishelps to compare our microarrays with other platforms,and it provides a framework to put array data into contextand understand their potential and limits. We also reportstraightforward and reliable experimental procedurestogether with a data evaluation pipeline optimised for thefission yeast microarrays. This results in accurate, sensi-tive, and highly reproducible data, allowing reliable meas-urements of expression ratios of the great majority of allfission yeast genes. The reported procedures and resourcesshould also be useful for other microarray systems. To getthe best data out of a limited number of arrays, we recom-mend to use samples from independent biological exper-iments and to swap the fluorescent dyes for repeatedhybridisations. All experimental protocols, primersequences, and the scripts for primer design and initialdata processing are available from our website [29].
MethodsMicroarray construction: primer design, PCR reactions, and arrayingWe generated each array element by polymerase chainreaction (PCR) using gene-specific primer pairs (GenSet)
Table 3: Reproducibility of array data
Measurement Mean SD (Range) a) CV (Range) b)
Within array replicates c) 0.04 (0.03–0.06) 4.4% (3.1–6.2%)Technical repeats d) 0.04 (0.02–0.06) 4.5% (2.5–6.3%)Biological repeats e) 0.07 (0.05–0.10) 6.4% (4.9–8.1%)
a) Standard deviation (SD) of signal ratios were calculated for each measurable pair of array elements, and the mean SDs of all repeated measure-ments are indicated. The range indicates the lowest and highest mean SDs obtained from several pairs of comparisons. b) CV: Coefficient of varia-tion: [(SD of signal ratios × 100)/mean of signal ratios] was calculated for each measurable pair of array elements, and the mean CVs of all repeated measurements are indicated. The range indicates the lowest and highest mean CVs obtained from several pairs of comparisons. c) Determined from 10 arrays of experiments used in this study (4 self-self, 1 temperature, 4 media, and 1 harvesting experiment; see Methods). d) Determined from 7 pairs of arrays from this study (4 self-self, 4 media) and from [17](oxidative stress); for each pair identical RNA samples were used that were labelled independently and with reverse colors for the two hybridisations. Within array replicate data were averaged before analysis. e) Determined from 9 pairs of arrays from this study (4 self-self, 4 media) and from [17](oxidative stress); for each pair RNA samples from identical but independ-ent biological experiments were used that were labelled with reverse colors for the two hybridisations. Within array replicate data were averaged before analysis.
Page 10 of 15(page number not for citation purposes)

BMC Genomics 2003, 4 http://www.biomedcentral.com/1471-2164/4/27
selected for each of the predicted and known ORFs in theannotated S. pombe genome sequence [10,11]. We wrote aPerl script (available at our website: [29]) to batch processEMBL format files for exon selection and primer process-ing. PRIMER3 [30,31] was used to determine primersequences matching defined criterions. The majority ofprimers were 18–22 bp long with melting temperaturesbetween 58–62°C and GC contents between 40–60%.Primers were selected such that the resulting ampliconswere 180–500 bp long and contained 100% exonsequence, and the reverse primers were positioned <2500bp upstream of the stop codon. All the forward primershad an additional 8 bp universal sequence at their 5' end(5'-TGACCATG-3'), which is not included in aboveparameters. All primer and amplicon sequences wereblasted against the S. pombe genome. Only primers andamplicons that showed no significant similarity to othersequences in the genome were used (i.e., primers with ablast score of <70 and amplicons with a blast score of<400, the latter corresponding to less than ~70%sequence identity). For ~50 genes, we amplified up to 150
bp of 3'- or 5'-untranslated regions to obtain more specificarray elements. In a few cases of highly similar genes, wehad to use less specific array elements (blast score of<1000 with other sequences in the genome); this affected~140 genes, including many ribosomal protein and trans-poson-related genes.
In addition to the predicted ORFs, we amplified fragmentsof the 11 mitochondrial genes, 19 pseudogenes, variousRNA genes (a few genes for ribosomal RNA, tRNAs, andsnRNAs as well as 68 other larger genes for 'miscellaneousRNAs' [32]), 114 very hypothetical ORFs, 33 large introns,as well as centromeric repeats and ars elements. The latestmicroarrays contain elements for 5269 different genesand other genomic features of fission yeast. Some genesare represented by two or more different array elements.We also designed array elements from 22 S. cerevisiaegenes showing varying degrees of similarity to S. pombegenes to control for cross-hybridization. The arrays alsocontain elements for several widely used markers andepitope tagging sequences: Kan-MX, GFP, GST, Myc, and
Reproducibility of signal ratios and intensitiesFigure 7Reproducibility of signal ratios and intensities. (A) Scatter plot showing the reproducibility between two biological repeats of an experiment where cells grown in minimal or rich media were directly compared to each other. The plot represents 4245 genes that gave measurable data in both experiments. The CV for the repeated experiment shown here is 5%. Just one gene shows an ~2-fold difference in ratios between the two experiments (just outside the outer lines). (B) Autocorrelation plot showing the distribution of Cy5 and Cy3 signal intensities from a single self-self experiment. Median signal intensities minus median local background intensities were determined and signals from replicate spots were averaged. Grey spots: data from 790 spots that were flagged 'absent' during analysis or initial data processing (see Methods). Blue spots: data from 4260 spots that were retained for evaluation. All the signal intensities from the blue spots are <2-fold different from each other (within outer lines).
Page 11 of 15(page number not for citation purposes)

BMC Genomics 2003, 4 http://www.biomedcentral.com/1471-2164/4/27
3HA [33]; TAP [34]; and Pk [35]. A detailed file containingall the primer sequences and parameters is available fromour website [29]. PCR products of five genes from theprokaryote Bacillus subtilis were used as control elementson the array (lysA, pheB, dapB, thrB, and trpC). These canbe used as positive controls by spiking in a 'cocktail' of thecorresponding bacterial mRNAs in known quantities (fordetails on control genes and preparation of mRNA 'cock-tails' by in vitro transcription, see [36]).
PCR reactions were performed in 96-well plates (Costar)using a Tetrad thermocycler (MJ Research). For each arrayelement, two rounds of PCR reactions were performed.For the first PCR reaction, we used gene-specific primerpairs, with forward primers containing an additional uni-versal sequence (see above). As a template, we usedgenomic DNA prepared with a simple glass bead protocol[33]. To amplify array elements from genes containingonly small exons (<250 bp), we used pools of cDNAlibraries as a template ([37,38]; pREP3X: constructed by B.Edgar and C. Norbury; Clontech). PCR products from thefirst round were used as templates for the second round ofPCR reactions, together with gene-specific reverse primersand a universal forward primer containing a 5'-aminomodification (5'-GCTGAACAGCTATGACCATG-3';Oswel). Details of the PCR reaction mixes and cyclingparameters are available from our website [29]. All PCRproducts were checked for single strong bands of expectedsizes on 2.5% agarose 1x TBE slab gels. Typically, the fail-ure rate was <3%. Failed PCR reactions were repeated, andnew primer sequences were ordered in cases where PCRreactions failed repeatedly. At the time of writing, arrayelements for all predicted genes had been successfullyamplified. The gene-specific primer pairs together withthe two sequential and independent PCR reactions makeit highly unlikely that array elements are assigned towrong genes.
Spotting buffer was added to the PCR products at a finalconcentration of 250 mM sodium phosphate pH 8.5,0.00025% Sarkosyl, followed by spin filtration using 96-well filtration plates (Millipore). The filtered array ele-ments with spotting buffer (15 µl total volume) were thenre-arrayed into 384 well plates (Genetix), snap frozen ondry ice, and stored at -70°C. These array elements wereprinted without any further purification onto activatedamine-binding slides (Codelink, Amersham) using aBioRobotics TAS arrayer with a 48-pin tool. All array ele-ments are printed in duplicate onto each slide (~13,000spots/slide). The replicate spots are printed in separatehalves of the slides and with different spotting pins toobtain two measurements that are as independent as pos-sible [6], and to prevent local depletion of the sample andminimize the chance of losing both measurements of agene due to local hybridisation problems (unpublished
observations). One array of each batch was quality controltested by hybridization. Array elements were dried com-pletely in a vacuum concentrator and stored at -70°C insealed plates between print rounds. Before printing, arrayelements were reconstituted by addition of HPLC water(BDH) and left to dissolve o/n at 4°C. Details of the array-ing and post-processing procedures are available from thewebsite of the Microarray Facility at the Sanger Institute[36].
RNA isolation from fission yeastWe used the S. pombe wild-type strain 972 h- for all exper-iments [39]. Standard media and growth conditions wereused [40], and cells were harvested from liquid cultures atmid-exponential phase (OD600 0.1–0.4), unless statedotherwise. For the spike-in experiment (Table 2), S. cerevi-siae cells (strain AB1380) were grown in YPD medium toOD600 0.3, and RNA was extracted as described below forS. pombe cells.
Cells were harvested either by mild centrifugation (2 min,800 rcf), and the pellet was snap frozen in liquid nitrogenafter discarding the supernatant, or by rapid filtration(Millipore), and the filters were snap frozen in liquidnitrogen after transfer into a 50 ml tube. To see whetherthese two methods of cell harvesting affect geneexpression, we used a microarray to directly compare RNAsamples obtained after cell filtration or centrifugation ofthe same culture grown in EMM medium. The dataobtained from the two samples were very similar to eachother (SD of signal ratios: 0.08), and only two mitochon-drial genes were 2-fold different between the samples. Weconclude that the two methods of cell harvesting that weroutinely use do not lead to significant differences in geneexpression.
Total RNA was isolated from S. pombe cells using a hotphenol method followed by phenol-chloroform extrac-tions, precipitation, and purification using Qiagen RNe-asy columns. (We had also experimented with isolatingmRNA before labelling, and only a few genes give differ-ent results compared to total RNA. Because mRNA isola-tion requires much larger cell samples and potentiallyintroduces biases, we routinely use total RNA for label-ling.) RNA quality was determined by gel electrophoresisand spectrophotometry. A detailed protocol is availablefrom our website [29].
Sample labelling and microarray hybridisationTo generate fluorescently labelled samples for microarrayhybridisation, we used a direct labelling protocol. 10–20µg of total RNA was reverse transcribed into cDNA withSuperscript enzyme (GibcoBRL) and an oligo-dT17 primerin the presence of Cy3- or Cy5-dCTP (PerkinElmer). Wehave also experimented with a mix of random nonamer
Page 12 of 15(page number not for citation purposes)

BMC Genomics 2003, 4 http://www.biomedcentral.com/1471-2164/4/27
and oligo(dT) primers for labelling; although this willlead to amplification of non-coding RNAs, it does not giveincreased background, and significantly improves the sig-nal intensities of most spots. Only a few genes are differ-entially labelled when comparing the two primingmethods. One advantage of using a random primer is thatmRNAs without or with short polyA tails will also be rep-resented in the hybridisation. The labelled cDNAs werepurified using AutoSeq G-50 columns (Amersham) andprecipitation. Hybridization was performed at 49°C in abuffer containing 48% formamide using LifterSlips (ErieScientific) and a hybridisation oven with humid chamber(Boekel Scientific). Slides were washed at roomtemperature and stored in the dark for scanning. Adetailed protocol for labelling, hybridisation, and slidewashing is available from our website [29].
Data acquisition, processing, normalization, and evaluationMicroarrays were scanned using a GenePix 4000 B laserscanner, and fluorescence signals were analysed usingGenePix Pro software (Axon Instruments). Array imagesthat did not pass minimal quality thresholds were notused (median signal-to-background >3; median signal-to-noise >5; mean of median background signal <200).Technically flawed spots were removed either automati-cally by the GenePix software or through manual investi-gation of the array images, and such spots were flagged as'absent' in the GenePix results files.
For subsequent data processing and normalization, wedeveloped a Perl script that uses GenePix results files asinput (script available from or website [29]). This scriptdiscards data from spots with failed or faulty PCR prod-ucts by masking them 'absent'. Data from spots with lowarray element concentration (as judged by PCR productstaining on gel) or PCR products where the reverse primeris located 2500–3500 bp from the gene end are flagged'marginal'. All genes on the array are also represented byat least one good array element, and 'marginal' data fromsub-optimal array elements are only used as a backup ifother data from a given gene are not available. The scriptalso applies cut-off criteria to discard data from weak sig-nals: spots with <50% of pixels >2 SD above median localbackground signal in one or both channels are flagged'absent', unless one channel shows >95% of the pixels >2SD above local background. The SD was calculated usingonly the lower 55% of the pixel intensities (called SD2 inGenePix Pro), as this measure is less susceptible to beingskewed by bright pixels. The script provides a quality con-trol report showing the numbers and percentages of spotsdiscarded during the various steps of the data analysispipeline as well as data of replicate spots with signal ratios>2-fold different from each other.
The script also performs a local normalization using asliding square window of spots surrounding each spot. Auser-defined minimum number of spots is chosen to beused with which to normalize over (default is 400). Thewindow size default is 16 spots. This means the squarecontains 33 × 33 spots (1089) surrounding central spots,33 × 17 spots (561) surrounding spots at the edge of thearray, and 17 × 17 spots (289) surrounding spots in a cor-ner of the array. Only spots that are flagged 'present' areused for the normalization. Hence, using a window of 16means that sometimes, especially for spots close to thecorners of the array, less than 400 spots may actually beused for the normalization. In cases where the block sizechosen is small, the window size is increased up to a user-defined maximum window size (default is 24) so that atleast 600 total spots are in the square. This means theblock size used with this window change is larger thanmay be necessary to optimise the chances of having 400'present' spots to use for normalization. This is a heuristicto make the algorithm faster for the majority of spots,since counting the number of 'present' spots in the initialsquare uses a relatively large amount of computationaltime. If, during normalisation, the number of spots is stillfound to be less than 400, the window is increased furtheruntil the maximum window size is reached. In these cases,the spots that do use less than 400 spots for normalisationare reported in the output log file. The script then calcu-lates a normalization factor such that the median signalratio of all measurable spots within the square equals 1,and this factor is then used to scale the signal ratio for thecentral spot. The signal ratios used for normalization cor-respond to the median of all pixel-by-pixel ratios of sig-nals minus median local background for each pixel of agiven spot (called 'median of ratios' in GenePix Pro). Thismeasures ratios more reliably and is less affected byunspecific signals than the 'ratio of medians' (see also[41]). In the rare cases where the 'median of ratios' waszero, the 'ratio of medians' was used instead for data eval-uation. Finally, the script averages the normalized datafrom all replicate spots that produced measurable signalratios of the same genomic element. These mean normal-ized ratios were then used for downstream data evalua-tion and mining using GeneSpring (Silicon Genetics) andSAM [28].
Microarray experiments used in this studySelf-self experiments were performed with RNA isolatedfrom exponentially growing cells, followed by labellingidentical samples with both Cy3 and Cy5 fluorochromesand hybridising on the same array (six experiments intotal). Self-self experiments were used for data in Figure 1,Figure 2 (right), Figure 5, Figure 6, Figure 7B, Table 2, andTable 3. For experiments showing differential gene expres-sion, we compared samples from cells growing at 25°C vs30°C (one experiment; used for Figure 2 [left], Figures
Page 13 of 15(page number not for citation purposes)
BMC Genomics 2003, 4 http://www.biomedcentral.com/1471-2164/4/27
3,4,5, and Table 3), samples from cells growing in full vsminimal medium (four experiments; used in Figure 7Aand Table 3), as well as samples from cells harvested bycentrifugation vs filtration (one experiment; used in Table3). Some data were acquired from previously publishedexperiments, including samples from meiotic vs vegeta-tive cells ([16]; Table 1) and samples from oxidativelystressed vs unstressed cells ([17]; Table 3).
Authors' contributionsRL wrote the computer scripts for primer design and ini-tial data processing, gave informatics support, and con-tributed to data evaluation. GB amplified the arrayelements, developed optimised protocols, performedmost of the microarray experiments, and contributed todata evaluation. JM developed the scheme for local nor-malization and participated in data evaluation. CJPrefined the computer scripts and participated in data man-agement and organization. GR and DC contributed toprotocol optimisation and some experiments. CL and DVhelped to build and print the arrays and provided initialprotocols. JB conceived the study, participated in itsdesign and coordination, and drafted the manuscript. Allauthors read and approved the final manuscript.
AcknowledgementsWe thank Val Wood for help with genome information, the Microarray Facility at the Sanger Institute for arraying, Aengus Stewart and Mike Lyne for help with primer design, and Hiroshi Nojima for a meiotic cDNA library.
This work was funded by Cancer Research UK.
References1. Brown PO and Botstein D: Exploring the new world of the
genome with DNA microarrays Nat Genet 1999, Suppl 21:33-37.
2. Lockhart D and Winzeler E: Genomics, gene expression andDNA arrays Nature 2000, 405:827-836.
3. Young R: Biomedical discovery with DNA arrays Cell 2000,102:9-16.
4. Schena M, Shalon D, Davis RW and Brown PO: Quantitative mon-itoring of gene expression patterns with a complementaryDNA microarray Science 1995, 270:467-470.
5. Shalon D, Smith SJ and Brown PO: A DNA microarray system foranalyzing complex DNA samples using two-color fluores-cent probe hybridization Genome Res 1996, 6:639-645.
6. Churchill GA: Fundamentals of experimental design for cDNAmicroarrays Nat Genet 2002, 32(Suppl 2):490-495.
7. Holloway AJ, Van Laar RK, Tothill RW and Bowtell DD: Optionsavailable-from start to finish-for obtaining data from DNAmicroarrays II Nat Genet 2002, 32(Suppl 2):481-489.
8. Quackenbush J: Microarray data normalization andtransformation Nat Genet 2002, 32(Suppl 2):496-501.
9. Yang YH and Speed T: Design issues for cDNA microarrayexperiments Nat Rev Genet 2002, 3:579-588.
10. Wood V, Gwilliam R, Rajandream M-A, Lyne M, Lyne R, Stewart A,Sgouros J, Peat N, Hayles J and Baker S et al.: The genomesequence of Schizosaccharomyces pombe Nature 2002, 415:871-880.
11. Schizosaccharomyces pombe GeneDB [http://www.genedb.org/genedb/pombe/index.jsp]
12. Wood V and Bähler J: How to get the best from fission yeastgenome data Comp Funct Genom 2002, 3:282-288.
13. Delneri D, Branca FL and Oliver SG: Towards a truly intergrativebiology through the functional genomics of yeast Curr OpinBiotechnol 2001, 12:87-91.
14. Kumar A and Snyder M: Emerging technologies in yeastgenomics Nat Rev Genet 2001, 2:302-312.
15. Heckman DS, Geiser DM, Eidell BR, Stauffer RL, Kardos NL andHedges SB: Molecular evidence for the early colonization ofland by fungi and plants Science 2001, 293:1129-1133.
16. Mata J, Lyne R, Burns G and Bähler J: The transcriptional programof meiosis and sporulation in fission yeast Nat Genet 2002,32:143-147.
17. Chen D, Toone WM, Mata J, Lyne R, Burns G, Kivinen K, Brazma A,Jones N and Bähler J: Global transcriptional responses of fissionyeast to environmental stress Mol Biol Cell 2003, 14:214-229.
18. Stillman BA and Tonkinson JL: Expression microarray hybridiza-tion kinetics depend on length of the immobilized DNA butare independent of immobilization substrate Anal Biochem2001, 295:149-157.
19. Franssen-van Hal NL, Vorst O, Kramer E, Hall RD and Keijer J: Fac-tors influencing cDNA microarray hybridization on silylatedglass slides Anal Biochem 2002, 308:5-17.
20. Perez-Hidalgo L, Moreno S and San-Segundo PA: Regulation ofmeiotic progression by the meiosis-specific checkpointkinase Mek1 in fission yeast J Cell Sci 2003, 116:259-271.
21. Molnar M, Parisi S, Kakihara Y, Nojima H, Yamamoto A, Hiraoka Y,Bozsik A, Sipiczki M and Kohli J: Characterization of rec7, anearly recombination gene in Schizosaccharomyces pombe.Genetics 2001, 157:519-532.
22. Yang IV, Chen E, Hasseman JP, Liang W, Frank BC, Wang S, Sharov V,Saeed AI, White J and Li J et al.: Within the fold: assessing differ-ential expression measures and reproducibility in microar-ray assays Genome Biol 2002, 3:research0062.
23. Yang YH and Speed T: Representing and evaluating slide data InDNA Microarrays Edited by: Bowtell D, Sambrook J. New York: Cold SpringHarbor Laboratory Press; 2002:544-551.
24. Yang YH, Dudoit S, Luu P, Lin DM, Peng V, Ngai J and Speed TP: Nor-malization for cDNA microarray data: A robust compositemethod addressing single and multiple slide systematicvariation Nucleic Acids Res 2002, 30:e15.
25. Verdnik D, Handran S and Pickett S: Key considerations for accu-rate microarray scanning and image analysis In: DNA ArrayImage Analysis: Nuts & Bolts Edited by: Kamberova G, Shishir S. DNA PressLLC; 2002:83-98.
26. Colantuoni C, Henry G, Zeger S and Pevsner J: Local mean nor-malization of microarray element signal intensities across anarray surface: quality control and correction of spatially sys-tematic artifacts Biotechniques 2002, 32:1316-1320.
27. Snijders AM, Meijer GA, Brakenhoff RH, van den Brule AJC and vanDiest PJ: Microarray techniques in pathology: tool or toy? MolPathol 2000, 53:289-294.
28. Tusher VG, Tibshirani R and Chu G: Significance analysis ofmicroarrays applied to the ionizing radiation response ProcNatl Acad Sci USA 2001, 98:5116-5121.
29. Bähler Lab Website: Pombe Functional Genomics [http://www.sanger.ac.uk/PostGenomics/S_pombe/]
30. Rozen S and Skaletsky HJ: Primer3 on the WWW for generalusers and for biologist programmers In: Bioinformatics Methodsand Protocols: Methods in Molecular Biology Edited by: Krawetz S, MisenerS, Totowa NJ. Humana Press; 2000:365-386.
31. Primer3 Code [http://www-genome.wi.mit.edu/genome_software/other/primer3.html]
32. Watanabe T, Miyashita K, Saito TT, Nabeshima K and Nojima H:Abundant Poly(A)-bearing RNAs that lack open readingframes in Schizosacharomyces pombe. DNA Research 2002, 9:209-215.
33. Bähler J, Wu JQ, Longtine MS, Shah NG, McKenzie A III, Steever AB,Wach A, Philippsen P and Pringle JR: Heterologous modules forefficient and versatile PCR-based gene targeting inSchizosaccharomyces pombe Yeast 1998, 14:943-951.
34. Tasto JJ, Carnahan RH, McDonald WH and Gould KL: Vectors andgene targeting modules for tandem affinity purification inSchizosaccharomyces pombe Yeast 2001, 18:657-662.
35. Craven RA, Griffiths DJ, Sheldrick KS, Randall RE, Hagan IM and CarrAM: Vectors for the expression of tagged proteins inSchizosaccharomyces pombe Gene 1998, 221:59-68.
Page 14 of 15(page number not for citation purposes)

BMC Genomics 2003, 4 http://www.biomedcentral.com/1471-2164/4/27
Publish with BioMed Central and every scientist can read your work free of charge
"BioMed Central will be the most significant development for disseminating the results of biomedical research in our lifetime."
Sir Paul Nurse, Cancer Research UK
Your research papers will be:
available free of charge to the entire biomedical community
peer reviewed and published immediately upon acceptance
cited in PubMed and archived on PubMed Central
yours — you keep the copyright
Submit your manuscript here:http://www.biomedcentral.com/info/publishing_adv.asp
BioMedcentral
36. The Microarray Facility at the Sanger Institute [http://www.sanger.ac.uk/Projects/Microarrays/]
37. Watanabe T, Miyashita K, Saito TT, Yoneki T, Kakihara Y, NabeshimaK, Kishi YA, Shimoda C and Nojima H: Comprehensive isolationof meiosis-specific genes identifies novel proteins and unu-sual non-coding transcripts in Schizosaccharomyces pombeNucleic Acids Res 2001, 29:2327-2337.
38. Fikes JD, Becker DM, Winston F and Guarente L: Striking conser-vation of TFIID in Schizosaccharomyces pombe and Saccharo-myces cerevisiae Nature 1990, 346:291-294.
39. Leupold U: Genetical methods for Schizosaccharomyces pombeMeth Cell Physiol 1970, 4:169-177.
40. Fission Yeast Handbook [http://www.sanger.ac.uk/PostGenomics/S_pombe/docs/nurse_lab_manual.pdf]
41. Brody JP, Williams BA, Wold BJ and Quake SR: Significance andstatistical errors in the analysis of DNA microarray data ProcNatl Acad Sci USA 2002, 99:12975-12978.
42. Watanabe Y and Yamamoto M: S. pombe mei2 + encodes an RNA-binding protein essential for premeiotic DNA synthesis andmeiosis I, which cooperates with a novel RNA speciesmeiRNA Cell 1994, 78:487-498.
Page 15 of 15(page number not for citation purposes)
Copyright © 2022 FDOKUMEN