The Consequences of Budding versus Binary Fission on ...
29
genes G C A T T A C G G C A T Article The Consequences of Budding versus Binary Fission on Adaptation and Aging in Primitive Multicellularity Hanna Isaksson 1,2 , Peter L. Conlin 3 , Ben Kerr 4 , William C. Ratcliff 3 and Eric Libby 1,2,5, * Citation: Isaksson, H.; Conlin, P.L.; Kerr, B.; Ratcliff, W.C.; Libby, E. The Consequences of Budding versus Binary Fission on Adaptation and Aging in Primitive Multicellularity. Genes 2021, 12, 661. https://doi.org /10.3390/genes12050661 Academic Editor: J. Mark Cock Received: 2 March 2021 Accepted: 22 April 2021 Published: 28 April 2021 Publisher’s Note: MDPI stays neutral with regard to jurisdictional claims in published maps and institutional affil- iations. Copyright: © 2021 by the authors. Licensee MDPI, Basel, Switzerland. This article is an open access article distributed under the terms and conditions of the Creative Commons Attribution (CC BY) license (https:// creativecommons.org/licenses/by/ 4.0/). 1 Department of Mathematics and Mathematical Statistics, Umeå University, 90187 Umeå, Sweden; [email protected] 2 Integrated Science Lab, Umeå University, 90187 Umeå, Sweden 3 Georgia Institute of Technology, School of Biological Sciences, Atlanta, GA 30332, USA; [email protected] (P.L.C.); [email protected] (W.C.R.) 4 Department of Biology, BEACON Center for the Study of Evolution in Action, University of Washington, Seattle, WA 98195, USA; [email protected] 5 Santa Fe Institute, Santa Fe, NM 87501, USA * Correspondence: [email protected] Abstract: Early multicellular organisms must gain adaptations to outcompete their unicellular ancestors, as well as other multicellular lineages. The tempo and mode of multicellular adaptation is influenced by many factors including the traits of individual cells. We consider how a fundamental aspect of cells, whether they reproduce via binary fission or budding, can affect the rate of adaptation in primitive multicellularity. We use mathematical models to study the spread of beneficial, growth rate mutations in unicellular populations and populations of multicellular filaments reproducing via binary fission or budding. Comparing populations once they reach carrying capacity, we find that the spread of mutations in multicellular budding populations is qualitatively distinct from the other populations and in general slower. Since budding and binary fission distribute age-accumulated damage differently, we consider the effects of cellular senescence. When growth rate decreases with cell age, we find that beneficial mutations can spread significantly faster in a multicellular budding population than its corresponding unicellular population or a population reproducing via binary fission. Our results demonstrate that basic aspects of the cell cycle can give rise to different rates of adaptation in multicellular organisms. Keywords: binary fission; budding; multicellularity; aging; adaptation; filaments 1. Introduction The evolution of multicellularity gave rise to organisms whose scale and complexity significantly exceed those of their unicellular ancestors [1,2]. Yet, the early stages of multi- cellularity were likely primitive and precarious owing to the small genetic distance from unicellularity [3–8]. Central to the success of any nascent multicellular organism was the ability to gain adaptations and outcompete its ancestors along with other unicellular and multicellular lineages present in the environment [9]. Although many factors influence the ability of a multicellular lineage to gain adaptations—e.g., physical structure [10–12], the multicellular life cycle [13–16], and eco-environmental conditions [17–19]—a crucial factor may be the suite of initial traits of the component cells [20]. Comparative genomics studies show that co-option of ancestral unicellular genes is among the most common modes of adaptation in diverse multicellular lineages [21–25]. In some cases, the existence of certain characteristics in unicellular ancestors may potentiate the evolution of novel multicellular phenotypes. For example, it has been proposed that the existence of temporally alternating phenotypes found in the unicellular ancestors of metazoans, dictyostelid social amoebas, and the volvocine algae were co-opted for spatial cellular differentiation during the evolu- tion of multicellularity [22,26–28]. Thus, traits that evolved first in unicellular organisms can influence the tempo and mode of multicellular evolution in that lineage. Genes 2021, 12, 661. https://doi.org/10.3390/genes12050661 https://www.mdpi.com/journal/genes
-
Upload
khangminh22 -
Category
Documents
-
view
3 -
download
0
Transcript of The Consequences of Budding versus Binary Fission on ...

genesG C A T
T A C G
G C A T
Article
The Consequences of Budding versus Binary Fission onAdaptation and Aging in Primitive Multicellularity
Hanna Isaksson 1,2 , Peter L. Conlin 3 , Ben Kerr 4, William C. Ratcliff 3 and Eric Libby 1,2,5,*
�����������������
Citation: Isaksson, H.; Conlin, P.L.;
Kerr, B.; Ratcliff, W.C.; Libby, E. The
Consequences of Budding versus
Binary Fission on Adaptation and
Aging in Primitive Multicellularity.
Genes 2021, 12, 661. https://doi.org
/10.3390/genes12050661
Academic Editor: J. Mark Cock
Received: 2 March 2021
Accepted: 22 April 2021
Published: 28 April 2021
Publisher’s Note: MDPI stays neutral
with regard to jurisdictional claims in
published maps and institutional affil-
iations.
Copyright: © 2021 by the authors.
Licensee MDPI, Basel, Switzerland.
This article is an open access article
distributed under the terms and
conditions of the Creative Commons
Attribution (CC BY) license (https://
creativecommons.org/licenses/by/
4.0/).
1 Department of Mathematics and Mathematical Statistics, Umeå University, 90187 Umeå, Sweden;[email protected]
2 Integrated Science Lab, Umeå University, 90187 Umeå, Sweden3 Georgia Institute of Technology, School of Biological Sciences, Atlanta, GA 30332, USA;
[email protected] (P.L.C.); [email protected] (W.C.R.)4 Department of Biology, BEACON Center for the Study of Evolution in Action, University of Washington,
Seattle, WA 98195, USA; [email protected] Santa Fe Institute, Santa Fe, NM 87501, USA* Correspondence: [email protected]
Abstract: Early multicellular organisms must gain adaptations to outcompete their unicellularancestors, as well as other multicellular lineages. The tempo and mode of multicellular adaptation isinfluenced by many factors including the traits of individual cells. We consider how a fundamentalaspect of cells, whether they reproduce via binary fission or budding, can affect the rate of adaptationin primitive multicellularity. We use mathematical models to study the spread of beneficial, growthrate mutations in unicellular populations and populations of multicellular filaments reproducing viabinary fission or budding. Comparing populations once they reach carrying capacity, we find thatthe spread of mutations in multicellular budding populations is qualitatively distinct from the otherpopulations and in general slower. Since budding and binary fission distribute age-accumulateddamage differently, we consider the effects of cellular senescence. When growth rate decreases withcell age, we find that beneficial mutations can spread significantly faster in a multicellular buddingpopulation than its corresponding unicellular population or a population reproducing via binaryfission. Our results demonstrate that basic aspects of the cell cycle can give rise to different rates ofadaptation in multicellular organisms.
Keywords: binary fission; budding; multicellularity; aging; adaptation; filaments
1. Introduction
The evolution of multicellularity gave rise to organisms whose scale and complexitysignificantly exceed those of their unicellular ancestors [1,2]. Yet, the early stages of multi-cellularity were likely primitive and precarious owing to the small genetic distance fromunicellularity [3–8]. Central to the success of any nascent multicellular organism was theability to gain adaptations and outcompete its ancestors along with other unicellular andmulticellular lineages present in the environment [9]. Although many factors influencethe ability of a multicellular lineage to gain adaptations—e.g., physical structure [10–12], themulticellular life cycle [13–16], and eco-environmental conditions [17–19]—a crucial factormay be the suite of initial traits of the component cells [20]. Comparative genomics studiesshow that co-option of ancestral unicellular genes is among the most common modes ofadaptation in diverse multicellular lineages [21–25]. In some cases, the existence of certaincharacteristics in unicellular ancestors may potentiate the evolution of novel multicellularphenotypes. For example, it has been proposed that the existence of temporally alternatingphenotypes found in the unicellular ancestors of metazoans, dictyostelid social amoebas,and the volvocine algae were co-opted for spatial cellular differentiation during the evolu-tion of multicellularity [22,26–28]. Thus, traits that evolved first in unicellular organismscan influence the tempo and mode of multicellular evolution in that lineage.
Genes 2021, 12, 661. https://doi.org/10.3390/genes12050661 https://www.mdpi.com/journal/genes
Genes 2021, 12, 661 2 of 29
Broadly speaking, prior work examining adaptation in simple multicellular organismshas focused primarily on the mode, not the tempo of adaptation. Many of the majorconceptual topics surrounding the evolution of multicellularity fall under this category.These include: (i) how multicellular groups form and become Darwinian units capableof adaptation [18,29–33], (ii) how the transition to multicellularity affects subsequentevolutionary processes [6,34], (iii) how cooperative behaviors associated with complexmulticellular organisms (e.g., cellular differentiation) evolve and remain stable in the faceof social defection [35–40], (iv) how multicellular life cycles arise and shape the subsequentevolution of multicellularity [13,14,41], and (v) how multicellular lineages co-opt andmodify traits of their unicellular ancestor for novel multicellular purposes [21,27,42–44].
Despite the significant body of research on the mode of adaptation in early multi-cellularity, little attention has been given to the tempo of multicellular adaptation. Liketheir unicellular ancestors, multicellular organisms need to fix beneficial mutations andpurge deleterious ones. The few studies on the tempo of multicellular adaptation havecompared different multicellular life cycles with an aim towards understanding variationand competitive differences between life cycles [13,16]. These studies have not consideredhow different unicellular life history traits can affect the rate of multicellular adaptation.Here we consider how a trait fundamental to unicellular life, whether it reproduces viabudding or binary fission, can have consequences for multicellular adaptation.
Budding and binary fission are two common modes of reproduction in single-celledorganisms. With budding, a parent cell creates an outgrowth that eventually becomesa daughter cell. With binary fission, a parent cell reproduces by splitting in half. Bothtypes of reproduction are common among unicellular organisms [45], and can be foundwithin extant multicellular taxa. For example, multicellular cyanobacteria [46] typicallygrow via binary fission, as do plant and animal cells [47], and filamentous fungi grow viabudding [48]. Although both mechanisms of reproduction give rise to two cells, they arenot identical. Budding creates a clear parent/offspring distinction in which age-relateddamage, e.g., oxidatively damaged proteins and protein aggregates, is split asymmetricallybetween parent and daughter cells (see review [49]). In contrast, binary fission partitionscomponents more symmetrically which is readily observable in the age of the cell poles ofthe two resulting cells (the age of cell poles correlates with age-related damage [50]). Sinceaging can correspond to a decrease in the rate of reproduction, it affects the relative ratesthat cells in a population reproduce and thus the rate that a new mutant may spread.
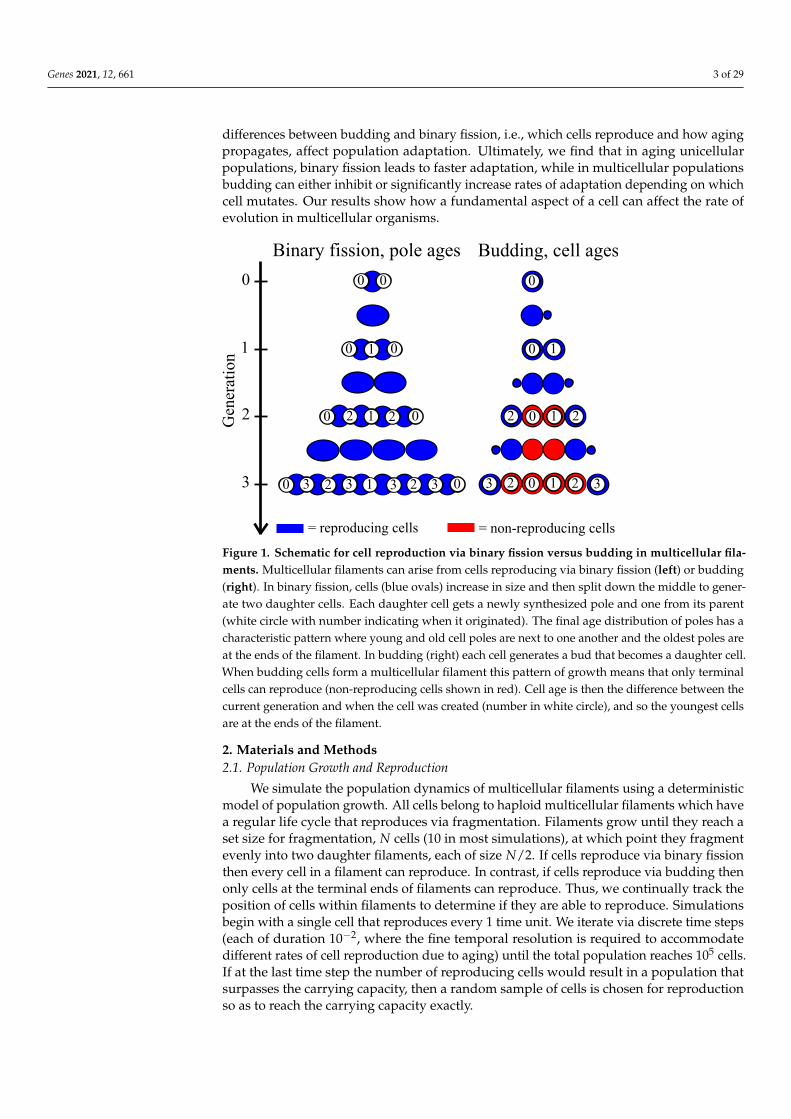
Another difference between budding and binary fission can manifest when pop-ulations evolve to be multicellular. Single-celled organisms can form groups—a basicrequirement for multicellularity—in two main ways. They can ‘come together’ via ag-gregation or ‘stay together’ by failing to separate after reproduction [51]. In this paper,we focus on multicellular organisms that form by ‘staying together’ because it is a com-mon mode of multicellular development [45]; it favors the evolution of cooperation [52]and cellular differentiation [37]; and all ‘complex’ multicellular organisms (i.e., animals,plants, red algae, brown algae, and fungi) grow through cell adhesion following cellreproduction [53]. If multicellularity evolves via cells staying together, then the physicalconnection between cells must be maintained, at least until the multicellular organismfragments. Cells can still reproduce via binary fission while being connected since the axisof division is down the middle; however, in budding there needs to be space for a newoutgrowth else the budding cell may not have room to reproduce [11,12]. So, in the samemulticellular structure (see Figure 1 for a filament) whether cells reproduce via binaryfission or budding may determine which cells reproduce.
Here, we examine how the ancestral cell’s mechanism of reproduction affects thetemporal dynamics of adaptation when organisms grow in a simple and mathematically-tractible multicellular form, a filament. We consider a mutation that increases cellulargrowth rates and use a mathematical model of population growth to compare how quicklythe mutation spreads in unicellular and multicellular populations that reproduce viabudding or binary fission. Our theoretical approach allows us to disentangle how two key
Genes 2021, 12, 661 3 of 29
differences between budding and binary fission, i.e., which cells reproduce and how agingpropagates, affect population adaptation. Ultimately, we find that in aging unicellularpopulations, binary fission leads to faster adaptation, while in multicellular populationsbudding can either inhibit or significantly increase rates of adaptation depending on whichcell mutates. Our results show how a fundamental aspect of a cell can affect the rate ofevolution in multicellular organisms.
Binary fission, pole ages Budding, cell ages
0
1
2
3
= reproducing cells = non-reproducing cells
0 0 0
0 100 1
0 1
0 1
2 2
2 323
01 2
02 333 120 3
20Gen
erat
ion
Figure 1. Schematic for cell reproduction via binary fission versus budding in multicellular fila-ments. Multicellular filaments can arise from cells reproducing via binary fission (left) or budding(right). In binary fission, cells (blue ovals) increase in size and then split down the middle to gener-ate two daughter cells. Each daughter cell gets a newly synthesized pole and one from its parent(white circle with number indicating when it originated). The final age distribution of poles has acharacteristic pattern where young and old cell poles are next to one another and the oldest poles areat the ends of the filament. In budding (right) each cell generates a bud that becomes a daughter cell.When budding cells form a multicellular filament this pattern of growth means that only terminalcells can reproduce (non-reproducing cells shown in red). Cell age is then the difference between thecurrent generation and when the cell was created (number in white circle), and so the youngest cellsare at the ends of the filament.
2. Materials and Methods2.1. Population Growth and Reproduction
We simulate the population dynamics of multicellular filaments using a deterministicmodel of population growth. All cells belong to haploid multicellular filaments which havea regular life cycle that reproduces via fragmentation. Filaments grow until they reach aset size for fragmentation, N cells (10 in most simulations), at which point they fragmentevenly into two daughter filaments, each of size N/2. If cells reproduce via binary fissionthen every cell in a filament can reproduce. In contrast, if cells reproduce via budding thenonly cells at the terminal ends of filaments can reproduce. Thus, we continually track theposition of cells within filaments to determine if they are able to reproduce. Simulationsbegin with a single cell that reproduces every 1 time unit. We iterate via discrete time steps(each of duration 10−2, where the fine temporal resolution is required to accommodatedifferent rates of cell reproduction due to aging) until the total population reaches 105 cells.If at the last time step the number of reproducing cells would result in a population thatsurpasses the carrying capacity, then a random sample of cells is chosen for reproductionso as to reach the carrying capacity exactly.
Genes 2021, 12, 661 4 of 29
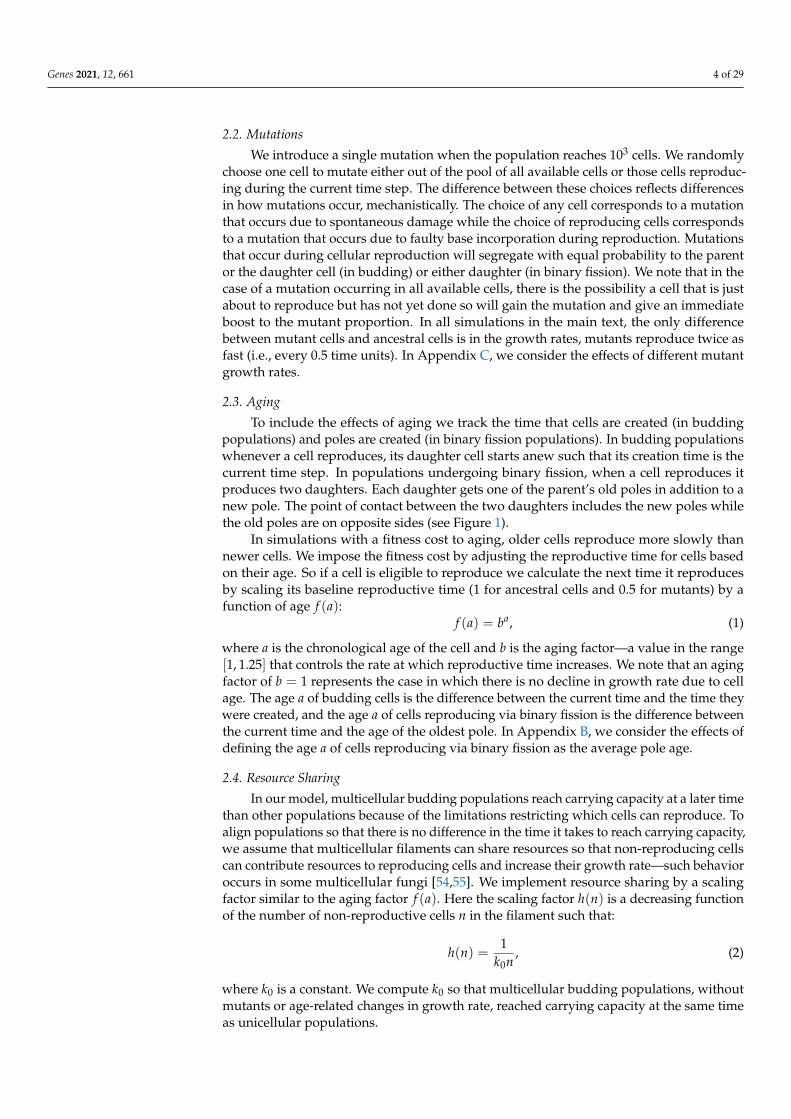
2.2. Mutations
We introduce a single mutation when the population reaches 103 cells. We randomlychoose one cell to mutate either out of the pool of all available cells or those cells reproduc-ing during the current time step. The difference between these choices reflects differencesin how mutations occur, mechanistically. The choice of any cell corresponds to a mutationthat occurs due to spontaneous damage while the choice of reproducing cells correspondsto a mutation that occurs due to faulty base incorporation during reproduction. Mutationsthat occur during cellular reproduction will segregate with equal probability to the parentor the daughter cell (in budding) or either daughter (in binary fission). We note that in thecase of a mutation occurring in all available cells, there is the possibility a cell that is justabout to reproduce but has not yet done so will gain the mutation and give an immediateboost to the mutant proportion. In all simulations in the main text, the only differencebetween mutant cells and ancestral cells is in the growth rates, mutants reproduce twice asfast (i.e., every 0.5 time units). In Appendix C, we consider the effects of different mutantgrowth rates.
2.3. Aging
To include the effects of aging we track the time that cells are created (in buddingpopulations) and poles are created (in binary fission populations). In budding populationswhenever a cell reproduces, its daughter cell starts anew such that its creation time is thecurrent time step. In populations undergoing binary fission, when a cell reproduces itproduces two daughters. Each daughter gets one of the parent’s old poles in addition to anew pole. The point of contact between the two daughters includes the new poles whilethe old poles are on opposite sides (see Figure 1).
In simulations with a fitness cost to aging, older cells reproduce more slowly thannewer cells. We impose the fitness cost by adjusting the reproductive time for cells basedon their age. So if a cell is eligible to reproduce we calculate the next time it reproducesby scaling its baseline reproductive time (1 for ancestral cells and 0.5 for mutants) by afunction of age f (a):
f (a) = ba, (1)
where a is the chronological age of the cell and b is the aging factor—a value in the range[1, 1.25] that controls the rate at which reproductive time increases. We note that an agingfactor of b = 1 represents the case in which there is no decline in growth rate due to cellage. The age a of budding cells is the difference between the current time and the time theywere created, and the age a of cells reproducing via binary fission is the difference betweenthe current time and the age of the oldest pole. In Appendix B, we consider the effects ofdefining the age a of cells reproducing via binary fission as the average pole age.
2.4. Resource Sharing
In our model, multicellular budding populations reach carrying capacity at a later timethan other populations because of the limitations restricting which cells can reproduce. Toalign populations so that there is no difference in the time it takes to reach carrying capacity,we assume that multicellular filaments can share resources so that non-reproducing cellscan contribute resources to reproducing cells and increase their growth rate—such behavioroccurs in some multicellular fungi [54,55]. We implement resource sharing by a scalingfactor similar to the aging factor f (a). Here the scaling factor h(n) is a decreasing functionof the number of non-reproductive cells n in the filament such that:
h(n) =1
k0n, (2)
where k0 is a constant. We compute k0 so that multicellular budding populations, withoutmutants or age-related changes in growth rate, reached carrying capacity at the same timeas unicellular populations.
Genes 2021, 12, 661 5 of 29
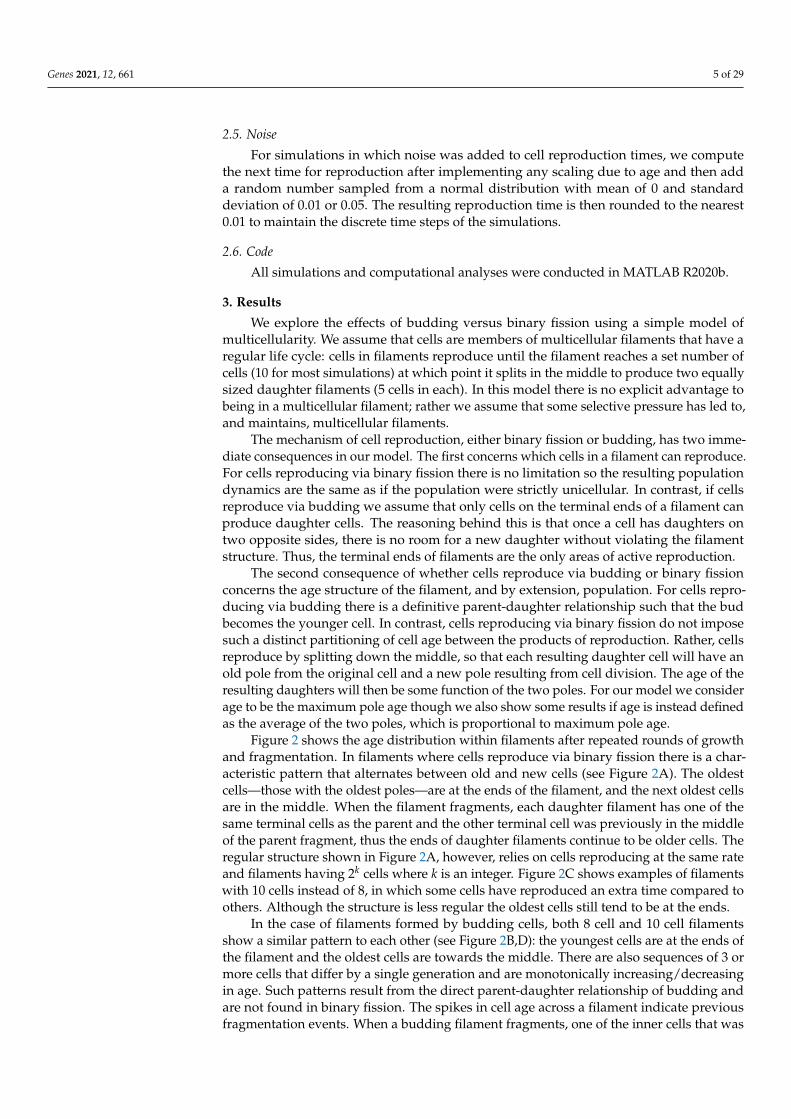
2.5. Noise
For simulations in which noise was added to cell reproduction times, we computethe next time for reproduction after implementing any scaling due to age and then adda random number sampled from a normal distribution with mean of 0 and standarddeviation of 0.01 or 0.05. The resulting reproduction time is then rounded to the nearest0.01 to maintain the discrete time steps of the simulations.
2.6. Code
All simulations and computational analyses were conducted in MATLAB R2020b.
3. Results
We explore the effects of budding versus binary fission using a simple model ofmulticellularity. We assume that cells are members of multicellular filaments that have aregular life cycle: cells in filaments reproduce until the filament reaches a set number ofcells (10 for most simulations) at which point it splits in the middle to produce two equallysized daughter filaments (5 cells in each). In this model there is no explicit advantage tobeing in a multicellular filament; rather we assume that some selective pressure has led to,and maintains, multicellular filaments.
The mechanism of cell reproduction, either binary fission or budding, has two imme-diate consequences in our model. The first concerns which cells in a filament can reproduce.For cells reproducing via binary fission there is no limitation so the resulting populationdynamics are the same as if the population were strictly unicellular. In contrast, if cellsreproduce via budding we assume that only cells on the terminal ends of a filament canproduce daughter cells. The reasoning behind this is that once a cell has daughters ontwo opposite sides, there is no room for a new daughter without violating the filamentstructure. Thus, the terminal ends of filaments are the only areas of active reproduction.
The second consequence of whether cells reproduce via budding or binary fissionconcerns the age structure of the filament, and by extension, population. For cells repro-ducing via budding there is a definitive parent-daughter relationship such that the budbecomes the younger cell. In contrast, cells reproducing via binary fission do not imposesuch a distinct partitioning of cell age between the products of reproduction. Rather, cellsreproduce by splitting down the middle, so that each resulting daughter cell will have anold pole from the original cell and a new pole resulting from cell division. The age of theresulting daughters will then be some function of the two poles. For our model we considerage to be the maximum pole age though we also show some results if age is instead definedas the average of the two poles, which is proportional to maximum pole age.
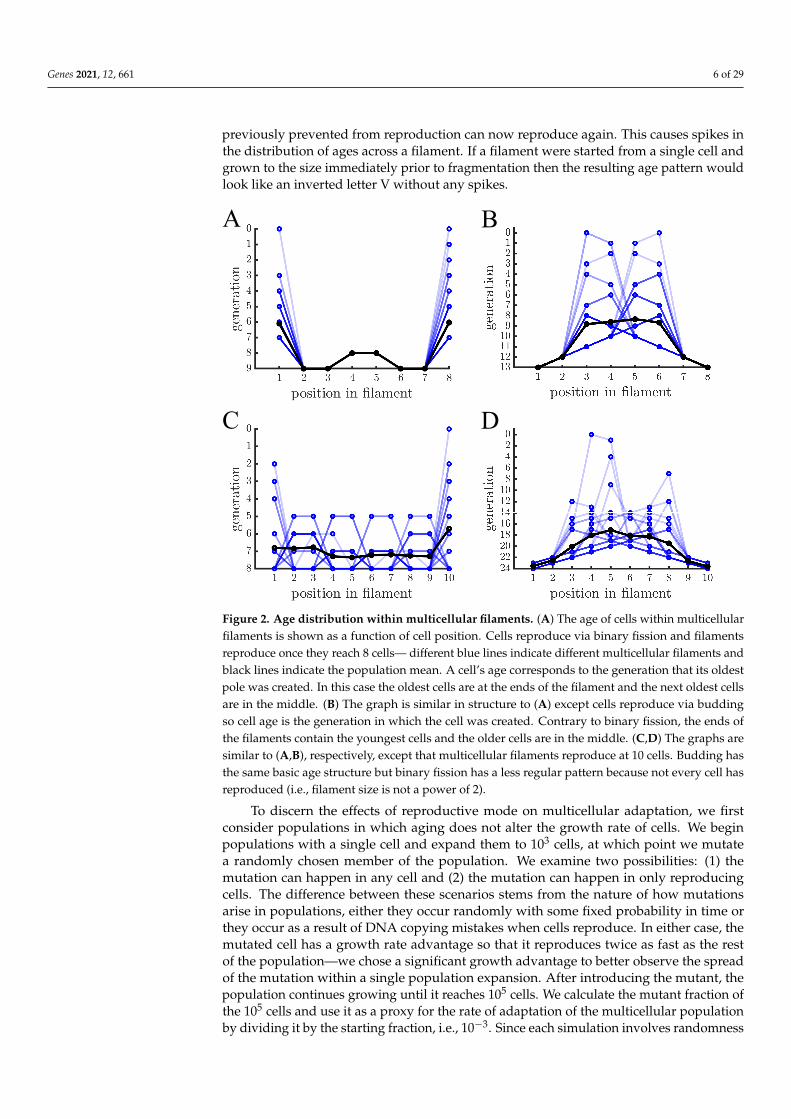
Figure 2 shows the age distribution within filaments after repeated rounds of growthand fragmentation. In filaments where cells reproduce via binary fission there is a char-acteristic pattern that alternates between old and new cells (see Figure 2A). The oldestcells—those with the oldest poles—are at the ends of the filament, and the next oldest cellsare in the middle. When the filament fragments, each daughter filament has one of thesame terminal cells as the parent and the other terminal cell was previously in the middleof the parent fragment, thus the ends of daughter filaments continue to be older cells. Theregular structure shown in Figure 2A, however, relies on cells reproducing at the same rateand filaments having 2k cells where k is an integer. Figure 2C shows examples of filamentswith 10 cells instead of 8, in which some cells have reproduced an extra time compared toothers. Although the structure is less regular the oldest cells still tend to be at the ends.
In the case of filaments formed by budding cells, both 8 cell and 10 cell filamentsshow a similar pattern to each other (see Figure 2B,D): the youngest cells are at the ends ofthe filament and the oldest cells are towards the middle. There are also sequences of 3 ormore cells that differ by a single generation and are monotonically increasing/decreasingin age. Such patterns result from the direct parent-daughter relationship of budding andare not found in binary fission. The spikes in cell age across a filament indicate previousfragmentation events. When a budding filament fragments, one of the inner cells that was
Genes 2021, 12, 661 6 of 29
previously prevented from reproduction can now reproduce again. This causes spikes inthe distribution of ages across a filament. If a filament were started from a single cell andgrown to the size immediately prior to fragmentation then the resulting age pattern wouldlook like an inverted letter V without any spikes.
A
C
B
D
Figure 2. Age distribution within multicellular filaments. (A) The age of cells within multicellularfilaments is shown as a function of cell position. Cells reproduce via binary fission and filamentsreproduce once they reach 8 cells— different blue lines indicate different multicellular filaments andblack lines indicate the population mean. A cell’s age corresponds to the generation that its oldestpole was created. In this case the oldest cells are at the ends of the filament and the next oldest cellsare in the middle. (B) The graph is similar in structure to (A) except cells reproduce via buddingso cell age is the generation in which the cell was created. Contrary to binary fission, the ends ofthe filaments contain the youngest cells and the older cells are in the middle. (C,D) The graphs aresimilar to (A,B), respectively, except that multicellular filaments reproduce at 10 cells. Budding hasthe same basic age structure but binary fission has a less regular pattern because not every cell hasreproduced (i.e., filament size is not a power of 2).
To discern the effects of reproductive mode on multicellular adaptation, we firstconsider populations in which aging does not alter the growth rate of cells. We beginpopulations with a single cell and expand them to 103 cells, at which point we mutatea randomly chosen member of the population. We examine two possibilities: (1) themutation can happen in any cell and (2) the mutation can happen in only reproducingcells. The difference between these scenarios stems from the nature of how mutationsarise in populations, either they occur randomly with some fixed probability in time orthey occur as a result of DNA copying mistakes when cells reproduce. In either case, themutated cell has a growth rate advantage so that it reproduces twice as fast as the restof the population—we chose a significant growth advantage to better observe the spreadof the mutation within a single population expansion. After introducing the mutant, thepopulation continues growing until it reaches 105 cells. We calculate the mutant fraction ofthe 105 cells and use it as a proxy for the rate of adaptation of the multicellular populationby dividing it by the starting fraction, i.e., 10−3. Since each simulation involves randomness
Genes 2021, 12, 661 7 of 29
in terms of which cell becomes the mutant, we run 1000 simulations to obtain a distributionof mutant proportions.
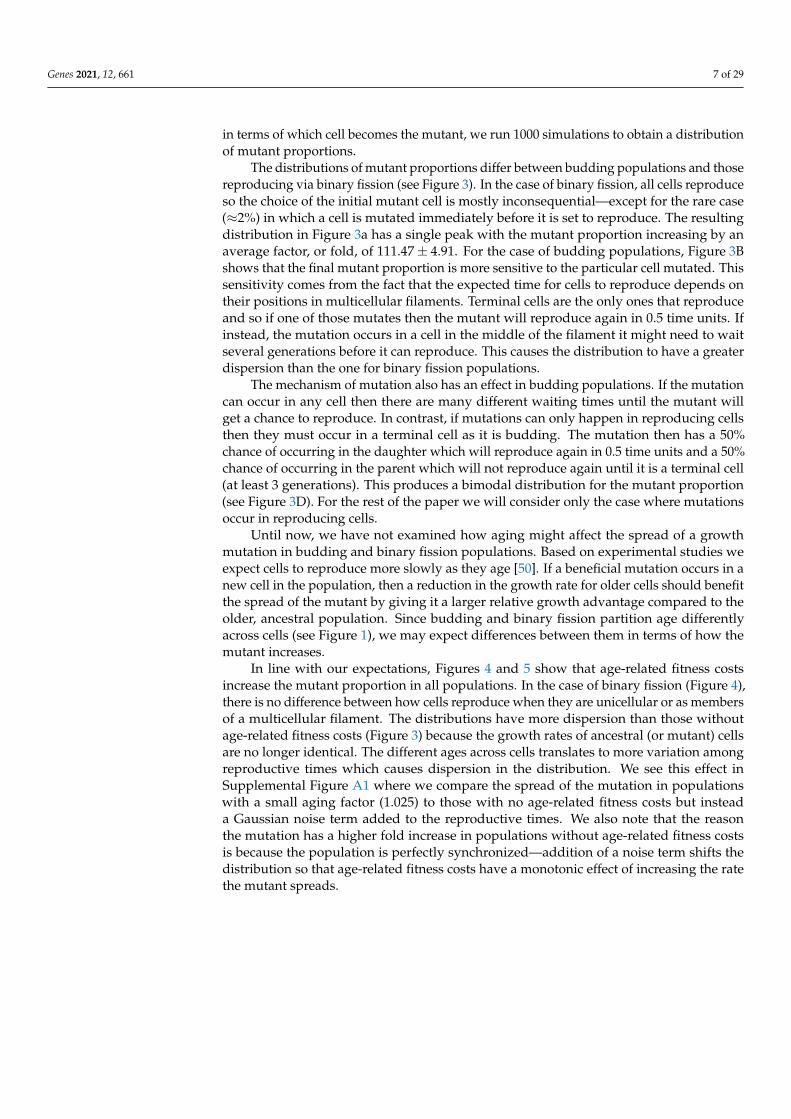
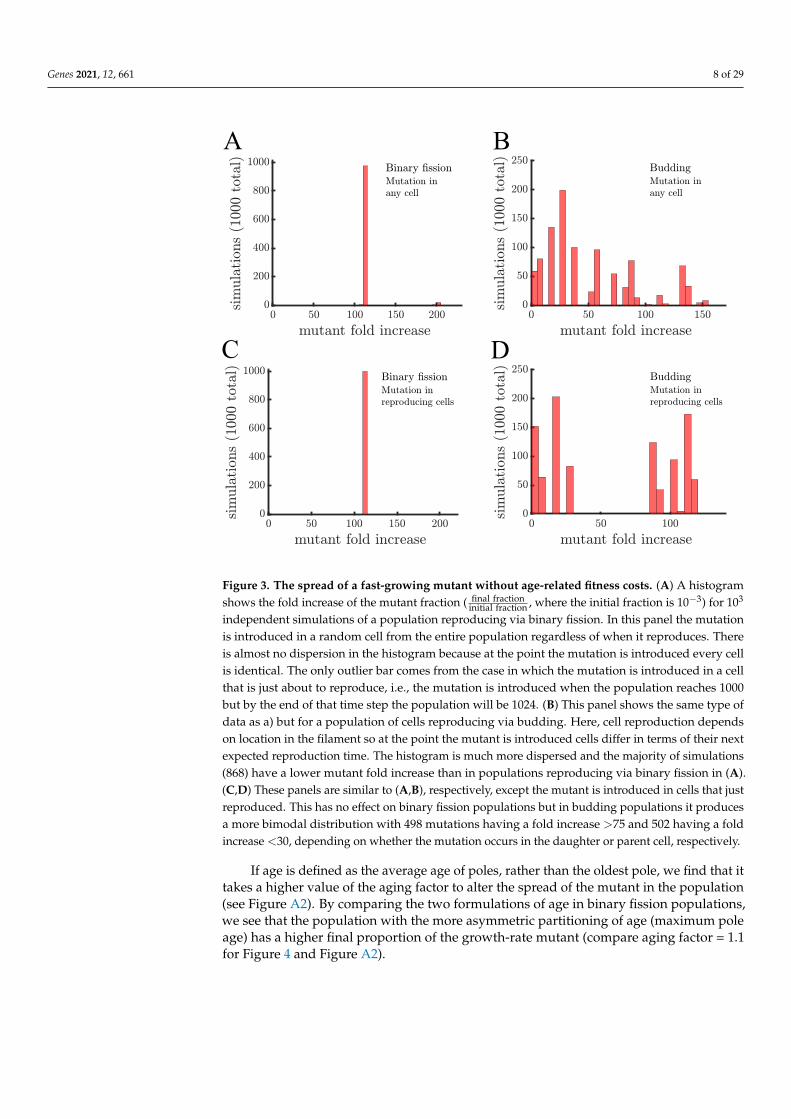
The distributions of mutant proportions differ between budding populations and thosereproducing via binary fission (see Figure 3). In the case of binary fission, all cells reproduceso the choice of the initial mutant cell is mostly inconsequential—except for the rare case(≈2%) in which a cell is mutated immediately before it is set to reproduce. The resultingdistribution in Figure 3a has a single peak with the mutant proportion increasing by anaverage factor, or fold, of 111.47 ± 4.91. For the case of budding populations, Figure 3Bshows that the final mutant proportion is more sensitive to the particular cell mutated. Thissensitivity comes from the fact that the expected time for cells to reproduce depends ontheir positions in multicellular filaments. Terminal cells are the only ones that reproduceand so if one of those mutates then the mutant will reproduce again in 0.5 time units. Ifinstead, the mutation occurs in a cell in the middle of the filament it might need to waitseveral generations before it can reproduce. This causes the distribution to have a greaterdispersion than the one for binary fission populations.
The mechanism of mutation also has an effect in budding populations. If the mutationcan occur in any cell then there are many different waiting times until the mutant willget a chance to reproduce. In contrast, if mutations can only happen in reproducing cellsthen they must occur in a terminal cell as it is budding. The mutation then has a 50%chance of occurring in the daughter which will reproduce again in 0.5 time units and a 50%chance of occurring in the parent which will not reproduce again until it is a terminal cell(at least 3 generations). This produces a bimodal distribution for the mutant proportion(see Figure 3D). For the rest of the paper we will consider only the case where mutationsoccur in reproducing cells.
Until now, we have not examined how aging might affect the spread of a growthmutation in budding and binary fission populations. Based on experimental studies weexpect cells to reproduce more slowly as they age [50]. If a beneficial mutation occurs in anew cell in the population, then a reduction in the growth rate for older cells should benefitthe spread of the mutant by giving it a larger relative growth advantage compared to theolder, ancestral population. Since budding and binary fission partition age differentlyacross cells (see Figure 1), we may expect differences between them in terms of how themutant increases.
In line with our expectations, Figures 4 and 5 show that age-related fitness costsincrease the mutant proportion in all populations. In the case of binary fission (Figure 4),there is no difference between how cells reproduce when they are unicellular or as membersof a multicellular filament. The distributions have more dispersion than those withoutage-related fitness costs (Figure 3) because the growth rates of ancestral (or mutant) cellsare no longer identical. The different ages across cells translates to more variation amongreproductive times which causes dispersion in the distribution. We see this effect inSupplemental Figure A1 where we compare the spread of the mutation in populationswith a small aging factor (1.025) to those with no age-related fitness costs but insteada Gaussian noise term added to the reproductive times. We also note that the reasonthe mutation has a higher fold increase in populations without age-related fitness costsis because the population is perfectly synchronized—addition of a noise term shifts thedistribution so that age-related fitness costs have a monotonic effect of increasing the ratethe mutant spreads.
Genes 2021, 12, 661 8 of 29
A B
C D
Figure 3. The spread of a fast-growing mutant without age-related fitness costs. (A) A histogramshows the fold increase of the mutant fraction ( final fraction
initial fraction , where the initial fraction is 10−3) for 103
independent simulations of a population reproducing via binary fission. In this panel the mutationis introduced in a random cell from the entire population regardless of when it reproduces. Thereis almost no dispersion in the histogram because at the point the mutation is introduced every cellis identical. The only outlier bar comes from the case in which the mutation is introduced in a cellthat is just about to reproduce, i.e., the mutation is introduced when the population reaches 1000but by the end of that time step the population will be 1024. (B) This panel shows the same type ofdata as a) but for a population of cells reproducing via budding. Here, cell reproduction dependson location in the filament so at the point the mutant is introduced cells differ in terms of their nextexpected reproduction time. The histogram is much more dispersed and the majority of simulations(868) have a lower mutant fold increase than in populations reproducing via binary fission in (A).(C,D) These panels are similar to (A,B), respectively, except the mutant is introduced in cells that justreproduced. This has no effect on binary fission populations but in budding populations it producesa more bimodal distribution with 498 mutations having a fold increase >75 and 502 having a foldincrease <30, depending on whether the mutation occurs in the daughter or parent cell, respectively.
If age is defined as the average age of poles, rather than the oldest pole, we find that ittakes a higher value of the aging factor to alter the spread of the mutant in the population(see Figure A2). By comparing the two formulations of age in binary fission populations,we see that the population with the more asymmetric partitioning of age (maximum poleage) has a higher final proportion of the growth-rate mutant (compare aging factor = 1.1for Figure 4 and Figure A2).
Genes 2021, 12, 661 9 of 29
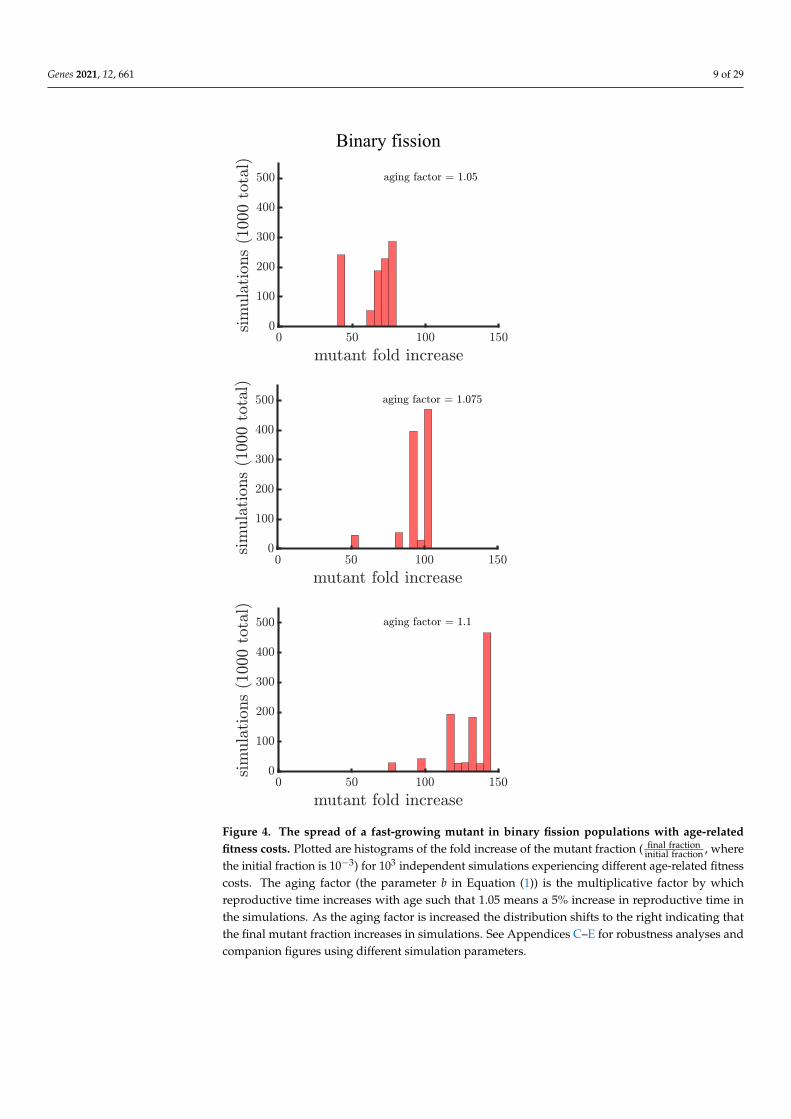
Binary fission
Figure 4. The spread of a fast-growing mutant in binary fission populations with age-relatedfitness costs. Plotted are histograms of the fold increase of the mutant fraction ( final fraction
initial fraction , wherethe initial fraction is 10−3) for 103 independent simulations experiencing different age-related fitnesscosts. The aging factor (the parameter b in Equation (1)) is the multiplicative factor by whichreproductive time increases with age such that 1.05 means a 5% increase in reproductive time inthe simulations. As the aging factor is increased the distribution shifts to the right indicating thatthe final mutant fraction increases in simulations. See Appendices C–E for robustness analyses andcompanion figures using different simulation parameters.
Genes 2021, 12, 661 10 of 29
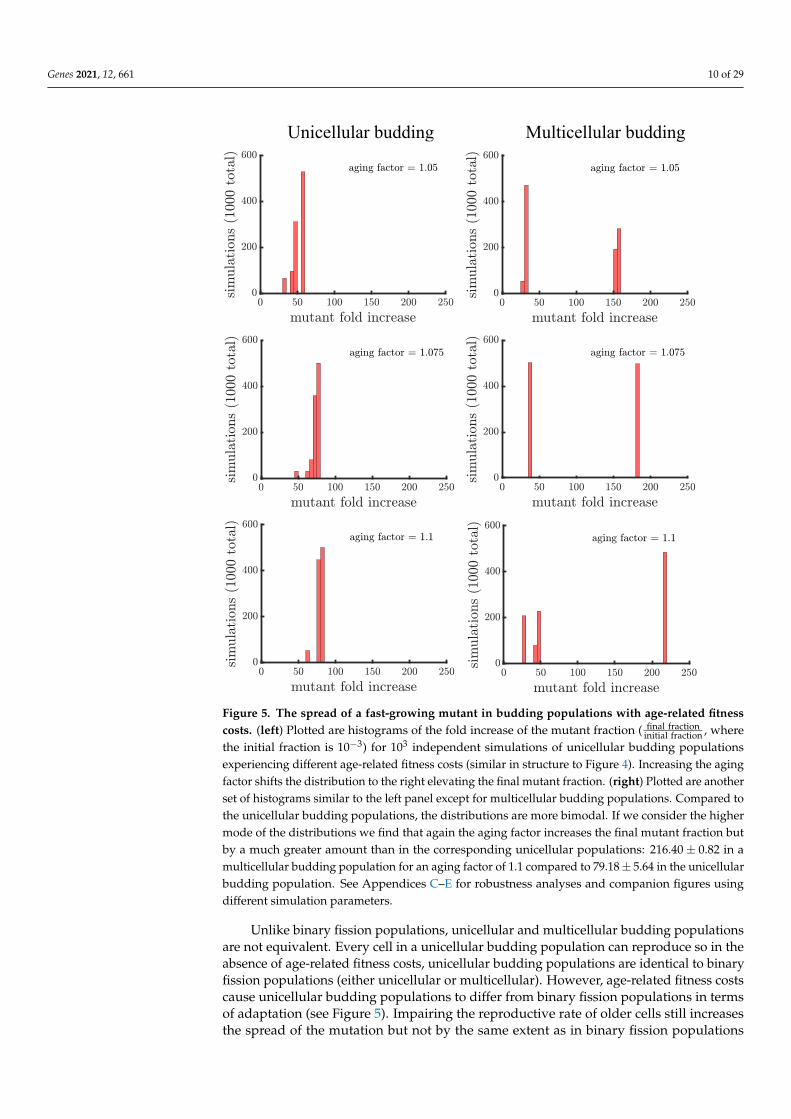
Unicellular budding Multicellular budding
Figure 5. The spread of a fast-growing mutant in budding populations with age-related fitnesscosts. (left) Plotted are histograms of the fold increase of the mutant fraction ( final fraction
initial fraction , wherethe initial fraction is 10−3) for 103 independent simulations of unicellular budding populationsexperiencing different age-related fitness costs (similar in structure to Figure 4). Increasing the agingfactor shifts the distribution to the right elevating the final mutant fraction. (right) Plotted are anotherset of histograms similar to the left panel except for multicellular budding populations. Compared tothe unicellular budding populations, the distributions are more bimodal. If we consider the highermode of the distributions we find that again the aging factor increases the final mutant fraction butby a much greater amount than in the corresponding unicellular populations: 216.40 ± 0.82 in amulticellular budding population for an aging factor of 1.1 compared to 79.18± 5.64 in the unicellularbudding population. See Appendices C–E for robustness analyses and companion figures usingdifferent simulation parameters.
Unlike binary fission populations, unicellular and multicellular budding populationsare not equivalent. Every cell in a unicellular budding population can reproduce so in theabsence of age-related fitness costs, unicellular budding populations are identical to binaryfission populations (either unicellular or multicellular). However, age-related fitness costscause unicellular budding populations to differ from binary fission populations in termsof adaptation (see Figure 5). Impairing the reproductive rate of older cells still increasesthe spread of the mutation but not by the same extent as in binary fission populations
Genes 2021, 12, 661 11 of 29
(average fold increase of 79.18 ± 5.64 in unicellular budding versus 131.21 ± 15.29 in binaryfission populations for aging factor 1.1). It is unclear though if such comparisons arefair because the way age accumulates is different between binary fission and buddingpopulations. If we instead compare unicellular budding populations to binary fissionpopulations where age is defined as the average age of poles rather than the oldest pole(see Figure A2), we find that unicellular budding populations show the higher relativeincrease in mutant proportion.
Unicellular and multicellular budding populations are affected differently by age-related fitness costs. In Figure 5, we see that that the distributions of the mutant foldincrease have different shapes: unimodal in unicellular budding populations and bimodalin multicellular budding populations. The shape differences are due to the limitationson which cells can reproduce in multicellular filaments. Another difference is that agingcan enhance the spread of a mutant by a much larger factor in multicellular populationscompared to unicellular populations (216.40± 0.82 in the higher mode of multicellular pop-ulations for aging factor 1.1 compared to 79.18 ± 5.64 for unicellular populations). Indeed,if a mutation lands in a terminal cell its fold increase is higher in budding populations withan aging factor of 1.05 than the highest fold increase in a unicellular budding population(or a multicellular binary fission population) with an aging factor of 1.1.
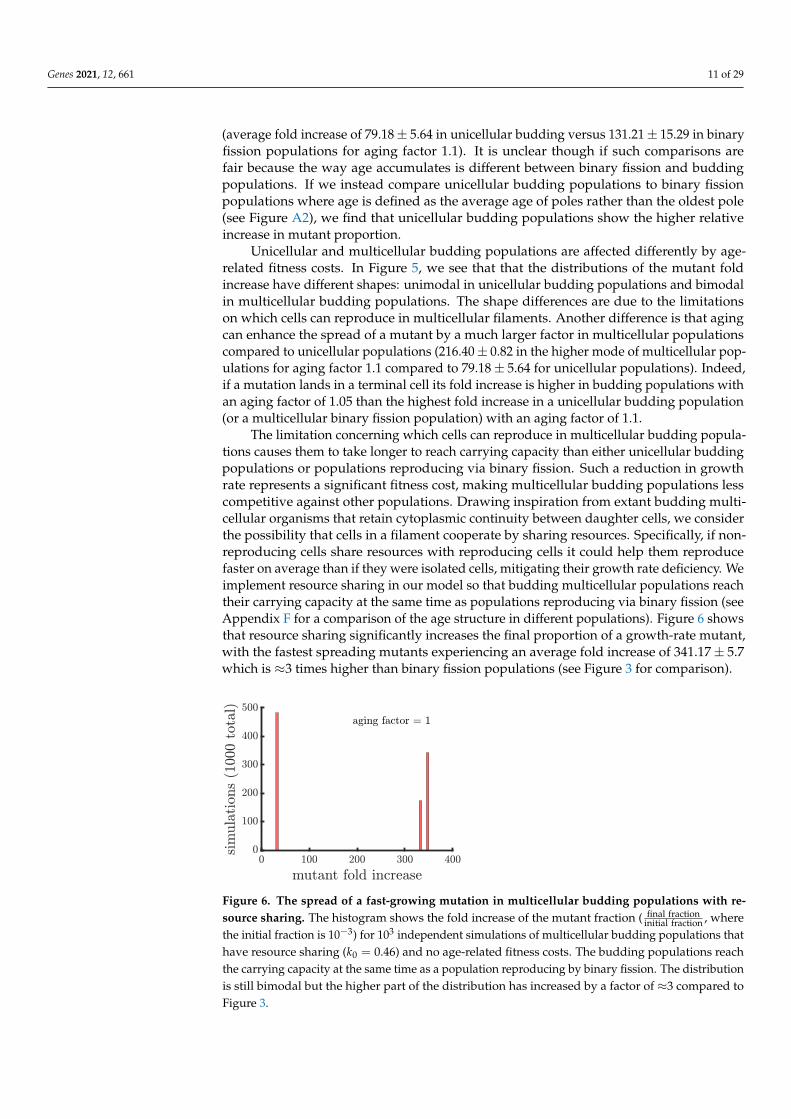
The limitation concerning which cells can reproduce in multicellular budding popula-tions causes them to take longer to reach carrying capacity than either unicellular buddingpopulations or populations reproducing via binary fission. Such a reduction in growthrate represents a significant fitness cost, making multicellular budding populations lesscompetitive against other populations. Drawing inspiration from extant budding multi-cellular organisms that retain cytoplasmic continuity between daughter cells, we considerthe possibility that cells in a filament cooperate by sharing resources. Specifically, if non-reproducing cells share resources with reproducing cells it could help them reproducefaster on average than if they were isolated cells, mitigating their growth rate deficiency. Weimplement resource sharing in our model so that budding multicellular populations reachtheir carrying capacity at the same time as populations reproducing via binary fission (seeAppendix F for a comparison of the age structure in different populations). Figure 6 showsthat resource sharing significantly increases the final proportion of a growth-rate mutant,with the fastest spreading mutants experiencing an average fold increase of 341.17 ± 5.7which is ≈3 times higher than binary fission populations (see Figure 3 for comparison).
Figure 6. The spread of a fast-growing mutation in multicellular budding populations with re-source sharing. The histogram shows the fold increase of the mutant fraction ( final fraction
initial fraction , wherethe initial fraction is 10−3) for 103 independent simulations of multicellular budding populations thathave resource sharing (k0 = 0.46) and no age-related fitness costs. The budding populations reachthe carrying capacity at the same time as a population reproducing by binary fission. The distributionis still bimodal but the higher part of the distribution has increased by a factor of ≈3 compared toFigure 3.

Genes 2021, 12, 661 12 of 29
4. Discussion
In this paper, we examine the spread of beneficial mutants (faster growth) in bothunicellular and multicellular populations. By considering a mutation that has comparableeffects on organisms in either unicellular or multicellular states, our approach allows usto examine the impact of multicellularity on adaptive processes. Specifically, we focus onexamining how spatial constraints imposed by a simple multicellular growth form andvariation in the cell’s mechanism of reproduction (i.e., budding or binary fission) affectthe rate a beneficial mutation spreads. This comparison is useful because multicellularorganisms necessarily evolve from unicellular ancestors, and must somehow outcompetesingle-celled organisms in order to persist. While this is generally thought to require selec-tion favoring increased size (obtained via multicellularity, see p. 67 of [56] for an excellentsummary of the argument), the evolutionary consequences of multicellular morphologyare also consequential. Our results show that beneficial mutations spread faster in buddingmulticellular populations than their unicellular counterparts, though this depends onwhether mutations arise in newly created cells or the parents of those cells.
Adaptation in nascent multicellular populations likely involves signatures of evolu-tionary history [57,58]. For instance, the form of division of labor amongst cells insidea multicellular organism may depend on the form of temporal plasticity that existed inits unicellular ancestors [22,26–28]. Our work illustrates an interesting case of contingentevolution. With regards to the rate of spread of a beneficial mutant, unicellular organismsthat reproduce through budding are not predicted to differ from those that reproduce bybinary fission. However, a difference that is neutral in the unicellular context becomessubstantial in the multicellular context, affecting the rate and extent of the spread of ben-eficial mutations. Furthermore, other cell-level features, such as aging, interact in newways with cell reproductive mode following the evolution of multicellularity. In this way, amajor evolutionary transition can dramatically amplify subtle differences in lower-levelunits, affecting both the tempo and mode of subsequent evolution of higher-level units in acontingent fashion.
The reason budding in multicellular populations has a different pattern of adaptationfrom the other populations considered is that the ability for cells to reproduce depends ontheir location in the organism. Filaments represent a severe form of this limitation; in orderto maintain the filamentous structure only the two outermost cells in each filament canreproduce (via budding). Other multicellular organisms composed of cells that reproducevia budding are likely to be less restrictive. For example, in snowflake yeast, budding cellsform branching multicellular structures [29,59]. Within these structures cells can reproduceseveral times until they run out of physical space or nutrients and stop reproducing [11].By the time this has happened these cells tend to be centrally located within the group. Sothere are still limitations correlated with location, but they are less restrictive than thosein filamentous multicellularity. Interestingly snowflake yeast share a feature similar tothe linear filaments studied here in that non-reproductive internal cells can regain theability to reproduce again after the multicellular group fragments and they are no longerspatially constrained.
There is no unequivocal way to measure the effects of aging—both chronological timeand number of replicative cycles can drive senescence [49,60]. Measures of aging basedon each of these metrics are termed chronological and replicative age, respectively. Inthis paper, we focused on chronological age, as this measure is more straightforward tointerpret and is used more widely than replicative age. We would not expect this choiceto qualitatively affect our conclusions in either unicellular populations or multicellularfilaments growing with binary fission, because every cell can reproduce at every time step.As a result, chronological age and replicative age should be highly correlated. We would,however, expect differences in multicellular filaments that grow via budding, since cellsexperience long periods in between reproduction events.
While we have focused our results on the evolution of nascent multicellularity, theyshould apply to spatially-structured growth more generally. Microbial growth is often
Genes 2021, 12, 661 13 of 29
limited to surfaces (e.g., the edge of an expanding biofilm), such that inner cells cannotdivide [61,62]. These colonies should act much like budding filaments, in that nearly allthe growth occurs on just the outermost cells, which our work suggests should acceleratethe spread of beneficial mutations. Indeed, prior work on microbial colonies has shownthat spatially-structured population growth allows beneficial mutations to reach muchhigher frequencies than when populations grow by uniform expansion in well-mixedliquid culture [63–65]. Furthermore, the accelerated rate of increase is highly sensitiveto the location of the mutant cell within the expanding colony—mutations that occur atthe growing frontier establish and rapidly increase in frequency while those that occurtowards the interior becoming trapped as non-growing ‘bubbles’ [65,66]. Since 40–80%of all bacteria and archaea on Earth live in biofilms [67], many of which will be diffusion-limited, understanding how topologically-structured growth affects evolutionary dynamicsstands to be quite consequential.
Author Contributions: Conceptualization, H.I., P.L.C. B.K., W.C.R. and E.L.; methodology, H.I.,P.L.C. W.C.R. and E.L.; formal analysis, H.I. and E.L.; investigation, H.I. and E.L.; resources, E.L.;writing—original draft preparation, H.I., P.L.C. W.C.R. and E.L.; writing—review and editing, P.L.C.B.K., W.C.R. and E.L.; visualization, H.I. and E.L.; supervision, E.L.; project administration, E.L.;funding acquisition, E.L. All authors have read and agreed to the published version of the manuscript.
Funding: This research was funded by NSF grant no. IOS-1656549 awarded to W.C.R. and NSF grantno. IOS-1656849 awarded to E.L.
Institutional Review Board Statement: Not applicable.
Informed Consent Statement: Not applicable.
Data Availability Statement: Not applicable.
Conflicts of Interest: The authors declare no conflict of interest.
Genes 2021, 12, 661 14 of 29
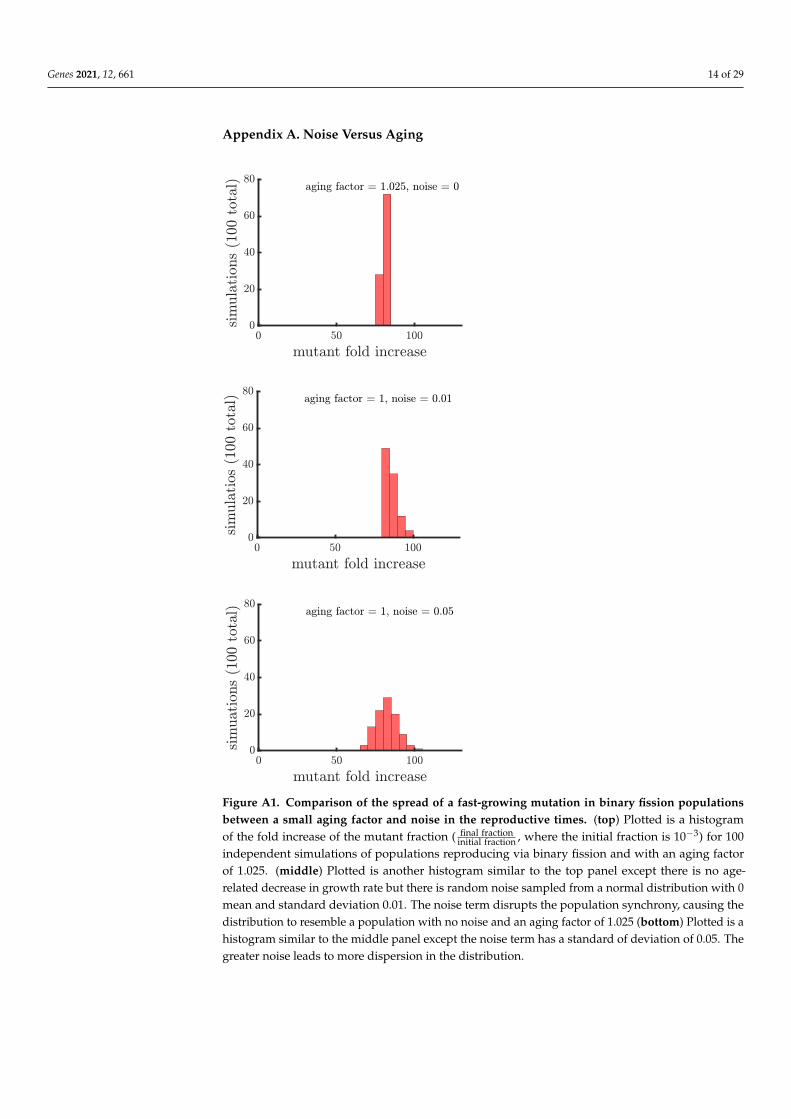
Appendix A. Noise Versus Aging
Figure A1. Comparison of the spread of a fast-growing mutation in binary fission populationsbetween a small aging factor and noise in the reproductive times. (top) Plotted is a histogramof the fold increase of the mutant fraction ( final fraction
initial fraction , where the initial fraction is 10−3) for 100independent simulations of populations reproducing via binary fission and with an aging factorof 1.025. (middle) Plotted is another histogram similar to the top panel except there is no age-related decrease in growth rate but there is random noise sampled from a normal distribution with 0mean and standard deviation 0.01. The noise term disrupts the population synchrony, causing thedistribution to resemble a population with no noise and an aging factor of 1.025 (bottom) Plotted is ahistogram similar to the middle panel except the noise term has a standard of deviation of 0.05. Thegreater noise leads to more dispersion in the distribution.
Genes 2021, 12, 661 15 of 29
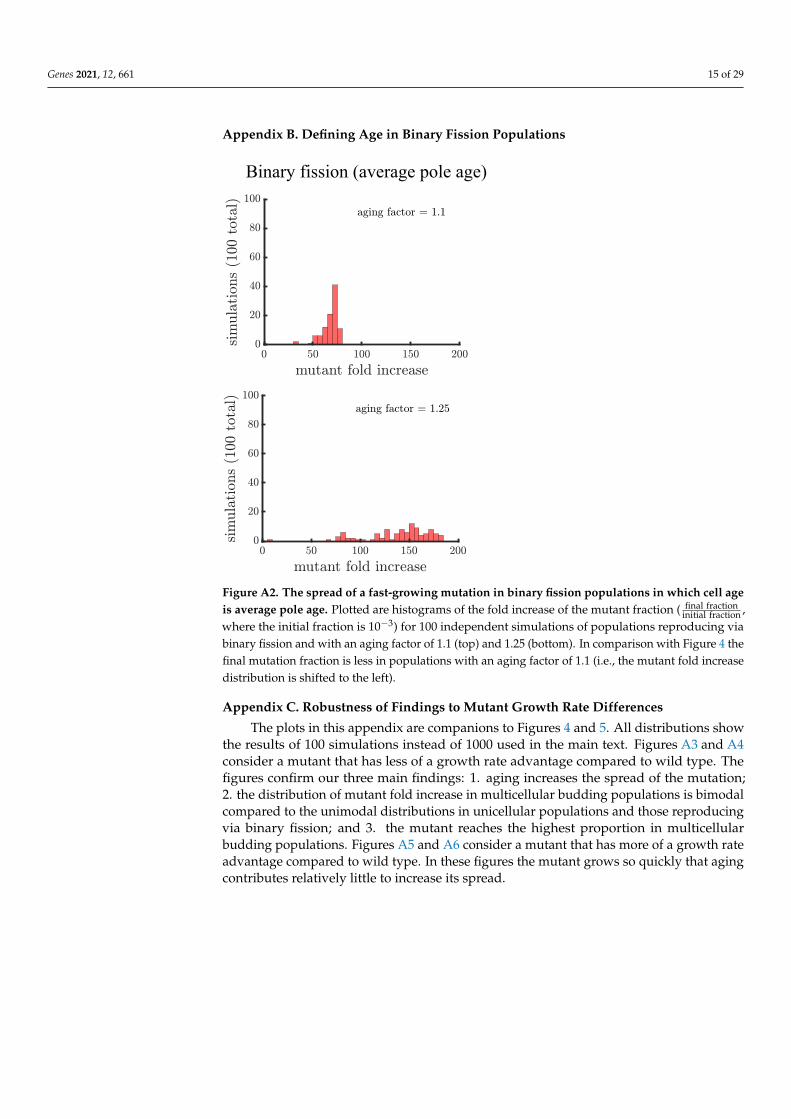
Appendix B. Defining Age in Binary Fission Populations
Binary fission (average pole age)
Figure A2. The spread of a fast-growing mutation in binary fission populations in which cell ageis average pole age. Plotted are histograms of the fold increase of the mutant fraction ( final fraction
initial fraction ,where the initial fraction is 10−3) for 100 independent simulations of populations reproducing viabinary fission and with an aging factor of 1.1 (top) and 1.25 (bottom). In comparison with Figure 4 thefinal mutation fraction is less in populations with an aging factor of 1.1 (i.e., the mutant fold increasedistribution is shifted to the left).
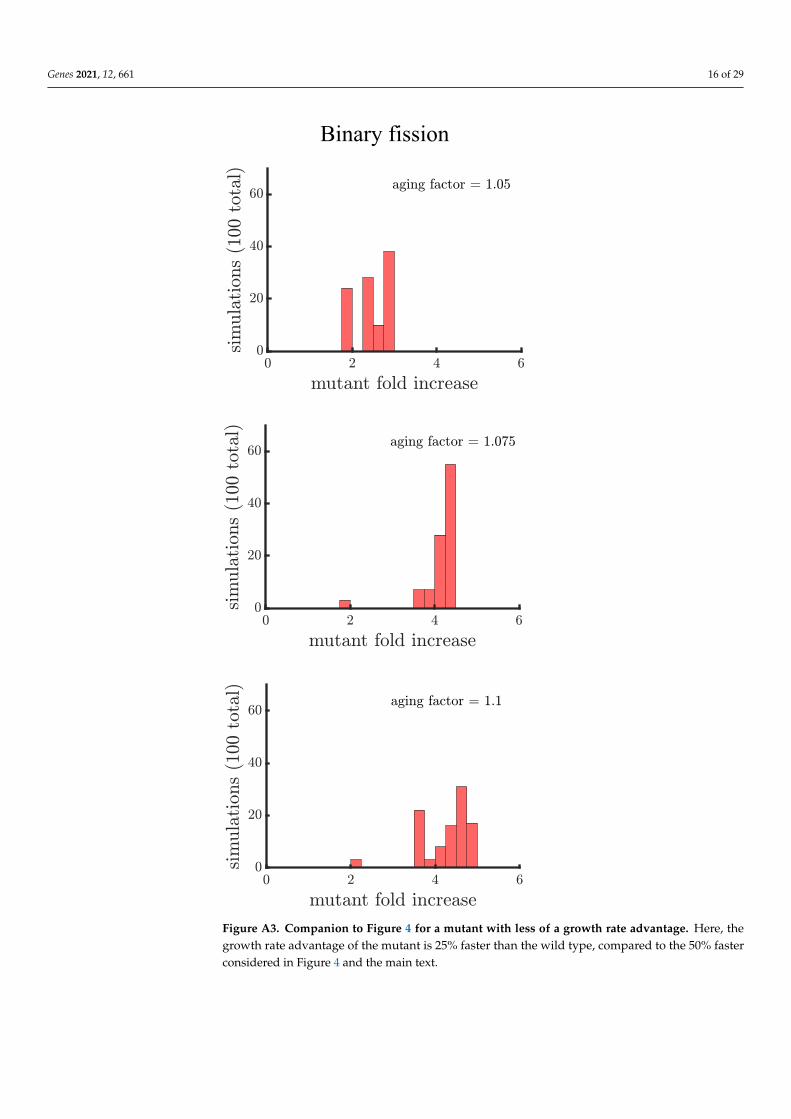
Appendix C. Robustness of Findings to Mutant Growth Rate Differences
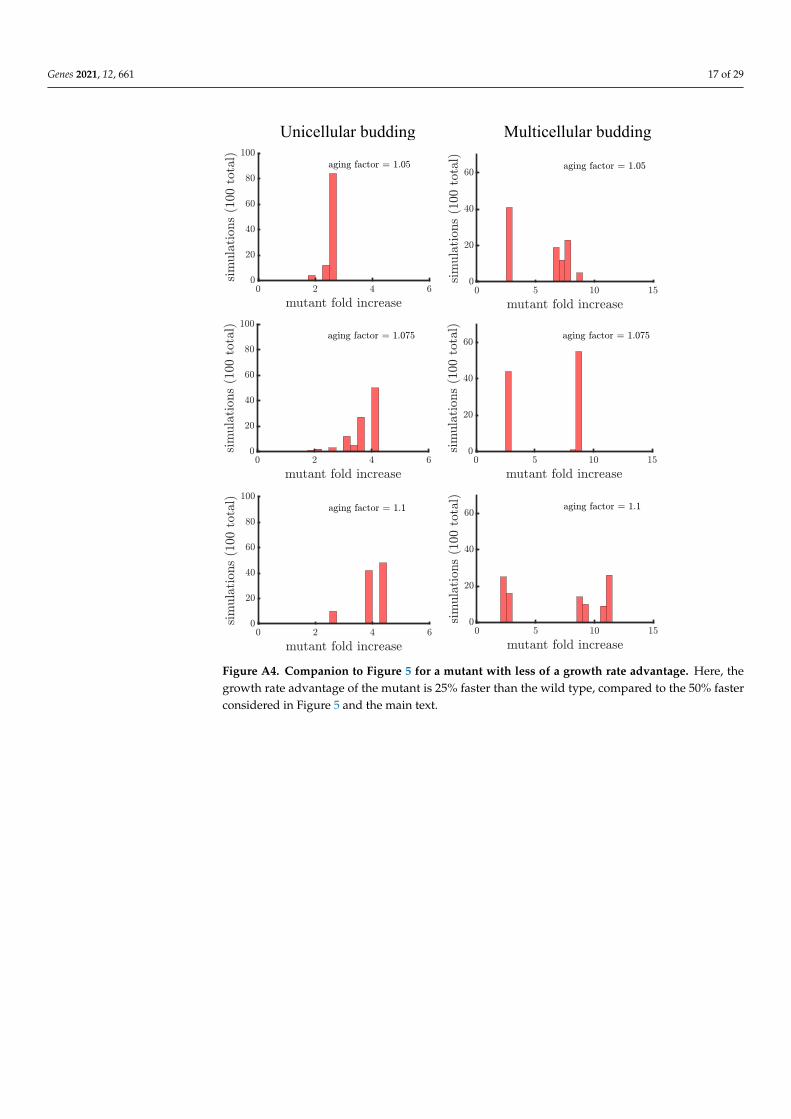
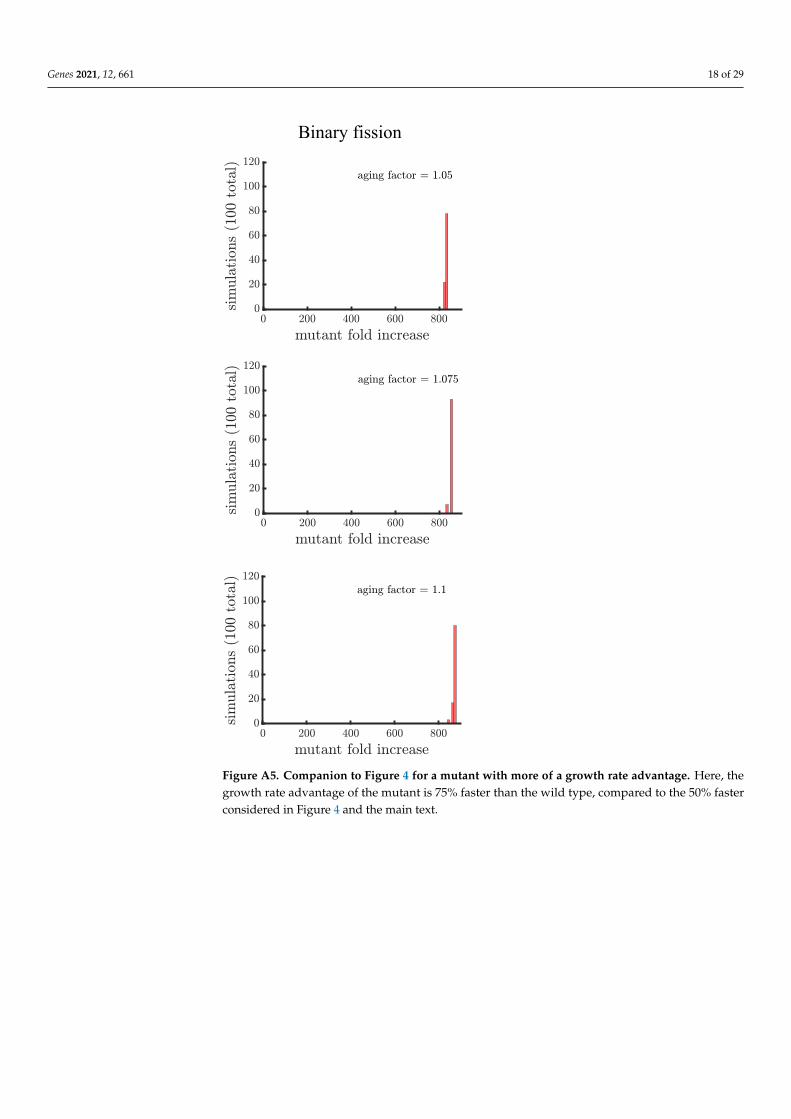
The plots in this appendix are companions to Figures 4 and 5. All distributions showthe results of 100 simulations instead of 1000 used in the main text. Figures A3 and A4consider a mutant that has less of a growth rate advantage compared to wild type. Thefigures confirm our three main findings: 1. aging increases the spread of the mutation;2. the distribution of mutant fold increase in multicellular budding populations is bimodalcompared to the unimodal distributions in unicellular populations and those reproducingvia binary fission; and 3. the mutant reaches the highest proportion in multicellularbudding populations. Figures A5 and A6 consider a mutant that has more of a growth rateadvantage compared to wild type. In these figures the mutant grows so quickly that agingcontributes relatively little to increase its spread.
Genes 2021, 12, 661 16 of 29
Binary fission
Figure A3. Companion to Figure 4 for a mutant with less of a growth rate advantage. Here, thegrowth rate advantage of the mutant is 25% faster than the wild type, compared to the 50% fasterconsidered in Figure 4 and the main text.
Genes 2021, 12, 661 17 of 29
Unicellular budding Multicellular budding
Figure A4. Companion to Figure 5 for a mutant with less of a growth rate advantage. Here, thegrowth rate advantage of the mutant is 25% faster than the wild type, compared to the 50% fasterconsidered in Figure 5 and the main text.
Genes 2021, 12, 661 18 of 29
Binary fission
Figure A5. Companion to Figure 4 for a mutant with more of a growth rate advantage. Here, thegrowth rate advantage of the mutant is 75% faster than the wild type, compared to the 50% fasterconsidered in Figure 4 and the main text.
Genes 2021, 12, 661 19 of 29
Unicellular budding Multicellular budding
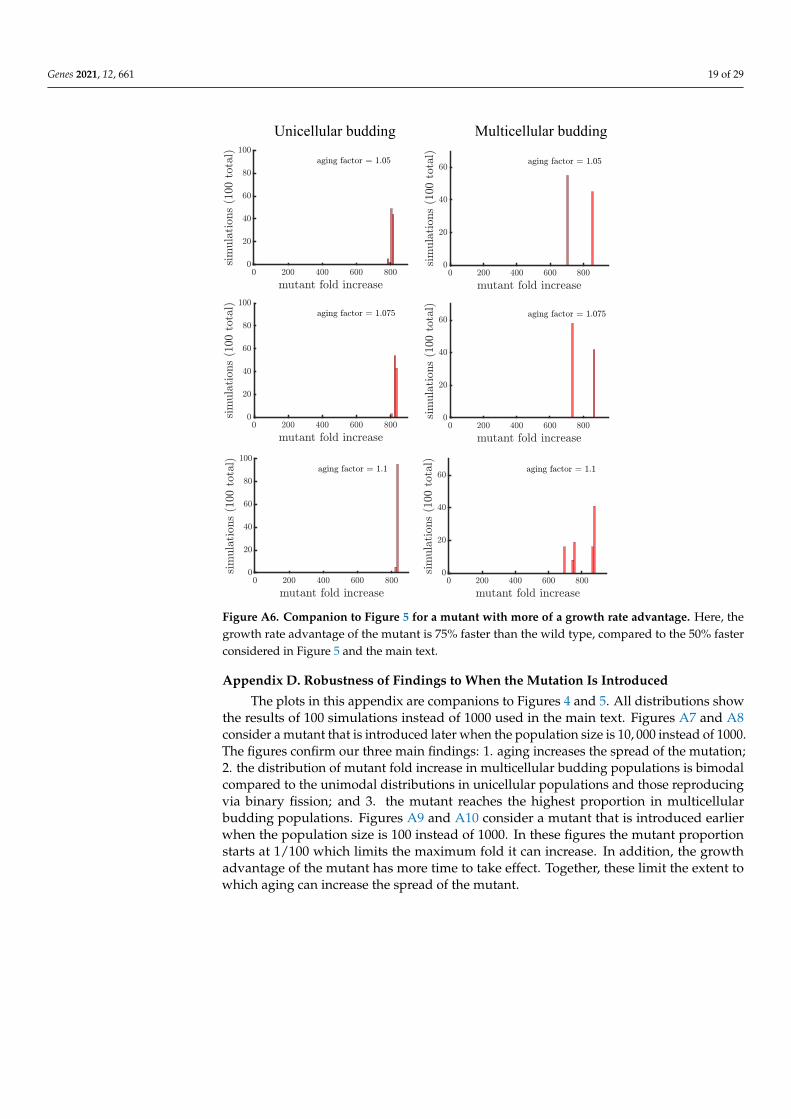
Figure A6. Companion to Figure 5 for a mutant with more of a growth rate advantage. Here, thegrowth rate advantage of the mutant is 75% faster than the wild type, compared to the 50% fasterconsidered in Figure 5 and the main text.
Appendix D. Robustness of Findings to When the Mutation Is Introduced
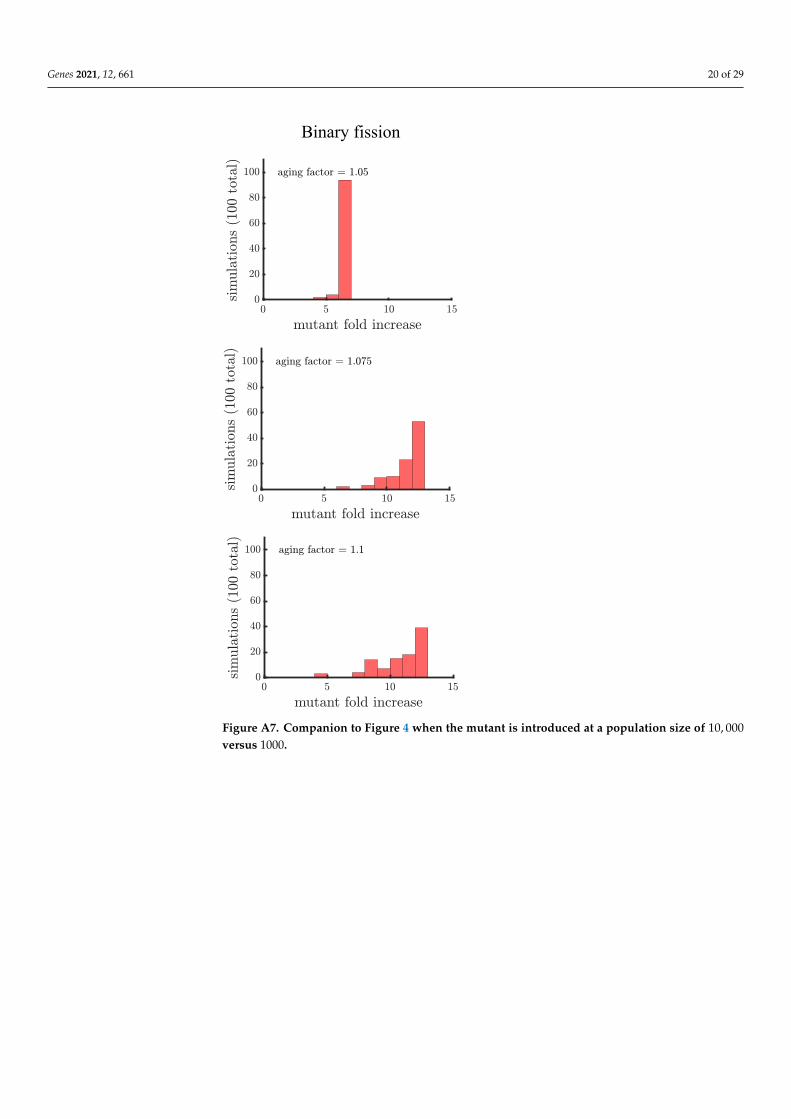
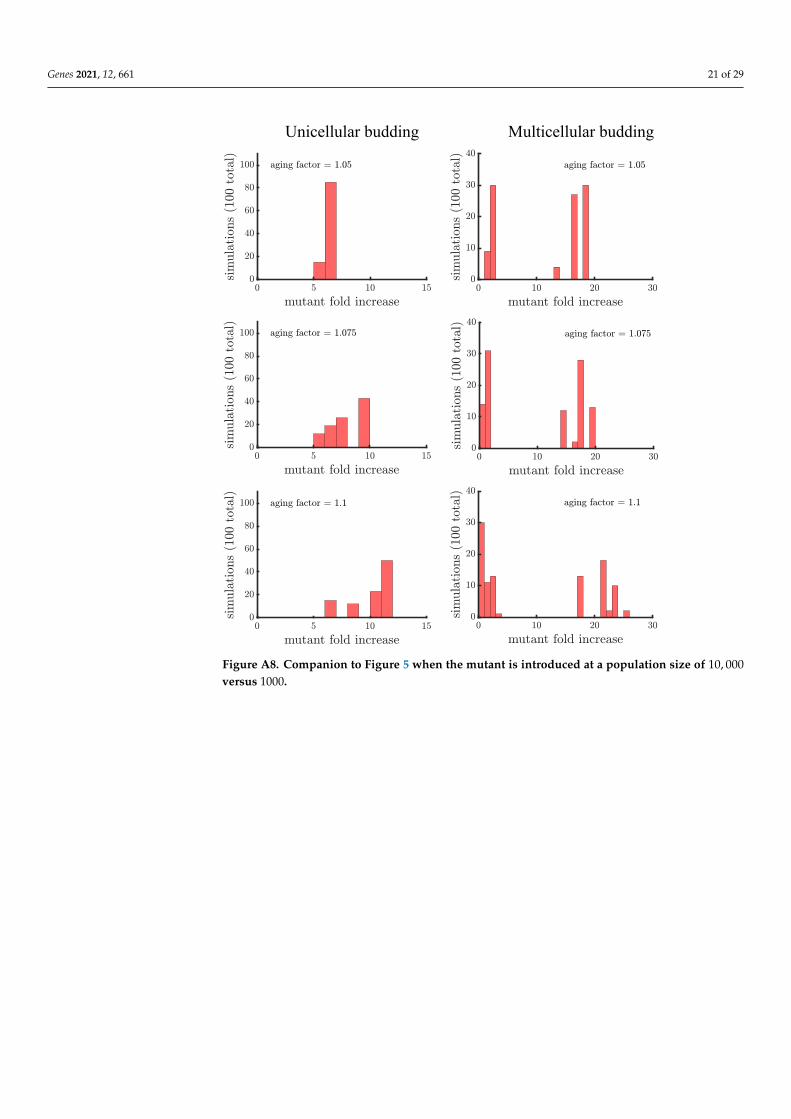
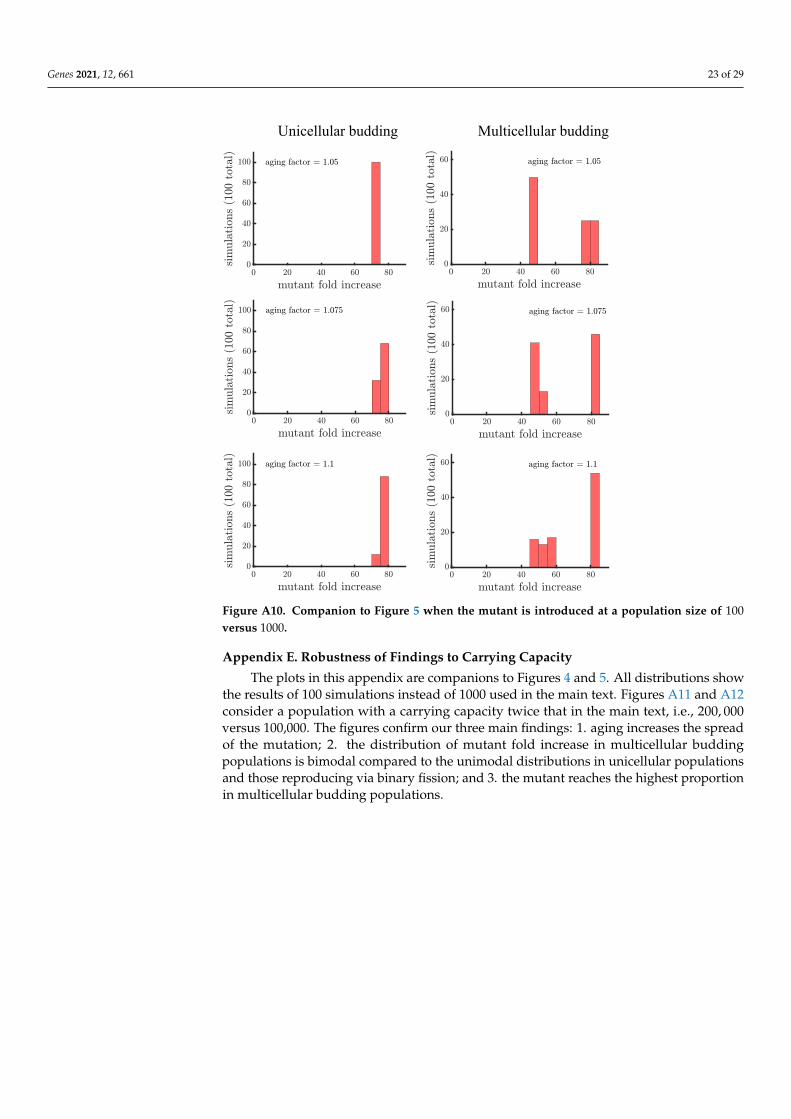
The plots in this appendix are companions to Figures 4 and 5. All distributions showthe results of 100 simulations instead of 1000 used in the main text. Figures A7 and A8consider a mutant that is introduced later when the population size is 10, 000 instead of 1000.The figures confirm our three main findings: 1. aging increases the spread of the mutation;2. the distribution of mutant fold increase in multicellular budding populations is bimodalcompared to the unimodal distributions in unicellular populations and those reproducingvia binary fission; and 3. the mutant reaches the highest proportion in multicellularbudding populations. Figures A9 and A10 consider a mutant that is introduced earlierwhen the population size is 100 instead of 1000. In these figures the mutant proportionstarts at 1/100 which limits the maximum fold it can increase. In addition, the growthadvantage of the mutant has more time to take effect. Together, these limit the extent towhich aging can increase the spread of the mutant.
Genes 2021, 12, 661 20 of 29
Binary fission
Figure A7. Companion to Figure 4 when the mutant is introduced at a population size of 10, 000versus 1000.
Genes 2021, 12, 661 21 of 29
Unicellular budding Multicellular budding
Figure A8. Companion to Figure 5 when the mutant is introduced at a population size of 10, 000versus 1000.

Genes 2021, 12, 661 22 of 29
Binary fission
Figure A9. Companion to Figure 4 when the mutant is introduced at a population size of 100versus 1000.
Genes 2021, 12, 661 23 of 29
Unicellular budding Multicellular budding
Figure A10. Companion to Figure 5 when the mutant is introduced at a population size of 100versus 1000.
Appendix E. Robustness of Findings to Carrying Capacity
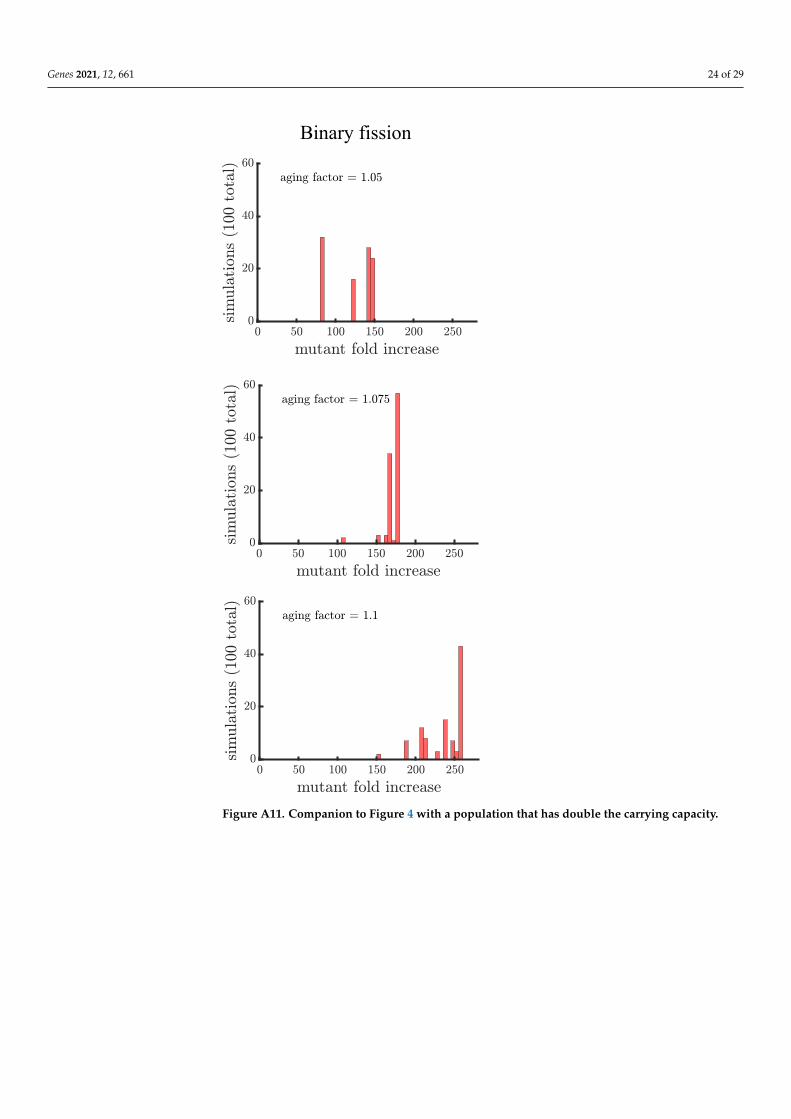
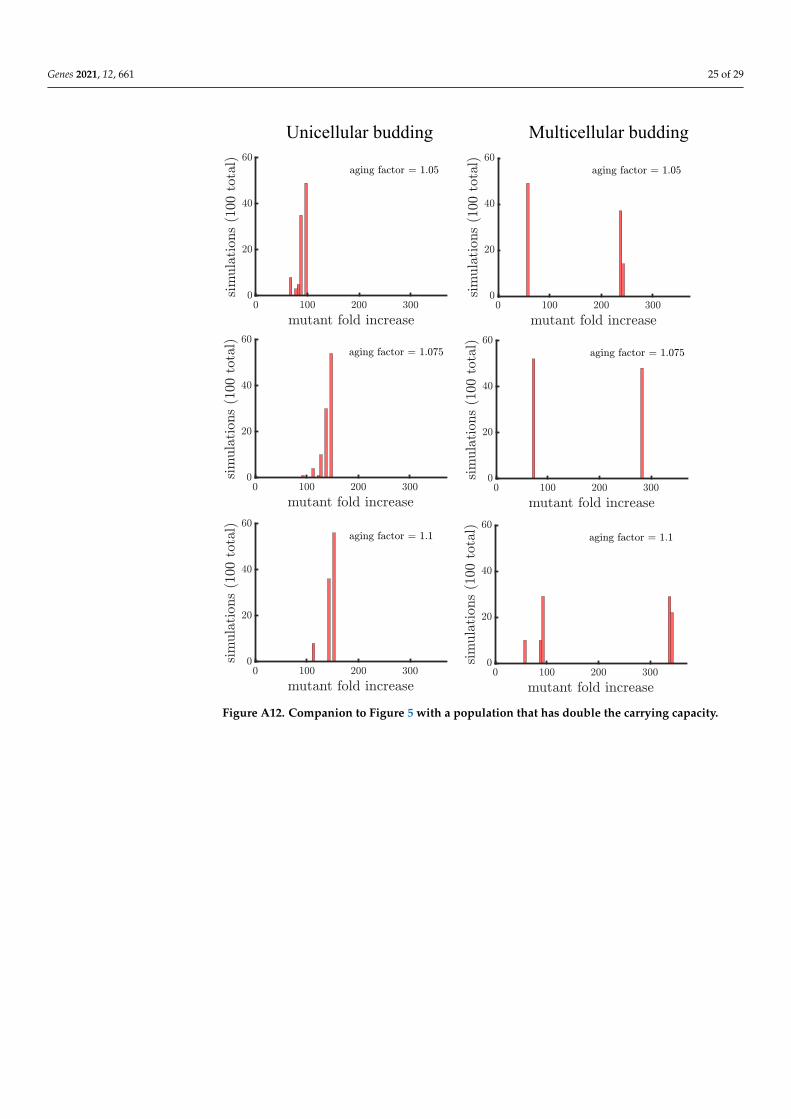
The plots in this appendix are companions to Figures 4 and 5. All distributions showthe results of 100 simulations instead of 1000 used in the main text. Figures A11 and A12consider a population with a carrying capacity twice that in the main text, i.e., 200, 000versus 100,000. The figures confirm our three main findings: 1. aging increases the spreadof the mutation; 2. the distribution of mutant fold increase in multicellular buddingpopulations is bimodal compared to the unimodal distributions in unicellular populationsand those reproducing via binary fission; and 3. the mutant reaches the highest proportionin multicellular budding populations.
Genes 2021, 12, 661 24 of 29
Binary fission
Figure A11. Companion to Figure 4 with a population that has double the carrying capacity.
Genes 2021, 12, 661 25 of 29
Unicellular budding Multicellular budding
Figure A12. Companion to Figure 5 with a population that has double the carrying capacity.
Genes 2021, 12, 661 26 of 29
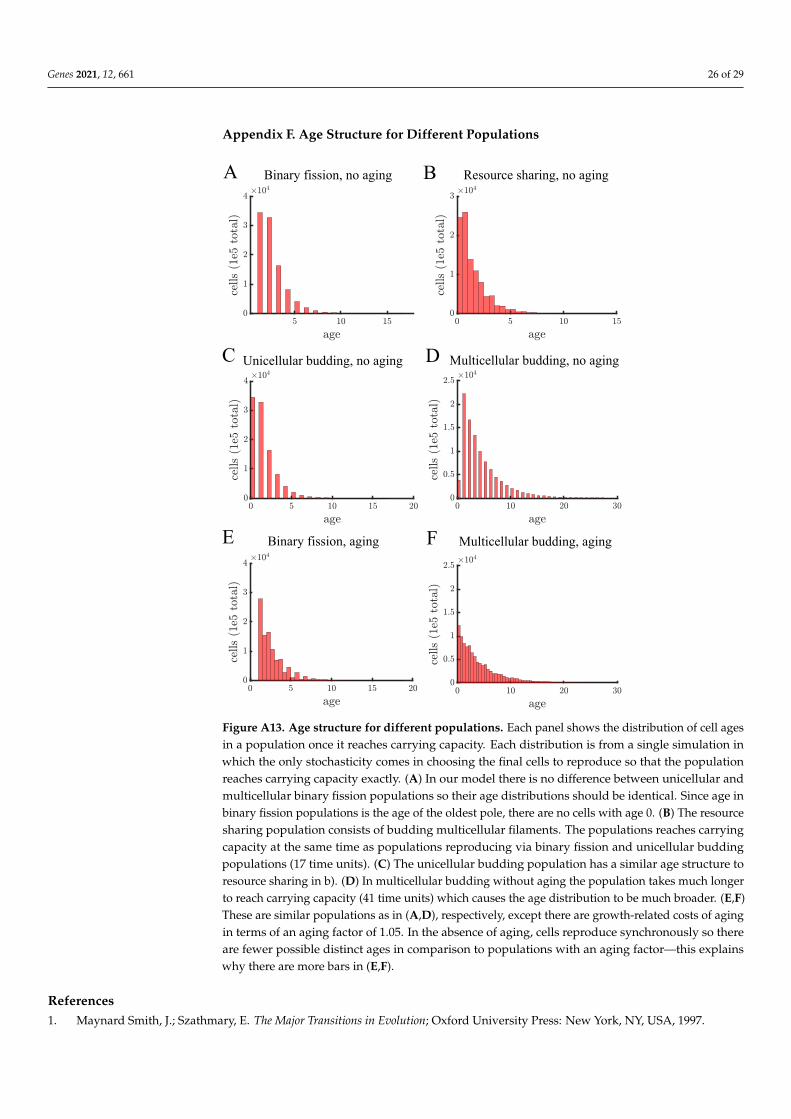
Appendix F. Age Structure for Different Populations
Binary fission, no aging Resource sharing, no aging
Unicellular budding, no aging Multicellular budding, no aging
Binary fission, aging Multicellular budding, aging
A B
C D
E F
Figure A13. Age structure for different populations. Each panel shows the distribution of cell agesin a population once it reaches carrying capacity. Each distribution is from a single simulation inwhich the only stochasticity comes in choosing the final cells to reproduce so that the populationreaches carrying capacity exactly. (A) In our model there is no difference between unicellular andmulticellular binary fission populations so their age distributions should be identical. Since age inbinary fission populations is the age of the oldest pole, there are no cells with age 0. (B) The resourcesharing population consists of budding multicellular filaments. The populations reaches carryingcapacity at the same time as populations reproducing via binary fission and unicellular buddingpopulations (17 time units). (C) The unicellular budding population has a similar age structure toresource sharing in b). (D) In multicellular budding without aging the population takes much longerto reach carrying capacity (41 time units) which causes the age distribution to be much broader. (E,F)These are similar populations as in (A,D), respectively, except there are growth-related costs of agingin terms of an aging factor of 1.05. In the absence of aging, cells reproduce synchronously so thereare fewer possible distinct ages in comparison to populations with an aging factor—this explainswhy there are more bars in (E,F).
References1. Maynard Smith, J.; Szathmary, E. The Major Transitions in Evolution; Oxford University Press: New York, NY, USA, 1997.
Genes 2021, 12, 661 27 of 29
2. Grosberg, R.K.; Strathmann, R.R. The evolution of multicellularity: A minor major transition? Annu. Rev. Ecol. Evol. Syst. 2007,38, 621–654. [CrossRef]
3. Rokas, A. The origins of multicellularity and the early history of the genetic toolkit for animal development. Annu. Rev. Genet.2008, 42, 235–251. [CrossRef]
4. Domazet-Lošo, T.; Tautz, D. Phylostratigraphic tracking of cancer genes suggests a link to the emergence of multicellularity inmetazoa. BMC Biol. 2010, 8, 1–10. [CrossRef]
5. Aktipis, C.A.; Boddy, A.M.; Jansen, G.; Hibner, U.; Hochberg, M.E.; Maley, C.C.; Wilkinson, G.S. Cancer across the tree of life:Cooperation and cheating in multicellularity. Philos. Trans. R. Soc. Biol. Sci. 2015, 370, 20140219. [CrossRef] [PubMed]
6. Libby, E.; Ratcliff, W.C. Ratcheting the evolution of multicellularity. Science 2014, 346, 426–427. [CrossRef] [PubMed]7. Rebolleda-Gómez, M.; Travisano, M. The cost of being big: Local competition, importance of dispersal, and experimental
evolution of reversal to unicellularity. Am. Nat. 2018, 192, 731–744. [CrossRef]8. Rebolleda-Gómez, M.; Travisano, M. Adaptation, chance, and history in experimental evolution reversals to unicellularity.
Evolution 2019, 73, 73–83. [CrossRef] [PubMed]9. Libby, E.; Conlin, P.L.; Kerr, B.; Ratcliff, W.C. Stabilizing multicellularity through ratcheting. Philos. Trans. R. Soc. Biol. Sci. 2016,
371, 20150444. [CrossRef]10. Duran-Nebreda, S.; Solé, R. Emergence of multicellularity in a model of cell growth, death and aggregation under size-dependent
selection. J. R. Soc. Interface 2015, 12, 20140982. [CrossRef]11. Libby, E.; Ratcliff, W.; Travisano, M.; Kerr, B. Geometry shapes evolution of early multicellularity. PLoS Comput. Biol. 2014,
10, e1003803. [CrossRef]12. Jacobeen, S.; Pentz, J.T.; Graba, E.C.; Brandys, C.G.; Ratcliff, W.C.; Yunker, P.J. Cellular packing, mechanical stress and the
evolution of multicellularity. Nat. Phys. 2018, 14, 286–290. [CrossRef]13. Ratcliff, W.C.; Herron, M.; Conlin, P.L.; Libby, E. Nascent life cycles and the emergence of higher-level individuality. Philos. Trans.
R. Soc. Biol. Sci. 2017, 372, 20160420. [CrossRef]14. Staps, M.; van Gestel, J.; Tarnita, C.E. Emergence of diverse life cycles and life histories at the origin of multicellularity. Nat. Ecol.
Evol. 2019, 3, 1197–1205. [CrossRef]15. Pentz, J.T.; Márquez-Zacarías, P.; Bozdag, G.O.; Burnetti, A.; Yunker, P.J.; Libby, E.; Ratcliff, W.C. Ecological advantages and
evolutionary limitations of aggregative multicellular development. Curr. Biol. 2020, 30, 4155–4164. [CrossRef]16. Pichugin, Y.; Peña, J.; Rainey, P.B.; Traulsen, A. Fragmentation modes and the evolution of life cycles. PLoS Comput. Biol. 2017,
13, e1005860. [CrossRef]17. Libby, E.; Rainey, P.B. Eco-evolutionary feedback and the tuning of proto-developmental life cycles. PLoS ONE 2013, 8, e82274.
[CrossRef] [PubMed]18. Black, A.J.; Bourrat, P.; Rainey, P.B. Ecological scaffolding and the evolution of individuality. Nat. Ecol. Evol. 2020, 4, 426–436.
[CrossRef] [PubMed]19. Fisher, R.; Shik, J.; Boomsma, J. The evolution of multicellular complexity: The role of relatedness and environmental constraints.
Proc. R. Soc. 2020, 287, 20192963. [CrossRef] [PubMed]20. Niklas, K.J.; Newman, S.A. The origins of multicellular organisms. Evol. Dev. 2013, 15, 41–52. [CrossRef]21. King, N.; Hittinger, C.T.; Carroll, S.B. Evolution of key cell signaling and adhesion protein families predates animal origins.
Science 2003, 301, 361–363. [CrossRef] [PubMed]22. Nedelcu, A.M.; Michod, R.E. The evolutionary origin of an altruistic gene. Mol. Biol. Evol. 2006, 23, 1460–1464. [CrossRef]
[PubMed]23. Ritchie, A.V.; van Es, S.; Fouquet, C.; Schaap, P. From drought sensing to developmental control: Evolution of cyclic AMP
signaling in social amoebas. Mol. Biol. Evol. 2008, 25, 2109–2118. [CrossRef] [PubMed]24. Hanschen, E.R.; Marriage, T.N.; Ferris, P.J.; Hamaji, T.; Toyoda, A.; Fujiyama, A.; Neme, R.; Noguchi, H.; Minakuchi, Y.; Suzuki,
M.; et al. The Gonium pectorale genome demonstrates co-option of cell cycle regulation during the evolution of multicellularity.Nat. Commun. 2016, 7, 1–10. [CrossRef] [PubMed]
25. Kiss, E.; Hegedüs, B.; Virágh, M.; Varga, T.; Merényi, Z.; Kószó, T.; Bálint, B.; Prasanna, A.N.; Krizsán, K.; Kocsubé, S.; et al.Comparative genomics reveals the origin of fungal hyphae and multicellularity. Nat. Commun. 2019, 10, 1–13. [CrossRef]
26. Mikhailov, K.V.; Konstantinova, A.V.; Nikitin, M.A.; Troshin, P.V.; Rusin, L.Y.; Lyubetsky, V.A.; Panchin, Y.V.; Mylnikov, A.P.;Moroz, L.L.; Kumar, S.; et al. The origin of Metazoa: A transition from temporal to spatial cell differentiation. Bioessays 2009,31, 758–768. [CrossRef]
27. Brunet, T.; King, N. The origin of animal multicellularity and cell differentiation. Dev. Cell 2017, 43, 124–140. [CrossRef]28. Schaap, P. From environmental sensing to developmental control: Cognitive evolution in dictyostelid social amoebas. Philos.
Trans. R. Soc. 2021, 376, 20190756. [CrossRef]29. Ratcliff, W.C.; Denison, R.F.; Borrello, M.; Travisano, M. Experimental evolution of multicellularity. Proc. Natl. Acad. Sci. USA
2012, 109, 1595–1600. [CrossRef]30. Libby, E.; Rainey, P.B. A conceptual framework for the evolutionary origins of multicellularity. Phys. Biol. 2013, 10, 035001.
[CrossRef]31. Herron, M.D.; Borin, J.M.; Boswell, J.C.; Walker, J.; Chen, I.C.K.; Knox, C.A.; Boyd, M.; Rosenzweig, F.; Ratcliff, W.C. De novo
origins of multicellularity in response to predation. Sci. Rep. 2019, 9, 1–9. [CrossRef]
Genes 2021, 12, 661 28 of 29
32. Koschwanez, J.H.; Foster, K.R.; Murray, A.W. Sucrose utilization in budding yeast as a model for the origin of undifferentiatedmulticellularity. PLoS Biol. 2011, 9, e1001122. [CrossRef]
33. Boraas, M.E.; Seale, D.B.; Boxhorn, J.E. Phagotrophy by a flagellate selects for colonial prey: A possible origin of multicellularity.Evol. Ecol. 1998, 12, 153–164. [CrossRef]
34. Shelton, D.E.; Michod, R.E. Group and individual selection during evolutionary transitions in individuality: Meanings andpartitions. Philos. Trans. R. Soc. 2020, 375, 20190364. [CrossRef] [PubMed]
35. Goldsby, H.J.; Knoester, D.B.; Ofria, C.; Kerr, B. The evolutionary origin of somatic cells under the dirty work hypothesis. PLoSBiol. 2014, 12, e1001858. [CrossRef] [PubMed]
36. Gavrilets, S. Rapid transition towards the division of labor via evolution of developmental plasticity. PLoS Comput. Biol. 2010,6, e1000805. [CrossRef] [PubMed]
37. Yanni, D.; Jacobeen, S.; Márquez-Zacarías, P.; Weitz, J.S.; Ratcliff, W.C.; Yunker, P.J. Topological constraints in early multicellularityfavor reproductive division of labor. Elife 2020, 9, e54348. [CrossRef]
38. Michod, R.E.; Nedelcu, A.M. On the reorganization of fitness during evolutionary transitions in individuality. Integr. Comp. Biol.2003, 43, 64–73. [CrossRef] [PubMed]
39. Gruenheit, N.; Parkinson, K.; Stewart, B.; Howie, J.A.; Wolf, J.B.; Thompson, C.R. A polychromatic ‘greenbeard’locus determinespatterns of cooperation in a social amoeba. Nat. Commun. 2017, 8, 1–9. [CrossRef]
40. Velicer, G.J.; Kroos, L.; Lenski, R.E. Developmental cheating in the social bacterium Myxococcus xanthus. Nature 2000, 404, 598–601.[CrossRef]
41. Ratcliff, W.C.; Herron, M.D.; Howell, K.; Pentz, J.T.; Rosenzweig, F.; Travisano, M. Experimental evolution of an alternatinguni-and multicellular life cycle in Chlamydomonas reinhardtii. Nat. Commun. 2013, 4, 1–7. [CrossRef]
42. Sebé-Pedrós, A.; Roger, A.J.; Lang, F.B.; King, N.; Ruiz-Trillo, I. Ancient origin of the integrin-mediated adhesion and signalingmachinery. Proc. Natl. Acad. Sci. USA 2010, 107, 10142–10147. [CrossRef]
43. Wolinsky, E.; Libby, E. Evolution of regulated phenotypic expression during a transition to multicellularity. Evol. Ecol. 2016,30, 235–250. [CrossRef]
44. Lachmann, M.; Libby, E. Epigenetic inheritance systems contribute to the evolution of a germline. Philos. Trans. R. Soc. Biol. Sci.2016, 371, 20150445. [CrossRef] [PubMed]
45. Sebé-Pedrós, A.; Degnan, B.M.; Ruiz-Trillo, I. The origin of Metazoa: A unicellular perspective. Nat. Rev. Genet. 2017, 18, 498.[CrossRef]
46. Dodds, W.K.; Gudder, D.A.; Mollenhauer, D. The ecology of Nostoc. J. Phycol. 1995, 31, 2–18. [CrossRef]47. Lloyd, C.; Chan, J. Not so divided: The common basis of plant and animal cell division. Nat. Rev. Mol. Cell Biol. 2006, 7, 147–152.
[CrossRef]48. Walker, G.M.; White, N.A. Introduction to fungal physiology. Fungi: Biol. Appl. 2017, 1–35. [CrossRef]49. Steinkraus, K.; Kaeberlein, M.; Kennedy, B.K. Replicative aging in yeast: The means to the end. Annu. Rev. Cell Dev. Biol. 2008,
24, 29–54. [CrossRef] [PubMed]50. Stewart, E.J.; Madden, R.; Paul, G.; Taddei, F. Aging and death in an organism that reproduces by morphologically symmetric
division. PLoS Biol. 2005, 3, e45. [CrossRef] [PubMed]51. Tarnita, C.E.; Taubes, C.H.; Nowak, M.A. Evolutionary construction by staying together and coming together. J. Theor. Biol. 2013,
320, 10–22. [CrossRef] [PubMed]52. Fisher, R.M.; Cornwallis, C.K.; West, S.A. Group formation, relatedness, and the evolution of multicellularity. Curr. Biol. 2013,
23, 1120–1125. [CrossRef]53. Knoll, A.H. The multiple origins of complex multicellularity. Annu. Rev. Earth Planet. Sci. 2011, 39, 217–239. [CrossRef]54. Cairney, J. Translocation of solutes in ectomycorrhizal and saprotrophic rhizomorphs. Mycol. Res. 1992, 96, 135–141. [CrossRef]55. Lew, R.R. How does a hypha grow? The biophysics of pressurized growth in fungi. Nat. Rev. Microbiol. 2011, 9, 509–518.
[CrossRef] [PubMed]56. Bonner, J.T. Why Size Matters: From Bacteria to Blue Whales; Princeton University Press: Princeton, NJ, USA, 2011.57. Schlichting, C.D. Origins of differentiation via phenotypic plasticity. Evol. Dev. 2003, 5, 98–105. [CrossRef]58. Travisano, M.; Mongold, J.A.; Bennett, A.F.; Lenski, R.E. Experimental tests of the roles of adaptation, chance, and history in
evolution. Science 1995, 267, 87–90. [CrossRef]59. Ratcliff, W.C.; Fankhauser, J.D.; Rogers, D.W.; Greig, D.; Travisano, M. Origins of multicellular evolvability in snowflake yeast.
Nat. Commun. 2015, 6, 1–9. [CrossRef] [PubMed]60. Longo, V.D.; Shadel, G.S.; Kaeberlein, M.; Kennedy, B. Replicative and chronological aging in Saccharomyces cerevisiae. Cell
Metab. 2012, 16, 18–31. [CrossRef]61. Wessel, A.K.; Arshad, T.A.; Fitzpatrick, M.; Connell, J.L.; Bonnecaze, R.T.; Shear, J.B.; Whiteley, M. Oxygen limitation within a
bacterial aggregate. MBio 2014, 5. [CrossRef]62. Roberts, M.E.; Stewart, P.S. Modeling antibiotic tolerance in biofilms by accounting for nutrient limitation. Antimicrob. Agents
Chemother. 2004, 48, 48–52. [CrossRef]63. Hallatschek, O.; Hersen, P.; Ramanathan, S.; Nelson, D.R. Genetic drift at expanding frontiers promotes gene segregation. Proc.
Natl. Acad. Sci. USA 2007, 104, 19926–19930. [CrossRef]

Genes 2021, 12, 661 29 of 29
64. Gralka, M.; Stiewe, F.; Farrell, F.; Möbius, W.; Waclaw, B.; Hallatschek, O. Allele surfing promotes microbial adaptation fromstanding variation. Ecol. Lett. 2016, 19, 889–898. [CrossRef] [PubMed]
65. Fusco, D.; Gralka, M.; Kayser, J.; Anderson, A.; Hallatschek, O. Excess of mutational jackpot events in expanding populationsrevealed by spatial Luria–Delbrück experiments. Nat. Commun. 2016, 7, 1–9. [CrossRef] [PubMed]
66. Farrell, F.D.; Gralka, M.; Hallatschek, O.; Waclaw, B. Mechanical interactions in bacterial colonies and the surfing probability ofbeneficial mutations. J. R. Soc. Interface 2017, 14, 20170073. [CrossRef] [PubMed]
67. Flemming, H.C.; Wuertz, S. Bacteria and archaea on Earth and their abundance in biofilms. Nat. Rev. Microbiol. 2019, 17, 247–260.[CrossRef] [PubMed]