Fission Product Behavior in the Mclten Salt Reactor Experiment
173
&L .'/"'J ORNL 4865 Fission Product Behavior in the Mclten Salt Reactor Experiment E. L. Ccmpcre S. S. KirsMs
-
Upload
khangminh22 -
Category
Documents
-
view
1 -
download
0
Transcript of Fission Product Behavior in the Mclten Salt Reactor Experiment

&L .'/"'J ORNL 4865
Fission Product Behavior in the Mclten Salt Reactor Experiment
E. L. Ccmpcre S. S. KirsMs

BLANK PAGE
<J
i
Printed in the United States of America. Available from National technical Information Service
U.S. Dioart.-nem of Commerce 5285 Port Royal Roaa. brxir.^fieid. Virginia 22161
Price: Printed Copy S7.60: Microfiche S2.25
This report was prepared n an aocou.it of work sponsored by rh* United States Government. Ne-ri'*. -he United States nor the Energy Research and Dcvdopmtn-Admmistration. nor any of ffi*-r employees, nor any o* their contractors, subcontractors, or their employees, makes any warranty, express or implied, -x assumes any legal liability or responsibi'ity for the accuracy, completeness or usefulness of any information, apparatus, product or process disclosed, or represents that its use would not infringe pr-vatdy owned rights.

OR NL 4866 UC 76 - Molon S*lt Reactor Ttchnology
Co-"*.- \ c .'.7-10= -r-9 26
MOIItVS\ l . l kl U1<)KPR«K,R\M
FISSION PRODUCT BEHAVIOR IN THE MOLTEN SALT REACTOR EXPERIMENT
E L Comoe'e E G 3ori!m;in S S <-r$hs F F. Biar,ken$i-,D
•V R Grimes
OCTOBER 1975
OAK RIDGE NATIONAL LABORATORY Oak Rid^e Tennessee ")7830
ooerated oy UNION CARBiDE CORPORATION
for the rNERGY RESEARCH AND DEVELOPMENT ADMINISTRATION
\
Thi* report » ore ot pcnu&t ttyoru m »hh.h mt 4ei*.nbe the x-pr* ••* rtw p » « Orhet Mpum m e d arias w i n me fated M »
O U X L M ^ FtoMdEadragJjrm* 3!. !*•** « tXL2t>> Period EadEMjOk.-f>r>~-! M . : ' ". 0 H \ L > » 4 rcwdEWM« J J M V . 31 ;•>•' OKSL-2"'2? Period Eada* Apr* 4* l«5» OKSL-2-r*> Pcr»dEadK«My3 . ;«*5«> O H M . : * * ) Period r i fci tOttofr 31. !•*•» « L M - > - 7 ftnud* EnfrfJa—»r 31 Md \prc 30 O H M J O M Period EadHHj M y 31 l-*0 OKM.-3I*: rVnud Eadmg Fcfcrajry >.. !•*.» O H M 3:15 Penud Ewtog A f t f 3; l»*»l OKSLS2*2 rVrwd E»4MC F«4»nur> > !>K»: O d M . i W Period Imimt A* f» * 3:. 1 % : ORM.-34I9 Period Eadn* hrnun 31. '«*to3 OBIL- iS> Ftnotf Eatfn* M y 31. i'** < ORSL-3fr2ft Herod E« fcwi JJ— *y 31. <464 ORM.-370H PenjdEsda«My3l. l < *K* O « M . » I : Period Eadnf Fcfcnury » . I«*.5 omL-arc Period EwJif Aagaa 31. l'i-5 ORML-Jafe Perod C i i d f Febnnry > . !"*<> OHNL-W37 Period EadMg Aapni 3 1 . I * * * OR.M.-I119 Period EitdM« F n m o > - 1"*»7 OKNL-II9I Penodtjidiaf .*«•»( 31.I%.7 ORNL-IJ54 Period EndiM I frmwy 2**. 1*** ORNL-1344 rVnod Endng V-wn 31.I«J6* ORM.-43*, hriod EadnHj F-* nury 2*. I«V» OHM-U4P r-rwf Eadnt Aupw 31.I«H*» ORM.-454* Period Endwg Fcrnnry 9 . !«>7M fi*HL4t>22 P*r;-jd Ending A»T-.a 31.1970 ORNL-4676 Period Ending F**"»o > . I'»7| ORXL-472H Period Ending Ao* t 31.I<*7| 0*SL-t7A2 Pfrtud Ending Fehn- >ry 2*. Iff 2
i**bO
J K
C0K1IXT5
ABSTRACT I
HOWARD ;
i. INTRODUCTION 2
2. ,,U MOLTtXSALTREACTORLXTtRIMLNT 3
3. vsKtamosauxiY 10 3.1 Opa.ai»m«iik :'*l Led 10
3.2 O p n * M i w M f c 2 J J t H i d 12
•». SOMfrCHEMISTRY HTUMMLNTALS 14
5. INVENTORY 16
6 SALT SAMPUS I*
h i ijdkVmpIn I«* 6.2 hM/^Vdac i * ^ > 22 6.3 DtwMrftjiC^Mit 24 6.4 FiMi»n ri»«iiKi Lkincni fanupmg 27 6.5 V-hfc MCIJI M u » » 27 6.6 Nmbiuin . . 28 6.7 IINIRIC 2»
6.J» Tdtauum 2*1
7 SCRt A l t DEPOSITION OF FISSION PF.O0< CTSBV PUMPROWi. I XPOSl R i 37 7.1 CjHe 37 7.2 Caps k Surfjto* 37 7.3 Exposure F*penm?nS» 37 7.4 M»l 41
J». GAS SAMPLES 48 X.I Frcr/c VJvcC jpwW 48 .1.2 VjlNfci) .K <«i» Samples 48 » 3 DuufclrWall ¥m/< \*brt Capsule 4*> x.4 Iiteci m K i i i 50
<». SURVEILLANCE SPECIMENS 60 «». I As»mhtK» I 4 6U
•U. I Preface 60 •». 1.2 Relative dVptMii intensity M

* 2 Fmal Assembly 70 *».2I Desapt 70 9.2.2 Specwaensaod flow 70 9.2.3 Fask» recoil 73 9.2.4 SalMeeljngn.xbaes 73 ••.15 N«cWe» with •oUr-fs precursors 73 9.2.6 V<Mrioetalv uiobMimaiidin<t>bdenuM 74 9.2? RuffceMMI 74 9.2.8 Tetmnum 74 9.2.9 Iodine 74 9.2.10 Sticking factor* 74
9.3 Profile Una 75 9.31 Procedure 75 9.3.2 Results 78 9.3.3 Difraswa mechanism relationships 78 9.3.4 CouciwsMts Iron; profile data M
9.4 Other Fmdmgs on Surveriiance Speconens 85
10. EXAMINATION OF OFF<iAS SYSTEM COMPONENTS OR SPtCIMLNS REMOVED PRIOR TO FINAL SHUTDOWN 9 |
10.! Exanunation of Particle Trap Removed alter Run 7 9 |
10.2 Examination of Oti-Cas Jumper line Removed alter Run 14 92 10.2.1 Chemical analysis 93 10.2.2 Radiochemical analysis >»3
10.3 Examination of Material Recovered from Off-Gas bne after Run 16 9* 10.4 OlY-Ga line Examinations after Run 18 100 10.5 Examination of VaKe Assembly from Line 523 alter Run 18 104 10.6 The Estimation of Flowing Aerosol Concentrations from Deposits on Conduit wall 106
10.6.1 Deposition by diffusion 106 10.6.2 Deposition by thermophore*!* 107 IC.6.3 Relationship between obseived deposition and reactor loss fractions 107
10.7 Discussion of Off-Gas Line Transport I C 10.7.1 Salt constituents and salt-wefcing nudnik 109 10.7 2 Daughters of noble Rases 109 10.7.3 Nook metals 110
11. POST-OPERATION EXAMINATION OF MSRE COMK>NENTS U2 I I.I Examination of Deposits from the Mist Shrid in the MSRE Fuel Pump Bowl 112 11.2 Examination of Moderator Graphite from MSRh 120
11.2.1 Results of visual examination 120 11.2.2 Segmenting of graphite string?. '20 11.2.3 Examination of surface sample. H> x-ray diffrac'.ion 121 11.2.4 Milling of surface graphite samr*"* 121 11.2.5 Radiochemical and chemical a r i s e s of MSRE graphite 121
11.3 txamma'.ion of Heat Exchangers and C< >riir"l Rod ThimWe Surface: 125
11.4 Metal Transfer in MSRE Sail Circuits 126
11.5 Cesium Isotope Migration in MSRE Grapnu; 127

11.6 Votfe-Mtul F H M I Tfwsfoit Model 12* 11.6.! iHKamn Mtdmoiei 128 11.6 2 On-cuhbedepusiu 130 11.6 3 SonreribKe i p K M s 130 11.6.4 PMNM> bu«rl unpin 131
12. SUMMARY ANDOVfc'.VItW 135 12.1 Subk Sak&ikiUe l-hwndn 135
12.1.1 Srtanpfcs 131 12.1.2 DepuHmm 135 12.1.3 Cjssampks 136
122 \MtHnJs 17* 12.2.1 Srfi-burat 136 12.2.2 Ntobmim 136 12 2.3 i.zvburac 136
12.3 Deposition in Crjpfcite md HKtdk* N 137
12.4 |.Mfc* 138 125 bvahiatiun 138
VI
USTOFFHXKES
F * a r e l i Desiga l l o * sheet »H the MSRL . 5
F ^ i r e 2-2 Pressures, tofcunes. and traiuii o m o n MSRt: tuei •.ucuLituK Uwp 4
Figure- 1 5 MSRF reactorvend . . . 5
F ^ t r c 1 4 F k » patteibs m the MSRF fuel pump . . . . r>
Figure 5.1 O u t m o i o a c a ! outhnes of MSRfc opei.:tH«i> . . . II
Figure. 6.1 Sampier-eiincfcer schematic I*»
Figure 6 .3 Apparatus toe removmg MSRL salt ir.wn puHen/ei -nuxer to
poh i>kne sample bottle 2U
Figure 6.4 Freeze v d»e capt tic- -2
Figure fej >.«Me-me»al activities «»l salt *ampk-* Mi
Figure ~M Specimen bolder designed to prevent ctHiiamination h\ c*«iiaci »nh translcr IU'JC ***
Figure 1.2 Sample holder lot diort-term deposit;- -n test . . . 41
Figure 7.5 Salt droplets on a metal strip exposed m MSRr pump howl ej> lpa^c tor r> hr 42
Figure S.I Freeze vahe cjpsule 4*
Figure 8.; DouMe-wail sample capsule 5o
Figure 9. | T> ptcai graphite stupe* used in a stringer ••! surveillance >pecimoji» Ml
Figure 9.2 Surveillance specimen str.nger r»l
Figure 9.5 Sirmger containment . . «»l
Figure 9.4 Stringer assembh r>2
Figure 9.5 Neutron "'iux and temperature profiles lor ci>rc surveillance assembU t»5
Figure 9.6 Scheme lor milling graphite samples M
Figure 9 7 >£•,£ mneUlance specimen assembts 70
Figure 9.>j Cm.entral ion profile tor ' " i s m impregnated CGB graphite, sample P-'»2 7 5
Figure 9.9 Concentration profiles tor **Sr and | 4 0 B J in two samples o t (<»B. X 15 wide lace.
and P-58 75
Figure 9 .10 C.mcentration profiles lor "*Sr and | 4 0 B a in psrolstic graphite 7h
Figure 9.11 Concentration profiles lor ' t $ N b and *' Zr in CGB graphite. X-15. double exposure 7h
Figure 9.12 Concentration profiles tor ' * J Ru on two laces of the X-15 graphic-specimen. CGB. double exposure 77
Figure 9 .13 Concentration profiles f o r ' °* R u . ' *' Ce. and ' 4 4 C e in ( O B graphite, sampie Y-9 77
Figure 9 .14 Concentration profiles f o r ' 4 ' C e and ' 4 4 C e m tw«» samples ol CGB graphite. X-13. wide face, and P-38 7«
Figure 9.15 Fission product dislribition in unimpregnated CGB (P-551 graphite specimen irradiated in MSRt cycle ending March 25. 1968 7«>
Figure 9.16 Fission product distribution in impregnated CGB (V-2H) graphite specimen irradiated in MSRt cycle ending March 25, l%8 80
» : i
t-tpiir »» ' Dt>'tibuti>*i n p\ r<4> I K pjfkne specimen trroduied m MSRk lo» .>vkcniiof M^IJ. :s. INM »i
hkpire M. Ik I r jnjuin-. ' .o c<*fcmtMi>«i profile* m I O B aad pvroKtK. g;aphite M
|-qpi:c M.1«# I ituum v<«wenif J I M C I A a I U O C I H W >•< drdafwe Irom the surtacf. specimen Y - 7 J»~
|-iiuic «* , ' u | j :h iun . cuncenlratkwi a* a f u n d i * * •»« dbtoBcc II.JTC the surface, specmen X - I 5 *~
trqBirc M ' I f-luofu«r cvwiml i j lMOk in f i jph i ie sample Y-7 . exposed to muiten t a d
%J| ui tin- M S K I :• -r nine ntutiths »~
Figure M 22 tHu-irinc ^.«i^i-nt-jii.>i. j> j iunciun, ot diilonce from the surface, specimen X-15 - * *
lieuie *» '» ( .xnpartvr. ••! lithium -'io«.iTilrjli««> ir. ijnipies Y - 7 and X-I • * *
I KUII- •#. 24 \tr»x Vincent ration ratio. I- 11. v> depth. >pecimen X-13 V*
l i iuic » ."• t ••rnpariv*-. • •» tluofine i<>r.centratk>Rs in samples Y - 7 and X-15. .» smooth line having been
Jrj»r> ibt>K>di tK: data p-nnts !»**
hisun- IU ! MSKI. •>tl-i9>pvlide trip «*l
f-isire 10 2 IVp -Mt\ -.i poflick- ttjp V-«twTkr*h "2
Fbeuff 10.5 l)tp"Mt-> -Ci i.oiipei line liarur^ atlei run 14 »*4
Heir.- | i) 4 V „ lions ->l .•it-ita> funipcr line tWxibie tubing and outlet tube aiie' run 14 Mf
Finite Hi.5 lX-piAii .»n ik-xihk- probe . -**>
frwuro Ml.ii i*u>: rc-coterod ii-.Ti lipMiear.i end.-: i-jnipci line after ran 141 ItvOUU Xl MM
l ip i r . - | i ) ~ Ott-2i% lino t p c i m c n h--kk'. a> yeonented after removal, t o i h w m c run l> 101
KiiT.nv I O N Section .•( .>tf-ius lino specimen holder sho»in2 flaked deposit. removed j l i e r run I k 104
f-ipire I I I Moi shield containing simpler cage Irooi MSRI pump bowl 115
Figure 11.2 Intern* •>« miM shu-tV 114
l-ipiuc 11.5 Sample >.«.' and mrsi Jueid 115
r-«m.- 11.4 IKp«>Mi> .HI sampler cap: l i b
lipiro 11.5 ('•mceniraihin proiiles lr.>nj the -ud side of an MSKb heal exchanprr lube measui.-nl ahtmt I.:" \ear» alter reactor thuldimn I 'ci
hnturc 11 .(> ("••iiienlraliiin of cesnim iv>ti>pe% m M-SRh core f^aphite at pven distances
iront fuel chaniK'l surface 12"
hipiif I I . 7 ( ompartnx-nl model I'm nohW-meial livMon transport in MSRh I?M
Fipire I I.H Ratio oi ruthomun: iviope actbilies for pump bowl samples 13!
VM1
l O T OF TAKES
TaMe2l Fk> seal properties ut d* MSRE fuel sail »
Table 2.2 toeia* comfosmua t« MSKE fuel sail •»
laMe3.l VSRE run periods and power acq—idjti m 12
Table 4.1 Fnceargy ol hirMafMaa(b50*CiJCa(.kcat> 14
Table 5.1 Ftssur pr»»4ucs data for mvencor)cakutaauas 17
Table VI Noble-gasdaue>ii iz. and sal«-seefang isotopesm sail samples from MSRE pomp bowl
daring iiramun 235 operations 21
TaUe6.2 Some metals m salt samples from MSRE pump buwl dura* uramu»-L>5 .f*f.Hftm 21
TaMe 6 3 Data JW fuel tnwhidmt earner! salt samples from MSRE pump bowl during uranium-233 operation 23
Table 6.4 NoMe-gas daughters and saiKseebing Hofopes in salt jampki from MSRE pump bowl during uramunt-233 operation 24
Table 6.5 "iible metals in sah samples from MSRE pump bowl durmg ir)Mum-233 operaunr. 25
Table 6.6 Opening COMBJUORS for sail samples taken from MSRE pwnp bowl durmg
uranium-233 operation 26
Table 6.7 Data lor salt samples from pump bowl during urannmi-235 operation . . 3 !
Table 6.8 Data for salt samples from MSRE pump bowl durUnj urannmv233 operation 32 36
Table 7.1 Dai i for graphite and metal specimens immersed m pump bowl 3X
Table 7.2 Deposition of fission products on ^ ^ h i i e and metal specHnens m 'loat-winduw
capsule immersed for various periods in MSRE pump bowl liquid sail 40
Table 7.3 Data for wire cods and cables exposed in MSRE pump bowl 44
Table 7.4 Data for miscellaneous capsules from MSRE pump bowl 45
Table 7.5 Data for sail samples for double-walled capsules immersed' «n sail in the MSRE pump bowl during uranium-233 operation 46
Table 7.6 Data for gas samples from doubte-wafted capsules exposed to gas in the MSRE pump bowl during uranium-233 operation 47
Table 8.1 Gas-borne percentage of MSRE production rate 51
Table 8.2 Gas samples " ' U operation 53
Table 8.3 Data for gas samples from MSRE pump bow! during uranium-233 operation 54 54
Table 9.1 Survettfcince specimen data: first array removed after run 7 66
TaMe 9.2 Survey 2, removed after run 11, inserted after run 7 67
Table 9.3 Third surveillance specimen survey, removed after run 14 68
Table 9.4 Fourth surveillance specimen survey, removed after run 18 69
Table 9.5 Relative disposition intensity of fission products on graphite surveillance specimens from final core specimen array 7!
Table 9.6 Relative deposition intensity of fission products on Hastelloy N surveillance specimens from final core specimen array 72
Table 9.7 Calculated specimen activity parameters after run 14 based on diffusion calculations and salt inventory 84
• X
Table **.H List ot nuBed cuts Irom paphi'e lor wtuch the lission pioduci omKni <**M be appf<>\im*iet> accounted tin b> the uranium present . . . H5
Tabie 0 % » Spectiogiafiluc anahsesol paphite specimens alter 32.000M%lu 86
Table *. 10 Percentage tsuiopic composition .it motybdraiMn on survedlanct specw.eus 9b
Table 0.1 Analysis ol dust irtjoi MSRt oii-^as r»mper fane «*>
Table I'-' 2 Reiatne .fiaatitirs tit dementi and isotopes tuund in of* g o jumper late . . . f ?
Table IO.J Material recovered Irom MSRb oil-gas fane aeiei run ifo iUO
Table IU4 Uaia tf sarapks •* segments Hum ofl-£as fane specimen holder rumored ioi'owww run lb . . . . 102
Table 10.5 Speiavrase\p.*edinMSRL>iit-2»hne.niJisl5 Jh 105
Table IO.t» Ana > sts ->l deposits irom Ime 523 105
Table IUT l)illu<>.>n cortiiitent of particles m 5 psig ol helium I Ob
Table !0.H Then.s«:phi.ieth. deposilhm parameters estimated tor off-gas! ne 10"
I able 10 v Gram? ol salt esimai^d to enier .'tl-*as sy xiem 10**
Table 10.10 kslFtuied penertagr * nobk-gzs nuclides v-utenng the of!-g» based on deposited daughter
actrv-rv and rat** !• theoretical value U' lull stripping I iO
Table 10 I i ksiBtaied traction >• nobtV-metai production ititenn,: mi-pa system 110
TaMe 11 I ("hem* J and speclrogiaphic analysis o! dep ic t s Irom m m shKUi in (he MSRt. pump bowl I i 7
f ahl~* 11.2 (>jmmaspe-';rographic(tie-diodelanalysis•>! deposit- irom mist shield in ihe MSKI: p i m p b ml 11»
Table 11.5 Chemical anal>»es ot miiirj samples 122
Table 11.4 Radiochemical analyses "'. graphite slimier samples 124
Table 11.5 |-:s>'.-.>n f>n»luct» in MSRt graphite core bai alter removal in cumulative values • »l raiH> lo inventory 125
Table I l.t> Hssion products or. surlacesot' llastetloy N aiier lerminatuHi ol operation expressed aslobserveddis rmn ' c m ~ : M M S R K inventory -lolal MSRh surtacearea) 127
I arte 11.7 Ruthenium isotope activity ratios ot oil-gas hue deposits 150
Taote I I..H Ruthenium isotope act. ity rjtio> ol surveillance specimens 151
Table 12. • Stable fluoride fission product activity as a traction ol calculated inventory
in sal*, samples from Zfi{ operation i55
TaNe 12.2 Relative deposition intensities lor noble meials 157
Table 12.5 Indicated distribution o! fission products in molten-salt reactors 15"

' • ' - ^ ^ ^ R a ^ ^ s ^ * - T
BLANK PAGE
r r y ^i&0miift^'M^"'*mmmmmm™''mm
1
FISSION PRODUCT BbH/% VIOR IN THE MOLTEN SALT REACTOR EXPERIMENT
I-. L. Compere E. G. Bohlmann S. S. Kirslis F. F. Bbnkenship
W. R. Grimes
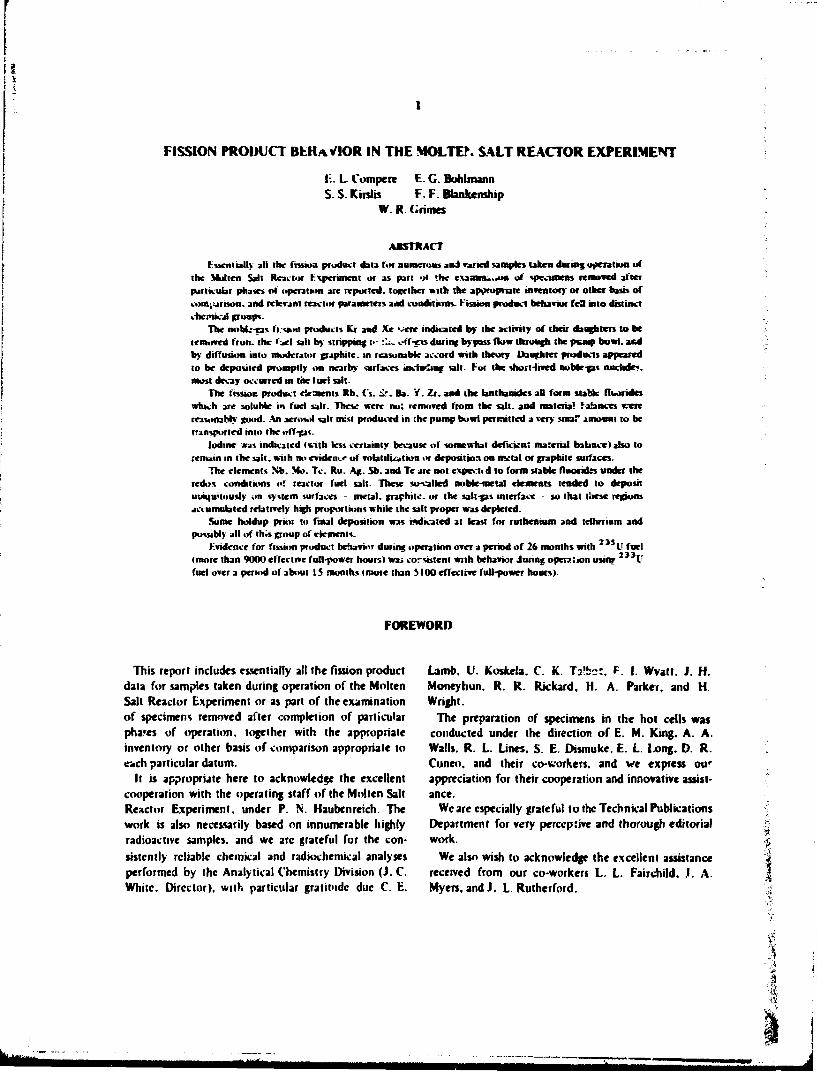
ABSTRACT kssentially all the fission product i b u for numnoib and varied samples Uken during operation of
the Mullen Sail Reactor rixperiment or as part of the exafmn...oe of specimens removed after particular phase* of operation are repotted, together with the appropriate inventory or other basis of ton^urnon. and relevant reactor parameter* add condition*. Fission product behavior fen into distinct chemical groups-
The nobL-ta* fi t*Hi products Kr and Xe vere indicated by the activity of their daughter* to be temoved fron. the t'uel salt by stripping !•- :::. vff-cts during bypass flow through the p e n s bowl, acd by diffusion into moderator graphite, in reasonable accord with theory. ttauehter products appeared to be deposited promptly on nearby oirfaccs including salt. For the short-lived noble-gas nuclide!, most decay occurred in the tucl salt.
The fission product elements Rb. fs . i r . Ba. Y. Zx. and the lanthamde* all form stabk fluoride* which are soluble in fuel salt. These were no: removed from the a l t . and materia! ratances vcre reasonably good. An aerosol salt mist produced in :he pump bowl permitted a very smaT amount to be transported into the off-gav
Iodine was indicated (with less certainty because of somewhat deficitn; nu:erial balance) abu to remain in the salt, wiih no evident of voialilu«tion or deposition on nvtal or graphite surfaces.
The elements Nb. Mo. Tc. Ru. Ajt. Sb. and Te arc not export! d to form stable fluorides under the redox conditions of reactor fuel salt. These so-called noble-metal dements tended to deposit uuiqu'tously on system surfaces - metal, graphite, or the salt-gas interface - so that tUesc regions accumulated relatively high proportions while the salt proper was depleted.
Some holdup prior to final deposition was indicated at least for ruthenium and tellurium and possibly all of this group of elements.
F.vidence tor fission product behavior during operation over a period of 26 months with I 3 J U fuel (more than 9000 effective full-power hours) was corsistcnl with behavior during operation usinr z l ' fuel over a period of about I5 months (mote than 5100 effective full-power hours).
FOREWORD
This report includes essentially all the fission product data for samples taken during operation of the Molten Salt Reactor Experiment or as part of the examination of specimens removed after completion of particular phares of operation, together with the appropriate inventory or other basis of comparison appropriate to each particular datum.
It is appropriate here to acknowledge the excellent cooperation with the operating staff of the Molten Salt Reactor Experiment, under P. N. Haubcnreich. The work is also necessarily based on innumerable highly radioactive samples, and we arc grateful for the consistently reliable chemical and radiochemical analyses performed by the Analytical Chemistry Division (J. C. While. Director), with particular gratitude due C. E.
Lamb, V. Koskela. C. K. Ta'bct. F I. Wvatt. J. H. Moneyhun. R. R. Rickard, H. A. Parker, and H Wright.
The preparation of specimens in the hot cells was conducted under the direction of E. M. King. A. A. Walls. R. L. Lines, S. E. Dismuke. E. L. Ijong. D. R. Cuneo, and their co-workers, and we express our appreciation for their cooperation and innovative assistance.
We are especially grateful to the Technical Publications Department for very perceptive and thorough editorial work.
We also wish to acknowledge the excellent assistance received from our co-workers L. L. Fairchild. .1. A. Myers, and J. L.Rutherford.
2
I. iNTROWCTION
In nioiten-salt rescto.s (or any with circulating fuel), fission occurs as the fluid fuel is passed through a core repot: large enough to develop a critical nxiss. Tie kinetic ena^? i f the fission fragments is takei up by the fluid. MibsuntiaNy as heat, with the fissk* fragment atoms (except those in recoil range of >u faces) remaining in the fluid, unless they subsequently are subjec* to chemical or physical actioas that transport them from Uw fiuid fuel In any event, progression down the radioactive decay sequence characteristic of each fission inain ensues.
In moiten-salt reactors, this process accumulate* many fission products in the salt uniu a steady *.tate is reached as a result of burnout, decay, or processing. The first four periodic groups, including the rare earths, tk!'in this category.
Krypton and xenon isotopes are slightly soluble gases in the fluid fuel and may be readily stripped from the fbci .* such, though most oi the rare gases undergo decay to alkali element daughters while in the fuel and remain there.
A third c&'egory of elements, the so-called noble metals (including Mb, Mo, Tc, Ru. Rh, ?d. Ag, Sb, and Te) appear to be less stable in salt and can oepTsit out on various surfaces.
There are a number of consequences of fission product deposition. They provide fixed sources of decay lies: and radiation. The afterheat effect will require careful consideration in design, and the associated radiation will make maintenance of related equipment mors hazardous or difficult. Localization (on graphite) in the core could increase the neutron poison effect. There are indications that some fission products
ie.g., tellurium) deposited on metals are associated with deleterious grain-boundary effects.
Thus, an understanding of fission product behavior is requisite for the development of molten-salt breeder reactors, and the information obtainable from the Molten Salt Reactor Experiment is a major wurce.
The Motten Salt Reactor Experiment in its operating period of nearly ibur years provided essentially four sources of data on fi«f ton products:
1. Samples - capsules of liquid or gas taken from the pump bowl periodically: also % irfaces exposed there.
2. Surveillance specimens - assemblies of materials exposed in the core. Five such assemblies were removed aftr. exposure to fuel fissioning over a period of tip-..
3. Specimens of material recovered from various system segments, particularly after the final shutdown.
4. Surveys of gamma radiation using remote collimaled instrumentation, during and after shutdown. As this is the subject of a separate report, we will not deal w:th this directly.
Because ».<" the continuing generation by fission and decay through 'ime. the fission product population is constantly changing. We will normally refer nil mrisure-mentt back to the 'inv at whkli the sample was removed during fuel circulation. In the case of specimen; removed after the fuel w » drained, the activities will normally refer to .b* time of shutdown of the reactor. Calculated inventories will refer in each case also to the appropriate lime.
3
2. THE MOLTEN SALT REACTOR EXPERIMENT
W<. will briefly describe here some of the characteristic of the Molten Salt Reactor Experiment that might be related to fission product behavior.
The fuel circuit of the MSRE 1"* is indvated in Figs. 2.1 and 2.2. It consisted essentially of a reactor vessel, a circulating pump, and the shell side of the primary heat exchanger, connected by appropriate piping. aD con-structed of Hastelloy N . s '* HastcUoy N is a nickel-based auoy containing about 17% molybdenum. 7% chromium, and •>*» iron, developed for superior resistance to corrosion by molten fluorides.
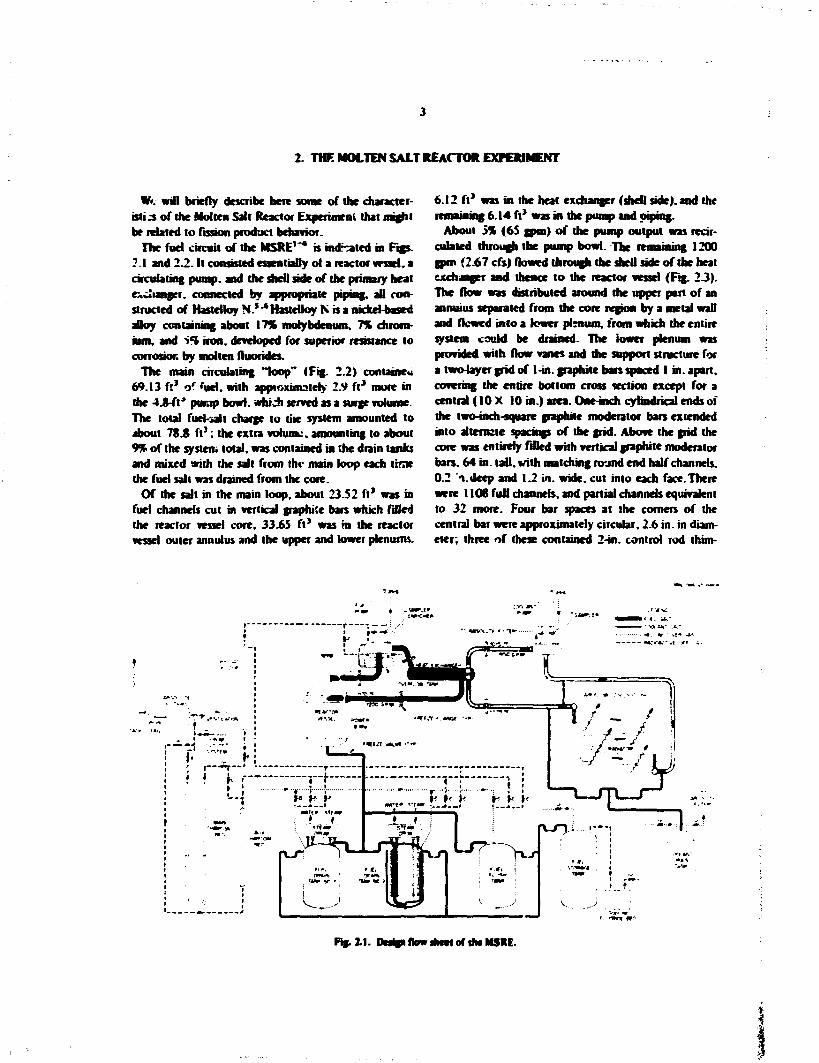
The main circulating "loop" (Fig. 2.2) container 69.13 f t ' of fuel, with approximately 2.V f t 3 more in the 4 J-ft* pump bowl, which served as a surge volume. The total fuel-sail charge to the system amounted to about 78.8 f t * ; the extra volume, amounting to about 9% of the system total, was contained in the drain tanks and mixed with the salt from thr main loop each time the fuel salt was drained from the core.
Of the salt in the main loop, about 23.S2 f t 1 was in fuel channels cut in vertical graphite bars which filled the reactor vessel core, 33.65 f t 1 was m the reactor vessel outer annulus and the upper and lower plenums.
6.12 f t 3 was in the heat exchanger (shell side), and the remaining 6.14 ft* was in die pump and piping.
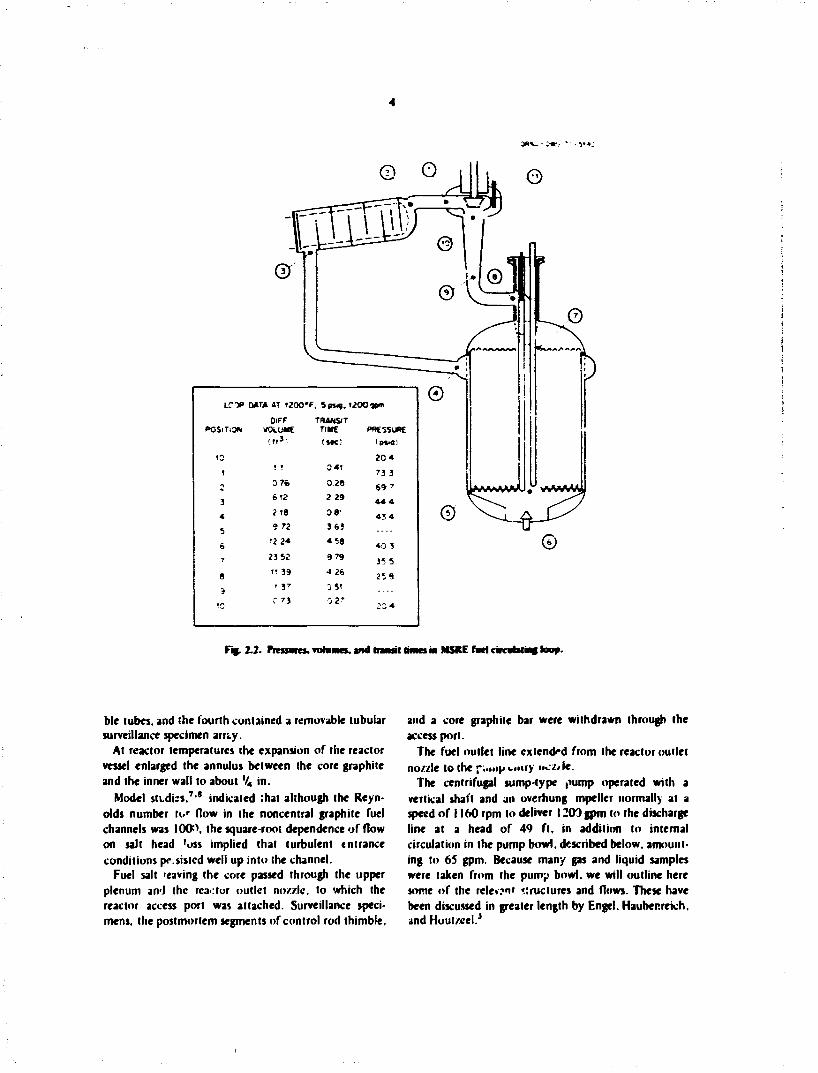
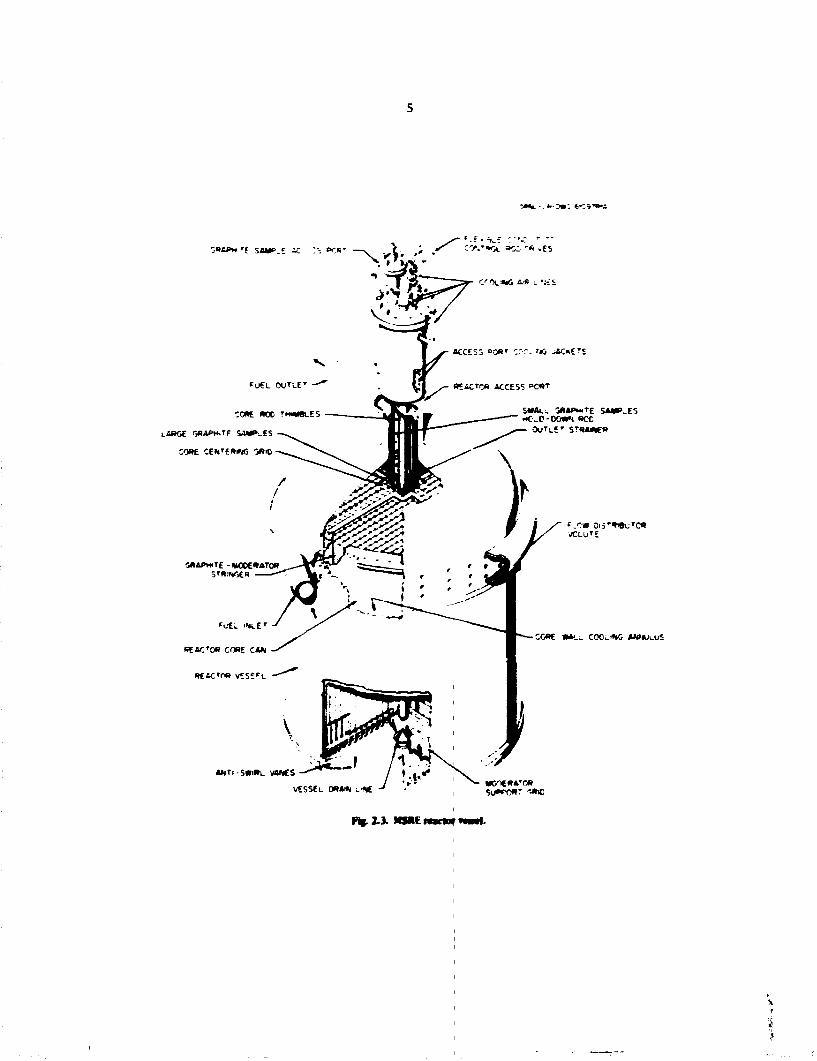
About 5% (65 gpm) of the pump output was recirculated through the pump bowl. The remaining 1200 gpm ( 2 4 7 cfs) flowed through the shell side of the heat exchanger and thence to the reactor vessel (Fig. 2 3 ) . The flow was distributed aroumi the upper part of an annuius separated from the core region by a metal wall and flowed into a lower plsnum. from which the entire system could be drained. The lower plenum was provided with flow vanes and the support structure for a two4ayer grid of 1-in. graphite bars spaced I in. apart, covering the entire bottom cross section except for a central (10 X 10 in.) area. One-inch cylindrical ends of the two-inch-square graphite moderator bars extended into alternate sparing* of the grid. Above the grid the core was entirely filled with vertical graphite moderator bars. 64 in. tall, with matching round end half channels. 0.2 n.deep and 1.2 in. wide, cut into each face.There were 110s full channels, and partial channels equivalent to 32 more. Four bar spaces at the comers of the central bar were approximately circular. 2.6 in. in diameter; three of these contained 2-in. control rod thim-
(«*• v • iMV . ; I , •
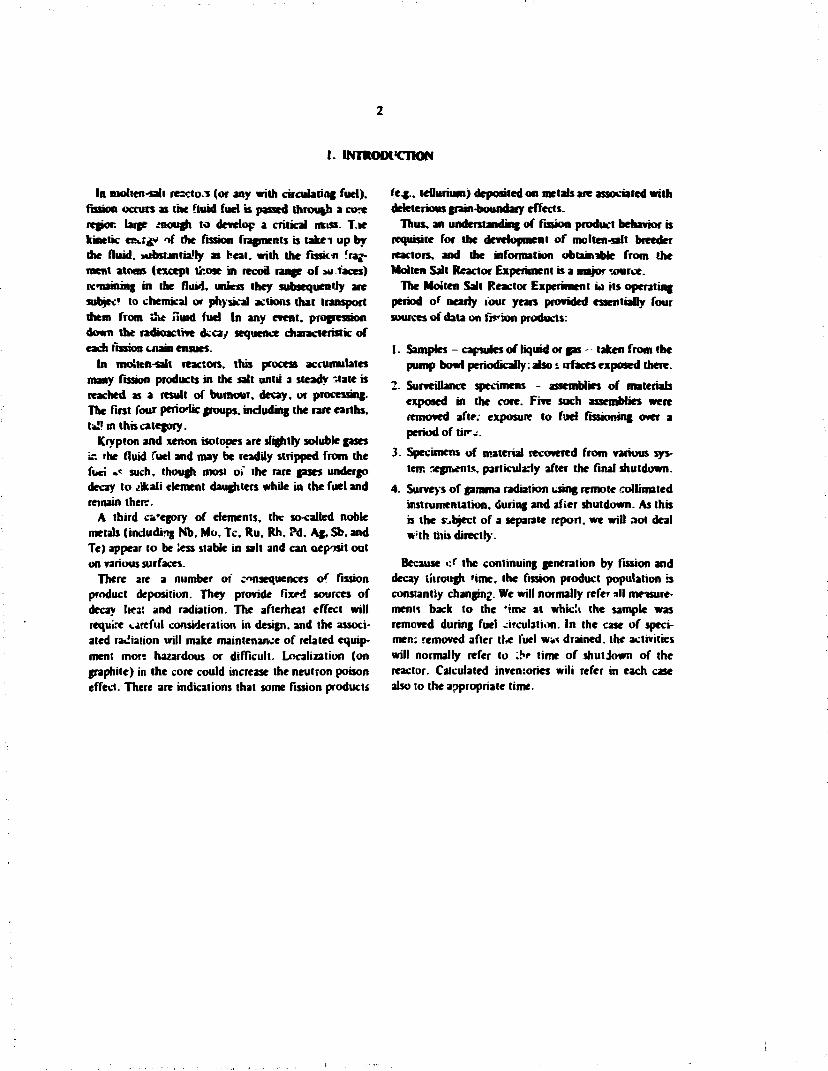
Rf.2.1. M g * flow sheet of the MSRE.
> » * - • j * - - * : 5 - - » :
LCTP OAT* AT »20O*F, 5 p * n . 1200 •jpm
DlFF TRANSIT POSITION VOLUME T l « PRESSURE
,„*•: f»«: 'pvo; t n 20 4
! t t 0 4 ! 73 3
i 0 76 0 28 6 9 7
3 6 t 2 2 29 4 4 4
4 ; T 3 0 0- 43 4
5 9 72 3 63
6 '2 24 4 58 40 3 7 23 52 9 7 9 35 5
8 IT 39 4 26 25 9 9 ' 3 7
j * t
10 r 73 0 27 20 4
Fif. 2.2. fiitsmti. TOIBIWW. and mmii times in MSRE fad cirobf mg loop.
Me tubes, and the fourth contained a removable tubular surveillance specimen arrty.
At reactor temperatures the expansion of the reactor vessel enlarged the annulus between the core graphite and the inner wall to about V4 in.
Model studies.7 •* indicated :hat although the Reynolds number io r flow in the noncentral graphite fuel channels was 100:1, the square-root dependence of flow on salt head 'oss implied that turbulent entrance conditions pr sisicd well up into (he channel.
Fuel salt >eaving the core passed through the upper plenum arvJ the realtor outlet no/xlc. to which the reactor access port was attached. Surveillance specimens, the postmortem segments of control rod thimble.
and a core graphite bar were withdrawn through the access port.
The fuel outlet line extended from the reactor outlet nozzle to the r\.mi/ <•"•'> ••^z<le.
The centrifugal sump-type pump operated with a vertical shaft and an overhung mpeller normally at a speed of 1160 rpm to deliver 1200 gpm to the discharge line at a head of 49 ft. in addition to internal circulation in the pump bowl, described below, amounting to 65 gpm. Because many gas and liquid samples were taken from the pump bowl, we will outline here some of the relevant «:ructures and flows. These have been discussed in greater length by Engel. Hauber.reich, and Houlzccl.5
T«ta. - < . - : » : fC*7»»i
t-BAPM *E SAMC. E AC ! S **".B C O V ' * X SCO 'ft .ES
CO(.*iG A * L. ':£S
ACCE33 =C*T e f f o r t jAC«£TJ
*uEL O U T L E T
CORE HOC
LARGE WAPH.TE SAMPLES
CORE CENT£R*iG I R *
S M A L . G R A P W T E SAMP.ES rtC_0-OG*M RCC
O U T L £ T STRAWER
\«LUTE
CORE • * • - . COOL'«iG M M J L U S
VESSEL ORAifc L « KCOtRA'OR SuPPCR" '-RiO
Fl(. 2. J. MSRE mctov *WMI.

6
Some of the major functions of the pump and
:. fuel circulation pump.
2. liquid expansion or surge tank.
3. point for removal and return of system overflow.
4. system pressuraer.
5. fission gas stripper.
6. gas addition point (heamn, argon, o i vapor).
7. hcMup and outlet for off-gas and purge gas.
8. furl enrkher and chemical addition point.
9. sa»t sample point.
10. gas sample point.
11. point for contacting specimen surfaces with liquid or gas during operation.
12. point for postmortem excision of some system surfaces.
The major flow patterns are shewn in Fig. 2-4. Usually the pump bowl, which had a fluid capacity of
4.8 l'tJ. was operated about 60% full. Although the overflow pipe inlet was wefl above the liquid level and
was protected from spray, overflow rates of several pounds per hour (0.1 to 10) resulted m the accumulation, in a toroidal overflow tank below the pump, of overflow salt, which was blown back to the pump bowl at the necessary mtervab (hours to weeks). The overflow tank was connected to the main off-fas hue. but because the pump bowl overflow hue extended to the bottom of the overflow tank, little or no off-fas took this path except when the normal off-fas exit from the pump bowl had been appreciably restricted.
It was desirable* to remove as much of the xenon and krypton fission gases as possible, particularly to mitigate the high neutron poison effect of ,iSXt. Consequently, about 50 gpm of pump discharge liquid was passed into a segmented toroidal spray ring near the top of the pump bowl. Many V l t and %-in. perforations sent strong jets angled downward spurting into the liquid a few inches away, releasing bubbles, entraining much pump bowl gas - the larger bubbles of which returned rapidly to the surface - and vigorously mixing the adjacent pump bowl gas and liquid. An additional "fountain" flow of about IS gpm came up between the volute casing seal and the impeller shaft. Other minor leakages from the volute to the pump bowl abo existed. At a net flow of 65 gpm (8.7
OftMl-OVC • • - t 0 1 7 2 «
REFERENCE LINE
CAPSUlf c»«
SUCTION
Fig. 2.4. Flow | mm* in ww MSRE fori wumv.
, s*u » R*OIO«CTIVC G»S » C L € * N CAS
7
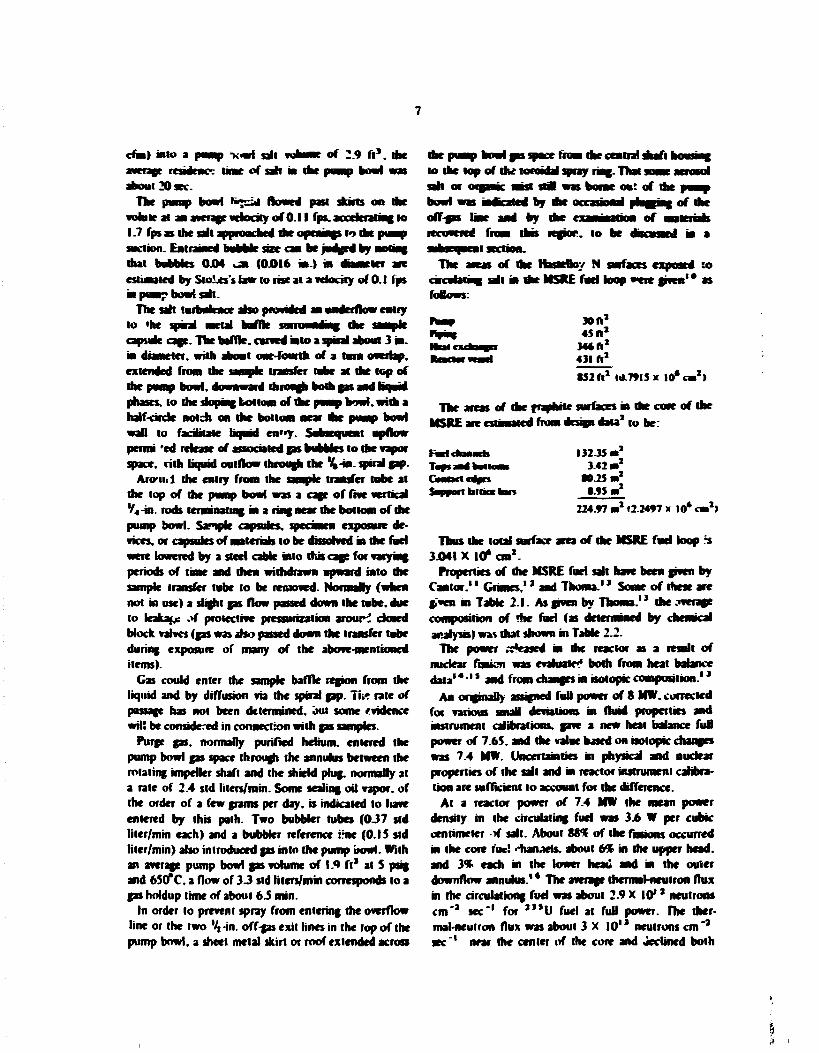
dm) into a pump * • • * sail volume of 2.9 f t ' , the avenge resident: time of sail in the pump bawl was about 20 sec.
The pump bowl >«>uia flowed paM skins on die while at anawennewjlociiyofO.il fps. accckrarmg to 1.7 fps as the sail approached rJK openings to dK pwnp snetion. Entrained bnbbte size can be judged by noting dial bubbles OXH u * (0D16 in) in diameter are estimated by Stt&es's law to rise at a velocity of 0.1 fps in pump bowl salt.
The salt tnrbnkncc abo provided an undeiflun entry to »he spiral metal baffle jiiiummng. the sample capsule cage. The baffk. earned into a spiral about 3 in. m diameter, with about oat-founts of a tarn overlap, extended from die sample transfer tube at die top of the pump bowl, downward through bom gas and KojanJ phases, to the sloping bottom of die pump bowl, wim a half-circle notch on the bottom near die pump boat wall to faciriate liquid en»«y. Subsequent apflow permi 'cd release of associated gas bubbles to the vapor space, nth liquid outflow through the %-m. spiral gap.
Aram J die entry from the sample transfer tube at the top of the pump bowi was a cage of liar vertical '/j-tn. rods lemanatiag in a ring near die bottom of die pump bowl. Sarnie capsules, specimen exposure devices, or capsules of materials to be disserved in die fad were lowered by a steel cable into this cage for varying periods of time and dam withdrawn upward into die sample transfer tube to be removed. Normally (when not in use) a slight gas flow passed down the tube, due to leakage ->f protective pressurizaiion arouri dosed block valves (gas was abo passed down the transfer tube during exposure of many of the above-mentioned items).
Gas could enter the sample baffle region from die liquid and by diffusion via the spiral gap. 7k? rale of passage has not been determined, out some evidence wil! be considered in connection with gas samples.
Purge gas. normally purified hchum. entered the pump bowl gas space through the annum* between the rotating impeller shaft and the shield plug, normally at a rate of 2.4 sld liters/mm. Some sealing oil vapor, of the order of a few grams per day. is indicated to love entered by this path. Two bubbler tubes (0J7 sld liter/mm each) and a bubbler reference i-ne (O.IS sld liter/min) also introduced gas into the pump bowl. With an average pump bowl gas volume of 1.9 ft* at S psig and 650*C. a flow of 3 J std litcrs/min corresponds to a gas holdup time of about 6.5 min.
In order to prevent spray from entering the overflow line or the two %-in. off-gas exit lines in the lop of the pump bowl, a sheet metal skirt or roof extended across
the pump bowl gas space from rhe centra! shaft houaag to the top of the toroidal spray ring. That sown- aerosol sat* or organic anal sua was borne out of rhe pump
off-gas line and by rhe eimaairiiia of materials recovered from this regior. to be discussed m a subsequent section.
The areas of die HasarBoy N surfaces exposed to cacabting salt in rhe HSRE fad loop were given1* as follows:
run*. JOft1
Haws 4$ ft7
HertorHiijii 346ft1
I O C W K W I 431 ft1
ran1 t*79isx IO'CM 1)
The areas of dm fnahite surfaces in dK core of die MSRE are estimated from design data* io be:
FacldMMKfc 132.35 « 2
To** ami boiUMB 3.42 m 1
CMNKI enact »-2J m2
S f »u« bilk* ban t.»S m* 224.*7 nt1 «2.24*7 x 10* «m2>
Thus die total surface area of die MSRE fad loop ~rs 3.041 X 10* cm 1.
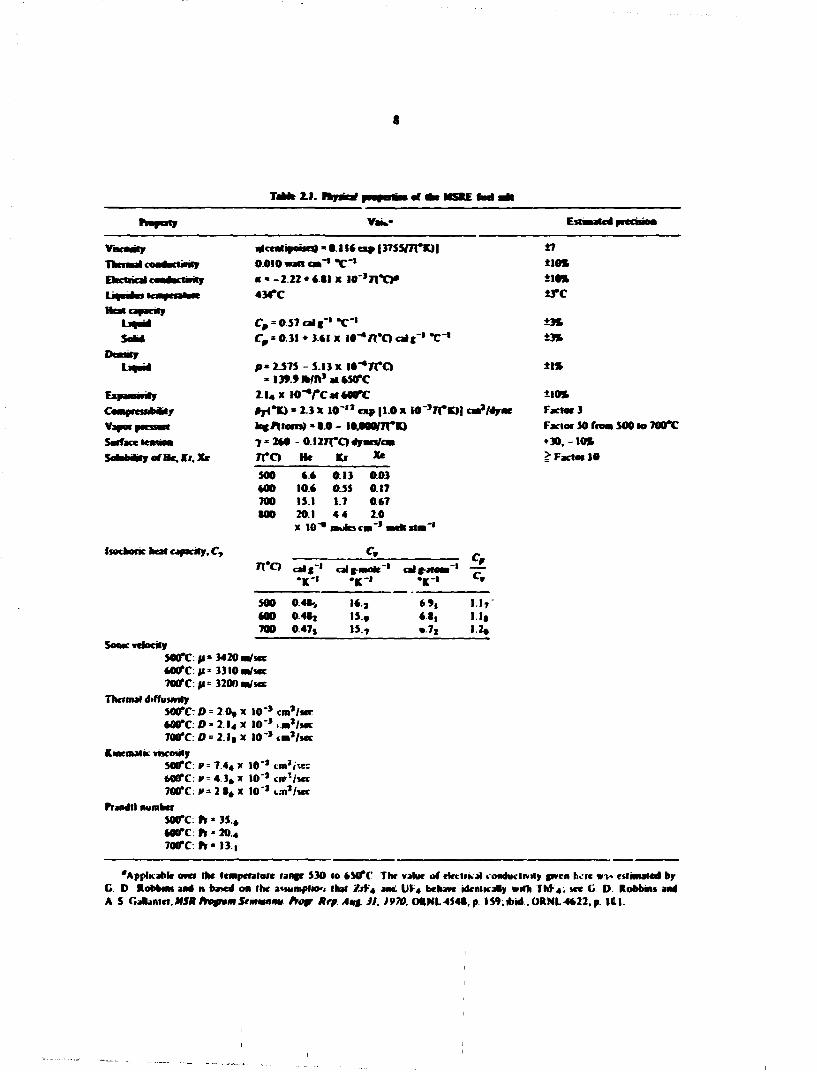
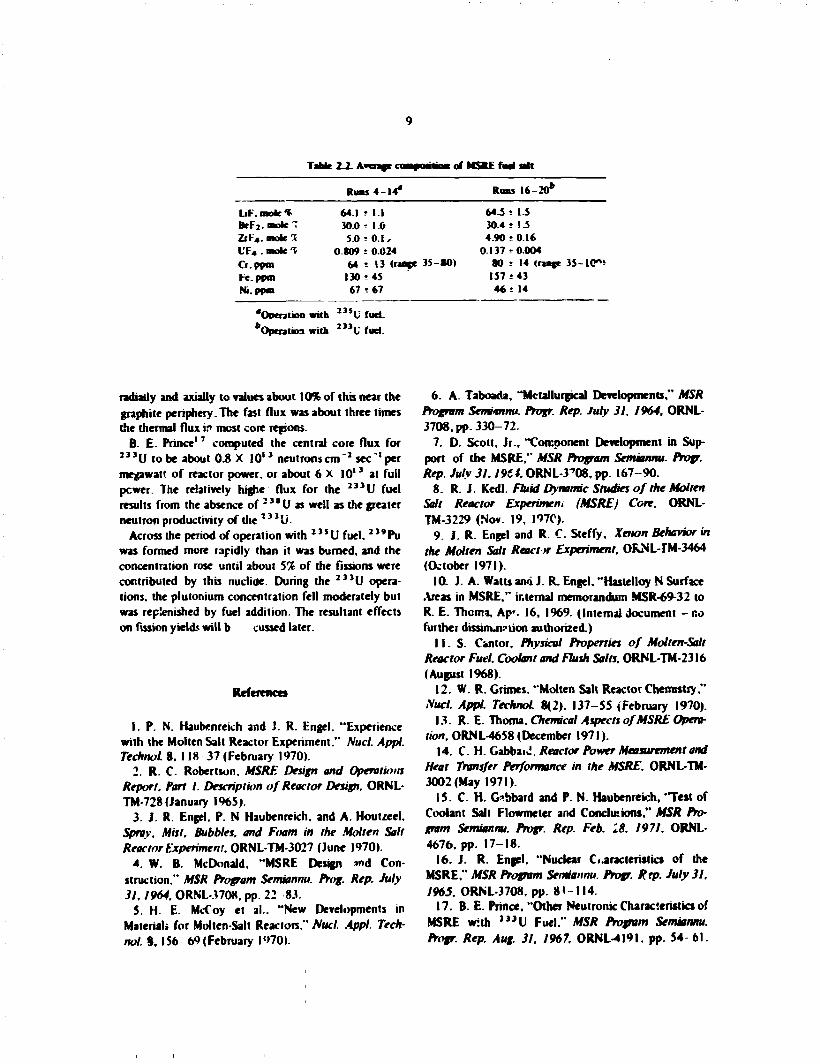
Properties of rhe MSRE fad salt have been given by Cantor.1' Crimes.' * and Thoma.1' Some of these are given m Table 2.1. As given by Thorna." the average composition of the fud (as determined by chemical analysis) w » dut shown in Table 2.2.
The power .-c*eased in die reactor as a result of nuclear fission was evaluate*' both from heat balance data 1 4 •' * and from changes m isotonic composition.'J
An originally assigned full power of 8 MW. corrected for various small deviation* m (had properties and instrument calibrations, gave a new heat balance full power of 7.65. and die value based on isotonic changes was 7.4 MW. Uncertainties m physical and nuclear properties of the salt and in reactor instrument calibration arc sufficient to account for rhe difference.
At a reactor power of 7.4 MW the mean power density hi the circulating fud was 3.6 W per cubic centimeter *f sail. About Wk of the fissions occurred in the core lue! dun.iels. about 6% in the upper head, and 3% each in the tower heaU and m die outer downflow annuhn.' * The average thermal-neutron flux hi rhe circulating fud was about 2.9 X 10* a neutrons cm' 1 sec'1 for a " U fuel at full power. Die Oier-mal-neuiron flux was about 3 X 10'* neutrons cm" 1
sec'' near rhe ccnier of the core and declined both
8
Z l .
¥»*.«
Vnroaty Thammt comtrnttmitf Electrical coajsoctarity
Heal capacity LjqMi SoW
Donaty Lifae*
CwptciriHii/ Vapor pmswt Saffacc tenooa
tfecntipoian, * 0.1 I t cxp> | 37SS/7TW| 0010wanca»-> *C- ' • « -2.22 • «.*! X 10**JVO* 434*C
C , = 0 5 7 o J f - ' T ~ ' Cp = 0.31 • 3*1 x l O - 4 / ? ^ c a l f " 1 X T 1
p« 2^75 - 5.13 x IO-*/rO '139.9 Ik/ft* ai«5CrC
2 l 4 x ur*/*Cat«*0*C *|4*K) * 2.3 X 10"'* exp |1 0 x UT'irKJI at?l*rmt log/lions) « 9.0 - 10,000/71**) 7= 2*0 0 t27r04y>eVcaB TTO He Ki X«
47 ±10% 110% ±rc ± » ± »
± 1 *
±10% Facte* 3 Factor 50 from 500 to 700*C • 30, -10% > Faciei 10
500 • • M0 106 700 15.1 BOO 20.1
X 10"
OI3 0.55 1.7 44
Itochonc heat capacity, C, TX'Ci
0.03 OI7 0*7 2.0
:m~* me* ataj''
calf-' calg-raok~ calg-2toa>~' 7 T
500 M 0 700
0.4t* 0 4 * , 047 ,
16., I S , I S *
• 9, * « i . 7 ,
I I . 12 ,
Some velocity 500*C:|l*3420*Vscc M 0 * C : | I O 3 I 0 M / « C C 700*0: f i° 3200 m/icc
Thermal drfluMnly 50O*C:/M2O,X 10 *» M O * C : 0 * 2 I 4 X 10"» 70SrC:/>=MiX 10"' <
em'/sct-
nn*/jec Kmemalic vncoiity
SO0*C: F = 7.4« X 10"* CK' I 'SK WOTC: ? = 4 3, x 10"' cir^/iec 700*C: f = 2 S , X 10'» cm'/icc
fljndll mimhcf S0O*C: ft * 3S.» wore n * 20« 70O*C:»»«l3.|
'Applicable over the temperature rang* 530 10 650*C The value of rleclrkal t onduclrvily given here ws-. estimated by G D Robbm* ami n bated on (he asMnnptiori thai MM and UF« behave idcnlKafly with Thf , ; tee G D Robbtns am) A S GalbMcl.MA fh>p»mSrmmnmi A o r **V> / * * * J/ . /»W. ORM.454S,p I59.4>id ORNL4622. p 1CI
9
Tabic 2-2. Avoafe < > of MSKE fad art
Runs 4 - 1 4 * Rons 16 -20*
UK. mole % 64.1 t I . I 64.5 • 1.5 BcF: .mok~ 30.<M 1 0 30.4 t !_5 Zrl-* . mote " 5.0? 0 . 1 , 4.90 • 0.16 L'F 4 . mok 1 0 809 ? 0.024 0.137 i 0.004 Cr.pptn 64 * 13 (ranee 35--SO) 80 r 14 (race 3 5 - l C > Fe. ppn 1 3 0 * 4 5 157 ± 43 Ni. ppm 67 t 6 7 46 t 14
'Operation with I 3 5 U fuel. "Operation with 2 , J U fuel.
radially and axially to values about 10% of this near the graphite periphery. The fast flux was about three times the thermal flux in most core regions.
B. E. Prince1 7 computed the central core flux for li3V to be about 0.8 X 1 0 ' 3 neutronscm"1 sec"'per megawatt of reactor power, or about 6 X I 0 ' J at full pewer. The relatively highe flux for the 2 , , U fuel results from the absence of ' 3 * U as well as the greater neutron productivity of the 7 J 3 U-
Across the period of operation with J , S U fuel. 2 3 ' P u was formed more rapidly than it was burned, and the concentration rose until about 5% of the fissions were contributed by this nuclide. During the 2 3 3 U operations, the pluionium concentration fell moderately but was replenished by fuel addition. The resultant effects on fission yields will b cussed later.
References
1. P. N. Haubenreich and J. R. Engel. "Experience with the Molten Salt Reactor Experiment." Nucl. Appi. Technoi 8. 118 37 (February 1970).
2. R. C Robertson. MSRE Design and Operations Report. Part 1. Description of Reactor Design. ORNL-TM-728 (January 1965).
3. J. R. Engel. P. N Haubenreich. and A. Houtzeel. Spray. Mist. Bubbles, and Foam in the Molten Salt Reactor Experiment, ORNL-TM-3027 (June 1970).
4. W. B. McDonald. "MSRE Design "id Construction," MSR Program Semiannu. Prog. Rep. July 31.1964. ORNL-3708, pp. 22 83.
5. H. E. McCoy et al.. "New Developments in Materiali for Molten-Salt Reactors." Mud. Appl. Techno!. 8,156 69 (February 1**70).
6. A. Taboada, "Metallurgical Developments," MSR Program Semimnu. Progr. Rep. July 31. 1964. ORNL-3708, pp. 330-72.
7. D. Scott, Jr., "Component Development in Support of the MSRE," MSR Program Semiannu. Progr. Rep. July 31.1964, ORNL-3TJ8, pp. 167-90.
8. R. J. Kedl. Fluid Dynamic Studies of the Molten Salt Reactor Experimen, (MSRE) Core. ORNL TM-3229 (Nov. 19, I97C).
9. J. R. Engel and R C. Steffy. Xenon Behavior in the Molten Salt React tr Experiment. ORNL-rM-3464 (October 1971).
10. J. A. Watts and J. R. Engel. "Hastelloy N Surface Areas in MSRE," internal memorandum MSR-69-32 to R. E. Them*, Ap*. 16, 1969. (Internal document - r.o further dissim.n?iion authorized.)
M . S . Cantor, Physical Properties of Molten-Salt Reactor Fuel. Coolant and Flush Salts. ORNL-TM-2316 (August 1968).
12. W. R. Grimes. "Molten Salt Reactor Chemistry," Nucl. Appl. Technoi 8(2). 137-55 (February 1970).
13. R. E. Thoma. Chemical Aspects of MSRE Operation. ORNL-4658 (December 1971).
14. C. H. Gabbai*!. Reactor Power Measurement and Heat Transfer Performance in the MSRE. ORNL-TM-3002 (May 1971).
15. C H. G'bbard and P. N. Haubenrekh, "Test of Coolant Salt Flowmeter and Conclusions," MSR Program Semiannu. Progr. Rep. Feb. 18. 1971. ORNL-4676, pp. 17-18.
16. J. R. Engel, "Nuclear Characteristics of the MSRE." MSR Program Semiannu. Progr. Ftp. July 31. 1965. ORNL-3708. pp. 8 » I I 4 .
17. B E . Prince, "Other Neutronic Characteristics of MSRE with " ' U Fuel." MSR Program Semiannu. Progr. Rep. Aug. 31. 1967. ORNL-4I9I. pp. 54-61.
10
3. MSRE CHRONOLOGY
A ske.chy chronology of the MSRE. with an eye toward factors affe. Ung fission product measurements, will be given below. More complete details are available.' -*
3.1 Operation with 2 J 5 U Fuel The MSRE was firs, loaded with flush salt on
November 28. 1°64. after draining the flush salt. 452 kg of carrier salt rLiF-BeFj-ZrF*. 62.4-32.3-5.3 mole T. mol. wt 40.2) was added to a drain tank followed by 235 kg oi 7 LiF- : , *UF 4 eutectic salt (72.3-27.7 mole rr. mol. wt 105.7) in late Apri'. Circulation of this salt was followed by addition of 7 LiF- I 3 5 UF 4 193'T enriched) eutectic salt beginn-ng on May 24. 1965. Oriticality was achieved on June 1. 1965. Addition of enriched capsules of 7 LiF- 2 3 $ UF 4 eutecti.- salt continued throughout zero-power experiments, which included controlled calibration. The !oop charge at the beginning of power operation consisted of a total of 4498 K« J salt Inominai •opposition by weight. 7Li. 1 l.f> ""-: Be. 0.35<*: Zr. 11.04^: and U. 4.628^). with 390k^ir. the drain tank(ref. 2.Table 2.15).
Operatior of the MSRE was commonly divided into runs, during which salt was circulating in the fuel loop: between runs the salt was returned to the drain tanks, mixing with ;he residual salt there.
Run 4. in which significant power wa; first achieved, began circulation in late December 1965. the approach to power has been taken arbitrarily as beginning at noon January 23. 1966. for pufpes-.'s of accounting for fission product prod'tcl'in and de.ay.
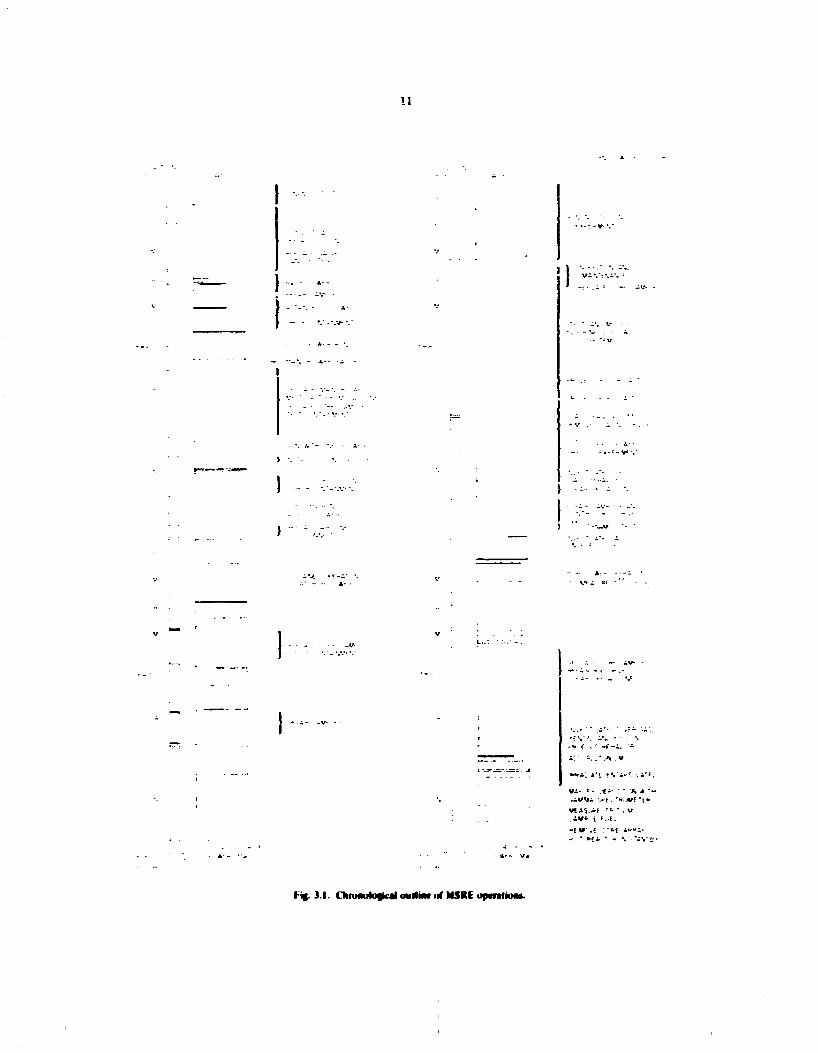
Significant events during the subsequent ->peration of the MSRE until the termii'iiion of opcaiion on December 12. 1969. are ;!iown in Fig. 3.1. The time per-od and accumulated power for the various runs are si.own in Table 3.1
S«H>n after significant power levels were reached, diff.culty in rcaintainiiig off-gas flow developed. Deposits <»f varnish-like material had plugged small passages and a small filter in the off-gas system. A small amount of oil in the off-gas holdup pipe and from the pump had evidently been vapori/ed and pol, merized by the heat and radiation from gas-borne fission products The problem was relieved by installation of a larger and more efficient filter downstream from the holdup pipe On resumption of operation in April 1966. full power was reached in run 6 after a brief shutdown to repair an electrical short m the fuel sampler-enricher drive. The first radiochemical analyses ol salt samples were reported for this run. Run 7 which was substantially at full power, was terminated in late July by failure of the
blades anc bub of the main blower tn the he.;' removal system. WIIK a replacement was redesigned, procured, and installed, the array of surveillance specimens waj removed, and examinations (reported later) were made. Some buckling ami cracking of the assembly had occurred4 because movement resulting from differential expnston had been inhibited by en:rapment and freezing of salt within tongue-and-groove joints. Modifications in the new assembly permitted its continued use. with removals after runs II. 14. and 18. when it was replaced by an assembly of another design.
Run 8 was halted to permit installation of a blower: run 9. to remove from the o»T-gas jumper flange above the purpp bowl some flush salt deposited by an overfill.
During run 9 an analysis for the oxidation state of the fuel resulted in a U3*7U4* value of 0.1**. Because values nearer IT were desired, additions of metallic l-ery Ilium as rod (or powder) were made2 using the samplt. enricher. interspersed with some sampl-s from iime to time to determine U3*' L'4*.
During run 10 lh' first "freeze-valve" gas sample was taken from the pump bowl. The scri< s of samples beyin at this time will be discussed in a later section Run 10 operated at full power for a month, with a scheduled termination to permit inspection of the new blower.
Run 11 lasted for IU1 u*ys. essentially at full power, and was terminated on schedule to permit routine examinations and return of the core surveillance specimen assembly. During this run a total of 761 go! i i i \ j was added las Lii-UF4 eutectic salt) withou: difficulty through the sampler-ennchcr. while th<: reac:or was in operation at full power. After completion of maintenance the reactor was operated at full power dur ng run 12 for 42 dayv During this period. 1527 g oi 2 3 5 1 ! was added using the sampler-enricher Beryllium additions were followed by samples showing If3* U 4 ' of 1.3 and l.OTr. Attempts to untangle th-: ampler drive cable -w?vered it. dropping the sample cjpsule attached to it. thus terminating run 12 Tit-cable latch was soon recovered: the capsule w-., subsequently found in the pump bowl during the final postmortem examination Run 14 commenced on Scpiembtr 20. after some coolant pump repair>. and continued Without fuel dram for 18* days the factor was operated subcrilical for several days in November to permit electrical repairs to the sampler-enncher Rca.'lor power and temperature were varied to determine the effect of operating conditions on ' ' ' X e stripping * During run 14 the first subsurface salt samples were taken using a freeze-valvc c ipsule
!1
rig. 3.1. Oroootoftcsl ovfltnt of MSRE opmtioM.
12
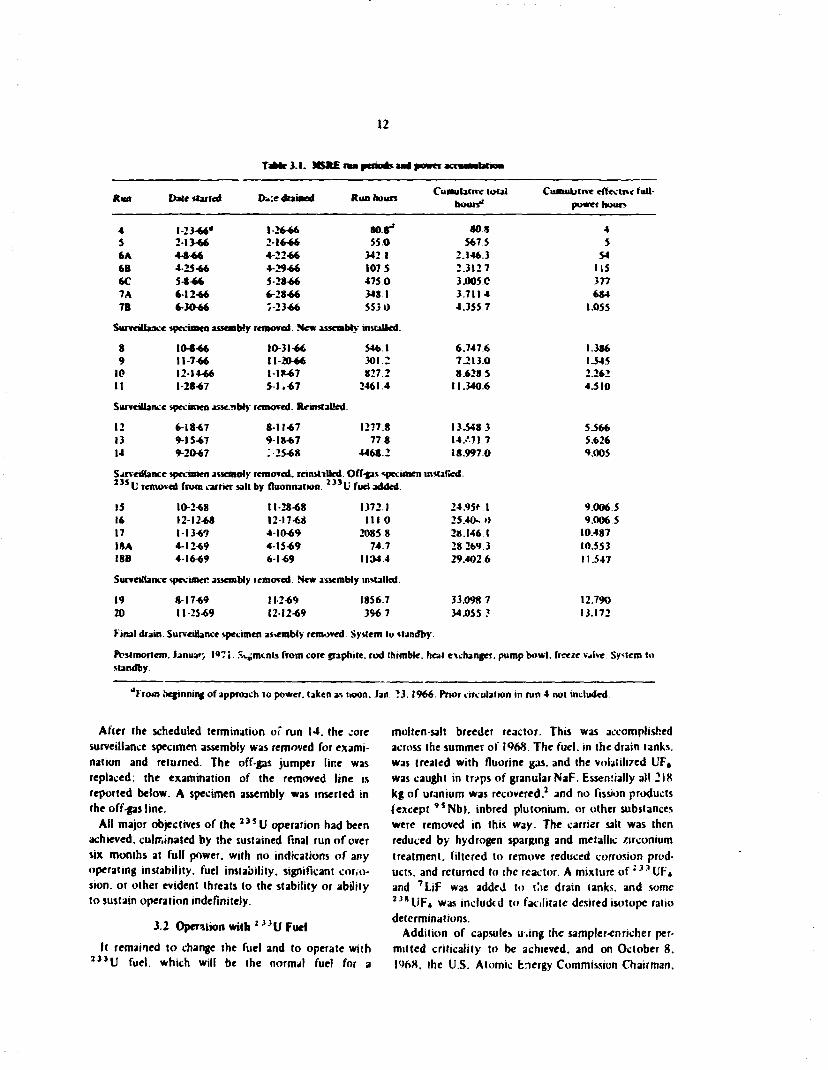
TaMe3-l- M5KE w periods aad power m i l i l i u w
Run Date Muted D.:e dtaioed Run hours Cumulative total hours'
Cumublive effective full-puwer hours
4 1-23-66* 1-26-66 80 8"1 80S 4 5 2-13-66 2-16-66 5 5 0 5675 5 6A 4-8-66 4-22-66 342 1 2.146.3 54 6B 4-25-66 4-29-66 107.5 2.3127 US 6C 5-8-66 5 28-66 475 0 3.005C 377 7 A 6-12-66 6-28-66 348 1 3.7114 684 7B 6-30-66 7-23-66 5530 4.3557 1.055
SurveiUaace specimen u x n W y removed. New assembly installed.
8 10-8-66 10-31-66 546.1 6.747.6 1.386 9 11-7-66 11-20-66 301.2 7.213 0 1.545
10 12-14-66 1-18-67 827.2 8.6285 2.262 11 1-28-67 5-1.-67 2461.4 11.3406 4.510
Surveillance specimen assembly removed. Reinstalled
12 6-18-67 8-11-67 1277 8 13.S48 3 5366 13 9-15-67 9-18-67 77.8 1 4 / 7 ] 7 5.626 14 9-20-67 I 25-68 4468.2 18.997.0 9.005
Surveillance specimen asicmoly removed. reinstiUed. Off-gas specimen installed. 5 U removed from carrier salt by fluonnalion. 1 Li fuel added
15 10-2-68 11-28-68 1372.1 24.95* 1 9.0065 16 12-12-68 12-17-68 [ 1 1 0 25.40, i) 9.0065 17 1-13-69 4-10-69 2085 8 28.146 1 10.487 ISA 4-12-69 4 -15*9 7 4 7 28 269.3 10.553 I8B 4-16*9 6-1-69 1104.4 29.4026 11347
Surveillance specimen assembly lemoved. New assembly installed.
19 8-17*9 11-2-69 1856.7 33.0987 12.790 20 11-25-69 12-12*9 396.7 34.055? 13.172
Final drain. Surveillance specimen assembly removed. System to standby.
Postmortem. January I**7 >. S^mcnls from core graphite, rod thimble, heat exchanger, pump bowl, freeze valve. System to standby.
From tiefinning of approach to power, taken as noon. Jan. 73.1966. Prior circulation in run 4 not included.
After the scheduled termination of ran 14. the core surveillance specimen assembly was removed for examination and returned. The off-gas jumper line was replaced: the examination of the removed line is reported below. A specimen assembly was inserted in the off-gas line.
All major objectives of the 2 3 $ U operation had been achieved, culminated by the sustained final run of over six months at full power, with no indications of any operating instability, fuel instability, significant cor.o-sion. or other evident threats to the stability or ability to sustain operation indefinitely.
3.2 Operation with l i}V Fuel It remained to change the fuel and to operate with
, 3 3 U fuel, which will be the normal fuel for a
molten-salt breeder reactor. This was accomplished across the summer of 1968. The fuel, in the drain tanks, was treated with fluorine gas. and the volatilized UF6
was caught in tr?ps of granular NaF. Essentially all 2IS kg of uranium was recovered.3 and no fission products (except , $ Nb) . inbred plutonium. or other substances were removed in this way. The carrier salt was then reduced by hydrogen sparging and metallic zirconium treatment, filtered to remove reduced corrosion products, and returned to the reactor. A mixture of : 3 : l I JF« and 7LiF was addej to the drain tanks, and some 2 3*UF4 was included to facilitate desired isotope ratio determinations.
Addition of capsules u.ing the sampler-en richer permitted criticality lo be achieved, and on October 8, l%8. the U.S. Atomic bnergy Commission Chairman,
13
vilenn Seaborg. a discoverer of 2 3 3 U . first took the reactor to significant power using : , 1 U fuel.
The uranium concentration with 2 1 3 U fuel (83*? enriched) WJS about 0.3 .nole %. The fuel also contained about 540 g of : " P u . which had been formed during the : 3 * l f operation when the fuel contained appreciable : 3 * U .
During the f.nal months of 1468. zero-power physics experiments were accompanied by an increase in the entrained gas in the fuel. Beryllium was added to halt a rise in the chromium .-ontent of the fuel. Some finely divided ircn was recovered from the pump bowl using sample capsules containing magnets. During a subsequent shutdown to combine all fuel-containing salt in the <lra:n tank for base-line isotopk analysis, a stricture in ihe off-gas line was removed, with seme of the rvaterial involved being recovered on a filter.
At the beginning of run 17 in January 1969. the power 'evel was regularly increased, with good nuclear stability being attained at full power, lransientsattrib-n'-j to behavior of entrained gas were studied by varying pump speed and other variables: argon was used as cover gas for a time. Freeie-valve gas samples and salt samples were taken, and a new double-wall-type sample capsule was employed. Further samples were taken for .sotopic analysis. The lower concentrations of uranium in the fuel led to unsuccessful efforts to determine the •j3*/U«* r a t j 0 However, beryllium additions were continued asCr2* concentration increases indicated.
In May 1969. restrictions in the off-gas lines appeared and subsequently also in the off-gas line from the overflow tank. Operation continued, and run 18 was terminated as scheduled on June I.
Surveillance specimens were removed, and an assembly of different design was installed. This assembly contained specially encapsulated uranium, as 'veil as material specimens. A preliminary survey of the distribution of fission products was conducted, using a collimated Ge(Li) diode gamma spectrometer.6 This was repeated more extensively after run 19.
After completing scheduled routine maintenance, the reactor was returned to power in August 1969 for run 19. Plutonium fluoride was added, using the sampler-enricher. as a first step in evaluating the possibility of using this material as a significant component of molten-salt reactor fuel.
At the end of run 19. i! reactor was drained without flushing to facilitate an eMen.ave gamma spectrometer survey of the location of fission products.
The fate of tritium in the system was of considerable interest, and a variety of experiments were conducted and samprs taken to account for the behavior of this product of reactor operation.7 •"
Because salt aerosol appeared to accompany the gas taken into gas sample capsules, a few double-walled sample capsules equipped with sintered metal filters over the entrance nozzles were used in run 20
After final draining of the reactor on Decer^er 12. 1969. the surveillance specimen assembly was removed for exsminatioti. and the reactor was put in standby.
!:i January 1971 the reactor ceil was opened, and srvera! segments of reactor components were excised lor examination. These included the sampier-enridier from the pump bowl, segments of a control rod thimble and a central graphite bar from the core, segments of heat exchanger tubes and shell, and a drain line freeze valve in which a small stress crack appeared du*ing final drain operations. The openings in the reacto. were sealed, and the reactor crypt was closed.
Kcfcffiiccs
I. P. N. Haubenreich and J. R. Engel. "Experience with the Molten Salt Reactor Experiment." SucL Appi Technol 8(2). 18 36( 1969).
2 R E. Thoma. Chemical Aspects of MSRt Operation. ORNL-4658 (December 1971).
3. MSR Program S,mmmai. Progr. Rep. la] July 31. 1964. ORNL-3708:(ft)f>ft. 28. 1965. ORNL-38l2:(c> Aug. 31. 1965. ORNL-3872: id) Feb. 28. 1966. ORNL-3936: (e\> Aug. 31. 1966. ORNL-4037: if) Feb. 28. 1967. 0RNL41\9.ig)Aug 31. 1967. ORNL-4I9I: [h) Feb 29. 1968. ORNM2S4: If) Aug 31. 1968. ORNL-4344: (J) Feb 28. 1969. GRWL-4396:1k) Aug 31. i969. ORNL-4449: (f)Feb 28. '.970. ORNH548: Km) Aug. 31. 1970. ORNL4622: In) Feb. 28. 1971. 0RNL4676:(oMwf. 31. 1971. CPNL4728.
4 W. H. Cook. "MSRE Materials Surveillance Test ing," MSR Prtrgram Semiannu. Progr. Rep. Aug 31. 1966. ORNL4037. pp. 97 103.
5. J. R. Engel and R. C Steffy. Xenon Behavior in the Molten Salt Reactor Experiment. ORNL-TM-3464 (October 1971).
6. A. Houtzeel and F. F. Dyer. A Study of Fission Products in the Molten Salt Reactor Experiment by Gamma Spectrometry. ORNL-TM-31SI (August 1972).
7. P. N. Haubenreich. (a) •Tr.iium in the MSRE: Calculated Production Rates and Observed Amounts." ORNL-CF-70-2-7 (Feb. 4. 1970): (ft) "A Review of Production and Observed Distributions of Tritium in MSRE in the Light of Recent Findings." ORNL-CF 71-8-34 (Aug. 23. 1971) (Internal documents no further dissemination authorized).
8. R. B. Briggs. "Tritium in Molten Salt Reactors." Reactor Technol. 14(4). 335 42 (Winter 1971 72)

14
4. SOME CHEMISTRY FUNDAMENTALS
Discuisi-Mis of the chemistry of the den* nts of majo-significance in molten-salt reactor fuels hav* been mad.* by Grimes.' Thoma.2 and Baes.J Some relevant highlights »ill be summarized here.
The original fuel of the Molten Salt Reactor Experiment consisted essentially of a mixture of 7 Li c -BeF»-ZrF 4 -UF 4 <65-*N 54J.**> mole %l The fuel was circulated at a » u t 650°C. contacting graphite bars in the reactor vessel and passing Then through a pump and heat exchanger. The equipment was constructed of Hastellny N. a Ni-MoCr-Fe alloy (71-'.7-7-5 wt 1). Small amounts et structural elements, particularly chromium, iron, and nickel, were found in the salt.
The concentration of fission product elements in the molten salt fuel b lower than that of constituent or structural elements. The following estimate will indicate the limits on the concentration of fission products evenly distiibuted ir the fuel.
For a single nuclide of fission yield y. at a given power P. the number of existing nuclide atoms in the salt is
4=FXPXVXT .
where F is the system fission rate at uni" power and r is the effective time of operation. This is th actual time of opeiation for a stable nuclide and equals l/X at steady state for a radioactive nuclide. The contribution to the mole fraction ol the fission product nuclide in 4.5 X 10* g of salt of molecular weight 40 is then
X = 6X 10*
4.5 X IP 6
40
As an example, for a single nuclide of ]r> yield and 30-day half-life at 8 M W . ^ = 9.4 X I 0 2 ' atoms and X = 1.3 X 10" T . Because the inventory of a fission product element in-olves only a few nuclide.',, many radioactive, the mole fractions are typically of the order of I X 10"* or less.
Traces of other substances may have entered the salt in the pump bowl, where salt was LMought into vigorous contact with 'he purified helium cover gas. Flow of this gjs to tt.e offga- system served c.» remove xenon and krypton fission gases from the system. A slight leakage or vaporization of oil into the pump bowl used as a lubricant and seal for the circulating pump introduced hydrocarbons and. by decomposition, carbon and hydrogen into the system. For the several times the reactor vessel was opened for retrieval of surveillance
assemblies and to. maintenance, the possible ingress of ceil air should be taken into account.
The bi.iary molten fluoride system LiF-BeFj < 66-34 mole "<) melts4 at about 459*C The soluti-'") chemistry of many substances in this solvent has been discussed by Baes.' Much of the redox and oxide precipitation chemistry can be summarized in terms of the free energy of formation of undissolved species.
Free energies of formation of various species calculated at 650*C largely from Baes's data are shown in Tabie 4.1. The elements of the table are listed in terms of the relative redox stability of the dissolved fluorides.
Tabic 4.1. F m c M w of Tot-nation at t t t ' C ( a C ^ t a O
Li*. Be*, uttf h" real unit activiiy; all other*, activitict in mot* fnvtion units
Solid PntoiraJm Lil*-2BeF,
Ga*
Li! 126.49 LaF, 363.3* 354.49 f « F j 364 67 356.19 NuK, 341X0 332.14 BcFj 216.16 BeO 123.00 109.37 Bel; 74.48 t 'F j 310.92 300.88 lrt-4 389 79 392.52 UO. 221.08 W . 449.89 Put-3 316 93 308.10 V j h i j O , 185.39 Zrf-4 392S2 ZrOj 219.42 Nbl-4 1 29635) Nbl-*-, 36649 / j N b 2 0 5 *Vy.t4
NbC 32.4 O F , l !50.7| 15206 V J O J C I 7.5 to 8.5 lcl-"i 138.18 134 59 Nil .2 121 58 113 40 MoFj 1 1863) MoOj 99 81 M o l * 306 65 Tclg 259.13 Tel* 5
•3226 Tc»4 200 59 TeF, 98 36 Tel 42.15 Tcj l - * 1 0
446.11 c:i« 18957 HI 50 29 66 12 HjO 47 04 F11F5 173 72
15
As one example of the use of the free energy data, we will -.oivulate the dissolved CrFz concentration suffi-c'-nt to halt the dissolution of chromium from Hastel-loy N if no region of lower chromium poteniui can be developed as a sink.
For the reaction
CrB(s) + 2UF4(d) = CrF^d) • 2UF,(d).
AG = 152.06 2) 392.52 . 300.88))
= 31.22 kcal. AG* 31.22
log K = = = 7.39 2.3RT/IOOO 4.233
logK = log CrFi log Cr° 2 log(U^/U3*)
If we assume I f / U * * ~ 100 and note that the chromium concentration in Hastelloy N is about 0.08 mole fraftrn (log Cr° = 1.10).
logCrFj = 7.39 + ( 1.10)
+ 2X2.0= 4.49 = log(3.2X 10"*) .
A mole fraction of 3.2 X I0" 5 corresponds to a weight concentration of 52 X 3.2 X IO"5/40 = 42 ppm Cr 2' in solution.
To obtain a higher concentration of dissolved Cr 2 \ the solution would have to be more oxidizing. Furthermore, the Hastelloy N surface during operation becomes depleted in chioinium. and a chromium sink of lower activity. Cr,C 2 (equivalent to a mole fraction of about 0.016 to 0.01). may be formed: all this would require a somewhat more oxidizing regime to hold even this much Cr 2' in solution.
The free cru-igy data can be used to estimate the quantises in solution only when the species shown are dominan'. Thus it is shown by Ting. Baes. and
Mamaniov5 that under conditions of moderate concentrations of dissolved oxide, pentavalent niobium exists largely as an oxyfluoride. which may be stable enough for this rather than NbF4 to be the significant dissolved species under MSRE conditions.
The stability of the various fluorides below chromium in the tabulation are such as to indicate that at the redox potential of the U^/ll 3* couole. only the elemental form will be present in appreciable quantity.
In particular, tellurium' vapor is muc!i more stabk than any of its fluoride vapors. Unless a more stable species than those listed hi the table exists in molten salt, these data indicate that tellurium would exist in the salt as a dissolved elemental gas or as a telluride ion. (No data are available on re2(g). etc.. but such combinations would not much affrr* ths view.)
References
1. W. R. Grimes. "Molten Salt Reactor Chemistry." NucLAppL*. 137 55(1970).
2. R. E. Thoma. Chemical Aspects ofMSRE Operations. ORNL-4658 (December 1971).
3. C. F. Paes. Jr.. "The Chemistry and Thermodynamics of Molten Salt Reactor Fuels." ,Vw/. Met. IS. 617 44 (I969XUSAEC CONF-690801).
4. K- A. Romberger. J. Braunstein. and R. F. Thoma. "New Electrochemical Measurements of the Liquklus in the LiF-BeF2 System Congruency of Lij BeF 4." / Phyi Chem. 76.1154 59 (1972).
5. G Ting. C. F. Baes. Jr.. and G. Mamantov. T h e Oxide Chemiitry of Niobium in Molten Uf-BeFj Mixtures." MSR Program Semknnu. Prttgr. Ref.. Feb. 29.1972. ORNL-4782. pp. 87 93.
6. Free energies for tellurium fluorides given in Table 4.1 were taken from P. A. G. O'Hare. 77ir Thermodynamic Properties of Some Chalcogen Fluorides. ANL-73l5(July 1968).

16
S. INVENTORY
Molten-salt reactors generate the full array of fission products in the circuiting fuel. The amount of any given nuclide is constantly changing as a result of concurrent decay and generation by fission. Also, certain fission product elemmts. particularly noble gases, noble metals, and other*, may not remain in the sau because of limited solubility.
FCH the development of information on fission product behavior from sample data, each nuclide of each sample must be (and here has boen) furnished with a suitable xnas of comparison calculated from an appropriate model, against which the observed values can be measured. The most useful basis is the total inventoiy. which is the number of atoms of a nuclide which are in existence at a given time as a result o( all prior fissioning and decay. It is frequently useful to consider the sUt as two pans, circulating fuel salt a d drain tank salt, which are mixed at stated times. It is then convenient to express an inventory value as activity per gram of circulating fuel salt, affording for salt samples a direct comparison with observed activity per gram of sample.
For deposits on surfaces, it is useful to calculate fur comparison the tout inventory activity divided by th' total surface area in the primary system.
Some of the comparisons for gas samples will b? based on accumulated inventory values, and others on production rate per unit of purge gas flow. These models will be developed in a later section-
In the calculation of inventory from power history, we oave in most cases found it adequate to consider the isotope in question as being a «iirect product of fission, or at most having only one significant precursor. For the nuclides of interest, it has generally not appeared necessary to account for production by neutron absorption by lighter nuclides. These assumptions permit us to calculate the amount of nuclide produced during an •utervai of steady relative power and bring it forward to a given point in real time, with unit power fission rate and yield as factorable items.
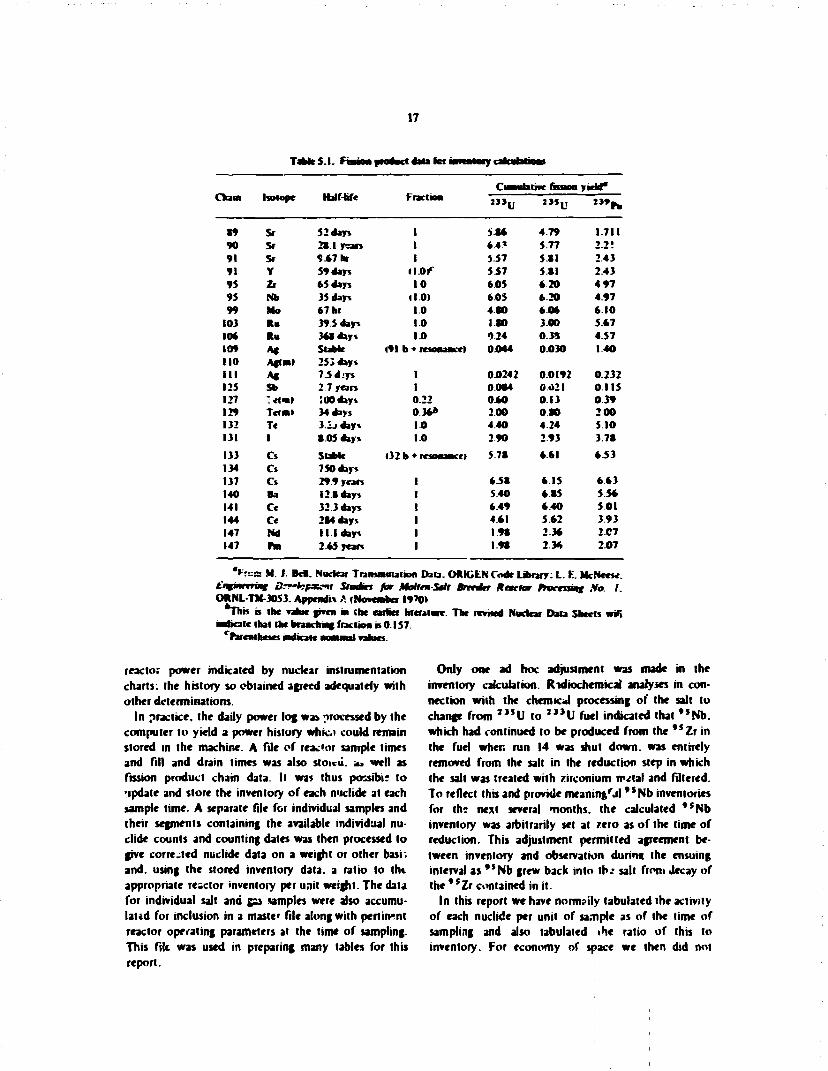
In Table S.I wr show yield and decay data used in inventory calculations In the case of l , o m A g and , J *Cs. neutron absorption with the stable element of the lighter chain produced the nuclide, and special calculations are required.
Th? branching fraction of l l 9 S b to l 2 " " T c is a (actor in the net effective fission yield of' I , m T c . The Nuclear Data Sheets z*? to be revised1 lo indicate lhal this branching fraction is 0.157 (instead of the prior literature vaiuc of 0.3d). All our inventory values ind
calculations resulting from them have been proportionately altered to reflect this revision.
The inventories for 1 3 5 U operation were calculated by program FISK.1 using a fourth-order Runge-Kutta numerical integration method.
Differential equations describing the formation and decay of each isotope were written, and lime steps were defined which evenly divided each period into segments adequately shorter than the half-lives or other time constants of the equation. The program FISK was written in FORTRAN 3 and executed on a large-scale digital computer at ORNL. Good agreement was obtained with results from parallel integral calculations
Tl e FISK calculation did not take into account iu-ingrowlh of 2 , ' P u during the operation with l i : V fuel. The effect is slight .xcept for' °* Ru. Tic obtained values taking this into account in separate calculations using the integral methor'..
For the many samples taken during operation with 1 3 3 U fuel, a one- or two-element integral equation calculation3 was made over periods of steady power, generally not exceeding a day. Because the plutonium level was relatively constant (about 500 g total) during the , 3 3 U operation, weighted yields wer* used, assuming4 .hat. of the fissions. 93.5T came from I 3 3 U . 2.2n from 1 3 * U . and 4.tt horn I 3 , P u .
For irradiation for an interval I, at a fission rate F and yield Y. followed by coding for a time t i . the usual expressions3 for one- and two-element chains are
Fission -» A -* B -»
Atoms .A(/2 ) = — (! f ' x ' ' ' l r ' * ' ' ' X|
Atoms Bf/j» = : / r - * i ' i X: \ X,
X, / "
where X, and X2 are decay constants for nuclides A and B
A program based on the above expressions was written in BASIC and executed periodically on a commercial time-sharing computer to provide a current inventory basis for incoming radiochemical da'a from recent samples.
To remain as current as possible, the working power history was obtained by a daily logging of changes in
17
Table 5 1 . Fa data fcr inventory <
ClOMl talive fission yield" Chan Isotope HalF«fe Fraction »»u I > S L , " » * .
• 9 Sr 52 days 1 i J t 4.79 1.711 90 Sr 21.1 r a n 1 6 4 * 5 7 7 2-2! 91 Sr 5 * 7 hr 1 5.57 5S1 2.43 91 Y 59 days il-Ol*" 5 5 7 5- t l 2.43 95 Zr 65 d a n 1.0 405 6 2 0 4 9 7 95 Nb 35 dan (1.0) 60S 6.20 4.97 99 Mo 67 br 1.0 4 1 0 6.06 6.10
103 Ka 39 5 d a n 1.0 ISO 3 0 0 5.67 10* Km 361 days 1.0 9.24 0.33 4.57 109 A« Stable ( 9 1 b * resonance! 0044 0.030 1 4 0 110 AglM) 253 days I I I M 7 j d i n 1 00242 0-0192 0.232 125 Sb 2.7 years 1 0.0S4 0 u 2 l 0 1 1 5 127 :«<•> : 00 days 0 2 2 0 6 0 0 1 3 0 3 9 129 T d M I 34 d a n 0 36* 2 0 0 oao 2 0 0 132 Te 3 . 2 J d a n 1.0 4 40 4.24 5.10 131 1 *.0S days 1.0 2 9 0 2 9 3 3.7»
133 Cs Stable (32 b • resonance! 5 7» 6.61 6 53 134 Cs 750 day* 137 Cs 29.9 years 1 6 5 1 6.15 6 63 140 h 12Sdays I 5 40 6 85 5 5 6 141 Ce 32 3 days I 6.49 6 4 0 5 0 1 144 Ce 2S4days 1 4.61 5 62 3.93 147 Nd I I I d a n 1 I 9 S 2 36 2C7 147 PM 2 65 yean 1 I 9 » 2.3« 2 0 7
tress M. I. Bdl. Nuclear Transmutation Data. OMGENCnde Library. L. K. McNec**. tngmrrrimt Brfhpzuni Simkn for MollrnStll Brrrdrr Ktactor /torronr So. I. ORNL-TM-3053. Appendix A (.November I9*0>
T h i s is the value given in (be earner bteratare. indKale thai ibc branching fraction is 0.157.
r Parentheses indicate nominal vafcjcs.
The revised Nuclear Dala Sheets « K
reacio; power indicated by nuclear instrumentation charts: the history so obtained agreed adequately with other determinations.
In practice, the daily power log was processed by the computer to yield a power history whici could remain stored in the machine. A fde of reac'or sample limes and fill and drain limes was also stoicii. *> well as fission product chain data. It was thus possibk: to •ipdale and store the inventory of each nuclide at each sample lime. A separate file for individual samples and their segments containing the available individual nuclide counts and counting dates was then processed to give corrected nuclide data on a weight or other basi; and. using the stored inventory data, a ratio to the appropriate rescior inventory per unit weight. The data for individual salt and gas samples were also accumulated for inclusion in a master file along with pertinent reactor operating parameters at Ihe time of sampling. This ftk was used in preparing many tables for this report.
Only one ad hoc adjustment was made m the inventory calculation. R-idtochemkal analyses hi connection with the chemical processing of the salt to change from J 3 5 U to 2 " U fuel indicated that " N b . which had continued to be produced from the " Z r in Ihe fuel when run 14 was shut down, was entirely removed from the sail in the reduction step in which the salt was treated with zirconium nvtal and filtered. To reflect this and provide meaning'.!) " N b inventories for th; next several months, the calculated " N b inventory was arbitrarily set at zero as of the time of reduction. This adjustment permitted agreement between inventory and observation durint ihe ensuing interval as " N b grew back into t h ; salt from Jecay of ihe " Z r contained in ii .
In this report we have norm?ily tabulated the activity of each nuclide per unit of sample as of the lime of sampling and also tabulated the ratio of this to inventory. For economy of space we then did not

18
tabulate inventory; this can of course be calculated by dividing the activity value by the ratio value.
RoCVHKCS
I. D. J. Horen (ORNL Physics Division I. "Decay »l , : , S b . , - ' m * T e . " leuer to J. R. Tallackson (ORNL Reactor Division I. May 5. 1472.
2. E. J. Lee (ORNL Mathematics Division). Program FISK.Junr ?8.1968.
3. J. M. West. trakulalMM. of Nuclear Radiation." pp. 7-14. 7-15 in sect. 7-1. \uckmr Engineering Handbook, ed. by H. Ethermgion. McGraw-Hill. New York. I*»58.
4. B. E. Prince. "Long-Term Isotonic Changes and Reactivity Effects during Operation with 2 3 > U . ~ MSR Phrgnm Semmnmt Phtgr Rep. Feb. 2S, /WW. ORNL-4396. pp. 35 37.

19
6. SALTSAMTLES
fcl Radnvhemical analyses were obtained on salt samples
taken I rum the pvnp bowl beginning in run 6. usmg the umpter-enncher1 : I Fig. 6 l» A tared hydrogen-fired cupper capsule I ladle. Fig. 6 2) which could contain 10 g of salt was attached lo a cable and lowered by wimlass past two containment gate valves down a slanted transfer tube until i* was below the surface of the liquid wrthn die mist shield in the pump bowl. Alter an interval the capsule was raised above the latch, null the sail fit*.? and mm was raised into the upper containment area ak4 paced in a sealed transport container and trarsferrcC to die Hwr. Radu'uon Level Analytical Laboratory. Similar procedures were followed with other types of capsules to be described later The various kinds of capsules had hemispherical ends and were %-tn-diam cylinders, o in. <* less in length. Ladks were about 3 in. long.
After removal from the transport container m the High Radiation Level Analytical Laboratory, the cable
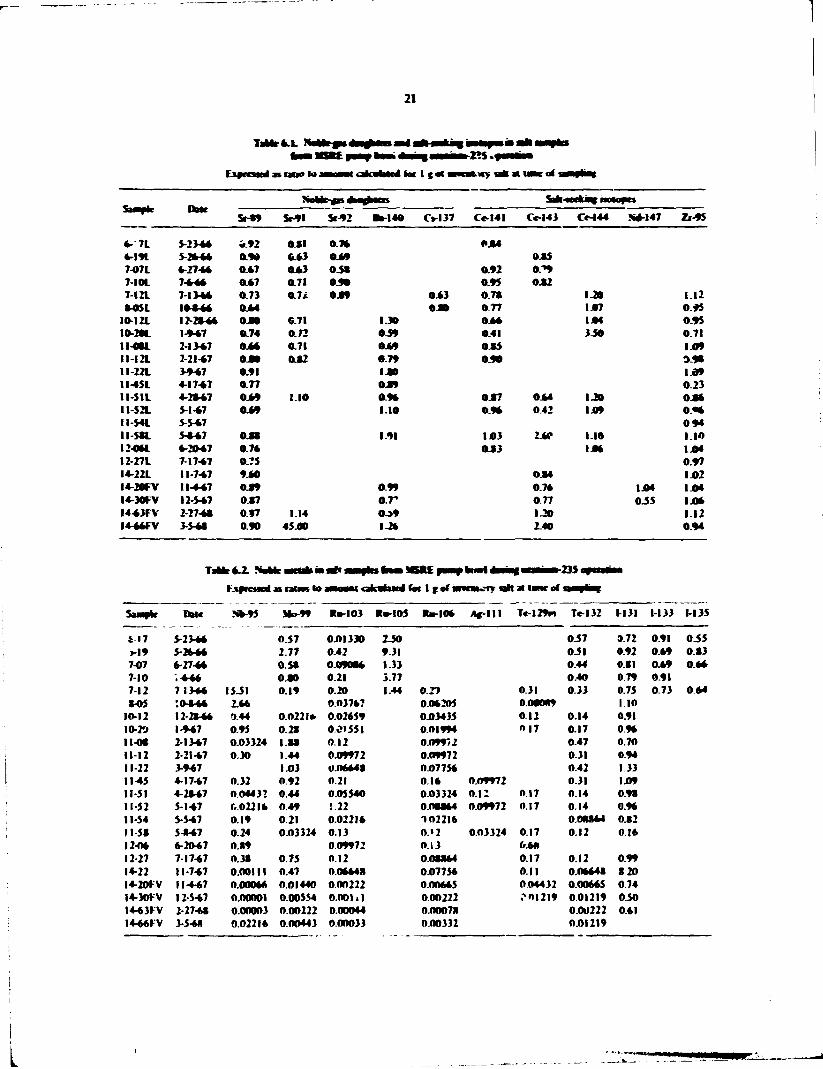
was slipped off. and the capsule and contents were mspected and weighed. The top of the ladle was cut off. After th». the sample m the copper iadk bottom part was placed in a copper containment egg and agitated 45 mm in a pulverizer owner, after which the powdered sai: was transferred iFig. 6.3) to a polyethylene bottle for retefh~. or analyst; Data from 19 such samples, from run 6 to run 14. are shown m Tables 6.1 au& 6.2 as ratios to inventory obtained from program FtSK. Full data are given in Table 6.?. at the end of rhis chapter.
There will be further discussion of the results. However, a broad overview wiM note that the noble-gas daughters and ^I'-frrlung isotopes were generally dose to invenion values, while the noble-metal group was not i s high, and values appeared to be more erratic Noble-metal .udide* were observed to be strongly deposited on surfaces experimentally exposed to pump bowl gas. Iras nnpiied that some of the noMe-metal activity observed for ladle salt samples coud have been picked up in the passage through the pump bowl gas
4CCES5 =*5«"
U C l l C
C»€»*--0*»«. MO
McowecT
S « * * - SE.lt.
• • "i.* SCO"! .* - 4 - r
:AS T -£ -C<%* .'S~t_aec
Vl*P-._»*0»
COWMK*
r - -•
CJ^SULE 5i.:0€
• 1 * C*TX»«. C •vOSuHlS <C0U<MW * 9u»»€»t0 SEAC
0 2
nf
Fig. 6.1-
20
MOTO « S M «
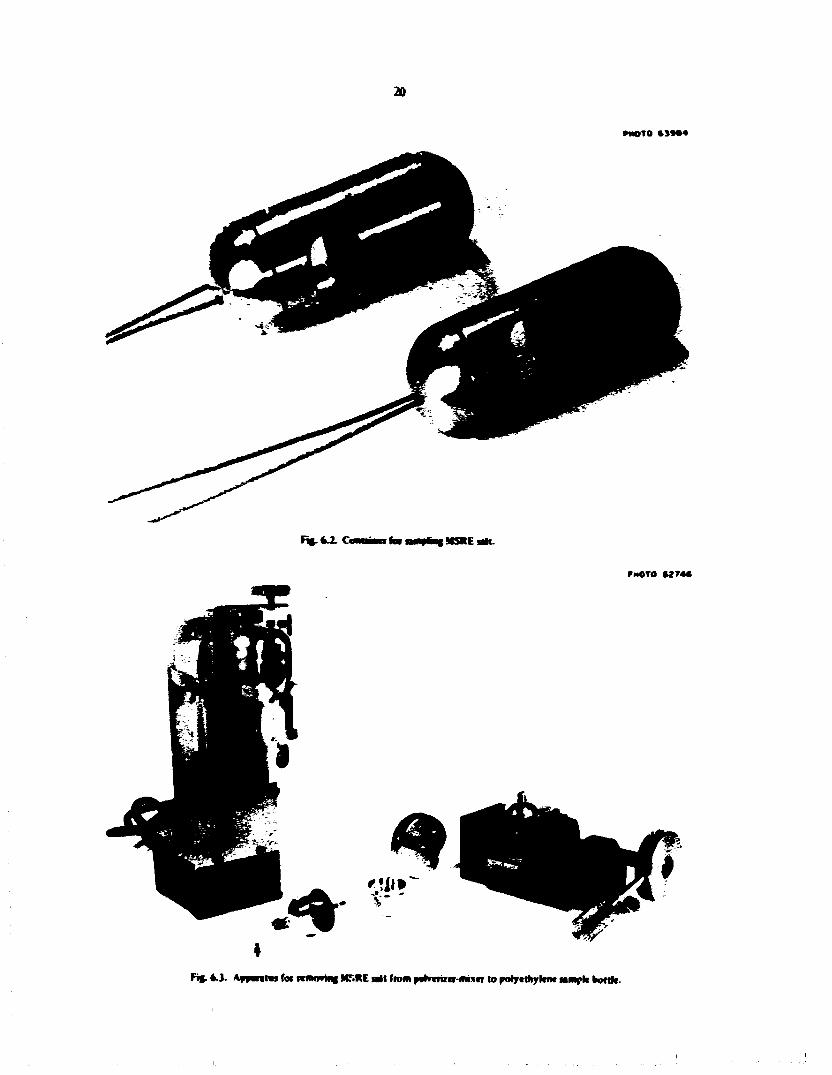
F«.fcZ fmiami*mgm*E*ti.
rnoTO u r w
ru*»
Fif.6. J. Affwitm fw www tag MT.RE nil (torn prtwira mixn lo polyethjrkn* sample bottle-
21
T a M r t . 1 . Ho* Mmaaal •fc-mfcaaj • M o j o * * i a a k a * a j * 1mm % • » « • » - Z * S . f M
Eaaraaoi • a w i « i • • t i l i i f a c I got a m a * * ? " " at mac of i
S - * CMC St49 5*91 Sr-92 •a-140 O I 3 7 C e - M I Cr-143 Cr-144 S4-147 Zi-95
6- 7L 5-2344 i .92 asi 0.74 0 4 4 t -m 5-26-4* aw ft.63 0 4 9 0 4 5 7-07L 6-27-66 0 6 7 0 4 3 0.5S 0.92 0/»9 7-I0L 7-6-66 0 4 7 0 71 0.90 0 9 5 0 4 2 7-12L 7-13-66 0 73 a 7 x 0 4 9 0 4 3 0.78 1-20 1 1 2 M S L 1 0 * 4 6 0 4 4 0 4 0 0.77 147 • 95
I0- I2L 12-2*46 0.6V 0.71 1.30 0 4 * 144 0.95 10-201 1-947 a 7 4 0.72 0.59 0.41 3 5 0 • 71 11-OtL 2-1347 0 4 6 a 7 i A49 • 4 5 1 4 9 I I - I 2 L 2-2147 0 4 4 a>2 0.79 0.90 0.94 U-22L 3 * 4 7 0.91 140 1 4 9 I I -45L 4-1747 a n 0 4 9 0.23 11-511 4-2*47 0 4 9 1.10 0-94 • 4 7 0 4 4 1J0 0 4 4 11-521 5-147 0 4 9 1.10 0.96 0.42 149 •.•* I I -S4L S-5-47 0 9 4 I I - 5 I L 5 4 4 7 a n 141 143 24P 1.10 1.10 I2-06L 6-2047 0.76 0 4 3 146 144 I2-27L 7-1747 0.75 0.97 I4-22L 11-747 9 6 0 0 4 4 1 4 2 I4-20FV 11-447 0 4 9 0.99 0.76 144 144 I4-30FV 12-547 0 4 7 o.r 0.77 0 3 5 1 4 6 I443FV 2-2748 0 4 7 114 0->9 1J0 1.12 I 4 4 6 F V 3-541 0.90 4 5 4 0 1-26 2.40 0.94
TaUr6.2 . N a 6 J e « c l * * • * • • • « • ts tmm SSKE faaBf •MrfojJM „•- 2 3 5 « f t M i
KxfictaoJ a m n i o M M M a l ta ta ie j (or 1 f of a * •CMcty n i l at MBit of «-•»* S » * r CMC
5-2346
Jik-95 Mo-99 Ro-103 Ra-105 Ra-106 A f - l l l Tc-!29m T*J32 M 3 I 1-133 1-135
i 17
CMC
5-2346
Jik-95
0.57 041330 2 3 0 0-57 0.72 0.91 0 3 5 J - 1 9 5-2646 2.77 0.42 9.31 0 3 1 0.92 0 4 9 0 4 3 7-07 6-2746 OSS 0.090S6 1.33 0.44 041 0 4 9 0 4 4 7-10 . 4 4 6 0 4 0 0.21 3-77 0.40 0.79 0.91 7-12 7 1346 15-51 0.19 0.20 1.44 0.29 0.31 0.33 0.75 0.73 0 4 4 * 0 5 ' .0446 2.66 0.03767 046205 0.080*9 1 10
10-12 12-2846 0.44 0.O22I* 042659 043435 0 1 2 0.14 0.91 I O - » 1-947 0.95 0 28 OOI55I 041994 0 1 7 0.17 0.96 l l -Ot 2-1347 0.03324 I . M 0.12 0.09972 0.47 0.70 11-12 2-2147 0.30 1.44 049972 049972 0.31 0.94 11-22 3-947 1.03 tf.06648 047756 0.42 1 33 11-45 4-1747 0.32 0.92 0.21 0.16 0.09972 0.31 149 11-51 4-2S47 0.04432 0.44 04S54O 0.03324 0.12 0.17 0.14 0.9S 11-52 5-147 0 02216 0.49 ! 2 2 0 4 U 6 4 049972 0.17 0.14 0.96 11-54 5-547 0.19 0.21 042216 102216 0.08864 0 4 2 I I -58 5-847 0.24 043324 0.13 0.»2 0.03324 0.17 0.12 0.16 12-06 6-2047 0.89 049972 0.13 fr.6* 12-27 7-1747 0.38 0.75 0.12 0.OM64 0.17 0.12 0.99 14-22 11-747 0.00111 0.47 0.06648 047756 0.11 046648 8 2 0 I4-20PV 11-447 0.00066 0.01440 0.00222 0.O0665 044432 0.00665 0.74 I4-30FV 12-547 0.00001 0.00554 0.001 • 1 040222 ?01219 0.01219 0 3 0 I443FV 2-2748 0.00003 0.00222 0.00044 0.0007* 0.00222 0.61 I446FV 3-5411 0.02216 0.00443 0.00033 040332 0.01219

22
aad transfer tube regions, and indicated that salt samples taken from below the surface were desuaeie.
6.2 Ffwte-Vamc Snmpks
Beginning in run 10.gas samples tq.v.) had been taken using a "freeze-vslue" capsule (Fig. 6.4».
To prepare a freeze-valve -.-apsule. n was heated sufficiently to meli the salt seal, then cooled under "acnum. It was thus possible to lower the capsule nozzle below th? surface of the salt in the pump bowl before the seal r-elied: the vacuum then sucked in the sample
After the freeze-valve capsule was transferred to the rwgh Radiation Level Analytical Laboratory, inspected, and weighed after removing the cable, the entry nozzle was seated with chemically durable wax. The capsule exterior was then leached repeatedly with "verbocit"
ORWL-OWC •T-vTMA
— STAINLESS STEEL CABLE
% - i n . 0 0 NICKEL
L ' j B e ^ NICKEL CAPILLARY
Fig.fr.4. Frccif****
iVersene. boric acid, and citric acid I and will. HNOj-HF soluiion until the activity of the lea.* soiulion was acceptably low. The capsule was cut apart •n three places m the lower sealing cavity, uist above the sealing partition, and near the top of the capsule-Salt was extracted, and the salt and sail-encrusted capsule pans were wenjhed. The metal parts were thoroughly leached or dissolved, as were auquots of the salt.
Four samples (desajnated FV | were taken late in run 14 using tius technique. Results shown nest the bottom of Tables 6.1 and 6.2 show that the voltes for salt-peeking isotopes and daughters of noble-gas isotopes were little changed and were near inventory, but values for nobie-meu: nucmto were tar below inventory. This supports the view that the liquid salt held little of the noble metals and that the oMe-metal activity of earlier bdle samples came from the pump bowl gas tor gas-liquid interface) or from the transfer lube.
After run 14 was terminated the - J * L fuel was removed by tluormation. and the carrier salt was reduced with hydrogen and with metallic zirconium, after which : J 3 U fuel was added, and the system was brought io criticakily and then to pow»r in the early autumn of 1468.
Radiochemical analyses were obtained on ladle samples taken during treatrient in the fuel storage tank (designated FST) during chemical processing, and from the fuel pump bowl aft.*r the salt wa* returned to the fuel circulation system (designated FP» from tune to time during runs 15. 17. 18. and 1°. as shown in Table 6 J Chemical analyses on these samples were -ported by Thorna.1
The " N b activity of the solution was slightly mor*. than accounted for in samples FPIS-6L. as the zirconium seduction process had been completed only a shon time before: the niobium inventory was set at zero at that rime. The " N b which then grew irtro ;he salt from decay of * *2 r appeared in these samples to show some response to beryllium reduction of the salt, though this effect is seen better with freeze-vaive samples and so will r M be dWuisrd here. The various additions of beryllium to the fuel silt have been given by Thorna.*
Data for all freeze-vaive sail simples liken during : 1 J U operation are summarized as ratios to inventory sail in Tables 6.4 and 6.5. and Table 6.8 ai the end of the chapter, where various operating conditions are given, along with the sample activity and ratio to inventory sail. Analyses for sail constituents as well as fission products are shown there. On the inventory-rati" basis, comparisons can be made between any con stitucnts and/or f. sk>n products.

TtWt •• J* DMO M IHfl IIMIIMMlvJ Wjffwf ) M l MMpvM InMVI MIRK 9ttM9 MMfl MffMf HffSMMM'JJJ opiMtM* lidl« titpwlti
V«HM* <town «•« tbt una ul obwrtwl Mlivtiy to invvniuiy »vtbviiy, bi >h in iiMnt*«t«Mnni ft minul* pm »i»m Ininnlory buti, 7 4 MW » full pawfi
TriM Sf-M S i» l Y-91 "» l«0 C«-l)7 C t H l t V H ) i f 144 N4-I47 Zf-9,1 N M * Mix** Uu-10) Ku-105 HulO* I*-I2*m T t O l 1-1)1
Fit-23. FiMl.pt> Kj 0 1 ) I . ]} 1.22 Am- 14
FST-27. Cwrt*i .*MlF| Q.»> 121 Awj. I»
F S T » . r w i m . * M l H , 0.94 D M J»H 4
FNJ-41. Fwl 0.92 M l 9*M. 14
FHS-9L. F I N I 0.9) 1.07 tap 17
FPI5-I0L. FIMI 0.9) 1.2* Upt .19
F»'S-IU.. Fwl 0.7S 1.04 (X 4
F N 5-2*1. F'Ml 0.19 1.40 Oct 10
F F 1 M I . Fwl .9 * *9»«« 1)4) 0 94 1)3 ton. 12 N)
FPI7-4L. FtMl.MtflvKn 0.15 0 ) 7 012 109 OKI 0.44 0.7* 17} 0 25 U
h*. 21 F»»ti FH7-9L. Fwl O H I 15 0 J I 0 4 ) 0 10 0.2*
J»». J * F F 1 M H . Fwl 112 ( U * 0 4 ) 015 0.04 0.14 1.07
F«b* FM7-UI. Fwl
Fib. 12 F U M f l , Fuel
Frt. 19 FPI7-204,. Fwl
Fvk.20 FFITJOt. Fwl
Ar* i 19-IL. Fwl
AF* '4 I M l . Fiwl
A * » 19-101. Fwl
Apt. » I9-I7L. <wl 1.01 I M 117 0.49 0.94 124 14 * M t 1.44 0.45 0.0* I 45 10.7 5.7
Aw. 17
102 0.M
0.99 0.71
III 0.50
III m.ihf"
129 I.JO
104 102
0.90 0.71
1.04 0.7*
1.05 0*3
1.09 OKI 0.44 0.7*
1 15 0JI 0 4 ) 0 10
1 12 0.2* 0 4 ) 015
1 17 0 22
122 (Oil)
1.01 Oil
10* 04*
III* 0.5)
1.25 0,44
1.44 0.15
2.19 1.44 0.45
***Nb M-IKWM) by nwaitMitun. *FbMlltbj Mt l*dK»M •FffOOUMM «*HW.

24
Tables 6.4 and 6.5 present only the ratio of the activity of various fission products to the inventory value for the various samples.
Two kinds of freeze-valve capsules were used. During runs IS. 16. and 17 (except 17-32) the salt-sealed capsule described above was used- In general, the results obtained with this type of capsule are betieved to represent the sample fairly However, as discussed above, the values for a given salt sample represent the combination of activities of the capsule interior surface
TaMc*-4. X o M t m t t i m » i m M J * ! • • • • g u n w 8 0 w m H • • p h i WI IW MSKE y — P t e w t *mrnt mmium 133
txprrucd n taiu to u u a i caUaUtcd tot 1 % of w««tnoiy ai t al I I M C ot %tmftmf
S>«pte Date KoMc-gn difvhien
Cc-141
&dt-*eefc«c HtMopn S>«pte Date
S«-89 Si-9> Y 4 1 «a-140 O I 3 7 Cc-141 Ce-144 Nd-147 Zi-95
15-28 10-12-68 0.20 1 36 0.29 0 2 8 15-32 10-15-68 0 9 4 0.61 0.84 108 0.91 15-12 10-29-68 O.W 0.82 1.16 0.88 15-51 I l * * 8 0 7 9 0 7(1 0 81 1.13 1 14 15-57 11-11-68 0 8 7 0 9 3 1.25 0.98 1 5 * 9 11-25-68 0.84 1.06 0 93 16-1 12-16-68 1.01 0.89 1 24 1.17 0.69 1 10 1 38 17-2 1 14-69 0.69 0 * 1 0.66 • 1.421* 074 1.10 C.79 17-7 1 23-69 0.48 O i l 0.96 0.80 0.68 0.53 0 7 0 0.66 0.72
r-io 1 28-69 0-60 076 1 22 0.69 0.83 0 9 4 0 6 2 0.98 0.89 i"-22 2-28-69 0.55 I 31 0 38 0.09776 0 80 1.07 0.99 0.89 1 7 - 9 J - 2 6 - 6 9 0.7* 1 22 1.08 0.91 085 1 28 1.22 0.98 17 31 4-1-69 0 6 3 2 53 0.64 1.05 081 0.77 111 1.08 0.92 17-32 4 - 3 * 9 i»76 0 9 4 1 01 0.77 0.8O 1 16 1 56 0.96 18-2 4-14-69 n r I 70 0 9 2 0.84 0.91 1 22 1.49 0.97 U-« 4-18-69 •;78 1.04 I 10 0.88 0.78 1 21 1 15 0.99 1 * - * 4-2 .'•69 <i.fr3 081 0 81 071 1.03 0.79 18-12 5-2*9 0.97 1.34 0 7 2 0.81 1.23 0.94 18-19 5-9*9 0 6 2 1 38 1 14 0.92 0.81 1.10 0 6 5 1 «'. | fr44 5-29-69 0.7fc I I I 1 01 0.79 0 78 0.94 0.04 i 48 0.95 18-45 6-1-69 V75 1 12 1.06 0 9 1 0.81 1.02 1 V. 0.95 18-16 6-1-69 0./2 1.02 1.04 0.84 0 7 5 1.23 IA»3 0.90 19-1* 8-11-69 000863 0.00389 0.00367 0.02514 G 00176 0.00984 0.0028'. 19-6* S-15-69 O01677 O.OI6I2 002157 0.09981 0 15 0 02149 0.01439 0.PSOI5 19-9 8-18-69 •».70 0 39 0.85 0 5 2 0.60 091 0 1 8 r-72 19-24 9-10*9 0.89 1 37 0.19 »85 0 * 5 1.00 0 1 2 0.86 19-36 9-29*9 0.82 1.00 0.94 1 10 0.76 107 0 94 0 8 6 19-»2 50-3*9 0 86 112 0 9 8 I.J6 0 84 1 12 1.21 0.93 1944 I 0 * * 9 0 78 1 21 0.99 0.08140 0 8 2 1.09 1 18 1 01 19-47 10-7*9 0 8 9 1.24 0 9 8 0.80 0.8a I I S 1.20 0.99 19-55 1014-69 0 7 7 1.00 1 12 0.69 0'/O 1.22 I . J * 095 19-57 IO-I7-69 0 75 1.13 1.10 0.85 0.87 1 16 1.22 0.93 19-58 10-17*9 0 7 J 1 17 103 0.86 081 1.17 1 36 092 19-59 10-17*9 0 6 5 223 1 10 0.80 0.79 1.06 1 16 0.90 19-". 10 3 0 * 9 0 7 J 0.76 i 04 0.98 08> 1 16 1 17 0.74 : .M 1. 2 6 * 9 0 6 J 1 29 107 075 0.67 1.13 092 20-19 12-5*9 0 5 3 1 02 0.91 0.79 0 6 9 1.06 085
'Appri'Ximtte nine *Hmh *»lf
with those determined for the contained salt. To prevent interference from activities accumulated on the capsule exterior, as many as several dozen HNOj-HF teachings were required: occasionally die capsule was penetrated. Also, the salt seal appeared to leak slightly. less vacuum inside resulted in less sample.
6.3 DomteWalC&pnBk
When a doubte-watted capsule was developed for gas samples iq.v.) it was adopted also for salt samples. The
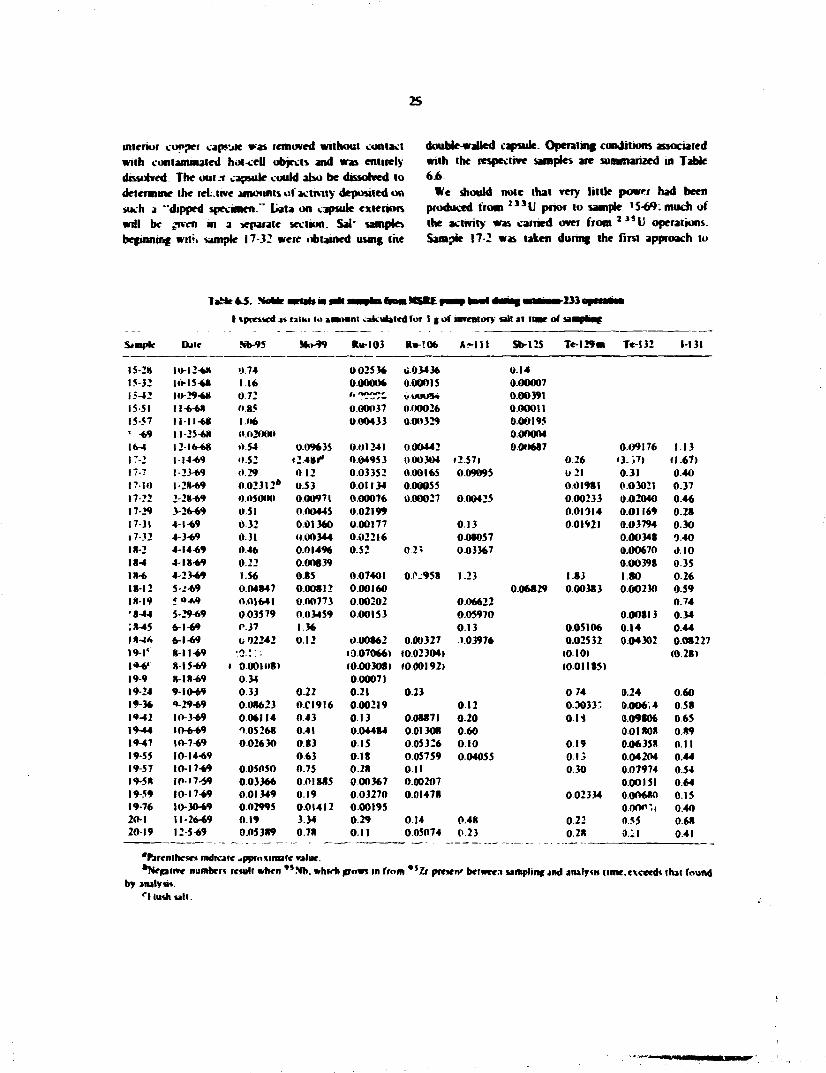
25
interior copper capsule was removed without contact with contaminated hot-ceil objects and was entirely dissolved The oui.-r capsule could abo be dissolved to determine the ret live amounts of activity deposited on such a "dipped specimen." Lata on capsule exteriors will be jrven in a separate section. Sal* samples beginning wits sample 17-32 were obtained using the
double-wailed capsule. Operating conditions associated with the respective samples are summarized in Table 6.6.
We should note that very little power had been produced from } 3 3 U prior to sample '5-6° . much of the activity was carried over from I , 5 U operations. Sample |7-2 was taken during the first approach to
laMr*~5. SoWr i • c a b m a l l M r i n f n M-233oMtM
Dale
t \pccu<d i * nlHt l» a*»
Sb-95 Mo-99
»n t vakubl cd tot 1 f at
fU- '06
' mventory sail ai I I M C of sawptmg
Simple Dale
t \pccu<d i * nlHt l» a*»
Sb-95 Mo-99 CU-103
cd tot 1 f at
fU- '06 A ~ l l l Sb-125 Tel 29 m Te-I32 1-131
is-:* to-12-68 0.74 002536 0 03436 0.14 15-32 10-15-68 1 16 0.00006 0-00015 0.00007 15-12 IO-29-68 072 f» *V*rt«*' VUUU5+ 0.00391 15-51 11-6-68 0 85 O.0OO37 0.00026 000011 15-57 I I 11-68 1.116 0.00433 000329 000195 ' -69 11-25-68 0.02000 0.OO0O4 16-4 12-16-68 054 009635 0.01241 000442 0.0O687 0.O9I76 1.13 ir-2 1-14-69 0 5 2 <2 48r' 0.04953 0.0OJO4 (2.57) 0.26 '3- .71 11.67) 17? 1-23-69 0 29 0 12 0.03352 0.00165 0.09095 0 21 0.31 0.40 17-10 1-28-69 0 02312* 0.53 0.01134 0.00055 0.01981 0.03021 0.37 17 22 2-28-69 0.05000 0.00971 0.00076 0.00027 0.00425 0.00233 0.02040 0.46 17-29 3-26*9 051 0 00445 0.02199 0.01014 0.01169 0.28 17-31 4-1-69 0 32 0.01360 0.00177 0 1 3 001921 0.O3794 0.30 17-32 4-3-69 0.31 0.00344 0.02216 008057 0.00348 0-40 18-2 4-14-69 0 4 6 0.01496 0.52 0 2 ; 003367 0.00670 0.10 I*-* 4-18-69 0 2 2 0.00839 0.00398 0.35 18-6 4-23-69 1.56 0.85 0.07401 0^-958 1-23 183 1.80 0 2 6 18-12 5-.T-69 0.04847 0.00812 0.00160 0.06829 0.00383 000230 0.59 18-19 5 o*<» 0.01641 0.00773 0.00202 0.06622 0.74 •8-»4 5-29-69 003579 0.03459 O.OOI53 0.05970 0.OO8I3 0.34 :8-l5 6-1-69 0.37 1 36 0 1 3 0.05106 0 1 4 0-44 m-4* 6-1-69 U02242 0.12 0.00862 O.0O327 .1.03976 0.02532 0.O43O2 0.0S227 19-1' 8-11-69 '0 !" 1007066) I0.023O4) (0 10) (0 28) |*-6« 8-15-69 l 0 001118) •000308) 1000192) (001185) 19-9 8-18-69 034 000071 19-24 9-10-69 0.33 0.22 0 2 1 0.23 0 74 0.24 0.60 19 36 0-29-69 008623 0.CI9I6 000219 0 1 2 0.3033: 0.006,4 0.58 19-12 10-3-69 006114 0 4 3 0 1 3 0.08871 0 2 0 O H 0.09806 0.65 19-M 10-6-69 0.05268 0.41 004484 0 01308 0.60 0.01808 0.89 19-47 10-7-69 002630 0.83 0 1 5 005326 0.10 0 1 9 0-O6358 0.11 19-55 10-14-69 0 6 3 0.18 0.05759 0-04055 0 1 3 0.04204 0.44 19-57 10-17-69 0.05050 0.75 0.28 O i l 0.30 0.O7974 0.54 19-58 IP-17-69 0 03366 0.01885 000367 O.002O7 000151 0.64 19-59 10-17-69 0.01349 0.19 003270 0.01478 002334 000680 0.15 19-76 10-30-69 0.02995 0.01412 0.00195 O.OOr»*.i 0.40 20-1 11-26-69 0.19 3.34 0 2 9 0.14 0.48 0.22 0.55 0.68 20-19 12-5-69 0.05389 0.78 0.11 0.05074 f>23 0.28 O i l 0.41
"fcremhese* mdicaie ..pprnxinu'e value. *Nepir»e number* rewli when "Mb. whirh grow* in from "Z f prcsen' between sampling and analysis lime.exceed* that found
by ana'ywt. r'Unit alt.

TaMe 6.6. Operating ewmMltwu foi Mil samplea takan from MSRE pump bowl during uranlnm-2JJ operation
Overflow
Sample No Dale Time
Iqinvjlcnt full-power
ho tin
Percent of lull
power
0 0 0
HoU.I1 41 percent of
power
0 5
Pump rpni
1180
Void* ( ' * • >
0 1)0
Pump bowl level • ' * > Lb/hr
Previous re1urn
D»y Tim*
Purge
Sid Inert/nun
»it\ flow
P«i»
15-28 10-12-68 1726 0 01
Percent of lull
power
0 0 0
HoU.I1 41 percent of
power
0 5
Pump rpni
1180
Void* ( ' * • >
0 1)0 63 1.4 •0-12 0711 3 30 He 5 2 Purge on 1532 10-15-68 2047 0 01 «'M 0 1 1180 0 6 0 66 2 9 10-15 1830 3 30 He 5 5 Purge on IS-42 10-2968 1123 0.01 0.00 9.4 1180 0.00 66 3.7 10-28 1730 3.30 He 4 9 Purge on 15-5 I 11-6-6* 15)1 0.01 0.00 243 1180 0.00 66 10 114 1630 3.30 He SO Purge- on 1557 11-11-68 2145 0 0 1 0.00 0.5 1180 0.60 63 0.8 11-11 1208 V30 He s.s Puige on 15 69 11-25-68 1700 0 0 1 0 0 0 21 4 1180 0.60 56 0 8 11-25 0425 3 30 He SO Purge on 16-4 12-lb fell 0555 1 56 0.00 6 2 8 1180 0 6 0 62 0.8 1215 1758 J.JO He 4 6 Purge on i7-> 1-M-69 1025 169 5 6 ) 15 1180 0.60 59 3 8 1-14 0310 3.30 He 3.8 Purge on l?-7 1-23-69 1320 94.00 5750 15.1 1180 0.60 57 1.8 1-23 0736 3.30 He 4.2 Purge on 17-10 1-28-69 060) 15550 5875 39.0 1180 0.60 57 16 1-27 2315 3.30 He SO Purge on 1722 2-28-69 2259 7 1 9 6 ) 87.50 31 4 942 0 0 0 65 0 7 2-27 1630 3.30 He 5 4 Purge on 17-29 3-26-69 1506 I U 4 75 86 25 0.1 1050 0.05 58 13 3-25 2132 3.3(1 He 4.2 Purge on 1 7 ) 1 4-1-69 1145 1271 00 90.00 140.8 1050 0.05 62 J.O 4 1 1015 3.30 He 8 9 Purge on 17-32 4-3-69 0552 1307 00 90.00 1829 1050 0.0S 60 4 5 4-2 1807 3 30 He J.I Purge on m-2 4 14-69 1150 152775 100 00 4 1 8 1180 0 6 0 61 7.4 4-14 0853 3.30 He 4 * Purge on l»-4 4-18-69 2119 1601 25 100 00 4 9 8 1180 0 60 63 4.9 4-1(1 1901 J.JO Hv 52 Purge on 11-6 4 -2 )69 1015 1713.11 100 00 158.7 1180 0.60 63 4 7 4-2) 0733 3.30 He s.s Purge on 18-12 5-2-69 1)05 : 9 ) 9 00 100 00 3765 1180 0.60 59 JO s-: 0500 3 J 0 He S2 Puigt on 18-19 5-9-69 1925 2106.00 100 00 93.8 1180 0 6 0 59 0.9 5-9 1303 330 He 4.8 Purge on 18-44 S i 9 6 9 0)11 2 4 7 ) 0 0 86 25 28.7 990 0 00 S3 0.0 5-28 1833 2.30 He 130 Purge on 18-45 6-1-69 0921 2 5 ) 8 6 ) 0 0 0 0.4 990 0110 50 0 0 5-31 2223 2(H) Ar 128 Purge on IH-46 6-1-69 1412 2538«>) 0.00 52 990 0 0 0 56 0 0 5-31 222) 2.00 Ar 1 3 to Purge on 19-1" 8 11-69 0845 . -38.63 0.00 0 0 1189 ' )00 72 0.0 0 0 0 0 3.30 He 2.4 Purge on 19-6" H I 5-69 041) 25., "63 0 00 0 0 U 7 0 0.00 62 0.7 0 0 0 0 330 He 5 J Purge on 19-9 8-18-69 0604 2 5 3 8 6 ) 0.1) I I 1189 0 6 0 65 2.4 8-18 0219 3.30 He 5.3 Purge on 19-24 9-10-69 1049 278187 0 1 3 196 1165 0 70 62 4.7 9-10 0501 2 90 Ar 5 0 Purge off 1 9 ) 6 9-29-69 1108 2978 50 6875 66 1 608 0.00 58 0.9 9-27 0316 J JS He 6 3 Purge off 19-42 10-3-69 1105 3048 87 87.50 49.0 1176 0.5) 68 6 3 10-3 1036 J JO He SO Purge off 19-44 10-6-69 06)5 311862 100.00 63 3 11.48 0 5 3 64 7.4 10-3 0305 3 30 He S.S Purge off 19-47 10-7-69 10)3 3148 75 100 00 91 3 1175 0 5 3 61 18 10-7 0228 335 He SB Purge off 19-55 10-14 69 1047 3)30 25 100 00 2595 1186 0 5 3 63 2.6 10-14 0353 330 He 5 2 Purge off 19-57 10-17-69 0620 3)95 38 100(10 4 2 6 1186 0.53 63 37 1017 01 OS J.JO He 5 2 Purge off 19-58 10-17-69 094' 3397 1) 0 1 3 10 1188 0.53 67 9 0 1017 0757 330 He 5 6 Purge off 19-59 10-17-69 1240 3)97.13 0 13 s 0 1189 0 5 3 65 3 9 10-17 07S7 3 JO He 5 6 Purge off
1976 10)0-69 HS9 3 7 0 5 6 ) 100 00 1406 1176 0 5 3 66 8.6 10-30 0916 3 30 He 5.2 Purge off 20-1 11-26-69 1704 3789.38 100 00 17 1190 0 5 3 64 6 8 11-26 1320 J.JO lie 5 5 Purge off 20-19 12-5-69 0557 399087 10000 3 6 ' 1200 0 5 3 63 5 6 12-5 0248 330 He 5.2 Purge off
i*
-l-"lM*h tall
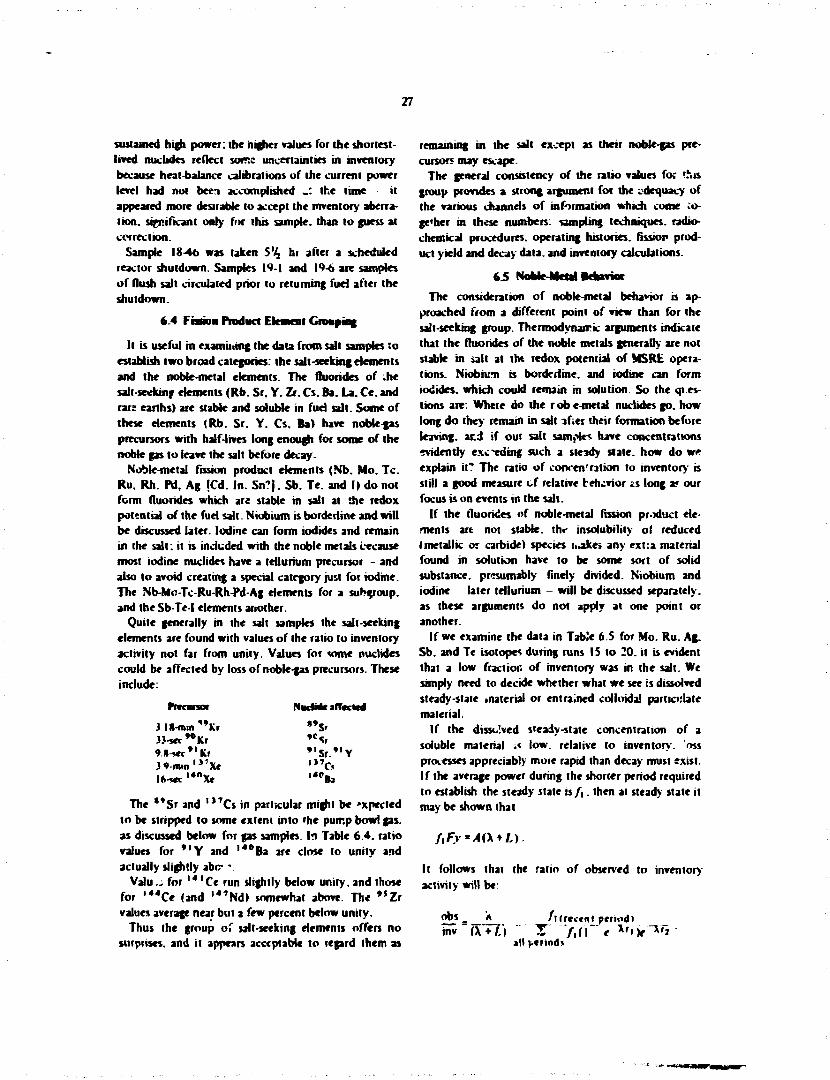
27
sustained high power: the higher values for the shortest-lived nuclides reflect sorts uncertainties in inventory because heat-balance calibrations of the current power level had not been accomplished _: the time it appeared more desirable to accept the inventory aberration, significant only for this sample, than to guess at correction.
Sample 18-46 was taken S\ hi after a scheduled reactor shutdown. Samples 19-1 and 19-6 are samples of flush salt circulated prior to returning fuel after the shutdown.
6.4 Farina Product Element Grouping
It is useful in examining the data from salt samples to establish two broad categories: the salt-seeking elements and the noble-metal elements. The fluorides of .he salt seeking elements (Rb. Sr, Y. Zr. Cs. Ba. La. Ce. and rare earths) are stable and soluble in fuel salt. Some of these elements (Rb. Sr. Y. Cs. Ba) have nook-gas precursors with half-lives long enough for some of the noble gas to leave the salt before decay.
Noble-metal fission product elements (Nb. Mo. Tc. Ru. Rh. Pd, Ag ICd. In. Sn?|. Sb. Te. and I) do not form fluorides which are stable in salt at the redox potential of the fuel salt. Niobium is borderline and will be discussed later. Iodine can form iodides and remain in the salt: it is included with the noble metals L-ecause most iodine nuclides have a tellurium precursor - and also to avoid creating a special category just for iodine. The Nb-Mo-Tc-Ru-Rh-Pd-Ag elements for a suhcroup. and the Sb-Te-I elements another.
Quite generally in the salt samples the salt-seeking elements are found with values of the ratio to inventory activity not far from unity. Values for some nuclides could be affected by loss of noble-gas precursors. These include:
AciMMJI Nacfvie affected
3 Ift-min ' Kr »»Sr 33-*c*°ICr • c s , ^H- jec^Kr • ' S r . " Y 3 » - m i n , i 1 X e . 3 7 C ,
!6-*«c , 4 0 X « . 4 0 f a
The **Sr and l l 7 C s in particular might be »xpecied to be stripped to some extern into 'he purr.p bowl gas. as discussed below for gas samples. In Table 6.4. ratio values for *'Y and "*Ba are close to unity and actually slightly abcr \
Valu.. for ' *' Ce run slightly below unity, and those for '**Ce (and , 4 7 N d ) somewhat above The , 5 Z r values average near but a few percent below unity.
Thus the group o> salt-seeking elements offers no surprises, and it appears acceptable to reprd them as
remaining in the salt except as their noble-gas precursors may escape.
The general consistency of the ratio values for This group provides a strong argument for the adequacy of the various channels of information which come io-ge'her in these numbers: sampling techniques, radiochemical procedures, operating histories, fission product yield and decay data, and inventory calculations.
65 NoWe-Metol Behavior
The consideration of noble-metal behavior is approached from a different point of view than for the salt-seeking group. Thermodynairic arguments indicate that the fluorides of the noble metals generally arc not stable in salt at the redox potential of MSRE operations. Niobium is borderline, and iodine can form iodides, which could remain in solution. So the questions are: Where do the rob e-metal nuclides go. how long do they remain in salt 3f;er their formation before leaving, and if our salt samples have concentrations evidently exceeding such a steady state, how do we explain it? The ratio of corxen"ration to inventory is still a good measure of relative tetuvior £S long a? our focus is on events in the salt.
If the fluorides of noble-metal fission product dements art not stable. th<- insolubility of reduced (metallic or carbide) species uakei any ext:a material found in solution have to be some sort of solid substance, presumably finely divided. Niobium and iodine later tellurium - will be discussed separately. as these arguments do not apply at one point or another.
If we examine the data in Table 6.5 for Mo. Ru. Ag. Sb. and Te isotopes during runs 15 to 20. it is evident that a low fraction of inventory was in the salt. We simply need to decide whether what we see is dissolved steady-state material or entrained colloidal particulate material.
If the dissolved steady-state concentration of a soluble material ;« low. relative to inventory, oss processes appreciably more rapid than decay must exist. If the average power during the shorter period required to establish the steady state i s / , . then at steady state it may be shown that
f,Fy*A(\*l.).
It follows that the ratio of observed to inventory-activity will be:
obs inv <\+[.) Z / , ( |
all v«nodi
'i(recent period) \t i y ~>' l

28
The amounts in solution should be proportional to the inverse of half-life, to the .urrent power (vs full), and to the relative degree of full-power saturation. The amount does not depend 01 the other atoms o f the species as lonf, as the loss term ts first order.
it follows that samples taken at low power after operation at appreciable power should drop sharply in value compared with the prior «amples. These include 18-15. 18-16. 14-24. l**-58. and l ^ o 1 ) Of these samples, only l°-58 jpp.j.> evidently low across the bo-jrd. the criterion is not generally met.
The expression also indicates that after a long shutdown, the rise in inventory occurring I for a half-life or so), with fairly steady loss raie. should result in an appreciable decrease in the ratio. The beginnings of runs 1" and 19 are the only such periods available. Here the data are loo scattered to be conclusive, some of the data on ' : ' m T e and ' 3 : T e appear to fir samples 17-7 and I*>-24. respectively, are somewh.ii higher thjn many subsequent samples.
Briggs4 has indicated that the loss coefficients should be
/. * | 1 Ik - 5.7A + 7IA.)hr '
for mass transfer to graphite, metal, -ind bubble surface, respectively, if sticking factors were imity and K the ratio r,i the mass (raster coefficient to that o f xenon. For metal atoms. K ~ I. neglecting bubbles. /. ~- 7 hr
The ratio 10 inventory predicted abov>> is dominated by the first factor. X (>« t / . ) . in the cases (.« majority) where the present power was comparable with the average powe. for the last half-life i>r so. We .-an then note fc-r the various nuclides using A = 7 hr" 1 :
Nuclide Half-life (days) \{l*X".
"*Mo :79 0 0015 " , 3Ru . in nnooin ""•Ru 367 OOOOOI " ' A j 7 5 0 00055
Comparing the observed ratios with these shows that what we observed in essentially all cases was an oider of n.agnihide or more greater This indicates that the 'ibserved data have 10 be accounted for by something other than just the stcady-siute dissolved-atom concentration serving to drive the mass transfer processes.
The concept that remains is tnat some form o( suspended material contributed the major part of the activity found in the sample. Because this would represent a sparine phase from the salt, the mixture
proportion could vary. The possible sources and b -havior o f such a r.-'xture will be considered in a later section after other data, for su:faces, etc.. have been presented. We believe that the data on noble-metal fission products in salt are for the major p a r t explicable in terms of this concept.
Three elements included in the table o f noble-metal data should be considered separately: niobium, iodine, and tellurium.
6.6 Niobium
Our information on niobium comes from the 35-day * 5 N b daughter of 65-day , 5 Z r . Thermodynamic considerations given earlier indicate that at fissior product concentration levels. Nb 4 * is likely to be in equilibrium with mobiurr. metal if the redox potential of the salt is set by U3*/"."** concentration ratios perhaps between 0.01 and 0.G0I. If Nb 3 * species existed significantly at MSRE oxid. concentrations, the stability of the soluble form would be enhanced. If NbC were formed a> a rate high enough to affect equilibrium behavior, then the indicated con.entral on of soluble niobium in equilibrium with a soli a phase would be considerably decreased.
Because ' s Nb is to be considered as a soluble species, direct comparison with inventory is relevant in the soluble case I v. nen insoluble, it should exhibit a limiting ratio comparable to 34-day l 3 , , n T e . or about 0.0001).
The data for " N b in salt samples do appear to have substantial ratio values, generally 0 5 to 0.3 at times when the salt w.»s believed to he relatively oxidizing. When appreciable amounts of reducing agent, usually beryllium metal, h id been added, the activity relative to inventory approached /ero(±0.05( . Frequently, slightly negative values resulted from the subtraction from the observed niobium activity at count time of that which would have accrued from the decay of 9 * Z . in the sample between the time of sampling and the time of .ounting.
6.7 Iodine
loJinc. exemplified by ' 3 I I. is indicated to be in the torn of iodide ion at the redox potential of fuel sail, with little 1} being stripped as gas in the pump bowl. 5
Thermodynamic calculations indicate that to strip 0 1% •>f the ' 3 ' I as I j . a V*'/V3* of at least I0 4 would have o cxisl. As far as is known, the major part of MSRE
operation was not as oxidizing as this (however, because soi.ic dissociation to iodine atoms can occur in the vapoi. stripping could be somewhat easier). I 3 I I
29
..tivities relative to inventory were between 8 and I 13'*. with most values falling between 30 and 60T What happened to the remainder is of interest. It appears likely thai the tellurium precursor (largely 25-min l 3 l T e ) was taken from solution in the salt before iialf had decayed to iodine, and of this tellurium, sone. possibly rulf. might h_ve been stripped, and the remainder deposited on surfaces. Perhaps half o. the 1 3 1 1 resulting from decay should recoil into the adjacent vit. From such an argument we should expect about the levels o f ' 3 ' I that were seen.
6Jt Tefuriwn
Tellurium is both important and to some extent unique among the noble metals :n that the element has a vapor pressure at reactor temperature (650T) of about 13 torr. Since the fluorides of tellurium are unstable with respect to the clement, at the redox potential iff the fuel, we conclude that the gaseous element and the tellurium ion are the fundamental species. As a dissolved gas its behavior should be like xenon. The mass transfer loss rate coefficients indicated by Briggs4 would apply. /. - (\.2K * 5.7A' + 7A,'). so that with high sticking factors, about %4-hr production would be the steady-state concentration. .<nd half the tellurium would go to off-gas. The dissolved concentration for l 3 2 T e . relative to inventory salt, would be about 0.0006. and for ' 2 , T e . about 0.0000b. Again it is evident that the observations run higher than this. Recent observations by C. E. Bamberger and J. P. Young of ORNL suggest that a soluble, reactive form of telluride ion can exist in molten salt at a presently undefined redox potential. Such an ion could be an important factor in tellurium behavior. However, it is also plausible that tellurium is l.rgcly associated with undissolved solids, by chemisorption or reaction. Any of these phenomena would result in lower passage as a gas to off gas.
The viewpoint that emerges with respect to noble-metal behavior in salt is that what we see is due to the appearance of highly dispersed but undissolved mat -rial in the salt, a mobile separate phase, presumably solid, which bears much higher noble-metal fission product concentrations than the salt. Our samples taken from the pump bowl can only provide direct evidence concerning the salt within the spiral shield, but if the dispersion is fine enough and turnover not too slow, it sv.ould represent the salt of the pump bowl and circulating loop adequately.
We have suggested that the noble metals have behaved as a mobile separate phaso which is concentrated in
noble metals and is found in varied amounts in the salt as sampled. This is illustrated in Fig. 6.5. where the activities of the respective nuclides (relative to inventory salt) rre plotted logarithmically from sample to sample. Lines for each nuclide from sample to sample have been drawn. A mobile phtse such as we postulated, concentrated in the noUe metals, added in varyIM; amounts to a salt depleted in noble metals, should result in lines between samples sloping all in the same direction. Random behavior would not rest It. Thus the noble-metal fission products do exhibit a common behavior in salt, which can be associated with a common mobile phase.
The nature and amount cf the mobile phase are not established with certainty, but several possibilities exist, including (I) graphite particles. (2) tars from decomposed lubricating oil from the pump shaft.< 3) insoluble colloidal structural metal in the salt. (4) agglomerates of fission products on pump bowl surface and/or bubbles. (5) spalled fragments of fission product deposits on graphite or metal. As we shall later see. at least some of the material deposits on surfaces, and it -s also indicated that some is associated with the gas-liquid interface in the pump bowl.
References
1. R. B. Callaher. Operukm of the Sampler Enmher in the Molten Salt Reactor Experiment. ORNL-TM-3524 (October 1971).
2. R. C. Robertson. MSRE Design and Operation Report. Part I. Description of Reactor Design. ORNLTM-728 (January 1965).
3. R. E. Thoma. Chemical Aspects of MSRE Operation. ORNL-4658 (December 1971).
4. R B. Briggs and J. R. Tallackson. "Distribution of Noble-Metal Fission Products and Their Decay Heat." MSR Program Semkr.nu. Progr Rep. Feb. 28. 1969. ORNL-4396. pn. 62 64: also R. B. Briggs, "Estimate of the Afttrheat by Decay of Noble Metals in MSBR and Comparison with Data from the MSRE." internal ORNI memorandum. November i')f>x. (Internal docti-mci't no dissemination authorized.)
5 ."ce R P. Wichner. with C F. Baes. Side Stream Processing for Continuous Iodine and Xenon Removal from the MSBR Fuel." internal memorandum ORNI CF-72-6-12 (June 30. l ° /2) . (Internal document no further dissemination authorized.?
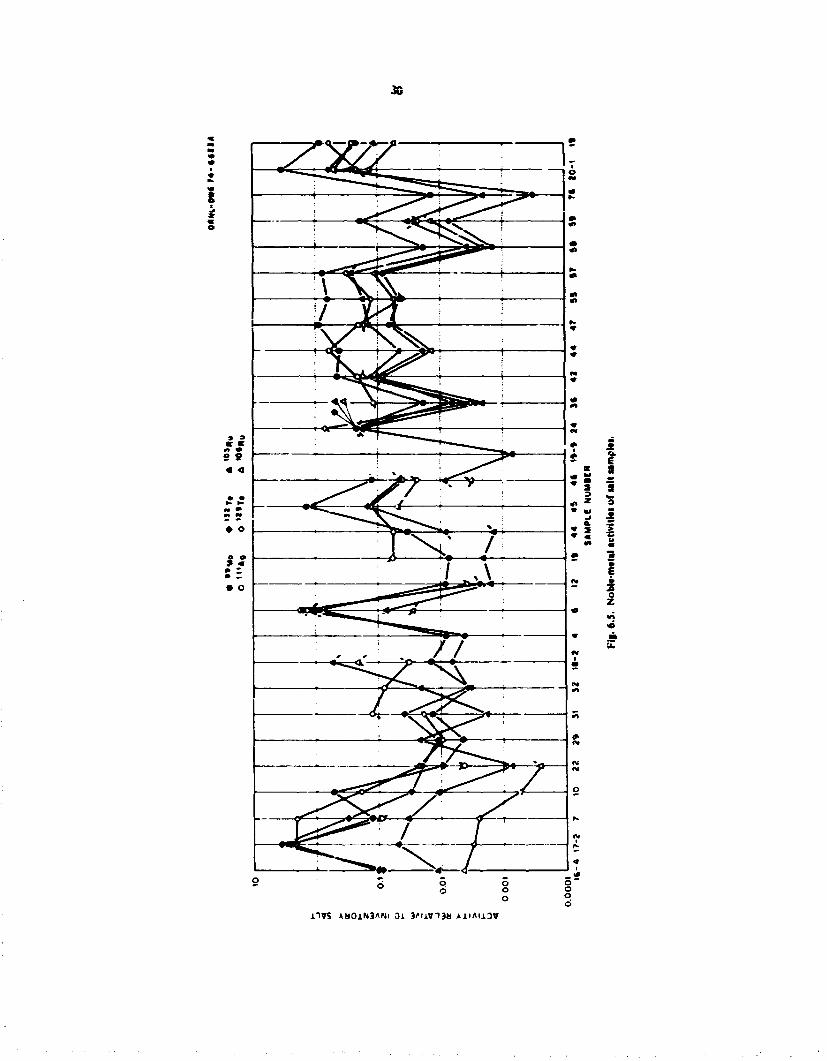
30
« 2
11VS AM01N3ANI 01 3/' l iWT3« AH/MA3W

31
t t - 7 . Data f a n
I k i m i T k t i t » * t a M « a l a t a i t a l | « f
Sr4» Sr-OI Sr4S Ife-MO CH37 2*95 Or-MI CM43 Cc-144 Mt-147 I M S » * * • K»M3 *»-MS ta-M* «*4
4-17 $-234* 1*72 IJEIO 0J92
I.IEII 041
94CM 0.74
24EI* 0 4 4
4-19 $-2544 2-2EI* • J *
IJEII 0 4 3
IJEII 0 4 9
I.4EII 0 4 $
7-7 4-2744 3JEI0 0 4 7
IJEII 0 4 3
9.7EI0 0 4 *
4-IEl* 0 9 2
IJEII 0.79
7-10 7 4 4 4 2.9EI0 0 4 7
:.3EI1 0.71
IJEII * S »
4.7EI0 0.9S
MEII 0 4 2
7-12 7-1344 44*10 0.73
IJEII 0.72
. JEII 0 4 9
3-1E* 44EI0 0 4 * 1.12
4JEI0 0.7*
I.9EI0 I J
*-s 10444 7J*** 3.7EIO 0 4 4
440ES 44EI0 0 4 0 0.9S
7JE10 0.77
14EI0 147
tt-12 12-2*44 I3JW I4E1* 0 4 0
IJEII 0.71
I4EII I J
S.4EI0 OJS
44EI0 0 4 4
MEIO 144
l » 2 * 1447 I5JM 4.7EI0 0.74
IJEII 0.72
94EI0 0J9
JJEIO 0.71
4.IEI0 0.41
9.7EI0 3J?
114 2-1347 I94W 44E10 0 4 4
IJEII 0.71
I4EII 0 4 9
9JEI0 149
9JE10 OJS
11-12 2-2147 20.4W 4JEI0 0 4 *
IJEII 0 4 *
IJEII 0.79
9JEI0 0.9*
I.IEII 0.90
11-22 3 4 4 7 7.9EI9 0.91
2.7EII? 14
I.IEII 149
IMS* 4-1747 294W •4EI0 0.77
I.7EII 049
34EI0? 0J3
ll-SI 4-2*47 3OJ0O MEIO 0 4 9
IJEII 1.1
14EII 0.94
1JEII 044
IJEII 047
I.IEII 0 4 4
4.4EI0 1.2
11-52 S-147 naso I.IEIO 0 4 9
2JEII I.I
IJEII 0.94
I4EII 0.94
7.7EI0 0.42
4.IEI0 149
11-54 S-S47 32400 IJEII 0.94
• 1 S T $ 4 4 7 32^50 I4EII 0 4 *
IJEII 141
IJEII 1.10
I.7EII 143
I4EII 2 4
4.2£I0 1.10
1 2 V 4-2047 324S0 •JEIO 0.74
IJEII 144
MEII 0 4 3
44EI0 1.04
12-27* 7-1747 34450 4.1 EIO 0.7S
I4EII 0.97
14-22 11-747 9JEII 9 4
IJEII 142
1.7E1I 0 4 4
F»
MEII 0.74
I4-20FV 11447 •JEIO 0 4 9
I4EII 0.99
IJEII IJA
1.7E1I 0 4 4
F»
MEII 0.74
I4-39FV I2-S47 MEIO 047
IJEII 0.77
IJEII 144
IJEII 0.77
I443FV 2-274* 9JEI0 047
MEII 1.14
• J E W 049
1JE11 1.12
1.9E1I 1.2
I4-44FV / 9.1 EIO 0.90
-9.IEI0 4S?
I.7EII 1.24
IJEII 0.94
9JEI0 1A
4.7EI* OJI
I4E* •412
4.9EI0 2J
3JEII I S
7.1E9 •JO
2JEU *.4
9JEI0 0 J 2
2.4*7 • 4 * 2
3JEI0 I J
I-IE.il 0-72
44E9 0 19
9.7EI0 3.4
2.4EII? 14.?
3JEI0 0-1/
7.IE9 0 1*
34EI0 1.3
2.1 54 0-J4
44EI0 2.4
1.4E? • 4 3 4
!JU£J 4 4 5 4
4-7E9 0.4P
34EI0 0 4 2 *
•4ES • 4 2 4
- 4 4 E 7 -4431
2-4EI0 • 4 4
44E10 OJS
4-IE* 0414
24E? • 4 1 *
I.IE9 0 4 3 0
3JEII 1.7
SJE9 0.11
I4E* 0 4 9
1.2EI0 0 J 7
2JEII? I J
S.3E9 0 4 9
-1.9E* -0.09
9.IEI0 0.93
3.E9 IJEt 047
94EI0 0 J 9
IJEII 043
MEIO 0.19
4 EI C.I4
44E9 0 4 4
7.2EIO 0.40
34E9 04S
- I J » 0 4 3
I.9E9 C42
•JEIO 0.44
•JEIO? 1.1
2.4E* 0.0*
3.IEI0 0.17
3JEI0 0.19
I4E9 0 4 2
7JE7 0.02
2.2EIO 0 J 2
3.2EIO 043
9JE9 0.12
34ES 0.11
•4EI0 0 4 0
4.9*9 0 4 9
3.9E* 0.12
I.9E10 0.34
1.2EII 040
S4E9 0.11
2.4E* 0 4 *
<IE* <040l
•JEIO 0.42
3.7E9 0 4 4
-2.7E* 047
44EI0 4.2E7 144 04004
2.2E9 0413
M E * 0.002
2.4E7 0404
4.3EI0 7 0ES OJS 040001
•JES 0.005
4.9E7 0401
<t.4E4 <0402
3.4E4 04003
3.2E* 0402
2JE7 04004
<3JE4 <0400f
- 2 J E 9 -0.02
3JE* 0404
<2.2E7 <04003
<14E7 <0403
wt$tn ajajr; cofraooajt lo oaj of AMI 7. 'Aftor i l iWii iof « 4 i o f » • ! — . • o 'rtrnfoHthi. *9rtmtpawm;cini*um}nom>totiwMl 'Urn aJ*MM of 3* 1 of 'Eat of ran 14.
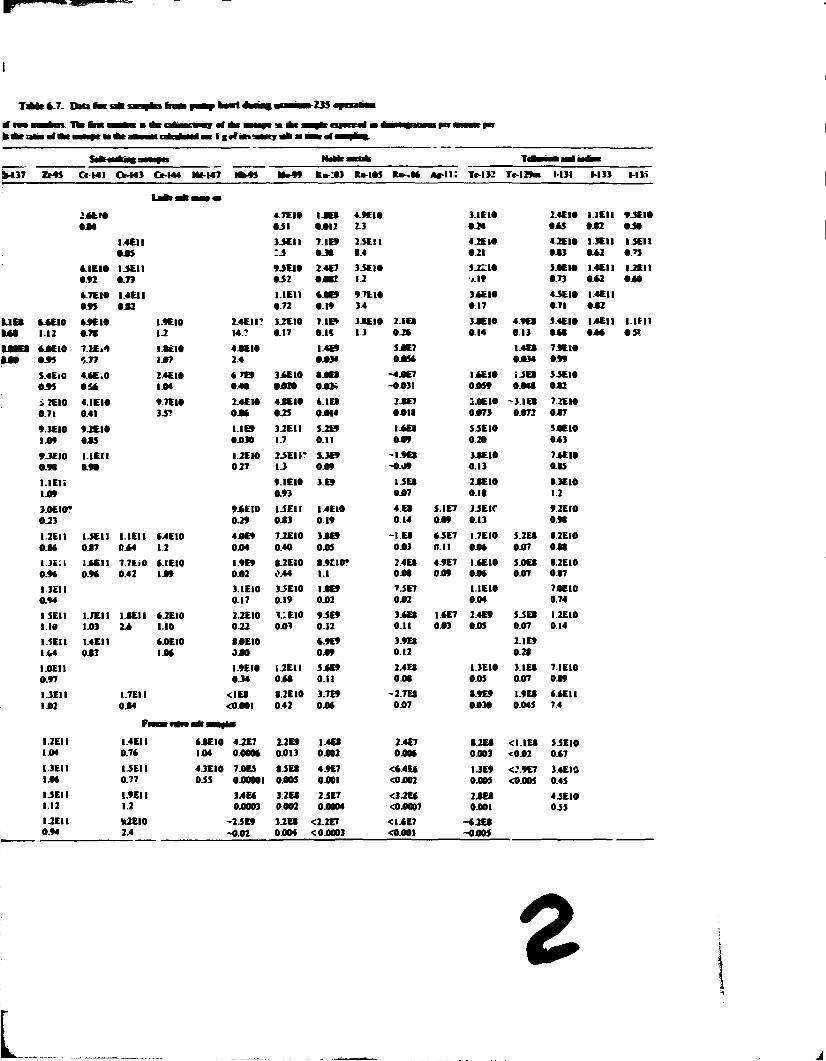
k-»7 ZrOS Ct-WI OM43 0-144 MM47 I M S H»49 R»-:03 Ra-I«3 fta-.« Ac-IK Te-132 Tc-I29a 1131 1-13 J 1-135
*4EI0 1.12 44EI0 •-93 S.4EiO 0-95
i 2 E I 0 •.71
9.3EI0 149
9-3E10 0.90 1.1 Eli 149 34EI0? 0.23
1.2EII 0.M 1.3E.1 0.94 I.3EII 0.94 I5EI1 1 10 1.5EU 144
14EII 0.97 1.3EII 1.02
I.2EII 144 I.3EII 1.0* I JEM 1.12 I.2EU 0.94
24t»» 0J4
I.4EII 0 4 5
4.1E10 1JE11 0.92 0.79 4 7EIO I.4EI1 0.9S 0 4 2 4.9EI0 0.7t 7.2E.1 «.77 4 4 E . 0 OS* 4.IEI0 0.41
9.2EI0 04S I.IEII 0.9O
I.9EI0 1-2 I K 1 0 147
2.4EI0 144
9.7EI0 3J?
IJEII 047
14E1I 0.9*
1.7EII 143 I.4EII 042
I.IEII 0 4 4 7.7EiO 0.42
I4E1I 2 4
I.7E11 0 4 4
1.4EI1 0.7C 1JEU 0.77
1.9EII 1.2 *2EI0 2.4
*.4EI0 1.2 4.IE10 149
*.2E10 1.10 «4EI0 14*
4.7E10 031
1 4 0 • 4 1 2
4.9EI* 2.3
31E10 0 2 4
2.4EI* 045
I.IEII 0 4 2
9JEW • J »
3JE11 :J
7 . I B •JO
2JE11 1.4
4JJU* • 2 1
4JEM • 4 3
1.3E11 0 4 2
IJEI1 •.7S
9JEI0 4 5 2
2.4E7 • 4 K
JJEIO 12
S-Z^IO A l t
54EM 0.73
I.4EII 0 4 2
I-2EII • 4 0
I.IEII 0.72
*4E9 • 19
97E1» 3.4
34E1« • 17
4JE1* • 7 1
1.4EII 0 4 2
2.4EII? 14.?
3-2E10 0.17
7.IE* • . I t
J4EIO 13
2 . IO •J*
34E10 0.14
4 . 9 a • 13
5.4EM • 4 1
I.4E1I 0 4 *
l . l f l l • J».
44E10 2-4
I-4E9 • 4 3 4
S4E7 0 4 M
1 . 4 0 • 4 3 4
7.9EW • 99
• 7 0 0.40
34EI0 0424
• 4 0 0 4 *
-44E7 -0431
I4EI0 04S9
i J O •4a
5JE10 042
24EI0 0 4 0
44EI0 OJS
* I E * • 4 1 4
24E7 0411
24EI0 0473
~ 3 . i a • 4 7 2
7 2E10 047
I.IE9 0430
3JE1I 1.7
S J 0 O i l
i 4 a 0 4 9
5JE10 0.20
54E10 043
I-2EI0 027
2 J E I P I J 9.1EI0 0.93
JJE9 0 4 9 3.E9
- i . 9 a -OJ9
u a 0 4 7
34E10 0.13 24EI0 0.10
74E10 0.15 •-JEI0 1.2
94EI0 0.29
1JE1I 0 4 3
I.4EI0 0.19
4.a 0.14
S.IE7 0 4 9
3JEIC 0.13
9.2EI0 0.90
44E9 0 4 4
7.2EI0 0.40
34E9 0 4 5
- i .a 0 4 3
*JE7 O i l
I.7EI0 0 4 *
5 . 2 a 047
I.IEIO 0 4 *
I.9E9 0 4 2
S.2EI0 0.44
O.OtlO? I.I
2 . 4 a 0 4 0
4.9E7 0 4 9
I4EI0 0 4 *
soa 0.07
S.2EI0 047
3.IEI0 0.17
3JEI0 0.19
I4E9 0 4 2
7JE7 0 4 2
I.IEIO 0 4 4
74EIC 0.74
2.2EI0 0.22
I.;EIO 0 4 3
9JE9 0.12
3 4 a 0.11
14E7 0 4 3
2.4E9 04S
5 J O 0.07
I.2EI0 0.14
•4EI0 0 4 0
«.9E9 0 4 9
3 . 9 a 0.12
2.IE9 0.20
I.9EI0 0.34
I.2E11 0 4 0
S4E9 0.11
2 . 4 a 0 4 0
I.3EI0 0.0S
3 . 1 a 047
7.IEI0 049
<IE« <040l
S.2EI0 0.42
3.7E9 0 4 *
- 2 . 7 a 0 4 7
I.9E9 0.030
1 .9a 0.045
«.*EII 7.4
* • • • * . «4EI0 4.2E7 144 0000*
2.2E9 0413
I.4EI 0402
2.4E7 040*
S.2U 0403
< i . i a <042
5JEI0 047
4.3E10 7.0ES OJS 040001
t J E t 0.005
4.9E7 0401
<*.4tt <0402
I.3E9 0405
•0.9E7 <040S
3.4EIO 0.45
3.4E* 04003
3.2E* 0002
2JE7 0.0004
<3.2E* <O40O7
24EI 0401
4JEI0 OJS
-2JE9 - 0 0 2
37.E* 0404
<2.2EI < 04003
<I4E7 <0403
-4.2E0 - 0 4 0 5
z

- ^<«*3a«eg£fc«!v§?<i;_
BLANK PAGE

<?
t*-»- Dan h i l t nB|Iii l — M g l f ^ W r t < • • • • ! • 231
T |- - l ! » IS-32S 15-42S 15 SIS I5-57S 1S-*9S I4-4+V5 T M ) I H f # l t 1 3329 (09115 515*84 5*95*3 320493 519*11 5*0914 Iter 10-124* 10-1548 10-29-U ll-*~*8 11-1148 ll-25-*S 12-1*4* Htfgmta fciiti 01 01 Oi l . l 0 1 0 1 I M n n c i . SCY 400 000 000 0 00 0.00 000 000 R f » USB 1100 I I W uao 1100 I I W nao F B — j l i U m l * •J 20 *sso **-» MOO *2J© MOO 42 30 O m l n n K . » 1 > 14 29 37 10 0 * 0 * OS V«fe.Y 000 0*0 000 000 C M 0 * 0 0«0 Fkm oic of fav. ia4 tan a a 3.30 Mr 3.30 He 3.30 He 3.30 Mr 3.301k 3.30 Hr J 30 He S - V f c t a c p . p t OB OB On
'SMS ns4aci
OB On OB OB
i*m*
SHI
U-233
U. Total
U
•c
Zr
1.222 7.86 7.50 0.151 0.974 0.929 44.35 1091 0.3S4 0.951 23 21 43 3 57.9 0378 0.941 0.8*7 41 3 109.1 104.9 0.357 0.949 0907
Sr-09 $2 00 5 4* I.32E9 59SE9 4 47E9 3.74E9 3.84E9 2.' 0190 0.93* 0J39 0.717 0171 1014
Sr-90 10 2*4 00 5S6 2.48E9 2 8*E9 3.63E9 0*09 0703 0 094
Y * l 58 80 5 57 4.44E9 1.23*
Ba-140 I2.SD 5 40 2-51E8 1.1*7
CVI37 10.95*00 < S t 5 53E9 3.42E9 3.3SE9 3.30E9 3.77E9 3.42E9 2.8IE9 1355 0840 0.823 0111 0 92* 0.142 0*92
Cc-144 28400 4*1 I43EI0 5ISEIO 5.4IEIO 5 I7EI0 5.4IEI0 4 4IE10 4.55EI0 0295 1.077 1.1*3 1.134 1.249 10*0 1.099
Zr-95 45 00 4.05 4.04E9 I 28EI0 IO7EI0 1 24EI0 I.02F.I0 l.4*E9 1.02EIO 0.279 0914 0JS4 1.135 0 911 0 935 1.382
Nb-95 3500 *05 * 39E9 I ©4EI0 7 12F9 17IE9 I.08EI0 2.02ES 5"8E9 0.740 1159 0 7 1 1 0.854 1.059 0020 0.537
Mo-99 279 4 »0 3.17E4 0 09*
K B - I 0 3 39*0 199 5.I3E7 I I5FJ 1.45E* 4.77E5 5.I2E* 8.75E* 0.025 0.000 0.001 0 000 0.004 0.OI2
Ra-10* 3*7 00 043 I.97E8 t*E5 4.65E* I.42E* 1.78E7 2.25E7 0034 0.000 0.001 0000 0.003 0.004
Sb-125 98*00 0 0 1 I.42E7 748E3 4.38ES I.ISM 2.14E5 4.64E3 7.42E5 0.143 0.000 0.004 0.000 0.002 0.000 0.007
Te-132 3 25 4 40 3.90E6 0.092
1131 105 290 I14ES I 129
653 0.977
7.82 7.85 0.9(9 0.973
108.8 0.942
6 1 ) 65.1 1.022 0.975 105 3 «?.3 0.910 0.75*

33
>**< S M M t r a i • t c r IS-2-NFVS IO-4-NFVS l * + N F V S • t - U - N F V I W * * * * I0-44-NFV IS-45- ICT 1 I 4 M V V • « M h n • » « • . < 3 * * S 1 H I M * « .7* I2 124*25 124*91 3 * 3 3 9 1 4 * 7 9 * M 9 7 * » D M * 4-1444 4-1 M l * 4-2349 5 -2 *9 S * 4 * 5- I9-*9 4-1•*» * - l « 9
Mw«n- 12.222* l2JJ»r» 13.7*54 15 .512* i t * * * * 19 .704* 2 * J * 9 * 2 0 J 0 9 * f b w . M r «*• S J * > • 4 0 1 * 0 S J M 4 5 * 0 * 0 • * * «#• M M I I * 11*0 1 00 I I S * 9 9 * 9 9 * 9 9 * r i « n i t T i ii i ( I JO * 3 i * • 3 J 0 S*-S* 5 * J 0 52 JO S * * 0 S * J 0 ( M M > I M . k > 7.4 4 ? 4.7 3 * • 9 0 * * * • * V « t v * •-*» • * • • J O • J * • 4 * 0 * 0 0 * 0 • * • R M > 3 B < ( p L # ! « H a i J J 0 H » I M i k J JO Mr 3J0«fc 3 J 0 « r 2-JOSV 2 * » A f 2 * 0 At S - ^ l . »r-» O B O B O B O B O B On O B OB
M - M r
ta« « f e r »
5 * * 9 5 2 * 0 5 4 * 7 34*10 7 * * E I 0 4 -24E I * 1 12111 7-SIE10 I * 9 E I I l * ! E I I 9 J 7 E I 0 • 771 0 7 0 0 C 4 * a 0 9 * * 0 * 2 1 * 7 5 t • 754 * . 7 2 *
Y-91 5 * * 0 SJ7 I .44EI I • ; ? * i * 1 J * E ! I 1 4 9 E H I 3 2 E 1 I I . 35E I I I -23EI I 1.7*2 I J M J 1 3 4 * I 3 * » 1 1*9 I . l l * 1 *17
• a - ' * * 12.10 5 40 I . 2 I E I I i 4 3 k i : i I 7 E I I 1 4 4 E I 1 1-S4E1! 14SE11 l * * E I I 0.917 1 100 0 * 1 3 1.143 1 * 0 * 1 * 5 * 1 * 3 9
c$-m 1055*00 *-» 4*04*4 4 . 3 » * * 3 E * J i j » 4 7 4 E 9 4 25E9 4 9*E9 4_5*E9 0 * 3 5 0 * 7 * t i l l • 7 1 * • 915 0 . 7 M 0 9 1 4 0 * 4 0
O I 4 1 3V00 7 * 9 1.29EM I . 12E I I I J . 9 E I I I . J t t l l I . 4 I E I I I 4 5 E I 1 1-52EII I J 9 E 1 I 0 . 9 M 0.713 0 7 i2 0 J 0 7 0 * 0 * 0.7*4 0 J I 3 0.747
Cr-144 2 * 4 * 0 4 4 ! 4 J S E I 0 • 3 *C I0 530E10 * * 2 E I 0 4 2SEI0 5 4 7 E I 0 4 21E10 7-S4EI0 1-222 1214 1034 1-227 1 * 9 * 0.937 1 * 1 * 1-234
nu-147 11 10 I N 7 2 9 E I 0 S J 2 E I 0 3 9 0 E I 0 2.3*E9 ( J 2 E I 0 5 * * E I 0 1.4C* 1 ISO 0 4 5 3 0 0 - ' . 1.19* 1 * 3 0
7t-9S 45 00 * * S •.SOCIO S.90E10 740E10 01EI1 1 13E11 I . I S E I I I 2 0 E I I I . I 3 E I ! 0 . 9 * * 0.99* 0.7*2 J-944 1 *99 0.952 0 5 5 2 0.904
N W S 35 00 *.0S 2 JEIO I . 2 3 C 0 9 * 9 E I 0 J.I7E5 1.I7E9 3.IOE9 3.33EIO 2 * 0 E 9 0 4 * 2 0.224 1-5*2 0 * M 0 0 1 * 0 * 3 * 0.374 0 * 2 2
l *>99 2.79 4 * 0 I.7SE9 9 * . • 1 3 I E I I I.30E9 1.I4E9 4.22E4 I J 0 E 1 I I .4SEI0 0 0 1 5 0 0 0 0 0 4 5 1 O J O M 0 0 0 0 0 0 3 5 1 3 * 4 O i l *
K B - 1 0 3 3 9 * 0 1.99 14 JEIO 2.97E9 7.13E7 9.30*7 isai 4.29ES 0.521 0.074 0 * 9 2 0.002 0 * 0 2 0 * 0 9
I U - 1 0 * 3 * 7 * 0 0.43 I.2SE9 0 2 JO 0 0 3 0
203E7 0 * 0 3
A * 111 7 J 0 0 0 2 7 * 2 E 7 t.33ES 4.99E7 4.03E7 l .7*E7 2 * * E 7 0 0 3 4 1.232 0 . 0 * * 0 0 * 0 0.12* 0 * 4 0
Sb-125 • M O O 0 0 1 . 4 I E 7 0.CM
IV 129m 34.00 0.33 I J 9 E I 0 i ( 2 t
J *2E7 0 0 0 4
4.40E* 0.051
2. I7E0 0 * 2 5
r e - l 3 2 3.25 4 4 0 7 . 2 4 U t.30E» 2.49EI1 3 3 * E t 9 . 2 7 U 1.74E10 4.99E9 >. . 7 0 * 0 4 I J O * 0 4 0 2 0.000 0.144 0.043
i n : S.05 2.90 7.33E* 2.49EI0 2 . I I E I 0 SMtlO ( 5 9 E I 0 2.7SEIO 3 4 2 E I 0 « .ME9 C.l. l l 0.352 2 2*0
S B X C M M
0 J 9 5 0.739 0.339 0 4 3 0 0 * * 2
CouMaciM
U-233 7 2S 7.11 * 233 • 72 7.19 •*» 7.10 0 ^ 0 .0*9 1 0 * 4 0.933 1005 1.07* 1.029 1 0 * 2 0.9*4
U-loUl 23.54 t i t • 9 3 * * .«7 * H i n «.7$ 2.917 0 7 * * 0.S59 0 * 5 1 0 M 2 1 100 0 * 3 0
U 1 1 * 4 107.5 44.34 9 1 5 * 110.7 103.2 10 *7 9 0 * I 0 0 « 0.931 0.557 0»SJ <l.95t 0 * 9 4 0.924 0.054
• c «S.97 * 5 I M .93 7 0 * (2 .5 4 4 0 70.0 0 . 9 M 0.97$ 0912 1.040 0.93* 0.950 1.057
2> 131.4 135.1 91.4 103.9 121.3 1 1 0 * 111-7 1 19* l i t * 0.790 0 1 9 1 I 109 0.951 0 9 * 5

34
S M V f c K I9-SJ-FVS W - 5 7 - W 5 19-S*FV5 19-59-FVS 19-74-FVS 3 M - F V S 2*M**TTS S M * 8 C M « *«.« 4 J W 3JS1S I 2 J D 9 •.«•*• IJ -477I I . M 4 S S478M D M * MH4-49 I 4 4 7 M M H 7 - 4 9 I4M74V9 W-J049 I I 2 4 4 9 12-5-49 » U l — n t i u i X M 1 1 2 7 . 1 4 3 * 27J774) 2 7 . 1 7 7 * 2 9 A 4 5 * 3 8 U 1 S * J I 5 2 7 * 2 W a t . M V «« • J O •Ml •M *«• I N scu « f * « l ! «4 1114 U t t 11*9 1174 1 I9» •2«* P m * h a r t • • •««.« 42 JO 43 J * 47 .4 * 45 20 45 * • 44 « • 43 5» O r f n m t M 2 4 1 7 9 * 3 9 S 4 4 4 5 * V a a K * e $ 3 4LS3 •Si • -53 • 5 3 • -53 • 5 3 F t o v w t W •*-**•• 3-3»*fc 3. JO He 3 3 » H r 3 J » H r 3 3 » H t 3 J * Mr 3 3 * He S - * i ~ Off Off Off Off Off Off Off
F«aaa
Off Off Off Off Off Off
1 — p . < * 9 «
4 S 2 E I * 4 9 I E I 0 4 75EIO 5 9 4 E I 0 * « 4 E 1 0 4 M E 10 Sr439 S 2 J M 5 4 * 4 S 2 E I * 4 9 I E I 0 4 75EIO 5 9 4 E I 0 * « 4 E 1 0 4 M E 10 4 7 9 C I 0
one • 747 0 7 3 * 0 * 4 5 • 731 • 425 0 5 3 2
V * l 5SJ0 5J7 • O K 10 934E10 9 J 7 E I 0 I J 9 E I I 7 ^ 7 E I « 9 4 2 E W S 4 S E I 0 0 9 9 4 112S 1145 2 2 2 9 0 7 4 * 1292 1017
• • -140 12 JO 5 4 0 1S4E1I 1 5 B E I I I . 49C I I I J 7 E I 1 1 7 I E I I 4 8 2 E I 0 • M E 10 t i l * 1097 1935 1 0 9 * 1043 1071 0 9 1 2
C v l 37 10.95*40 4 5 * 4 * I E 9 4 9 7 E 9 5 0 4 E 9 4 * 7 E 9 594E9 4 5 1 1 9 4 * 4 E 9 0 4 0 9 0 * 4 * 0 J 4 3 0 7 9 7 0 9 * 3 0 749 OT93
O - M I 3 3 0 3 7 0 9 I I I E I I I I 2 E I 1 105E11 I 0 2 E U I 3 2 E I I 4 1 I E 10 8 0 4 E I 0 0 9 0 2 O M 0 J I 4 0 7 9 1 0 * 4 4 0 * 7 3 0 * 9 3
Cr-144 2*4 00 4 4 1 4.7OEI0 65OEI0 4 5 5 E I O S.93EI0 4 S 2 E I 0 4 I 9 E I 0 6 0 3 E I 0 1214 I 145 1174 1043 1.154 1 128 1 0 5 *
M-147 I I 10 1 9 * 7 I 4 E 1 0 4 78EI0 7 52EIO 4 34E10 7 2 K I O 1341 1224 1340 1 141 1 170
Zt-95 45 OC 4.05 AJ IK IO • 4 2 E I 0 f J 3 E 1 0 1 . I I E I 0 7B 9E I 0 7 24E I0 7 4 4 E I 0 0 9 5 * 0 9 3 0 0.920 0 * 9 7 0 744 0.919 0 848
Nb-95 3 5 0 0 4.05 4 4 0 E 9 355E9 2.37E9 9.50E* 2 30E9 1 4 9 E I 0 4 34E9 0 0 9 2 0 0 5 0 0.034 0 0 1 3 0 0 3 0 0.1*4 0 0 5 4
»* *99 m 4.10 I.OWEIl 1 2 6 E U 3 1 IE9 2 9 S E I 0 2331:9 4 7 1 E I 0 ! I 4 E I ! 0 4 2 4 0 7 5 4 0 0 1 9 0 1 8 4 0 0 1 4 3 3 4 0 0 781
R B - 1 0 ) 3 9 * 0 l » 5S4E9 74»E9 1.25 E8 I . I1E9 7 9 * F 7 748E9 •50E9 0 1 0 0 0 2 7 9 0.004 0 0 3 ; 0 0 0 2 0 2 * 9 > 110
R u - I W 347.00 0 4 3 J24E8 40SE8 I 17E7 • 37E7 7 8118 290E8 0 0 5 8 0 107 O.0O2 0 0 1 5 0 140 0 051
A l t - I l l 7 5 0 0 0 2 294E7 0.041
507F7 0 4 7 8
1 1418 0 2 3 4
Tel 29m 34 00 0 . . . 7.24E8 1.76E9 I 3SE8 944ES 149E9 0 12* 0295 0 0 2 3 0.222 0 2 7 8
Te-132 3.25 4 4 0 6.40E9 1 22110 2 2 * E * 1 00E9 4.47F.7 6 4 0 E 9 2 54EIO 0.042 0.0*0 0 0 0 2 0 0 0 7 0.000 0 5 4 7 0 2 0 *
1 131 805 2.90 3 8 4 E I 0 4 J 8 E I 0 5.45EI0 1 29E10 3 85110 9.49E9 237i . lO 0 4 4 4 0.539 0 6 4 0 0.148 0.402 0 * 7 8 0 4 f ?
SMI Coajr t lwau* Coastttacaf U-233 7 6 0 7 14 4 * 4 6.48 7.28 7 13 6 * 7
i 137 1048 1023 0 9 9 9 1.089 1067 0 9 9 8 t ' f o u l *.** 7.41 5 7 * 5.94 4.38 7.44 7.32
0.841 0.9 IS 0.714 0 7 3 4 0 791 0 9 2 2 0.907
Li 12320 1 3 * 9 9 9 3 107 1 108 4 100.6 8 7 7 10.647 1.203 0 8 *0 0 9 2 7 0.939 0 * 7 1 0 759
Be 41.2 47.5 4 4 7 6 5 8 62.4 68 7 65.3 1011 1.010 0.969 0.985 0.934 1028 0.978
Z> 1335 160.5 127 7 131.0 75.8 110.7 170 5 I 154 1.3*7 1.104 1 132 0.655 0 957 1474
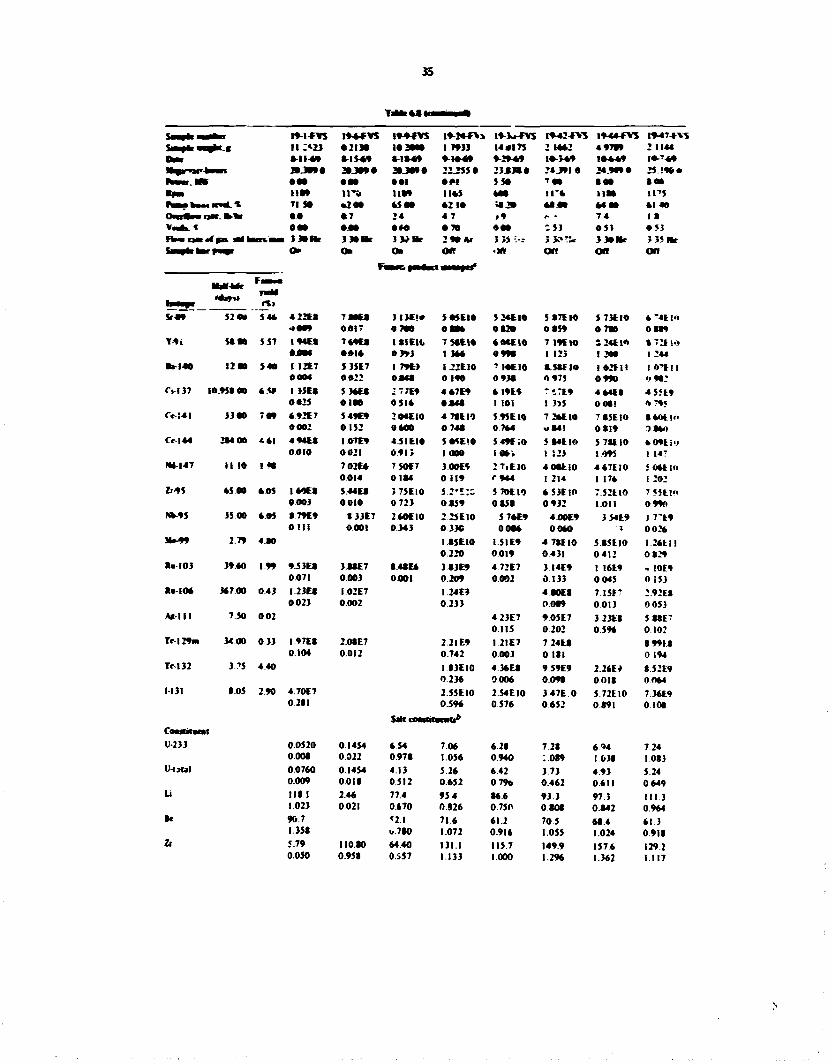
35
T*0t4*t
Tl J - I 9 - I - F W I 9 4 - F V S | 9 * E V S I 9 - J * * \ » 19-**-ffYS 19-42-ffVS i9-«*-nrc ; i 9 - * 7 - » \ i S a B f * r * ***** I I : * I J • 2 I M I 0 2 W 0 1 7933 14 #175 2 I « * 2 4 97*9 2 1144 D M * * - l l - * 9 • - 1 5 4 9 • I » - *9 9 - i * - * 9 9-29-49 i * - * « 9 ! 0 - * 4 9 l * -~«9 1mf» a » • » ! 2 0 J 0 9 0 2 0 J 9 9 0 2 O J 0 9 0 2 2 . U S 0 23J39 .0 2 4 J 9 1 0 34.949 • 2 S ! 9 » * N w u . M K • «• • «• • • 1 0 * 1 5 5 0 •>m • «• *•* « • • l i t * I P * 11*9 11*5 * M !!"» i l M ins h a a t a M » d . f 7 1 5 0 • 2 9 » * S * » • 2 19 5 * 2 » **•» * 4 M * I 4 0 Ovib* i j K . * k * r • • • 7 2.4 4 7 * 9 *• r 7 4 i * * A f 0 0 0 •m • *• • 7« ««• ; S 3 0 5 3 9 5 3 H n M • ( l a i a l m H i 3 39 Mr 3 M H r 3 * > M r 2 9 * A> 3 » ; . - : i J ? ! U 3 3 9 Mr 3 35 Mr S - * k t a r W o» O B Oa Off •w on on OH
H«f-Wr F _
o» O B Oa Off •w on on
I M * . •*r»» 5 4 * 4 22E* 7 M U 3 I 3 E 1 * 5 05EIO 5 24E I0 S » 7 E I 0 S73E10 V « 9 52 O* 5 4 * 4 22E* 7 M U 3 I 3 E 1 * 5 05EIO 5 24E I0 S » 7 E I 0 S73E10 * T 4 | I O
•»••» 0 * 1 7 0 7 W • at* 0 I 2 O o « 5 9 O7«0 O B t t Y 9 i M M SS7 I 9 4 E * T * 9 E * 1 S I E l i , 7 5 0 E I * * M E I 0 7 19EIO S24El<* » 721 u,
0 0 0 4 • * l * • J93 I 3 * * • 991 I 123 ! 20* 1244 •a-140 I 2 M 5 4 0 1 I2E7 5 35E7 1 7 9 » 1 22E10 ' I 0 E 1 0 t -SSf lO I 0 2 E U 1 0 1 1 1
0 0 0 4 0 0 2 2 0 * 4 * 0 190 0 9 3 * 0 975 0 9 9 0 ' • 9 « : CVI37 10.95*00 *«» I 3 S E * 53 *ES I 7 7 E 9 4 * 7 E 9 * I 9 E « * 1 T E 9 4 « 4 E * 4 5519
0C2S oiao 0 5 1 * out 1 101 I 3>5 0 0 * ! A795 C V M I 3300 7 0 9 * 9 2 E 7 549E9 2 04E I0 4 7»EI0 5 9SEIO 7 2*E10 7 «SE10 t * O t | M
0 0 0 2 0 152 0 * 0 0 0 74* 0 7 * 4 « * 4 ! 0 * 1 9 1Uft Cc 144 2*4 00 * * l 4 9 4 E * I 0 7 E 9 4 J I E I 0 5 O 5 E I 0 5 4 9 f . 0 5S4EIO 5 7*E10 * 0 9 E i u
0 0 1 0 0 0 2 1 0 9 1 3 1 0 9 0 I 0 * > ! !23 1095 1 147 !*J-I47 I I 10 !*• 7 0 2 E * 7 50E7 3 00E9 2 7 . E I 0 4 0 * t 10 4 * 7 1 1 0 S O U in
0 0 1 4 0 1(4 0 119 <-944 ! 214 1 I T * i 2 0 : Z»-9S *soo * 0 5 l * 0 E » S.44E* 375EIO s.2**:s 5 TOE 10 * 5 3 E l O 7S2E10 7 5 5 H O
• 003 0 0 1 0 0 723 0 * 5 9 0 1 5 1 0 932 1011 0 990 !»-9S 35 00 • 05 • 79E9 »33E7 2 * 0 E I 0 2 2 5 E I 0 5 7*E9 4D0E9 3S4E9 1 7*19
0 111 0 0 0 1 0 3 4 3 0 3 3 C 0 0 M 0 0 * 0 •? 0 0 2 * Mo49 2 7 9 4 1 0 1 I 5 E 1 0
0 2 2 0 I 5 1 E 9 0 0 1 9
4 7»EI0 0 4 3 1
5 * 5 1 1 0 0 4 1 2
1 2*111 0 * 2 9
R > I 0 3 3 9 * 0 199 9 53E* 3JSE7 I 4 » E * 3J3E9 4 7 2 E 7 3 I 4 E 9 1 l«E9 - I0E9 0 0 7 1 0.003 0 0 0 1 0.209 0 0 0 2 0 133 0045 0 i 5 3
• » 1 0 * 3*7 00 0 4 3 I 2 3 E * I 0 2 E 7 1 24E» 4 * 0 E * T15E? 2 9 2 E * 0 0 2 3 0 0 0 2 0 2 3 3 0.019 0 013 0053
A* I I I 7 5 0 0 0 2 4 2 3 E 7 0115
90SE7 0 2 0 2
3 2 3 E * 0 5 9 *
5 M E 7 0 102
Te-I29m 34 00 0 3 3 I 9 7 E * 2 .ME7 2 2 I E 9 1 2 IET 7 2 4 t » ( 9 9 M 0 1 0 4 0.012 0 7 4 2 0.003 0 1 * 1 0 194
T e l 32 3T5 4 4 0 I I 3 E I 0 0 2 3 *
4 3 6 E * 0 006
9 5 9 E 9 0 098
2 2 * E * 0 0 1 *
* 5 2 E 9 0O*4
l-l 31 SOS 2.90 4.70E7 2.55E10 2 5 4 E I 0 3 4TE 0 572E10 7 3 * E 9 0 2*1 0 .59* 0 5 7 * 0 * 5 2 0 * 9 1 0 1 0 *
S*M coaMMaciitt* C<MfMaC»t U-233 0.0520 0.1454 t .54 7 0 * 6 2 * 7 2 * * « 4 7.24
0.00* 0.022 0.97* 1 0 5 * 0.940 :o»9 1 0 3 * 1.0*3 U- i ju l 0.0760 0.1454 4.13 5 2 * 6 42 3 7 3 4 9 3 5 2 4
0.009 0 0 1 $ 0 512 0 652 0 7 9 » 0.4*2 0.611 0 6 4 9 Li l i t 1 2.4* 77.4 95 4 St.6 93.3 9 7 3 111 3
1.023 0.021 0.670 0 3 2 6 0.750 0 * 0 * 0 * 4 2 0964 Be 9 0 7 <2.l 71.6 61 2 70.5 6 * 4 61 3
1 358 (,.7*0 1 072 0.916 1.055 1.024 0 9 1 * It 5.79 110.80 64.40 131.1 115.7 149.9 157.6 129 2
0.050 0.95* 0.557 1.133 1.000 1.296 1.3*2 1 117
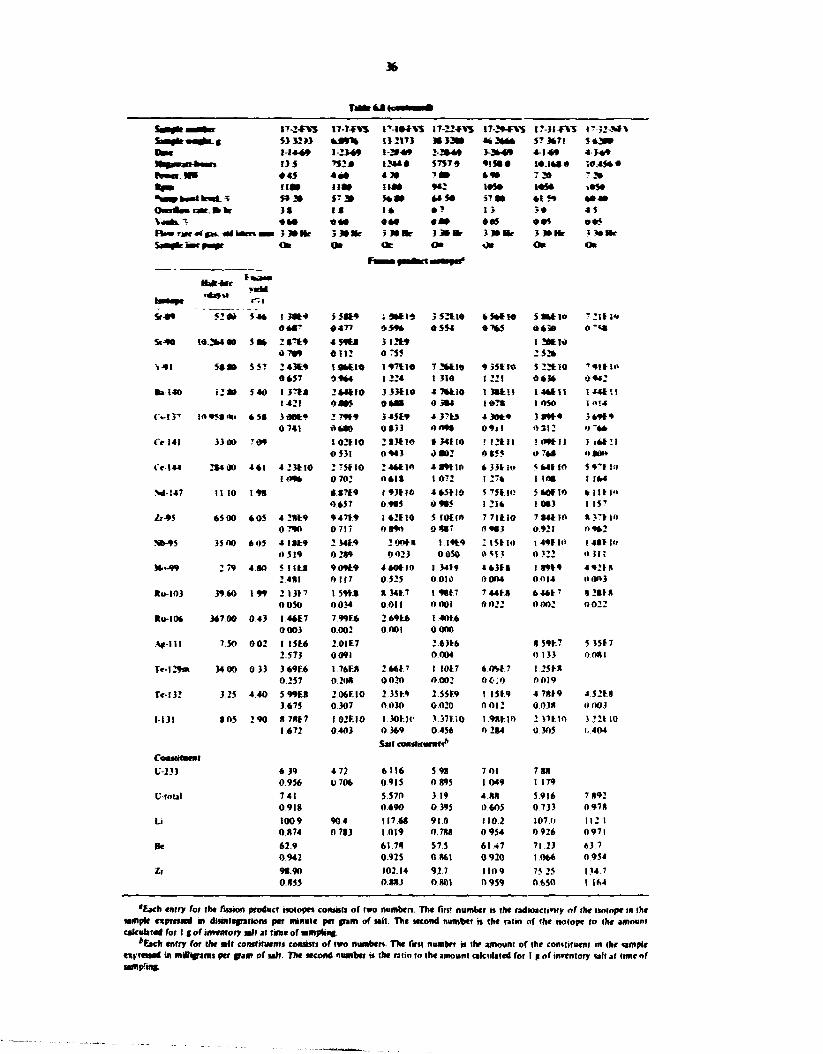
36
S — f * - I7 -2 - fV5 IT-7-FVS I ' - l e > * W J7-32-4VS I7-J9-FVS I7-3 I -4VS | 7 3 2 - » » 5baac4tv eJC*«-C 5 3 I 2 M 4«r* I J 2173 3* 3 3 * * 4 6 3 6 6 * $7J67 f 5 * 3 * * Case 1 1 4 4 * I - 2 M 9 I - 2 M 9 2 2 * 6 9 5-2*~«r» 4 - 1 4 * 4 3 4 *
13 5 7 5 2 * 1 2 4 4 * 5757 9 4!5*> • i * . i * * * ; < M 5 * • r W i f f • 45 4 a * 4 7 * • > • » 6 9 * 7 3 * - 2 * tcea I I I * l i t * ! I M 942 1*5* 1*5* . •$• S s a l i tsreet.^ 59 3 * $7 3 * 5 * 8 * 64 5 * 57 8 * 61 59 6 * 4 * OntWs n a e f t h 3 » 1 8 1 * • 7 I 3 3 * 4 5 v * * . - « N « 6 * « 6 9 • a * 0 * 5 0 * 5 • * 5 H » « r i K * t C * L sal kaen BBBI > 3 3 » H r 3 3 * Me 3 3 * Mr 3 j»Bk- 3 3 * Mr 3 3 * Hr • 3 * He S - p i r - «•«»» Ok 0 » O r O * Oe O B OK
Hasf-iste
Sr-*9 5 2 « * 5 4 * ! 3*+ 5 5 * 9 : 96419 3 5 2 4 1 * 6 5 * * ! * 5 * 6 4 1 0 7 214S«> o*«n • 4 " 0 5 9 * • 554 0T65 0 6 3 * 0 * * *
S t * * ! 0 J 6 4 « * 5 * 6 2 » - t 9 0 7 * 9
4 S 4 * 8 0 1 1 2
3 1244 0TS5
1 3 * 4 1 4 2 5 2 *
1-41 5 * 8 * 5 57 2 43C4 106410 1 9 7 4 1 * 7 2*419 9 35410 5 224 80 ' 9 1 4 I " 06S7 9 9 6 4 1224 1 310 1221 0 636 0 9 4 2
b l W • 2 * 0 5 4 * 1 3 7 4 * 264110 3 33410 4 76410 1 3 * 4 ! 1 1 *6411 I 4 4 4 I I 1421 0 * 0 5 0 6 8 * 0 3 * 4 1 0 7 * | 0 5 « I ft!4
c*-i?~ 1 0 * 5 8 '*.• 6 58 3d0E« 2 7*49 3 4549 4 J74S 4 3 * * * 3 8 *49 5 6949 0 741 0 6 8 0 0 833 »«»** 0 9 > l 0 312 • l r 6 *
O I 4 I 3 J i » :o* 1 02110 2 83410 8 34110 ! ! 2 4 l l ' (19411 I i 6 4 ! l 0 5 3 1 0 943 0 8 0 2 0 855 » ? 6 * •»St*»
l'r-144 2*4 00 4 6 1 4 23110 2 75410 246410 4 * 9 4 1 0 6 334 Iv 5 64410 5 9 ' 4 !•'» ! « 9 6 0 702 0 6 1 8 1072 I 276 1 10* 1 164
N4-147 11 10 I N 8 8 7 4 9 1 93410 4 65410 5 75410 5 60410 6 I I 4 M 0 6 5 7 0 9 8 5 0 9*5 1216 1 0 * 3 I 15*
jEr-95 65 00 6 05 4 2849 9 4 7 4 9 162410 5 104(0 7 7 l 4 i 0 7 84410 8 3*410 0 7 * 1 0717 0 890 0 887 0 9 *3 0 921 0 962
M»V95 35 no 6 05 4 l i t * 2 3449 2 0O48 1 1949 I 15410 1 494 H» 1 484 1 " 0 519 0 2*9 0 023 0050 ft 513 0 J22 0 3 i ;
*> -99 279 4SO 5 1148 9 0 9 4 9 4 60410 1 3449 4 6348 1 8949 4 924 8 2 4 * 1 0 1 1 7 0 5 2 5 0 010 (torn 0 0 1 4 0 0»3
Ku-103 3 * 6 0 l » 2 1347 1 594* 8 3447 19817 7 4448 6 4 6 4 7 8 2848 0 050 0 034 0 011 OOOI 0 022 0 002 0 0 2 2
Ru-10* 36700 0 4 3 14647 0 0 0 3
7 9 9 4 6 0002
2 6946 oooi
1 4046 0 0 0 0
A c - I l l 7 5 0 0 0 2 1 1516 2 0 IE7 2 6346 8 5947 5 3547 2.573 0091 0 0 0 4 0 133 0 0 8 1
T e l 29m 34 00 0 33 3 6916 1 76F8 2 664/" 1 1047 6.0*47 ! 2548 0 2 5 7 O i l * 0 0 2 0 0 0 0 2 oc:o 0 0 ) 9
T e l 32 325 4 4 0 5 9948 2 06410 23549 25549 1 1549 4 7849 4 5 2 4 $ 3 * 7 5 0307 0 0 3 0 0 0 2 0 0 0 1 2 0 0 5 8 0 003
1 1)1 $ 0 5 2 90 8 7 8 4 7 102410 1 3041f J 374 iO 1 984.10 2 37410 3 22410 1672 0403 0 369
Sat constrti 0456
•ems* 0 284 0305 1.404
Constituent
L-233 6 39 4 7 2 6 1 1 6 5 98 7 0 1 788 0.956 U706 0 915 0895 1 049 1 179
C Total 7 41 5570 3 1 9 4 88 5916 7 892 0 9 1 8 0.690 0 395 0.605 0 7 3 3 0 9 7 8
Li 1009 9 0 4 117 68 9 1 0 110 2 107 0 112 1 0.874 0783 1019 0 788 0 9 5 4 0 9 2 6 0 9 7 |
Be 62.9 61 78 575 6 1 4 7 71 23 6 3 7 0 9 4 2 0.925 0861 0 9 2 0 1066 0 9 5 4
Z» 98.90 102.14 927 110.9 75 25 134.7 0.855 0.883 0801 0 9 5 9 0 6 5 0 1 1 M
'Etch eniry for (he fusion product isotopes consists of (wo numbers. The fin! number is the radioactivity of the isotope in (he simple expressed in disintegrations per minute per cram of salt. The second number is the ratio of the isotope (o ihe amouni calculated for I f of inventory sail at time of samptinc.
*Each entry for the salt constituents consists of two numbers. The first number is Ihe amouni of the constituent in (he sample exv tessed in milligrams per (ram of salt. The second number is the ratio to the amouni calculated for 1 1 of inventory salt at (ime of sampling.
37
7. SURJACEDEPOSmONOFFISSMNPItOOlJCTSIYnBtfKirLEXrasUltE
7 1 Cable
I? »i> evident from the earnest maple* taken "rum The MSRt pump bowl tha» certam fostoe product elements. notjWv the noMe metah. wer* concentrated on wiix-ft exposed to the ga* w-tli«n die mm shield, and pussibiy ah» !he bqutd below The first such tests looked at segment* of ihe latch cable f«H .jpsile u n p i n . or of cods of s u e of vanou* metals iHa>*dl«»% N. standes* steel, and id.vrl Data from such test* extending o-rer the period of : " t," operation are shown rn TaMe T. ? at (he ead of' dit> chapter deft, bawd and gas exposures were obtained In order to facilitate comparisons, it n desrabie whe.e possible to express the deposition m ;erms of acimty per unit area However, the determined values were almost always m renns of the tufai tamp',- Therfbs approprure areas for am individual sample * : : * used as given in the tabulations These were obtained by cakuiathtti front measurement when possible or by esiirm:; i marked ~ l where necessary.
It was soon evident that the values for salt-seeking isotopes (least*, daughters of noble-gas nuclides, and the so-called noble metals (greatestI fell into distinctly different categories. The basis of comparison lor these numbers depends on the average time between production of the nuclide element by fission and deposition on the surface. The activities of elements having the same behavior should be proportional for brief holdup limes to fission rate yield and decay constant and for long holdup times to yield and to the powe•-averaged saturation factor, becoming independent of decay constant and approaching proportionality to inventory. The ratios of activities of two isotopes of certain elements (cerium, ruthenium, tellurium) appear to reflect appreciable holdup, and so the values giv<-R in the tables in this section are compared with inventory salt values, the units "equivalent milligrams of inventory salt per square centimeter' being used to indicate a convenient order of magnitude.
7.2 Capsule Surfaces
During the J 3 J U operation a variety of capsules were dipped into the pump bowl for purposes other than removing salt samples. The capsules and attached materials were dissolved, and radiochemical analyses were ODUIH..:* As these constituted a type of dipped sample, the values obtained and ratios to inventory are
shown m TaMe ~ 4 at the end of this chapter .Again. salt-seek-Kg nac'.des lorn a lowest group, nuclides with noble-gas pre.jiv>rs a somearfiai higher group, and the noMe-metal ffJup the h-ghest. by about two or more orders of Magnitude Syufkaatly greater amounts of noble metals were found when the capsule snvotved a reduciant iberyBnam. zirconium, chromumi than when die added material was oxtdi/mg »F*F : i or not reducing I ntcfcd. copper;
After the mtroducMon of the doubk wailed sampW capsule (abjui the end oi run P i . the ex tenor capsule of both gas and salt samples became avadabie f«r dissolution and radiochemical analysis. Data from the-.* sources are presented m Tables 7 5 and ~.fc lend of chapteri as disintegrations per minute per squat-* ceninneier and equivalent mdhgrams ot inventory salt pet square centimeter. Agam. the values generdly are lowest for salt-seeking nuclides, higher for nuclides wuh noble-gas precursors, and ordWs of magnitude higher for the noble metaiv
It is of particular interest to note the values found when the system was at low or zeio power. Since mostly (except for nuclides with noble-fas precursors) the values did not go down much, it would appear that 'he holdup period (in particular for noble metals* appreciably exceeded the period of low or zero power preceding the sample.
7 J Exposure Experiments
Five experiments were conducted .n which both graphite and metal speciments were exposed for varied periods of time below the surface of the salt. Data from the first of these experiments are shown in Table T. i. These dzta are of interest because they permit comparison of deposition rates on metal and graphite, and between liquid and gas phases. In addition, some protection against contamination during passage, by contact with substarces deposited in th.- sample transfer tube, was inherent in the design of tre capsule cage.
The first experiment. 11-50. used thr»e graphite specimens and one Hastelioy N specimen >i\a by end caps to be out of contact with the transfer tube at all times (Fig. 7.1). Two of these assemblies w;re contained in a perforated nickel container or capsule which was lowered into the pump bow'. Contamination from the areas above ihe pump bowl during removal, etc.. though not likely, was no! p"jlijd<d. however.

Tabic 7.1. Dili for jfraphito and rmrlal ijxiimtnn immifMtl In pump Huwl
h»i 11 SOc\|>u»uil »n April 26, |V*7, Im M hi at a rtM»' n |H»W»I ul NMW
IX-|>o«ilion (vqutt JICIII milliniaiiiMil invvniury vill* |i«r u|u»r« «VMIOMVI«I «l M-•MIIHMI «MlUt«>
Material M>a« Area urn') l'-2.<S S.-KV Ha-No ( V - M . I /.fin M f » 5 M w W Kiel IK M H I U * IvI.W i n i
I V I B * U Liquid O.lW J.l 2.1 HUM I I i n l l ft HO V IV.B»22 Liquid 0.0.1 0.5 0.04 11.Ill I I 16} IN 14 VII 7 Pyrolylic Liquid 0.0.1 4"> 1.1 OIK. 111 641 117 HI M<> I I
Ibsiclloy N Liquid 0.04 0.6" 11 l.» i l l II.OH 27 III 4 1 510 JV
Wire Liquid -1 1.2 «l "I Ml 45 1.1 5uo'i MO
Wire Interlace - 1 7 12 7UIMI INU VII I f Ml 4 nun CI;B«6I Has 0.10 l<» 2.1 n III 1.4 12 4 7 16 M l 10
COB»92 (las 0.03 0.7 110.1 2.5 mi 7 6 5.4 160 5 Pyrolytic Has 0 0 2 2.4 2.1 II O.I >0 I lk 111.7 7 1 100 5
Hastelloy N Cws 0.2 3D 2.1 u 2<» 1 u 105 JUKI 67
Wire tiai ~ l 24 r.fc 55 11411(1 imi
Inventory fui Igttf tail
Value lor U-2.15 in iiikionuim pel KMIII ••! sail; .aluc» lor Union |ii.aln.i< IM ilitiiilu«r,ilMinv wi mmultf |tvl IIMHI ul «all
14.250 1.161 II 1.Villi 1*7111 I . U I I I tt.fallii I III U 711 III H i l l M u l l l V J | |u 2 7 V I I I
K

19
' - - : - v . • „
: * ' .a i * - . -«
Fif. 7.1. Specimen Nobler desped to prevenl conummiicn by contact »ith transfer lube.
For the specimens, we note that generally the differences between metal and graphite and between liquid and gai exposure arc not great. It docs appear that the , 3 : T c activity was significantly higher on metal than on graphite. We again find the general patterns previously observed, with salt-seeking elements lowest, noble-gas daughter nuclides h'^ier. and appreciably higher levels of noble metals.
Clearly, the wire to which the capsule was ati.'ched received considerably more activity than the sptcimtis. This increased activity on the wire might be a result c: easier contamination or easier access to its surface while in the pump bowl. ;han to the specimens which were within a perforated container.
Data for four subsequent experiments. 18-26. 19-66. l°-67. and l°-6S. which were '.iquid-phase exposures for various periods conducted during the operation with 2 J , L ' . are shown in Table 7.2. In order to avoid contamination problems and problems of contact with the gas in the pump bowl, the specimens were contained in a windowed capsule, below a bulb which would float in salt, and thereby open the windows, but when above the salt would drop to close off the windows. This device is shown in Fig. 7.2.
Data for the various exposures are shown as milligrams of inventory salt equivalent to the activity deposited on one square centimeter. Data for isotope pairs( • 0 3 . 1 0 6 Ri\ 131.1 29m Te) appear more consistent
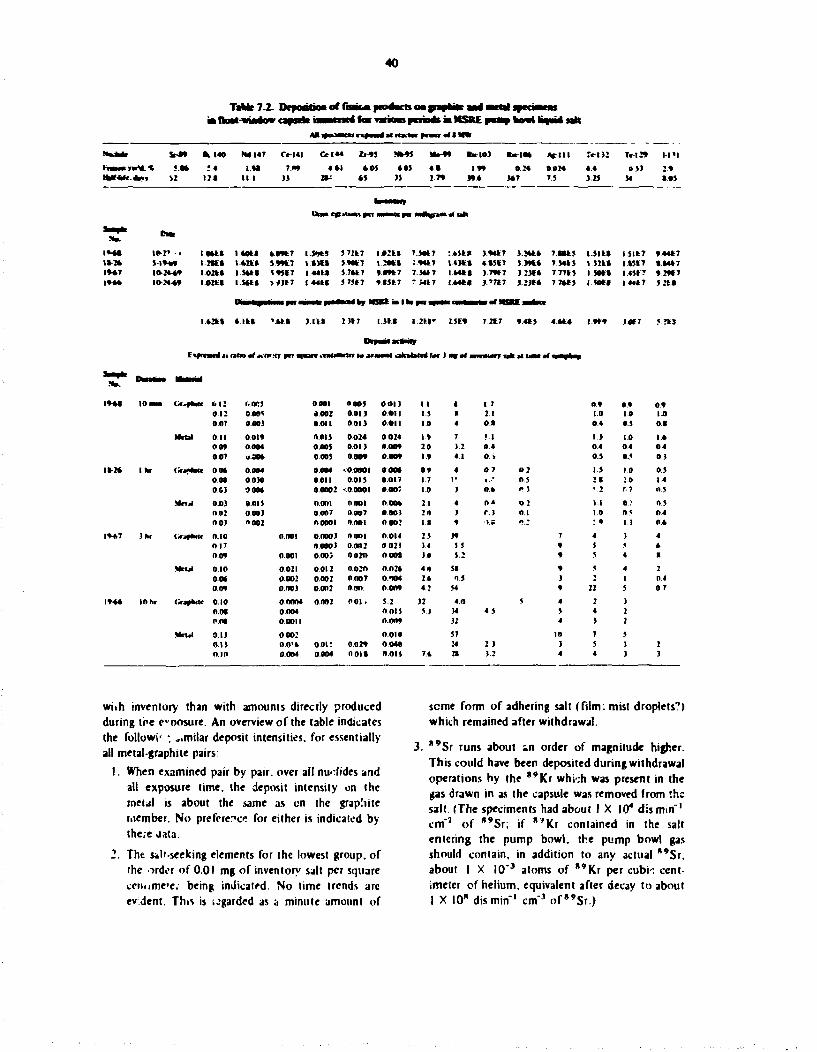
40
Tat*e7.2. > Hot tjimlaw
of fat
fat various p a M i « MSKE howl hoo** soft
M * St-t» I t 140 NO 147 C4- I4I Of l « 4 «v*s N M S !*•-»* • B - I O I B.B-104 JITIII r«-n» T . - I 2 *
K H M m * . * «.*» ;* I H 7J>* 4 * 1 4 - 0 ) 4 0 * 4 * I * » O H » « 2 4 4 4 0 ) } •fc*-Mc.4««< i i 12 • I I I 1 1 2»V 45 J5 I T * J » 4 1*7 7.J I .2J M
UttMk Cp*t»Mt» *«T 1 cpcs w v k g n a t t f u l t
2 * 1 0 5
l**« IP-r < l-OWt 14041 40*47 I.54CS 5 7247 I O i l ! 7 ) 0 4 7 l.*it* ) W ) 3 2*44 7.M45 I J i l t 1.511:7 ».44t7 l*-7* V l H t l -ZKt I * K » S.**tt 1-1X1 5*4*7 I.20M ;.»*47 I «J*» 4»$ t> J m i 7.I44J I l i t * I »51T » l * 4 7 I M ) 10-244* 10241 11441 * * U 7 1*44.1 5.744.7 *J*t.T 7 ) 4 4 7 I-ME I ).7»47 J 2 K 4 7.7745 I S * * * 1.451:7 • 2»*7 1*4* 10-24-4* i o n * 15444 >*)47 I 4441 5 7517 » I J * 7 ' rUT 1444* ) ' 7 4 7 ) 2 ) 4 * 7 74*5 I 504* 144*7 5 « »
4" «frc«ev j t rafp» mi j t w tfr l * r • • « I d M M d f f r ] i B y W w w l i T . n i l at M B <f
1*4*
14-24
<*»< f4lHI 0 12 r.oes 0.12 0.005 0.07 0 0 0 )
MRa( 0.11 0 0 1 * 0 0 * 0.004 0.07 v.304
(ifJB4MC 0 0 4 0.004 O N 0 0 ) 0 0.C3 0 0 0 4
Jfclj l 0 03 0.01 S 0 0 2 0.00) 0 0 } " 0 0 2
(rfjpnrtc 0.10 0 1 7 0 0 *
M r u l
if! («ra«4Ktc 0.10
0 .0* 0.0»
M r b l 0.1} on 0 1 0
0.001 » 0 0 ) 0 0 1 ) 1 1 1 1 7 0 * 0 * 0 * 0 0 0 2 0 . 0 1 ) 0 O I I I.S I 2 1 1.0 1.0 l i t 0 0 1 1 0 0 1 ) 0 .011 in 4 0 * 0 .4 0.5 0 1
0 015 0 0 2 4 0 0 2 4 I * 7 ! . l I . I 1 0 1.4 0 . 0 0 ) 0 . 0 1 ) ooo* 2 0 3 2 0 4 0 .4 0.4 0 4 0 005 0 0 0 * 0 . 0 0 * 1 * 4 1 0 > 0 . ) 0.5 0 )
0 0 0 4 <0.00OI 0 . 0 0 4 0 * 4 0 7 o2 1 5 1.0 0 . ) 0 0 1 1 0 0 1 ) 0.OI7 1.7 I ' • " 0 ) 2 1 :o 1 4 0 . 0 0 0 2 • 0 0 O O I 0 .007 1 0 ) 0 .4 <»3 » 2 r. 7 0.S
o.ooi o.ooi 0 . 0 0 4 2 1 4 0 4 0 2 1.1 a: OS 0 0 0 7 0 0 O 7 0 0 0 ) 2 0 ) r.) 0 1 1 0 0.5 0.4 0 0 0 0 1 noni 0 0 0 2 I I * IK *7 1 : « 1 3 0 4
0 .001 0 . 0 0 0 ) ooni 0 . 0 1 4 2 5 )» 7 4 ) 4 0 0 0 0 ) 0.0O2 0 0 2 ) 3 4 5 5 » 5 5 4
0 001 0 0 0 ) 0 0 2 O 0 0 0 * J.0 5.2 » 5 4 I
0.021 0 .012 0 0 2 0 0 . 0 2 4 4 0 51 » 5 4 2 0 . 0 0 2 0 .002 0.OO7 0.H04 2 4 0 ) ) 2 1 0 4 0 0 0 ) 0 .002 ooo 0 . 0 0 * 4 2 54 » 22 5 0 7
0 0 0 0 4 0 .002 0 0 1 . 5 2 32 4 . 0 5 4 2 ) 0 .004 0 015 5 3 34 4 5 5 4 2
0 0 0 1 1 0 . 0 0 * 32 4 } 2
0 . 0 0 2 0 0 1 0 37 10 7 5 0 . 0 ' 4 ooi: 0 . 0 1 * 0 . 0 4 0 24 2 ) ) 5 ) 2 0 004 0 0 0 4 0 0 1 * 0 0 1 4 7 4 21 I . I 4 4 ) )
wiih inventory than with amounts directly produced during ire foosure. An overview of the table indicates the followi' -, „.mtlar deposit intensities, for essentially all metal-graphite pairs:
1. When examined pair by pair, over all nuclides and all exposure time, the deposit intensity on the meul is about the same as on the grapliite member. No preference for either is indicated by the;e data.
2. The sJr-seeking elements for the lowest group, of the order of 0.01 mg of inventory salt per square cehume'e.' being indicated. No time trends arc ev dent. This is i-'gardcd as a minute amount of
seme form of adhering salt (film: mist droplets?) which remained after withdrawal.
* 9 Sr runs about in order of magnitude higher. This could have been deposited during withdrawal operations by the **Kr whkh was present in the gas drawn in as the capsule was removed from the salt. (The speciments had about I X 10* dismm"' cm"2 of *'Sr; if *'Kr contained in the salt entering the pump bowl, the pump bowl gas should contain, in addition to any actual "Sr . about I X I0"3 atoms of *'Kr per cubh centimeter of helium, equivalent after decay to about I X 10" dismin"' cm"1 of 8*Sr.)

41
PHOTO 97IS7
0 0.25 0.50 I I I L__l
INCHES
Fig. 7.2. Simple holder for short-term deposition lew (fits into outer capsule with windows).
4. Tht noble metals run appreciably higher - two orders of magnitude or so - than the other elements.
Salt samples taken at about the same times were generally relatively depleted in wbie metals, though they contained amounts which appeared to vary similarly from sample to sampie. Thjs it appears that the surfaces were capable of preferentially removing some noble-metal-bearing material borne by the salt moving through the sample shield.
5. The noble metals increased somewhat with time, but considerably less than proportionately, as if an initial rapid uptake were followed by a much slower rise.
Most importantly, the increase in activity level with time implies that the activity came from salt exposure rather than any explanation related to passage through the pump bowl gas. coupled with the further assumption that the window improperly and inexplicably was open.
6. As mentioned earlier, the activity ratios on the inventory basis are about equal for the ' ° 3 •' °*Ru and , 3 I - , 1 » m T e isotope pairs. But the longer-livec isotope is generally somewhat lower. This is consistent with the deposition of material which has been held up in the system for periods that are appreciable but not as long as the inventory accumulation period.
Tlius "or noble metals the data of Table 7.2 imply the accumulation from salt of colloidal noble-metal material, which has been in the system for an appreciable period but is carried by the salt in amounts below inventory, but with the surface retaining much more (in proportion to inventory) of the noble-metal nuclides than it does the salt-seeking nuclides. For the periods of exposure used, deposit intensities of yven nuclides on metal and graphite did not appear to differ appreciably.
7/, Mbt
One factor to be considered in the interpretation of pump bowl sample data is the presence of mist in the gas space1 within the mist shield in the pump bowl. Tnere is much evdence for this, none clearer than Fig. 7.3. which is a photograph of a '/j-in. strip of stainless steel (holding electron m.croscope sample screens) that was exposed in the sampler cage for 12 hr. The lower end of the 4-in. strip was at the salt surface.
Clearly, the photograph shows that larger droplets accumulated ..I lower levels, doubtless as * consequence

42
?M0TO !<•»»- »4
SALT SURFACE
F*. 7.3. Salt droplets o* a metal strip exposed in MSRE pump bowl p s space for 10 hr.
of a greater mist density nearer the bottom of the gas space, at least the larger drops representing the accumulation of numerous mist particles.
The mist mus; have betn generated in one of two ways. The ftrst is outside the sampler shield by the vigorous spray into the pump b"wl liquid, which also generated spray by the rising of large and small entrained bubbles. This would be followed by drifting
of some of tins spray mist around the spiral l/8-ir.-wide aperture of the shield.
Th second way in which mist could develop within the simpler shield is by the rise cf entrained bubbles too fite to resist the undertow of tne pump bowl liquid. 4s salt en!<v*d the bottorr of the sampier Jiieid. these bubbles would rise within the more quiescent liquiJ and would generate a fine mist is they broke the surface. In particular.2 the liquid rushing lo fill the bubble space would create a "jet" droplet (as well as corona droplets) which micht be impelled to a considerable height - in the case vf charrpogne tickling the nose several inches away.
The jet droplets can accumul'.'.. or concentrate surface contaminants1'4 on the droplet surface, being referred to as a surface microtome by Maclntyic. Jet droplets are likely to be about 10% of bubble diameter, thereby a few tens of microns in diameter. It is not certain how much of the mist within the sampier shield was produced from outside and how much from within: however, at least some of the mist must have been produced within the shield, and this explanation appears sufficient to account for the phenomena observed.
Kohn2 shows that fine graphite dust was carried from the surface of molten LiF-BeFj (66-34 mole %) by jet droplets, with the implication that nonwetted colloidal material on the fuel surface could similarly become gas-bome-
Thus a plausible mechanism for the ransport of noble-metal fission products by mists coulJ involve the transport of unwetted colloidal material in the salt. This could be transported to the surface of the liquid within the sampler shield, by ruing bubbles, and should accumulate there to some extent if surface outflow around the spiral was impeded. A jet droplet would concentrate this material significantly on its surface, and any receiver in the gas phase would indicate such concentration. Because most droplets most of the time would settle back into the surface, the accumulation of noble-metal-bearing colloidal material on the surface would not strongly be altered by this, and accumulator would continue until by various mechanism; inflow a>id outflow quantities became balanced.
References
I. J. R. tugel.P. N. Hauben.eich. and A.Houtzeel. Spray. Mitt. Bubbles, and Foam in the Molten Salt
43
Kecctor Fxperiment. ORNL-TM-3027. p. 10 (June 1970).
2. H. W. Kohn. Bubbles. Drops, and Enminment in Molten SmltyOfQiL-TMUli (December »968)
3. D. C. Blanchard. in Piv*ress in Jcetnognphy. vol. I. ed. M- Sears. Pergamon h-ess. Inc.. New York.
1963. p. 71; "Sea-to-Air Transport of Surface-Active Material." Srienrr 144.396-97 (1964).
4. Ferren Maclntyre. "Bubbles: A Boundary-Layer 'Microtome' for Micron-Thick Samples of a Liquid Surface." / Fhrs. Chem. 72.589 -92 (1968).
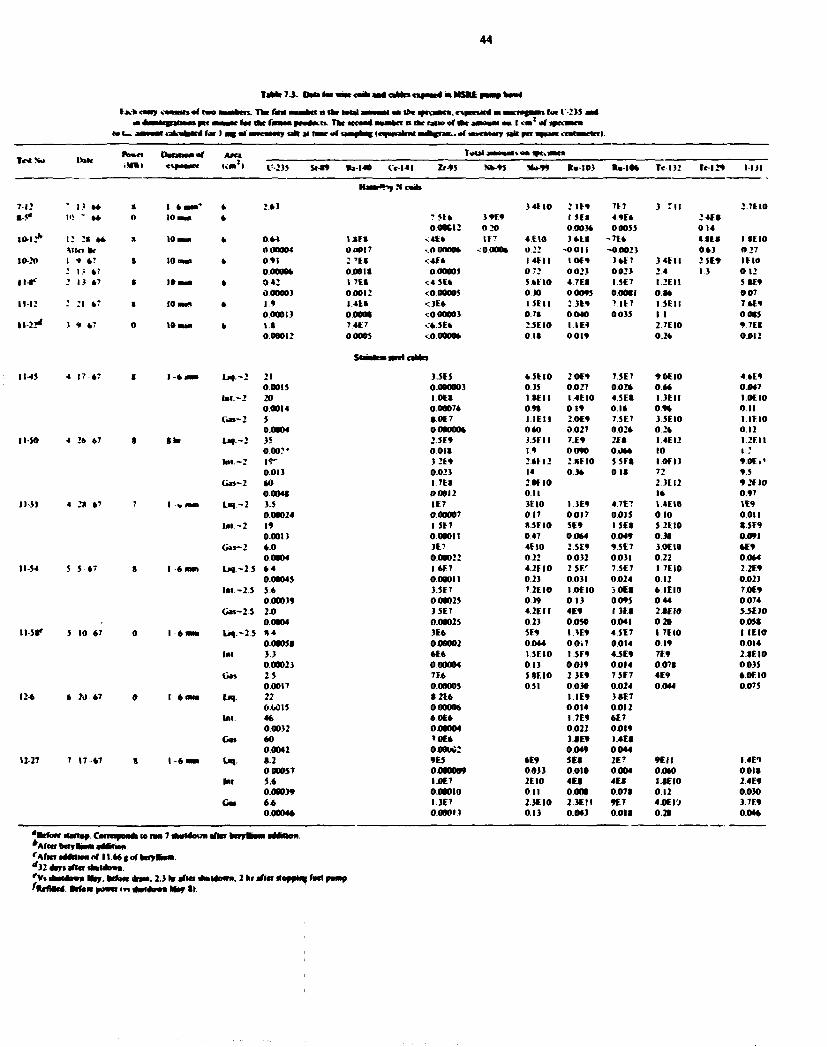
44
e 7 J . t o i k a i c M n a m r f a N S U
t t t k o o y ••aaai
M I — a w
c m i m i a t iwe aawaII i. Tat (am awaaaii « tat w o l » — •a t •> the liliaarm.t\mr%m4 m a m i n t — i tat 1-2)5 aai • • • a r t B dat i m v at m* iainaai a * 1 vm 1 at tpiuwmca wjanikm • •a^r ia • atancMofy n i l act aanar i i a i — i N U
t t t k o o y ••aaai
M I — a w H gaVainte1 fat 1 aaj M awtataiy a k M faar at — » * - f
• a t •> the liliaarm.t\mr%m4 m a m i n t — i tat 1-2)5 aai • • • a r t B dat i m v at m* iainaai a * 1 vm 1 at tpiuwmca wjanikm • •a^r ia • atancMofy n i l act aanar i i a i — i N U
T o l N o l»»* *o*ct Oaritiua of Area l o u l w w \ <M saCiMMCm
T o l N o l»»* *o*ct Oaritiua of Area
1-2)5 5*4)9 ta-140 Cc-141 Zr-95 N»-95 M»99 K > I 0 3 Ra-10* T * l ) 2 Tt-129 l l i l
l l m i » i ) i « c a a »
7-12 * 1) •*• s 1 * a a a * 6 2 * 3 14110 2 I E 9 7E7 ) rn 2 7110 m-f 10 " a* 0 10 m 6 ?SF»
000CI2 3 9E9 0 2 0
I 5 C I 0 0 0 M
4 9 E * 00055
2 4 E I 0 14
10-12* i : :» »* s 10 N » 0 * 4 ISE» <4fc» 117 4E10 3 * 1 1 -7E6 > I t « 1 M I O Mlct BV oonoot OflOl? -.0 00006 - 0 0 0 0 * 0.22 - 0 011 ~00O23 063 0 2 7
10-20 1 * »7 s 10 DM 6 0 9 1 : T E S <4E6 M i l l IOE9 ) * E 7 ) 4 E I I 25E9 IE 10 : ! • »7 0.0000* 0.00 IS 000005 0 72 0 0 2 ) 0023 2.4 13 0 1 2
n-r J 1) *7 * lOaa* 6 0 * 2 17ES <;45E* 5 6EIO 4 7 E I I5E7 1 2F I I 5 I E 9 000003 0.0012 <0 00005 030 00095 0 0 0 ( 1 0 0 6 007
I I I ! : 2i *? I 10 I M I 4 1 9 0 0001)
I 4 E » OOOOt
<3E6 < ooooot
15111 07»
23E9 0040
7 I E 7 0035
I 5 E I I I I
76E9 0015
1122* ? 9 *7 0 10 ana 6 I I 0.00012
7.4E7 00005
< * 5 E * <0 00006
Eaiiann caMcs
25E10 0 1*
1 I E * 0019
27EIO 0 2 6
9 7EI 0012
I M S 4 17 *7 I 1 - * mm L M -»2 21 0.0015
3.5E5 0000003
4 5EI0 035
2 0C9 0.027
7.5E7 0 0 2 *
9 0EI0 0 * 6
46E9 0.047
lae.- 2 20 00014
I 0 E I 0.00076
I I F I I 0 9 1
I 4 E I 0 0 1 9
45ES 0 .1 *
1-3EII 0 9 *
I0E10 O i l
G J » - 2 5 I 0 E 7 I I E I I 2.0E9 7.5F.7 3 5FI0 1 IF 10 0.0004 0.000006 060 0.027 0 0 2 * 0 2 6 0 1 2
1150 4 26 67 s Sfcr Ua.~2 35 2 5E9 3 3 E I I 7.E9 2FS I 4 E I 2 1 2EI I 0 00?' 0 0 l » 19 0090 0 0 * * 10 1.2
l a i - .y I f 0.01)
32E9 0 02)
2 6F I2 14
2 HE 10 0 3*
5 5 F I O i l
I 0 F I ) 72
9 0 F i « 9 5
G » ~ 2 60 1 7ES 2 OF 10 2 ) E I 2 9 2FI0 0.0041 00012 on 1 * 097
1151 4 2* 67 7 1 9 mm L«J.-2 35 IE7 3FI0 1 3E9 4.7E7 14110 IE9 0.00024 0 00007 017 0017 0015 0 1 0 0011
l a l - 2 19 1 5E7 H 5 H 0 5E9 I 5 E I 5 2110 I.5F9 0.0013 0 00011 0 47 0064 0049 0 31 0.091
to- .-» 4 0 00004
3E7 000022
4EI0 022
2SE9 0.032
9SE7 0 0 ) 1
3 0EI0 0 2 2
*E9 0.064
1154 5 5 67 s 1 6 lam Uq -2.5 6 4 0 00045
I 4 F 7 0.00011
4 2E10 023
2 5 E ' 0031
7.5E7 0024
1 7EI0 0 1 2
2.2F.9 0.023
l a t - 2 5 5 6 3SF7 72EIO I 0 E I 0 3 0 E I * I E I 0 7.0E9 0.00039 0-00025 0 ) 9 0 1 3 0095 0 4 4 0.074
G « - -25 2.0 0.0004
)SE7 000025
4 2 E I I 023
4E9 0050
I3F . I 0.041
2 I E 10 0 2 0
S.5EI0 0.051
I I S I * 5 10 67 0 l - * a m Liq. - 2 5 » 4 000058
3E6 000002
5E9 0044
1 1E9 0 0 .7
45E7 0014
1 7EI0 0 19
1 I E I 0 0014
Ml 3 3 0 00023
6E6 000004
I 5 E I 0 013
1 5F9 0 0 1 9
4.5E9 0014
7E9 0.071
2 IE 10 0035
C M 2 5 0.0017
7F.6 0.00005
5 IF. 10 0 51
2 3E9 0030
7.SF.7 0.024
4E9 0044
6 Of 10 0.075
12-6 6 2t) 67 0 1 6 M laf.
ml
Gas
22 0.W1S 46 0.0032 60 0.0042
I 2 E 6 000006 60E6 000004 7 0E6 0.00UC2 iii
iii
) * E 7 0012 6E7 0.019 I.4E* 0044
12-27 7 17-47 s 1 6 nun U q 1.2 000057
9E5 0000009
6E9 0.033
5E« 0.010
2E7 0.004
9 E I I 0060
I.4E9 0.011
Ml 5.6 000039
I.0E7 000010
2EI0 011
4E» 0.00*
4E* 007»
I . IE I0 0.12
24E9 0.030
Cat 6.6 000046
I.3E7 0.6WI.1
2.3EIO 0.1)
2 3E!I 0043
9E7 0.011
4 0EIJ 0 21
3.7E9 0 0 H
' M o w ftarta*. Camiauaai * A f W *u>K»w aaVWM <Mta a M n m of 11 44 | o f tf32aar«aft«f<lialaD»*
Vt fkatdawo May. before 4nm, f*t1tmtt OffoR mama I n
nm 7 alM4aowH afltf kcfyliaaji aMMon.
2.3 Nr afttt *aUu»w. 2 kr after Hoppiai fad pump. i f l l

45
r7.4. Data tar!
No. Hale Capsalc Basis Y 9 I Cs-137 Sr-19 Ba-140 Nd-147 * > - l 4 l Ct-144 Zr-95 Xk-95 »4o49 Rn-WB
17-8 1 2 4 - 6 9 ' ' ^ ^
Tota! *sin»*
2 .6FI I 7.2
3-SFI0 2.4
2.3EI3 2800
1 6 E I 4 1990
2.4EI1 450 :
17-1 i 1 29 69 Cr addition capsule Total m m
9.9FI0 1 *
3 . IE I0 l-S
I .2FI2 140
6.2EIJ 630
3 . 7 E I I « 1
IS-3 4 17 -69 Zi addition apsak Total n i m
4JE9 0-9
4 . ; E I I 4.3
6.2EI0 1.2
I 0 E I I I.I
6.9EI3 1300
9.4EI3 920
9 I E I I
18-7 4 2 5 - 6 9 Zi addition <apsnic total w i n *
5.6110 I I
1.5F.12 14
7F.7 0.0004
8.6FI I 16
I 3 F I 2 :3
3.3EI3 560
I .2EI4 760
2 .1E I1
I t - l l 5 - 1 - 6 9 Nicapnrie Total n in*
2.0E9 0.40
7.3EI0 0.63
4 3 E 9 0.08
I . IF. I0 0.10
1.SFI2 23
1.6FI3 94
9 .2E I I 21
IS-I7 5 - 8 - 6 9 l c K 2 addition capsule
Total n i m
I . I E I 0 2.1
8E9 0.07
3 3 E I I 2.1
I .4EI I 2.4
2 4 E I 0 0.21
2 5 F I I 3.6
5.SF.I2 40
I J O C U
2J
18-20 5 12 69 Cu 8 nr exposure Total 2.8EII 2.5
10K10 2.0
2 .4FI I 2.0
4 . 3 F I I 2*
I . 5F I I 2.4
S.4FI I 4.7
3.4FII 5.8
2 . I F I I 1.9
4 .6F I I 6.4
2 7T I3 no
4 . * E I I 9
18-23 5 15-69 Be addition capsule Total w i n *
l . l r . l l 20
I .7FI2 13
5.7EI I 10
2.6EI2 22
I .0FI3 135
6.3EI4 4300
I . IE1J 220
18-28 5 20 -69 Be surface ten.- ion effects
Total •sin*
7.0F.10 13
I .3EI2 10
9.0F.II IS
2.6EI2 21
9 . I E I I 11
3.9FI3 270
7.9EU 16
19-12 * 19-69 Enrkhntcnl capsulr Total **in»
2.0E9 0.045
5.2E8 0.10
9.7E9 0.22
2.2*8 O i l
9.0E8 0.028
2.0E9 0.041
I .3F9 OJ025
8.JFI0 1.2
9.2F9 on
19-52 1 0 - 1 2 - 6 9 "DRG^-Cu dnmmy Leach
Total *sin*
7.6F.8 0.01
4.6F.8 0.0*
4 .4F I0 0.51
2.IE9 0.016
5.0F.8 0.01
7.0E8 0.006
5.1F.8 0.009
6. IFX O.007
4 . I E I 0 0.60
I .3FI? 7.8
4 .4EI0 16
19-61 10 21 -69 No strip and Ni capsule. Harold Kohn Nb strip Toul
nan 1.4F10 0.16
6F8 0.10
8.8E9 0 0 9
2F I0 0.13
8E9 0.16
I .5FI0 oin
7E9 0.12
I 0 F I O 0.10
64E9 0.09
I .6EI2 10
2«E:O 0.6
Nicap Total *si-»
2.IE9 0.024
SF.8 0 .M
7.4F10 0 *
4F9 0.03
1.4F9 0.02
1.4K OOl
9E8 0.016
I.5F.9 0.016
2.8F11 4
S.1E12 50
I J E I I 4J6
'Calculated inventory per gram of salt assuming no losses.
I
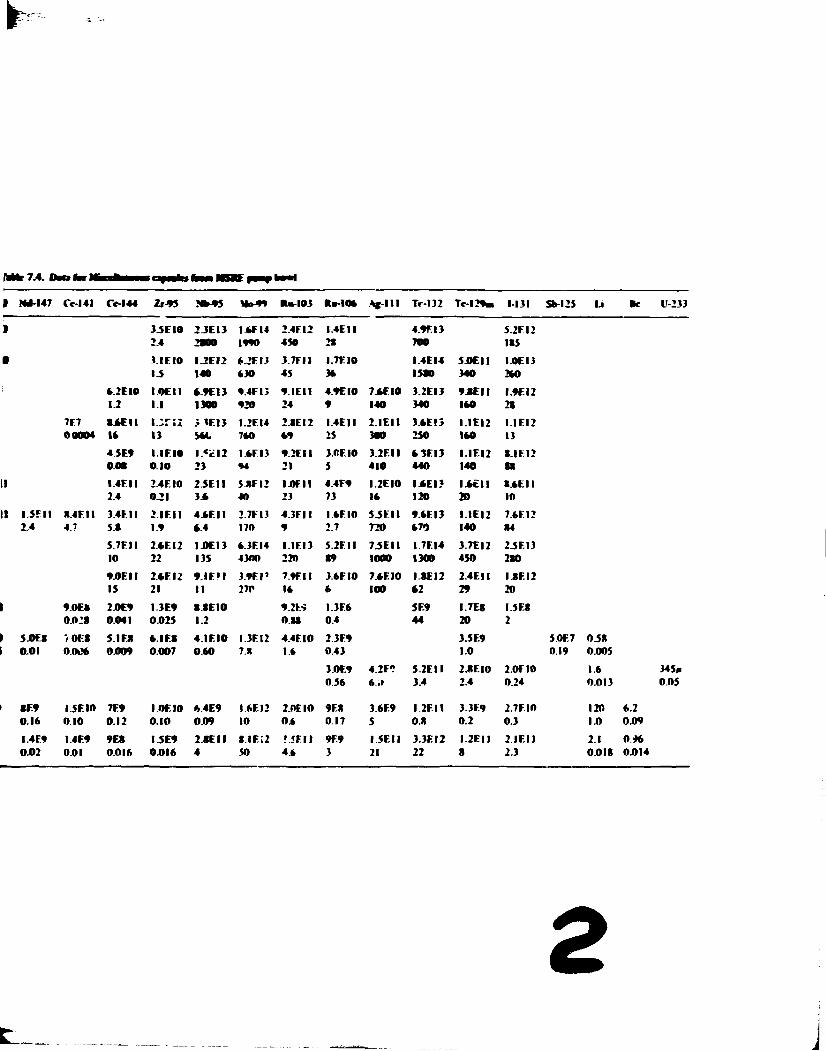
*
M i r 7.4. DM* fa* I
» N4-I47 I V - I 4 I Cr-144 Zi-95 N M S *»-*» Ra-103 R B - 1 0 6 A c - I H Tr-132 TC-I29M l-l 31 Sb-125 U Re U-233
] 3.SEI0 2.4
2.3EI3 2 M 0
I.6FI4 1990
2.4FI2 450
I .4EI I 2S
4.9FI3 700
5.2FI2 US
• 3 . I E I 0 13
I .2EI2 140
6.2FI3 630
3.7FI I 45
I .7FI0 36
I .4EI4 15*0
5 OEM 340
I.0F.I3 260
6.2EI0 1.2
I . 9 E I I 1.1
6 9 E I 3 1300
9.4FI5 920
9 . I E I I 24
4.9EI0 9
7 6 F I 0 140
3.2EI3 340
9 J E I I 160
I .9EI2 21
7F7 00004
S j t E l l 16
i . ; r ; j 13
.MF. I3 56C
I.2FI4 760
2.SEI2 69
I .4EI I 25
2.1F.II 300
3.6E13 250
I . I E I 2 160
I . IE I2 13
4.5E9 0.00
I . IE IO 0.10
I . «£ I2 23
I .6FI3 94
9 .2F I I 21
3.CEI0 5
3.2EI I 410
6 5EI3 440
I - I F I 2 140
8.1 F.I 2 m
I I I.4F.II 2.4
2.4EI0 0.21
2 5E I1 3.6
S.8FI2 40
I .OFII 23
4.4F9 73
I .2EI0 16
I 6 E I ? 120
l A t l l 20
8.6EII 10
I I I.3F.II 2.4
8.4EI I 4.7
3 4 1 I I 5 »
2 . IE I1 1.9
4.6F.II 6.4
2.7FI3 170
4 .3F I I 9
I .6FI0 2.7
5 .5FI I 720
9.6EI3 670
I I E I 2 140
7.6FI2 84
5 .7FI I 10
2 6 F I 2 22
I .0EI3 135
6.3EI4 4300
I . I F I 3 220
S.2EII 89
7.5EI I 1000
I7F . I4 1300
3.7EI2 450
2.5EI3 210
9 .0EH 15
2.6EI2 21
9 . I E U I I
3 .9F I ' 27P
7.9FII 16
3.6FI0 6
7.6EI0 100
1JKI2 62
2.4EI I 29
l.»F12 20
1 9.0E» oo:»
2.0E9 0.041
I 3 E 9 0J025
M E I O 1.2
9.2F/J 0 .M
I.3F6 0.4
5E9 44
I.7E8 20
I.5E8 2
> i
5 0F« 0.01
7 0F.S 0.006
5.1 EX 0 J 0 0 9
6.IF.S 0.007
4 . I E I 0 0.60
I.3EI2 7.8
4.4FI0 1.6
2.3E9 0.43
3.0F.9 0.56
4.2F? 5.2F.II 3.4
3.5 E9 1.0
2.8F.I0 2.4
5.0F.7 0.19
2.0FI0 0.24
0 3 8 0.005
1.6 0.013
345M 0 0 5
«E9 0.16
I .5FI0 0.10
7F9 0.12
I.OEIO 0.10
6.4E9 0.09
I.6EI2 10
2.0EIO o*
9E8 0.17
3.6E9 5
1 2F.il 0 *
3.3E9 0.2
2.7F.IO 0.3
120 1.0
6.2 0.09
I.4F9 0.02
14E9 0.01
9E* 0.016
I.5E9 0.016
2 .8EI I 4
<IE;2 50
! 5 F I I 4.6
9F9 3
I . 5E I I 21
3.3FI2 22
I . 2E I I 8
2.1 F.I 1 2.3
2.1 0.018
0 * 6 0.014
2 J

BLANK PAGE
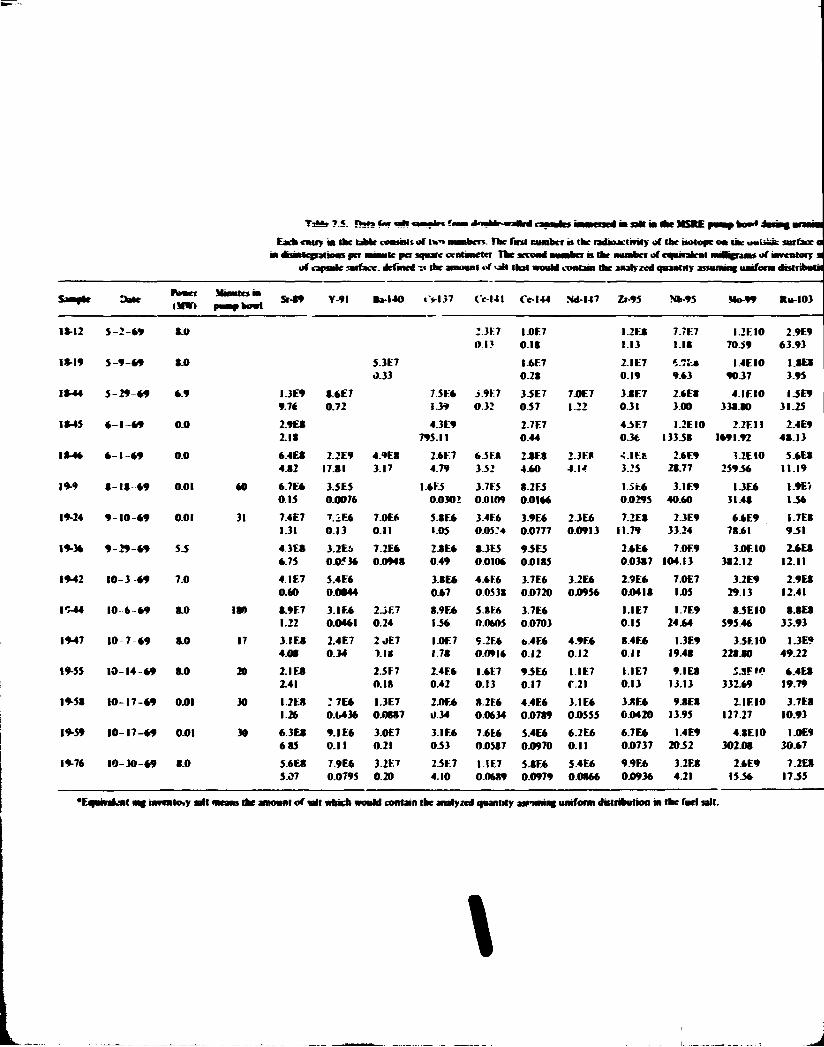
Each entry m the labtt consols of l v» nunbrn. The first cvmbcr B the radioactivity of the isotope on like i m b t s surface a n dninlepalnMS pet nunnlc per annate centimeter The second nnwhfi a the number of eajnivaknt miwgram* of inventory l
of capsnte -wface. defined n the amount vf M I I thai wooM contain the analyzed quantity assaminf uniform dntrAttU
Sample Dale •tower Mhmtesm
pnmp howl Si-*9 Y-91 •a-140 t's-137 t'e-141 Ce-144 Nd-147 Zr-95 Nh-95 Mo-99 Ru-103
l t -12 5 - 2 - 6 9 to 2.3E7 0.1?
I.0E7 0 1 8
I.2E8 1.13
7.7E7 1.18
I .2EI0 70 59
2.9E9 63.93
18-19 5 - 9 - 6 9 to 5.3E7 0.33
I.6E7 0.28
2.IE7 0.19 9.63
M E 10 90.37
I.SES 3.95
IS-M 5 - 2 9 - 6 9 6.9 I.3E9 8.6E7 7.5E6 j.m 3.5E7 7.0E7 3JE7 2.6ES 4. IE 10 I.5E9 9.76 0.72 1.39 0.32 0.57 1.22 0.31 3.00 338 80 31.25
1*45 6 - 1 - 6 9 0.0 2.9ES 2.18
4.3E9 795.11
2.7E7 0.44
4.SE7 0.3t
I .2EI0 133.58
2.2F.II 1691.92
2.4E9 48.13
1 * 4 * 6 - 1 - 6 9 0.0 6.4E1 2.2E9 4.9E8 2.6F7 6 SIX 2.8E8 2-3E8 • U E 8 2.6E9 3.2EI0 S.6E8 4.82 17.81 3.17 4.79 3.52 4.60 4.14 3?S 28.77 259 St 11.19
19-9 t - l « 69 0.01 60 6.7E6 3.5E5 I.6E5 3.7F5 8.2E5 ISr.6 3.IE9 I.3E6 I.9E7 0.15 0.0076 0.0302 0.0109 0.0166 0.0295 40.60 31.48 1 3 6
19-24 9 - 1 0 - 6 9 0.01 31 7.4E7 7.iE6 7.0E6 5.SE6 3.4E6 3-9E6 23E6 7.2E8 2.3E9 6.6E9 I.7E8 1.31 0.13 0.11 • 05 0.05J4 0.0777 0.0913 11.79 3324 78.61 9.51
19-36 9 - 2 9 - 6 9 5.5 4 3E8 3.2Ei 7.2E6 24E6 S.3E5 9.5E5 2.6E6 7.0E9 3 OF. 10 2.6E8 6.75 0.0536 0.0948 0.49 0.0106 0.0185 0.0387 104.13 382.12 12.11
1942 10-3 69 7.0 4 I E 7 5.4E6 3.8E6 4.6E6 3.7E6 3.2E6 2.9E6 7.0E7 3.2E9 2.9ES 0.60 0.0S44 0 4 7 0.0538 0.0720 0J0956 0.0418 105 29.13 12.41
IC-M 10 6 - 6 9 to ISO t 9 E 7 3.IE6 2.5F.7 S.9E6 5.SK6 37E6 I . IE7 I.7E9 8.5E10 8.8ES 1.22 0.0461 0.24 1.56 0.0605 0.0703 0.15 24.64 595.46 33.93
19-47 10 7 - 6 9 to 17 3. I E * 2.4E7 2JE7 I.0E7 S.2F.6 6.4E6 4.9E6 8.4E6 1.3E9 3 5 E I 0 I.3E? 4.08 0.34 > . l * 1.78 0.0916 0.12 0.12 0.11 19.48 228.80 49.22
19-55 10-14 69 to 20 2.1E8 2.5F7 2.4E6 I.6E7 9.5 E6 I . IE7 I . IE7 9.IE8 S.SF»C 6.4ES 2.41 0.18 0.42 0.13 0 1 7 f . 2 l 0.13 13.13 332.69 19.79
19-5* 1 0 - 1 7 - 6 9 0.01 30 I.2E8 : 7 E 6 I.3E7 2.0E6 8.2F6 4.4E6 3.IE6 3JIE6 9.8E8 2 . I F I 0 3.7E8 1.26 0.0436 0.0887 0.34 0.0634 0.0789 0.0555 0.0420 13.95 127.27 10.93
19-59 1 0 - 1 7 - 6 9 0.01 30 6 3E* 9.1 E6 3.0E7 3.1 E6 7.6F.6 5.4E6 6.2E6 6.7E6 I.4E9 4.8EI0 I.0E9 6S5 0.11 0.21 0.53 0.0587 0.0970 O i l 0.0737 20.52 302.08 30.67
19-76 1 0 - 3 0 - 6 9 S.0 5.6E8 7.9E6 3.2F.7 2.5 E7 I. IE7 5.8E6 5.4E6 9.9E6 3.2E8 2.6E9 7.2E8 5.07 0.0795 0.20 4.10 0.0689 0.0979 0.0866 00936 4.21 15.56 17.55
'Eqawaknf mg inventory a l l means the amoant of a l t which woald contain the analyzed quantity asviminf. uniform distribution in the fnel a l l .
\
L

r >^^-^ca>^-^^»^.v^^^
BLANK PAGE
.•...-,,••. — >~+- - S --if **,*»• >-tm*tm*it«m\*mmrrmu 'mmmmmmvmms.
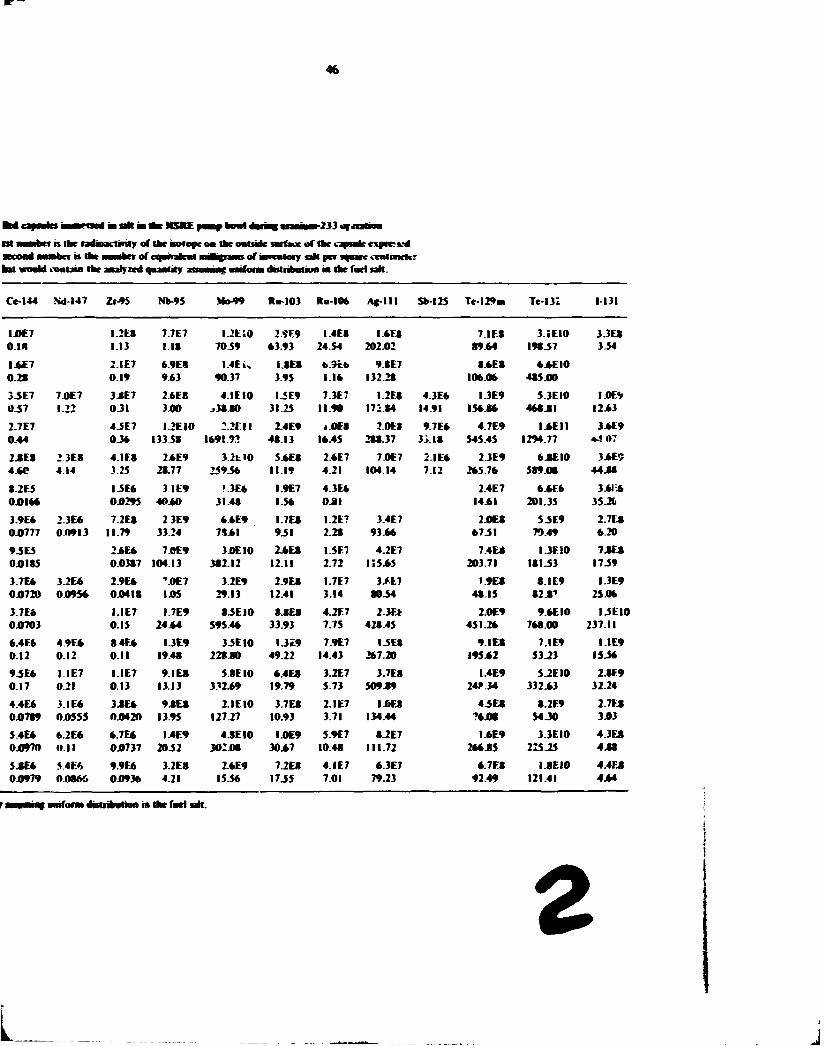
a n m dKMSKEf—ykwrt 4mn+ • » • • • 233 or* r is the ndioacthrily of Ike BOfopc oa Ike oatntc jarnce of Ike upJafc cxprcwd
rondamabci ii ifci miwliii uf ii|niiiliiil mil^itmi uf iimiiliiij a l l pet wfnr* oetHonetar I wo»M conlaia Ike anlyzrd quality groining naTom dnlribalion in Ike fad a i l .
Ce-144 Nd-147 Z»-9S NW5 Mo-99 Ru-103 Ra-106 Ag-lll Sb-125 Tc-I29ai Te-I3i 1-131
IJ0E7 om
I.2E8 1.13
7.7E7 LIS
I.2EI0 7039
2.9E9 63.93
I.4ES 24.54
I6E8 202.02
7.IES 8944
3.IEI0 19837
3.3E8 334
l . « 7 0.28
2.IE7 0.19
6.9E8 9.63
1.4Eiv 90.37
I.8ES 3.95
6.7C.6 1.16
9.SE7 132.28
8.6ES 106.0*
**E10 485 4»
33E7 0.57
7.0E7 1.22
3JE7 0.31
2.6E8 3.00
4.IEI0 j38.SO
I3E9 31.25
7.3E7 11.90
I.2E8 172.84
4.3E* 14.91
I.3E9 15* J *
5.3EI0 468.81
14*9 12 63
2.7E7 0.44
43E7 0 3 *
I.2EI0 13338
:.2rn 1*91.92
2.4E9 48.13
I.0E8 16.45
2.0E8 288.37
9.7E6 3i.l8
4.7E9 545.45
I4.EII 1294.77
3J6E9 •4 07
2.SE8 4 4 *
23E8 4 14
4.IF.8 325
2.6E9 28.77
3 2 t l0 25936
5.6E8 11.19
2.*E7 4.21
7.0E7 104.14
2.IE6 7.12
2.3E9 265.7*
64KI0 589.08
34.E5 44.88
8.2ES OJOIM
I3E* 04)295
3 1E9 40.6O
•3E* 31.48
1.9E7 1.5*
4.3E6 0.81
2.4E7 14.61
6.6E6 201.35
34»l-* 35J6
3.9E6 04)777
2.3E* 0.0913
7.2ES 11.79
2 3E9 3324
66E9 7161
I.7E8 931
I.2E7 2.28
3.4E7 93.66
20E8 67.51
53E9 70.49
2.7E8 6.20
9JE5 04)185
24.E* 0.03S7
7.0E9 104.13
34*10 382.12
24.E8 12.11
I3E7 2.72
4.2E7 i:5.65
7.4E8 203.71
1.3F10 18133
7JES 1739
3.7E6 04)720
3.2E* 00954
2.9E* 0.0418
••4*7 1.05
3.2E9 29.13
2.9E8 12.41
I.7E7 3.14
3*17 8034
• 9E8 48.15
8.IE9 82.8 1
I.3E9 25.06
3.7E* 04)703
I.IE7 0.15
I.7E9 24 64
S3EI0 595.46
8.SES 33.93
4.2E7 7.75
2.3E* 428.45
2.0E9 451.2*
9 6EI0 768.00
I3EI0 237.11
6.4E6 0.12
4.9E* 0.12
84E* O i l
I.3E9 19.48
33E10 228 JO
1.3*9 49.22
7.9E7 14.43
I3E8 2*7.20
9.IES 195.62
7.IE9 53.23
I.IE9 153*
93E6 0.17
1 IE7 0.21
I.IE7 0.13
9.IES 13.13
5.SEI0 332.69
6.4ES 19.79
3.2E7 5.73
3.7E8 509.89
I.4E9 24* .34
5JEI0 3324>3
2JE9 32.24
4.4E6 04)789
3. IE* 00555
3JE* 00420
9.SE8 13.95
2.IEI0 127.27
3.7E8 10.93
2.IE7 3.71
I0E8 134.44
4 5E8 ?*4»
8.2E9 54.30
2.7E8 34)3
5.4E6 04)970
6.2E* O i l
*.7E* 04)737
I.4E9 2052
4.SEI0 302418
I.0E9 30.67
5.9E7 10.48
S.2E7 111.72
I.6E9 2*6 AS
3.3EIO 225.25
4.3E8 4.88
5.8E6 04)979
5 4E4 0.0866
9.9E6 04)93*
3.2ES 4.21
2.6E9 15.56
7.2E8 17.55
4.IE7 701
6.3E7 79.23
6.7E8 92.49
I8F I0 121.41
4.4ES 44*
r •••wiw| umfonw dittrifcvtioa in Ike fact ah .

47
Takfe?.*. Ik «*».» M » * » * — i l n l > • M M
^ — — , « » > » ^ m r i i i i w i n u l a f i
• M r a m i • f !•>» oMMkcn TtMT D M • • • • m i e n • M i Tat l I H i M a ~r ^ • C B M 0 1
• * « • • < • • • * t t a l • * ^ — — , « » > » ^ m r i i i i w i n u l a f i • k ^ { » M i M 4 a k a M • • • f a * *
m i e n • M i Tat l I H i M a ~r ^ • C B M 0 1
• * « • • < • • • * t t a l • *
S—fk OMC IXW) i « r i M i S>0* Y-41 ••-14* O I » 7 Cr-141 Cf-144 IM-147 Z P * 5 NMS • » • * * *> -M) • » M * A f l l l Sk-125 Tr-I2«B M i l
11-11 S-12 *» 7 * 40 ) 7 F * 2 * 1
1 ?F7 0.12
4 * f 7 0 JO
1 111 20)4
5.0F* 0027*
44E7 077
1 IE* • 004*
*5ES • M
)2E I» 2*5 24 14.52
42E7 707
4.M7 M S *
4 * t S 5)40)
J.4CI 2 X J I
is -a 5 17 * * ? • 4 0 24F7 0 1 *
22E* OOMI
• I E * 0.051*
L I E * I 2E I0 t * ) 7
I4E0 I t )
7 2E* 1 10
1 X 7 4444
• S I S 7I.4W
2 « f M0.2S
11-2* 5 21 »4 7 1 4 0 2 O F * 1 * l
1 2F7 0O44*
4 5F4 )*E» 001*4
20f» 00) )7
I 0 E * 00152
1 IF * I X
1 IE 10 7*07
I J M JOI
2 * * * •.*)
ISE7 D M
) M S ) 5 ) :
IOEI M2 . l t
1*42 ) . 1 M 4.4 40 2 411 1 1)
1 7F4 001)4
1 7t7 a n
I 7 F * 141
) 7 E * 00 i *»
2 J I * DO J* J
»7E* 012
) * £ * 0 0 2 * *
* X 7 • 7)
57E* 414*
1IET 1*4
4.4E* • 71
2 X 7 )2SI
*51S J* 12
2 X 1 2 I I J I
1*1) I 21 -4 O.OM 40 4 517 105
I0F4 00224
I 4 U or,
2 7F* 051
21F5 0000*
7115 00145
I 7 E * 00)45
I t E l 242
* * C * 7*J»
7JE7 » 5 *
l *E7 ) * 4
I5E* 5 7*
1 * 1 12* *
2 S H
1*14 * 21 * * O O M 5J VIF7 0 7}
1114 00414
2 2F4 1 20
1 7E4 0 ) 1
• 715 00274
2 OF* 0*415
I 4 E * 00272
• • E 7 • M
4 * E * 4*42 ! 1)
) 2 E * • *2
1*17 12 2)
• •E l 2) ISB
1*15 1 21 M O O M 40 1217 021
1 IF * 002)4 0 1*
4)F< 0.01)*
4 2E5 • t i n
4*43 0*1)2
4*17 • »2
l ) E » IJ *5
* ) E » • 7 4
2.4E* • 45
*JE4 • )7
) l ( 7 2040
15C1 41151
1 * 1 * 1 21 *4 " " 40 71F7 112
2 * f * 00547
14*5 044
4 2k* 0 71
1 IE* * 0 ) ) 5
25E* 00501
l * E * • 0)04
40C* 5 40
2 « 7 l * ) * 2
I M S I S *
2SC7 4 » )
2 X 5 • 15
7 M ? 51 W
*SE1 77»»*
1 * 1 * 4 4 M 55 20 2 5(1 4J4
4>F4 00055
1 1(7 024
1 IF7 200
«*C5 001)1
l * F * 00M7
* I E 5 • •107
2*F1 )75
4 IE4 511)
JOE* H 7 7
I .M7 )J»
) I E 7 I I I I I
1 X 1 52 71
» S H *TJ»
1*2* * 4 4* 5 5 20 2 2F1 4 J 0
2 514 00445
1 2F7 0 2'
l ) F * 152
44F5 00I2O
1 IE* 0022)
4 .£7 12*
2.2ES )24
I J C M 2 I » I I
J4E1 2114
l *E7 2.4*
4*17 15)7*
I X S 517*
7 X 1 MS.TT
•*:.» 4 1 * * * • •1 20 * * F ; 1 74
>)F* » » 5 )
2 * 1 ' 044
I0F7 114
2 IF * 00)22
24E4 00477
I 2 E * 0 0 * * *
4 7E7 I S *
) IES 4 4*
) * E * 4215
2.2E1 I 2 « *
I4E7 2*1
21(7 5*7*
1 X 7 .'.121
ISES M I 5
2 J H 15.11
• * 2 i I U H 55 20 5*5
* 5 F * O i l
I4T7 O i l
* ) F 7 I I 2)
) * E * 00*72
) * F * 00**7
24E* O0M0
74ES 1 JEW 11*54
LIES )»*7
*<IE7 750
I4ES ) X J 5
4 7F1 D I M
I S O • M M
1*2* * 2) 4* 55 20 2 211 J 45
2*F7 044
) IF? 041
5 2F4 0*4
I I F 7 0 2 )
l*F7 0)2
4)F» 0 ) 1
I5F7 • 2 )
) I E 0 4*«
»5E» • • ITS
**ES 44*7
4SF7 SSS
7517 1*4 1 *
4 4 f t I2 )»7
• 111 1254*
1*17 » M * * 001 20 4 5F7 070
4 5F5 OOI54
• 7FS 00114
I 4 F * 0 25
1 )F4 0*0*2
I4E4 00004
)SES • •057
l * t * 21)
) 1 W 4 0 1 *
l . iT* 55)
7SE* 145
J4E* 1*57
• 4F7 2 ) 5 )
I J B X . M
•*» • • 1 * 4 55 20 * * F 7 1.01
5 52E5 000*4
4 2F1 5)2
! * F * *))
1 IE5 0001)
2TF.4 0*005
) I F * • M M
5*»7 0 75
4 « 1 ) * 7
)7ES 1*55
2.417 455
IJ17 1252
7517 2SM
I J H M J »
1*41 1 * I 44 70 20 I4F1 20}
7 2 1 * O i l
1417 • 22
2 I F * 0 4 *
)*E5 00041
24E3 COM*
52EI • M75
i ; E 0 2 1 *
4JC* 4012
I M S *17
H I T 2»l
2. X T • l . l l
) X S M * 4
IJC1 1 X 5 5
l*-4* 1* 7 44 t o 200 ).)E1 4 ) 5
2 I F . 0 ) 0
7*17 0 7|
4 I F * 071
I 2 E * 0 0 ! 12
l o t * 0014)
4 7E5 • M»2
2*E7 • w
* ) E 1 4 21
ISES *.**
1217 111
5 M 7 17*5
2 *E* » 7 )
IJCI •2.7J
1**4 M 14 44 10 22 4 711 7*2
4 * F * 005*5
I1F7 • 1)
2 I F * 041
1 IE* 00042
121* 00211
)*E5 • 0071
1.71* * * 2 * l
1 IE* 155*
s.tc* 4*55
I*E* *»>T
1 IE I 1*7)
2 X 7 ) I J * 4
) 5 I 1 • I S *
i . iei *.7»
1 * 5* 1* 15 44 001 20 I 0 M 1 14
) 7 F * 00450
7 r t » 0.055*
5 or* O K
J i l t 00)05
24E* 00427
2 4 1 * • M M
M E * • •!))
I 4E1 20*
7 ) f * 42*0
2.7ES 1 2 )
I5E7 1 X 7 MM
)*ES 5*15
»StJ »)SJ
l * *2 • • 22 4* 1.0 20 )4F1 )45
)2F» 00)55
J0F7 • 20
* * F * 1*2
ISE* 00110
l*E» 00251
I2E* • O i l *
I M S • M l *
1 J H 1.11
I M M 11'J»
• TFJ 111*
) K 7 57»
)*E7 470*
5 X 1 W I S
2 5 t l M4SS
l **4 I * 22 44 t o 40 2**S 2*1
1 X 7 0 14
).*F7 024
4 I F * 0*4
».*E» 0.0*51
)5E» 00*07
* X » ««7 ) l
S IC* • 05)5
I *E1 2 2) 5 1 »
)5ES ISE7 )•)
1 X 7 25M
)2«S 4 * M
I . X X J D
1*45 X> 2) * * • 0 40 4 ' f t 4*5
I I F 7 012
4 7F7 O M
7 5F* 12*
tOE* 0*071
74FJ 0012*
l ) E » • 011*
I M S 412
I V . I * i r « i 7
•0E1 20*4
4 X 7 7*»
4*17 5**»
• M S • M X
2JC I M S *
- . •7* M-JS 4* *.» 40 • I F ! 040
15F* 0*174
44F* 012
74E* 00*07
4 4E* 0074*
41E* 00*4*
15F7 I I )
»4CI« 4*2 • !
I7E5 • *S4)
7 117 1 1 1 *
7.117 mm
I 5 1 M 2M7J5 MJ*>
it-W W 2* 44 1 * 40 4 M l 4 4 )
1 IF? en
» IF7 0 ) 7
« I F * 1*1
7 IE* 004*4
) K » 00*50
4 4 1 * • •T*S
2 4 1 * • •22*
I2E1 15)
2 « i a l ) * 7 »
1 * 1 * ) * M
7217 12.21
• X 7 M.4S
I S I S 25 J *
5JM ».M>
1*77 • • - ) • • * 1 0 41 ) 1 M )4»
2 5F* 00250
4*E7 * 2 »
M O 0 1 )
2*E* 001*7
l ) E * 0 H 2 I
1 X 0 0*1*0
) I E » •jam
2 ) U )•)
I . I I M *•**
*JtM If.TS
7517 12 7*
4.117 514*
l i t * 14*51 2S*5»
l*TS 1 * I I 44 a* 40 • IF * 571
1 2F.7 012
7SF7 • 47
• SE» I I )
I0F7 • 0»55
* H * 0 1 *
*4E» • I I
M M • M M
5*L» 7.45
l . t t l * » 1 J M
I M S 4 J M
• I I S win
S X 7 M252
I X * 17) SI
4JB nt.tr
I t - I t I I 2 44 • i 40 S4E7 040
7415 00077
l i t * •.010*
I4E5 002)7
I41S 000*4
I IE5 •0» l»
1!E5 0 M 2 0
4 I f 7 • J )
| 4 f * I D )
7 M 7 1*5
5 M * 0S5
1 X 7 M S *
I S M l ) * » 15 3»
J M 11 1 M t o 40 2 1FS 1*1
4 I f 7 054
)«*» 0 5 *
) *F» 00)4)
) * E * •0*12
*7E» 5 M S *
7 M > •.»»
1511 111
) 4 t » • S I S 11212
2 » l l I I 2 44 t o 0* 1.717 0 ) 1
• 5 1 * • M M
1 IF7 • 1)
l * E * M I T *
47ES 511
I 5E I» 1174*
4 K S 14)1
1 X 7 4.12
5 X 7 I4»*7
I M S 2**5
j . * r
7*17 11-W • * . 0 40 I I I ? 011
S.ttS • 0544
7*F» 0.0MI
21FJ 00447
l .Ttt • MS)
1 * M 00*44
) ) E * • M M
l « U I M
l i t * • M 7 15S
M H • S I
«517 H I S I S M z»sf
X - l l 11-11 *4> • 40 7 S I * 00741
H I S • N i l • N i l
I . I I5 • •ITS
1*14 • 0*01
2 K 4 • M M
1.015 • M i l
) 4 t 7 • 41
) I U i . f i
1JE7 • *•
I S ! * • ) l
IMS I J » • 74
z»sf
I

47
fea<M •ts«tr<
• f t * • » « * • • *M •y •> ike oMc M a t 1 f N M i « * I M B « « t « ( ogoUc vMfan
itlnm n i * r i I f c t w t m O i a l
> ( » H l l » l | H < l > » N » « M l .
MMVSMly *t MV W M f r £•• MoT • • r M t a a O n
ai«H:ib*l*0l
• f t * • » « * • • *M •y •> ike oMc M a t 1 f N M i « * I M B « « t « ( ogoUc vMfan
itlnm n i * r i I f c t w t m O i a l
> ( » H l l » l | H < l > » N » « M l . ai«H:ib*l*0l
Y-*l •VI40 0-1J7 c«-:«" Cc-144 IM-147 Zt-%5 NV*5 «*»*» H*-W3 •.••M* 4*111 Sk-125 Tt-I2*a Tc-132 1-1)1
JE7 L12
4>E7 OJO
1 IE* 50E* 0027*
44E7 0.77
1 IE* *5E» SO*
3 2EIO 205 24
»<E* 1*57
4 2ET 7.07
4*E7 *S.M
* 4 » » 3 ) * *
i o n •3*32
ISO* 1*3)
2 * E ' O i l
2 21* 0*3*1
VIE* 0.051*
1 IE* 1 3*
12110 T O "
I4E* 2*5
72E* 120
) ) E 7 444*
•JOE* 7140
2 4 * W IM25
-2E7 HM*4
» ) E * 122
3*Ef 001*4
2*E» 00337
ISE* • 0152
1 IE* 1 3*
1 JEW 7007
1 5 1 * 3.01
2*E* 0 4 3
I0ET 1 ) 4 *
)•>•* » 5 ) 2
I4IIO 102 J *
1 I I * 17 3*
L7E* IM3*
1 7E7
en * 7 F * 1*1
J7E* 0.014*
2 3E* 003*3
* 7 E * 0 1 2
3 * € » 0 0 2 0 *
• JE7 0 7 3
5 7E* 40.4*
• IE7 1.**
4 4E* 0 7 1
2 2E7 32*1
* M » 7 » I 2
2 N W 211 21
1 21* M 3 *
IM:* W22*
1-4E* • 7* 051
2 M 5 M E ) 00145
I 7 E * 00345
ion 2 4 2
• *E* 74.5*
7JE7 * 5 *
l*E7 3*4
i ; . » 1*17 5 TO 12*4 3*37
I X * W.24
I M * L0414
22E* 129
l ? E * 0 31
»7E5 60274
2*C* 00413
I 4 E * 00272
60E7 0 J 0
4*E* 4*42
I3E7 1 15
3 2E» 0*2
l*E7 1223
l«E7 2 3 I M
2 5 1 * 2 5 ) 4
LIE* 1*2 J*
»«ES 0 1 *
4JE5 0.013*
02ES OOIM
• M S 00132
4AE7 0 * 2
I3E* 13 *5
* J E * 0 74
24E* 0 4 5
»0E4 3117 OJT 2041
35E7 41*51
• 5 1 * l«<VS*
l * E * U H 7
t » ( 5 0 4 *
4 2E* • 1
• IE* 00)35
25E* 005OI
l*C« 0*3*4
40E* 5.40
20E7 1*3*2
I0E* • •*
2*E7 4 * 3
2 3C5 7*17 • S5 51 W
M i l 77*34
4 5 1 * 45 TO
U E * MS55
1 I f 0 24
1 IE7 2 0 0
**E5 0.0131
I t f * 003*7
* I E 5 0.0107
2*Et J75
4 IE* 51*3
lot* l »77
I0E7 ).*»
) « 7 III .1
I K S 52 7*
» M * * 7 M
• M * 20 51
I S t * SJSMS
i :»7 0 24
I H i 152
*4E5 00120
1 IE* 00223
• M 7 1 2 *
2.2ES 3 24
I K W 21*11
J4E* 21 14
I*E7 20»
*»E7 I J t * 5 1 1 *
7 7E* 10*77
7 M * 2 ) 5 4
M E * • M 3 3
2 * f 7 0 * 4
I0E7 1*4
2 IE* 00322
24E* 00*77
l.*E* 0*4*4
»7E7 1 5 0
3 IE* 4 4 *
5*E* » 2 «
2.2EO 12.0*
I4E7 2*7
2117 5*7*
1 717 l* f* *l 21 34 15
2 « * 3311
2.2E* 50 57
U E * • II
I4E7 0 1*
*3E7 II 23
J*E* 00*72
)*E» *0»*7
2*E» 90X4)
T.4ES II l l
1 IEW 11*54
« I E * 3**7
4 0E7 7 5 *
I 4 H )>».»
4 7E0 131*1
1 4 ( 1 0 IM.**
I M * )7.M
MET 0 4 *
5 2F* 0*4
: « 7 0.23
l*E7 0 3 2
• JE* 0 3 1
1 » i * 0 23
3 IE* 4*1
» 5 f » 101 70
**f* 44*7
* ( » 7 M 5
75E7 1*41*
44E« 123.07
H E W I 2 5 M
I 4 » » 2 S M
05E5 • • I S *
* 7 E ) 00114
I4E* 0 2 5
1 3E* 000*2
I4E4 3 K 5 00057
l*EI 2*3
3 2f* 40 . l t
I2E0 3 5 )
7*E* 145
5.4E* 1457
• 4»7 25 55
I 5 E * 2*10
• M S 14.21
000*4 42E* 5 J :
l * U O.JJ
1 115 00*13
2.714 00*05
3 I t * • 0005
5 0E7 0 75
4JE1 5 0 7
17E* 1*55
2.4E7 4.55
1.217 ) 2 J 2
7 5E7 2*02
I2E* 1*2*
I 4 E * 30AI
7 J E * • 1 1
l * f 7 0 22
2 M * o.*»
3*E3 00042
2W5 00*5*
5 2C5 00075
ISE* 2 2 *
4 3E* 4012
1*C* *«7
I.IE7 201
2 7E7 41.11
3 2EO mm
I 2 f 10 12*55
I M * W.J!
1IET • > .
7*17 O' l
4 IE* 0 7 |
I2E* 69122
I0E* 9 01* J
4 7E5 * M * 2
2*E7 0 3 *
* ) E » 4 21
l * E * »**
I2E7 2 21
53J7 • 7 * 5
2.0EI 5*73
I 2 I W •2.73
• M « 27.M
' • E * 105*5
l * » 7 O i l
2.SE* 0 4 *
1 IE* 0*0*2
I2E* 0021*
J*E5 0*071
I 7 E * 002*1
1 IE* K M
l * E f 4*55
l * E * 4*7*
I I U 1*7)
2 * 7 31*4
)5E» • I M
I I I * • 70
J 2 I S ) M
J 71* • M 5 *
7 * 1 * ~05S*
50E* Of*
3SE* 00305
24E* 00*27
2 4E* 00*. '*
2 IE* 00233
• « ' • 2.0*
7 J W 4 2 M
27E0 • 2)
I5E7 274
2 2*7 30 2»
) 4 U 5 0 ) 5
» .M* » ) » 5
«irs 0 ) 5
l i t * • O W
J0E7 • * £ * 1*2
I5E* 0.01 W
I4E* 0*251
I2E* O02!4
I.OIS 0*20
2 3Ef 313
20EW 23 3*
* 7 E * I I ' 0
J .H7 5 » »
)*E7 47 •»
5 7E* M l *
2JEM W 4 M
2 * » - i . 4 l
IJC7 • 14
J.*E7 0 2 4
4 IE* 0 * 0
*.4E* 00*51
3 i E * 00*07 0*731
5 2 1 * 00535
l*E» 2 23
* J I » 5*20 ».)*
I M 7 305
I.0E7 ISO)
) . 2 U
mm H E W
7*20 • 5ES 0 . "
MET • 12
4 7E7 O.JO
7 S t t 1 2 *
I0E* 00(71
74E5 0012*
I K * 0 0 1 2 *
10EI 4 1 2
l * E I * 10*27
7*E* 20*4
4 .K7 7.40
4*E7 504*
•*u 105 2*
2 3EW I5*#7
• M S 7 . ) )
MOT* 4 * * * 0 * 2
7 4E* 00*17
4.4E* 0*74*
ooc* 0 0 * * *
• 5E7 1 13
• *EI0 40202
I T U M M )
7IE7 1 2 1 *
7IE7 mm
I.5EW 2M7.) )
5 4E* 2 M * )!•)
I.IE7 • II
• IE7 0 ) 7
• IE* 101
7 IE* 004*4
1 « * 01450
44E* 0 0 7 M
24E* 0 0 2 2 * 153
2 3EI* I M 7 *
l * » M M
7.217 1221
*7E7 • 4 4 5 25 J*
5 X 0 3) W
I M * • • • 7
1JE* ftri)»
4*E7 f 2*
»0E5 0 1 3
2*E* 001*7
I .H* 00221
I2E* LIE* 002*3
2 3 U 303
I.IEIO M M
S2E* 1*75
7 5 t 7 12.70
4IE7 5140
H E * I M 5 2
3 M l * 25*50
2 M * 2 * 4 )
I.M7 • 12
7M.7 0 4 7
• «E* 111
I.M7 • M 5 5
• 2E* 0 1 0
* * E * I I I
• o f * • M O )
5 t U 745
l * f W 233*0
l . f t t 4 M
» I M 1*3*2
• 7E7 10252
I X * I 7 U I
4 3110 270.07
2 M * M M
7.415 M 0 7 2
H E * 0.010*
I4E5 00237
I4E5 o.wr*
IIE5 OMI*
2IE5 0M2O
4 2E7 0 5 3
l * E * 1 2 3 )
7 K 7 1*5
50E* 0*5
I K 7 l»*»
IJE* l ) * »
22fO 152)
) M * )7.S2
4IE7 054
14E* OS*
) * f » OOJ45
)*E» 00*12
4 7E* 7*E» *»7
)M1 1.21
J * l * 0 7 0
• M S 12212
)»* 74.07
* 5 M • M M
IIE7
on l * E * 0.017*
4 7 U 5*1
I5EI* 4 3 M 14)2
2 )E7 4 12
5717 IM*7
I3ES 2*45
) M » 3 ) 2 4
24E* 4 0*
M S 4 » 7*F» 0.0*41
2.SU 00*47
I.Tt* ooaj
2»E* 00*44
1JE* 00340
l * U 1**
l i t * I0J7
9.M7 2 5 *
)*t» ••)
4JE7
rin I.M.S
I0.4* ) M *
2*57 ) M » * M
I.IE5 • M I 2
1.JE5 O M I t
1 115 0 0 I 7 S
2*E4 0*0*2
LtU OMd)
I M S • M i l
J4I7 • 41
3 I U I.W
2 5E7 • M
I M * 0 ) 1
•JCS 150 • 7 4
f i t ? •))
l i t * 1 4 *
2

--^—- ^•^•iMsm^s^^
BLANK PAGE
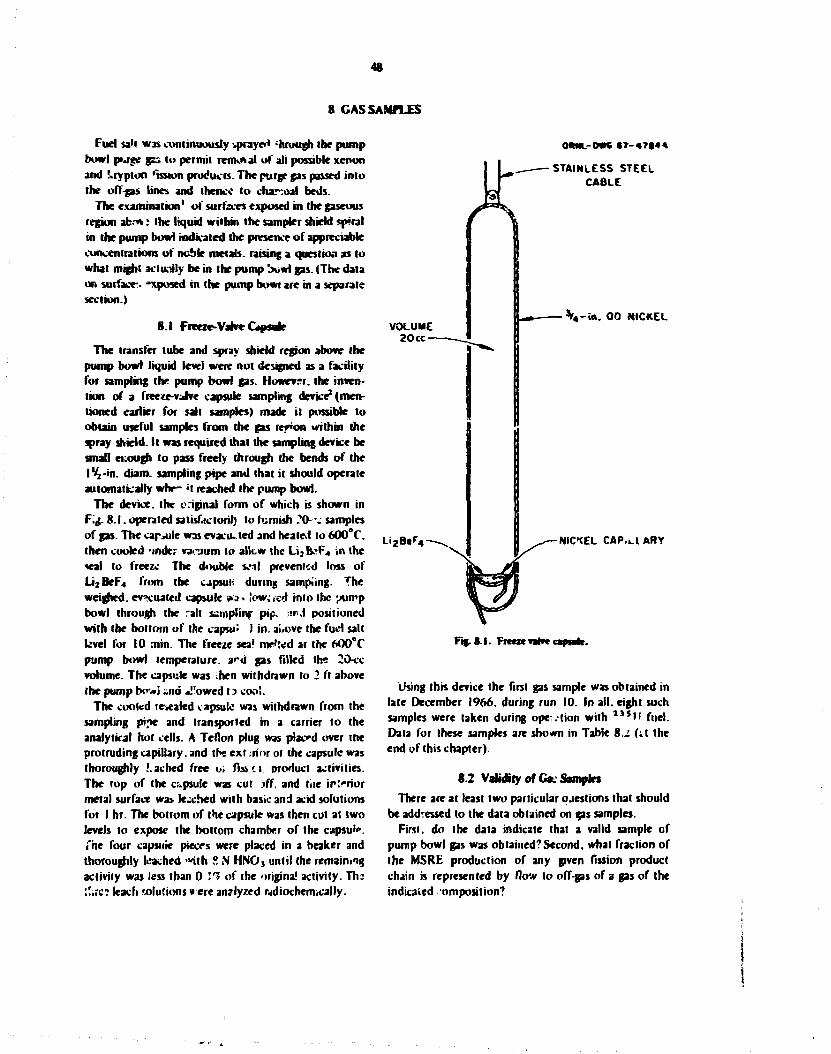
48
8 CASSAMfLES
Fuel sa't was continuously ipraye<* *hrough (he pump bowl pwge gas to permit removal of all possible xenon and krypton 'Ission products. The purge gas passed into the off-gas lines and thence to char-:oal beds.
The examination1 of surfaces exposed in the gaseous region ah.-*: the liquid within the sampler shield spiral in the pump bowi indicated the presence of appreciable concentrations of ncble metals, raising a question as to what might actually be in the pump bowl gas. (The data on surface-. ~xposed in the pump bowi are in a separate section.)
8.1 Freeze VahrOpsule
The transfer tube and spray shield region above the pump bowl liquid level were not designed as a facility for sampling the pump bowl gas. However, the invention of a freeze-vJve capsule sampling device2 (mentioned earlier for salt samples) made it possible to obtain useful samples from the gas rer»on tvithm the spray shield. It was required that the sampling device be small enough to pass freely through the bends of the I'/j-in. diam. sampling pipe and that it should operate automatically whr- *t reached the pump bowl.
The device, the original form of which is shown in Fig. 8.1. operated satisfactoril} to furnish ?0- .- samples of gas. The capsule was evacuated and heaicti to 600°C. then cooled -inder va.-jum to allow the Liifc.*F4 in the seal to freeze The double snl prevented loss of U 2 B e F 4 from the cjpsui- during sampling. The weighed, evacuated capsule wa» lowaei into the vump bowl through the rait sampling pip. ;?*.! positioned with the bottom of the caput' I in. alcove the fuel salt kvel for 10 niin. The freeze sea! mff«d ar the 600°C pump bowl temperature. a r t l gas Tilled the 20-cc volume. The capsule was hen withdrawn to 2 ft above the pump bowi «nd J'owed 13 coo'.
The cooled repealed capsule was withdrawn from the sampling pipe and (ransporled in a carrier to the analytical hot cells. A Teflon plug was placed over the protruding capillary, and the ext ;ri>r of the capsule was thoroughly .'.ached free o. f i & t i product activities. The top of the capsule was cut jff. and tiie interior metal surface was leeched with basic and acid solutions for I hr. The bottom of the capsule was then cut at two levels to expose the bottom chamber of the capsu'«*. i'he four capsnie piecrs were placed in a beaker and thoroughly leached , w i th i S H N 0 3 until (he remaining activity was less than 0 11 of the original activity. Th: l!i?c? leach solutions were analyzed rydiochermcally.
VOLUME 20 cc
Li28«» r4
0RNL-DW6 C T - 4 7 M 4
STAINLESS STEEL CABLE
\-itt. 0 0 NICKEL
NICKEL CAP.UARY
Fif. 8.1. Freeze valve capMie.
Using this device the first gas sample was obtained in late December 1966, during run 10. In all. eight such samples were taken during ope-.(ion with 2 3 i M fuel. Data for these samples are shown in Table %.i ( i t the end of this chapter).
8.2 Validity of Gat Samples
There are at least two particular qjestions that should be addressed to the data obtained on 52s samples.
First, do the data indicate that a valid sample cf pump bowl gas was obtained?Second, what fraction of the MSRE production of any given fission product chain is represented by flow to off-gas of a gas of the indicated omposition?
49
The first question was approached by estimating the activity of S04ay * 5 Sr resulting from the stripping of 3.2-min * *Kr into the umpbowl purge gas For example, the activity of lull-power samples 11-46. 11-53. and 12-26 averaged 3.8 X 10* dis/min for " S r . indicating that the gas contained 2.0 X 101 J atoms of " S r per cubk centimeter of capsule volume. If the only losses of " K r were by decay or 1007 efficicit stripping in the pump bowl, then
" K r strippcd/min _ F
" K r produced/mm F + X where X is the decay constant of 3.2-mm " K r (0.2177 min " ' ) . F is the fraction of fuel .ol-ume that passes through the pump bowl per minute; for 50 gpm spray flow and 15 gpm fountain flow ind a salt volume of 72 cu ft. F =0.121 Thereby, FHF+ X) = 0.357. At nominal full power of 8 MW and a fission yield of 4.797. the rate of production of " K r is 7.25 X 1 0 ' 7 atoms/min. Thus 2.59 X 1 0 ' 7
atoms/min enter the pump bowl. Heliurr. purge flow at the pump bowl temperature and pressure is 8370 cc/mhi. so that the gases mix for a concentration of 3.09 X 1 0 ' 3 atoms of **Kr per cubic centimeter. With agas space in the pump bowl of 54.400 cc. the average concentration in the well-mixed pump bowl is 1.28 X 1 0 ' 3 atoms of " Kr per cubic centimeter. The difference between this and the entrant concentration represents the " R b and " S r produced in the pump bowl gas phase. Doubtless most of these atoms return to the salt.
T ie observed concentration. 2.0 X I 0 1 3 atoms of " S r per cubic centimeter of capsule volume, is somewhat greater than the calculated average " Kr concentration in the pump how! gas (msx-mum. 1.3 X I 0 U atoms of * 'Kr per cubic centimeter of pump bowl gas). Possibly some o» the " R b and " S r atoms from " K r decay in the pump bowl remained gas-borne,
entering with the sample. The concentration of " S r in the luel salt was about 1.2 X 10'* atoms/g. Thus all of the observed " S r activity in these gas samples corresponds to about 2 mg of fuel salt per cubic centimeter of gas. However, the " 5 U contents of these samples were 9. 23. and 25 ug per 20-cc sample, and the salt contained about 15.000 fig of 2 3 , U pe; gram, implying entrained fuel salt amounts of 0.03.0.08. and 0.08 mg/cc. Very possibly, mists containing fuel salt couM remain stable within the relatively tranquil san.pler shield for a time sufficient to accumulate on their surfaces much of the gas-borne " R b and " S r and to enter the capsule with the sample gas.
Two other gas samples (11-42 and 12-7) were taken while the system had be*n at negligible po*er for several hours. ConcentraiRjfu of "Srwere about an order of magnitude lower (0.06 and 0.23) in accord with the above viewpoint: of course, purely gas samples should go to zero, and purely salt samples should be unaffected within such a period.
Thus we conclude that the samples arc quite possibly valid gas samples, probably with son*? mist involvement.
The salt-seeking elements, including zirconium, cerium, and uranium, do not involve volatilization as a means of entering the gas phase. It is shown in Table 8.2 that an individual gas sample contains quantities of thes? elements equivalent to a common magnitude of inventory «alt. Thus the conjectured presence of salt mist in the gas samples appears verified.
The noble metals appeared in the p s samples in qualities that are orders of magnitude higher fin proportion to inventory salt) than was found for the salt-seeking elements.
Thus appreciable quantities of noble metals are involved in the gas-phase samples. I f they are rapidly stripped as a result of volatility, then the observed concentrations represent the stripping of a major part of the fission products in this way. However, the volatile compounds of these dements thermo-dynamkaly arc not stable in the fuel salt. I f the noble metals are not volatile, then some form of aeiosol mis. or spray is indicated. The relationship in this cas.> between aerosol concentrations wit.iin the sample, shield, in the gas space above the violently agitated pump bowl liquid surface, and in the shielded approaches lo the off-gas exit from the pump bowl have not beer, established. However.3 in the pump bowl pioper. "the spray produced a mist of salt droplets, some of which drifted into the off-gas line at a rate of a few grams per month" (3.6 g/monlh is equal to 10"' g of salt per cubic centimeter of off-gas flow). As we shall see. in the samples taken during " 3 U operation, the quantity of gas-borne salt mist in our samples, though low. was higher than this.
8 J DouMe-Wal Freeze Valve Capsule
A number of gas samples were taken during 1 3 3 U operation using the freeze-valve capsule, with capsule volume of 30 cc: results are shown in Table 8.3. These extended across run 17. However, mam aggressive acid leaches of the capsule were required to reduce external activities to values assuredly below (he contained sample, and sometimes !c::V*ge resulted. T J relieve this and also to provide a more certain fusible Vacuum sell.

so
the double-walled capsule sampler shown in Fig. 8.2 was employed. This device contained an evacuated copper vial with an internal nozzle sealed by a mldeicd ball. The nozzle tip was inserted through and welded at the end tc an outer capsule tip. A cap was welded to the top of the outer capsule, completely protecting the inner capsule from contamination. In practice, after a sample obtained using this device was transferred to the Hjgh Radiation Level Analytical Laboratory, the tip was abraded to : ree the nozzle, and die upper cap was rut off, permitting the inner capsule to slide directly out into a clean container for dissolution without touching any contaminated objects. Usually the part of the nozzle projecting from the internal capsule was cut off and analyzed separately.
Samples 19-77. 19-79. 2T>9. 20-12.20-27. and 20-32. in addition, employed capsules in which a cap containing a metal felt filter (capabk of retaining 100% of 4-fi particles) covered the nozzle tip. This served to reduce the amounts of the larger mist particles car.ied into the capsule.
Dab from all the gas samples taken during the l J J U operation are shown in Table 8.3. Reactor operating conditions which might affect sa-iiples are also shown. The data of Table 8 J show the activity of the various nuclides in the entire capsule (including nozzle for
OW»t-0«G 70-tTM
cuTfon SAMPLE REMOVAL-
A I> i >
• '
A0RAOE FOR SAMPLE REMOVAL—•>
-MCXEL OUTER T U K
VACUUM
COPPER NNE* CAPSULE
.—BALL RETAWfR
BALL WITH SOFT SOLOEft SEAL
T - -C0PPE* NOZZLE TUBE
Fig. 8.2. DMMC-WWI ample rapnwe.
dowM*waHed capsules), divided by the < Some attributes of a number of the samples are of interest.
Samples 19-23. 19-37. and I9-S6 were taken after the power had been lowered fix several hours.
Samples 19-79 and 20-32 were taken after reactor shutdown and drain. Some salt constituents and noble metals sti l remain reasonably strong, unplyiag that the salt mist is fairly persistent.
Sample 70 was taken "upside down'1'; strangely, it appeared to accumulate more salt-seeking elements. Samples 19-29. 19-64, and 19-73 were "control-samples: the internal nozzle seal, normally soldered, was instead a bored copper bar which did not open. So data are only from the nozzle tube, as no gas could enter the capsule.
8.4 Effect of Mist
As it was evident that all samples tended to have salt mist, daughters of noble gases, and relatively hueh proportions of nobie metals in them, a variety of ways were examined tc separate these and to determine which materials, if any, were truly gas-bome as opposed to being components of the mist. It was concluded that the lower pat of the uv/zic »ube (external to die gas capsule proper, but within the containment capsule) would carry mostly mist-borne materials: some of the;? would continue to the part of the nozzle tbhc that extended into the internal capsule, and of course was included with it when devolved for analysis. The amounts of salt ••» nozzle and capsule segments were estimated for each w \p !< by calculating and averaging the amounts of inventory" salt indicated by the various salt- seeking nuclides.
For all nuclides a gross value was obtained by summing nozzle and capsule total and dividing by capsule volume. The "pet" value for a given nuclioc was obtained by subtracting from the observed capsule value an amount of nozzle mist measured by the >all-seeking elements and nuclides contained in the capsule: the amount rrmaining was then divided by capsule volume.
This was done for all gas samples taken at power during runs 19 and 20. The results are shown in Table 8.1. expressed as fractions of MSRE production indicated by the samples to have been gas-bome. with gross values including, and net values excluding, mist. Median values, which do not give undue importance to occasional high values, should represent the Jala best, though means are also shown.
The median values indicate that only very slight net amounts of noble metals (the table indicates , 0 * R u a s a

SI
ropcnXttu)
hotope Gross*
Number
Net » M e * .
Slrippu*/ hotope Number Ranee M a l a * Mean Number
Net » M e * . leak*)
botopeswMh C M l h
" s . , , 7 C , " Y ' - t o
13 I I 13 13
0.3 17 6 - 9 «
0.005-3 0.005 0.4
5.2 22 o.oa o.ot
6.5 1 1 3 3 1 6
0.3610.17 0.IC 10.02
I I 9
I I I I
0 .06- IS - 1 . 6 - 9 1
-0 .11 - 0 . 0 * - 0 . 0 0 4 - 0 . IS
3 23 0.003 0.027
5.7 1 1.2 2 5 1 6
0 .00610.010 0.05610.013
14 I t 0.07 0.16
» 5 2 t I 4 I „ , 4 4 C $
M 7 N .
( 3 13 13 9
0.002-0.3 0.002-0.2
0.01-1.7 0.0001 0.1
0.04 0.009 0.22 0.012
0.05710.014 0.025 10.011
0 .3210.09 0.021 i 0.007
•Om J * - - V__w* E w H r
I I 10 I I 9
M e t r i t e s
-0 .007-0.05 -0 .03-0 .005 -0 .12-0.42 0.01-0.01
0.006 -0.0003
0.007 -0.001
0.01210.004 -0 .00310 .003
0 .0510 .03 0.00210.002
" N b " • I . " ' A , ' " i t . ' • ' I t .
13 13 13 13 13
0.07-7 0 . 1 * - I S 0 .2-20
&.3 I -20 3.» 67
0.7 1.0 1.5 I.S
13
1.910.5 2 .710 .9 4 . 0 1 I . I 4.3 1 1.2 2 2 1 4
I I 11 I I I I I I
- 0 . 2 - 3 . 6 - 0 . 6 - 7 . 3 - 0 . 9 - 4 . ! 0 .05-10
- 2 - 3 6
ov 0 3 0.3 1.1 6
0 . 9 1 0 . 2 I J 10.5 0 . 7 1 0 . 3 2 .310 .7 1 1 1 3
TtOirium fc>*Kb0t0r«
" • T e
m l
13 13 13
0.3 2 ' 0.03 2« 0.04 6
l.ft 1.0 0.8
5.1 1 1.5 3.5 1 1.2 1.610.4
11 I I I I
- 0 . 1 1 - 4 - 1 2 - 2 - o ; 2
0.1 -0 .4
0.2
1 1 0 . 1 - I 1 0 J 0 . 5 1 0 . 1
•Gross includes capsule plus nozzle isotopes. *Net include* capsule isotopes onl> less proportional quantify of material of nozzle composition, for the c m . sample. rTm* a the percentage of MSRE pro.'.elm of the chain IlM is pfcstiil. at the aoMe^as precursor of the
avcra** ms m lami V*~ rag) the ; .mp bo»t, if complete strippi*; occurs ia tat ifsaWty while m the puav bowl are not iw.huhu'.
t pump bowl. Daujhum of the aobfct m» resultiag from
possible exception at 3%) arc to be fount? as actually gas-borne, ard little or no tellurium and iodine. The quantities of " S t <3^) and , 3 7 C s ( 2 3 7 ) a . e undoubtedly real ana do indicate gas-borne matci*i. Com-paiison with the values indicated by calculalkm assuming complete stripping of noble gases on passage of salt into the pump bowl (147 for " S t . 18* for l , 7 C s . 0.07% for »'Y. and O.lfVtf for M 0 B a ) show that oirserved values in the gas phase are below fully stripped values by moderate amounts except in the case of , , 7 C s . The low value, roukJ result from some additional holdup of the gases in the sampler spiral, and high , , 7 C s values could result from the gic?ter volatility of cesium, which might permit (his. as a product of decay in the pump ho vl. to remain uncondensed. Though we doubt that these arguments could stietch enough for the data to fit perfectly, the magnitudes are right, and we conclude that the net values for " S r and l , 7 C s in (he gas arc real and are reasonably correct.
The gas tamples thereby indicate that, except for •luclides havir.; noble-gas precursors, only small fractions of any fissi-Mi product chain should be carried out of tte pump bowi with the off-gas. with mist accounting for the major part of the activity in samples. The amount of salt carried out with off-gas as mist has been estimated3 as "at most a few grams a month." Far lower mist concentrations than appeared in our samples, which were taken within the san.pler shield, are indicated for the off-gas. We conclude that the "net" median column, which discounts the mist, is the best measure furnished by our gas samples of the fraction of the various chains leaving the system with the off-gas.
REFERENCES
I. S. S. Ki«'!i '...: F. F. Bbnkenship. "Pump Bowl VolaliHiation and Platbg Tests." MSR Program Semi-«mnu. ttnp. Rep. Aig. 31. 1966. O R N L - 4 0 J 7 . pp. 169 71 .
52
2. S. S. Kinfe and F. F. Bbnkenship. "Freeze Vate Capsule Experiments." MSR Proprnm Stmmtmi. hop Rep. Feb. 28.1967. 0RWL-4119. pp. 139 41
3. J. R. Engel. P. N. ttoubcnieich. and A. Houtzeel. Spray. Mia. Bubbles, mnd Foam in ike MtJ'cn Salt Reactor Experiment. ORNL-TM-3027 (June 1970).
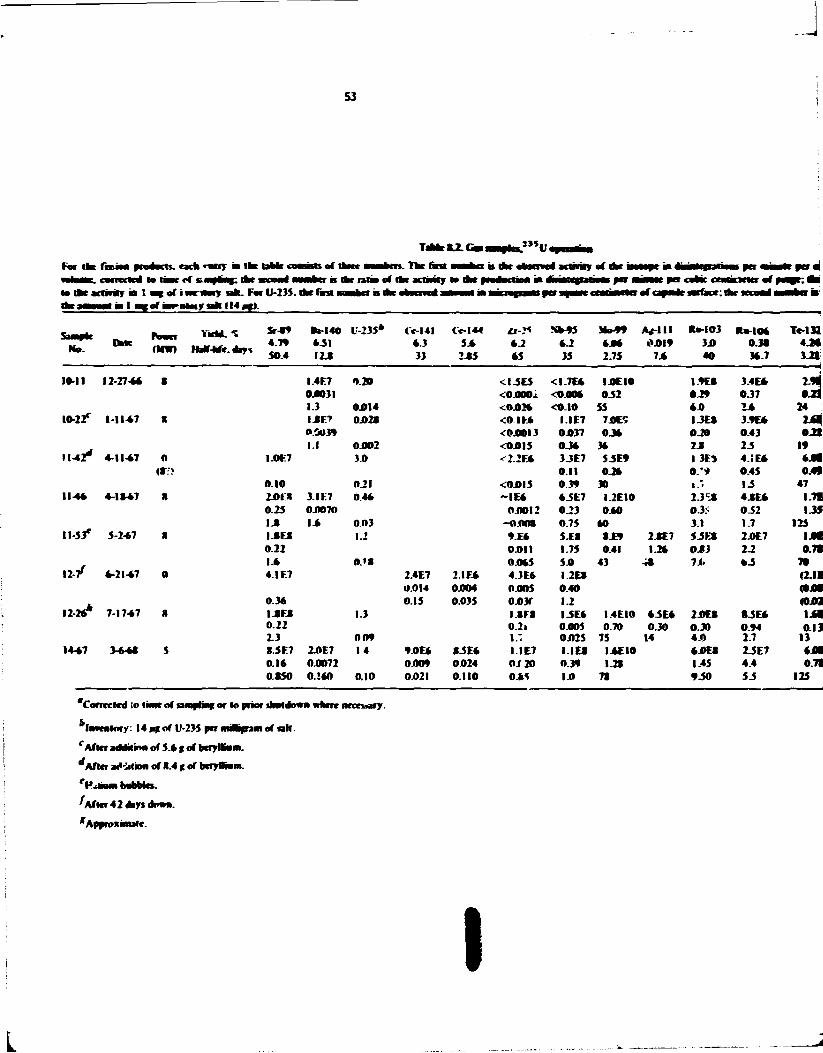
S3
. " * For the fouoo pronncu. each >«T «• the table niiiiiti of three OOOMBC. t o m r i to line of wanting; the mcamt nasher B the ratio of to the arririrr in I • * of itorNory ah. For U-235. the lint HKMHMI m I t u r f w - M w y n m u ^ )
Power YieM.'S *•" te-140 U-235" t"e-141 Ce- I * t li-j* Nfc-W Mo49 Arf- l l l lto-103 Ra-106 T«-1JJ
No. D M C
Power ItaV-Wc. o^y t _^ 4.51
I 2 J 6.3 33
5.4 IMS
4.2 45
4.2 35
6Jtt 2.75
0 J 0 I 9
7J4
3i» 40
0 J S 34.7
4 . M
10-11 12 27-44 • I.4E7 0.0031
1.20 < I J E 5 <0.000x
<1.7E4 < 0 J M 6
I J O E I O 032
I.9ES 0 J 9
3.4E6 0 J 7 ^
1.3 0J014 < O J 0 2 6 <0.10 55 6 JO 2 4 24 10-22? 1-11*7 X tSFS
0.5039 0.02» < 0 I E 6
< 0 J » I 3 I . I E7 0 J 0 3 7
7J0ES
0 J 4 I J E S 0JO
3.9E6 0.43
2J61
9M
M ^ I.I 0.002 <0J>I5 0.34 34 2 J 2.5 19
M ^ 4-11-47 0 I.0F7 3.0 <2.2E6 3JE7 5.5E9 1 3E* 4.SE6 6 J M
lr:> 0.11 0.26 0 . ' * 0.45 0.41 0.10 0.21 <0J»I5 0.39 30 %'t \S 47
11-46 4-11*7 » 2.01» 3.1*7 0.46 - I E 4 4JE7 I .2EI0 2J C J I 4 . IE6 1.71 0.25 0.0070 0.0012 0.23 O J M OJ:: 0 J 2 1JS 1 * 1 * 0 0 3 -OjflOS 0.75 40 3.1 1.7 125
11-55' 5-2-47 II I.SES 1.2 9.E4 S.ES ».E9 2JE7 5-5E» 2i>E7 IJME 0.22 0J0I1 1.75 0.41 1.26 0 J J 2.2 0 .7*
1 2 - / 1.6 0. '« 0.045 5.0 43 -» IS. 6.5 70
1 2 - / 4-21-47 0 4.IF.7 2.4E7 2.1 E6 4.3E4 l - 2 » a n 0.014 0.004 0.005 0.40 «tm
12-26* 0.34 0.15 0.035 04>3f 1.2 loin
12-26* 7-17-47 » I J F J 1.3 I . IFS I.5E4 I.4E 10 6 5 E 6 2 JOES S.SE6 I J H 0.22 0.21 0.005 0.70 0.30 0.30 0.94 0.13 2.3 0 0 9 i . : 01125 75 14 4.0 2.7 13
1447 3-4-4S 5 8.5E7 2J»E7 14 9.0E4 •-5E4 I . IE7 L IES I 4 E I 0 6.0ES 2JE7 6 J N 0.14 0.0072 OJ0O9 0.024 0 J 2 0 0.39 l.2» 1.45 4.4 0.71 O.tSO 0.140 0.10 0.021 0.110 o.» l i ) 71 9.50 5.5 125
'Corrected io lime of sampting or lo ft Inventory: 14 *f. of U-235 per eAfter adntrm of 5.4 it of bcrylham. *Af ler at*ill ion of S.4 % of beryMnm.
H nom bnoWes. ^Aflcr42d»rsdown. ^Approximate.
ihwldown where nccebary.
of ah.
I
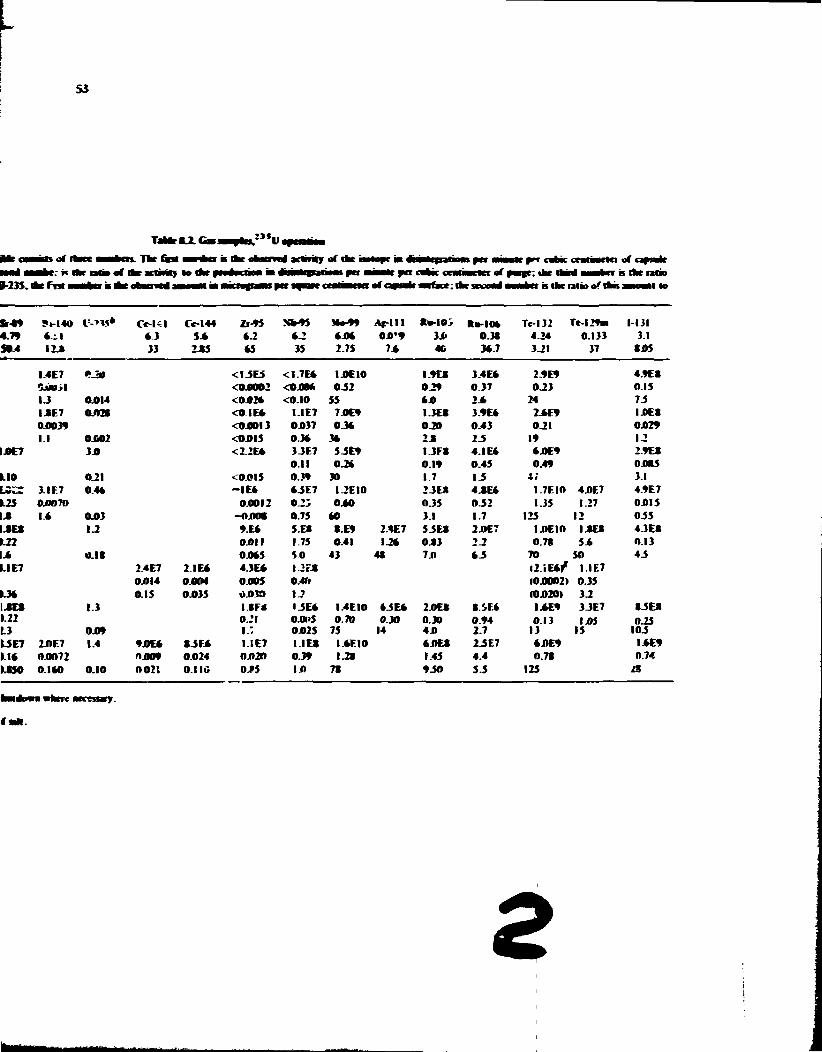
S3
•MM) BBBBC: rt IMC OB> o f IBC JttB*l» M> IB* BRMMKOBB Wk SBBBfBntBMB f t t BBBBk BIT CBBJC 11 i j — III of BBIft: ike Ihinl BBBMCT B IBC M B 1^235. lBtfl«BBBBPBBMrohBjnCB»BWBBIBI«Bril iyMBI>ri BBMBC IIBBBIIIII o f TMJIBll BBfacC;llM-BXTOB< BBBB«f B t l » lalitt of IBB IB1 • • ! lo
Sr-W S.-I40 I W * Ce-UI Ce-144 Zf-*$ S W 5 Mo-99 Af-l l l KB-103 RB-104 Tel 32 Te-I29ai 1-131 4.79 4-il • 3 5 * 4.2 4.2 4J04 OJO'9 3i» OJt 4.24 0.133 3.1 50.4 12.* 33 2*5 •5 35 2.7S 7 * 40 34.7 3.21 37 • 4 5
I.4E7 *_a* <I_SE5 <I.7E* IDE 10 I.9EI 3.4E4 2.9E9 4.9EB Cimil <0.0002 <OJ0O4 0.52 0.29 0 J 7 0.23 0.15 1.3 OJOM <OJ02* <0.I0 55 4J0 2J4 24 IS l.*E7 0A2t <0IE» I.IE7 7JOE9 I.3EI 3.9E4 2J4E9 IJOES
O0039 <OJOOI3 OJ037 0 J 4 0.20 0.43 0.21 0.029 I.I 0.602 < 0 J » I 5 0.34 34 2 * IS 19 l_2
IJ0E7 3.0 <2.2E* 3JE7 0.11
5.5E9 0.2*
I.3FS 0.19
4.1 E4 0.45
4.0E9 0.49
2.9EI OJNtS
110 0.21 <0J»I5 0.39 30 1.7 1.5 47 3.1 LvCC 3.1 E7 0.4* - I E * 4.5E7 I.2EI0 2JE* 4.SE4 I.7EI0 4.0E7 4.9E7
us 0JJO7O 0.0012 0JJ 0.40 0.35 0.52 1.35 1.27 0415 4 1.4 0J>3 -OJOOB 0.75 40 3.1 1.7 125 12 0.55
IJES 1.2 9.E4 5E> S.E9 2*E7 5.5 ES 2.0E7 IJIEIO IJEt 4.3ES U 2 0.011 1.75 0.41 1.24 0 J 3 2.2 0.7S 5.4 0.13 J4 0.18 0.045 5 0 43 4* 7 0 4.5 70 50 4.5
1.1 E7 2.4E7 0.014
2 IE* 0.004
4.3E* 0.005
1.27* OAll
<2.iE4f 10.0002)
I.IF.7 0.35
(J* 0.15 0.035 I>J039 !.? (OJ020) 3.2 IJES 1.3 I.SF4 I.5E4 I.4EI0 4.5E4 2.0E» S.5E4 I.4E9 3JE7 i J E * 1.22 0.21 0«>5 0.70 0.30 0.30 0.94 0.13 105 0.25 U OJ09 I.: 0.025 75 14 4D 2.7 13 15 10.5 U E 7 10E7 1.4 9JOE» S.5E* 1.1 E7 LIES 1.4F.I0 4.0EI 2JE7 4JOE9 I.4E9 >.I4 0.0072 noat 0.024 OJ02O 0.39 1.21 1.45 4.4 0.7t 0.74 USO 0.140 0.10 0 0 2 ! 0.1 IC 0J»5 l i l 7S 9.50 5.5 125 a
f a * .
2

BLANK PAGE
- -.,---. ••-->-v^-*nr;*r^^JW?&*rsW.'*W»»WH^^

54
r*,i •• *-2I3«
T " H mi I i HtS-24 3444 w-ivta 4.1
FPI5-*3 FUS *> »m 3444 ;4-29-u i n •J 4.1
VBah.*
424C 1.4 • 4 4 3.34 He O B
-.IS9 0 J I 74 444 3.34 N Oa
111
14 • 4 * 3.34 Nr OB
11-12-4 • 1 *m ua» * 2 J 4 4 4 •m j j » i k ©•
Fns-71 f»I7*. FW7-I7
11-2744 1-22-49 14 4*74 • 4 3 4 4 * I I M K M 43.24 M 3.7 2-2 • 4 * * M 3J0Hr 3-34 I k O B Oa
444 MM SSJ4 14 • 4 4
O B
FW7-2J 3444 3-14-49 72M4 7J4 •42 5*4* 14 444 3J»Mr OB
IW
Sr-44 S244 5.44
ft* •42*444 544
Y-41 SS44 5.57
•B-144 1244 5.44
C»-IJ7 I445444 450
t>14 l 33.00 7.0*
Ce-lV. 2»i.?» %M
N4I47 I I 10 m
2>9S •3.0 4.05
Nb-9S 35.00 4.05
J*>49 Z79 4.49
R B - I 0 3 J440 1.99
R B - I M 34740 0.43
AC-HI 7 JO 0.02
J4-12S 94440 0.00
Tc-I29n 3440 033
T*-I32 3-25 4.40
1-131 105 2.90
U-2?3
l i
4f
i4i rr 4.70ES 4.1064 547E4 3_SE» I.44E4 443C7 1531 4*7E*
44479 •413 I2-9W •74 247E*
13444 434
1194 449 2J4ES 22424 443E4 23.727
I.ISE4 11.34*
2.21 rr 343E7 1.34E4 S47ES 247E7 9.I7E7 •J4CS M30 •927 3244 194 4570 22J5»
IJ7ES 9345
1*5.594 JJ7E4 0.475
•43E7 S.S0ES 1.HE4 4.43E} 3.19E7 7.47E« 744E5 1744 11424 0.254 0.154 7M 194*4 15474
2.2K7 544
2.26E7 •-43E4 2.93E3 1.43E3 543E* 3.I4E* I.23E4 1524 7.024 0.244 0.143 447 25.923 3IM I.23E4 I.5IE7 I.4K4 I.99E* 447E* I.ISES 443Et «.i4C7 14.171 1524 145 l*i 44.205
7.S7E* 315.27*
14.713 44.775 2.3U9 IS.740
1444 3JOE9 41.744
3JOE7 I07F» IJ5E* •47E7 35411 25440 7519 2992
1.991:7 5.I0E4 1 WE* 3.32E7 447E4 740E4 5.13E4 3471 91* 342 4303 1010 150* 944
UIE7 24 J44
103E5 I.70E5 7109 151*
3.24E* i*?jr*
4.47E7 •7434
I.24ES 37,24* 547E9 49.71*
4.97E7 19.244 ».57f4 109.404
I4.E9 l.3*E* 4.73Et I42E9
SaftcowM • » • »
3.3*9419 4003 4940 14440
04044 0.1 It: 04231 04010 M2 17.704 34*1 149
2.9447 25415 0.2000 2994

ss
B»H IllOOgl i-DOi
R M M I I I K I N
FTiT-ji m«-M m«-is m t - n -Fna-zs rm-29 H I« -«2 3M* 740 34-OB 7 j a 7JO 7 J t 740
S+4* 5*-4» 5-12-OT 5r174* J-21-4* S-2*-** JJ» H4J09.0 M4S20 I7I43J* I 0 M 2 J 0 M4A94 I9*790>
040 f-00 MO 730 T M 7J0 * * • uo» n a * i i a * noo 9*0 l i t * • * • * * * » 43.40 « 0 M 40J0 SS.90 M M SJJ i 4 4 JJ4 2-2 l i 4X1 I J 0 * • J W O J M 040) O M • * • 040 0 4 0 IJONr J JO Mr JJCIk MO lie H O * 3J09k 2J00Jr O B Ok Oa O B O B O B O B
r v
S.4*
v-9i * " «J?
h-140 turn 5.4*
I V I 3 7 I * J >
< C - I 4 I 33JOJ 7119
C"e-I44 2 M J M 441
Zf-OS 45 J * 4-OJ
• M S njm *BS
l*>99 270 4.00
RB-103 39.40 1.99
lta-104 347.00 043
A r m 7.50 0.02
Sk-125 99*00 0-00
Tel 29m MOO 0.3)
T«-I32 3 25 4.40
1-1)1 f 0 5 2 90
S*0i4 2J4E4 2 3 K 7 IS4»7 S94> ma 199 124 143*4 1 5 4 * 4 IC3E4 • J 1 7 M.420 9371 I . J M 1-344:7 34344 349*4 $7 OS* W2 19.423 10440 1 1947 4.9944 142*4 IBM* 24JT 910 471 » ) 5 J 7 I 5 9 * 1 4 3 347E3 J.7T7 34*9 2.144 S.33ES 3.7*45 1*045 5J4 5 M 3 3 4 MUM 1*34 9 » )
IOM 5 44*45 1721 4493
2 J S I " IJ5»7 1451 • 2B447 4210 224 2134 2*1 S.*3Et I.I4E9 S 4 * t 9 I-I4C9 3032 •744 41424 7407 I-37E0 1 0 4 M I.73E4 4S4C7 3*04 2402 3M7 I4>) 0.43E4 4.92E* • 131* 19SE* 1509 •34 1503 49) I44E7 0.27E* 241E7 I 4 I F * 27.170 11430 21.191
i 5 « t 5 421
2302
J TOM •-9&C4 i.rru 2.32E7 54.917 11)5 14.152 2*13 I . 43U0 3)5111 4*3E4 1.91 E9 122.55* 2.720.450 5)4*5 13.354 2.55M 2 2 3 M • T7E4 I.97ES 3140 2400 10.102 21*2
3.99E7
3 2 3 t t 4 J J O 24*5 3293 2 4 K 4 4.12*4 33.4M 34303 1 ) 3 * 7 2J0SU 142 13734 4 4 * 1 4 3 J K T 7*2 SIS* * I 4 » * 2 5 9 4 * *-272 1 ) 9 9 9 713*3 1-30*4 ' 2 BIB 24-IBB • J 9 M 4 744J *4SS 3.44) 194*7 4 4 7 4 7 244 519 I.5IE9 1 I 0 » 10405 17 J i t 4.4717 4.73E? 912 1771 I-9SE* 4.ISE* 320 •74 4.20E* 4.27E4 5743 4334
922E4 4.77E7 1001 5594 4 . 3 2 U I53E* )I54 13.745 I.47E0 I.SSE* 1054 1094
noon* 0.0001 001102 00001 95.402 12.274 34540 17*44 1.1053 0.0047 1*3)3 00042 10.242 57.720 14.141 34.430
ami 0 0 0 0 * 17.444 07.049 0.3077 0.0942 2444 •33
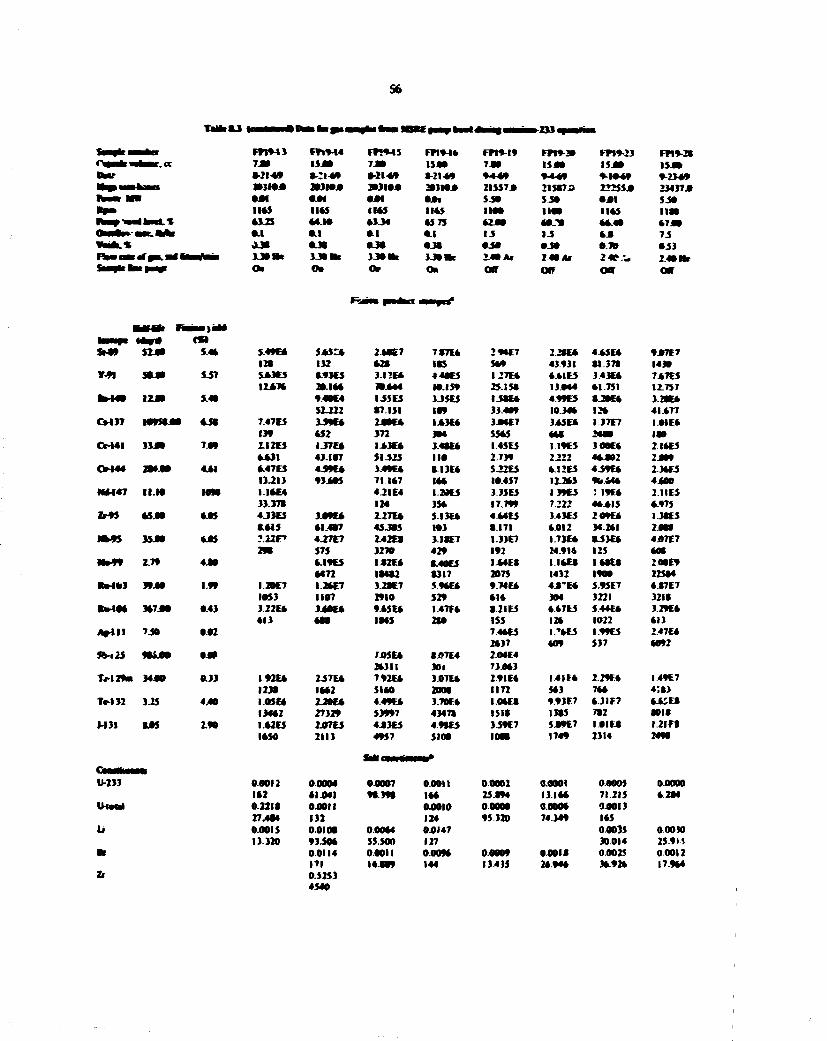
56
TaMtfcJt T * • • ! — • » 1 • -233«
FWO-M rr*9-is rm-io i s * * 7*0 is*o 0-:i-49 0-2149 0-214* 2 0 3 M * 20310* 20)19* • * < 0 * 1 0 * i • I tS IMS 1145 •4.14) 43-34 45 75 Oil 0 1 9 1 0.30 * J * OJO SJOOk 3-MHt JJONr O* Or OB
FW9-I9 FM9-30 FM9-23 F»19-2S 7*0 is*o is*o ISJ* 9 4 4 9 9 * 4 9 9-I049 9-234W 2ISS7* 215073 2225$* 23437* S-S* S-SO 0 * 1 SM 110* 1100 1145 US* 42*0 40L9 44.40 47JW 15 l_J 4 * 75 •S» O-SO 0.7* 433 2 * 0 A i 2-40AI 24T.U 2 40 Mr Off OP Off Off
• M * . 1 u? SMO sua 5 4 * S-49C4 5*514 240E7 7S7E4 294E7 2J0C4 4.4SE4 **7E7
120 132 420 I0S 549 43.931 01 374 1430 Y*I 3 0 J 0 SJ7 5J43ES 0-93CS 3.1?E4 440E5 I27E4 441E5 3.43E4 74TE5
12474 20.144 70*44 10.159 25.S50 13*44 41 751 12.757 04H40 I 2 J 0 5.40 9.49E4 U S E S 3J5E5 I30E4 4.99ES 0J0E4 3.20E4
52 222 07.151 109 33.409 10344 124 41.477 CM 17 mum 4 J 0 7.47S5 3.SOE4 2*0*4 l*3E4 3*4E7 345E4 I.37E7 1*1 E4
13* 452 372 304 S545 4W 2400 100 CM4I nm 7*9 1I2E5 IJ7E4 l*3E4 3.40E4 I.4SE5 II9E5 300E4 2I4E5
4431 43.107 51525 110 2.739 2.222 44J02 2J09 C N 4 4 204*0 441 447E5 4.59E4 3.49E4 0.I3E4 S.22ES 4.I2E5 4.59E4 2.34E5
13.213 03*05 71 147 144 10.457 12.2*5 9b.&44 4*00 M H 4 7 l l . l t MM 1 I4E4 4 J I E 4 I.20E5 3.35E5 I39E5 I 1914 2.IIE5
33.370 124 3S4 17.799 7.222 44*15 4.975 W S 45 J * 4*5 4J3E5 3J9E4 2.27E4 S.I3E4 444E5 343C5 209E4 I.30E5
0*15 41.407 45-305 W3 0.171 4*12 34.241 2*00 N M > 1SJW 405 ?.22F» 4J7E7 2.42ES 3-IOE7 I.33E7 I.73E4 0-53E4 4*7E7
290 575 327* 42* 192 24.914 125 4*0 W^TT m 4JO 4.19ES IJ2E* 0.40E5 I.44E0 I.I4E0 I40E0 200E9
4472 10402 0317 2075 1432 1900 22504 •k-103 39*9 I.f* I.2M7 I24E7 3-2JE7 .V94E4 9.74E4 4*~E4 5.95E7 4J7E7
I0S3 1107 2910 529 414 304 3221 3210 **- l04 Him 0.43 3.22E4 3J0C4 945E4 I.47F4 0.21 E5 4.47E5 5.44E4 3.29E4
413 400 IMS 2*0 155 124 1022 413
*rui 7.50 0.02 744E5 2437
I.HES 409
I.99ES 537
2.47E4 4092
5%-iU mm 0.00 7*SE4 24311
0i»7E4 301
2.04E4 73*43
TM29m 34JO 0.33 I92E4 2J7E4 792E4 3A7E4 2.9IE4 1 4 1 1 * 229F.4 I49E7 12)0 1442 5140 2000 1172 543 744 4 ; i )
Te-132 3.25 4*0 LOSE* 2J0C4 4.49E4 3.70E4 I.04E0 9.93E7 4.3IF7 »*;F* 13442 27)2* 53997 43470 1510 1305 702 •010
M3I •JOS 2.90 I.42E5 2J07E5 4.03E5 4.9SE5 3.S9E7 SJ9E7 I0IE0 I.2IM 1450 2113 4057 5100 1000 1749 2314 2490
0-233 0.0012 0*004 0.0007 0*011 0.0002 0.0001 0.0005 0.0000 142 41*41 90.390 144 25.094 13.144 71.215 4.204 0.221t 0*011 0*010 0.0000 0.0004 0*013 27404 132 124 9 5 ) 2 0 74.349 145 0*015 0*100 0.0044 0*147 0*035 0.0030 13.320 93.504 55.500 127 30.014 2S.9M
0.0114 0.0011 0009* 0-0009 00010 00025 00012 | 7 | 0.5253 4540
14.009 144 134)5 24*44 34-924 17.944
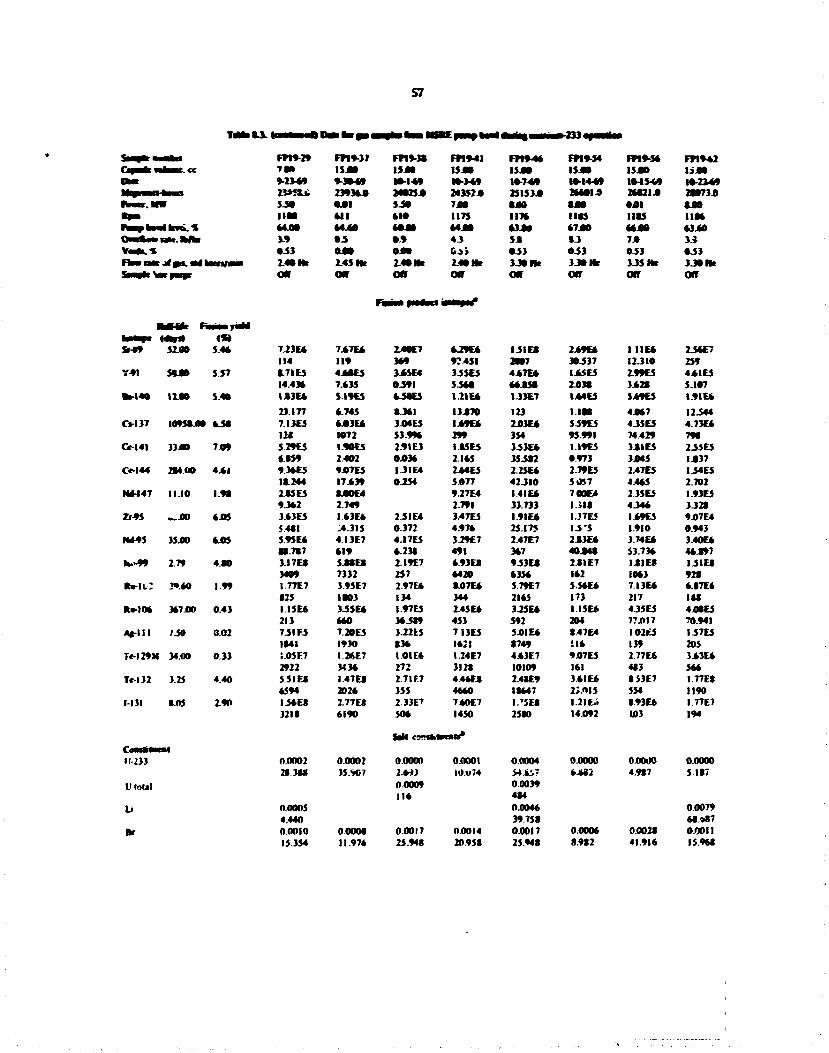
S7
» * J L I
fhm R K of pa. * • btm/aMi
FW9-29 FF19-37 FFI9-3* FW9-41 FFI9-4* FW9-54 FM9-S* FP1942 T » IS44 IS4» I S 4 * I 5 J H 1540 I S M 154* 9-23-*9 *-3fr*9 K M - * * 14>3-*9 M-749 10-1449 1*4 549 M-2149 ZW5SJ. 23*3*4 24*254 243S74 25153* 2*M14 2H214 2*4734 SJt 041 5 - » im •JOB M l • 4 1 •JO n n M l *•• UTS I I * IMS uas I I M M M • 4 4 4 • * * • *440 *34» •744 ttm A3 JO 3.9 • J • 4 4 5 5 4 • J i» 3.9 0-53 0 4 * OJOO 6->i 053 033 053 053 2.4* Nr 2.45 Hr 2 .4* Hr 2.4* He 354 He 354 Mr 3JSHc 3J0Hr Off Off Off Off Off Off Off Off
• • H f C f « V « «» Sf-09 S240 5 4 *
Y-91 59.00 557
Ba-140 12.00 5 40
C*-I37 1095*40 050
Cc-141 33JOO 7 09
Cc-144 204.00 441
N4-I47 11.10 1.90
Zr-95 w 4 0 • 4 3
N M S 35iW MIS
lv-99 2.79 4.00
«.-a: ?9.*0 1.99
*«-10t 347 0 0 0.43
A|t-lll IM 0.02
TC-I29M 34.00 0.33
Tc-132 3.25 4.40
l-l 31 •45 2.90
C M S M M I I 11-233
IKolal
Li
•K
7.23E* 747E* 2-40C7 *_29E6 I 5 I E * 249E* H I E * 25*E7 114 119 3*9 97.451 2007 30537 12510 759 *7IES 4 ABES 34SE4 35SES 447E* I4SE5 2.99ES 44IES 14.43* 7.0JS 0591 S 5 M * * - •$* 243* 342* S.I07 l l ) E i S.I9ES • 5 K S 1.21E* 1J3E7 I64E5 549ES I.9IE* 23.177 •-745 • 3*1 13470 123 i.ia* 44*7 12544 7.I3ES * 4 3 E * 344ES I49E* 243E* S59E5 45SES 4.73E* I M 1072 S3.9H 299 354 9S.99I 74.429 79* S.29ES 190E5 2-91E3 14SES 353E4 1 19E5 341 ES 255E5 6 059 2.402 043* 2.1*5 355*2 0.973 3445 1437 9.3*E5 947E5 1.3IE4 244ES 2.2SE* 2.79ES 2.47ES I54E5 11.244 17439 0.254 5.077 42510 5057 4.4*5 2.702 24SES S40E4 9J7E4 I.4IE* 700E4 2 35E5 I.93ES 9.3*2 2.749 2.791 33.733 1 >l» 454* 3.32» 343ES l.*3E* 25IE4 3.47ES I.9IE* I.J7E5 I49ES 947E4 5.401 .4.31$ 0.372 4.97* 25.175 I 5 ' 5 1.910 0.943 S.9SE* 4.I3E7 4.17E5 3-29C7 2.47E7 243E* 3.74E* 3.40E6 n.7t7 •19 • 23t 491 3*7 4 0 4 a $3.73* 4*497 3.17E» S4SEI 2-I9E7 *.93E* 953E* 241E7 14IE9 I51E» 3409 7332 257 «420 •35* 1*2 10*3 974 I.77E7 3.9SE7 2-97E* •47E* S.79E7 55*E* 7.13E* •47E6 •25 1003 134 344 2165 173 217 I W I.ISE* J55E* I.97ES 2.4$E* 3.2SE* I.ISE* 4.35ES 44*ES 213 660 345I9 4S3 S92 204 77417 70.941 751FS 7.20ES 3.22E5 7I3ES 5.01 E* M7E4 I02£S I57ES 1*41 1930 «3* 1*2! •749 : i 6 139 205 S4SE7 l.2*E7 I.0IE6 1.24E7 443E7 947ES 277E* 3.63E* 2922 K M 272 312S 10109 161 m 5*6 551ES I.47E8 2.71 E7 4.4*E* 2.48E9 3.61 E* • S3E7 I.77E8 •594 2026 355 46*0 11*47 2J.OIS 554 1190 I5*E8 2.77E« 2.33E7 740E7 l. 7SE* 1.21 E i 8.93E6 I.77E7 321 • • 190 50* 1450 25*D 14492 103 194
M l <9?!fMKMr*
0.0002 0.0002 0.0000 0X1001 0.0004 04000 OiJOOO 0.0000 2»3*« 3S.W7 2.*i3
00009 I I *
H)«>74 S4.*S7 0 0039 4(4
64S2 4.9*7 5 187
0.0005 0404* 0.0079 4.440 39 758 *B.»S7 00010 0.000* 0.0017 04014 04017 0.0006 0.002* 04011 15.354 11.976 25.948 20958 25.94* *.9*2 41.916 15 968

58
r U ;« * k « * * i t-233 <
.MW
Owrffe* ate. M/tr Vol* . 2 Flaw rate «rf ft*. adkMn/aMi
FT1944 rao 10-22-69
« i » MM *JOO 3.7 033 3.30 Hr CUT
FM9-4S 15-00 10-2349 282990 too lias 63.40 4.0 0.53 3.25 He OfT
FH9-70 7.ao 10-2849 29219* • 00
nn 4330 5 ) 0.53 3.30 He OrT
FW9-73 7 » 10-2949 29450.0 8-00 1185 43*0 3.2 0.53 3.25 Hr Oft
hn*-rr 15.00 10-3149 29849.0 • 00 11*5 45.00 $0 033 3.30 Hr Off
FFI9-78 15.00 10-3! 49 29859A •-00 117* 43JJ0 4.5 033 3.30 Ht on
FH9-79 15 00 11-2-49 30247.0 000 I I I * 0.00 0.0 0.00 3.30 He Off
bMafc <£«(> « H Sr-09 52.00 544 4.27E4 4J4E7 8.4 IES 10317 ?09t8 1 2IES I02E*
4?«7» 481 7H0 95.540 979 1093 9027 Y-91 TUO 537 i .«2« 48DK5 I.3SE9 5 4215 3.S5E5 4.331.5 SWES-t
1 1 1 * 7.424 I3M9 5.701 3.809 4.271 0.4*4 b-140 i l « » 5.40 1.38E4 4.041* 1 73E9 i.l+i.t' 5.24E4 4.04E4 9.4 ?E4
9JI50 31.558 10444 19.899 31487 34304 0570 CV137 1095800 4.5* 2.82E4 I.53E4 I.3BEB I.2IE4 9.40E5 I.08E4 23JF*
475 25- 17*40 2O0 151 178 38.205 te-141 33.00 7.09 2.71 F5 1 3714 I.I7E9 J.73E5 4.27E4 573E5 6.I8E4
1.919 0.097 7475 2.423 0.397 3.424 0.384 Ce-144 2M.«n 4.41 14415 I.47E4 4.22FS 2.90E5 4.35E4 4.40E5 443E4
2J74 0.254 10429 4.921 0.733 7.420 1.076 SU 147 I I III 1 9k I.90FS 2.1 SE> I.86E4 I.20E3 111*5
3 243 3514 3O.O80 0019 2 M I Zi-95 45 no 4JI5 2.24M l.»i M 8.28F8 3.3115 445K4 1 1614 «. IIE4
2.318 0.184 RU4I 3.180 0.421 10.841 0 540 N6-95 35.WI 4.115 1.4714 437F5 I.37F9 4 7116 5.33F4 3 1514 1 t 'E*
22.925 9.005 I«I69 4> 747 68.906 40.455 18.613 *4>*9 2-79 4.00 • 44E7 4.12E7 3.3 IE9 4.I0E* I.34E8 9.80E7 3.4IE7
514 251 20047 24*6 •07 590 ?M R«-l03 39.40 1.99 Z94E6 I.I5E6 1 26E8 I.43F.7 I52F.7 4.04E4 3.66F.6
•0.203 30.954 3140 402 367 144 86.644 Ra-106 347.00 0.43 2.00ES 4.17E5 4.I5F.6 I.0IE4 1.15F.6 432ES 274E5
34.775 72.223 1054 172 195 76.448 44.202 Ac-Ill 7.50 0.02 3.46F.5 4.67F.4 4.45E4 9.42E5 8.67E4 4.46E4 I.29E5
*5 I M.448 5*17 1114 108 55.611 143 Te-I2*m 34.00 0.33 12*17 4.89F* B.73E7 I.56F.7 I.23F.6 i.42E6 2.I2F.6
1984 ,46 12450 2202 168 195 284 Te l 32 3.25 4.40 7.65 E8 2.43E8 2.09E9 8.27E8 2.12E7 3.7IE7 3.94E7
5103 •422 I3«39 5476 139 244 276 1-131 • 05 290 4.23E7 2.I0E7 7.60E07 8.13E7 I.48E7 6.87F.6 3.6IE7
679 22S SOI 852 154 71.379 382
s* Comtttacut U-233
u Be
00001 10.358
00154 133 0.0023 34.546
0.0003 0.0000 00001 0.0002 42.198 4.987 11.949 26.731
0.06c 7 01890 8261 23417
00029 0.0013 00019 00034 25.530 11.544 (.162 29.437 00005 0.0001 0.0013 7.677 0.998 19.960
1
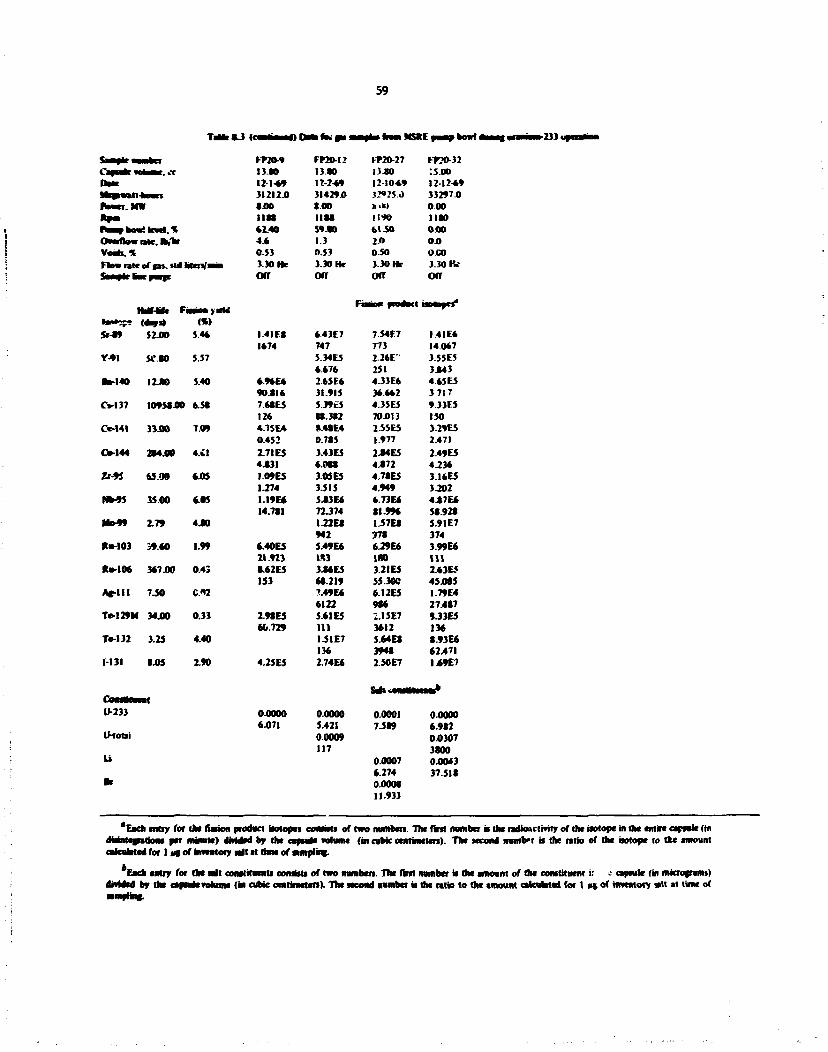
59
t « J ( >- ps aaaaha ham MSKE | »ho*td
•aatl-hoan
rtHBkMtlCKi.% Overflow ate. hVar Votes.* Howraccof gu.x4 Wcn/a
FWO-9 13.00 12-1-69 312124 • 4 0 l l t t 42.40 4 4 0.53 3.30 Hr Off
FF20-I2 13.40 H-2-69 3I429JO *.0O HUM S9.«B 13 0.53 3.30 Hr Off
KT20-27 IJJ0 12-1049 J?*25.0 ».*) 1140 4150 2.0 0.50 3.30 Hr Off
FRO-32 :s.oo 12-12+9 33297.0 000 iiao ooo 00 oco 3.30 IV Off
lyicW I n * : ; : (*•/*> (%) Sf-t9 52.00 5.46 1.41 F.« 6.43E7 7.54E7 I.4IE6
1674 747 773 14.067 Y-91 KM 5.57 5.34E5
6.676 2.26E-251
3.55E5 1MJ
fc-140 I2.K0 5.40 6-96E6 2.65 E6 4.33E6 4.65E5 90.11* 31.915 36.662 3 717
Cs-137 1095100 6.56 7.66E5 5.39£5 4.35E5 9.33E5 126 St.3a2 70.013 150
Cc-141 33.00 7.09 4.7SE4 H.4SE4 1.S5ES J.29E5 0.452 0 715 1.977 2.471
Cn-144 2M40 4.C1 2.7IE5 3.43E5 2J4E5 2.49E5 4«31 6.0M 4.172 4.236
Zr-95 65.00 4.05 I.09E5 3.05 E5 4.7SE5 3.16E5 1.274 3JI5 4.949 3.202
WWS 35.00 605 I.I9E6 S.I3E6 6.73E6 4A7E6 14.711 72J74 tl.996 SS.92*
W&^9 2.79 4J0 1.22ES 942
1-S7B 71%
5.91 E7 374
fts-103 39.60 1.99 6.40E5 5.49E6 6.29E6 3.99E6 21.913 m \m 111
M-106 36740 0.43 • 62E5 3J6E5 3.21E5 2.63E5 153 M.219 S5.30C 45.0*5
A r U I 7.50 C.02 ?.49E6 6122
6.12E5 9(6
1.79E4 27.4»7
TC-I29M 3440 0.33 2-9IE5 5.61 E5 "i.lSE7 9J3ES 60.729 111 3612 136
Te-132 3.25 4.40 1.51E7 136
5.64EI 394«
S.93E6 62471
1-131 8.05 2.90 4.25E5 2.74E6 2.50E7 I49E7
SaH
U-233
IHotai
U
•r
04000 0.0000 0.0001 04000 6.071 5.421 7-5»9 6.912
0.0009 04307 117 3(00
0.0007 04043 SSI
37.SH
'Each entry for the ftarion predict isotopes m a i m of two ngmben. The first number • die ndMnclhrity of the ifotopc in die entire capsule (in diaiiHsgutkms per minaw) dMdfd by the ceprale solnme (in cubic centimeters). The tccond m»mb»r if the ratio of die isotope to the amount calculated for 1 M of amatory adt it time of atmplinf.
Each entry for the salt conatituents conasts of two numbers. The first number is die amount of die constituent r. c cspnilc (in micTojjnm«) dMded by the capsule vokimt (in cubic centimcten). The second number ia die ratio to the amount cakumtoi fot I at of mwntory sstt at time o( tarnpnmj.
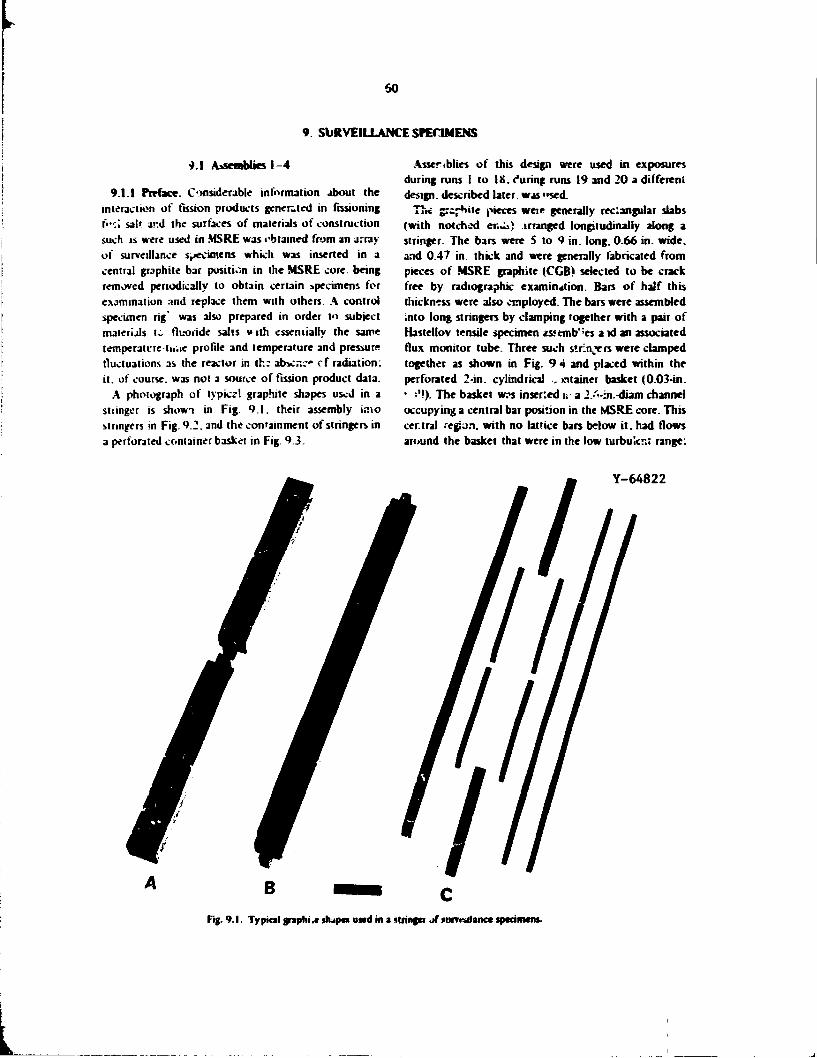
60
9. SURVEILLANCE SPECIMENS
9.1 Assemblies 1-4
9.1.1 Preface. Considerable information about the interaction of fission products generated in fissioning f>":i salt and the surfaces of materials of construction such is were used in MSRE was obtained from an array oi surveillance s^cimens which was inserted in a central graphite bar position in the MSRE core, being removed periodically to obtain certain specimens for examination and replace them with others. A control specimen rig' was also prepared in order to subiect materials l„ fluoride salts with essentially the same temperatrre-tu.ie profile and temperature and pressure fluctuations as the reactor in th: abscr.c* of radiation: it. of course, was not a source of fission product data.
A photograph of typicr! graphite shapes used in a sttinger is showi in Fig. 9.1. their assembly iruo stringers In Fig. 9.2. and the containment of stringers in a perforated container basket in Fig. 9.3.
Assemblies of this design were used in exposures during runs 1 to 18. r'uring runs 19 and 20 a different design, described later was »sed.
Tin srsptiite pieces weir generally rectangular slabs (with notched er.^> irranred longitudinally along a stringer. The bars were 5 to 9 in. long, 0.66 in. wide, and 0.47 in. thick and were generally fabricated from pieces of MSRE graphite (CGB) selected to be crack free by radiographic examination. Bars of half this thickness were also employed. The bars were assembled into long stringers by clamping together with a pair of Hastellov tensile specimen as?emb''es a id an associated flux monitor tube. Three such strlnjers were clamped together as shown in Fig. 9 4 and placed within the perforated 2-in. cylindrical . >ntainer basket (0.03-in. ' :'!). The basket w?s inserted n a 2/<-:n.-diam channel occupying a central bar position in the MSRE core. This central region, with no lattice bars below it. had flows around the basket that were in the low turbulent range;
Y - 6 4 8 2 2
Fig. 9.1. Typical graphi.e stupe* used in a ftrinfn of furvnilancc specimens.
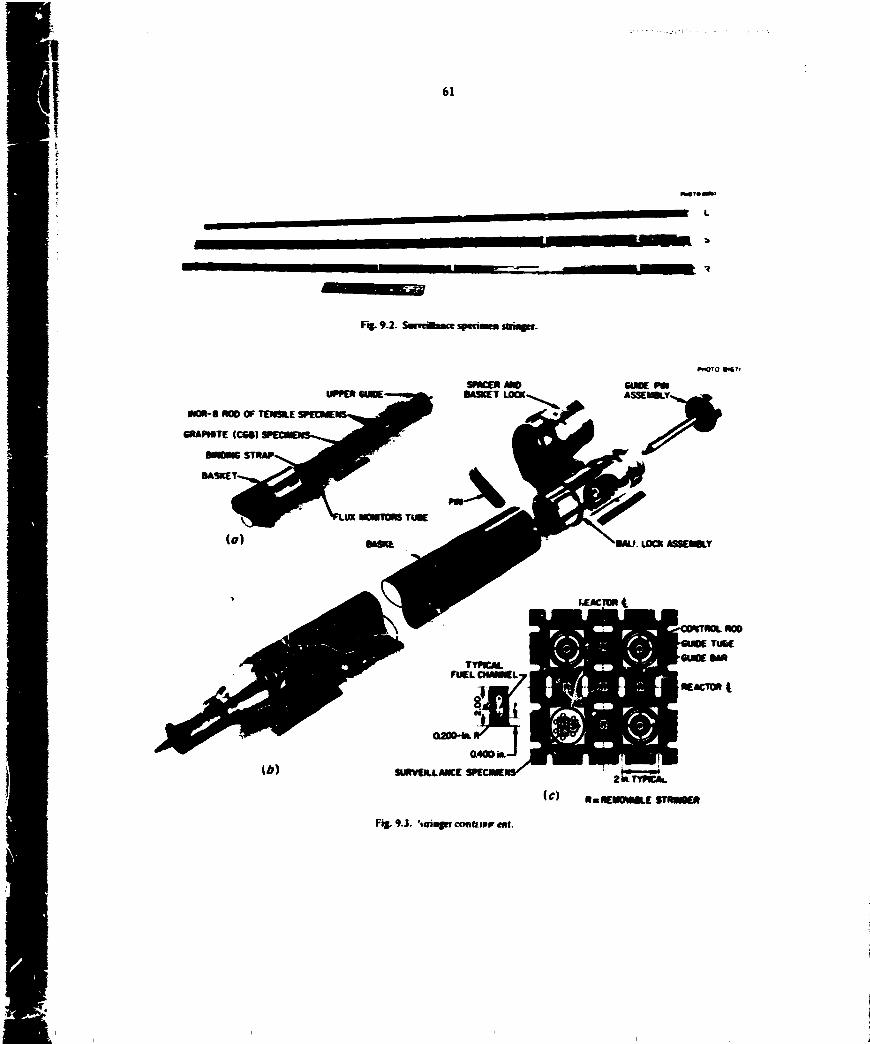
61
Fig. 9.2. Sw wiBjate iptciwta ittiwgu.
MOTO **'•
UPPER CUBE SPACER AND
BASKET LOOU
WOR-8 HOD OF TEM9LE SPECMENS
OtAPMTE (C68>
STRAP
BASKET-
GUOE PM
M
O200-f»l
0 . 4 0 0 M.-
SURVEH.LAHCE SPECIMEN
l ^ j z f \REACTOR 4
ic) 2«.TYPlCAi
R B R E M M M L E STRMBER
Fig. 9.3. Stringer conbinir cut.

62
0 " * * . 3 * . +*• * » * *
:%c* * s**;*e%
W!
Fig. 9.4. SOMger tarmMr.
within the basket along the specii:«ens, no detailed flow analysis has been presented, but quite likely the flow may have been barely turbulent, because of entrance effects which persisted or recurred along the flow channel.
The first two times that the surveillance assemblies were removed from the MSRE (after runs 7 and 11) for fission product examinations, metal samples were obtained by cutting the perforated cylindrical Hastelloy N basket that held the assembly. The next two times (aiter ruitc 14 and 18). %-in. tubing that had held Josimeter wires was cut up to provide samples. When the tubing was first used, lower values were obtained (after run I I ) for the deposition of fission products. After run 18 the basket was no longer of use and was cut up to see if differences in deposition were due to differences in type of sample.
The distribution of temperatures and of neutron fluxes along the graphite sample assembly were estimated1 f o r 2 3 S U operation (Fig. 9.5). The temperature of the graphite was generally 8 to I0°F greater than that of the adjacent fuel, normally which entered 'he channel at about I I80°F and emerged at I 2 I0 °F . The thermal-neutron flux at Iht center was about 4.5 X 1 0 ' 3 with a fast flux of I I X I O 1 3 . these values declined to about one-third or one-fourth of the peak at the ends of :he rig.
It was found on removal of the assembly after run 7 that mechanical distortion of the stringer bundle with speciiiien brenkzge had occurred, apparently because tolerance to thermal expansion had been reduced by salt frozen bet wet n ends of consecutive graphite specimens. The entire assembly was thereby replaced, with slight modifications to design: this design was used without further difficulty until the end of run 18.
After the termination of a particular period of reactor operation, draining of fuel salt, and circulation and draining of flush salt (except after run 18. when no flush was used), the core access port at the top of the reactor vessel was opened, and the cylindrical basket containing the stringer assemblies was removed, placed in a sealed shielded carrier, and transported to the segmenting cell of the High Radiation Level Examination facilities. Here the s'ringer assembly was removed, and one or more stringers were disassembled, being replaced by a fresh stringer jssembly. Graphite bar? from different region, of 'he stringer were markeJ ?" one face and set isire for fission product examination.
Stringers replaced after runs 11 and 14 contained graphite bars made from modified and experimental grades of graphite in addition to that obtained directly from MSRC core bars (type CCB). After runs 7 and 11. '/, 6 i n . rings of the cylindrical 2-in. containment basket were cut from top. middle, and bottom regions for
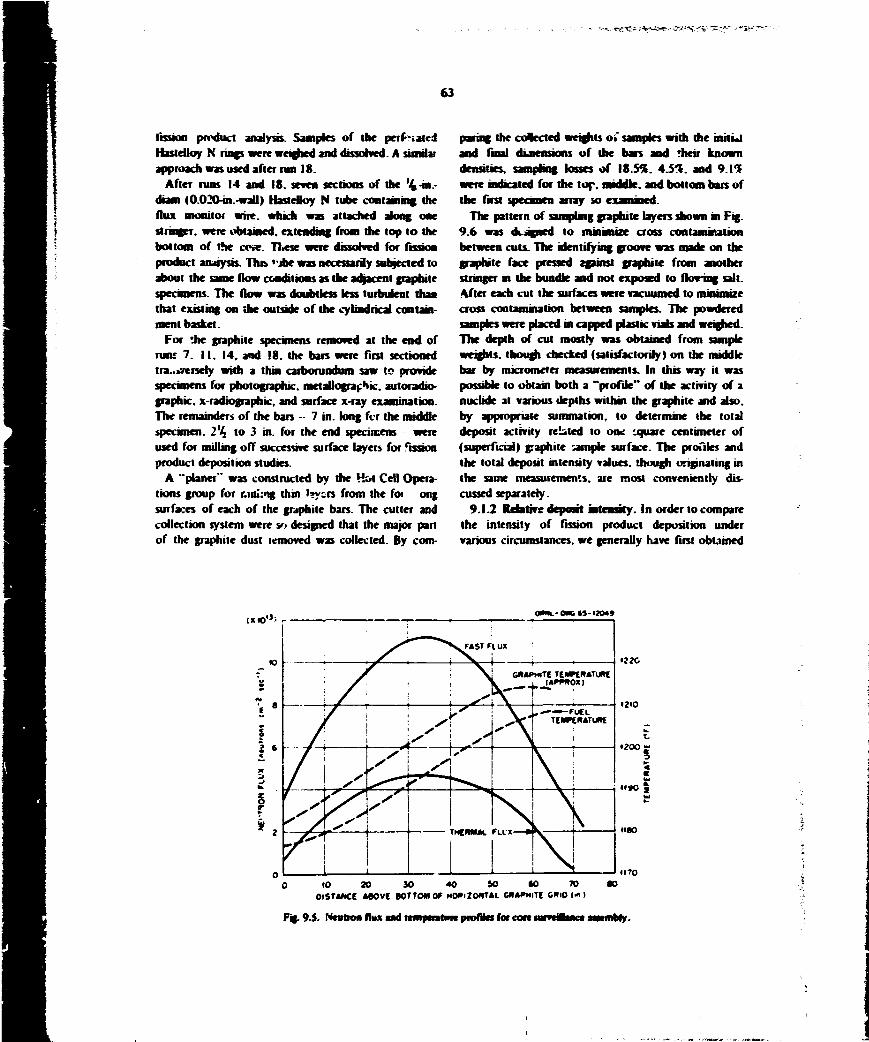
••->. fl!-«s;*!«»":?"H'« — •-*.-
63
fission product analysis. Samples of the perflated HasleUoy N rings were weighed and dissolved. A suniiv approach was used after run 18.
After runs 14 and 18. seven sections of the %- in -diam (0.020-in.-wall) HasteHoy N tube containing the flux monitCM wire, which was attached along one stringer, were obtained, extending from the top to the bottom of the cose. These were dissolved for fission product analysis. The* "joe was necessarily subjected to about the same flow conditions as the adjacent graphite specimens. The flow was doubtless less turbulent than that existing on die outside of the cylindrical containment basket.
For the graphite specimens removed at the end of rum 7. I I . 14. and 18. the bars were first sectioned tra..>7enefy with a thin carborundum saw to provide specimens for photographic. metallogracNic. autoradiographic, x-radiographic, and surface x-ray examination. The remainders of the bars - 7 in. long ft r the middle specimen. 2 % to 3 in. for the end specimens - were used for milling off successive surface layers for fission product deposition studies.
A "planer" was constructed by the Hot Cell Operations group for r.iui:ng thin l»y;rs from the foi ong surfaces of each of the graphite bars. The cutter and collection system were so designed that the major part of the graphite dust lemoved was collected. By com
paring the collected weights oi" samples with the mhwl and final dimensions of die bars and Then known densities, sampling losses of 18.59. 4 . 5 1 . and 9.17 were indicated for the top. middle, and bottom bars of the first speiimfn array so examined.
The pattern of sampling graphite layers shown in Fig. 9.6 was dVagned to minimize cross contamination between cuts. The identifying groove was made on the graphite face pressed against graphite from another stringer in the bundle and not exposed to flov-ing salt. After each cut the surfaces were vacuumed to minimize cross contamination between samples. The powdered samples were placed in capped plastic vials and weighed. The depth of cut mostly was obtained from sample weights, though checked (satisfactorily) on the middle bar by micrometer measurements. In this way it was possible to obtain both a "profile" of the activity of a nuclide at various depths within die graphite and also, by appropriate summation, to determine the total deposit activity related to one tquare centimeter of (superficial) graphite oample surface. The profiles and the total deposit intensity values, though originating in the same measurements, are most conveniently discussed separately.
9.1.2 Relative deposit intensity, in order to compare the intensity of fission product deposition under various circumstances, we generally have first obtained
(XiO 0"m.-0»6*5-<20«»
0 10 2 0 3 0 4 0 9 0 6 0 7 0 0 0 OlSTANCE ABOVE BOTTOM Of H0»'ZOftT«L GRAPHITE G*iO <* )
Fig. 9-5. NCBOOII flux and temperature profile* for core snrvemtnee membry.
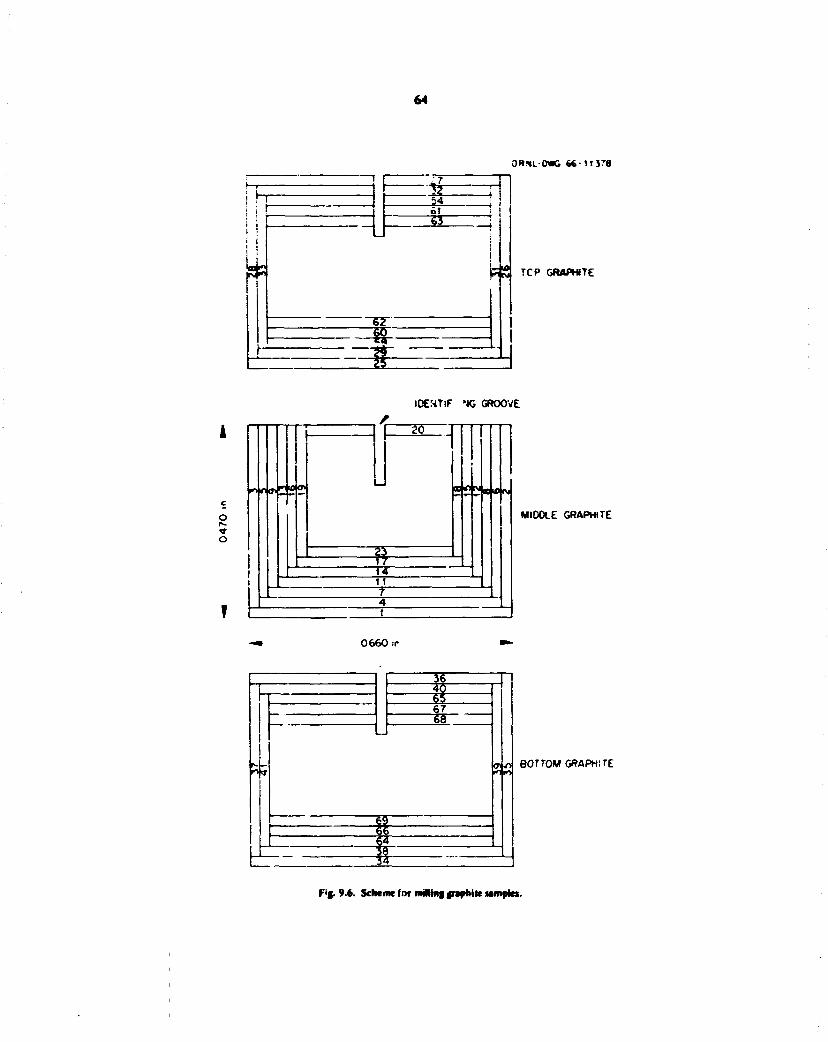
64
i rr
irviKi
T F =a= ^
s j * _ at
0*»*L OWC 66 M 376
K N TCP GRAPHITE
O IV-
O
"> * * £ £ oj
14 11
lOENTiF »« GROOVE
; S ~ * * t v .
MIDDLE GRAPHITE
0660 pr
I T 5 67
~5r
BOTTOM GRAPHITE
F'f. 9-6. Scheme for nMlmg pspkile umples.

65
the observed activity of the nuclide in question per unit of specimen surface (ob*c'-*d dbimefra;>ors pet minu.e per square centimeter). For the same tin.o. the MSRE inventory activity was obtained and dnriied by the total MSRE area (metal. 0.79 X 10* cm 1 .graphite channels, edges, ends, and lattice bars. 2.25 X 10* cm*. for a total of 3.04 X 10* cm*). giving an inventory value (disintegrations per mmute per square centimeier) that would result if the nuclide deposited evenly on all surfaces. The ratio of observed to inventory disintegration; per minute per square centimeter then yields a relative iepos.' intensity which may oe tabulated along with the inventory disintegrations per minute per square centimeter.
The relative deposit intensities, of course, will average between 0 and 1.0 when summed over all areas, indicating the average fraction cf inventory deposited on the reactor surface. The values may be compared freely between runs, nuclides, regions, kinds of surfaces, and qualities of flow. The fraction of the total inventory estimated to be deposited on a particular surface domain is the product of the relative deposit intensity attributed to it and the fraction of the total area it represents. In particular, all the metal of the system represents 26% of the total area, graphite edges a similar amount, and flow channels (and lattice bars) abort 48%.
Results of the examination of metal and graphite samples from surveillance arrays removed liter runs 7. I i. 14. and 18 are shown, respectively in Tables 9.1. 9.2, 9.3. and 9.4. expressed in each Cise as relative deposit intensities.
For each sample set the metal specimens are listed from the reactor top to the bottom, followed by graphite specimens. The nuclides with noble-gas precursors are followed by the salt-seeking isotopes, followed by noble metals and ending with tellurium and iodine.
A number of generalizations of interest may be noted. As a base line, in the absence of minute salt particles which «n:ght have come with a sample, recoils from fission in adjacent salt should give a relative deposit intensity of 0.001 to 0.003. The salt-seeking elements (Ce, Nl~. Zr) on both metal and graphite and the elements with noble eas precursors (Sr, V. Ba. Cs) on metal specimens do shov. •••: !i levels of values, even generally being I.jher near the core midplane. consistent with the higher flux.
For graphite. Ihe elements with noble-gas daughters have some tendency to diffuse into the graphite in the form of their short-lived noble-gas precursor. Thus the values for *"Sr are mostly in the 0.10 0.20 range.
indicating thr. appi'.iable entry has indeed taken place. Values for : **Ba and " Y are an order of magnitude lowet consistent with noMe-gas precursors of much shorter half-life, their values are still about an order of magnitude above those of the salt-seeking elements. On specimens of pyrolytic graphite, which had appreciably less internal porosity, the entry perpendicular to the o p h i t e planes was less dua that where the edges of the planes faced the salt: both directions were lower than CCB graphite. The data for' , T C s were more than an order oi !-tagnitude lower thai for strontium, though the half-lives of tlte noble-gas precuneus were similar (3 18 nun for **Kr and 3.S min for 1 J 7 Xe). The inventory data used in the tabulate were for all material built up since first power operation; such an inventory is severalfold too high for the later runs in cases such as this where transport rather than alt accumulation is important. However, inventory
adjustment is not sufficient to account for the low levels of ' 1 T C s values. Appreciable diffusion of cesium from the graphite, as discussed later, appears to account for the lew values.
The noble metals (Nb. Mo. Ru. Ag. Sb. Te) as a group exhibited deposits relatively more intense than other groups on graphite and even more intense deposits on metal, where the relative intensities on various samples approached or exceeded I and were in practically all cases above 0.1. Significant percentages of the noble metals appear to have been de?"*»cd un system surfaces.
Generally the deposit intensities on the 2-in.-OD perforated container cylinder (after runs 7.1 Land 18) were higher than on tne %-in.-OD flux monitor tube, which was attached to a stringer within the container. Flow was turbulent around the container cylinders but was less turbulent and may have been laminar along the internal tube.
The most intensely deposited elements appear to have been tellurium, antr.nony. and silver; on the container cylinder the relative deposit intensities were mostly jbove I. The deposit intensities for flux monitor tubes were at least several fold greater than for graphite, which should have had similar flow, so that we can conclude that these elements had definitely more tendency to deposit on metal than on graphite under comparable conditions.
T " a degree only slightly less intense, molybdenum exhibited similar behavior to that described above. Niobium appeared to have deposited with roughly similar intensities on graphite and metal; deposition became somewhat less intense and varied proportion-

Table 9.1. SurveilUnce *^cimt<i data: firsl aiiay, removed after run 7
Ratio |(obsdii mln"' cm^J/tinveniory dii min' ' cm- 1)! Specimen •»Sr • ' V '*°Ba »"C» •«'Ce •«*c ' * 7 Nd ••Zr •»Nb " M o ' " H u H l T , • 1 1 ,
Hastettoy N Top 0.0004 0.0004 0.019 0.83 0.56 2<i 0.068 Middle 0.0011 0.0014 0.027 0.79 0.37 !i,4 0.044 Bottom 0.0016 0.0036 0.019 1.07 0.40 1.9 0.03)
Graphite Top
Wide, salt 0.16 0.01 S 0.022 0.005 0.0019 0.0006 <0.0004 0.0004 0.16 0,18 0.19 0,17 O.OOi: Side 1. ialt 0.004 0.3020 0.0005 0.10 0,10 0.12 0.1) 0.0011 Side 2, salt 0.026 0.0031 0.0008 0.14 0.19 0.10 0.26 0 0023 Wide, naphite 0.010 0.012 0.004 0.0016 0.0005 0.00014 0.0007 1.00 0.08 0.04 0.09 K
Middle K
vYi4e, salt 0.14 0.0001 0.019 0.003 0.0047 0.0016 <0.C003 0.0018 0.80 0 IS 0.09 0.19 0.0027 Side 1. salt 0.002 0.016 0.0050 0.0017 u.00005 0 45 0.13 0 08 0.17 0.00)7 Side J, salt 0.023 0.0043 0.0017 0.74 0.12 Q<K 0.1* 00027 Wide, graphite 0.003 0.020 0.0032 0.016 <0.0003 0.0016 0.61 O.Oi 0.0' 0.17
Bottom Wide, salt 0.25 0.002 0.051 0.092 0.0043 0.0038 0.00024 0.0035 0.67 0.21 0.12 o.iv 0.i*»6 Side 1.salt 0.010 0.046 0.001 0.0079 0.0037 0.00017 1.03 0,21 0.13 0.2) 0.004) Side 2. salt 0.005 0.042 0.002 0.0091 0,0031 0.00009 0.(6 0.21 O i l 0.21 0.0044 Wide, graphite 0.024 0.018 00060 0.0037 0.0003 0.15 0 05 0/»S O.iS 0.0048
Inventory4 (ciis min '• err.-*) 8.8EI0 8.8EI0 2.2EH 7.6E8 MEII 2 51-10 V.2EI0 9 6EI0 3.0IM0 2.6EM 6.4KII' I.8E4 1 2l:il
"MSRE inventory activity divided by the lota* MSRE area.
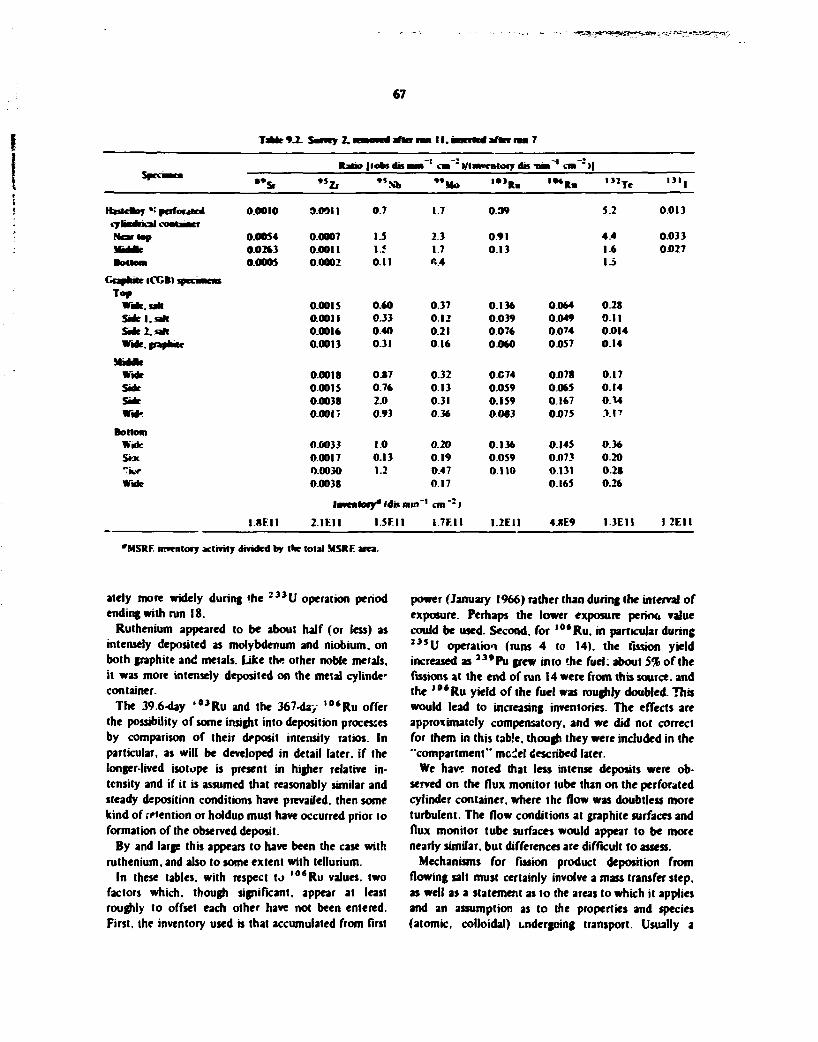
~"!S».- ?*r*3<w>£?*™^S!>*,;-s
TaMr9.2. Sarvcy 2.
67
after raa 11. ennHid after m 7 t "" , Ratio | lots d a m cm'm yimvoMory do • n m - ' cm"- >l
SpOIBW - s , " Z i , 5 N b " H o ' • J R - ' • * R « ' " T * ' " l
Hutcfejr * : pcrfoMtcd 0.0010 9.0911 0.7 1.7 0.09 5.2 0.013 cylMrinoi coMancf Near top 0.00S4 0.0007 I J 2.3 0.91 4.4 0.033 MiiMli 0.02*3 0.0011 1.5 1.7 0.13 1.6 OJ027
BMtOM aooos 0.0002 O i l «V4 13
Graphite |CGB)> tpu-iMiiu Top
Wi4c.aU 0.0015 0.60 0.37 0.136 0.064 0.28 Side 1.salt 0.0011 0.33 0.12 0.039 0.049 0.11 Side 2. tall 0.0016 0.40 0.21 0.076 0.0'4 0.014 Wide.grapMtr 0.0013 0.31 0 1 6 0.060 0.057 0.14
Middle Wide 0.0018 0.87 0.32 0.C74 0.078 0.17 Side 00015 0.76 0 1 3 0.059 0.065 0.14 S i * 00038 2.0 0.31 0.159 0.167 0 3 4 Wi* - 0.0017 0.93 0.36 0 0 8 3 0075 XV
Bottom Wide 0.0033 1.0 0.20 0.136 0.145 0.36 S * * 0.0017 0.13 0.19 0.059 0.073 0.20 ~'mr 0.0030 1.2 0.47 0.110 0131 0.28 Wide 0.0038 0.17 0.165 0.26
Imtntorf* l&n mm' • o n " 5 )
I.8F.II 2.1EI1 I.5F.I1 17F.I1 I .2EI I 4.8E9 1.3EU 1 2 E I I
'MSRF. inventory activity divided by the total MSRF. area.
ately more widely during 'he 2 3 3 U operation period ending with run 18.
Ruthenium appeared to be about half (or less) as intensely deposited as molybdenum and niobium, on both graphite and metals. Like the other noble metals, it was more intensely deposited on the metal cylinde' container.
The 39.6-day , 0 3 R u and the 367-day , 0 * R u offer the possibility of some insight into deposition processes by comparison of their deposit intensity ratios. In particular, as will be developed in detail later, if the longer-lived isotope is present in higher relative intensity and if it is assumed that reasonably similar and steady deposition conditions have prevailed, then some kind of retention or holdup must have occurred prior to formation of the observed deposit.
By and large this appears to have been the case with ruthenium, and also to some extent with tellurium.
In these tables, with respect to , 0 6 R u values, two factors which, though significant, appear at least roughly to offset each other have not been entered. First, the inventory used is that accumulated from first
power (January 1966) rather than during the interval of exposure. Perhaps the lower exposure period value could be used. Second, for , 0 ' R u . in particular during 2 3 S U operation (runs 4 to 14). the fission yield increased as J 3 * P u grew into the fuel; about 5% of the fissions at the end of run 14 were from this source, and the , 0 * R u yield of the fuel was roughly doubled. This would lead to increasing inventories. The effects are approximately compensatory, and we did not correct for them in this table, though they were included in the "compartment" mc^el described later.
We have noted that less intense deposits were observed on the flux monitor tube than on the perforated cylinder container, where the flow was doubtless more turbulent. The flow conditions at graphite surfaces and flux monitor tube surfaces would appear to be more nearly similar, but differences are difficult to assess.
Mechanisms for fission product deposition from flowing salt must certainly involve a mass transfer step. as well as a statement as to the areas to which it applies and an assumption as to the properties and species (atomic, colloidal) undergoing transport. Usually a
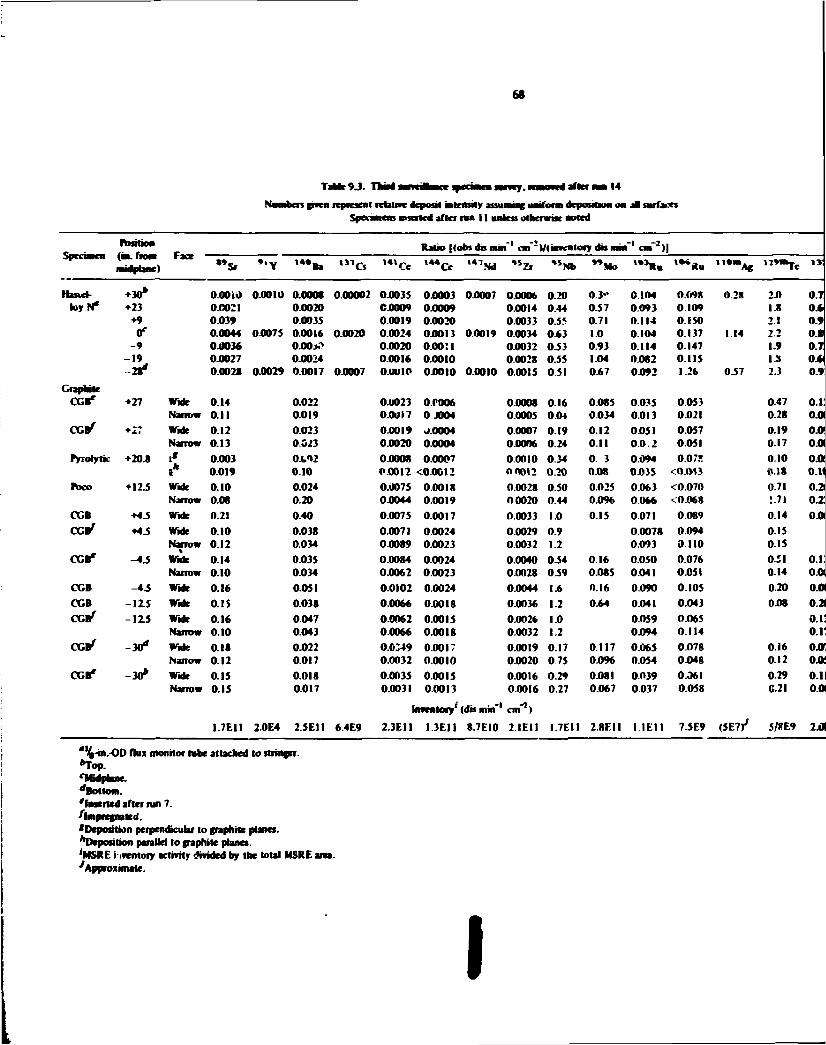
68
I after ran 14 Number* given rtpstsent refatne deposit intensily maming uniform deposiboa on al surfaces
Specimens inserted after n u 11 antes otherwise noted
Pontoon Specimen (in. front Face
Ratio |<ofcsdgmn» an"" V( inventory da i »•« i n . •Ce 'Nd « Z r »Nb *Mo »w. k « u " • " A g " * *
Hand-toyN*
•30* •23
•9 0*
- 9 - 1 9
28*
0.00iO 0.0010 0.000* 0.00002 0.0035 0.0003 00007 04006 0.20 0 3" 0 ! 0 4 0.098 0.0021 0.039 0.0044 0.0036 0.0027 0.0028
Graphite
ccr •27 Wide 0.14 Narrow 0.11
C G B 7 •27 Wide 0.12 Narrow 0.13
fyroryrjc •20.8 l* 0.003 «* 0.019
Poco • 12.5 Wide 0.10 Narrow 0.08
CGB +4.5 Wide 0.21 C G B 7 •4.5 Wide 0.10
Narrow 0.12 CGB* -4.5 Wide 0.14
Narrow 0.10 CGB -4.5 Wide 0.16 CGB -12.5 Wide 0.1$ CGB^ -12.5 Wide 0.16
Narrow 0.10 CGB^ - 3 0 * Wide 0.18
Narrow 0.12 CGB* -30* Wide 0.15
Narrow 0.15
0.0020 0.0035
00075 0.0016 0.0020 0.00*» 0.0024
0.0029 0.0017 0.0007
0.022 0.019 0.023 0.023 0V>2 0.10 0.024 0.20 0.40 0.038 0.034 0035 0.034 0.051 0.038 0.047 0.043 0.022 0.017 0.018 0.017
C4009 0.0009 0.0014 0.44 0.57 0.093 0 109 0.0019 0.0024 0.0020 0.0016 0.0U10
0.0020 0.0013 ooo: i 0.0010 04010
0.0019
04010
0.0033 0.0034 04032 0.0028 0.0015
0.55 0.63 0.53 0.55 0.51
0.71 1.0 0.93 1.04 0.67
0.114 0.104 0.114 0482 0.092
0.150 0.137 0.147 0.115 1.26
0.28
1.14
037
1.7E11 2.0E4 2.5E1I 6.4E9
2-0 1.8 2.1 22 1.9 1JS 2.3
0.0023 o.roo6 0.0008 0.16 0485 0035 0.053 0.47 0OOi7 0J004 0.0005 0.04 0.034 0.013 0.021 0.28 04019 0.0004 0.0007 0.19 0.12 0.051 0.057 0.19 04020 04004 0.0006 0.24 011 0.0.2 0.051 0.17 0.0008 0.0007 0.0010 0.34 0. 3 0.094 0.07X 010 O.0012 <0.00I2 O0012 0.20 0.08 0435 <0.«M3 0.18 0.0075 04018 0.0028 0.50 0.025 0.063 <0.070 0.71 04044 0.0019 0 0020 0.44 0.096 0066 <0.068 !.7I 04075 0.0017 0.0033 1.0 0.15 0.071 0.089 0.14 0.0071 0.0024 0.0029 0.9 0.0078 0.094 015 0.0089 0.0023 0.0032 1.2 0.093 0.110 0.15 0.0084 0.0024 0.0040 0.54 0.16 0.050 0.076 Oi l 04062 0.0023 0.0028 059 0.085 0.041 0.051 0.14 0.0102 0.0024 0.0044 1.6 0.16 0.090 0.105 0.20 04066 0.0018 0.0036 1.2 0.64 0.041 0.043 048 0.0062 0.0015 0.0026 1.0 0.059 0.065 0.0066 0.0018 0.0032 1.2 0.094 0.114 0.0>»9 0.0017 0.0019 0.17 0117 0.065 0.078 0.16 0.0032 0.0010 04020 0 75 0.096 0.054 0.048 012 0.0035 04015 0.0016 0.29 0481 0.039 0.361 029 0.0031 0.0013 0.0016 0.27 0.067 0437 0.058 G.2I
Inventory' (do min" cm ) 2.3E1I I.3EII 8.7EI0 2.IEII I.7EII 2.8F.1I I . IEI I 7.5E9 (5E7/ 5/8E
"4-in.-OD flux monitor tube attached to stringer. *Top. qUidpUne. 'Bottom. 'Inserted after run 7. 'impregnate tf. 'Deposition perpendicular to graphite planes. ''Deposition parallel to graphite planes. 'MSRE i ivemory activity divided by the total MSRE area. 'Approximate.
I I

- ?*f*^&n:Lr*^^-ttis&tv?aF>&aBmiga&i
BLANK PAGE
»*»*»Fic^rf *«**!• J * •t;**^-!*&4rfm&4&2if!&j&a*^rr--f
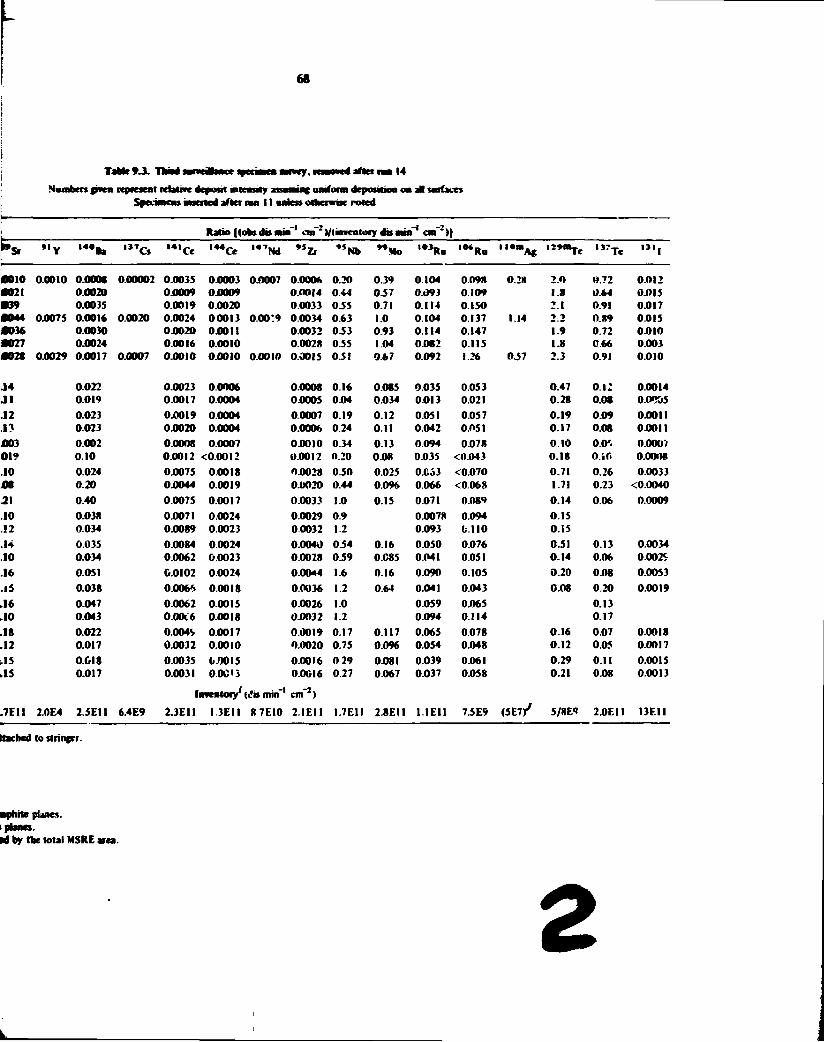
68
e*-l . I M i I after m 14
Numbers given represent ictatiwc deposit iateasity H W i t umform depostboa oa JB sarfaces Specimens ami ltd after nw 11 Bates* otherwise rotcd
i L _ _ ._
Ratio |(obs dts au •* ' cm zV(mweator]r ofe mi . - cm')
fir »'Y , 4 # a » , , 7 C s • 4 i C e , 4 4 C e , 4 7 N d " a , s N b " M o , , 3 R » , 0 * R a "°"A« , M - T e , , r T e m ,
0010 0.0010 0.0008 0.00002 0.0035 04)003 0-0007 0.0006 0.20 0.39 0.104 0.09K 0.2X 2.0 0.72 0.012 •021 0.0020 0.0009 04)009 0.0014 0.44 037 0.093 0.109 1.8 0.64 0.015 •39 0.0035 0.0019 0.0020 0.0033 035 0.71 0.114 0.150 2.1 0.91 0.017 0044 0.0075 0.0016 0.0020 0.0024 00013 0.00:9 0.0034 0.63 1.0 0.104 0.137 1.14 2.2 0.89 0.015 0036 0.0030 0.0020 0.0011 0.0032 0.53 0.93 0.114 0.147 1.9 0.72 0.010 0027 0.0024 0.0016 0.0010 0.0028 0.55 1.04 0.082 0.115 1.8 0.66 0.003 0028 0.0029 0.0017 0.0007 0.0010 04)010 0.0010 0.0015 031 0.67 0.092 1.26 037 2.3 0.91 0.010
.14 0.022 0.0023 0.0006 0.0008 0.16 0.085 0.035 0.053 0.47 0.12 0.0014 J l 0.019 0.0017 0.0004 0.0005 0.04 0.034 0.013 0.021 0.28 0.08 0.0TJ05 .12 0.023 04)019 0.0004 0.0007 0.19 0.12 04)51 0.057 0.19 0.09 04)011 .13 0.023 0.0020 0.0004 0.0006 024 0.11 0.042 0.O5I 0.17 0.08 0.0011 J003 0.002 0.0008 0.0007 0.0010 0.34 0.13 0.094 0.078 0.10 0.0'. 0.0007 019 0.10 0.0012 <0.00l2 0.0012 0.20 0.08 0.035 <0.043 0.18 O.iO 0.0008 .10 0.024 0.0075 0.0018 0.0028 0.50 0.025 0.C63 <0.070 0.71 0.26 0.0033 m 0.20 0.0044 0.0019 0.0020 0.44 0.096 0.066 <0.06S 1.71 0.23 <0.0040 21 0.40 0.0075 0.0017 0.0033 1.0 0.15 0.071 0.089 0.14 0.06 0.0009 .10 0.038 0.0071 0.0024 0.0029 0.9 0.0078 0.094 0.15 .!2 0.034 0.0089 0.0023 0.0032 1.2 0.093 0.110 0.15 .14 0.035 0.0084 0.0024 0.0040 034 0.16 0.050 0.076 0.51 0.13 0.C034 .10 0.034 0.0062 0.0023 0.0028 0.59 O.C85 0.041 0.051 0.14 0.06 0.002S .16 0.051 C.0102 0.0024 0.0044 1.6 0.16 0.090 0.105 0.20 0.08 0.0053 .15 0.038 04)066 0.0018 0.0036 1.2 0.64 0.041 0.043 0.08 0.20 0.0019 .16 0.047 0.0062 0.0015 0.0026 1.0 0.059 0.065 0.13 .10 0.043 0.00i6 0.0018 0.0032 1.2 0.094 0.114 0.17 .18 0.022 0.004S 04)017 0.0019 0.17 0117 04)65 0.078 0.16 0.07 0.0018 .12 0.017 0.0032 0.0010 0.0020 0.75 0.096 0.054 0.048 0.12 0.05 0.0017 .15 0.618 0.0035 04)015 0.00)6 0 29 04)81 0.039 0.061 0.29 0.11 0.0015 .15 0.017 0.0031 0.0013 0.0016 0.27 0.067 0.037 0.0S8 0.21 0.08 0.0013
Inveatory'i «!is miif cm )
.7EII 2.0E4 2.5EI1 6.4E9 2.3E1I 1.3E1I 8 7E10 2.IEII I.7E1I 2.8EU 1.1E1I 7.5E9 (5E7)/ 5/8E9 2.0EII I3E11
ttached to stringer.
•phite planes. 1 planes. id by the total MSRE area.
a

69
TaMr9.4. ForduanHiMinu wjtciwrn survey.nmnni after i
Nn flush sail after drain U-233 operation began villi run IS
Specimens insetted aflet ran 14 unless otherwise noted
18
Specimen Position i in. from mic: plane)
Fjut Ratio |(obi dis min ' cm * >/(imentory dis imn"1 cm'* )1
"Ba . 3 T 0 , . , C e 5Zr 'Nb No 'Ru 'Ru •Ag
'inserted after run 11. Salt flow in the low turbulent range. *'4-in.-0D flux monitor tube attached to stringer. Salt flow barely turbulent. Top. 'MidplaiK. 'Bottom. 'All samples taken from faces exposed to flowing fuel sail. 'Inserted after run 7. ^Impregnated. 'MSRI inventory activity divided by the total VSRE area. /Approximate.
Ilasfcfloy N Perforated cylindrical Top 0 0038 0 0038 0.0027 00023 0.0003 0.0015 0.16 0.76 0 2 6 0.94 2.6 3.1
container* Bottom 0.0075 0.0035 0.0035 0 0016 0.0010 0.0029 073 1 1 0.28 1.05 3.6 2.6 Flux monitor tube • 30* 0.0011 0.0004 0.U043 0.0004 0.0003 0.0007 0.08 0.05 O i l 0.14 0.10 r-S9
•23 0.0025 0.0007 0.0028 0.0006 0.0006 0.0020 0.09 0.94 012 0.17 0.38 0.09 • 9 0 0031 0.0025 0.0027 0.0011 0.0010 0.00! 9 0.10 0.66 0 0 9 0.17 0.21 0.31 tf* 0.0030 0.0035 0.0070 O.00I2 0.0014 0.0024 0.14 1.07 0.14 0.29 0.42 0 15 9 00030 0.0036 0.0027 0 0010 0.0013 0.0024 0.19 1.27 0 2 4 0.^5 0.62 0 15
19 0.0030 00028 0.0030 0.0010 0.00'3 0.0020 0.12 0.9* 0.11 0.19 0.51 0.81 29 ' 00380 0.0086 0.01 I I 00267 0.0019 0.0031 0.05 0.47 0 19 0.35 0.72 0.57
Graphite' CGB* • 27* Wide 0.12 0.015 0.011 0.009 0.0006 0.0036 0.036 0.034 0.018 0.033 0 6 9 DOS'
Narrow 0.16 0.025 0.013 0 013 0.0009 0.0010 0.046 0.050 0.013 0.032 0.70 0.041 0 d Wide 0.2! 0.033 0.014 0.035 0.0016 0.0013 0 180 0.035 0.024 0.054 0.87 O i l !
Narrow- 0.30 0.015 0.026 0.038 0.0024 00016 0.095 0.030 0.024 0.059 1 31 0 0 * 27* Wide 0.18 0.023 0.017 0.0 IR 0.0028 00027 0.33 0.11 0.053 0.096 0.97 0.21
Narrow 0.31 0.039 0.028 0.018 0.0028 0.0028 0.38 0.11 0.069 0.131 1.03 0 15 CC.B +27* wide 0.14 0.017 0.013 0.002 0.0005 0.0006 0.036 0.044 0.10 0.0"6 0.63 0.011
Narrow- 0 1 3 0.050 0.0'4 0.0008 00007 0.042 0.092 0.040 0.035 0.82 0.OM CC.B" +27* Wide O i l 0 018 0.010 o.oof. 00004 0.0005 0.020 0.064 0.026 0.013 0.47 0.001 CGB +24 Wide 0.14 0.023 0.0009 0.044 0.097 0026 0.022 0.60 0.011
Narrow 0.18 0.020 0.010 r.ooi 0.0006 0.024 0.040 GO 14 0.015 0.55 0.003 Poco* + 19 Wide 0.14 0.031 0.016 0.002 0.0003 0.005 0.010 0.004 0.004 0.12 0.001
Narrow 0.15 0.033 0.019 0.001 0.0021 0.069 0.091 0044 0.043 1.60 0.015 CC.B 0d Wide 0.16 0030 0.022 0.005 0.0012 0.0037 0.14 0.067 0.037 0.043 0.67 0.OK
Narrow 0.12 0.028 0.016 0.001 0.0010 0.0015 0.17 0.069 0026 0.023 0.55 0.00« COB ad Wide 0.24 0 031 0.024 0.004 0.0020 0.0036 0.14 0.OS3 0.055 0.071 0.94 0025
Narrow 0 24 0.032 0.024 0.004 0 0016 0.0027 0.21 0.063 0.052 0.054 1.24 0.031 CC.B 27' Wide 0.43 0.048 0.036 0.009 0.0108 0.102 0.052 0.036 0.033 1 17 0.01C
Narrow 0.2S 0.026 0.022 000.1 0.007') 0.064 0.046 ( 0 0 0 3 / 0.030 1.16 0.024 COB* 27' Wide 0.15 0.014 0.014 0.004 0.0008 0.0015 0.057 0.041 0.023 0.025 0.79 0.013
Nartow 0.30 0.002 0.024 O.OOr. 0.0001
Inventory' (dis mirf'
0.0011
cm"*)
0.093 0.047 0.027 0.029 0.64 0.013
2.0EII I.8E1I 2.3E11 8.3E9 9.3EI0 1.9E11 I.4E11 I.9E11 6.8E10 5.2E9 I.0E7 4.4EI
I

69
Tahle9.4. Foartk s—veiK—te • j n i — n a n r y , u w o v i d after m 18
No flush salt after drain U-233 operation began with run IS
Specimens inserted after run 14 unless other woe noted
R»»~> llobsdis min" «. m" )/f inventory dis m 1 fm"*>|
ST ••v , 4 °Ba "Vs • 4 1 ^ , 4 « C e . « r Nd * s Z r , 5 N b Mo , a , R u l o * R u ' " A s , : s S b , 2 , m T e , , J T e U i ,
138 0.0038 0.0027 0.0023 0.0003 0.0015 0.16 0 7 6 026 0.94 2.6 3.1 1 9 0.072 175 0.0035 0.0035 0.0016 "0010 00029 0.73 I.I 0.28 1.05 3.6 2.6 2 « 0.093 Ml O.0CO4 0.0043 0.0004 0.0003 0.0007 0.08 0.05 C I I C.!4 0 10 0.59 0.67 0.53 0.030 125 0.0007 0.0028 0.0006 0.0006 0.0010 0.09 0.94 0 5? 0..7 0.38 0.09 0 4 3 0.38 0.044 m 0.0025 0.0027 0.0011 0.0010 0 0019 0 1 0 0.66 0 0 9 0.17 0.21 0 3 1 0 7 8 0.49 0.041 do 0.0035 0.0070 0.00'2 0.0014 0.0024 0.14 1.07 0 14 0.29 0.42 0. i5 0.81 0.52 0.048 130 0.0036 00027 0.0010 0 0013 0.0024 0.19 1.27 024 0.45 0 6 2 0.15 3.7 0.50 0.050 130 0.0028 0.0030 0.0010 0.0013 0.0020 0.12 0.98 O i l 0.19 0.51 0.81 0 87 0.47 0.033 ISO 00086 0.01 I I 0.0267 0.0019 0.0031 0.05 0.47 0 1 9 0.35 0.72 0.57 1.6 0.9 i 0.068
t 0.015 0.011 0.009 0 J006 0.0036 0.036 0.034 0.018 0.0'? 0.69 0.057 0.1> 0.083 0.0033 I 0025 0.013 0.013 0.0009 0.0010 0.046 0.050 0.013 0.032 0.70 <V046 0.14 0.114 0.0064
0.033 0.014 0.035 0.0016 0.0013 0.180 0.035 0.024 0.354 0.87 0.119 0.09 0.08 0.0014 1 0.015 0.026 0.038 0.0024 0.0016 0.095 0.030 0024 0.059 1 31 0.08? 0.17 0.13 0.0097 I 0.023 0.017 0.018 0.0028 0.0027 0.33 O i l 0.053 0096 0.97 0.21 0.18 0.15 0.0085
0.039 0.028 0.018 0.0028 0.0028 0.38 0.11 0.0M 0.131 1.03 0 1 5 0 26 0.17 0.0090 \ 0.017 0.CI3 0.002 0.0005 00006 0.036 0.044 I* 10 ooot 0.63 0.011 0.065 0.061 0.0044
0.050 0.014 0.0008 0.0007 0.042 0.092 0.040 0.035 0.82 0.016 0.083 0.089 0.0037 o.o:» 0.010 0.006 0.0004 O.O0O5 0.020 0.064 0.026 0.013 0.47 0.008 0.048 0.052 0.0031
\ 0.023 0.0009 0.044 0.097 0026 0.022 0.60 0.010 0.061 0.058 0.0052 I 0.020 0.010 0001 0 0006 0024 0.040 0.014 0.015 0.55 0.005 0.041 0.051 0.0042 \ 0.031 0.016 0.002 0.0003 0 "05 0.010 0004 0.004 0.12 0001 0.059 0.040 0.0019 ! 0.033 0.019 0.001 0 0021 r.069 0.091 0.044 0.0*3 1.60 0.015 0.03.3 0.090 0.0067 > 0.030 0.C22 0.005 0.0012 0.003/ 0.14 0.067 0.037 0.043 0.67 0.016 0.109 0.045 0.0046 I 0.028 0.016 0.001 0.0010 0.0015 0.17 0.069 0.026 0.023 0.55 0.004 0.039 0.059 0.0015 \ 0.031 0.024 0.004 0.0020 0.0036 0 14 0.083 0.055 0.0/1 0.94 ' .025 0.072 0.052 0.0054 1 0.032 0.024 0.004 0.0016 0.0027 0.21 0.063 0.05: 0.054 1.24 0.131 0.057 0.067 0.0042
0.048 0.036 0.009 0.0108 0.102 0.052 0.036 0.033 1 17 0.016 0.078 0.0022 ( 0.026 0.022 0.003 0.0079 0.064 0046 (0.003/ 0.030 1.16 0.026 0.074 0.078 0.0OI2
0.014 0.014 0.004 0.0008 0.0015 0.057 0.041 0.023 0.025 0.79 0.013 0.037 0.032 0.0018 1 0.002 0.024 0.006 0.0001 0.0011 0.093 0.047 0.027 0.029 0.64 0.013 0.035 0.032 0.0022
Inventory' <dis min"' cm" 1)
£11 I .8EI I 2.3EM 8.3E9 9? ,:io I.9F.II I.4F.II i.9EJl 6.8F.I0 5 2 F 9 I.0K7 4.4F.8 I .3EI0 I.8F.H I.2F.I1
pknt range. «r. Salt flow barely turbulent.
a

BLANK PAGE
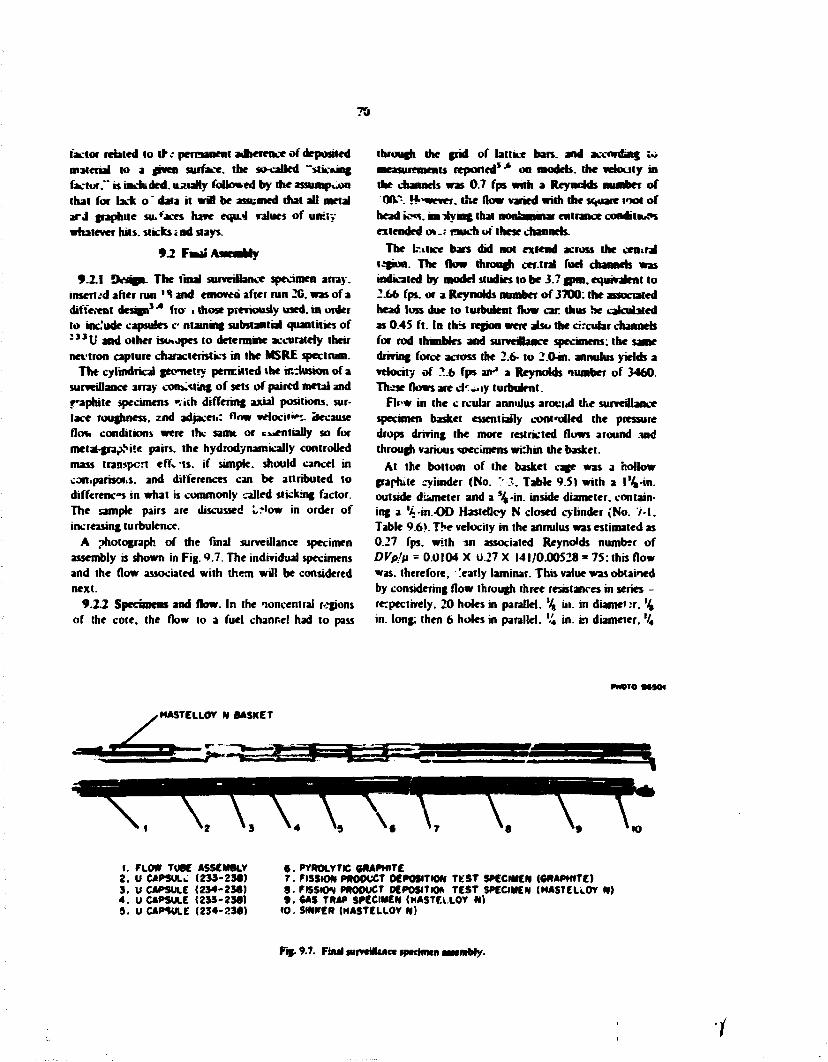
70
factor related to tK- permanent adherence of deposited material to a given surface, the so-called "sticking factor." is included. luuafty followed by the assump>.oa that for lack o ' data it wiH be assumed that all metal ard graphite su.<aces have equal values of urrliy whatever hits, sticks i nd stays.
92 F »
•-2.I Dttofa. The final surveillance specimen array, insert.-d after run ' S and emoved after run 20. was of a different design3 •* fro- «those previously used, in order to inc.'ude capsules c ntauiing substantial quantities of : , , U and other isotopes to determine accurately their nei'tron capture characteristics in the MSRE spectrum.
The cylindrical geometry permitted the inclusion of a surveillance array consisting of sets of paired metal and faphite specimens ».ish differing axial positions, sur-tace roughness. 2nd adjacei(: n«*w velocity, because flov conditions were thv same or c»enfially so for metal-granite pairs, the hydrodynamically controlled mass transport efl^ts. if simple, should cancel in coniparisoi.s. and differences can be attributed to differences in what is commonly called sticking factor. The sample pairs are discussed l?'ow in order of increasing turbulence.
A photograph of the final surveillance specimen assembly is shown in Fig. 9.7. The individual specimens and the flow associated with them will be considered next.
9.2.2 Specimens and flow. In the noncentrai regions of the core, the flow to a fuel channel had to pass
through the grid of lattice bars, and according :•> measurements reported* •* on models, the velocity in the channels was 0.7 fps with a Reynolds number of 0OT-. H-'wever. the flow varied with die square toot of
head io«s. im living that nonlwiinii entrance conditium extended o*.r much 01" these channels.
The kutice bars did not extend across the central region. The flow through cer.tral fuel channels was indicated by model studies to be 3.7 gpm. equivalent to 2.66 fps. or a Reynolds number of 3700: the associated head loss due to turbulent flow car. thus be calculated as 0.4S ft. In this region were also the circular channels for rod thmwles and surveillance specimens: the same driving force across the 2.6- to 2.0-in. annulus yields a velocity of 2.6 fps an-* a Reynolds number of 3460. These flows are c k - i y turbulent.
Fl«w in the c rcular annulus arouijd the surveilance specimen basket essentially controlled the pressure drops driving the more restricted flows around and through various specimens within the basket.
At the bottom of the basket cage was a hollow graphite cylinder (No. '3. Table 9.51 with a l'4-in. outside diameter and a %-in. inside diameter, containing a 'A-in.-OD Hastelloy N closed cylinder (No. 7-1. Table 9.6). The velocity in the annulus was estimated as 0.27 fps. with an associated Reynolds number of DVp/n = 0.0104 X U.27 X 141/0.00528 = 75: this flow was. therefore, '.early laminar. This value was obtained by considering flow through three resistances in series -recpectirely. 20 holes in parallel. % in. in diamet:r. % in. long: (hen 6 holes in parallel. \\ in. in diameter. %
PHOTO MMM
,HASTELLOY N BASKET
(. FLOW TUMI ASSEMBLY 2. U CAPSULE (233-238) 9. U CAPSULE (234-238) 4. U CAPSULE (233-238) 9. UCAP5ULE (234-238)
8 . PYROLVTlC GRAPHITE 7 . FISSION PftOOUCT DEPOSITION TEST SPECIMEN (GRAPHITE) 9. FISSION PftOOUCT DEPOSITION TEST SPECIMEN (HASTELLOY N) 9. GAS TRAP SPECIMEN (HASTEi.LOY N>
10. SINHEN (HASTELLOY N)
Fig. 9.7. Final swreHfance specimen Mwmbry.
1
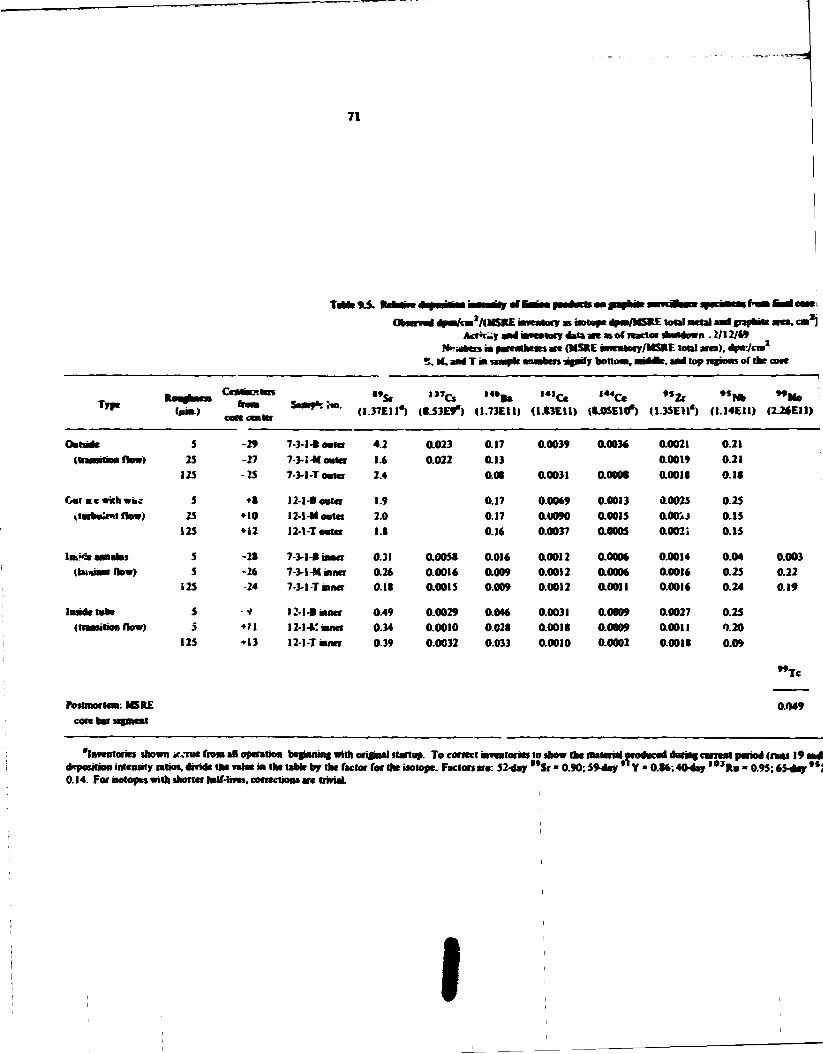
71
TaMtlSv H i l l * i iaj i **/«* Observed dpea/cm'/tMSIlE amatory as isotope «pa/MSR£ total aKtal and inphitc jrca, OB*!
Actnr y and ajweaiacy date art as of leactoe motauvi n .2/12/(9 Nrinoen m parentheses are (MSRE inventory/MSP.E total area), dptt/cm2
5. H, and T • jiaeplf mmbers arnsfy bottom, naaVak, and top Rpno of the core
Ctrnmcxtm "Sr " 7 C s !«•„ i e i a , 4 4 C e » s2r •»Nb " M o Type (mm.) from
cove h&uiu Samp': No. (I.37EI1*) 4153E9") (1.73EU) <I.K3E11) (t.OSEltf) U3SE11*) (1.14E11) (2.26EI1)
Ootadc 5 -29 7-3-l-8toafcr 4.2 0.023 an 0.0039 a0036 0.0021 0.21 ttraaaiiion flow) 23 -27 7-3-I-* ooler 1.6 0.022 0.13 0.0019 0.21
123 -23 7-3-1 -Toatcr 2.4 0.01 0.0031 0.0000 0.0018 0.18
Cot KC vrithwkc 3 • I IM-Boatcf 1.9 0.17 0.0069 0.0013 0.0025 0.23 «tarb«»tnf flow) 23 • 10 12-l-Mooter 2.0 0.17 0.0090 0.0015 OOOiJ 0.13
123 • 12 12-1-Toater 1.S 0.16 0.0037 aooos 0.002; 0.15
ln*«9e aaewkis 5 -2S 7-3-1-9 inner 0.31 0.0050 0.016 0.0012 0.0006 0.0014 0.04 0.003 tbmiaai flow) 3 -26 7-3-1 -M inner 0.26 00016 0.009 0.0012 0.0006 O0016 0.23 0.22
123 -24 7-3-1-Tinner 0.18 0.0015 0.009 0.0012 aoon 0.0016 0.24 0.19
Inside lobe 5 1 12-l-B inner 049 0.0029 0.046 0.0031 0.0009 0.0027 0.23 (tiansition flow) 5 *H I2-1-Kinner 034 0.0010 0.028 0.0018 0.0009 0.0011 0.20
123 +13 121 Tamer 0.39 0.0032 0.033 0.00)0 0.0002 00018 0.09
M T c
Postmortem: MSRE cote bar segment
0049
"inventories shown ic-roe from aO operation bepnning with orifinal startup. To correct inventories to show the material prodoccd dorntg corrent period (runs 19 and osition intensity ratios, drride the *atee in the table by the factor for the isotope. Factors are: 52-day "Sr - 0.90; 59-day * ' Y « 0.86; 404ay ' 0 , P.o « 0.95; 65-day **; deposition
0.14. For isotopes with shorter half-lives, corrections are trivial.
I

• f t - * IE iaveatory as iartop* dpaa/MSItE total metal i • d aweawory oata «« a» of reactor skudewa 12/12/69 ^ewbears arc < MSKE anentoiy/MSltE total area), dpn/caa2
signify bono**, aaMdfct. aad lop regams of the core
91)
, 4 , C e (1.03EU) (S.0SE10*)
•»2r UJSFll") (1.14EU)
" M o (2.26EII)
• • 3 R . (4.4SEI0") (4.47E9*) (S.63E»
I 3 2 j c l l«a»f c
(IJ5E10) • 3 1 ,
(I.06E1I)
0.0039 aoo3» aoo2i 0.21 0.003 aovi 0.011 00005 aooi9 0.21 0.033 0.013 0.046 0.0OS9
0.0031 aooot 0.0OU 0.1S a035 0.035 0.029 00035
0.0069 0.0013 0.0025 0.2S 0.040 OOOOi 0.012 0.0033 0.C090 0.0015 0.0023 0.15 0.039 0.0S9 0J025 0.0047 O.0037 oooos 0.0021 0.15 0450 aooso
6 0.0012 0.0006 0.0014 9.04 0.003 0.022 0.019 0.065 0.0033 » 0.0012 0.000* aoou 0.25 0.22 0.150 0.10S 0.054 0.0026 • 0.0012 0.0011 ooou 0.24 019 0.064 0.049 0.579 0.0010
• 0.0031 aooo9 a0O27 0.25 0.056 0.047 O M I 0.0031 • aoois 0.0009 aoou 0.20 0.035 0.029 0457 0.0019 3 0.0010 0.0002 0.0018 0.09
w T c
0.004 0.065
0.23 0.56
OOSO
""Te <lav-2.«£9)
0.44
0.0017 0.0010 0.0002 0.0018 0.09
0.049
0.004 0.065
0.23 0.56
OOSO
""Te <lav-2.«£9)
0.44
toric* to tbow the isalerialj carnal period {nms 19and 20) only, matlipry by factors fj*v» below. To obtain sawawrly correctod IpfOOBCed t M H ^ t w i c i H i m n f m n i 7 a n 4V/ Vfrnj, M I H W ^ n H H V » P I M www. i v W I W I W M B V « H I K I « May " S r » 0.90; 59-day * *¥ - 0J6;4Oday , # , l l o - 0.95;65-day **Zt « C M ; 204-day , 4 * C e - 0.36; 1-year ' **1U« 0.32; 30irear , , T C » *
2

1 -*
BLANK PAGE -aps
m

Tatar 9jfc.
Type '»•», c* I « l Ce *Cc ' »
«I.37EII«> f«-53E9*> ll 7Jtll> fl4)EII> (S45*f**> |I)5E!I"> H.I4EII> t,
Ootast «M*J rat (outakM flu«>
• • r e
fbawnrflo*)
Inude Mb* |lra«itKm i?> flow|
Stagnant (made, liquid region i
Stagnant imndc. fas rcpun)
5 •24 14-3-S • . • t i t • ••15 • • 0 ( 2 •4009 040M •4004 013 25 •25 14-VM •40*. 3 04S5* C4609 • 4 S M 04S03 00003 T I2
125 •27 14-3-T 00)10 0.300a 0-b»7 o«»m 04003 • 0803 014
S • 1 * 13-2-S •4o;3 aoso9 04013 0-MS9 04004 04003 0.2* 25 • IS IJ-2-* •4020 0.025) 04010 040 t ; 0.0005 04007 0.34
125 •20 13-2-T • 00 J* 0.0022 000>J 04012 04005 S.r»04 0 4 *
• l« D i m 0-0019 0.000» 0.0015 o.oo:« •4001 00005 021
• I I 12-2 witc 000 JO 00011 t'0027 0.0014 04001 04000 on
5 -2S 7-i-0 0001 • 0.000a 0-0015 04011 0.0005 0000a 0.21 125 - 2 * M-T 00020 0.0007 00017 0.0013 0.000a 0400a 0.39
5 • 1 * I3-I-S 0-0021 0.0005 04020 00014 OOOW 00007 0J7 5 • 1 * I3-I-K 0.0021 0.0012 0.001« 04013 0400a 0.41
125 •20 13-IT 0.0019 0.0007 0.0015 04011 04005 00004 071
•26 I4-2-L2 000 JO 00020 04002 040003 0.00002 0.00001 00051 •24 14-2-LI 0.0010 0.0002 04002 040011 040000 0.00000 0.025
•29 14-2-CI 0.14 0.0027 O.0057 0.0000! 0.000005 040003 0.0010 •2S I4-2-G2 047 0.0022 0.007- 0000T2 0.00001 000002 0.0012 •27 I4-2-G3 0.41 00014 0.00a* 040004 0.00001 0.00000 00012
Pott mortem 54SRE teal exchanger fogmrnt NSItE rod t h*»Me tmvmmt icon)
0.20 0J3
Inventories shown accnat from all oprratioa ta;*amg wMi original starlnp. To contct hwmlonr*. lo show the material prodoced daring carrent period (mat 19 and ] intensity ratios. divide the value in labk by ike fartor for r*Hooe. Factors an: 52-day **Sr - 0.90:59-day * ' Y • OK;40-day • • ' t a • 0.95.64-day *'2> • 0.04:2S4-day half-lrm. correction* an trivial.
\

BLANK PAGE
>»v^»mtitm»Mi&m^.^.^i0£^j;}ji-.:.,
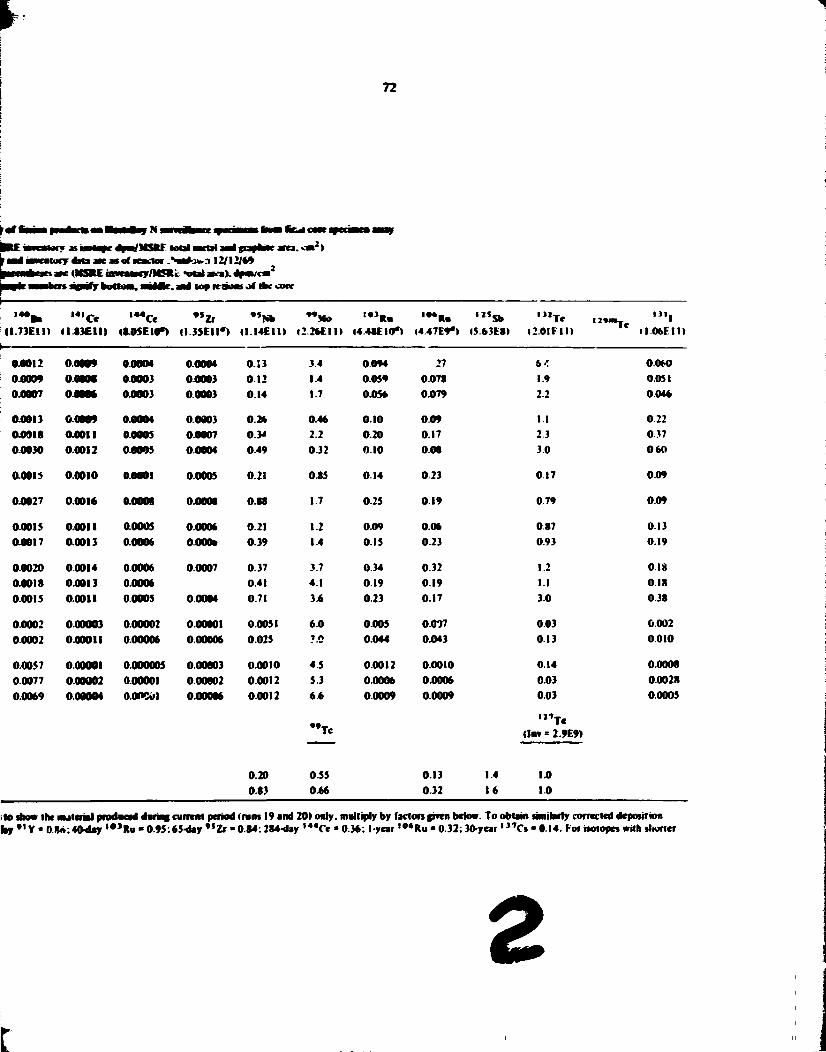
k 72
rot i
tati dtw/SKKF tool mtt* m data aft as ofreactor '•wafown 12/12/69
w (MSKE iaawWcy/M5>fc •otal sros. dpaa/ca2
boOOM. aoMkr. and loft nrsoat of tktr core
(I.73EI1. i « i c <
I1S3EII)
, 4 V e <84SEI0*>
•*2r »I3SEII«>
•*Nb ( I - I4EI I )
" M o (2-26EIII
S , , R . I4.48EI0*) (4.47E9-) <5.63ES>
• ) ! - , - . 1 ) 1 ,
( 2 0 I F I I ) M06EI I )
0-0012 00009 0.0004 0.0004 0.13 3.4 0494 27 6 / 0.060 04009 00000 0.0003 04003 0.12 1.4 0.0S9 0.078 1.9 0.051 0.0007 04D0* 04003 0.0003 0.14 1.7 045* 0479 22 0.046
0-0013 ©0009 04004 04003 0.26 0.46 0.10 049 1.1 0.22 04918 O.00II 00005 04007 0.34 2.2 0.20 0.17 23 0.37 04030 0.0012 04005 04004 0-49 0.32 0.10 048 3.0 060
aoois 04010 04001 0.0005 0.21 045 0.14 0.23 017 049
04027 00016 0.0008 04001 0.88 1.7 0.25 0.19 079 0.09
aoois 04011 00005 0.0006 0.21 1.2 049 0.06 0.87 013 04017 04013 0.0046 0400ft 0.39 1.4 015 023 0.93 0.19
04020 00014 04006 04007 0.37 37 034 032 1.2 0.18 0.0018 0.0013 0.0006 0.41 4.1 0.19 0.19 1.1 018 04015 04011 0.0005 0.0004 0.71 36 0.23 0.17 3.0 0.38
04002 040003 040002 040001 0.0051 64 0.005 0497 0.03 0.002 04002 0.00011 0.00006 0.00006 0425 ?.o 0.044 0443 0.13 0.010
0.0057 OOOOOI 0.000005 0.00003 0.0010 4.5 04012 04010 0.14 0.0008 0.0077 000002 0.00001 040002 04012 5.3 0.0006 04006 043 0.0028 04069 000004 o.oncoi 0.00086 04012 6.6
" T «
0.0009 04009 0.03
• " T «
0.0005 6.6
" T « (In* = 2.9E9)
020 0.83
0.55 046
013 0.32
1.4 16
14 14
I to show the nuterM produced during current period (rum 19 and 20) only, multiply by factors given below. To obtain similarly corrected deposition by • ' Y • 0 R»;40-day , 0 , R u - 0.95;65-day •»& « 0.84:284-day , 4 4 C e « 0.36; 1-year l 0 * R u « 0.32; 30-year' , 7 Cs * 0.14. For isotopes with shorter
a t

73
in. long; then an annulus7 'f,t in. wide. 5 in. long. A flow head loss of 0.057 ft. which should develop along the outer part of the basket. was asumed.
In the annulus between the outside of the graphite cylinder and the basket, the velocity was estimated to be about I.S fps: the associated Reynolds number is 2200. and the flow was either laminar or H I the transition repon. Some distance above, at the tap of the assembly, was a Hastelloy N cylinder (No. 14. Table 9.6: No. I. in Fig. 9.7) of similar external dimension, which presumably experienced similar flow conditions on the outside. This specimen was closed at the top and had a double wall. Inside was a bar containing electron microscope screens. The liquid around the bar within the cylinder was stagnant, and gas was trapped in the upper part of the specimen.
Below this, above the nudplane of the specimen cage were located respectively graphite (Table 9.5. No. 12) and doubie-waBed Hastelloy N (Table 9.6. No. 13) cylinders, with connecting '^-in.-diam bores. Flow through this tube is believed to have been transition or possibly turbulent flow, though doubtless less turbulent than around t!.e specimen exterior. The exterior of the l-in.-OD cylinders was wrapped with 'A.-in. HastHIoy N wire on V} -in. pitch as a flow disturbance. Flow in the annulus between the s;>ecimen exterior and (he basket was undoubtedly the most turbulent of any affecting the set of specimens.
Th .• data from the various specimens are presented in Table 9.5 for graphite and Table 9.6 for Hastelloy N in terms of relative deposit intensity.
We sa-w no effect of surface roughness, which ranged from 5 to 125 urn. rms. on either metal or graphite, so this will not be further considered here.
9.2.3 F O R M recufl. Because the specimens were adjacent to fissioning salt in the core, some fission products should recoil into the surface." We calculate that where the fission density equals the average for the core, the relative impingement intensity of recoiling fission fragments, (recoil atoms per square centimeter)/ (reactor production/surface area), ranges from 0.0036 for light fragments to 0.0027 for heavy fragments. The ratio will be higher (around 0.005) where the fission density is highest.
9.2.4 Mi-seeking nuclides. Relative deposition intensities for salt-seeking nuclides f ' s Z r . l 4 , C e ) are of the order of the calculated impingement intensities or less: for " Z r . 0.001 to 0.0027 on graphite and 0.0003 to 0.0008 on metal: for , 4 , C e . 0.0010 to 0.0090 on graphite and 0.0006 to 0.00i6 on metal. The deposition of 284-day ' 4 4 C e is consistent with this, on a current basis after adjustmen; for prior inventory as shown in the table footnotes.
There also appears to be some dependence on axial location, with higher values nearer the center of the core. Thus all of rhe salt-seeking nuclides observed OR surfaces could have arrived there by fission recoil: the fact that remaining deposition intensities on metal surfaces are consistently less thm impingement densities indicates that many atoms that impinge cs the surface rr-y soorer or bier return to die salt.
9.2.5 Nncmfes with mmkgt j BttranaB. The nuclides with noble-gas precursors (**Sr. " V - . ; *»Ba . and. to a slight extc i . : . ' 4 * Cc', «*e. after formation, also salt seekers. They are found to be deposited on meul to about the same extent as isotopes of salt-seeking elements, doubtless by fission recod. However, nobk-gas precursors can diffuse into graphite before decay, providing an additional and major path into graphite. It may be seen that values for * ' S r . ' , T C s . and l 4 * B a for the graphite samples are generally an order of magnitude or more greater than for the salt-seeking elements.
It appears evident that the deposit intensity on graphite of the isotopes with noMe-gas precursors was higher on th- outside than on the inside, both of specimen 7 *nd 'pecimen 12. Row was also more turbulent outsiie than inside, and atomic mass transfer coefficients should be higher. (Flows are not well enough known to accurately compare the outside of the lower specimen (No. 7-3) with the inside of the upper graphite tube specimen (No. 12-1)].
Appreciably more 3.1-min " K r and 3.9-min , 3 7 X e should enter the graphite than 16-sec l 4 0 X e or 2-sec 1 4 ' X e . but the l 3 7 C s values are considerably lower than for **Sr. Only about \ATk of t h e ' 3 7 Cs inventory was formed during runs I ? and 20. With this correction, however. ' 3 7 C s deposition intensities still are less than those observed for strontium. As will be discussed laf?r' the major oart of the cesium formed in graphite will diffuse back into the salt much more strongly than the less volatile strontium: this presumably accounts for the lower ' * 7Cs intensity.
At first glance the "fast flow" values for **Sr on graphite appear somewhat high even though * ' K r entry to graphite from salt was facilitated by the more rapid flow. Similar intensity on all flow-channel graphite would account for the major part of the **Sr inventory, while salt analysis for the period showed that the salt contained abou: S2-% of the **Sr. But the discrepancy is not unacceptable, since most core fuel channels had lower velocity and less turbulent, possibly laminar flow.
On the inside of the closed lube the deposition of " S r and other salt-seeking daughters of noble gases was m'ich higher in the gas space than in the salt-filled region. This is consistent with collection of 8 * K r in the
74
gas space aad die relative unmnhdit; ot strontwai deposits on surfaces not washed by sail.
Turning to die noMe-metal fv-skxi products. >*e no«e that ' * N b deposited ratrty stro iffy and fairly evenly on aB surfed- The data are not mconstsieai w.di postmortem examnwtmn of reactot COUHXMK..IIS. to be described bier. Mohhdenum ( * * M O | deposited considerably more strongly on metal than on graphite Ibmited graphite data). Because the relative deposit intensity of molybdenum on metal is smwtar to mat of **Sr on graphite, which is attributed to atomic krypton diffusion mrough the salt boundary layer, it m be rhat molybdenum could also have been transported H I appreciaMe part by an atonic mf thmra i . and pre Sunday had a hsgh sticking factor on nana! I about V, Under saaiar flow conditions, the depoajt intensify of motybdeiKjn on graphite B natch less: hence rhe sticking factor on graphite is doubtless nvcfc below unity. Postmortem coniponeni exaaanauoa found r>at the * *Tc daughter also was note Mtensefy depositee on metal than on graphite
The widely vary*- * * M o values for salt jamplej taken during this pernd. however, imply that a sunufi-cant amount of " M o occurred along wilt other noMe-metal isotopes in pump bowl salt samples as particulates. Since molybdenum was relatively high in ti'e present surveillance samples also, it may be that in appreciable part of the deposition involved materia! from this pool.
Because molybdenum deposited more strongly than its precursor niobium, an appreciable part of the molybdenum found must have deposited independently of niobium deposition, and niobium behavior may only roughly indicate molybdenum behavior at best. This may well be due to the relation of niobium behavior to the redox potential of the salt, while molybdenum may not be affected in the same way.
9.2.7 Rutbcnhua. The ruthenium isotopes. l 0 3 R u and l 0 i R u . showed quite similar behavior as would be expected, and did not exhibit any marked response to flow or flux variations. The ruthenium isotopes appear to deposit severaifold more intensely on metal than on graphite. The correction of inventories to material formed only during the exposure period will increase the ' °*Ru intensity ratios about threefold but will change the " " R u intensity ratio very little. On such a inventory basis the , 0 3 R u deposition will then be appreciably lower than that for """'Ru; this indicates that an appreciable net lime lag may occur before deposition and argues against a dominant direct atomic deposition mechanism for this element.
92S TehwriuaL The rethiuum isotope* ' , 2 T e ion metals) and ' 2 ' * T e (on graphite) show an appreciably stronger (almost 40 times) relative deposit intensity on metal dun on graphite, indicative of real differences in sticking factor. Deposit intensities of lenumun were moderately higher in faster flow regions than in low H±v " - ~ J U S (2 times or more). poju»i») mcSatrve of response to mass transfer effects. Fhix effects are not significant.
Postmortem examination ot' MSRC coK^Mueuts showed ' * 5 S b and ' 2 T T e deposition ntensities which were consistent with this, except rhat the deposition intensity ot' teuurian on the core tad-channel si njres was higher dun we observe bete on sMvedunce
On balance, it appears dot me jticirmg actor of leaunam an metal is retaowjhr huh Tins r a > - resw): from dnecf atoaac denoshjua amVor ieyommm on tunkubie wjUad winch dam deposits u l u i m R hut securely S * h strmg nMenssty of teaunun • rhe «i.-p^*«s vutdd be rhe leant of duect deposition of leamm.a. or of siaanr promft depusrtma of precursor antunony with retention of the tcnunum daughter, or both, "."he data do not leg
9.Z3 twuhar- Iodine exhibits deposit L-temitie> wtiich appear to be at least an order of r.agniiudc lower than tellurium, both for graphite specimens and. at considerably higher levels for both tellurium and iodine, for the metal specimens. The data for the metal surface mostly vary with icilurium. sugg*sting that the iodine found is a result of tellurium dspi»si:ion ana decay, but with most of the iodine soimed hiving returned to the salt.
9.2.10 Sticking factors. In general the data of ihe final surveillance assembly are consistent with those of the earlier assemblies. Thr pairing <*f the metal and graphite specimens in the final asiiemMy permits some conclusions about relative s» vicing factors that weu implied but less '-ertain in the earlier assemblies.
It appears evident, because the deposition intensity differs for different isotopes under the same flow conditions, that the sticking factor must be below uniiy for may of the noble-metal isotopes, either on metal or on graphite. The deposition intensity appears rather generally to be higher on metals than on graphite and could approach unity In terms of mechanis- !~>w values of slicking factor could result if only part of the area was active or if material was relumed to the liquid, either as atoms via chemical equilibrium processes, or by pickup of depositeJ particulate material from the surface.
75
The rataes w « M *•- *-«• H die amatory atar idbe dmnawted own a larger area dua ru t Die mm of systeaa aretal aid papaae M L Sach areas * d i ( radadr the i w d c t of haafclrii at cotoaftd parades m
the arcabtMg *ari It B adruaanh dear, bowem. dot aaai
t » a v the a M M i n of deposits on i He sarfaces dtffer mi fVamiy lor
•e ta l efcawats. wnJi ewre arte**? deposits of a j M C U C geatuMy accamag on die aanal sartace of a
• exposed aaeul-fnpbite pa*
»_J
9 3 . 1 IVsctdasr. As described earlier n dm JCCIMM. for a m i graphite sarvedbaoe swecaams a success*)* of das cab were raade ar*ard froai each face to depths frc*)aeady of aboat SO aab (0.050 m.» These car* were
bottled. wcajKd- mi aaatyzed f . . each The i——almas for the aidjiiaud faces have
already beewenwn at theexbei tables of ibis sectroa. It does not appear expedreai to accouM here for the arJnidiij> saaptes I which would increase the w d w of data auaylotd). since a m i oi the ntbnaatioa B
ted m typio*! profiles shown below for samples
&*.-3*.**-•*!•*
havoc*. pccowty of ^5 lo T 9 % of
X - l i • aaened after raa 7
after raa . l l . Data for the orioas
fofandawic plots of activity per oarl cat depth. Afchoafh sach a plot the dua. it does lead to
easy ditalay of fact dot
>
«o
10 •0 20 30 40
DISTANCE FROM SlWACE <""'»> 50
Fig. 9 - & ttmttMntkm profile for CGi frapkitc, ample t>-92.
i s i C» hi ii
«3
10 10 20 50 *0
onrmcc t*o* SUMMCC «•«•'«) 50
Fig. 9.9. ConctiirratiMi profite* for " S t and , 4 0 U i •mates of CGi. X-l 3 wide face, and F-S8.
7 *
I * Zi
• * :i
.',' "> V .,--U-
Fig. 9.10. Conctntntkm profiles for **Sr pyrorrlk ptptnlt.
140.
p >c z-; s.- «r *-
Fig. 9.11. Ctmrt»tntwm profiles for **M» and * 5 Zr m CGt ~ c. X-1 i . do«Me cxamarc.
\
I }
;•*
. : sc * c
«•*••:£ * » : v s.»**c£ .*• »• ; . s - i V t I a . "V S. • ' * . '
Rg. 9 . 1 1 Cjmn*v.&m ftoOta for , c > l t o (tor X-l j gi jyhin ^ t r c a m . OGK. A M M T e»i
of Fig. 9.1). , 4 4 C e i l l C G »
•rof i ta fct ' • * » • • . , 4 , C « . V 9 .
78
Fig. 9.14. ComenlntMMi profiles for M , C e and l 4*C'e hi two ami les of C(iB graphite. X-l i. wide face, and P-3H.
f-y far the greatest amount of any nuclide was to be found within ? ven few mils of the surface. Consequently what the fission product profiles tend to display is the behavior of the small fraction of the deposited nuclide which penetrates beyond the first few mils.
Additional data or samples from this set of specimens were obtained by Cuneo and co-workers, using a technique developed by Ivans. The technique offered
less possibility of cross contamination of samples. Accordinr ••> ihb technique the specimen was generally cut cngitudinally and at the midplane. and a core was drilled to !h-j outer surface. The core was then glued la a cold graphite coupon, which in turn was glued to a machined steel piston. This piston, the position of which could be measured accurately using a dial iracromeler. fitted into a holder which was mo» .*d on a piece of e.-ntry paper. The resulting powder was Scotch taped in place, and the total activity of various nuclides was determineu -•s.ng a gamma-ray spectrometer.
9.3.2 Results. Results using the. lectu ique are shown in Figs. 9 15 9.17.
The materbl found on or in the svaphite doubtless emerged from the adjscent salt. Transport from sal: c^ii occur by fission product atom recoil from adjacent fuel salt, by the deposition of elemental fission products diffusing out oi sail as atoms or borne by sail as colioids. by hemica'. reaction of salt-soluble species with fraphite. by diffusion of gases from rait and deposi';.?!? onto graphite, and by physical transport of salt into graphite either by nnssurc permeation of .racks, by wetting the graphite, or by ^puttering processes due to fission spikes in sail close to the graphite surfaces.
Of these, there is no indication of reaction of fluorides v i h graphite (with niobium a possible exception), and volaiile substances are not thought to be a factor, the mble-gas nuclides excepted. Furthermore, the graphite did not appear to be wet by salt. Occasionally there was an indicilion that salt entered cracks in the graphite, and this could be a facto, ior a few samples.
The nuclides most certain to be found at greatest depth., snould be the daughters of the noble gases. Profiles for " S r and , 4 0 B a are shown in Fig. 9.9
9.3.3 Diffusio • mechanitm reJat.onships. Among the ways in which fisrion products might enter into and diffuse in grnphite .ire ( i ) recoil of fission fragments from adjacent salt. (2) diflusion into graphite of noble or other short-lived gases originating in salt which on decay wiii dc,msit a nonmobiie diughtcr. (3) foimation of fission products from uranium •hat was found at that depth in the graphite. (4) migra'.on of fission products by J sutlace diffusion mechanism.
In o.u consideration of any mechanisms for the migration of fission products. v»j will seek ( I ) estimates of the amount of activity on linn are-,, summed over all depths (expressed ;•* disintegrations per minute per square centimeter). (2) the .surface concentration (cxpro.^.l as disintegrations per minute per gram of graphite), and (3> the variation of concentration with

79
asv ; » . » # -
Vt <.• V t>T PC- 9 0 '"V " 0 •'• ' V • * ' •*»•" »*r »~~ "«~ *<*C ? 0 ^ /.'^
Fir- 9.15. Fiwimi product distribution in unimprcgnated CGB (P-55) graphite specimen irradiated in MSRE ejele ending March 25. 1968.
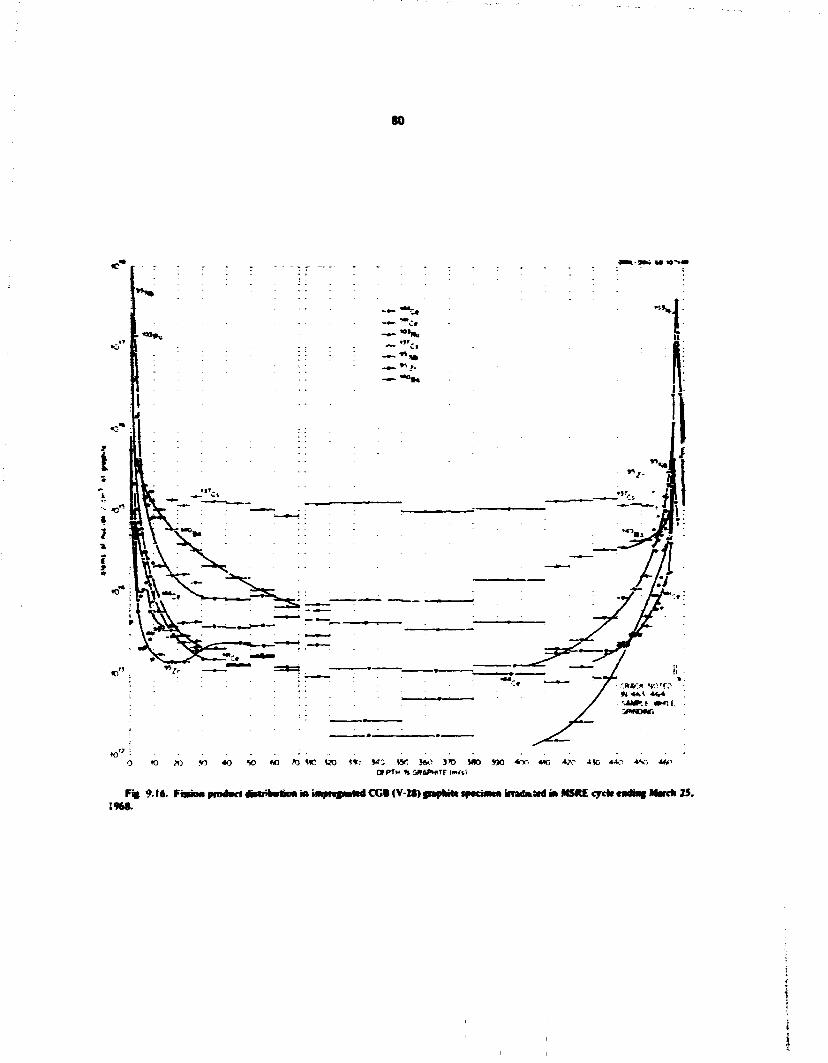
80
Fi» 9-16- F H M protect dMrbBtiM id tmprefmttd CGB <V-M) papliitt ifiUwww jnMtaiMtf M MSRE cycfc trnt/mg Nwck 25, I9M.
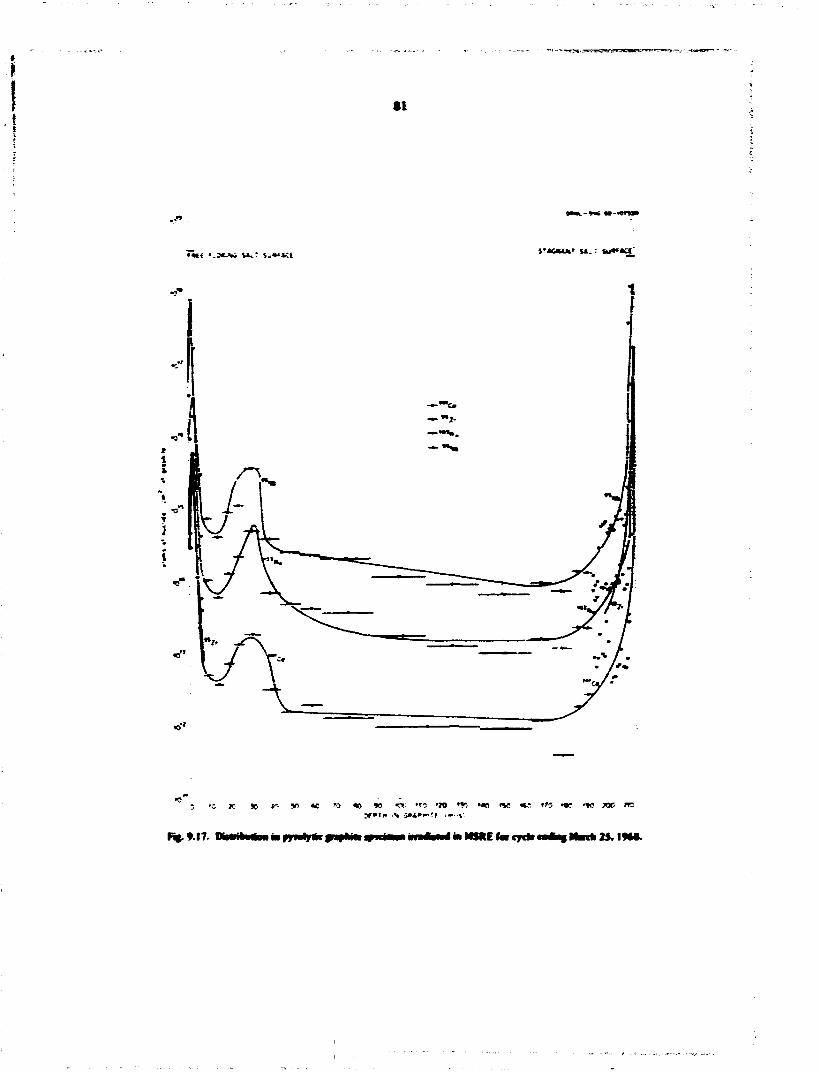
t l
«<ti « .3KA; U ^ t.«'«ci SMCJUX' M. - W*«K(
5 rc It » *-, V) « *> 10 *> f*. "5 'JO •»-, * » •*! »K "5 •»? •«! wo res
Fig. 9.17. ttrtiirtim » f) iul| «i » • » « * J» iiiwin iw fc l r f i» MSHE fat cytte wrfhig M K > 25, I W .
12
depth - o m l y expressed as the depth required to hirtc (or otberwar reduce) the coacestration. Wc should also try to relate the calculated activity to the r drained amatory activity of rod sah (expressed as diiioK gi itiooj per auaute per gram of szit) developed for the
Siace 25% of the famous ocenrriag ia sah widuaoae range aart wal leave the salt and doubtfcn eater the idjiLeal graphite, and if we use at apulic iblr to salt the
drtrnaiard as TS aad S.9 aaj/iM* respectively. wc caa calculate the luunadard rccoi activity:
vjhere / is the ratio of local to cote average acatroa flax. (/ - 2 to 4 for core center spedsaens. arprndiag oa axial position.)
Oaly m the case of salt-seefciac auchan is rccuii a
The range of fission prodacu entering a graphite of density I Jo was deiiianaid'* as 3.07 tag/cm1 for »*Y aad 2.51 mg/cm2 for > 4 * X e : this lontmonds to I6.S aad 13J n. so that the peaelratina should be hauled to a nominal 0.6 nal.
The inaspon of fission gases ia graphite has been reported'' •' * for representative CCB graphites.
The diffusion of noble gases in graphite also involves diffusion through boundVr, layers of the adjacent salt. We will express the behavior in graphite as a function of the entering flux, aad then use this as a boundary condition for diffusion from salt.
At steady state the diffusion of a short-lived gaseous nuclide into a plane-surfaced semi-infinite porous solid has been shown by Evans'a to be characterized by the following:
0 « ( « V 0 G > " 2 •
/Vt>l*C fcxp( * » .
where
Cg * nom concentration in surface gas phase. J0 - al-m flux entering surface.
t « total porosity of graphite. D(; * Knodsen diffusion coefficient in graphite.
N[y) » concentration of atoms in gas phase in pores at depth y.
The surface concentration of a noamohdr daughter ia graphite resulting from the decay of a diffusiag shortlived precursor it obtained from the n i uimd ition exprsssoa
where C2 is the daughter concentratr*! per gram of graphite, latcgrating this across the power history of the ran. we obtaia for the activity («,) of the daughter ia disiaMgtatiuns per minute per gram of graphite:
further.
•,!-»=>««•,». e x p l f r ) : (2)
where
Jc* ~ P* nucade flux into graphite at unit power,
f nw.),,, is the activity inventory jn.umul.iicd by salt during run,
f * * fusion rate at unit power ia given mass. Y = fission yield.
The total accumulation for unit surface integrated over all depths follows as
d p m / c m ~MG F*r/mass
It remains to determine the flux into the graphite../'' at unit power, by conauVriag conditions within the salt.
The short-lived noble-gas nuclide is generated vohi-metricaNy in the salt: the characteristic distance (DJX)"7 a about 0.06 cm for a 20Osec nuclide and about 0.013 cm for a Ifrsec nuclide. The salt m a boundary layer at 0.013 cm from the wall of a fuel channel with a width of ! cm unU flow more slowly than the bulk salt and wsH require perhaps 100 sec to traverse the core. Tor nuclides of 10 sec or lest half-life and as an approximation for longer-lived nuclides. Kedl' 1 showed that such flow terms could be neglected, so that at steady state
~i? " Dt Ds'
where Q, is the volumetric generation rale in core salt, D, is diffusion coefficr.nl in salt. C, is the local con-
S3
cealratioa m salt, an* r is Ike from the sab
cnwiir taaie:
1. at
or, r - 0 , ^ - 0 ;
2. al either surface:
J% * fax at sail at surface;
Cf*CJLc
* r = 0 * w a W coefficient
Integration an* satisfaction of the •ion yields.
C = dlfL
We may aow obtain
JG'*<fZ.
(£) i/J
We mem are able to write the Ashed eipression for the activity of an—whajr ilaaghtre of shon-tjveo' 00016
i vbTtase iato raphite.
vaamteper Sat face activity,.
fcj, '(im.\9m X / X •anpkfte
core vol. \DcJ
2. Activity per gram of
•i(r>"C«i)»«o»-iV.
fi*{**ilDG)tn .
S i / i s < h 2 M f .
3. Total JU.—bt iun for surface.
5" , t a ' * - x ' , c ss: x ' - x y$
OR
Tabic 9.7 aopbes these resatts to the icmoved at die end of ran 14. A obscwatioas given earlier in Table 9 J is later.
A dmo" poaaMity of nuelopmg activity within die graphite is from die traces of oramnm found in die
Here die telaiionship is:
4si<Uft»MhwJm. X / X salt vol. COO! VOl,
" * U coot w graphite at TITTj cone, in
tcatpwen IgoTsan
depth
*7 • itDc/D,)"* cofh ir,>/%D,)
coth ( r . 0 / 0 , ) - I ani Ke < (eDc/ f t )" * .
*+ t r Y w SSttVOl. v
mass con voi.
die it—pfioa that the uranium was present » die giaphite at die given location for essewtiaHy al of die nm. The * * ' U concentration in rod salt wasaboot 15.5001
- 3 not vol. 71ft' corevol." 23 H*
The concentration at vartoos depths of J " U in a spa tun in of CCt graphite is mown in Fig. 9 1$. The surface concentration of about 70 ppm soon falls to
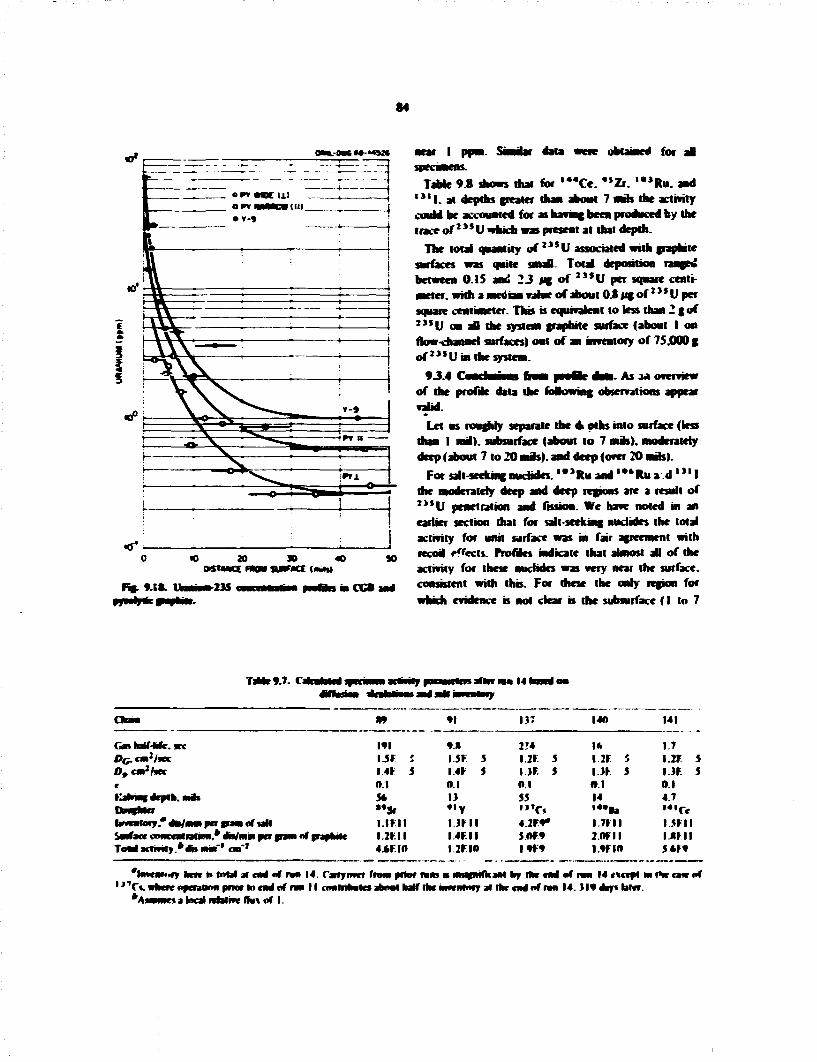
84
•ear I pom. Smmar data wete obtained for a l
TaMe 9,8 shows that lor , 4 4 C e . **Zr . ' • » R u . and 1 " | . at depths greater than about 7 nub the activity could be accounted for as having been produced by the trace of 2 " U which was present at that depth.
The total quantity of 2 , 5 U associated with graphite surfaces was quite small- Total deposition ranged between O.IS and 2 J MB of " 5 U per square centi-meter. with a meson value of about 0 J jig of * J * U per square centimeter. This is equivalent to less than 2 gof " * U on aB the system graphite surface (about I on flow-dunnei surfaces) out of an inventory of 75J0O0 g o f " * U m the system.
• J .4 Cunchnmus from n v n V num. As 3» overview of the profile data the folowing observations appear valid.
Let us roughly separate the A pths into surface (less than I m i ) , subsurface (about to 7 mis), moderately deep | about 7 to 20 nub), and deep (over 20 nub).
For salt-seeking nuclides. ' • , R u and , * * R u a d ' " I the moderately deep and deep regions are a result of 2 > , U penetration and fission. We have noted in an earlier section that for salt-seeking nuclides the total activity for unit surface was in fair agreement with recoil ejects. Profiles indicate that almost all of the activity for these nuclides was very near the surface,
in CCB and consistent with this. For these the only region for which evidence is not clear is the subsurface ( I to 7
Task-9.7. C* t after mm 141
• I IJ7
G » hatf-Mr. KC
0^ cat1 free c Iranian depth. NHH
nn/Min per cram of B N Surface cDfjcuHMioi). dnVoiai per Total activity.* act turn* cm"1
gram of fraphuc
ivl I.5F I I.4F 5 0 1 SA • • * I.IF.II 1 I H I 4*nn
• • I.SF. 5 I.4F 5 0 1 IJ
# , V IJF 11 I4F.I I 1 IF 10
2M I.2F IJF. 0.1 55 I J T 0
42F** 5.0M I f f *
140
I* I IF. 5 IJF $ O I 14 " • • a I.7F.II i o n i I.WIO
141
17 I.2F IJF. 0.1 4.7 , 4 , c < I.SF 11 IDF 11 5*F*
'hnearory hnv » total at end of rvn 14. Carryover from prior IWB B NMa/mfkaM hy fhf end of i m 14 <\c*fi m rHr ca*r of 1 J , C t . whew operaltnn pnor to end of ran I I nwiiihates about half the mnnHny at 0 K end of nm 14. ) I * day* bier,
a local Rtafivc fhn of I.
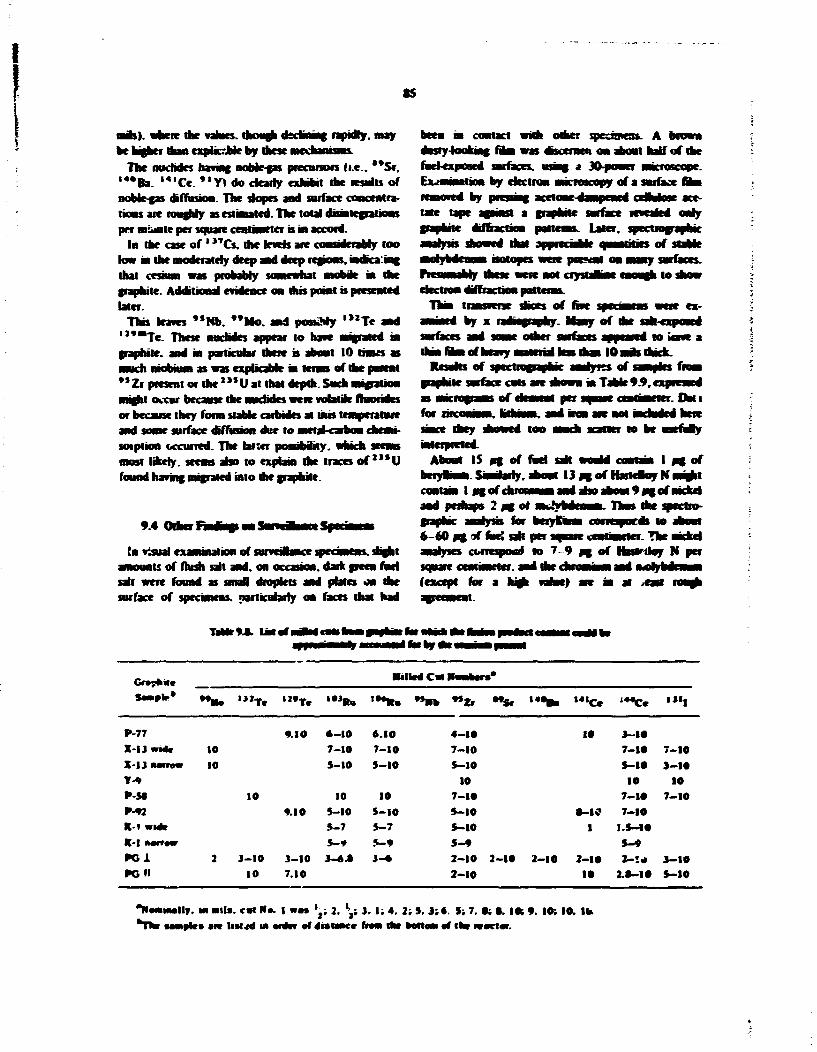
•5
nfls). where the values, tooth dahning rapidry. may been in contact with other spearmen*. A brow* be higher than expUc.-Jbk by these najchanrmw dusry-lookmg fan was discern** on about half of the
The nuclides having noMe-gas precursors |i.e.. **Sr, fuel-exposed surfaces, using a 30-pouer microscope. , 4*Ba. , 4 , C e . " Y i do ckarty exhibit the results of Examination by electron uucroscopy of a surface aha noble-gas diffusion. The slopes and surface coacentfa- removed by pressing acetone d—pentd ceMose ace-tions are toughry as estimated. The total disintegrations tale tape against a graphite surface revealed only per inane per square centhntter is in accord. graphite diffraction patterns. Later, spectrograph*;
In the case of' "Cs. the levels are considerably too analysis showed that appreciahlr nuinrilifi of stable low in the moderately deep and deep regions, indtea:ing ntorybdrnun isotopes woe that cesium was probably somewhat moMe m the Pit iianmlj these were not crystamne enough to i graphite. Additional evidence on this point b presented electron diffraction patterns.
This leaves "Nb. **Mo. and possiMy , , 2 T e and ammed by x ladrograahy. Many of the safe-cxposcd i I * a T e . These nuclides appear to have migrated in surfaces and some other surfaces appeared to iovt a graphite, and in particular there is about 10 times as ihafmnofbeavy mavmalhstbaa lOrndsoutA. much iwobmm as was explicabte in terms of the patent Results of spectrograph* aaalyrr of samples from •*Zr present or the"*U at that drpm. Such migration graphite surface cuts are shown m Tabk 9.9. expressed might ocau because tire ivudides vrere rotatfe fluorides as natwujiami of ekmeat per n m r unlanrwr. Prti or because they fona stable carbides at Wis temperature for uiirmmm. lithium, and iron arc not memdri hem and some surface diffusion dtee to metal-carbon chemi since they showed too much scatter to be useruly soiption occurred. The latter posamnty. which seems mterpreted-most likely, seems also to explain the traces of "*U About IS ng of fuel salt would contain I ng of found having migrated into the graphite. berytmaj. Similarly, about 13 ng of Hartctoy H naght
coatam I iajof chioauum aad also abom 9age*"nickel and perhaps 2 ag ot m ^frdinam Thus the spectro-
9 M j ^ • aaak •* «• . « • aw> » nttamTmatC SBBMWV^BS lumT naftuYEaanma1 CtaBTaCamTdarwaS ftO JaammmaY
A? aVjjBjMwa* av'wBammmaaja aaan WMmaYJmmmmmmwua* Y£ammt?imBmuwmB' BkuwHuvuvat a w a a v a a n w**m w < * a y a t ^ p a a %APvavmpav-'WHi a ? a a ^ r w s
" *»«—»— ^^ ^ rf ^ ^ ^ M B K cBtinnn.Tktmaui gn visual examination of surveillance jut una HJ. shghl analyses ctofTcspond to 7-9 ag of HasKJoy N per
amounts of flush salt and. on occasion, dark green fuel square centimeter, aad the < salt were found as smaR droplets aad plates on the (except for a high value) are in at surface of specimens, particularly on faces that had agreement.
TafcM. Unofi
Graphite atllro CM Ha
* " " - * • • a . ' " T e »"T« » " » • ' • * » . •»H» •»*> " s > » « • » . " » C e '**€> « " l
P-77 9.10 « - i 0 6.10 X-\i wvt* 10 7 -10 7 - 1 0 X - U M c n m 10 5-10 S -10 Y-9 •MO 10 10 10 P-02 9.10 5-10 S -10 R-i « • * 5 -7 5 - 7 K-I narrow S—• 5—9 K l 2 3 - 1 0 3 - 1 0 3 -6 .0 3 - * PCM 10 7.10
4-10 in 3--I0 7-10 7-10 7-10 $-10 S-10 S-10
to 10 10 7-10 7-10 7-10 5-10 0-IC 7.10 S-10 I !.S-10 $ - 9 S-0 2-10 2-10 2-10 2-10 2-Itf 3-10 2-10 10 2.0-10 S-10
"Nominally, in n i l s , cat Wo. I was l
JW 2. \i i. I; 4. 2; 5. 3;« . S; 7. 0i 0. 10; 9. 10; 10. l b *Th» samate* are \ivtrt IN afwtr of •'••tatce rt»a ttar bottom of the ivoclor.
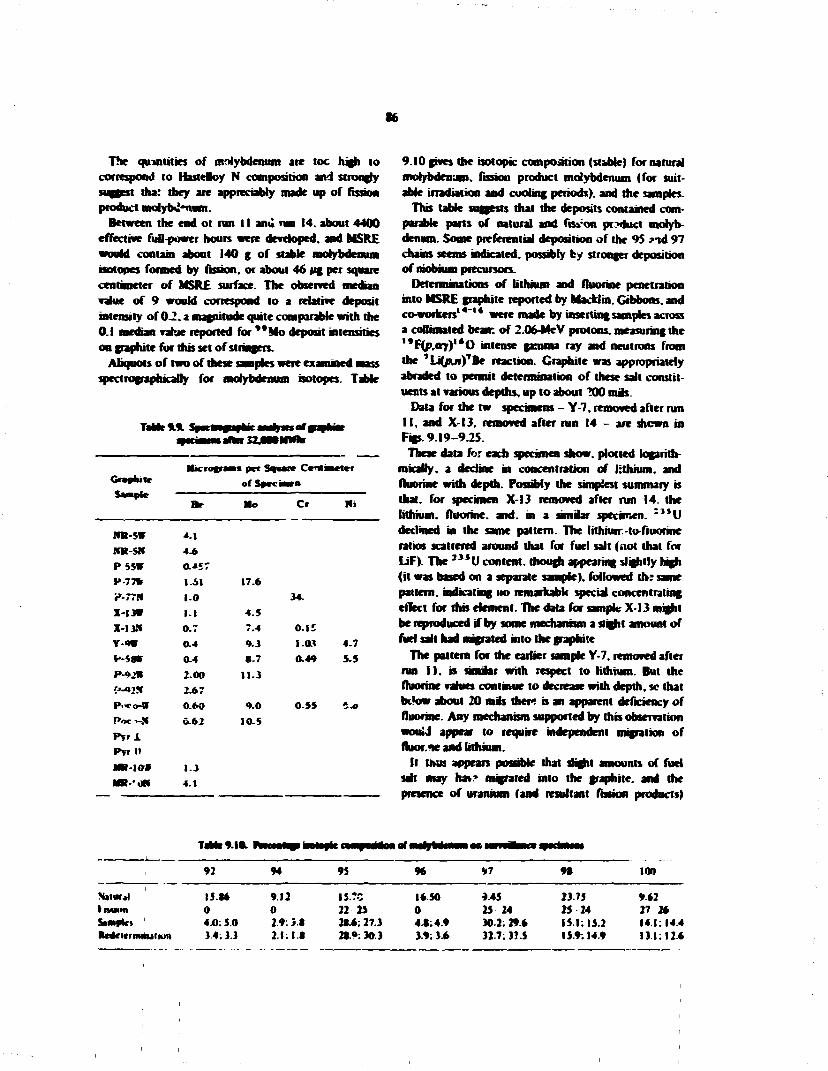
86
The qumtities of molybdenum are toe high to correspond to HasteHoy N composition and strongly suggest tha: they are appreciably made up of fission product molyb«!"num.
Between the end ot run 11 ami nm 14. about 4400 effective full-power hours were developed, and MSRE would contain about 140 g of stable molybdenum isotopes formed by fission, or about 46 ug per square centimeter of MSRE surface. The observed median value of 9 would correspond to a relative deposit intensity of 0.2. a magnitude quite comparable with the 0.1 median value reported for * * M o deposit intensities on graphite for this set of stringers.
Aliquou of two of these samples were examined mass spectrographkally for molybdenum isotopes. Table
TaUrMl Tinaiipiifci i i i l j inofa j sain • m i — m aft" H j m n U i
Micruii—» pet Square C e K » r m Gn*lut* otSfecmtu Sample
&• Ho Cr Hi
IfB-SW 4.1 MR-5W 4.6 P 5SW a*57 P 7 7 * 1.51 17.6 i»-77!« 1.0 X-13W I . I 4 .5 X-1JM 0.7 7.4 Y-9W 0.4 9.3 f-S8W 0.4 8.7 P-9JW 2.00 I I . 3 r*«2!t 2.67 p.«o-W 0.60 9.0 Poc>-!» 6.62 10.5 P r r i P*r It
MR- IO* 1.3 MR-'ON 4.1
TaMtv.10. NNMMBtaovasvc
92 94 95
Mmwjl I5 .M 9.12 15.70 liwwm 0 0 23 35 Sampkt 4 0:50 2.9:31 216; 273 RcofMrmMuiwn 34. J ) 2.1: I J 2t.9:30.)
9.10 gives the isotopic composition (stable) for natural molybdenum, fission product molybdenum (for suitable irradiation and cooling periods), and the samples.
This table suggests that the deposits contained comparable parts of natural and ftsvon product molybdenum. Some preferential deposition of the 95 ?nd 97 chains seems indicated, possibly by stronger deposition of niobium precursors.
Determinations of lithium and fluorine penetration into MSRE graphite reported by MacUin. Gibbons, and co-workers' *"' * were made by inserting samples across a coftmnted bean: of 2.06-MeV protons, measuring the **f{p,arj)t*Q intense gamma ray and neutrons from the 7 U(/> j i ) 7 Be reaction. Graphite was appropriately abraded to permit determination of these salt constituents at various depths, up to about 200 mils.
Data for the tw specimens - Y-7. removed after run 11, and X I 3 , removed after run 14 - are shewn in Figs. 9.19-9.25.
These data for each specimen show, plotted logarithmically, a decline in concentration of lithium, and fluorine with depth. Possibly the simplest summary is that, for specimen X I 3 removed after run 14. the lithium, fluorine, and. in a similar specimen. : i s U declined in the same pattern. The lithrurr-io-fiuorme ratios scattered around that for fuel salt (not that for LiF). The " 5 U content, though appearing slightly high (it was based on a separate sample), followed t h ; same pattern, indicating no remarkable special concentrating effect for this element. The data for sample X-13 might be reproduced if by some mechanism a slight amount of fuel salt had migrated into the graphite
The pattern for the earlier sample Y-7. removed after run 11. is smMar with respect to lithium. But the fluorine values continue to decrease with depth, so that bt'ow about 20 mis there is an apparent deficiency of fluorine. Any mechanism supported by this observation would appear to require independent migration of fluor.ie and lithium.
It thus appears possible that slight amounts of fuel salt may hat.* migrated into the graphite, and the presence of uranium (and resultant fission products)
96 97 9» 100
16.50 4.45 23.75 962 0 25 24 25 24 27 26 4J.4.9 30.2; 296 15 1:15.2 14 1:144 3.9:3.6 32.7.3?.S 159:149 13.1:12.6

87
wo, WOO o FIRST SURFACE TO CENTER -
TO CENTER \ • * " b N SMRUM SPECIMEN - - - - - - 500
•0 <00 OtSTfttCE FROM SURFACE (mis)
WOO
F«.9.I9. i horn the wriace. Y-7.
900
200
•00
I *>
I
„ 0 MEASUMK aHMNO FNOH FMST SURFtCC - -» MEUURMC OUTMMO TOMNO SECOW —
I * . - » • ! •
\ . V . . . . — .- — . ....... . . .*. . . .
't~%L. . . *- - v** * • — .
CENTER
' 0 2 S *> 2 5 WO 2 a c P T M t M *
s coo
0 0 0 9 001 002 . 0 5 0 1 0 2 OS «0 SEPT* i t - l
Hg. ».»
tooo g n i ' M I » » < «
« " ' 2 » « r * 2 » «or' 2 j rf OCPTn Icm)
Fa* M l w p o i l to RMMM I M mm m * t MSKE In- MM* MrsnrcinnMt «m* matt as (he MMMIT • » W J M J _ a r a i pnfirymt fnMi :he fini nrfac* lo Ik* cntei drctn) ami thai froai ibr imtrior -.jwartf ike MCOMJ (CMMMl IriMMjR). U K MJKMKa d W D MC » the M M M Mffaoc csvmcrt lo moilcn «lt*.
Y-7.
tmimct from

88
woo oam-oac M-MSJO
•O 100 DISTANCE FROM SUftMCC ("••"»)
Fig. 9.22. FhMfMB concnttatmi at» fWictfeM of irofii dw M n t t t X-IJ.
500
aoo
wo
so
20
OKNL-0W6 C6-M5M
! • - o — SAMPLE Y - 7 r — • — SAMPLE X - O
-+V--• V- ttrair - * • - • + — » - » * • •
r^tr.n » *
•4—i—U-
• M - •4-+
a > " •
+-j 1 V — + — * » •* » •-• 1 -» • -
w i > • • » * • » * * • > - i : * * - - -> t t -rr
1 i- *•
5 10 20 90 0 0 200 OBTANCE FROM SURFACE , MM
900
Fif, 9.23. tYlmiXli.
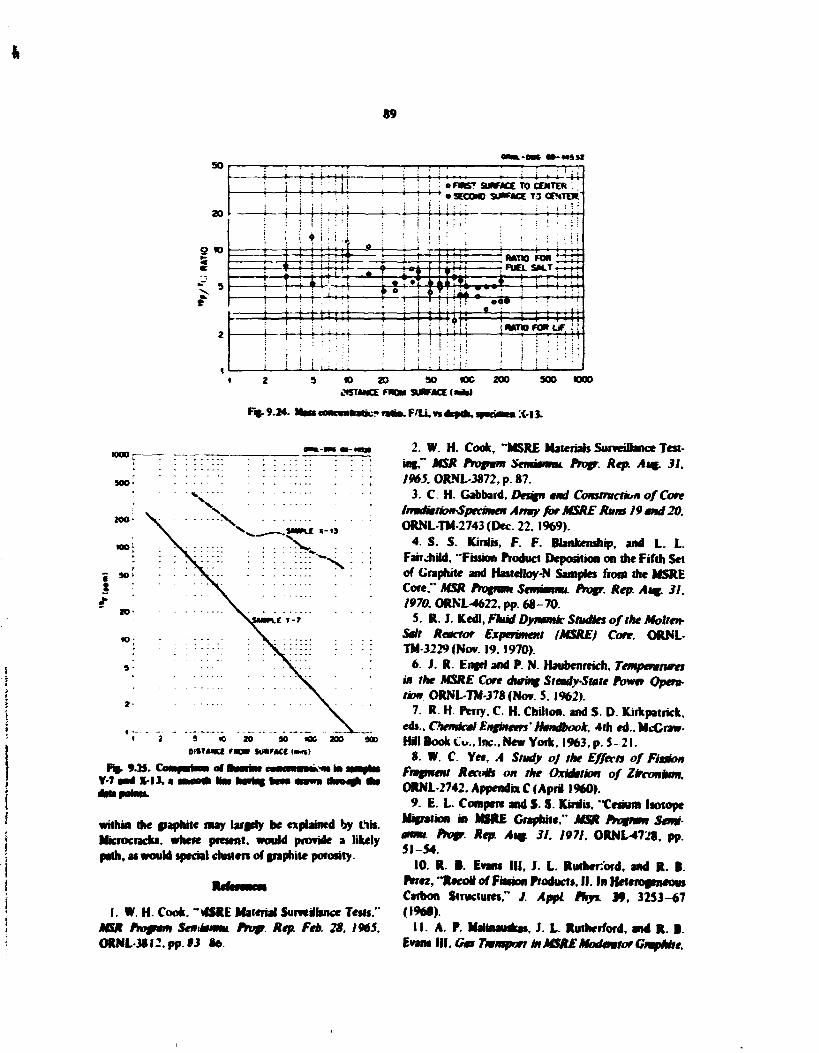
89
so
» v
s w
4-W--•• I I I
4—1-+ : o FRST SURFACE TO CENTER
"* • SECOND SU"**CE T3 CENTO*
—I—(—t—i
! i i t ' i ' . * . ; ; i i l ! ; i I j i j j i i j - L j ; ; rTffcp 1—±—>• i ; • • » 1 — * — • — i i • i » i
I—t i-t r»--1—* i - • .1 I I W -^m I i — M - r
~ RATIO FOR 1 -; FUEL SALT T
iw •H4+ - i — ! M ' it
M i ! jtjil i j 1 ! Hi I 8 Mi l -t44-
{RATIO FOR OF
Rg.9.24.
W 20 SO «K 200 SCO O00 MTANCE FROM SURFACE C«M
F'Li. n ataOM, niiti—• x-t J.
MO-
ZOO-
KIO;
r 90-
20-
S 10 20 90 IOC 200 900 DiSTMtct rmm SUHMCC ««»»
within the graphite may largely be explained by tin. Microcrack*. where present, would provide a likely path, at would special dusters of graphite porosity.
I.W.H. Cook. "vSRE Material Surveillance Tests." MSR Program Senmrmu. Progr. Rep. Feb. 28. 1965. OftNL-3Sl2.pp.93 86
2. W. H. Cook, "MSRE Materials Surveillance Testing," MSR Program Semiannu. Prop. Rep. Aug. 31. /yttS.ORNL-3872,p.87.
3. C. H. Cabbard, Design and Construction of Cote Irradiation-Specimen Army for MSRE Runs 19 and 20. ORNL TM 2743 (Dec 22,1969).
4. S. S. Kirsbs, F. F. Bbnkenship, and L. L. Fair child, "Fission Product Deposition on the Fifth Set of Graphite and HasreJloy-N Samples from the MSRE Core." MSR Program Semiannu. Progr. Rep. Aug. 31, 1970. ORKL-4622, pp. 68-70.
5. R. J. Kedl, Fluid Dynamic Studies of the Molten-Sail Reactor Experiment /MSRE) Core. ORNL-TM 3229 (Nov |9.1970).
6. J. R Engel and P. N. Haubenreich, Temperatures in the MSRE Core during Steady-State Power Operation ORNL TM-378 (Nov 5. 1962).
7. R H Perry. C. H. Chilton, and S. D Kirkpatrkk. «b.. Chemical Engineers Handbook, 4th ed.. McGraw-Hill Book Co.. Inc., New York. 1963, p. 5-21.
8. W. C. Yet, A Study of the Effects of Fission Fragment Recoils on the Oxidation of Zirconium. ORNL-2742. Appendix C (April I960).
9. E. L. Compere and S. S. Kirslis. "Cesium Isotope Migration in MSRE Graphite," MSR Program Semiannu. Progr. Rep. Aug 31. 1971. 0RNL47^8, pp. 51-54.
10. R. B. Evans III, J. L Rutherford, and R. B. Perez, "Recoil of Fission Products, II. In Heterogeneous Carbon Structures," / AppL Pays. 19, 32S3-67 (I9*»>
11. A. P. MaUnauskas. J. L Rutherford, and R. B. Evans III. Gas Transport in MSRE Moderator Graphite,
90
/. Reriew of Theory and Counter Diffusion Experiments. ORNL-4148 (September 1967).
12. R. B. Evans (II, J. L. Rutherford, and A. P. Maiinaudcas, Gas Transport in MSRE Moderator Graphite. II. Effects of Impregnation. III. Variation of Fhw Properties, ORNL4389 (May 1969).
13. R. J. Kedl, A Model for Computing the Migration of Very Short Lired Noble Gases into MSRE Graphite. ORNL TM18I0< July 1967).
14. R. L. Macklin, J. H. Gibbons. E Rkci. T. H. Handley. and D. R. Cuneo. "Proton Reaction Analysis for Lithium and Fluorine in MSR Graphite," MSR
Program Semkmmi Progr. Rep. Feb. 29. 1968. ORNL 4254. pp. 119 27.
15. R. L. Maddin. J. H. Gibbons, and T. H. Handley. Proton Reaction Analysis for Lithium and Fluorine in Graphite. Using a Slit-Scannmg Technique. ORNL-TM-223S Uuly 1968 >.
16. R. L. Macklin. J. H Gibbons. F. F. Blankenship. E. Rkri. T. H. Handley. and D. R. Cuneo. "Analysis of MSRE Graphite Sample X-13 for Fluorine and Lithium." MSR Program Scmnnnu. Progr. Rep Aug 31. 1968. ORNL-4344. pp. 146 50.
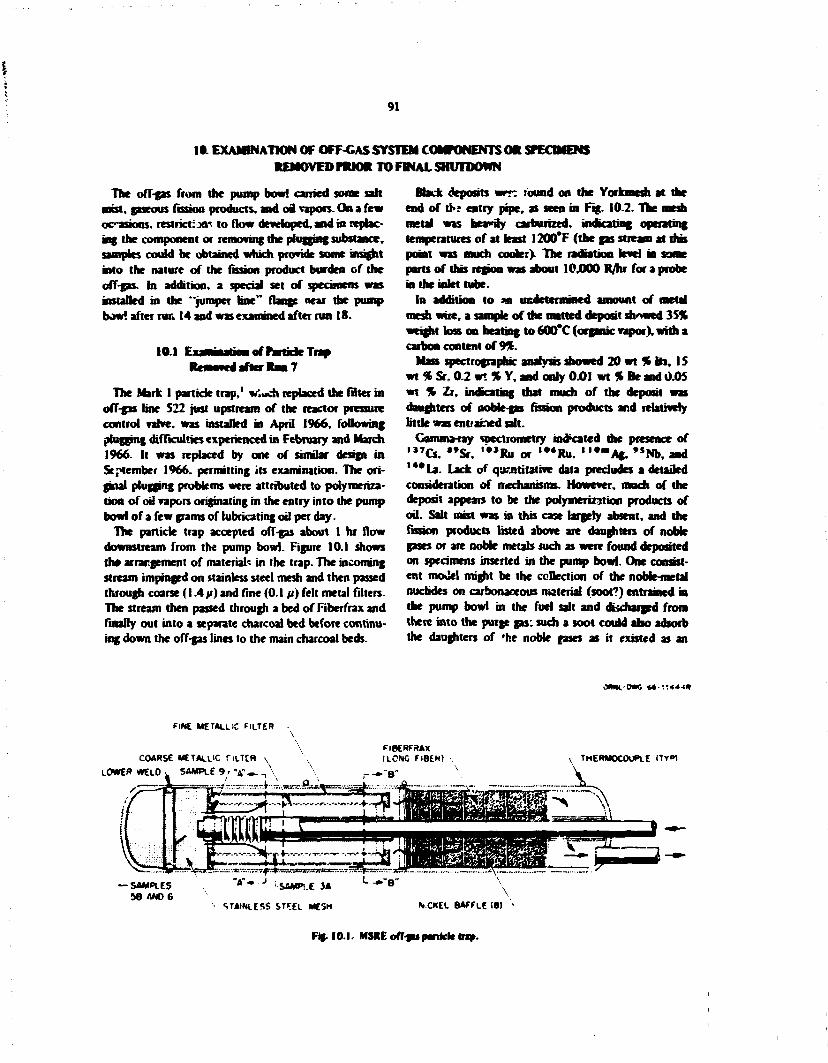
91
10. EXAMINATION OF OFF-GAS SYSTEM COMPONENTS OR SfECIMENS REMOVED PRIOR TO FINAL SHUTDOWN
The off-gas from the pump bowl carried some salt mist, gaseous fissioa products, and o i vapors. On a few occasions, restrict:xn to flow developed, and in replacing the component or removing the plugging substance, samples could be obtained which provide some insight into the nature of the fission product burden of the off-gas. In addition, a special set of specimens was installed in the "jumper line" flange near the pump bow! after run 14 and was examined after run 18.
10.1 E u N M U t m i o f P w t k k T r a n Removed after Ran 7
The Mark I particle trap,1 W.uch replaced the filter in off-gas line 522 just upstream of the reactor pressure control valve, was installed in April 1966, following plugging difficulties experienced in February and March 1966. It was replaced by one of similar design in September 1966. permitting its examination. The original plugging problems were attributed to polymerization of oil vapors originating hi the entry into the pump bowl of a few grams of lubricating oil per day.
The particle trap accepted off-gas about I hr flow downstream from the pump bowl. Figure 10.1 shows th» arrangement of material.-: in the trap. The incoming stream impinged on stainless steel mesh and then passed through coarse (1.4 p) and fine (0.1 it) felt metal filters. The stream then passed through a bed of Fiberfrax and finally out into a separate charcoal bed before continuing down the off-gas lines to the main charcoal beds.
Black deposits wrrt round on the Yorkmesh at the end of ti»» entry pipe, as seen in Fig.. 10-2. The mesh metal was hevny carburized, indicating operating temperatures of at least I200*F (the gas stream at rhts point was much cooker). The radiation level in sane parts of this region was about 10,000 R/hr for a probe in the nuet tube.
In addition to *n undetermined amount of metal mesh wire, a sample of the matted deposit showed 35% weight loss on heating to 600*C (organic vapor), with a carbon content of 9%.
Mass spectrographic analysis showed 20 wt % its, 15 wt % Sr. 0.2 wt % Y, and only 0.01 wt % Be and 0.05 wt % Zr, indicating that much of the deposit was daughters of nobfe-gas fission products and relatively little was entiacted salt.
Gamma-ray oectrometry indicated the presence of , 3 T C s . " S r , , , 3 R u or , # * R u , , , 0 - A g . »*Nb, and ' • • L a . Lack of quantitative data precludes a detailed consideration of mecharusms. However, much of the deposit appears to be the polymerization products of od. Salt mist was in this case largely absent, and the fission products listed above are daughters of noble gases or are noble metals such as were found deposited on specimens inserted in the pump bowl. One consistent mo«!el might be the collection of the noble-metal nuclides on carbonaceous material (soot?) entrained in the pump bowl in the fuel salt and dtsduwyed from there into the purge gas: such a soot could also adsorb the daughters of 'he noble fasts as it existed as an
0MfM.-0«G «4-:T«44l»
FINE METALLIC FILTER
COARSE METALLIC fiLTLR x
LOWER WELD v SAMPLE 9 r "A' *- -, \
FIBERFRAX (LONG Fie£W
- - • " B N THERMOCOUPLE (TT»)
— SAMPLES 58 AN06
STAINLESS STF.EL MESH VCKEL BAFFLE (8)
Fig. 10.1. MSRE of f f« panicle fra».
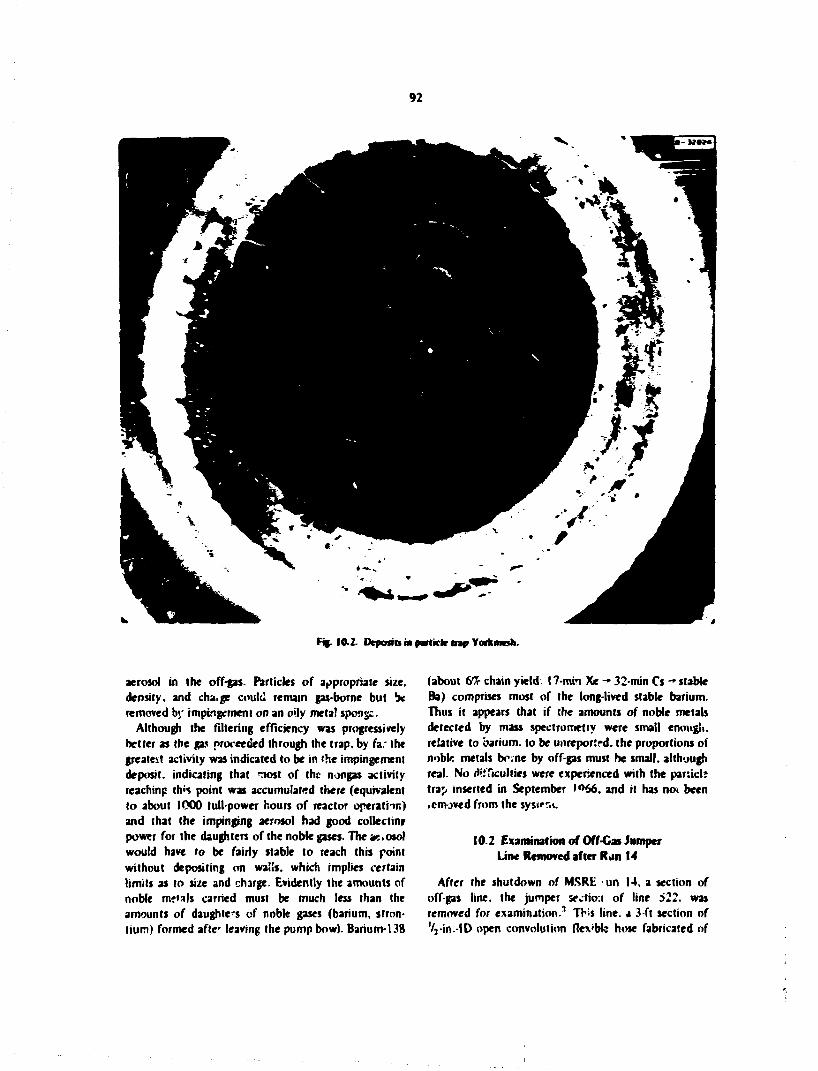
92
FiB- 10.2. Deposes m particle trap Yortmoh.
aerosol in the off-gas. Particles of appropriate size, density, and cha.ge could remain gas-borne but b* removed by impingement on an o'ly metal sponge.
Although the filtering efficiency was progressively better as the gas nroreeded through the trap, by fa; the greatest activity was indicated to be in the impingement deposit, indicating that <nost of the nongas activity reaching th'5 point was accumulated there (equivalent to about 1000 tull-power hours of reactor operathn) and that the impinging aerosol had good collecting power for the daughters of the noble gases- The ae.osol would have to be fairly stable to reach this point without depositing on walls, which implies certain limits as to size and charge. Evidently the amounts of noble mfials carried must be much less than the amounts of daughters of noble gases (barium, strontium) formed afte' leaving the pump bow). Barium-138
(about 6% chain yield. 17-min Xe -* 32-min Cs -* stable Ba) comprises most of the long-lived stable barium. Thus it appears that if the amounts of noble metals detected by mass spectrometiy were small enougii. relative to barium, to be unreported, the proportions of noble metals br.ne by off-gas must he small, although real. No r>!!'ficulties were experienced with the par;icf; trap inserted in September '°66. and it has not been •cmoved from the sysif r.i.
10.2 Examination of Off-Gas Jumper Line Removed after Ran 14
After the shutdown of MSRL un 14, a section of off-gas line, the jumper se»tio.i of line 522, was removed (or examination .* THs line. * 3-ft section of '/j-in.-ID open convolution flex'bb hose fabricated of
93
type 304 stainless steel with O-ring fbnges on each end. was located about 2 ft downstream from die pump bowl. The upstream flange was a side-entering flange which attaches to the vertical one leaving the pump bowi. white the downstream flange was a top-entering flange which attaches to the widened holdup line. The jumper discussed here, the third used in the MSRE. was installed prior to run 10. which began in December 1966.
After the shutdown, the jumper section was transferred to the High Radiation Level Examination Laboratory for cutup and examination. Two flexible-shaft tools used to probe the line leading to the pump bowl were also obtained for examination. On opening die cuntainer an appreciable rise in hot-cell off-gas activity was noted, most of it passing (he cell filters and being retained by the building charcoal trap. As the jumper section was removed from the container and placed on fresh Mutter paper, some dust fell from the upstre.m flange. This dust was recovered, and a possibly larger amount -.o» obtained from the flange far; using a camel's !'.JI: brush. The powder looked like soot: it fell but ii.:'"red somewhat in the moving air of the cell, as if it were a heavy dust. A sample weighing approximately H mg read about 80 R/hr at "'comae'." The downstream flange was tapped and brushed over a sheet of paper, and similar quantities of bfcck powder were obtained from it. A sample weighing approximately IS mg resd about 200 R/hr at cor lact. Chemical and radiochemical analyses of these dust samples are given later.
The flanges each appeared to have a smooth, dull-black film remaining on them but no other deposits of significant ir-ig. 10.3). Some unidentified bright flecks were ven in or on the surface of the upstream flange. Wrier' the black film was gently scratched, bright metal showed through
Short ieclicr.: of the jumper-line hose (Fig. !0.4) were taken from each end. examined microscopically, and submitted for chemical and radiochemical analysis. Except for rather thin. dull-Mack films, which smoothly covered all surfaces ir.cluding the convolutions, no deposits, attack, or other effects were seen.
Each of the flexible probe tools was observed to be covered with blackish, pasty, granulat material (Fig. 10.5). This material was identified by x ray as fuel-salt particles. Chemical and radiochemical analyses of the tools will be presented later.
Electron microscope photographs (Fig. 10.6) taken of the upstream dust showed relatively solid particles of rhc order of a micron or mo c in dimension, surroum'ed by a material of lighter and different structure which appcarc.' to be amorphous carbon; electron diffraction line* for gijphitc were noi evident.
An upstream !-m. section of t V jumper line near the flange read ISO R/hr at contact: a similar section near die downstream flange read 350 R/hr.
10.2-1 Cht—rri —Tjiii Portions of the upstream and downstream powders were analyzed chemically for carbon and spectrographicaOy for lithium, beryllium, zirconium, and other cations. In addition. " * U was determined by neutron activation analysis; this could be converted to total uranium by using the enrichment of the uranium in the MSRE fuel salt, which was about 33%.
Results of these analyse., are sh'.wn in Table 10.1 -Analyses of the dust samples show 12 to 16% carbon.
2d to 54% fuel salt, and 4% structural metals. Rased on activity data, fission products could have amounted to 2 to 3% of the sample weight. Thereby S3 to 22% of •b? sample weight was not accounted for in these categories or spectrographically as other metals. The discrepancies may have resulted from the small amounts of sample available. The sample did not lose weight under a heat lamp and thus did not contain readily volatile substances.
10.2.2 Radiochemical analysis. Radiochemical analyses were obtained for the noble-metal isotopes ' ' ' Ag, 1 ° ' R u . ' ° J Ru. '»Mo. and "Nb.for **Zr; for the rare earths , 4 7 N d . , 4 4 C e . and , 4 , C i : for the daughters of the fission gases krypton and xe.'on: " Y. *'Sr. " S t , 1 4 0 B a . and , 3 T C s : and for the tellurium isotopes l 3 I T e , I J » T e . .->nd , 7 , I (tellurium daughter). These analyses were obtained on samples of dust from upstream and dowro:ream flanm. on the approximately I-in. section*, of flexible hose cut near the flanges, and on the first flexitie-shaft tool used to probe the pump off-gas exit line.
Data obtained in the examination are shown in Table 10.2, along with ratios to inventory.
It appeared reasonable to compare the dust recovered from the upstream or downstream regions with the deposited material on the hose in that region: this was done for each substance by dividing the amount deposited by the amount found in 1 g of the associated dust.
Values for the inlet region were reasonably consistent for a!l classes of nuclides, indicating that the deposits could be regarded as deposited dust. The median value of about 0.004 g/cm indicates that the deposits in the inlet region corresponded to this amount of dust. A similar argument may be made with respect to the downstream hose and outlet dust, which appeared to be of about the fame material, with the median indicating about 0.016 g/cm. Ratios of outlet and inlet dust values had a median of 1.5. indicating no great difference between the f *o dust samples.

94
PHOTO t»56 - 7«
Fig-10.3- Deposits oftjampcr K M flanpts after ran 14.
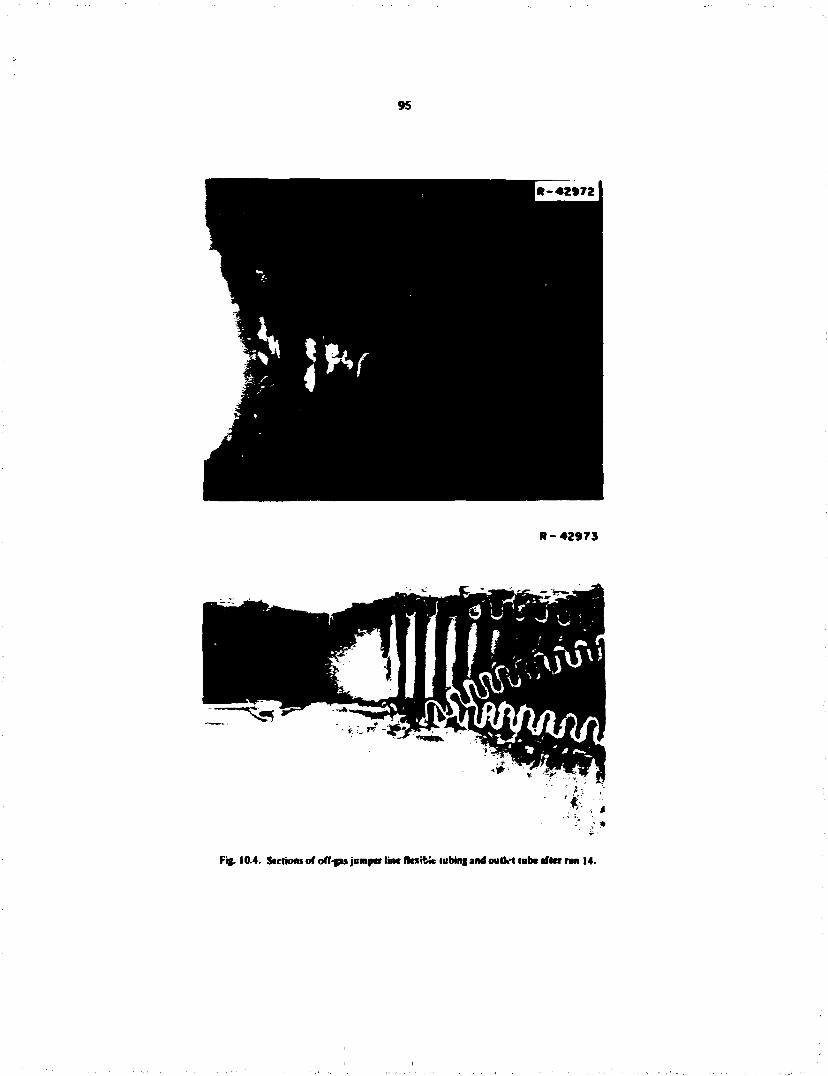
95
n- 42973
'£, i
Fig. 10.4. Sections of off-ps jumper line flnibk lubing and outkt lube after ran 14.
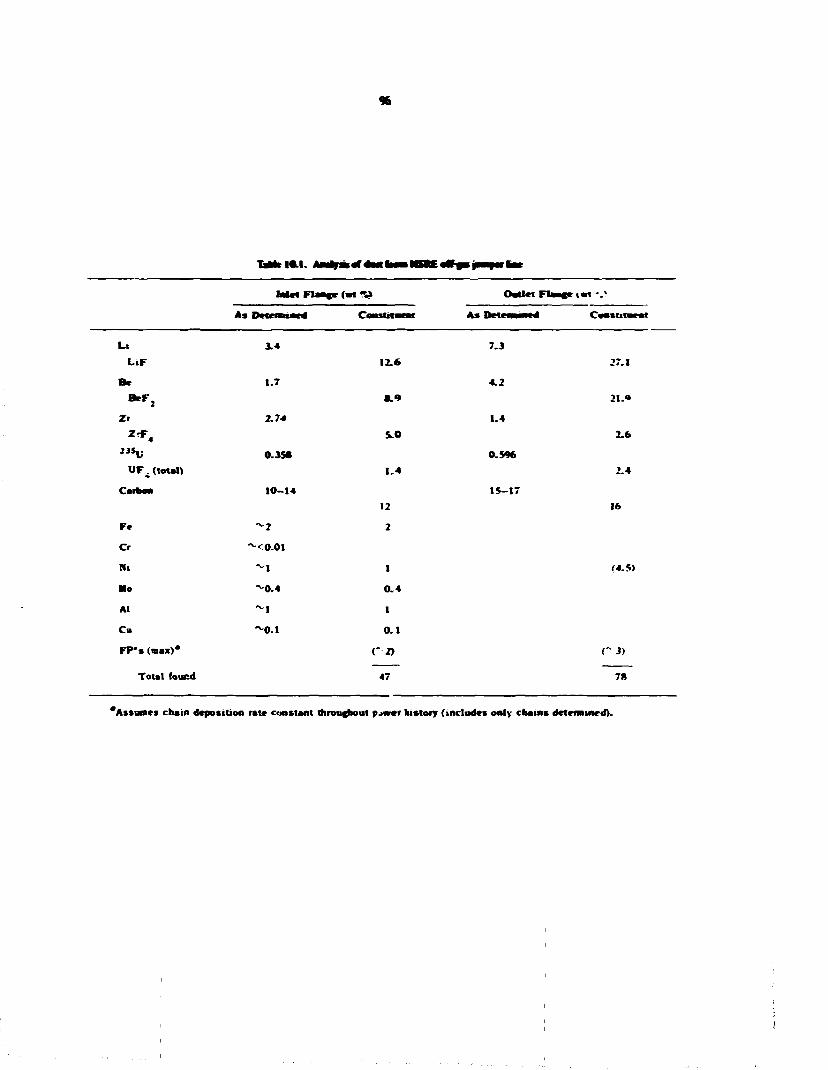
%
l«Ll .
Inlet Flange <•* 1*
As ConstttneM
Outlet Fiance \mx -.»
As Pet t ra in i s Constituent
Li
LiF
Be B e F ,
Zr 2rT.
3.4
1.7
2 .7 *
»*u O.JS U F ; (total)
Carbon 1 0 -
Fe ~ 2
Cr ~ < 0 . 0 I
Nt ^ 1
Mo ~ 0 . 4
AI ~ l
Cu ^ 0 . 1
F P ' s (mas)*
Total found
12.6
*.9
S.O
1.4
12
2
I
0.4
I
0.1
(" 2)
47
7.3
4.2
1.4
0.596
15 -17
27.1
2I-«
2.6
2.4
16
<4.5>
r 3) 7 *
Assumes chain deposition rate constant throughout pjwer history (includes only chains determined).
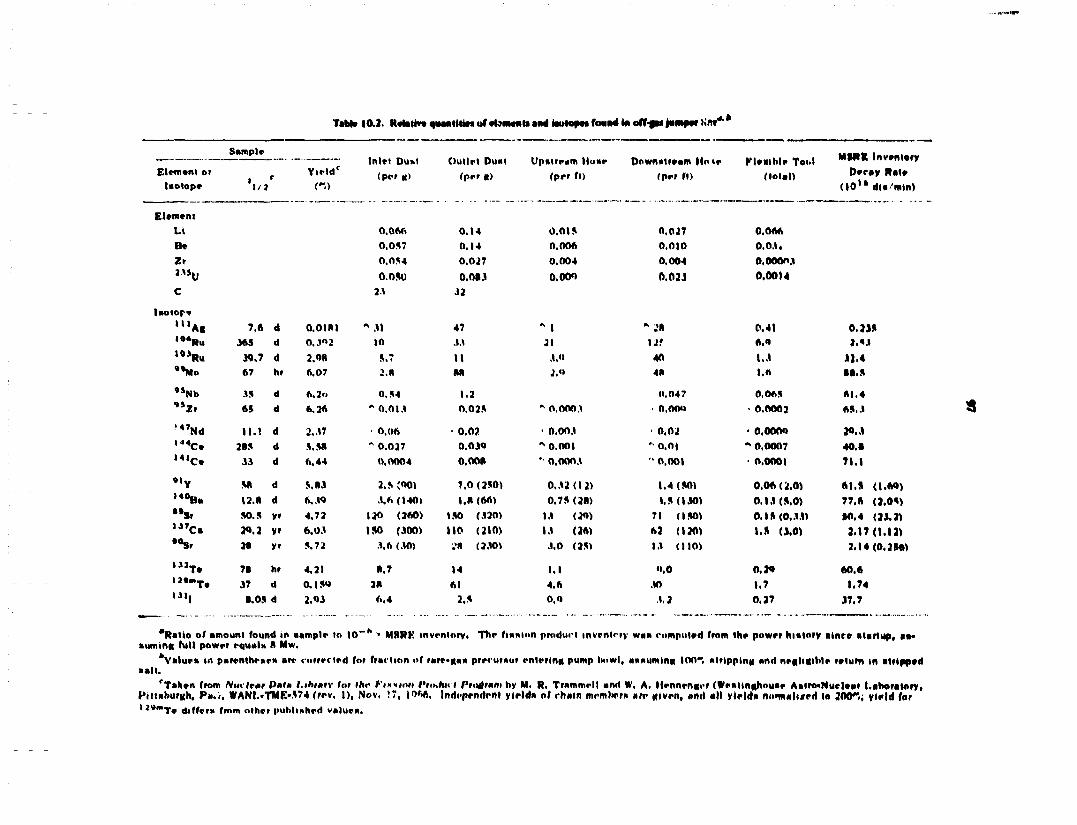
Tabic 10.2. Ratattvt QUMHitW* of efcmenli and tMrtape* found ia off-f»* Jump** liftt - '
Sample
Y i e l d r
Inlet Duht (per it)
Oullel Dual (per t )
Upatream l|o*e (per ft)
Downatream M««e (per ft)
Flealble Toi.l (total)
MMtK Inventory Element or
Imolope ' , / ,* Y i e l d r
Inlet Duht (per it)
Oullel Dual (per t )
Upatream l|o*e (per ft)
Downatream M««e (per ft)
Flealble Toi.l (total) Deray Rat*
( l O ^ d t a m t n )
Element L i 0,066 0.14 0.015 0.027 0.066 Be 0,057 0.14 0,006 0,010 0 .03 . Zr 0.054 0.027 0,004 0.004 0,00003
"»u 0.050 0.013 0.00O 0.02J 0.0014 c 23 32
Isotope m A « 7.6 d O.OIftl * 3 1 47 *\ 1 * i* 0.41 0.235 i o » R u 36S d O.J"2 10 x\ 21 12* 6.0 3.«3 » P i R u 39.7 d 2.08 5.7 11 .1.0 40 1.3 31.4 •»Mo 67 hr 6.07 2.« M 2,<» 4* I.A • 1 . 5
, s N b .IS d 6.2« 0.54 1.2 0.047 0.OA5 61.4 , J Z r 65 d 6.36 * 0,013 0.035 * 0.0003 • O.OOtt • 0.0003 65.3
, 4 , N d l l . l d 2,37 0,06 • 0.02 • 0.003 0.02 • 0,0000 20.3 , 4 « C e 2B5 d 5.5» * 0.027 0.03O * 0.001 " 0,01 - 0.0007 40. • M , C e 13 d 6.44 0.0004 0.00ft ' 0,0003 " 0.001 • 0,0001 71.1
" Y 5P. d 5,63 2.5 v'O0) 7 .0 (250) 0 .32 (12 ) 1 .4(50) 0 .06 (2 ,0 ) At.S (1.60) M 0 B a I2 .« d 6..W 3.6 (140) l.ft (66) 0.75 ( 2 i ) 1.5(130) 0.1.1(5.0) 77.6 (2.05) " S r SO. 5 yr 4.72 120 (260) 150 (320) 13 (20) 71 (150) 0 .15(0 .33) 50.4 (3 J. 3) I J 7 C , 20.2 yr 6.03 150 (300) 110 (210) 13 (26) 63 (120) 1.9 (3.0) 3.17(1.12)
t 0 S r 26 yr 5.72 3.6 (30) J* (230) 3.0 (25) 13 (110) 2 .14(0 ,356)
, J 1 T . 76 hr 4.21 A. 7 14 I . I 0.0 0.20 60.6 ' " " T e 37 d 0.150 211 61 4.6 30 1.7 1.74 1 3 ) , «.05 d 2.03 6.4 2.5 0.0 1.2 0.27 J7.7
"Ratio of amount found ir> sample to I 0 - " ' MSRK inventory. The fiNNion pmdurl inventory waa computed from the power hiatory atnre i lartup, • • • awning full power equal* H Mw,
""Value* in parentheae* are corrected for fraction of rare>n** precuraor entering pump IM>WI, aaaumina. 100", atrlpplng and negligible return in atripped aalt.
'Taken from Nui lr«r Para l.thtatv lot the /•'insnm 1'nt.hn l f'to^ntm hy M, R. Trammell and W, A, Hennengor (Weallnghouae Aatro«Nucla«r Laboratory! Pittsburgh. P a . . , WANl.«TME«574 (rev. 1), Nov. 17, 1066. Independent y ie ld* of chain member* are itlven, ami all y ie ld* noqnali«pH to 200*.; yield for 1 " " T r differ* from other publi*hed value*.
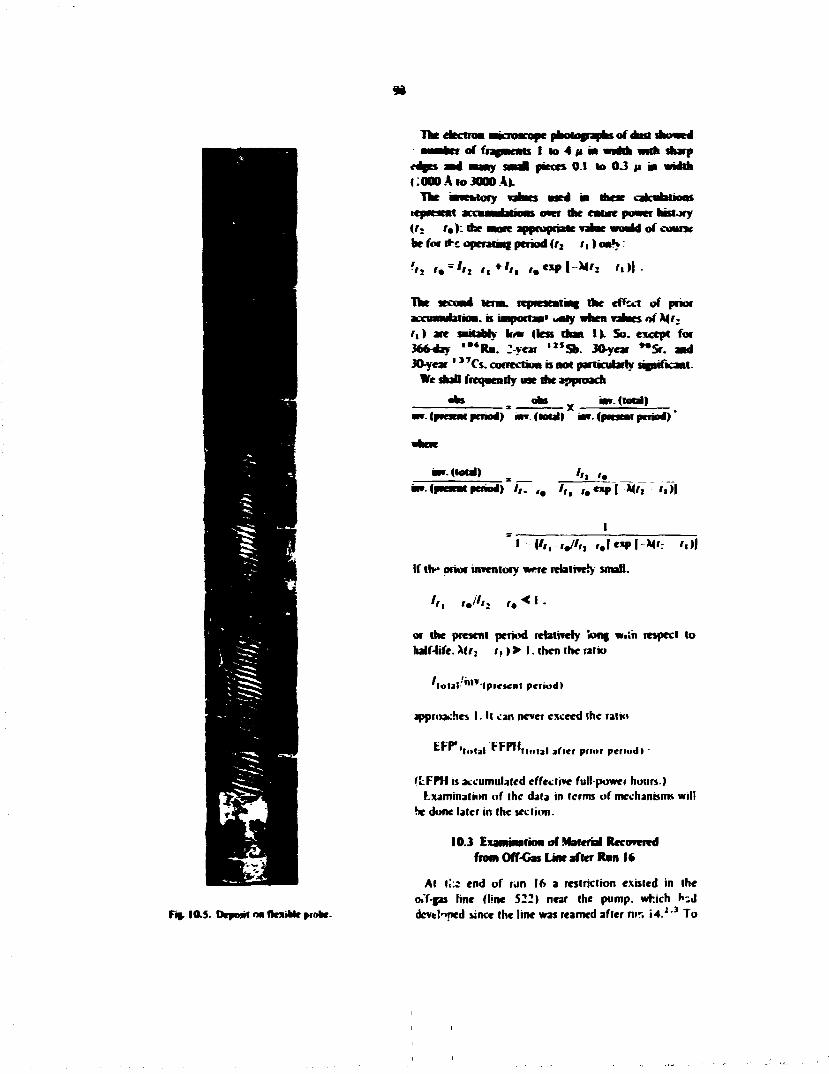
9 i
H e electro* microscope pkxopaphsof dust showed nwmber of fragments I to 4 p m width with sharp
edges and many smal pieces 0.1 to 0 3 j i in width COOOAtoJOOOA).
The hncMory i j h m wed in these catenations icpnaest armi—IMWIWI o w the eatjrc power history (iz r«>: the More appropriate n h t would of course he for frc operating period (tx it) onN:
-ii '• = §'s i, * 'it '• e * P « - * ' i ' • H
The second term, rcptc suiting the effect of prior acewneiation. is importa*' uory when values of M'z f , ) are suitably k m (less don 1). So. except for 366-day ' • * R u . :-year ' " S b . 3f>year »*5r. and 30-year ' > 7 C s . correction is not panicubrty significant.
We shall frequently use die approach
«*» oh* x Jnv(total) nv. (PKJUM period) «r». (total) • * . (pwnm period)
• » • (total) . />, r. in*. (pment period) / , . , . / , , , , exp [ Mh ', )|
| "l l'«, » A »,|exp|Xr : r,)|
If th* orior inventory wrre relatively small.
or the present period relatively long w»h respect to half-life. Miz i,)> \. then ihc ratio
*loIal'n ,*-|pre»«iil period)
approaches I. M can never exceed the ratio
" ' 'lolal * *"™*ftt»lal after prior period) -
(LFPH is accumulated effective full-power hours.) Examination of the data in terms of mechanisms will
be done later in the section.
10.3 Eummafion of .Material Recovered from Off-Cos Line after Ran 16
At tl:: end of run 16 a restriction existed in the oi'f-gas line (line 522) near the pump, which hiJ dcvtl'MKd since the line was reamed after mr. i 4 . i > To

n
• PCM- . « 4 H - t t
f * 1 H OmtfCB-HlhmmuptlHBm iw<»f j»nyn fcmftwraw I4(IMJ» x).
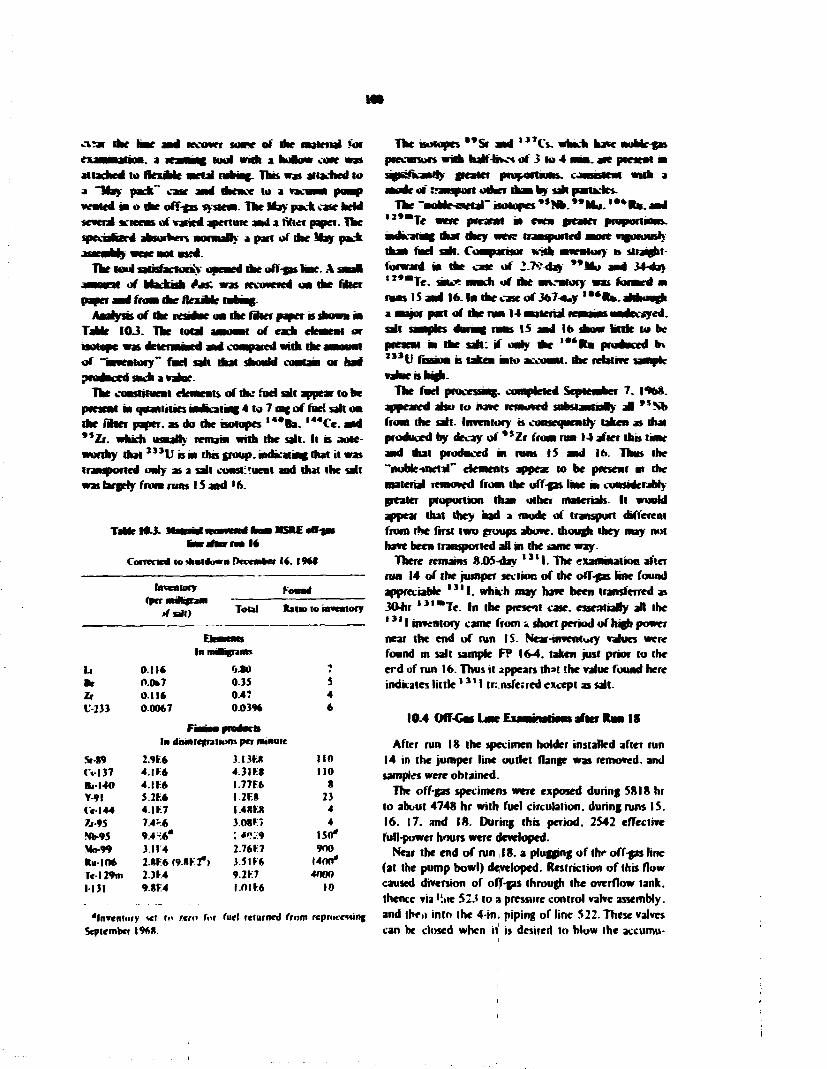
100
cs» the brie and Recover some of die material fat examination, a teaming h * ° * " h * * holow co*r was attached to flexible Metal rubmg. This was attached to a "lay pack"* case and aVnce to a vacuum pump vented in o the off-gas system. The Ma)- pack case held several sewews of varied apertuK and a fillet paper. The spcoahard ahsorhen nomaB> a pari of the Hay pack assembly were not ussd
The tool satisfactorily opened the off-gas brie. A smal amount of blackish AMK was recovered on the fiber paper and front rhe Aeubie rubmg-
Anafysts of the residue oa the filer paper is shown in Table 103. The total anwnnt of each element or
of "inventory" fwd sail that should contant or had prodnced such a vane.
The constituent elements of the Sad salt appear lobe present in quantities indicating 4 to 7 mg of fuel salt on the fitter paper, as do the isotopes l 4 *Ba . l 4 4 C e . and **lt. which usually remain with the salt. It is noteworthy that , S 3 U is in this group, indicating that it was transported only as a salt constituent and that the salt was largely from runs I5 and '6.
f-i. iMSUanTwv
Corrected lo <kml4a»n December 16. I 9 M
Inventory Found (per mmarani
-if sil> Total Ram to mwtniory
I n iiiinlpp'iWi
Li O i l * 0.80 ^ •c 0.0*7 0.35 5 Zt 0.116 0.47 4 1-233 0.0067 0.0396 6
F M M 1 tfRMMctl In di>micg»lNMU per minute
Sr-89 2.9F.6 3.I3M 110 (VIJ7 4.IF6 4.3 I M 110 BJ-UO 4. I t * I.77F6 8 Y-91 5.2F.6 I.2F.8 23 f«-l44 4.1 F.7 l.4*FJt 4 Zr-95 7.4-6 3.08K7 4 NWS 9.4-6* ; w.'.-a 150* Mo-99 3.114 2.76F7 900 Ru-IO* 2.*F.6(9«F2*> J.5IF6 1400* Tel 29m 2.3K4 9.2F7 4000 1131 9»F4 I.0IF6 10
The isotopes **S< and ' " i s . winch have uobk-gas precursors wnh haM-bws of 3 to 4 nun. are present m sBjK&anftly greater proportions, cjomstcut with a •ode oi transport other than by salt partkks.
The -awMesaetaT isotopes ' * » . •*•*»». , # * l u j . and " • " T e were preamt in even greater proportions, mdtcariag that they were transported more ncuroush rhan fuel salt. Comparisor with nuratory » slraigbt-forward in the case of r t t d a y **Uo and 34-da> 1**™Te. sow*! nmch of the mwntory wxi formed at runs IS and 16. In the case of 367-cy ' • • * » , . ahhuueji a major part of the ran 14 material remains uanVcsyed. salt samples during nms IS and lb show hide to be present in the salt: if only the ** 'Rn produced bv " 3 U fission is taken into account, the relative sample value is high.
The fuel processing, completed September 7. |<*>&. appeared also to hate removed sobsiawiauy al * 5 Nb from the salt. Irtveniory b consequently taken as dial produced by decay of * 5 Zr from run 14 after ibb time and that produced in runs IS and 16. Thus the "noMe-rnetal'' dements appear lo be present in the material removed from the off-gas line in considerably greater proportion than other materials. It wuuM appeal that they had a mode of transport different from the first two groups above, though they may not have been transported all in the same way.
There remains 8.05-day , 3 , l . The examination alter run 14 of the jumper section of the off-fas tine found appreciable l , ' l . which may have been transferred as 3<Mir , J , ""Te . In the present case, essentially all the 1 3 1 1 inventory came from * short period of high power near the end of run IS. Near-tnventwry values were found m salt sample FP 164. taken just prior lo the erd of run 16. Thus it 2ppears ih»t the value found here indicates l i t t le ' 3 1 1 transferred except as salt.
10.4 OfTGns Lwe Run l»
*ln»enl»ry *el »<> zero fur fuel returned from repriiceMing September 1968.
After run IS the specimen holder installed after run 14 in the jumper line outlet flange was removed, and samples were obtained.
The off-gas specimens were exposed during 5818 hr to about 4748 hr with fuel circulation, during runs IS. 16. 17. and 18. During this period. 2542 effective full-power hours were developed.
Near the end of run 18. a plugging of thr off-gas line (at the pump bowl) developed. Restriction of this flow caused diversion of off-gas through the overflow tank, thence via ':ne 52J to a pressure control valve assembly, and thru into the 4-in. piping of line 522. These valves can be closed when it is desired to Mow the accumu-
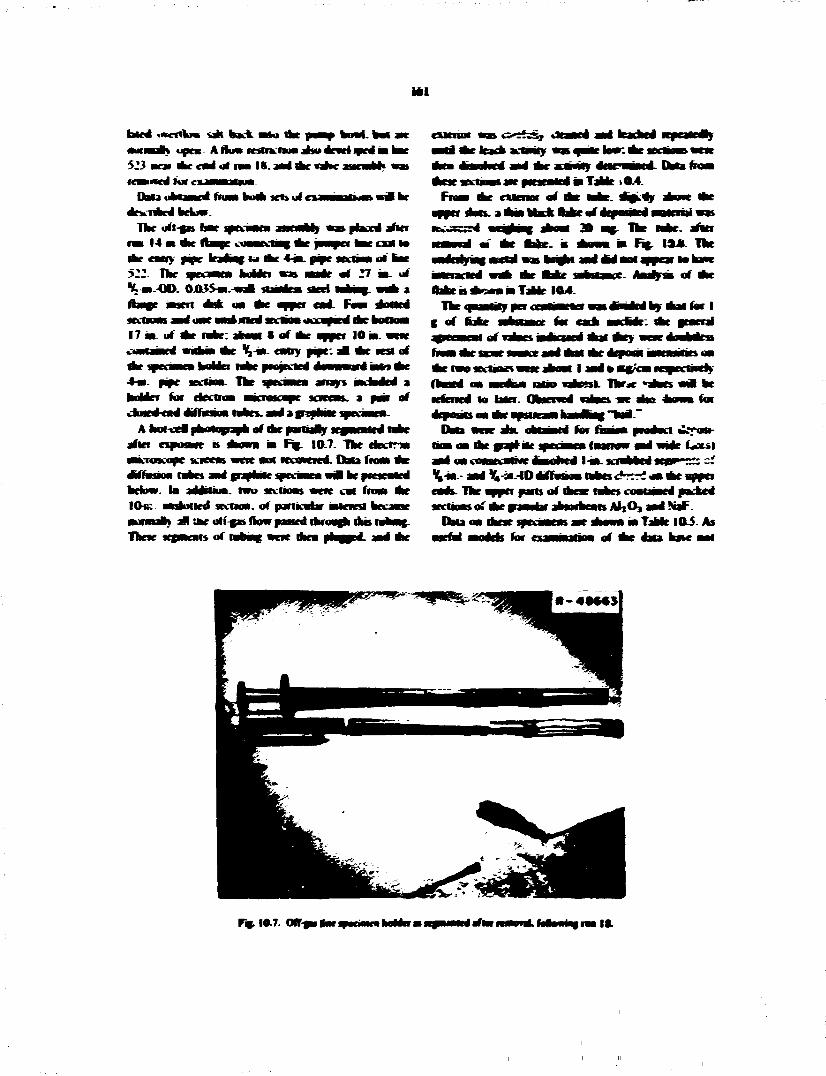
Mi
bua .«««*» tab back atto the para w i j *9CK A A M I restnerrua jfcw aewtiawa1 m hat 523 acw aWcaaoliaa ItLaaaaferateaMcarah w»
D W i u b i M d fnaabudi K b u ( c u M n t M D * i b c •cynBtv bcWrtV-
Tbe ofI-f» tor i f»—ra aaxaaa> «as abeed after m M K M C ttaaac vMNKctoj ate jaaracx toe cut 10 tar m r ) pipe karbag H I OK 4-ia. pipe m t o at tot 522 The saxaaea boUei « » auae of 27 m. of
saed aaaag. ava a • t . O O 0 0 3 S » . - « •
17 a>. of ate eabr: aboat S of ate apart 10 « . mm e ^-ia. cany pipe, a l ate test of tabe piojectcd i m n n i i iaa> a * 1W ipuaaf arrays rachjaei1 a
for dectroa aacraataae aaecas. a pat of rcCencd to vancatna' aaYasna tabes. aaa1 a (Rafale specaaea-
Atotvc^photoyaplioftaepaniaayiraawileitaae Data after exposal* a steam ia Faj. 10-7. The ekxrna baa oa the (natae jpfraara fa aatroscopc stteeas were aot axwcita. Data froai dte aaa oa aMBnaMiwe aaaitoi 1-ia.j oaTaooN tabes aadpaaaMspccaaeaaal be pie«a«e« \-m-mfU<*ADt bctoar. la aaaJtioa. two stcuoas were O N faaa ate eaas. The appcr parts of these tabes coacaaerl packed 10« sashmed sectioa. of partkabr iaietcsi beoase stctaoas of da; fraaabr abaabeau Al^O^ aad SaF. aunaat) JH U K o t i ^ tVm paste* raroajh dm rata*. Data oa dstse aanaaem are lkumn m Table 10-5- As These sepacats of tabaaj awe diea phage*, aaa the metal raoacb far ijuaaaartnn of aW data hate aot
Fig. 10.7. Off-sat tar awcia* n attct la.
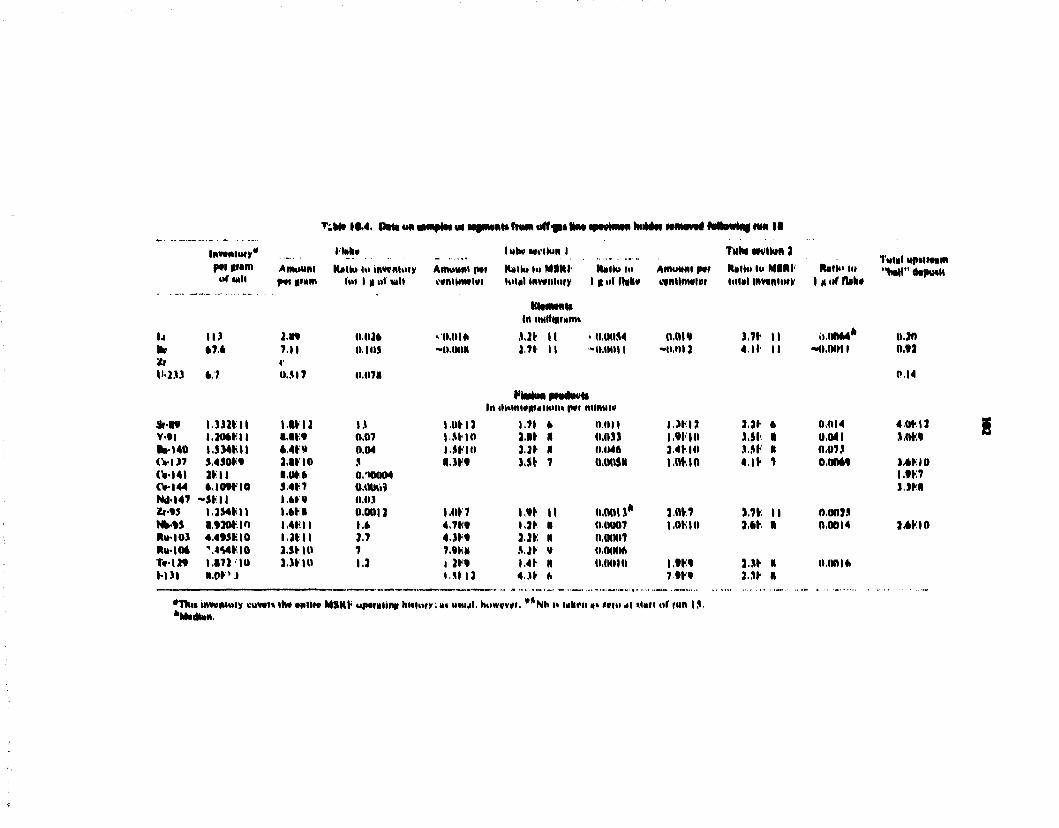
T^M* 10.4. P m <m MWftw « M f f t m faun aff^pi Mm »irtwww M 4 w mwww* Mtuwlnj ww II
InwMioty" p»» gram ofwli
Amount P»i »i»m
link* MulKt i« invcniuiy
I'm I K nl Milt
l j I I ) 2.W 01124 k» 67.4 7.11 0.1 IIS / i I 1
U-233 4.7 0..M7 0.07*
* W I.33JHI 1.M-I2 15 V » | I .W4HI *.•»:« 0.07 fc»40 I.S34HI t.4t» 0.04 <VI37 5.430M urio 5 OH4 I » l l I t * 6 0. ¥>004 CVI44 4.10*1-10 5.41-7 O.WKrt Nd-147 -sm l.6H» 0.03 Zf-95 1.354*1) 1.41-1 0.001] Nk-%S I.930HO 1.4m 1.6 R«H03 4.4931! 10 i nn 2.7 RulOi \4S4KI0 i.si-in 7 T . I W 1.172 10 3.3HO 1.1 M i l ».0>'J
Amount 1*1 t-vntlnwivi
-0,01ft -O.OOK
Iubv within I Hmtu iu MIKI UHHI invf niuiy
In itMlllaumt
,UI 1.71
I I I I
lUlto m I M Hi ll»k«
O.MIM "IMMtl I
In «lt>ini«ni«iH<n« MI ntlnuiv
I OH J I.SI-10 ISI-IO l . J H
I.OH 4.7K* 4.3I-9 7.9KN I II« I II12
1.71 6 111 I 3 21 I LSI- T
l » l 13* 2 21 S.2I 1.41 4 31
II R * V H 6
I) 011 0.0)3 0,046 0.00SR
0.001 r (1.0007 0,0007 0.0006 0.0010
Amuuni pw MMHIMlVf
0.01« -0,013
D i d I,VI-10 3.4HO I.OHO
1.01-7 l ,01-; io
I t M 7-W9
*Tfci» mwiiiuiy cuv*i» ttw cnOiv MSHI-' uMtmlny hMiory; u» i»«wl, h»iw#w. w*Nb n ukfii »» *vi«i *t Mart of run IS, *Mt4tan.
T H N Nvlkin I Rilta lu MINI lulil Invmiufy
3,71-4.11
I I I I
2.21 6 JSI I ,VM I 4,11- 7
2,6*
J.SF
I I
Tumi i»»t»»t»m
i«<»r n»k#
.1,0064" HI.OM I
0,014 0,041 0.073 O.OOM
0,0013 0,0014
0,0016
0.30 0,»J
0.14
4.0HJ S.OM
3,41-10 I.W7 3.3M
2.4H0
s

183
til
Hi* i I , i « t
~ S *
* l
:M1* lilts:
y v
fl«» i z •.
I | £ ! £ . £ ! £ £
i ! : i in i
i i
I If
c 3 •
i:'
• ^ — « — — «
= | * * * ? ; S
22-152
* i a
z 55? tStSS
I / . * a-hi
± J± Ji *i * 'Ji *i *i Ji iH Ut ! — — — « * > — « •»««" • — I
i

104
• r / - ' "VV«a*w*v
wtft.
1*5 f u n m HiofValve • Hj worn Law $ » after R M IS
The overflow hue from the pomp bowl opens a: about die mray baffle, descends vertical)-, spirals afvMRM me sacfnm ane aefciw me pump uowl, Jteiv panes mroagh rh* Mf of Ac tmunlal overflon lank, and i n w i i a near die bottom of die tank. Ga> nay pass through dm bar if ao sail covers die cxn info "he overflow unk or if die pressure r* safYirierH fdac lo •Jugging of uydn off-fas hnes. etc) •ocaas* frrtbhwg dwiwgh any salt dial is pnrsmt.
In J M H I M . brbum f about 0-7 xd feer/nan) flows in awoogh two bubbhu lo measure the hqnU level. Gas from these babbters. along witn «ny off-gas flow, win pass through iv* 523 to enter the 4-m-dram part of die mam off-gas hue 522.
From rime lo mne die salt accunruaieo m die overflow lutfc was relumed to the pamp bowf. This was accnmplnned by dosing a control valve in hue 523 between the overflow lank and the entry point into hue 522. The entry of die babbler gas pressurised ibe overflow tank until return of dw accumulated salt to the pump howl permitted the gas lo pass into die pump howi. (he control valve was then reopened.
Near the end of ran IS. duggmg of mar 523. winch had been carrying most of the off-gas flow foe several weeks, was cxperieaced. This TO attributed to phmaag m rhe vahv ajstmaty. aad after jhalduvm aW assembly was replaced. The removed eojapmett was transported lo the High Ibmafnm Level lAjnarmwm Laboratory.
The vertical ft-m. entry and ex* bnes to the vahv aaembt) were spaced about 3* in. apart, tcrminiimg in Onug flanges. Tuwuiaiag the eniry flange rhc bar. coniinaed upward, across, and downward to rhe entry port of the automatic control vaJve HTV-523. Gas flow proceeded past die plunger mio (he cyhndei contaming the beflows pfcanjc' v*al and upward info L-shapcd ex* boles in the flMge. Icavrg rh» »j|ve range horvoMaty. Carved piping dm. led t a mancal valve (V-52'». normally open, which VTO, ';« .-red upward. The bnri-amui exit pipe from this valve carved upward and then downward to the exit frange.
Kxaminairon of HTV-523 did not rcveai an obsfrac-non lo flow. AH surface* were covered with sootKke deposrls over bright metal: samples of the were recovered. Some samples of brack dust were obtained from sections of the line between rhe two valves.
In the normally open V-523 the exit flow was downward. A blob of rounded Mack surn'ance (about the w/e of a small peal was found covering the exir

105
T a N r l * * . A a s * r a ^ * * « • * > b a a hat 523 <i
l.ig»TiM< J * iaa»ihai y i i i at mn
Rata* «rf uawma' oka
emery o n
T a N r l * * . A a s * r a ^ * * « • * > b a a hat 523 <i
l.ig»TiM< J * iaa»ihai y i i i at mn
Rata* «rf uawma' oka c in ti-<l for • ( * f a m n i « r r a n hnowun L B K r x 1 j u M a d n l f
BCV-523 L B K r x 1 j
u M a d n l f BCV-523
D M D M D M
r x 1 j u M a d n l f Leach D M D m D M D M D M
V-523 Loch
b ;XL l j I I * 0400 o.o25 ooo* < 0 0 0 * -0.0005 0 4 0 0 •r 47 1.5 1-4 0 4 3 * 0 0 0 J 0 0 3 3 I" • . 7 054 0 . 1 * 0 2 3 0 1 2 0 12 0 013 0495 i i r 2J5i «3©> •3Si • 241 «44| <29> n l -23«i <59i
D M K M i a a i
i « l i 154) «*l»
Sr-09 1 5 F I I 1 v O J O I * 0-0*5 0404 0 2» 0-35 5.0 S r * 0 5 .4 f * 230 i *o 17 >*! i sen -ooo* <0405 to-l40 1 5 H l 0 4 3 9 0 * 1 9 4 * 3 0 4 3 t 0 4 0 2 0 4 1 1 0 4 2 2 CVIJ? 3 -51* * I 33 41 1 2 0-31 0 3 3 94 i ' r | 4 l I .9*:I 0 4 0 i 0 4 0 2 fe-144 4 1110 0449 0 4 1 3 S*- |47 5 « | 0 - 0 0 5 0 . 4 . 0 4 3 * 0409 0 0 . 0 0 4 0 2 <0O4 Xr-95 • M i l 9404 0-4C V-017 0-00* 0.0093 04015 0 4 4 * !*>95 t m o ' 5 430 27 5.2 * .4 9 2 Kn-I<»l * - 5 H « 14 *-57 © 1 1 0.13 4 . * 0 4 3 * 13 Ra-IO* 3«ff9 I t 0-5* 0 1 * 0.13 4.3 0441 20 * « - l l l * .7»8 --30 3O0 24 1*0 0-7» 10 ' 2 0 S*-I2< 2 9 M 5* • 2 Tr - I *9 » 3 » 9 17 70S 77 *« ** * 3 J5 M 3 | • Ir . lO 13 3* 15 4.9 0 03 * 1.4 1.5
aperture, in addiliun to a hard Mack deposit on die hexagonal sate of the entry port.
The Hack material which coveted die V-52* port was glossy, quite hard and frangmte. and filled with babbits I mm m iumrm. HmnwjUuo b* %. *>. Parkiasor4 is
TVr plug male-sal jnaly/cd **1 .arbon. 0.3'* beryllium, and 0.11 MhnjM.
leachmg by C'CU at room temperatui,; ; ukkd a somfion unhealed by its mfrared specimm ie» content a saturated hydrocarbon hjiins. considerabk branchmg. The leach residnc. cumpiuing own two>d»irds of the wigwd sampk. in aN probability w v a saturated crow linked and msnlubh hydrocarbon. 7N? sower of Ihts material was believed to be a hydrocarbon flubri-canf or sotvcnl) which evaporated or decomposed al elevated temperature with vapors being carried lo ihc valve where ihcy condensed. Condcnsalioti was thought to be followed by cross-Jmkmg. probably radnlton-mduced. to render the materia! insoluble -
The off-fas s m k e of line 523 and its valve assembly was sporadic over the fu l prior bis**:* of rhe rcactor. A food account of die amount and duration of u> flow B not araibMe. and so a detailed cxaciuafiou of dau in terms of mechanisms related to such history will not be a'templed.
The total ouantila- of the various dements and nuclides in the samples from each «ai«e and die intervening line are shown m Table i0J>. where they are expressed as fractions of die inventory for I g of salt.
In spite of unknown mass and uncertain deposituM schctMe. several conclusions arc evident. The uranium was largely " * U and " M J . doubtless deposited during that phase of operations. Tho B substantiaied by high values of " S r and ' " C s (both long-lived) compared with 50.4-day **Sr. indicating that the average accumulation rate was higher than the recent.
The noble metals generally were relatively high:* 'Mb far exceeded v s Z r . md the two ruthenium botopes ( ' • * H u and , # * R u > wore consistent with each other
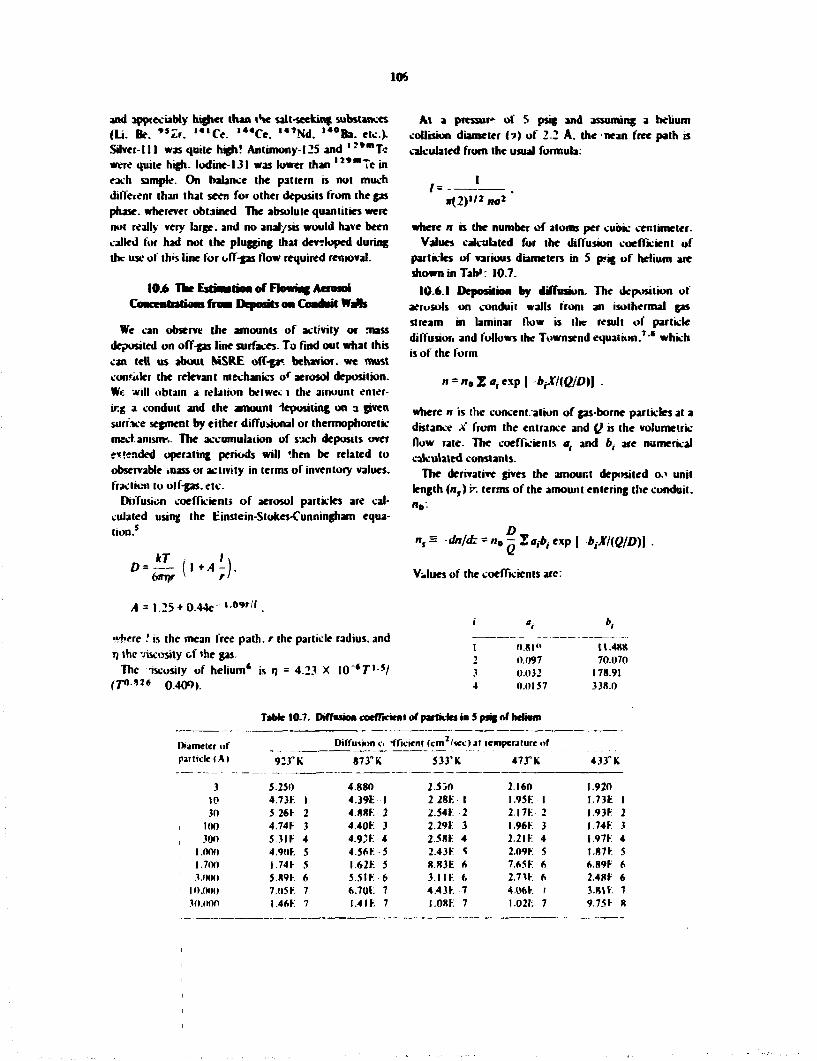
106
and appreciably higher than i*te salt-seeking substances (Li. Be. " Z r . M , C e . , 4 4 C e . , 4 , N d . , 4 0 B a . etc.). Silver-111 was quite high! Antimony-125 and ' ?* r aT> were quite high- lodine-131 was lower than , l * " T c in each sample. On balance the pattern is not much diffcient than that seen for other deposits from the gas phase, wherever obtained The absolute quantities were not really very large, and no analysis would have been called for had not the plugging that developed during the use oi th>s line for off-gas How required removal.
10.6 The ntiwution of Flowing Aerosol Concentrations from Deposits on Ccndait Wafc
We can observe the amounts of activity or mass deposited on off-fas line surfaces. To find out what this can tell us about fciSRE off-ga* behavior, we must conritler the relevant mechanics o r aerosol deposition. We will obtain a relation bet we.:-t the amount entering a conduit and the amount lepositing on a given surface segment by either diffuaional or thermophoretic meet amsmv The accumulation of such deposits over emended operating periods will '.hen be related to observable mass or activity in terms of inventory values, fraction to olf-gas. etc.
Diffusion coefficients of aerosol particles are calculated using the Einstein-Slokes-Cunningham equation.5
D = (l*A-).
A = 1.25 + 0.44c -»••» '" .
At a ptess»r» of 5 psig and assuming a helium collision diameter if) of 2-2 A. the nean free path is calculated from the usual formula:
/ = I
» ( 2 ) " 2 « o I
where n is the number of atoms per cubic centimeter-Values calculated for the diffusion coefficient of
particles of various diameters in 5 p?«g of helium are shown in Tab": 107.
10-6.1 Deposition by diffusion. The deposition of aerosols on conduit walls from an isothermal gas stream in laminar flow is I lie result of particle diffusion and follows the Townsend equation.7'* which is of the form
n = «,35« |exp| bJHQ/D)] .
where n is the concentration of gas-borne particles at a distance A" from the entrance and Q is the volumetric flow rate. The coefficients a, and bt are numerical calculated constants.
The derivative gives the amount deposited o.< unit length (nt) v. terms of the amount entering the conduit. n 0 .
n, H dnldz = « 0 - Zafii exp | *,*/((?//)))
Values of the coefficients arc:
•"here .' is the mean free path, r the particle radius, and TJ the viscosity of the gas.
The iscosity of helium' is rj = 4.23 X 10 T ' •*/ (pt.iit 0409,
out" 0.097 0.032 0.0157
II.4KK 70.070
178.91 338.0
Table 10.7. Diffusion coefficient of particles in S psig of hclrarn
ftametet »f 923°
5.250
Diffusion c. *ffici< nl (cm 2/«c>ai lemperjturc of
533' K 473" K particle (A) 923°
5.250
K 873° K
4.880
nl (cm 2/«c>ai lemperjturc of
533' K 473" K 433" K
3
923°
5.250
873° K
4.880 2.530 2.160 1.920 IP 4.73E 1 4.39E 1 2 28E 1 I.95E 1 I.73E 1 30 5 26K 2 4.88E 2 254E 2 2.I7E 2 I.93E 2
100 4.74E 3 4.40E 3 2.29E 3 I.96E 3 I.74E 3 300 5.3IE 4 4.92E 4 2.58E 4 2.2IE 4 1.97E 4
1.000 4.90E 5 4.56K 5 2.43F < 2.09E 5 I.87E 5 1.700 I.74F 5 I.62E 5 8.83E 6 7.65 E 6 6.89E 6 3.IKMI 5.891 6 5.5IE-6 3.1 IE (. 2.7 3E 6 2.48E 6
10.000 7.05K 7 6.701'- 1 4.43E 7 4.06E 1 3.RIE 7 30.000 1 46r 7 I.4IE 7 I.08E 7 I.02E 7 9.75E 8
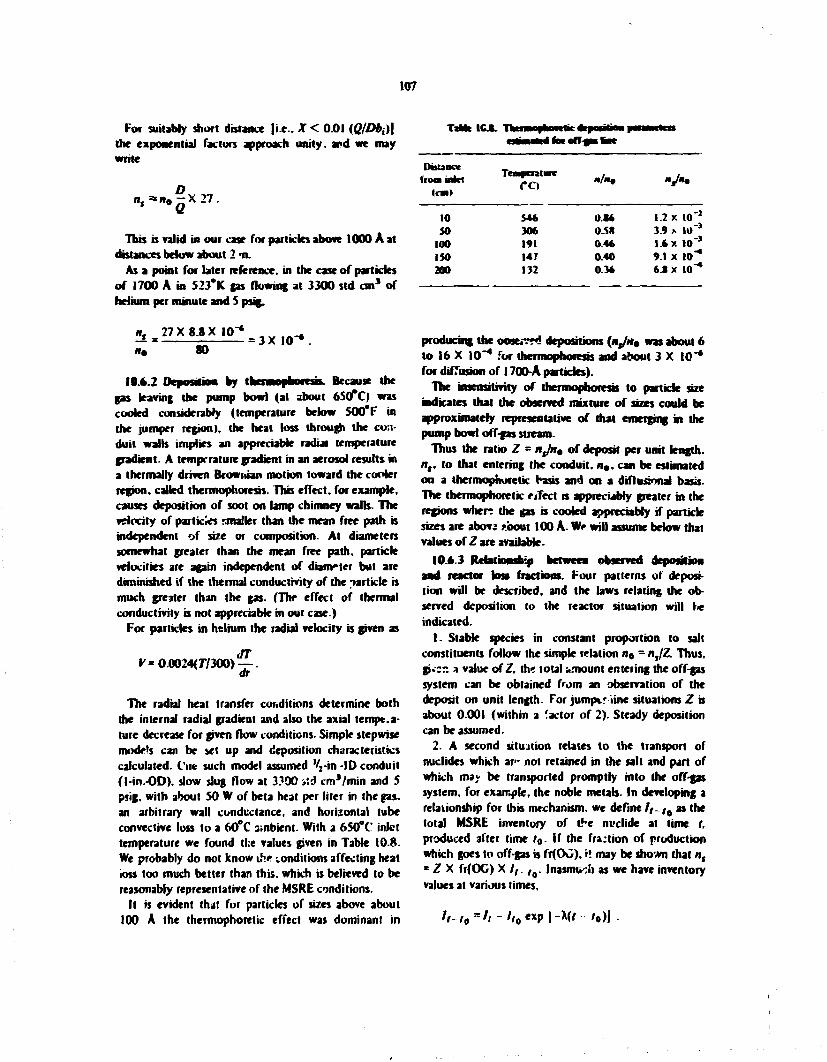
107
For suitably short distance | i* . . X < 0.01 (Q/Dbjl the exponential factors approach unity, apd we may write
This is valid in our cast for particles above 1000 A at distances below about 2 -n.
As a point for later reference, in the case of particles of 1700 A in S23*K gas flowing at 3300 std cm 3 of helium per minute and S psig,
& . 2 7 X U X I Q -n, 80
1 0 * 2 DeposHm by thumopbowMi. Because the gas leaving the pump bowl (at about 6S0*C) was cooled considerably (temperature below 500*F in the jumper region), the heat loss through the cur.-duit walls implies an appreciable radial temperature gradient- A temperature gradient in an aerosol results in a thermally driven Browiiian motion toward the cooler region, called thermophoresis. This effect, for example, causes deposition of soot on lamp chimney walls. The velocity of particles smaller than the mean free path is independent of size or composition. At diameters somewhat greater than the mean free path, particle velocities are again independent of dianvter but are diminished if the thermal conductivity of the ^article is much greater than the gas. (The effect of thermal conductivity is not appreciable in our case.)
For particles in helium the radial velocity is given as
P= 0.0024(77300) — . ar
The radial heat transfer conditions determine both the internal radial gradient and also the axial tempt.a-turc decrease for given flow conditions. Simple stepwise mode's can be set up and deposition characteristics calculated. Cue such model assumed V2-in -ID conduit (l-in.-OD). slow slug flow at 3?00 Ai cm 3/min and 5 psig, with about SO W of beta heat per liter in the gas. an arbitrary wall conductance, and horizontal tube convective loss to a 60°C s.nbient. With a 650°C inlet temperature we found tl:e values given in Table 10.8. We probably do not know ih* conditions affecting heat ioss too much better than this, which is believed to be reasonably representative of the MSRE conditions.
It is evident that for particles of sizes above about 100 A the thermophoretic effect was dominant in
TiMt ICJS. TtKranyhnvtlic ecpadliMi pwnclfss estimated fa» ofT-gas fate
from inlet <*0 " ' * • "J** lea)
10 54* O.St 1-2 x I0~ 2
50 306 0JS« S.9 A I 0 J
100 191 0 4 * 1.6XI0" 3
150 147 0.40 9.1 X 10"* 200 132 0.36 6 » x I0~*
producing the oostrw! depositions (*,/»• was about 6 to 16 X W4 for thermophoresis and about 3 X 10"* for diffusion of 1700-A particles).
The mscnauvity of thermophoresis to particle size indicates that the observed mixture of sizes could be approximately representative of mat emerging in the pump bowl off-gas stream.
Thus the ratio Z = njn% of deposit per unit length, ns, to that entering the conduit. n». can be estimated on a thermophurelk basis and on a diftusonal basis. The thermophoretic eject is appreciably greater in the regions wlierr the gas is cooled appreciably if particle sizes are abovj *bout 100 A. We will assume below that values of Z are available-
10.6.3 Rebtmubip between observed depositiMi and reactor lost fractions. Four patterns of deposition will be described, and the laws relating the observed deposition to the reactor situation will r* indicated.
1. Stable species in constant proportion to salt constituents follow the simple relation n 0 = nJZ. Thus, gW;r. n value of Z. the total amount enteiing the off-gas system can be obtained from an observation of the deposit on unit length. For jump*.nine situations Z a about 0.001 (within a factor of 2). Steady deposition can be assumed.
2. A second situation relates to the transport of nuclides which ar» not retained in the salt and part of which may be transported promptly into the off-gas system, for example, the noble metals. In developing a relationship for this mechanism, we define //_ ,0 as the total MSRE inventory of t^e nuclide at time t, produced after time r<>- if the fra:tion of production which goes to off-gas is frfOG). '• may be shown that nt
s Z X fr(OG) X /,_ l Q . Inasmuch as we have inventory values at various times,
11 i0=li / 7 0 exp | -X(f r0)J

u»
Thus and
In many cases, ltlh-tm * 1 -For many of the noble metals. V , * 10"' to NT*:
thereby
fr (0C)<—|—X 1 0 * < 0.001 . 0.001
An mtensMKi of this case wiB involve holdup of the nuclide in a "pool" for some average period. If the holdup tune is significantly loner than the half-lire, the effect is not great and should involve an addftional factor e*kr.
For appreciable holdup periods and complex power histories, integral equations are not presented. Differentia! equations and a several-compartment model. munericaSty integrated through the power history, could be used to produce a value of the total atoms to off-gas (#r,).
3. A third mechanism of transport is applicable to fission products which remained dissolved in salt, with some salt transported into the off-gas, either as discrete oust particles or .anonvabty as small amounts accumulated on some ultimately transported particle, possibly as the result of momentary vaporization of salt along a fission spike.
If we assume a continuous transport during any interval of reactor power.
and
^ - W C - n , , .
where C is the number of atoms per tyam of salt, P is reactor power. F is the number of fis:ions per gram at unit power in writ time, v is fission ykJd, Wis the rate of salt transport to off-gas in grams per unit lime, Z = n,/nQ, and n, is the number of ??oms in unit length of deposit.
From these for interval / we find:
PFv G - C i - , e - w i + - ^ ( | -*"*")
PFv \
The equation for C, is evidently simply a version of the inventory relationship- It appears possible to carry the second equation through the power history. If we take into account the lack of transport when the reactor is drained and assume that the rate of salt transported to off-fas is constant white the salt is circulating, we may write Wj = Wfj, where /i = 0 when drained and I when circulating- Then the WZfk term can be factored out. and the term
can K obtained by computation through the power hiHttry in conjunction with the inventory equation:
WZ » ,= — I C ( / , - / . ) .
The evaluation of IG(r - / , ) , the gas deposit inventory, has not yet been done.
4. The final case considers the daughters of noble gases, insofar as they arc produce J by decomposition in the off-gas stream. Here the mechanism changes: The daughter atoms diffuse relatively rapidly to the walk, so that to a good approximation the rate of deposition of daughter atoms on the walls is the rate of decay of vmon krypton in the adjacent gas. Thus we must, for shorr-lived parent atoms, define the time of flow (r) from the conduit entrance to the point f » in question.
Let
r<x)=-J*A{x)p(x)dx,
where p is the gas density at the point x (at T,P).W'a the mass inlet rate of the gas, and A is the cross-sectional area of the conduit.
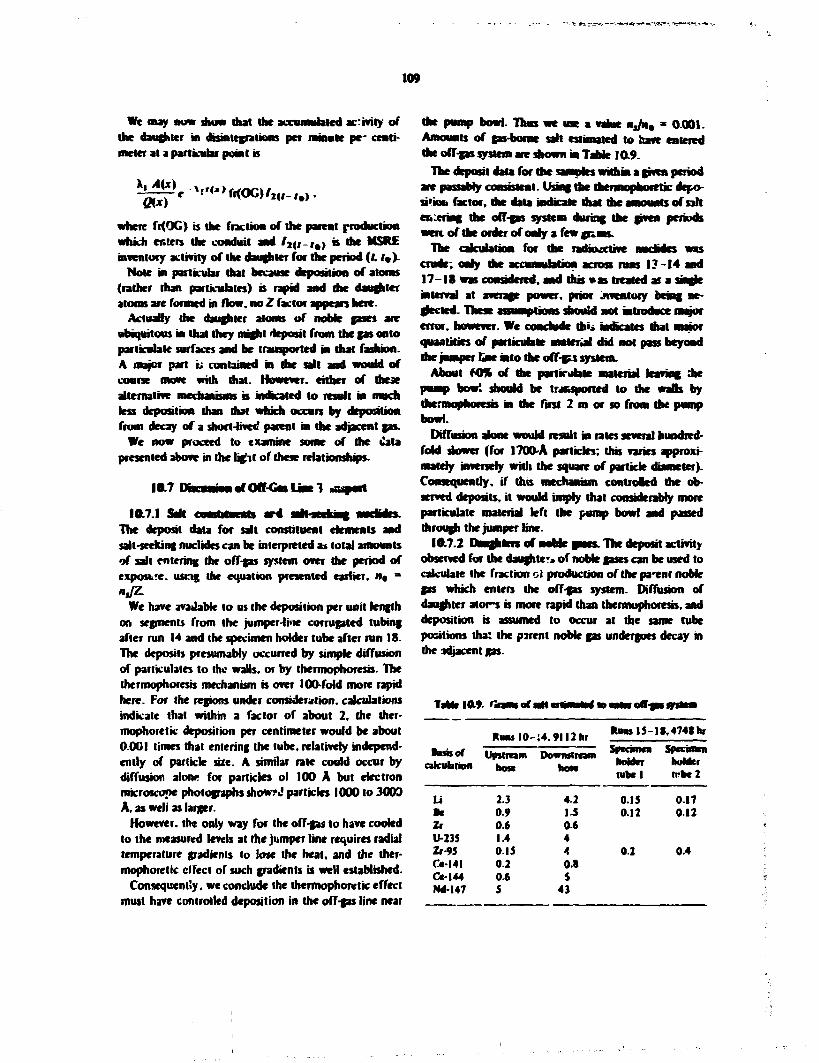
109
We may now show mat the accumulated activity of the daughter in disintegrations per minute pe- centimeter at a particular point is
X, A(x) f - ^ » 6 ( O C ) / „ M i , ,
where fr(OG) is the fraction of the parent production which enters the conduit and / i< i - r # ) * «•* MSRE inventory activity of the daughter for the period (J. /#>•
Note in particular that because deposition of atoms (rather than particulates) B rapid and die daughter atoms are formed in flow, no Z factor appears here.
Actually the daughter atoms of noble gases are ubiquitous in that they might deposit from the gas onto particulate surfaces and be transported in that fashion. A major part u contained in the salt and would of course move with that. However, either of these alternative mechanisms is indicated to result in much less deposition than dial which occurs by deposition from decay of a short-livcti parent in the adjacent gas.
We now proceed to examine some of the data presented above in the light of these rebtionships-
107 WiLumunofOff-GmLincl »wa*it
1071 Suit euniWewtt ard The deposit data for salt constituent elements and salt-seeking nuclides can be interpreted as total amounts of salt entering the off-gas system over die period of exposure, using the equation presented earlier. n« = nJZ.
We have available to us the deposition per unit length on segments from the jumper-line corrugated tubing after run 14 and the specimen holder tube after run IS. The deposits presumably occurred by simple diffusion of particulates to the walls, or by thermophoresis. The Ihermophoresis mechanism is over 100-fold more rapid here. For the regions under consideration, calculations indicate that within a factor of about 2, the tfier-mophoretic deposition per centimeter would be about 0.001 times that entering the tube, relatively independently of particle size. A similar rate could occur by diffusion alone for particles ol 100 A but electron microscope photographs show?J particles 1000 to 3009 A, as weli as larger.
However, the only way for the off-gas to have cooled to the measured levels at the jumper line requires radial temperature gradients to lose the heat, and the thermophoretic effect of such gradients is well established.
Consequently, we conclude the thermophoretic effect must have controlled deposition in the off-gas line near
the pump bowl. Thus we use a value mjm% * 0.001. Amounts of gas-borne salt estimated to have entered the off-gas system are shown a Table 10.9.
The deposit data for the lamyki within a given period are passably consistent. Using the thermophoretic depo-si'iob factor, die data indicate that the amounts of salt e*:ering uae off-gas system during the given periods wen; of the order of only a few gruus-
The calculation for the radioactive nuclides was crude; only the accumulation across runs 13-14 and 17-18 was considered, and this *as treated as a single •nerval at average power, prior jivcntory being neglected. These assumptions should not introduce major error, however. We conclude mi* indicates that major quantities of particulate material did not pass beyond die jumper Une into the ofT-gu system.
About f0% of the particulate material leaving die pump bow! should be transported to the walk by diermophoresis in the first 2 m or so from the pump
Diffusion alone would result in rates several hundredfold slower (for 1700-A particles; this varies approximately inversely with the square of particle diameter). Consequently, if tho mechanism controird the observed deposits, it would imply that considerably more particulate material left the pump bowl and passed through the jumper line.
19.7.2 Daughters of noble gases. The deposit activity observed for the daughter, of noble gases can be used to calculate the fraction ol production of the parent noble gas which enters the off-gas system. Diffusion of daughter ators is more rapid than thermuphoresb, and deposition is assumed to occur at die same tube positions that the pirent noble gas undergoes decay in the .idjaceni gas.
Taw* 10.9. rkawofuM to enter off-gut
Rons 10- ;4.9I I2hr Ram 15- l»,474Skr
Bans of catenation
UpMKSRI hot*
Downstream how
SpciinMn HjilAmm IKHMT label
Specimen hoMer rrbe2
Li 2.3 4.2 0.15 0.17 •c o.» M 012 0.12 Zr 0.6 04 U-23S 1.4 4 Zr-M 0.15 4 0.2 0.4 Ce-141 0.2 o.» Ce-144 0.6 i Nd-147 5 43
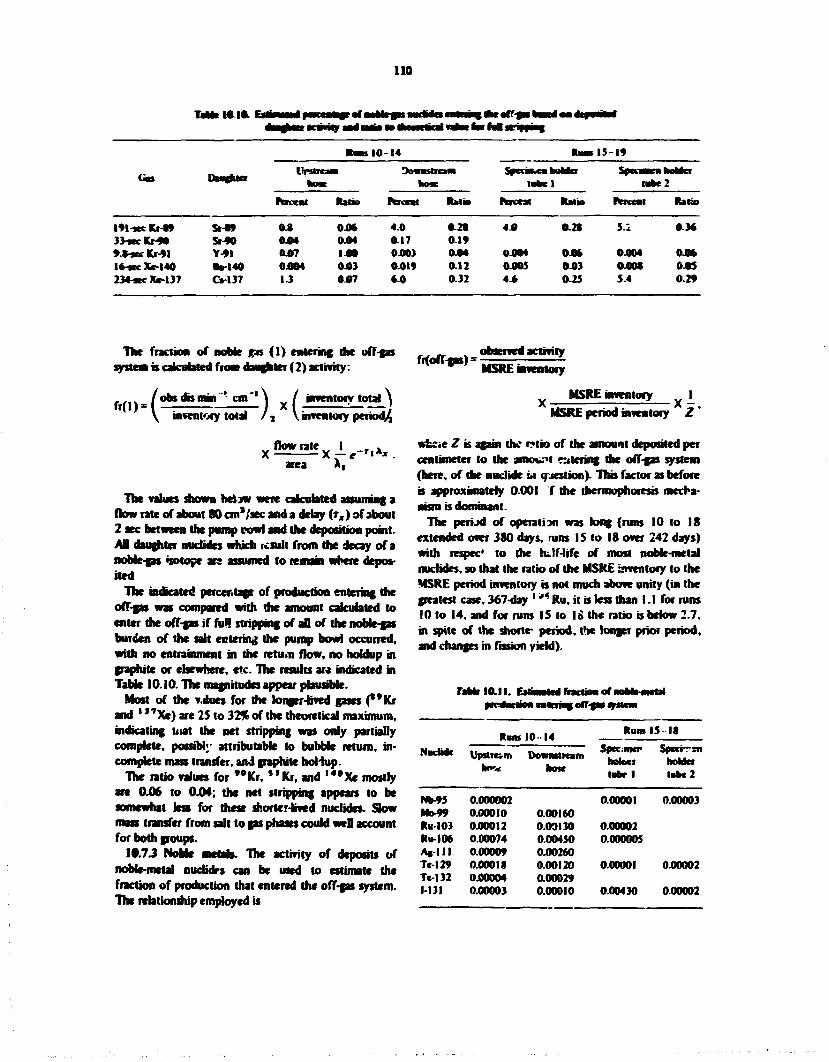
110
101*.
R M B I O - 1 4 R M B I S -19
Gas D«f>m Dfsucam Dowastrcaai hose ho*
SpfOWiCOUuhfcl M k t l
SpcMKahoMcr take 2
rcfccal Ratio fcrceat Ratio rctccat Rain DetccM Ratio
191-KC Kf«9 St-W 3 3 - K C K > 9 0 Sr-90 9S-KcKr-91 Y-91 16-*ec Xc-140 R»-I40 234-*cXe-l37 0-137
04 04» 4.o a n 04M 04M 0.17 0-19 04)7 14)0 04M3 O04 04KM 04)3 0.019 0.12 I J 04)7 6.0 a32
44) a n
04MM 04)6 04)05 04)3 44V 0.25
5.2 0.34
04)04 0.0* O00S 04>S 5.4 0.29
The fraction of noble gas system b calcafaled from dau|
/ o t a d B n w ' c m ^
(1 ) entering the offgas r r f - « . »_ *ter (2 ) activity: WolPfas)-
| / inventory total ) i \ inventory period^
flow rate 1 „ > wht teZ is i
observed activity MSRE inventory
x M S R E i nventory 1 " ( I ) * I —: ;— ,
\ inventory total /
(1 ) entering the offgas r r f - « . »_ *ter (2 ) activity: WolPfas)-
| / inventory total ) i \ inventory period^
flow rate 1 „ > wht teZ is i
MSRE period inventory " Z '
again the r*tio of the amount deposited per
area * i
The values shown bei JW were calculated assuming a flow rate of about 80 an'/sec and a delay ( r x ) of about 2 sec between the pump row) and the deposition point. AH daughter nuclides which icsult from the decay of a noble-gas isotope are assumed to remain where deposited
The indicated percentage of production entering die off-gas was compared with the amount calculated to enter the off-fas if fuH stripping of all of the noble-gas burden of the salt entering the pump bowl occurred, with no entrainment in the return flow, no holdup in graphite or elsewhere, etc. The results are indicated in Table 10.10. The magnitudes appear plausible.
Most of the v.dues for the longer-lived gases (**Kr and * " X e ) are 25 to 32% of the theoretical maximum, indicating iiiat the net stripping was only partially complete, possibly attributable to bubble return, incomplete mass transfer, and graphite hoHup.
The ratio values for " K r , * ' Kr, and M 0 X e mostly are 0.06 to 0.04; the net stripping appears to be somewhat less for these shorter-lived nuclides. Slow mass transfer from salt to gas phases could wcO account for both groups.
10.7.3 NoMe metals. The activity of deposiu of noble-metal nuclides can be used to estimate the fraction of production that entered the off-gas system. The relationship employed is
(here, of the nuclide ia Question). This factor as before is approximately 0-001 f the tbermophoresis mecha-ntsrn is dominant.
The period of operation was long (runs 10 to 18 extended over 380 days, runs IS to 18 over 242 days) with respec' to the ru!f-iife of most noble-metal nuclides, so that the ratio of the MSRE inventory to the MSRE period inventory is not much above unity (in the greatest cast, 367-day ' a < Ru, it is less than I . I for runs 10 to 14, and for runs IS to 16 the ratio is below 2.7. in spite of the shortr period, the longer prior period, and changes in fission yield).
ra t * 10.11. Csftnvjt<i fraction of noMe-metal now catering; off-mu W J I M
Runt 15 I I Rum 10-14 Rum 10-14
Spcc;mcr holoci
Nuclide Upitrom Downstream Spcc;mcr holoci
SocciTsn t i n l Jtmm
he* hose lube 1 lube 2
N M 5 0.000002 0.00001 0.00003 Mo49 0.00010 0.00160 Rii-103 04)0012 0.00130 0.00002 Ru-106 0.00074 0.00450 0.000005 A.-I I I 0.00009 04)0260 Tel 29 0.00018 0.00120 0.00001 0.00002 Tc-132 0.00004 0.00029 1-131 0.00003 0.00010 0.00430 0.00002
H i
Thur. to a useful approximatio i
oteaclnrrtypetcaa 1 fr(ofT-gas) = ——— X -
MSRE inventory Z
We tabulate in Table 10.11 this fraction, using for Z the value of OJOOI as before.
These values, of course, indicate that only largBpbir amounts of noble metals entered the off-fas system, tenths to hundredths of one percent o r production. We believe that the mumptinni mwdw.d in the above estimate are acceptable and consequently that the estimates do indicate the true magnitude of noble-metal transport into ofT-gas.
Obviously, the estimated values depend directly on the inverse of the deposition factor, Z I f only the diffusion mecharism were active (which we doubt), the estimated amounts transported into the off-gas would be increased several hundredfold (300 X ?). Even ra this situation the estimated fractions of noble metals transported into the off-gas would mostly be of the order of a few percent or less.
We consequently believe that the observed activities of noble metals in off-gas line deposits indicate that only negligible, or at most minor, quantities of these substances were transported into the off-gas system.
1. A N. SnurJi. "Off-Gas Fater Assembly," IfiX PKopmm Semimmm. ho*. Hep. Amg, 31. I966.0KNL-4037. pp. 74-77.
2. E. L Compere, Trmwaiioa of MSRE OTfGas Jumper Line,'* MSR Jfrugwjm Senmnam Prop. Rep. Aug. 31.1966. ORNL-4344,pp. 206 10
3. E. L Compere, "Enjnniijiion of Material Recovered from MSKE OfT-Cas Liner MSR Aogvam Semimmm. Augr. Rep. Feb. 28.1969. ORNL-4396,pp. 144-45.
4. W. W. Parkinson (ORNL Health rfayucs Drvi&on). "Analysis ot Bbck Plug from Valve in MSRE," letter to E. L. Compere (ORNL Chemical Technology Division). Jan. 21,1970.
5. Cited by J. W. Thomas, The Difftakm Battery Melkod for Aeroaol Hankie Size Determmmtkm. ORNL 1649 (1953), p. 4S.
6. C. F. fcnuna. Nuclear £ngMecfiaj Handbook, e«». IL Ethermgton. McCraw-Hal, New York. 1959, p. 9-23.
7. C. N. Duvies,ed.,j4erosrfStievKer Acadennc. New York, 1966.
*. N. A. Fuchs. 7 V Mechanics of Aerosols. Macnul-lan. New York. 1964.
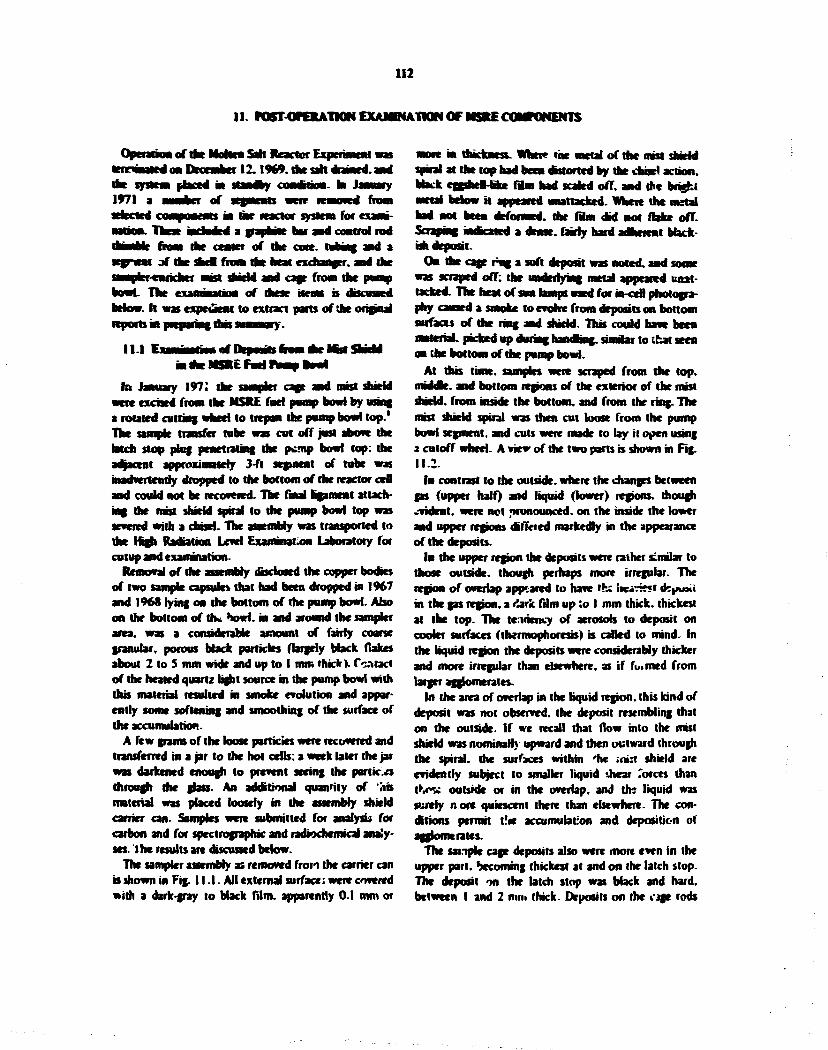
112
II. Ktt4rt*ATHM£XAM^rWNOFm*ECa*tONEHlS
Operation of t l* Molten Sate Reactor Experiment was Krr«nKd oa December 12.1969. the salt drained, ami the system placed m rtandby condition, m January 1971 a somber of agmints were icmowed from selected oonnmncuts m the reactor system for examination. These mcmdid a graphite bar and control rod damMe from the center of the core, tubing and a segrwut of the she! from the heat exchanger, and the imajnii iaih.hu mjst shield and cage from the pomp
below. It was expeueat to extract parts of the original reports in preparing this summary .
11.1 Fximhiarii II off Imp inil fao me Mat Shield in me MSRE Fad "warn inwl
ht January 197; the sampler cage and mist shield were excised from the MSRE foci pomp bowl by using a rotated cutting wheel to trepan the pomp bowl top. 1
The sample transfer robe was cot off jost above the latch stop plot penetrating the p»anp bowl top: the adjacent approximately 3-ft segment of tobc was inadvertently dropped to the bottom of the reactor erf and covld not be recovered. The final ligament attaching the mist shield spiral to the pomp bowl top was severed with a chisel. The assembly was transported to the rfcgh Radiation Lrrel rjcammatum Laboratory for cotop and examination.
Removal of the assembly disclosed the copper bodies of two sample capsules that had been drooped m 1967 and 1968 lying on the bottom of the pump bowl. Abo on the bottom of trw bowl, in and around the sampler area, was a considerable amount of fairly coarse granular, porous black particles (largely Mack (lakes about 2 to 5 nun wide and up to I mm thick t- Csatact of the heated quartz light source in the pump bowl with this material resulted in smoke evolution and apparently some softening and smoothing of the surface of the accumubtion.
A few grams of the loose particies were recovered and transferred in a jar to the hot cells: a week later the jar was darkened enough to prevent seeing the porticos through the glass. An additional quan'ity of 'an material was placed loosely hi the assembly shield carrier can. Samples were submitted for analysis for carbon and for spectrographic and radiochemical analyses. I he results are discussed below.
The sampler assembly as removed from the carrier can is shown in Fig. 11.1. All external surface; were covered with a dark-gray to Mack film, apparently 0.1 mm or
more m thkkarsv Whet* the metal of the mist shield spiral at the top had been distorted by the chisel action, black eggshel-bax film had scaled off. and the bright metal below it appeared unattached. Where the metal had not been deformed, die film did not flake off. Scraping mdkated a dense, fairly hard adherent bbefc-ish deposit.
Oa the cage rug a soft deposit was noted, and some was scraped off: the underiying metal appeared unattached. The heat of sun lamps used for in-ccfi photography caused a smoke to evoke from deposits on bottom surfaces of the ring and shield. This could have been material, picked up during handbag, similar to that seen on the bottom of the pomp bowl.
At this time, samples were scraped from the top. nwddk. and bottom regions of the exterior of the mist shield, from inside the bottom, and from the ring. The mist shield spiral was then cut loose from the pump bowl segment, and cuts were made to by it open using 2 cutoff wheel. A viev of the two parts is shown in Fig. 11.2.
In contrast to the outside, where the changes between gas (upper half) and liquid (lower) regions, though .-vident. were not pronounced, on the inside the lower and upper regions differed markedly in the appearance of the deposits.
In the upper region the deposits were rather similar to those outside, though perhaps more irregular. The region of overlap appeared to have the heAviest dtinnii in the gas region, a «{acic film up :o I mm thick, thickest at the top. The tendency of aerosols to deposit on cooler surfaces (thermophoresis) is called to mind. In the liquid region the deposits were considerably thicker and more irregubr than elsewhere, as if filmed from larger agglomerates.
In the area of overlap in the liquid region, this kind of deposit was not observed, the deposit resembling that on the outside. If we recall that flow into the mist shield was nominally upward and then outward through the spiral, the surfaces within 'he »ni:f shield are evidently subject to smaller liquid ihear forces than thow outside or in the overlap, and th; liquid was surely n ore quiescent there than elsewhere. The conditions permit t!« accumulation and deposition of agglomerates.
The sai.iplc cage deposits also were more even in the upper part, becoming thickest at and on the latch stop. The deposit on the latch slop was black and hard, between I and 2 mm thick. Deposits on the cjge rods
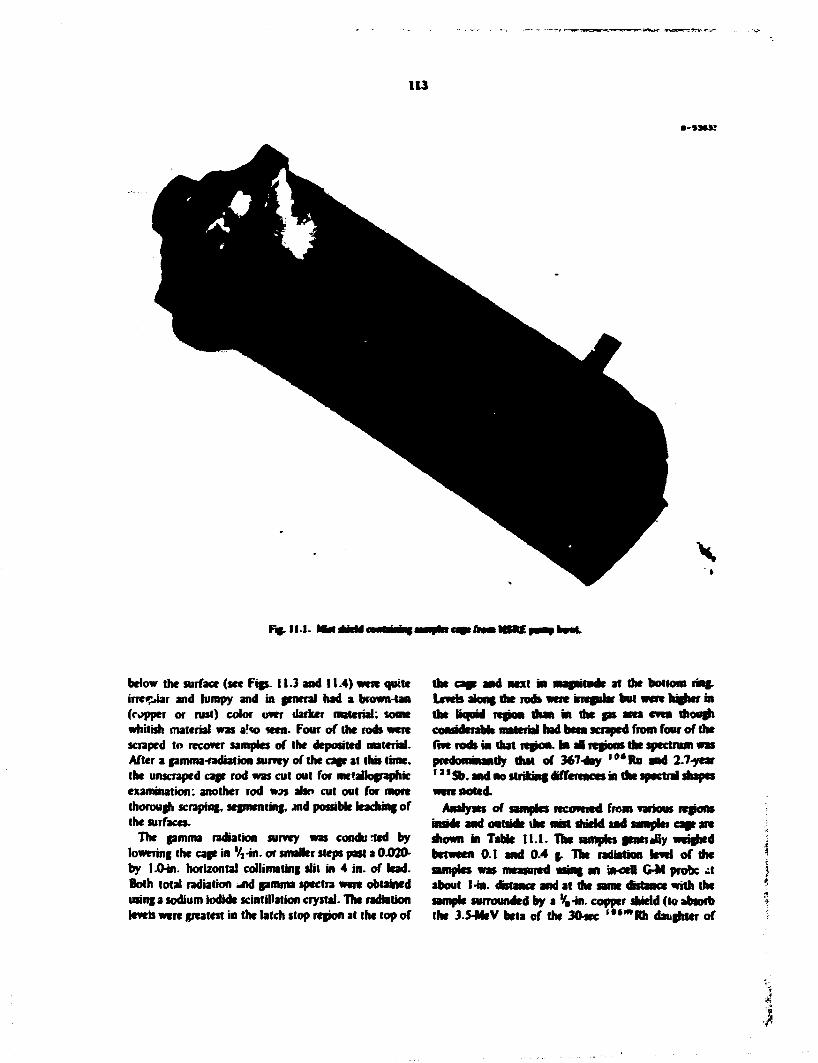
113
• - » S M :
F«. l l . l . mm cMtMaagi
below the surface (see Figs. 11.3 and 11.4) were quite intrJai and lumpy and in general had a brown-tan (copper or nisi) color e m darker material; some whitish material was a!w wen. Four of the rods were scraped In recover samples of the deposited material. After a pmma-radiation survey of the cage at this time, the unscraped cage rod was cut out for mcfaHographk examination: another rod » » also cut out for more thorough scraping, segmenting. <md possible leaching of the surfaces.
The gamma radiation surrey was conduced by lowering the cage in Vj-in. or smaller steps past a 0.020-by 1.0-in. horizontal collimating slit in 4 in. of lead. Both total radiation -nd gamma spectra were obtained using a sodium iodide scintillation crystal. The radiation levels were greatest in the latch slop region at the top of
the cage and next in magnitude at the bottom ring. Levels along the rods were irregular but were higher in the liquid region than in the gas area even though considerable material had been scraped from four of the five rods in that region. In afl regions the spectrum was ptedorninantty that of 367-day "*Ru and 2.7-year * * *Sb. and no striking differences in die spectral shapes were noted.
Analysts of samples recovered from various regions inside and outside the mat shield and sampler cage are shown in Table 11.1. The samples g*nti«fiy weighed between 0.1 and 0.4 g. The radiation level of the samples was measured using an m-cefj G-M probe i t about I-in. distance and at the same distance with the sample surrounded by a V,-in. copper shield (to absorb the 3.5-MeV beta of the 30stc '*""Rh daughter of

114
•-S42ZO
rig. 11.2. Interior of Mict iMrM. Right part of right segment ovtrbppcd kf t part of segment on left.
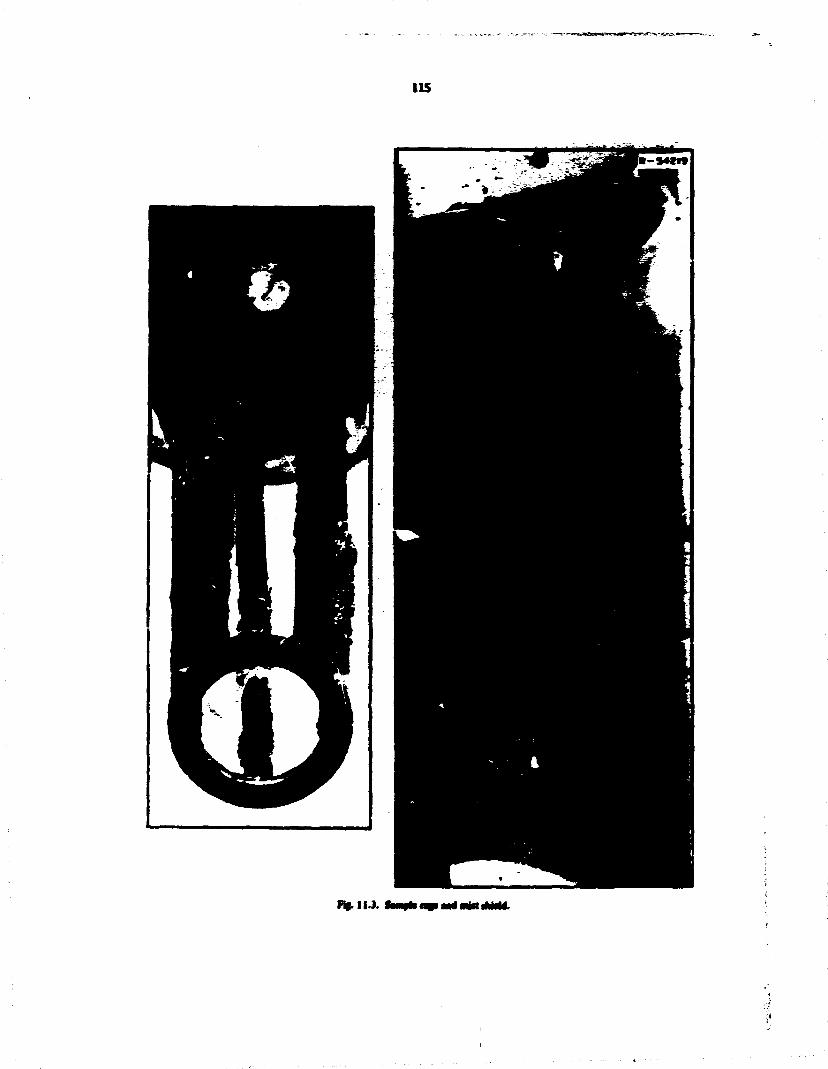
fcgpp. irt'-rw^fc^ffiw^.i*
I IS
P* I IJ . fiwplir^iwiwlw

' • * * • ) . Activities -winwrd r* das wiy ranjtd from 4 R/hr (2 R/fcr ««Wed) to 110 R*u (SO R/fcr stsahled). the toner bemg oa a 0.4-g sample of me i lakh rta? si n r top of the <.
( I ) the alack hnapy meierial picked mp a> bowl bottom. (2) me deposit oa the
hack sua at the top of ear aaaple cage, aad (3> scraped from the inade of the mist shield m
The material ncmiti from the coataiaed 7% carbon. 31%
Heneloy N atetth. 3.4% I t ( l t% BeF,), aad 6» U (22% LiFX Om» poanMy this mcmatd some cutting •com. The orboa dooMess was a tar or soot resaltiag tram thermal ami ramofytic drcurapositioa of mbri-catiag of kabag into the pamp bowl. It is believed that this material was jarred loose from opper parts of the pamp bowl or the sample transfer take during the chisel work to detach the mist smeM.
Tat hard deposit oa the fetch stop contained 2S% carbon. £0% Be ( I I * BeF,), Xt% U (10* UF), aad 12% metals m approximate Hastaloy N proportions, again possibly to some exteat cuttiag debris.
The sample taken from the iantr liquid region of the east shield contanwd 2.5% Be (13% BeF,), 3.0% Li (11% LiF), and 18% metals (with somewhat mote cwrowauin and iron than HastefloyN); a carbon analysis was not obtained.
m each case, about 0.S to 1% Zr (about 1 to 2% ZrF 4) was found, a level lower than fuel sal: in proportion to the lithium and berymum. Uranium analyst! were not obtainable; so we cannot dearly say whether the salt is fuel salt or flush salt. Since ission product data suggest that the deposits buSt up over appreciable periods, we presume that it b fuel salt.
In aO cases the dominant Hastelloy N constituent, nickel, W3S the major metallic ingredient of the deposit. Only in the d»;osit from the mist shield inside the liquid region did the proportions of Ni, Mo, Cr, and Fe depart appreciably from the metal proper. In this deposit a relative excess of chromium and iron was found, which would not be attributable to incidental metal debris from cutting operations. It is also possible that the various HatteOoy N efcrnen's were all subject to mast transport by salt during operation, and that little of that found resulted from cutup operation.
We now come to consideration of fission product isotope data. These data are shown in Table 11.2 for deposits scraped from a number of regions. The activity per gram of sample is shown as a fraction of MSRE inventory activity per gram of MSRF. fuel salt to cBmmite the effects of yield and power history;
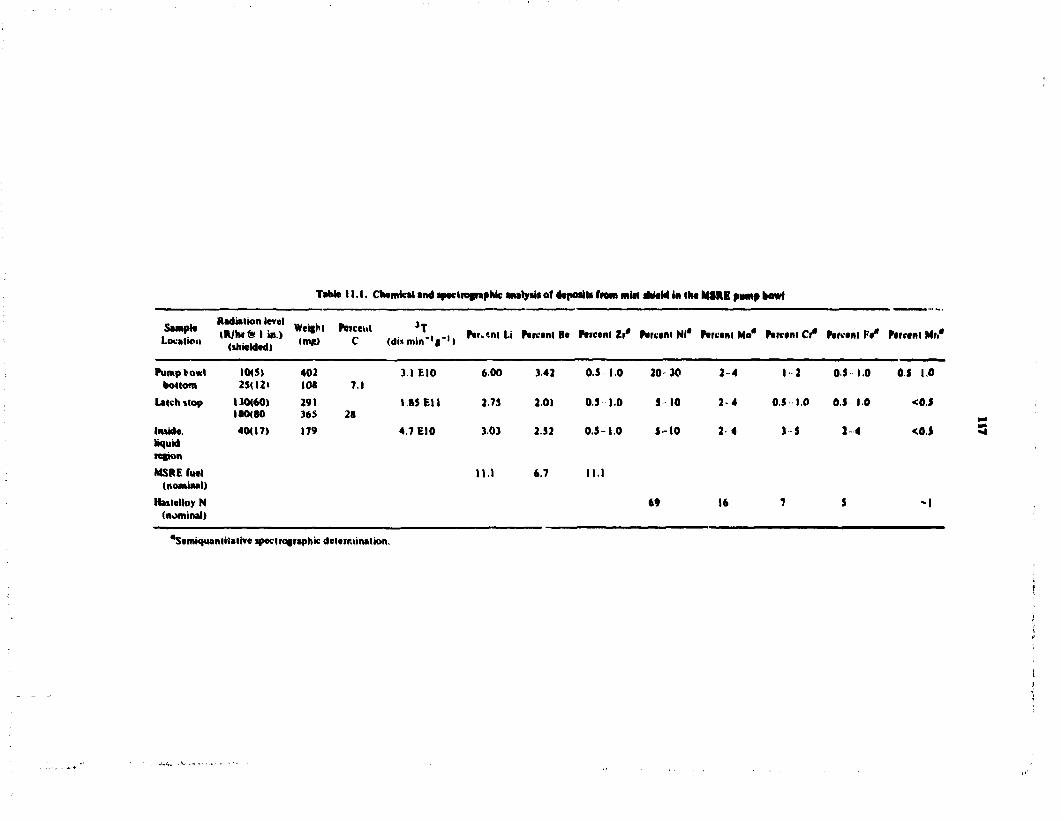
Table 11.1. Chemical and spectrofrapMc analysi* of deposit* from mitt sbieM in Iht MSRE pump bowl
sample ,•./„»» 1 in.) " " t ™ "'«««» T Peutnt Li Percent Be Percent Zr* Partem Nl* Percent Mo* Percent Cr* Percent Fa* Percent Mr.' Location <ihieided) { m f ) (dis mm ' f ' )
Pump rowl bottom
10(5) 2S(12»
402 108 7.1
3 1 EIO 600 3.42
Latch stop 130(60) 180(80
291 363 28
IBS E l l 2.7J 2.01
Inside. liquid ration
40(17) 179 4.7 EIO 303 2 52
MSRE fuel (nominal)
11.) 6.7
HasleUoy N (nominal)
0.3 1.0 20 30
0.3 1.0 3 10
0.3-1.0 3-10
I I . I
69
2-4
2-4
2 4
16
I I 01 1.0 0.3 1.0
0.5 1.0 0.3 10 <0.J
3 3 2 4 <0J
"Semiquantitative speciragraphic delerr.iination.

Tabs* 11.2. Gamma specttogneMc (C*4iode) analysis of deposits from mist «MaM In Ida MIRK pump bowl
••Tc " N b , 0 , R u » " R M '»»Sb " " " l a ' " C i " Z i - ' "C«*
Half-life 21 x 10> yrau 33 days 39.6 days 367 days 2.7 ytan IOS days 30 years 6S4ayi 2114ayi (after , $ Z r )
Inventory, dnmin'1 |"' 24u| / | S3 ElO 33 ElO 3.3E9 3.7 El 2.0 E9 6.2 89 9.9 ElO S.9II0 Sample activity pei gram expressed
as fraction of MSRE inventory activity/grams fuel salt*
Pump bowl bottom, loose particles
Latch stop Top
Outside Inside
Middle outside Below liquid surface
Inside No 1 Inside No. 2 463 Cage rod
Bottom Outside Inside
"Background values (limit of detection) were as follows: * s Zr, 2-9 ElO. , M C e . I -2 ElO;' " C i . 2-9 E l ; " * A | . I 3 Kf;' **Eu, I El 2 E9. ^Uncertainty stated (as t value) only when an appreciable fraction 010%) of observed.
0.23 36 52 20 17 2.1 013 10.03 0.10
263 364 1000 S.7 69 3.1 0 0
122 42* l«
167 237 < 1*3
321 273
104 1000
91 69
9.S 4.3
0 0
0 0
217 S3I 646 363 34 1.0 0 0 334 141 303
164 292 22)
224 310 692
271 72 191
143 91 117
0.6 II 0.2
0 0 0
013 10.02 0 0
(0. <60) 16 s 9
(0, <60) 13*9
1210 119
167 31
232 27
3.2 0.32
0 0
0 on
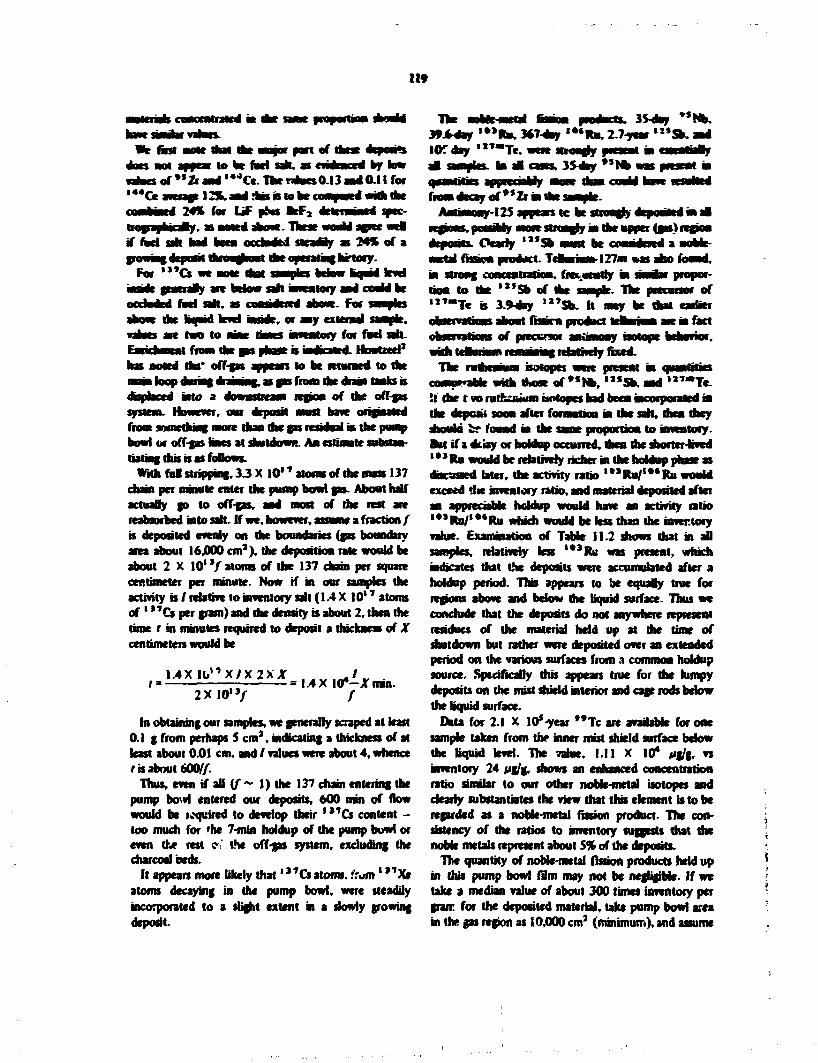
119
013 J fcrfaw
0.11 for with the
first arte Hot me major pact of \ ant apptaw to be rati salt. i o f ^ a a d ' ^ C e - T h e i
• * 4Ce i m p 12*. aad ins is to he » 24% for LiF pfias l e F 3
if fad St* had bees oulanH sttaday as 2 4 * of a growing deposit throaghoat the operating hrtory.
For »"Cs we aote that samples below Kamd level made austiaBy are below sah inventory ami coaid be occluded fad salt, as considered above. For
the bqmd level inside, or any extents!
•to a
from the gas | has aoied ths* off-fas appeals to be fttamed to the
, as gas from the dram taaks is enjon of the offfas
system. However, oar deposit mast have originated from something more than the gas resides! n the pamp bowl or off-gas haes at shutdown. AM estimate substaa-tutmg thb is m foBows.
With ful stripping. 3 3 X 10 ' T atoms of the mass 137 chain per nanute cater the pump bowl gas. About half actually go to off-gas, sad most of die rest are reabsorbed into salt. If we, however, assume a fraction / is deposited evenly on the boundaries (gas boundary area about 16,000 cm 3), the deposition rate would be about 2 X 10' ' / atoms of the 137 chain per square centimeter per minute. Now if in our samples the activity is / relative to inventory salt (1.4 X 10* ''atoms of * * 7Cs per gram) and the density is about 2, then the time t in minutes required to deposit a thickness of X centimeters would be
M X 1 0 " X / X 2 X j r , . „ , « , # - . / • = 1.4 X 10*—JT mm.
2XI0 1 */ / In obtaining our samples, we generally scraped at least
0.1 g from perhaps 5 cm 2 , indicating a thickness of at least about 0.01 cm, and / values were about 4, whence r is about 600//.
Thus, even if all ( / - 1) the 137 chain entering the pump bowl entered our deposits, 600 nun of flow would be inquired to develop their ' > 7Cs content -too much for 'he 7-min holdup of the pump bowl or even the rest 9\ the off-fas system, excluding the charcoal beds.
It appears more likely that ' 3 *Cs atoms, 'rum* " X e atoms decaying in the pump bowl, were steadily incorporated to a slight extent in a slowly growing deposit.
The aoUe-metd namm pmdacts. 3*dey **Nb. 39Aday ' " R u , 367-day ' * * I U . 2.7-ycar ' "SY. aad lOfday ' " " T e . wem straady present i
la a l cases. 3Sdsy * s N b vn
from decay of ** Is m the j r-I2S appears tc be tfroady i
ante strongly m dse upper (gas) regno Ocariy * " » mast be conadercd a
metal fission product. Tdwrium-127m M S aho fo ia Wrong concentration, frwjwndy at smriaar propor-boa to the ' " » of die sane*. T V paKursor of • *""Tc is 3.9-day l , 7 S b . It may be that earner
i about fiaora product ttaanam are in fact of precursor
with teBurium remaning idativdy fixed. • •Tat IVtbCsTanWII BOtOOCS VCt t f f f l M M
comparable wnfc ti**t of »«Nb, ' " S n . aad * " " T e -lithe t vo ruthenium untopes had been incorporated m the deposit soon after formation ia the sah, then they should i f foaad in the same proportion to inventory. But if a dtiay or holdup occurred, then the shorter-lived , M R u would be relatively richer m the holdup phase as discussed later, the activity ratio , M R u / ' * ' R u would exceed the inventory ratio, and material deposited after an appreciable holdup would have an activity ratio ' " R u / ^ ' R u which would be less than the inventory value. Examination of Table 11.2 shows that in aD samples, relatively less > > 3 R u was present, which indicates that the deposits were accumulated after a holdup period. This appears to be equally true for regions above and below the liquid surface. Thus we conclude that the deposits do not anywhere represent residues of the material hdd up at die time of shutdown but rather were deposited over an extended period on the various surfaces from a common holdup source. Specifically this appears true for the lumpy deposits on the mist shield interior and cage rods below the liquid surface.
Data for 2.1 X 10*-year " T c are available for one sample taken from the inner mist shield surface below the liquid level. The value. 1.11 X 10* jig/g, vs inventory 24 ug/g, shows an enhanced concentration ratio similar to our other noble-metal isotopes and dearly substantiates the view that this element is to be regarded as a noble-metal fission product. The consistency of the ratios to inventory suggests that die noble metals represent about 5% of the deposits.
The quantity of noMe-metal fission products held up in this pump bowl film may not be negligible. If we take a median value of about 300 times inventory per gran: for the deposited material, take pump bowl area in the gas region as 10,000 cm3 (minimum), and assume
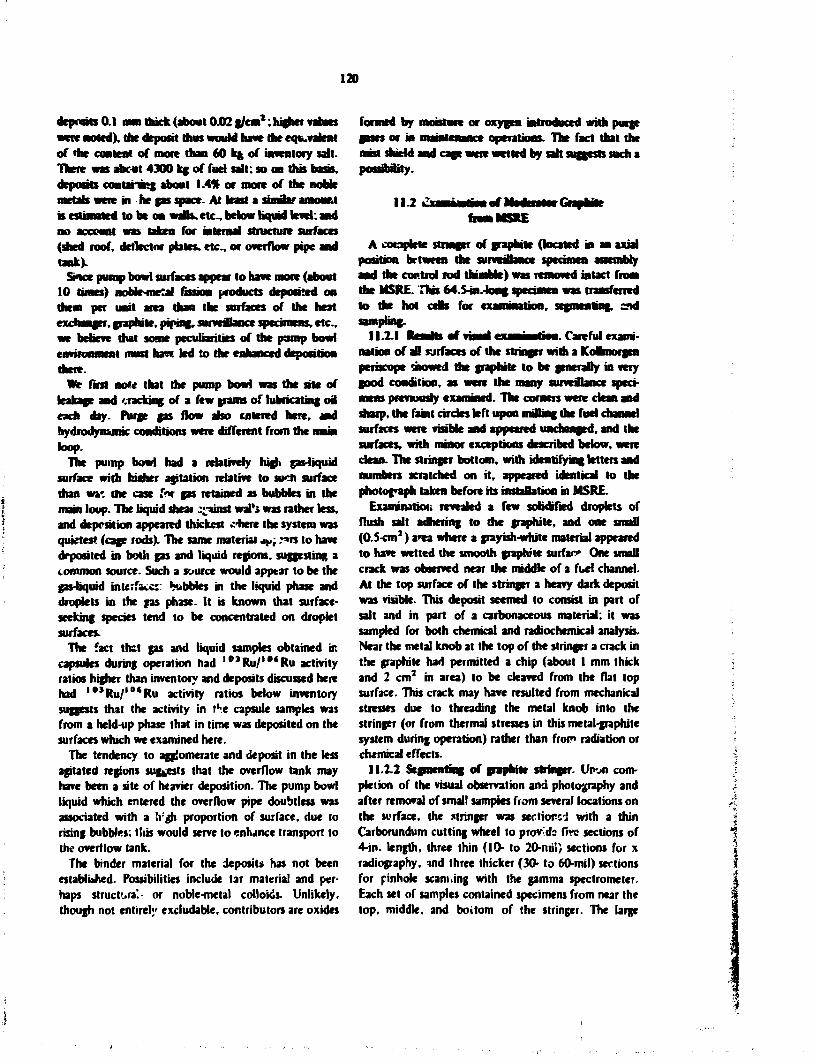
120
deposits 0.1 mm thick (about 0.02 g/cm*: higher values were noted), the deposit thus would have theeqtuvaient of Hie couleat of more than 60 1% of inventory salt. There was about 4300 kg of fuel salt: so on this basis, deposits contarang about 1.4% or more of the nook metals were in he gas space. At hast a similar amount is estimated to be on watts, etc., below liquid level-, and no account was taken for internal structure surfaces (shed roof, deflector plates, etc., or overflow pipe and tank).
Since pump bowl surfaces appear to have more (about 10 tunes) nobk-metal fission products deposited on diem per unit area than the surfaces of the heat exchanger, graphite, piping, surveibnee specimens, etc., we believe that some peculiarities of the pump bowl environment must have led to the enhanced deposition there.
We first note that the pump bowl was the sit* of leakage and cracking of a few grams of lubricating oil each day. Purge gas flow also entered here, and hydrodyn&mk conditions were different from the mam loop.
The pump bowl had a relatively high gas-liquid surface with hither agitation relative to such surface than wi'. the case frr gas retained as bubbles in the nam loop. The liquid shear zpwM wal's was rather less, and deposition appeared thickest tfbere the system was quietest (cage rods). The same material ay, r*n to have deposited in both gas and liquid regions, suggesting a common source. Such a source would appear to be the gas-bquid interface;: bubbles in the liquid phase and droplets in the gas phase. It is known that surface-seeking species tend to be concentrated on droplet surfaces.
The fact tret gas and liquid samples obtained ire capsules during operation had ' 0 J R u / ' ° * R u activity ratios higher than inventory and deposits discussed here had , 0 , R u / , 0 ' R u activity ratios below inventory suggests that the activity in the capsule samples was from a held-up phase that in time was deposited on the surfaces which we examined here.
The tendency to agglomerate and deposit in the less agitated regions suggests that the overflow tank may have been a site of heavier deposition. The pump bowl liquid which entered the overflow pipe doubtless was associated with a !i : jh proportion of surface, due to rising bubbles; tSiis would serve to enhance transport to the overflow tank.
The binder material for the deposits has not been established. Possibilities include tar material and perhaps structural or noble-metal colloids- Unlikely, though not entirely excludable, contributors are oxides
formed by moisture or oxygen introduced with purge gases or in maintenance operations. The fact that the mist shield and cage were wetted by salt suggests such a possibility.
112 • l a m i w r w u r f M i j m l i i Crap hilt fmmMSXE
A complete stringer of graphite (located in an axial position between the surveillance specimen assembly and the control rod thimble) was removed intact from the MSRE. This 64.5-m.4ong specimen was transferred to the hot cefls for examination, segmenting, s id sampling.
112.1 Results of visual iwi—natinn. Careful exami-nation of all surfaces of the stringer w i n a KoBmorgen periscope rowed the graphite to be generally in very good condition, as were the many survedlance specimens previously examined. The comers were dean and sharp, the faint circles left upon milling the fuel channel surfaces were visible and appeared unchanged, and the surfaces, with minor exceptions described below, were dean. The stringer bottom, with identifying letters and numbers scratched on it, appeared identical to the photograph taken before its installation in MSRE.
Examination revealed a few solidified droplets of flush salt adhering to the graphite, and one small (0.5-cm 2) a*ea where a grayish-white material appeared to have wetted the smooth graphite surfar* One small crack was observed near the middle of a fuel channel. At the top surface of the stringer a heavy dark deposit was visible. This deposit seemed to consist in part of salt and in part of a carbonaceous material: it was sampled for both chemical and radiochemical analysis-Near the metal knob at the top of the stringer a crack in the graphite had permitted a chip (about 1 mm thick and 2 cm 1 in area) to be cleaved from the flat top surface. This crack may have resulted from mechanical stresses due to threading the metal knob into the stringer (or from thermal stresses in this metal-graphite system during operation) rather than from radiation or chemical effects.
11.12 Segmenting of graphite stringer. Upon completion of the visual observation and photography and after removal of smal! samples from several locations on the surface, the stringer was sectioned with a thin Carborundum cutting wheel to provd; five sections of 4-in. length, three thin (10- to 20-niii) sections for x radiography, ind three thicker (30- to 60-mil) sections for pinhole scam.ing with the gamma spectrometer. Each set of samples contained specimens from near the top, middle, and boitom of the stringer. The large
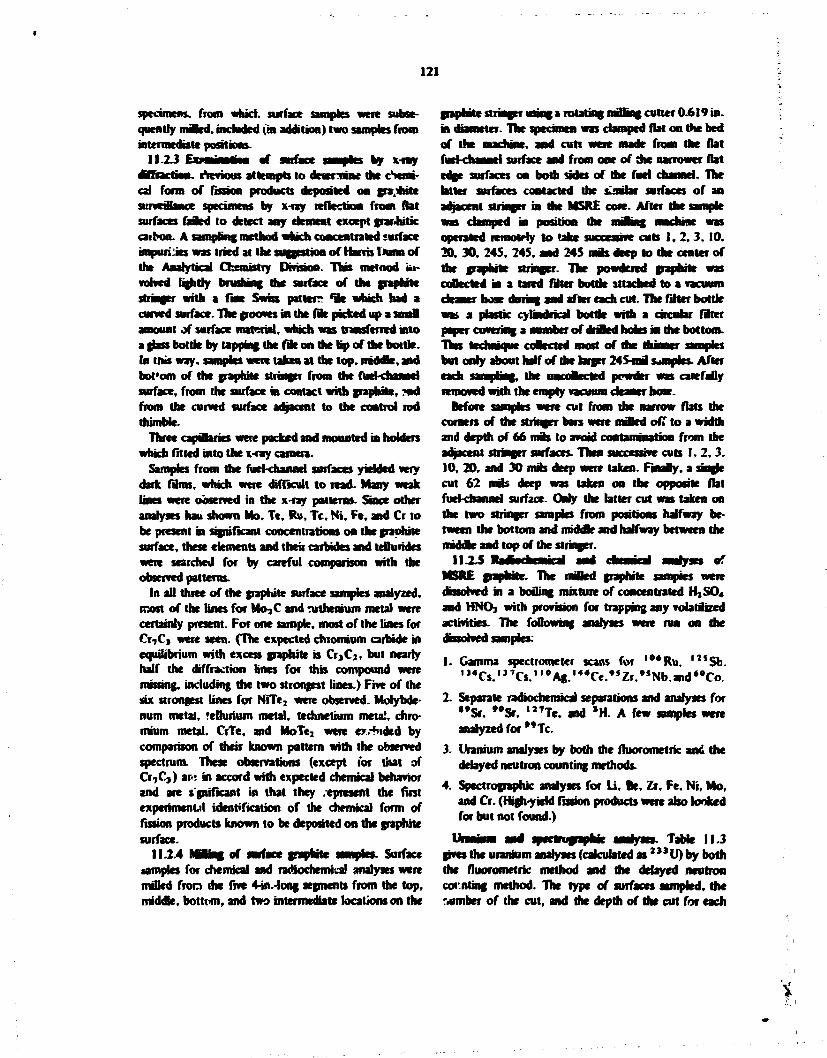
•
121
specimens, from whict. surface samples were subsequently nulled, included (m addition) two samples from intermediate positions-
I I 2 J E t f M w i M of surface samples by *cay dafrrac titer iVevious attempts to deier-nine the cSemi-cal form of fission products deposited on gra.duic surveillance specimens by x-ray reflectkM from flat surfaces faded to detect any dement except tjrarJutk caibon. A sampling method which concentrated surface impuh:ies was tried at the suggestion of Harris h u m of the Analytical Cfamustry Division. This metood involved lightly Drudung the surface of the graphite stringer with a fine Swiss patter? <3e which had a curved surface. The ( r o o m in the foe picked up a small amount of surface material, which was transferred into a glass bottle by tapping the fue on the hp of the bottle. In this way, samples were taken at the top. middle, and bot'om of the graphite stringer from die furl-channel surface, from the surface in contact with graphite, ?nd from the curved surface adjacent to the control rod thimble.
Three capibries were packed and mounted in holders which fitted into the x-ray camera.
Samples from the fuel-channel surfaces yielded very dark films, which were difficult to read- Many weak lines were observed in the x-ray patterns. Since other analyses hau shown Mo, Te, Ru, Tc, N i , Fe, and Cr to be present in significant concentrations on the graphite surface, these elements and their carbides and teBurides were searched for by careful comparison with the observed patterns.
In all three of the graphite surface samples analyzed, most of the lines for Mo?C and ruthenium metal were certainly present. For one sample, most of the lines for CrjCj were seen. (The expected chromium carbide in equilibrium with excess graphite is C r 3 C } , but nearly half the diffraction lines for this compound were missing, including the two strongest lines.) Five of the six strongest tines for NiTe 2 were observed. Molybdenum metal, Tellurium metal, technetium metal, chromium metal. CrTe, and MoTe 2 were errfnded by comparison of their known pattern with the observed spectrum. These observations (except lor that of Cr^.j) ar<: in accord with expected chemical behavior and are sgnificant in that they represent the first experiment*! identification of the chemical form of fission products known to be deposited on the graphite surface.
I I 2.4 MWng of surface graphite samples. Surface samples for chemical and radiochemical analyses were nulled from die five 4-in.-Iong segments from the top, middle, bottom, and two intermediate locations on the
graphite stringer using a rotating naumg cutter 0.619 in. in diameter. The specimen was clamped flat on the bed of the machine, and cuts were made from the flat fuel-channel surface and from one of die narrower flat edge surfaces on both sides of the fuel channel. The latter surfaces contacted the sjnilar surfaces of an adjacent stringer in the MSRE core. After the sample was clamped in position the miffing natchme was operated remotely to take successive cuts I , 2 , 3 , 10. 20. 30. 245. 245. and 245 mis deep to the center of the graphite stringer. The powdered graphite was collected in a tared filter bottle attached to a vacuum cleaner hose during and after each cut. The filter bottle w u a pttstk cylindrical bottle with a circular filer paper covering a number of drifted holes indie bottom. Thn techmquc coBected most of the thinner samples but only about half of the larger 245-mi synapses. After each samphng. the uncolccted powder was carefully removed with the empty vacuum eh ana r hose.
Before samples were cut from the narrow flats the corners of the stringer bars were milled off to a width and depth of 66 mis to avoid contamination from the adjacent stringer surfaces. Then successive cuts I , 2 . 3, 10, 20, and 30 nub deep were taken. Finally, a single cut 62 mis deep was taken on the opposite flat fuel-channel surface. Only the latter cut was taken on the two stringer samples from positions halfway between the bottom and mtddar and halfway between the rmddk and top of the stringer.
MSRE gwphth. The milled graphite samples were dissolved in a boiling mixture of concentrated H?S0 4
and HNOj with provision for trapping any volatilized activities. The following analyses were run on the dissolved samples:
1. Gamma spectrometer scans for , 0 * R u . l l f S b . I J 4 C s . , , 7 C s . " ° A g . M 4 C e . , 5 Z r . , , N b . a n d " C o .
2. Separate radiochemical separations and analyses for •»Sr. M S r . , 2 ' T e . and 3 H . A few samples were analyzed for **Tc.
3. Uranium analyses by both the fluorometric and the delayed neutron counting methods.
4. Spectrographk analyses for Li , Be, Zr, Fe, N i , Mo, and Cr. (High-yield fission products were also looked for but not found.)
Itantam and spectrographs!. sawJ/wi Table 11.3 gives the uranium analysts (calculated as " ' U) by both the fluorometric method and the delayed neutron cot nting method. The type of surfaces sampled, the Mimber of the cut, and the depth of the cut for each
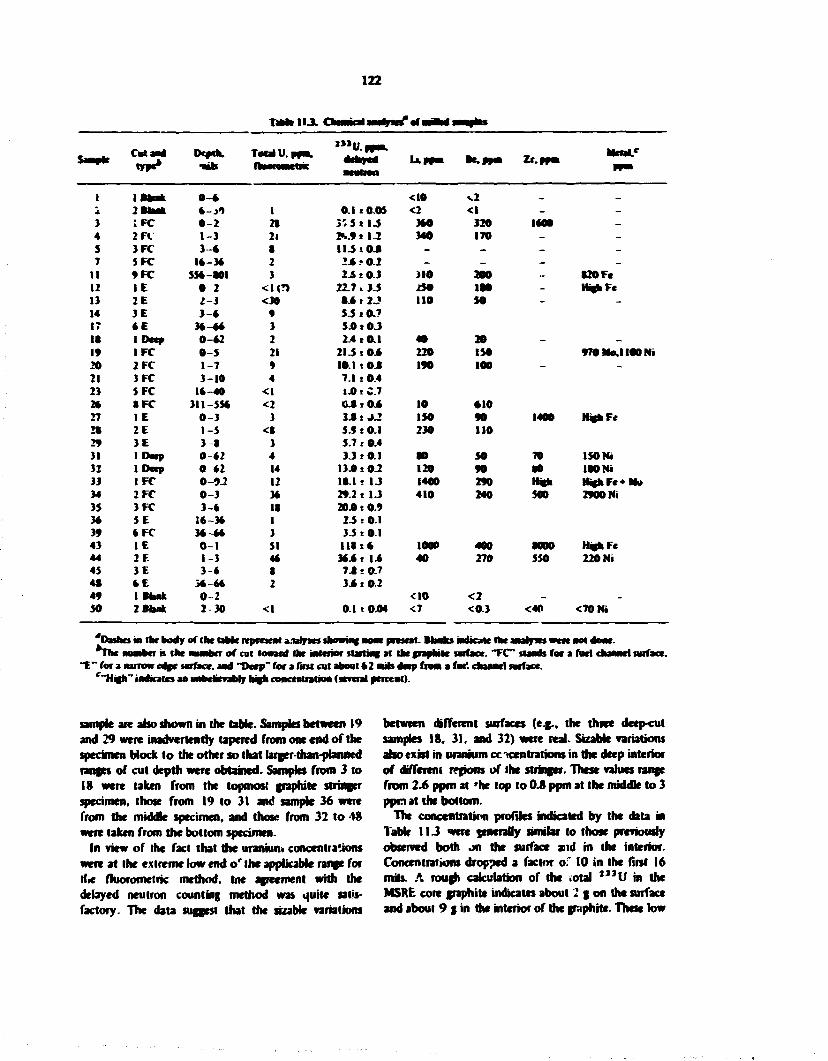
122
Taut* 11.3.
'"U.ppaB. S - P * Cut and
t*P«* Depth, ••ib
Total U.ppat, Uppni Kppni Zr.PF* Metal*
I IBank 0-4 <I0 <2 _ _ i 2 M M * 4 - j l 1 0.1 x 0.05 <2 <1 - -3 ; F C 0 -2 21 >ZS t 1.5 3M 320 WOO -4 2FC 1-3 2i V..91 11 340 170 - -5 3FC 3 - * • I U : 0 J - - _ _ 7 SFC 14-3* 2 i * • 0.2 - - - -
I I 9FC 35t-a0l 3 24 : 0-3 >I0 200 - 020 Fc 12 I E 0 2 < l (? l 22.7 i 3 J 250 1W - MghFe l> 2E 2-3 <30 • - * s 2 ? 110 so - -14 3E 3-« 9 SJtO-7 17 • E H - M 3 SJOXOJ I t 1 Deep 0-o2 2 2.4 t Oil 40 29 - -19 I F C 0-5 21 21S : 0 4 220 150 970Mo.llOONi 20 2FC 1-7 9 10.1 t 0 4 190 100 - -21 3FC 3-10 4 7.1 t 0.4 23 $FC I* -40 <1 1 J> •- C-7 2* • FC 311-5$* <2 0 4 t 0 4 10 010 27 1 E 0-3 3 3 4 t J . 2 150 90 1400 HtjbFc 2S 2E 1-5 <• 5.9 s 0.1 230 110 29 3E 3-« 3 5.7 t 0.4 31 1 Deep 0-«2 4 3J t 0.1 so SO 70 ISONi 32 I Deep 0 62 14 13 J) t 0 2 120 90 •0 I W N i 33 I F C 0-9.2 12 I I I f 1.3 1400 290 Wen H«fcFc+tfc 34 2FC 0-3 3* 29.2 t 1J 410 240 500 2900 Ni 35 3FC 3 - * I t 20.01 0.9 3* 5E 16-3* 1 2.5 ! 0 1 39 • FC 36-6* 3 3.5 t 0.1 43 I E 0 -1 SI l i t ! 6 1000 400 0000 HajhFe 44 2E 1-3 4* 3*4 t 14 40 270 550 220 Ni 45 3E 3 * 1 741 0-7 « 6 E 3 t - « * 2 3 4 1 0.2 49 1 M M * 0-2 <I0 <2 - -SO 2 M M * 2 30 <l 0.1 t 0.0* <7 <0.3 <40 <70Ni
'Dashes in the body of the table represent aaah/scs innuiiin; none prcseat- Blanks nwttcale the analysts wet* not done. *Tbe number B the number of cut fouanf the interior starting at tbt graphite surface. "FC" stands for a fuel channel surface.
~E" for a narrow edge surface, and "Deep" for a first cut about 62 otib deep front a fuel channel surface. f "High" indicates an unbentraMy high concentration (several percent).
sample are abo shown in the table. Samples between 19 and 29 were inadvertently tapered from one end of the specimen block to the other so that larpr-tJian-planned ranges of cut depth were obtained. Samples from 3 to 18 were taken from the topmost graphite stringer specimen, those from 19 to 31 and sample 36 were from the middle specimen, and those from 32 to 48 were taken from the bottom specimen.
In view of the fact that the uranium concentrations were at the extreme low end o ' the applicable range for tliC fluoromctric method, trie agreement with the delayed neutron counting method was quite satisfactory. The data suggest that the suable variations
between different surfaces (e.g., the three deep-cut samples 18, 31 , and 32) were real. Sizable variations also exist in uranium cctcentrations in the deep interior of differem nrporrs of the stringer. These values range from 2.6 ppm at 'he top to 0.8 ppm at the middle to 3 ppm at the bottom.
The concentration profiles indicated by the data in Table 11J were jmerally similar to those previously observed both on the surface and in the interior. Concentrations dropped a factor o; 10 in the first 16 mMs. A rough calculation of the iotal 2 I 1 U in the MSRE core graphite indicates about * g on tht surface and about 9 g in the interior of the graphite. These low
123
values indicate that unnhun penetration into moderator graphite should not be a serious problem in bvge-icale molten-salt reactors.
The fact that flcorometric values ibr total uranium Md Ihe delayed neutron counting values for " * U agreed (with the " * U value usually larger than the total uraojuin value) indicates that little uranium remaned in the graphite from the operation of the MSRE with " 5 U fuel. Apparently, the " " U and " * U previously in the graphite underwent rather complete isotopk exchange with " ' U after the fuel was changed. The finding of ISO to 2900 ppm nickel in a few of the surface samples is probably real. The main cuncittsioru from the spectrograph*: analyses are that adherent or permeated fuel salt accounted for the uranium, lithium, and beryhum in half the samples and that a thin layer of nickel was probably deposited on some of the graphite surface.
stadhM tenncai analyses. Since the graphite stringer samples were taken more than a year after reactor shutdown, it was possible to analyze only for the relatively long-lived fission products. However, the absence of interfering short-lived activities made the analyses for long-lived nuclides more sensitive and precise. The radntdiemkal analyses are given in Table 11.4, together with the type and location of surface sampled, the number of the miring cut, and the depth of the cut for each sample.
The species ' " » , ' " R u , , , # A g . " N b , a n d ' " T e St* wed concentration profiles similar to those observed for mMe^netal fission prodwts ( " M o . ' " T e , ' " T e i » s R u »"*Ru, and »*Nb) in preriooi graphite sutYtil lance specimens, that is, high surface concentration? falling rapidly several orders of mvmrtudc to low interior concentrations. The profiles for **Zr were of rinribr shape, but the interior concentrations were two or three orders of magnitude smaller than fbi its daughter " Nb. It is thought that * s I r is either injected into the graphite by a fission recoil mechanism or is carried with fuel salt into cracks ir the graphite: the much larger concentrations of " N b (and the other nobk metals) are thought to result from the deposition or plating of solid metallic or carbide particles on the graphite surface. The " S r (33-stc " K r precursor) profits were much steeper than those previously observed in surveilance specimens for " S r (3.2-nin " K r precursor), as expected. An attempt to analyze the stringer samples lot " S t also was unsuccessful. !t is difficult to analyze for one of these pure beta emitters in tht presence of large activities of the other.
Surprisingly high concentrations of tritium were found in the moderator graphite samples (Table 11-4).
The tritium concentration decreased rapidry from about 10" db mm"1 g~* at the surface to about 10' dis mm*1 g~' at a depth of V, ( in. and then decreased slowly to about half this value at the center of the stringer If a l the graphite in the MSRE contained this muck tnrium. then about 15% of the tritium produced during the entire power operation had been trapped in the graphite. About half the total trapped tritium was in the outer V, t - in. layer.
Sirmhrry high concentrations of tritium were found in spuimtns of Poco graphite (a graphite characterized by large uniform pores) exposed to fissioning salt in the core during the final 1786 hr of operation. Surface concentrations as high as 4.S X 10** dis mm' 1 g~* were found, but interior concentrations were below 10* dis ma" 1 g ' 1 , much lower than for the moderator graphite. This suggests that the graphite surface is saturated relatively quickly but that diffusion to ti> interior is slow.
If it is assumed that the surface area of the graphite (about 0.5 m*/g) is not changed by irradiation (there was no dependence of tritium sorption on flux), there was 1 tritium per 100 surface carbon atom*. Since the MSRE cover gas probably contained about 100 times as much hydrogen (from pump oil decomposition) as tritium, a remarkably complete coverage by dierrn-sorbed hydrogen is indicated
An overall assessment oi tritium behavior u. the MSRE3 and proposed MSBRV is presented elsewhere.
The data on fission product deposition on and in the graphite, based on Table 11.4, have been calculated as (observed activity per square centimeter) divided by (inventory activity/total area), as was done for survei-lance specimens earner. The resulting relative deposit intensities, shown in Table 11.5, can, of course, then be compared with values reported for other nuclides, other specimens, or other times. If a l graphite surfaces were evenly covered at the indkated intensity, the fraction of total inventory in such deposits would be 14% of the relative deposit intensity shown. For top, middle, and bottom regions and for channel and rdge (graphite-to-graprrite) surfaces, values are shown for surface and overall deep cuts.
As in the case of surveilance specimens, mtenntics for swt-seekhrg nucSdrs are at levels appropriate for fission recoil (about 04)01), the noble-*** daughters ( " 7 Cs and '*Sr) are 10 to 20 times as Ugh, and the noble metals notably higher, though, » we thai sec. not as high on balance as c«metias.Wr^fecc4nparisons canrxmade.mortofthcdeposftwasjidicatedtobeat the surface. Vahies for " N b are far above " Z r . indicating that " M b was indeed deposited: the graphite
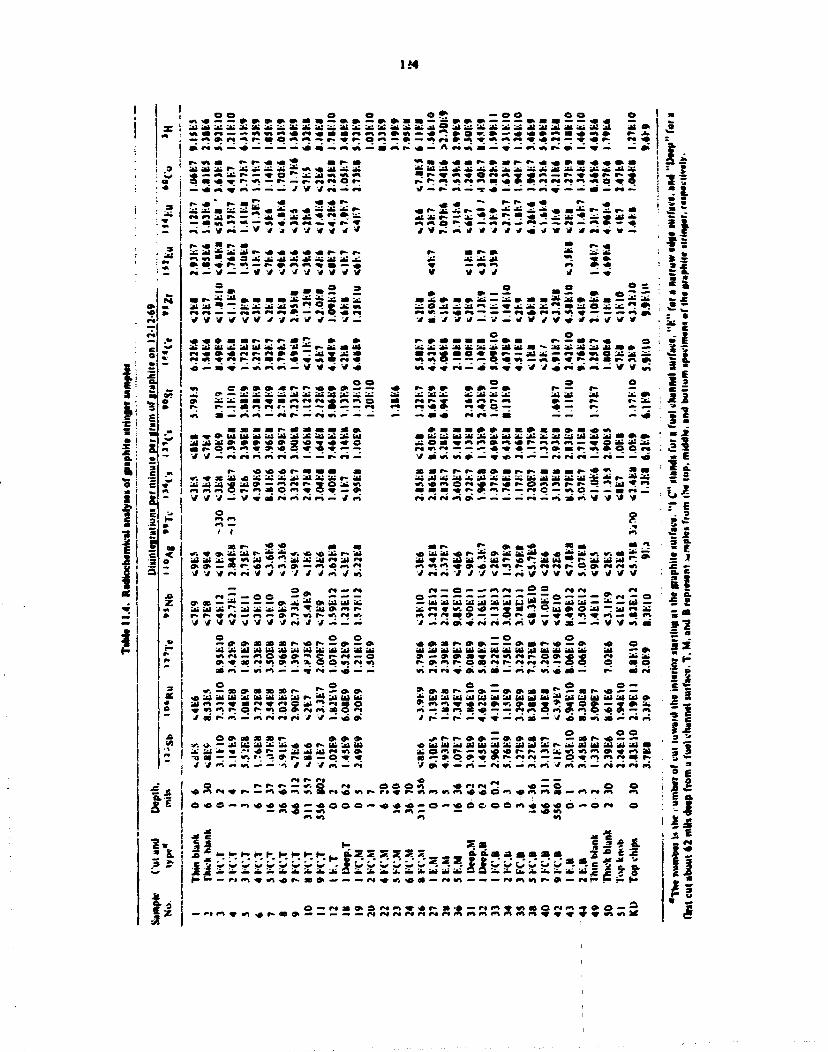
114

125
TaMtll-S. •aMSKEl i r f M b k i
t ~ u ~ T»»c UCV** ( M b )
"Vs " * 1 4 4 & " 2 . M N k ' " t o ' " T « » " »
T-r Ouaact 0 2 04001 0407 04007 0.24* 0.11 0424 0-41 o soo 0-M7 0472 04032 04024 049 0.14 0490 0i5O
**** 0 2 04090 0406 04005 04007 O.IJ »••*? *$n 5-524
M»c o 42 04007 0430 0.30 OJS 0 4 t 0-79
* * awMKt 0 3 0 550
0402* 0430 0471
0402 0403
0.31 045 0.10 0.12
9-11
w * 0 3 0413 0414 04000 04004 0.15 0421 0415 024 0 J* 0-020 0429 04011 04009 0-20 0024 04IS 025
Ms* 0 * 2 0.030 0 4 JS 0400* 140 I I * 0.94 2-14
E4r* 0 42 0437 0401 04021 04023 043 0.29 040 0.79
•MtaM n.n-i. t 0 3 OJOOIS 0414 04012 04011 0-49 049 OJ* 040 0 »D0 04*9 0417 04024 04011 0-50 0.14 0.43 044
l+ft 0 J 04017 0401 04015 04015 045 047 0-14 0^7
*-2E»
tnu/nwi pw ff*m of aft)
0 .1» 5-9EI0 9.9EI0 0.3EIO 3.3E9 24W 3.7E*
ippeai to be higher next section for metal surfaces, bat the dozen harffcves between shutdown may have reduced the precision of the data
in the o f a
be the resntt of a gram-boundary transport of the
efHeat I I J
Among the specimens of component surfaces excised from the MSRE were two segments of control rod thimble and one each of heat exchanger she! and tubing- In addition to the fission product data we report here, these specimens were of major interest because of gram-boundary cracking of surfaces contacting molten salt fuel, as discussed elsewhere.*
Successive layers were removed ctectrocherojcally f.om the samples using methanol-10% HO as electrolyte. These solutions were exam, ltd both spectro-graphicaily and radwehernkafly. The sample depth was calculated from the amowi' of nkfcd and the specimen geometry, etc (V,(icentration profiles (relative to nickel* Tor the fuel side of the specimen of heat exchanger tube are shown in Fig. 11.5 for constituent dements, fission product tellurium, and various fission product nuclides. It >i of interest to note that concentrations 3 mils below the surface were 1 to 10% of those observed near the surface. Value; this high could
For die various samples, deposit concentranocs were obtained by wnrnung the amouits dttunintd in successive layers. Trwse arc shown, expressed as ratios to inventory concentration dmded by total MSRF. area (3.0 X 10* cm 3 ) , in Tab** 114.
As discussed for surveillance specimen and other deposit data, tins ratio, the relative deposit intensity, permits Jhect comparison with deposits on other surface*, for example, graphite. To cakv>ate the fraction p. inventory mat deposits on a rartkjlar kind of surface, the relative deposit mtensi'.y should be multiplied by the fraction of MSRE surface represented by the deposit. The metal surface was 26% of the total MSRE surface.
The most strongly deposited nuclides were ' " S b and 1 , T T c . with most values above I, indicative of a selective strong deposition. The variation in values from surface to surface suggests that generalizing any value to represent all metal surfaces wil probably not be very accurate- Abo. no values are available for certain targe areas - in particular, the reactor vessel surfaces. In spite of all their caveats, the data here for tellurium and antimony are r^uUtent with similar data from the various surveillance specimens in indicating that theie
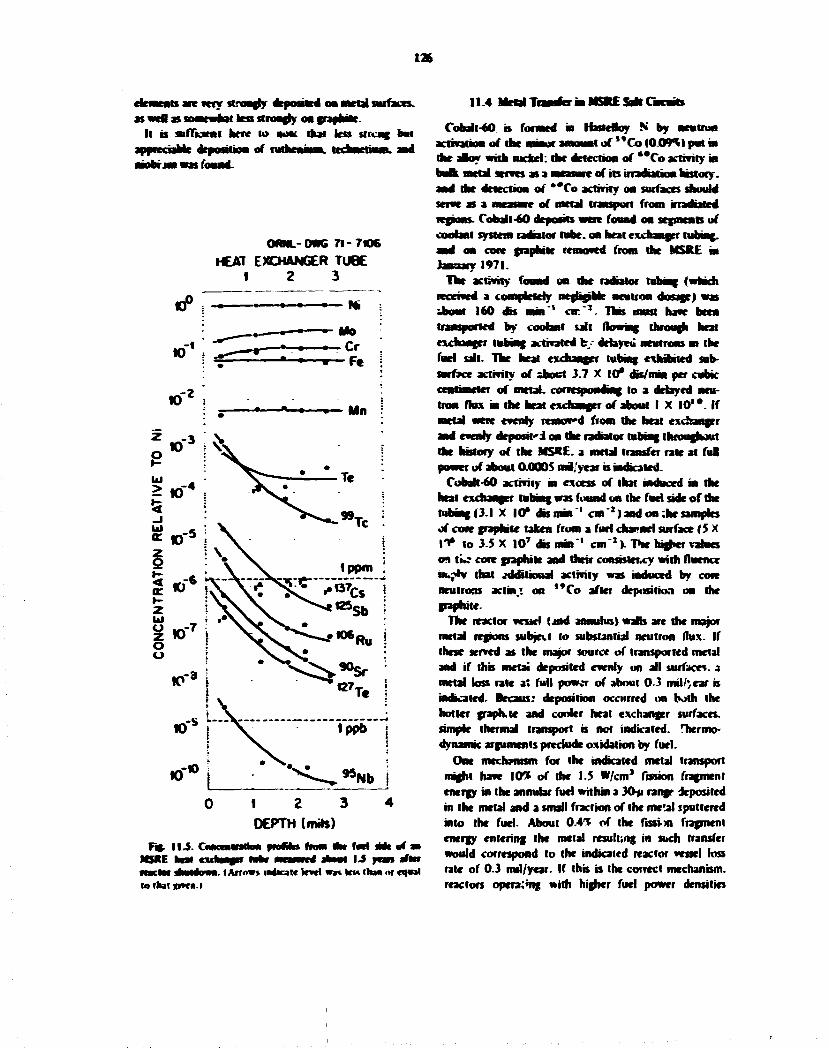
12ft
elements are very strongly deposited on metal surfaces, as wen" as some •hat less strongly on graphite.
It is suflkienl here to note thai less strcug but SppCCCSpblC Q C M H M K W Oi rotnttMMHL tcdHKtHMB* J M
OfML-0«G 71-7106 HEAT EXCHANGER TUBE
I 2 3
0 1 2 3 4 DEPTH (mils)
Fig- 114. CoaccittntiQft wonws from the fori nut of an MSRE heal excfcmgrr tot* mrmmrd aknot 13 yon ater m c M matovwH. f Arfowi iMicalc tort w» k » item «t ««val la (Mai given. >
114 lurtat Transfer m l61r£Sa fc r> r« *s
Cobaii-60 is formed in HasteHoy N by neutron activation of the minor amount of " C o ( O J O P I I pot in the ahoy with mcfcel: me detection of * *Co activity in baft metal serves as a measnrc of its irradiation history, and die detection of * # C o activity on surfaces should serve as a measure of metal transport from irradiated regions- Cobalt-60 deposits were found on segments of coolant system radiator rube, on heat exchanger tubing, and on cow graphite removed from the MSRE in Janaary 1971.
The activity found on the radiator tubing (which received a completely negligible neutron dosage) was ^bottt 160 dts mm'* cnT* . Tins must have been transported by coolant salt flowing through heat exchanger tubing activated b detayeii neutrons m the fuel salt. The heat exchanger tubing exhmited subsurface activity of short 3.7 X 10* drt/mm per cubic centimeter of metal, corresponding to a delayed neutron flux in the heat exchanger of about I X 1 0 ' * . I f metal were evenly removed from the heat exchanger and evenly deposM*d on the radiator tubing throughout the history of the MSKE. a metal transfer rate at fu l power of about 0.0005 mi/year is indicated.
Cobalt-60 activity in excess of thai induced in the heat exchanger tubing was found on the fuel side of the tubing (3.1 X 10* d b m n T 1 cm * ) and on :he samples of cow graphite taken from a furl channel surface (5 X I * to 3.S X I 0 T db mm" 1 cm H T V higher values on tu; core graphite and their consistency with fluence uuyhr that additional activity was induced by cow neutrons actm.t on **Co after deposition on the graphite.
The reactor vessel (jnd annulus) wafts are the major metal regions subject to substantial neutron (lux. If these served as the major source of transported metal and if this metai deposited evenly on all surfaces, a metal loss rate at full power of about 0.3 mil/', ear is indicated. Becaus; deposition occurred on both the hotter graph, te and cooler heat exchanger surfaces, simple thermal transport is not indicated. Itermo-dynamic arguments preclude oxidation by fuel.
One mechanism for the indicated metal transport night have 10% of the I.S W/cm J fission fragment energy in the annular fuel within a 30«i range deposited in the metal and a small fraction of the metal sputtered into the fuel. About 0.47 of the fissi-wi fragment energy entering the metal resulting in such transfer would correspond to the indicated reactor vessel loss rate of 0.3 nut/year. If this is the correct mechanism, reactors opera:*ng with higher fuel power densities
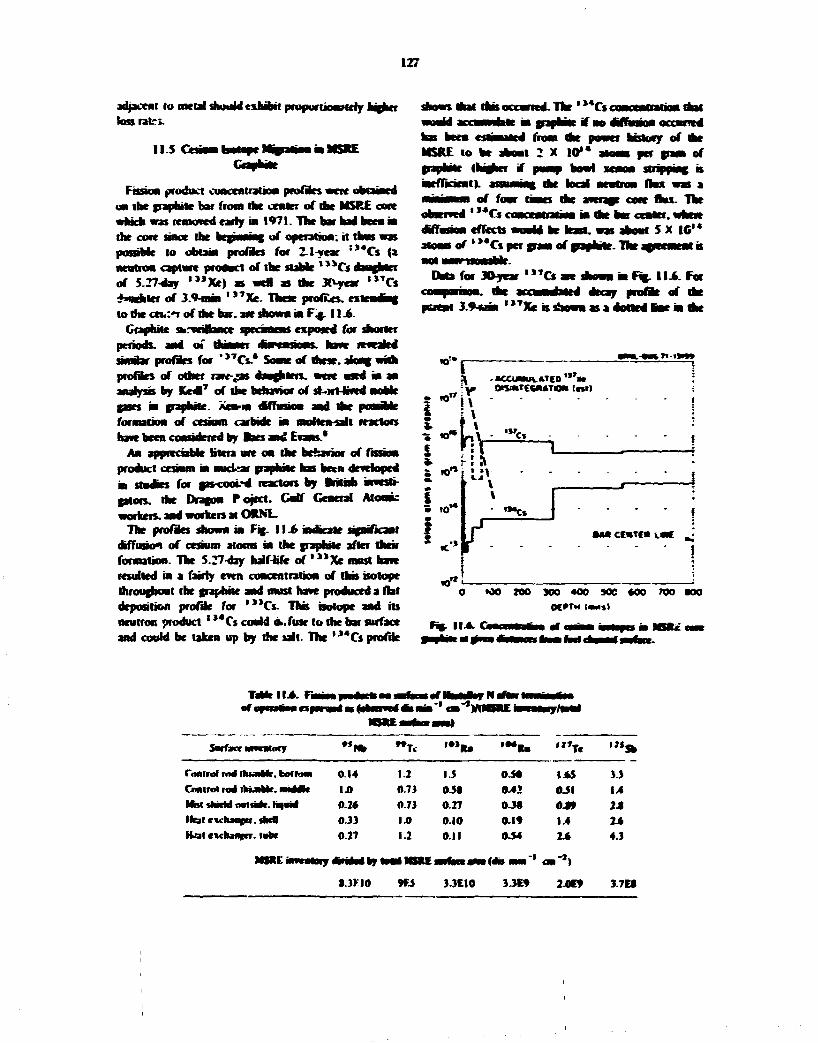
127
adjacent to metal should exhibit proportionately hither loss rates.
11.5
Fission product concentration profiles were obtained on the graphite bar from the crater of the MSRE cove which was removed early ia 1971. The bar had been in the core since the beginning of operation: it tbas was possible to obtain profits for 2.1-year ! , * C s (a neutron capture product of the stable , s > C s daughter of 5.27-day ' " X e ) s a d a da 3fWear *"Cs ^HMhter of 3.9~mm , , 7 X e . These profits, exteanmg to the ceu:*r of the bar. are showa ia F^. 11.6-
Graphite sarveiibnce ipn.imtB> exposed for shorter periods* aad oi thaaatr dm easuius. have revealed smubr profies for , , T C s . * Some of these, along with profiles of other rare-.9s daughters, were used m aa analysis by K e * T of the behavior of sr-ort-tived i gases ia graphite. Xca-a. dtffusioa aad the formatam of cesium carbide ia molten-salt reactors have been considered by Bats ane Evans.
Aa appreciable bitera arc oa the behavior of fiitaja product cesium in nuclrar tjapmte has been developed in studies for gas-cooi-d reactors by British investigators, the Dragon Poject. Catf General Atomic workers, and workers at ORNL.
The profies shown in Fig. 11 Jb indicate significant diffusion of cesium atoms in the f apbitc after their formation. The 5274ay halttitc of * " X e mast have resulted in a fairly even concentration of dm isotope throughout the graphite and must have produced a flat deposition profile for ' "Cs . This isotope and its neutron product ' **C$ could u>.fuar to the bar surface and couM be taken up by the salt. The ' **Cs profile
shows mat this ocewned. TW ' **Cs concentration that would accumulate m graphite if no daTrusioa octured has been tjtiuuml from the power history of the htSRE to be about 2 X 10** atoms per gram of araphitt (higher if pump bowl xeaoa Jt.n^puu, is meflncat). imiming the local aewtroa fhn was a
of four times the average core flax. The
daTasna effects would be least, was aboat 5 X 10'* atoms of ' »*Cs per gram of graph.*. The.
Data for JOycar *"Cs compamoa. the pueat 3.9-wm " T X e is
mFjg.IIA.For profit of the
asa
• 0 O 2 O O 3 0 O 4 O 0 M 0 M O W I O O OC'TM I M I I
Fig. 114. riiiiaaiwjn of <
TaMrll ja. fin* ewaa sarimaumi rNatautena ofoptnwaMcxmr wnfattJl 4 daw m * cm^mKLmmm •vy/ttmf
nBtts**. aauat
Swfccr w*»Wocy "t+ W T < tnK* • • • « - ' " T « ' " $ »
Comrol rnrf ihi.ullfc. battum 0.14 1.2 I J 040 IAS 3.3 Control rod ikwnWr. H M M C 1.0 0.73 0-5t 0 *2 0.51 14 M M dwcM ovf «•#>. KqvMt 0.3a 0.73 0.27 0.39 0J« 2J Meal evclttacn. mat 0.33 U> 0.10 0.19 M 1 * Hal «xchj«ie»T. fat* 0.17 12 0.11 OS* Vk 4.3
MSRE MSRE ><*» m m '
S.3KI0 9Ci 3.3EI0 3.3» 2JBK9 3.7ES
l a
upper left of the figure. Tins was estimated uiuimtg that perfect strippinf ottntied in the pump fcjwl with a nass transfer coefficient from salt to central core ejruihnr of OJ ft/hr* and a diffusion coefficient of xenon in papM* (10% porosity) of I X 10** csn*/sec.,#
Near the surface the observed ' " C s profile is lower won the estanated deposition profile: ••word the center Ihc ubsuv i profne '.apers downward cut is about the es mated deposition ptofue. This pattern should develop if dtftusioo of cesKim occurred- The centra! ranee ntniion n about one-third of chat crar die surface. Steady diffusion into a cylinder" from a cocuaut surface scarce to yield a simnar ratio requires ttntDr/r1 ( K a b m r a u Foracyfcnderof2cmradns and a salt emanation tune of 21,781 hr. a cesium uWuswa coefficient of about 7 X I0~* em'/sec is
mjcoofcd reactor systems'2 at nnwiiJinn i uflOOiu UOBTC nary be extrapolated to 650*C tor coamarBon. The dnTunon coefficient diereby obtained is sSghtty heww I0"» • ; the diffusion coefficient for a gas (xenon) is about • '-' 10~* cm1/sec. .Vane form of surface
substantiated by the sorption behavior rtoored by ham 11 ' ' foe the ujjum nuthn-ftraphin system.
oftOOtoI 00*Canduwtenwatiu«ofOJ04tolj6mf
jrapmar fonows a Fic^nunch twtherm (1.6 anj of cesium on I m 1 of graphite surface correipoudi to the sntmatkin surface <xmpuaud CsC,). Below das. a L—emni isotherm is innuatrd. hi the MSRE graedmc under c nsidenrir* the " T &content was about 10'* atoms rer grar.i of ssacdme. and the 133 and 135 chains would pronds simnar amuunti. tojuwjfcnt to a total content of 0-007 mg of cesium per gram of fjrapnite. At 650*C. in the absence of mvtrtcrewce from odar adsorbed species. Langmuir adsorption to dus conceutratiov should occur at a cesium partial pressure of about 2 X 1 0 ' " atm. At this presnie. cesium transport via the gas phase should be negngdde. and a*rf»c? phenomena should control.
To some extent. ruMdmm, slionthim, and barium atoms abo are mutated to be mralatr) assorted and bnefy todrffme m graphite.
It thus appears that for time periods of the order of a year or more the amah" and alkaline earth daughters of noble gates which get into «te graphite can be expected to exMbit appreciable migration a the moderator graphite of molten-sal: .eactors.
114 Nabfc Mead Fmaan Tnaaj lit Model
It was noted clstwhcre14 that noble metab in MSRE salt samples acted as if they were particulate constituents of a mobie "poof" of such substances held up in the system for a suhstantjzl period and that evidence wginhng this might be tint am J from the activity ratio of pairs.,-" isotopes.
Pairs of die same element, diereby having die same chemical behavkr (e.g.. ' " R u and ' " R a ) . should be particularly effct tivc. As produced, die activity ratio of such a pair is proportional to ratios of fission yields and decay constants. Accumulation over die operating history yields die inventory raio. ultimately proportional (at constant fission rate) only to die ratio of fission yields. If. however, there is an iatenaediatt holdup and ttkvr. uefore final deposition, die activity ratio of die retained material wal depend on holdap time and wai fal between production and inventory values. Funhcrmoie. die material deposited after such a ibldup wnl. as a result, have ratio valuer lower than inventory (Values for rhe iso:ope of shorter half-life, here ' " K M . wiR be used in die nuvcator of the ratio DNXUghowt our discussion ) Convqugndy. company n of an observed ratiu of activioVs (in die same sample) with associaled production and inventory ratios should provide an indication of die "accumulation history" of the rerkm represented by die sample. Since bom determinations are for isotopes of die same element in die same sample (consequently subjected to identical treatmert). many sampling and handling errors cancel and do not affect die ratio. Ratio values are diereby subject to less variation.
We hare wed oV , # 1 R u / , , * R u activity ratio, among odiers. to examine sample j of various lands taken at various times in the MSRE operation. These mdude salt and gas samples from die pump bowl and od*n materials briefly exposed diere at various times.
Data are also avaiabk from the sets M surveilance ipeumtns removed from nms I I . 14. 18. and 20. Materials re noted from the off-gas line after runs 14 and 18 offer useful data. Some information is avari-abk1 * from the on-site gamma spectrometer surveys of the MSRE following roits 18 and 19. particularly with regard to the heat exchanger and off-gas line.
414.1 Inventory and model. The data wnl be discussed m terms of a "compartment" model, whkh will assign Tint-order transfer rates common for both isotopes between given repjr.s and wil assume that this behavior was consistent throughout MSRE history. Because die half-lives of " * R u and " ' R u are quite different. 39.6 and 367 days, respectively, appreciably

129
different isotope activity ratios are .ndicaied for different compartments and times as smvJaied operation proceeds. A sketch of a useful *hm* of compartments b shown m Fig. I {.7.
We assume direct production o f ' * J R u and ! * * R u in D V luet salt m proportion to fisskm rale and fuel cotmmitioH as jetenmned by MSRE history. The material is fairly raptdry lost from salt etihcr to "surfaces" or to a mobaV "particulate pool" of aechNa-erated Material. The pod loses material to one or mure final reposiiories. nominally "off-fas." and also may deposit material as *he "surfaces."* Rates are such *s to mul t in an appreciable holdup period of oV order of 50 to 100 days in the ""particulate pool." Decay, of course, occurs in aH compartmcnts-
Material is abo transferred lo me "drain tank" as ntojuircd by the history, and transport between compartments ceases in die interval.
From * e atoms of each type at a given time m a i cc«npartment. the activity ratio can be calculated,
t an overal ar—wtory ratio. We shal identify samples cafcvn from dnTerent repcas
of the MSRE with dte various cormarnvents and Ami obtain insight into me transport pains and lags kadntf to Ae iamphd iccjon. It Jionld be noted mat a compartment can involve more dun ope legion or kind of sample. The additional information itmmvd to establish the amounts of material to be uujgntd to a S"*en regkm. and thereby to produce a materul I
In comparison with the overall inventory value of ' • , R u / " * R u . we should expect -surface*" values to equal it if die deposited material comes rapidry and only from "salt" and to be somewhat below it if. in addition, "particulate'* is deposited. I f there is no direct iepoatiun from "salt" to "surface." but only "particu-lJe ." then deposited material should approach "off-gas" compartment ratio.
The "off-gas" compartment ratio should be below mventory. since it is assumed to be suaowy deposited from die "particulate pool." which is richer in afcc long lived ' * * R u component r*taa inventory is aVe accumulation of decay.
Tue particulate pool a n be xbeve mventory if : is transferred to rt rapvaV and lost from it at a i t rate. Slow lorn rates corrcipond lo hang
> periods, and ratio values tend toward ieveniory. DuTerential eunations awohjiug
and decay of , M R u and ' " R a at respect to mese compartments mne incorporated
• t o a fauna-order Range Kutta nmnerkal integration scheme which was operated over t i e M MSRE power hstory.
The rates used in c»- .akalatiua ptferrcd to in nW duewnion below mow rapid lorn ( les i o n one day) fnv» sdt to particulates and surface. wnJi a toM 4%
: dnertty to surface. Holdup m me particulate pool i m % daiy transport of about 2 * per day j f me lo "off-gas.** for an effective
m-fsws
riSSKM SAI.T
»4 stances
J TT Lf^3
fe Li «urr.cu.ATE orr-c«s iano omen saws)
ron M a r c u s
Ot) 0**01 TANKS tanoMCCLi
EfiJ53
L { K C * V ) U|nica.vl
(ALL m«ns^o*T ceases Outwv* pcmoo rmrr SALT IS ORamto mom STSTCHI
Pig.li.?.

130
period of about 4$ days. AH transport processes are assumed irreversible in dm scheme.
1142 Off-fas iae dtp—Hi. Data a-ere reported in Sect 10 on die examination after run 14 (March 196*) of the jumper line installed after run 9 (Drvember 1966). on the .-xammaoon after run IK (June 19*9) of parts of a spximen holder assembly from die main cff-gas line iutaled after run 14. and on die examination of puts of line 523. uVr fuel punm overflow tank purge g» outlet to die mam off-pa lint, which was instated during ordinal fabrication of MSRE. These data are shown in Table 11.7.
For AW jumper hue removed after ran 14. observed ratios range from 2.4 to 7J. By comparison me inventory ratio for the net exposure interval was 12.1. If a hnldup period of about 45 days prior to deposition in die off-gas line is assumed, we calculate a lower ratio for die compartment of 7.0. It seems indkated dot a ho!dupofrudwmmiof45daysormorebreauirrd.
Ratio values from die jptumin holder removed I rem me 522 hue after run IS ranged between 9.7 and SM Net inventory ratio for the period was 19.7. and for material deposited after a 45nfay holdup, we estimated a ratio of 17J. A tamer holdup would reduce mis estimate. However, we recaf dial gas Dow uvrough dns one was appreciably dmmnshed during die final month of ran It. Thi, would cause dse observed ratio vjjuu to be lower by an appreciable factor than would ensue from steady gas flow al die time. A holdup period of something over 45 days sol appears indkated.
Flow of off-fas through Sue 523 was less wel known. In addition to bubbler p s to me awe salt «cpth m me overflow tank, pan of die mam off-fas I W from die
bowl went dtrough nte overflow tank when flow line 522 was hindered by deposits. The
observed ratio aflei run ISwasSto 13-7. inventory was 9A. and for atatenal deposited after 45 days holdup die ratio ii cakutated to be 5.8. However, the unusudry peat flow durmg nW final moadi of ran IS (unti Mockage of hue 523 on May 25) would increase die objerved ratio cuisnJerabh/. This response isconsistenr
the low value for material from line 522 cited
holdup period prior to deposit*** m off-fas regions
11-6J Sarvesmmce nveemvam. Si^vedbncc specimens of graphite and abo selected srgments of metal were removed from die core sumdtancc aumujbfy after txponm throughout sever*! runs. Table 11.8 shor* valnes of the activit* ratios for >**W*H* for a number of graphite and metal specimens removed on different occasions -n |%7. 1968. and 1969. Insofar as
deposition of these isotopes occurred irreversibry and with reasonable directness soon after fission, die ratio values should agree widi die net inventory for die period of exposure, and the samples dial had been exposed longest at a given n&z** time shou!d have appropriately lower values for die '• ,Ru/'~*Ru activity ratio.
Examination of Table 11.8 shows dial dus tatter view b confirmed- the otter samcilti -*-o have values dtat are lower, to about ore right extent, rt-vwever. we abo note that most observed ratio values fan somewhat below the net inventory values. This could come about if. in addition to direct deposition from salt onto surfaces, deposition abo occurred from the holdup "Hoot." presumed coloidai or paniculate, which was mentioned m die drsrusnon of die off?ss deposits. Few of tJr
labjes fal below the parenthesized off-ga This value was catenated to result if aB the
deposited material had come from the holdup pooL
11.7. na •VMM
, 1 1 ) Km
-Km
Samvtr
1. J inui iSerww i « f U » » S 2 2 . l l v n i i i l I n * t w * j M W » M l t a c n Z S . l v M
Mrxinai 2.4 ^ r P h U v t t i M * 5» I VMfcaw b v r 2.4 Nrt imtmvtt 12.1 DmnMiCinkinc 4.1 » 4 laktdvn* - . J \ci4*fom f ( X i i k i J M 4 4 *f-**r twMvy T.n
J V. WMovfcaMv? 5 5
If. SucaMrnlM unci. U m 522. E'tiMmu *wnna l « M M t J u n r l v M
U M i T i V.T "< ^ f W O f m w K 43 tbke 5 0 \ * t W W I I I W ) IV.7 TvhrwclWm* 5.4.5 v » ,
RcrnwM ' 70. can * . : Net wruiwit if: 45-*w iMMtof i r >
-> V i M g fcjiwjp v.3
tH . Q»vT<Wv>Tjv*Off-CMiUnrl52J>.Ci>ii i i Iv t5 f v J u u e l * * *
>i r Vjhc V523 * n MvmfOIT V.fc I me 523 11.3. 13.7. I3.J VJVJV HTV 523 13.3.12 5. 100 < Mel wttwut it:
45-dtey fcoHvj 5 J
> v r - * y » o W v » 4.3
"Contttc* to mm of W MC"'l lf-rf.milwhreu " • * rt"t fuel, wilwlwn l.\i of » < i
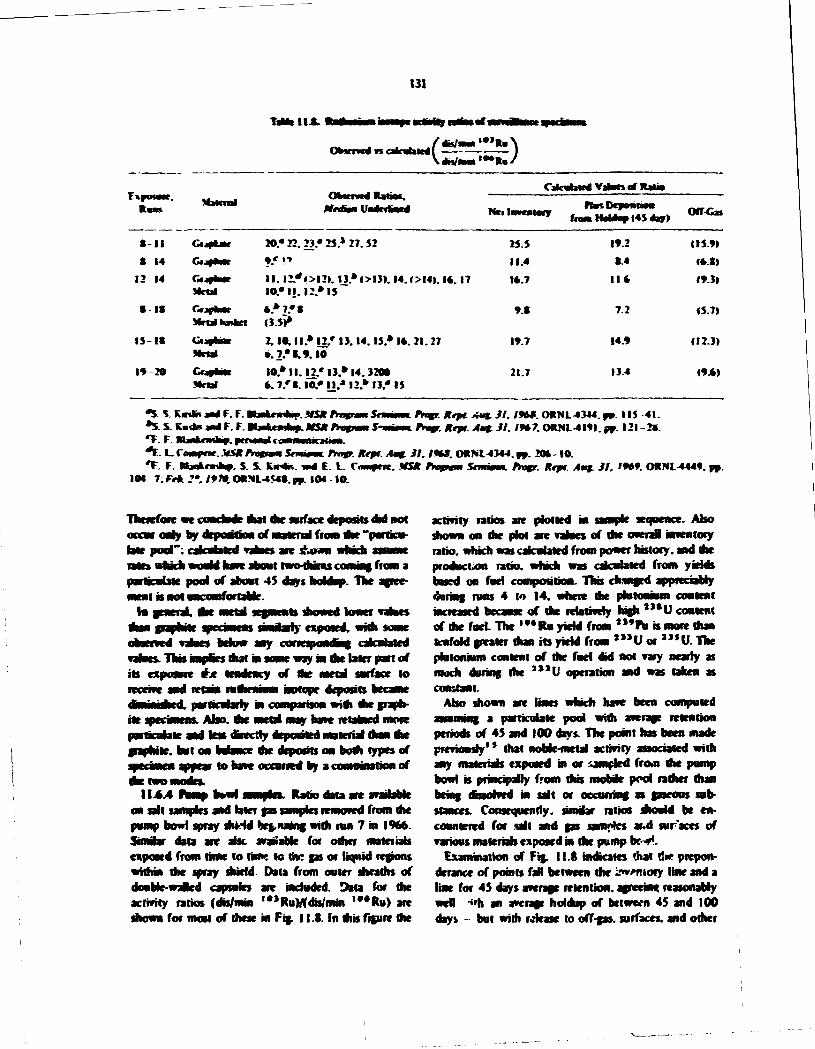
131
Tatar 1 I J . * • * •
0 - 1 0
15 I t
I* 20 GnawiK Jienl
Otnrrw4 w* cainfaMO W-«'*»K. /
Jfewial
CfjftMC
CfjfkNr
Mrtal
CWjfPtMr Mraiknkn
OOfcnnO Ratios* M*diaH Ufl4tf0M0
CalcvbwO Vahm of Rati*
Net Inventory i<45 4>?>
OrrCas
20.« 22. 2 3 " 25.* 27. $2
11 . I2*«>I2) . I3.*t>13>. I 4 . 0 1 4 ) . 14.17 10." U . 12.* IS * .*7.«0 <3.5»»
2.10. II.* 12* 1J. 14.15.* I*. 21.27 •.2.*».».io 10.* II. ! 2 . ' 13.* M. 3200 0. 7 . ' t . I0.« U* 12.* 1 3 / 15
25.5
11.4
10.7
9.0
19.7
21.7
19.2 0.4
110
7.2
14.0
13.4
115.9) <*.*) <9.3|
15.7)
112.3)
<9J0>
*S. V Kmfr and F. F. Whmktm^m. HSK tropwrn Stmmmi flwt* Kept. Aug. SI. I9*t. O0NL-»M4. pp. 115 41. *5. S. Kmtn ami F. F. 01 jufcrmlf. SfSt thagnmS-nmm. fV»»y. Kept Amf. SI. f9»7 .0*m-4l9 | . s*> . 121-20.
*f.\..i:omr€n.J4SKrrafmmSeimmm. rmgr. Kept. Amg. SI. I«M. OHNL-4344.pp. 200-10. T. F. Kk*krm)mm. S. S. K«4n. W E. L. Cnwr-m. V H A***** Srmmm. Tn&. Kept. Amf. SI. 'M9. ORNL-4444. pp.
IM J . f t k 2*. 1979. ORML-(540.pp. 104 10.
Theicforc occur only fey la * pool'
sorface deposits dwl not of material from I
re shown have abort two^hiras coming front a
partjenute pool of about 45 days holdup. The I is m
In general, owe metal
its This
exposure
stoned loncf' exposed, trim some
any turnipunoaoj calculated mat in some way m OV later part of
of the metal surface to ejt tendency
rte particularly in lumpjiiion widi the graph-
Also, die metal may have retained more and less dnecwy deposited material than die
hot on balance the deposits on both types of to have occurred by a computation of
H J M ftvmp tnwl stmnoes. Ratio data are available on salt samples and later gas samples removed from die pomp bowl spray shHd hennaing nidi ran 7 in 1966. Sirniar data are abc available for other rmteiiab exposed from time to time to the p s or liquid regions within the spray shield. Data from outer sheaths of doubfc-waRed capsules are included. Dau for die activity ratios (dWnwn l # ,Ru)rtdis/min , # # R u ) are shown for most of these in Fig. 11.8. In dm figure the
activity ratios are plotted in sample sequence. Abo shown on die plot arc values of the overaR inventory ratio, which was catenated front power history, and die production ratio, which was calculated from yields based on fuel composition. This changed appreciably daring runs 4 to 14. where die pmtonmm content increased became of the relatively high " * U content of die fnel. The ' " R v yield from *"Pu is more dun tenfold greater dtan to yield from * " U or " * U . The pkuonwm content of die fuel did not vary nearly as much daring the " * U operation and was taken as constant.
Abo shown arc lines which have been computed assuming a particulate pool with average retention periods of 45 and 100 days. The point has been made previously1 * dial noMc-metal activity associated with any materiab exposed in or '.articled from die pomp bowl is principally from dm mobile pool radter dian being dbsobed in salt or occurring as gaseous sab-stances. Consequently, similar ratios should be encountered for salt and gas samples ar.d sur'aces of various materiab exposed in die pump to*!.
Examination of Fig, 11.8 mdkaics that t* preponderance of points fad between die iiwruory line and a line for 45 days average retention, agrccmc reasonably well ->'h an average holdup of between 45 and 100 days - - but with release to off-gas. surfaces, and other

132
' ' i i i i i i i i i l l i i i i i i i i i i i i i i i i ! I i i i I I i i i ; i n * i 1 •2 •• 70 • 77 4« V SI •» K 20 4J t f H V " 2 7 «T M 2 « "4 i» 2* 4* t t j i» •» 2J »• M *> 42 . « j4 H M «7 « "X f» * • » 1
1 12 27 '7 4» SO »2 * • • 2* K « * 20 42 »* 4 • O 22 3J 4 « •* 2> 42 f » M « 20 24 2*C W 4t 44 4 ' W »T S» MC »C •<, t • '7 MW1C M H « iw OvC* « M
» » * * » . • * 'J
• W 4 HIM 4 M *m« >r nun '»
M M W t
•Wti» %M
F f e . l l . *
I

BLANK PAGE
* * « * » * ^ ^ 8 ^ ^
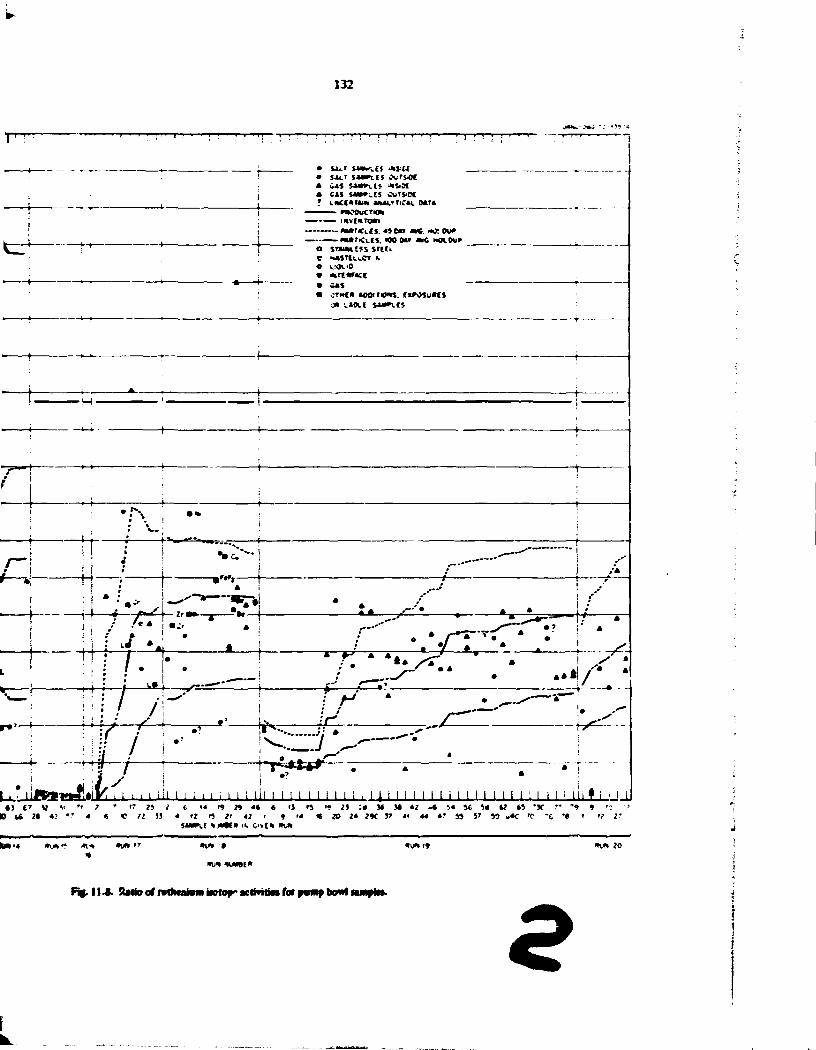
*
132
" I * • ! f ' M T-
tr r-
' ' T • I I f
SiLT I H T t E ! 0«t$iOf
U S S4»»LCS CuTS.DC lac iaMut I M I ' T I C I L M »
— PWCOuCM*
— marci.es. 4 » e » « * MO:OU* — mariCLts. * » o u *<c NOXOU* snwttf 5S STICL naSTtLiCT *
* retrace 1*5 CT»e« »OOitO««. CVOSuKS JH t » X { S44»US
— r — — t . . i • » ' » —i
r-x -+*w
S c .
"•'"»- /*
-«5 y r *^ i r—~
i—li -H-
_l -41
77 r
-1—i . .y . */ ». * . <r_
- ) — • = -£—•?
/
r-r^ ^ - _»'.
/ 1 -
liiaam&K
/ —
-Iv^
T' •I i L i I i l l I 1 i 1 i i 'I i i i i i • i f i n i i i i i i i i i i i i i ', i i i i i l i t i i i
• i I T v v " ? 7 '7 J J i o i4 "> n *t t *i n •• 23 ; • M M 4z ( « » ! . > < ' < * « 7> SI 4 f2 4 2f «2 « * 14 « » J * 1*C J7 41 44
S4M»v.C »*«•€• it. ( i v ( « HUH
14 »« 54 t? *5 -JC ?* ' » » ••-• .' 4 ' » 57 » V 4C 'C ' 0 *» ' '? I'
• '4 «J«tf 41-* 4UN '7 »U» » *U« '9 4u« JO
Fif.11.8. !Ulioof nillMawfniKrlo^'tcliTitiMfotpampbowlMmpltt. e
133
regions resulting is a limited retention radier than the unlimited retention implied by an inventory value.
Although meaningful differences doubtless exist between different kinds of samples taken from die pump bowl, their similarity clearly indicates that all are taken from die same mobile pool, which loses material, but slowly enough to have an average retention period of several months.
Duruaion. The data presented above represent practically all die ratio data available for MSRE samples. The data based or* gamma spectrometer surveys of various reactor regions, particularly after runs 18 and '9. have not beet* examined in detail but in cursory views appear not too inconsistent with values given here.
It appears possible to summarize our findings about fission product ruthenium in diis way:
The off-gas deposits appear to have resulted from die fairly steady accumulation of material which had been retained elsewhere for periods of die order of several months prior to deposition.
The deposits on surfaces also appear to have contained material retained elsewhere prior to deposition, diough not to quite die same extent, so that an appreciable part could have been deposited soon after fission.
All materials taken from die pump bowl contain ruthenium isotopes with a commor attribute: they are representative of an accumulation of several months. Thus all samples from the pump bowi presumably get their ruthenium from a common source.
Since it is reasonable to expect fission products to enter salt first as ions or atoms, presumably these rapidly deposit on surfaces or are agglomerateJ. The agglomerated material is not dissolved in salt but is fairly well dispersed and may deposit on surfaces to some extent. It is believed that regions associated with the pump bowl die liquid surface, including bubbles, die shed roof, mist shield, and overflow tank • are effective in accumulating this agglomerated material. Regions with highest ratio of salt surface to salt mas« (gas samples containing mist and surfaces exposed to the gas-liquid interface) have been found to have the highest quantities of these isotopes relative to the amount o> salt in the sample. So the agglomerate seeks the surfaces. Since the subsurface salt samples, however, never show amounts of ruthenium in excess of inventory, it would appear that material entrained, possibly with bubbles, is fairly well dispersed when in salt.
Loss of the agglomerated material to one or more permanent sinks at a rate of I or 2% per day is indicated. In addition to the off-gas system and to some
extent die reactor surfaces, diese sinks coukl include die overflow tank and various nooks, crannies, and crevice; if diey provided for a reasonably steady irreversible loss.
Widicut additional information die ratio raedi-*d cannot indicate how much material follows a particular padi to a particular sink, but it does serve tc indicate die padis and rhe transport lags along ttiern for die isotopes under consideration.
References
1. E. L. Compere and E. G. Bohlmartn. "Exzmu»jtion of Deposits from die Mist Shield it> the MSRE Fuel Pump Bowl," MSR Program. Semimnu. Prat- R*P- Feb. 28.1971. pp. 76-85
2. A. Houtzeel. private communication. 3. P. N. Haubenrekh. A Renew of Production and
Observed DLiribiikm of Tritium in the MSRE in the Light of Recent Findings. ORNL-CF-71-8-34 (Aug. 23, 1971). (internal document - No further dissemination authorized.)
4. R- B. Briggs, Tritium in Molten Salt Reactors." Reactor Technol. 14.335 42 (Winter 1971 -1972).
5. H. E. McCoy and B. McH»bb. In tergnrtulor Crock ing of INOR-8 in the MSRE. ORNL-4829 (November 1972).
6. 3. S. Kir'lis et al.. "Concentration Profiles of Fission Product- in Graphite," MSR Program Semianmt. Progr. Rep. Aue. 31. 1970. ORNL-4622, pp. 69-70: Feb. 28.1970. ORNL-4548. pp. 104 S.Feb. 28.1967. ORNL-4119. pp. l2S~2S:Aug. SI. 1966. ORNL-4037. pp. 180 84; D. h. Cuneo et al.. "Fission Product Profiles in Three MSR.C- Graphite Surveillance Specimens." MSR Program S'miannu. Progr. Rep. Aug. 31. 1968. ORNL-4344. pp. 1*2. 144-47; Feb. 29. 1968. ORNL-4254. pp. 116.118-22.
7. R. J. Kedl. A Model for Computing the Migration of Very Short Lived Noble Gases into MSRE Graphite, ORNL-TM-lfclOfJuly 1967).
8. C. F. Bacs. Jr.. and R. B. Evans III, MSR Program Semiennu. Progr. Rep. Aug. 31.1966. ORNL-4037. pp. 158 65. 9. R. B. Briggs. "Estimate of the Afterneat by Decay
of Noble Metals in MSBR and Cointarisjn with Data fron the MSRE." MSR-68-138 (Nov. 4, 1968). (Internal document - No further dissemination authorized.)
tO. R. B. Evans 111. J. L. Rutherford, and A. P. Malinauskas. Gas Transport in MSRE Moderator Graphite. II. Effects of Impregnation. III. Variation of Flow Properties. ORNL-4389(May 1969).
II. J. Crank, p. 67 in The Mathematics of Diffusion. Oxford University Press. London. 1956.
134
12. H. J. df- Nordwall. private communication. 13. C. E. Mislead. "Sorption Characteristics of the
CesntnvGrapiuie System at Elevated Temperatures and Low Cesium Pressure." Carbon (Oxford) 7. 199-200 (1969L
14. E. L Compere and E. C. Bohlmaan. MSR Propam Semkmnu. hoar. Rep. Feb. 28. 1970. ORNL-
4548. pp. 111-18; see aho Sect. 6. this report, cspeciaty Fig. 6.S.
IS. A. Houtzeel and F. F. Oyer. A Study of Task* hvducts m Ike Molten Salt Reactor Experiment by Gamma Spectrometry. C INL-TM-315I (August 1972).
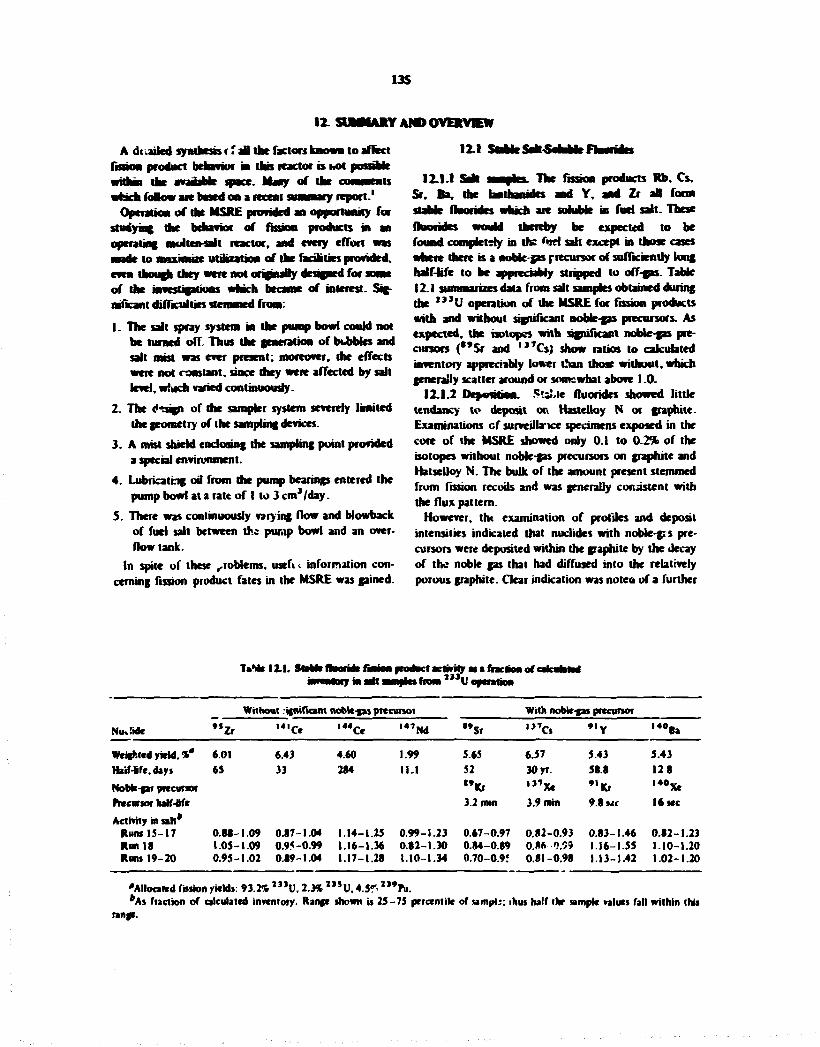
13S
12. SUMMARY AMD OVERVIEW
A dt .ailed synthesis r f all the factors known to affect fission product behavior in this reactor is MM possible within the awadabk space. Many of the comments which follow are based on a recent summary report.1
Operation of the MSRJE provided an opportunity for studying the behavior of fission products in an operating molten-sail reactor, and every effort was made to maximize utihtation of the facilities provided, even though they were not originally designed for some of the investigations which became of interest. Significant difficulties stemmed from:
1. The salt spray system in the pump bowl could not be turned off. Thus the generation of bbbbks and salt mist was ever present; moreover, the effects were not constant, since they were affected by salt level, w!uch varied continuously.
2. The dtsign of die sampler system severely limited the geometry of the sampling devices.
3 . A mist shield enclosing the sampling point provided a special environment.
4. Lubricating oil from the pump bearings entered the pump bowl at a rate of I to 3 cm 1/day.
5. There was continuously varying flow and Mowback of fuel salt between the purap bowl and an overflow tank.
In spite of these problems, usefu information concerning fission product fates in the MSRE was gained.
12.1
12.1.1 St* samples. The fission products Rb, Cs, Sr. Ba, the lanthanides and Y, and Zr a l form stable fluorides which arc soluble in fuel salt. These fluorides would thereby be expected to be found completely in the fuel salt except in those cases where there is a nobk-gas precursor of sufficiently long half-life to be appreciably stripped to off-gas. Table 12.1 summarizes data from salt samples obtained during the X 3 > U operation of the MSRE for fission products with and without significant nook-gas precursors. As expected, the isotopes with significant noble-gas precursors (**Sr and , 3 *Cs) show ratios to calculated inventory appreciably lower than those without, which generally scatter around or somewhat above 1.0.
12.1.2 Deposition. Stable fluorides showed little tendancy to deposit on Hasteuoy N or graphite. Examinations cf surveillance specimens exposed in the core of the MSRE showed only 0.1 to 0.2% of the isotopes without nobk-gas precursors on graphite and Hatselloy N. The bulk of the amount present stemmed from fission recoils and was generally consistent with the flux pattern.
However, tht examination of profiles and deposit intensities indicated that nuclides with noMe-g;s precursors were deposited within the graphite by the decay of the noble gas that had diffused into the relatively porous graphite. Clear indication was noteo of a further
T»M» I I I . StaWe fluoride M o n inventory in nit w
product activity m a fraction of catenated Mptts from 2 , 3 U operation
Without .-ifmficant noMc-gai precursor With nook-gas precursor
NuJidc " Z r • 4 , C e , 4 4 C « , 4 7 N d M S r I J 7 C $ • ' Y , 4 0 B a
Weighted yield. %* 6.01 6.43 4.60 1.99 5.65 6.57 5.43 5.43 Hsif-flfe. days Nook-gar precursor Precursor half-lire
65 33 284 I I .1 52 " K r 3.2 mm
30 yr. " 7 X e 3.9 min
58.8
9.8 MC
128 , 4 0 X e 16 sec
Activity in salt* Runs 15 17 Run 18 Runs 19-20
0.88-1.05-0.95-
1.09 •1.09 1.02
0.87-1.04 0.95-0.99 0.89-1.04
1.14-1.25 1.16-1.36 1.17-1.28
0.99-1.23 0.82-1.30 1.10-1.34
0.67-0.84-0.70-
0.97 0.89 0.9!
0.82-0.93 0.86 O.W 0.81 -0.98
0.83-1.46 1.16-1.55 1.13-1.42
0.82-1.23 1.10-1.20 1.02-1.20
'Allocated fission yields: 93.2% 23iV, 2.3* I , , U,4.5f- " ' h i . *As fraction of calculated inventory. Range shown is 25-75 percentile or sampi:; thus half ihr sample values fall within this
range.
136
diffusion of the relatively volatile cesium isotopes, and p » My also of Rb. Sr. and Ba. after production within paplm*
12-1J Gas sanapfes. Gas samples obtamed r u m the gas space in the pump bowl mist shield were consistent with the above results for the salt-seeking isotopes with and without noble-fas precursors. Table 12.1 shows the percentages of these isotopes which were estimated to be in the pump bowl stripping gas. based on the amounts found in gas samples. Agreement with expected amounts where there were sirippaMe noble-gas precursors is satisfactory considering the mist shield, contamination problems, and other experimental difficulties. Gamma spectrometer examination of the off-gas line showed little activity due to salt-seeking isotopes without noble-gas precursors. Examinations of sections of the off-gas lire also showed cnty small amounts of these isotopes present.
12.2 Noble Metals
The so-called noble metals showed a tanializingry ubiquitous behavior in the MSRE. appearing as salt-borne, gas-borne, and metal- and graphite-penetrating species. Studies of these species included isotopes of Nb, Mo. Tc, Ru, Ag. Sb. and Te.
12.2.1 Salt-borne. The concentrations of five of the noble-metal nuclides found ir. salt samples ranged from fractions to tens of percent of inventory from sample to sample. Also, the proportionate composition of these isotopes remained relatively constant from sample to sample in spite of the widely varying amounts found. Silwf-111. which clearly would be a metal in the MSRE salt and has no volatile fluorides, followed the pattern quite well and also was consistent in the gas samples. This strongly supports the contention that we were dealing with metal species.
These results suggest the following about the noble metals in the MSRE.
1. The bulk of the noble metals remain accessible in the circulating !ucp but with widely varying amounts in circulatio I at any particular time.
2. In -pile of this wide variation in the total amount found in a particular sample, the proportional composition is relatively constant, indicating t h t the entire inventory is in substantial equilibrium with the i *w material bein^ produced.
3. The mobility of the pool of noble-metal material suggests that deposits occur as an accumulation of finely divided, well mixed material rather than as a "plate."
No satisfactory correlation of noMe-metal concentration in the salt samples and any operating parameter could be found.
In order to obtain further understanding of this particulate pool, the transport paths and lags of noMe-meial fission products in the MSRE were examined using all available data on the activity ratio of two isotopes of Ihe same element. 39.6^tay ' , J R u and 367-day ' * * R u . Data from graphite and metal surveillance specimens exposed for various periods and removed at various times, for material taken from the off-gas system, and for salt and gas samples and other materials exposed to pump bowl salt were compared with appropriate inventory ratios and with values calculated for indicated lags in a simple compartment model. This nwdel assumed ttuu salt rapidly lost ruthenium fission product fonvd in it. some to sui feces and most to a separate mobile "pool" of noble-metal fission product, presumably particulate or co.ioidal and located to an appreciable extent in pump bowl regions. Some of this "pool" material deposited on surfaces and also appears to be the source of the off-gas deposits. All materials sampled from or exposed in the pump bowl appear u receive their ruthenium activity jointly from the pool i f retained material and from more direct deposition as produced. Adequate agreement of observed data with indications of the model resulted when holdup periods of 45 to ° 0 days were assumed.
12.2.2 Niobium. Niobium is the most susceptible of the noble metals to oxidation should the U^/U** ratio be allowed to get too high. Apparently this happened at ihe start of the I J , U operation, as was indicated by a relatively sharp rise in Cr2* concentration; it was also rated that 60 to about I 0 O of the calculated " N b invc tory was present ir the salt samples. Additions of a reducing agent (beryllium metal), which inhibited the Cr 2* build jp , also lesuiled in the disappearance of the " N b Iron the salt. Subsequently the ' * N b reappeared in the salt several times for not .'ways ascertainable ' - ..runs and was caused to leave me salt by further reducing additions. As the 2 , , U operations continued, the percentage of " N b which reappeared decreased, suggesting both reversible and irrrversible sinks. The " N b data did not correlate closely with the Mo-Ru-Te data discussed, nor was there any observable correlation of its behavior with amounts found in gas samples.
12.2.3 Gas-borne. Gas samples taken from the pump bowl during the 2 , , U operation indicated concentrations of noble metals that implied that substantial percentages (30 to 100) of the noble metals being
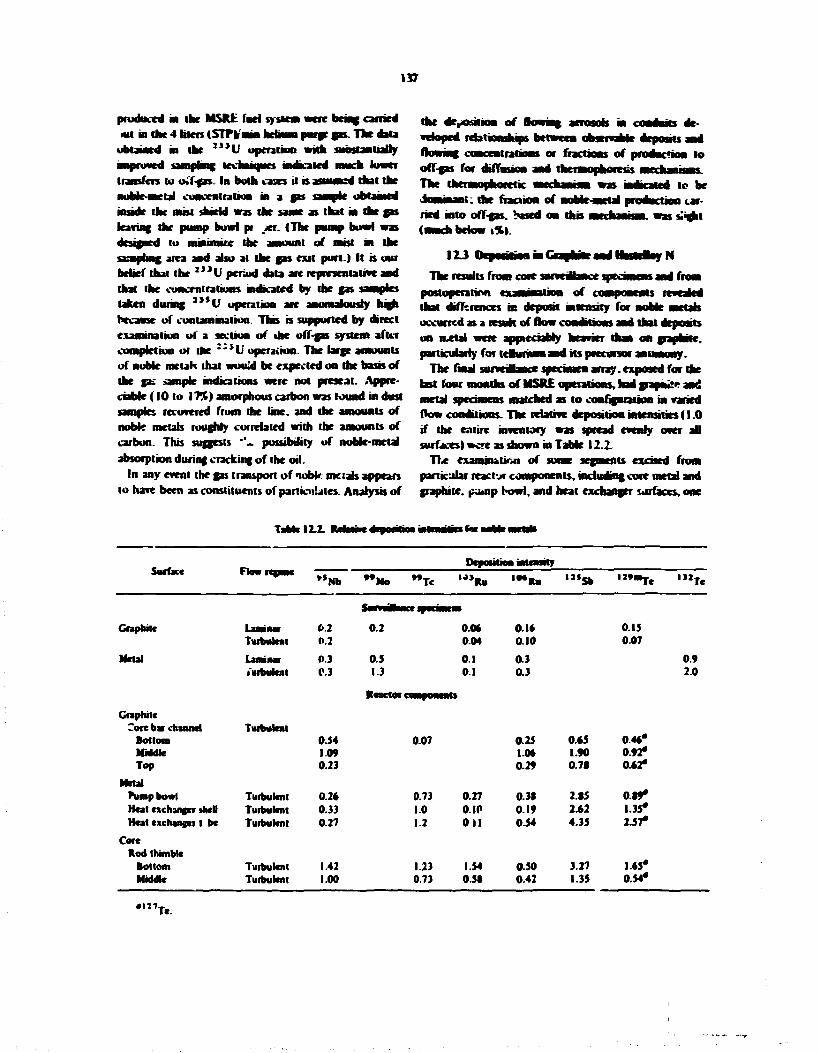
137
produced m the htSRfc fuel system were being carried •ut in the 4 titers lSTP> MM hetnun purge a s . The daU
obtained in the ZiiV operation with substantially improved iimplmg tevajuqucs indicated much lower transfers to otf-as. In both cases it is assuaud that the noMe-mctal concentration in a a s inside the mist shield was the same as that in the a s leaving the pump bowl pi jet. (The pump bowl was designed to minimize the amount of mist m the sampling area and also at the gas exit port.) It b our belief thai the " J U period dab are representative aad that the concentrations mdkated by the gas nmplri taken during " * U operation are anomalously high because of contamination. This b supported by direct examination of a section of the off-gas system after completion oi the ZZiV operation. The large amounts of noble ractah that would be expected on the basis of the gas iampie indications were not present. Appreciable (10 to 17%) amorphous carbon was found in dust samples recovered from the line, and the amounts of noble metals roughly correlated with the amounts of carbon. This suggests ''*. possibility of noble-metal absorption during cracking of the oil.
In any event the gas transport ofnobfr mctab appears to have been as constituents of particulates. Anatysbof
the deposition of vefoped relationships between observable deposits and flowing concentrations or fractions of prodacrioa to off-fas for diffusion and thermophore sis aaediantans. The thermophoretic mrrhmiim was indicated tc be
•t: the fraction of noble-metal production carried into off-os. based on this mechanism, was s!<ght (much below i%)_
I from
12.3
The results from core postoperaikMi examination that differences m deposit mtenaty for noble metab occurred as a result of flow conditions and that deposits on a*tal were appreciably heavier man on graphite, particularly for tellurium and its precursor anianony.
The final surveillance specimen array, exposed for the last four months of MSRE operations, had grapni;* and metal specimens matched as to configuration in varied flow conditions. The relative deposition intensities (1.0 if the entire inventory was spread evenly over all surfaces) were as shown in Table 12.2.
The examsn&iica of some segments excised from particular react-jr components, including core metal and graphite. pump bowl, and heal exchanger surfaces, one
I I I
Rowrcpmc Deposition intensity
Surface Rowrcpmc »*Nb " M o »»Tc w l l . »•*•. ' " » nvmr . ' " T e
Graphite laminar 0.2 0.2
K t MVftt&fJmTl
0.06 0.16 0.15 Turbulent 0.2 0.04 0.10 0.07
Metal Laminar 0.3 0.5 0.1 0.3 0.9 I'urbuknt 0.3 1.3
Reactor CmMOMItwJ
0.1 0.3 2.0
Graphite Core bar channel Turbulent
Bottom 0.54 0.07 0.25 065 0.46* Middle 1.09 1.06 1.90 0.92* Top 0.23 0.29 0.71 0.62*
Metal Pump bowl Turbulent 0.26 0.73 0.27 0.31 2.65 0.19* Heat exchanger shell Turbulent 0.33 1.0 0.IP 0.19 2.62 1.35* Heat exchanger 1 be Turbulent 0.27 1.2 O i l 0.54 4.35 2.57*
Core Rod thimble
Bottom Turbulent 1.42 1.23 1.54 0.50 3.27 1.65* Middle Turbulent 1.00 0.73 0.51 0.42 1.35 0.54*
• 127. Te.

13t
year afar ihawlowa abo revealed njii i i » » i ace—-famwa of these umiltatn The (dative deporiuoa
I2J .
intense or. urtal than on pajmHt. and for eaetai was more • H i m wader note turbufcnt flow. Surface rowfhnes had no jppauat effect.
Extension to a l the metal and paphctc area of the system would require rnnnwdgr of the effects of flow condition a each repot) and the Iracuon of total area represented by the region. (Overal. metal area was 26% of the total and fjiphiii 74% >
How effects have not been studtcd cxperinentaMy:
through salt boundary layers. dMwp> a useful franc of reference, do not in their waul forai take iMo aocowat the fonnauou. deposition, and release of fine particu-bte Wilfrid such as that mnkated to haw been present m the fad systciR. This, much more must be learned about the fates of noble metals m molten-salt reactors before their effects on various operations can be estimates rcaaory.
Although the nobk metab ate appreciably deposiied on graphite, they do not penetrate any more than the sdt-scefcing fluorides without nook-gas precursors.
The more vigorous deposition of noble-metal nuclides on Hastetoy N was indicated by postoperaiion examination to include penetration into the metal to a swfju extent. Presumably this occurred along grain-boundary cracks, a few mis deep, which had developed during extended operation, possibly because cf the deposited fission product tcturium.
12.4 lawme
The salt samples indicated considerable ' * ' I -**» not present in the fuel, the middle quartiks cf results ranging from 45 to 71% of inventory with a median of 62%. The surveillance specimens and gas samples accounted for less than 1% of the rest. The low tellurium material balances suggest the remaining ' ' ' I was pcrmanmflv amoved from the fuel as " ' T e (half-life, 25 min). Gamma spcc'romeier studies indicated the ' " I formed in contact with the fuel returned to it; thus the losses must have been to a region or regions not in contact with fuel. This strongly suggests off-gas, but the iodine and tellurium data from gas samples and examinations of off-gas components do not support such a loss pith. Thus, of the order of one-l^urth to one-third of the iodine has not been adequately accounted for.
It it ictogniacd mat. as show* m gas-coated reactor states.' ~* fission product iodine may be at partial presnares in off-fts hrhan that are too low for iodine to be food by steel surfaces at temperatures above about 4O0*C. However, various off-gas surfaces at or downstream from me jumper hne onset were below nma^wa wmnTmnmn^w^tahmnBUvf ^mmna mnadl mawmT ntva4nmf k^n sa) ^npjwwmw^'w^nmmw'
iodine deposition. Combined with low values in gas swantes. this mdkavrs hide iodine transport to off-gs.
The experience with the MSRE showec that thenrtk gates and stable fluorides behaved as cxctcied based on their dkenwsfry. The noble metal behavior and fates, however, arc stU in part a matter of conjecture. Except for "iubiuin under unusualy oxidizing conditions, it seems dear that these elements are present as metab and that their ubtquitow properties stem from that fact since metab are not wetted by, and have extremely low solsbwiues in. molten-salt reactor fuels. Unfortunately the MSRE observations probably were subuaitiially affected by the spray system, oi. cracking produ -is. and flow to and from the overflow, all of whvh were continuously changing, uncontroned variables. The iow material balance on ' ' * i makaics appreciable undetermined loss from tbt MSRIT. probably as » nobk-metai precursor (Te, Sb).
Table 123 shows the estimated distribution of the various fission products in a molten-salt reactor, based on the MSRE studies. Unfortunately the wide variance and poor material babnees for the data on nobk metals make it unrealistic to specify tneir fates more than qualitatively. As a consequence, future reactor designs must allow for encountering zppreciabk fractions of the nobk metals in all regions contacted by circulating fuel. As indicated in the tabk. continuous chemical processing and the processes finally chosen will substantially affect the fates of riany of the fission products.
Reverences 1. M. W. Rosenthal. P N. Haubenrckh. and R. B.
Briggs. The Dewehrnt,,! Status of Molten Salt Breeder Reactors. ORNl-4812 (August 1972). especially chap. 5. "Fuel and Coolant CK-n.istry." by W. R. Crimes. E. G. Bohlmann. et al.. pp. 95 173.
2. E. Hoinkis. A Review of the Adsorption of Iodine on Metal ami its Behninr m Loops, ORNL-TM-2916 (May 1970).
3. C. E. Mil<:<ad. W. E. Bell, a i l J. H. Norman. "Dcpwtiiion of iodine on Low Chromium-Alloy Steels". Nucl. AppL Technol 7.361 66 (1969).
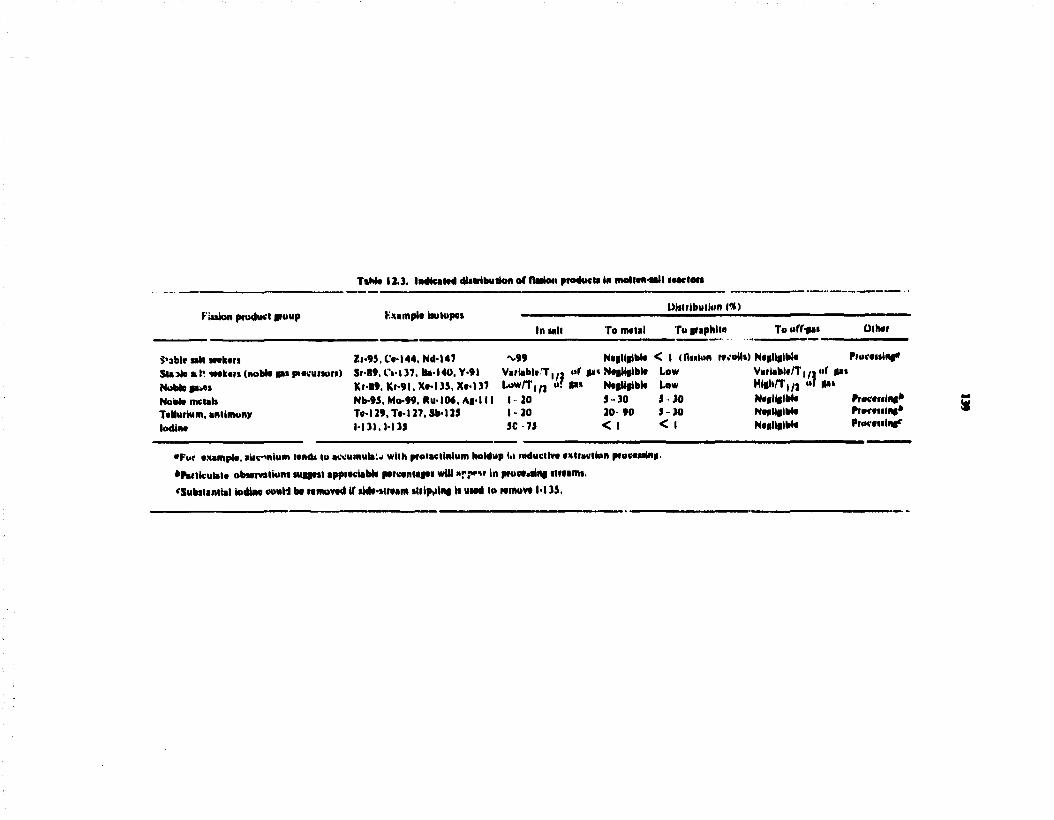
TiH* 11.3. Indicated distribution of Anion product* in molten-tall reactor*
. , Distribution (*) Fission product group Kxample Isotopes — _ _ _ _ - _ _ _ _ _ _ « _ _ _ - _ - _ - _ _ _ _ » _ - — _ _ » _ _ _ _ — - - — . - - « _ — - — -
In mil Tomeial To graphite Toofr-pai OitMr
S'aW* Mil mkwi Zr-93.Ce-l44. Nd-147 -v99 N««lisjtbl« < I (fluton recoils) N«stlt«ll>l« Proveuing* Sta>k»l> seekers (noble RBS precursors) SiW. O l 3 7 . lta-140, Y-91 Variable , T , » of «a< Negligible Low Variable/T^jof gat Noblegexs Kr-«».Ki-9I.X«.|33.XflJ? Low/T,,, of gas Negligible Low Mlgh/T ( /, «f *»> Nook metals Nb-9S. Mo-99. Piu-lOo, Ag-1 I I I 20 5-30 S JO Negligible Processing* Tellurium, antimony Tel29.Te.|27.Sb-123 1-20 20 90 S-JO Negligible Processing* Iodine 1131.1-t3S SC 73 < l < l Negligible Processing*
•Fur txample. »itcnium lend* to accumubiu wlih protactinium holdup l.i reductive extraction processing. •Particulate observations suggest appreciable percentages wUI » r ? M ' in processing sireami. 'Substantial iodine couM b» removed if tide-stream ilrip»il«« 1> uMd to remove l-l33.
140
4. P. R_ Rowbad. V. E. * > « • • » mi M. Cariyk. 5 E. L. Cuafwie. M. F. Osborne. » d H. J. drNord-BetmwrofloJmeltotopnmtt.'ik Tew+ermwrGa * * lodfar JMbjrior at «• «7CW. ORNL-TK4744 Jbarwr GXMMT Omar. D. P. Report 736 (Novtwbet (Fet^nrjr 1975). I970|L