Four helophyte species growing under salt stress: their salt of life
14
Four helophyte species growing under salt stress: their salt of life? Michiel J.M. Hootsmans * , Frank Wiegman Department of Environmental Science and Water Resources, IHE-Delft, P.O. Box 3015, 2601 DA, Delft, The Netherlands Received 26 September 1997; accepted 3 June 1998 Abstract We studied the capacity of pre-germinated seedlings of four helophyte species to develop under conditions of chronic and temporary salt stress in waterlogged sediments: Typha latifolia L., Phragmites australis (Cav.) Trin. ex Steud., Scirpus lacustris ssp. lacustris L., and Scirpus maritimus L. Salinity levels were 1:8%S and 18%S, applied constantly during four months, or for one or three weeks in otherwise freshwater conditions. The chronic salt stress treatment at 18% S led to a rapid die-off of both T. latifolia and S. lacustris ssp. lacustris. The other two species only barely survived, hardly forming new vertical shoots. At 1.8% S, the consequences were less, and limited to T. latifolia and S. lacustris ssp. lacustris. Both levels of short-term salinity stress were well-tolerated by P. australis and S. maritimus, while mortality of T. latifolia and S. lacustris ssp. lacustris was significantly increased after the three weeks, 18% S treatment. The surviving individuals of these two species after this treatment also showed a more than 50% reduction in their total biomass compared to the control plants. Remarkably, after the three weeks 18% S treatment, all species apart of T. latifolia showed a short period in which the growth rate of the number of new shoots was significantly increased. This increase was sufficient to restore the same development pattern as observed in the control plants. # 1998 Elsevier Science B.V. All rights reserved. Keywords: Salt tolerance; Helophyte; Seedling development; Restoration 1. Introduction Lake Volkerak-Zoom is a former marine tidal estuary, which came into existence in 1987 after the closure of several dams in the south-western part of The Netherlands. After Aquatic Botany 62 (1998) 81–94 * Corresponding author. Tel.: +31 152 151 789; fax: +31 152 122 921; e-mail: [email protected];internet:http://www.ihe.nl 0304-3770/98/$ – see front matter # 1998 Elsevier Science B.V. All rights reserved. PII:S0304-3770(98)00085-0
-
Upload
independent -
Category
Documents
-
view
0 -
download
0
Transcript of Four helophyte species growing under salt stress: their salt of life

Four helophyte species growing under
salt stress: their salt of life?
Michiel J.M. Hootsmans*, Frank Wiegman
Department of Environmental Science and Water Resources, IHE-Delft, P.O. Box 3015,
2601 DA, Delft, The Netherlands
Received 26 September 1997; accepted 3 June 1998
Abstract
We studied the capacity of pre-germinated seedlings of four helophyte species to develop under
conditions of chronic and temporary salt stress in waterlogged sediments: Typha latifolia L.,
Phragmites australis (Cav.) Trin. ex Steud., Scirpus lacustris ssp. lacustris L., and Scirpus
maritimus L. Salinity levels were 1:8%S and 18%S, applied constantly during four months, or for
one or three weeks in otherwise freshwater conditions. The chronic salt stress treatment at 18% S
led to a rapid die-off of both T. latifolia and S. lacustris ssp. lacustris. The other two species only
barely survived, hardly forming new vertical shoots. At 1.8% S, the consequences were less, and
limited to T. latifolia and S. lacustris ssp. lacustris. Both levels of short-term salinity stress were
well-tolerated by P. australis and S. maritimus, while mortality of T. latifolia and S. lacustris ssp.
lacustris was significantly increased after the three weeks, 18% S treatment. The surviving
individuals of these two species after this treatment also showed a more than 50% reduction in their
total biomass compared to the control plants. Remarkably, after the three weeks 18% S treatment,
all species apart of T. latifolia showed a short period in which the growth rate of the number of new
shoots was significantly increased. This increase was sufficient to restore the same development
pattern as observed in the control plants. # 1998 Elsevier Science B.V. All rights reserved.
Keywords: Salt tolerance; Helophyte; Seedling development; Restoration
1. Introduction
Lake Volkerak-Zoom is a former marine tidal estuary, which came into existence in
1987 after the closure of several dams in the south-western part of The Netherlands. After
Aquatic Botany 62 (1998) 81±94
* Corresponding author. Tel.: +31 152 151 789; fax: +31 152 122 921; e-mail:[email protected];internet:http://www.ihe.nl
0304-3770/98/$ ± see front matter # 1998 Elsevier Science B.V. All rights reserved.
PII: S 0 3 0 4 - 3 7 7 0 ( 9 8 ) 0 0 0 8 5 - 0

its creation, the lake water quickly freshened, while saline groundwater remained in
deeper or shallower parts of the sediments. During the first years after the closure, the
lake was characterized by a very high transparency of the water and a diverse submerged
freshwater macrophyte community (Schutten et al., 1994). However, the development of
an extensive belt of shoreline vegetation strongly lagged behind.
Thus, spawning and nursery areas for important predatory fish species like Pike, Esox
lucius L., are scarce and this has probably contributed to a strong development of
whitefish like Bream, Abramis brama (L.) (Ligtvoet and De Jong, 1995). Together with
on-going eutrophication, this in turn may have caused the recent change of the system
from a desired, clearwater, macrophyte-dominated state to a turbid, algae-dominated state
(for a general discussion of these phenomena, see a.o. De Nie, 1987; Moss, 1990;
Scheffer et al., 1993; and Van Vierssen et al., 1994).
The managing authorities started a research project to evaluate options for action in the
lake (Ter Heerdt, 1995; Vulink and Coops, 1995). As a working hypothesis, it was
assumed that the very limited development of shoreline vegetation is mainly due to the
high amount of sea salt in the lake shore sediments, which is only slowly disappearing by
the flushing action of fresh surface water and rainwater. In the upper 10 cm of underwater
sediment, salt concentrations currently are relatively low (0.1±1.0 g Clÿ1 lÿ1 interstitial
water), rapidly increasing with depth to 5±8 g Clÿ1 lÿ1 at 50 cm. However, saline
groundwater in shoreline sediments that have been exposed to the air since the closure of
the estuary is easily transported upwards by capillary movement, leading to very high
concentrations (from 20 g Clÿ1 lÿ1 at 50 cm depth upto 140 g Clÿ1 lÿ1 in the top 2.5 cm).
The same salinization process was demonstrated in underwater sediment that was
exposed after experimental drawdown of the watertable (data taken from Slager, 1996).
The present study focused on the effects of chronic and temporary salt stress on growth
and development of helophytes under controlled conditions, growing from the seedling
stage. Four species, already present in the area of Lake Volkerak-Zoom, were used:Typha
latifolia L., Phragmites australis (Cav.) Trin. ex Steud., Scirpus lacustris ssp. lacustris L.,
and Scirpus maritimus L. Information on salinity tolerance in these species is scarce, and
appears limited to P. australis and S. maritimus (Mercado et al., 1971; Van der Toorn,
1972; Lissner and Schierup, 1997).
2. Materials and methods
2.1. Experimental design
The experiments were performed outdoors on an unshaded roof of the IHE-Delft
premises. In a randomized block design, seven treatments, differing in salinity level and
duration of the salt stress, were applied (see Table 1). Each of the 10 blocks used,
contained one replicate plastic container (60 cm�40 cm�40 cm) for each treatment.
Salinities were created using artificial sea salt and tapwater, but no nutrients were added
to the water and thus, differences in nutrient concentration between salinity treatments
were negligible. For comparisons, our (sea salt) salinity values can be divided by 1.8 to
convert them into chlorinity values.
82 M.J.M. Hootsmans, F. Wiegman / Aquatic Botany 62 (1998) 81±94

One individual of each of the four species of helophytes per container was present,
each in its own 5 l plastic bucket. This made competition between plants in one container
for the (low) nutrient supply in the outside water unlikely. The bottom of the buckets was
perforated with five holes of 5 mm diameter, and covered with a 2 cm layer of pebbles to
prevent sediment wash-out. A sandy sediment, coming from the littoral zone of Lake
Volkerak-Zoom, was used, and the water level inside and outside of the bucket was kept
at the sediment surface. Tapwater was added to replace evaporated water. To increase or
reduce the salinity level, the buckets were raised for a short time above the water to drain.
If necessary, the flushing was repeated several times to achieve the required salinity level
inside the buckets, which in general was reached within 2 days. Control buckets were not
flushed and thus, sediment redox conditions may have differed between these treatments
and the controls. As the nutrient content in the water surrounding the buckets was low
(tapwater levels), flushing of the temporary salt stress treatments could have led to a
(temporarily) reduced nutrient content of the porewater.
Our experiments started 18 May 1995 with seedlings less than one week old. Seedlings
were provided by RIZA Lelystad, using seeds collected in the Netherlands. Experiments
started on 18 May 1995. Some seedlings died within a few days after planting, and thus
some re-planting of newly germinated material was done in the first two weeks to
establish as many replicate plants as possible. The temporary salt stress was applied
between 19 July and 9 August (three week period) and between 26 July and 2 August
(one week period). The experiments were harvested in the period of 18±19 September.
2.2. Measurements
Photosynthetic photon fluence rate (PPFR, mmol mÿ2 sÿ1, 400±700 nm) was measured
using a LiCor 192 sb quantum sensor. Temperature of the air (inside a standard weather
station) and water temperature of one container were measured using thermistors. Half-
hour averages of temperature and light data were recorded with a Campbell 21x
datalogger. Salinity was measured as conductivity using a WTW salinity meter. Salinity
of the interstitial water in a number of replicate buckets per salt stress treatment was
regularly monitored using artificial roots (RHIZON SSS1). These are hollow, flexible
sticks (70 mm�3 mm) made from a semipermeable material, coupled to a syringe.
Table 1The treatments used in the experiment
Treatment No. Salinity (%) Duration of salt stress
1 0 No salt stress (freshwater control)
2 1.8 4 months
3 18 4 months
4 1.8 1 week, otherwise freshwater
5 18 1 week, otherwise freshwater
6 1.8 1 weeks, otherwise freshwater
7 18 1 weeks, otherwise freshwater
During the middle of the 4 month experimental period, the temporary salt stress treatments were applied: the 3weeks exposure lasted from 19 July till 9 August; the 1 week exposure was from 26 July till 2 August. Duringthe remaining period, the temporary salt stress treatments contained freshwater.
M.J.M. Hootsmans, F. Wiegman / Aquatic Botany 62 (1998) 81±94 83
After the first month of establishment, the following weekly data were obtained: length
of the main shoot (including uppermost leaves, in cm), total number of leaves of the main
shoot, and the number of new vertical shoots per replicate plant. At the end of the
experiment, dryweight (DW, 72 h, 708C) of aboveground and belowground biomass per
replicate clone was determined, and the number of new S. maritimus tubers was counted.
2.3. Analysis
In the case of the number of leaves and the length of the main shoot, results from a
replicate were removed from the dataset from the moment at which the main shoot
appeared to have died (defined as plants with a brownish, wilted appearance, showing no
change in leaf number or length). In the case of the number of new vertical shoots, this
was done from the moment at which the whole clone in the bucket was considered dead.
Aboveground biomass development during the experiment was estimated by a set of
linear regression equations with a forced zero intercept, describing the allometric relation
between morphological characteristics and aboveground biomass (in g DW) at the date of
harvesting. These relations were obtained by stepwise multiple regression per species
using the SAS statistical package (SAS Institute, 1988). Weekly linear relative growth
rates (RGR) of estimated aboveground biomass were calculated and plotted against the
mean date (in days) of the period for which the RGR estimate was made.
For statistical analysis, the mentioned SAS package was used. For all characteristics,
the results were analysed separately for the set of two chronic salt stress treatments and
the control, and for the four temporary salt stress treatments and the control. A one-way
analysis of variance (ANOVA) was applied to test treatment effects for each date, while a
two-way ANOVA tested the effect of age, treatment and their interaction. When a
treatment effect is stated as being significant, its significance level was at least p<0.05. If
the data were not normally distributed, or when variances were not homogeneous, data
values were transformed using a log(x�1) transformation. All multiple comparisons tests
per sampling date were done using student-t tests. Using the Bonferroni method, the
comparison-wise error level was kept sufficiently low to ensure an overall experiment-
wise error level of 5% for the complete set of comparisons per date. In the chronic salt
stress experiment, sometimes all plants of treatment 3 (18% S) died. In that case, the
values of the two remaining treatments 1 and 2 were compared with zero.
3. Results
3.1. Environmental conditions
During the experiment the irradiance values remained relatively constant, at about
37 mol mÿ2 dÿ1, with peak light intensity values of about 1300 mmol mÿ2 sÿ1 reached
around midday. Daily mean temperatures of air and water varied between 15 and 258C.
During the second half of June, quite some rainfall lowered the originally installed
interstitial water salinity levels by half for a two week period. Subsequently, July and
August had dry, sunny weather, with an average maximum temperature of about 258C.
84 M.J.M. Hootsmans, F. Wiegman / Aquatic Botany 62 (1998) 81±94
Irradiance and temperature values during the temporary salt stress period are shown in
Table 2. There were no significant differences in irradiance and temperature between the
mean values in the first week and the mean values for the whole three weeks period. Thus,
it is concluded that the one week and three weeks temporary salt stress treatments did not
differ in irradiance and temperature.
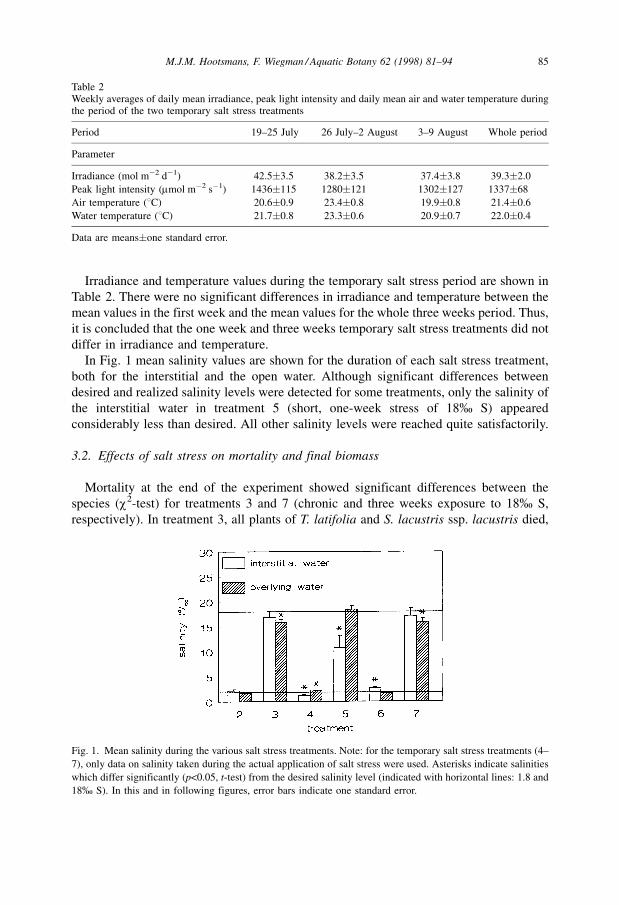
In Fig. 1 mean salinity values are shown for the duration of each salt stress treatment,
both for the interstitial and the open water. Although significant differences between
desired and realized salinity levels were detected for some treatments, only the salinity of
the interstitial water in treatment 5 (short, one-week stress of 18% S) appeared
considerably less than desired. All other salinity levels were reached quite satisfactorily.
3.2. Effects of salt stress on mortality and final biomass
Mortality at the end of the experiment showed significant differences between the
species (c2-test) for treatments 3 and 7 (chronic and three weeks exposure to 18% S,
respectively). In treatment 3, all plants of T. latifolia and S. lacustris ssp. lacustris died,
Table 2Weekly averages of daily mean irradiance, peak light intensity and daily mean air and water temperature duringthe period of the two temporary salt stress treatments
Period 19±25 July 26 July±2 August 3±9 August Whole period
Parameter
Irradiance (mol mÿ2 dÿ1) 42.5�3.5 38.2�3.5 37.4�3.8 39.3�2.0
Peak light intensity (mmol mÿ2 sÿ1) 1436�115 1280�121 1302�127 1337�68
Air temperature (8C) 20.6�0.9 23.4�0.8 19.9�0.8 21.4�0.6
Water temperature (8C) 21.7�0.8 23.3�0.6 20.9�0.7 22.0�0.4
Data are means�one standard error.
Fig. 1. Mean salinity during the various salt stress treatments. Note: for the temporary salt stress treatments (4±
7), only data on salinity taken during the actual application of salt stress were used. Asterisks indicate salinities
which differ significantly (p<0.05, t-test) from the desired salinity level (indicated with horizontal lines: 1.8 and
18% S). In this and in following figures, error bars indicate one standard error.
M.J.M. Hootsmans, F. Wiegman / Aquatic Botany 62 (1998) 81±94 85
while mortality was 60% in P. australis and S. maritimus. In treatment 7, T. latifolia had
70% mortality, S. lacustris ssp. lacustris showed 30% mortality, while all plants of the
other two species survived.
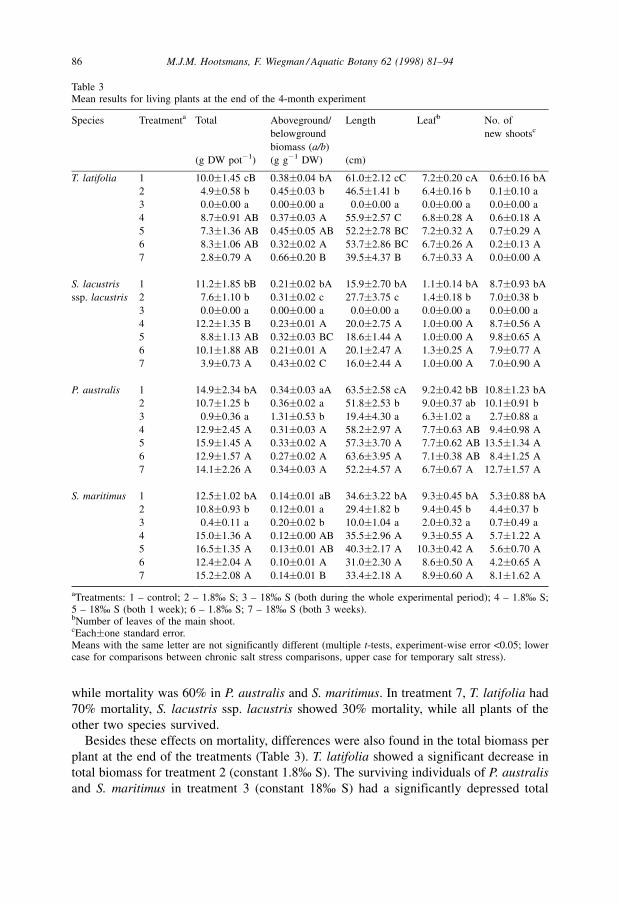
Besides these effects on mortality, differences were also found in the total biomass per
plant at the end of the treatments (Table 3). T. latifolia showed a significant decrease in
total biomass for treatment 2 (constant 1.8% S). The surviving individuals of P. australis
and S. maritimus in treatment 3 (constant 18% S) had a significantly depressed total
Table 3Mean results for living plants at the end of the 4-month experiment
Species Treatmenta Total Aboveground/
belowground
biomass (a/b)
Length Leafb No. of
new shootsc
(g DW potÿ1) (g gÿ1 DW) (cm)
T. latifolia 1 10.0�1.45 cB 0.38�0.04 bA 61.0�2.12 cC 7.2�0.20 cA 0.6�0.16 bA
2 4.9�0.58 b 0.45�0.03 b 46.5�1.41 b 6.4�0.16 b 0.1�0.10 a
3 0.0�0.00 a 0.00�0.00 a 0.0�0.00 a 0.0�0.00 a 0.0�0.00 a
4 8.7�0.91 AB 0.37�0.03 A 55.9�2.57 C 6.8�0.28 A 0.6�0.18 A
5 7.3�1.36 AB 0.45�0.05 AB 52.2�2.78 BC 7.2�0.32 A 0.7�0.29 A
6 8.3�1.06 AB 0.32�0.02 A 53.7�2.86 BC 6.7�0.26 A 0.2�0.13 A
7 2.8�0.79 A 0.66�0.20 B 39.5�4.37 B 6.7�0.33 A 0.0�0.00 A
S. lacustris 1 11.2�1.85 bB 0.21�0.02 bA 15.9�2.70 bA 1.1�0.14 bA 8.7�0.93 bA
ssp. lacustris 2 7.6�1.10 b 0.31�0.02 c 27.7�3.75 c 1.4�0.18 b 7.0�0.38 b
3 0.0�0.00 a 0.00�0.00 a 0.0�0.00 a 0.0�0.00 a 0.0�0.00 a
4 12.2�1.35 B 0.23�0.01 A 20.0�2.75 A 1.0�0.00 A 8.7�0.56 A
5 8.8�1.13 AB 0.32�0.03 BC 18.6�1.44 A 1.0�0.00 A 9.8�0.65 A
6 10.1�1.88 AB 0.21�0.01 A 20.1�2.47 A 1.3�0.25 A 7.9�0.77 A
7 3.9�0.73 A 0.43�0.02 C 16.0�2.44 A 1.0�0.00 A 7.0�0.90 A
P. australis 1 14.9�2.34 bA 0.34�0.03 aA 63.5�2.58 cA 9.2�0.42 bB 10.8�1.23 bA
2 10.7�1.25 b 0.36�0.02 a 51.8�2.53 b 9.0�0.37 ab 10.1�0.91 b
3 0.9�0.36 a 1.31�0.53 b 19.4�4.30 a 6.3�1.02 a 2.7�0.88 a
4 12.9�2.45 A 0.31�0.03 A 58.2�2.97 A 7.7�0.63 AB 9.4�0.98 A
5 15.9�1.45 A 0.33�0.02 A 57.3�3.70 A 7.7�0.62 AB 13.5�1.34 A
6 12.9�1.57 A 0.27�0.02 A 63.6�3.95 A 7.1�0.38 AB 8.4�1.25 A
7 14.1�2.26 A 0.34�0.03 A 52.2�4.57 A 6.7�0.67 A 12.7�1.57 A
S. maritimus 1 12.5�1.02 bA 0.14�0.01 aB 34.6�3.22 bA 9.3�0.45 bA 5.3�0.88 bA
2 10.8�0.93 b 0.12�0.01 a 29.4�1.82 b 9.4�0.45 b 4.4�0.37 b
3 0.4�0.11 a 0.20�0.02 b 10.0�1.04 a 2.0�0.32 a 0.7�0.49 a
4 15.0�1.36 A 0.12�0.00 AB 35.5�2.96 A 9.3�0.55 A 5.7�1.22 A
5 16.5�1.35 A 0.13�0.01 AB 40.3�2.17 A 10.3�0.42 A 5.6�0.70 A
6 12.4�2.04 A 0.10�0.01 A 31.0�2.30 A 8.6�0.50 A 4.2�0.65 A
7 15.2�2.08 A 0.14�0.01 B 33.4�2.18 A 8.9�0.60 A 8.1�1.62 A
aTreatments: 1 ± control; 2 ± 1.8% S; 3 ± 18% S (both during the whole experimental period); 4 ± 1.8% S;5 ± 18% S (both 1 week); 6 ± 1.8% S; 7 ± 18% S (both 3 weeks).bNumber of leaves of the main shoot.cEach�one standard error.Means with the same letter are not significantly different (multiple t-tests, experiment-wise error <0.05; lowercase for comparisons between chronic salt stress comparisons, upper case for temporary salt stress).
86 M.J.M. Hootsmans, F. Wiegman / Aquatic Botany 62 (1998) 81±94

biomass. These two species, together with S. lacustris ssp. lacustris, showed a significant
increase in the ratio of aboveground to belowground biomass with increasing salinity.
In the temporary salt stress treatments (Table 3), comparable trends were observed.
Both T. latifolia and S. lacustris ssp. lacustris showed a significantly depressed final total
biomass in the three week, 18% S treatment 7. Under these conditions, their ratio of
aboveground to belowground biomass appeared significantly increased. These effects
were not found for P. australis and S. maritimus. The other short salt stress treatments had
no significant effects on the final total biomass of any of the four species.
The mean number of tubers per plant and per belowground biomass of S. maritimus
only showed significant effects in the chronic 18% S treatment, where a decrease in tuber
number per plant (to a value of 3.3�1.1, mean �1 se) was combined with an increased
number of tubers per g belowground biomass (to a value of 12.2�1.9). The mean values
of all other treatments taken together were 14.6�0.6 tubers per clone, and 1.3�0.1 tubers
gÿ1 belowground biomass.
3.3. Effects of chronic salt stress on biomass development and morphology
A significant interaction effect between age and treatment was found for all species on
aboveground biomass and RGR (Fig. 2). This effect can be attributed to the strongly
limited biomass development in treatment 3, and the slightly limited biomass
development in treatment 2. During the first part of the experiment, RGR values for
P. australis and S. maritimus in treatment 3 were significantly depressed compared to
their control RGR. Subsequently, although the salinity levels were not changed, the
treatment RGR values recovered back to the control values in all cases. Nevertheless, the
aboveground biomass levels often remained influenced: for almost all dates and species,
treatment 3 biomass differed significantly from that in the other two treatments.
T. latifolia also showed a significant difference between the control and treatment 2 from
the 5th measurement date onwards.
Comparable observations were made for main shoot length, number of leaves on the
main shoot and number of new vertical shoots (Table 3). During the experimental period,
RGR values for these morphological characteristics (not shown) at first remained very
low or showed a serious decline for treatment 3, and to a lesser extent even for treatment
2. They subsequently recovered to control values, or the plants died. For treatment 2, a
significantly reduced length was found in T. latifolia and P. australis, but both Scirpus
species were hardly affected. Its only effect on leaf number was found in T. latifolia (a
slight reduction) while shoot number was reduced only in S. lacustris ssp. lacustris.
T. latifolia hardly made new vertical shoots during the experiment in any treatment.
Treatment 3 killed T. latifolia and S. lacustris ssp. lacustris; length, leaf number and
number of vertical shoots in the other two species declined by 30±80%.
3.4. Effects of temporary salt stress on biomass development and morphology
For aboveground biomass of T. latifolia and S. lacustris ssp. lacustris, a two-way
ANOVA showed a significant interaction effect of age and treatment. The other two
species showed a significant effect of age and treatment (see Figs. 3 and 4). Regarding
M.J.M. Hootsmans, F. Wiegman / Aquatic Botany 62 (1998) 81±94 87
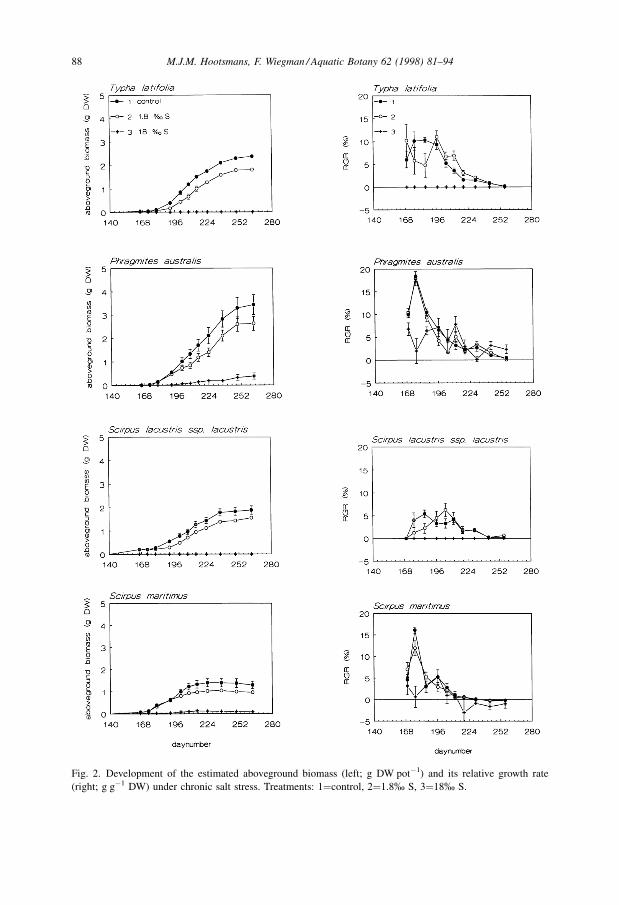
Fig. 2. Development of the estimated aboveground biomass (left; g DW potÿ1) and its relative growth rate
(right; g gÿ1 DW) under chronic salt stress. Treatments: 1�control, 2�1.8% S, 3�18% S.
88 M.J.M. Hootsmans, F. Wiegman / Aquatic Botany 62 (1998) 81±94
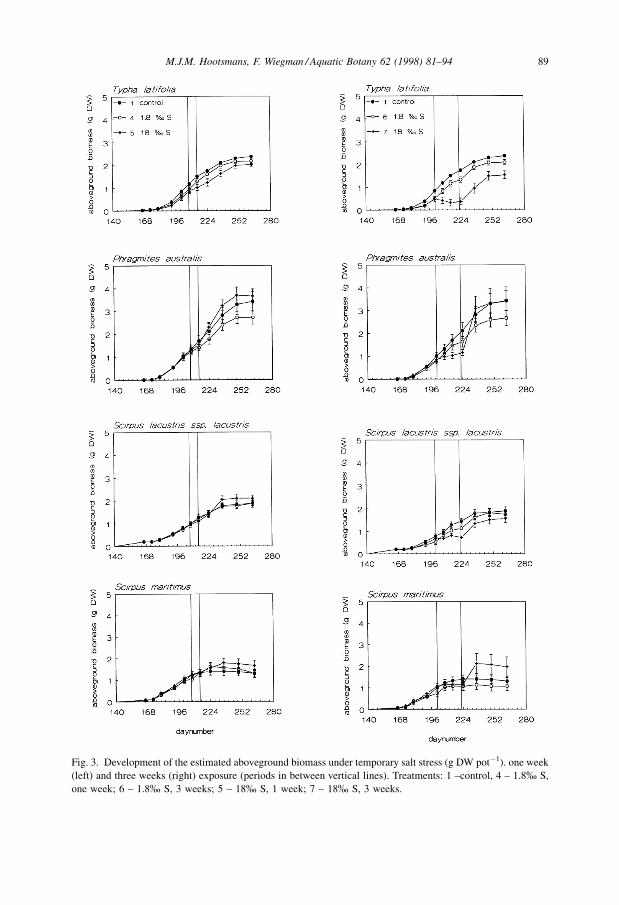
Fig. 3. Development of the estimated aboveground biomass under temporary salt stress (g DW potÿ1). one week
(left) and three weeks (right) exposure (periods in between vertical lines). Treatments: 1 ±control, 4 ± 1.8% S,
one week; 6 ± 1.8% S, 3 weeks; 5 ± 18% S, 1 week; 7 ± 18% S, 3 weeks.
M.J.M. Hootsmans, F. Wiegman / Aquatic Botany 62 (1998) 81±94 89

Fig. 4. Effect of one week (left) and three weeks (right) of temporary salt stress (period in between vertical
lines) on RGR values of the estimated aboveground biomass (g gÿ1 DW). Treatments: 1�control, 4�1.8% S,
one week; 6�1.8% S, three weeks; 5�18% S, one week; 7�18% S, three weeks.
90 M.J.M. Hootsmans, F. Wiegman / Aquatic Botany 62 (1998) 81±94

their RGR, all species had a significant interaction between age and treatment, which was
predominantly due to the results in the three weeks salt stress treatments (see Fig. 4).
In general, the one week salt stress treatments did not strongly affect aboveground
biomass development: significant differences in biomass were only found for T. latifolia
between the control and treatment 5 (one week 18% S) during the first three
measurements after the end of the salt stress. The RGR values for these treatments did not
show any significant differences.
In all the species, aboveground biomass was most strongly influenced by treatment 7
(three weeks 18% S, Fig. 3), although there also appeared to be a small but consistent
difference between the control and treatments 4 and 6 in P. australis and between the
control and treatment 6 in S. maritimus. Only a few significant differences in biomass
could be detected: for T. latifolia in treatment 7 they were present right from the start of
the salt stress till the end of the experiment despite a clear tendency to recover.
Furthermore, S. lacustris ssp. lacustris showed a low value at the end of this high salinity
treatment, which disappeared subsequently. An interesting phenomenon is the
significantly increased RGR value after the end of three weeks, 18% S treatment in all
species but T. latifolia. This resulted in a fairly strong increase in biomass, enabling these
species to reach the same biomass levels as the control.
Plant morphology at the date of harvest of the temporary salt stress treatments
(Table 3) indicated that the main shoot length was depressed in T. latifolia by treatment 5
and 7 (one or three weeks of 18% S, respectively); and it recovered only in the former
treatment. P. australis showed a reduced length in treatment 7, but recovered fully. These
decreasing lengths were due to mortality of the uppermost leaves. Both Scirpus species
showed a slightly declining trend in length for all treatments; in treatment 7, length of
S. lacustris decreased most rapidly, but plants in the other treatments eventually reached
the same value. All species showed a significant reduction in leaf number of the main
shoot in treatments 5 and 7. Only P. australis remained slightly below the control level
after treatment 7; for the same treatment, T. latifolia showed a remarkable full recovery
after a severe decline. In all species except T. latifolia, the shoot number showed a
significantly increased RGR after treatment 7.
4. Discussion
4.1. Effects of chronic and temporary salt stress
From the chronic salt stress experiment, it was apparent that the constant high salinity
level used (18% S) left no possibilities for T. latifolia and S. lacustris ssp. lacustris to
survive. Although P. australis and S. maritimus managed to stay alive, they could only do
so at a very low biomass level making them vulnerable for disturbances like water level
changes (Weisner and Ekstam, 1993; Coops et al., 1994). Furthermore, they hardly
developed new shoots. Clearly, at the high salt levels (above 140 g Clÿ1 lÿ1 in the upper
few cm) observed in the exposed shoreline of Lake Volkerak-Zoom (see Slager, 1996),
none of the four species had much potential for the creation of a belt of emergent
vegetation. This confirms the validity of the hypothesis that the permanently high salinity
M.J.M. Hootsmans, F. Wiegman / Aquatic Botany 62 (1998) 81±94 91

of the supralittoral shoreline sediments of Lake Volkerak-Zoom is the main reason for the
poor development of emergent vegetation (Vulink and Coops, 1995). In contrast, at the
constant low salinity level of 1.8% S (treatment 2), all species apart of T. latifolia
appeared more or less promising for establishment of a shoreline vegetation from
seedlings.
All species apart from T. latifolia showed a short, significant increase in aboveground
biomass RGR after the three weeks, 18% salt stress was lifted. This enabled them to grow
back fairly quickly to the control aboveground biomass levels. Possibly, the response
could be due to re-use of carbohydrates that were accumulated to create a high osmotic
pressure during the salt stress period. A reduction in nutrient availability due to the
necessary flushing associated with this treatment seems a much less likely explanation.
The salt stress experiments were carried out under permanently waterlogged sediment
conditions and thus it cannot be decided whether a combined effect of an increasing
salinity, lowering of the water table and high summer temperatures could lead to other
conclusions. We assume that under more extreme conditions, the differences in salinity
tolerance between the species would not change much, although probably all species
would show a more severe growth depression.
It must be realized that we have studied the response of plants grown from seedlings. It
is known for all these species that propagation and survival, at least in the short term, are
governed more by successful vegetative reproduction (by means of rhizomes and/or
tubers), than through seeds. In general, seed germination and/or seedling establishment
occur at rather low rates for the species under study (Ter Heerdt, 1995). The capacity of
the plants grown from rhizomes to survive adverse conditions like (temporary) salt stress
may differ considerably from that of seedlings; see for instance Lissner and Schierup
(1997) for P. australis. Hellings and Gallagher (1992) grew P. australis from rhizomes for
8 months at 15 and 30% S. They found a strong reduction in plant height, shoot density
and biomass, but not as dramatic as observed in this study. Thus, the present results are
applicable to situations in which colonization and establishment from seeds are the most
important key factors determining success, i.e. in the first season of a new vegetation.
Comparisons between our findings and other studies are relatively difficult. The
species under study are known to show quite some phenotypic plasticity, which is
certainly partly linked to genotypic variation. Different `strains', `ecotypes', `varieties' or
even `subspecies', responding differently to the same conditions, are known in literature
(see for instance Van der Toorn (1972) for P. australis and Clevering (1995) for Scirpus).
Still, the above findings are in reasonable agreement with general knowledge about salt
tolerance in these four species (Haslam (1971) and Van der Toorn (1972) for P. australis;
Shay and Shay (1986) and Weeda et al. (1994) for T. latifolia and S. lacustris ssp.
lacustris; Flowers Dietert and Shontz (1978); Liefers and Shay (1980) and Hutchinson
(1982) for S. maritimus).
In our experiments, S. maritimus showed a negative relation between salinity and tuber
number. In contrast, Mercado et al. (1971) found that S. maritimus responded to
increasing salinities with an increased number of shoots and tubers. The highest salinity
used by them was about 11.5% S. Our plants at 18% S did show an increased tuber
number per unit belowground biomass, but the implications of such an increase for
survival are limited when the belowground biomass development is hampered. If this
92 M.J.M. Hootsmans, F. Wiegman / Aquatic Botany 62 (1998) 81±94

response also would exist under less saline conditions, it could assist in speeding up
establishment of this species.
In conclusion, we recommend further work aiming at the creation of helophyte belts in
Lake Volkerak-Zoom to concentrate on P. australis and S. maritimus. These species
showed the best development both under chronic and temporary salt stress.
Acknowledgements
We thank Prof. Dr. Patrick Denny, Dr. Jan Vermaat (IHE), Dr. Hugo Coops (RIZA) and
an unknown referee for their comments on the manuscript. Mr. Frans Kerkum (RIZA)
provided germinated seeds of the four helophyte species and collected the necessary
sediment from Lake Volkerak-Zoom. This work was financed by the Institute for Inland
Water Management and Wastewater Treatment (RIZA, project no. 64.097286); we thank
RIZA for allowing us to use the data for publication.
References
Clevering, O.A., 1995. Life-history characteristics of Scirpus lacustris and Scirpus maritimus. General
introduction. Ph.D. Thesis, Nijmegen University, The Netherlands, pp. 7±16.
Coops, H., Geilen, N., Van der Velde, G., 1994. Distribution and growth of the helophyte species Phragmites
australis and Scirpus lacustris in water depth gradients in relation to wave exposure. Aquat. Bot. 48, 273±
284.
De Nie, H.W., 1987. The decrease in aquatic vegetation in Europe and its consequences for fish populations.
EIFAC/CECPI Occasional paper No 19, p. 52.
Flowers Dietert, M., Shontz, J.P., 1978. Germination ecology of a Maryland population of saltmarsh Bulrush
(Scirpus robustus). Estuaries 1, 164±170.
Haslam, S.M., 1971. The development and establishment of young plants of Phragmites communis Trin. Ann.
Bot. 35, 1057±1072.
Hellings, S.E., Gallagher, J.L., 1992. The effects of salinity and flooding on Phragmites australis. J. Appl. Ecol.
29, 41±49.
Hutchinson, I., 1982. Vegetation±environment relations in a brackish marsh, Lulu Island, Richmond, BC. Can. J.
Bot. 60, 452±462.
Liefers, V.J., Shay, J.M., 1980. Distribution and variation in growth of Scirpus maritimus var. paludosus on the
Canadian prairies. Can. J. Bot. 60, 1938±1949.
Ligtvoet, W., De Jong, S.A., 1995. Ecosystem development in Lake Volkerak-Zoom: concept and strategy. Water
Sci. Technol. 31, 239±243.
Lissner, J., Schierup, H.-H., 1997. Effects of salinity on the growth of Phragmites australis. Aquat. Bot. 55, 247±
260.
Mercado, B.T., Malabayabas, C., Gumasing, S., 1971. Responses of some lowland weed species to salinity. I.
Scirpus maritimus L. to sodium chloride. Phil. Agric. 55, 253±259.
Moss, B., 1990. Engineering and biological approaches to the restoration from eutrophication of shallow lakes in
which aquatic plant communities are important components. In: Gulati, R.D., Lammens, E.H.R.R., Meijer,
M.L., Van Donk, E. (Eds.), Biomanipulation, tool for water management. Dev. Hydrobiol., 61, 367±378.
SAS Institute Inc., 1988. SAS/STAT User's Guide. Release 6.03 ed., Cary, NC, p. 1028.
Scheffer, M., Hosper, S.H., Meijer, M.L., Moss, B., Jeppesen, E.M., 1993. Alternative equilibria in shallow
lakes. Trends Ecol. Evol. 8, 275±279.
Schutten, J., Van der Velden, J.A., Smit, H.J., 1994. Submerged macrophytes in the recently freshened lake
system Volkerak-Zoom (The Netherlands), 1987±1991. Hydrobiol. 276, 207±218.
M.J.M. Hootsmans, F. Wiegman / Aquatic Botany 62 (1998) 81±94 93
Shay, J.M., Shay, T.S., 1986. Prairie marshes in western Canada, with specific reference to the ecology of five
emergent macrophytes. Can. J. Bot. 64, 443±454.
Slager, H., 1996. Ontziltingsverloop in 1995 op de drooggevallen oever in het proefvak op de Krammerse
Slikken en op verspreid liggende plekken rond de waterlijn.(Desalinization during 1995 of the exposed
underwater sediment in the experimental polder at the Krammerse Slikken and in various other places along
the shore line; in Dutch). RIZA Work document Nr. 96.147x, Lelystad, The Netherlands, p. 16.
Ter Heerdt, G.N.J., 1995. Planten in de Peiling. Literatuuronderzoek naar de invloed van het zoutgehalte in de
bodem op de ontwikkeling van helofyten (Literature review on the influence of sediment salinity on the
development of helophytes, in Dutch). RIZA Nota Nr. 95.041, Lelystad, The Netherlands, p. 55.
Van der Toorn, J., 1972. Variability of Phragmites australis Trin. ex. Steudel in relation to the environment.
Ph.D. Thesis, Groningen University, The Netherlands, pp. 94±111.
Van Vierssen, W., Hootsmans, M.J.M., Vermaat, J.E., 1994. Lake Veluwe, a macrophyte-dominated system
under eutrophication stress. Geobotany 21, p. 375.
Vulink, J.T., Coops, H., 1995. Projectplan Planten in de Peiling ± Ontwikkeling van oeverplanten in het Volkerak
Zoommeer onder invloed van peilbeheer (Project plan ± Development of shoreline vegetation in Lake
Volkerak-Zoom as influenced by water level regime, in Dutch). RIZA Nota Nr. 95.037, Lelystad, The
Netherlands, p. 54.
Weeda, E.J., Westra, R., Westra, C., Westra, T., 1994. Nederlandse oecologische flora. Wilde planten en hun
relaties 5 (Dutch ecological flora. Native plants and their relations 5, in Dutch). IVN, Amsterdam, The
Netherlands.
Weisner, S.E.B., Ekstam, B., 1993. Influence of germination time on juvenile performance of Phragmites
australis on temporarily exposed bottoms ± implications for the colonization of lake beds. Aquat. Bot. 45,
107±118.
94 M.J.M. Hootsmans, F. Wiegman / Aquatic Botany 62 (1998) 81±94