FISSION PRODUCT NUCLEAR DATA (FPND) VOL.III
373
IAEA-169 VOL. 3 FISSION PRODUCT NUCLEAR DATA (FPND) VOL.III PROCEEDINGS OF A PANEL ON FISSION PRODUCT NUCLEAR DATA ORGANIZED BY THE INTERNATIONAL ATOMIC ENERGY AGENCY AND HELD IN BOLOGNA, 26-30 NOVEMBER 1973 A TECHNICAL REPORT PUBLISHED BY THE INTERNATIONAL ATOMIC ENERGY AGENCY, VIENNA, 1974
-
Upload
khangminh22 -
Category
Documents
-
view
1 -
download
0
Transcript of FISSION PRODUCT NUCLEAR DATA (FPND) VOL.III
IAEA-169 VOL. 3
FISSION PRODUCTNUCLEAR DATA (FPND)
VOL.IIIPROCEEDINGS OF A PANEL
ON FISSION PRODUCT NUCLEAR DATAORGANIZED BY THE
INTERNATIONAL ATOMIC ENERGY AGENCYAND HELD IN BOLOGNA, 26-30 NOVEMBER 1973
A TECHNICAL REPORT PUBLISHED BY THEINTERNATIONAL ATOMIC ENERGY AGENCY, VIENNA, 1974

PLEASE BE AWARE THATALL OF THE MISSING PAGES IN THIS DOCUMENT
WERE ORIGINALLY BLANK

The IAEA does not maintain stocks of reports in this series. However,microfiche copies of these reports can be obtained from
INIS Microfiche ClearinghouseInternational Atomic Energy AgencyKdrntner Ring 11P.O. Box 590A-1011 Vienna, Austria
on prepayment of US 80.65 or against one IAEAmicrofiche service coupon.

Panel on Fission Product Nuclear Data, Part 2: - •>:.SELECTED CONTRIBUTIONS TC REVIEW PAPERS.
Table of Contents}
Contribution to Review Paper No. 2 ...................................... 1
M. Lager, E. MerzFission Product Nuclear Data and Environmental Aspects of theNuclear Fuel Cycle .«,..... .<,....,>.............................. 3
Contribution to Review Paper No. 3 ........................1............... 19
D. Ilberg, D. Saphier, S. YiftahThe Effect of Bufnup and Fission Product Nuclear Data onFast Reactor Static and Dynamic Parameters ....................... 21
Contribution to Review Paper No. 4 ...«o................................. 41
V.V, Crlov, 0;D. Bakumenko, E.M. Ikhlov, M.Ya. Kulakovsky,K.F. Trpyanov, A.G. TzykunovPhysical Peculiarities of the Fast Power'Reactor Fuel Cycle ....... 43
Contributions to Review Paper Wo. 5 ....%................. ,.„.....*........ 53
K. Debertin, H. RamthunFPND needed for Nondestructive Burnup Determination .•......*...... 55
EL Go PriesmeyerBurnup De-termination by Neutron Transmission ................p..... 57
M* Robin, R, Hafeman, J. Bouchard, G. Frejaville, R. VidalThe Importance of Fission Product Nuclear Data in Burnup ^ - -Determination ., „, „ „ „ » . „..,......,(............................. 59
K. Tasaka, N. SasamotoMeasurement of Burnup of Irradiated Fuel by the Analysis ofGamma~Ray Spectra ................................................. 71
i '<H..WertenbachProblems encountered in Burnup Determination of Oxide FuelSpecimens with a High Rod Power .................................... 83
L. SchSchter, D. Hacman, 0. MotThe Influence o.f FPND Uncertainties: On a Method of PlutoniumDetermination from the Burnup Data in Irradiated Nuclear Fuel .... 91
Contributions to Review Paper No, 6 ........................................ 103
B.P. Maksyutenko, M.Z. TaraskoThe Control of Fissionable Materials by Means of DelayedNeutrons ..........................................................105
\
T. GozaniFPND and Nondestructive Assay Systems of Nuclear Materials .......Ill
- 2 -
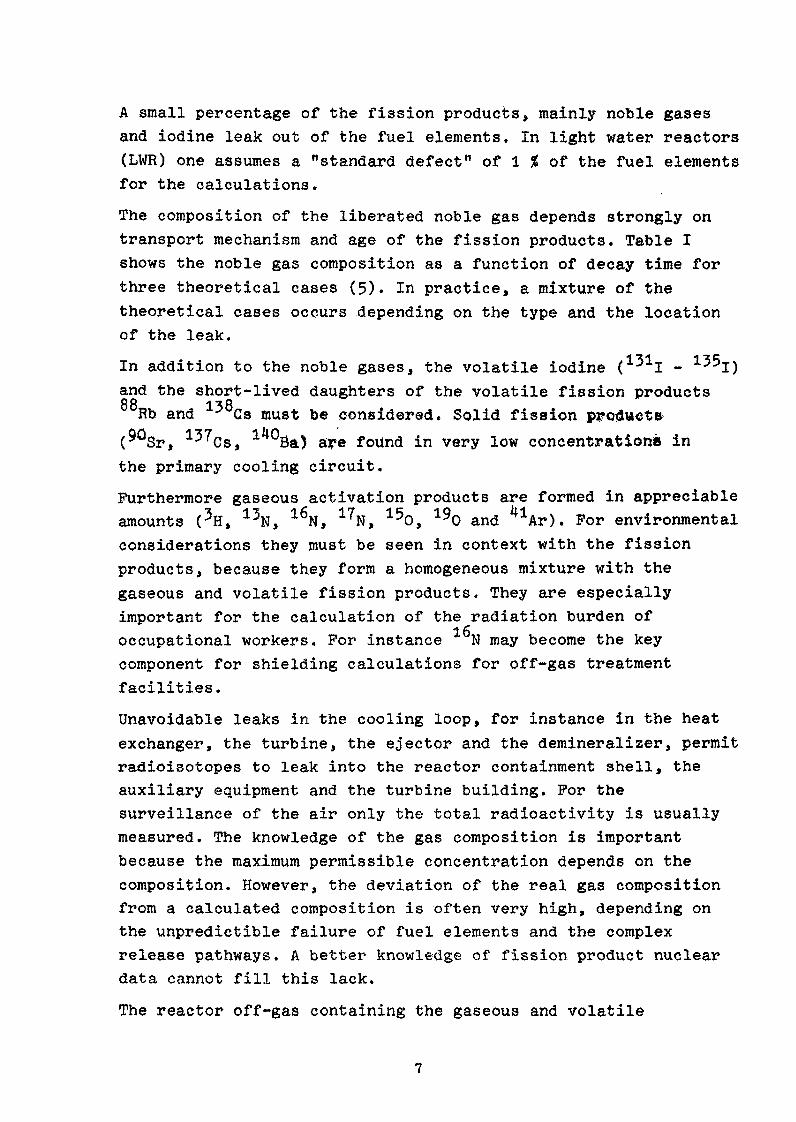
Contributions to Review Paper No . 10 .......,................*.,.......... 121V. Benzij G. Reffo, M. VaccariOn tlie Calculation of Total Radiative Widths ofNeutron Resonances .................. ........................... 123C.J. Dean1 Group Fission Product Capture Cross Section as used inFast Reactor Calculations .......... ............. ............... 137H. MatsunobuCompilation of Neutron Capture Cross Section Data for FissionProduct Nuclides in the Energy Range from 1 KeV to 15 MeV ...... 143
A.L. Pope, J.S. StoryThermal Average, Resonance Integral and Fission-SpectrumAverage Neutron Capture Cross-Sections of Nuclideswith Z = 30 to 68 .............................................. 163
Contribution to Review Paper No . lla ..................................... 213
A. Zukeran p-jcAn Investigation on the Gaussian Width Parameter in U(n , ,f) 215tn
Contributions to Review Paper No . lib ..................................... 243M. Lammer _ -Yields in Fast Neutron PissibaL. f-.- Uoand 5 Th. ................. 245S. Dar6czys P. Raics5 S. NagyCompilation of Fission Product Yields of U for14 MeV Neutrons ................................................ 281
Contributions to Review Paper No . 12 ...................................... 323K. Debertin, U. Sohotzig, K.F. Walz? H.M. WeissNew Measurements on Gamma-Ray Emission Probabilities of FissionProduct Nuclides Important for Non-destructive Fuel Analysis ... 325M . LammerStandards for Calibration of Semi-conductor Detectors .......... 329
M . LammerEvaluations performed for the SGAE fission product nucleardata file ...................................................... 339
Contributions to Review Paper No. 13 ..................................... 365S. Shal'evj G. RudstamDelayed Neutron Spectrometry .................................. 367A. E. EvansDelayed Neutrons from Fissions Present Status of Measurementsof Yields, Group half-lives and Abundances* and Spectra ....... 377

Contribution toReview Paper No« 2

FISSION PRODUCT NUCLEAR DATA AND ENVIRONMENTAL
ASPECTS OP THE NUCLEAR FUEL CYCLE
by M. Laser and E. Merz
Institute for Chemical TechnologyKernforschungsanlage JUlich / Germany
Summary
Among the nuclear data of fission products, important for theirenvironmental aspects, the fission yield of tritium is knownwith only a relative low degree of accuracy. This data shouldbe redetermined exactly as a function of the neutron energyfor 253U, 235U and 239Pu fissions. In addition, other reactionsfor the formation of tritium should be included.
Beyond this theme the activation product C and the formationof actinide elements are of environmental importance. An exactknowledge of the cross sections may be helpful in environmentalcalculations.
1. Introduction
Small amounts of fission products may be emitted to theenvironment from the time of their formation in a nuclearreactor up to their final disposal. For the control of theseemissions and for the calculations of their impact to mankindprecise nuclear data for the fission products, i. e. fissionyield, decay schemes, cross sections and so on are necessary.Data for neutron activation products and transuranium elementsare also important. They should be included in the followingconsiderations.

2. Release of fission products into the environment
Fission products are released into the biosphere during normaloperation of nuclear reactors, reprocessing plants.and fissionproduct solidification plants. In the case of malfunction oraccident storage facilities, waste transporters and finaldisposal facilities may also emit fission products.
The gaseous and volatile fission products (tritium, krypton,xenon, iodine) as well as aerosols are discharged into theatmosphere directly or via leakage into the containment or intothe service rooms.
The distribution in the atmosphere depends on several factorssuch as stack height, meteorological conditions, built-upareas and vegetation. These effects may be described mathe-matically by the Pasquill Atmospheric Diffusion Theory (1).
The liquid effluents are usually diluted by river water. Theradioactive isotopes are partly absorbed by minerals, plants,or animals. The behaviour of these radionuclides in surfacewater is very difficult to predict and to calculate. It dependsstrongly on the geology and the vegetation.The impact of radionuclides in the environment on thepopulation may occur by several modes of action:by submersion, by inhalation and by ingestion.
The relatively complicated interconnection between the fissionproduct inventory of a facility on the one hand and the impactto the people on the other hand is shown in a simplified mannerin fig, 1.
Formula for the calculation of the radiation exposures of thepopulation are given by several authors (2, 3). The equationscontain among others
the a- and \-energy per disintegration,
the mean JJ-energy per disintegration,
the linear energy absorption coefficient of the criticalorgan for the respective y-
the relative biological efficiency,

11
Fission Product
Inventory
Leak Rate
Concentrationin the
Service Room
Emission
1Concentration
inAir and Water
Uptake byPlants and Animals
Concentrationin
Plants and Animals
Submersion Dose andInhalation Dose(Occupational Workers)
Submersion•*» Inhalation Dose > to Population
Ingestion Dose J
Ingestion Doseto Population
Fig. 1 : Fission Product Impact to Humans
5

the enrichment of special isotopes in critical organs,
the physical half-life of the isotope
and
the biological half-life of the isotope in the body.
The accuracy of the data used in the calculations are verydifferent. In most cases the nuclear data of the fissionproducts are best known. Biological data like biological half-life, enrichment of isotopes in critical organs or the mass ofthe critical organ are only mean values valid for a hypothetical"standard man". The margin of error may be in the order of- 50 % or higher. The calculations of the dilution anddistribution of radioactive isotopes, including the pathwaysof the isotopes from the contamination of the plants and animalsto the ingestion by humans are normally associated withrelatively high errors of more than a factor of 2.In light of these errors one could conclude that the nucleardata for the fission products are known well enough for theuse in environmental calculations. Indeed, many environmentalscientists use the nuclear data uncritically.
In special cases, however, a better knowledge of the fissionproduct nuclear data may be advantageous. Therefore in thefollowing chapters the different steps of fission producthandling and their impact to the environment are describedand discussed in detail.
2.1 Fission product inventory in and leakage from nuclearreactors
The fission product inventory of a nuclear reactor can becalculated by computer codes. The results of the computationsdeviate from each other according to the different input dataand assumptions. In several cases, estimations of cross sectionsas function of the neutron energy were necessary (*0. A highdegree of accuracy of these data, however, is more importantfor calculations of burn-up than for environmental calculations.
A small percentage of the fission products, mainly noble gasesand iodine leak out of the fuel elements. In light water reactors(LWR) one assumes a "standard defect" of I % of the fuel elementsfor the calculations.
The composition of the liberated noble gas depends strongly ontransport mechanism and age of the fission products. Table Ishows the noble gas composition as a function of decay time forthree theoretical cases (5). In practice, a mixture of thetheoretical cases occurs depending on the type and the locationof the leak.
In addition to the noble gases, the volatile iodine (131I - 155I)and the short-lived daughters of the volatile fission productsQQ .a -r aRb and •* Cs must be considered. Solid fission products
( °Sr, 1^57Cs, Ba) are found in very low concentrations inthe primary cooling circuit.Furthermore gaseous activation products are formed in appreciableamounts (3H, 13N, l6N, 17N, 150, 190 and Ar). For environmentalconsiderations they must be seen in context with the fissionproducts, because they form a homogeneous mixture with thegaseous and volatile fission products. They are especiallyimportant for the calculation of the radiation burden of
*t £occupational workers. For instance N may become the keycomponent for shielding calculations for off-gas treatmentfacilities.
Unavoidable leaks in the cooling loop, for instance in the heatexchanger, the turbine, the ejector and the demineralizer, permitradioisotopes to leak into the reactor containment shell, theauxiliary equipment and the turbine building. For thesurveillance of the air only the total radioactivity is usuallymeasured. The knowledge of the gas composition is importantbecause the maximum permissible concentration depends on thecomposition. However, the deviation of the real gas compositionfrom a calculated composition is often very high, depending onthe unpredictible failure of fuel elements and the complexrelease pathways. A better knowledge of fission product nucleardata cannot fill this lack.
The reactor off-gas containing the gaseous and volatile

Table Jt ; Composition of Noble Gas Mixture* a» function of theDelay Time (Lindaclcera £5^ ).
Delay TimeIsotope Half-life A
Kr ^1 10 aXe 110 16 aKr 90 33 sX« 379 41 5 3,0Kr 8" 3,2 nin 8,2Xe 157 3,9 nin 11,3Xe 1 5$n 15,3 nin i.6Xe 13? 17 nip 11,1r r ?- ?8 nin 7,5'•'r ?lm l l fc piiri 1,3Kr 81 ?,S h 10.2vr S5tr a,* ft »,2Xe H5 9,2 h 17,2:te 13Vi P , 3 d 0.5Xe 13* 5,* d 18,0Xr I M^ 12, 0 d 0,1<r 35 10.6 a 0,1
2 nin
B C
0,11,8 0.5
18,0 6,921, « 9,fi22,1 21,625,1 26,72,6 5,57,0 15,70,3 3,80,1 0,60.5 3,C0,1 1,20,2 3,1.
0,00? 0,9,
1.10*5 -
30 nin
A
0,10,12,07,5
1,81*,86,3
27,30,8
29,70,20.1
B
1.13,2
15,1*7,513,11,79,92,65.5.0,4•
-
C
0,30,98,0
26,715,72,5
17,*5.8
17,60,25,0--
A
0,10,35.71.1
13,56.7
32,21,0
39,00,20,1
2 h
B
1.05.1
26,71,2
30,19,2
21,60,11.9--
C
0.31,5
15.23,1
25.59,7
33,50,1
10,7-•
«
0.20,5
11.T1.7
«z.i0,50,3
1 A
B
2,1*.6
65,71,3
26.20.1••
c
0,71,9
38,51,8
57,00,80,1
A
0,51,5
96,70.80,5
3 dB
7.73.1
88.90,3*
60 d 120 4
C A B C A B
2.32.1
95,0 - 7*. 2 - - 0,20,« - 13,8 - - 3.30.2 100 12,0 100 100 96,5
C
--
100
00
Typ of Vtxt^re ABC
MixtureRecoil fixtureDiffusion Mixture

radioactive isotopes as well as a small amount of aerosols passesthrough several filters and hold-up tanks or beds.
In the United States, power plants are often equipped with hold-up pipes to delay the emission of the radioactive gases by appr.20 to 30 minutes. Typical examples of off -gas radioactivity,emitted from a boiling water reactor (Dresden I, 210 MWe) andfrom a pressurized water reactor (Yankee, 185 MWe) are given intable II (6, 7). German power stations use charcoal beds with adelay time of 2.5 and 40 days for krypton and xenon, respectively.The discharged off -gas contains mainly "mXe and -*
Table II : Reactor Off-gas of LWR Reactors
Isotope
Ar tilKr 85mKr 85Kr 87Kr 88Xe 133mXe 133Xe 135Xe 138H 3C 14Sr 89Sr 90I 131Cs 137Ba 140Mn 54Co 58Co 60
BWRCi/a
12 3004,4
30 74724 220
47315 20037 622102 713
0,3
0,030,00030,030,00110,014
0,00080,0008
PWRCi/a
0,40,0230,020,030,0020,10,2
130,3
0,00020,00032-10"7
0,0001
0,0002

Experience with high temperature reactors (HTR) is very limited.The fuel consists of uranium and/or thorium carbide or oxide,coated with pyrocarbon and in some cases with silicon carbide,and is embedded in a graphite matrix. The pyrocarbon coatingseems to be extremely gas tight. However, the fuel element ismore or less contaminated with uranium. The fission productsfound in the primary helium circuit come from this contamination.The radioactivities found in the cooling gas of the AVR reactor(15 MWe) are given in table 111(8). After passing charcoalabsorbers only small amounts of 5Kr and 155Xe are emitted intothe atmosphere. The total gaseous activity emitted during a 17month period amounted to 20.3 Ci.
Table III; Radiactive Isotopes in the Primary Cooling Gasof the AVR Reactor (HTR 15 MWe)
Isotope RadioactivityCi/cin3 STP
Kr 85m 2,5-10~y
Kr 88 8 . 10~9
Xe 133 6 -10~9
Xe 135 U,5-10~9
In the reactor containment vessel, small amounts of ^Kr, ^raKr,1 'I'T 1^5R fift- Xe, -"Xe and Rb are measured. In the secondary water andsteam loop *H (1.8 • icf ci/cm* HgO) as well as activationproducts (59Pe, 6°Co, 65Zn, 51Cr, *6Mn, 61*Cu) are found.
The liquid effluents of nuclear power stations contain onlysmall.amounts of fission products. Individual isotopes are notusually specified. However, tritium is given separately,
In the case of accidental release of fission products thecomposition of the emission depends on the type of the accident
10
and on the duration of reactor operation. As shown by Vogt (3),I or 9 sr - 9 Y are in all cases the most important fission
products with thyroid gland or bones, respectively, as criticalorgan. Other important fission products are:8V, 91Sr, 92Sr, 91Y> 92Y> 95 97 103Ru .105Rh, 12 Te - 12%-e, 131mTe - 131Te, 132Te, 132I,
Of the fission products, which are of environmental importance,for the reactor operation, less is known about tritium than anyother isotope. As shown in chapter 3, more attention should bepaid to tritium in the future.
2.2 Release of fission products during the transportof depleted fuel elements
Under normal conditions no fission products are emittedduring the transport of depleted fuel elements from thereactor to the reprocessing plant. After an accidental
90release, 7 Sr and J I are the most important isotopes.Other important isotopes may be Ce - Pr, 129SiTe - 129Te,
and 137Cs.
2.3 Release of fission products from reprocessing plants
After interim storage, the depleted fuel elements are dis-integrated and the.fuel is dissolved. The gaseous and vola-tile fission products are liberated to the vessel off-gasor dissolver solution. The most important volatile isotopesare 3-H, 85Kr, 129I, 131I and 133Xe. In HTR fuel reprocessing
-i hplants, the activation product C is of environmental im-portance.
At the present time the noble gases are quantitativelydischarged to the atmosphere. In the future, however, theywill be retained by suitable procedures.
Tritium is partly discharged with the off-gas, and is partlyretained in the aqueous solution. Today the tritiated wateris discharged to a river. The tritium radioactivity in theeffluents from big plants, however, would be too high, and
11
the discharge of tritium into underground strata or intothe ocean are being considered.
A high percentage of the iodine is also released to theoff-gas, but it can be retained by suitable filter materials.
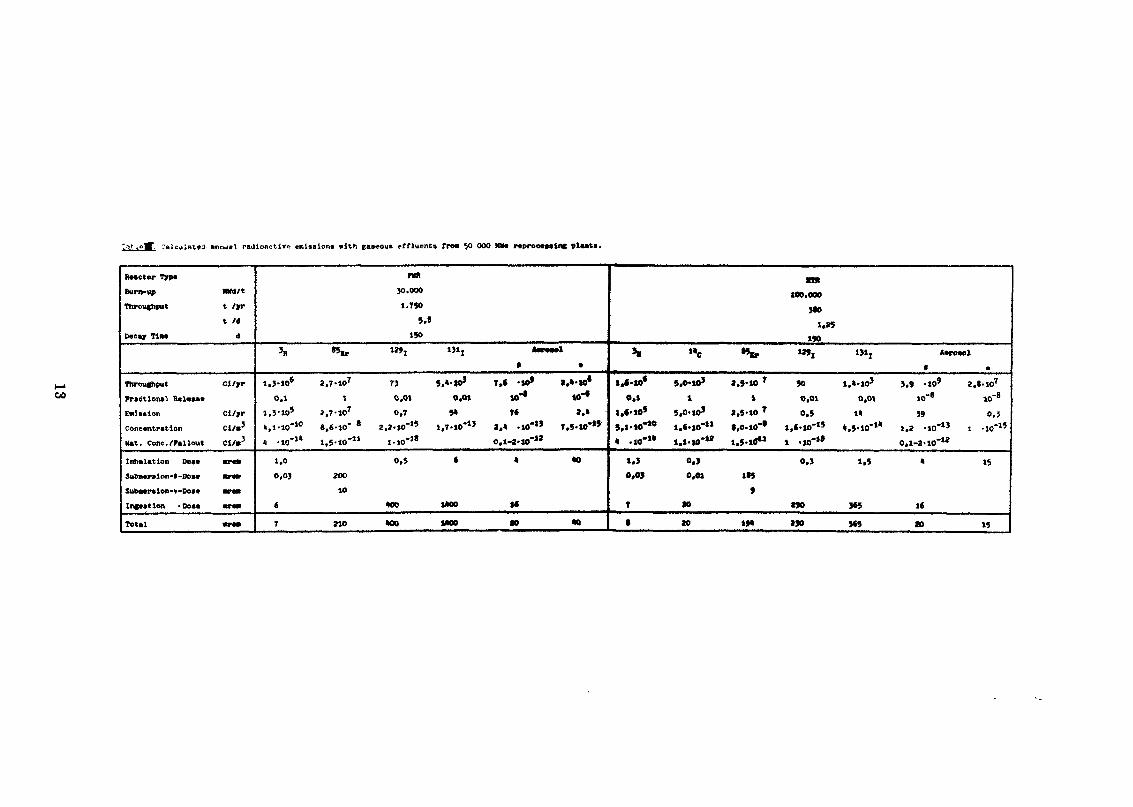
Table IV shows the calculated annual gaseous emissions froma 50 000 MWe reprocessing plant and the resulting dose ratein the vicinity of the plant, assuming that the gaseous andvolatile isotopes are quantitatively emitted (9). It can beconcluded from these data, that the emission of gaseousand volatile isotopes from big plants must be limited, ifa recommended exposure of 30 mrem/yr is not to be exceeded.
In this context special interest should be paid to the•\\\activation product C, which is formed mainly in thegraphite matrix of HTR fuel elements . The matrix is burnt
l^before dissolution of the fuel. Retention of the C, which14is emitted as C02, seems to be infeasible.
In addition to the gaseous and volatile fission products,small amounts of aerosols containing 9Sr, " Sr, Ru,13'}Cs, 157Cs and Ce - l41tPr as well as actinide elementsare emitted. The dose commitment due to these isotopes maybe smaller than that caused by the fall-out from nuclearweapon-tests.
Liquid effluents contain mainly a Ru, 95Zr - 95Nb, 157Cslililand Ce - Pr. Prom Windscale, for instance, the critical
isotope is 106Ru (10).
The fission product solution is stored temporarily on-siteat the reprocessing plant in tanks. Under normal conditionsonly neglegible amounts of fission products are emitted. Ifhowever a tank fails, fission product solution may penetrateinto the underground, where soils may act as ion exchanger.The critical isotopes are 89Sr, 9°Sr, 137Cs and l44Ce -
2.4 Release of fission products from fission productsolidification equipment
Some years after discharge from the reactor the fissionproduct solutions should be solidified on-site at the re-
12
urinjBl r»Uio«ctiv<> enlaslona »Sth gaaeoufi rrflucnti fro* 5O OOO MWa r»pro«aalnC planta.
Reactor TypeBurn-up MM/tThroughput t /Jrr
t /«Decay Tine 4
Throughput cl/jrFractional Rel«aaeE*)««lon Ci/jrr
Concentration Cl/»Hat. Cone. /fallout «/•'
Inhalation Deae are*
SubMraion-t-Doae ar«nInfeation -Do«« «r»»
Total mm
rm30.0001.750
1503H «5«, 1WT 131, *-*.!
1.3-W6 *.7-10T 73 S.'-IO* 7,6 •»* I,«-10*0.1 I 0,01 0,01 10'* W**
1.3-105 S.7-107 0,7 S« « *.»
SI-10'10 e.6-W' * 2.2-JO-" 1,7-10*1J 2.* .10'" T,5'10**'
« -Wf1* 1.5-10-" J..O-" 0.1-2.»-M
1.0 0,5 * * 400.0} 200
10
« 400 1MO W
7 210 400 MOO 10 *»
m100.000
MO
l.W
H "c «Hr
l,6-*0* 5.0-1O5 a.5'10 r
O.I 1 1
i.«'»* s,0'ioj a,s-io T
«' .io-»* !.'».»•» i.'s.id*1
1.3 0,)0,03 0,01 1*5
*T to
• 20 If*
"», W'
50 1.4-103
O,01 O.01
0.5 1»1.6.10-" *,S.10-»»
1 -10-*8
0,3 1,5
tjo W,no »s
Aero*ol* •
J.9 -1O* 2.4-1O7
10-' io-«39 0,3
0,1-2-10-**
« 15
16
to 15
CO
processing plant. Several profe«»ses are under development toproduce calcinates, glasses or ceramics. They are producedby high temperature procedures (500 - 1200 °C). Under theseconditions several lower volatility elements are volatilized.
Key isotopes may be 89Sr, 9°Sr, l06Ru, 129I,
2.5 Interim and final storage of solidified fission products
To date the further treatment of the solidified waste hasnot been settled. In the USA, engineered storage of thesolidified waste for the next 100 years in stainless steelpots under water is being considered.
Emission of radioactive isotopes during this storage periodis not expected. Only low activity liquid effluents arepossible.
In Germany the solidified fission products will be disposedof in a salt mine for final storage. Under normal operatingconditions, neither during the transport nor during finalstorage will fission products be emitted, with the exceptionof low activity aerosols resulting .from surface contamination.
Even in the case of the maximum credible accident (MCA), whenthe mine is filled with water, the brine should remain se-parated from the biosphere. Therefore no radiation exposureis to be expected. If, however, the mine should break downcompletely, which is very unprobable, the brine may come intocontact with the ground water. In this case, the criticalisotopes are probably 9 Sr, "cs and the actinide elements.
2.6 Storage and disposal of noble gases
The noble gases which are emitted into the atmosphere at thepresent time, must be separated from the off-gas in the
Ocfuture. However only the long living Kr is of environmentalinterest. The separated gases may be compressed into steelcylinders and stored during the next 100 to 150 years.
14
However, cylinder failure can result in a sudden accidentalQc
release. Therefore the disposal of 5Kr into the deep seahas been proposed (9). It can be calculated that the en-vironmental impact is very low. Experiments are continuing.
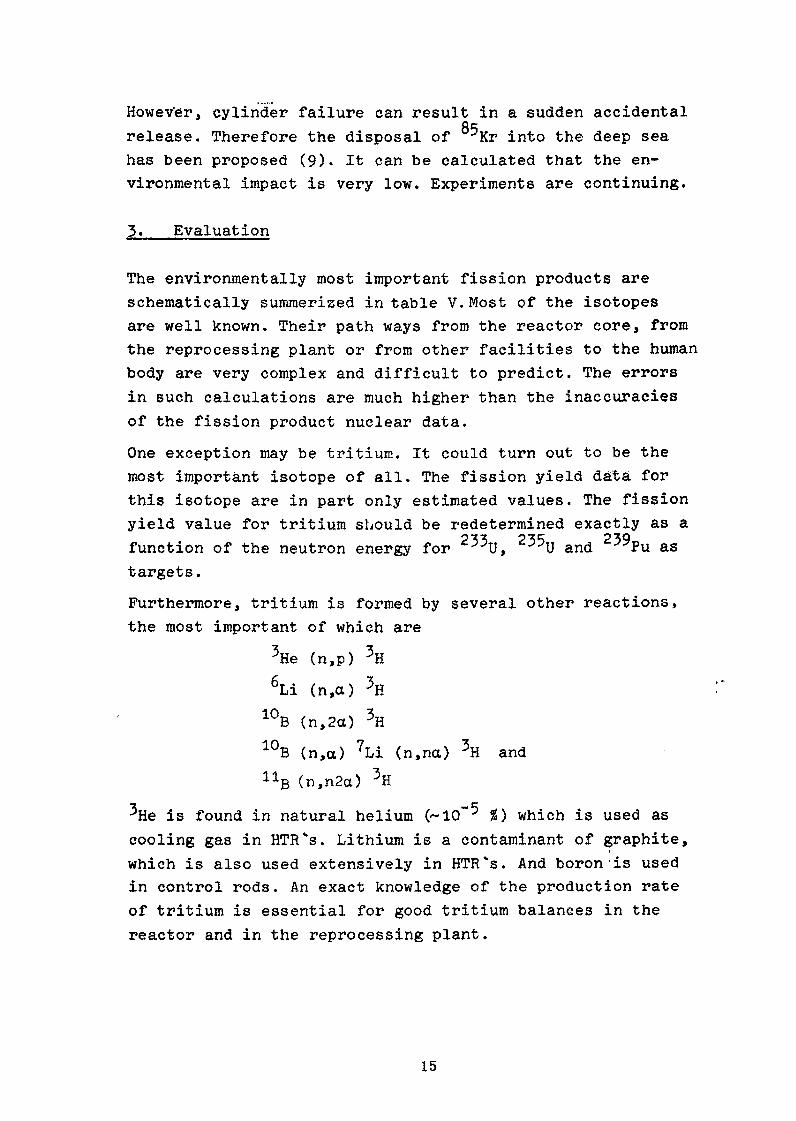
3. Evaluation
The environmentally most important fission products areschematically summerized in table V.Most of the isotopesare well known. Their path ways from the reactor core, fromthe reprocessing plant or from other facilities to the humanbody are very complex and difficult to predict. The errorsin such calculations are much higher than the inaccuraciesof the fission product nuclear data.
One exception may be tritium. It could turn out to be themost important isotope of all. The fission yield data forthis isotope are in part only estimated values. The fissionyield value for tritium should be redetermined exactly as afunction of the neutron energy for 233U, 23^U and 39Pu astargets.
Furthermore, tritium is formed by several other reactions,the most important of which are
3He (n,p) 3H6Li (n,o) 3H
10B (n,2<x) 3H10E {n,ct) 7Li (n,na) 3H andnB (n,n2a) 3H
3He is found in natural helium (~10"" %} which is used ascooling gas in HTR"s. Lithium is a contaminant of graphite,which is also used extensively in HTR*s. And boron'is usedin control rods. An exact knowledge of the production rateof tritium is essential for good tritium balances in thereactor and in the reprocessing plant.
15

Table y : Summary of Important Isotopes
Important Isotopes during NormalOperation
3R 83mKr 85mKr 87Kr 88Rr 89
131mxe 133mxe 133Xe 135mXe 137Xe"9Xe 88Rb 90Sr/90y 131-135,137Cs ll40Ba/lli0La 13N 16N 17N
"o 190 MlAr
3n 1I!C 35Kr 8^Sr 9°Sr 95Zr/95lib106Ru 129, 131, 133Xe 137CslZtl4Ce/lZ|4Fr
89Sr 90Sr 106Ru 129I 13MCs 137Cs
^Ce/^Pr
Reactor
Fuel ElementTransport
ReprocessingPlant
Fission ProductSolidification
Final Disposal
Important Isotopes in the Case ofAccidental Release89Sr 90Sr/9°Y 91Sr 92Sr 95Zr 97Zr103Ru/103mRh 105Rh 129mTe/l29Te131mTe/131Te l32Te 131-135J
lft0Ba/llK)La Ce Ce/ Pr
90Sr 125mTe/129Te 131, 13*Cs 137Cs
9°Sr 95Zr/95Nb 106Ru 131I 137Cs
^Ce/^PrActinides
90Sr 106Ru 137Cs MCe/MPr
9°Sr 137Cs Actinides

Of similar importance for the HTR fuel reprocessing plantsod13
is the activation product C. The main reactions are
C (n,Y) C14N (n,p) 14C and170 (n,a) 14C.
•I jiC is emitted from HTR reprocessing plants as COg. It is
taken up by assimilation in vegetation which in turn iseaten by' animals and humans. Genetic defects may be causedby this long-lived isotope.
Finally, the actinide elements should be mentioned, thougha detailed description is beyond the scope of this paper. Dueto their long half-lives and their high toxities, they mustbe stored safely for hundreds of thousand years.
A good knowledge of their production rate should allow oneto make better calculations of the effect on mankind in theevent of their release to the biosphere.
REFERENCES
(1) P.Pasquill : Atnosphoric Diffusion,llostrand Comp., London 1962
(2) G.BlSsser and : Mukleare Grundla^en ftlr Standort-K.Wirtz und Gebliudewahl bei Kernreaktoren;
Nukleonik 3, 164-178 and 210-231(1961)
(3) K.J.Vogt : Unweltkontamination und Strahlen-belasfcunp; durch radioaktive Ab-luft aus kerntechnischen Anlagen;Report JU1-637-ST, 1970
17

Y.Liu
(5) K.H.Lindackers
(6) B.Kahn et al.
Zur Behandlung der Spaltproduktein Abbrandrechnungen unter Be-rUcksichtigung neuer nuklearer Da-ten angewandt auf Graphitreaktoren;Report JU1-678-RG, 1970
Einflilsse des atomrechtlichen Oe-nehmigungsverfahrens In der Bundes-republik Deutschland auf die tech-nische Auslegung und den Betriebvon Kernkraftwerken;Thesis, Aachen 1970
Radiological Surveillance Studiesat a Boilinc Water Nuclear PowerReactor Plant,Report BRH/DKR-70/1 (1970)
(7) B.Kahn et al. Radiological Surveillance atpressurized Water Reactors,Trans. Amer. Nucl. Soc . 15,(1972)
(8) J.Engelhard AbschluBbericht Ober die Er-richtung und den Anfahrbetriebdes AVR-Atomversuchskraf twerkes ;Report BMBW-FB K 72-?^ (1972)
(9) H.Beaujean,J.Bohnenstingl,M.Laser,E.Merz,H.Schnez
Gaseous Radioactive Emissionsfrom Reprocessing Plants and theirpossible Reduction;Symposium on Environmental Behaviourof Radionuclides Released in theNuclear Industry, Aix-en-Provence,1973. IAEA/SM-172/17.
(10) W.G.Marley Atomic Energy and the Environment;Symposium on the Management ofRadioactive Wastes fron FuelReprocessing, Paris, 197?
18

Contribution toEeview Paper No. 3

THE EFFECT OF BURNUP AND FISSION PRODUCT NUCLEAR DATA
ON FAST REACTOR STATIC AND DYNAMIC PARAMETERS
D. Ilberg, D. Saphier and S. Yiftah
Soreq Nuclear Research CentreYavne, Israel
ABSTRACT
Fast reactor static and dynamic parameters of "clean" and100r000 MWd/t cores were evaluated. The calculations were performedwith five different fission product cross section sets {FPCS). Thefollowing results were obtained.
- K is reduced by up to 10% after BU of 100,000 MWd/t,&££however, only small differences were found when usingdifferent FPCS.
- The positive sodium void effect is doubled, and up to50% differences are observed when using different FPCS,
- Minor differences in plutonium isotopic concentrationwere found after BU of 100,000 MWd/t when using differentFPCS in the calculations.
- The effective delayed neutron fraction B - is changedconsiderably during the BU process, but only smalldifferences were observed when calculated with differentFPCS.
- The prompt neutron lifetime & „,. may change by 10%.Q£ £It is affected by using different FPCS.
- The spatio-temporal behavior of a high BU reactorundergoing a local step perturbation differs by severalorders of magnitude from the "clean" reactor andsignificant differences between transient solutionsusing different FPCS were obtained.
21
I. INTRODUCTION
Several authors have shown that significant differencesexist between a reactor at the beginning of its lifetime and when itsfuel has reached considerable burnup (BU) . The present goal infast reactor design is to achieve a BU of 100,000 MWd/t in the fastcommercial breeders. At this stage of BU, approximately 10% of thefissile isotopes have been transformed into fission products (FP)while new fissile isotopes were bred, changing the initial fuelcomposition.
Philbin and Axford have shown that considerable power shiftinto the blanket occurs during approach to equilibrium. They calculateda 11.2% increase in the sodium void coefficient and a 2% change in theDoppler coefficient.
[4]Wright compared the control rod effect in reducing powerexcursion in "clean" and 66,000 MWd/t cores. The power excursion was10% higher in the high BU core.
Yamashita pointed out that there is a tendency towards un-favorable values of the sodium and Doppler coefficients during reactoroperation as FP are built up and changes in fuel composition occur, theformer becoming positive and the latter less negative.
However, many of the safety and feasibility calculations are stillbased on clean cores, disregarding the various changes resulting fromreactor BU and almost no dynamic calculations including BU fuel are knownto the authors. This is partly because until recently, only incompletedata for the Fission Product Cross Sections (FPCS) and yields were avai-lable and because complete BU calculations are complicated and costly.Even those calculations accounting for BU use lumped data for the FPas the input to either static or dynamic calculations.
Bince detailed Fission Product Nuclear Data (FPND) havebecome avialble recently, it seems timely to test their influence onsome of the static and dynamic parameters of fast breeders.
In what follows, detailed BU calculations followed by static anddynamic calculations of one dimensional reactor models were performed.Cores at the beginning of their lifetime were compared with coresundergoing burnup for one and two years without refueling, i.e. witha mean BU of 50,000 and 100,000 MWd/t respectively. The same reactors
22

were then recalculated using different PPCS. The effect of the differencesin the BU level and FPCS on fast reactor transient excursions were compared.
2. METHOD OF CALCUIATION
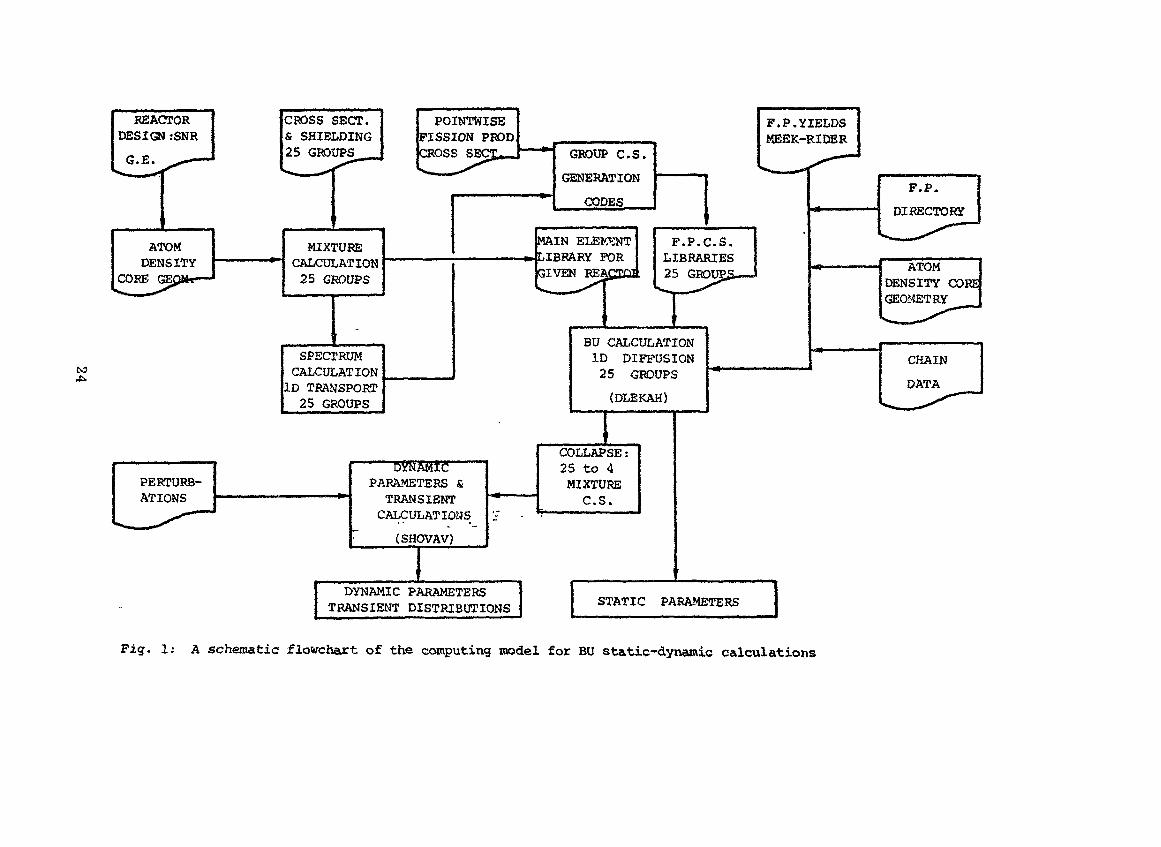
A detailed flowchart of the programs used and the file managementprocedures is given in Fig. 1.
The present evaluation has the following stages:
1) Preparation of a 25 group cross section library in ABNenergy structure for all the isotopes present in the reactor modelusing the ENDF/B-III file.
2) Preparation of 25 group cross sections for the FP isotopes using4 different PPCS files.
3) Preparation of simplified one dimensional models for the reactorsunder investigation.
4) Performing one dimensional BU calculations using the OLEKAKcode ~ see Fig. 1 . This code uses one dimensional diffusion in25 groups for criticality search, a modified version of the
[14]ICON code to calculate the concentration of 380 FP isotopesand the new concentration of the various fissile isotopes ateach interval, and a collapse subroutine to obtain four groupcross sections serving as the input for the SHOVAV dynamic code.
5) Collapsing the 25 group cross sections into four groups usingthe appropriate fluxes and isotopic compositions obtained inDLEKAH (see calculation scheme in Fig. 1) for various stages of BU.
6) Calculations of kinetic parameters such as B ..... and i ,- .err err7) Space-time dependent solution of the four group diffusion
equation with six groups of delayed neutrons. A local perturbation(control rod withdrawal) is inserted to initiate transientexcursions. The calculation is performed with the SHOVAV code.
3. REACTOR MODELS AND NUCLEAR DATA
Three reactor cores were investigated:a) General Electric - 1968 conceptual design of a 1000 MWe
(2260 MWt) fast reactor. The core is enriched with 11% plutoniumdischarged from thermal reactors. (Enrichment is defined by,239 ^ 24L . .,238,, 239 ^ 240 241 242 ..( Pu + Pu)/( U + Pu «• Pu + Pu + Pu)> .
240 241The composition of the Pu is 60% Pu , 25% Pu, 12% Pu and3% 242Pu.
23
REACTORDESIGN :SNR
G.E.
ATOMDENSITY
CORE GEC
CO
PERTURB-ATIONS
CROSS SECT.& SHIELDING25 GROUPS _
MIXTURECALCULATION25 GROUPS
SPECTRUMCALCULATIONID TRANSPORT25 GROUPS
POINTWISEFISSION PRODCROSS GROUP C.S.
GENERATION
CODES__
F.P,YIELDSMEEK-RIDER
DYNAMICPARA-METERS &
TRANSIENTCALCULATIONS
(SHOVAV)
DYNAMIC PARAMETERSTRANSIENT DISTRIBUTIONS
MAIN ELEKSNTIBRARY
F.P.C.S,LIBRARIES25 GRQiGROUgS.——'
BU CALCULATIONID DIFFUSION25 GROUPS
(DLEKAH)
COLLAPSE:25 to 4MIXTUREC.S.
F.P.
DIRECTORY
ATOMDENSITY COREGEOMETRY
CHAIN
DATA
STATIC PARAMETERS
Fig. 1: A schematic flowchart of the computing model for BU static-dynamic calculations
239b) Same as above but enriched with Pu only.c) SNR - German prototype reactor (1967) , 300 We (750 MWt) . The
239core is enriched with 17% plutonium, composed of 75% Pu, 22%24°Pu, 2.5% 241Pu and 0.5% 242Pu.
For the isotopes included in the reactor a 25 group cross sectionf 181set was prepared by Y. Gur from the ENDF/B-III file.
The following FPCS files have been used in this evaluation:a) Cook's file, which includes cross sections for 192 isotopes in
127 'energy groups. A 25 group cross section set for a , a and ascattering transfer matrix was formed and called COOK-M.'
b} Same as (a) but only a . was collapsed. This was called COOK-L.n,y
c) The ENDF/B-III file, which includes 58 isotopes. The 25 group crossrisisections for a and 0 were computed by Y. Gur in the same
way as for the fissile, fertile and structural isotopes mentionedabove.
[7]d) The evaluation of BENZI and KEFFO , which includes 142 isotopesfor which pointwise cross sections are given. These were collapsedby a separate program, forming a 25 group library of a . This
«FIfile is designated as BEN2I,
e) The 25 group library based on UKNDL, which was prepared by Tone and[19JHasegawa . The weighting flux was different from the flux used
in the above evaluations, but this gave rise only to second orderdifferences in the group cross sections. The file includesonly.
The relevant features of the above files as used in thecomparative calculations are shown in Table I. It should be notedthat some of the FP isotopes appearing in the original files wereomitted in the calculations because of their negligible effect.
In the BU calculations, the independent yields compiled by
Meek and Rider were used. Their compilation includes yields for236 239fast fission of U, U, Pu and for thermal fission of Pu.240 239For the fast fission of Pu, the yields of Pu were used. For the
241 242 '241fast fission of Pu and Pu, thermal fission yields of Pu were
used. These replacements are inevitable because no data were availablefor all the fissile isotopes, and were made under the assumption that
cumulative yields change slowly with energy and only slightly with themass number.
25

TABLE Is Evaluated Fission ProductNeutron Cross Section Piles
Library
CCOK161
1971
BENZI/REFFO/PANINI in1969
BENZI/ORAZI 18]
1972
ENDF/B-III 19J
1972
UKNDL t19^
1968
RCNt1^1973
Cross Section
V,ael,ain,atr
127 Groups
°nY {4ann->Pointwise
anyPointwise
anYaelrain,0trPointwise
%25 Groups
%
No. ofIsotopesIn Library
192
142 (+18
80*
58
78
75
No. ofIsotopesUsed
178
1 113
8
55
78
0
Processingfor thisStudy
25 group <3ny0tr and scattering trans-fer matrix25 group On-yonly
25 group
%
25 group 0n-yand addinato the BENZIfile25 group anOfcr and scattering transfer matrix
-
-
Designation
[ COOK-M
COOK-L
BENZI
-
\ BNDF/B
UKNDL
-
These are 80 new evaluations which were added to the 142 isotopesevaluated by Benzi/Reffo
.1203 delayed neutron data were used in the dynamicd
Measurements of Feigcalculations. The delayed neutron spectra were taken from recent
(21]
4. CHANGES IN K -- OWING TO BU AND DIFFERENT FPCS———— i n , , , gf £—————.—————_______————————————————————————————_——————————————
Burn up and static calculations to find K were made for
the GEt16^ and SNR' reactors, using five different FPCS files. Theresults are summarized in Table II. The reduction in K £ is 5% and10% for the 50,000 MWd/t and 100,000 MWd/t cores, respectively in theGE core, while in the SNR core the reduction is 8% and 14%. Theseresults are in agreement with those obtained by itemashita . Thegreater reduction in SNR is due to the higher enrichment of this core.
26

TABLE II: K of SNR and GE Cores beforeerfand after BU Using Different FPCS
FPCS
SOURCE
COOK-M
COOK-L
BENZI
UKNDL
ENDF/B-III
COOK-M
COOK-L
BENZI
UKNDL
ENDF/B-III
General Electric (1968)0
MWd/t
1.021
50 000MWd/t.9635.9729.9723
.9670
.9724
100 000MWd/t
.9183
.9354
.9336
.9265
.9360
SNR (1967)
0MWd/t
1.040
50 000MWd/t
.9548
.9594
.9601
.9540
.9597
Percent of Change Relative to 3ero BU
- 5.6
- 4.7
- 4.8
- 5.3
- 4.8
-10.1- 8.4o £— o.-O
- 9.3
- 8.3
- 8.1 '
- 7.8
- 7.7 /
- 8.3
- 7.7
100 000MWd/t
.8867
.8949' I
.8963
.88|4
.8963
'; i
'•'• -14.7:;,. -14.0f -13.8-14.8
-13.8
TABLE III: Na Void Effect of SNR and GE Cores Before
and After'BU Using Different FPCS
FPCSSOURCE
General Electric (1968) SNR (1967)0
MWd/t50 000MWd/t
100 000 [ 0MWd/t 1 MWd/t
50 000MWd/t
100 000"MWd/t
Percent Ak/k of 100 % Na Void in CoreCOOK-M
COOK-L
BENZI
UKNDL
ENDF/B-III
1.32 1.72
1.86
1,62
2.06
1.73
1.98
2.27
1.77
2.56
1.99
1.68 2.08
2.20
1.88
2.42
2.05
2.262.48'1.84
2:«6
2.20
Percent of Chanqe Relative to Zero BUCOOK-M
COOK-L
BENZI
UKNDL
ENDF/B-III
30.3
29.0
22.8
56.031.1
50.0
72.0
34.1
94.0
50.8
23.8
31.0
11.9
44.0
22.0
34.5
47.6,'*9.5 r \.'
71 ,,4"31.0 '
27

17% as compared with 11% in the GE core. As a result of using differentFSCS, only second order differences were observed in K __ , see Table II.errCOOK-M and UKNDL files gave the greatest reduction, while COOK-L,ENDF/B or BENZI showed smaller reductions in K ... .erf
5. The Na VOID EFFECT
The Na void effect was found to be the most sensitive to thevarious FPCS. The results at zero BU, for 50/000 MWd/t and 100,000 MWd/tcore\ jure given in Table ill for the GE and SNR reactors. Noappreciable difference exists between the two cores of the GE reactors.It is seex from the table that the positive Na void effect is signi-ficantly greater at higher BU. However, there is a discrepancy of 60%between the predictions using BENZI and UKNDL cross sections.
The inclusion of the scattering cross section in the FPCS(COOK-M and EU F/B files) reduces the sodium void coefficient.
TABLE IV; Changes in fuel isotopic composition, at the middle ofthe core due to different FPCS sources __
REACTOR
OS
conceptualdesign of1000 MWe(1968)Ref.16
GE
1000 MWepurePu-239
SNR
Germanprototypedesign(1967)300 MWeRef. 17
BU[rowd/t]
0
§oos0
ooo0o
0
o
8
FPCSSOURCE
COOK-MCOOK-LBENZIUKNDLENDF/B
COOK-MCOOK-LBENZIUKNDLENDF/B
COOK-MCOOK-LBENZIUKNDLENDF/B
Fuel isotOBic composition [%]U-238
34.89
71.3371.2671.2971.4171.18
89.26
74.2074.1074.1574.3074.04
78.83
70.4970.4870.5070.5770.46
Pu-239
8.90
9.079.039.009.059.05
10.74
9.869.819.789.859.83
15.90
11.8211.8111.7911.8611.81
Pu-240 Pxz-241
3.88
4.484.454.454.434.48
0
2.272.242,252.202.29
4.64
5.605.585.595.565.60
1.840.770.760,760.760.7;
0
0.160.160.160.150.16
0.53
0.600.600.600.600.61
PU-242
0.49
0.570.570.570.570.57
0
0.0150.0150.0150.0150.015
0.10
0.160.160.160.160.16
FP
0
13.7113. «713:. 8613.7113.87
0
13.4313.6113.5813.4213.60
0
11.2611.3111.3011.2011.30
28
6. DIFFERENCES IN PLUTONIUM AND FP IjSOTOPIC CONCENTRATION
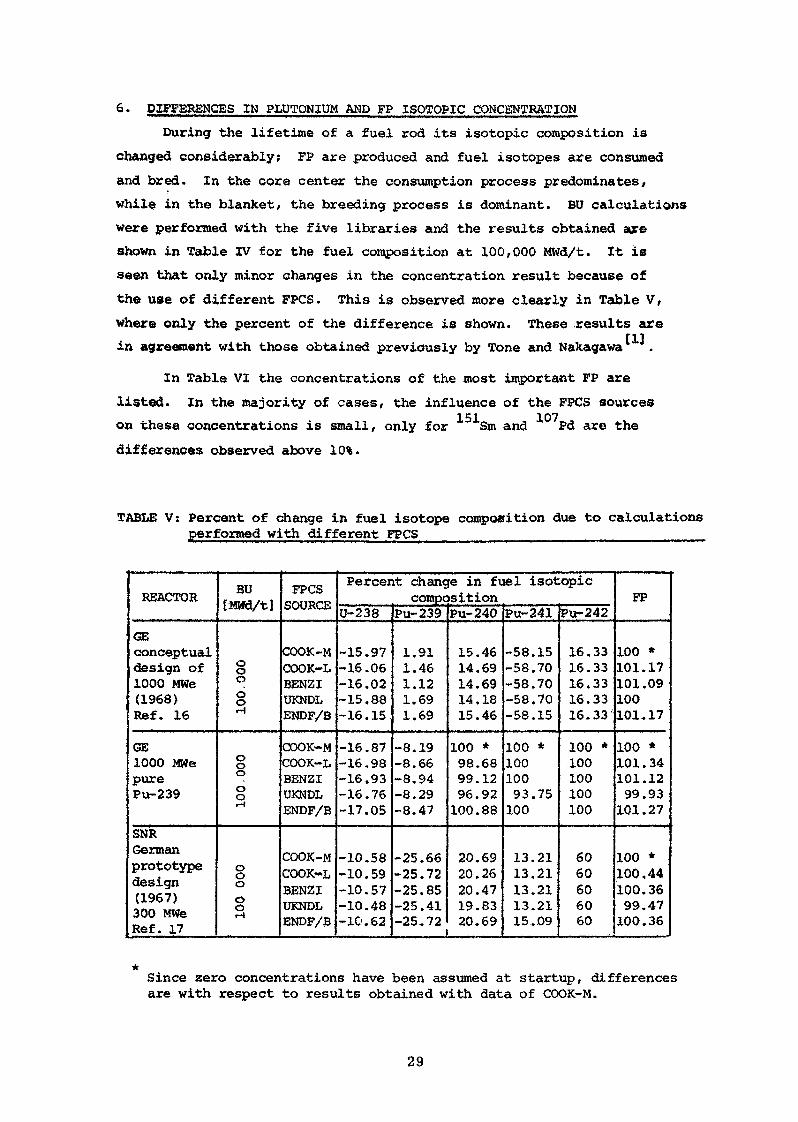
During the lifetime of a fuel rod its isotopic composition ischanged considerably; FP are produced and fuel isotopes are consumedand bred. In the core center the consumption process predominates,while in the blanket/ the breeding process is dominant. BU calculationswere performed with the five libraries and the results obtained areshown in Table IV for the fuel composition at 100,000 MWd/t. It isseen that only minor changes in the concentration result because ofthe use of different FPCS. This is observed more clearly in Table V,where only the percent of the difference is shown. These .results arein agreement with those obtained previously by Tone and Nakagawa
In Table VI the concentrations of the most important FP arelisted. In the majority of cases, the influence of the FPCS sourceson these concentrations is small, only for Sm and Pd are thedifferences observed above 10%.
TABLE V: Percent of change in fuel isotope composition due to calculationsperformed with different FPCS
REACTOR
GEconceptualdesign of1000 MWe(1968)Ref. 16
GE1000 MWepurePu-239
SNRGermanprototypedesign(1967)300 MWeRef. 17
BU[MWd/t]
oo00ofH
Ooooor-l
o0oo0I-J
FPCSSOURCE
COOK-MCOOK-LBENZIUKNDLENDF/B
COOK-MCOOK-LBENZIUKNDLENDF/B
COOK-MCOOK-LBENZIUKNDLENDF/B
Percent change in fuel isotopiccomposition
U-238
-15.97-16.06-16.02-15.88-16.15
-16.87-16.98-16.93-16.76-17.05
-10.58-10.59-10.57-10.48-10.62
Pu-239
1.911.461.121.691.69
-8.19-8.66-8.94-8.29-8.47
-25.66-25.72-25.85-25.41-25,72
Pu-240
15.4614.6914.6914.1815.46
100 *98.6899.1296.92100.88
20.6920.2620.4719.8320.69
Pu-241
-58.15-58.70-58.70-58.70-58.15
100 *10010093.75100
13.2113.2113.2113.2115,09
Pu-242
16.3316.3316.3316.3316.33
100 *100100100100
6060606060
FP
100 *101.17101.09100101.17
100 *101 . 34101.1299.93101.27
100 *100,44100.3699.47100.36
Since zero concentrations have been assumed at startup, differencesare with respect to results obtained with data of COOK-M.
29

TABLE VI: Differences in FP concentrations due to different PPND sourcesafter lQQt_Q_QO_MWa/t BU («1Q20 atoms)___________________
FPElement,
Mo-97
Tc-99
Ru-101
Ru-102
Rh-103
Pd-105
Pd-107
Xe-131
Cs-133
Nd-143
Pm-147
Sm-149
Sm-151
COOK-M
0.598
0.625
0.667
0.846
0.621
0.527
0.350
0.429
0.735
0.457
0.162
0.130
0.060
COOK-L
0.603
0.631
0.673
0.852
0.626
0.531
0.352
0.433
0.742
0.461
0.164
0.131
0.061
BENZI
0.598
0,596
0.665
0.849
0.640
0.477
0.313
0.439
0.722
0.476
0.177
0.131
0.076
UKNDL
0.590
0.599
0.654
0.839
0.616
0.471
0.310
0.436
0.714
0.502
0.166
0.121
0.065
ENDF/B-III
0.595
0.697{*}
0.671
0.833
0.716(*)
0.502
0.345
0.433
0.707
0.458
0.157
0.121
0.053
MAXIMUMDIFFERENCE
%
2
6
3
2.5
4
6.5
13.5
1.5
5
9.5
12.5
8.5
43
{*) For these element ony wag zero (i.e.not given by the library)
7. CHANGES IN & and £ „ AS A RESULT OF BU AND OF DIFFERENT FPCS—————•—— eft ———• erf ————————————————————•—————-—uAfter the termination of the BU calculations, a new criticality
search was performed and K values as shown in Table II wereobtained. The eigenfluxes are normalized and the adjoint flux is alsocalculated using the SHOVAV code. At this stage the kineticparameters are evaluated. Table VII shows the effective delayedneutron fraction £ __, and Table VIII gives the effective neutronef £lifetime fc ««Up to 10% changes in 6 _, are observed during the BU
6£3t e££process as seen in Table VII. This is due to the changes in the ratio
30

TABLE VII: Effect of BU and FPCS on the EffectiveDelayed Neutron Fraction S ff _____ta
Reactor
General ElectricConceptual Design (1968)1000 MWeRef.16
General Electric1000 MWePure Plutonium
SNR-German Prototypedesign (1967), 300 MWeRef.17
FPCSSource
COOK-MCOOK-LBENZIUKHDLENDF/B
COOK-MCOOK-LBENZIUKNDLENDF/B
COOK-MCOOK-LBENZIUKNDLENDF/B
3eff x 103 forCore Burn Up (MWd/t)
0
3.725
3.411
3,029
50,000
3.503
3.323
3.060
100,000
3.3653.4323.4393.4313.402
3.2863.3403.3463.3403.303
3.0883.1253.1313,1233.110
TABLE VIII: Effect of BU and FPCS on the EffectiveNeutron Lifetime - eff(xlO~
6 sec)
Reactor
General ElectricConceptual Design (1968)1000 MWeRef.16
General Electric1000 MWePure Plutonium
SNRGerman Prototypedesign (1967)300 MWeRef.17
FPCSSource
COOK-MCOOK-LBENZIUKNDLENDF/B
COOK-MCOOK-LBENZIUKNDLENDF/B
COOK-MCOOK-LBENZIUKNDLENDF/B
Core Burn Up (MWd/t)
0 50,000 100,000
0.2616
0.2754
0.3245
0.2601
0.2701
0.3395
0.25900.24930.25510.23670.2623
0.26660, 25700.26420.24390.2703
0.34990.34180.35400.32500.3537
31

of the number of fission events in 238.U to the fissions of Pu isotopes,238the latter being poorer delayed neutron emitters than U.
The effective neutron lifetime changes approximately by 10%during the BU process, decreasing in the GE reactor and increasingin the SNR reactor. The differences between the various FPCS arealso of the order of 10%, the UKNDL giving the lowest value and theENDF/B-III giving the highest.
8. SPATIO-TEMPORAL BEHAVIOR OF "CLEAN" AND HIGH BU COKES USINGDIFFERENT FPCS
After the BU calculations were terminated, a four group crosssection set was evaluated to be used with the SHOVAV code. Thetransient was initiated by inserting a step change in the absorptioncross section at the core outer region. This step is equivalent toan abrupt withdrawal of a control rod.
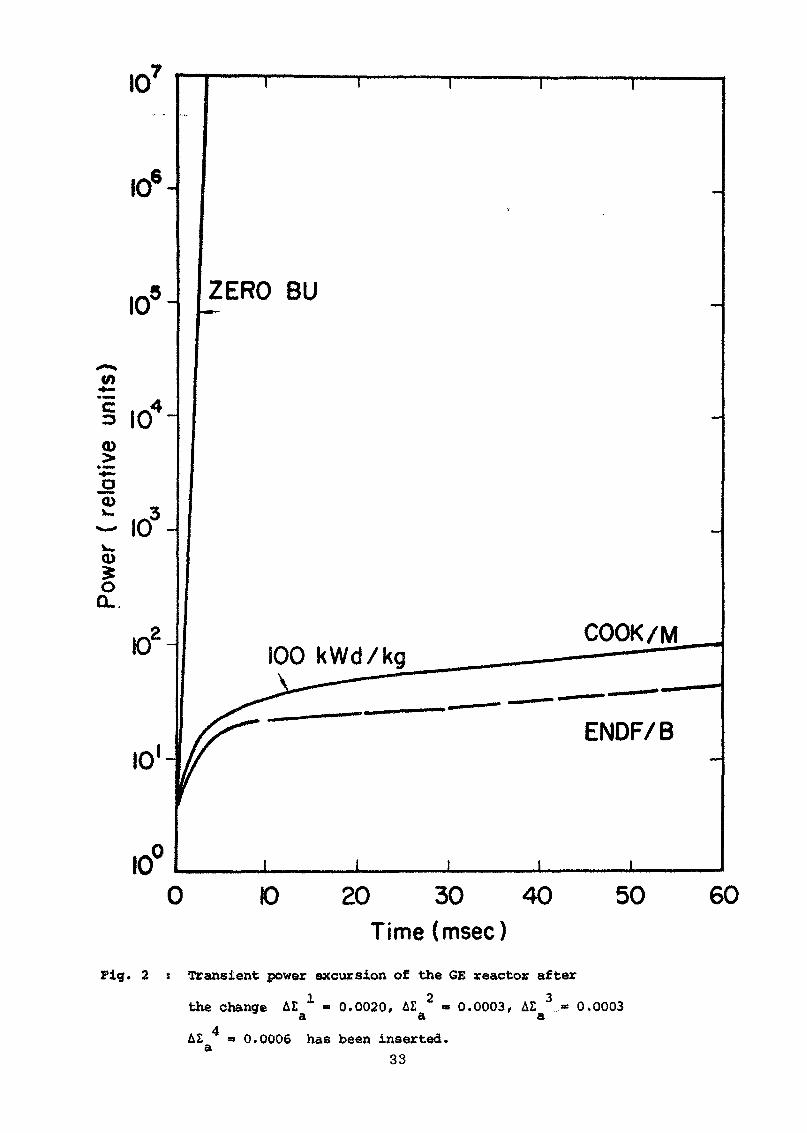
In Fig. 2, the change in the reactor power as a function oftine for the GE core with no higher plutonium isotopes is shown forthree cases. In each case, the same perturbation was inserted, butthe appropriate reactivity was different as explained in Table IX.
TABLE IX: Effect of BU and FPCS on the ReactivityDue to Constant Change in Absorption Cross Section
Reactor,
G.B. 1000 MWeConceptual designRef.16
G.E. 1000 MWePure Pu-239
SNR-GennanPrototype design300 MWeRef.17
FPCSSource
COOK-MCOOK-LBENZIUKNPLENOP/B
COOK-MCOOK-LBENZIUKNDLENDF/B
COOK-MCOOK-LBENZIUKNDLENDF/B
Core Burn Up (MWd/t)
0
$1.030
1.030
1.030
50,000
$0.922
0.815
1.096
100,000
$0.9130.8960.9080.9130.891
0.7880.7660.7810.7860.765
1.1411.1451.1531.1561.144
32
10
100 kWd/kg
20 30 40Time (msec)
50 60
Fig. 2 : Transient power excursion of the GE reactor after
the change 41 0.0020, AE 2 » 0.0003, AE 3 _ « 0.00034
a - - - - - - &
0.0006 has been inserted.33

0 20 40 60 80 100 120 140 160
Z(cm)
Fig. 3 : Initial power distribution in the "clean" and high BU
GE cor* using two different FPCS for the BU calculations.
34

10r5 10-4Time (sec)
icr 10'
Fig. 4 : Reactivity charge as a function of time after a constant step changein the absorption cross section has been inserted.

In the "clean" core the change resulted in a superprompt criticalexcursion while in the 100,000 MWd/t cores the perturbation was inthe delayed critical region. A considerable difference in the powerexcursions after 60 milliseconds is observed. Using the COOK-M FPCSa 100% higher power excursion is obtained as compared with the resultsobtained with ENDF/B-III FPCS. There are several reasons for theabove differences. First and most important is the initial flux andpower distribution. While in the "clean" reactor this distributionis flat giving rise to a considerable flux tilt which increasesreactivity; in the 100,000 MWd/t core the power and flux have a morecosine-like distribution as seen in Fig.3. The changes in reactivityas a function of time resulting from different flux shapes of "clean"and high BU cores are shown in Fig. 4. The small difference betweenEMDP/B and COOK-M curves is due to the fact that these files haveonly a slight effect on the B ~£ and the reactor isotopic composition,as shown in Tables V and VII. Hence, the reactivities inserted indollar units become 0.765 and 0.788 respectively. The other reasonsfor the differences in the transients are different E.p/£ ratiosE C
and different spectra. Only a single example is presented here showingthe large sensitivity of the dynamic solution to the changes -occurringin the core after BU of 100,000 MWd/t and due to the use of differentFPCS. The picture may be completely different in other cases {differentcore size, different core enrichment and Pu composition) i.e. thedifferences in dynamic behavior may be much larger or much smaller.
9- F.P. I EATIVE IMPORTANCE
After calculations with several FPCS libraries are performed, itbecomes apparent that not all the FP are of the same importance. Inthe DLEKAH code the concentration of 380 FP isotopes was calculated.These concentrations were then multiplied by Cook's FPCS to obtainthe macroscopic capture cross sections, which served as a measure oftheir relative importance. In Table X the various FP are groupedaccording to their importance. It is seen that 52 isotopes accountfor 90% of the captures in the FP, and this number seems sufficientfor all practical purposes in BU calculations. This explains why onlyminor differences were found in reactor parameters when using ENDF/B-IIIdata having 55 isotopes, as compared with COOK-M data having 178 isotopes.
36

TABLE X: Grouping of FP's According to their CumulativeAbsorption Effect
„ . _ FP Isotopes in Group (Using CookFission Product Nurnber Percent
- of of Total Data, and in order* as ObtainedElements Absorption ^ Reactor 100 OOQ Mffd/t)
I
II
III
IV
V
Total
VI
Total
Ru-101,13 fiO Pd-105,13 6° Nd-143,
Mo-97
Mo- 95,13 22 Ag-109,13 22 Xe-132,
Zr-93
Sm-147,13 8 La-139,13 8 Xe-134,
Pd-108
Ru-100,13 45 Sm-150," *' Nd-150,
Sm-148
Cd-111 ,13 1 9 Gd-157'1J i>y Sb-125,
Zr- 95
65 96.4
113 3.6
178 100
Rh-103,RU-102 ,Pm-147,
Cs-135,Ru-104 ,Mo-100,
Nd-148,Nd-144,1-127,
Zr- 96,Zr- 91,Ce-144 ,
Rb- 85,In-115 ,Nb- 95,
Te- 99,Pd-107 ,Sm-149,
Nd-145,Eu-153,Sm-152,
Ru-103,Eu-155 ,Pd-104,
Cs-134,Ru-106,Ce-140,
Sm-154 ,Gd-155 ,Pr-143,
Cs-133,Xe-131Ssn-151
Mo- 98Pr-141 ,Eu-154,
Pd-106Nd-146,1-129
Ce-142Kr- 83Cs-137
Gd-156Br- 81Zr-94
Order of decreasing magnitude of the isotope's absorption effect
10. CONCLUSION
The above calculations are by no means comprehensive, only tworeactors - a 1000 MWe and a 300 MWe reactor wars investigated, andonly very simple dynamic calculations were performed, excluding thevarious feedback effects. Nevertheless, it seems that the followingconclusions can be drawn:
37

a) "Clean" and high BU reactors differ considerably mainly- in the sodium void effect which increases by almost 100$in certain oases;
" in eff' which is ch»nged by UP te 10%>- in the affective neutron lifetime, which may change by 10%»- in the transient power excursion which differs considerablyfor "clean" and high BU cores, but the extent of thisdifference depends strongly on the reactor investigated.
b) By using 52 PP isotopes, 90% of the total FP effect of thehigh BU reactor i* accounted for* The differences betweenthe libraries of FPCS used were, therefore, due to theirdifferent cross sections and not because of the differentnumbers of isotopes inserted.
c) The differences between the calculations performed withdifferent FPCS were smaller than those observed between cleanand 100,000 MWd/t BU cores using the same data source.The main differences are again, in the sodium void coefficient,up to 50%. Small differences - of a second order - were foundin I , , 8 ££> an** higher plutonium isotopic concentration.However, in the example shown, considerable differences wereobserved in the reactivity inserted by a control rod withdrawalusing COOK-M and ENDF/B-III data.
REFERENCES
1.) T. Tone and M. Nakagawa, "Effect of FP on PhysicalQuantities Accompanying BU of Large Pu-U Fast Reactors",J. Nucl. Sci. Technol. £, 6, (June 1969) 295.
2.) S. Yamashita, "Variation in Nautronic Characteristics Ac-companying BU in Larae Fast Breeders", J. Nucl. Sci.Technol. 6_, 10, (October, 1969) 573.
3.) J.S. Philbin and R.A. Axford, "BU and Power Shift Effectsin Large Fast Breeder Reactors", Nuclear Technology, 15,3, (Sept. 1972) 327.
4.) J.H. Wright et al, "Conceptual Design and PreliminaryAccident Analysis of a Sodium-Cooled Carbide - Fueled LargeModular Fast Reactor", in Proceedings of the Conference onSafety, Fuels and Core Design in Large Fast Power Reactors,ANL-7120 (1965).
38

5.) M.E. Meek, and B.P. Rider, "Compilation of FP yields",NEDO-12154 (Jan. 1972).
6.) J.L. Cook, "FP Cross Sections," AAEC/TM549 (June 1970).
7.) v. Benzi, and G. Reffo, "Fast Neutron Radiative CaptureCross Sections of Stable Nuclei with 32 $ Z $ 66", CCDN-NW/10Newsletter Bulletin 10, ENEA Neutron Data CompilationCentre, (Dec. 1969).
8.) V. Benzi, H. B'Qrassi, and G. Reffo, "Past Neutron RadioactiveCapture Cross Sections of Stable Nuclei with Z Between 29 and70, HT/PI-(72) 6, (Feb. 1972).
9.) fi.E. Sehenter, and F,A. Schmittrcth, "Cross Section Evalua-tion of 27 PP Isotopes for EJTOF/B-III, ENDF-159 (Oct. 1971).
10.) D.S. Norton, "The UKAEA Nuclear »ata Library", AEEW-M-824(Feb. 1968).
11.) G. Launtenbach, to be published as RCN report.
12.) I. I. Bondarenko, "Group Constants for Nuclear ReactorCalculations", Consultant Bureau (1964).
13.) D. Ilberg and D. Saphier, "DLEKAH - A One Dimensional BUCode", to bft published.
14.) D. L. Falrcloth and M.J. Hoopper, "ICON - A Prograwae forthe Calculation of FP Inventories", AERE-R-6242 {1970).
15.) D. Saphier and S. Yiftah, "SHOVAV - A Pragwwa to Solve theFew Group Space-Time Depaadent Diffusion Equation withTemperature Feedback," IA-1217 (1971).
16.) "Conceptual Plant Design System Description, and Costs fora 1000 MWe Sodium-Cooled Fast Reactor", GEAP-5678 (1968).
17.) K. Gast et al, "Schneller Natrium Gekuehlter Reactor Ha 2"KFK 660 (1967).
18.) Y. Gur, Private communications.
19.) T. Tone and A, Hasegawa, "Multigroup Constants for FP Nuclides:Part III", JAERI - Memo 4251 (1970).
20.) G. R. Keepin, "Physics of Nuclear Kinetics", Addison Wesaly (1965),
21.) G. Feig, "Measurements of Delayed Fission Neutron Spectra ofU-235, U-238, and Pu-239 with Proton Recoil ProportionalCounters", USAEC, CONF-720 901, Book I, TID 4500 (1972).
39

Contribution toReview Pa-per Uo» 4
PHYSICAL PECULIARITIESOP THE PAST POWER REACTOR FUEL CYCLE
V.V. Orlov, O.D. Bakumenko, E.M. Ikhlov,M.Ya.Kulakovsky, M.F.Troyanov, A.G.TzyfcunovInst. Physics and Power Engineerg.,0bninsk,
USSR
Abstracti Main calculated physical characteristics of fast powerreactor fuel are presented in the paper: isotopic composition,fission product activity and residual heat release.
Changes of these characteristics with the cooling timeof the spent fuel are analyzed, as well as the influence of thesevalues on the problem of fuel transportation and the required degreeof fuel decontamination from fission products.
Factors affecting radiation conditions in the process offabrication of fuel elements and assemblies are considered.
1, Introduction
Reduction of the out-of-pile fuel cyr.le timo is one of theeffective ways to increase..the rate of growth of the fast reactornuclear power stations (plants.) f^l* ^ ^nis time is equal tnabout half a year, fast rectors, even those using oxide fuel, mayensure 6-year doubling time and lffs^ t which would allow their fasterdevelopment and would help t9 polve the problem of natural uraniumdemand for nuclear power industry [l, 2],
In order to provide for a short time of the external fuel cycleperformance a great number of problemn nowsected with the .chain offuel movement outside a reactor should, be considered completely.
1. A discharging system of spent fuel assemblies from a reactormust exclude fuel delay. In this connection a technological systemof transpOYtation of a nuclear power plant sh'ould. make fuel dischargepossible without exposure during storage ffc the reactor site.
2. The means of fuel transportation from a reactor to a re-processing plant must ensure safe fuel transport in spite of con-siderable residual heat release euid aot^ity. An alternative f«rfuel transport to a controlled reprocessing plant can be creationof radiochemical facilities at large niwlear power plants, buf insuch a case the problem of high activity waste storage at atomicpower stations arises.
43

3. A special technique for fue!l rod separation and removal ofthe cladding as well as the technolpgy of the chemical reprocessingshould be developed for short cooling times,
4. The fabrication of fuel rods and assemblies of reprocessedfuel as well as the treatment of fuel being introduced into a reactorafter fabrication must be performed 'taking into account t'he specialfeatures mentioned, above. In this case there is a considerabledifference between cases of complete', or incomplete decontaminationof fuel from radioactive fission products.
Technological aspects of aqueous and nonaqueous methods of fuelreprocessing for fast reactors are considered in [3, 4].
The paper presents main calculated physical characteristics offuel for fast power reactors of the BN-600 type: fuel isotopic com-position, fission product radioactivity in the discharged fuel, re-sidual heat release, accumulation of stable fission products andinherent activity of the fuel after reprocessing. These changes ofthe characteristics are analysed depending on the duration of thefuel cooling1 time as well as the effect of these values on the problemof spent fuel transportation and the requirements of the degree offuel decontamination.
Factors affecting radiation conditions of fuel rods andassemblies fabrication from reprocessed fue] are studied.
?. Characteristic Features of Fast Pover Reactor Fuel
Reprocessing of mixed urardum-plutonium fuel for breedersis the principal task of the external fuel cycle. A mixture ofuranium and plutonium dioxides as, probably, to be useci for a.long time as the main fuel for fast reactors, utiliaation ofcarbides and metallic fuels is considered .in perspective. T'hepresent paper gives a consideration of an oxide fuel for breedersthough it is kntfwn that first loadings of the BN-350 and BJv-600reactors would. W:-of enriched uranium dioxide.
High content of fissionable material (10 - 3C$0 is a peculiarityof fuel foip fast reactors in contrast to that of thermal reactors.This fact imposes certain restrictions on nuclear safety during fuelstorage and reprocessing.
Fuel power density in fast reactors is considerably higher thanin thermal reactors. Thus, in a reactor of the BN-600 type this valueis about 150 kwt/kg of an oxide fuel as compared to 40 kwt/kg for alight water cooled power reactor (WWR-1000) [5], Along with this fact,
44

— 3 —
accumulation of fission products of a fuel being discharged from afast reactor is two /to three times higher than in the case of athermal reactor of the water cooled power reactor type. Thereforethe -specific activity of fission products in fast reactor fuelsis 4 - 5 times higher.
One of the main characteristic features of fast "breeders inthe first stage of their operation in a nuclear power system isutilization of plutonium from thermal reactors. At "burn-ups of 30 kgfiss. prod, /ton UOg thermal reactors o^ light water-cooled powerreactor type will produce plutonium of a complex isotopic compositionwith a high content cf higher isotopes. The following composition canbe given as an example [6, 7~]s
Plutonium-239 58$
' Plutonium-240Plutonium-241Plutonium-242 3$
Changes of such an isotopic composition of plutonium during itsuse in a reactor of the BN-600 type arc given in table I. The sametable presents the plutonium isotopio composition that can be obtainedas a result of multiple fuel recirculation at make-up with plutoniumformed in blankets of fast reactors.
"~'l'able I:' Isotdpib composition of fast breeders piutonium
Maximumburn-up
kg f is. prod. /t
0100100* '
239Pu
5860.761
240Pu
2727.228
241Pu
12
8.56
242Pu
33.6
.. 5
*) Equilibrium fuel
A complex composition of Pu with a great number of a-emitting andspontaneous fissioning nuclides influences the fuel cycle technology.
3« jtecu mu 1 at ion of Fig sion Produc t sand Activity of Discharged Fuel
Past power reactors designed for wide use in nuclear power industryachieve a maximum burn-up of about 100 kg fzss.prod,/t of fuel. Itcorresponds to the mean burn-up of •-*/*<> kg fiss.prod./t of the dis-charged fuel.
45

Zirconium, molybdenum, cesium, cerium, neodym, praseodymiumare the main components of solid fission products.
Gaseous fission products with high activity at short coolingtimes of a discharged fuel determine schemes and instrumentationfor gas activity capture in the process of fuel reprocessing.
Table II gives calculated data for gaseous fission productsand iodine activity after discharge from a breeder of the BN-600type without storage at the reactor site (mean burn-up of about80 kg fissoprodo/t, maximum burn-up of about 100 kg fiss. prod./t).Iodine, krypton and xenon yields are taken from [8], data fortritium are taken from [9]
Table II: Activity of gaseous fission products per 1 kg offuel
coolingtime(months)
01
3612
Activity (curie)131, 129TI I
4300 6*10~5320 6*10~5
1.8 6ao~5— ^10 6*.W J
6,10-5
85Kr
3232323130
133Xe
11000210
0.08--
T
0.90.90.90.90,9
Activity of solid fission products remaining in fuel afterKr, Xe, I and T removal are given in Table III. Fission productyields are taken from [8].
Table Ills Activity of solid fission products per 1 kg offuel_______
cooling ____time Curie
(months)
ActivityGram-equi-valent Ra
Main contributors tototal activity
10 days 8.63*104 2. 11* 104
36
12
5 .25 *io
3-2*104 6.6yl03
1.65X10⁴ 2o 58X103
140(Ba+La)s 42$5 95(3r+Kb)s34$f103RuS 756?
95(Zr+Hb)s 57$f14°(Ba+La)s27$f103,Rus
95(ZjM-m))s 84$, 103Rus 7$ 5i 76$ 5 Css 6$
s 51 513$? 44(Ce+Pr)s 10$?
s 6$.
' 46—

The decay heat of radioactive fission products determined with the sameinitial data as above" is shown in table IV for a fuel assembly of aBN-600 reactor (127 fuel rods of 6.9 mm diameter and 75 cm active length.The fuel assembly contains about 23 kg of dioxide).
Table IVs Residual heat release in a core fuel assemblyof a BN-600 reactor
cooling time(months)heat release(kw/assembl.v)
1
9
3
3-5
6
2.0
12
1.0
Fuel discharged from a fast breeder will have a neutron activity. Thevalue of this activity depends on the initial composition of the fuel..Whenusing plutonium with a significant amount of higher isotopes, part of theneutron activity of discharged fuel is caused by spontaneous fission and( ct,n)-reaction in oxygen.
In this paper it is assumed that plutonium produced in thermal reactorsand used for fast reactor fuel fabrication is free from such sources ofneutron activity as 242Cm and 244cm formed in a-fast reactor during operationis a main source of neutron activity of discharged fuel.
The duration of fuel storage before loading into a fast reactor „...influences the rate of Cm formation. This is caused by the fact that Amis formed by 13-decay of ^ Pu which is then transformed into 42 y neutroncapture in the reactor. Fuel storage results in accumulation of ^Am and,therefore, causes an increase of neutron activity of the fuel being dis-charged .
Table V gives data on neutron activity of fuel discharged from a fastreactor (based on ( a,n)-reaction and spontaneous fission of ^^Cn\) u&diex theassumption that accumulation of americium in the process of storage can beneglected. Contribution of other sources to neutron activity was not takeninto account because it was insignificant according to preliminary evaluations.
Table Vs Neutron activity of fuel discharged from a fast breeder
cooling time n , ,- _/ .1.1 \ U 1 3 O Ld(months)_________________________________________________
Activity 6 6 6 6 6neutrons x sec x kg" 3.2x10 2.8*10 2.2ilO 1.5*10 0.7x10
241Fote; the Am concentration in initial fuel is zero.
When 'calculating the data for table V it has been assumed that fuel dis-charge from a reactor is carried out without exposure in an in-pile storage.
If it is assumed that reprocessed fuel has been stored for half a yearand accumulated Am-241 before loading it into a breeder, the neutron activityincreases by about a factor of 2.
47
Calculated results for fuel Y-activity, and, especially, for neutronactivity, depend considerably on the accuracy of available fission productyields and of cross-sections for transplutonium isotope formation. Theuncertainty of the V-activity determination is unlikely to be lower than 30$$the uncertainty in the determination of the intensity of emitted neutrons isevaluated as being a factor 5 /1J2/* This fact stresses a necessity of seriouswork on nuclear data service provision for calculations in connection withnuclear fuel cycles.
4« Transportation of Spent Fuel1 from Fast Power Reactors
Exclusion of an in-pile storage and shortening of the cooling time ofspent fuel complicate considerably the fuel handling of the reactor and theproblem of'fuel transportation from a nuclear power station to a chemicalreprocessing plant. First of all, this is caused by considerable residualheat release of the spent fuel assemblies (see table IV).
Considering the fact that in more powerful reactors an increase of fuelassembly dimensions can be expected compared to an assembly of a BN-600reactor, the residual heat removal will become a serious problem.
The aim should be to ensure heat release without forced cooling? i.e« toprovide natural air circulation. For the transportation of spent fuelassemblies after short cooling times containers with sodium filling are con-sidered /Il7» The heat is removed by air through a ribbed container surface.In work /ll/ the cooling system is studied with the account for an acceptabletemperature on a fuel rod surface of about 700° C with maximum temperature ofa container surface of 80° C.
Such a container should be designed for emergency situations duringtransportation. Particular attention should be paid to the presence of failedfuel elements, as in this case fission products escape into container coolant,The requirements for maximum fuel burn-up achievement made it necessary toallow for the fact that each fuel assembly extracted from a reactor may havedamaged fuel rods. This should be taken into account when designing trans-portation containers -and systems of fuel handling.
Shortening of the cooling time demands increase of shielding from^-radiation.
The. presence of neutron radiation is also important because specialneutron shielding is needed.
5 « Fuel Inherent Activity
The inherent fuel activity is the activity "O'ther than-that due to fis-sion products. When analyzing the inherent fuel 'activity it is assumed thatthe fuel in a cycle is in the form of a mixture of uranium and plutoniumdioxides. It can also be considered that during the cooling period, thetransportation and the production of a new fuel from a reprocessed fuel,Y-activity of uranium-237 accumulated in the fuel in the process of reactoroperation decreases to a negligibly low level (for this 2.5 months will beenough). In this case the following processes will oause fuel, inherentactivity?
48

i) , .Plutonium-241 a-deoay and formation of urani«a*2_37.This process causes the activity of about 0.17 curie/kg(UQ + PuO ).
ii) Plutoniu-241 3-decay, formation of Am-241 with Y-activityaccumulating with the rate of 3«9 curie/kg(TJO + PuO ) per year.
The nature of inherent activity accumulation with time is shown intable VI.
Table Vis Accumulation of fuel inherent -activity
cooling time •(months)
13612
237n
curie
0.17
0.17
0.17
0.17
£.ea0.14
0.140.140.14
Activity per 1 kg
241.Am,Ra curie
0.38
0.98
1.96
3.9
g.eq.Ra
8.10"3
0.0230.047
0.094
As it is seen from table VI, prolonged storage of reprocessed fuelresults in accumulation of Y-activity in Am-241 ? that may rec|u;Lreadditional decontamination from this isotope.Taking the time of fuel inherent activity accumulation equal to 3 months,
one can evaluate the required coefficients of decontamination from fissionfragments activity.
It can be seen from tables III and VI that for decontamination of spentplutonium fuel from Y-activity of fission products to the level of inherentactivity it is necessary that the coefficients of decontamination at chemicalreprocessing for different cooling times should bes
71 month 10g3-6 months 10
Neutron activity in plutonium fuel caused by spontaneous fission of plutoniumand curium isotopes and (a,n)-reaction in oxygen reaches the value of10° - 10' n/sec per 1 kg of U02 + Ptt025 depending on the amount of ^ Am inthe fuel being loaded. The main contribution to neutron activity is made bycurium, therefore its separation during chemical reprocessing is desirable.In this case only the °Pu neutron activity is left, its contribution beingsmaller than that of curium. The value of neutron activity connected with3°pu depends on the content of this isotope in the loaded fuel. The contentof 238 in plutonium produced in thermal reactors at high burn~uf>s is about1% according to JVZJ. Using the data on specific activity from £&_J a valueof the neutron activity can be obtained under the condition of absence ofcurium in fuel.
This value is equal to about 5 »10 n/sec per 1 kg of fuel.

6. Radiation Environment at Fuel Elements and Assemblies Fabrication ofReprocessed Fuel
Plutonium fuel inherent activity requires special measures for handlingof this fuel.
When obtaining the above decontamination coefficients at the time ofchemical reprocessing, the total value of dose rate from fuel elements forreprocessed fuel from a BIT-600 reactor within one month storage afterchemical reprocessing will be 0.3 mcrem/sec at a distance of 0.5 m from afuel element, the maximum dose rate for a fuel assembly will be 10 mcrem/secat the same distance.
Ueutron activity of plutonium fuel affects the radiation conditionsduring handling of this fuel.
Separation of curium during chemical reprocessing will considerablydecrease the neutron activity. There exists a principal difference in hand-ling of the reprocessed fuel in case of deep decontamination of fuel fromfission products and in treatment of fuel incompletely decontaminated fromfission products, from the view point of radiation protection during fabrica-tion of fuel elements and assemblies as well as during repair of the equip-ment.
In the case of deep decontamination of plutonium fuel from fissionproducts, manual operations connected with adjustment or repairing of equip-ment, etc. can be allowed. Incompletely decontaminated fuel requires remotefabrication of fuel elements and assemblies.
7» Conclusion
One of the main problems of the development of fast power reactors isto optimize the economy of the external fuel cycle.
There exist many problems and alternative solutions in connection withthe external fuel cycles
- choice of a suitable technology for chemical reprocessing and- fabrication of fuel|- reprocessing of fuel at large nuclear power plants or at a
centralized plant3 in the latter case the main problem is thetransportation of radioactive fuel p
- deep on? .incomplete decontamination of fuel 5- transportation of fuel with exposure in an in-pile storage or without
it and' some other problems.
Experience is now too insufficient to choose unambiguously an optimalscheme for the external fuel cycle. Such a scheme will, probably, bedeveloped for the needs of modern nuclear power industry. At the same time,investigations of new approaches would create a basis for further progressin this field.
In the solution of all these problems an important part is the dynamicsof the activity decrease and the irradiated fuel heat release at differentstages of a fuel cycle. Despite the known uncertainties of initial data, the

information presented in the paper gives a possibility to evaluate the radia-tion situation at different stages of fuel reprocessing. Although moredefinite conclusions can "be drawn only with the aid of economical studies5these estimations allow a number of important conclusions.
So, in spite of a relatively high "inherent" activity of the fuel, deepdecontamination of the fuel from fission products allows a considerabledecrease of activity thus reducing significantly the problems of fuel elementfabrication.
The problems due to the growth of activity and heat release withshortening of the cooling time of discharged fuel from one year to some monthsare not too serious and enable a considerable shortening of the fuel handlingtime.
Experimental studies of isotopic compositions of nuclear fuel at thetime of discharge and at all stages of the fuel cycle are of great practicalimportance.
Considerable attention should be paid to measurements and verification ofnuclear data on actinides, of data on isotopic composition of fuel and itsactivity.
1. UeiinyHCKHM A . H 0 n .up. HyiM 9$$eKTHBHororopro^ero B a-roMHOH onepreTHKe c CBICTPBIMH peaKiopaMW
9HeprHs", 31, Bbm. 4, 1970, c. 383.
2. OpJIOB B.B0 riyTH .HOCTMCeHHH MajIHX BP6M6H VJlBOeHHH flJIS dBICTpBDCHaTpneBBnc peaKTOpos c OKMCHBM TonjiHBOM. .HoKjiafl, npe,ncTaBJieHHBi&iHa HaCTOHmMH CHMn03MyM; 1973.
3. nieBienKO B.B. H £p, RoKjia.R na IV SKeHescKOK KOH$epemi,HH 1 435.
4 0 BepHTHH y.JU H ,n;p» .HoKjia^ na IV JKeneBCKOH KOH^epeHUHH H? 448.
5o JteriHCOB B o E e K J;PC JIoKjiaji na IVN? 49/p/693.
S o Nuclear Technology, Vol. 17 (3), 1973, p. 217.
7r radecKi-ipHH E.H. n jip. Mccjie^oBaHne HaKonjieHHH3jieM6HTOB B ropKmeM peaKTopa BK-50T. 34, BBin, 3 7 1973 .
So rpeniHjroB A. A, H jip. IlpojiyKTBi MrHOBGHHOro ^ejieHHH ypaHa— 235,ypa.Ha-23S? njiyTOHHH-239 B HHTepsajie 0 - 1 q.
1969.
9 „ Reactor and Fuel Technology, Vol. 12, No, 1, Winter, 1968 -
10. TpH6jiep n. H ap. SnaqeKwe Heonpe^ejieHHOCTMKOHCTpyKu;HM peaKTOpOB, JloKJiaji C-26/102, XejitCHHKH, 1970.
llo Specialists' meeting on handling and transportation of spent fuel elementsfor LMKBR's, Rome, 26 - 28 April, 1972 „
12. Nuclear Technology, Vol. 18 (l), 1973, p. 50

Contributions toReview Paper Ho. 5
FPND HEEDED FOR NON-DESTRUCTIVE BURHTJP DETERMINATION
by K. Debertin, H. RamthunPhysikalisch-Technische.Bundesanstaltj Braunschweig, Germany
ABSTRACT;
There is a need of more accurate fission product nuclear datafor the non-destructive burn-up determination "by means of ?-rayspectrometry and post-irradiation calorimetry. Mean (3-rayenergies and -ray emission pro"babilities of medium- and long-lived fission products are primarily required.
The accuracy of non-destructive "burn-up determination by meansof Y-ray speotrometry depends on the quality of fission productnuclear data. Fission yields and decay constants of the relevant
fission products are rather well known whereas absolute Y-rayemission probabilities (also called absolute intensities) ofimportant burn-up monitors such as Ru/ Rh and Ce/ Prhave an uncertainty of 3?o and more. This may be the dominanterror contribution in the commonly practised methods of Y-rayspectrometric burn-up determination and, therefore, more accuratedata are required.
The knowledge of the Y-ray emission probabilities is not needed,however, if the method described in reference JJ-J is useds Spectra
of well calibrated standard sources of the single fission productsare directly or indirectly compared with the fuel Y-ray spectrum.
The calibration procedures for the standards are such that nodetailed information on the decay scheme is necessary.
Another non-destructive burn-up determination "method /2-j./ is basedon the calorimetric measurement of the decay heat due to (3- and
55
y-radiation of the fission products. The accuracy of the burn-up
value deduced from the measured heat power mainly depends on theaccuracy of
- nuclear data of the fission products (yields, half-lives,
mean p-ray energies? branching ratios, conversion coeffi-cients)
- effective absorption and fission cross sections- the irradiation history " "
- Y-ray absorption calculations.
For cooling times greater than 30 days 95$ of the heat power is,89 91 95 95produced by about 10-15 fission products. ( ySr, J Y, y^Zr, " Fb,
10V l06Rh, 14°Ba, 14°La, 141Ce, 144Ce, 144Pr,...). Mean B-rayenergies are normally obtained from semi-empirical formulae with an
an estimated accuracy of l-2$.~- This procedure could, however,
result in an additional systematic error of the burn-up value.'Therefore? experimental measurements of the mean 3—ray energies(desirable accuracy 1$) are required in order to check thevalidity of the formulae. As Y-rays are not totally absorbedin the calorimeter also branching and conversion ratios of the
mentioned fission products have-to be known.
References
K- Debertin, H. Ramthun,
Bericht FMRB 36/71, Physikalisch-Technische Bundes-
anstalt, April 1971
H. Ramthun, K. Debertin, Atomkernenergie 199 17 (1972)
K. Debertin, H. Ramthun, Atomkernenergie 21, 119 (1973)C. Devillers, 0. Lhi'aiibet, M. Lott, M'Guyen van Dat?F. Dufreche,, ,CEA Bulletin of Scientific and Technical
Information l8l, . 41.- (1973)
BURNUP DETERMINATION BY NEUTRON TRANSMISSION
H.G. Pnesmeyer
Institut ftir Heine und Angewandte Kernphysik der UniversitSt Kiel,Reaktorstation Geesthacht, Fed. Rep. of Germany.
Abstract;A method for non-destructive determination of the residual heavy atomcontent of irradiated fuel is briefly described. Initial studies for235U are based on the neutron resonance absorption at 8.78, 11.67 and12.4 eV. They indicate that this method is applicable to highly irradiatedmaterial because of the absence of strong fission product resonances atthese energies.
Generally resolvable resonances in the total neutron cross section of a certainmaterial make it possible to determine the amount of that material in theneutron beam, once the resonance parameters are known. One has to do atransmission experiment and to measure T(E) = exp (-no (E)) in the re-sonance region. The resonance dips are more or less deep, depending on theresonance cross section, Doppler- and resolution broadening and the number
2of atoms per cm .
In our investigations, which were planned to find unknown resonance para-meters in fission product isotopes, we used gross fission product samplesand found, that big fission product resonances are very rare and that the
235remaining U resonances were almost unaffected by fission products. So235they could be used for U content determination.
The method has the following advantages:2351. it gives an absolute measurement of the U content;
2. it works even when highly radioactive samples are used;2 3P 2 39 ?403-» it can be nxtenden to ' ", "Pu, Pu ajid some fission product
isotopes
4, it is principally nondestructive
57

We have until now tested the method on three samples:
HFR 101: a sample prepared by RON Petten for their integral measurement s,turned down to appr. 60$, originally enriched in U to(MTR fuel)
UOg-Powder: not irradiated, enriched to 2.5 <?„ in U.
UOp-Pellets: from the fuel elements of the KWO nuclear power station,original enrichment 2.8 $>, burnup 18500 MWd/to U
235 *tThe U content of the first sample was measured with an accuracy of$»4?»»whereas for the second sample - fission product resonance influences beingabsent - the difference between our measurements and the figures given by themanufacturer is m, 1%.
235For the first two samples the U contents were known by other measurements.The results of the third sample are "self-consistent" in so far, that for
235 239several resonances analysed in U and Pu the contents differ by lessthan 4$>« They will be counterchecked in the near future by chemical massspectrometric analysis at Karlsruhe.
To conclude, it can until now be said, that the method will give results
with an accuracy of less than 5 %•
58

THE IMPORTANCE OP FISSION PRODUCT NUCLEAR DATAIN BURNUP DETERMINATION
X. Robin*, R. Hageaan**, J. Bouohard*, 0. Frejaville*, R. Vidal*Commissariat & I'Energie Atomique
* Centre d'Etudes HuclSaires de Fontenay-aux-Roses, Department ofReactor Physics and Applied Mathematics, Experimental Physics Section
** Centre dfEtudes KuclSaires de Saclay, Department of Research andAnalysis
ABSTRACT1 AftMeasuring the content of M is the most exact method of
determining burn-aip. A useful supplement to this method is the relative,but non-destructive, measurement of the contents of gamma-emitting nuelidesresulting from fission.
A good knowledge of the fission yields is necessary to interpreti /iflthe results of analysis of the Hd content.
This paper gives results recently obtained in France for thermalneutron fission of U and 2™Pu and for fast neutron fission of 2 U,2»P*f 24°Pu and 241Pu.
I. INTR03XJCTION
An analysis of the fuel makes it possible to determine the numberof fissions that have taken place in the fuel during irradiation. The energyreleased can then be deduced by adopting for each fission some appropriatefigure, which takes into account the nature of the nuclide, the mean energyof the neutron spectrum, etc.
Determining the burn-up by measuring the number of atoms arisingduring fission is an attractive method and is widely employed.
Non-destructive methods, in particular gamma spectrometry, have theT yiflimportant advantage of simplicity, but measurement of the content of Tfd
by mass spectrometry is still the most exact method of determining burn-up.
To interpret the analytical results, one needs a good knowledge -for thermal and fast neutron spectra - of the neodymium fission yields forall isotopes which give rise to fission in reactors.
In the case of the Oklo (Gabon) fossil reactor, the problem ofdetermining the characteristics of an irradiated fuel material arises in anentirely new form.
59

II. NON-DESTRUCTIVE METHODS
II.1. Gamma spectrometiy
"By means of gamma spectrometry the activity of an isotope resultingfrom fission can be measured directly in the fuel. In principle the burn-Hipcan then be deduced, at least in a relative sense.
The measuring techniques have been well developed, and with asuitable method of analysis it is possible to isolate the activity of aparticular emitter in the spectrum. It is assumed, of course, that the fuelzone "seen" by the measuring instrument is precisely known.
The half-life of the fission product considered must be long enoughfor the entire irradiation to be taken into account. Some emitters which aresubject to migration during irradiation are unsuitable for determining burn-up.
In obtaining a fission rate from the measured activity the followingfactors must be taken into account:
(a) Radioactive decay during and after irradiation;
(b) The law of transmission of radiation in the fuel;
(c) The detector efficiency;
(d) The branching coefficient near the gamma energy considered;
(e) The mean fission yield.
Gamma spectrometry is often used to compare the burn-ups of similarsamples* A number'of the above-mentioned points play the same role for allsamples and do not therefore need to be taken into account.
Interpreting gamma-spectrometric measurements involves the use ofthe nuclear constants for the fission products and for the emitters resultingfrom them. The interpretation will therefore be improved by any refinementof these data, but a big additional effort in this direction does not seemessential.
Among the gamma-spectrometry results, more and more attention isbeing paid to the activity ratio ( Cs/ Cs), which indicates the fluencereceived, and hence the burn- up. The full interpretation of this quantityinvolves the capture cross-section of Ca in the neutron spectrum existingin the fuel during irradiation. A better knowledge of the cross-section of•"Cs in the thermal, epithermal and fast ranges is required.
60
H»2. Other techniques
In Prance, methods employing irradiation by neutron fluxes have notbeen developed for the determination of burn-up. These techniques are moresuitable for checking fissile materials in new fuel elements or in waste.
Neutron emission from the fuel, due to spontaneous fission and( «,n ) reactions, increases with burn-up, "but the development of an accuratemeasuring technique based on these phenomena is quite difficult, largelyowing to the presence of curium isotopes.
With a calorimeter it is possible to measure the power released bybeta and gamma emitters. Results obtained in France with pins irradiated infast neutron reactors are in good agreement with theory [l]. Calorimetryappears to be a promising non-destructive method for the measurement of totalburn-up. This work has been described by Mr. Lett in Revue 15 of the BolognaConference.
III. SBfiJLTAHBOUS DETERMINATION OF BURN-UP BY MEASURING HEAVY-ISOTOPECONTENT ATO SEQB'yMlUM CONTENT ....—-- -..- -. -..-
In connection with neutroa-tftudies on reactors, considerable attentionhas been paid in Prance to the exact analysis of irradiated and non-irradiatedfuels [2]. The interpretation of neutron measurements in critical experimentscalls for a good knowledge of the composition of the uranium and uranium-Plutonium standar-ds employed. Using different physical methods (alphaspeotrometry, oscillation, neutron-emission measurements) it has been possibleto check the qua'.'ity of the specimen preparation techniques and the analyses.
For measuring the composition of fuel samples the method of mass—spectrooetry feas been adopted, which gives the isotopio composition of eachelement with high precision. The concentrations of the different elements areobtained by double, isotopic dilution. All concentrations are given inrelative values, referred to one of them (generally U).
In the case of irradiated fuel materials we can compare the compo-sitions before and after irradiation,- taking into account, by calculation, the
2'38 " "slow dis«ppe»ranc» of J U. We can then deduce the number of fissions thathave taken place in the fuel.
The content of an isotope resulting from fission can also be measured onthe same sample. In Francs preference has been given to mass 148 as opposedto mass 99 because of the good solubility of neodymium and because of thepresence of molybdenum among the constituents of uranium-metal fuel elements.
61

The technique of double isotopic dilution developed for uranium-plutonium analysis has been used for measuring the content of neodymium-148.
Comparing the number of .fissions deduced from the change in then «Q
content of heavy atoms and from the content of ^ Nd gives the fission yield.
This technique has been used to measure the TSd fission yieldfrom 235U in (see Refs [4, 5]):
- The fuel of natural-uranium, graphite-moderated reactors;2V5- Fast-reactor fuel containing large proportions of •'•'Uj
o-jc- JJ\1 samples irradiated in fast-neutron spectra. .
The values thus obtained are now being checked on new samples*
The coherence of the results imparts great confidence in the neodymiummethod used for determining burn-up in all types of fuel.
IV. NUCLEAR CONSTANTS USED FOR DETERMINING BURN-UP
IV. 1. Measuring technique ":*Tr'--'l-;:.-"-*" "
The method used in France for the ejcact determination of burn-upis to measure the content of neodymium-148 by double isotopic dilution.
This technique has the disadvantage of being destructive and quitetricky to apply; hence it is costly.
Howevert it has many advantages:•-.
- It gives a good mean value foy the, .sample under study , whateverits nature and geometry?
- Neodymium-148 has well-known advantages as a burn-'up./indiicaturf
- The measuring technique, which is the same for all types offuel, has- been progressively improved and simplified;
•'. / . ''- The additional cost caused by using the double isotopic
dilution method is only a part of the total cost of destructiveanalysis (sectioning and dissolving of the eScmple)V
* ,:: , .,.-- - -The radiochemical method (measurement of the gamma-emitter of
>•• '.'.-'.fission product;, which can be employed in laboratories not possessing amass spectrometer, is less accurate. Apart from the disadvantages of radio-active decay and different fission yields, it is difficu-l-tvto refer themeasured activityv-t« a precise mass of fuel. The pres-eWt limitation of this
62
method does not seem to reside in the inadequate knowledge of the nuclearconstants of the nuclides in question ( Cs, Ce, Zrt etc.). However,it is quite clear that all "basic work relating to these isotopes will "beuseful.
For measuring the content of neodymium-148, the sample used shouldbe perfectly representative of the fuel zone being studied, and the samplingoperation must be performed with the greatest care. The sample is completelydissolved, if necessary using special techniques (plutonium oxide, HTR pellets).The,. quantity of Nd referred to the mass of uranium or plutonium is measuredby double ieotopic dilution using the same tracers as are used to determinefission yields (cf. section III).
In view of the care taken with the measurements, it is necessaryto use precise fission-yield values for the absolute determination of burn-up.
IV* 2. Fission yields for thermal neutron spectra
In the majority of thermal reactors most of the fissions come from235U. numerous measurements have been performed, and there is a significant
1 ylAlack of agreement among the values^ published for the Nd yield. Thediscrepancies are greater than the experimental measurement scatter, so thatthere is reason to suspect systematic errors; the causes of these have notyet been clarified. Further efforts must be made in this connection.
This further work should include intercomparisons among laboratoriesmeasuring the Nd content of fuel samples, and new determinations of thefission yield.
The role of plutoniura-239 increases with irradiation of the fuelsconsidered. Only few measurements of ^ Nd fission yield have been made,since they are rather difficult to perform. Instead of determiningagain, it would be more advisable to measure accurately thesince this is the term involved in comparing widely differing burn- ups. Theaccuracy of this y-j-soAo-M; ratio can be rendered almost independent of theaccuracy for y c * An experiment of this type is at present being conductedin Prance.
219The remarks on Ji/Pu apply also to ^ Pu, for which only few directmeasurements of y*.-, have been carried out.
In thermal- react or fuel the share of U in the total number offissions is far from negligible (4-8$). The term yo^S/^SVi* **1:*-<*L di ersgreatly from unity, is significant in the determination of burn-up. The
63

published values differ widely from one another. The French programme ofmeasurements in fast neutron spectra includes the determination of
A good knowledge of the jSTd fission yields from uranium-233 andthoriura-232 is needed for the development of certain high-temperature reactorfuels* For high buMMips it is necessary to take into account the disappearanceof neodymium-148 as a result of neutron capture. The correction term iscalculated on the basis of the most recent integral cross-section values usedin neutron studies on irradiated fuel.
The Nd yields at present used to determine the irradiation levelof fuel unloaded from a thermal-neutron reactor are:
These values have given very coherent results in the systematicstudy of the composition of natural-uranium fuel irradiated in gas-graphitereactors [4]*
IV. 3« Fission yields for fast neutron spectra
Two sets of fission-yield values are at present in use, one of themvalid for all types of thermal-neutron reactor (moderated with light water,graphite, heavy water.,.,), the other valid for all-fast neutron spectraincluding fission spectra.
This distinction will certainly have to be refined for studying thefuel unloaded from large fast-neutron reactors, where the fissions will beproduced by neutrons of several keV.
The well-known advantage of neodymium-148 as a fission-rate indicatorfor thermal-neutron spectra is that the fission yields for U and °Pu arevery fclose. The first experimental results obtained in France [5] show that
2V3although this may well be the case for ^U and -"Pa, it is\not so for UO A 1
and ^ Pu, which make an important contribution to the fissions in the fuelof a reactor such as Ph&nix, which contains only a small amount of "Hi.
Nevertheless, neodymium is being retained as fission indicator"beoaus* — apart from its numerous other advantages - the measuring techniquesinvolved have been well developed and the results obtained are consistentwith the body of the work carried out on irradiated fuels. In view of thelow capture-reaction rates in fast-neutron spectra, it is not impossible thatsome day another neodymium isotope will be used instead of Nd.
64

So far, only a few fission-yield measurements have been made for, * ll and 3°Pu. These measurements should be repeated with a view to
reducing the discrepancies "between the values so far published.
In recycled fuels, heavily laden with higher plutonium isotopes, aconsiderable proportion of the fissions are due to 'Pa, and the fissionsin the even plutonium isotopes ( Pu, ^ Pu, Pu) and in americiura ( Am)cannot be ignored.
The above considerations justify the French programme of measurementsdescribed in section V.
V. THE PROGRAMME OF MEASUREMENTS NOW BEING CARRIED OUT
V.I. Thermal neutron spectra235 239Analyses are being performed on samples of •'u-Al and Pu-Al
irradiated in the reflector of a thermal reactor. The number of fissions inU is measured from the change in isotopic content of the uranium. In the
239case of Pu, the method of isotopic dilution with natural uranium is usedto measure the difference in the plutonium contents of two samples (oneirradiated, the other not irradiated) which have been previously comparedusing a physical method (measurement of neutron emission).
*
235 239In this way it is possible to measure U and 'Ptr-fi-ssion yieldswith the same technique and the same tracer, which gives good accuracy for they239/y235 ratio used in comparing widely differing burn- ups.
The results obtained on the first experimental facility gave thefollowing values for the Nd yield from thermal fissions
235U: y($) . 1.68 £ 0.03 ( 2 a )239Pu: .._. y(#) » 1.71 +0.04 (2 a.) - — - ——
A fresh irradiation to a highor integrated flux is now being carriedout. The above values will thus be checked during the second half of 1974.
When this measurement programme has been completed, the results willbe combined with those obtained in analysing other types of fuel with aview to adopting a new set of fission yields for determining burn-tip fromthe content of Nd.
65
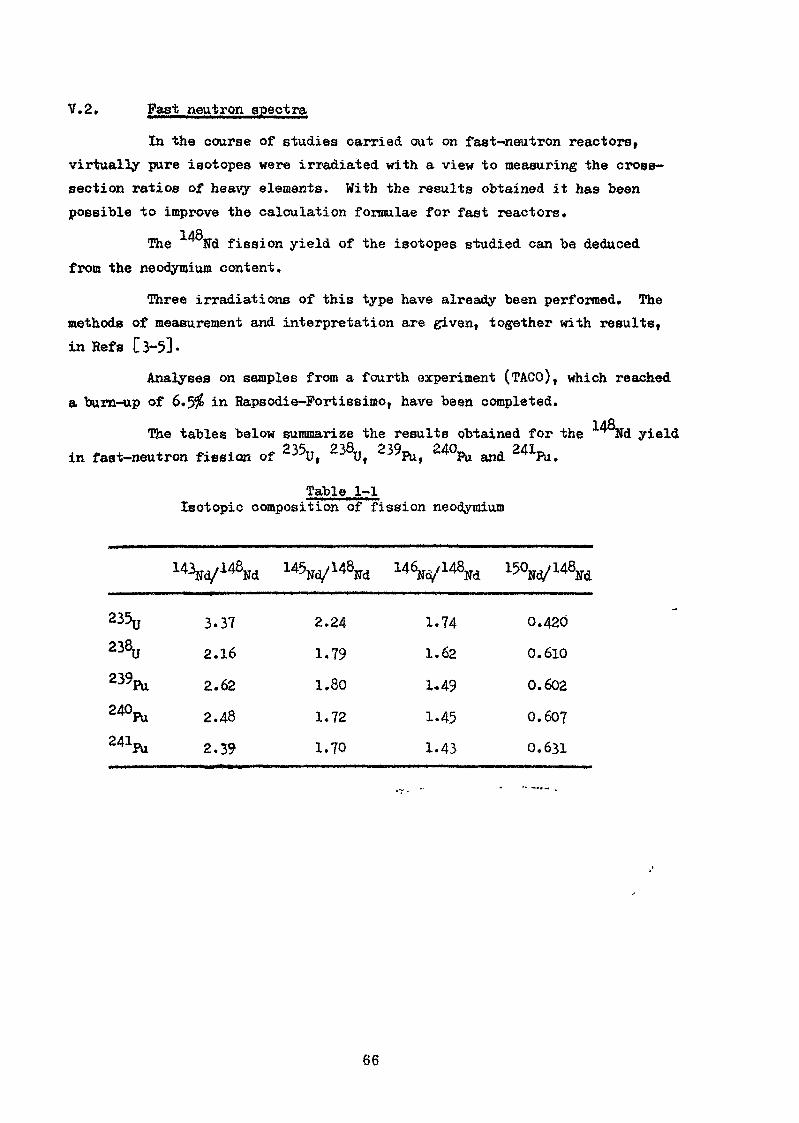
V.2. Past neutron spectra
In the course of studies carried out on fast-neutron reactors,virtually pure isotopes were irradiated with a view to measuring the cross-section ratios of heavy elements. With the results obtained it has beenpossible to improve the calculation formulae for fast reactors.
1 >iAThe Hd fission yield of the isotopes studied can be deduced
from the neodymium content.
Three irradiations of this type have already been performed. Themethods of measurement and interpretation are given, together with results,in Refs [3~5J.
Analyses on samples from a fourth experiment (TACO), which reacheda burn-<ip of 6.5$ in Rapsodie-Fortissiino, have been completed.
•I .Q
The tables below summarize the results obtained for the TJd yieldin fast-neutron fission of 233U, 238Ut 239Pu, 24°Fu and 241Fu.
Table 1-1Isotopic composition of fission neodymium
23^238y
239Pu24°Pu241Pu
3.37
2.16
2.62
2.48
2.39
2.24
1.79
1.80
1.72
1.70
1.74
1.62
1.49
1.45
1.43
0.420
0.610
0.602
0.607
0,631
66

Table 1-2148M yields
y + Ay(2 o)
1.70 + 0.03238U 2.30 + 0.020
\L 1.74 + 0.05
24°Pu 2.00 + 0.20241PU 2.05 jh 0.10
The mass spectroraetric measurements on these samples have beensupplemented by radiochemical measurements, carried out by Mr. Blachot atGrenoble. On the basis of the first results it has been possible to measurethe •* Cs and -4Gs fission yields, and the capture cross-section of - Cs.In the course of the present work the fission yields obtained for thesehighly irradiated samples will be grouped with those obtained in short-durationirradiations.
Samples of separated isotopes (heavy isotopes and fission products)irradiated in the same Rapsodie-Fcrtissirao assembly (TACO experiment) areat present being analysed b,y Dr. "Coch of the Institute for transuranicelements at Karlsruhe. The Iff. fission yields will be compared with thevalues obtained on French samples. The figures thus obtained in two independentlaboratories will be of great value.
With the start- up of the Fhe'nix breeder reactor a new irradiationexperiment will be begun on separated isotopes (the PROFIL experiment). Theneutron spectrum is much softer than the Bapeodie spectrum and resembles thatto be expected in future reactors. The pin contains 46 samples ( (J,
239 240 241 242
The purpose of this experiment is to compare the measured reactionrates with those predicted by the fast reactor calculation formula. ._.
Prom the content of neodymium, measured for each heavy isotope -''-A'sample, the fission yield of the neodymium isotopes will Tje determined. Theresults obtained will be extremely useful for measuring ihe burn-up of recycledPlutonium, containing a very large amount of higher isotopes.
67

The mass spectrometry measurements will "be supplemented by radio-chemical measurements, which will give the distribution curve of the fissionproducts as a function of atomic mass for each nuclide.
These experimental results are expected to be available during thefirst half of 1975.
The migration of fission products constitutes an important problemin the design of all types of power reactor (fast-neutron, high-temperature,light-water, etc.). The experimental programme at present being carried outin Prance will provide various constants characterising the migration phenomenaof fission products.
VI. THE OKLO FOSSIL REACTOR
In September 1972 the C.E.A. announced the discovery of a fossilnuclear reactor situated in the Oklo uranium deposit in Gabon.
The presence of uranium highly depleted in U (2 %/2^ U <0.5)and of characteristic fission products (neodyraium, samarium, xenon, krypton,etc.) provides evidence of nuclear reactions which" took place almost4'2000 million years ago.
This fossil reactor is clearly of great interest from the point ofview of fundamental research. Definition of the reaction zones, anddetermination of the reactor's age and duration of operation, and of theconditions governing the initiation and control of the nuclear chain reactionare the aiost important pwbleme to b* eolued here.
A significant point to be stressed in the case of the Oklo fossilreactor is that this is the first time that we have had available a fuelhaving already reacted very strongly and containing only stable elementscorresponding to the ends of the fission chains.
The studies being carried out at present are concerned particularlywith the chemical and isotopic analysis of uranium and fission products,which should yield data relating to the operation of the reactor: fluence,spectral index, fission number, conversion factor. The duration of thereaction can be determined from the isotopic composition of the elementsproduced by neutron capture on elements- .resulting from fission and having ahAlf-life of the same order of magnitude as that estimated for the reactor.
68

In order to make use of the measurement results, fundamental datarelating to fission yields and neutron capture cross-sections in the thermaland epithermal range are necessary. Such data are needed in particular forNd, 5m, To, Ru, Kr, Xe, I, Cd and Pd. Confirmation of the values of theseconstants, or new measurements of the constants, are desirable in respect ofthese elements.
Conversely, once the operating conditions of the fossil reactor haveteen determined, reactor samples could be used to measure the fission yieldsof certain elements in this environment, whose particular advantage lies inthe fact that it is inactive.
REFERENCES
[l] C. DEVIL1ERS, G. LHIAUBET, M. LCTT, N'GUYEN VAN DAT, P. DUFKECHE,Calorimetric measurement of the residual power in fuel elementsfrom Rapsodie-Portissimo (in French), Bulletin d*InformationsScientifiques et Techniques No. l8l (May 1973)•
[2] Neutron study of plutonium in thermal neutron reactors (in French),Final Report of C.E.A.-EURATOM contract 002.64.9 TRUF "Recyclagedu plutonium".
[3] J. BOUCHARD, J.Y. BARRE, R. BOYER, M. DARROUZBT, G. PREJAVILLE,Measurement of integral cross sections of heavy isotopes byirradiation in fast neutron spectra. Conf. BHES - Chemical NuclearData - Canterbury (September 197l).
[4] M. ROBIN, J. BOUCHAHD, M. DARROUZET, G. FREJAVILLE, M. LUCAS,F» PROST-MARECHAL, Determination of the 148-Nd in the fission of235-U, 238-JJ and 239-Pu. by thermal and fast neutrons. Conf. BNESChemical Nuclear Data - Canterbury (September 197l).
[5] J. BOUCHARD, P. CHAVARDES, M, DA8ROUZET, J. aOURDOK, M. ROBIN,Experimental study of burn-up in fast breeder reactors. Conf. ANS -New Developments in Reactor Physics and Shielding - Kiamesha Lake(September 1972).
69

Measurement of Burn-up of Irradiated. Fuelby Analysis j>f Gamma-Bay Spectra
i TASAKA and HoTsuo 3ASAMOTO
Japan Atomic Energy Research InstituteTokai-mura, Naka-gim, Ifoaraki-keas JAPAN
ABSTRACT
The reliabiiily of fission product nuclear data ore examined through the burnup*
measurement of the irradiated fuel of JRR-4 by analysing the gamma-ray spectra of
small samples which were cutted from the MTR-type fuel plate. The fuel assembly is
irradiated for about 4 years in the core and the gamma-ray spectra are measured using
a Ge(L?) detector after cooling for 522 days.
ft is pointed out through the analysis that the improved data of the gamma-ray
abundance of each FP nuclide are necessary to get better accuracy of a burnup measure-
ment.
1. Measurement of Gamma-Ray Spectra
Three disk samples (5.3mm diam. x 1.3mm, U-A1 Alloy) are made from the MTR
type fuel plate, which has been irradiated for about 4 years in the core of JRR-4
reactor. The irradiation history is shown ?n Fig. 1. The reactor fs operated usually
4 times a week, and the power averaged for a month is shown in the figure.
Japan Research Reactor No.4 is a swimming pool type reactor which is
constructed for shield research .
71

to
200.0
§PU
a) 100.0oo
I
Jl
n
n.
11
II1966 1967 1968 1969
Date
Fig. 1 Irradiation History of JRft-4 Reactor

»*
J-JCO
<fii;
:-
* 2
o 3~ >
i ~ * - ». J • > 2
£ T M x '? A > f iJ i J. s
K«*
vf
\M»
Fig, 2 Ganma-ray spectrum of the sample(002).
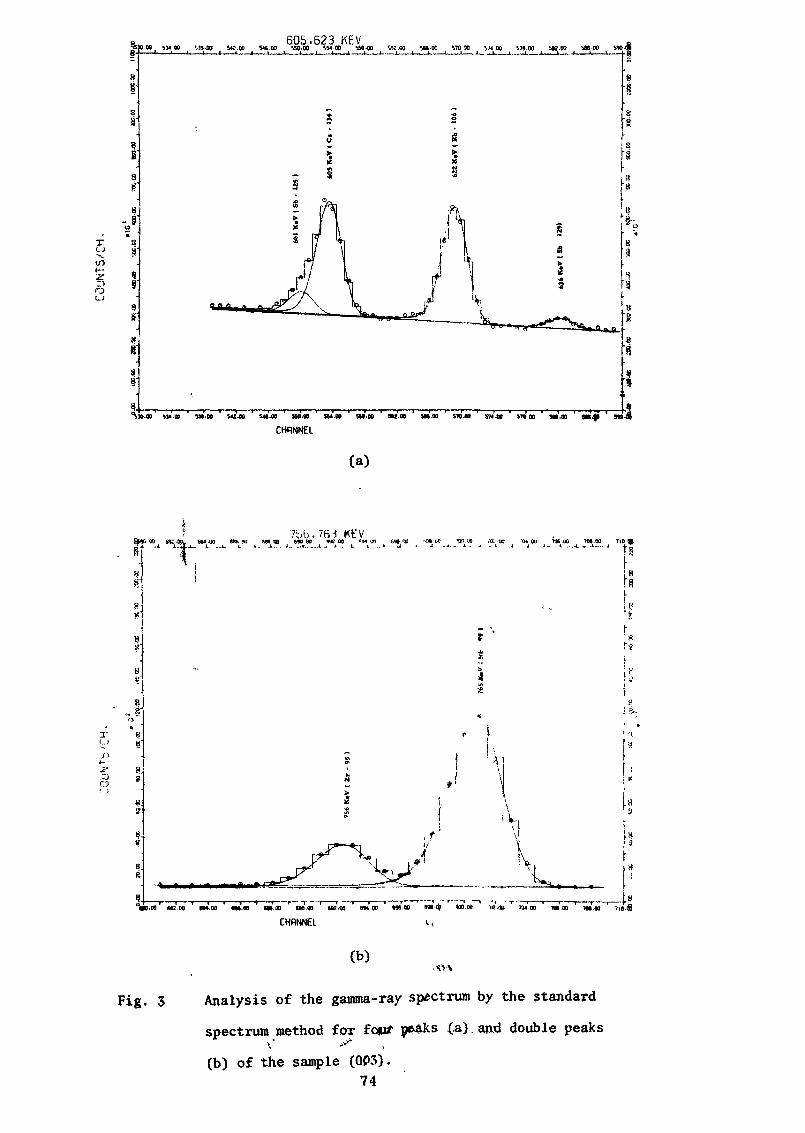
605.623 KF.V
IC..J
I—2?o
CHRNNEL
(a)
rc>
o
_ 5 7C.G.76:!ft» » «K .00.. MM UO 8W. W VM 00 MC W W .1z. . .j. i.(i._i_, L. —v i i,, i.,. A-. ..^.—.L._ t. .C.OO.. H1: 7MW 71041
t5LRrs
!8r*
\
<VH.OQ MI-GO IM.QO «•».» n».go 00.91 ate.oo »«.oo UB.C
CHRNNEL704.00 106.00 TO.OO
_..«
^ 1
(b)
Fig. 3 Analysis of the gamma-ray spectrum by the standard
spectrum method for font p*4ks (a), and double peaksjS~
(b) of the sample (003).74
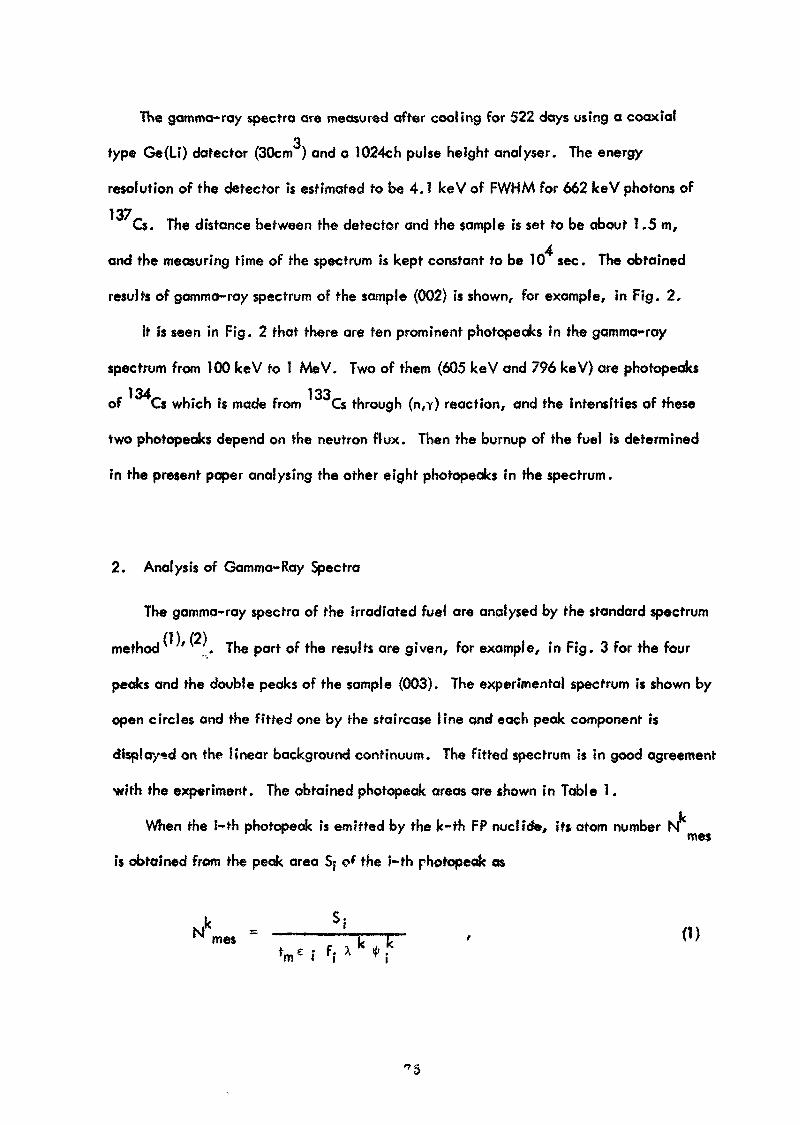
The gamma-ray spectra are measured offer cooling for 522 days using a coaxial
3type Ge(Li) detector (30cm ) and a 1024ch pulse height analyser. The energy
resolution of the detector is estimated to be 4.1 keV of FWHM for 662 keV photons of
137Cs. The distance between the detector and the sample is set to be about 1 ,5 m,
and the measuring time of the spectrum is kept constant to be 10 sec. The obtained
results of gamma-ray spectrum of the sample (002) is shown, for example, in Fig. 2,
it is seen in Fig. 2 that there are ten prominent photopeaks in the gamma-ray
spectrum from 100 keV to 1 MeV. Two of them (605 keV and 796 fceV) are photopeaksI QJ i t\f\
of Cs which is made from Cs through (n,y) reaction, and the intensities of these
two photopeaks depend on the neutron flux. Then the burnup of the fuel is determined
in the present paper analysing the other eight photopeaks in the spectrum.
2. Analysis of Gamma-Ray Spectra
The gamma-ray spectra of the irradiated fuel are analysed by the standard spectrum
method . The part of the results are given, for example, in Fig. 3 for the four
peaks and the double peaks of the sample (003). The experimental spectrum is shown by
open circles and the fitted one by the staircase line and each peak component is
displayed on the linear background continuum. The fitted spectrum is in good agreement
with the experiment. The obtained photopeak areas are shown in Table 1.
When the i~th photopeak is emitted by the k-th FP nuclide, its atom number NT mej
is obtained from the peak area 5; of the 5-th photopeak as
me$ - _ , (1)
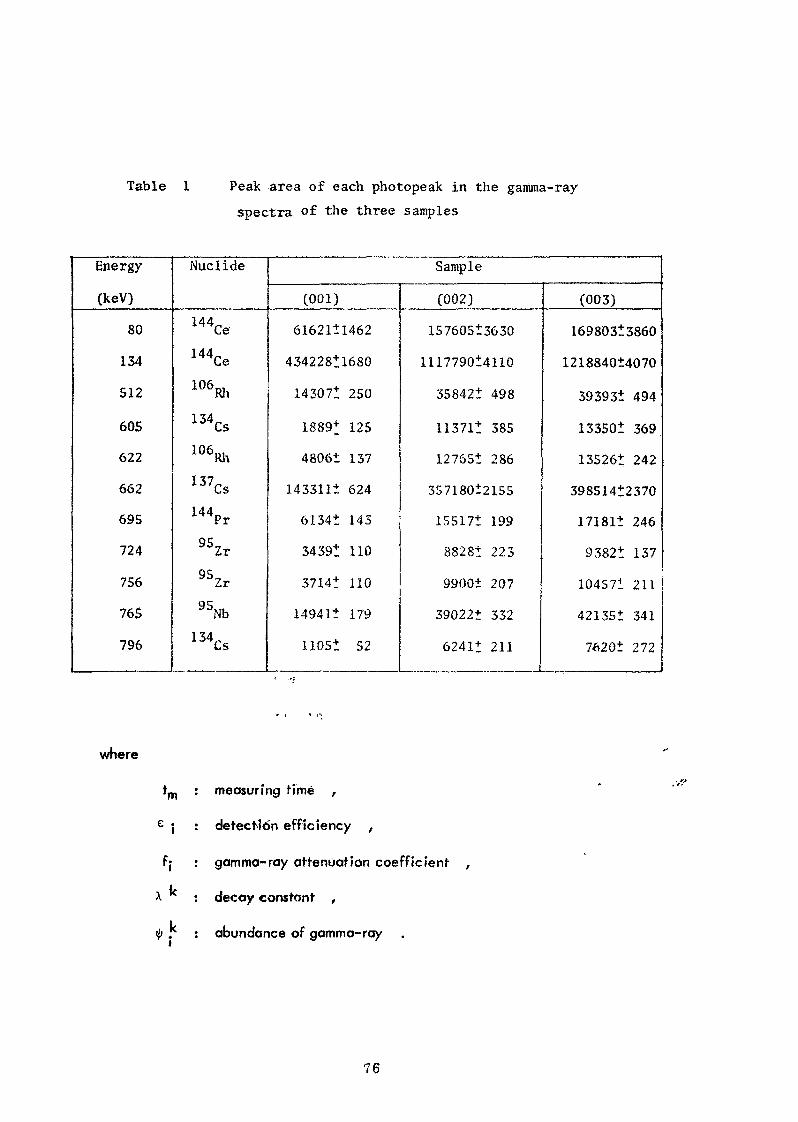
Table 1 Peak area of each photopeak in the gamma-rayspectra of the three samples
Energy
(keV)
80
134
512
605
622
662
695
724
756
765
796
Nuclide
144Ce144Ce
106Rh
134Cs
106Rh137Cs144DPr95_Zr9S_Zr95Nb
134Cs
Sample
(001)
6162111462
43422811680
143071 250
18891 125
48061 137
143311+ 624
61341 143
34391 110
37141 110
149411 179
11051 52
(002)
15760513630
111779014110
358421 498
113711 385
127651 286
357180i2155
155171 199
88281 223
9900t 207
39022i 332
62411 211
(003)
16980313860
1218840+4070
393931 494
133501 369
135261 242
39851412370
171811 246
93821 137
104571 211
421351 341
76201 272
where
: measuring time ,
: detect-idn efficiency ,
: gamma-ray attenuation coefficient ,
: decoy constant ,
: abundance of gamma-ray
76
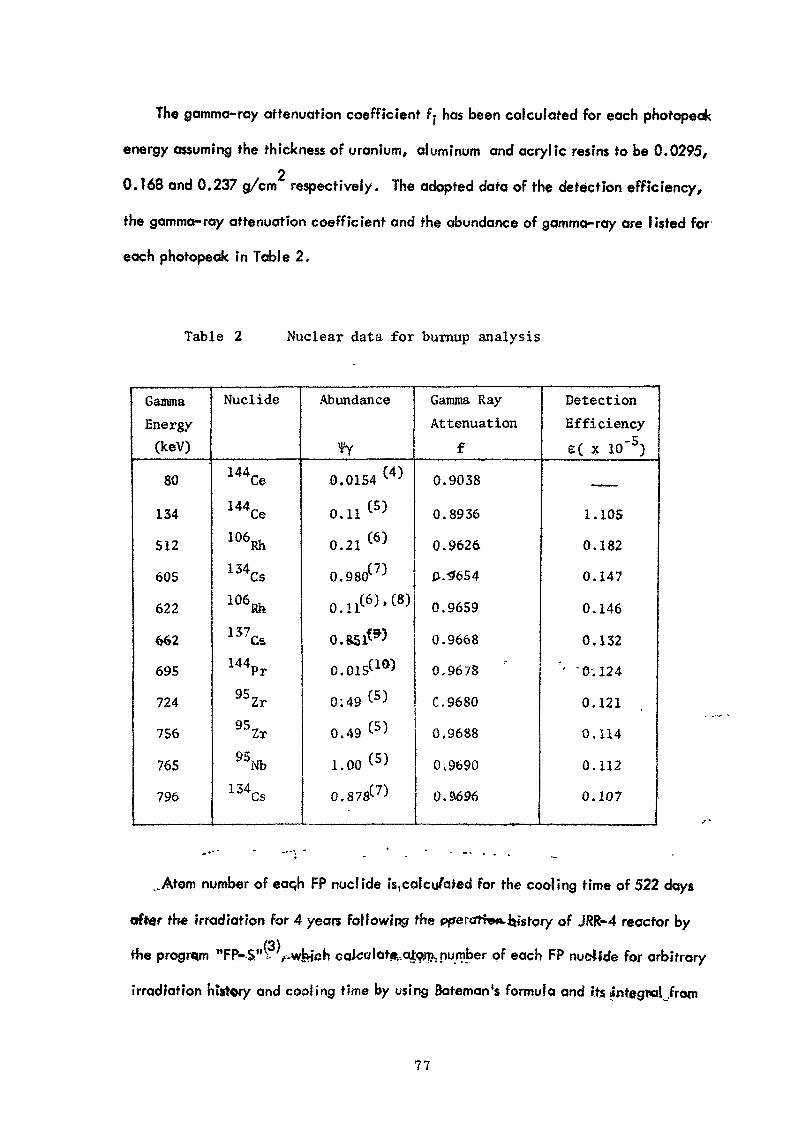
The gamma-ray attenuation coefficient f- has been calculated for each photopeak
energy assuming the thickness of uranium, aluminum and acrylic resins to be 0.0295,2
0.168 and 0.237 a/cm respectively. The adopted data of the detection efficiency,
the gamma-ray attenuation coefficient and the abundance of gamma-ray are listed for
each photopeak in Table 2.
Table 2 Nuclear data for burnup analysis
GammaEnergy
(keV)
80
134
512
605
622
662
695
724
756
765
796
Nuclide
144Ce144Ce106Rh134Cs106Rh
137Cs144Pr
95Zr95Zr95Nb
134Cs
Abundance
0.0154
0.11 C5)
0.21 <6>
0.980C7)
QaiC6),C8)
O.KlW
0,015<10)
0:49 C5)
0.49 (5)
1.00 (5)
0.878^7^
Gamma RayAttenuation
f
0.9038
0.8936
0.9626
P.*654
0.9659
0.9668
0.9678
G.9680
0.9688
0,9690
0.9696
DetectionEfficiencye( x 10"5)
T _ _ _ _ _ _ _
1.105
0.182
0.147
0.146
0.132
'' '0-.124
0.121
0.114
0,112
0.107
..Atom number of eaqh FP nudide is,calcu/ated for the cooling time of 522 days
after the irradiation for 4 years following the pjseratiw».Jjisrory of JRR-4 reactor by/3\
the program "FP-S"V ^-wtnch cakolatft.aio^ number of each FP nu&Mde for arbitrary
irradiation history and cooling time by using Bateman's formula and its integral .from
77

repeatedly. The results are shown in Table 3 as the ratio (Nk/F) . between the atomcal
number of each FP nuclide and the heat generated by fission. The nuclear data used
for the calculation are also shown in the table. Then the burnup of the fuel is obtained
to be
mes mescal
(2)
Table 3 Calculated ratio between atom
number and burnup.
Nuclide
05J*Zr9SNb106nRu
106Rh
137Cs
144Ce144pr
Half Life
65 d
35 d
367 d
30 s
30 y
2S4 d
17.3m
Decay Const.(I/sec)
71.234 x 10
72.292 x 10
n
2.186 xSLQ
2.311 x 1C'2
7.327 x 10"1D
0
2.825 x 1Q '
6.678 x 10" •'
Cumulative Yield
6.1823
6.3917
0.3979
0.3979
•' ' ,; 6..1822
•(l 5.3845
5.3845
(N/F)cal.(atom/W.sec)
5.263 x 10⁵
6.119 x 10
1.732 x 10
1.647 x 10²
1.824 109
1.460 x 10⁸
6.120 x 10³
The obtained results of burnup of the three samples are shown in Table 4. These
results are strongly dependent on the nuclear data in Table 2 and 3. Among them the
abundance of gamma-ray is most inaccurate and there are targe differences among the
experimental data. The present results of burnup measurements changes considerably
from peak to peak, which is also considered to result mainly from the inaccuracy of
the abundance or each photopeak (cf. Table 4). The values of abundances'in Table 5
are' recommended in the present paper to make tlie present results of fFfe burnup
78
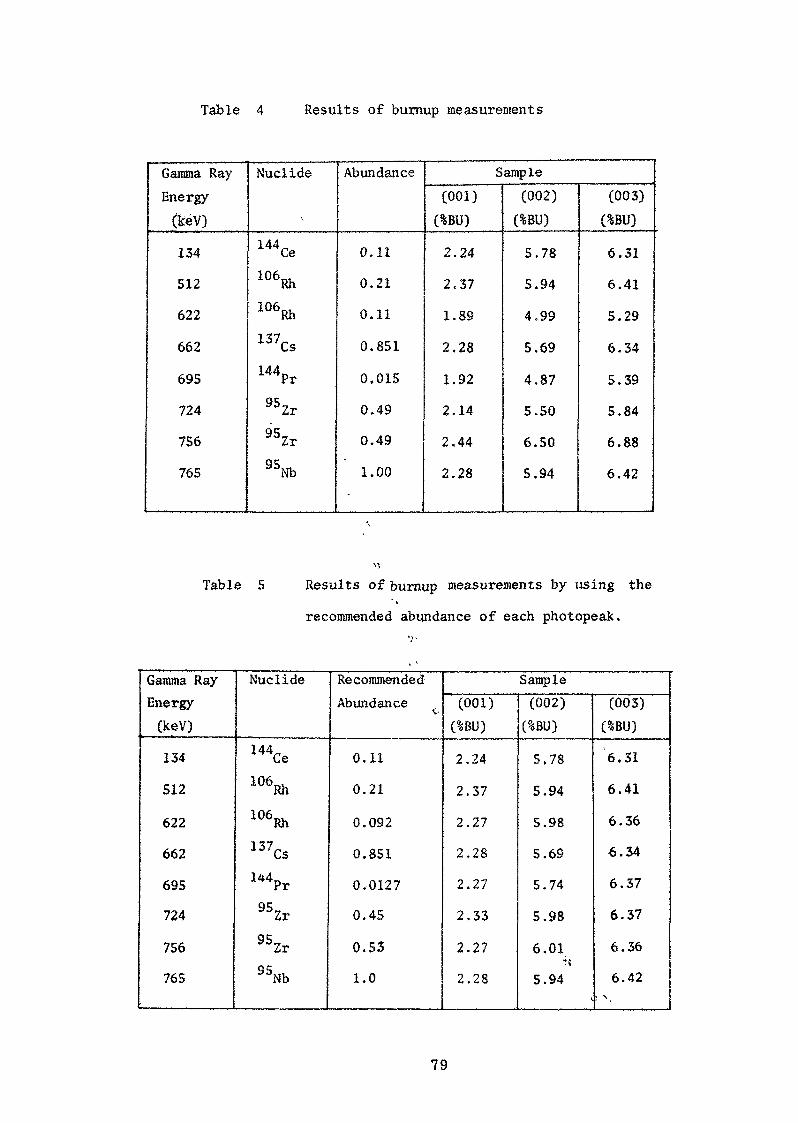
Table 4 Results of burnup measurements
Gamma RayEnergy
(keV)
134
512
622
662
695
724
756
765
Nuclide
144Ce106Rh106Rh
137CS144Pr
95Zr95Zr95Nb
Abundance
0.11
0.21
0.11
0.851
0.015
0.49
0,49
1.00
Sample(001)
(%BU)
2.24
2.37
1.89
2.28
1.92
2.14
2.44
2.28
(002)(%BU)
5.78
5.94
4.99
5.69
4.87
5.50
6.50
5.94
(003)(%BU)
6.31
6.41
5.29
6.34
5.39
5.84
6.88
6.42
Table S Results of burnup measurements by using the
recommended abundance of each photopeak.
Gamma RayEnergy(keV)
134
512
622
662
695
724
756
765
Nuclide
144roCe106Rh
I06Rh
137Cs
U4Pr95Zr95ZrS5Nb
RecommendedAbundance
0.11
0.21
0.092
0.851
0.0127
0.45
0.53
1.0
Sample(001)(%BU)
2.24
2.37
2.27
2.28
2.27
2.33
2.27
2.28
(002)(%BU)
5.78
5.94
5.98
5.69
5,74
5.98
6.01
5.94
(003)(%BU)
6.31
6.41
6.36
6.34
6.37
6.37
6.36
6.42
79

measurement consistent from peak to peak. The results of the burnup measurement by
using these abundances are also shown in Table 5. They are considerably in good
agreement for every peaks. The maximum deviation of the results amount to 4%, 6%
and 1% for the sample (001), (002) and (003) respectively by assuming that the results
137from the 662 keV photopeak of Cs is correct.
3 . Discussions
The recommended abundance 0.092 for the 622 keV gamma-ray of Rh is
approximately equal to the value by Ambiye and Sharma who proposes the abundance
ratio ty (622 keV) / <J* (51 1 keV) of 0.44 which corresponds to the abundance iji (622 keV)
of 0.093 because ^(51 1 keV) is equal to 0.21 . Others propose the abundance ratio
* (622 keV) / *(51 1 keV) of 0.52(12) or 0.53(8)' (13\ but the data by Ambiye and
Sharma is the latest one among them and considered to be most reliable. The present
results of burnup measurements also support the value by Ambiye and Sharma.
144The recommended abundance 0.0127 for the 696 keV gamma-ray of Pr is
smaller than 0.015 or 0,016 by Porter and Day and by Graham et a{ . respectively.
144The decay constant and the cumulative fission yield of Ce are considered to be
fairly accurate because the burnup of the sample is accurately determined from the
144134 keV photopeak of Ce. Then it is natural to consider that the existing value of
144the abundance of the 696 keV gamma-ray of Pr is too large,
The recommended abundances 0.45 and 0.53 respectively for the 724 keV and
756 keV gamma-rays of Zr are close to the values of Mtttelman who proposes the
abundances of 0.43 and 0.54 for the 724 keV and 756 keV gamma-rays respectively
through the analysis of tlie beta-ray spectrum measured by using a magnetic spectro-
meter. Drabkin er ol . proposed the abundances of 0.55 and 0.43 for 724 keV and
''. 80
756 keV gamma-rays respectively from the specfrum analysis of beta-rays. The present
recommended values fall between the results of these two measurements.
The nuclear data of the decay constant, fission yield and gamma-ray abundances
of each fission product nuclfde, and also the gamma-ray absorption coefficients of
fuel and structual materials are necessary for a burnup measurement by the gamma-ray '
spectrum analysis. Among these nuclear data the gamma-ray abundances are most t
* C U, I IT CD |.J L 957 95KIU 106D 106DL /~maccurate for the long life FP nuciides such as Zr- Mb, Ru- Rh, Cs,
144 144Ce- Pr etc. which are useful for a burnup measurement. Then »f is necessary to
ttimprove the data of the gamma-ray abundance for the above mentioned nuciides to get
better accuracy of a burnup measurement by the gamma-ray spectrum analysis. It is
also important to determine practically the most probable values of these nuclear '0*0*0
through the analysis of the gamma-ray spectrum of fission products of the irradiated fuel .
References '« .i
1 . K. Tasaka, Method of Standard Spectrum Fitting for the Analysis of Gamma-Ray
Spectra from Semiconductor Detectors, J. Nucl. Sci, Technol ._9J7), p. 430-432
(1972).
2. K.. Tasaka, Standard Spectrum Method for the Analysis of Gamma-Ray Spectra
from Semiconductor Detectors, Nucl. fnstr. and Meth. 109(3), p. 547-556 (1973).
3. K. Tasaka, N. Sasamoto, FP-S: Program for Calculation of Atom Number for
Each Fission Product Nuclide, JAERI-1198 (1971).
4. M.A. Wakat, Catalogue of y -Rays emitted by Radionucl ides, Nuclear Data
Tables 8, p. 445-666 (1971).
81

5. C.M. Lederer, et a\.r Tobies of kotopes Sixth Edition, John Wiley & Sons, (1968).
6. B. Kahn, W.S. Lyon, Phys. Rev. 92, p.902 (1953),
7. D.E. Raeside, et af., Nuclear Physics A93, p.54 (1967).
8. O.J. Segaert, etai., Nuclear PhysicsJj$, p.138 (1960).
9» H.H. Honsen, et aL, Z.F. Phys Ik 218 , p.25 (1969).
10. F.T. Porter, P.P. Day, Phys. Rev. U4, p. 1286 (1959),
11. S.Y. Ambfye, R.P. Sharmo, Nucl. Phys. 29, p.657 (1962).
1?. R.L. Robrrvson, eta!., Phys. Rev.JHf, p.1692 (I960).
13. M. Grigor'ev, etal., Bull. Acad. Sci. USSR, Phys. Ser. 22, p.191 (1958).
14. R.L. Graham, et al., Can. J. Phys. 36, p. 1084 (1958).
T5. P.S, MiMetoian, Phys. Rev. 94, p.99 (1954).
16. G.M. Drabfeln, etal., Izv. Akad, Nauk SSSR, Ser. Ffz.J9, p. 324 (1955).
82
Problems Encountered in Burnup Determinationof Oxide Fuel Specimens with a High Rod Power
H. Wertenbach
Institut fiir Radiochemie - Projekt Schneller Briiter
Kernforschungszentrum Karlsruhe
'Hi-I
Abstract
This work is an indication of the restriction with respect to theaccuracy of burnup analysis through migration of the fission productsand the heavy atoms an l, of errors produced in the conversion of atompercent of burnup into fffljfd/tonne „
It is not considered necessary to achieve errors lower than 1 - 2 % forthe fission yields of U-235 and Pu-2J9 and of 2 - 5 % for Pu-24l bothin the thermal and in the .fast spectra.
"83
1. Introduction
A method always applicable in the determination of buraup is thefission product isonitor-heavy atom technique. Besides the deter-mination of the concentration of the fission product nsonitor andof the heavy atoms with an accuracy of 0.25 relative percent *the fission yield of the nsonitor is required to compute the burnup.
The thermal fission yields for U-2 5 and Pu~239 are presentlyassociated with an error of 1 - 2 %, Therefore* the accuracy of theburnup analysis is limited essentially by the errors of th© fissionyield determination. Consequently, attempts are being made toincrease the accuracy of fission yields, above all thfet of fastfission yields .
This work aims at indicating additional factors upon the accuracyof the burnup analysis.
2. Migration of the Fission Products and of Heavy Atoms
It is known that besides the fission products Cs, Ba, etc. alsouranium and plutonium undergo migration during irradiation. A uniform,annular enrichment of plutonium in the columnar crystal zone at theedge of the central channel of irradiated UOg* PuOg fuel rods has beenregularly observed. In addition to this norssal uranium-plutoniumdemixing process transports have been observed with the capsule testgroup FR 2-4a studied at the Karlsruhe Nuclear Research Center, whichbecome effective over larger distance in the axial direction withinthe outer fuel zone and at the edge of the fuel 2) 3).
During irradiation of the capsule test group PR £~4a in the thermalneutron flux power peaks occurred at the extremities of the rod. Thiaproduced a temperature gradient in the axial direction which waslinked to a material transport. Broadening of the central channel atthe extremities and narrowing in the center of the rods has beenobserved with many specimens */.
The radial and axial uranium-plutonium-detaiJclng process was detectedby o-autoradiography and measurement with microprobes. Burnup de-terminations were also performed with the specimens of the FR2 cap-sule test group b&. Sections of 8 - 13 mm length ware cut from the

central part of the 80 mm long fuel column. Upon dissolution of thespecimens the concentrations of Ce~l44, Nd-148 and of the heavy atomswere measured as described in KFK 1704 ).
The results are summarized in Table 1.
For all specimens good agreement becomes evident between the burnupvalues found via Ce-144 and Nd-l48, By contrast, 2 burnup values de-rived by computation from plutonium depletion deviate considerably.
Considering the isotope composition of plutonium and taking the Pu-242fraction as a measure of the fluence, specimen 21 should have thehighest and specimen 25 the lowest burnup, while the specimens 20 and27 should be approximately identical.
Table 1. Burnup Determination with Specimens of the FR2 CapsuleTest Group 4a
Specimens No.
Atoms Pu/atom UAtoms Pu-242/atom PuBurnup /kt.jf/ viaCe-144Nd-148Pu-depletion
20
0.0660
0.0575
9-769.679.66
21
0.05600.0726
9.589.6810.50
25
0.06820.0536
9.779.649.48
i -
27
0.07000/0588
10 ,-5110J149.»
There is no doubt that the burnup values have been falsified bymigration of the fuel.
In these specimens the rod power was very high. It amounted to about650 W/cm.
Contrary to the heavy nuclei fission neodymium itself does not seem tomigrate in the oxide fuel. Although measurements with the microprobeperformed at specimens from the irradiation Mol 7A 5) showed that Ndhad accumulated radially by about 12 % at the central channel, plutoniumwas found to accumulate by some 28 % in the same direction.
85
Since the fission cross-section of plutonium-?39 1$ higher than thatof U-235 -most of the fissions in this irradiation took place at a *»c ,neutron energy of 10 eV- the higher concentration of Nd in the vicinityof the central channel can be explained by the higher fission rate ofPlutonium
As a matter of fact, an axial differentiation of plutonium was observedalso for these specimens. A 2 % difference was measured with themicroprobe between the rod center and the rod extremities ^', Therod power was 500 W/cm and the maximum value was 560 W/em.
Results of burnup are also available for specimens examined in the capsuletest group 4b . For 8 specimens the burnup was determined via Ce-144,Nd-148 and the depletion in plutonium. The Nd-146/Hd-l45 ratio was takenas a measure of the neutron fluence. It was estimated that the errorsof the burnup do not exceed 5 percent "'. The error introduced in theburnup determination with undisturbed specimens is estimated to be
Some results obtained from the FR2 capsule test group 4b will be dis-cussed now.
Three specimens eacU wore taken from some rods of the capsule testrig 49 of this group and subjected to burnup analysis. The results aresummarised in Table ?.
It appears from the burnup values that in case of specimen 4 Bll-6there is a considerable difference between the burnup values derivedfrom plutonium depletion and from the fission products. On account ofthe Nd-l46/Nd--l45 ratio and due to the position of this specimen in thereactor (between the specimens 4 Bll-J and 4 B12-2) the burnup valuesobtained via the fission products should be higher by 10 % while theburnup value derived from the depletion in plutonium should be lowerby the same amount. This falsification could be easily explained by theassumption that uranium has condensed at the point of the burnup spec-imen. Also in these specimens the rod power was about rjQO w/cm.
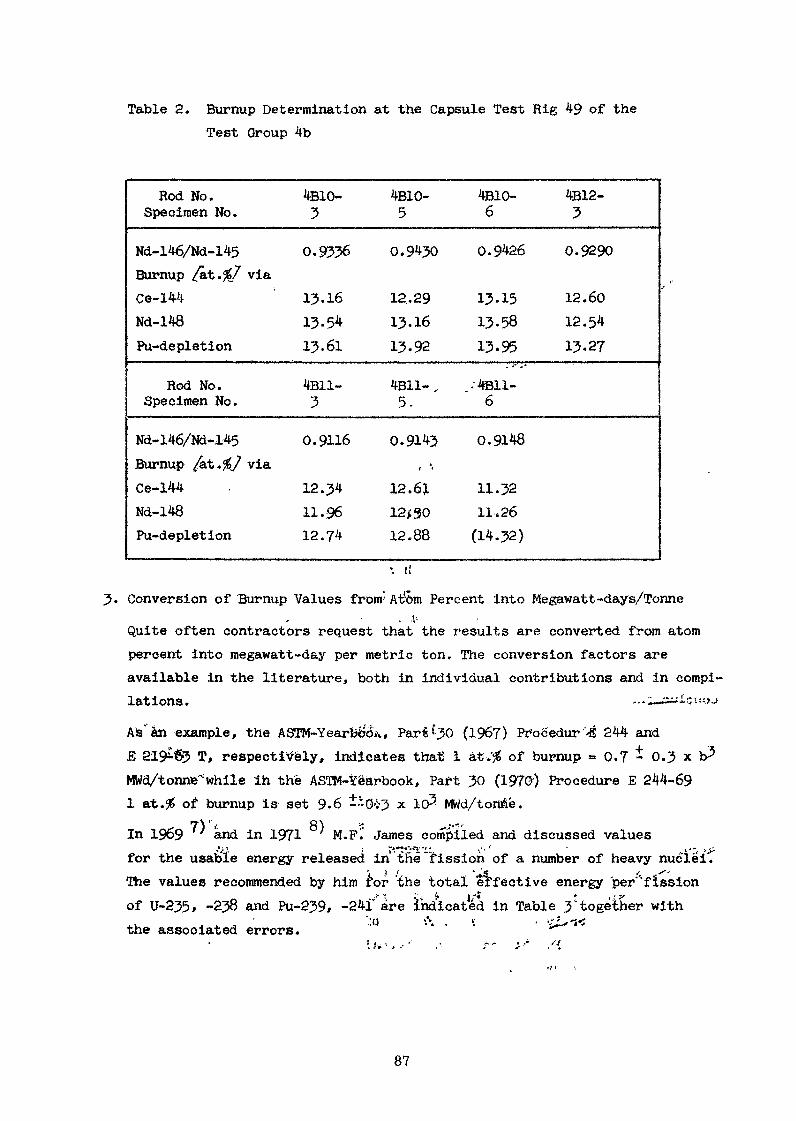
Table 2. Burnup Determination at the Capsule Test Rig 49 of theTest Group 4b
Rod No.Specimen No.
Nd-l46/Nd-l45Burnup /at .%} viaCe-144Nd-148Pu-depletion
Rod No.Specimen No.
Nd-146/Nd-l45Burnup /a&.%J viaCe-144Nd-148Pu-depletion
4B10-3
0.9336
13.1613.5413.61
4B11-3
0.9116
12.3411.9612.74
4B10-5
0.9430
12.2913.16
13.92
4B11- ,5.
0.9143i i
12. 6112*3012.88
4B10-6
0.9426
13.1513.5813.95
.. •- - *
/4B11-6
0.9148
11.3211.26(14.32)
4B12-3
0.9290
12.6012.5413.27
3. Conversion of Burnup Values f rom-At&m Percent into Megawatt-days/Tonne. v
Quite often contractors request that the results are converted from atompercent into megawatt-day per metric ton. The conversion factors areavailable in the literature, both in individual contributions and in compi-lations . --- i-Si-'-Oi«.*J
As'an example, the ASTM-Yearfc&k, Pari'30 (1967) Pi*ocedur' 244 andE 219 63 T, respectively, indicates that 1 at.'# of burnup = 0.7 - 0.3 x bMWd/tonne'-'while In the ASTM-Yearbook, Part 30 (197G') Procedure E 244-691 at.# of burnup is set 9.6 i-G*3 x 10 MWd/tonAe.
In 1969 ' and in 1971 ' M.Pl,' James compiled and discussed valuesfor the usable energy released in"the"fission of a number of heavy nucieiCThe values recommended by him £or the total effective energy 'permissionof U-235. -238 and Pu-239, -2*1'are Indicated in Table 3*together withthe associated errors.
87

Table 3, Total Effective Energy per Fission
Nuclide
U-235U-238Pu-239Pu-241
Spectrum
thermalfission spectrumthermalthermal
MeV/Fission
201,7 - 0,6205,0 ± 0,9210,0 - 0,9212,4 i 1,0
Based on these values we calculated the conversion factors at.# - MWd/tonne to be 9-50 x 10? for U-2J5, 9-62 x 105 for U-2}8, and 9.80 x id5. h\for Pu-259, the error i>eing approximately - 3 # '.
The errors introduced in the conversion factors can be considerablyenhanced in the irradiation of highly enriched test elements in smallreactors. So, values ranging from 194,4 to 199.6 were found in EBR IIinstead od 20J MeV/fission and for highly enriched uranium even190 - 192 MeV/fission 9>.
If in the fission yields errors not higher than 1 % are strived for,the usable energy release from the principal fission nuclides shouldhave to be known with approximately the same uncertainty.
4. Conclusions
The statements io Chapters 2 and 3 lead to the conclusion that frequentlythe accuracy of the burnup analysis -above all for ceramic mixed fuel witha high rating- is not predominantly determined by the error in the fissionyields. The migration of fission products and heavy atoms may rather giverise to major errors unless a complete rod is available for analysis. Theftacuracy is further reduced by the errors contained in the conversionfaotortK Although fission yields with an error of only t i % are desirablefor the fission of U-235 and Pu-2j9 with fast and thermal neutrons, theymight not necesswUjf be required, Errors of 1 - 2 % for U-235 and Pu-239and of 2 - 5 % for Pu-2 1 undergoing thermal and fast fissions couldrepresent adequate values.
88
Literature
1) W.J. Maeck, R.P. Larsen, J.E. ReinBurnup Determination for Fast Reactor FuelsTID - 26209, 4 (1973)
2) W. Dienst, 0. Gbtzmann, H. Kleykamp, G. Ondracek, B. Schulz,H. ZimmermannAuswertung der Untersuchungsergebnisse an den bestrahltenU02-Pu02-Brennstaben der Versuchsgruppe FR2 - 4aKFK 1727 (1973)
3) D. Freund''\ i
Ausle,gung, Bestrahlung und Nachuntersuehung der Oxidbrennstabproben ~;im FR2
4) H. Hoffmann, H. WertenbachAbbrandbestimmung an den Kernbrennstoffprlif 1 ingen aus dem FR2 '
i
KFK 1704 (1973)
5) W. Dienst, K. Ehrlich, O. Gfrtzmann, H. Hoffmann, H. Kleykamp, L. >§chafer,B. Schulz, H. Zimtnermann ''"U02-Pu02-Brennstabbtindel~Bestrahlung Mol 7A "Auswertung der Untersuchungsergebnisse an den taestrahlten Brennstaben
KFK 1736 (1973) ii
6) H. Wertenbach, E. Qolz, E. Gantner, K. Matern |Abbrandbestimmung an Proben der FR2-Kapselversuchsgruppe 4b und an \Kriechproben i2. Vierteljahresbericht des Projektes Schneller BriiterKFK 1273/2 EUR 4970 d 115-1 (Sept. 1973)
7) M.F. James. Journal of Nuclear Energy
Vol. 23517-536 (1969)
89

8) M.P. James. Journal of Nuclear EnergyVol. 2551>523 (1971)
9) L.B. Miller, A. GopalakrishnanTransactions of the American Nuclear Society, 1972 Annual Meeting,Vol. 15 No. 1, 487-488
Annex
Significant Data on the Specimens Dealt with in this Work 3) 5)
SpecimensCapsule Test Group4a 4b Mol 7A
FuelCompositionU/Pu /wt. 7Uranium enrichment/"wt. 7Composition ofPlutonium 239/240241/242 /wt. 7
Density {% of TD/0/M ratioLength of fuel column/mm/Diameter of fuel column/mm/Irradiation
ReactorBurnup /WWd/kg7Rod power /W/cm/
85/15 85/200.7
80/2079
90.9/8.21/0.85/0.04 91/8.2/0.74/0.04
84 891.9880
6.25 5.12
thermal
FR285 80650 500
88.41.985.00
5.01
epith«r»al(Cd~»hielding)
BH245 max.
560 max.
90

The Influence of Fission Product Nuclear Data Uncertainties:
On a Method of Plut on itm Determination from the Burn-up. Data in— - - - ' - — - ; r L- : 1
< . -J.r --T-_I_L-_- _j _ . L ,i " "T'L- .-I'— -- _ .1— -rrr
Irradiated Nuclear Fuel
L. Sch&chter, D. Hacman, O. MotInstitute of Atomic Physics
Bucharest - ROMANIA
Abstract
A method, regarding the possibility to determine the Pluto-
nium contents in an irradiated nuclear fuel by using the burn- up
measuring data is presented., „,
The method has been applied to fuel irradiated in the Bucha-
rest WR-S reactor at 1o% $urn -up, (After 600 days of cooling time.
The Plutonium determination is qufeted to be in error by 7%. A study
of the influence of the uncertainly, introduced by the FPNDr on tho
final results is carried on*; |
It was found that a half-life error of 1 .5% contributed
1 . 8% uncertainty to the final results .
A Description of the Method
Starting from a well-known initial number of U nuclei,* ft! < ") 1 2 "3Qthe method tries to determine the (U , Pu ) fissile material
r <•' ' If*
concentration in a plutonigen fuel sample, by employing the method""*** srof burn-up determination by means of the (1,2,3,4,5) gamma spectro-
_ _ , / . , , *•, -\-r^rf- '>* .t*P • <metry.
«' * * ' O iCIn order to determine 1:he separate burn-up of U and
239Pu , the fuel sample was measured after an adequate cooling time
91

and two fission products were chosen, namely Cs and Ru and
one of them exhibits different fission yields for U235 and Pu239
(Ru106).
In order to obtain the real number of nuclei of the mea-
sured fission products* corrections concerning the irradiation
history as well as the selfshielding correction was ap-
plied.
When the fuel boundles having the elements displayed in
a certain configuration have been determined, a geometric in-
trinsic factor characterizing the measuring data has been de-
termined.
Figure 1 shows the influence of this factor, which
takes into account the reciprocal influence; of the fuel rods
forming the bundle unit in case o'f an axJlal burn-up distribu-
tion.
Knowing the number of nuclei of Cs and Ru ° , the235 239number of fissions of U and Pu was determined by
solving-the following system of equations!
F1 " ———— . (1)
where:5 235* .... is the fission yields 4.a Uq 23QY* .... is the fission yields ift Pu*e 235F .... is the number of fis$.ions in Uq 339F .... is the number of fissions in Pu**
235Knowing the initial number of IT fissile nuclei wvd2 *x ^the number of fissions in U , F, f rom equation (I), the
92

235number of U fissile nuclei extant in the fuel after irradiation
was determined (N ) .
239The residual number of Tu nuclei in the fuel was de-
termined by a measurement of Ba - La resulting from a
new short, exposure in a neutron flux. This new irradiation
had to he sufficiently short not to change the content of
fissile material and h*id to he performed after the Ba140_]-ja1 40
produced in the original irradiation had decayed to an un-
measurable amount.
The Ba - la oair has been chosen according to the
following criteria:
- The BaUO- La1/!C fission yield ( Y_ ) is 6.44# forDel
U235 and <5.7^> for Pu239 thermal fission.
- The h a l f - l i f e of Ba1:/!0 ( T1/?Ea. ) is 12.8 days, which
requires an irradiation of one day or less in order to
avoid corrections for decay during irradiation.1 40- T t^ direct descendant , La , has a ha l f - l i f e of 40 hour?
and a negligible i ndependen t f i s^on y ie ld .
A f t e r ahout 12 days of Irradiation the exponential de-
cay of La1/1° fo l lows the hal f - l ife of Ba1^0 . La140 emits a
1.6 WeV gamma-ray with an absolute intensity of 9&&, which
appears as sufficiently isolated arid marked neak in a e;amma
spectrum. At this energy self shielding "--tiorrection is negligible.
Another important feature of Ba -La. is, that no
change in its yield from thermal to epi thermal fission has
been observed within' ;§^pe"rimental error, which means that it
is rather ind"e"peridenf of neutron energy
93
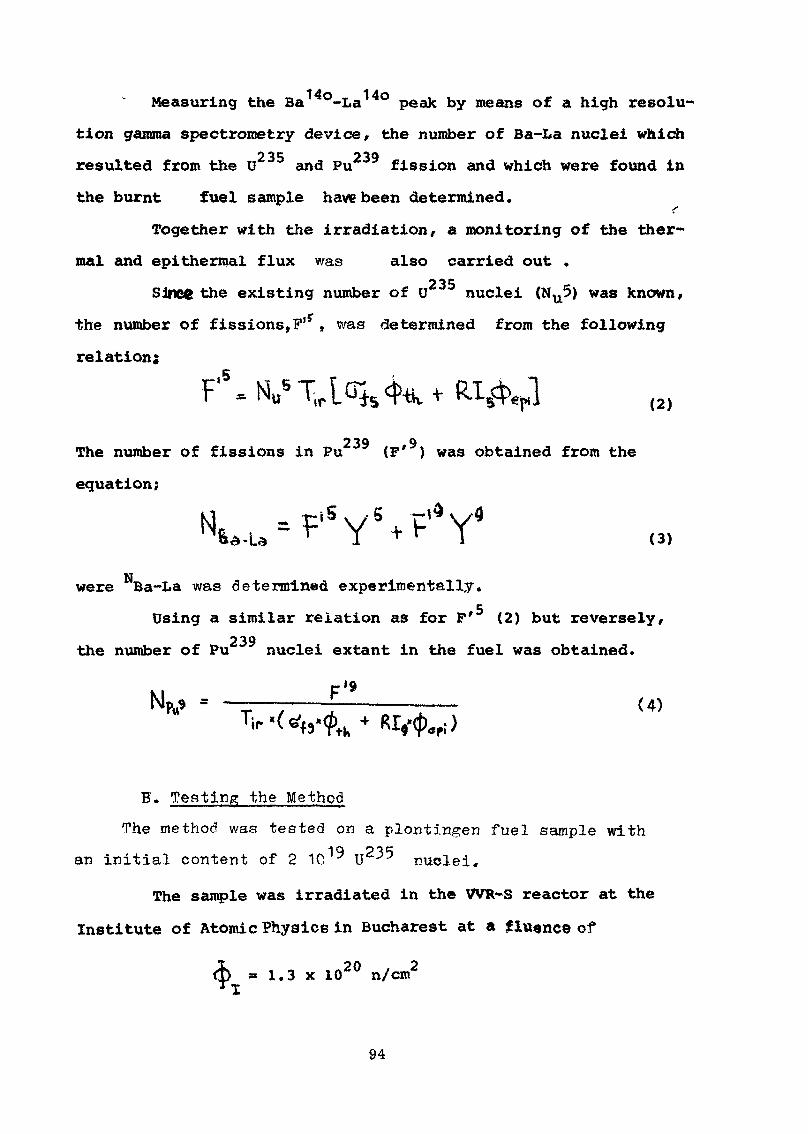
Measuring the Ba °-La peak by means of a high resolu-
tion gamma spectrometry device, the number of Ba-La nuclei which235 239resulted from the U and Pu fission and which were found in
the burnt fuel sample haw been determined*
Together with the irradiation, a monitoring of the ther-
mal and epithermal flux was also carried out .235Since the existing number of U nuclei (NU5) was known,
the number of fissions, F' , was determined from the following
relation;
^ s < > m
239 9The number of fissions in Pu (F* ) was obtained from the
equation;
kl r-iS v y 5 7-1$ v ANr — T~ N/ 4- h Y&£-Ld I " 1 (3)
were Ba-La was determined experimentally.
Using a similar relation as for F' (2) but reversely,239the number of Pu nuclei extant in the fuel was obtained.
'9— (4)
B. Testing the Method
The method was tested on a plontingen fuel sample with
an initial content of 2 1C19 U235 nuclei.
The sample was irradiated in the W»-s reactor at the
Institute of Atomic Physics in Bucharest at a £luence of
20 2m 1.3 x 10 n/cm
94
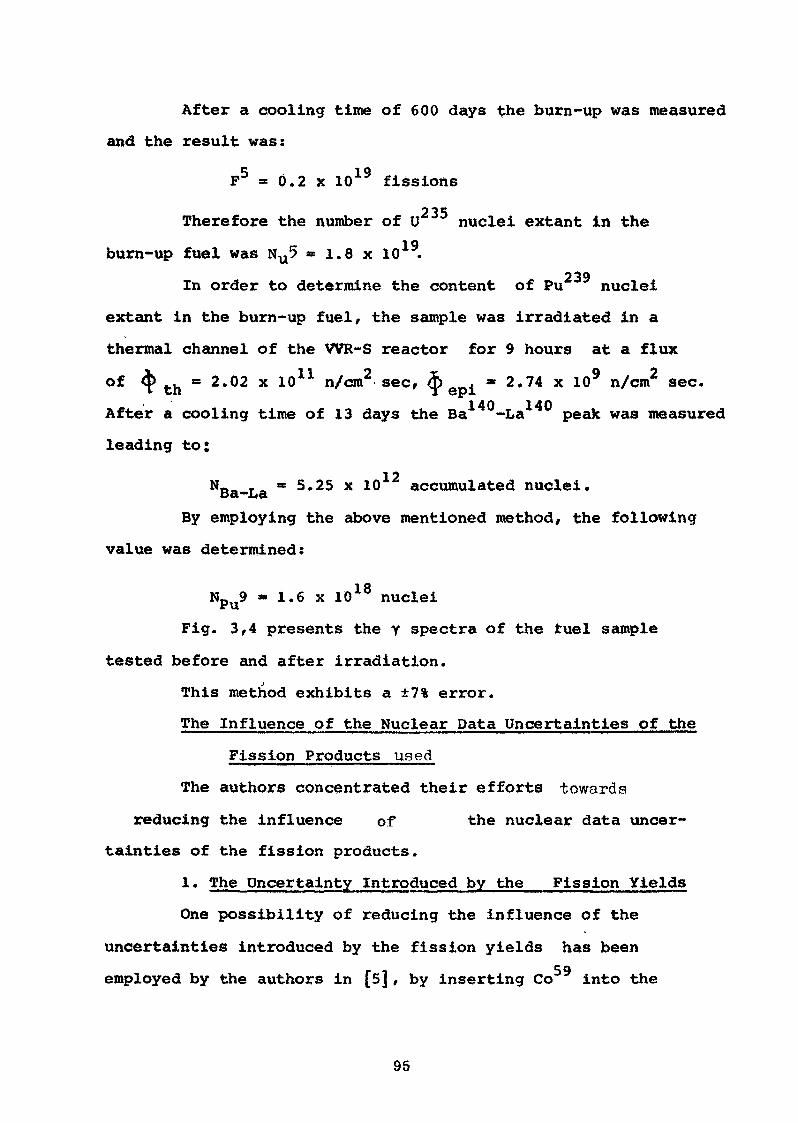
After a cooling time of 600 days the burn-up was measured
and the result was:
F5 - 0.2 x 10¹⁹ fissions
235Therefore the number of U nuclei extant in the
burn-up fuel was NU5 * 1.8 x 10 .239In order to determine the content of Pu nuclei
extant in the burn-up fuel, the sample was irradiated in a
thermal channel of the WR-S reactor for 9 hours at a fluxi JL JL / ._. fc >VL. _ f% ** M ^ f\ * u. t —- **of § th = 2.02 x 10 n/cm sec, <fo ^ » 2.74 x 10 n/cm sec.
After a coo!
leading to*
140 140After a cooling time of 13 days the Ba -La peak was measured
Nt»«, r» * 5.25 x 10 accumulated nuclei.tsa—By employing the above mentioned method, the following
value was determined:
Npu9 1.6 x 10¹⁸ nuclei
Fig. 3,4 presents the y spectra of the tuel sample
tested before and after irradiation.
This method exhibits a ±7% error.
The Influence of the Nuclear Data Uncertainties of the
Fission Products used
The authors concentrated their efforts towards
reducing the influence of the nuclear data uncer-
tainties of the fission products.
!• The uncertainty Introduced by the Fission Yields
One possibility of reducing the influence of the
uncertainties introduced by the fission yields has beenr 1 59employed by the authors in [5], by inserting Co into the
95

irradiated fuel sample which led to a much improved determina-
tion of the fluence.
Since the accuracy required for fission yields de-
pends on the irradiation history knowledge, a correction factor
can be determined, which estimates the variation of the nuclei
number of the fission products during irradiation* In order to
determine this factor, the complete period of irradiation is
considered as devided into n number of cycles of T * t' H
t" duration, where t' represents the irradiation time and t" -
the pause in a cycle. As it is known, the variation t/Hhtime of
the number of nuclei of a fission product x is given by the
following relation:
<. V M CT ,-k "\ Ki(5)
where from, by integration over the irradiation period, the
accumulated number o±' nuclei of product x is obtained;
By the end of the first cycle, the number of nuclei
is estimated as :
Similarly, by the end of the second cycle there will be:
(8)The same for the third cycle as well:
= A rA* AO - a i o -/MV A .W -XT)
96
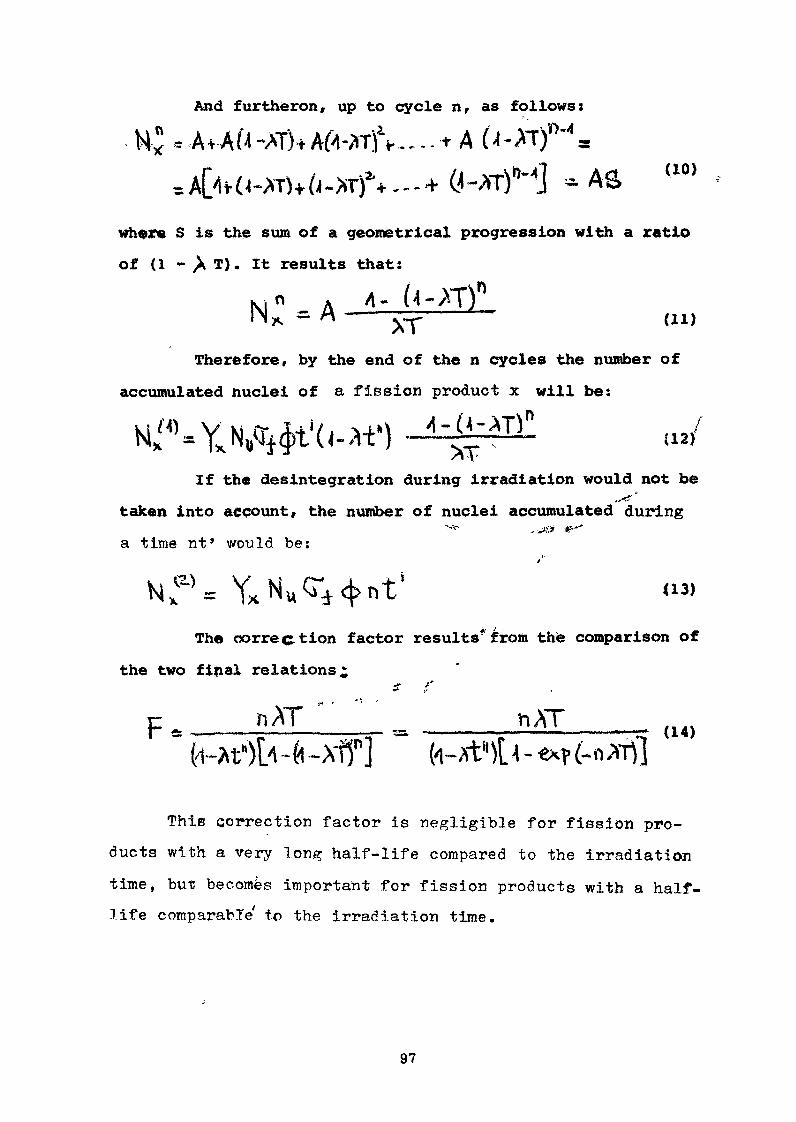
And furtheron, up to cycle n, as follows:
" -ASwhere S is the siim of a geometrical progression with a ratio
of (1 - ^X T). It results that:
XT '"'Therefore, by the end of the n cycles the number of
accumulated nuclei of a fission product x will be:
If the desintegration during irradiation would not be
taken into account, the number of nuclei accumulated during*-J£f **'
a time nt* would be:
The correction factor results* from the comparison of
the two final relations^
(14)ft -xff] h-rt't 4 - « r (-« *nl
Thie correction factor is negligible for fission pro-
ducts with a very long half-life compared to the irradiation
time, but becomes important for fission products with a half-life comparable' to the irradiation time.
97

2. The Uncertainty Introduced by the Half -Life
The equation of the La evolution, the fission productwe use in our method, will be as follows:
The solution of the equation is:
•La
IIf we take into account the known values of. ^rsm and
• 4.8 x 10~6 sec"1
6*27 X 10~
and th» cooling tiae of 13 days
* °'693
it conies out that:t - 0.5
. 0.00457
} The solution in this case, if we neglect e" , will
be*
It cap be seen that the decay constant of £a is
common to the correction factor for the irradiation history,
the uncertainty of which ultimately determines th^ accuracy
required for the fission yield, as well as to the equations
for the number of La nuclei formed during the short
98

irradiation, which are determined in our proposed method,Jv
Therefore we consider it of utmost importance that this
factor be known as accurately as possible.
In this view, as Behrens [?] also shows, we devide the
number of desintegrations in several At«7yt short periods. In
this case, the possibility of a certain number of radioactive
desintegrations for each period, will be described by the Poisson
distribution, but at the same time, the medium number of desinte-
gration events must vary from one period to the other, accordingto the radioactive des integration law.
The point is that, once the law of the variation of
the medium activty with time is ftiven, one has to choose
the decay constants such that they are in full concordance
with the results of the measurements in the periods. Alonp;
this line we consider A and aQ (the initial activity) to
be unknown.
If we write down the number of des integration events noti-
ced (followed) within the I* period, as:
and the probability for a certain number of disintegration
events to occur during each period ( as determined by the
Poisson distribution ) as:
then the following expression is fiw6Ttly obtained for A,,
after a certain number of mathematical operations described
in [7]
US
99

£ n^.t^SL m^ln § - 2. m^Z m^t^lpi - —i————i————._—i——i—'.——————— (20)
2
1
and for the dispersion DA:
Z-n^-TT- (21)
and the relative error in the determination of Xewill be:
2 m.C22)
Under the experimental conditions of our proposed
method and the results we gor for the six periods chosen,the
relative error in the determination of Aga is:
£ABa = 1.46 %.The influence of this error results in the following
relative error of the final result, the number of La nuclei:
SN,„ = 1.78 %.1.1 a
R E F E R E N C E S
1. L. Schachter, P.Popa, Rev.Roum.Phys., 14, 10, (1969).
2. L. Schachter, P.Popa, D.Haconan, Rev.Roum.Phys., 15, 7(1970)
3. L. Schachter, P.Popa, D.Hacman, Rev.Roum.Phys., Ij5, 7(1971)4. L. Schachter, P.Popa, &»Hacman, Rev.Rpum.Phys., 17, 6(1972)
5. L. Schachter, D.Hacman, O.Motz, Rev.Roum.Phys., 18, 7(1973)
6. P. Popa, M de Coster, P.Van Assche, NSE, 39, 50-55 (1970).
7. D.J.Behrens, AERE Harwell, R^f No. T/R 629
100

X'
« ";r
^
*
i
«___*
o •o
ooo «
o •o •
Mlfvf]

Contributions toReview Paper tTot 6

THE CONTROL OP FISSIONABLE MATERIAL BY MEANS OP DELAYED NEUTRONS
B.P.Maksyutenko and M.Z.Tarasko
Institut of Physics and Power Engineering, Obninsk, USSR
English translation of PEI-370
Abstract»
The authors propose a new method of identifying fissionable materialsor determining the percentage of them present in a mixture; the new method,which replaces the normally applied six-group analysis of the delayed neutrondecay curve, is based on representation of the decay curve as a continuousdistribution of the precursors of the delayed neutrons relative to theirhalf-lives.
The difference between the absolute and relative yields of delayedneutrons in fissionable materials affords a means of identifying them ordetermining the percentage of them present in a mixture without the use ofchemical or isotopic analyses and without destroying the fuel elements*
In this report, the authors consider only the problems associated withmeasuring relative yields, and in so doing concern themselves with the physical,rather than the technical, aspect of the matter.
The gist of the problem as formulated is, how strictly can two decaycurves (for two fissionable materials) be compared mathematically. In viewof the statistical scatter of the points, it is difficult to establish anydifference criterion for an experimentally observed dependence (counting rateversus time). The criterion can be obtained by formulating the problem inanother way, namely by describing the decay curve by means of a set of parameters.Comparison of the parameters (together with the errors attributed to them) willthen serve- as an identity or difference criterion for the decay curves* At thepresent time, use is being made of the six-group description of decay curves /~1_7»i»e. the curve showing decrease in neutron activity is decomposed into sixexponents. The curves are compared from the contributions (yields) of the
105
different groups, since the difference is fairly large for various fissionablematerials. For these fissionable materials each of the groups has only approxi-mately the same half-life. This is due not only to the experimental errors,but also to the fact that each group is a mixture (the proportions varying withdifferent materials) of several contributors, or in other words, in the givencase we are dealing, apart from errors, with poor resolution.
Our approach to the problem differs in that, instead of a limited set,of. .parameters to describe the decay curve, we use in principle, an infinite setof them, or in other words, we try to formulate the problem in terms of asearch for an "amplitude" distribution of the components with different half-lives. Being differential in nature, a description of that type enables us tocompare the decay curves in greater detail, as compared to one based on a limitedset of parameters. Furthermore, it automatically results in smoothing out of theexperimental scatter of the points on the curve and is consequently the bestmethod.
Since we are here interested only in the theoretical aspect of the matter,we shall henceforth work only with decay curves calculated theoretically witha computer, and will not use experimental curves containing a statisticalscatter of the points. Decay curves of this kind were calculated for the givensix-group half-lives and yields /~1_7 ?or <J> " U and Pu, during thermalneutron fission. We assumed in the process that the irradiation of the fission-able materials was carried out for* an infinite length of time, or in other wordsthat the activation of all the groups was carried to the point of saturation.
Applying the method of the "least directed divergence" /~2_J7, we transformedthe decay curve (counting rate versus time N(t)) into an "amplitude" distributionfor the probability P(i') of the presence of a, component with half-life T.Figures 1 and 2 show the distribution P(T), normalized in such a way that theyield from the first group is the same for all the fissionable materials. Itcan be seen that:
(a) There are only four clear-cut peaks for all distributions, althoughsix groups have been incorporated in the calculation of the decaycurves;
(b) The difference in spectral composition is large in all cases, exceptfor the pair 235U-2^Pu;
(c) For the pair U- Pu the distributions merge, except in theregion of half-lives lasting 7-35 sec.
This analysis permits a clear formulation of the possibility of identifying
106

fissionable materials when determining their percentage composition in a mixturewith other materials. It is obvious that we can distinguish any pair of fission-
235 239able materials, except U- Pu, over the whole range of half-lives. In thecase of "TJ— Pu, the possibilities are limited to the 7—35 second range,i.e. the interval over which delayed neutrons from the mixture of precursors1 ^fj ftft
I and Br are present.
Let us give some figures. Prom the decay curves for delayed neutrons fromU and Pu, during fission induced by thermal neutrons, the ratio between
the second group ( I and Br mixture) and the first group ( Br) yield is:
(a) For decomposition by the method of least squares, 6.65:1 for " U,and 8.53:1 for 239Pu £~lj, i.e. they differ by 28$;
(b) The ratio between the distribution peaks (see Fig. l) for thesecond group is 1.52, i.e. a difference of 52$.
Thus the processing of the experimental results by the method of "leastdirected divergence" provides the best opportunity of comparing and establishingthe most favourable conditions for identifying or determining the percentagecomposition of fissionable materials from the relative delayed neutron yields,since:
(a) For different fissionable materials, the same groups have; differenthalf-lives on account of varying proportions of contributors, hencea comparison of the yields from groups with a different weightedhalf-life is, strictly speaking, incorrect; in the new method thisshortcoming is corrected;
(b) Comparison of decay curves on the basis of a few selected parametersis also incorrect, because in such a case the curve is decomposedinto a different number of parameters ('5» 6, 7 and so on), the choiceof which is somewhat arbitrary.
The new method enables us to make a comparison over the whole range ofhalf-lives and does not suffer from the limitations referred to.
The authors thank G. Ya. Rumyantsev for his valuable comments and interest
in their work.
REFERENCES
KEEPIN, J.R.t Fiziceskie osnovy kinetiki jadernyh reaktorov(Physical fundamentals of nuclear reactor kinetics), Atomizdat,Moscow (1967).
TAKASKO, M.Z., Preprint FEI-156 (1969).107

PCT)
3 4 5 6 7..,tt 19 27 35 4351 T(sec)
1. Speotrxim for the probability of delayed neutron yield asa function of half-life (the arrows indicate the half-lifeincorporated during computation of the decay curve).
108

P IT)
8
6
108
6
0,2 0.6 1.0 1.5 T (sec)
Spectrum for the probability of delayed neutron yield asa function of half-life (the arrows indicate the half-lifeincorporated during computation of the decay curve).
109
FISSION PRODUCT NUCLEAR DATA AND NONDESTRUCTIVEASSAY SYSTEMS OF NUCLEAR MATERIALS
T. Gozani
Intelcom Rad TechSan Diego, California
ABSTRACT
A concise list of passive and active nondestructive assay (NDA)techniques for nuclear material is presented. Development, design, andimplementation of NDA techniques are shown to be dependent on fissionproduct nuclear data (FPND) to a varying degree. Areas where some addi-tional work would be desirable are identified.
1. INTRODUCTION
This contribution lists some fission product nuclear data (FPND)which could be helpful in the development, design, and the actual applica-tion of nondestructive assay (NDA) systems for nuclear materials.
2. PASSIVE AND ACTIVE NDA TECHNIQUES
Nondestructive assay methods are usually divided into two main cate-gories: passive assay and active interrogation. Passive assay involves
239observation of both gamma rays emitted following alpha decay (as in Pu235
and U) which are uniquely characteristic of the individual fissionspecies, and neutrons emitted as a result of (ot,n) reactions or spontaneousfissions (e.g., in Pu). The latter can be distinguished from the formerby using coincidence counting techniques. Passive NDA methods are quiteoften severely limited by the lack of penetrability for some of the gammarays and absence of a suitable signature for several fissionable isotopes.Nonetheless, they are extremely attractive due to their inherent simplicityand the fact that they are relatively inexpensive.
A list of the most commonly used passive NDA techniques is given inTable 1. In this table the various methods are very briefly described interms of the basic detectors used, the main observed radiation, and theirstatus from the point of view of availability and actual experience.
Ill
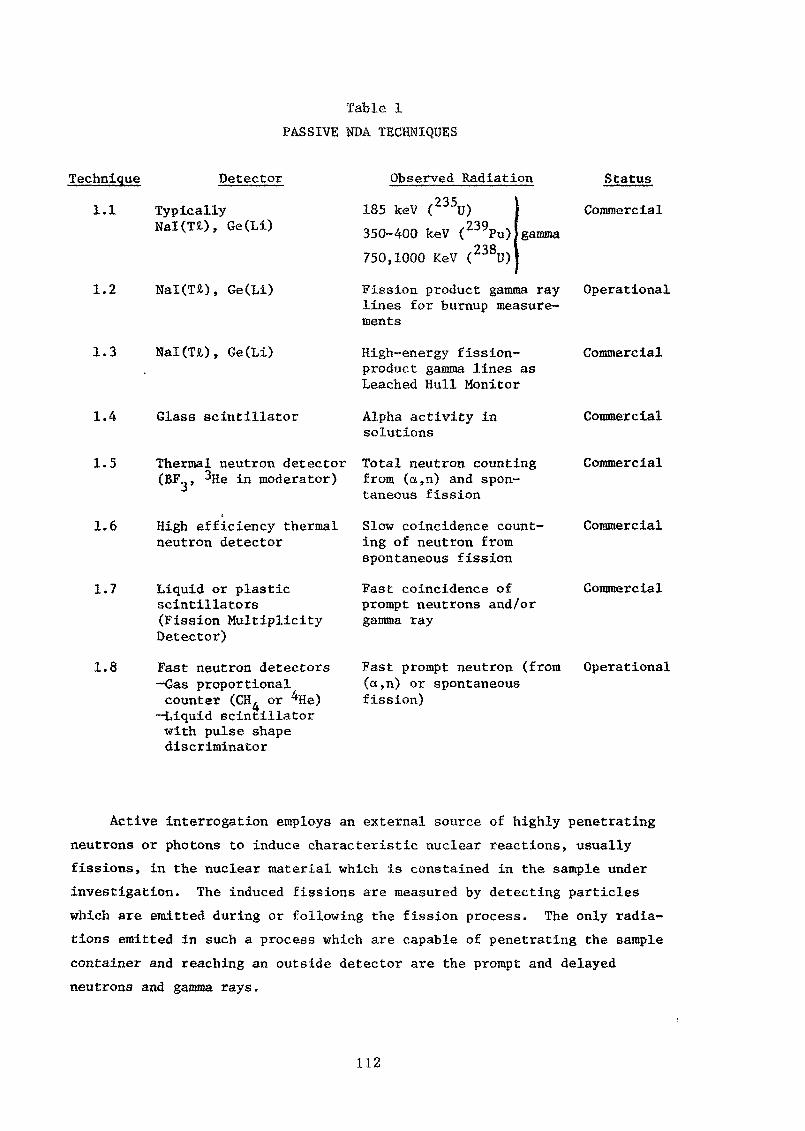
Table 1PASSIVE NBA TECHNIQUES
Technique Detector Observed Radiation
1.1 TypicallyNal(TJl), Ge(Li)
1.2 Nal(TA), Ge(Li)
1.3 Nal(n), Ge(Li)
1.4
1.5
1.6
1.7
1.8
Glass scintillator
Thermal neutron detector(BF , 3He in moderator)
High efficiency thermalneutron detector
Liquid or plasticscintillators(Fission MultiplicityDetector)
Fast neutron detectors—Gas proportionalcounter (CH o
—Liquid scintillatorwith pulse shapediscriminator
185 keV rU)350-400 keV (239Pu)750,1000 KeV ( U)
gamma
Fission product gamma raylines for burnup measure-ments
High-energy fission-product gamma lines asLeached Hull Monitor
Alpha activity insolutions
Total neutron countingfrom (a,n) and spon-taneous fission
Slow coincidence count-ing of neutron fromspontaneous fission
Fast coincidence ofprompt neutrons and/orgamma ray
Fast prompt neutron (from(a,n) or spontaneousfission)
Status
Commercial
Operational
Commercial
Commercial
Commercial
Commercial
Commercial
Operational
Active interrogation employs an external source of highly penetratingneutrons or photons to induce characteristic nuclear reactions, usuallyfissions, in the nuclear material which is constained in the sample underinvestigation. The induced fissions are measured by detecting particleswhich are emitted during or following the fission process. The only radia-tions emitted in such a process which are capable of penetrating the samplecontainer and reaching an outside detector are the prompt and delayedneutrons and gamma rays.
112

A list of most of the active nondestructive techniques being used andtested or in an advanced state of study is given in- Table 2 (see also Ref. 1),In this table the various methods are also very briefly described accordingto the source they use, the incident (interrogating) radiation, and theobserved (induced) radiation. The last column lists the stage of develop-ment of the technique.
Most of the techniques listed in Tables 1 and 2 are discussed in theliterature, particularly in Refs. 2, 3, and 4. The general physics of theactive NDA techniques are discussed in Ref. 1.
3. THE REQUIREMENT IN FPND FOR NDA TECHNIQUES
3.1 GENERAL
A quick survey of the NDA techniques listed in Tables 1 and 2 showsthat all of the techniques, except possibly for the burnup determinationfrom fission product gamma lines (Technique 1.2) do not depend directlyon the knowledge of FPND. The NDA techniques are usually applied to rathercomplicated samples in the nuclear industry, ranging from small sinteredfuel pellets to the complete fuel assemblies and 55 gallon waste drums.This variety of samples is dictated by the nature of the nuclear industry.The only practical approach to the determination of the amount of fissilematerials in such complicated samples is to use standards of similarnature to the measured unknown, rather than attempt to determine theamount in an absolute fashion. Even if all of the nuclear parameterswere known to a very high degree of accuracy, variations in the geometri-cal configuration and the presence of non-fissile matrix materials, amongothers, will generally not allow an absolute measurement.
The usefulness of FPND lies mainly in providing some guidance in thedevelopment and design phases of NDA techniques, and it could be of helpin understanding and possibly alleviating problems arising in the utiliza-tion of the technique.
3.2 DELAYED GAMMA TECHNIQUES
Gross delayed gamma activities versus time (Refs. 5, 6) provided ahighly useful guidance in the development of the nuclear fuel rod scanners(Refs. 7, 8) (Technique 2.12) and the high precision Small Sample AssaySystem (SSAS) (Ref. 9). However, more work needs to be done in measuringgross delayed gamma yields from relatively early times (a few tenths of asecond) out to several tens of minutes after fission. One of the main
113
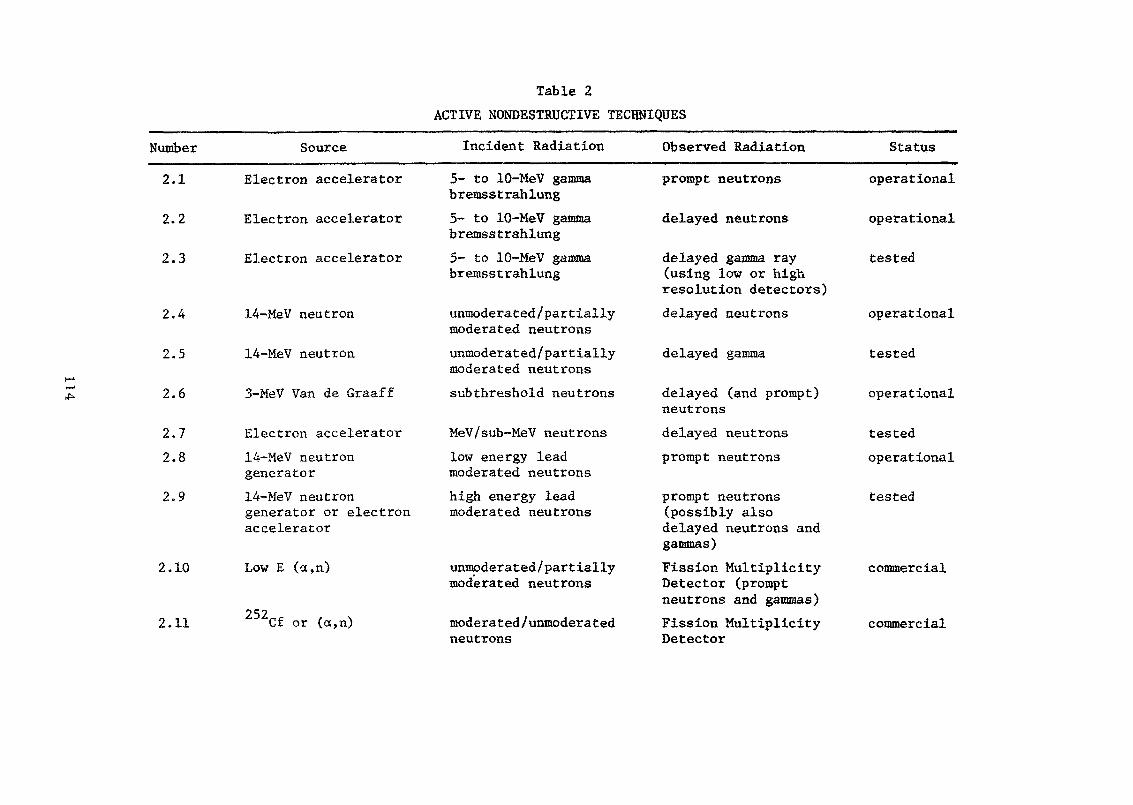
Table 2ACTIVE NONDESTRUCTIVE TECHNIQUES
Number
2.1
2.2
2.3
Source
Electron accelerator
Electron accelerator
Electron accelerator
Incident Radiation
5- to 10-MeV gammabremsstrahlung5- to 10-MeV gammabremsstrahlung5- to 10-MeV gammabremsstrahlung
Observed Radiation
prompt neutrons
delayed neutrons
delayed gamma ray(using low or high
Status
operational
operational
tested
2.4
2.5
2.6
2.72.8
2.9
2.10
2.11
14-MeV neutron
14-MeV neutron
3-MeV Van de Graaff
Electron accelerator14-MeV neutrongenerator14-MeV neutrongenerator or electronaccelerator
Low E (a,n)
252Cf or (a,n)
unmoderated/partiallymoderated neutronsunmoderated/partiallymoderated neutronssub threshold neutrons
MeV/sub-MeV neutronslow energy leadmoderated neutronshigh energy leadmoderated neutrons
unmoderated/partiallymoderated neutrons
moderated/unmoderatedneutrons
resolution detectors)delayed neutrons
delayed gamma
delayed (and prompt)neutrons
delayed neutronsprompt neutrons
prompt neutrons(possibly alsodelayed neutrons andgammas)Fission MultiplicityDetector (promptneutrons and gammas)Fission MultiplicityDetector
operational
tested
operational
testedoperational
tested
commercial
commercial

Table 2 (Continued)
Number
2.12
2.13
2.14
2.152.16
2.17
2.182.19
2.202.21
2.22
2.23
Source252Cf
Low E (a,n)
(Y,n)
ReactorReactor
Reactor
ReactorMedium £ Linac
Zero power reactorZero power fastreactorX-ray generator
241.Am
Incident Radiation
moderated Cf-fissionneutrons
highly/partiallymoderated neutronssub-MeV neutrons
thermal neutronsthermal neutrons
low eV neutrons
thermal and low eVneutrons (via time-of-flight)thermal neutronsfast neutrons
200-keV x rayslow E gamma
filtered low E(<60 keV) gamma
Observed Radiation
gross delayed gamma(possible prompt anddelayed neutrons)fast prompt neutrons
prompt (and delayed)neutronsdelayed neutronshigh resolutionfission productgamma rays
prompt neutrons andneutron transmissioncapture gammacapture gamma
reactivity changereactivity change
fluorescent x rays
fluorescent x rays
Status
commercial
tested
tested
commercialpartiallytested
tested
testedtested
testedunder study
operationaloperational
commercial

motivations for these investigations is to seek a practical way to dis-233 23*5tinguish between the three main fissile isotopes, namely U, U, and
239Pu. This may be achieved if significant differences in the gross decayrates and energy distributions exist between these isotopes. A possibilitythat some useful difference exists in the high energy portion of the spec-trum is indicated in the data shown in Ref. 5.
More extensive compilation and evaluation of the existing data andpossibly more work is required in generating FPND in the area of highresolution gamma spectroscopy of fission products. Again, the main aimshould be not only to determine the amount of a particular fissile isotope
900 ? ftin the presence of fertile isotopes (e.g., Th and U), but to identifyindividual fissile isotopes when present in a mixture. There have beensome attempts in this direction, with varying degrees of success. Studiesat Rad Tech (Refs. 10,11) showed little difference between the various fis-sile isotopes in terms of observed fission product gamma-ray lines, but someuseful differences in the line intensities were measured. Additional workin this area for the case of photofission would be desirable. Studies atLASL (Ref. 12) had a similar goal, namely to determine if there are prominentindividual high-energy gamma-ray lines in the early-times after-fission
235(M. sec to 30 sec) spectra of U(n,f) which might be useful for nuclearsafeguards applications. Again, it was found that most of the prominent
235 939peaks appear in both U(n,f) and Pu(n,f) fission product gamma spectra.However, some of the peaks exhibit yields which differ significantly betweenthese two fissile materials.
3.3 DELAYED NEUTRON TECHNIQUES
Many of the techniques listed in Table 2 use delayed neutrons as anindication of fission. The present knowledge of delayed neutron parametersfrom neutron fission, including energy spectra, is satisfactory from thepoint of view of the NDA techniques as expressed above. However, nomeasurement of the energy spectra of delayed neutrons from photofissionhas been done so far. It thus seems worthwhile to generate some basicdata on the energy distribution of delayed neutrons from photofission.Also, more accurate group parameters for delayed neutrons from low energy(6 to 10 MeV) photofission would be desirable.
3.4 BURNUP DETERMINATION FROM FISSION PRODUCT GAMMA RAYS
One of the most commonly used methods to assess the burnup in spentfuel elements is to perform a complete gamma spectroscopy analysis of the
116

element, usually using a high-resolution Ge(Li) detector (Technique 1*2).Since it is hardly possible to prepare standards for such a measurement,the buraup assessment, based on these spectroacopy measurements, dependsheqyily cm the availability of nuclear and non-nuclear iata, such asdiffusion properties of fission products within the fuel and claddingmaterial. It Is doubtful, however, whether the available FPND, especiallyyields, half lives, branching ratios, and line intensities, to any appreci-able extent» limit the accuracy of burnup determination. However, acomplete compilation, error analysis, and sensitivity calculations wouldbe beneficial.
3.5 COINCIDENCE TECHNIQUES
The presence of trace quantities of certain fission products in freshnuclear fuel will be unavoidable as more and more reprocessed fuel will beused. Thus fission products will inevitably constitute a background to allNBA techniques. The present knowledge of the FPND seems to be sufficientto enable the designer or the user of an NDA technique to estimate the limitof operability and possibly to reduce the error due to the presence offission product. One exception to this might be the amount of high-energy(>2.2 MeV) gamma rays which induce background in neutron-moderated detec-tors by the (y,n) reaction in the deuterium. However, the available informa-tion is not sufficient for those NDA methods which are based on the conceptof fission multiplicity and use fast coincidence circuits (especiallyTechniques 1.6, 2.10, and 2.11). In this case it is required to know theexistence of positron emission, cascade of gamma rays, the order of multi-plicity of the cascade, and the associated gamma energies. Obviously acomplete level scheme of the appropriate (relatively long lived) fissionproducts will contain this information. However, the required specificinformation can also be obtained using simple coincidence techniques,without performing additional comprehensive measurements.
Another set of parameters which are important to systems based on the5 -,
Fission Multiplicity Detectors (Ref. 13), and should be mentioned in thiscontext, are the average multiplicity for both prompt neutrons and gammarays (the latter include early delayed gamma rays with half lives up tofew tens of nsec). These parameters, although actually not being FPND,are important for the design, efficiency calculation, and, in general, formore efficient utilization of the devices. An interesting example of thelatter was attempted a few years ago (Ref. 14). For neutrons, the distribu-tion of multiplicities is moderately well known; for gamma rays the situa-
117

tion is;;different. While the multiplicity is reasonably well known(e.g., Ref. -i&i-, the multiplicity distribution and possible multiplicity-energy correlating (Ref. 16) are rather poorly known.
4. CONCLUSIONS " " ""/,-
A brief review of the existing NBA techniques and those which'are inian advanced stage of testing indicates that the requirements for FPND inthis area are quite modest and could possibly be met, to a large extent,by an extensive compilation and evaluation of the available data. Specificareas of recommended additional work are mentioned.
REFERENCES
1. T. Gozani, "Physics of Nuclear Materials Safeguards Techniques,"Nucl. Technology, 13., 8-18 (1972).
2. Proc. Symp. Safeguards Research and Development, WASH-1147 USAEC(1969).
3. Proc. Symp. Progress. in Safeguards Techniques, IAEA-SM-133, IAEA(1970).
4. Proc. of Institute of Nuclear Materials Management (INMM) Vol. II,No. 1 (1971) through Vol. II, No. 3 (1973).
5. P. C. Fisher and L. B. Engle, "Delayed Gammas from Fast NeutronFission of 232Th, 233U, 23°U, and 239pu," Phys. Rev. 134, 4B,B796-B823 (1964).
2386. R. B. Walton et al., "Delayed Gamma Rays from Photofission of U,and 232Th," Phys. Rev. 134, 4B, B824-B830 (1964).
7. H. 0. Menlove et al., LASL Report LA-5071-M (1972).
8. D, G. Costello and T. Gozani, "Statistical Consideration in theDesign and Utilization of High Speed Fuel Rod Scanner," Proc. ofINMM Vol. II, No. 3, 187-204 (1973).
9. T. Gozani et al., "High Precision Small Sample Assay System,"ANS Trans. Vol. 17, 2 (1974).
10. "Application of Photoinduced Reactions to Nuclear Materials Safe-guards Problems," Project Summary Report, July 1968-June 1969,GA-9614, pages 7-14.
11. T. Gogani et al., "New Developments in Nuclear Material Assay UsingPhotonuclear Reactions," Safeguards Techniques Vol. II, IAEA-SM-133(1970).
118
12. Los Alamos Report LA-4162-MS, 13-15 (1969).
13. T. Gozani and D. G. Costello, "Isotopic Source Assay System forNuclear Materials," ANS Trans. 1J3, 2, 746 (1970).
14. T. Gozani and D. G. Costello, "On the Reduction of Prompt FissionGamma Self Shielding Using the Fission Multiplicity Detector,"Intern. Meeting of ND Measurement and Identification Techniques inNuclear Safeguards, Euratom, Ispra (1971) and ANS Trans. 14, 2, 809(1971).
15. V. V. Verbinski, H. Weber, and R. E. Sund, "Prompt Gamma Rays from235u(n,f), 239Pu(n,f) and Spontaneous Fission of 252cf," Phys. Rev.C, 7., 3 1173-1185 (1973).
16. T. Gozani, "On the Correlation Between the Multiplicity and Spectrumof Prompt Fission Gamma Rays," 3rd IAEA Symp. on the Physics andChemistry of Fission, August 1973.
119

Contributions toReview Paper No. 10

ON THE CALCULATION OF TOTAL RADIATIVE WIDTHS OF NEUTRON RESONANCES
V. BENZI. G, REFFO. M. VACCARI
Ctx<ato Nazionale Energia NucleareCentre di CalcoloBologna, Italy
Abstract:
Three different formulae have been proposed to estimate P atneutron binding energy, namely: the Brink formula, the Weigraann-Rohrformula and the Musgrove formula. The three formulae are brieflydescribed in this paper. Results of calculations of Hyf using thethree formulae, are compared for all fission products, for whichexperimental data are available
§ 1. INTRODUCTION
The statistical model of nuclear reactions is frequentlyadopted in order to estimate the fast neutron radiative capturecross-sections of fission product nuclei when experimental data
are missing.
The theoretical calculations can be performed provided anumber of parameters, like 7 , I>obs , etc.., are known.These parameters, in turn, can be obtained from the analysis ofthe observed resonances at low energy.
When no resonance parameters are available, as frequentlyoccurs in fission product nuclei, an estimate can be obtained onthe basis of the systematic behaviour of the required data or byusing some semi-empirical recipe.
The aim of this work is to test the validity of threedifferent formulae which have been suggested to obtain an esti-mate of 7 at neutron binding energy. The test is limited tothose, nuclei which have the mags number in the region of inter-est for fission products, with at least two measured r .
123
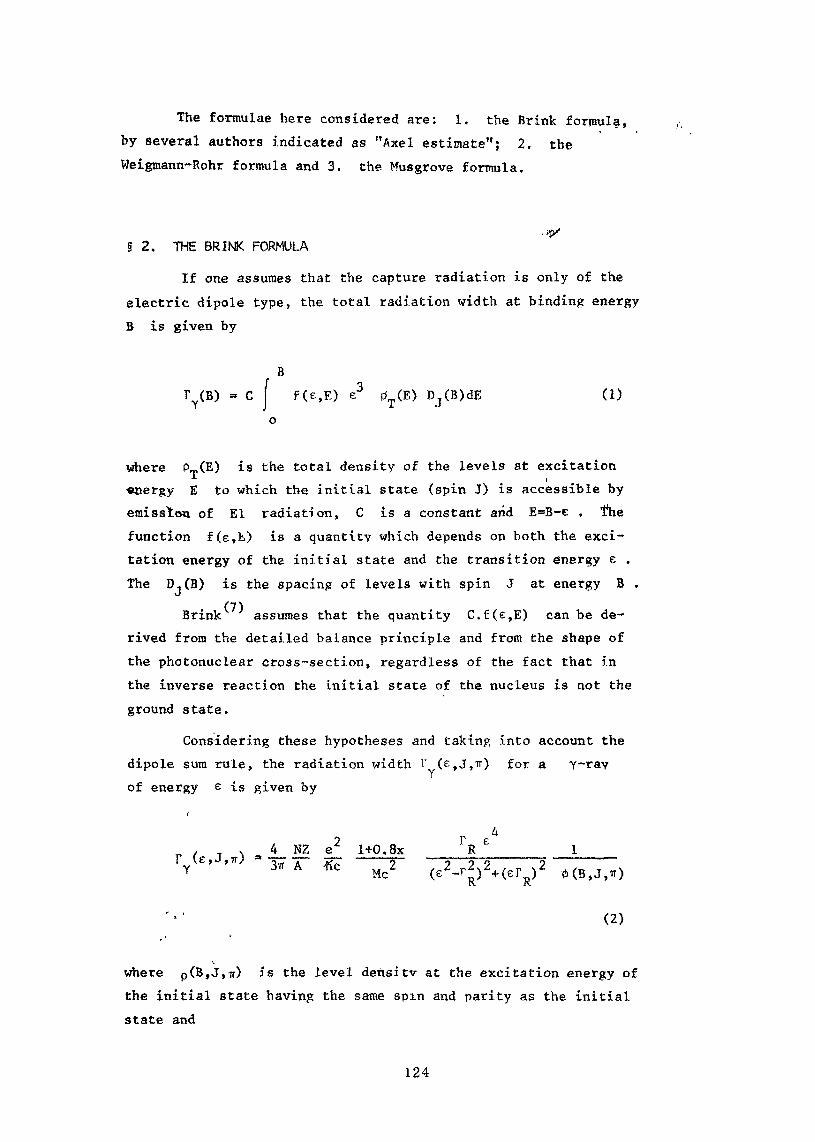
The formulae here considered are: 1. the Brink formula,by several authors indicated as "Axel estimate"; 2. theWeigmann-Rohr formula and 3. the Musgrove formula.
§ 2. THE BRINK FORMULA
If one assumes that the capture radiation is only of theelectric dipole type, the total radiation width at binding energyB is given by
BI •*>ry(B) =» C j f(e,E) e (E) DJ(B)dE (1)o
where PT(E) is the total density of the levels at excitation«nergy E to which the initial state (spin J) is accessible byemission of El radiation, C is a constant and E=B-e , fhefunction f(e,b) is a quantity which depends on both the exci-tation energy of the initial state and the transition energy e .The D.(B) is the spacing of levels with spin J at energy B .
ij
Brink assumes that the quantity C.f(e,E) can be de-rived from the detailed balance principle and from the shape ofthe photonuclear cross-section, regardless of the fact that inthe inverse reaction the initial state of the nucleus is not theground state.
Considering these hypotheses and taking into account thesum rule, the radi
of energy e is given bydipole sum rule, the radiation width I' (e,J,Tr) for a Y~rav
24 NZ e 1+0.8x-wr -r- ^~ ———s~Jir A flc ^'V
( RJ1
(eTR)2 0 (B,J ,u)
(2)
where p(B,J,Tr) is the level densitv at the excitation energy ofthe initial state having the same spin and parity as the initialstate and
124

x a fraction of exchange force (x <v 0.5)
ER » energy of the peak of the giant resonance
rD * width of the giant resonanceK
The total radiation width is given by
(B,J,Tr) - j F C(B-E),J,7r] T~ (E.J1 ,-Tr)dE . (3)
The calculations carried out in this work were performed(12)using the LARA code '. In this code, formulae (2) and (3) are
slightly modified, in particular
1) As far as formula (2) is concerned, the integrated cross--section as obtained from the Lorentzian fit of photo-absorption experimental data is used instead of the dioolesum rule.
2) Formula (3) is split into two parts in order to take better intoaccount the transitions to the resolved levels.
More explicitly, the formula here adopted is
r (B,J,TT)
(4)
B-E TA1c „ J+l
where the <S's take into account the spin and parity selection rules,O represents the density of the unresolved levels and E is the
energy at which the first level of unknown characteristics is assumedto be found.
The composite Gilbert-Cameronv ' formula was used for the anal.ysis of the level spacing of a number of nuclei with at least 1Os-wave measured resonances in order to obtain the level density para-meters on which the absolute value of P depends.
125

For the spin cut-off factor a in the Cameron formula, the(9)estimate of Facchini et al .
= 0.146
was adopted.
The results of such an analysis for the parameter "a" aregiven in Table 1, whereas Fig. 1 shows a plot of "a" vs. the neutronnumber N of the nucleus. As usual, the plot shows a rather welldefined trend of the a-dependence on N, from whic^ a smooth value"a " can be guessed,
The photonuclear cross section a is assumed to haveLorentzian shape for non deformed nuclei and double-Lorentzian shapefor the deformed ones.
As far as the photonuclear reaction parameters are concerned,when the required data were not available, the experimental valueseiven for neighbouring nuclei were adopted according to table 1, wherethe data marked * refer to ref . 2, yhile all the others refer toref. 3.
§ 3. THE WEIGMANN-ROHR FORMULA
Very recently, Weigmann and Rohr have carried out a sys-tematic analysis of total radiative widths of low-energy neutronresonances for a large number of nuclei, usinp, the following formula
• /~» B= 5 A2/3(B*)5M e"2/aB (B-e)3 p(E*)dE + s A.2/3 g» D S (5)
The quantity S represents the 4,-wave neutron strengtht~
function and p the energy dependent part of the level density,for which the Cilbert-Caroeron formula is assumed.
The first term of the R.H.S. of the above formula derivesfrom a manipulation of the well known Weisskopf estimate of theradiation width, whereas the second term takes into account thevalency nucleon contribution. The f is an adjustable parameter,and
5.26

10 for s-waves, A<63-L
10 for p-waves, 88sA<125-210 for s-waves, 196<A<204
otherwise
In addition,
E <= E + A
B = B + A
where A and n are excitation energy corrections for shell andpairing effects, which are assumed to be given by the formulae ofKahn-Rosenzweig^ and Nemirovsky-Adamchuk , respectively. Theresults obtained with these formulae are multiplied by the constantsC, and C , respectively, which are obtained from a simultaneousbest fit of the experimental I" s . Thus, formula (5) containsthree (adjustable) constants (C. , C , £)» for which the followingvalues are suggested by Weigmann and Rohrr
C. - 0.07A
C - 0.75n£ - 3.72 . 10~3
§ 4. THE MUSGROVE FORMULA
The empirical formula suggested by Musgrove is
(B) -=KaX|> (B)]yU2f(Z)obs
with U=B~A .
When F and D . are given in eV and B in MeV, they ODS
following numerical values of the parameters have to be adopted
-31.13x10 for isomeric nucleiK -
1.43x10 for non isomeric nuclei
127
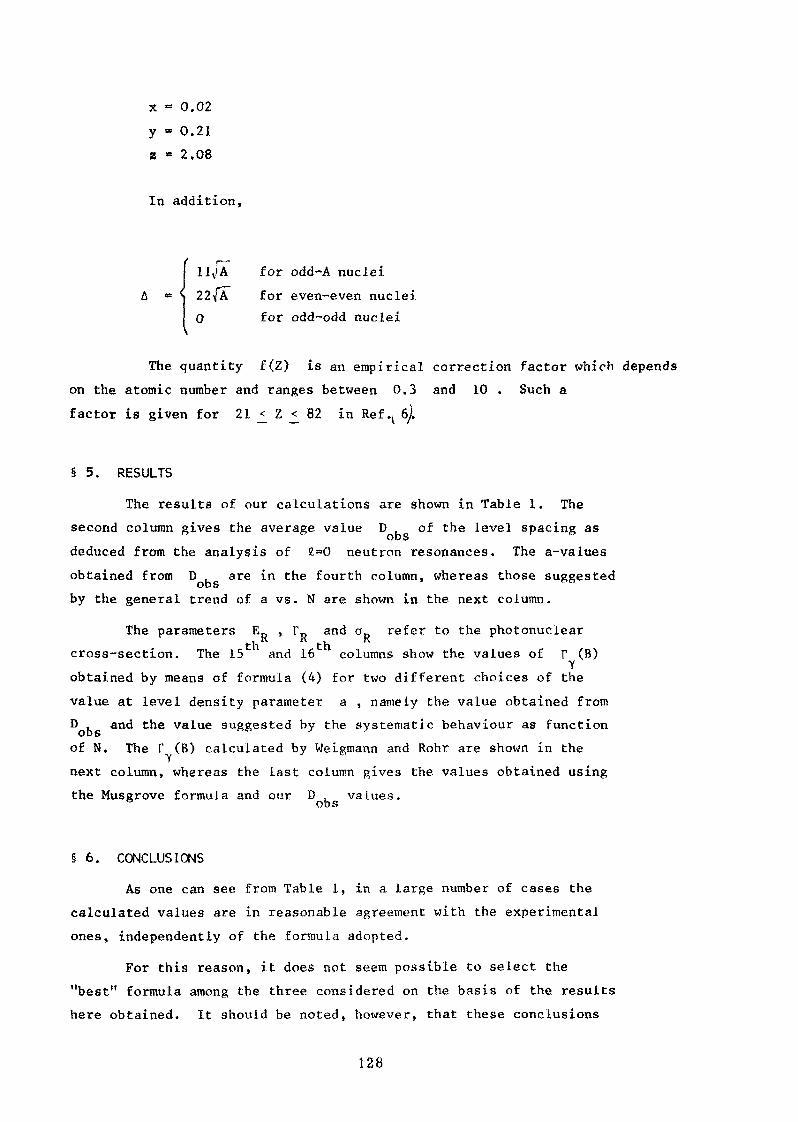
x - 0.02y - 0.21z = 2.08
In addition,
11V)A for odd-A nuclei22\i*A for even-even nuclei0 for odd-odd nuclei
The quantity f(Z) is an empirical correction factor which dependson the atomic number and ranges between 0.3 and 10 . Such afactor is given for 21 <_ Z _< 82 in Ref.( 6Jt
§ 5. RESULTS
The results of our calculations are shown in Table 1. Thesecond column gives the average value D of the level spacing as
OD 5deduced from the analysis of l=>0 neutron resonances. The a-valuesobtained from D are in the fourth column, whereas those suggested
QDSby the general trend of a vs. N are shown in the next column.
The parameters E11R and aD refer to the photonuclear
**cross-section. The 15 and 16 columns show the values of r (B)
Yobtained by means of formula (4) for two different choices of thevalue at level density parameter a , namely the value obtained fromD and the value suggested by the systematic behaviour as functionof N. The F (B) calculated by Weigmann and Rohr are shown in thenext column, whereas the last column gives the values obtained usingthe Musgrove formula and our D values.
§ 6. CONCLUSIONS
As one can see from Table 1, in a large number of cases thecalculated values are in reasonable agreement with the experimentalones, independently of the formula adopted.
For this reason, it does not seem possible to select the"best" formula among the three considered on the basis of the resultshere obtained. It should be noted, however, that these conclusions
128

refer to the case of F (B) . If the energy dependence of r hasto be considered, as in the case of statistical model calculations,the above conclusions are no longer valid. For example, in manycases, the Musgrove formula gives a decreasing trend of r vs. E ,which does not seem acceptable on a physical basis.
In addition, one should expect that the Weigroann formula failsat high energies because the Weisskopf estimate does not account forthe giant resonance phenomenon.
REFERENCES
1) M. Pasquali: Thesis on "Analisi sistetnatica del parametro "a"della densita dei livelli"^ carried out at C«d.Cv CHEN, Bologna(unpublished).
2) B.I. Goryachev: Atomic Energy Review, vol. 2 n. 3 pag. 71 (1964).
3) E.G. Fuller, H.M. Gerstenberg,H. Vander Molen, T.C. Bum: Photo-nuclear Reaction Data 1973 - NBS special publication 380.
4) M. Goulassy, S.T. Perkins: UCKL-50400, vol. 13.
5) U. Weigmann, G. Rohr: Proc. "Tripartite Symposium on Nucl. Phys.with Thermal and Resonance Energy Neutrons" to be published asRCN report.
6) A.R. de L. Musgrove: AAEC/E211 - November (1970).
7) D.M. Brink: Thesis, Oxford 1955; See also Handbuch der Physik,vol. XL, pag. 315. Spring-Verlag (1955).
8) A. Gilbert, A.G.W. Cameron: Canadian Journ. of Phys., vol. 43(1965) pag. 1446.
9) U. Facchini, E. Saetta-Menichella: Energia Nucleare, vol. 15/n,l/1968, pag. 54.
10) P.B. Kahn, N. Rosenzweig: Phys. Rev. vol. 187 (1969), pag. 1193.
11) P.E. Nemirovsky, Yu.V. Adamchuk: Nucl. Phys. vol. 39 (1962),pag. 553.
12) G. Reffo, M. Vaccari: to be published as a CNEN report.
129
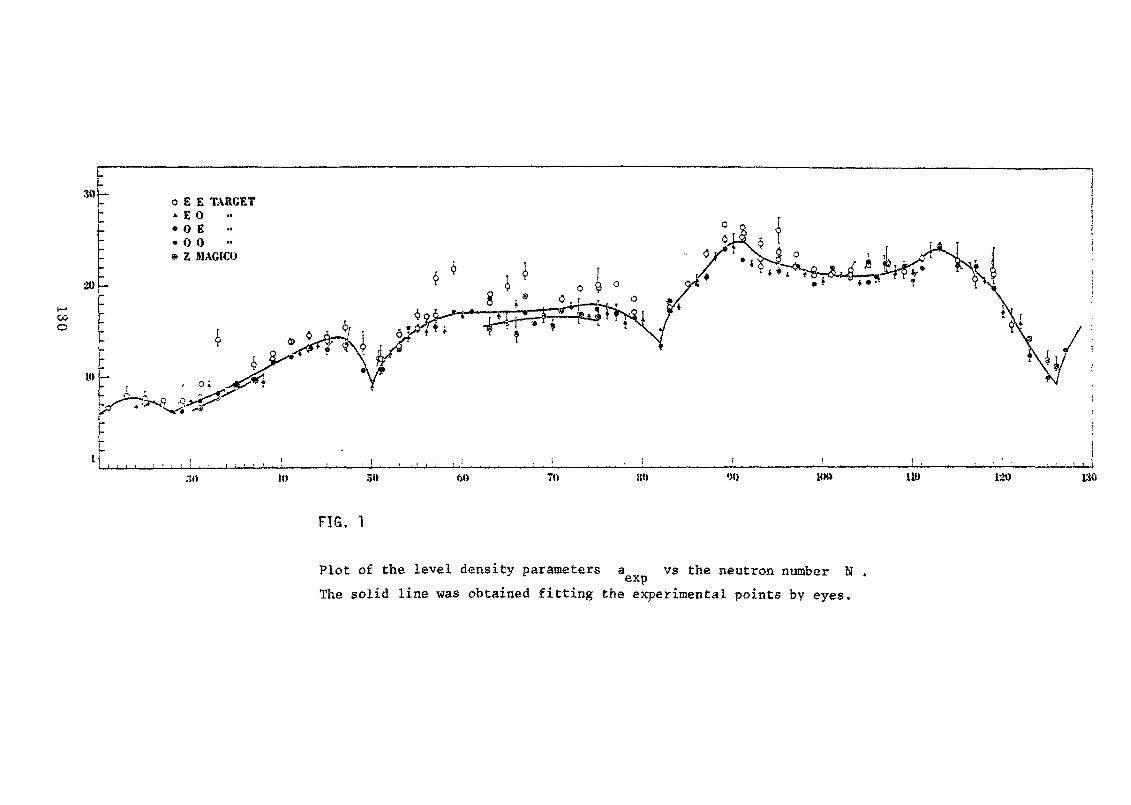
30 —
ooo
o E E TARGET• E 0• O E• 0 0• Z MAGICO
^
110 120 Wfl
FIG. 1
Plot of the level density parameters a vs the neutron number N .The solid line was obtained fitting the experimental points by eyes.

TABLE I
COMPOUNDNUCLEUS
Zn-68Zn
Ga-70Ga-72Ga
Ge-71Ge-73
EXPTL
«V
670
230381
9741550
Ge-74 | 124Ge-75 5850Ge-77 . 4200Ge
As-75As-76
Se-75Se-77Se-78Se-79Se-81Se
8r-80Br-828r
Rb-86Rb
71.4
370933120
10004110
60
Ret
5
14
41141
1
14114
5
i
180 1
a axp
9.53
11.511.9
1313.7512.5512.313.9
13.1
13.81413.414.3413.1
13,35
10.65
a s . s tMaV~'
10.8
11.412.5
11.412.512.913.414.1
13.4
12.513.413.81414
1414
11
!EXPERIMENTAL ADOPTED
MeV
16.3*
16.5
17.5
17.15*
15.5
18*
16.75
MeV
6.3*
9.2"
barn MeV
' 16.30.082*
16.5! 16.5
0.115
17.517.5'17.5
j 17.5
0.158
0.092*
17.5
17.15
17.1515.515.5
j 15.5
5.2
7*
; 15.50.118 |
116
i 160.175"
4.1 j 0.192i
15.75
MeV
6.3
^s for Zn"
tt
n
n
barn
0.082
0.1150.115
0.1580.1580.158
y e x p
mV
490±80
270*94240±40
162±25160*25197+29
0.158 j 195±4011
9.2
9.25.2
0.158
0.092
0.0920.118
5.2 0.118
120+25
290±55
290t50230*40411*72
5.2 1 0.118 i 220±455.2 0.118 220±50
7 0.175 405*567 ' 0.175 324t54
», i
i4.1 ! 0.192 215i86
i *)
i
N°
0<
1|
Reso
nanc
es j
2
109
33
1222
33
65
1642
73
2
. * -, ,''• Fy '- • Fy >
Ret From a 1 From 9exp sisl
i mV ' mV
1
1
1
1
1
1
1
1
4
1
646 ! 361
309240
211
316203
363158 235204 | 188152150
298
218
119140
279
2921 202 258411
14
4
j
278160256
488
289
W- R
mV
448
328
187140209159121
222
199174
238 283175171
417374
264
160130
283
MSGRV
mV
538
372331
214144167161122
460
417300402283308
345
195
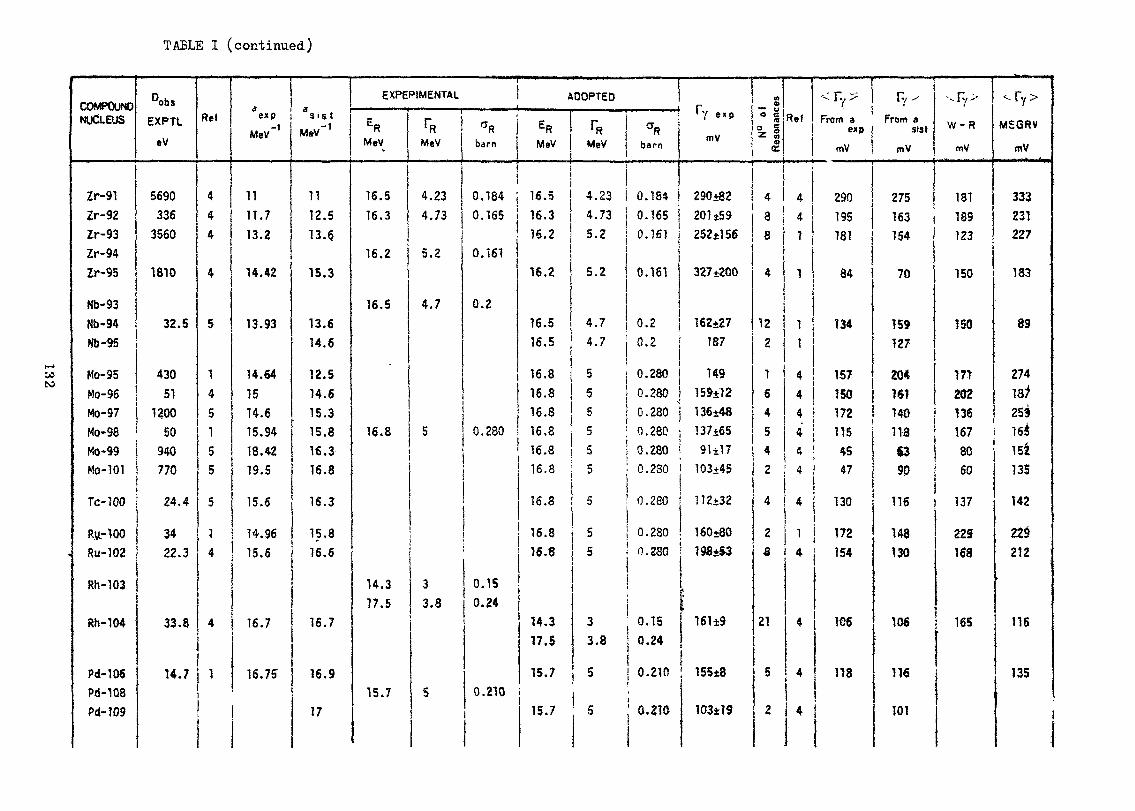
TABLE I (continued)
COMPOUNDNUCLEUS
Zr-91Zr-92Zr-93Zr-94Zr-95
Nb-93Nb-94Nb-95
Mo-95Mo-96Mo-97
°ObS
EXPTL
eV
5690336
3560
1810
32.5
43051
1200Mo-98 50Mo-99 940Mo-101 770
Tc-100 j 24.4
RU.-TOORu-102
Rh-103
Rh-104
Pd-106Pd-108Pd-109
3422.3
33.8
14.7
Rel
444
4
5
145155
5
J4
4
1
exp
MeV"1
11
11.7
13.2
14.42
13.93
14.641514.6
a s , s tMeV"1
11
12.513.6.
15.3
13.614.6
12.514.615.3
15.94 15.818.4219.5
15.6
14.9615.6
16.7
16.75
16.316.8
16.3
15.816.6
16.7
16.9
17
EXPERIMENTAL
ERMeV
16.516.3
16.2
16.5
16.8
MeV
4.234.73
5.2
4.7
CTRbarn
ADOPTED
MeV MeV
0.184 ; 16.5 4.230,155 16.3 4.73
16.20.161
0.2
j
5 0.280i
i
14.317.5
15.7
16.2
16.5
5.2
5.2
4.716.5 4.7
16.8 516.8 516.8 516.8 516.8 516.8 | 5
16.8 5!
16.8 5
33.8
5
0.15
16.6 5
0.24 j14.317.5
15.7
33.8
50.210
15.7 5
barn
0.184
0.1650.161
0.161
mV N°
o)
iRe
sona
nces
j 1
Ref
1t
290+82 4 4
'From a
exp
mV
290201*59 8 4 195252*156
327+200
t0.2 162+270.2 187
0.280 1490.280 159+120.280 136+480.280 | 137+650.280 91+17Q.2SO 103+45
0.280 112+32
0.280 160+800.230 198+53
•
0.150.24
0.210:
0,210
161±9
;
| 155*8
103+19
8
4
1 181
1
12 12
164
1
44
84
134
157150
From aSISt
mV
275
163154
70
759127
2041ST
4 ! 172 i 1405 4 1154 4 i 452 ! 4 4 7
4 4 130
25
21
5
2
1 1724
4
;
154
1C6
m
4
W - R
mV
181
189123
150
150
171202T36
MSGRV
mV
333231227
183
89
274IS?259
llfi 167 16563 8090 i 60
i
116
148130
137
229168
106 165
116
101
15*135
142
22$212
-
116
135
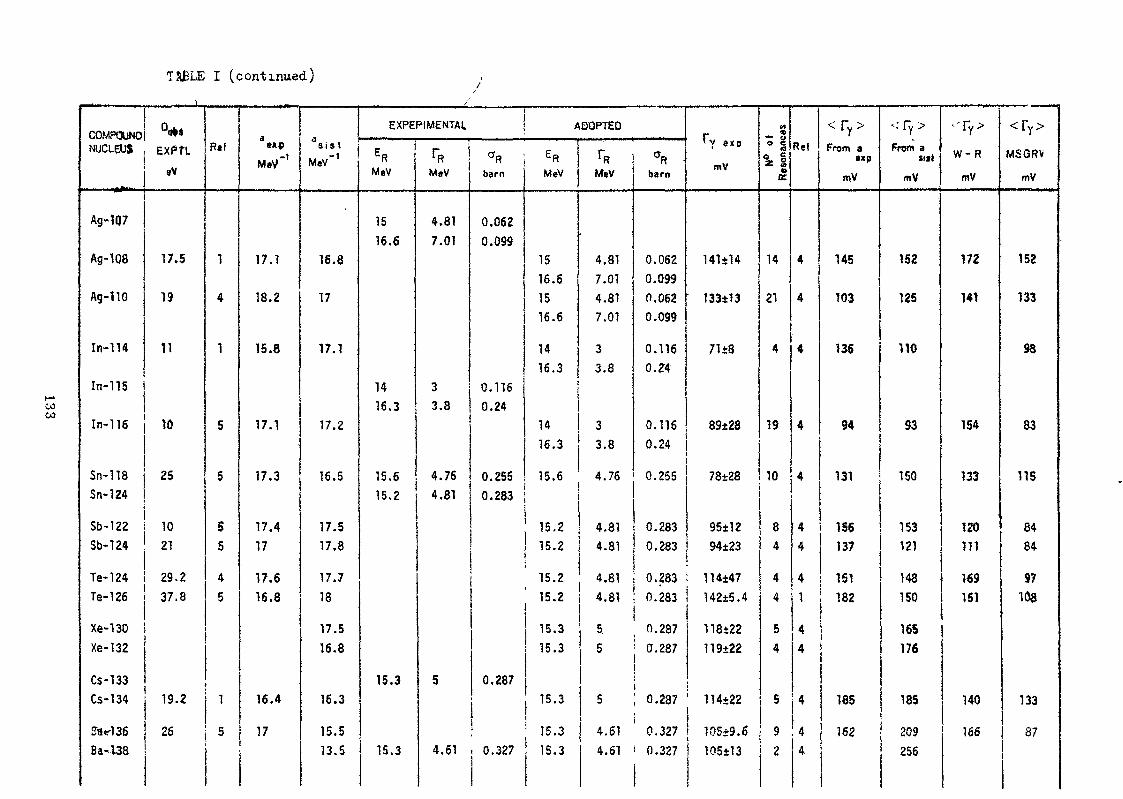
TJiBLE I (continued)
COMPOUNDNUCLEUS
Ag-107
Ag-108
Ag-110
In-114
In-115
In-116
Sn-118Sn-124
EXPtL
»V
17.5
19
11
10
25
Sb-122 i 10Sb-124
Te-124Te-126
Xe-130Xe-132
Cs-133Cs-134
2S<rl36
Ba-138
21
29.237.8
19.2
Ref
1
4
1
5
5
S5
45
1
26 j 5
M*'-'
17.1
18.2
15.8
17.1
17.3
17.417
17.616.8
16.4
17
a s ,s tMeV"1
16.8
17
17.1
17.2
16.5
17.517.8
17.718
17.516.8
16.3
15.513.5
• ———————————————— i ————————————————EXPERIMENTAL ADOPTED
MeV
15
16.6
1416.3
15.615,2
15.3
15.3
{- :
MaV
4.817.01
3
barn
0.0620.099
0.1163.8 j 0.24
4.764.81
5
0.255
MeV
1516.61516.6
1416.3
MeV
4.817.014.817.01
33.8
i14
16.3
15.60.283
15.2
33 Q
.O
4.76
4.8115.2 4.81
barn
0.0620.0990.0620.099
0.1160.24
0.1160.24
0.255
0.2830.283
> v e x o
mV
141+14
133±13
71+8
89+28
78+28
H°
ol
Reso
nanc
es
|
14
21
4
19
10
95±1294±23
15.2 4.81 0.283 i 114+4715.2 4.81
0.287
15.315.3
15.3
5
0.283
0.2875 0.287
i
142±5.4
118±22119+22
5 j 0.287 ; 114+22
15.3 | 4.61 0.3274.61 . 0.327 15.3 4.61 0.327
105*9.6105±13
84
44
54
5
92
Ref
4
4
4
4
4
44
4
<ry>from a
sxp
mV
145
103
136
94
«,
156137
1511 i 182
4
4
4
! 44
185
162
<Fy>
Prom aSilt
mV
152
125
110
93
150
153121
148150
165176
185
209256
•Ty>
W- R
mV
172
141
154
133
120111
1691S1
140
166
<ry>MSGRV
mV
152
133
98
83
115
8484
S7108
133
87

TABLE I (.continued)
COMPOUNDNUCLEUS
Pr-141Pr-142
Nd-144
°ohs
EXPTL
eV
31.2
32Nd-145 ! 520Nd-146 17.7Md-147 310Nd-148 |fid- 149 I 258Nd-150
Nd-151 i 247
Pm-148.-? 4.76
Sm-148 * 7.4Sm-150 • 2,8Sm-152
Sin- 153J8
Sjn-154
Sm-T55 _!'f
>/•52.5
125
'.* :
"=
•
Ref
1
51
41
4
4
5
14
1
1.
Mev!l
18.25
18
MeV~'
17
18.520.21 19.620.4 ; 20.823.54 21.8
i
26 23.1
i24.9 24.8
21.8 21.8
20,51 20.723.3
25.4
23
24.8
24.6 ' | 23.2
"
EXPEPIMENTAL | ADOPTED
R j RMeV i MeV
15.16
15.1
4.49
5.3IS 6.514.8
14.7
12.316
14.113.611.614.7
1115.3
barn
0.32
0.317
MeV
.15.16
15.10.297 i 15
6 0.308 t 14.8
7.2
3.35.2
45.5
i
MeV f barni
4.49
5.2
0.32
0.3176.5 0.2976 0.308
14.8 6 j 0.3080.253
0.1740.223
0.3350.36
14.7 7,2
12.3 \ 3.316
14.1
14.113.6
2.4 0.4 !3.4 0.42
34
0.2040.320
1
11.614.7
1115.3
5.2
4
45.5
2.4
0.263
0.1740.223
0.335
0.3350.36
0.4
3.4 0.42
i3 ! 0.2044 j 0.320
iii
Ty exp
mV
85±17
73±7.378±1253tlO55+8
85±35
84+19
68+8
71+2764+3.3
57±4
74±11
1 N«
.1 I
| Re
sona
nces
}
10
17
2172
5
5
5
44
9
3
Rut
4
4141
4
4
<ry>From a
; 9Xp
mV
94
13811411549
42
31
4 63
,4
10
10
80120
50
51
< ry >SlSt
' '
115
12912810861
60
31
63
78125
58
63
W - R
mV
87
91647637
65
90
49
,58
MSGRV
fflV
f
50*'
86< 93' 66' 67
54
60
73
6750
61
64
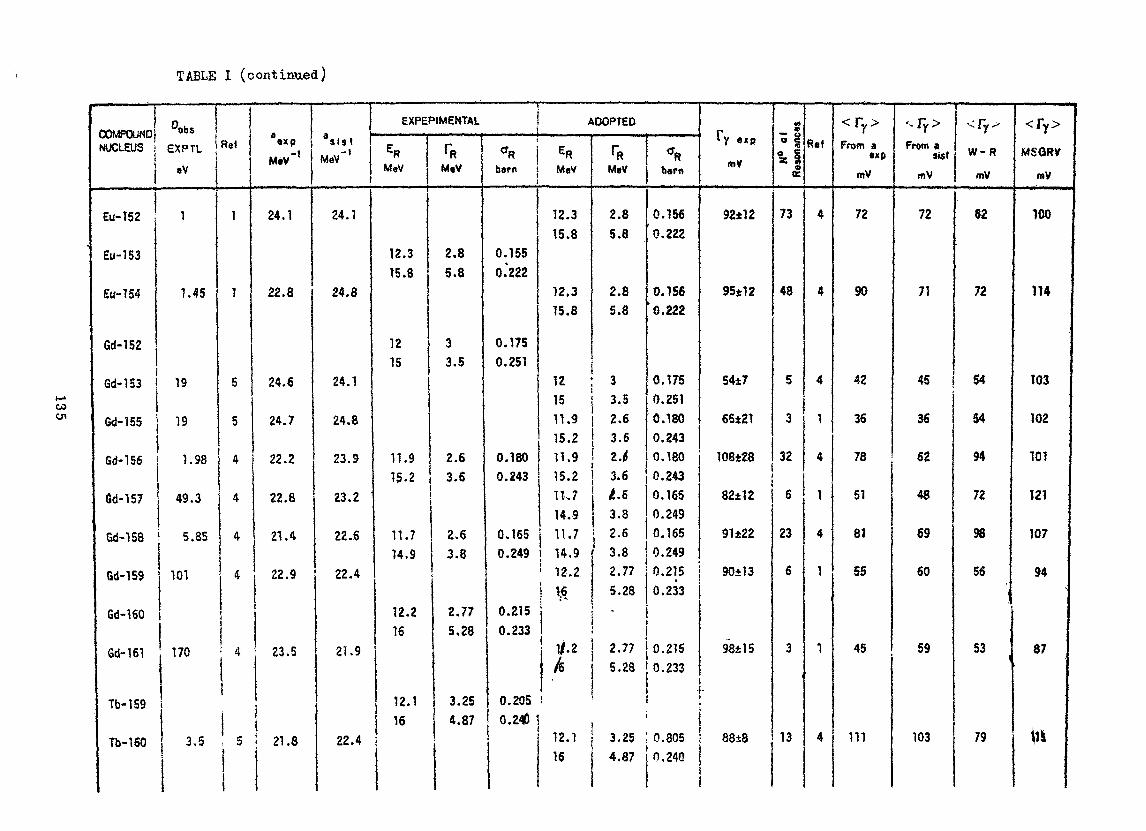
TABLE I (continued)
COMPOUND)NUCLEUS :
Eu-152
Eu-153
Eu-154
Gd-152
Gd-153
Gd-155
Gd-156
3d- 157
Gd-158
Gd-159
Gd-160
Gd-161
I
EXPTL
«v
1
1.45
19
19
1.98
49.3
5.85
101
170
1Tb-159
Tb-160
Re»
1
1
5
5
4
4
4
4
! 4
1
\
3,5
MtV"1
24.1
22.8
24.6
24.7
22.2
22.8
21.4
22.9
23.5
t5 : 21.8
as is tMeV"1
24.1
24.8
24.1
24.8
23.9
23.2
22.6
22.4
21.9
22.4
EXPEPIMENTAUi
MeV
12.315.8
1215
11.915.2
MeV
2.85.8
33.5
2.63.6
I
11.714.9
12.216
12.116
i
2.63.8
2.775.28
3.254.87
t
barn ii
0.1550. 222
0.1750.251
0.1800.243
0.1650.249
ADOPTED
MeV
12.315.8
12.315.8
MeV
2.85.8
2.85.8
12 : 315 | 3.511.9 2.615.2 3.611.9 2.415.2 3.6IT. 714.911.7
1.63.82.6
barn
0.156
0.222
0.1560.222
0.1750.2510.1800.2430.1800.2430.1650.2490.165
14.9 ' 3.8 0.249! 12.2
162.775.28
0.2150.233
mV
92 ±12
95t12
54±7
65±21
108*28
I N«
o.
1|
Reso
nanc
es ]
73
48
5
32ti
82±12
91±22
0.215 ; 90±13( I
0.233
1/.2 2.77 0.215/ i/6
0.205 !0.240
5.28 0.233j1
{
12.1 3.25 ; 0.80516 4.87 0.240
98±15
.
8S±8
6
23
6
3
13
Ret
4
4
4
1
4
1
4
1
1
4
From atxp
mV
72
90
42
36
78
51
8)
55
45
in
•-ry>From a
list
mV
72
71
45
36
62
48
69
60
59
103
W - R
mV
62
72
$4
54
94
72
98
56•
53
79
<ry>MSGRV
mV
100
114
103
102
101
121
107
94
87
m
CO

TABLE I (continued)
. COMPOUNDNUCLEUS
Dy-157
Dy-162
. Oy-163
Dy-164"
Ho- 165
"ocs
EXPTL
.V
3.4
2.8
72
3
' '
Her ~ * < P) WeV~'
1 25.74
4 ! 21.3
1 * 22. C41
1
4 _ 21.7
1
t
i
•i
i
;t
|
1'
i
MeV"'
24.8
22.2
:21.9
1
21.7
EXPERIMENTAL^ 1 v
MeV i MeV : barn ' M
1 j: ! , 1 2I i »
! i 12i ii 16
1 12
i is1 *
121 i ' *s1 ! '=
12.1 I 2.7 ' 0.25 j15.6 ! 4.8 ! Q.287 i
,
i Sj ii i: Ii ii i; i! ii ii i
i iI i iS |' j j
| !; i ii !' !
J I
1 '"
ADOPTEDI f
sV •• MeV barn ' mV
!
i i *J ' 3.25 0.205 j 133±25
| 4.37 o.240 I.1 3.25 C.2C5 ' 113+25
.' 4.37 .240 :.1 2.7 .25 . 155±15.6 4.s -237.1 2.. 7 :.25 i 109±6
s , . . ^0-t, i
t
i<
; !i 1 -
1 r
\ ''- t
1
; I
1 >
'' , !
'
•
i i! j,!
!
j
«
• =1 <C i/l
S.;
2i
6'
2
4
R«J
1
1
4
- r,-From a
mV
64
121 '
76
92
(•1
rT>From a
sist
mV
71
109
77
92
*
W - R
mV
114
82,
H6
I
•
<rY>MSGRV
mV
103
113
147
T08
en

ONE^ GROUP FISSION PRODUCT CAPTURE CflOSS-SBpTIONS
AS USED IN FA3T REACTOR CALCULAffONS
C. J. BEAN
United Kingdom Atomic Energy Authority Atomi* Energy EstablishmentWinfrith Dorchester Dorset
ABSTRACT
In order to give a broad comparison of th.e various cros-sectionevaluations available for u*e in fast reactor calculations a typicalfast reactor spectrum has been used to form l«-group cross-sections*This spectrum averaged over the 37 energy groups of the FD*j set isgiven in Table 2.
One-group capture cross-sections for fission products condensedfrom the 1971 Lucas Heights data (l), and the Australian and Italiancombined evaluation of 1967 (2), (3) over the energy range 10 MeV to0.0001 eV using this standard fast reactor spectrum are given inTable 1.
REFERENCES
(1) BERTRAM W.K., CLAYTON E., COOKE J.H., FERQUSON H.D., MUSOBOVE A.R. 4ROSE B.K. (June 1971) AABG/E214
(2) BENZI V. A BARTOLANI M.V. (Oct. 1966) IAEA Paris Gonf. on Nuclear Datafor Reactors I_, 537
(3) COOK J.L. (Oct. 1966) IAEA Paris Conf. on Nuclear Data for Reactors 1., 549
137
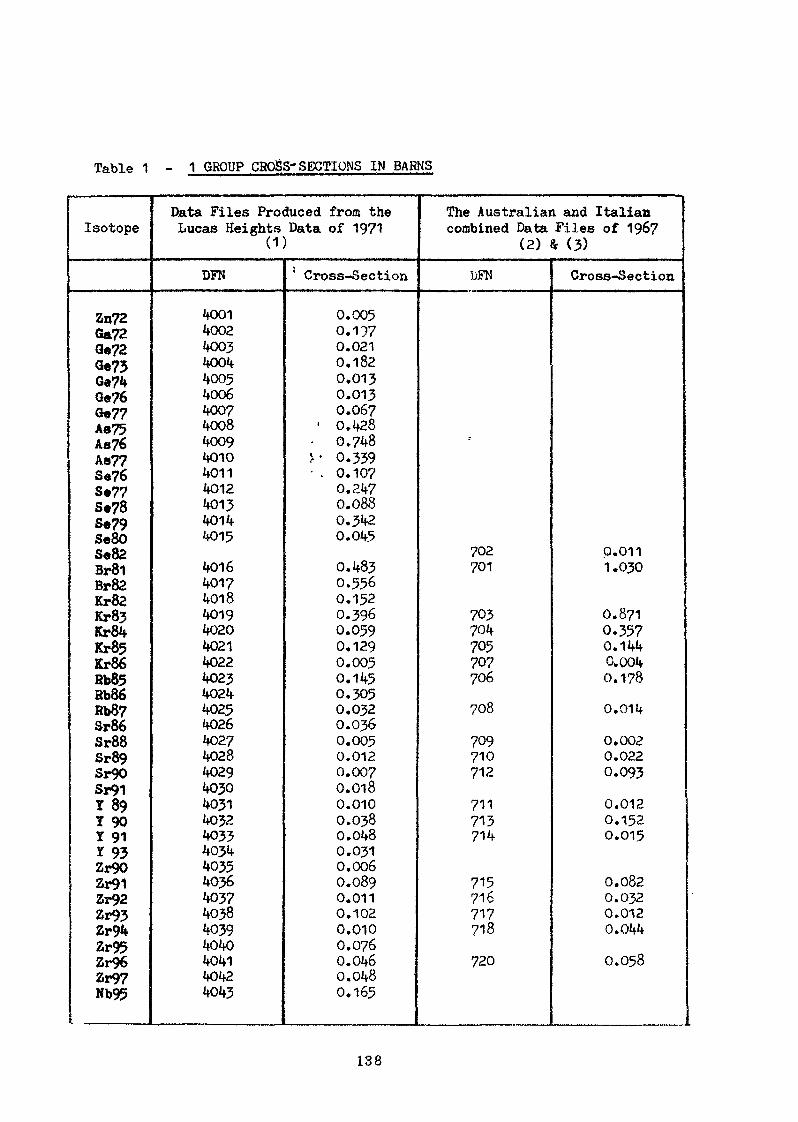
Table 1 - 1 GROUP CROSS-SECTIONS IN BARNS
Isotope
Zn72Ga72G<>720*73Ge74Qe76G«77A«75As76Aa?7
S«77S*78£•79Se80S«82Br8lBr82Kr82Kr83Kr84Kr85Kr86Bb85Bb86Rb87Sr86Sr88Sr89Sr90Sr91T89I 90I 91I 93Zr90Zr91Zr92Zr93Zr94Zr95Zr96Zr97Nb95
Data Files Produced from theLucas Heights Data of 1971
(D
DFN
400140024003400440054006400740084009401040114012401340144015
4016401740184019402040214022402340244025402640274028402940304031403240334034403540364037403840394040404140424043
' Cross-Section
0.0050.1970.0210.1820.0130.0130.067
1 0.428• 0.748>• 0.339• . 0.107
0.2470.0880.3420.045
0.4830.5560.1520.3960.0590,1290.0050.1450.3050.0320.0360.0050.0120.0070.0180.0100.0380.0480.0310.0060.0890.0110.1020.0100.0760.0460.0480.165
The Australian and Italiancombined Data Files of 1967
(2) & (3)
DFN
~
702701
703704705707706
708
709710712
711713714
715716717718
720
Cross-Section
0.0111.030
0.8710.3570.144C.0040.178
0.014
0.0020.0220.093
0.0120.1520.015
0.0820.0320.0120.044
0.058
138

Table 1: (continuec5)
Ho95Mo96
Jfo98Mo99MolOO
RulOO
Ru102Ru103
Ru105fia.106Rk103Rh105Pd104Pd105Pd106Pd10?Pd108Pd109Pd110P<t112Ag109
Cd110Cd111Cd112/"* J*! *€ 1vU I 1 J
Cd114CdH5CdH6In115Sal15S»116Sa11?Sn1l8SB119Sn120Sa1215&122
Sn124Sn125Sn126Sb121Sb122Sb123
—— ....
4O44404^7iiO46^Qit740484049405040514052^vQcj"5iiO^/»
405640574058405940604061406240634064406540664067406840694070407140724073407440754076407740784079408040814o824083408440854086
-408740884089409040914092
0.293 '0.0800.2540.1600.2580.1160.46?0.4521.5260.2770.4630.1410.3100.0650.5410.2340.4100.4640.1450.4580.0960.2750.0430.0610.5690.2850.2820.2210.1730.2660.1430.3440.0410.4830.1520.1110.2890.1110.200O.0420.2450.0370.1260.0270.1020.0120.3920.7060.294
719
721722
724723
725726
728
727729
730731732733
734
735
736
——————————
0.319
0.3530.149
0.1260.657
0.7960.350
0.216
0.8330.0091.1390.2521.CJ660.287
1.010
0.593
0.717
139

1: (continued^
Sb124Sb125Sb126Sbl2?Sb128T«122Te123T«12%T«125T«126T«127Te128T«129T«130T«131T«132I 127I 129I 130I 131I 133I 13?X.128X.130X«131X«132X.133
X.135X*136C«133
C»135Ce136C8137
Bdi36Ba137Ba138Bal40La139
C«140C«141C«142C«143C«144Px*141P2**t42Ppl43
J^QQ'Z
liQQli
409540964097409840994100410141024103410441054106410741084109411041114112411341144115411641174118411941204121412241234124412541264127412841294130413141324133413441354136413741384139414041414142
0.3280.1440.3640.1110.1540.2170.4150.1250.2880.0710.2230.0370.0870.0080.0040.0010.4980.2660.5880.1680.00040.0020.3490.2300.4200.1130.1110.0170.0160.0040.3880.4490.1600.1770.0170.3810.0800.1080.0070.1940.0490.1860.0180.1190.0430.1200.0760.1310.2930.410
737 , u _
-•-•
739
741
738740
742
749
743744745747750752746748751
753
754
755
756
758
757
0.472-
•: > < - ,.• • • •
0.0250.030
0.9740.565
0.450
0.004
0.3930.0610.3770.0410.0090.0110.5271.8340.305
0.002
0.003
0.020
0.025
0.035
0.160
140

Table 1: (continued)
P*145H4142H4143M4144H4145
H4147
K4150P&147
Psil49P«151Sisl47Snl48Sal49Sa150Sal516a152Sa1538*154SB156Bu153K«1548*155Eu156Eo157041550415604157641580415904160Tb159Tbl60Tbl6lDyl6ODj-161Dyl62Dyl63ES3T164Eo1$5Tc99MC4115MHI& 4 *JjTEjrf•»V IC*^^*
T®125M7«127MT«129MJ*Q ' J? 1 1Jr|( I^Qin.
4143ikl /AJI
tl li 5
f t ^ iioi» ii1?Ji llo
41494150415141524153415441554156415741584159416041614162416341644165416641674168416941704171417241734174417541764177417841794180418141824183418441854186418741884189419041914192
0.3090.0780.4210.1310.3520.0920.5150.2630.1091.1460.9031.1051.1311.2120.2191.4170.5832.5910.5831.5120.2680.4021.9602.8931.7381.6561.0771.3120.4070.655Qw2Qlf
0 3^*30.0721.5341.5270.8160.7401.0170.3870.5710.0951.4410.4250.3600.4550.2890.2520.1110.0051.327
759760761762
764768763766
767769770771
773
77277^775
776777778
765
0.0030.1210.5730.1550.2100.2561.1713.061
2.0010.6453.3220.541
0.249
2.6105.3652.267
2.1980.7651.428
21.048
141

Table 2 - STANDARD FD5 FAST REACTOR SPECTRUM
Group
12345678910111213141516171819202122232425262728293031323334353637
Lower Energy
10.0 MeV6.06533.67882.23131.3534
820.85 KeV497.87301.97183.16111.0967.38040.87024.79015.0349.11905.53103.35462.03471.2341
748.52 eV45 .00275.36167.02101.3061.44037.27022.603
Flux
0.0188480.3668611.7837425.0363046.9838568.31576215.16434015.10651518.96925419.54335416.79954513.4663789.9844388.9307046.4534873.8110142.3625750.9261762.5399411.7349040.9393030.4425710.1549610.0534090.0115430.0014400.000232
13.710 | 0.0000298.31505.04403.05901.85501.12500,68300.414000.100000.00010
0.0000030.00.00.00.00.0o.o0.00.0
142

Compilation.ofNeutron Capture Cross Section. Data for FissionProduct Nuclides in the Energy Range from 1 keV to 15 MeV
H. MatsunobuSUMITOMO Atomic Energy Ind., Ltd.
Abstract
Nuclear data of the fission products play an important role
in many fields relating to nuclear energy. In particular, neutron
capture cross section of the fission product nuclides is an
important quantity in order to determine reactor design and burn
up of nuclear fuel. However, the situation of the data for neutron
capture cross section is not satisfactory at present.
In this paper, status of the experimental data for neutron
capture cross section which were compiled up to date for the
important 28 nuclides in the energy range from 1 keV to 15 MeV is
explained, and comparisons with the evaluated data are given.
Furthermore, measurements of neutron capture cross section are
requested for the important nuclides whose the experimental data
are not obtained or poor.
1. Introduction
Neutron capture cross section of fission product nuclides
play* an important role in the burn up characteristics of
reactor. Accordingly, in order to do the accurate burn up
calculation, it is necessary to prepare a reliable neutron
capture cross section set of FP nuclides. However, the experi-
mental data for FP nuclides are neither enough nor complete at
present. Therefore, for FP nuclides whose the neutron capture
cross section has not been measured, it is required to produce
143

the cross sections by theoretical calculation of the basis of
some nuclear models. In this case, it is necessary to know the
systematic trends for the nuclear parameters and cross sections
of the neighboring nuclides whose the experimental data are obtained.
In order to grasp this systematic trends, it is desirable to get
the experimental data as many as possible.
On the basis of such background, compilation work of the
experimental data for neutron capture cross sections of the FP
nuclides has been commenced as a part of the nuclear data
evaluation works in JNDC (Japanese Nuclear Data Committee) since
1970. As the first step, the experimental data cited in BNL-3252)2nd Edition, Supplement No. 2 were compiled in the atomic
number range 32<Z^66 in 1970, and a comparison with the evaluated
data of Benzi and Reffo ' was done in the energy range from
1 keV to 10 MeV.
On neutron capture cross sections of the FP nuclides, many
measurements have been performed since 1966 in which the above-
mentioned Supplement published, and a number of data were accumulated
up to date. Therefore, as the second step, the new experimental
data for the following important 28 nuclides which play the most
effective role in the burn up calculation of fast reactor have
been searched in the energy range from 1 keV to 15 MeV.
o, **Tc,I03flfc, 105Pd, 107Pd, l°*Ag, 129J, l3lXef l^Cs, 13s6's, 137<7s, '
^"Ce, llt'Nd, l^Nd, ll>5Nd, 11>7PW, l^Sm, l^Sm, 15lSm, l53Eu, 1S5ff
The compiled experimental data are compared with the evaluated4)data of Benzi and Reffo, Musgrove , and JNDC data which were
obtained in the above-mentioned evaluation works.
As the next step, compilation work of the new experimental
data for nuclides except the above-mentioned important 28 nuclides
is in progress at present. These compiled experimental data will
be serviceable in estimation of the neutron capture cross sections
for the nuclides whose the experimental data do not exist.
2. Neutron Capture Cross Sections for the Important 28 Nuclides
The above-mentioned 28 nuclides were selected on the basis
of the fact that the important FP nuclides which give the most
dominant effect to the burn up characteristics of reactor, have
large values of macroscopic cross section which is defined as
microscopic neutron capture cross section times yield ratio.
The experimental references on neutron capture cross section for
28 important nuclides we»e searched using CIND.A 72, and the
numerical data were collected from the original literatures and
NEUDADA. As the result of search, 40 literatures and the numerical
data were compiled in the energy range from 1 keV to 15 MeV for
the following 11 nuclides.95Ato, *7Mo, "re, l**Ru, l»*RUr 103/?fc, l»*Ag, 133Ca, l*7Sm,
l**Sm, 1532?u.
However, these are not all of the experimental data,
because there are some literatures and data that we can not obtain
and are not also cited in NEUDADA.
On the remaining 17 nuclides among the important 28 nuclides,
the experiments for neutron capture cross section have not been
performed up to date. The reason may be that it is difficult to
perform the measurement, because the most nuclides among the
above-mentioned 17 nuclides are radio-active nuclides. But, it<•,
is noted that there are no data in the fast energy range for the
most isotopes of Xe which are not radio-active.
On 11 nuclides whose the experimental data exist, there are'.•if-' V
large differences between numbers of data points for each nuclide.
145

That is, there is only one data point for l*7Sm and ltf9Sm, on the
contrary the experimental data are very rich for l °3Rh and 133Ce.
The status of the data distribution for 11 nuclides is shown in
Table 1.
Table 1 The status of the experimental data for 11 nuclides
Nuclide95 Mo97 Mo".To
l'*Rul'*Ru
105Rh109Ag133Cel*7Sml**Sml**Eu
No. ofReferences
11137
2269111
No. of DataPoints
14
243037
many3710411
20-
Energy Range ofthe Experimental Data
below 50 keVbelow 60 keVbelow 50 keV2, 24, and 190 keV2, 24(2 points), 190 keV,3, 14, and 15 MeVall rangebelow 6 MeVall range30 keV30 keVbelow 40 keV
The experimental data collected for 11 nuclides are shown in
Pig. 1 through 11, and compared with the evaluated data of JNDC
and Benzi & Reffo, or Musgrove. Agreement between the evaluated
data and the experimental data is generally good for 11 nuclides.
However, in detail, there are some discrepancies between the
experimental and the evaluated data, between the experimental data,
and between the evaluated data, respectively. Especially, forlo*Rh, 103Ag, and 133C'3, it is noted that considerable discrepancies
exist between the experimental data. On the other hand, it is seen
that large discrepancies between the evaluated data of Benzi & Reffo
146

and JNDC appear in MeV region. That is, the curve of JNDC data
are falling down rapidly in MeV region, while the curve of Benzi &
Reffo data are rising up above 10 MeV. These discrepancies may
be caused by the difference of calculation methods that the
contribution for direct process of nuclear reaction is not taken
into account in the evaluation of JNDC, while it is taken into
account in that of Benz'i & Reffo. Judging from the experimental
data near 14 MeV for 'l**Ru, 103fl/z, and 13S£e, it should be taken
into account of necessity, although this energy range is not so
important in reactor calculation.
3. Compilation of the Experimental Data for FP Nuclides except
the Important 28 Nuclides
It is necessary to collect the experimental data as many «a \possible, in order to know the systematic trends of neutron capture
cross section for FP nuclides. Accordingly, as the next step,
compilation work of the new 'experimental data measured since 1966
has been performed in the atomic number range 32&Z&66 for FP
nuclides except the important 28 nuclides. This work is not completed
at present, because a number of new data are accumulated up to
date for many nuclides. At present, the experimental data for
87 nuclides including natural elements have been compiled. However,
the number of the experimental data for each nuclide is generally
poor except some nuclides. Nuclides which have many data are the
following 14 nuclides and 9 elements.75As, 89Y, 90Zr, 93tffc:, Mo, **Mo, l«°Mo,''Ag, l07Ag, Cd'f In,
ll5In, Sb, 127I, 13«Ba, Lcc, 1<tXPr, Sm, l*lEu', Gd, l**Gd, 'l**Tb, Vy ,
Next, comparison with the evaluated data of Benzi & Reffo was
done for the stable nuclides and the natural elements. As the
147
results, it was confirmed that agreements are good for nuclides
and elements which have many experimental data.
4. Remarks
As mentioned in the previous sections, a number of the
experimental data for FP nuclides have been accumulated up to date,
but number of the data for each nuclide is not enough except some•' .*•
nuclides. Especially, the data in the energy range above 100 keV
are poor for the most nuclides, and the data for radio-active
nuclides are also scanty. Furthermore, there are some discrepancies
between the experimental data for the nuclides which have many data.
These discrepancies are an obstacle to evaluate the data, and the
source of them should be clarified in early time.
In..yiew of these facts, it is necessary to have reliable
experimental data, (neutron capture and inelastic scattering cross
sections and resonance parameters) as many as possible in addition
to present data, in order to grasp the systematic trends (energy
and N-Z dependences) of the data, and to do tiore accurate calculation
and evaluation of neutron capture cross sections.
At least, it is an urgent problem to obtain any experimental
data for the important nuclides whose neutron capture cross sections
or resonance parameters have not been .measured and the data are poor.
References
1. Evaluation of Neutron Cross Sections for < 8 Important Fission
Product Nuclides: (Communicated by Igarashi S) (1973)
2. BNL 325, 2nd Edition, Supplement No. 2 (LS66)
3. Benzi V. and Reffo G. : CCDN-NW/10 (1969)
4. Musgrove A. R. de L. : AA3C/E198 (1969)
148
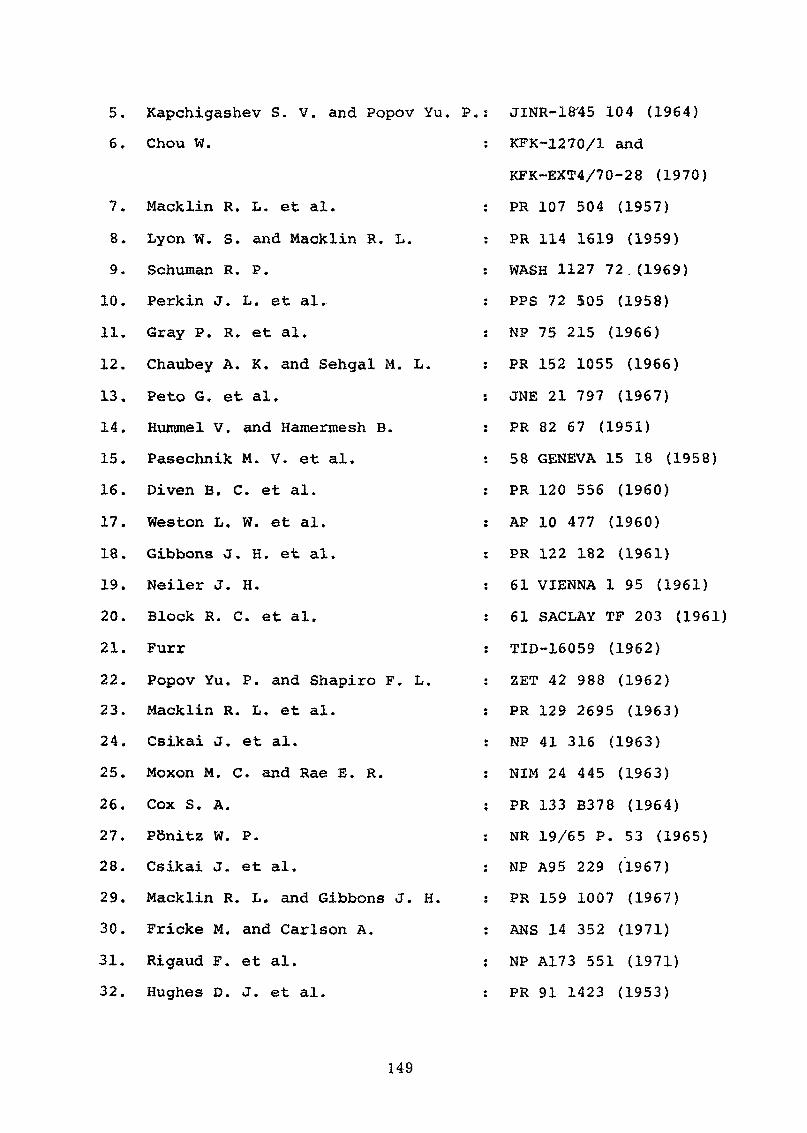
5. Kapchigashev S. V. and Popov Yu. P.:
6. Chou W. :
7. Macklin R. L. et al. :
8. Lyon W. S. and Macklin R. L. :
9. Schuman R. P. :
10. Perkin J. L. et al. :
11. Gray P, R. et al. :
12. Chaubey A. K. and Sehgal M. L. :
13. Peto G. et al. :
14. Hummel V. and Hamermesh B. :
15. Pasechnik M. V. et al. :
16. Diven B. C. et al. :
17. Weston L. W. et al. :
18. Gibbons J. H. et al. :
19. Neiler J. H. :
20. Block R. C. et al. :
21. Furr :
22. Popov Yu. P. and Shapiro F, L. :
23. Macklin R. L. et al. :
24. Csikai J. et al. :
25. Moxon M, C. and Rae E. R. :
26. Cox S. A. :
27. Ponitz W. P. :
28. Csikai J. et al. :
29. Macklin R. L. and Gibbons J. H. :
30. Fricke M. and Carlson A. :
31. Rigaud F. et al. :
32. Hughes D. J. et al. :
JINR-18'45 104 (1964)
KFK-1270/1 and
KFK-EXT4/70-28 (1970)
PR 107 504 (1957)
PR 114 1619 (1959)
WASH 1127 72. (1969)
PPS 72 505 (1958)
NP 75 215 (1966)
PR 152 1055 (1966)
JNE 21 797 (1967)
PR 82 67 (1951)
58 GENEVA 15 18 (1958)
PR 120 556 (1960)
AP 10 477 (1960)
PR 122 182 (1961)
61 VIENNA 1 95 (1961)
61 SACLAY TF 203 (1961)
TID-16059 (1962)
ZET 42 988 (1962)
PR 129 2695 (1963)
NP 41 316 (1963)
NIM 24 445 (1963)
PR 133 B378 (1964)
NR 19/65 P. 53 (1965)
NP A95 229 (1967)
PR 159 1007 (1967)
ANS 14 352 (1971)
NP A173 551 (1971)
PR 91 1423 (1953)
149

33. Kononov V. N. and Stavisskij Yu.Ja.
34. Sriramachendra M. M. et al.
35. Booth R. et al.
36. Borbely I. et al.
37. Ponitz W. P. et al.
38. Tolstikov V. A. et al.
39. Qaim S. M.
40. Brzosko J. S. et al.
41. Rigaud F. et al.
42. Macklin R. L. et al.
43. Konks V. A. and Fenin Yu. I.
AE 19 457 (1965)
70 MADURAI 2 29 (1970)
PR 112 226 (1958)
KFKI-1467/F (1963)
KRL, SM1 01/9 (1967)
AE 23 566 (1967)
JIN 32 1799 (1970)
APP B2 489 (1971)
NP A176 545 (1971)
Nature 197 370 (1963)
DUB-1845 100 (1964)
150

Fig. 1
S.V. Kopchigashev, Conf. on Interaction of Neutronswith Nuclei, Dubna, 1845. 104 (1964)Benzi and Reffo : CCDN - NW/IO (1969)JNOC H973)
151
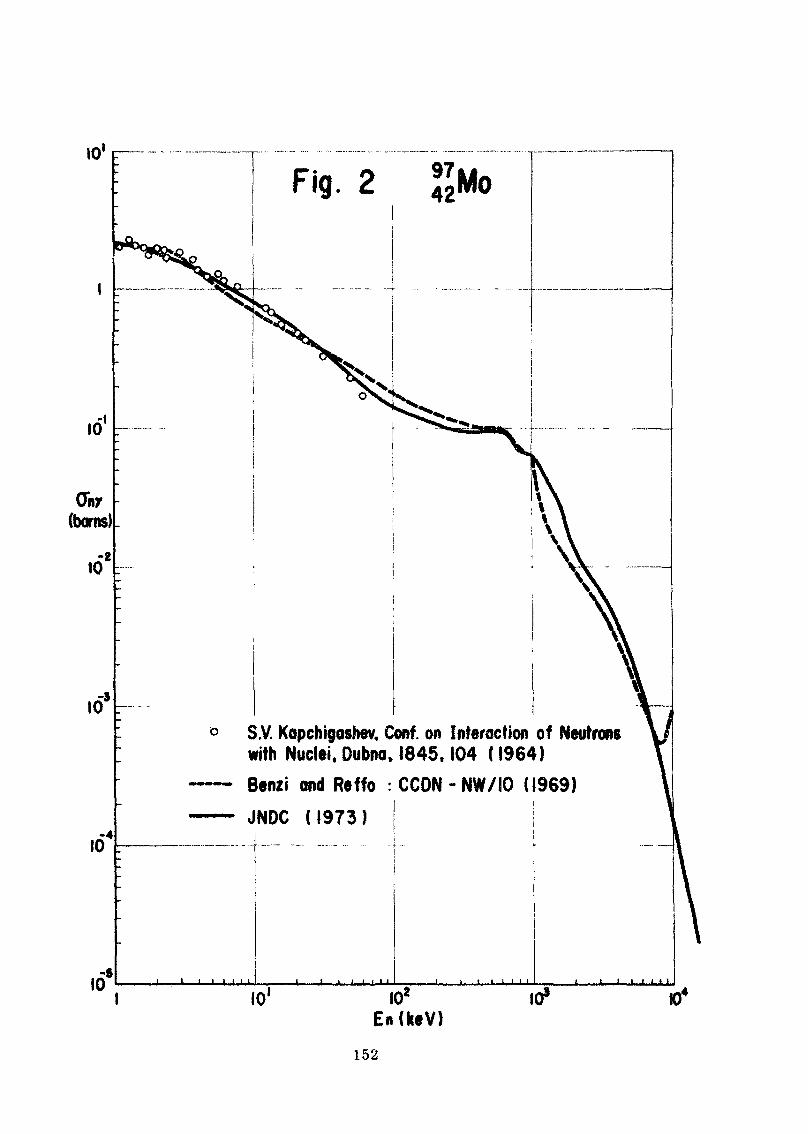
Fig. 2
S.V. Kopchigoshev. Conf. on Interaction of Neutronswith Nuclei. Oubna, 1845.104 (1964)Benzi and ReffoJNDC (1973)
CCDN-NW/IO (1969
1010*
E n ( k e V )10s 10*
152

101
(boms)
-210
Id5
.64
10s1
Fig. 3 JJTc
Chou :KFK 1270/f (1970)NEUDADA 2/72
Musgrove : AAEC/E 198 (1969)JNDC (1973)
10'En (keV)
153

(boms)
I0"!
10
10"
KT
Fig. 4 l0
R.L.Macklln et al. : PR 107.504(1957)
W.S.Uyon and R.L.Macklin : PR 114,1619(1959)•> r\
R.P.Schuman : WASH 1127,72(1969)
Benzi and Reffo : CCDN-NW/IO (1969)
JNDC (1973)
t i t i i t t i I I I J . _ _ . I L 1 t 1 I I 1 1 ( 1 1
I01
En UeV)
154
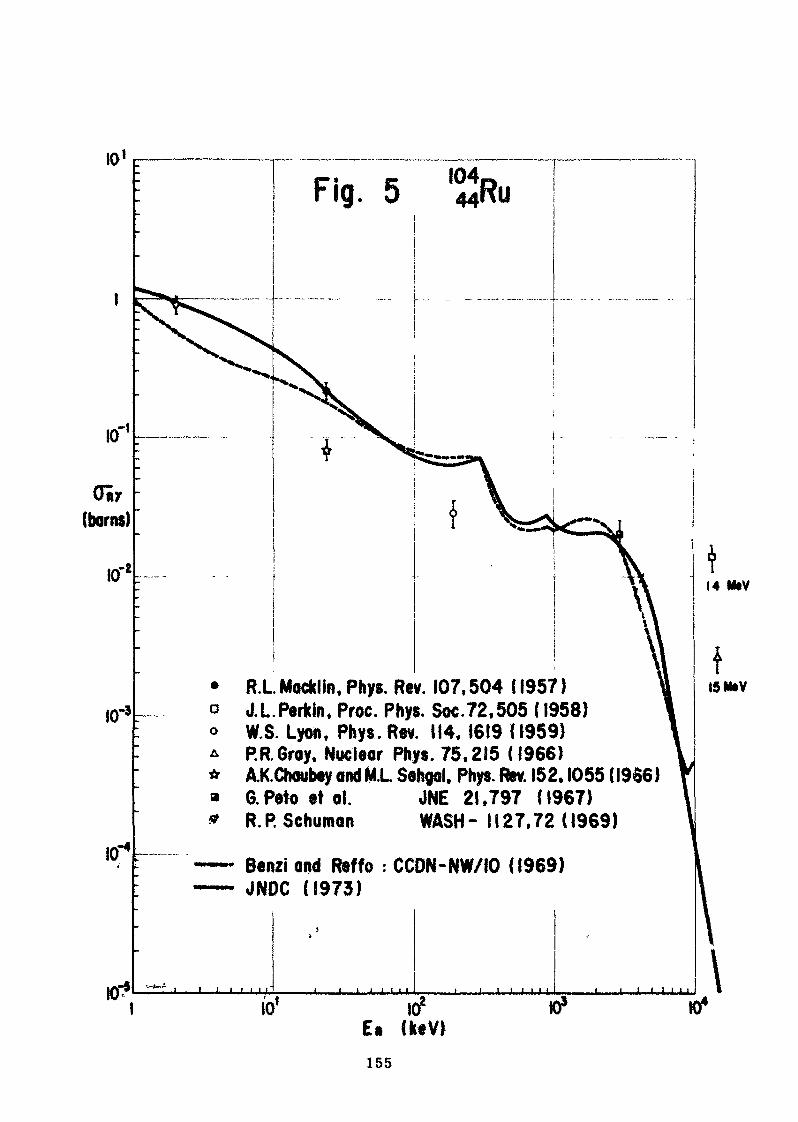
i<r
KT3
10"
I04044Ru
R.LMocklin.Phys. Rev. 107,504 (1957)J.LPerkin, Proc. Phys. Soc.72,505 (1958)W.S. Lyon, Phys. Rev. 114, 1619 {(959)PR.Gray, Nuclear Phys. 75,2!5 (1966)AXChoubey awl Ml. Sehgol. Phys. Rev. 152,1055 (1956)& Mortal . JNE 21,797 (1967)R.P Schuman WASH- 1127,72 (1969)
Benzi and Reffo : CCON-NW/IO (1969)JNDC (1973)
.1 I L LA
10*
155
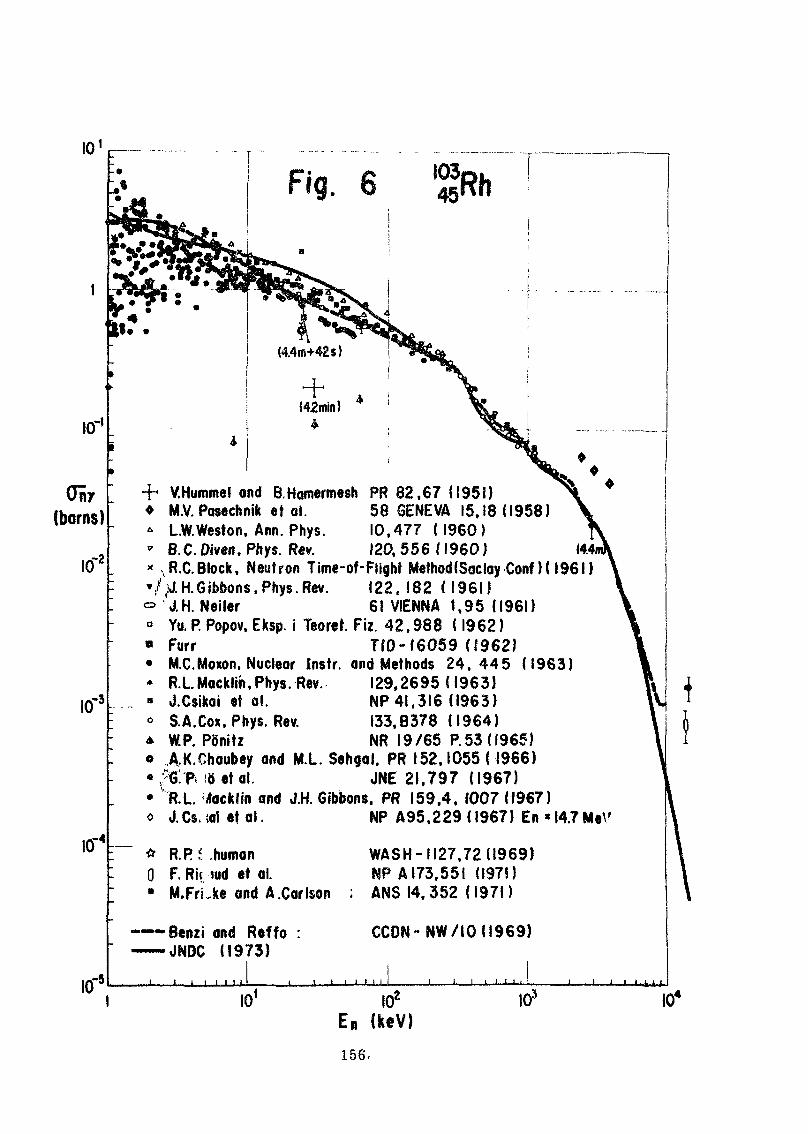
10'
HIO
Onr(barns)
10
K
,-2
S
ID"4
« V.Hummel and B.Hamerrnesh PR 82.67 (1951)MV. Posechnik et al. 58 GENEVA 15.18(1958)LW.Weston, Ann. Phys. 10,477 ( I960)B.C. Diven. Phys. R«v. 120, 556 (I960) 14R.C.Block, Neutron Time-of-Flight MethodfSaclay Conf)(1961)
/•J.H. Gibbons, Phys Rev. 122,182 (1961)J.H. Neiler 61 VIENNA 1,95 (1961)Yu. P. Popov. Eksp. i Teoret. Fiz. 42.988 (1962)Furr HO- (6059 ((962)M.C.Moxon. Nuclear Instr. and Methods 24. 445 (1963)
129,2695(1963)NP41.3I6 (1963)I33.B378 (1964)NR 19/65 P. 53 (1965)
A.K.Ohaubey and M.L. Sehgal. PR 152.1055 (1966)'&P< io'etal. JNE 21.797 (1967)R.L. Jack!in and J.H. Gibbons. PR 159.4. 1007 (1967)J.Cs a! et al. NP A95.229 (1967) En
R.LMacklin,Phys. RevJ.Csikai et al.S.A.Cox. Phys. Rev.WP. Ponitz
* R.R i .human0 F. Ric iud et al.* M.FrLke and A.Carlson
•—-Benzi and Reffo :—— JNDC (!973)
WASH-II27,72(1969)NP A 173,551 (1971)ANS 14.352 (1971)
CCDN-NW/IOU969)
KT ' i l l !
I02
En (keV)I05 I04
156,
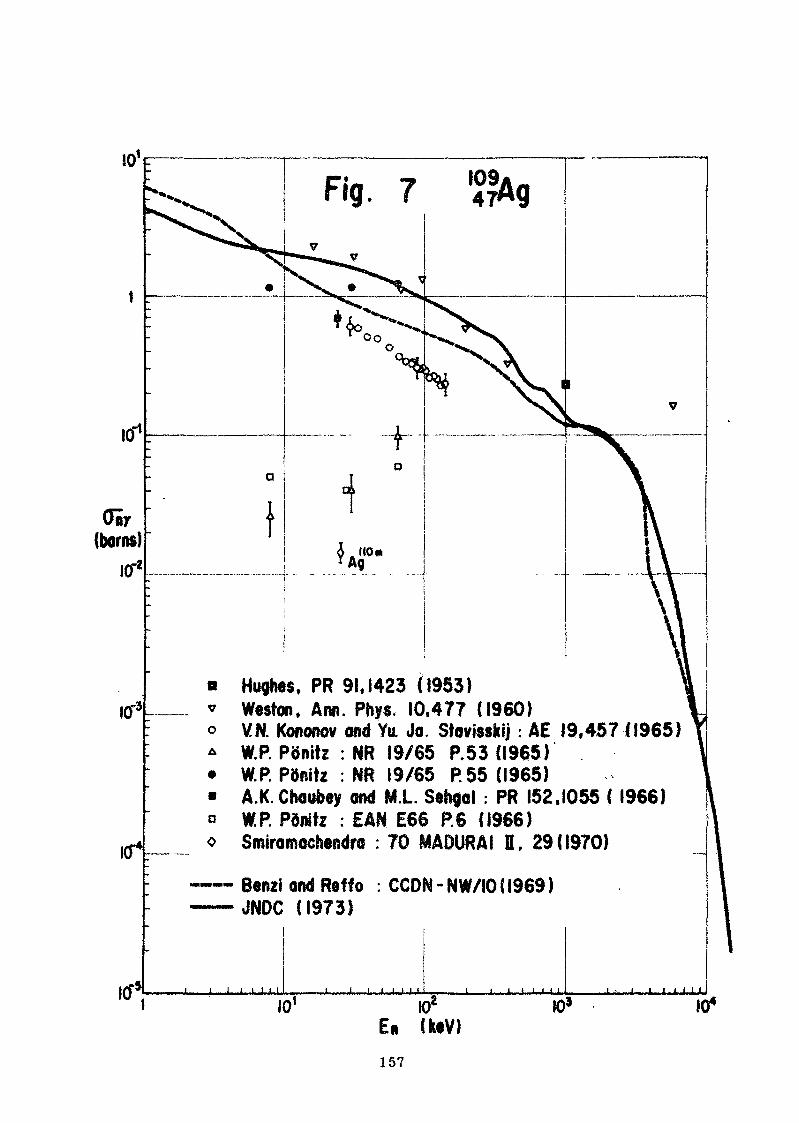
icr!
iff4
Fig. 7 109,
1:0*
Hughes, PR 9!, 1423 (1953)Weston. Ann. Phys. 10,47? (i960)VN. Kofionov and Yu Jo Stovisskij : AE 19,457 (1965)W.P. PSnitz : NR 19/65 P.53 (1965)W.P. Pdnit* : NR 19/65 R55 (1965)A.K. Chaubey and M.L. Sahgal : PR 152.1055 ( 1966)W.P. Pdnitz : £AH E66 P.6 (1966)Smiramochandra : TO MA DURA I E, 29 ((970)
Benzi and Ret f oJNDC (1973)
CCON - NW/IO ( 1969 )
1 . 1 1 t
En UeV)I04
157

10'
IO'1
(T«r(bams)
Kf1
10"
R.Booth et a! : PR 112,226(1958)Yu. R Popov.and F.L. Shapiro : ZET 42.988 (1962)I.Borbely et al. : KFKI - 1467/F (1963)W.PPbmtz et al : KRL. SM1 01/9 (1967)VATolstikw et al : AE 23.566 (196?)R.P Schumon : WASH 1127,72 (1969)S.M. Gain : J. Inorg. Nucl. Chem 32,1799 (1970)F.Rigaud et o! : NP AI76.545 (1971)J.S.Brzosko ei at: APP 8 2,489 (1971)Benzi and Reffo : CCDN-NW/IO (1969)JNOC (1973)
614.06 IfcV
KT10' 10*
En UeV)JO5
158

Fig. 9
o R.L.Macklin, Nature 197,369 (1963)• Benzi oml Rfiffo :CCDN-NW/K) (1969)
JNOC (1973)
159
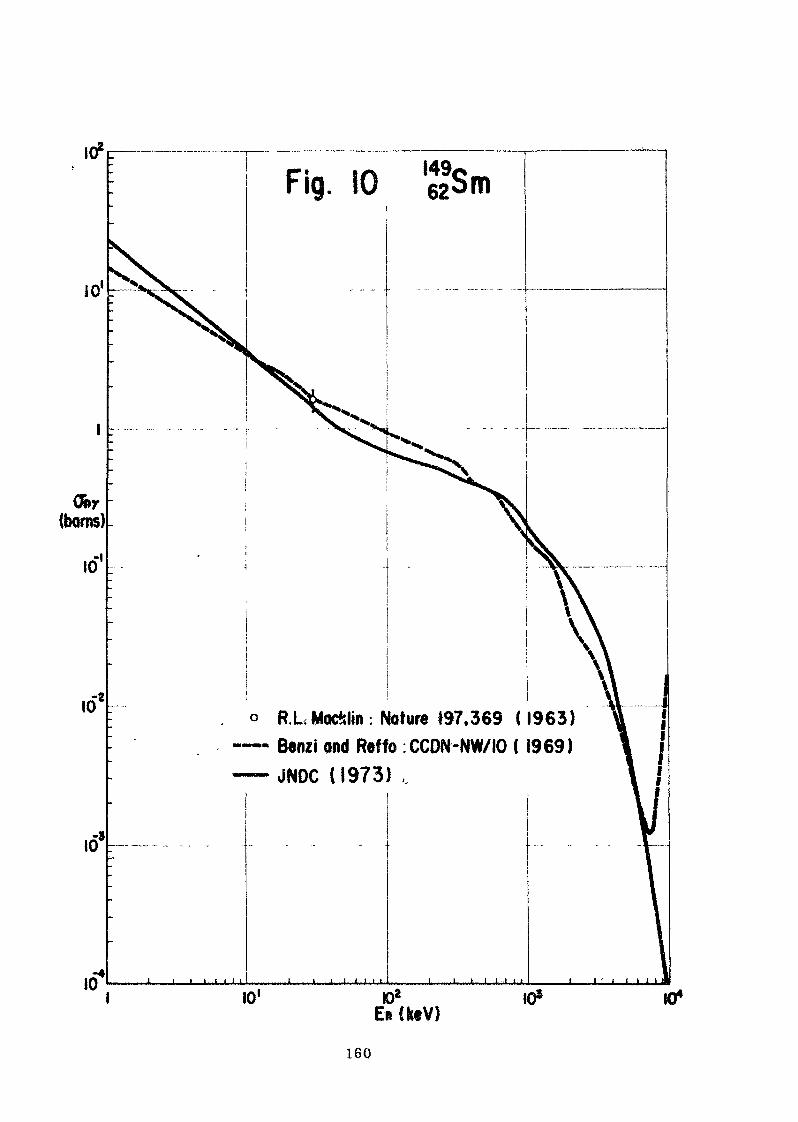
(barns)
R.L.Mochlin : Nature 197,369 (1963)Benzi and Reffo :CCDN-NW/IO ( 1969)JNDC (1973) ,
10 K)2Eh (ktV)
160

10'
Ony(barns)
I01
10'
Fig. 11 153Eu
10'
V.A. Konks, Conf. on Interaction of Neutronswith Nuclei, Dubno 1845.100- (1964)BNL 325 2nd Edition, Suppi. No. 2 (1966)Benzi and Reffo : CCDN -NW/IO (1969)JNDC CI973)
10.-4 J———I——I—I. I LI I J———I——1—i i i i i I——I—I I I I I, i———I——I,,,I 1 . 1 ,11
10' toz
En(ksV)I03
161

THERMAL AVERAGE. RESONANCE INTEGRAL AND FISSION-SPECTRUMAVERAGE NEUTRON CAPTORS CROSS-SECTIONS OF NUCLIDBS
' - > TO 68
A L POPE & J S STORY
United Kingdom Atomic Energy AuthorityAtomic Energy Establishment
WinfrithDorchesterDorset
ABSTRACT
For the fission-product range, 2 = JO to 68, this report gives a comparativetable of integral characteristics computed from capture cross-sections in themany evaluated data*'itles presently available in the format of the UK NuclearData Library* Similar data relating.to the ENDF/B3 data library are includedalso. The integral characteristics" listed are:
(1) Thermal Average Cross-sections
(2) Resonance Integrals, including the 1/V component
(3) Fission Spectrum Averages
Selected means of the experimental data are listed also when available.
1 INTRODUCTION
Nearly ¥>0 files of capture cross-section data for stable and unstableisotopes in the fission-product range (Z - 30 to 68) are presently availablein the format of the UK Nuclear Data Library. In 1967 a set of 78 filas offission-product capture cross-sections was assembled for the UKNDU these arecomposite files, using in the lower energy range a compilation carried out atLucas Heights by Cook (1966) and others, and in the higher energy mnge thedata of Benzi & Bortolani (1966) at the Centro di Calcolo in Bologna: thesefiles span the energy range from 0.0001 eV to 10 MeV. In 1969 Benzi & Ueffopublished 1 2 files of capture cross-sections from 1 keV to 10 MeV for allstable isotopes with 2 = 32 to 66; the Bologna group has subsequently extendedthis compilation to include all 198 stable isotopes with Z = 29 to 79(Benai «t al 1971 a), but the present study has been restricted to the atomic£U0b«r range Z = 30 to 68. The Bologna group has also produced 1$ f|J.es offission-product data giving inelastic, (n, 2n) and radiative•capture cross-sections (Benzi et al 1971 b). In 1971 the Lucas Heights group (Bertfara etal 1971) produced a revised set of fission-product data files, covering theenergy range 0.00010263 eV to 15 MeV, for no fewer than 192 nuclidesincluding 82 radioactive nuclides with half-lives down to 2*f.8 minutefe.These files give neutron capture, elastic and inelastic scatter, and transportcross-sections. A few files of UK origin are also available in the UKNDLin the fission-product range.
A number of files of neutron cross-section data in the fission-product rangeare available in the American ENDF/BJ data library, mainly by Schenter &Schraifrtroth (1971) and by Livolsi (1971), These files contain data for all
163
important neutron cross-sections, though only the neutron absorption cross-sections are considered in this paper. We may note also for completeness arecent paper by Schmittroth & Schenter (1973) giving compilations of fastneutron capture cross-sections for 39 fission-product nuclides.
When two or more different files are available for a single nuclide it wouldbe a tedious task to compare them point-by-point, and it is not necessarilythe most useful method of comparative assessment in the first instance. Inthe following table are listed three integral characteristics computed fromthe capture cross-sections in these various data files, namely the Maxwellianaverage cross-section in the thermal region (we follow Westcott's convention),the resonance absorption integral* and the fission-spectrum average, includedin the table are values of the thermal average and resonance integral cross-sections drawn mainly from recent summaries of the experimental data.
NOTATION USED IN THE TABLE
The first column of the table-lists in order of atomic number Z and atomicweight A the nuclides for which information is given in the table. Includedare all stable nuclides or quasi-stable nuclides with Z = $Q to 68; allradioactive fission~products with half-lives greater than 1 day and a few withshorter half-lives, down to 2b minutes; 259 nuclides and isomers in all. Thestable and quasi-stable nuclides (with half-lives greater than 1Q9 years) arfully underlined, and the very long-lived nuclides with half-lives in th range10 years to 1o9 years have broken underlining. Unstable nuclides hare theirhalf-lives in parentheses underneath the isotopic symbol,
For each nuclide the following kinds of information are given, if available:•i
DFN - Data File Number in UK Nuclear Data Library, or MAT number inENDF/B3
Thr - Thermal average capture cross-section in Westcott's conventionat 20,Mt°Ct (ie Maxwellian average x 2/fot ).
HI - Resonance integral including the 1/v component above 0,55 QV".
FSA - Fission Spectrum Average cross-section using the U235 Watt-Cranberg form for the fission spectrum.
Explicit expressions for these three cross-sections may be found in thepaper by Pope and Story (1973).rSucceeding column headings identify the origin of the data files asmentioned in th.e' introduction.
»• _ f
AUA + BOL '1967, - the composite files based on the Australian compilations - dr."* by Cook et al (1966) and those of Benzi & Bortolani
(1966) in Bologna.
BOL 1969''''*'' - the Bologna compilations by Benzi & Heffo (1969). Becausethese do not extend below 1 keV the thermal cross-section
1 and resonance integral are omitted. ^ >
AUA 1971 ' ' - the Australian ABC compilations by Bertram et al (19J.& ~;..r
BOL 1971 - the Bolognese compilations by Benai et al. (1971 a) and ,-:(1971 JO. ' . I • ,; -. .•> ,
164
ff>I
o «j to8} <M -P 4>0) J3 r-tr-l W O -r-J• H O * «M
n
1*<1> -rlS -P
•H 53P-t (tf
1°*4) «
^5
•P (0
colle
ctin
gen
ded
valu
e
Sr* a•H O
O
4)4id>r-*P.
O0
-Pas*>&^5•p<rt
•«tsc*iHU
*M•S-(0§3-Jl>f5
S3 C'° •**rt) •? <3 C!w -H >- »-•H -Pf< Ua) a>a< hS3e?i«a> ts> s<D -H, Jrf<M
°8« -p
flj 0
aJ3 fr<h 0>•P O,o X
Fsi5TS1 *to toC fr4
<E>
30>rH
3
Ss•HcQ>>•H
1<DS§Ist0)•pc•H«
0>0
jS0(Q4>ti
"a o
e no
inte
gr
Icula
ted
fr
f-i «a$ o« CO
•(0o>CO
+>g53P.c•H
ti9>
S
a>h
o•Pt-,-§2(4
2-P
fe<M(Uf*
£4>4J<wOO.-f
M4J
tJ<M 4>O (0
(QV} <D<U <M0 Cfr* 03 0
orig
inal
sosh
ould
be
•pa>M.c;•P
o+>-a<ufcH)
«M(J>h4)
11*•
0i-»O.E'.
>>iH•H
(0<DO •<D (CC §-P r-<
§ £
t> «CJ•H Q>
^ f cO 0)S «H
0)<-- M
a
rH5c4>•Hk
I
«0
w
oCM
«-P
CO0)i-<O3
Co
ooto
•H
M
Ml
t)O
MSi
o> t*oM -P!S3 OS? SB
o/•~N
tST*IN
O
••s.
'i3
MOS
05
M
1"E!
OM
Io--
o
« 1A O8 - Q
OOo
X*
•-3
OO
*TJ
2p J-e-i t->-i <\i< W
3 INO-s: v-
Is
in
tos*0-U0
105
wp05
o3CCo
_
w
"7
INc-
i vi3 g•a i:n _;a^ «
j-:
CO
o* 2;-P v_xuO
M
* §O MO -4
ca-n_-»•d08
*o
ra
cjf
CT-r-•
-PO0
TH F
,
M
io-o
g
T3C
IS.
60
X
X
trt08 5
iU
.OCS
oVi
to0)o
I
CO
S3 S^4
S Tr61 -ZT~1 i—tM *:
o o <jaI

Integral capture cross-sections computed from various evaluated data files
05
Nuclide(Half -life)
Zn-64(>8 X 10¹⁵y)
Zn-66
2n-67
Zn-68
Zn-70(>1015y )
Zn-7246.5h)
DFNThrRIFSA
DFNThrRIFSA
DFNThrRIFSA
DFNThrRIFSA
DFNThrRIFSA
DFNThrRIFSA
AUA + BOL1967
BOL1969
t
AUA1971
-4001-55-7 mb63.0 mb1.83 mb
BOL1971 a, b
-683-**
13.3 mb
-684-**
10.9 mb
-685-**
8.94 mb
-686-**
6.87 mb
-687-**
8.42 mb
EHDF/B31971 OKNDL Experiment
0.815 + *01 Ob1.798 + .028 b
1.095 + .15 b3.61 i~.51 b
0.105 ± .008b
Escpt.Ref
(1)(2)
(6)(2)
16)
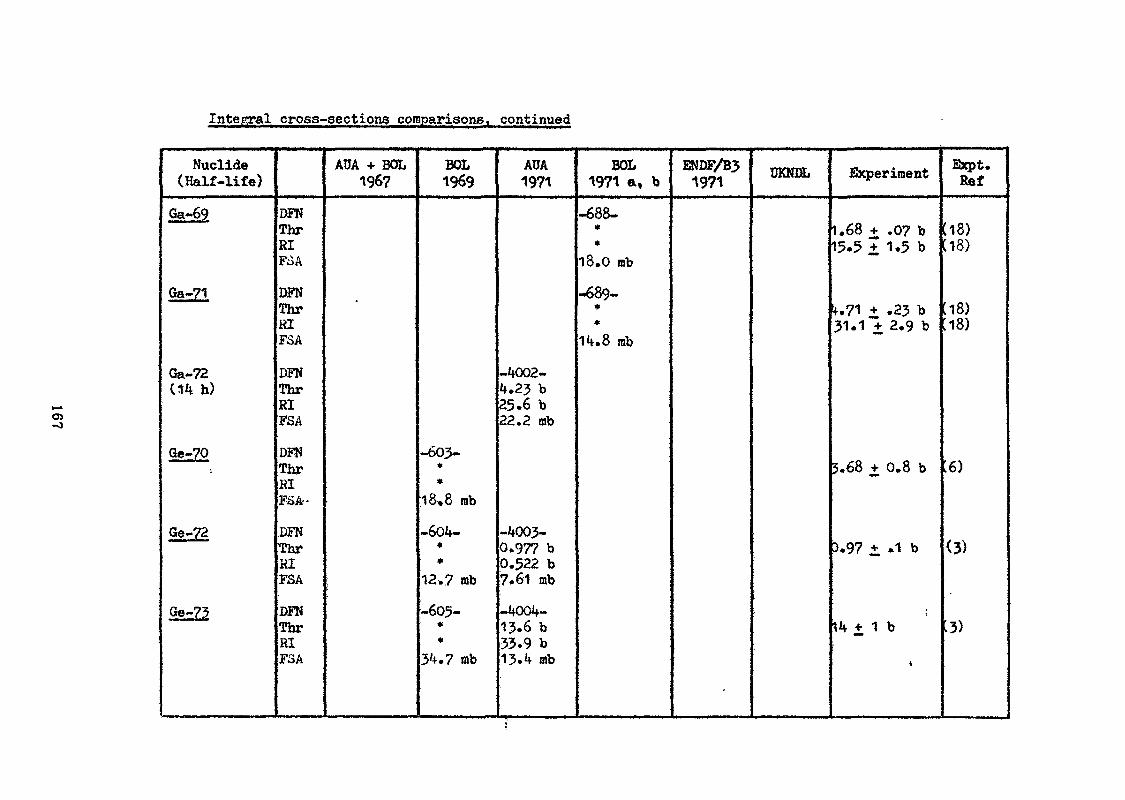
Integral cross-sections comparisons,, continued
Nuclide(Half-life)
Ga~69
Ga-71
Ga-72W fa)
Ge-70»,
Ge-72M HMM M*
Ge-73n^i««««trfi»
DFNThrRIKA
DFNThrRIFSA
DFNThrKIFSA
DFNThrRIFS&-
.DFNThrHIFSA
DFNThrRIFSA
AUA -f BOX,1967
BOL1969
-603-**
18*8 mb
-6otf-**
12.7 mb
-605-**
3 .7 mb
AUA1971
-4002-tf.2? b25-6 b22.2 mb
-M303-0.977 b0.522 b7»6l mb
J+OOlf-13.6 b33.9 b13.4 mb
BOL1971 a, b
-688-**
18.0 mb
-689-**
14.8 mb
ENDF/B31971 UKNDL Experiment
I. 68 + .07 b15.5 i 1.5 b
f,71 + .23 b31.1 + 2.9 b
3.68 + 0.8 b
5.97 i .1 b
l*f + 1 b
*
Expt.Ref
18)C18)
[18)[18)
6)
(3)
:3)
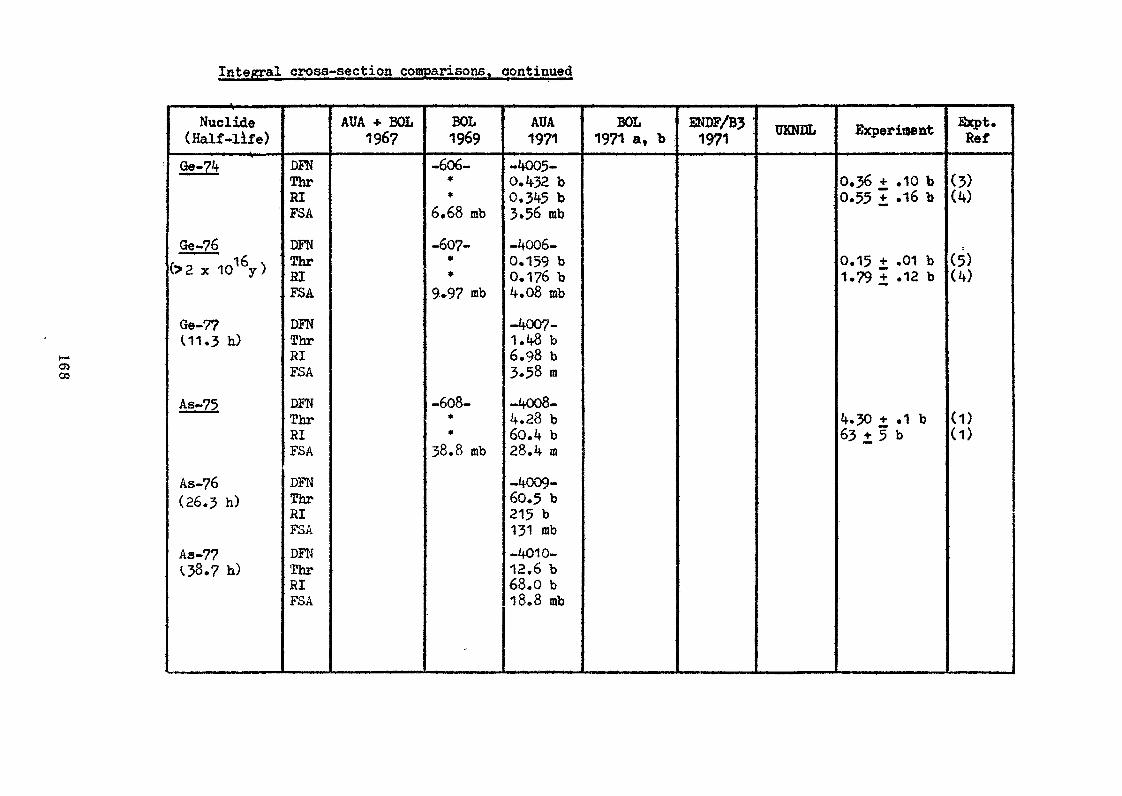
Integral cross-section comparisons, qontinued
O3CD
Nuclide(Half -life)
Ge-74
Ge-76(>2x 10l6y)
Ge-77U1.3 h)
As~75
As-76(26.3 h)
As-77O8.7 h)
DFNThrHIFSA
DFNThrSIFSA
DFNThrRIFSA
DFNThrRIFSA
DFNThrRIFSADFNThrRIFSA
AUA + BOL196?
BOL1969
-606-**
6.68 mb
-607-**
9,97 mb
-608-**
38.8 mb
-
AUA1971
-4005-0.432 b0.345 b3.56 rob
-4006-0.159 b0.176 b4.08 mb
-4007-1.48 b6.98 b3.58 m
-4008-4.28 b60.4 b28.4 m
-4009-60.5 b215 b131 mb-4010-12.6 b68.0 b18.8 mb
BOL1971 a, b
ENDF/B31971
UKNDL Experiaent
0.36 + .10 b0.55 i .16 b
0.15 + .01 b1.79 + .12 b
4.30 + .1 b63 ±5 b
Expt.Ref
(3)(4)
(5)(4)
(1)(1)

Integral cross-section comparisons,, continued
CO
Nuclide(Half -life)
Se-74
Se-76
5e-77
Se-78
Se-79l*65000y)
3e-80
DFNThrRIFSA
DFNThrRIFSA
DFNThrRIF3A
DFNThrRIFSA
DFNThrRIFSA
i*wThr •RIFSA
AUA + BOL196?
BOL1969
-609-**
20.4 mb
-610-**
25,6 mb
-611-**
47.6 mb
-612-**
37.2 mb
-61?-»*
5.43 mb i
ADA1971
-4011-84.8 b40.5 b13.5 nb
-4012-41.8 b28.1 b20.1 mb
-4013-0.399 b7.08 b13.5 mb
-4014-39.1 b54.8 b19.3 mb
-4015-0.573 b0.986 b7.30 mb
BOL1971 a, b
ENDF/B31971 UKNBL Experiment
55 + 5 b512 + 51 b
85 ± 7 b
42 + 4 b<3lT? + 2.2)b
0.35 + .05 b3.9 + .6 b
0.59 + .05 b1.60 7 .16 b
Expt.Ref
(19)(23)
(3)
(5)(5)
(5)(5)
(5)(5)

Integral cross-section comparisons, continued
Nuclide(Half-life)
3e-82(>1017y)
Br~79f
'' Br-81
Br-82(35.3 h)
Kr-78
Kr-80
DFNThrRIFSA
DFNThrRIFSA
DFNThrRIFSA
'DFNThrRIFSA
DFNThrRIFSA
DFNThrSIFSA
AUA + BOL196?
-702-2.03 b1.05 b^. 35 fflb
-701-3.25 b108 b26.3 mb
BOL1969
-61 if-*"*
12.0 mb
-615-**
61.0 mb
-616-**
26.3 mb
-61?-**
VI .0 mb
-61 8-**
ifO.2 mb
AUA• 1971
- 016-2.99 b59.5 b39.0 mb
-¥>17-18.0 b90.1 b121 mb
BOL1971 a, b
ENDF/B31971
UKNDL Experiment
k5 + 5 mb(O.T09 b)
11.3 + .45 b130 +""11 b
2.87 + .1^ b61 +1Z b
it.71 + .68 b
11.3 + •>+ b56.1 + 2.8 b
Expt.Kef
(5)(5)
(165(16)
(16X22)(16X23)
(37)
(21)(21)

Integral cross-section comparisons, continued
Nuclide(Half-life)
Kr-82
Kr-83
Kr-84
Kr-85HQ.73 y)
Kr-86
Rb-85
DFNThrRIFSA
DFNThrHIFSA
DFNThrRIFSA
DFNThrRIFSA
DFNThrRIFSA
DFNThrRIFSA
AUA + BOL1967
-
ii-703-209 b231 b52.6 rob
-704-159 mb22.5 b5.56 mb
-705-14.5 b73.6 b2.57 mb
-707-58.1 mb72.1 mb1.91 mb
-706-0.843 b3.85 b16.3 mb
BOL1969
-619-* .'* *
45.2 rab
-501 D-**
61.8 mb
-502D-**
7.05
-505D-*• .+
2.48 mb
-503D-**
26.7 mb
AUA1971
-461 8-24.9 b191 b30.4 mb
-4019-199 b214 b39.1 mb
-4020-96.8 mb3.59 b6.12 rab
-4021-7.91 b8.02 b10.6 rab
-4022-995 mb460 mb1.63 mb
-4023-0.419 b !3.70 b20.7'mb
BOL1971 a, b
ENDF/B31971
-1201-187 b235 b
UKNDL .
-904-206 b253 b61.7 mb
\
Experiment
25 + 6 b(201 + 26) b
201 + 10 b(233~± 21) b
117+ 18 mb(8.47 b
1.66 + .02 b1.8 £~1.0 b
60 + 20 rab
0.399 + .005b6.7 +0.2 b
Expt.Ref
(5)(5)
(5)(5)
(3X5)(5)
(7)(7)
(3)
(5)I5>
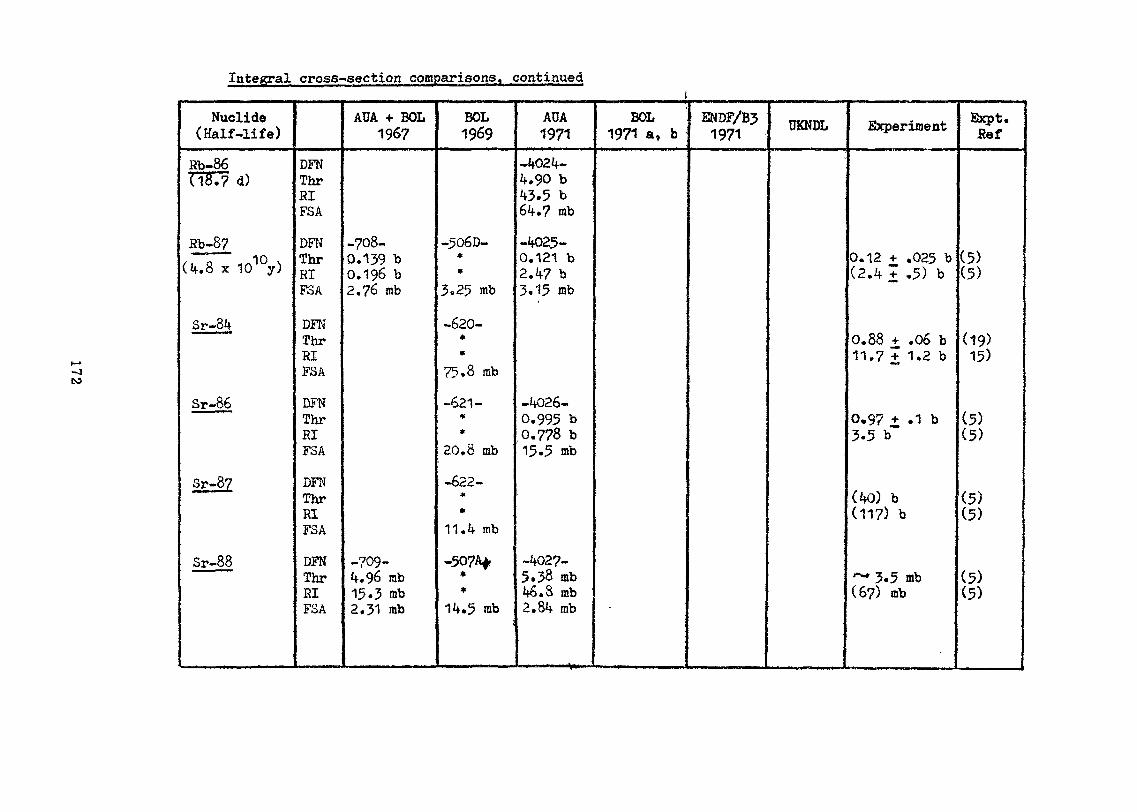
Integral cross-section comparisons, continued
Nuclide(Half-life)
Sb-86TlBT? d)
Rb-8?(4.8 x 101°y)
Sr-84
Sr-86
Sr-8?
Sr-88
DFNThrRIFSA
DFNThrRIFSA
DFNThr81FSA
DFNThrRIFSA
DFNThrRIFSA
DFNThrRIFSA
AUA + BOL1967
-708-0.139 b0.196 b2.76 mb
-709-4.96 mb15.3 mb2.31 mb
BOL1969
-506D-**
3.25 mb
-620-**
75.8 mb
-621-**
20.8 mb
-622-**
11.4 mb
— 507&***
ADA1971
-4024-4.90 b43.5 b64.7 mb
-4025-0.121 b2.47 b3.15 mb
-4026-0.995 b0.778 b15.5 mb
-4027-5.38 mb46. 8 mb2.84 mb
BOL1971 a, b
ENDF/B31971
UKNDL Experiment
0.12 + .025 b(2.4 7 .5) b
0.88 + .06 b11.7 + 1.2 b
0.97 + .1 b3.5 b"
(40) b(117) b
•-** 3.5 mb(67) mb
Expt.Ref
(5)(5)
(19)15)
(5)(5)
(5)(5)
(5)(5)

Integral cross-section comparisons, continued
Nuclide(Half-life)
Sr-89(50.52d)
Gr-90(28.3 y)
Sr-91(9.6? h)
1=82
y-9o(.64.0 h)
Y-91(58.8 d)
DFNThrRIFSA
DFNThrHIFoA
DFNThrRIFoA
DFNThrRIFSA
DFNThrRIFSA
DFNThrHIFoA
AUA + BOL1967
-710-0.406 b0.8296 b1.19 mb
-712-0.977 b30.2 b4.92 mb
-711-1.34 b0.643 b3.84 mb
-713-7.01 b16.4 b5.71 mb
-714-1.07 b1.31 b0.898 mb
BOL1969
-508 A-**
5.60 mb
AUA1971
-4028-0.415 b0.348 b2.23 mb
-4029-0.793 b0.393 b4.02 mb
-4030-0.148 b0.616 b2.42 mb
-4031-1.28 b0.657 b2.63 mb
-4032-3.46 b2.54 b9.13 mb
-4033-1.05 b•1.92 b6.22 mb
BOL1971 a, b
-5080-*
*5.59 mb
ENDF/B31971 UKNDL Experiment
0.1*3 + .04 b
0.9 1 .5 b
1.28 + .01 b1.01 + .07 b
<6.5 b
1.4 ± .3 b-
-
Bxpt.Ref
(3)'
(3X5)
(5)(18X5)
(5)
(5)
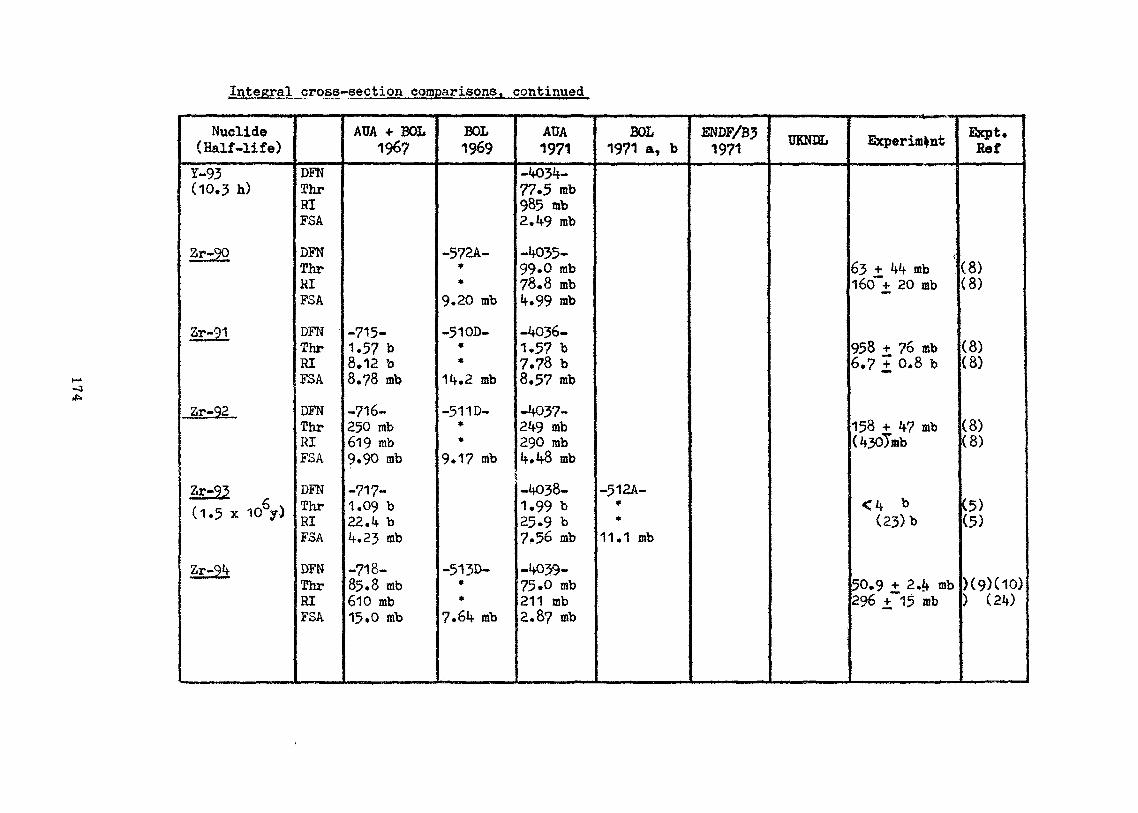
Integral cross-section comparisons, continued
Nuclide(Half -life)1-93(10.3 h)
Zr-90m—— M*T. .••
2£r2I
Zr-92
Zr-93—— £(1.5 x 10 y)
Zr-9*f
DFNThrHIFSA
DFNThrHIFSA
DFNThrRIFSA
DFNThrRIFSA
DFNThrRIFSA
DFNThrRIFSA
AUA + BOL196?
-715-1.57 b8.12 b8,?8 mb
-716-250 mb619 mb9.90 mb
-717-1.09 b22.it bif. 23 mb
-718-85.8 mb610 mb15.0 mb
BOL1969
-572A-**
9.20 mb
-510D-**
n.2 mb
-511D-**
9.17 mb
-51 3D-**
7.6 rab
ADA1971
-l*Q3k-77.5 mb985 mb2,1*9 mb
-1 35-99»0 mb78.8 mbk.99 mb
-4036-1.57 b7.78 b8.57 mb
-M337-2 9 mb290 mbit.MS mb
-¥>38-1.99 b25-9 b7.56 mb
.1*039.75.0 mb211 mb2.87 rab
BOL1971 a, b
-512A-**
11.1 mb
ENDF/B31971
UKNDL Experiment
63 + kk mbI60*~t_ 20 mb
958 + 76 nsb6.7 + 0,8 b
158 + V7 mb(lf307s»b
<i* b(23)b
50,9 + 2.{* mb296 +~15 ob
Expt.fief
(8)(8)
(8)(8)
(8)(8)
(5)(5)
)(9)do)) (21f)
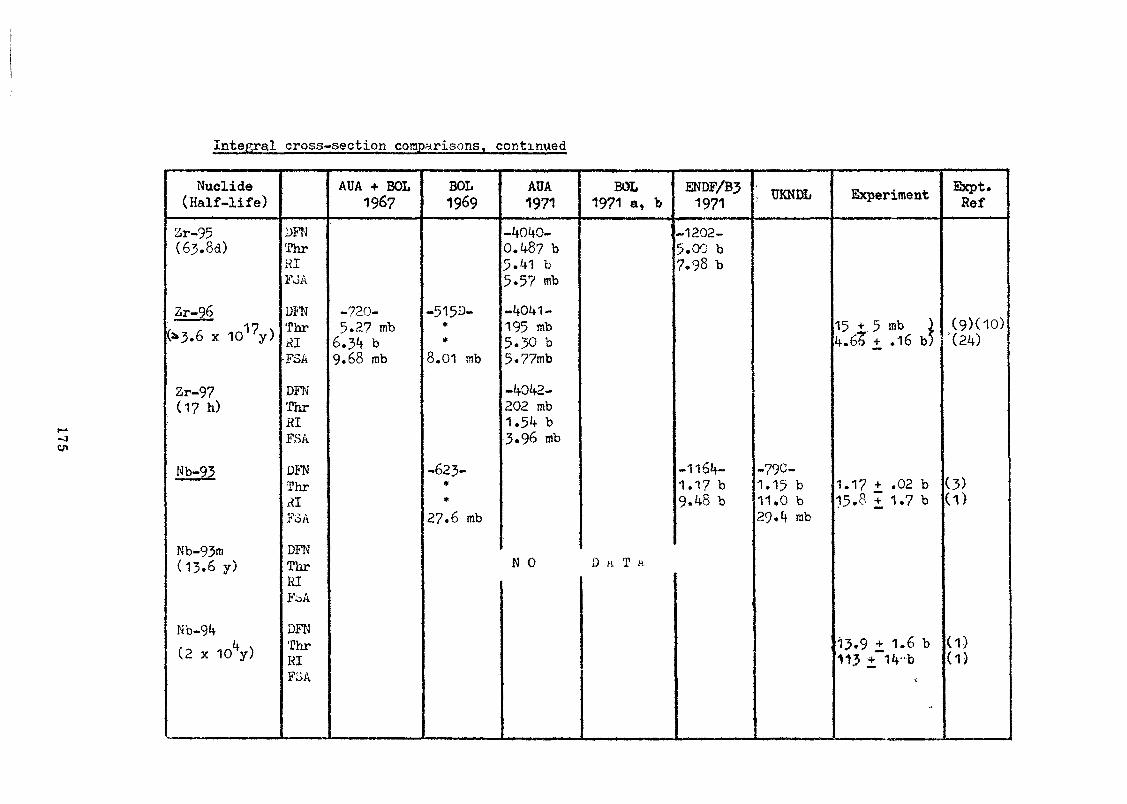
Integral cross-section comparisons, continued
-301
Nuclide(Half-life)
3r-95(63.8d)
Zr-96(*3.6 x 10¹⁷y)
Zr-97(17 h)
Nb-93
Nb-93m(13.6 y)
Nb-94(2 x 10*V)
DFNThrHIFoA
DFNThrAI•FSA
DFNThrRIFSA
DFNThriilTT 1 I,
I1 OH
DFNThrHI
DFNThrHIF A
AUA + BOL1967
-720-5.27 mb6.34 b9.68 mb
BOL1969
-515D-**
8.01 mb
-623-**
27.6 mb
AUA1971
-40I+0-0.487 b5*41 b5.57 mb
-40U1-195 mb5.30 b5.77mb
-4042-202 mb1.54 b3.96 mb
BOL1971 a, b
i
N O D H T A
ENDF/B31971
-1202-5.00 b7.98 b
-1164-1.17 b9.48 b
UKNDL
-79C-1.15 b11,0 b29.4 rab
Experiment
15 + 5 mb )4.66 + .16 b)
1.17 +• .02 b15.8 + 1.7 b
13.9 + 1.6 b113 ±""l4"b
-
Sxpt.Ref
'(2k}
(3)(1)
(1)(1)

Integral cross-section comparisons, continued
CO
Nuclide(Half -life)
Nb-95(35.0 d)
Nb-95m(90 h)
Nb-96(23.4 h)
"2=22 18(>4 x 10IOy)
Mo-94
Mo-95
DFNThrRIFSA
DFNThrRIFSA
DFNThrRIFSA
DFNThrRIFSA
DFNThrRIFSA
DFNThrSIFSA
AUA + BOL1967
-719-14.0 b113 b54.9 mb
BOL1969
AUA1971
-4043-1.45 b25.1 b14*2 mb
N 0
N 0
-573A-**
14.2 mb
-573A-**
17.1 mb
-514D-**
36.5 mb
-4044-14.5 b116 b39*3 mb
BOL1971 a, b
D A T A
D A T A
ip»
j"*
ENDF/B31971
-1203-4.00 b26.6 b /
-1204-14.3 b109 b
UKNDL
»
Experinsdnt
<7b
14.5 + .5 b106 +~21 b
i
Expt.Raf
(5)
(3)(3)

Jntegral cross-section comparisonst continued_
Nuclide(Half -life)
Mo-96
Mo-97 i• •f""V..*.
Mo-98'"*>
Mo-99(66.3 h)
Mo-100& 3 x 10¹⁷y)
Tc-9'3* •"",:,
(1.5 x 10 y)•j *
k
DFNThrElFSA
rtfFNThrHIFSA
DFNThrRIFSA
i)GNThrRIFSA '
DFNThrHIFSA
DFNThrKL -FSA
AUA + BOL1967
-721-2.24 b18.4 b42.3 mb
-722-135 nb6.82 b25.0 mb
-724-197 mb6.37 b14.5 mb
-
•
BOL1969
-575A-**
25.2 nib
-?16D-«*
:4l.8-mb :i
-517D-**
27.3 mb
-519D-**
14.2 mb
AUA1971
-4045-1.19 b26.1 b /18.1 mb
-4046-2.19 b15.0 b28.9 mb
-4047-143 mb6.68 b37.3 mb
-4048-1.73 b24.8 b21.0 mb
-4049-225 mb6.53 b14.5 mb
BOL '1971 a, b]
t1
ENDF/B31971
-1205-1.91 b16.1 b
-1206-154 mb6.79 b
-1207-5.uQ b25.9 b
-1208-20; mb3.62 b
&
UKNDL Experiment
1.2 + .6 b(26 T 5) b
2.2 + .7 b(16 + 3) b
137 + 3 mb6.76~V .12 b
199 + 5 mb4.05"i .07 b
>2.6 b
•
Expt.Ref x
(5)(5)
(5)(5)
(5)(5)
(5)f5)
(25)

Integral cross-section comparisons, continued
CO
Nuclide(Half -life)
2£ 9(2,13 * wy>
Tc-99m(6.05 h)
Ru-96
• Bu~98
SU.-99
Ru-100
DFNThrRIFSA
DFNThrBIFSA
DFNThrBIFSA-V * -t'DFNThr.81FSA
DFN-ThrRIFSA
DFNThrKIFSA
AUA + BOL1967
-723-22.1* b205 b97.9 tub
•
'
BOL1969
I-576A-**
91.3 mb
-577A-*
35.5 ab
-57SA-**
51*. 7 mb
-579A-**
AUA1971
-i*050-22.0 b197 b46.1 mb
-1*185-1.62 b26.7 b1*6.1 mb
5 .-¥>51-5.47 b41.2 b81.3 mb
BOL1971 a, b-518A-**
92.9 mb
EN8F/B31971 OKNDL Experiment
22 4- 3 b69 * 20 b
0.21 + .03 b6.67"+ «11 b
<8 b
10.6 + .6 b
5.81* b11.1* b
Expt.Ref
(3)(3)
(26)(*v)
(6)
(6)
(5)(5)

Integral cross-section comparisons, continued
CO
Nuclide(Half -life)
Ru101
Ru-102
Ru-103(39.5 d)
Ru-104
Ru-105(4.44 h)
Ru-106(368 d)
DFNThrRIFSA
DFNThrRIFSA
DFNThrRIFSA
DFNThrRIFHADFNThrRIFSA
DFNThrRIFSA
AUA + BOL1967
-725-4.98 b213 b53.9 mb
-726-1.44 b180 b68.7 mb
-728-3.50 b250 b23.5 mb
BOL1969
-520D-**
74.5 mb
-521D-**
86.5 mb
-523D-**
24.6 mb
AUA1971
-4052-4.83 b86.6 b28.7 mb
-4053-1.28 b10.6 b57.9 mb
-4054-7.67 b65.9 b58.9 mb
-4055-0.436 b5.42 b15.5 mb
-4056-0.188 b5.09 b•40.7 mb
-4057-137 mb1.27 b11.9 mb
BOL1971 a, b
^
•.**
•
ENDF/BJ1971
-1210-5.21 b79.6 b
-1211-1.30 b6.90 b
-1212-5.00 b9.24 b
-1213-0.470 b3.73 b
-1214-0.300 b7.85 b
-1215-125 mb1.41 b4
•s
UKNDL
...__..„._,,. .,..rExperiraent\
i; s
'
5.23 b79.1 b
1.37 + .12 b4.99 ± .2 b
0.47 b4.6 b
0.30 _+ .03 b
146 + 40 mb2.09~~i .6 b
Bxpt.Ref
(5)(5)
(5) (27)(5)
(5)(5)
(5)
(5)(5)

Integral cross-section comparisons, continued
COo
Nuclide(Half -life)
Bh-103
Bh-105(35.6 h)
Pd-102
Pd-104
Pd-105
Pd-106"
———————
DFNThrRIFSA
DFNThrRIFSA
DFNThrRIFSA
DFNThrfilFSA
DFNThrRIFSA
DFNThrRIFSA
ADA + BOL1967
-727-158 b1193 b87.4 mb
-729-15088 b54676 b0.720 mb
-730-10.2 b95.8 b95.8 mb
-731-5.94 b14.7 b42.7 mb
BOL1969
-522D-**
83.6 mb
-580A-**
75.2 mb
-581A-**
63.9 mb
-524D-**
106 mb
-525D-**
46.9 rab
AUA1971
-4058-152 -b"1O06 b81.7 ab
-4059-15591 b9880 b20.6 mb
-4060-373 mb22.9 b91.9 mb
-4061-10.8 b74.6 b57.3 mb
-4062-284 mb8.37 b22.7 mb
BOL1971 a, b
-522E-»«
84.4 mb .
ENDF/B31971
-1217-17000 b7488 b
-1218-14.0 b86.3 b
-1219-293 ab10,1 b
TJKNDL Experiment
145.5 •*• 2.3 b1127 ±""71 b
16100 + 1200b16700 + 3000b
^ 40 b
17 b(89 + 8)b
290 + 30 mb5.73"± .57 b
Expt.Ret
(3)(28) (29)
(5)(5)
C3>
(3)(5)
(5)(5)

Integral cross-section comgarisons, continued
00
Nuclide *(Half -life)
Pd-107-
(16.5 x 10 y)
Pd-108"
Pd-109(13.5 h)
Pd-110
Pd-112(20 h)
AK-107— . — ...
:•
DFNThrRIFSA
DFNThrRIFSA
DFNThrRIFSA
DFNThrRIFSA
DFNThrRIFSA
DFNThrRIFSA
AUA + BOL196?
-732-9.70 b83.5 'b91.7 mb
-733-11.0 b179 b3*f.7 mb
—
BOL >1969
f •*•
*
-527D-**
32.1 rob
-582A-**
25.7 rab
-583A-* ^• "*105 mb
AUA '•.1971 :
-4063-9.35 b ;Sb'i3 b76.4 mb
-4064-12.0 b215 b12.7 mb
-4065-5.21 b60.8 b28.7 mb
-4066-225 mb1.08 b6.09 mb
-4067-286 mb1.98 b10.9 mb
',* .*. *
BOL :
1971 a, b-526A- *
**
121 mb
(
',
ENDF/B31971 *
-12205.00 b79.7 b ,
-1221- ,5.11 b60.2 b
-1138-36-9 b115 b
»UKNDL1
*-••
r
t
"973A-36.9 b115 b114 rab
Experiment
, ',. t% 750 b
10.0 + ,6 b(244 + 60)b
270 + 60 mb(6.1~V 0.6)b
37.6 + 1.2 b9 5 + 5 b
Expt.Ref
(5)
(5)(5)
(5)(5)
(11)(11)

Integral cross-section comparisons, continued
00CO
Nuclide(Half -life)
Ag-109
Ag-110 m(252 d)
Ag-111(7.45 d)
Gd-106'
Cd-108
Cd-110
DFNThrRIFSA
DFNThrRIFSA
DFNThrRIFSA
DFNThrRIFSA
DFNThrRIFSA
DFN•nrRIFSA
AUA + BOL1967
-73V89.8 b1440 b131 wb
BOL1969
-528D-*
*
129 mb
-624-*>10.1 b295 mb
-625-**^4.58 b
128 mb
-626-*
102 mb
AUA1971
~4o6895-2 b11(42 b90.7
-40692.81 b106 b35.1 mb
"'
-4070-9.94 b50.9 b62.3 mb
BOL1971 a, b
-528E-**
130 mb
ENDF/B31971
-1139-92.3 b1457 b
ti UKJtiBL« t
-974A-93*6 b1454 b62.5 mb
Experiment
92.6 + 1.8 b1910 T 200 b!
82 +. 11 bt
3.2 + 2.0 b '106 + 20 b
~1 b
D.7 1 .2 b
6,3 * 1.1 b(38^6) b
>
Expt.Ref
(5)(5)
\(5)
(5)
(30)
h)
(1)CD
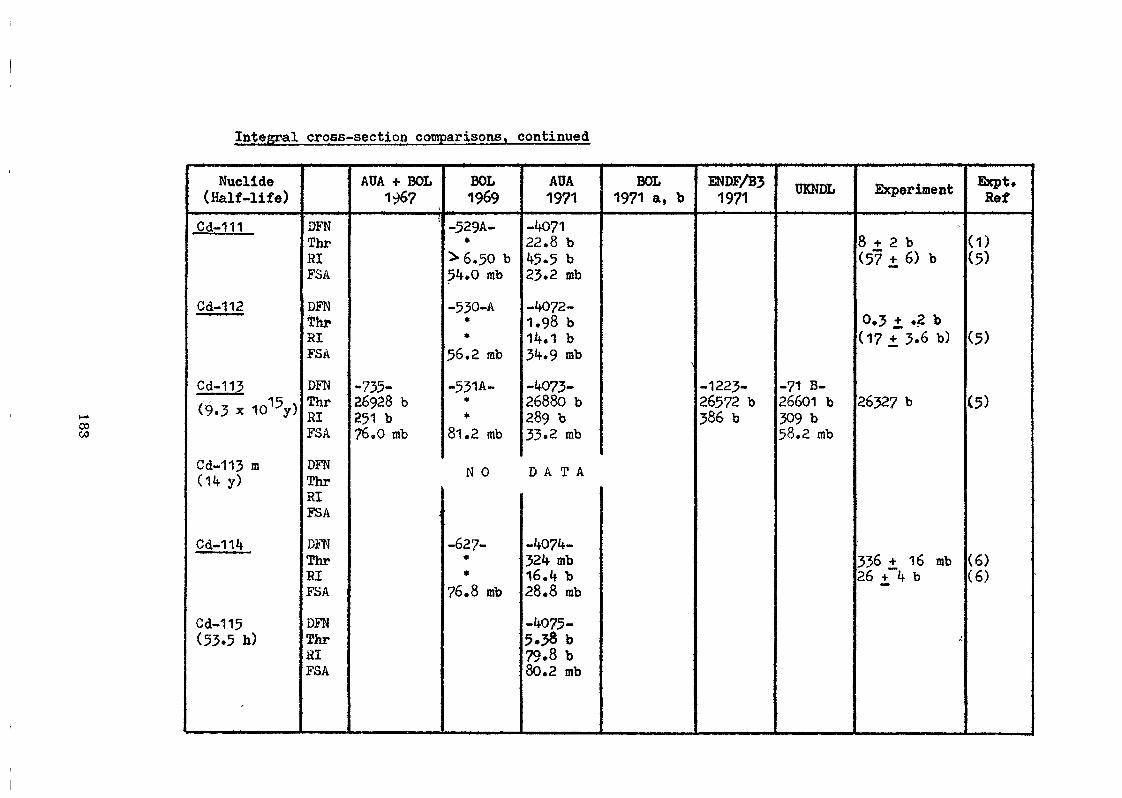
Integral cross-section comparisons, continued
O3CO
Nuclide(Half-life)
Cd-111
Cd-112
Cd-113(9.3 x 10¹⁵y)
Cd-113 m(14 y)
Cd-114
Cd-115(53.5 h)
-
DFNThrRIFSA
DFNThrRIFSA
DFNThrSIFSA
DFNThrRIFSA
DFNThrRIFSA
DFNThrHIFSA
AUA + BOL1967
{
-735-36928 b251 b76.0 mb
BOL1969
-529A-*>6.50 b54.0 mb
-530-A**
56.2 mb
-531A-*
81.2 mb
N 0
AUA1971
-407122.8 b45.5 b23.2 mb
-4072-1.98 b14.1 b34.9 mb
-4073-26880 b289 b33.2 mb
n A T A
-627-**
76.8 mb
-4074-324 mb16.4 b28.8 rob
-4075-5.38 b79.8 b80.2 mb
BOL1971 a, b
N
ENHF/B31971
-1223-26572 b386 b
TJKNDL
-71 B-26601 b309 b58.2 mb
Experiment
-8 + 2 b(57 ± 6) b
0.3 + «2 b(17 ±"3.6 b)
26327 b
336 + 16 mb26 + 4 b
Expt.Ref
(1)(5)
(5)
(5)
(6)(6)

.Integral cross-section comparisons, continued
tfc-
Nuclide(Half-life)Cd-115 m(Mt.6 d)
Cd-116C* 1017y)
In-113
(6 x 10¹¹V)
Sn-112
.Sn-114
DFNThr •'RIFSA
DFNThrRIFSA
DFN -ThrRIFSA
DFNThr
FSA
DFSF*ThrRI•FSA
DFNThrRIFSA
AUA + BOL1967
.-736-210 b3379 b151 rob
BOL1969
-628-**
19. mb
-629-**
113 »b
-532A-**
130 mb
-630-
73-9 mb
-631-*.. *
66.4 mb
AUA1971
30.6 b195 b80.2 mb
0.786 b1.27 b6.3*f mb
-1*077-206 b3212 b101 mb
BOL1971 a, b
-629A-*«
196 mb
-532D-**
185 mb
ENDF/B31971 UKNDL Experiment
77 + 13 fflb1.3"V .2 b
11.1 + 1.3 b£"29 b
205.8 + 1.0 b31*28 +"170 b
0.73 ± .09 b
to 70 b>) b
Excess resonance integral only ( excluding 1/v component) because the v*lue of th» thermalcross-sectitm i s jso uncertain.- i t 1 1 1______I i____ . i________________I_____I I
Expt.Ref
(5)(1)
(6)(2)
(5)(5)
'(1)
(1)(3)
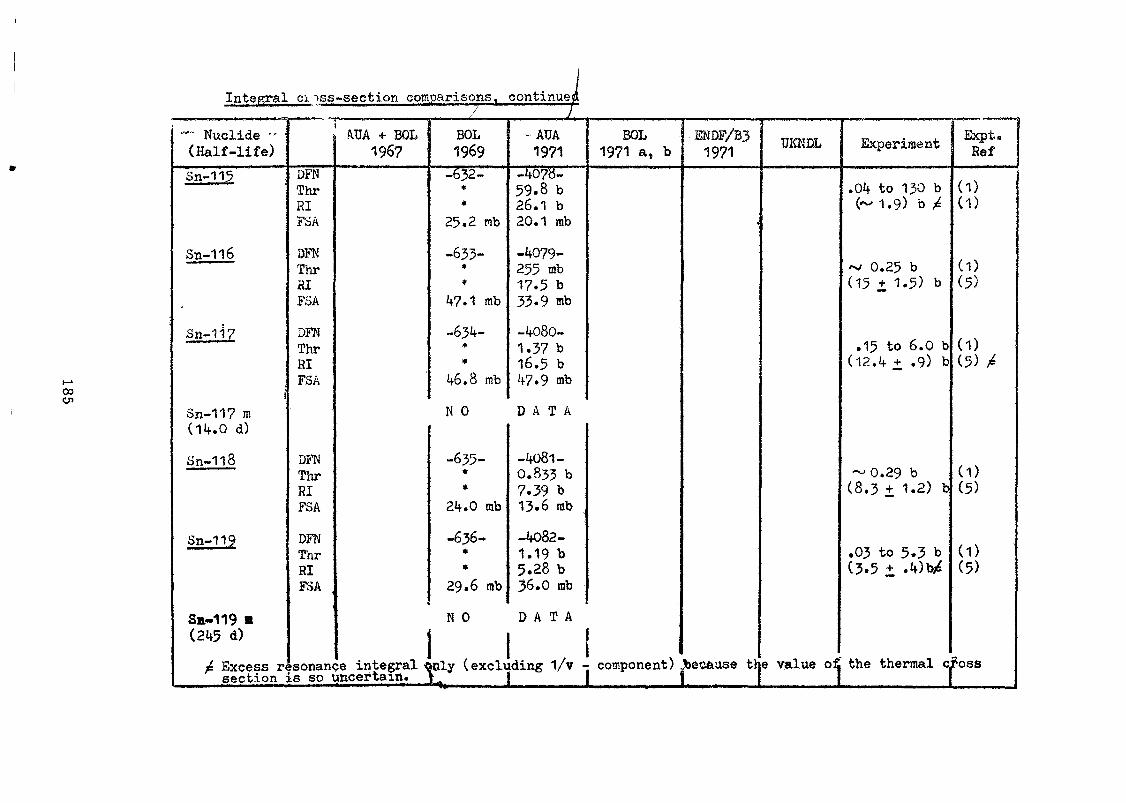
Integral c> ^ss-seotion comparisons, continue
00
"~ Nuclide -(Half -life)3n-115
Sn-116
Sn-117
Sn-117 m(14.0 d)
Sn-118
Sn-119
Sn-119 •(245 d)
^ Excess rsection :
•
DFNThrHIFSA
DFNThrHIFSA
DFNThrRIFSA
DFNThrRIFSA
DFNThrRIFSA
isonanc.8 SO I
AUA -f BOL1967
;e integral <mcertain.
BOL1969
-632-**
25.2 mb
-633-*
*
47.1 mb
-634-**
46.8 mb
N 0
-635-**
24.0 mb
-636-**
29.6 mb
N 0
- AUA1971
-4073-59.8 b26.1 b20.1 rab
-4079-255 mb17.5 b33-9 mb
-4080-1.37 b16.5 b47.9 mb
D A T A
-4081-0.833 b7.39 b13.6 mb
-4082-1.19 b5.28 b36.0 mb
D A T A
[Gly (excluding 1/v •
BOL1971 a, b
ENDF/B31971
component) Joecause tl
UKNDL
e value of.
Experiment
.04 to 130 b(~ 1.9) b X
^ 0.25 b(15 1 1.5) b
.15 to 6.0 b(12.4 + .9) b
~0.29 b(8.3 ± 1.2) b
,03 to 5.3 b(3.5 + .4)b^
E&cpt.Sef
(1)(1)
(1)(5)
(1)(5) 4
(1)(5)
(1)(5)
the thermal c^oss

Integral cross-section comparisons continued
00Oi
Nuclide(Half -life)
Sn-120"• " """" ^
Sn-121(27.0 h)
Sn-121 m(76 y)
Sn-122
Sn-123(129.3 d)
Sn-124(>2 x 10¹⁷y)
DFNThrRIFSA
DFNThrElFSA
DFNThrHIFSA
DFNThr•si?i>A
DFN'ThrRI,FSA
DFNThrHIFSA
AUA + BOL196?
;
*-BOL{' -1969
-637-' •
*15.8 mb
AUA1971
Jf083-1lfO mb1.30 b11.9 mb
-4084-5.74 b26.2 b34.8 mb
BOL1971 a, b
N O D A T A
-638-**
13.6 mb
'
-639-**
8.13 mb
•
-4085-179 mb
, 884 mb13.0 rab
-4086-32.8 mb2.39 b19.6 nib
-4087-165 rab11.3 b5.62 mb
JWDF/B31.971
/
UKNDL Experiment
130 + 55 mb(1.6""+ .2)b
158 •*• 14 mb(672*+ 70) ml
131 + 14 mb(9.1"± .9)b
acpt.fief
(1)(5)
(1)(5)
(1)(5)

Integral cross-section_comparisons, continued
CQ
Nuclide(Half -life)
Sn-125(9.6*f d)
Sn-126(-ICTy)
Sb-121
Sb-122(2.76 a)
'Sb-123«'.
-m '
3b-12*f(60.20 d)
»•
J
DFNPhrRIFSA
DFNThrRIFSA
DFNTbrPIFSA
DFNIbr81FSA
DFNThrRIFSA
DFNTbrRIFSA
AUA * BOL196?
-
BOL1969
-533A-**
66.9 mb
-53W)u**
lt2.0 mb
o:
AUA1971t
-<4088~550 mb13.9 b9.¥> «b
-i»o89-296 mb225 mb3.66 mb
-W90-ai9 b205 b62.7 mb
~*»Q91-21V3 b15$ b21.3 rob
-i*092-W1# b126 b36.4 rab
-if093-6,2? b
: 19.1 b10.3 mb
BOL1971 a, b
ENDF/B31971 UKHBL Experiment
6.13 + .10 b201 +"12 b
ij.38 + .0? b109 i"*8 b
6.5 i 1.5 b
£kpt«fief
(16)(16)(32;
(1)(2)(16)
(5)

Integral cross-section comparisons, continued
COCD
Nuclide{ Half -life)
Sb..125(2,74 y)
Sb-126(12*5 a)
Sb-127(93 h)
Sb-128(9.3 h)
Te-120
Te-12a
DFNThrRIFSA
DFNThrRIFSA
DFNThrRIFSA
DFNThrRIFSA
DFNThrRIFSA
DFNThrRIP6A
AUA + BOL196?
-737-1.51 b31.9 b68,5 mb
BOX.1969
-6W-**
62.0 mb
-641-**55. § fflb
AUA1971
-4094*967 mb19.0 b14.9 mb
-4095-5.78 b64.3 b85.1 mb
-4096-913 mb14.7 b9.M3 rab
-4097-1.13 b15.9 b22.4 mb
-4098-2.78 b46.8 b43.3 mb
BOL1971 a, b
-640A-**
62.0 mb
-641A-**
63.9 mb
BNDF/B31971 UKNDL Experiment
2.34 + .30 b
2.8 + ,9 b(67 + 20) b
Expt.fief
(6)
(5)(5)

Integral cross-section comparisons, continued
Nuclide(Half -life)
Te-123(1.2 x 10¹³y)
Te-123 m(120 d)
Te-124
Te-125
Te-125 m(58 d)
>
Te-126
•*• *
DFNThrRIFSA
DFNThrSIFSA
DFNThrRIFSA
DFNThrRIFSA
DFNThr81F3A
DFNThrAIFSA
ADA + BOL1967
*» i '"
BOL1969
-642-.*
76.9 mb
-643- .*#
28*3 fflb
-644-**
29.8 mb
-537A-**
1&»5 mb
AtIA1971
-4099-416 b5548 b46.5 mb
-418742*4 b272 b46.7 aft
-4100-6.48 b7.81 b26.8 rnb
-4101-1.55 b17.5 b36,6 fflb
-4188-11. Ob78.7 b36.7 mb
-4102-994 mb8.16 b11.2 fflb
BOL1971 a, b
-642A-*
76.7 fflb
-643A-**
28.3 mb
-644A-**
29.8 fflb
-537D-**
16.5 rab
ENDF/B31971 DKNEL Sxperiaent
406 + 30 b(5600 <+330)b
6.5 + 1.3 b
1.55 + .16 b(18.5"± 1.3)t
940 + 100 mb(10.3 +. 2.o)t
Expt.Ref
(5)(5)
(5)
(5)(5)
(5)(5)

Integral crosa-sectioo comparisons, continued
Nvclide(Half-life)
*e-127(9.30 h)
Te-12? ffi(109 d)
Te-128
Te-129(68.7 tn)
Te-129 tn.(34.1 d)
Te-130(8 <x 1020y)
••
DFNThrRIFSA
DFN -•ThrRIFSA
DFNThrRIFSA
DFNThrRIFSA
DFNThrRIFSA
DFNThrRIFSA
ABA ^ BOL19 7 ;
-739-291 mb63^ mb5.91 nb
-7*11-483 ob1.43 b3.49 mb
BOL1969
-539A-**
5.81 mb
•.
-541A-**
3.22 mb
AOA1971
103-2.74 b48.2 b24.5 mb
-4189-9.34 b103 b24.5 mb
-4104-213 mb1.55 b3.47 mb
-4105 -369 mb7.40 b11.1 mb
-4190-1.11 b20.5 b11.2 mb
-4106-259 mb178 ob2.31mb
BOL1971 a, b
-539D-•*
6*88 mb
. -541 D-*
*
3.22 mb
JSNDF/B31971 UKNDL Experiment
216 + 8 mb1.56~V .09 b
194 + 20 mb436 + 48 rab
Expt.Ref
(5)(5)
(5)(5)

Integral cross-sgction comparisons, continued
CO
Nuclide(Half -life) ;
Te-131(2U.8 m)
Te-131 m(30 h)
Te-132(78 h)
1-127
1-129{1.7 x 10⁷y)
1-130(12.3 h)
DFNThrHIFSA
DFNThrRIPSA
DFNThrBIFSA
DFNThrHIFSA
DFNThrHIFSA
DFNThrRIFSA
AUA + BOL1967
-738-6.57 b189 b69.8 rab
-7^0-23.2 bMf.8 bJf2.*f mb
BOL1969
-538A-**
81.0 mb
AUA1971
.4107-35 »6 rab50.0 mb0,^7 mb
-4191-107 mb159 «>bO.if95 mb
-4108-2.38 mb7.02 mb0.207 mb
-IH09-6.16 b152 b73.1 mb
-M ID-27. 9 b25.5 b'47*3 mb
•4111-16.6 b173 b1<9f mb
BOL1971 a, b
-538D-*1
81.7 mb
-5WA-#*
50.3 mb
ENDF/B31971 DKNDL Experiment
6.12 + .08 bH9 ±"^ b
28.1 + 1.3 b37 + 1 b
19 ± 3 b(reactor spec
Expt.Ret
(5)(16)(16)(23
(5)(3)
(3)
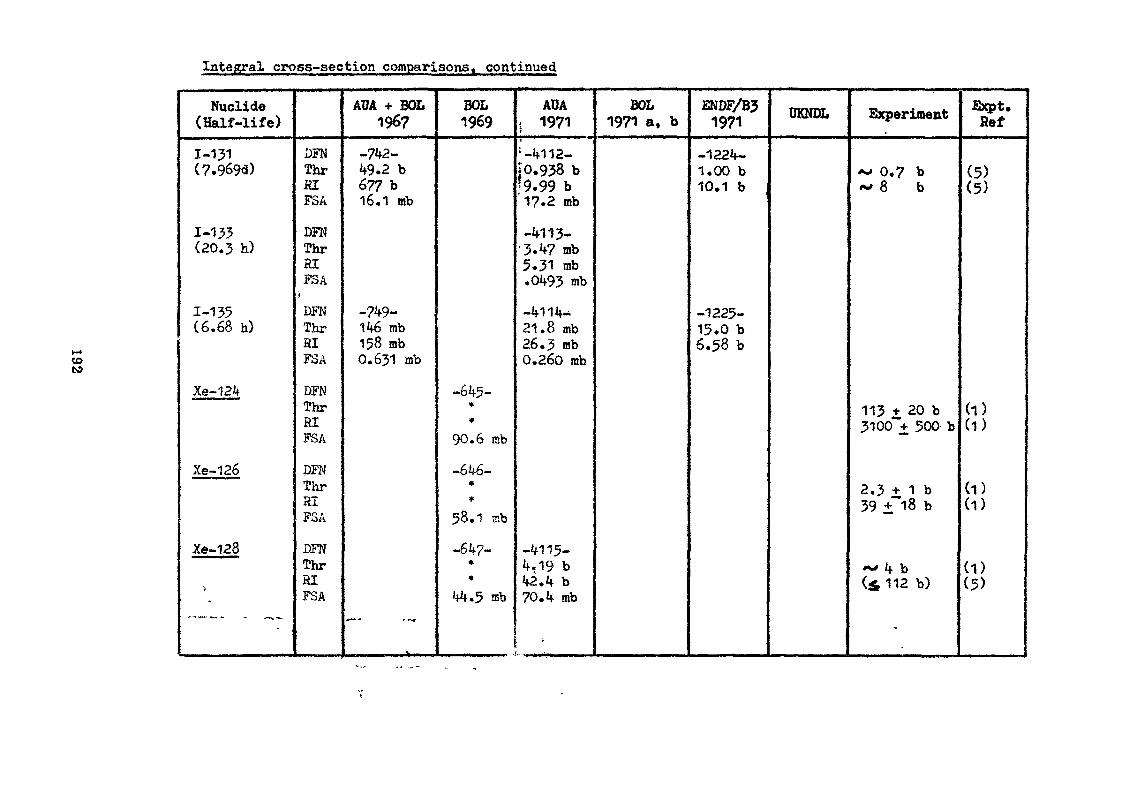
Integral cross-section comparisons, continued
toto
Nuclide(Half-life)
1-131(7.969<3)
1-133(20.3 h)
1-135(6.68 h)
Xe-124
Xe-126
Xe-128
;
DFNThrJ8IFSA
DFNThrRIFSA
j.
DFNThrHIFSA
DFNThrRIFSA
DFNThrSIFSA
DFNThrRIFSA
AUA + BOL1967
-742-49.2 b677 b16.1 mb
-749-H6 mb158 mb0.631 mb
— ._
BOL1969
-645-«*
90.6 mb
-646-**
58.1 ab
-647-**
44.5 ffib
AUA| 1971
"'-4112-[0.938 b?9.99 b17.2 mb
-4113-•3-47 mb5.31 mb.0493 mb
-4114-21.8 mb26.3 ob0.260 mb
-4115-4,19 b42.4 b70.4 mb
BOL1971 a, b
ENDF/B31971
-1224-1.00 b10.1 b
-1225-15.0 b6.58 b
UKNBL Experiment
^ 0.7 b*•» 8 b
113 + 20 b3100~V 500 b
2.3 + 1 b39 ±"18 b
~ 4 b($112 b)
-
Expt.Ref
(5)(5)
(1)(1)
(1)(1)
(1)(5)

Integral cross-section comparisons, continued
50
Nuclide(Half -life)
Xe-129• ' "•'"
Xe-129 ra(8.0 d)
Xe-130~~—--—fj---
Xe-131
Xe-131m(11.94 d)
Xe-132
Xe-133(5.29 d)
DFNThrRIFSA
DFNThrRIFSA
DFNThrRIFoA
DFNThrRIFoA
DFNThrRIFSA
AUA + BOL19^7
-743-120 b796 b28.7 mb
-744-193 mb726 mb18.8 ipb-745-188 b1709 b11.7'mb
BOL1969
-648-**
52.9 mb
AUA1971
BOL1971 a, b
ENDF/B31971
N O D A T A
-649-**
43.3 mb
-542A-**
38.7 mb
.4116.4.24 b17.2 b52.5 rab
-4117-110 b788 b44.7 nib
-542D-**
39.1 mb
-1226-87.1 b890 b
N O D A T A
-543A-**
27.1 mb
-V1 18-459 rab2.44 b27.9 mb-4119-189 b49.1 b8.98 mb
-543B-**
27.2 mb-1227-185 b49-8 b
DKNDL Experiment
17 + 7 b(230 + 8) b
A/4 bS*«5) b
90 + 10 b(870% 190)b
4304; 90(**»2.8) b
198 i 94 b(reactor spec)
Expt.fief
(1)(5)
(5)( D
(1 )(5)
(1)(D
(3)

Integral cross-section comparisons, continued
CO
Nuclide(Half-life)
Xe-133 mi(2.26 d)
Xe-134
Xe-135(9.172 h)
. .
Xe-136
Cs_133
Cs-134(2.07 y)
DFNThrHIFSA
DFNThrHIFSA
DFNThr
SIFSA
DFNThr81FSA
DFNThrRIFSA
DFNThr81FSA
AUA + BOL196?
-747-193 mb478 mb14.7 mb
-750-3.87 ,
x 106b8659 b11.3 «nb
-752-146 mb457 mb4.99 mb
-746-28.6 b386 b35.8 mb
-748-132 b1136 b81.5 mb
BOL1969
AUA1971
BOL1971 a, b
SNDF/B31971
N O D A T A
-545A-**
17.4 mb
-547A-**
4.49 mb
-544A-**
54.7 mb
-4120-253 mb260 rab6.14 mb
-4121-3.06 ,
x 10 t5803 b2.05 mb
-4122-198 mb115 mb2.23 mb
-4123-29.5 b377 b37.5 mb
-4124-132 b86.1 b98.8 tab
-545D-**
17.4 mb
-547D-**
4.53 mb
-544D-**
55.3 mb
-1026-3.06 ,
x 10>7635 b
-1141-29.6 b380 b
UKNDL
-4F-
5893 b
Experiment
221 + 12 mb330 T 23 mb
(3.09 + .04)~X 106b
180 _+ 50 mb
29.5 ± 1 b457 + 15 b
140 + 12 b(reactor spec
Kxpt.fief
(1)(D
(1)
(1)
(5)
(5))
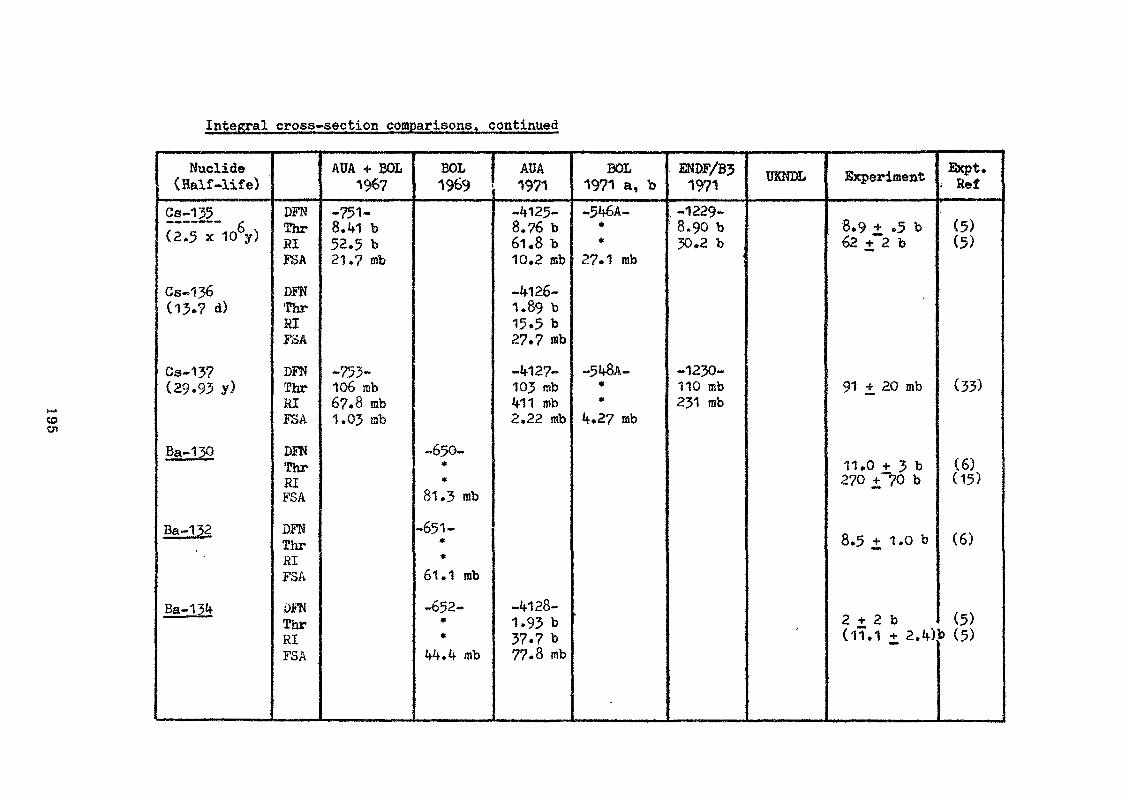
Integral cross-section comparisons, continued
CO
Nuclide(Half -life)
Cs-135(2.5 x 10⁶y)
Cs-136(13.7 d)
Cs-137(29-93 y)
Ba-130
Ba-122
Ba-134
DFNThrHIESA
DFNThrHIFSA
DFNThrRIESA
DFNThrRIFSA
DFNThrHIFSA
DFNThrRIFSA
AUA 4- BOL1967
-751-8.41 b53.5 b21.7 mb
-753-106 nsb67.8 mb1.03 tab
BOL19 9
-650-**
81.3 mb
-651-**
61.1 rab
-652-**
it4.*f mb
AUA1971-4125-8.76 b61.8 b10.2 mb
-VI26-1.89 b15.5 b27.7 mb
-4127-103 nib411 mb2.22 mb
-if 128-1.93 b37.7 b77.8 mb
BOL1971 a, b-5 A-**
27.1 mb
-5**8A-**.27 mb
ENDF/B31971
. -1229-8.90 b30.2 b ,
'
-1230-110 mb231 rab
UKNDL Experiment
8.9 + .5 b62 £2 b
91 ± 20 mb
11.0 + 3 b270 + 70 b
8.5 i 1.0 b
2 , - T-+ d b(1T.1 + 2. if)
Expt.• Sef
(5)(5)
(33)
(6)(15)
(6)
(5)) (5)

Integral cross-section comparisonst continued
CDG5
Nuclide(Half-life)
Ba-135
Ba-135 m(28.7 h)
Ba-136
3a-137
Ba-138
Ba-140(12.79 d)
DFNThrHIFSA
.DFNThrRIFSA
DFNThrRIFSA
DFNThrRIFSA
DFNThrRIFSA
DFNThrRIFSA
AUA + BOL1967
-754-694 Ob300 mb25.2 mb
BOL1969
-653-**
36.8 mb
ADA1971
3 0
BOL1971 a, b
D A T A
-654-**
19.6 mb
-655-**
14.4 mb
-549A-**
27.4 mb
•4129-393 mb17.1 b14.3 mb
-4130-5.07 b4.83 b14.7 nib
-4131-349 mb210 mb3.90 mb
-4132-1.58 b13.6 b13.6 rab
BNDF/B31971
.
UKNDL Experiment
5.8 + .8 b95 ±~6.5 b
0.4 + .4 b(17.5+ 1.7)1
5.1 + .4 b4.1 7 .34 b
400 + 40 mb400+40 .rab
1.57 + .03 b13.6 7 1.4 b
Ebcpt.fief
(5)(1)
(5)(5)
(5)(5)
(5)(5)
(5)(5)
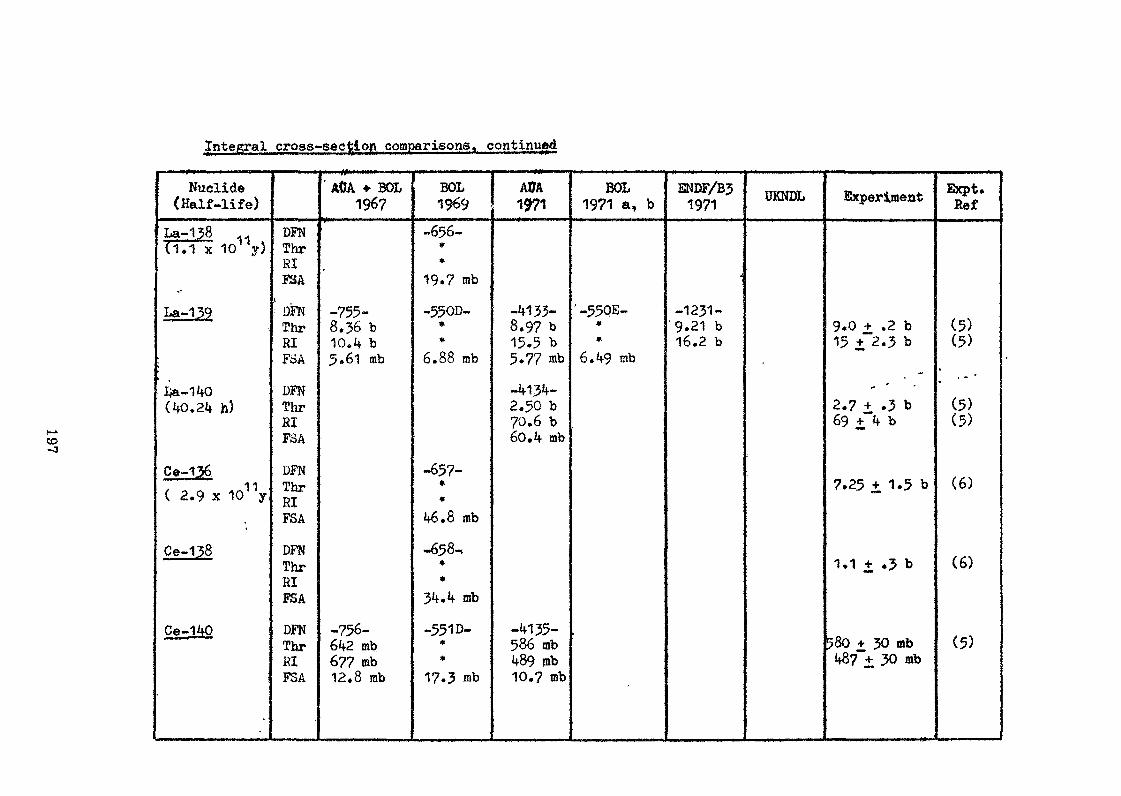
Integral cross-section comparisons, continued
CD
Nuclide(Half-life)
La-138 ,,ri.1 x 10 y)
La-139
;
Ija-lUOUO.24 h)
Ce-136( 2.9 x 10¹¹y
Ce-138
Ce-1.W
•
DFNThrRIISA
; DFNThrRIFSA
DFNThrRIFSA
DFNThrRIFSA
DFNThrRIFSA
DFNThrRIFSA
A0A 4- BOL1967
-755-8.36 b10. k b5.61 mb
-756-6k2 mb6?7 mb12,8 mb
BOL1969
-656-#*
19.7 tab
-550D-**
6.88 rob
-657-**
MJ.S mb
-658-.**
3k.k mb
-551 D-**
17.3 mb
A0A1971
-W33-8.97 b15.5 b5.77 mb
-iflSif-2.50 b70.6 b60. mb
-4135-586 mbif89 mb10.7 mb
BOL1971 a, b
' -55QE-**
6.^9 mb
ENEF/B31971
<
-1231-'9.21 b16.2 b
TJKNDL Experiment
9.0 + .2 b15 + 2.3 b
- '2.7 + .3 b69 +"k b
7.25 + 1.5 b
1.1 + .3 b
580 + 30 mb487"+ 30 mb
Expt.Ref
(5)(5)
*
(5)(5)
(6)
(6)
(5)

Integral cross-section comparisons, continued
CO
Nuclide(Half-life)
Ce-141(32.5 d)
Ce-142, , in1** )> x y
Ce-143(33.5 h>
Ce-144(284.4 d)
Pr-141 '———— 16(>2 x 10 y)
Pr-142"(19.2 h)
\
V
DFNThrHIFSA
DFNThrHIFSA
DFNThrRIFSA
DFNThrRIFSA
DFNThrRIFSA
DFN •Thr \HIFSA
AUA + BOL1967
-758-965 mb1.09 b10.8 mb
-757-11.8 b20.8 b14.5 mb
*\
V,
BOL1969
-5530-**
14.2 mb
-552D-**
18.5 mb
AUA1971
-4136-28.6 b28.2 b12.8 mb
-4137-855 mbL49 b8.58 mb
-4138-5.57 b42.6 b9.76 mb
-4139-0.932 b2.58 b7.61 mb
-4140-11.0 b17.3 b15.5 mb
-4141-17.2 b1ft? b88>5 b
••,_.
BOL1971 a, b
-552E-**
18.5 mb
ENDF/&31971
-1232-29.0 b29.1 b ,
-1233-11.4 b18.8 b
UKNDL Experiment
29 ±3 b(reactor spec!
900 + 90 mb1.18"+ .09 b
6.0 + .? b(reactor spec]
1.0 * .1 b2.6 T .26 b
11.3 * .2 b15. 7 i Lib
20 + 3 b[reactor spect
/• -
Expt.Ref
(5)
(5)(5)
(5)
(5)(5)
(5)(D
(5)

Integral cross-section comparisons, continued
COto
Nuclide(Half -life)
Pr-143(13.6 d)
Pr-145(6 h)
Nd-142
Nd-143
Nd-144(2.4 x 10¹⁵y)
Nd-145 ;? " ' -£
(>6 x 10 y)
DFNThrHIFSA
DFNThrRIFSA
DFNThrRIFSA
DFNThrRIFSA
DFNThrRIFSA;DFNThrRIFSA
AUA •(• BOL1967
-759-329 b57.5 b4.93 mb
-760-4.83 b8.51 b24.4 mb
-761-60.9 b388 b55.9 mb
BOL1969
-584A**
22.8 mb
-554D-**
42.3 mb
-555D-**
27.1 mb
-556D-
32.4 mb
AUA1971
-4142-96.3 b471 b38.2 mb
-4143-18.3 b445 b23.7 mb
-4144-18.5 bO« *rO M29.8 mb
-4145-303 b63.9 b36.7 «b
3.38 b7.57 b32.8 mb
271 b25-3 n»b
BOL1971 a, b
ENDF/B31971
-1234-99.5 b167 b .
-1235-317 b136 b
-1236-41.2 b298 b
UKNDL Experiment
90 + 10 b190"% 25 b
18.7 + .7 b8.2 £".5 b
. 322 + 5 b(197 + 4) b
3-8 + .3 b(5.2~% .8.) b
45 + 4 b259"+ 55 b
'» *
Expt.Jt9t
(5)(5)
(5)
(5)(5)
(5) -(5)
(5)(5)
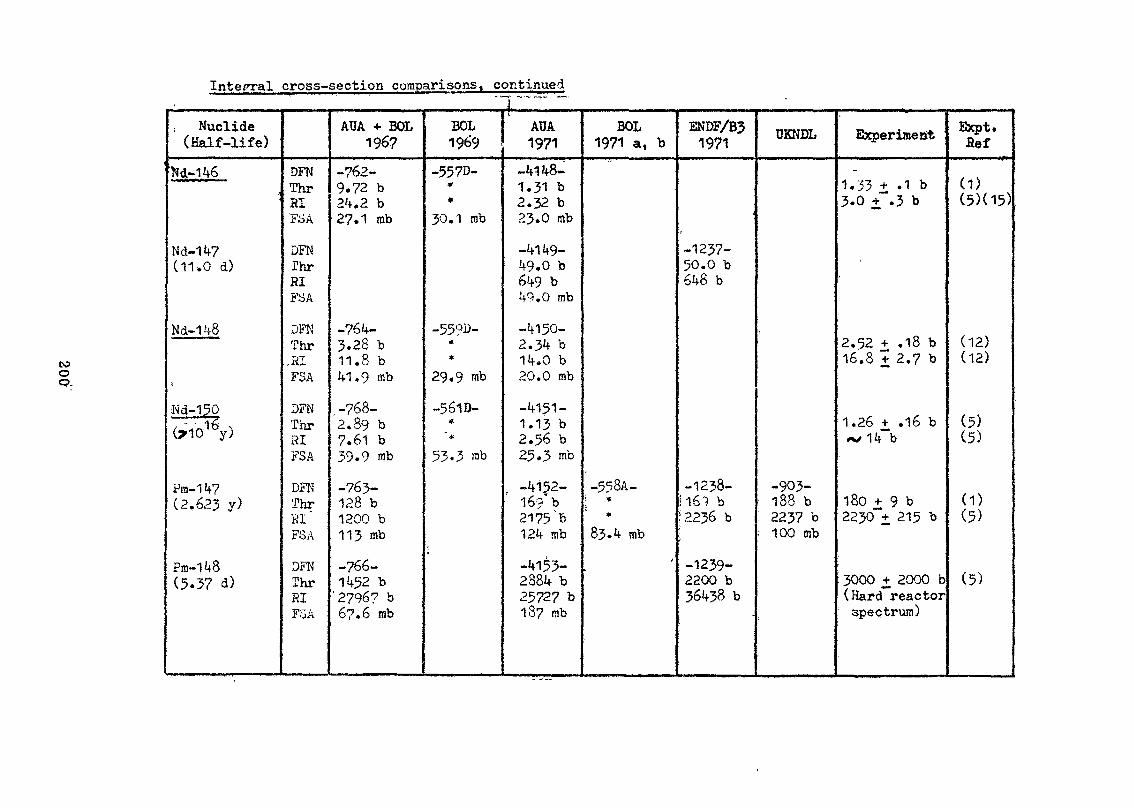
Integral cross-section comparisons, continued..™ -.,„_. „
COo
, Nuclide(Half -life)
Nd-146
Nd-147(11-.0 d)
Nd-148*^—"™^*"*^™—
t
iNd-150^6(710 y)
Pra-147(2,623 y)
Pm-148(5.37 d)
DFNThrHIFSA
DFNfhrRIFSA
DFNThr
FSA
DFNThr81FSA
DFNThrKI"FSA
DFNThrRIFSA
AUA + BOL1967
-762-9.72 b24.2 b27.1 mb
-764-3.28 b11.8 b41.9 mb
-768-2.89 b7.61 b39.9 mb
-763-128 b1200 b113 mb
-766-1452 b
'27967 b67.6 rab
BOL1969
-557D-**
30.1 mb
-559D-*
*29.9 mb
-561D-*
"*53.3 rub
AUA1971
-4148-1.31 b2.32 b23.0 mb
-4149-49.0 b649 b4Q.O mb
-4150-2.34 b14.0 b20.0 mb
-4151-1.13 b2.56 b25.3 rab
, -4152-1 69' b2175'b124 mb
-4153-2384 b25727 b187 mb
BOL1971 a, b
-558A-! *
*83.4 mb
-
ENDF/B31971
-1237-50.0 b648 b
-1238-i 161 b12236 b
-1239-2200 b36438 b
UKNDL
-903-188 b2237 b
•: 100 mb
Experiment
-1.33 + .1 b3.0 jf.3 b
1
'
2,52 + .18 b16.8 + 2.7 b
1.26 + .16 b*%/ I4~~b
180 + 9 b2230"*+ 215 b
3000 +_ 2000 b(Hard reactorspectrum)
Bxpt.fief
(1)(5)(15)
(12)(12)
(5)(5)
(1)(5)
(5)

Integral cross-section comparisons, continued
too
Nuclide(Half -life)
Pm-148 m(40.6 d)
Pm-149(53.1 h)
Pm-151(28 h)
Sm-144
Sm-147(1.05 x 10¹¹y)
Sffl-148(72. x 101*V)
DFNThrHIFSA
DFNThrRIFSA
DFNThr .RIFSA
DFNThrHIFSA
DFNThrSIFSA
DFNThrBIFSA
AUA •*• BOL196?
-765-38668 b35669 b
762 mb
BOL1969
-585A-**
67.3 mb
-586A-**
209 mb
-587A-**
65.3 mb
AUA1971
-4192-20700 b19250 b188 mb
-4154-1314 b923 b91.7 mb
-4155-171 b1208 b120 mb
-4156-53.4 b566 b133 mb
-4157-4.41 b18.4 b60.2 rab
BOL1971 a, b
ENDF/B31971
-1254-24000 b10569 b
-1240-1450 b807 b
-1241.-150 b1201 b
-1242-57.1 b623 b
-1243-4.73 b54.2 b
UKNDL Experiment
20500 b3600 + 2400b
1450 + 240 b(reactor spec
<700 breactor spec)
0.7breactor spec)
52 + 3 b640 4; 200 b
4.72 + .08 b4s50~b
, Sxpt.. fief
(34)(34)
: (5)
(5)
' (6)
(5)(5)
(5)(1)

Integral cross-section comparisons, continued
tooCO
Nuclide(Half-life)
Sm-14915(?10 y;
Sm-130
3m-151(ft&gy y)
Sm-152
3m- 153(46.58 h)
Sm-154
DFNThrRIFSA
DFNThrRIFoA
DFNThrHIFSA
DFNThrHIF3A
DFNThrRIFSADFNThrHIFSA
AUA + BOL1967
-767-68640 b3610 b131 mb
-769-96.8 b871 b16.2 rab
-770-14160 b2697 b100 mb
-771-227 b2290 b88.9 mb
-773-5.33 b17.1 b35.6 mb
BOL1969
-560D-**
168 rab
-588A-**
85.1 mb
-563D-**
86.0 mb
-565D-*•
69.7- mb
AUA1971
-4158-66280 b3594 b123 mb
-4159-101 b328 b59.6 mb
-4160-13850 b2163 b351 mb
-41 61-205 b1766 b55.4 mb
-4162-333 b1106 b158mb-4163-4.69 b38,1 b47.8 rab
BOL1971 a, b
-562A-*
*157 mb
ENDF/B31971
-1027-67477 b3183 b
-1244-100 b252 b
-1245-13578 b3772 b
-1246-204 b3462 b
-1247-9992 b5459 b
UKNDL Experiment
68600 + 300b ;
101 + 5 b255 ± 25 b
13700 + 1600(3170 + 700)b
209 + 4 b3060""+ 60 b
f
4.9 + 1.0 b ((31 + 6) b ;
,
Expt.Bef
(5)
(5)(5)
> (5)(5)
(1)(5)
»•
(5)(13)

Integral cross-section comparisons« continued
tooCO
Nuclide(Half-life)
Sm-156(9.4 h)
Eu-151
Su-153
Eu-154(16 y)
Eu-155(4.65 y)
:
Eu-156(15.4 d)
£ Corrected ;
DFNThrRIFSA
DFNThrRIFSA
DFNThrRIFSA
DFNThrRIFSA
DFNThrRI.FSA
DFNThrRIFSA
AUA -(• BOL1967
-772-459 b1491 b287 mb
-774-1481 b4722 b381 mb
-775-19725 b1394 b261 mb
•*>"
BOL1969
-589A-**
360 mb
-564D-**
303 mb
i .
» a cut-off at 0.55 «VI I -
AUA1971
-4164-17.1 b332 b46.8 mb
-4165-435 b1203 b234 mb
-4166-1480 b1157 b750 mb
-4167-3674 b1213 b153 mb
-4168-472 b1238 b319 mb
^
BOL1971 a, b
EMDF/B31971
-1028-8339 b3154 b
-1029-444b1512 b
-1248-1611 b1321 b
-1249-4040 b1817 b
-1250-2000 b1947 b
UKNKL
-921A-8336 b2390 b207 mb
-992A-444b1500 b152 mb
Experiment
8280 + 270 b(2485~£ 310)b
450 + 70 b(16201 200)b
1420 * 280 b(reactor epe<
4040 £ 125 b
Expt.fief
(3)(5)4 (13)
(5)^ (13)
(3))
(14)
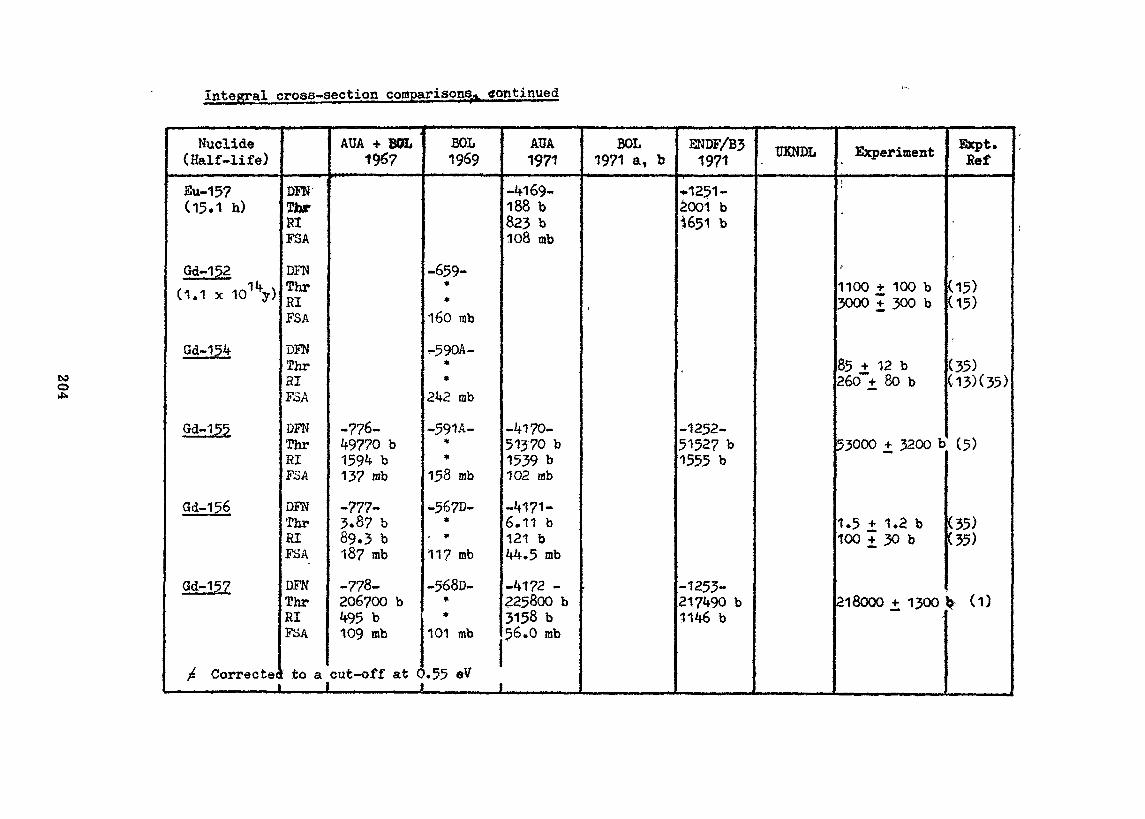
Integral cross-section comparisons continued
too•*»
Nuclide(Half-life)
3u-157(15.1 h)
Gd-152(1.1 x 101*V>
Gd-15*f
Gd-155
Gd-156
Gd-157
£ Corrects*
DFN'TtorRIFSA
DFNThrRIFSA
DFNThrRIFSA
DFNThrRIFSA
DFNThrRIFSA
DFNThrRIFiJA
to a
AUA + SOL196?
-776-49770 b159 b137 mb
-777-3.87 b89.3 b187 rab
-778-206700 b1*95 b109 mb
cut-off at C
BOL1969
-659-**
160 mb
-590A-**
2U2 mb
-591A-**
158 mb
-567D-**
117 mb
-568D-*«
101 mb
.55 eV
AUA1971
-Vl69-188 b823 b108 mb
-if 170-51370 b1539 b102 mb
-if 171-6.11 b121 bkk.5 mb
-M72 -225800 b3158 b56.0 mb
. l i i
BOL1971 a, b
ENDF/BJ1971
*1251-2001 b1651 b
-1252-51527 b1555 b
-1253-217W b11 b
UKNDL Experimenti
>1100 + 100 b3000 + 300 b
85 + 12 b260""+ 80 b
53000 + 3200 b
1.5 + 1.2 b100 + 30 b
Expt.Ref
(15)(15)
'
(35)(13X35)
(5)
(35)(35)
218000 + 1300 (1)""

Integral cross-section comparisons, continued
tooCJ»
Nuclide(Half-life)
Gd-158
Gd-159(18.0 h)
Gd-160
Tb-159(>5 x 10l6y>
Tb-160(72.1 d) .
DFNThrRIFSA
DFNThrRIFSA
DFNThrRIFSA
DFNThrRIFSA
DFNThrRIFSA
AUA + BOL196?
•
BOL1969
-569B-**
87.3 mb
-592A-**
59.1 mb
-570A-**
208 rab
\'.
AUA1971
-VW2.66 b97.8 b36.1 mb
-if 174-16.2 b186 b29.2 mb
-M75-720 mb1.42 b25.0 rob
-if 176-21.6 b376 b202 mb
•W7-V79 b1017 b322 mb
BOL1971 a, b
ENDF/BJ51971 UKNDL Experiment
2.78 + O.if2 b66.7 ± 16 b
768 + 115 fflb(6.9~V 1.0) b
23.2 + -5 bW)6 £"19 b
600 + 100 b(reactor spec
Expt.Ref
(5)(15)
(36)(13)
(11)(1)
(5))

Integral cross-section comparisons, continued
tooo>
Nuclide(Half-life)
Tb-161(6.9 d)
Dy-136(7lOl8y)
Dy-158
Dy-160
Dy-161
py-162
DFNThrHIFSA
DFNThrBIFSA
DFNThrHIF5A
DFNThrRIFSA
DFNThrElFSA
DFNThrRIFSA
AUA + BOL196?
<
BOL1969
-660-**
2k2 mb
-661-**
228 mb
-662-**
110 mb
-571A-**
213 mb
-663-**
66.2 mb
AUA1971
-if 1?8-95.5 b65^ b83.6 mb
-M79-56.6 b1159 b83.7 mb
-M80-561 b13i»5 b111 mb
-VI 81-205 b25*f3 bV7.** mb
BOL1971 a, b
. ENDF/B3J 1971
''
' OKNDL Experiment
33 - .3 b960 - 80 b
if? 1 6 b130 - 20 b
61 £ 5 b1000 + 78 b
623 + 13 bHf90"V 100 b
165 * 7 b2360"% 1100 is
Expt.Ref
(38)(38)
(1)(1)
(1)(1)
(1)(1)
(1)
(1)
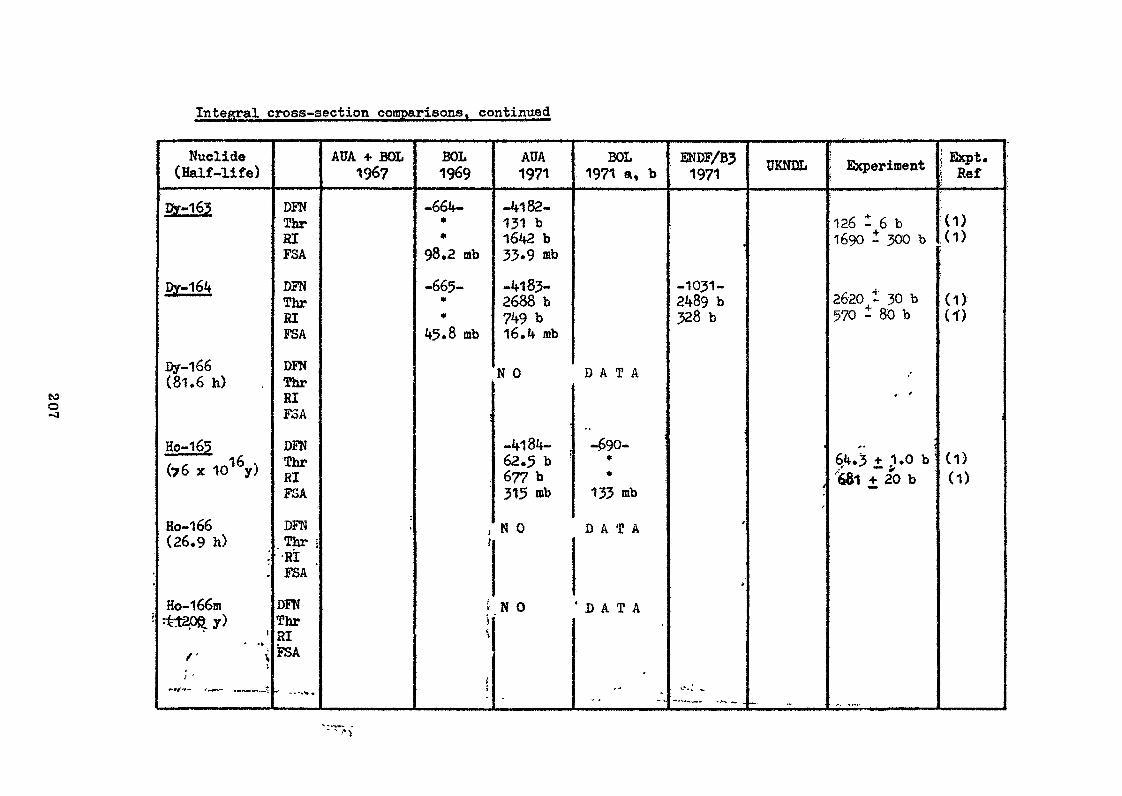
Integral cross-section comparisons continued
too
Nuclide(Half-life)
Dy-163
Dy-164
Dy-166(81.6 h)
Ho-165(76 x 10l6y)
Ho-166(26,9 h)
.•
Ho-l66mrttt20^ y)
!* •»
/-' \
I '
""" "~ '~"~'
DFNThrRIFSA
DFNThrRIFSA
DFNThrRIFSA
DFN .ThrRIFSA
DFNThr -:•RIFSA '
DFNThrRIFSA
- . -» V -m
AUA + BOL1967
t
BOL1969
-664-**
98.2 mb
-665-**
45.8 mb
i
it
i
i\
i•
AUA1971
-4182-131 b1642 b33.9 mb
-4183-2688 b749 b16.4 mb
N 0
-4184- .62.5 b '677 b315 mb
N 0
.N 0
-
BOL1971 a, b
D A T A
-690-**
133 mb
D A T A
' D A T A
•
-.
ENDF/B31971
-1031-2489 b328 b
'
-.._,„ .. _ .
UKNDL
,
Experiment
126 - 6 b1690 - 300 b
2620 i 30 b570 - 80 b
/* '
*• ':6,4.3 ±1.0 b !
'681 + 20 b
^ , „..
Expt.Ref
(1)(1)
(1)H)
(1)(1)
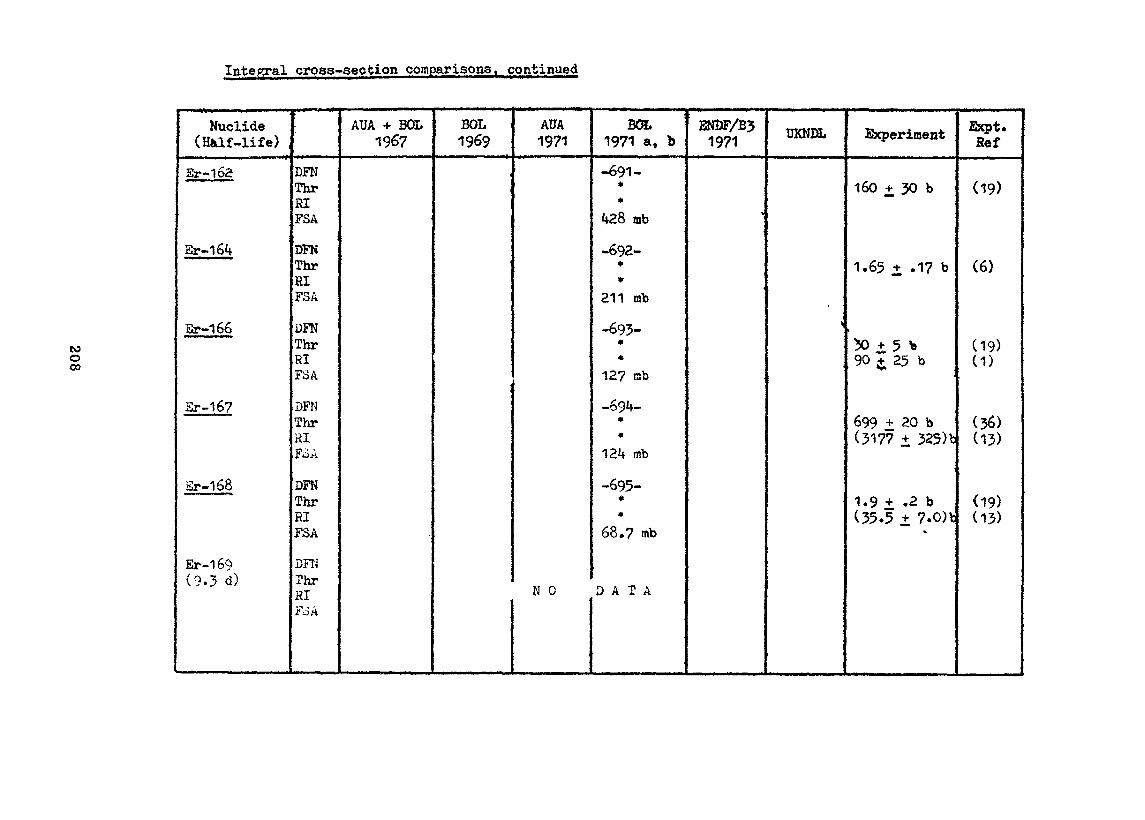
Integral cross-section comparisons, continued
tooCO
Nuclide(HMf-life)
Er~1o2
Er-l6<t
Sr-166
Er-167
iSr-168
Er-169(9.3 d)
DFNThrRIFSA
DFNThrRIFSA
DFNThrRIFSA
DFNThrHIrv •>JO.K
DFNThrRIFSA
DFNThrHIFoA
AUA + BOL1967
BOL1969
AUA1971
N 0
B<H.1971 a, b
-691-**
kZB mb
-693-**
211 mb
-693-*«
127 tab
-69V**
12U mb
-695-**
68.7 mb
D A T A
SNSF/B31971 UKNDL
i
Experiment
160 + 30 b
1.65 + .17 b
50 + 5 b90 £ 25 b
699 + 20 b(3177 + 325) t
1.9 + .2 b(35.5 i 7-0)1:
«
Expt.fief
(19)
(6)
(19)(1)
(36)(13)
<19)(13)

Integral cross-sections conjCinued
COoCD
Nuclide(Half-life)
Br-170
•
DFNThrHIFSA
AUA + BOL196?
BOL1969
AUA1971
BOL1971 at b
-696-**
34.3 mb
ENDF/BJ1971
UKNDL Experiment
.9 + .6 b32.2 b
Expt.fief
(1)(37)
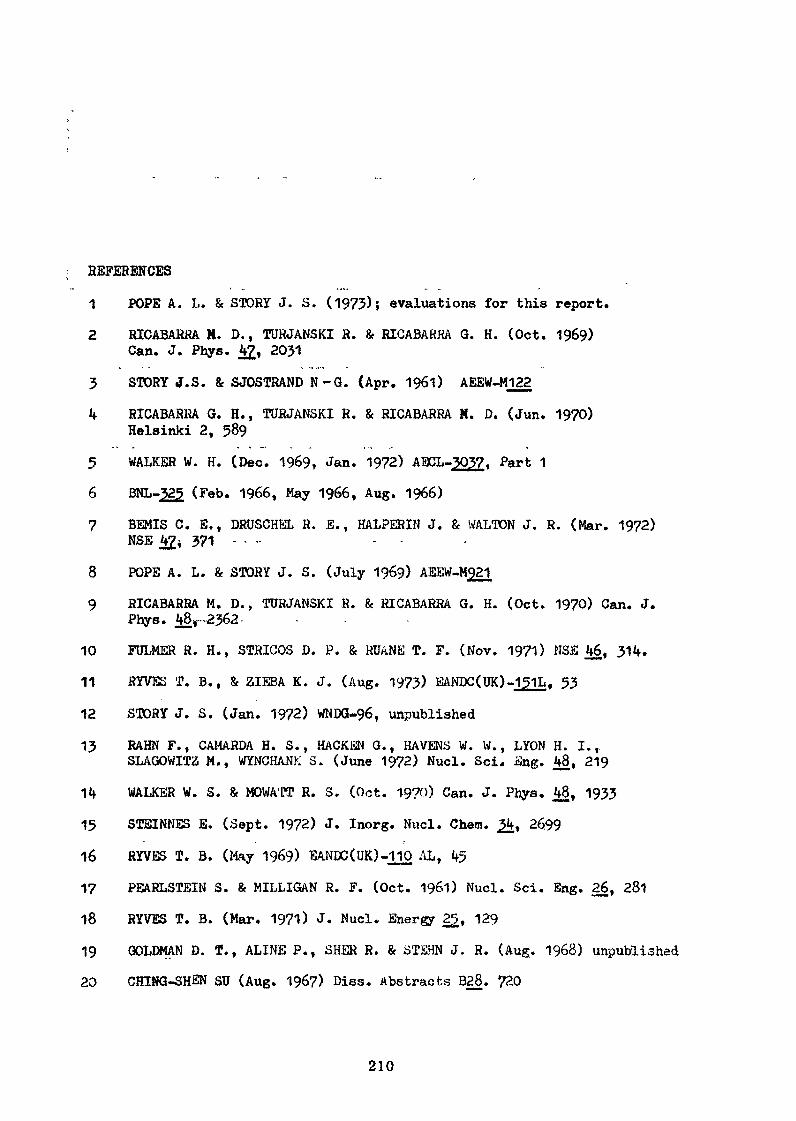
REFERENCES
1 POPE A. L. & STORY J. S. (1973); evaluations for this report.
2 RICABARRA M. D., TURJANSKI R. & RICABARRA Q. H. (Oct. 1969)Can. J. Phys. 4£, 2031
3 STORY J.S. & SJOSTRAND N-G. (Apr. 1961) AEEW-M122
4 RICABARRA G. H., TURJANSKI R. & RICABARRA M. D. (Jun. 1970)Helsinki 2, 589
5 WALKER W. H. (Dec. 1969, Jan. 1972) ABCL-3037. Part 1
6 BNL-3J5. (Feb. 1966, May 1966, Aug. 1966)
7 BEMIS C. E., DRUSCHKL R. E., HALPERIN J. & WALTON J. R. (Mar. 1972)N S E 47.* 3 7 1 - • . . .
8 POPE A. L. & STORY J. S. (July 1969) AEEW-M921
9 RICABARRA M. D., TURJANSKI R. & RICABARRA G. H. (Oct. 1970) Can. J.Phys. 48r2362
10 FULMER R. H.f STRICOS D. P. & RUANE T. F. (Nov. 1971) USE 46, 314.
11 RYVES T. B., & ZIEBA K. J. (Aug. 1973) BANDC(UK)-151L. 53
12 STORY J. S. (Jan. 1972) WNDG-96, unpublished
13 RAHN F., CAMARDA H. S., HACKEN G., HAVENS W. W., LYON H. I.,.SLAGOWITZ M., WYNCHANK S. (June 1972) Nucl. Sci. Sng. 48, 219
14 WALKER W. S. & MOWATT R. S. (Oct. 1970) Can. J. Phys. 48, 1933
15 STEINNES E. (Sept. 1972) J. Inorg. Nucl. Chem. , 2699
16 RYVES T. B. (May 1969) BANDC(UK)-110 AL, 45
1? PEARLSTEIN S. & MILLIGAN R. F. (Oct. 196l) Nucl. Sci. Eng. 26, 281
18 RYVES T. B. (Mar. 1971) J. Nucl. Energy 2jjr, 129
19 GOLDMAN D. T., ALINE P., SHER R. & STEHN J. R. (Aug. 1968) unpublished
20 CHIHG-SHEN SU (Aug. 196?) Diss. Abstracts B28. 720
210

21 BRADLEY J. G. & JOHNSON W. H. (Jan. 1972} Nucl. Sci. Eng. 4£t 151
22 EMSRY J. F. (May 1965) J» *norg. Nucl. Chem. 2£, 90?
23 RICABARRA H. D. , TRUJANSKI R. , RICABARRA G. H. & BIGHAM C. B. (Nov. 1968)Can. J. Phys. 46, 2473
2k SANTRY D. C. & WERNER R. D, (Nov. 1972) EANDC (Can)-46jL, 1
25 ANDERS E. (Apr 1958) Phys. Rev. 110, 427
26 KATCOFF S. & WILLIAMS D. C. (Oct. 1958) J. Inorg. Nucl. Chem. £« 194
27 ISHIKAWA H. (Oct. 1969) J. Nucl. Sci. Tech. 6, 587
28 WALKER W. H. & COPLSY L. A. (Sept. 1966) Can. J. Phys. 44, 1985
29 LESAGE L. & SHER R. (Feb. 1966) ANS San Diego meeting
30 WAY K & HAINES G. (Feb. 1948) AECD-2138
31 KBISCH B. (Jan 19&3) Phys. Rev. 129. 769
32 ORVINI E, , GAGGERO G. , LESCA L. , BRESESTI A. M. & BHEiiESTI M. (July 1968)J. Inorg. Nucl. Chem. .£0, 1353
33 STDPEGIA D. C. (May 1960) J. Nucl. Energy A12, 16; weighted mean of thesix results presented
3it KIROUAC G. J., EILAND H. M. , CONRAD C. A., SLOVACEK R. E. & SEEMANN K. W.(Nov. 1973) Nucl. Sci. JSng. 5 , 310
35 HIWSSBERGER E. (Sept. 19$9> SQAE G-14/1969
36 MANGAL S. R. «c GILL P. B. (Mar. 1963) Nucl. Phys. 4_lf 372
37 KONDAIAK E., RANAKUMAR N. & FJNK R. W. (Nov. 1968) Nucl. Phys. A120, 329
38 ALSTAD J., PAPPAS A.C & SYVSHSOI* T. (May 1972) INDC(NOR)-1/G,2.
211

Contribution toReview Paper No. 11a

AN INVESTIGATION ON THE GAUSSIAN WIDTH PARAMETER IN 235U(n th,f)
A. ZukeranPower Reactor and Nuclear Fuel Development Corporation
9-13, 1-chome Akasaka, Minato-ku, Tokyo, Japan
Abstract
The most stable charge Z. has been obtained from the Garvey's mass tableO'lC
[1], and the most probable charge Z in U ( n . ^ 9 f } has been estimated usingthe ZA~values under the ECD postulate [2]. Dependence of the estimated mostprobable charge Z on the mass number A has been compared with that of semi-empirical Z -values obtained from the observed fractional yields [3] usingthe assumed Gaussian width parameter o. The fairly well agreement between themhas been confirmed.
Contrarily to investigate on the Gaussian width parameter 0 assumed above,the a-value has been obtained from the same observed fractional yield tfsing theestimated Z -value mentioned above. The resultant a-values as functions ofmass number A have been investigated from the point of view of dependencies onthe neutron number n and proton number p respectively. It is found that somepossible systematics may exist in the dependencies of cr-values oft the n and p.
To examine the validity of dependencies of Z and a-values only on themass number A, the following attempt has been made. If Z and a-values dependonly on the mass number .A, there should be a common point (2 ,a) t* all isoto-pes of the isobar on the Z -o correlation curve, i.e. th« calculated fractionalyields based on the Gaussian distribution [4] should be exactly equal to theobserved ones of those isotopes. The result of investigation on the correlationbetween Z and a shows that such a common point scarcfty exists. It seems to bepossible interpretation that Z and a wou ldn ' t be the functions of mass number Aas a single variable but the functions of the proton and neutron numbers respec-tively, Further investigations, however, are still required, e.g. on the valid-ity of simple Gaussian distribution function used for present work.
1. INTRODUCTION •• 'A preliminary evaluation [5] was made for the fission product yields of
235U, 239Pu and 241Pu thermal neutron induced fissions and of 238U and 239Pufast neutron induced fissions. The eharge ditributions in that work werebased on the constant Gaussian width parameter o= 0.58 [6] and the mostprobable charge obtained from the Garvey's mas,s table [1] as described in this
215
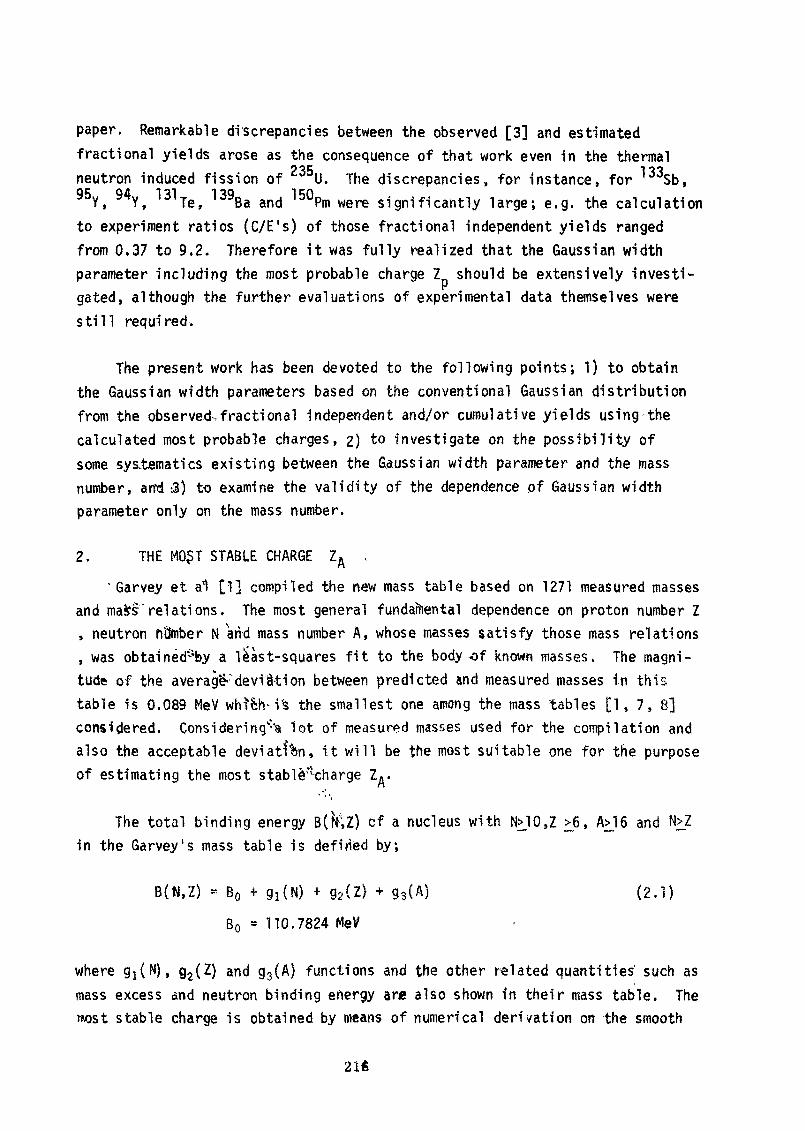
paper. Remarkable discrepancies between the observed [3] and estimatedfractional yields arose as the consequence of that work even in the thermal
235 1 ^"3neutron induced fission of U. The discrepancies, for instance, for ' Sb,95Y, 94Y, 131Te, 139Ba and 150Pm were s ignif icant ly large; e.g. the calculationto experiment ratios (C /E ' s ) of those fractional independent yields rangedfrom 0.37 to 9.2. Therefore it was ful ly realized that the Gaussian widthparameter inc luding the most probable charge 2 should be extensively investi-gated, although the further evaluations of experimental data themselves weres t i l l required.
The present work has been devoted to the following points; 1) to obtainthe Gaussian width parameters based on the conventional Gaussian distributionfrom the observed-,fractional independent and/or cumulative yields using thecalculated most probable charges, 2) to investigate on the possibility ofsome sys.tematics existing between the Gaussian width parameter and the massnumber, an*d :3) to examine the val idi ty of the dependence of Gaussian widthparameter only on the mass number.
2. THE MO$T STABLE CHARGE ZA ,
' Garvey et a1 [1] compiled the new mass table based on 1271 measured massesand mafcs'relations. The most general fundamental dependence on proton number Z, neutron h'dmber N arid mass number A, whose masses satisfy those mass relations, was obtained^by a l£ast-squares fit to the body of known masses. The magni-tude of the average"-"deviation between predicted and measured masses in thistable is 0.089 MeV whffelvi 's the smallest one among the mass tables [1, 7, 8]considered. Considering'-^ lot of measured masses used for the compilation andalso the acceptable deviation, it w i l l be the most suitable one for the purposeof estimating the most stable^charge Z « .
The total b i n d i n g energy B(itU) cf a nucleus with IMO,Z >6, A>16 and N>Zin the Garvey's mass table is defined by;
B{fl,Z) » B0 + 9l(N) + g2(Z) + g 3 (A) (2.1)
B0 * 110.7824 MeV
where g ^ N ) , g2(Z) and g 3 (A) functions and the other related quantities such asmass excess and neutron b inding energy are also shown in their mass table. The»ost stable charge is obtained by means of numerical derivation on the smooth
21ft

curve fitted to the masses of isobars. The most stable charge ZA is thesolution of the following equation;
(8M(A-Z.Z)/3Z)A » (MH-Mn) - (aB{A-Z,Z}/*Z)A * 0
MH = 7.28899 MeV [9]
MM * 8.0714 MeVnThe trend of the most stable charges obtained from Garvey's mass table is
shown by the solid l ine in Fig, 2,1. The minimum requirement should be thatthe location of the estimated most stable nucleus has to be close to the loca-tion of the observed one when the most stable nucleus for odd mass number 1sconsidered, or between the locations of two observed ones when the most stablenucleus for even mass number is considered, and also that the estimated trendshows reasonable shell effects. The present results satisfy both requirementsas shown in the Fig. 2.1.
The comparison of the present work with the Fiedler and Hermann's [10]obtained from the mass table compiled by Konig et al [11] is shown in Fig. 2.2.The estimated curve agrees fairly well with their's within about 0.3 chargeunit on the overall range of mass number and also has some fine structures,e.g. the stair-like behavior from 92 to 114 of mass number. This behaviorseems to be due to the mass relations used by Garvey et al for compiling themass table. Similar ones are found over 143. Furthermore, the valley around121 becomes deeper than that of Fiedler and Herrmann [10].
3. CHARGE DISTRIBUTION IN 235U(n th»f)3.1 CHARGE DISTRIBUTION FUNCTION
The Gaussian width parameter a, which is a basic parameter in the Wahl ' smethod, is obtained by fitting the Gaussian charge distribution function toseveral observed fractional yields [3], In early work by Wahl . the t$we Gauss-ian distribution with constant value of a was used. However in the l&ttwworkit was pointed out by Wahl [12] and Ami el and Feldstein [13] that the same Gau-ssian distribution does not satisfactorily fit to the observed independentyields, i,e. the importance of even-odd effect were emphasized. One of attemptsto take it into account has been made by Musgrove [14] for this panel. However,for present work the following simple distribution function has been tfSfJd beca-use the auther has been interested in the capability of the conventional Gauss-ian distribution when the Gaussian width parameter is varied in the widte range.
217

The fractional Independent yield y^(Z) and fractional cumulative yieldY (Z) of an isotope with atomic number Z and mass number A can be approximatelyexpressed in terms of 8-decay chain length (Z-Z ) and the Gaussian width para-meter o;
1 (z - V2
P{Z) * -J- Exp[ - ————— ] (3.1)/CTT C
1 Z + 0.5 (n - Zp)2
y (Z) , —— f Exp[ . ———— ]dn (3.2)
1 Z + 0.5 (n - Z )2
YjZ) = —— / Exp[ - ———— ]dn (3.3)C 0/27T ^ 202
C « 2(a2 + 1/12)
where P(Z) and o mean the Gaussian charge dispersion and the Gaussian widthparameter respectively.
3.2 'THE MOST PROBABLE CHARGE Z
The most probable charge Z based on the equal charge displacement (ECD)postulate [2 ] can.be obtained from the most stable charge Zft. A well-knownrelationship DO ] between 2n and Z. are as follows;P H
Zpl ' ZA1 - A1 - Al -
Zph - ZAh - 1/2^ZAh + ZA - Ah -V -ZF) <3'4b>
VT S vl
AF = A, + Ah(3,4c)
I'Vwhere suffix 1 , h and F mean the light and heavy fragments, and the fission-ing nucleus, and A and v mean the mass number and the number of emittedneutron 'per fission respectively.
The 'empirical Z -values of U thermal neutron induced fission havebeen obtained from the observed fractional independent and/or cumulative
218
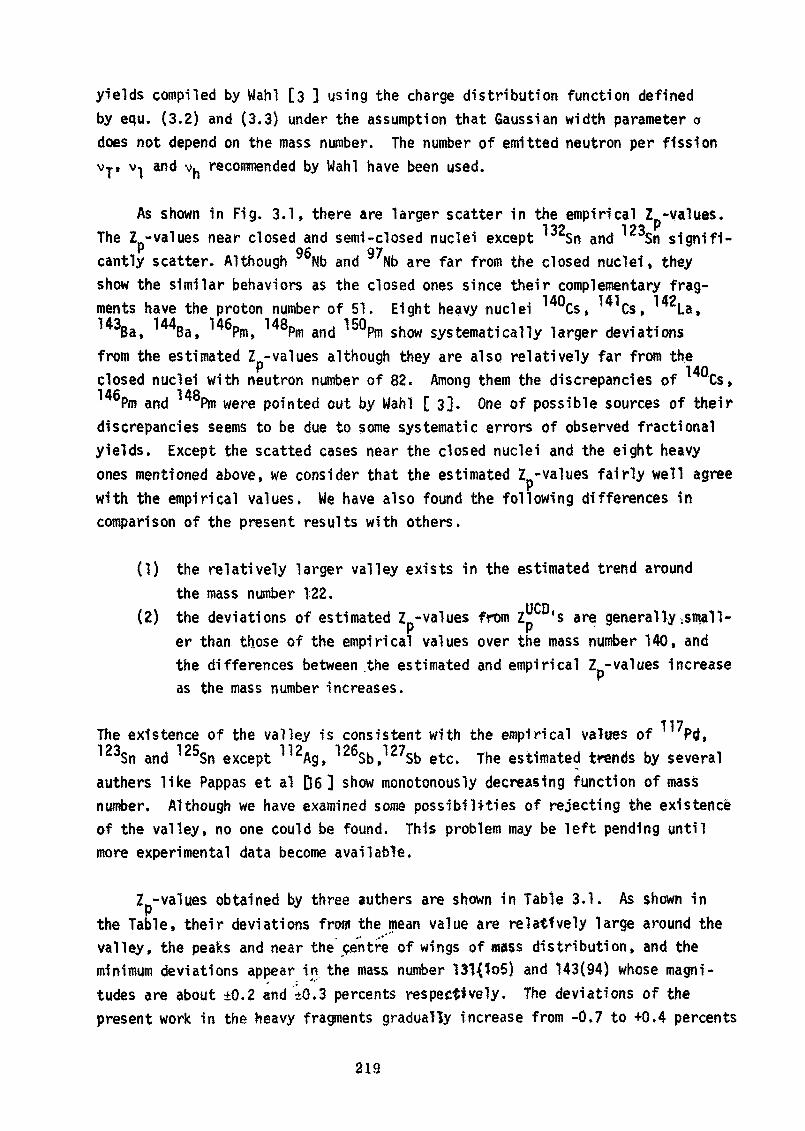
yields compiled by Wahl [3 3 using the charge distribution function definedby equ. (3.2) and (3.3) under the assumption that Gaussian width parameter adoes not depend on the mass number. The number of emitted neutron per fissionv-p v-j and v^ recommended by Wahl have been used.
As shown in Fig. 3.1, there are larger scatter in the empirical Z -values.•jOO 199 PThe Z -values near closed and semi-closed nuclei except Sn and Sn signifi-P og 07
cantly scatter. Although Nfa and Mb are far from the closed nuclei, theyshow the similar behaviors as the closed ones since their complementary frag-ments have the proton number of 51. Eight heavy nuclei Cs, Cs, La,143Ba, 144Ba, 146Pm, 148Pm and 150Pm show systematically larger deviationsfrom the estimated Z -values although they are also relatively far from theclosed nuclei with neutron number of 82. Among them the discrepancies of Cs,
Pm and Pm were pointed out by Wahl [3]. One of possible sources of theirdiscrepancies seems to be due to some systematic errors of observed fractionalyields. Except the scatted cases near the closed nuclei and the eight heavyones mentioned above, we consider that the estimated Z -values fairly well agreewith the empirical values. We have also found the following differences incomparison of the present results with others.
(1) the relatively larger valley exists in the estimated trend aroundthe mass number 122.
(2) the deviations of estimated Z -values from ZJJ s are generally ^mail-er than those of the empirical values over the mass number 140, andthe differences between .the estimated and empirical Z -values increaseas the mass number increases.
The existence of the valley is consistent with the empirical values of Prf,123Sn and 125Sn except 112Ag, 126Sb,127Sb etc. The estimated trends by severalauthers l ike Pappas et al D6 ] show monotonously decreasing function of massnumber. Although we have examined some possibilities of rejecting the existenceof the valley, no one could be found. This problem may be left pending untilmore experimental data become available.
Z -values obtained by three authers are shown in Table 3.1. As shown inPthe Table, their deviations from the mean value are relatfvely large around thevalley, the peaks and near the centre of wings of wass distribution, and theminimum deviations appear in the mass number 131{?°5) and 143(94) whose magni-tudes are about ±0.2 and ±0.3 percents respectively. The deviations of thepresent work in the heavy fragments gradually increase from -0.7 to +0.4 percents
219

as the mass number increases, and the same tendency appears in the light frag-ments. The status of the other's are nearly the same to our's although theirdirections of deviations are different from each other.
It will be important to examine the dependence of the scatter of empiri-cal Z -values on the a's. The empirical Z -values obtained from the sameobserved fractional yields [3 ] by varing the magnitude of the Gaussian widthparameter are shown in Fig. 3.1 to 3.3. However, the scatter of empirical Z -values is hardly improved. For instance, the Z -values of Cs, 1448a, 14Smand Pm, which have shown uniformly larger deviations (Z - Z:J ), show onlyslight change against about 15% change of cr-value. Average most probable char-ges Zp's are also shown in Fig. 3.1 to 3.3 by dashed lines as a temporallystandard to indicate the movement of empirical values, Average Z -values toge-ther with the other averages denoted by I, and 2 . for light and heavy frag-ments respectively are shown in Table 3.2. When the o 's increases from 0.55 to0.62, the Zpi(o) decreases from 0.350 to 0.225, but contrarily I .(a) increas-es from 0.425 to 0.521. Averages of Z -(o) and Z h(o) denoted by Z in the 5thcolumn are 0.300 and 0.483 respectively. Comparing the present result withWahl's, T of 0.438 for heavy fragments fairly well agrees with his result of0.45 for mass number 141 to 144. As it is clear from the normalized 1 , . re-presentation as shown in Table 3.1, T. is more sensitive to a than T. . Sin-ce the function Z^(a) is decreasing and Ipu(a) increasing respectively, theempirical most probable charge as a whole move towards the average value T. of0.40 as shown by dashed line in Fig. 3.1 to 3.3*
3.3 GAUSSIAN WIDTH PARAMETER IN 235U(nth,f)
3.3.1 FITTING,OF GAUSSIAN WIDTH PARAMETERIn the preceding discussion on the empirical Z -values as a function of
Gaussian width parameter, it was^assumed that the Gaussian width parameterwould'nt depend on the mass number. As the consequence, the empirical Zp -values significantly scatted around the calculated trend as shown in Fig. 3.1.It seems to be one of possible sources of the scatter that the constant valueof Gaussian width parameter has been used. Therefore as the next attempt theGaussian width parameter^depending on the mass number are obtained from thesame measured fractional yields [3 ] using the most probable charge Z obtain-ed in Section 3.2. Such an attempt was done by Chouch [4 ] but in our casethe emphasis has been placed on th^derivation of son* systematics from thoseo-values. .;•?.
- 220
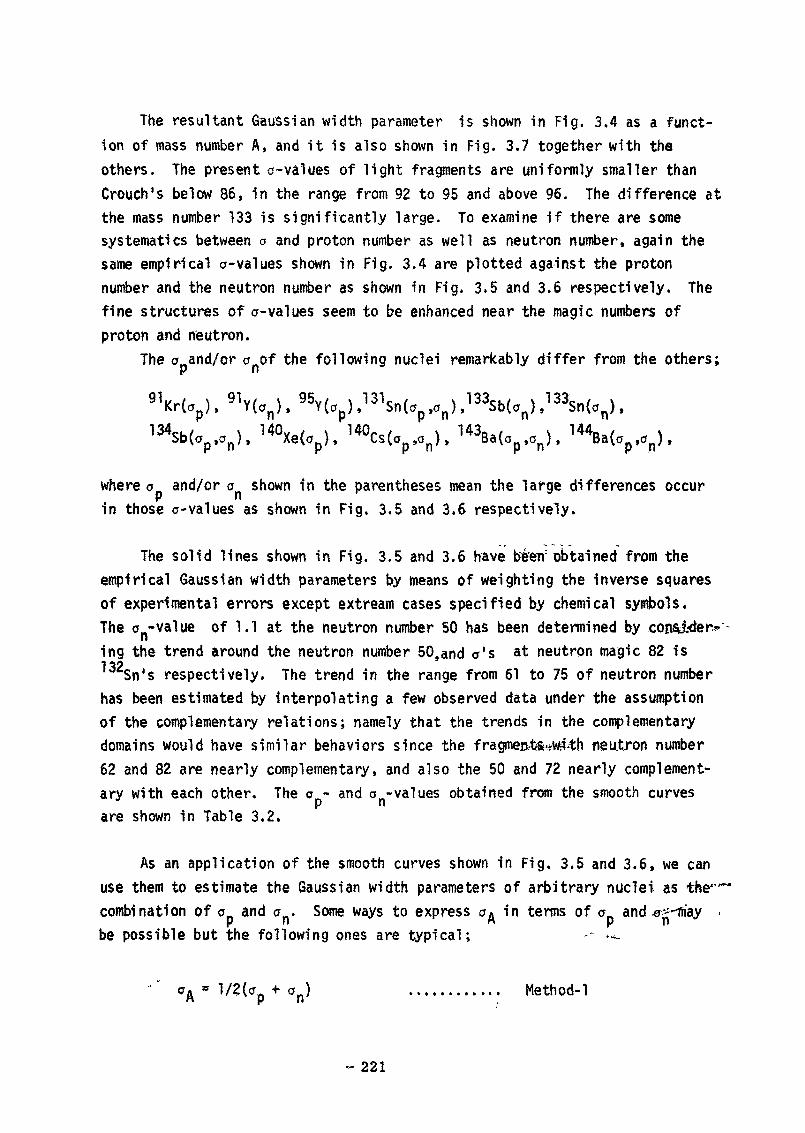
The resultant Gaussian width parameter Is shown in Fig. 3.4 as a funct-ion of mass number A, and it is also shown in Fig. 3.7 together with theothers. The present o-values of l ight fragments are uniformly smaller thanCrouch's below 86, 1n the range from 92 to 95 and above 96. The difference atthe mass number 133 is s ignif icantly large. To examine if there are somesystematics between o and proton number as well as neutron number, again thesame empirical cr-values shown in Fig. 3.4 are plotted against the protonnumber and the neutron number as shown in Fig. 3.5 and 3.6 respectively. Thefine structures of o-values seem to be enhanced near the magic numbers ofproton and neutron.
The o and/or a of the following nuclei remarkably differ from the others;
91Kr(0p), 9 1Y(an), 95Y(ap) ,131Sn(<rptcn) ,133Sb(an) ,133Sn(an).134Sb(Von>, 140Xe(op), 140Cs(op,cnK 143Ba(cp,on), 144Ba(op,on).
where o and/or a shown in the parentheses mean the large differences occurin those 0-values as shown in Fig, 3.5 and 3.6 respectively.
The solid lines shown in Fig. 3.5 and 3.6 have b'e'err obtained from theempirical Gaussian width parameters by means of weighting the inverse squaresof experimental errors except extream cases specified by chemical symbols.The o - value of 1.1 at the neutron number 50 has been determined by consider*-'ing the trend around the neutron number 50,and a's at neutron magic 82 isT?2Sn's respectively. The trend in the range from 61 to 75 of neutron numberhas been estimated by Interpolating a few observed data under the assumptionof the complementary relations; namely that the trends in the complementarydomains would have s imi lar behaviors since the fragmer>..t&-fW-tah neutron number62 and 82 are nearly complementary, and also the 50 and 72 nearly complement-ary with each other, The o - and o-values obtained from the smooth curvesare shown in Table 3.2.
As an application of the smooth curves shown in Fig. 3.5 and 3.6, we canuse them to estimate the Gaussian width parameters of arbitrary nuclei ascombination of o and a . Some ways to express a. in terms of a and e-'be possible but the following ones are typical; -- —.
l/2(crp + on) ............ Method-1
- 221

Method-2p * n ............
2o_0nEJ2 —— ............ Method-3
where p and n mean the proton (atomic) number and neutron number respective-ly. The method-1 is the simple average of <j - and <r -values. This is themost suitable procedure because the o - and cr -values are essentially the sameGaussian width parameters as the original ofl before separation to an and <r .H p nTherefore the method-1 is recommended for the comparison of present work withothers like Crouch's. However, when we wish to extend such a method to predictthe unknown Gaussian width parameters, we have to establish some appropriateextrapolation methods such as method-2 or -3. Method-2 is the weighted meanof o -and o -values but it has no physical significance. Method-3 is the"equivalent" Gaussian width parameter a. when the Gaussian charge dispersionP(Z) is the product of two independent Gaussian charge dispersions in terms ofthe width parameters cr and a respectively. The overall comparison betweenCrouch's and our's is shown in Fig,
3.3.2 SIMULTANOUS FITTING OF Z AND o
In section 3.3.1, the Z -values have been obtained from the observed fract-ional yields using the assumed Gaussian width parameters. On the other hand,tfc* Catusian width parameter can be contrarily obtained from the same observedfractional yields even when the Z -values are given, In both cases, the experi-mental errors of yields are drawn in either of two variables Z or o. There-fore, we have attempted to fit Z and <j to the observed fractional yields simul-tanously,and the emphasis in this section has been placed on the examinationof the validity of the mass number dependence of Z and <r.
Let us assume that b^oth Z and a depend only on the mass number A, andalso that the fractional yields can be estimated by eq.(3.2) and (3.3). Ifthese assumptions were val id , there should be a pair of Z and o-values whichcould simultanously satisfy the observed fractional yields of all isotopes withthe 9«me mass number A.
Treads as functions of Z -values are shown in Fig. 3. 7. as a part of wholeZ -o correlation «ap , The intersecting point of a few correlation curves shownby the solid lines is just the point which satisfy the assumption..
We have searched for these intersectiong points on the Z -o plane(Fig. 3.8)obtained from the observed fractional yields of 235U(nth,f) compiled by W a h l [ 3 ]
- 222 -

The results are shown in Table 3.3. There are some Isotopes whose correlationcurves do'nt intersect with any. The case for mass number 141 is the onlycase whose three correlation curves of Xe, La and Cs intersect witheach,other, and the remainders are of two-crossing cases. Three correlationcurves for ^Xe, 141la and 141Cs Intersect with each other at the point ofZ =54.85 and 0=0.85.P
The Gaussian width parameters obtained in this section (Z -a fitting) areshown by square (C3) in Fig. 3.7 in comparison with the others. Discrepanciesbetween the present results and the preceding ones obtained by use of calcula-ted Z -values based on the Garvey's mass table are remarkably large near massmimbers 84, 134, 136 and 139. Z and o-values of mass number 84 significantlydevute from the average values; Z -Z =0.44 and ^=0.60. It seems due to thesmall fractional yields of 84As as pointed out by Wahl [3].
In order to examine the overall reliabilities of observed fractional yie-lds from the viewpoint of satisfactory fit in three different procedures usedin this section, major fission products largely differed from the others areshown in Table 3.5. As it is clear from this Table, these fission productsshow more than two unsatisfactory fittings in most cases. Total number of que-tion-marks shown in the last column wi l l be a measure of discrepancies in thefitting.
4. CONCLUDING REMARKS(1) The mo«t stable charge Z^ has been obtained 'from Garvey's mass table [1]and compared with Fiedler and Herrmann's. Both Zv's agree within 0.3 chargeunit on the ovarall range of mass number but the -present result in the devia-tion (ZA-0,4C!\) has non-linearity and "stair-like* fine structure on the massnumber from S 2 to 114, where Fiedler and Herrmann's linearly decreases. Thisstair-like beiavior as mass number seems to be dufe to the mass relations usedby Garvey.
(2) The most }:*obable charge Z based on the EOD postulate has been estimatedfrom the ZA-val ^s and compared with the empirical values obtained from theWahl 's compi-lati 1 [3] using the constant Gaussian width parameter. The -cal-culated Z trend, (Z -zj; ) vs A, has a relatively deeper valley around massP P Pnumber 122. As shun in Fig. 3, l s the existence of it is consistent with Pd123Sn and 125Sn but "neons is tent with 112Ag, 12%b and 127Sb. To establish the
223

existence , the more availabil i ty of experimental data is extensively required.The investigation on the dependencies of empirical Z -values on the cons-
tant Gaussian width parameter a has been made since the empirical Z -valuesscatter around the calculated values. However, the scatter of Z-values washardly improved, and consequently it suggested that the constancy of Gaussianwidth parameter for overall mass number might be inval id . If the even-oddeffect is taken into account for the distribution function, the scatter may beimproved 06 ] since the present one has no even-odd effect.
(3) Gaussian width parameter a depending on mass number has been obtained— ' •from the same observed fractional yields using the calculated Z -values'andcompared with Crouch's [4]. The present result is generally smaller thanCrouch's below mass number 88 and from 92 to 95 for light fragments, but great-er than Crouch's for overall heavy fragments with four exceptions; mass-numbers134, 139, 140 and 144.
', "(4) ,ln order to investigate the fine structure and systematics of the Gaussianwidth parameters obtained from the observed fractional yields [3]» the Gauss-ian width parameters have been separated into two terms depending on proton(atomic) number p and neutron number n respectively. The shell effects isenhanced in these term-presentations and the systematics becomes more clear.Two components as smooth curves a vs p and a vs n have been evaluated by meansof inverse-square weighting and by assuming the complementary relations. TheGaussian width parameters for unobserved nuclei , especially nuclei in /the sym-metric fission region, can be estimated by using these two curves. As an att-empt for predicting the Gaussian width parameters depending on mass number,simple average method 0.= l/2(g +c } has been used and the resultant a. has
n p n nbeen compared with Crouch's and the others obtained in this paper.
(5) Z -a correlation curves, which satisfy .the observed fractional yields,have been prepared in order to examine the validity of mass number dependenciesof the most probable charge Z and Gaussian width parameter <j. If Z and oare functions of only mass number A, there should be a pair of Z and o whichcan simultaneously satisfy the observed fractional yields of all isotopes withmass rnu^er A. The case for mass number 141 was only one whose three correla-tion curves of 141Xe, 14\a and U1Cs intersected with each other at the point(Z =54.84, 0=0.58), and the remainders 28 cases were of two-crossing cases.Some cases such as mass numbers 91, 95, 97, 132, 133, 134, 139 and 143 gave
- 224 -

several different points (Z ,a), for instance, (1*52.59,a =0,41), (Z =53.59,a =1.35) and (Z =51,70,a =0.59) for 134Cs, 134S5 and 134I, and (Z =54.55,o -0.53) and (Z -54.35,a =0,85) for 139Cs, 139Ba and 139Xe respectively. Thisresult shows that the Z and a may be not the single variable functions ofmass number, i.e. it is one of possible cases that they are functions of prot-on (atomic) number and neutron number and consequently of mass number. Furth-er investigations, however, is seriously required since the present Gaussiandistribution function excludes the even-odd effect, and also more carefulevaluation of experimental data themselves should be made.
ACKNOWLEDGMENTThe auther wish to thank Dr's M. Yamamoto, S. lijima and S/tgarashi for
their advices and encouragements as members of JNDC (Japan Nuclear Data Commi-ttee), and also acknowledge Miss M. Inai for her help in the CRC computation.
,v
225 -
REFERENCE[I] Garvey.G.T., et al.t Rev. Mod. Phys., 41_ (1969) 4, Part II.[2] Pappas, A.C., Massachusetts Institute of Technology, Laboratory of
Nuclear Science Technical Report No. 63, (1953)
[3] Wahl, A.C., Norris, A.E., Rouse, R.A., and William, J.C., Second IAEA
Symposium on Physics and Chemistry of Fission, Vienna (1969), IAEA-
SM-122/116
[4] Crouch, E .A.C . , AERE-R6056 (1969)
[5] To be published.
[6] Denshlag, H.O.,et al . , Second IAEA symposium on Physics and Chemistry
of Fission, Vienna (1969), IAEA-SM-122/26.
[7] Kummel,H,, Mattauch, J . H . E . , Thiele, W . and Wapstra, A . M . , Springer-
Verlag, Wien-New York,(1964).
[8] "Weizsacker-Brthe liquid-drop model", Weizsacker, C.F. von, Z. Physik,
96 (1935) 431.
[9] Myers, W.D. and Swiatecki, W . J . , " Nuclear Masses and Deformations",
N.P . 81 (1966).
[10] Fiedler, J. and Hermann, 6., Z. Naturforsh. , 18a (1963), 553.
[II] Konig, L .A. , KUmmel, H . , Thiele, W. and Wapstra, A . , AERE-M-1078,
P. 35-36, (1962), unpublished,
[12] W a h l , A . E . , etal., Phys. Rev. Jj26_ (1962) 1112.
.. . 1] Amiel, S. and Feldstein, H . » Rochester Conference (1973),
[Hj Musgrove, A .R . de., IAEA Panel on Fission Product Nuclear Data,
Bologna, Nov., (1973)
[15] Ptppas, A.C. and Alstad, J., Second IAEA Symposium on Physics andChemistry of Fission, Vienna (1969), IAEA-SM-122/206, Review Paper.
[16] Rider, B .F . , private communication.
226 -

Table 3.1 Comparison of Evaluated Most Probable Charge ZMass No.
A
77788082838486878990919293949596979899102103105106112115117121123125125126127128129130
Evaluated Z -values
Ours
3031313232333334353536363737383839394041414242444546474848484849494950
.71
.11
.87
.51
.81
.15
.83
.28
.22
.70
.21
.72
.26
.79
.33
.84
.24
.62
.01
.01
.32
.02
.41
.85
.76
.24
.42
.06
.40
.69
.94
.21
.53
.87
.22
Crouch[4]
30.3130.7031.4832.2632.7133.1534.0334.4635.37 "35.8536.3236.8637.3837,9638.4438.8239.1839.5039.8440.9341.2141.8842.2144.7146.2047.0448.2448.7549.0449.2949.5149.7349.9450.1850,44
Mean and St7
Wahl *-p[ 3]
30.7131313233333434353636363737383838393940414142444546474848484949495050
.12
.94
.75
.16
.57
.40
.82
.66
.06
.46
.86
.27
.67
.08
.47
.87
.26,65.75.11.88.29.70.66.34.60.27.84.71.01.32.66,02.39
3030313232333434353536363737383839393940414142444546474848484949495050
,58±0.98±0.76±0,51±0.89±0,29±0.09+0.52±0,42±0.87±0.33±0,81±0,30±0,81±0.28±0.71±0.10±0.46±0.83±0.90±0,21±0.93±0.30±0.75±0.87±0.54±0.75±0.36±0.62±0.90±0.15±0.42±0,71±0.02±0.35±0
.19
.20
.20
.20
.19
.20
.24
.22
.18
.15
.10
.07
.05
.12
.15
.17
.16
.15
.15
.11
.09
.07
.08
.07
.23
.36
.35
.29
.29
.28
.25
.22
.17
.13
.09
id.
Ours
1 .00441.00421 .00351.00000.99760.99580.99240.99300.99440.99500.99700.99950.99880,99961.00121.00331.00371.00411.00441 .00281.00271.00221 .00261.0C220.9S950.99360.99300.993S0.99540.99580.99570.99580.99640.99690.9974
Zp(X)/Ip
Crouch
0.99130.99100.99120.99230.99450.99580.99820.99830.99860.99900.99971.00131.00211,00411.004)1.00281.00211.00101.00021.00081 .00000.99890.99790.99901.00711,01071.01021.00811 .00861.00801,00731.00631.00461,00311,0018
Wahl
1.00431.00451 .00571.0074 .1 .00821.00841 .00911 .00871 .00681 .00501 .00361.00140.99510.99640.99470.99340.99420.99490.99540.99640.99760.99890.99980.99880.99530.99570.99680.99810.99600.99620.99710.99800.99900.99991 .0008
227

Table 3.7 (continued)
Mass No
A
131132133134135136138139140141 '142143144146147150 A
160
Evaluated Z -valuesPOurs
50.605s, 9651.3451.7752.2052.60':;
53.4954.0254.5555.09'55,6056.1256.5957.5358.0159.0961.67
Crouch[4 ]
50.7551.0951,5251.9352.34
'52.7053.1053,8854.4054,9155.4655.9556.4557.3957.8359.1363.62
Mean and Std. - (XVI
Wahl TC3] P
50.51.51.52.52.52.53,54.54.54.55.55.
802165125698791959993978
56.1857.0057.4658,7062.47
50.51,51.
L- 51,52.52.53.54.54.55.55.55.
72±009±050±094±037±076±046±003±051±000±048±095±0
56.41±057.3UO57, 77±058.97+062.59±0
.08
.10
.13
.14
.15
.16
.28
.13
.08
.07
.09
.14
.17
.22,23.19.80
00000010111111110
Ours
.9977
.9975
.9968
.9967
.9967
.9970
.0006,9998.0007,0017.0021.0030.0033.0039.0042.0019.9853
Crouch
1.00071 ;00001.00030.99980.99950.999890.99330,99720.99790.99840.99961.00001,00081.00151,00111.00271.0165
Wahl
1,00161 ,00241.00281 .00351.00371,00421,00621,00301.00140.99990.99830.99700.99600.99460,99470.99540.9981
228
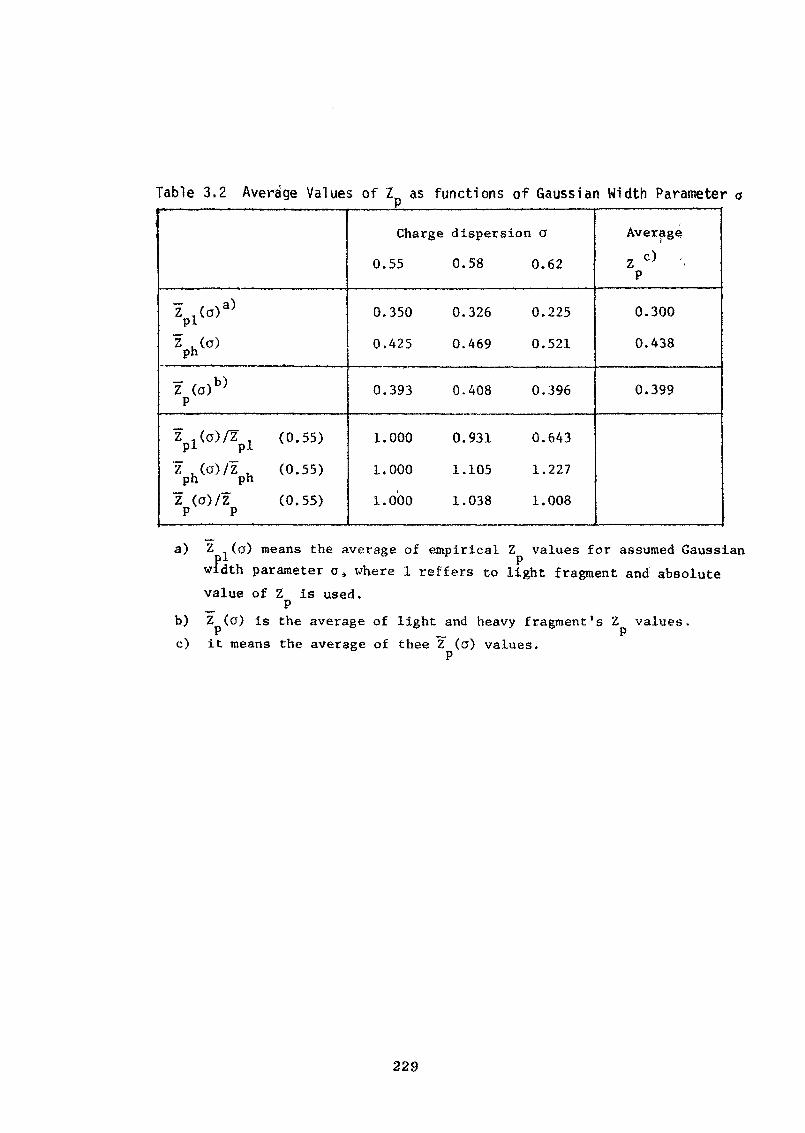
Table 3.2 Average Values of Z as functions of Gaussian Width Parameter a
Zpl(a)a)
ph °
P
"z ,(a)/Z (0.55)
Z (0)/Z . (0.55)ph ph"Z (a)/Z (0.55)P P
Charge
0.55
0.350
0.425
0.393
1.000
1.000
1 . 000
dispersion
0.58
0.326
0.469
0.408
0.931
1.105
1.038
a
0.62
0.225
0.521
0.396
0.643
1.227
1.008
Average
Z c^P
0.300
0.438
0.399
a) Z (a) means the average of empirical Z values for assumed Gaussianwidth parameter a} where 1 reffers to light fragment and absolutevalue of Z is used,_ P
b) Z (a) is the average of light and heavy fragment's 2 values.c) it means the average of thee ~Z (a) values.
P
229

Table 3.3 Gaussian Width Parameters o and a asn pFunctions of Neutron and Proton Numbers respectively*n
4546474849505152535455565758596061626364656667
o;
00000100000000000000000
#
.60
.58
.57
.59
.64
.10
.94
.77
.67
.60
.53
.46
.41
.50
.61
.69
.71
.69
.63
.53
.44
.44
.48
n
6869707172737475767778798081828384858687888990
C
0
0
000000000000100000000
n
.54,60.60.54.47.45.55.74.83.65.64.59.58.62.12.76.65.60.64.70.70.68.68
P
3031323334353637383940414243444546474849505152
o
000000000000000000100
p
.60
.58
.57
.58
.62
.65
.64
.58
.45
.43
.45
.56
.66
.68
.58
.43
.46
.70
.40
.80
.71
P
53545556575859606162636465
a
0000000000000
P
.66
.70
.62
.58
.57
.56
.55
.54
.53
.525
.52
.51
.50
* n and p mean the neutron and proton numbers respectively.# an and o mean the Gaussian width parameters as a function
of neutron number and as a function of proton number respect-ively.
230

Table 3.4 Comparison of Zn and a values obtained by different procedures,
Mass No.A (
84899091
92939495
9697
131132
133
134
139
140141142143
144
————————— rG.W. Pra^ Most
Zp-o fit)
0.470.760.742.00.680.580.560.520.510.610.520.620.540.710.660.610.431.080.411.350.590.530.850.540.580.490.600.520.67
Cals>
33.1535.2235.7036.21
36.7237.2637.7938.33
38.8439,24
50.6050.96
51.34
51.77
54.02
54.5555.0955.6056.12
54.50
Probable Charge(Vo
33.8335.2535.8034.1036.9036.7537.3037,6038.0038.3038.539.1538.8050.4050,9550.8552.2053.3052.5953.9251.7054.5554.3554.9054.8555.0855.9055.5556.60
fit) o=0. 62f!
32.6335.4435.8136.7336,7136.7237.2837.6938.1338.1036.7137.0438.9250.7251.0050.9249.6549.9151.9852,2151,5254.0854,0154.4954.8855.3355.9555,8854.94
AZp(x)/Z
ftp-o fit)
2.00.900.3
-6.22.10.80.2
-0.6-0.8-0.1-0.9-0.2-1.1-0,40.0
-0.21,7
-3.81.64.2
-0.11,0
-0.60.6
-0,4-0.9-0.4-1.03.9
calP («)o=0.62
-1.70.60.31.51.50.00.1
-0.3-0.5-0.6-5.5-5.6-0.80.00.0
-0.1-3,3-2.80.40.9
-0.50.00.00.0
-0,4-0.5-0,3-0.40.8 '
Crossing1'
(Rb.As)(Kr,Rb)(Rb,Y),Kr(Sr,Y),Kr,RbSr,(Y,Kr),Rb(Y,Kr),Rb(Y.Kr).Rb(Y.Kr).Rb(Zr,Kr),Rb,YZr f(Kr,Rb),Y(Rb,Nb)(Rb,Kr),NbRb,(Kr,Nb)(I,Te),Sn(Ce,Te),ICs,(Te,I)(Xe,Sb),I,SnXe,(Sn,I),Sb(Cs,Sb),ICs,(Sb,I)(I,Cs),Sb(Cs.BaJ.XeCs,(Ba,Xe)(Ba.La) ,Xe,Cs(Xe,La,Cs),Ce,Ba(La>Xe)(Ce.Xe).BaCe»(Xe,Ba)(Cs,Xe),Ba
*) Gaussian width parameter 0 was derived from two variable,Z and a,fitting.S) The most probable charge Z was obtained from the Garvey's mass table.t) The most probable charge Z was derived from the observed fractional yields
assuming the Gaussian width parameter o=0,62.f) Fission products whose correlation curves in the two variable fitting inter-
sect with each other are shown in the parentheses.
231

Table 3.5 Major Fission Products largely differed from the others in threedifferent fitting procedures^' > '•
P.P. Z -fitting(b) a-fitting(c) • , fitting (d)
141Cs(f)
142La
143Ba
144
AZp/Zpcal Crossing
(%}
91KrY ?
95y
131Sn ?
133Sb ?Sn ?
134Sb ?
UOXe
?(e) 2.0? -6.2 ?? 0.68 2.1 ?
? 0.51 -0.8 ?
? ? 0.71? -0.4
? 0.43? 1.7 ?? 1.08? -3.8 ?
? ? 0.41? 1.6 ?
? 0.54 0.6 ?
(Sr,Y),Kr,RbSr,(Y,Kr),Rb
(Zr,Kr),Rb,Y
(IJe),Sn
(Xe,Sb),I,SnXe,(Sn,I),Sb
(Cs,Sb),I
(Ba,La),Xe,Cs
3?3?
2?
4?
4?3?
5?
2?
Ba
0.58 -0.4' (Xe,La,Cs),Ce,Ba
0.49? -0.9 ? (La.Xe) 2?
0.60 -0.4 (Ce,Xe),Baft. 3?
0.52 -1.0 ? Ce,(Xe,Ba) ' 4?
(a) Fission products which showed larger scatters in these fitting procedures.This table is prepared in order to check the overall discrepancies among threedifferent procedures.
(b) Z -values obtained from the observed fractional yields assuming o=0.62.(c) The mass number dependent Gaussian width parameter OA are decomposed to the
proton (atomic) number dependent term o and neutron number dependent term a^.(d) Z and o are obtained by simultaneously fitting. Some fission products whose
correlation curves intersect with each other are shown in the parentheses.(e) "?" means that the isotope shows the lamer deviation from 'the others in this
fitting procedure.(f) This is an example of the best case.
232

10W00
60
N
50co
40 _ _ _ _ _ _ _ _ _ > 1 JVi>»__ J*~-i*- — — — — _ — — — — — _ __.__ __ __ __ ——.__ — _ __ _ _ — _ -
\ stable nuclidethe most stable nuclide
50 60 70Neutron number N
80
Fig. 2.1 The observed stable nuclei and the calculated most stable nuclei. The solid line shows the trend ofthe most stable nuclei derived from the mass table compiled by Garvey et al [1] and the closed circles on thestraight lines show the observed stable nuclei with mass number A. Classes shown by the dotted lines mean theLevy's shell classes, where co-classes for complementary fragments are excluded.

toCO
4.0
3.0
2.0
1.0
80 90 100 110 120 130 140Mass number A
150 160
Fig. 2.2 The most stable charge ZA as a function of mass number A. Two theoretical curves are shown for comp-arison. The solid curve is ours derived from Garvey's mass table [1] which is essentially the same as theresult shown in Fig. 2.1 and the dotted l ine is the result obtained by Fiedler and Hermann [10].
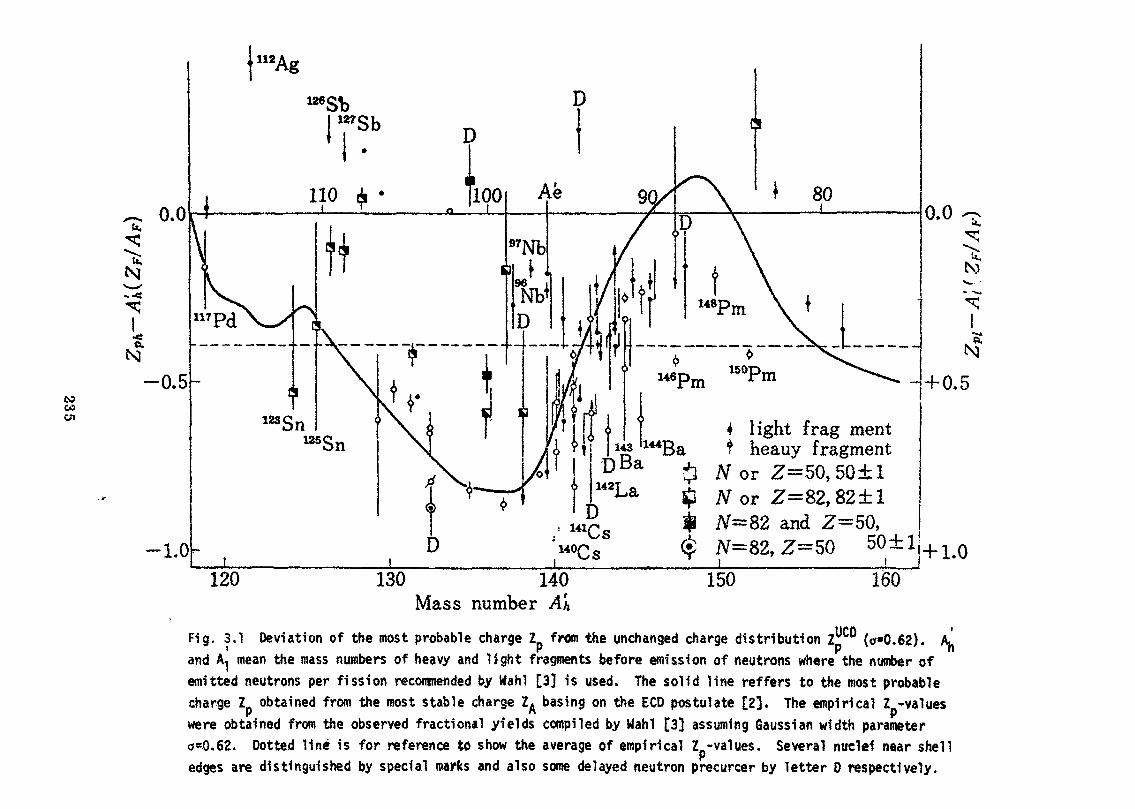
CO00en
110 i -
© N=82, Z=50 1+1.0130 140
Mass number Ah160
,UCD (a»0.62).Deviation of the most probable charge I from the unchanged charge distribution lmean the mass numbers of heavy and Tight fragments before emission of neutrons where the number of
Fig. 3,1andemitted neutrons per fission recommended by Wahl [3] is used. The solid line reffers to the most probablecharge ln obtained from the most stable charge Z4 basing on the ECD postulate [2]. The empirical I -values
P M P
were obtained from the observed fractional yields compiled by Wahl [3] assuming Gaussian width parametero*Q.62. Dotted line is for reference to show the average of empirical Z -values. Several nuclei near shelledges are distinguished by special marks and also some delayed neutron precurcer by letter 0 respectively.
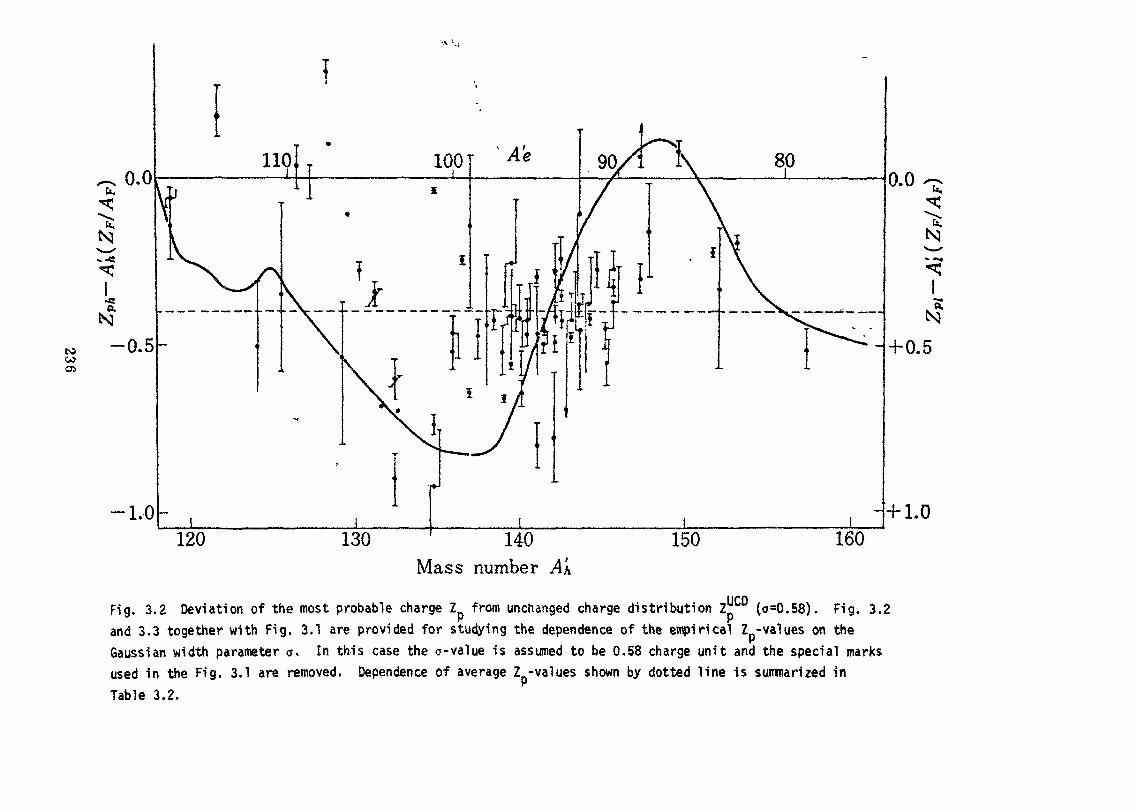
to -0.5- -+0.5
+ 1.0120 130 140
Mass number Ah150 160
Fig. 3.2 Deviation of the most probable charge Z from unchanged charge distribution ZUCD (c»0.58). Fig. 3.2and 3.3 together with Fig. 3.1 are provided for studying the dependence of the empirical Z -values on theGaussian width parameter a. In this case the a-value is assumed to be 0.58 charge unit and the special marksused in the Fig. 3.1 are removed. Dependence of average Z -values shown by dotted line is summarized inTable 3.2.

00-3 -0.5- -+0.5
- + 1.0120 130 140
Mass number150 160
Fig. 3,3 Deviation of the most probable charge Z from the unchanged charge distribution ZJJ00 (a»0.55). Thisis provided for studying the dependence of empirical Z -values on the Gaussian width parameter o in relationto the preceeding two figuresthe same as Fig. 3.2.
In this case the o value is assumed to be 0.55. The other discriptions are

COCO
.1.5ot-
1 1.013
1 0.5<o«J
0.0
-
^ •
J™
<« *',
<
•r i
i1 1 180 90 100
i . - •r
I110
lf
1
t
\* +
>
<
•
I •>
f $f ' , ti j
I+ • *
i i i i120 130 140 150 160
Mass number .4
Fig,- 3.4 Gaussian width parameter a as a function of mass number A. Gaussian width parameter are derived fromthe observed fractional y*o1<is compiled by Wahl [3] using the estimated most probable charge Z shown by thesolid line in Fig. 3.1. These semi-empirical ^-values are also shown in Fig, 3.7 for comparison with Crouch's[43-

*35U(Nth,/)
40 50Proton number Z
60
F1g. 3.5 Gaussian width parameter as a function of proton number Z. Semi-empiricalGaussian width parameter o. as a function of mass number A is plotted against theproton number Z. Solid line refers to the weighted mean of semi-empiHcal a -valuesexcluding the extream cases specified by chemical symbol with mass number andUtotnicnumber-
The magnitudes of Gaussian width parameters o's are shown in Table 3.3 togetheryith o's, a*4 the Gattssian width parameter <?fl depending on the mass number A obtain-
I* f\ed by a cpmbuiation of o2 and a^ is shown in Fig. 3.7.
239 ^

s 0.5
0.0 50 60 70Neutron number N
Fig. 3.6 -iGaussian wid^h'parameter a^, as a function of neutron number N. Semi-empirical Gaussian width parameter asa function of mass,..pumper A are plotted against the neutron number N. Solid line refers to the weighted mean of sem-semi-empirical rf^-vslues excluding the extream cases specified by chemical symbols with mass number and atomic number.
The magnitudes of Gaussian width parameters a^'s are shown in Table 3.3 together with o, and o..

to
1.0
<°-9o
s§ °-8
11 0.7g15 0.6
0.5
0.4
't
o
/i nA flM• \/ s \ U" wJ!i\ '/ M- : \ A iM! \ / >xx cf i n «>i j /* \» \•• * f t * i ^o ty i '^/
O 1D •^*^ itsi^
\ \'0 80 90
11
c
inI MC 1
1
ft J
1 f '• vn « ' !
f >W0 T ^« ? , IB,^ '1 A« l*^Jrtf^ 1 19 jc <r_x '< ,
£' »L« c |oJP 1 B 'ui • i(:u ic"* / ijtA o 134 C! Vh \•. * . V tj« vD/1™^™"™"'
i ' i i i100 110 120 130
7*""(»'Ba, u*Xe)
o L*- 'A1 1 tjX \ In UuKW»
;:%-|vM V
/ i 1 \ n \\r 1 1 • " \\
kl \11 » <
1 1\ I
L_L(1MCstmBa)i i
140 150Mass number A
Fig. 3.7 Gaussian width parameter a vs A. Four Gaussian width parameters obtained from the same observed fractionalyields [3] by different procedures are compared with each other; o : by fitting Gaussian width parameter to the observedfractional yields using the calculated Z -values obtained from Garvey's mass table [1], g : by f i t t ing two variables(j and Z to the same fractional yields, x/. by combining o^ with a^, oA=l/2{oz + O, • : the recommendation by CrouchC4].

4.0
J_0.
•o•»—
s
33 34 35 36Mast prabable charge Zf
37 38
F1g. 3.8 Correlation between Z and o. This 1s a part of whole Z -a corre-V*fi^ ^lation map, and the reference Z denoted by 2' shown on the upper corner
means the calculated most probable charge shown by the solid line in Fig. 3.1.Solid lines mean the correlation curves on which the observed fractionalindependent and/or cumulative yields compiled by Wahl [3] are theoreticallypredicted by using these ! and a values for equ.(3.2) and (3.3). Larger opencircles refer to the locations of the point (Z ,o) where more than two observ-ed yields are simultanously satisfied.
The location of the point (Z .o) mentioned above is summarized in Table3.4 in comparison with tN others.
242

Contributions toReview Paper No. lib

YIELDS IN PAST NICUT2DF FI3SI01T OP1 U-238 AND Th-232
M. Lammer
Nuclear Data Section, Division of .-.iesearch A Labs.»International Atomic Jtoergy Agency,, Vienna, Austria
(llevitsed)
Abstract; A critical discussion of the status of yields in fast neutronfission of U-238 and Th-232 is presented. After a "brief survey of rele-vant measurements of these yield data and a discussion of the dependenceon the neutron ener -y spectrum the experimental data are criticallycompared and tiie uncertainties assessed. Existing evaluations are dis-cussed. rLecommendationG are jiven for suitable measurement techniquesand further measurements and evaluation work required. Th-232 fissionyields are re-evaluated.
1.
In the case of fast neutron fission yield data for Th-232 and U-238there are as many different sets of recommended data as there areevaluations. This in due to difficulties in evaluation methods employedand preferences for certain measurements, as outlined in detail in anearlier publication [Lam 73]. Therefore this paper starts wifai a 'dis-cussion of the publications of experimental data used in the evaluationsin order to enable a critical comparison of available yield data. Thiswill allow us to detect discrepancies and recommend further experimentalwork required. Th-232 yields are re-evaluated for the Panel and referredto as '"'present evaluation-- in chapter 3.
2. U-238 PAST 1MJT1UM FISSIOH YIELDS
2.1. gxpe.riments
Different methods for fission yield measurements have been discussedin derail in [Lam 73], particularly in the light of the possibilities theevaluates: has to check and correct the original experimental data. In thiscontext it should be borne in mind that radiochemical measurements cannotbe corrected by an evaluator, if the decay data used in the original workare out of date. The only possibility is to check the .nuclear data used.
2.1.1, I'athews and Tomlinson fj>lat 721
The authors report results on niass-opectrometric measurements ofyields in tho heavy mass peak. Information on experimental details in-cluded' in the publication is sufficient to allow a check of the correctionsapplied.
245

Tlie 3$ contribution of Pu-239 fission should "be taken into account incases where differences in fission yield ratios between U-238 and Pu-239fast fission approach or exceed 10$. So, for example, was the measuredyield ratio Os-137/ITd-145 = 1.385, whereas the same ratio for Pu-239 fastfission is about 2.2, or 1.6 tiroes the measured ratio (using chain yieldsfor Pu-239 fast fission as recommended by Grouch [Cro 73]. Thus a 3$contribution of Pu~239 fission (50 days irradiation) would result in a2% increase in the above ratio. For a 30 day irradiation the increase isstill about 1$. . Such corrections should not be neglected for relativeyields.
It is not clear whether 1-133 has been considered for correcting themeasured Xe-133 abundance for decay, which would be important for samplesE and P. The change of the Xe-133 half-life from 5.27 days (at the time ofthe (juoted half-life measurement, Xe-133ro wac not known and therefore thevalue is in error) to 5.29 ± 0.01 days [Ude. 73] causes only little changesof the decay corrections (about 0.3$ and 0.5$ for samples E and P, respec-tively). The constancy of the C0~133/Cs-137 ratio does not prove theabsence of contamination, if the samples are prepared from the samematerial. As all values are within the quoted standard deviations it canbe concluded that the chemical procedures and mass spectrometric analysis,as performed at different times, did not introduce noticeable contamination.
Other decay corrections introduce negligible uncertainties (Ba-140,Ce-144).
In the case of Ba, Ce and 9m reliable correction for .contamination isnot possible and therefore contamination may cause serious problems. Fur-ther measurements are required for clarification (see Section 2.3« below).
2.1.2. Other mass-spectrometric measurements
Rider et al. [Rid 67]; Nothing is said about irradiation conditions,'1purity of U-238 (including fissions), contamination corrections for Nd iso-topes or gammaspectrometric measurements of Ca-137« Only relative yieldsare given,
Wanlesff and Thode [Wan 55] measured relative yields of stable Xe and Krisotopes, including Kr-85« lib information on the decay correction forKr-85 is given.
Itobin, et al. [Hob 71] measured relative yields of M isotopes and theabsolute yield of IJd-148. Details of the data analysio and correctionsapplied can be checked.
2.1«3« Gamma-spectrometric measurements of Larsen et al. [Lar 72, Lar 74]
Absolute yields of strong y-emitters among fission products withhalf-lives from 1 - 100 days were measured using a Ge(Li) detector.
The preliminary publication [Lar 72] contains little information onthe work. Most of the details oan be found in the recent publication[Lar 74j» Half-lives and y-Tay data used can be checked, but decay correc-tions by the evaluater are not possible.
[Lar 74] contains the average of 2 measurements, including the onepublished in [Lar 72], However, the earlier recruits [Lar 72] for Zr-97and 1-131 appear to be superseded by a later analysis of the data, theTe-132 does not appear in [Lar 74]• Therefroe these earlier results areshown in brackets in Table I for comparison.
246
2*1 • 4* Ratio measurements
Eunney et al. [Bun 58] measured Il-values (see [Lam 73] and others for thistechnique) I
Ciuffolotti [Ciu 68] and Bie£oiSJSi_aU. [Die 71] measured the Ba-140 yieldrelative to U-235 thermal fission with a ITal detector, thus avoiding errorsdue to detector calibration and Y~ray branching. It might be worth notingthat in [Die 71] the U-235 reference yield uaa obtained from a Cd-shieldedsample. This might be a potential source of error since the thermalfission yield value is used. However, so far no significant differencehas been found between mans peak yields in thermal and epicadmium fission.Even the difference between thermal and fast fission yield is less than2.5$ [Lie 70, Lar 7 A],
2,1,5. iladiochemical measurements
Qujiinghame et al. [Gun 72] quote all errors involved in their measurementsseparately, but do not give information on the decay data used. Althoughno check is possible, they should be more up-to-date than those used inearlier measurements,
decay data used in the earlier measurements [Sng 51 » Kel 54? Bon 60,Pet 603 are out of date, but no correction is possible. Corrections forwrong half-lives can be applied for long-lived fission products (Sr-90,Cs-137) if it can be assumed that the original decay correction introducednegligible error and thus the total half-life error appears in the de-duction of the fission yield from the measured activity,
Other measurements are not considered here.
2.2,1. Pisnion cross-section of U-238
Since the fission cross section of U-238 is0,001 b below 600 KeV0,02 b at 1 I'eV0.3-0.6 b from 1.5-2 i-TeV euid above;,
the neutron spectrum above 1,5 Me/ is significant if any changes in fissionyield due to neutron spectrum occur. Differences in fast neutron spectrabelow 1 He1/ can bo neglected. I lore important than changes of fiscion yieldwith discrete neutron energy values would bo studies of yield variationwith neutron spectrum above 1»5~2 I'leV. Eorisova et al. (Yad.i^iz. 6_ (1967)454) measured yields of Ba-140, Jd-115, Ag-111 and Ac-77 relative to" theyield of Flo-99 at 1.5, 2, 3, 3.9, 4 8, 13, 15, 16.4 and 17.7 KeV. ISieyield ratio Ko~99/Do,-140 is 1.03 at 1.5 KeV and varies slightly around1.20 from 3 to 17.7 MeV. The ratio of'cd-115, As-Ill and As-77 yields tothat of Ho-99 increase rapidly from 1.5 to 13 HeV by a factor of 100 forCd-115 and remain fairly constant above 3,5 MeY.
From these results it can be concluded that yields in the peakregions of the mass yield curve can be evaluated with some confidence fordifferent fast reactor spectra. For yields in the valley region and at thewings of the peaks an evaluation of best values for all reactor spectrais presently not possible, r unless a large uncertainty is allowed for, orthe high energy tails of fast reactor noxitron spectra are similar.
247-

2,2.2. IJeutron fluxes used in experiments
Mat 72? Thermal reactor neutrons, cample covered by 0.03 inch Cd. U-235depleted to 100 ppm (0.01?-).
Wan 55, Fast reactor (Los Alamos, UGA ) , U-235 depleted to about 0.0 2/>.
Rid 67- Thermal power reactor (vmi, Yellecitos, USA), Cd-f liter, depletedUranium.
1'ob 71; Past reactor spectrum (iL/U' ODP Prance), U-235 depleted to 0.04$.
Lar 74- Past reactor spectrum (7iPi:-3» Argonne, UHA) , high isotopic purity(99.999+ ;') of sample.
Dun 58: Cpectrum similar to fission spectrum (Be bombarded with 12 MeVprotons) , Jd shielded. U-235 content 0.03/j.
Ciu 68: 2 mm Od shielded, surrounded by 1 mm Uranium converter: pre-dominantly fission neutrons. U-235 depleted to 0.035$.
Die 71" Thermal reactor (ispra-I, Italy), 0,1 mm nd, natxiral and depletedUranium, pure U-238 yield evaluated.
Gun 72- Past reactor (Dill, 'Scotland), 0.4$ U-235.
TCng 51° Cd shielded, surrounded by Uranium converter:, predominantlyfission neutrons. U-235 content ~0.04$.
Kel 54"- Converter, fission spectrum with median neutron energy of 2.8 JioV.
Eon 60 : Unmoderated fiosion neutrons and Uranium converter, Cd-covered.
Pet 60' Cd-coveredj Uranium converter.
Any influence of U-235 or Pu-239 (built up during irradiation) should belargest in pile neutron spectra (Od- shielded) and smallest in fissionspectra.
2.3.1. Comparison of experimental data
Plosion yields for which more thm one meaBurement exist arc comparedin Table I. In the original contribution to review paper lib, sent toJ0G. Cuninghanie, [L.ob 7lJ waR not included and neither wao the normalizationto iJd -148. Therefore the data in Table I are partially different to thoseshown in review paper lib, Appendix 3« :l'he normalization points, namely6.14?, for the Ho-^9 yield, 5.94^ for tho ,:<»-! 40 yield, and 2.40/0 for theNd— 140 yield, should not be considered as evaluated values, Ueasonablevalues have been chosen to allow a bettor comparison of renormalized data,
Except for tho valloy region largest discrepancies can be observed forthe important fission products 3r-95 ^<i Cs-137» Only the relative mass-spoctrometric Md yields and the Ba-140 yield show good agreement. There-fore it is recommended that the Da-140 absolute yield should be used as astandard. Furthermore, since more than 20 years the half-life of Ba-140is well known and has only changed from 12,80 days to 12.7o9iO.005 days[Ede 73], The only objection would be that systematic differences have
248

been observed ^Lar- 71] between "•,-rjpeoti'ometr.-c -an? mass-speotrometricmeasurements, which are still unresolved.
It is cliff i oult to -draw conclusions f ron. the comparison of experimen-tal data in Table I. " The earlier measurements [liig 51, Kel 54, Don 60,Pet 60] suffer frorc out-of-date corrections of raw data. T'or example, theOs-l37~yield of [Kel 54] decreases from 7.4$ to 6.7;{ if a half-life of30 years [Ede 73] i" used instead of 33 years, if the error in the originaldecay correction is considered, negligible (see section 2.1). It would beworth estimating the reliability of early measurements with respect to decaydata by performing model calculations using nost recent data in comparisonwith the data used in the original work (see 2.4-3)« The two more recentmeasurements [Oun 72, Lar 74"! 0?'n only be compared for a fev fission pro-ducts which ia not very informative.. Jhe valuer? of mass-spectrometricmeasurements depend on the normalisation point chosen. The absolute M-148yield (common to all mass-spec-trornotric measurements) of [jtob 71] ka-3 a
large uncertainty (>8'f-).
The results of [Cuir 72] and [T,ar 74] agree in the case of Ho-99 andDa-140 (for which all recent measurements agree? within the error limits),but disagree for Zr-95 and Zr-97, The Zr~95 yield of [Lax- 74] is favoured byearlier measurements and has inuoh higher accuracy than that of [Cun 72],The agreement between different measurements of the yield;:; of Sr-89, lto-103,Ifti-106, Ag-111, Cd-115g and Eu-l^o varies. Discrepancies in the cases ofAs-Ill and Bu-156 may be due to differences in the neutron spectrum.
The situation in the heavy mass peak is very much confused by theresults of [Hat 72]. In their measurements, relative element yields of Xeand Gs were linked isobarically via mass 133, those of Ba, 3e and M viamasses 140 and 144 • r|1he yield ratio Os-137/M-145 w&s obtained by isotopedilution mac a spec troraetry. It can be seen in 'i'able I that the normaliza-tion of their relative yields at :"a-140 is favoured by the agreement withother measurements at masses 131, 132 and 140, but disagrees With theabsolxite lid-140 yield of [Rob 71]« Moreover, the sum of yields in theheavy masa peak obtained in. this way would only be about 95'$« ^e normal-ization of those i-'elative yields to the absolxite yield of >fd-140 bringsthe sum of yields up to about 105/ and results in disagreement x*ith othermeasurements, particularly at mans 140, The severe discrepancy of theCs-137 yield with other measurements remains. It is possible that theCe-140 yield suffers from contamination (see section 2.1.1) but this doer,not resolve the di corepanoy in the On-137 yield. Due to the large un-certainty of the c.bcolute Jfd-148 yield, the masr, 144 yield i» not reliableenough to perform the contamination correction proposed in section 2.4«1«
'fhere is nc possible explanation of the discrepancies between measuredOs-137 yields. II ir; possible that the ir.otopc dilution ratio of [flat 72]is in error. But raising the v^B-137 yield to the average of other measure-ments would cimul-t aneously raise the Xo yields (linlced via Xe-133 and Ca-133)»resulting in sovei-e disagreement with other measurements at masses 131 and132. On" the" other hand, it is very unlikely that all other Cs-137 yieldmeasurements arc 3 n error.
A comparison of relative lid yields suggests that the Nd-150abundance measurec. by [Lid ^7] is in error. Thic argument is supported bythe general trend of the mass yield curve. The discrepancy cannot beexplained.
249

Table I. Comjaarison of experimental yield data for; U-238fast fission
FP Yield St. Kef. jrp Yield St. Itef.Sr-89
Zr-95
Z^-97
Mo-99
Ru-103
Ru-106
Ag-111
3.12+0.19
4.410.43.4±0.32.8+0.33.2
7.24+1.315.44±0.165.2+0.66.1+0.64.9±0.77.16.00+0.3?
(5.91+0.18)5.32+0.165.2+0.6
6.00+0.796.031.0.127.0+0.?6.6+0.46.7+0.75-746.29±0.223.910.56.611.07.2
2.85±0.303.02+0.302.63
.0581.011,094±.012.08?±.008.06?+. 006,0?0
absol .absol .Mo-99Ba-140Ba-140
absol .absol .absol .Mo-99Ba-140
Ba-140
absol .absol .absol .absol .
absol .absol .absol .absol .
Ba-140Ba-140
absol .absol.Ba-140Ba-140
absol .Ba-140Ba-140
absol .absol .Mo-99Ba-140Ba-140
Gun? 2Bon60Pet60
Kel54
Gun? 2Lar?4BonoOPet60Kel54
Gun? 2Lar?2Lar?4Bon60
Gun? 2Lar?4Bon60Pet60
Kel54Eng51
Lar?4Bon60
Kel54Eng51
Bon60Kel54Eng51
Gun? 2Bon60Pet60Kel54
Cd-115g .0331.005.0461.00?.039i.004.0331.006
1-131 (3.62+0.11)3.0510.12
Xe-131 3.173.66
Te-132 4,23+0.34(5.27+0.32)4.1+0.44.9+0.6
Xe-132 4.645.36
Cs-137 7.68+1,726.llo.??.4lo.?5.155-957.706.52
Ba-140 6.03±0.425.92+0.185.8+0.5
6.7+.G.56.0310.195.72+0.14
Ba-140) r o,-+Ce-140) * D
Hd-143 4.405.225.215.38
absol .absol .Mo-99Ba-140
absol .absol.Ba-140Nd-148
absol.absol .absol .Ba-140Ba-140Nd-148
absol.absol.Ba-140Ba-140Nd-148Nd-148Nd
absol .absol *absol .absol .
U-235U-235
Ba-140Nd-148Nd-148Nd-148
Gun? 2Bon60Pet60Kel54
Lar?2Lar?4Mat? 2Mat? 2
Cun?2Lar?2Bon60Kel54Mat? 2Mat? 2
Gun? 2Bon60Kel54Mat? 2Kat?2Rid6?Ilid6?
Gun? 2Lar?4Bon60Pet60Ciu68Die?lMat? 2
Mat?2Hat? 2Kob?lKid6?
250
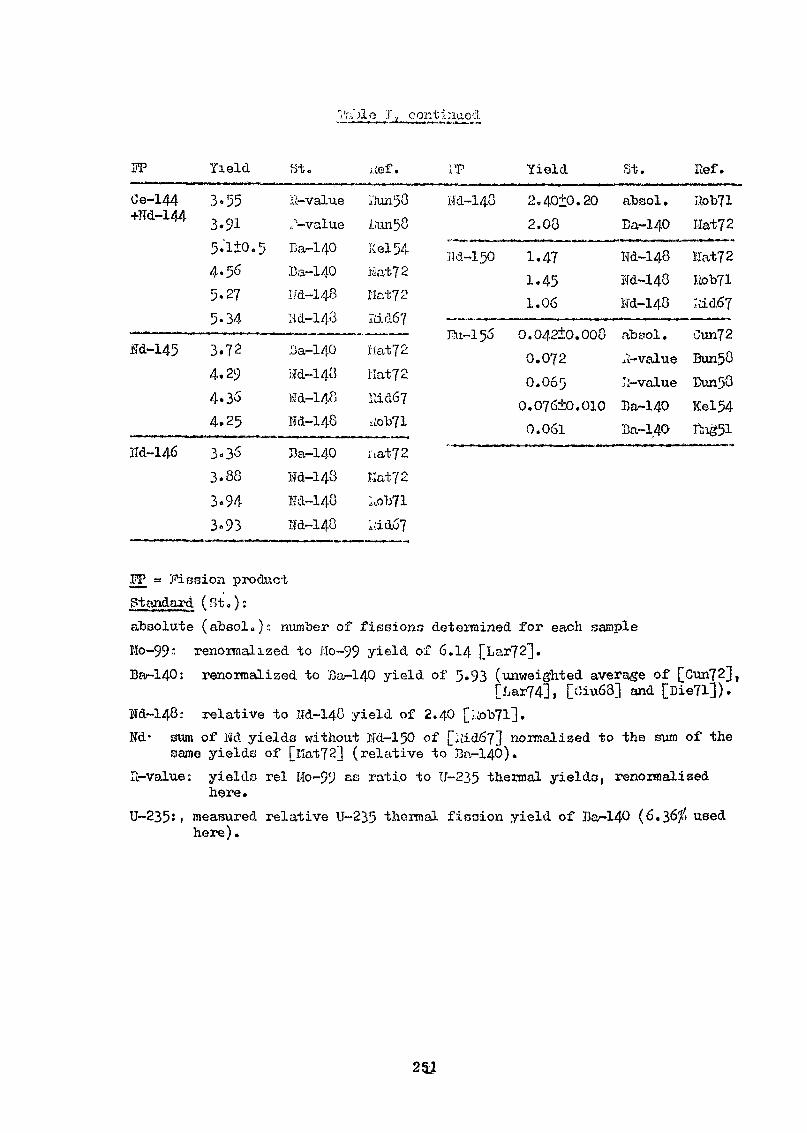
37P Yield Ht.
r.'r^jlp_JT^_ oQKt1;tood
uef. Yield St. Kef.
Ce-144+M-144
iJd-145
Hd-146
3.553.915.1+0.54.565-275-34
3.724.294-354.25
3.353.883.943-93
j.J-value."'-valueBa-140Ba-140lid-148Hd-143
Ba-140;M-14uHd-148Hd-148
Da-140Hd-148Nd-148TTd-148
i'iunjOLun58I;el54Mat72Hat? 2Iiid67
-. ————hat? 2iiat?2Tdd6?«»b71
i.at.72Eot72littoll:,id6?
Hd-148 2.40±0.20
2.00
Hd-150 1.471.451.06
ftx-155 0.042±0.0000.0720.065
0.0?6±0.0100.061
absol .
Ba-140
Hd-148Hd-148Md-140
absol .lvalueJi-valueBa-140Ba-1-40
Uob?lHat72
Hat? 2Rob71,;iid6?
Gun? 2Bun58Bun'58Kel54Rig51
j? = Fission prodxic-tStandard (fit.):absolute (abeol»): number of fifssionu determined for each sampleMo-99; renormalized to Mo-99 yield of 6.14 [bar?2].Ba-140: renormalized to 'Ba-140 yield of 5.93 (unweighted average of [Cun72],
[Lar74], [Oiu63] and [Die7l])»Id-148; relative to Nd-140 yield of 2.40 [liob?!].Nd' sum of 3M yields without Kd-lfjQ of [itLd67] normalized to the sum of the
same yields of [Kat?2l (relative to Ba-140).Il-value: yields rel Mo-99 SB ratio to IJ-235 thermal yields, renormalized
here.U-235:, measured relative U-235 thermal ficaion yield of Ba-140 (6.36/1 used
here).
2.3.2., Uncertainties
Apart from the standards IIo-99 and Bar-140, used most frequently inrelative fission yield measurements, 1 vail discuss the uncertainty offission yields important for turnup, namely Zr~95, .Ju-103, Ku~106, Os-133,Cs-l37j Ba~140, Oe-144 an& lid isotopes, in more detail arid make some generalstatements on the other mass yields. rSie rnass-spectrornetrically determinedyields of [Hat 72] need further clarification. Presently,, their measuredisotopic abundancies can only "be normalized to yielc1 data obtained by otherauthors.
The absolute Ba-lAO yield has been confirmed by several measurementsusing different methods. Its uncertainty is about 2'f.
The 2$ accuracy of the Mo-99 y'-teld assigned by Larsen et al. seemsreasonable. However; their valiie should be confirmed by further measure-ments of comparable accuracy. In view of the discrepancies among results onaverage value is uncertain to about 4~5/-»
}flor the Zr-95 yield the 37' uncertainty of [},ar 74 I is recommended.It'ortuitously, this value IB close to the weighted average of rather dis-crepant values with large uncertainties.
For Go-137 it is difficult to find r. best value at all.. In view of thediscrepancies also among recent measurements; the uncertainty of such a yieMis at least 20,'>. Consequently, the Cs-137 yield has the same uncertainty.
The 3d yields are presently no more accurate than the absolute yieldof Hd-14o [liob 71], namely 8-9?.., This includes the yield of Ce-144, forwhich no other reliable measurement exists.
''tor i u-103 the 3»5p uncertainty of [Lar 74] is acceptable, the un-certainty of the Eu-106 yield is about 10,'.
Other yield data;
- lielative }le yields [Wan 55l seem to fit reasonably at masses 131[Lar 74] and 132 [Cun 72]." H'he micertainty should be 5-£$.
- Only relative 3m yields exist [hat 72]. If adjusted to fit the massyield curve (lid isotopes, measurements of [.oun 5&]) "the uncertainty isabout l^/jo
- -'.part from those mentioned alrenxty? very fev? yields have been measuredin the light raaBR poalt (masnea 77, 89, 90, 97, 105), Their uncertain-ties are about 6-0^ (89, 97) and 20^ (others).
It should be kept in mind •thcvt yields below about 0.2/> (valley regionand wings of the peaks) depend strongly en the neutron spectrum. They canbe used for all neutron spectra only with about 30-50'j uncertainty.
2.3«3» Existing evaluatioiis
I have not studied the most recent evaluation [Oro 73a, I-Tee 72] insufficient detail to enable an analysis of the treatment of individual dataand the evaltiation method employed. I \ave noticed, however, that onlyfew corrections of experimental data have been applied. Generally, onlyrelative yields have been adjusted to evaluated reference yields. For adiscussion of evaluation methods see [Lam 73.] and 2.4«3« below.
25.2-

a) Meek_ajidJUder [llee 72]: From a check of some fission products it isnot clear how individual data were treated and errors assigned, as can "beillustrated by some examples of fission yields discussed also above:
Only [kob 71] measured the absolute yield of Hd-140. In [l-iee 72]this reference appears twice in. the list of experimental data, onceas absolute value, the second time a« relative value. I'he absolutevalue has been "adjusted'1, but I cannot see how this can be done.All relative measurements of ITd yields [iiid 67, .,tob 71» Mat 64]([Mat 64] in probably the same as [Hat 72]) have been normalized andconverted to absolute values> but no information ic available howthis was done, furthermore, the adjusted relative yields of Hd-140(converted to absolute values) have smaller uncertainty than theabsolute yield and were averaged with the latter value, although it is15/S higher than the others, as shown in [Hee 72]» Clearly, relativeM yields with an accuracy of 1-2/. arc distortet by thin averagingprocedure.
Similarly, it is not clear how the relative Xo yields of [Wan 55jMat 64] have been converted to absolute yields. Nevertheless, theyhave higher weight at masses 131 and 132 than the absolute measure-ments of [Lar 72] (which are superseded by [Lar 74])•
Consequently, I cnnnot agree with the uncertainties obtained in[liee 72], for example 2-4$ in the case of .Xo and M yields. Sincerelative yields have to be normalized to a reference yield, they can-not be more accurate than the latter when converted to absolute values.
I cannot see how the authors derive an uncertainty of 2-4% for theimportant Cs-137 yield from the tabulated original reference data.'Hie highest accuracy of the data shovm have those of [Lev 6l] formonoenergetic neutrons of about 2-3 I'lev', namely 5»l/>» (Other experi-mental data have assigned uncertainties of 7«l/oj 7«9$i % "- m°re.)Also the error assigned to the mass 89 yield does not reflect thediscrepancies. The errors quoted in [i'ee 72j for the other massyields discussed in section 2.3.2. appear to reasonably reflect theuncertainties of experimental data.
k) Crouch [Cro 73a]: In this evaluation the uncertaintier; assigned byauthors are shown in the tables. Although I wr,c informed that these uncer-tainties are not the same as those assigned by the evaluator and used forthe recommended yield, I found in n. check that the weighted averages corre-spond in 4 cases (Zr-95» Mo-99, Ba-140, e-144) to the errors shovm intable 16 of [Cro 73a] jpJid only for Os-137 they do not. Errors assigned byauthors are sometimes optimistic and do not take into account nuclear datauncertainties used for corrections. It will be discussed later thatparticularly wrong decay data used in the original irork should be consideredby the evaluator (see also the example of the Ort-137 yield in section 2.3.1.).
In [Cro 73a] the uncertainties of the average generally reflect wellthe uncertainties of experimental data and existing discrepancies. This isiue to the fact that Grouch has used the larger error of weighted and simpleaverage (together with the result of the weighted average). I have, however,a few commentsj
Although this procedure reflects fairly well the uncertainties ofexperimental data, the yield valxxe itself obtained by the weightedaverage is determined by the uncertainties assigned by authors to their
2&3
experimental data. Thus it is still necessary for the evaluator tomake his own judgement of all sources of error.
- Due to the nuclear data uncertainties in earlier measurements discrep-ancies may be observed among experimental results* Thus, if reliablerecent measurements are opposed by discrepant data from earliermeasurements or with large uncertainty [Gun J2], the yield and errorof the weighted average or the most reliable measurement could beadapted. Among the fission products discussed here, the weighted andsimple means of [Oro 73a] are, for Zr-95: 3$ and 6$, for Ku-103: 3$and 13$. The higher uncertainties are adopted in [Oro 73a]«
[Cro 73o.] does not include the experimental data of [Wan 55 » Mat 12(or I-iat 64), ilid 67, Die 71] • Therefore some mass yields are missingand, particularly, the discrepancies among the Cs-137 yield data shownin table 16 of [Cro 73a] are not as large as those in Table I in thiswork.
- In cases where authors have not quoted uncertainties, Grouch hasassigned errors common to all experiments of a certain type. However,I am of the opinion that errors should be assigned by the ovaluatorindividually to experimental results, judging from other measurementsxuider similar conditions, itor (earlier) radio chemical measurementssuch a procedure would, be more complicated as counting statistics maydiffer widely for the same imclide. In this case the absolute errorshould be higher than the average of similar measurements.
Principally, higher uncertainties should be assigned for measurementsof lov; yield fission products. Otherwise the common error assignedduring the evaluation may be lower than those from other experiments.The (low) yields of As-77 and Sb-127 in table 16 of [Oro 73a] aregood examples whore the 15'f- error assigned by Crouch is opposed byauthor-assigned errors of 2r}% end 2yf.,t respectively, of other measure-ments of comparable reliability.
When comparing the two evaluations fjiee 72, Jro 73a] it should be keptin mind that more experimental data (particularly the mass-spectrometricmeasurements of [?ad 67, Mat 64] are included in [l-ee 12] and that both usethe superseded data of [Lar 72] for mass numbers 131 and 132.
2.4.
2.4.1. Suitable techniques
The very low fission cross section of U-235 imposes several restric-tions on suitable measurement techniques.
uass-spectrometric measurements require longer Irradiations (at leasta few days) in order to accumulate a sufficient number of fission products.Particularly in Od-shielded samples irradiated in a thermal reactor spectrumthe buildup of Pu-239 due to resonance capture in XI- 23 8 may be significanttogether with the rather high resonance fi scion crosa-section of Pu-239*This problem is much less serious for irradiations in fast reactor orfission neutron spectra.
In view of the low fission cross-section of U-238 and hence the lowburnup, contamination problems aro more serious than in other fission yieldmeasurements (e.g. thermal yields). This affects particularly the elements
254

lib, Sr, Cs, Ba and Ce which have either no isotope not Occurring e,s fissionproduct or the abundances of such isotopes are very low in the natural elementtExperience has shown • that contandnation. l>y Cs and .ib was rare in the past.However, Ba and Ce yields often showed discreponcies. I would propose tomeasure the Ea-140/£e-144 yield ratio to about 1-2$ accuracy, e.g. byy-spectrometry [Deb 73 J« Then measured relative Oe abundancies can be cor-rected for contamination using this ratio, rather than by the method em-ployed by [Hat 72].
Jorrections for contamination by natural (3m introduce great uncertain-ties in the yields of Sm-152 and r'.m-154« which have highest abundance in thenaturally occurring element. In addition, resonance capture in Pm-147 cannotbe neglected, after long irradiations in the ca^o of Cd-shielded samples, andcalculation of the amount of Sm- O formed this wrty in rather uncertain.This difficulty could be circumvented using large samples irradiated lessthan 10 days. Because of the 11-day half-life of M-147 capture in Pm-147can be kept negligible.
Contamination problems for radiochemical measurements are not seriousas fast neutron capture cross- sections are very low. (As a rough estimateit can be shown: if in cv fast reactor spectrum the neutron flux in therange from 100 to about 700 i:e\ is 10 times the fluz of 1.5 - 3 BeV, then1000 ppm Ko-9 would produce n2i amount of n.o-99 which would be of the orderof 1% of the fission product.)
rJ5ie determination of absolxito yields with the aid of fission chambersor fission track detectors requires rather thin samples. The inelasticscattering cross-section of <-?3u is about 2. 5 b in the range of 1-3 he\r.lloughly half of that vjould be responsible for scattering 1,5-3 MeVneutrons belov; U-230 fission threshold. A reduction of the neutron flux inthis energy range by less than 1'f> requires a sample thickness of £.2 g/cm .
Due to these restrictions in sample size, absolute measurements offission yields by radiochemical techniques can only be performed i.«.th goodcounting statistics for hirjh activity fincion p3;^Dductri, since short irradia-tions are roq>iired to avoid uncertain decay corrections.
Relative y-i.eMs GOJI be determined rr.diochemically by p)-coixnting ofseparated fission products from largo ruwples with good counting statistics,using the predetermined yields of high activity fission products as reference.
samples are aliiroy;:: required for the determination of yields bygamma spectrometry without dissolution of the sample 'U'ld separation offission products. Although this method has fewer sources of error, it isapplicable only for a restricted number of fission products.
A suitable method for chain yields is the measurement of R-values rela-tive to the well-known U-235 thermal fission .yields. One source of error,the detector calibration, can be OToidecU
2.4«2. l'\irther measurements required
Viecommendations for further measurements depend on the accuracies re-quired in application fields 7
- Jtor burnup determination ~5'/' accuracy is required for the I'1? mentionedin 2.3.2.
255

Other application fields probably require an accuracy of 15-20$,depending on the significance of the FP, Certainly yields in thevalley region and at the wings of the mass peaks are needed with loweraccuracy,
Presently only the yields of Zr-95, liu-103 and ]3a-l40 meet turnup re-quirements. Among these the Zr-95 and Uu-103 yield as well as that of thestandard Ho-99 should be confirmed by other measurements, as discrepant butless reliable data exist,
Further measurements of the yields of lai-106, Cs-133, Os-137, Ce-144and M isotopes are required. Relative .tld yields are sufficiently accuratesthus requiring only a redetermination of the M-148 yieldf or alternativelya measurement of the absolute (Je-144 yield.
All the above-mentioned fission product yields can be determined bygamma spectromotry with sufficient accuracy [Deb 73? Lar 74] « The relativeyields of .'Js-133 osid. M isotopes can be normalized to one of thene fissionproducts. In addition, the ratio of <Je to Ed yields could be redeterminedby isotope dilution macs spectrometiy.
For other applications measured relative and absolute yi<?lds in theheavy mass peak together with the measurements recommended above should besufficient. In the light mass peak yields for a number of mass chains aremissing. These could be measured most conveniently and with' sufficientaccuracy by the .U-value technique. Ilass-spectrometric measurements are notrequired, nince relative Kr yields are known flJan 55~1°
use of Ea-140 as reference yield is recommended until more reli-able data for other fission products (Zi— 95» IiO-99i Oe-144) exist. li\irthoi-absolute yield measurements would be useful. The dependence of fissionyields on neutron energy, particularly in the regions of low yields, shouldbe investigated.
2«4«3» Evaluation work
Up to now all experimental yield data, ranging from Gd-shieldedirradiations in thermal reactors over fast reactor spectra to fission spec-trum and 3 He if yields, have been evaluated together resulting in a recom-mended "fast1' fission yield. In. future these different types of measure-ments should be separated and the effect of neutron energy be ottxdied, un-less there will be evidence that certain yields do not depend on this effect.
A source of error is the use of superseded decay data in earliermeasurements, ITuclear data like half-lives, [ -branching ratios, endpointand mean energies, intensities of conversion electrons, are required inradiochemical measurements for analysis of raw data, corrections for build-up and decay, corrections for other fission products present and for countingrate as well as for calculation of fission yields from measured activities.Although in earlier measurements no details on error analysis are given,nuclear data uncertainties were generally not included in the calculationof errors. In addition, earlier measurements suffer from errors due tosuperseded nuclear dato. which are not reflected by the uncertainties calcu-lated for the result a.
Such uncertainties should be estimated by the evaluator. In a veiytime-consuming evaluation these additional uncertainties could be estimatedfrom model calculations, using the nuclear data and experimental conditions(irradiation and cooling times, sranplcs) of the original work and comparing
the results with the calculations using presently adopted nuclear data. Theresults shoudl "be urjed to estimate systematic errors and check the reli-ability of these data, as appropriate corrections are hardly possible.
If time does not permit this procedure, additional uncertainties shouldbe assigned to experimental data individually, according to the evaluator'cijudgement of the nucleo,r data used and the esrperimental details described.
Furthermore, evaluators should try to resolve disc rep ansiec" in orderto reduce the uncertainties of fission yield data and save experimentalwork. This requires a thorough check of details of experimental proceduresand data analysis and justifies to Deck pertinent information, which is notincluded in publications, directly from authors.
3. Th-232 K13T 1E3UT €17 MT'IOJ YDTLir
The experiments discussed "below and listed in Table II are those in-cluded in the evaluation presented in [Lam 73] «
3.1.1. lyer et al. [lye 63!
lyer et al. measured the most complete set of Th-232 fission yields,They measured U-values relative to U-235 thermal fifsion using IIo-99 as
standard. "By nojmalisin^ their relative yields in such a way that the sumof all fission yieldo is 200/, they obtained a value of 2.78$ for lio-99.
The table 1 in [lye 63] contains two errors;
The 3a-139 yield for thermal neutron, fission of U-235 should read 6. 55,-'(instead of 5«55)« The value 5. 55 has been used to calculate the Th-232yield of 6.64/5.
The error quoted for the same yield, ncmely 6.6^±0.033? is wrong, as can becalculated from the It-value. There the error is 5/% whereas the error ofthe yield is 0.5'*''. Therefore the value should read 6. 64^0 ,33-
The errors quoted in flye 6 3 I &w standard deviations of the measuredIt-values and do not include uncertainties of IT-235 yields, the I'o-99 refer-ence yield and systematic errors. Inspite of ihe measurement of Revalues,additional errors can be introduced for example by differences in decaycurve analysis (between IT-235 and T'h-232 fiasion products), differences indecay; corrections, etc. liurthermore, a 1.3?' error (Os-137» Zr-97) or0.38^ error (Ge-144) a^> standai'd deviation for 2 measurements has to be con-sidered fortuitous, as lon^ as errors for other hi^li yield fission productsare 5$ i» the average.
In the present evaluation all yields have been recalculated using thepublished revalues and fie U-235 yields of [Lam 73]. The yields in Table IIhave been normalised arbitrarily to a T-a-lAO yield of of-,,
3.1.2. Kennett ?jid Thode [icon 57]
The mass 85 yield has been calculated using a branching of 22% toICr-05t1« The originally measured yield of Kr-85o relative to Kr-86,corrected for decay, was 0.145« The authors quote 5-97-0, 15/i as measured
257
absolute yield of Kr-8<5. This in, however, the "unweighted average- of5EE££EiSSiSi£» os tile authors cay, 3.8:'?, (spmnle A) find o. Ill (sample I)).Therefore it has not been ursed in the present evaluation, although it isthe only measurement of an absolute yield, for Th-232 fast fiscuon.
In the present evaluation the relative yields have "been normalizedtogether with the mass-spectrometric measurements of [l*ar 68a] to the 'Js-137yield of [lye 63], using the Xe Kr ratio of [..en 57]. This 'Ja-137 yieldmight, however, be wrong (see 3.4»1.)»
3«1«3« ITarvey et al», mastj-specti-ornetric measurements [liar 66aj
The same impurity problems r>.rise for Os-137 and M isotopes an statedfor U-238 fast fission. M contamination should be detected by the abun-dance of Hd-142. However, nothing is oaid in the publication.
In the present evaluation the relative .[e and Er yields have beennormalized together with those of [Ten 57]. /.relative IM yields have beennormalized at mans 143. The value of 6.64 ir. the average of [lye 63,liar 68b] and [Ere 67] (with 1/2 weight).
3.1.4. Harvey et al., "-values [liar 6ob]
In the present evalxiation measured ,. -values have been adjusted usingthe U-235 yields of [Lain 73] with the exception of masses 131 nnd 132. ..ecentgamma~spectrometric measurement?;: of 1—235 yields relative ;"Je-144 [Deb 73.]have confirmed the mass 131 relative yiel.d quoted by i'o,rrar et al, [ i'ar 62],Mie latter value had been obtained from an unpublished Xe-l32/Xe-133 yieldratio and therefore not been used in [Lam 73]° limn the new U-235 yieldsused are 2.93/j for mass 131 and 4«3o/> for mass 132 (with a fractional cumu-lative yield of 0.995 for U-235 and 1.0 for Th-232).
'ilie relative ^11-232 yields have beer, normalized at mass 132 ar, ob-tained from the normalization of mascs-Bpectrometric measurements.
3.1.5« Jiresesti et al. [J3re 67]
yieldr. were measured with a TTal detector calibrated bycoincidence method, '['ho internal standard was ''Je-
T'he reported errors a.t-e strndard deviation-. The uncertainties due tocalibration of the detector are not oonnidrred. In [Lam 73] the devia-
tions of measured U-235 yields from recommended values were considered to besystematically due to thi.i detector calibration. Therefore, the Th-232yields were adjusted, according to these
However, fission products have been chemically separated before gamrna-spectrometric meastirementn and experimental condxtiont;: "uch as mounting ofsamples, etc., were not explicitly stated to be identical in the determina-tions of U-235 and 'r1'-232 yields, r.ince a i-e^dju^tment of measured valueswithout detailed information from the authors is alvrayn critical and shouldnot be done without good i-easonL, the original relative yields are used inthe present comparison (ri.'ible II) , although the two measui-ements could beconsidered as j , '.-value o.
At present the diacrepancies aaong measured Th-232 yields are toolarge to make detailed studies of individual measurements worthwhile. Shoulda more thorough and detailed evaluation be attempted when further precisemeasurements become available, such information on enqperimentol details, asmentioned above, should be sought from the authors.
253

The reported yields of Pm~149 ^16. Pni-l^l were corrected for U-235reference yields, as these were used for detector calibration.
3.1.6, Kobayashi et al. [Kob 701
These measurements in a fast neutron spectrum (close to a fission spec-trum) are not yet ptiblished in the open lieratvire. La-140 was used asstandard and the quoted uncertainties are high: lOfi for Zr-95» 12$ forTe-132, 15' for Sr-91 and 23";, for Ae-13> Tlowever, the agreement with othermeasurements (m^ss-spectroraetric [jtr,r 68, lye 63]) IF; far better than thequoted uncertainties,
No experimental details are available , r['herefore these measurementsare mainly used as a check and only the yields of ,f,r-91 and Zr-95 are in-cluded in the average with low weight (see 3 * 3 . 3 » ) «
3.1.7« Wyttenbach and von aunt en [Uyt 65]
The quoted errors are standard deviations resulting from 3-8 measure-ments. Systematic errors are not considered. Tii-103, As-Ill » Pd-112,I-131s Os-l37j Bar-140 and Ge-141 were mecurured £pjrnma~spectrometricallyusing a calibrated counter and. disintegration data from Nuclear Data Sheets.Sr-90, I&.-106 and i,e-144 were measured against calibrated IAEA standardsin a gas flow proportional counter. Mo-99 was used P.S standard.
In the present evaluation it was iisBtuiied that Ko~99 was measured byboth methods. Gamma-apectroinetrically determined yields were corrected fordifferences in the emission probabilities of the most abundant gamma raytabulated in Uuclear Data Sheets up to 1964 to those of the "eibersdorfcomputer library [r,de 73 > Lcaa 73' 'J. '.'.Ihe relative j^icldG of iLu-106 andCe-144 remained unohanged. That of c'r»90 was corrected for half-life. Thecorrected relative yields were normalised to 8f> for Da-140 «
3»1.B» Tarkevich and Hi day [i!"ur 51"]
At the time of these early measurements data on half-lives and betarays (branching, energy, etc.) were not vrell kno>n.i» "ovrever, a number offission products ("r-91, '5r-97, no-S->» J'iu-103, T;h-105v rtu-106, Pd-109,Ag-111, Pd-112 and Cs-137) were measured relative to IT-235 fission yieldswith Gr-89 as standard.
The yields meacurod relative to U-235 have been readjusted in thepresent evaluation. The other yields reported in the article are not used.
3.1.9. Orook and -to i girt [Oro 63]
detailrj on measured value B are given in the report. The raw dataare reduced to counting rjytee at refei'ence time. In some cases large dis-crepancies are obvioxis among individual saturation activities of the samefission product.
As experimental detail r: o.re given, it was1 attempted to correct themeasured yields for differences in half-lives used in the original work tothose reported in [Sde 73.]* This was done by calculating yields from theraw data as well as by calculating decoy correction factors using theoriginal haJf-life valuer; and the new ones.
The severe discrepancies of the yields measured by Orook and Voightcompared to those of other authors could not be improved by these correc-
253

tions. Table II shows the corrected data normalized to 8,t yield for theirinternal standard Ba-140. Any other normalization either using the originalor the corrected vaTu.es, gave agreement x-rith other authors) for 3 relativeyields out of 9 measured ones at the most. For this reason the data of Crookand Voight have not been used in the present evaluation.
3.2. Heutron spectrum
3.2.1. Plosion cross-section of Th-232
The fission cross-section of Th-232 riser, from zero at 1.1 MeV toO.ll bat 2 KeV, remains fairly constant from 3 KeV (0.13 b) to 6 Me7 (0.15 b) <i*id-rises up to 0.3 b between 6 and 7 Le/. The cross-section is roughly similarto that of U-238 and all that has been said for T.T-230 is also valid forTh-232. The same arguments used for U-238 with respect to inelastic neutroncross-section and cample nize con be used for Th-232.
3.2.2. ITeutron flux used in experiments
lye 63; Irradiation of baro samples in the core of vsApsarn!i reactor. Fastflux should be close to fission spectrum.
Ken 51- Samples in cylinder of natural Uranium should be close tofission spectrum.
Har 68a: Samples wrapped in 2 layers of 0.015 inch Od. Pile neutrons.
liar 68b; Thermal flux reduced by 1)203 plug in addition to Od. Th-232 con-tainers to enhance fa«t flux of incoming pile neutrons.
Bre 67" Cd-wrapped samples irradiated in graphite reflector as well asclone to core.
Kob 70: Fast reactor spectrum clone to fission spectrum,
Wyt 65: Cd-wrapped. somp? es at the side of core,
TUT 51 and neutrons.Cro 63-, ^
The samples used were of very high purity, sufficient to make U fis-fions negligible.
With the exception of [Ken 57] f [Kob 70J and perhaps [liar 68b], essen-tially pile neutrons were used in all experimentB. &• stated for U-233, thedependence on the hard part of the incoming neutron spectrum might be sig-nificant at the wings of the mass peaks and. in the valley region. Yields inthe peak regions should bo the name vritnin ,?. certain confidence limit. Thisshould be further investigated. 'lork in thin direction IB in progress atIdaho. It might well be possible that, if desired, yields will have to bedetermined with high accurary for individual or prototype bast reactor spectra.
3«3. a f t e r
The "'present evaluation1" is not a new evaluation, but only a modification of [Lam 73], which I consider as improvement. The general procedureremained the same and difference: are discussed in 3-3«4«
260
3«3«1» General procedure
AD no absolxite Th-2.32 fast fission yields exist, except the very roughmeasurements of Kennett and Thode, the arbitrary normalisation of relativeyields is justified* Ac stated in the comments to U--238 fact yields, Ba-140has generally been measured moat accurately and was the-refore chosen a-sstandard wherever possiblot oven if thin fission product was not used asstandard in the ori.Tinf.il work. There may be rui objection against this pro-cedure as 6o'£. [lye 63] used ;,o-99 O.B internal standard for different campleswhich were not all analyzed for La-140, furthermore, all reported yieldvalues are averages of never-:1,] detormmrfcionsj including the yield of Bar-140>which would be different when normalized to the Irtter for each anrnple.
However, published standard deviations for individual fission productsare generally sm^ll compared to the overall uncertaintiess which indicatesno systematic error duo to the claoioe of the standard, r.'he reference yieldsused in measurementc vary: Lo~99r r^a-140, Oe-141, Te-132 and Sr-89 (see3.1.). Jo fir,.-!iovi product has been measured more frequently thru P.a-140fand this normalisation showed best agreement nmong experimental dafa.Besides, using the noxrnalization points of the original measurements viouldcause only little changes (nee below).
Relative experiment-:J yields in 'fii-232 f T.t fisnion are shown inTable II. The data of [ lye 63] "re used as starting ppint relative to 0/£for the Ba-140 yield. paos-r;pectromotric date [Xcn 57? T|cir 63a"] in themass range 83 - Go and Ijl -- 137 '-re noiinaliaed at mass 137« The data of[liar 68b] are normalized to the mast; 13'- yield obtained from QCen 57]-Together with other raoasurementn including; r.a-140 [Bre 67, Lob 70f VJyt 65]normaliization points for the data oi [ Tur ^l] nnd relative Hd-yieldo[liar 68b] could be found.
jjorrualizing the data of [TJyt 653 ^ i-c—99 would have increased themby 1.5f- relative to the data of [lye 63]«. The resulting average of theCe-141 yield would be 7«15 ™& would increase the data of [lire 67] by Z?> ifchosen as reference yield. 'iSiie would cause changes of about 1-1.5^ in someaverage yields.
Relative yields were averted an explained in 3«3»3« The data obtainedin this way are shown in the column headed "'average' of Table II. The finalnormalization ao shown in the last column of Table II was obtained by makingthe sum of yields in the heavy mass penlc total 100/,, as there are lessestimated yields than in the light mast, peak.
3.3«2. Quoted uncertainties of experimental data
With the exception of ['Air 51] and, probably, [Kob 70] all authorsquote standard deviations relative to the reference yield used. The averagestandard deviations for high yield fission products of more than twomeasurements are:
lye 63-: 3-5',* (except r^r-91., &;<:.)Ken 57" 0.5-1,',liar 68ai 0,5-2«liar 68b: 1-2;' (except 1-131, 6,5)Bre 61: 2-tfXob 70, lOf, and moreHyt 65- 1-5.j (average 3/;)(Tur 51? 10/i minimum (stcvudardGro 63: 6-8;'
261

Table II. Th-232 fast yields: experimental data in the normalizationused in the evaluation
Underlined: iformalization Point
MassHo.
72737783848586878889909193959799
103105106109111112
113115117121123125127131132133134
Iye63
9-8-31.87
7.136.51
5.104.032.63.145.0279.039.038.046.073-055.054.048.053.030,032.072l«54
Har68a Har<5Gb Bre67 Kob70 Wyt65 Tur51 Oro6;j
(3-2-4)(4.4-4)(0.02)
1<78 (1.06)3.263-54 3.555.385.696.00
6.08 (8,29)6.63 (6.80) (8.86)
6.60 6,2 6.JJ2 (5* 11)7.24
5.23.60 4.61
2.59 2.47 (3.20).146 .145
.061.057 .040
.039.075 .035.083 .061
(.057)
1,44 1.29 2.07 (1.17)2«55 .2^ 2.6 (2 '35)3.46 3-684.79
average
3.2-4
4-4-4.01
1.80
3.26
3-545.385.696.006.086.886.557.245.123.802,60.145.04.039.038.04.06
.055
.054
.048
.053
.030
.032
.0721.442.553.554-79
final
3-4-44.6-4.011-90
3.443.745.696.016.346.437.276,927.655.414.022.74.153.04.041.040.04.06.058.057.051.056.032.034.0761.522.693.755.06
262

Table II (continued)
MassHo.
135136137139140141143144-145146147148149150151153156
Iye63
4.266.248.007.186.786.71'
2.94
.823
.0025
ILSL !^0b 4.31 4.705.09!-JL6.
6,608.007.01
6.6J. 0.53 6.577:51
5.394.62
2.992.03
1.391.02
.393
.198
Kob70 Wyto5 Tur51 Jro63 average
4-1 4-55.09
6.08 5.78 4.266.42
JLO 8o£ (6,06) (8.0) 8.007.02 (8,80) (7.45) 7.10
(7.77) 6.647.43 (6.94) (8.55) 7.09
5.394.62
(3.24) 2.962.031.391.02
.393
.198
.0025
final
4-765-384.506.788.457.507.027.495-704.883.132.151.471.08.42.21.0026
It is evident that the measurements of [lye 63, Bre 67 and Wyt 65]have about equal precioioii. As [lye 63] measured It-values their results areconsidered more reliable than those of f'fyt 65] and [lire 67]. An assign-ment of overall uncertainties was not attempted.
3.3»3. Selection of experimental data
In Table II those yields of [rfur 51] are shown in brackets which hadnot "been measured relative to U-235. They are not used to obtain averageyields except for masses nos. 72 and 73»
1!he following data were used to obtain the relative yields shown inthe column headed "average" in Table II (see also discussion in 3»4«1»).
As-77: [lye 63]mass 83" [Ken 57] and with 1/2 weight [lye 63]masses 84 - 88; mass spectrometnc data [Ken 57> Har 68a]3r-90j unweighted average of [lye 63, Wyt 65]t since the
latter has much higher precision.mass 91' highest weight given to [Ear 68b], lowest to [iCob 70]
263
Zr-95'Zr-97:
Ho-99:
masses 105 -
[lye 63] weighted higher than [Kob 70]unweighted average of (equal precision) results of[lye 63, liar 68b]highest weight given to [lye 63], lowest to [Tur 51] »in view of the different reliability of the data.
mass 112:
masses 131? 132:masses 133, 135'
Cs-137:
masees 139 "to 144:
Pm-149:
about equal weight given to [lye 63] and [Tur 5 ]» sincethey show good agreement (except Kh-105, where only anapproximate value is taken as average). The data of[Wyt 65] have not been used, as the situation of yieldsin the trough region needs further clarification.[lye 63] quote also a result for lg-112 which would be0.050 in the normalization shown in Table IT. Onlyapproximate value used as average.mass-epectrometric data.average of [liar 63a] and [liar 68b]. The ratio 133/132has equal precision in both measurements, Thereforethe normalization of mass-spectrometrically measuredratio 135/132 cannot be more precise (see also 3.4,!.for further discussion).the value of [lye 63] waa chosen an it agreed best withmass-spectrometnc measurements, combined with 1-131yields of [lye 63] and [jrar 60b] (overall agreement).This yieldj however, needs further clarification(see 3«4»1« ) •equal weight given to 1 -valuers, 1/2 weight to [l)re 67]and [T"Jyt 65],the yield of ("l3re 67] fits better between mass-spec tro-metric data and has been preferred.
3.3.4. Differences between Table II and [Lam 73]
The evaluation presented in [Lam 73] was done for internal use at atime when new important measurementF? became available [Har 68, Bre 67], butwere not incorporated in evaluations. The normalization was done in one ofseveral possible ways. Individual experiments were examined carefully andchecked for reliability. However, no account was taken of the precision ofindividual yieldr. within one experiment, father was the reliability judgedfrom an experiment an a whole including the method used, and the specificfission products considered for taking an average since no overall errorswere estimated by authors (cf. 3»3«2.)«
The values presented in Table II should be considered as a slightlydifferent way of normalising and selecting experimental data$ using the sameevaluation principle. The influence of such differences may become evidentfrom a comparison.
The differences between the procedure to obtain the two sets ofdata are:
- In [Lam 73] the readjustments of La-139 (see 3.1.1.) and Ce-144yields of [lye 63] wac in error (assuming wrong U-235 referenceyields used in the original work). This time only the It-valueswere used for corrections.
264

- U-235 reference yields for Iai-103, 1-131 and Te-132_used now are3.09/j [Deb 73], 2,93;! arid 4«3<S,j , respectively. In [Lam 73] "the U-235yields pxibliched there have "been used. This affects the 1-131 yieldof [lye 63] and all ad jus-bed ^-values of [liar 68b],
- liass-spectrometi'ic relative Kr, Xe and Os yields were previously normal-ised to agree in the atun of masr. 83 >• 131 and 137 yields.
- The data of [lOre 67] were readjusted for differences between measuredand recommended U-235 yields in [Lam 73] and thus treated as .u-valueo.
- The data of ['Pur 51] wore previously normalized at mass numbers 91and 99? this time only at 91 •
- In [Lam 73] "the masu-ppectrornetric .''e-133/Xe-132 was averaged firstwith that obtained from the "'.-value [j:.ar 63]? relative Os-yieldswere normalized to thin average value.
- The preference of data was-
1) mass-spectrometric2) [Har 68b]3) flye £3] and [i3re 67]4) [Vyt 65] and ['jur 51]Other data were not used.Exceptions were Oe-141 (y-spe'otrometric measxirements preferred),Je-144 ( [lye 53, ...re 67, T-Fyt 65] equal weight), mass 143 ([Har 68b,lye 63, Bre 67] equal weight) and .Ca-139 ([lye 63, TIar 68b] equalweight).
3.4. Status jof ;i&-_232 fj.ist_ f Li
3.4«1" Comparison of exrperirnental data
A comparison of experimental data an displayed in Table II is of courseinfluenced by the normalisation chorjcn. The following comments have to beunderstood as ^relative to the Da-140 yield".
Apart from the valley region the most striking discrepancies occur atmass numbers 131 and 137 » With the normalization chosen, the Gs-137 yieldof [Nyt 65] is 43;' higher than that of [lye 63]. If the Xe-131 yield of[Ken 57] is chosen as reference, the 1-131 yield reported in [Har 68b] is 10lower, those of [lye 63] and [l-Jyt 65] are higher by 1% and 44^ respectively.All data sets that include a measurement of the mass 131 yield are normal-ized at this value in Table III for comparison. The most striking observa-tion is the good agreement among the 137/131 yield ratios ([lye 63] ~$%lower). Also in the valley region the values of [lye 63] and [Fyt 65] aremuch cloner whereas all other yields (including [liar 60b] exhibit severedisagreement.
It can be cloncluded that the discrepancies are in the mass 131 yield.The Gs-137 yield is either around relative yields of 4.3 or 6. Averagingthese two values makes no sense. The reason for the preference of a Cs-137yield of 4*26 in thia evaluation is that it is confirmed by 4 measurements,3 of which are completely independent ([lye 63], mass-spectrometric, filar 68b];U-235 reference yields cam be excluded as cause- for the discrepancies).A normalization to the Cs-137 yield of [Hyt 65] would raise the mass spectro-metric data [Ken 57, liar 60a] and those of [liar 68b] by 43/ and cause severe
265
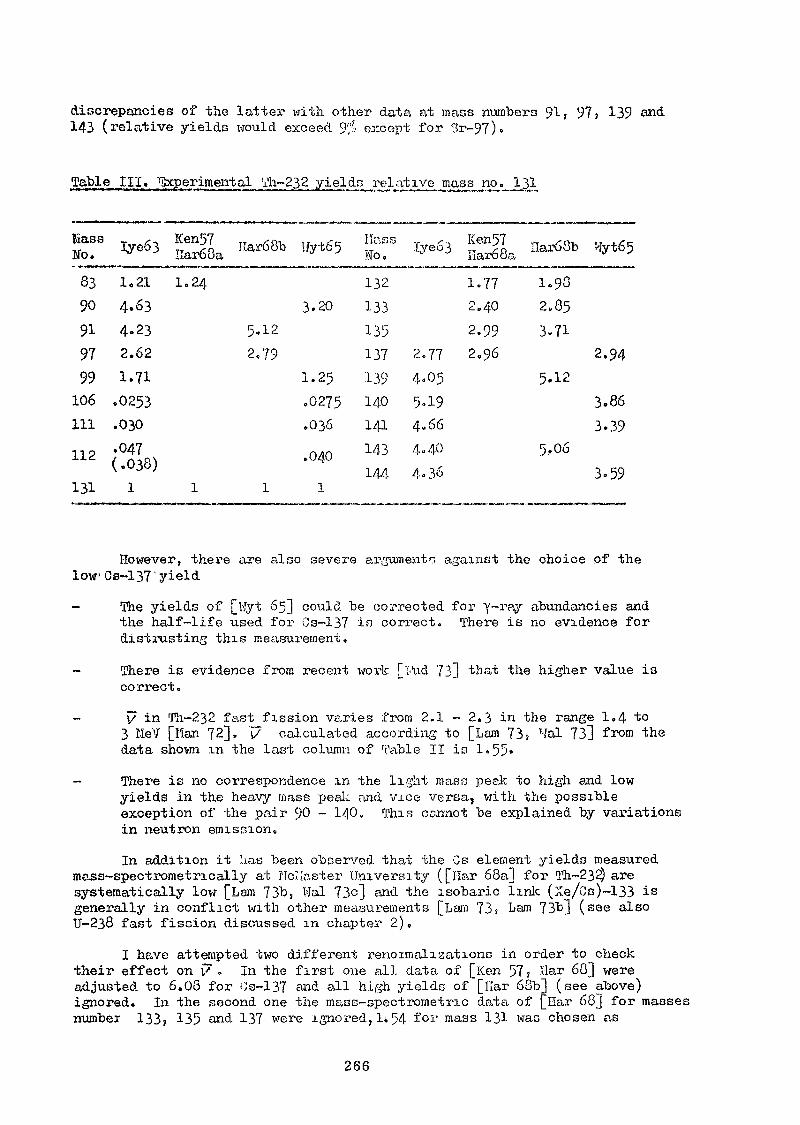
discrepancies of the latter with other data at mass numbers 91, 97, 139 and-143 (relative yields would exceed 9'5 except for 3r-97).
Table, III, ^c^erimartal Ah-232 yields i-elativc .mags no. 131
MassMo.
8390
919799
106111
112
131
T f. Ken57Iye63 IIar68a
1.21 1.24
4.634-232.62
1.71.0253.030
.047(.038)
1 l
*«68b *«5
3.205.122,79
1.25.0275.036
.040
l 1
IlassNo.
132133135137139140141143144-
IyeS3
2.774,055-194.664.404.36
Ken57 Ti.,-6%IIar68a Jar0ol>
1.77 1-982,40 2.85
2.99 3-712.96
5.12
5,06
Wyt65
2.94
3.863.39
3.59
However, there are also severe arguments, against the choice of thelowCs~137'yield
- The yields of [Wyt 65] could be corrected for y-ray abundancies andthe half-life used for Os-137 in correct. There is no evidence fordistrusting this measurement,
- There is evidence from recent work T^ud. 73] that the higher value iacorrect.
- v in Th-232 fast fission varies from 2.1 - 2.3 in the range 1.4 to3 MeY [Man 72], '7 calculated according to [Lam 73, Wal 73] from thedata shown in the last column of Table II is 1«55»
- There is no correspondence in the light mass peak to high and lowyields in the heavy mass peak and vj.ce versa, with the possibleexception of the pair 90 - 140. This ccoinot be explained by variationsin neutron emission.
In addition it lias been observed that the Cs element yields measuredmass-spectrometncally at Hcllaster University ([liar 68a] for Th-232) aresystematically low [Lam 73b, Wal 73c] and the isobaric link (Xe/Cs)-133 isgenerally in conflict with other measurements [Lam 73,- Lam 73b] (see alsoU-238 fast fission discussed in chapter 2).
I have attempted two different renoimaliaations in order to checktheir effect on y , In the first one all data of [Ken 57? Har 60] wereadjusted to 6.08 for Os-137 and all high yields of [liar 68b] (see above)ignored. In the second one the mass-spectrometric data of [liar 68] for massesnumber 133> 135 a^d 137 were ignored, 1;54 fo*' mass 131 was chosen as
266

reference point for [Ken 57, liar 68], and all data of [liar 68b] used as wellas 6,08 for Cs-137. The resulting values for j7 are 2.79 and 1.96 respec-tively. However, there are too many factors of uncertainties and no clearreasons to favour the one or the other set of experimental data to allow anyreliable conclusions.
When comparing experimental data in Table II, other discrepancies arealso evident, e.g. at mass numbers 90? 97» valley region (105 ~ H2), 139?149 and, most important, at 144» These depend, however, partially on theparticular normalization chosen. Interesting in the good agreement amongrelative mass 140, 14! and 144 yields of [Lre 67] and [Hyt 65].
In order to check the influence of the choice of the reference yieldand the normalization of relative yields to 100$ in the heavy mass peak,I have performed another comparison of experimental data, using the refer-ence yield of the original work wherever possible, and the absolute .yieldof Kr-86 (5.97$ [Ken 57]) as starting point, The other data were adjustedin the following steps,
a) [Ken 57] Kr and Xe at Kr-36b) [Ear 68a] Kr-37, Kr-83 at Kr-86, Xe-133 at Xe-134
relative OB yields not usedc) [liar 68b] 51-value yields at mass 132 [Ken 57]d) [lye 63] at masses 83 and 131 [Ken 57] (original; 99)e) [Wyt 65] at mass 99 [lye 63]
[Tur 51] It-value yields at mass 99 [lye 63] (original: 89)f) [Bre 67] at mass 14! (average [lye 63, Wyt 65])g) [liar 68a] stable M yields at mass 143 (average [liar 68b, lye 63,
Bre 67]).
A simple average was taken, omitting discrepant data of [lye 63](masses 91, 131, 137, 139, 144), [Wyt 65] (mass 131) and [Tur 51] (mass 97)and the results presented in Table IV under ''absolute7' together with otherevaluations.
This normalization reduces the discrepancies at masses 90 and 97> butincreases the others. However, there is close agreement between the Gs-137yields of [Tur 51] and [Wyt 65] and better agreement among all data at mosses141 and 143» The changes in the final yields are not very significant(cf. Table IV), except for the Os-137 yield.
A common feature of all normalizations is that the sum of yields in thelight mass peak (including interpolations) is less than that in the heavymass peak. In the last absolute normalization the sum of yields in the lightmass peak is 97«67, *hat in the heavy mass peak is 105.32. This and thefact that no high yields in the light mass peak correspond to those at masses140 and 144 in the heavy mass peak suggest that the yields in the region140 - 144 oould be too high. Clarification by further measurements isnecessary.
3,4.2, Discussion of evaluations
As discussed in the previous section the uncertainties of Th-232fission yields depend significantly on a p<orticular normalization chosen.Therefore we shall discuss evaluations and normalizations of other authors
267

and compare them (Table IV) "before we draw any conclusions on the uncertain-ties of available data.
C TOUCh separated pile [Cro 73"b] and fast [Oro 73a] neutron fission yields ofTh-232, which he did not do for U-238. The criteria for the separation arenot quite clear, as under :Tfast7' [dro 73a] the data of [Ken 57] (fissionspectrum), [liar 68] and [Wyt 64], an earlier publication of [Wyt 65], (bothpile neutrons) appear, whereas under -'pile" [Wyt 65] is listed together withthe other data (cf. section 3.2.2.),, Furthermore, we have seen that the shapeof the neutron spectrum above ~lo5 MeV is the essential criterium. In that re-gk>n1he spectrum of fission neutrons in a water moderated reactor is closerto a pure fission spectrum than the neutron spectrum of a fast reactor.
a) ["Cro 73aL table 3, '.'fast' (the reference numbers are those quoted in[Cro 7 3a]): This "evaluation includes the data of [Ken 57] (=ref. 241),[Bar 68] (=ref. 369) and [Wyt 64] (=ref. 389? which is the same as [Wyt 65]).The reference yield chosen for Mo-99 is that obtained by [lye 63] which isnot included in this evaluation. It should be noted that the data quoted inthis table for ref. 369 are those obtained in the final normalization by[Har 68], which include the data of [Ken 57], arid [lye 63], The yields ofstable Kr and Xe isotopes quoted for ref. 369 (=[llar 68]) are those of[Ken 57] in "the normalization of [ll.ir 60] and averaged with those of ref. 24!(=[Ken 57]) in table 3 of [Cro 73a]. On the other hand mass yields 91 and97 [Har 68b] are not used. Furthermore, the data of refs. 241 and 3 9 werenot found using a Mo-99 yield of 2. 78 . Finally, it is not clear why a 10%uncertainty was assigned to the mass spectrometric data of [Ken 57 » Har 68]and 5fo uncertainty to the radiochemical yields of [Wyt 64] (cf. section 3«3»2.).
b) £Gro 73b], table V't "pile;' (reference numbers are talcen from this table):This evaluation includes the data of [Cro 63, lye 63, Tur 51? Wyt 65, Ere 67]among others. It has been shown in section 3«3»2. that all authors, except[Tur 51] » quote standard deviations of relative yields. In this evaluationthe standard deviations quoted by authors were used for references 15(=[Cro 63]), 228 (=[lye 63]) and 326 (=[Tur 51] f / overall error), if theyexceeded 5$» In the case of ref. 336 (=[Wyt 65]) the quoted standard deviationswere used for 8r-90 and I>u-103, whereas for all other yields a common 15$error was assigned, which compares to a r}"/., uncertainty used for [Wyt 64] in[Cro 73a]. An error of 15/j was also assigned to all data of refs. 348(=[Nid 50]) and 367 (=[Bre 67]). To be consistent, either all relativemeasurements should have a common error when converted to absolute yields,or all errors should be assigned individually (e.g. "by adding an estimatedsystematic to the statistical error in quadrature) « [Hid 50 ] IB an earlierpublication of [Tur 5 3 1 " "t not the same data.
It-values have been corrected for U-235 reference yields and Mo-99 waschosen as reference yield (2. 78?' [lye 63]) wherever possible. Since no finalnormalization was made, the averages are not strictly absolute yields. It isnot clear from the experimental data shown how the high Ge-141 yield wasobtained.
°) fMee 72"}; The general statements made in 2.3»3- on how the authors obtainedtheir "updated7- yields are alco valid here. In particular, the referenceyields used in a certain experiment are indicated in the table of originalreference data, but the 'updated" reference yield does not correspond tothe average (or recommended) yield (see table >/, mass numbers 14! [Bre 67]and 143 [liar 68a]; some of such errors are, however, corrected in the latestuptake [Mee 74]« This and the comparison of different normalizations inevaluations (table V) suggest that experimental data were adjusted to give
268

the best overall agreement irrespective of their original reference point.It is possible that the adjustment was changed during subsequent iterationsof the computerized fit to give the smallest overall uncertainty.
Original and revised data, were raised by ~3f> in the light mass peak andlowered by ~4/> in the heavy mass peak in order to make the sum of recommendedyields 100% in each mass peak, thus causing a 7,': change in originally measuredrelative yields in different mass peaks. On the other hand, this is con-sistent with the observation made in this work mentioned at the end of sub-section 3»4«1»
The assignment of relcitive errors to experimental data appears to bereasonable. However, since all measurement!?, are only relative (also in[Mee 72]) these errors are too small when data ara converted to absoluteyields. This is demonstrated by the change of yields in the light mass peakby 7'/' relative to those in the heavy mass peak, which is opposed by uncertain-ties as small as 2"! (stable ]_'r and Xc yields cf. table IV").
It is not clear why the drvtn of [Tire 67! are assigned much higher errorsthan others, as their quoted uncertainties are comparable to those of otherauthors (cf. section 3»3«2.). Those yields of [Tur 51] which were measuredrelative to U-235 should be assigned lower uncertainties, as those assignedby the authors [Tur 51] arc overall errors including those of the referenceyields. Also in [ij.ee 72] both nets of data [Uyt 64, Wyt 65] are used as wellas [Hid 50, Tur 51].
Ojtee 14], is an update of [Mee 72] published recently. It is included intables IV and Vt as a comparison with the previous evaluation [llee 72] andothers is interesting but will not be discussed in detail.
In this new evaluation some normalisations of experimental data arechanged consider-ably (cf. table V")» Also the uncertainties of the data areincreased, some even drastically (e.g. [lye 63], Ba-140 and CJe-141 yieldsfrom ~4«7$ to ~30;;''). It appears from p, few checks of the new evaluation thatfor some yields "estimated'" by evaluators (e.g. [Eng 65, Sid 72, Lam 73]) notonly updated values wore calculated; but they were even included in weightedaverages., This should be further chocked but in no case should they be mixedwith experimental data,. They should even be omitted from the tables*
In the new evaluation the duplication [Wyt 64, Wyt 65] is avoided.
3»4«3« Comparison of evaluations
Different normalizations made in this work are compared in Table IV tothe evaluations discussed in the previous subsection. Differences in thegeneral trends of yield values are due to the particular normalization chosenfor each set of data, differences in individual relative yields are, inaddition, due to the weights (including omissions) assigned by evaluators toexperimental data.
The effect of the normalization should be such that the recommendedyields in the light mass peak of [Mee 72, Mee 74] should generally be higherthan others, as relative yields were increased by 3 to moke the sum ofyields 100$. 'Absolute'1"' yields of Lcsnmer (table IV) should in both masspeaks be comparable to those of Grouch [Oro 73a, b], who used the Mo-99 yieldas reference. Other yields evaluated by Lammer (see table IV) should be lowerin the light mess peak, as they were obtained by making the sum of yields inthe heavy mass peak 100$ (see discussion in previous sections). In the heavymass peak the ''absolute" yields and those of [Cro 73] should generally be
269

Table> IV. Comparison of evaljxat_e_d_Th~23_2 fast fission yieldsUncertainties are given in ?-. in brackets
Massno.
72737783048586878889909193959799
103105106109111112113115117121
123125127131132133134135
Table II
.00034
.00046
.011.903-443.745.696.016.346.437.276.927.655.414.022.74.153.04.041.040.04.06.058.057.051.056.032.034.0761.522.693.755.064.76
LaromerLam 73
.01021.07
3-444.025.665,996.326.727.407.267.215.303.962.76.146.05.041.042.045.062.06.057.049.055.031.033.0891.522.703.745.064.65
absol .
.00036
.0005
.011.983.623-93-5.976.316,66
6.777.257-317.415.334.102.75.155.07,05.04.06.07.06.06
,05• 05.03.03.0751.602.833.965.325.30
CrouchCro 73b Gro 73a
.000136(15)
.00035(50),011(24)
1.98(9)
6.96(5)7.24(4)5.18(11)7.86(15)5.30(6)4.65(9)2.78 -.15(6).072(14).043(10).050(7).054(14).057(14).045(7).050(13).048(11).046(15).027(15).037(15).17(15)1.27(22)1.76(15)
2.03(7)3.72(7)3-95(7)6.11(7)6.57(10)6.92(10)
6.99(5)
2.78 -
1.87(11)2.82(7)3.75(10)5-48(7)4,66(10)
Meek andMee 72
.00027(16)
.00054(32)
.0126(8)
2.14(4)3.91(4)4.06(2)6.25(2)6.81(4)7.18(4)7.79(8)7.85(4)7.33(4)7.28(16)5.64(8)4.38(4)2.85(4).0164(4).040(8).053(4).051(8).078(8).088(8).072(8).063(8).070(16).047(8).044(8).034(16).078(4)1.58(2)2.67(2)3.85(4)5.15(2)5.07(4)
RiderMee 74
,00035(16).0005(23).0126(8)2.04(2)
3.72(4)3.82(2.8)6.09(2.8)6.48(4)6.85(4)7.83(8)7.96(6)7.10(4)7-75(8)5-53(8)4.12(2.8)3-02(6).167(6).036(11).045(11).060(16).085(8).091(6).061(23).088(16).059(16).052(8).036(16).036(11).096(8)1.45(2.8)2.66(2)3.66(2.8)4.87(2.8)4.85(4)
230

Table IV (continued)
Massno.
136137139140141143144145146147148149150151153156
"lable
5,384.506.?33.457.407.027.495-704.383.132.151.471.08.42.21.0026
LammerII Lam 73
5.30
4-447.38
8,317.287.127 0665.784.952.972.181.441.09,41.21
.0026
absol.
5.65
6.457.328.487.487.227.955.865.62
3.002.21
1,48
1.10
,42.24.0026
CrouchOro 73b
4.76(9)7.60(10)
7.59(7)7.60(0)6.81(4)7.10(4)
2,96(6)
1.22(30)
,46(15).22(15).0029(15)
Uro 73a
5.55(7)5.92(18)7.00(10)
7.72(5)7.26(5)6.79(10)7.98(5)5.52(10)4.73(10)
2.08(10)
1.04(10)
Seek andhee 12
5.20(4)5.28(4)6.50(4)7-81(4)7.29(4)6.87(4)7.50(4)5.37(8)4.60(8)3.05(8)2.02(8)1.23(16).99(8).40(16).19(16),00?5(16)
IJiderIlee 745.12(2.8)7.02(6)
6.73(4)7.91(4)7.65(6)6.99(4)8.22(6)5-67(4)4.85(6)3.27(6)2.11(6).94(16).34(16).175(16).032(16).0027(11)
higher than all otherst for which the sum of yields is 10Q$. L An ition of Table 17 shows that these general trends can only be observed approx-imately in the light mass peak. Whereas relative yields, which were originallymeasured mass-spectrometrically, agree in all evaluations, differences in pre-ferred values at other mass numbers are large enough to influence the wholenormalizationt particularly in the heavy mass peak.
Table V compares how evaluators have adjusted experimental data. ThisTable is restricted to measurements discussed in section 3.1. and evaluationsshown in Table IV. The mass numbers chosen are those for which severalmeasured yields exist and waich are essential for the normalizations obtainedby evaluators. The most important observations can be summarized:
a) Comparison of normalisations.In Meek and riders evaluations [Hee 72, 'hee 74] "the data of [Tur 51](and [lid 50]) are much higher them in any of the others. The reasonfor this is not clear. A. possible explanation is that the adoptedyields to which the data, were adjusted in the evaluations [llee 72,Hee 74] are rather high (e.g. masses G3, 89, 90, 99, 144, see alsodiscussion below) and/or the yields of fTur 51] particularly low (e.g.masses 1318 140). In any case, the good agreement of the yieldsmeasured relative to U-235 thermal fission, which can be readjusted likeK-values in evaluations, with other measurements is distorted in thisnormalization. This suggests that the ""-value type* data of [Tur 51]should bo treated neparatly from the others.,
271
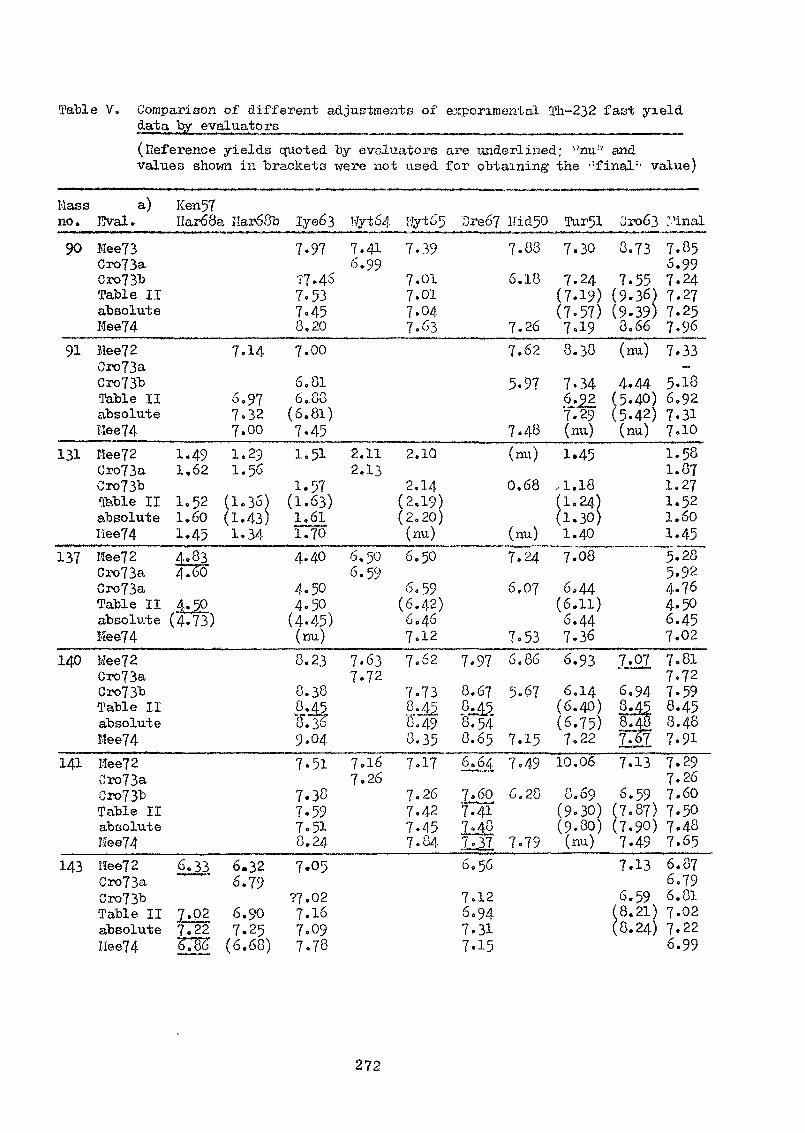
Table V» Comparison of different adjustments of experimental Mi-232 fast yielddata by evaluators(Reference yields quoted by evaluators arevalues shown in brackets were not used for
Massno.
90
91
131
137
140
141
143
a) Ken57Eval. I.lar68a IIar68b
Mee73Cro73aGro73bTable IIabsoluteMee74Hee72 7.14Gro73aCro73bTable II 6.97absolute 7 , 32LIee74 7.00
Mee72 1.49 1.2?Cro73a 1,62 1.56Cro73b•feble II 1,52 (1.36)absolute 1.60 (1.43)Hee74 1.45 1,34Mee72 4.83Cax>73a 4756"
Table II 4^_0absoltxte (4.73)Hee74Mee72Cro73aCro73bTable IIabsolute
Mee72Oro73aCro73bTable IIabsoluteIIee74Mee72 6.33 6.32Gro73a " 6,79Cro73bTable II £,,02 6.90absolute 7.22 7.25I:iee74 CTJ (6.68)
1 3
7.97
77.467.537«458,207.00
6,816,80
(6.81)7.451.51
1.57(1.63)1,611.704.40
4.504.50
(4-45)(nu)8.23
8.388.4587369.047-51
7.387.597.518.247.05
?7,027.167.097.78
Wyt64 Wy
7.41 7.6,99
7.7.7.7.
, ,-(_
3901010463
-o
2.11 2.102.13
2.14(2,19)(2.20)
(nu)6,50 6.6.59
6.(6.6.7.
50
5942)4612
7.63 7.627.72
7.73£-.458.498.35
7.16 7.7.26
7.7.7.7.
17
26424584
7
8
§86
77116
7677
underlined; s;nu:? andobtaining the -final" value)
reo7 !Tid50
7.88
6.18
7.267.62
5-97
7.48(nu)
0.68
(nu)7.24
6.07
7.53.97 6.86
.67 5.67
• 54".65 7.15i&i 7-49.60 6.28.41.48.•37 7.79.56
.12
.94
.31
.15
Tur51 Cro63
7
7(7(7
7
.30
.24
.19)
.57)
.198.38
7.34
7~29(nu)1
17
6(6676
6(6(67
.45
.18
.24)
.30)
.40
.08
,44.11).44.36.93
.14
.40)
.75),22
10.06
8.69(9.30)(9.80)
(nu)
3,
7.(9.(9.a.
73
5536)39)66
(nu)
4.44(5.40)(5-42)
(nu)
6.948-458748LiZ7.
6.(7.(7.7.7.
6.(8.(8.
13
5987)90)4913
5921)24)
I'inal
7.855.997.247.277.257.967.33
5.186,927.317.101.581.871.271.521.601.455.285.924.764.506.457.027.817.727.598.458.487.917.297.267.607.507.487.656.876.796.817.027.226.99
272

Table V (continued)
Mass a) Ken57no, Hval. JlarCOa IfaroOb Iye63 v.?yfc£4 Uyto5 Lre67 lad50 Tui>51 <Jro63 Final
144 Hee72 7.01 7,08 7.CO ?•[50 7.74 7.93 7.00 7.50Oro73a 7-9"' 7.90Cro73b 6,98 7.98 0.14 6.49 6.93 7.15 7.10Table II 7,09 7-05 7.94 (7*33) (9-03) 7-49absolute (7-02) 7.89 0.01 (7.73) (9-06) 7.95Kee74 7.C9 8,62 0.16 0,05 0.26 0.19 8.22
a) [llee 72, llee 74] -'updated values are shown,•"'Table II'1'; The -final" values of T'-ble II r,re shown in the last column,
These were obtained by multiplying the •average-' yields of•T-xble II by the factor 1.056. In order to allow a bettercomparison with the other evaluations, all experimentaldate, shown in T-'Vble II are Multiplied by the same factorfor this table.
It can general be observed that the normalizations of Grouch andLammer are rather similar and different from thoso of ITeek and rider. Thedata of [Wyt 65] are corrected for |1- and Y-rsy intensities in this work(Table II and "absolute"') and therefore the adjusted valuers differ fromthose of other evaluators, but the agreement with other measurements icimproved. The nonvialiflatioiv-; of the measurementc of [3ro 63] differconsiderably.
b) Comparison of recommended, yields-
In the evaluations:. [Cro 73j '-lee 72, Tee 74] recommended yields wereobtained from vreighted averages, as discussed in 3«4«2. In the presentwork the reliability of the deta was judged from the experimentalmethod employed and the overall agreement, generally a simple averagewas calculated and discrepant data omitted. Those different methodsare reflected by a comparison of adjusted experimental data and "final"yields in Table \7'» In the case of [lice 74] the selection and averag-ing is not so obvious because additional data sets not shown in Table Vwere used, possible also estimates (see subsection 3»4«2.).The high Sr-o9 yields of [llee 72, I'iee 74] (see Table IV) are due tothe normalisation of the data of [Cro 63, 'iur 51, Hid 5°]« Highervalues obtained in these evaluations for other yields in the lightmass peak are due to their final normalization to make the sum ofyields total 100 , The influence of the high weight given to the dataof [Gro 63] by Crcuch is reflected by the final mass 91 yield.In the heavy mass peak mass speotrometric data were preferred in theevaluations "Table II1, 'absolute'' and [lice 74.] > m the latter this isdone only effectively by assigning a much smaller error to these data.
Mass 131; The higher weight assigned to [llyt -64] in [Ore 73a] is reflected bythe average. In the case of [C,ro 73b] the low average is due to the factthat Crouch has assigned a 15/'> error to the extremely low value of [Hid 50](who quote no error) which iy opposed to a 5°/> uncertainty for [Tur 5 3
273

(as given by the authors). Similar observations con be made for 3sexcept for the strong influence of the low yield measured by '
The high Ba-140 yield evaluated in this work is due to the correctionof the [Wyt 65] measurements and the omission of other data. In the otherevaluations the rather high weight given to the measurements of [Cro 63],which were discarded altogether in this work as being completely out of therange of other values, has a noticeable effect on the final value. The Bameis true for the C/e-j.41 yield (except [Cro 73b]j see 3.4.2.), and mass_1.43_ inthe case of [aro'~T3b]7 The final mass 143 yield obtained in [Mee 72, Kee" 74]is determined by the mass-spectrometric data and it is not clear how theywere adjusted in these evaluations.
The lower Oej--144 yield of [-Jro 73b] is due to the high weight assignedto the H-value measurement of [lye 63j. The comparison of individual dataadjusted by [Oro 73b] and [liee 74] is a good illustration how agreementamong experimental data is influenced by the particular normalizationschosen.
3»4»4« Uncertainties
In [Lam 73] no uncertainties were assigned to individual yields, but aminimum of 5/> was estimated to be due to the final normalization. The evalu-ation procedure outlined in 3«3. did not allow to calculate a variance ofthe mean obtained, as experimentnl data were not weighted by the reverse ofthe squares of their errors. Errors quoted by measures are generally stan-dard deviations and lack of time did not allow to analyze experimental resultsin detail and estimate overall tincertaiiities as discussed in section 3«3«In addition it was felt that the absence of absolute yield measurements andthe rather arbitrary adjxistment of relative yields do not allow a reliableassignment of uncertainties to individual yields. These arguments have nowbeen confirmed by the other new evaluations discussed above-, as Table V shows.On the other hand, this comparison allows a better estimate of the uncertaintyintroduced by the normalization.
As in the case of U-238 fast fission we shall discuss the uncertain-ties of those yields in more detail that are either used in fuel analysis(burnup) or which are commonly used as reference yields. Since we areeasentially dealing with relative yields we shall estimate their accuracyfirst and then add an error for conversion to absolute yields. Individualestimates are presented in Table VI.
Column P of Table VI lists the precision obtained in the measurementsdiscussed in section 3-1. (see also 3«3«2.), expressed as 1 standard deviation.This is the average of the most accurate measurementc generally (lye 63,Bre 67t Wyt 65]. The precision is combined with an uncertainty of 2 - 4$ toobtain the overall experimental accuracy, listed in column A of Table VI.This additional uncertainty accounts for calibrations corrections, nucleardata, etc., and is taken to be about 2/j if mass spectrometry or an It-valueor different independent methods are involved, and about 3 - 4$ f°r roorarecent radiochemical measurements, but in no case was A allowed to be lessthan 3$» It has to be kept in mind that the accuracy A represents thecapability of the experiments discussed but docs not include a comparison ofthe actual results. The latter depends on how sets of measured relativeyields are adjusted to one another. ?or this purpose the different adjust-ments as presented in Table V (and Table II) were used and standard devia-tions of the unweighted average calculated. These turned out to be similarfor all evaluations and typical values are shown in column avg of Table VI,which should reflect the agreement among experimental data. Column "relij
274
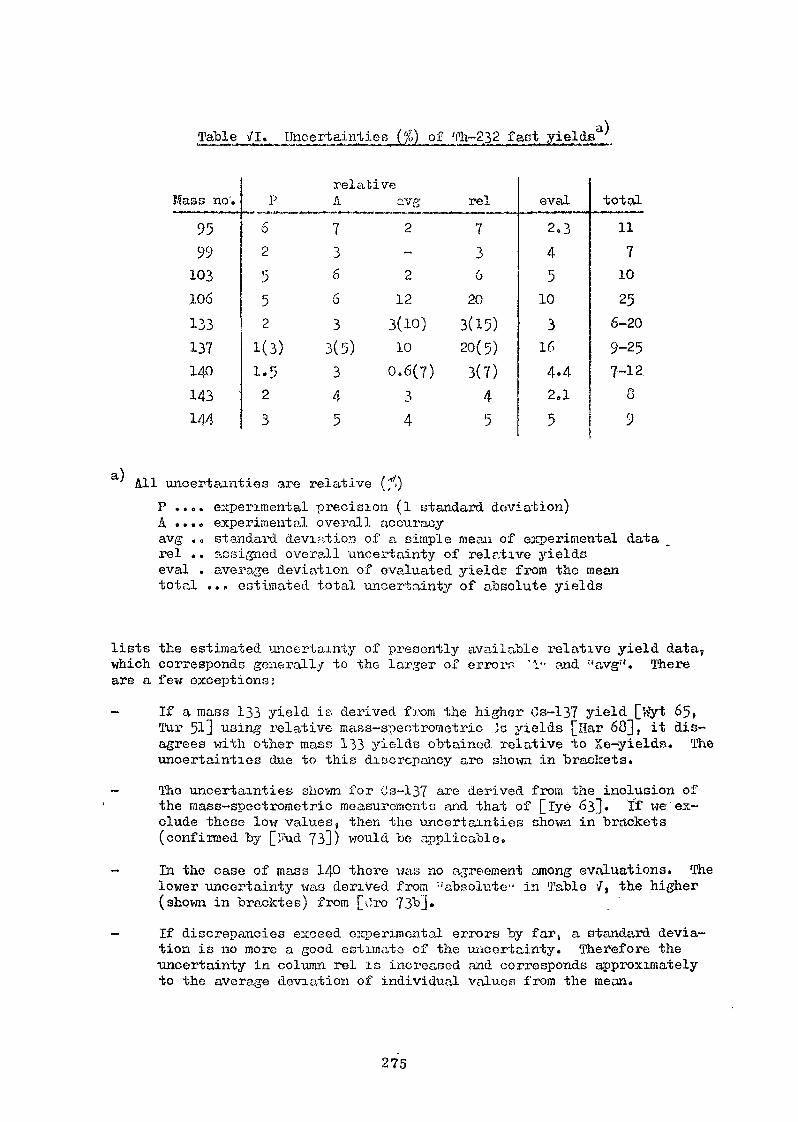
^) of ri^-
Mass no'.
9599103106133137140143144.
relativeP
62
552
1(3)1.52
3
A
736633(5)345
c.vg
2-2
12
3(10)10
0.6(7)34
rel
73620
3(15)20(5)
3(7)45
eval
2.345103164.42.1
5
total11710256-209-257-1209
' All uncertainties are relativeP .... experimental precision (1 standard deviation)A ...« experimental overall accuracyavg .. standard deviation of a simple mean of experimental datarel .. assigned overall uncertainty of relative yieldseval . average deviation of evaluated yields from the meantotal ... estimated total uncertainty of absolute yields
lists the estimated uncertainty of presently available relative yield data,which corresponds generally to the larger of errorn '!!" and ;iavg:'. Thereare a few exceptions:
- If a mass 133 yield is derived from the higher Cs-137 yield [Wyt 65,Tur 51] using relative mass-speotrometric .Ja yields [Har 60], it dis-agrees with other mass 133 yields obtained relative to Xe-yields. Theuncertainties due to this discrepancy are shown in brackets.
- The uncertainties shown for Cs-137 are derived from the inclusion ofthe mass-spectrometric measurements and that of [lye 633. If we'ex-clude these low values, then the uncertainties shown in brackets(confirmed by [}i\id 73]) would be applicable.
- In the case of mass 140 there was no agreement among evaluations. Thelower uncertainty was derived from ''absolute- in Table ifs the higher(shown in bracktes) from [\'!ro 73bj.
- If discrepancies exceed experimental errors by far, a standard devia-tion is no more a good estimate of the uncertainty. Therefore theomcertainty in column rel is increased and corresponds approximatelyto the average deviation of individual values from the mean.
275

The uncertainty duo to -the conversion of relative to absolute yields itsunknown, but can be estimated in two different ways. lieek cuid idder [Mee 72]and Lammer (• absolute-1) have tried to derive absolute yields from experimentaldata and have observed deviations of X' and 4$ respectively 3# and cj% in thesum of yields in the light and heavy mass peak from lOO,1',. (Crouch has notcompared the num of his yields to 100$ and in [llee 74] the adjustments ob-tained finally in [llee 72] were used,) ?rom this we may conclude that theuncertainty due to the final normalization is about 3 - 5/« &s anotherapproach we may compare the final valxios of different ©valuators. Theaverage deviation of individual evaluated data from the mean (a standarddeviation of the mean itself is meaningless in this case) is shown in column"eval>! of Table '/I. [Lam 73j was not used for this comparison, as the dataare similar to those in Table II. These average deviations are about2 - 5/5 in agreement with the first estimate of 3 - 5.'» except for those massnumbers where discrepancies exist already onion,; experimental data.
uncertainty due to the final normalization has to be added to theuncertainty of relative yields as the normalisation ic not independent ofrelative yields njid causes a shift in one direction. An. average of 4% isadded to each of the estimated uncertainties of relative yields and theestimated total uncertainty of absolute yields is r-shown in the last colvtmnof Table VI. A range is given if 2 xmocrt, unties of relative yields wereestimated.
Relative wd yields have an accuracy of 1.4/-> 3% 1«47* find Bfj for massnumbers 145? 14*5 1 148 and 150 respectively [Uor 68a]. Absolute M yieldsdepend on the accuracy of the maws 143 yield. Their overall uncertaintiesare 8f, for masses 143, 145 and 148, 9< for Ud-146 and II"' for iJd-150(errors combined quadratic ally in this case).
Other yields:
- Absolute yields of stable Kr and Xe have on accuracy of about 5$(from [lf.on 57] )» unstable Kr-87, 80 and Ke-133 (see also above) about6fi> accordingly.
- Other absolxite yields in the pealc regions should have an accuracy ofabout 8 - 20f?. It should be noted th.?t discrepancies up to about afactor of 2 exist amonf; measured mass 131 yields, but the mass-spectrometric data are considered more reliable by all evaluators inthis case.
- yields in the valley region are based Mainly on li-value measurements.Hero the U-235 reference yields have on uncertainty of ~10$ forexperiment.?! data, and about 20 - 30'f, for interpolated yields (masses113, 117 t 119)« Variation of those yields with neutron energy has tobe checked.
- Yields at the light wing below mass 83 are scarce. Measured yieldsin the heavy wing at mass 148 '-nd below show two different trends;[lye 63] on the one hand and [liar 6 On, 3re 67] on the other hand.Although not very likely, these differences could be due to differ-ences in the neutron spectrum. This effect should be further in-vest i gated P
Presently the accuracy of Th-232 fast fission yields is limited by thelarge uncertainty of the conversion of relative to absolute yields. Reli-able measurements of absolute yields, particularly at reference points, withstiff icientlyhigh accuracy should reduce this uncertainty considerably.
276

Uncertainties of relative yields could "be reduced raid combined woth thoseof absolute yields in quadrature. Thus uncertainties of presently 7-9/f couldbe reduced to about 3 - Aff tfithout additional relative yield measurements.
3 « 5 « .
3 « 5 • 1 • 0T-'-i t abl o t eohni que s
These are essentially the Game an mentioned for U-238 fast yields.In addition it might be stated that ^i/nma-spectrometric techniques r,s uoedby [Wyt 65! and ['Ore 67] are more suitable especially for measurements ofZr-95, liu-103s j ji-106, Jo-141-, !e~144 -und other fission products for whichdaughter product B have to be taken into account or which involve decay curveanalysis in G-Gpec'trometry. Possible systematic errors in chemical separa-tions are the some as in p-fr
3.5»2» further measurement r, required
Tho recommendations fox- further measurements are similar to those forU-235 fast fission yields* i.'irst of all, measurements of absolute yields areneeded. "Suitable fission products are nr-90., 3r~-y5» 1 10-99. I-13l} -s-137v3a-140, Je-141 '"'J d Oe-144? or id-isotopes:; if Ki-.i.s£3-»peotronietiy is employed.These proposal*:, include the .eedetcmiination of the ratio of yields in thelight mass peak to those in the hervy maps pe?>k and a check of yields-1, in themass ran^e 1AO - 144 relative to others.
A fairly lar.'je number of rep.f.sono,!)] '- -iccux'ate rneanurements of relativeyieldn already eyiots. It can be hoped that the proponed future measure-ments help to select among these data, resolve the inconsistencies andclarify the uncertainties ariso--.ir.ted presently with normalization pointw.
As for U-238, the change of yield,'.; vath inciaont neutron energy orneutron spectrum should, be s buttled.
3 • 5 • 3 » LValuat ion wo rk
In thin evaluation the data of [ "ro £3! were corrected for half-life andthose of f"Jyt -55'J for y-ray abundance, "j-ibtli corrections vrere not nuc.cesyfulin renolving the most serious discrepancies, although in the. co,se of [l^yt 65]the agreement with other data coul'l he improved for some yields.
revaluation x-;ork shovild ..urn at the proposal put forvrr.J?d in section2,4«3« In particular, the causer, of the discrepancies should be investigated,but further experimental work should be awc\itfed in view of the unclearsituation.
This contribxition in its present form liar.; been extended and revised in1974- It therefore contains information not included in the original contri-bution sent to J „•"-..
original contribution wo,f.s done rather hastily and therefore in-complete and unsatisfactory. It was followed by letters with further com-ments, corrections and additions (e.g» 'the inclusion of [job 71] m the U-238survey and its consequences ) •> I.ince the -rtile war: not suitable for publi-cation, the whol c contribution war; revised to include all additional informa-tion and, as a consocruence of more thorough work, normali actions iind evalua-
277

tionn are now studied in more detail. It will be noted by the reader thatreferences published in 1974 are included for completeness, if they containimportant information, whereas evaluations not dealt with in Review Paper libare omitted here. Therefore it should "be noted that important informationcontained in this paper was not available at the time of preparation of Re-view Paper lib (e.g. estimates of uncertaintiesy nonnoliaations other thanthose in Table II, discussion of [• ee 72, L'ee 74]).
Just now I became aware of a recent publication on absolute 'i1h-232 fastfission yields (j,,;« Deen, I?,,0* Draper Jr., Trans. *m. tfuol. Soc, lj[ (jlov.1973) 531)» The results cause more confusion than adding to a clarificationamong the data discussed in chapter 3, \ have a few reservations about themeasurement method, but the description given IH too brief. Lore detailedinformation on data used and corrections applied is necessary to allow moredefinite conclusions.
Great care is required in the design of future measurements; calibra-tion and data analysis, if the results are to clarify the present situationin both Th-232 and IT-238 fast fission yields. Also the discussion of whetherdiscrepancies can be explained by different neutron spectra should be settledby a measurement of this effect for various mass numbers, neutron energiesand neutron spectra in one experiment, or several coordinated experiments.
References
Eon 60 K.K. lionyushkin et al, AT:-tr-4532 (1960)Bre 67 I... Bresecti et al, J. inor<?, nuol. Chenu 2j? (1967) 13.89Bun 50 L.,i. Bunney et al, 2nd Int. Oonf. njA!?, Geneva 195uf /o3. 15, p. 449Ciu 68 L. Ciufollotti, rtnargia Nucleare 15 (1968) 272Cro 63 J.U, Oroolc and A.L-'1. Yoight, L>558 (1963)Cro 73a E.A.O., Ji-ouch, U.K., V.ep. 1T:Lrr-.;-7394 (1973)Cro 731" E.A.O. Crouch, IAEA r;yrnpo:.iiura on Jucle.u- "Data in Science and O'ech-
nolOi^y, Paris, Larch 1973» proceeding v'ol. I, p. 393
Gun 72 J.Go O'uningharne et al, m.iE-6862 (Hev) (1972)Deb 73 K» 3Debertrn» private communication, Hay 1973 paper sumbitted to
Ladiochim. Acta.Die 71 i;. Bierckx et as J. iJucl. Tn. 2J_ (1971) 85Ede 73 O.J. Eder and. Ij. Loiamer, IA11A Bymposiutn on Nuclear Data in Science
and Teclmolo/jy, Paris, March 1973» proceedings /ol. I, p. 233
En£ 51 D.W. Eivjelkemeir et alf paper 318 in ; :adiochemical Studies- TheFission Products" ( '3.0. vJoryell, II. 'Jugarman, MB.), il.U.IU.S,,Div. IV•» »Tol. 9, Part / , JJook 3, p. 1375and: AWL-4927 (1552)
En^ 65 ut'J.1. England, V/AFD-T—333, Add. no. 1 (Jan. 1965)Far 52 IT. T>'arrar and i.Ti.. Tomlineon, liuol. Phys. 3.4 (1962) 367Tiud 73 A.J. Fudge ("ilarwell, IK) during Panel discussion, results quoted as
private communication in fj'.ee 74]Har 68 J,T r. Harvey et al, Can. J. •-'Jhem. 46 (i960) 2911
a) mass spectroraetric measurementsb) Ge(Li) i;-valTies
278

lye 63 R.II. lyer et al, J. inor^. nucl. G'hem. 2% (19^3) 465Kel 54 a.U. Xeller et al, Phyc. liov. pj. (1954) 9^9Ken 57 T.J. Kennett nnd II. G. Miodo,, Gen. J. Phya. (1957) 9<>9Ko"b 70 JC. Kobayachi and I. iLimura, Tr,Aifl)ij( j)~19t,, p. 37
nnd annual reports iar'ulI-3 (1970) 04Lorn 73 H. Lcunmor nnd O.J. ISAer, IAF.A Sympoaixwi on Juolear Data in Science
rand Technology, Parin, ilnrch 1973i proceedingc Vol. I, p. 505Lam 73<"i "• Tjcunmer, contribution to Itevievr Pnper 12, theoo- Panel proceedingsLorn 73"b 5I« Loruner, informal contri"bution to Iteview Paper Ha (V/.II. Walker),
this Panel.bar 72 It, P. Larnen et al, Trono* Am. Hucl, Soc. 1 (1972) 483Lar 74 T^.P. Larsen et al, iiucl. Oci. Rnsg. ^/j. (1974) 263Lev 61 U.S. Levy et al, Phyn. liev. 12/j. (196!) 544Lis 70 F.L. LiBman et al, Fuel, 3ci. En,5g. £2 (1970) 191I-i'an 72 P. Ilanero and V. Konshin, At. Jin. Review 10 (1972) 637Hat 64 v'^.iC. Kathews, Ph.JD. Tliesio, llc.Iacter Univeroity, Hamilton, Ontario,
CanadaHat 72 O.K. Hobhewo and n.n. Itomlinson, 'Jan. J. Phys. ^0 (1972) 3100Kee 72 U.S. Ileelc and B.I?, aider, UQABC report KEDO-12154 (Jan. 1972)Mee 74 U.K. Ueek and B.F. Idder, OTTO-1 21 54-1 (Jnn. 1974)Hid 50 J.B. JTiday and A. Turkevich, AKCTO-2862 (1950),
see altjo App. 31, loc. cit. ref. [PJn^ 5^1Pet 60 K.A. PetrzhoJc et al, .!T!W-tr~4696 (i960)lUd 67 li.l-'. 1-tider et al, USAJ3C report GKAP-5505 (19<^7) 21Hob 71 li« ^oliin et al, Proc. Int. Conf. on Ohemioal Huolear ])ata, Canter-
bury (inO, 1971, P. 19Sid 72 fl.H. rJidebotham, tnCfil'A Hep. TIM-2L43(;i) (1972)Tur 51 A. Turkevich and J.B. Uiday, Phys. i7.ev. 84 (1951) 52W«l 73 W.II. Walker
a) Keview Paper lla, this PanelTs; Proo. 1,1111 oympooitan on ifviclear Data in ficience and Technology,
Paris, j larch 1973, 7ol. I, p. 459c) AP!CL-3037/Part II (1973)
Wan 55 U.K. Wonleso and JT.G. TJiode, Can. J. Phys. 3J, (1955) 541Wyt 64 A. Wytteribach et al, itadiochim. Actr. 3_ (19^4) 110Hyt 65 A. IJyttenbach. and II, il. von Gunton, IAEA Gympoaium on Physico and
Chemistry of Fission, SalzTaurg, 1965, Vol. 1, p. 414
279

COMPILATION OP FISSION PRODUCT YIELDS OP U-238 FOR 14 MeV NEUTRONS
S. Darficay, P. Raics, S. NagyInstitute of Exp. Phys. Kossuth Univ., Debrecen, Hungary
Abstract:
Measured cumulative yields from the 14-15 MeV neutroninduced fission of U-238 have been collected, corrected and re-commended values are proposed /also for masses without any pub-lished experimental data, by interpolation/* The available in-dependent and fractional cumulative yields are presented too*
1» Present status of the U-238 14 MeV neutron fissionyield compilations
There are some new careful compilations of fission pro-duct yields for various fissile nuclidee, e,g, [l, 2, 3J » butthe situation is quite different for the 14 MeV neutron fissionof U-238*
Katcoff, 1960 [4] : Generally available recommendationcontaining the largest number of data up to now* The originaldata and errors have not been given. This compilation includes
experimental data up to I960.
Gunten.1969 [5] : Only recommended values have beenpresented for a limited number of masses, vdthout error quotation,
281

Meek and Rider. 1968 [6] j Kot generally, availablecompilation. It is known for us only from references.
Zysin et al. 1963 [?] and Greahilov et al. 1969 [8]Only collections of measured data without recommendations*
2. Collection of experimental data
We <?id OUT best to collect 14 MeV neutron fission yieldsof U-23R published up to now, but are not sure whether we have notmissed the one or other work. In particular, laboratory reportsor preprints have not been available to MR at all.
We have collected yield data measured in the neutronenergy range of 14 - 15 MeV.The published neutron energies andtheir uncertainties /if they have been quoted/ are listed togetherwith the references* -.
Tn addition to our recently published yields''{pa73}we have taken some preliminary results of'our new measurementjpa73al in some critical cases.
3 • T re a tin e n t o f the m e as u r e d y i e 1 s
All measured yields, for which a literature value wasused for normalisation,were treated as relative ores.
All absolute measurements /employing fission chambersor flux'monitor foils/ included a determination of either theMo-99 yield or the Ba-140 yield or both. Tn order 'to take intoaccount all absolute measurements, we have first evaluated theMo-99:Ba-140 yield ratio by averaging all available data /Table I/.Using this ratio, we have then evaluated the absolute yields ofMo-99 and Ba 140 /Table TT/. These absolute yields were used tonormalise the other measurements wherever possible. These wnew"cumulative yields have been converted into absolute chain yieldsaccording to Wethaway JKe7?I . The original measured and the "new"cumulative yields as well as the recommended chain yields formass numbers between 66 and. 172 are presented in Table TTI.
282

Table IV contains a collection of the measured inde-pendent and fractional cumulative yields without recommendationsbecause generally single measurements are only available for eachinvestigated fragment.
4. Comments to the Tables
Data which severely disagree with others or data thatare considered as being unreliable are marked with a " + " signIn the tables and not included in the average. We have assumedthat the errors quoted by authors correspond to one standarddeviation (68,3 % confidence level).
Both the simple /A/ and the weighted averages /WA/ werecalculated with their standard error in all possible cases asfollowee:
A ~ N
£where Y* and. Yi are the measured yields and their standard atrorsrespectively. The same errors were accepted for the recommended ,chain yields although their physical meaning is very questionable.All errors are written after the values for the last figures, e.g,0,625 12 means 0.625 1 0.012. If the yields are less than0,001 % an abbreviated normal,format is used, e.g, /8.5 9/-5stands for /8.5 + 0.9A1CT5*.
Abbreviations used for the experimental methods:
a./ General methodsEC - measurement with radiochemical separationMS - mass spectrometry /including also on-line methods/DG - direct Geld gamma spectrometry of the irradiated sample
without any chemical separation or using recoil effect
"J
283

DGR - as DG without Geld, efficiency calibration using the BOcalled R~method /relative to the same fragment in theU-235 thermal neutron fission/.
b«/ Detection techniques in the RC methodbe - simple beta counting with end-window GM-tube or not men-
tioned clearly in the original paper2be - beta counting with 2K gas flow proportional counter4be - beta counting with 45T gas flow proportional counterga - Kal/Tl/ gamma spectrometryGe - GeLi gamma spectroraetry*
c*/ Absolutisation methodsPC - absolute counting of the fission events with a fission
chamber27Al - neutron flux measured by the Al vn,alpha/ monitor reaction
using literature cross sections for monitor and fissionreactions
6*5Cu - same as Al but using,Cu3/n,2n/ monitor reactionR - R~method /see above/*
When the method was not mentioned clearly in the ori-ginal article or the latter was not available for us the methodis marked with " ? » sign.
Corrections on the measured yields were carried outusing the following accepted data;
- the cross sections for the monitor reactions atdifferent energies by the compilation of Kanda and Kakasima [9] ;
«•» the U-235 thermal neutron fission yields of Wahl [1]were used for the R-method,
- the U-238 fission cross sections at different neutronenergies by Pitterle's new data [lO],I» the choice of Pitterle's new U-238 neutron fission cross sec-tions we have been influenced by their freshness although thereare other references /[l5J, [$e69,72], Pitterle's old curve, etc/giving values higher by 4-7 ft,
As original articles did not contain sufficient in-formation on half-lives, beta or gamma ray energies and intensi-ties, conversion coefficients etc. used in the data analysis,it was not possible to correct published yields using recent data.
284
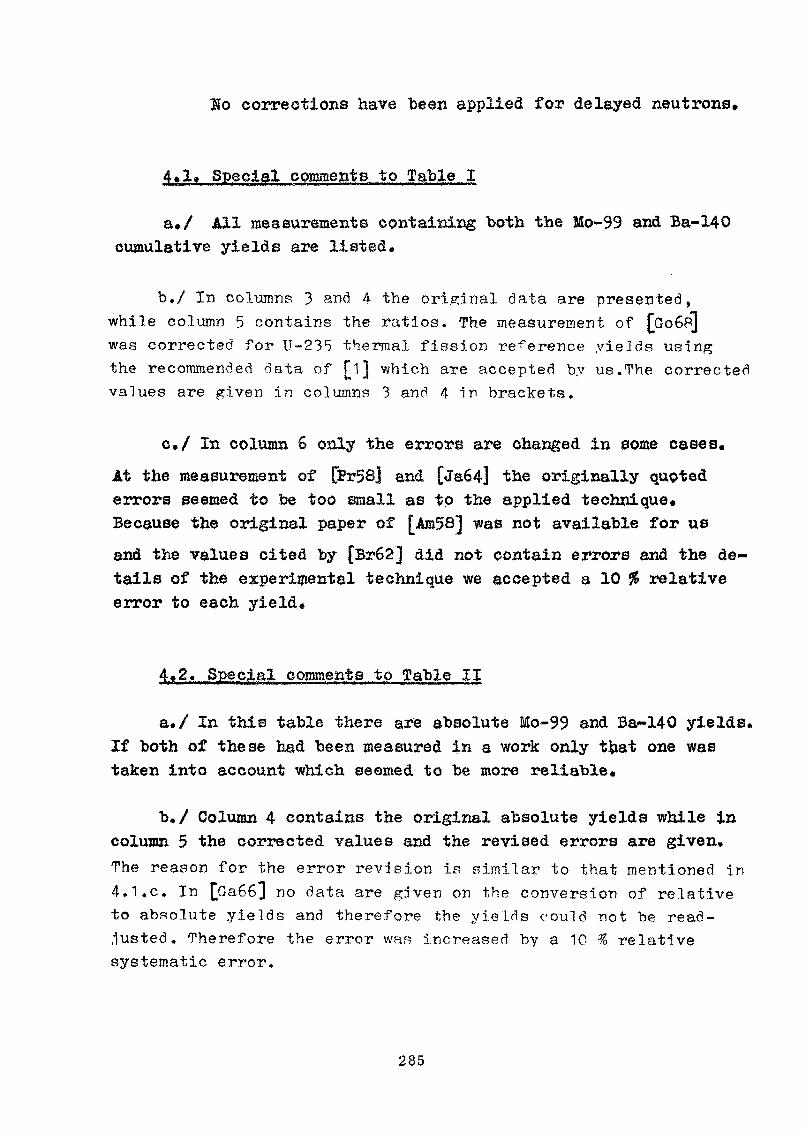
$0 corrections have been applied for delayed neutrons*
4»1» Special coionientB to Table I
a*/ All measurements containing both the Mo-99 and Ba-140cumulative yields are listed,
b./ In columns 3 and 4 the original data are presented,while column 5 contains the ratios. The measurement of (po68Jwas corrected for U-235 thermal fission reference yields usingthe recommended data of £1] which are accepted by us.The correctedvalues are given in columns 3 and 4 in brackets,
c./ In column 6 only the errors are changed in some cases.At the measurement of [Pr58j and [Ja64J the originally quotederrors seemed to be too small as to the applied technique.Because the original paper of [Am58] was not available for usand the values cited by [Br62] did not contain errors and the de-tails of the experimental technique we accepted a 10 % relativeerror to each yield*
4,2. Special comments to Table II
a./ In this table there are absolute Mo-99 and Ba-140 yields.If both of these hed been measured in a work only that one wastaken into account which seemed to be more reliable,
bo/ Column 4 contains the original absolute yields while incolumn 5 the corrected values and the revised errors are given,The reason for the error revision is similar to that mentioned in4.1.c. In [Ga66] no data are gnven on the conversion of relativeto absolute yields and therefore the yields could not be read-justed . Therefore the error was increased by a 10 % relativesystematic error.
285

c./ Column 6 shows apart from measured absolute Mo-99 yieldsalso Mo-99 yields converted from absolute Ba-140 yields with theaid of the accepted ratio of Table I. Both types of Mo-99 yieldswere used for calculating the average. The recommended absoluteBa-140 yield was obtained, from the Mo-99 yield and theMo-99:Ba-140 yield ratio of Table I.
d./ The errors of the recommended absolute yields contain27also a 4 % relative systematical error because of the Al /nf,alpha/
reaction cross section predominantly used for absolutisatioxu
4.3. Special comments to Table III
a./ In column 1 the mass number is underlined when measuredyields have been available. If the measurements refer to a meta-stable /m/ or ground /g/ state or both /rag/ it is noted in column2. In some cases there is no indication for m or g states in thepapers although their presence is clear from the decay schemes [llj,e.g. Br-84, Pd-111, Ag-111, Ag-115 in [Ja64j , Ag-113 in,allworks, Cd-115 in [Am58] and [Co70] , Xe-135 in all works. Theseoases are not indicated in column 2 except for Cd-lJ5 and A=113where the special note n 47Ag5h M refers to tbe 5.3 h half-life state.
Sometimes the authors* element notation for the measu-red yield did not seem to be quite adequate. These are revisedby us : [Co70] notes Gd-156 instead of /io/ Eu-156, Sm-147 ioPr-147, Eu-153 io Sra-153 and La-140 io Ba-140; [B17l] notes1-132 io Te-132, la-140 io Ba-140 and Ce-142 ip La-142;t<k>68] notes Y-91 io Sr-91 and 1-132 io Te-132.
b./ Column 5 contains the original measured data /generallycumulative yields in % or relative values/. The R-measurement of[Go68] have been corrected for the accepted U-235, "thermal fissionyields with their error [1],and put into brackets. The normali-sations refer to these data. [Bq72] published relative cumulativeyields. Line noted with " chain " gives relative chain yieldscorrected by the author himself using measured fractional cumula-tive yields of [Wo65] # Our normalisation refers to these chainyields,,
286

Column 6 and 7 contain data normalised to the recom-mended Mo-99 and Ba-140 absolute yields if these nuclides havebeen measured. In column 8 there is the average of these norma-lised yields or the only available one. If neither Mo-99 norBa-140 have been investigated in a work the normalisation wascarried out to the recommended value of an appropriate mass num-ber /noted with **=" /. [Fo65] have measured relatively fewmasses which did not give possibility for normalisation. Itsoriginal absolute yields were accepted with addition of a.10 %relative systematical error. As mentioned before /see 4.I./there is no error quotation in JAm5S] that is why a 10 % rela-tive systematical error is added to its data. There is no othererror revision in this table. If in an article an unreasonablesmall error was quoted the simple rather than the weighted ave-rage is accepted as recommendation at a given mass.
If the fractional cumulative yield of the measuredelement is not 100 % the average value in column 8 is put intobrackets and the chain yield corrected by the Nethaway-method[Ue72] is given below it.
Column 9 gives the recommended chain yield in %. Ifthis value is accepted from one experiment or from the average/A or WA/ of more, it is underlined. At mass numbers experimen-tally not investigated an exponential interpolation was madeand is shown without error and underlining. If it is clear thatthe authors have measured the yield at a given mass for the mor g state only the recommended value is a lower limit for thechain yield and is denoted by a " " sign.
c./ At the mass number 102 none of the experimental datawere accepted because of their unreliability. The situation isquite different for the mass nufcber 129 : although all yieldsare very close together and seem to be reliable but they do notfit to the trend of the mass distribution curve in this region.It may be caused by the presence of an unknown metestable state.Interpolated yields are recommended for these two cases,
d./ All iodine yields of Br62 had been evaluated from acomplex beta decay curve and some of them are far from,the otherauthors* data. Therefore all these yields were omitted.
287

e./ UainjEr 117.68 for the centre of the mass distribution,as obtained by [Ne69] , we get the following sums of recommendedchain yields;
for the light mass region from JU=66 to A=117measured chain yields 64.52 %interpolated 35.95 %total 100.47 % i
for the heavy mass region from A=118 to A=172measured chain yields 75.05 %interpolated 21.48 %total 96.53 % \
for the entire mass region from A=66 to A=172measured chain yields 139*57 %interpolated 57.43 %total 197.00 % .
Taking into account the 4«5 % relative error of the absolutisa-tion /see Table II/ the sum of the,yields of the heavy and lightfragments seems to be satisfactory. More accurate experimentalyields and measurements for the interpolated masses would benecessary for renormalisation.
f./ The recommended chain yields versus mass number areshown on a lin - lin as well as on a log - lin plot4
4.4. Special comments to Table IV
a./ This table is only a collection of the experimentalindependent and fractional cumulative yields. Key for the abbre-viations used :IY - independent yieldPIY - fractional independent yieldFCY, - fractional cumulative yield,
b./ Column 5» 6 and 7 contain the measured yields generallyin per cent, data of [Bq72] are relative ones.
c./ An attempt was made by us also to calculate the measuredyields using Uethaway's empirical rule [Ke72J, Uraezawa*s proce-
288

dure generally recommended for medium energy fission [12] and amethod based on Bocquet»s experimental results [Bq72] .
This last method applies an experimentally determined| &Zh 2p~ Z.UCB" °»32 * °»10 value. [Bq?2] generally accepted byus for the asymmetric region only and Wahl's charge dispersionof 0,56 i 0.06 [ij, "Zucc was calculated using an average valueof 4.4 fiaeion neutrons [13] from which 0.75 are prefissionones [14] in the U-238 14 MeY neutron fission. The post fissionneutrons were assumed to be equally distributed between the comp-lementary products.
Either Hethaway*s method or that of mentioned at lastgives practically the same results in good agreement with themeasured yields. To distinguish between them is not possiblebecause of the present status of the experiments. At the sametime Umezawa's method generally does not give reasonable resultsfor light fragments. It seems to be caused presumably by the lowexcitation of the compound nucleus in 14 MeV neutron bombardment.
Since all methods use roughly the same charge disper-sion the difference between them arises mainly from their pre-dicted Z.p values. That is why only these most probable charge va-lues are given in column 8, 9 and 10.
5. General conclusions and remarks
a./ As it can be clearly seen the mass distribution has anappreciable structure in the heavy region. It is interesting tonote that this structure is very similar to that of the thermalneutron induced fission of U-235 where pronounced maxima occurat masses 134, 138, and 142.
At the moment, evidence for structure at the light peakmay neither be declared nor rejected because of the lack or theuncertainty of the experimental data for critical masses, e.g.94, 96, 98, 100, 101, 102. The deviation from the smoothcurve at masses 84 and 86 is quite remarkable and is duepresumably to the 50 and 52 neutron numbers.
The structures mentioned above would not disappeareven applying delayed neutron corrections.
The presence of the fragment shell effects in the massdistribution even at 20 MeV excitation energy is interesting
289

from the point of view of the nuclear fission theory. Thereforeeach measurement even in the peak regions are of great importancein the future.
On the "basis of these considerations reflecting themeasured yields /"mirror points'1/ and smoothing the mass distri-bution is not quite correct,
b./ The average yields for the peaks /including masses 99,100, 101, 133, 134, 135, 136/ is 5.85 i 0.1 %, and that ofthe valley /including masses 115, 121/ is 0.83 t 0.02 #,The peak-to-valley ratio is then 7*05 * 0,21 being a littlegreater than 6,8 coining from a smoothed plot of the mass-yieldcurve [He 72j.
The lack of the experimental yields requires new measu-rements particularly in the symmetric region*
c./ The center of the mass distribution was calculated as
where YA is the recommended chain yield for the mass A /fromTable III/. It gives A«»116,97 . This value is less than the trueone because of the difference between the light and heavy peaknormalisations /see 4.3.e/. Applying an appropriate correction wehave A0=117.36 i 0.15 • The average number of neutrons emittedper fission can be calculated from Ao, and is 4.3 t 0.2 .Calculating the weighted center of the light and heavy peaks si-milar to that mentioned above /summing to~from 117.3$ / we haveAu= 97.98 i 0.10 and Aw» 136.62 t 0.10 respectively. Itgives 4.40 ± 0.15 for the average number of neutrons emittedper fission* These are in good agreement with each other as wellas with the direct measurements [13].
It is interesting to note that our center value is lowerthan that of Nethaway's 117*68 t 0*09 [Be69'J which have beencalculated from the low yield fragments on the wings. This diffe-rence can be explained by the assumption that the neutron emissioncurve for 14 MeV neutron induced fission of U-238 has also a" saw-tooth1* shape similar to that w£H known in the low energyfission.
290

, d./ In the asymmetric regions Hethaway's method [Ue72J maybe recommended to calculate the most probable charge, Zp 9 fora given mass as well as the independent or fractional cumulativeyields using Wahl's dispersion value of 0.56 ±0.06 [l]. Theunchanged charge distribution assumption may be applied forcalculation in the symmetric region where the former value ofthe charge dispersion may also be used* It is a pity that thereare no measured independent or fractional cumulative yields her?*
e./ The full width at half maximum of the heavy and Ifghtpeaks is about 5 % greater than that of the thermal neutronfission of U-235. This can be connected to the many-chance fiaaionprocesses.
f,/ The general requirement for the future is to make newmeasurements /rather than such compilations/ in the entire frag-ment mass region applying the full arsenal of the nuclear phy-sicists' and radiochemists' fantasy and experimental methods*
References
[Te53l J.Terrel, W.B.Scott, J.S.Gilmore, C.D.Minkkinen, Phys.Rev,£2, 1091 /1953/; 14 MeV.
[Bo55] E.K.BOHIHBKBH, WoC.SsMflTHH, H.C.KHpHH, H.II.MapTHHOB, E.A.CRBOPKOB. B.S.yiaTCKHiL HeftipoHHafl teHKa (c(5. CTaieft ~ ~
A m » ^* \ V\^V I m^\ ft A m/\l *Tltf*^TT A ffl fttf ___ —LpesaKUHe n.A.KpynnimKoro), 224, rOCATOMH3/UT, Mocraa,196 I; 14.5 M3B.
[Po56] G.P.Pord, J.S.Gilmore, Hef.5. in Ref. [Wo65j*[Cu57] J.G.Cuninghame, J.Inorg.NucloChem., %, 1 /1957/; 14 MeV.[Am58] D.P.Ames, J.W.Barnes, J.P.Balagna, A.A.Comstock, G. A. Cowan,
P,B,Elkin, G.P.Ford, J.S.Gilmore, D.C.Hoffman, G.W.Knobeloch,E.J.Lang, M.A.Melnick, C.D.Minkkinen, B.C. Pollack, J.B,Sattizahn, C.W.Stanley, B.Waren, Ref.9. in Ref . [Br62] .
[Pr58] A.H.npoTononos, r.M.Toama^eB, B.H.ymaTCKHii, P.B.BeHejpKTOBa,H.T.KpHCH)K, JI.n.PozHOHOBa, T.B.flKOBJieBa, AiOMHaa 9Heprafl,5, 130 (1958); 14.6 Mas.
[Kr6o] H.T.KPHCIDK, r.n.JIenHeB, H.B.njraiynoBa, PaflHOXHMHH, II, 743(I%0); 14 MSB.
P.C.Stevenson, E.G. Hicks, J.C. Amatrong, S.R.Gunn, Phye.Rev. ,117. 186 /1960/j 14 MeV.
291

[Ap62] A.H.AnnoaoHOBa, H.T.KpHC»K, B.H.ymascKHft, PaaHOXHMHH, I?,587 (1962); I* MSB. -*
[Ap62aJA.H.AnnojioHOBa, fl.T.KpHC»K, B.H.yznaTCKHft. Paanoxminfl, IV.711 (1962); 14- ~
[Br62] lUM.Broom, Phye.Rev* 126. 627 /1962/; 14.7 ± 0.4 MeV.
[ja64l R.H.Jamea. G.R.Martin, D*J. Silvester, Radiochim.Acta,2, 76 /1964/; 14*7 ± 0.2 Me?.
[Me64l M.P*Menon» P.K.Kuroda, J.Inorg.Nucl.Chem. , 26, 401 /1964/;14.7 t 0.4 ~"
[Po65] G.P.Pord, R«3.1eachman, Phys.Rev. , 137. B 826 /1965/;, 14.1 1 0,17 and 14.9 t 0.25 MeV.
[Wo65] K.Wolfsberr;» Phys.Rev., 131. B 929 /1965/* 14.6 ± 0.2 MeV.fGa66] R.Ganapath^r, H.Ihochi, J.Inorg.Wucl.Chem. , 28, 3o71 /1966/rL 14.8 i 0,2 MeV. ""
[Qo68] D.J.Gormawy R.Hv^oi^Linson, Can.J.Chem, , 46. 1663 /1968/;14
[]5te69l D.R.lfeths 'ay, B.Mendoza, T.E.Voes, Phys.Rev. , 182, 1251J /1969/; 3 .8 1 0*3 MeV. ——[Pe69] K.A.UeTp? 3. B.O.TenjibK, M.F.IIaHBflH. EiofuieTeHB UeBTpa noL J H^epHHM ,,JIHHM, BmiycK 6, 226 (1969), ATOMH3J5AT; I4V7 ? as.[Co7o] F. Commuw tu, Ref«9. in Ref , [B17l],
[Ge70] L»H.Qeva< 't, R*S,Jervis, H»D,Sharma, Can.J.Ohem. , 46. 641/1970/j lt,7 MeV.
fBI7l1 O.Birgul, S.J.I<yle, R.Wellum, Radiochim.Acta, 16, 104 A971/;L 14.8 MeV. -"
[B17ll J.Blachot, r.Oavai'. Ini, C.Chauvin, Proc. of Int.Conf. onChemical Juclear D 'a, p. 13 of Vol. "Measurements and App-lications The Institution of Civil Engineers London, 1972;14.8 MeV.
fSw7ll D.LSwindle, R.J,Wr.ight, T.B.Ward, P.K.Kuroda, J.Inorg.Kucl.L Chem., 3Ji, 651 A971/; 14.8 i 0.2 MeV.[A172] P* Alexander, Hucl.PhyB., A198. 228 /1972/j 14 MeV,fBq72l J,P.Bocquet, R.Brieeot, J.Crancon, A.Moussa, Uucl.Phye,,
A189. 556 /1972/; 14*5 MeV.fHe72] D.R.Nethaway, B.Mendoaa, Phys.Rev., C6, 1827 /1972/j
14.8 I 0.3 MeV.[Pi72] A.loPrindle, Ref. 7. in Ref. [Ue72].~
292

[Da73] S.Dardczy, E, German, P.Raics, S.Nagy, J.Csikai, Soviet Na-tional Conference 'on Neutron Physics, Kiev, May 28 - June 1,1973; 14.4 ± 0.2 MeV.
[Da73a1s.Dar<5czy, S.Nagy, Ji.Kb've'r, P.Raics, J.Csikai, to be pub-lished; 14.4 + 0*2 MeV.
[l] A.C.Wahl, A.E*Norris, R, A. Rouse, J.C.Williams, 2nd IAEA Symp.on Phys. and Cnem. of Fission, 813 /1969/, IAEA, Vienna.
[2] A.E.Crouch, IAEA Symp. on Appl. of Nucl. Data in Science1 J and Technology, Paris, 12-16 March 1973, IAEA/SM-170/94,[3] M.Lamraer, O.J.Eder, IAEA Symp* on Appl. of tfucl.Data inc J Science and Technology, Paris, 12-16 March 1973. IABA/SM-
170/13,[4] S,Katcoff, Nucleonics, 18 /No.ll./, 201 /1960/.
[5] H.RoVon Gunten, Actinides Rev., 1, 275 A969/.
[fi] M^E.Meek, B.P.Rider, Ref.22. in Ref.[3J.
W.A.SHCHH, A.A.JfeOB, JI.M.CejiB eHKOB. Buxom npo^yKTOBHHH H HX pacnpeaejieHHe no MaccaM, rOCATOMHSSAAt HocKBa, 1963.
[8] A.A.rpeiHHjroB, B.M.Kojro(5aiifKHH, C.H.fleMeHTBeB, Hpo yKTH MTHO-B6HHOBO 5eneHHflt~235tu-238, pu-239 B HHTepBane 0-1 .,ATOMHSflAT, MocKBa, 1969.
[9] Y.Kanda, R.Nakasima, Proc. Conf* on Neutron Cross Sectionand Technology /Washington, D.C., March 4-7, 1968/, KBS Spec*Publ. 299., Vol.1*, 193 /1968/*
liol T.A*Pitterle, 2nd Int« Conf, on Nucl. Data for Reactors, Vol. II. ,L 687, IAEA, Vienna, 1970,
[ll] C.M.Lederer, J.H.Hollander, I.Perlxaan, Table of Isotopes,6th Edition, J.Wiley and Sons, Inc., New York - London -Sidney, 1967; Nukldkarte, 3. Auflage, 1968.
fl2] H.Umezawa, S.Baba, H*Baba, Nucl.Phys., A160. 65 /1971/,
[l3] K.B.PopseeB, S.A.Kap aiseB, A.B.MaamireB. flsepHO$H3H ecKHe KOH-1 CT3HTU, 577, rOCATOMMS^AT, MocKBa, 1963.[14] W.G.Davey, Nucl.Sci.Engo , 4J.. 345 /1971/,
[15] BNL 325, 2nd ed*, Supplement No. 2., USAEC /1965A
293

Table I, Mo-99 / Ba~140 «u»ulai?iv© yield ratios for14 MeV neutron induced fission of U-238
Ref.M n
1
Method
2
Measured dataMo-99
3Ba-140
4Mo/Ba ratio
5
Acceptedratio
6
Bo55Cu57Pr58A058Ja646068
RCbeRC2beBCbe
6.
5o1
558
528
44
»
.
941
0.80
? 5.7RC2be
DGB
1.1.
315000
47
/1.000/Co70B171Da73
?DG
DG
5.5.5*
508
61
66
8
56
4
0
0
/O
.
.
.
.
6
949825830
4.92
9*14.44
422
4
28
90
90/70
345
11111
1111
.327
.265
.250*239.386
.205
.118
.137
.26*
15090
63
64
130208
171130
1.327 1501.265 901.250 891.239 1901.386 80
1.205 1301.118 208
1.137 1711.264 130
A 1.243 28
WA 1.277 39
Recommended 1+277 39
294
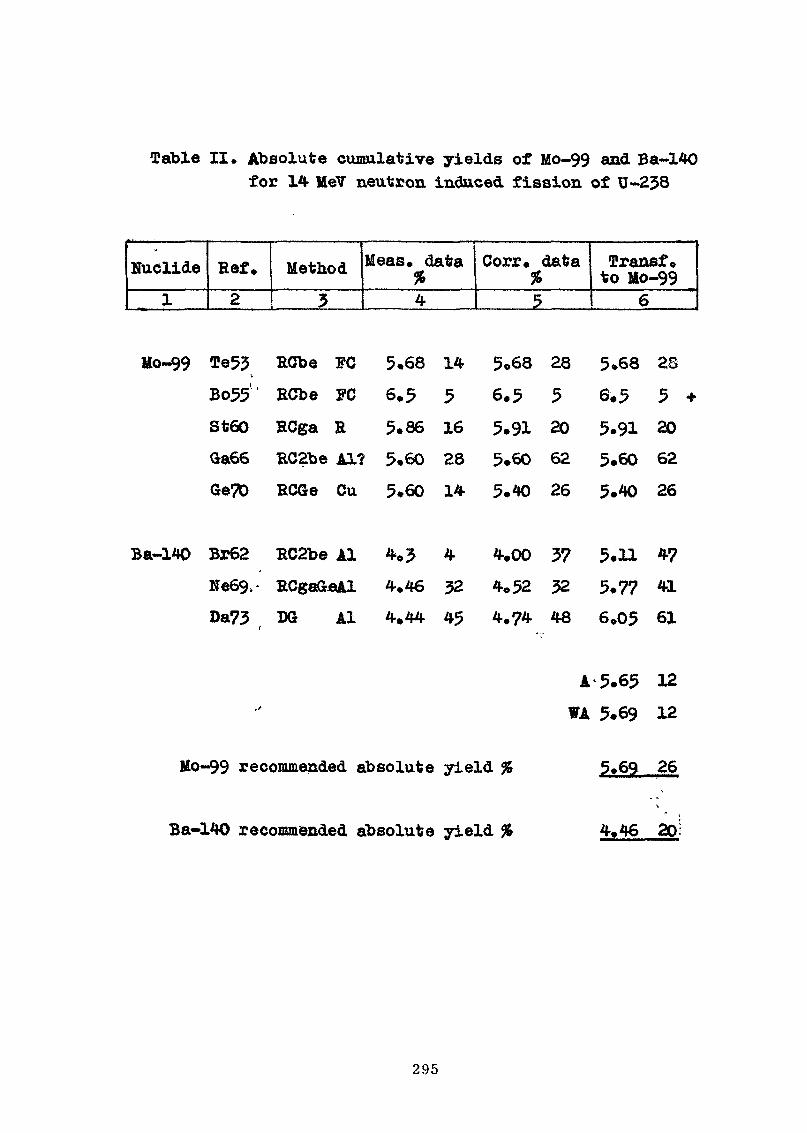
Table II. Absolute cumulative yields of Mo-99 and Ba-140for 14 MeV neutron induced fission of U-2J8
Nuclide1
Ref.2
Method3
Meas. data%4
Corr. data%5
Transfoto Mo-99
6
Mo-99
Ba-140
Te53L
Bo55' '8t60
Ga66GeTO
Br62
RCbeRCbe
RCgaRC2.be
RCGe
RC2be
EC
PC
R
Al?
Cu
AlNe69.- ECgaGeAl
Da73 DG Al
5*68
6.55*86
5.605*60
*.34,46
4.44
14
5
16
28
14
4
32
45
5*68 28
6.5 55.91 205.60 62
5.40 26
4.00 37
4o52 324.74 48
5*68 28
6.5 55.91 205.60 62
5.40 26
5.H5.776.05 61
Mo-99 recommended absolute yield %
A 5.65 12WA 5.69 12
5.69 26
Ba-140 recommended absolute yield % 4.46 20:
295
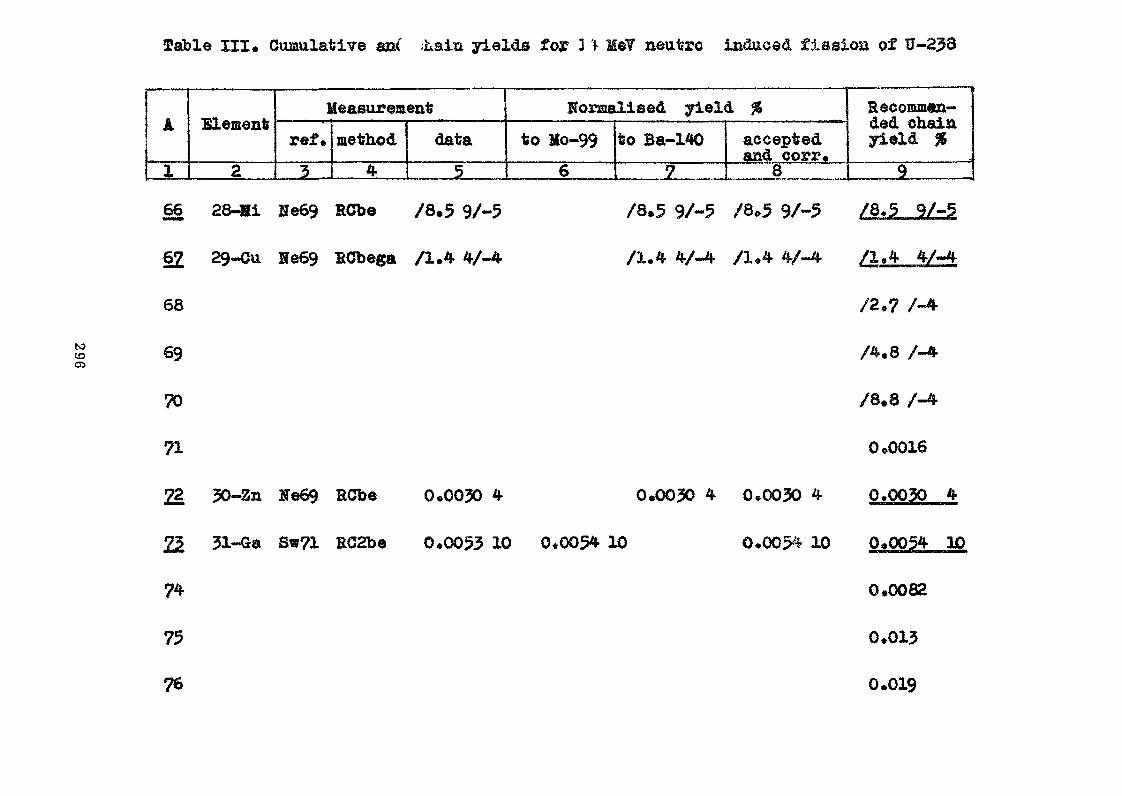
Table III* Cumulative az« ;Laia yields foy 1 f Me? neutro induced fission of tf-238
A
3.
Element;
2
Measurementref*3
method*
data5
Normalised yield %
to Mo-996
to Ba-1407
acceptedand corr.
S
Recommen-ded chainyield %
9
(siCO
22
74
75
76
66 28-Hi Ne69 RCbe /8.5 9/-5
§2 29-<Ju 2Te69 BCbega
68
69
70
71
22 30-Zn JTe69 BCbe 0»0030 4
/1.
S«71 RG2be 0.0053 10 0*005* 10
9/-5 78.5
Oo0016
0*0030 4 0*0030 4 0.0030 4
0*0054 10 0,f Opfffr. 10
0*0082
0.013
0.019

8
22 32Ge/mg Sw?l RC2be 0,030 5 0.030 533-As Sw71 RC2be 0.030 5 0.030 5
80
81
82
2§ 32-Ge33-As
RC2be 0,040 5 0,041 5RC2be 0.041 10 0.042 10
22. 33-As S«71 RC2be 0.18 3
Sv>71 RC2be 0.33 5
82 35-Br Ja64 RC2be 0,138 1036-Zr Go68 m 0.423 4
0.18 3
0.34 5
0,030 50,030 5
A 0,030WA 0.030 4
0,041 50,042 10
A 0,042 1WA 0.041 4
0.18 3
0.34 5
0.597 43 0.649 4? 0,623 450,719 35
A 0,671 48WA 0.683 28
0,030 4
0.041 4
0.18 3
0.25
0.34 5
0,48
0.683 28

COtoCO
84
88
2 3 *
35-Br Ja64 RC2be36-£r Go68 US
36Kr/mg Go68 DGR
36Kr/rag B171 DG36Kr/mg Da73 DG
36Kj?/iag Go68 MB
36-Kr Go68 MS
36-Kr B<i72 MSChain
36-Kr B171 DG36-Kr Bq72 118chain
5 6
0.270 8 1.17 *0.716 7
0,203 7/0.198 9/ 1.13 50,94 15 0.92 151.52 30 1.54 30
0.635 6
1
66 257 1
1.35 10 1.32 1071 362.0 1.5
7 8
1.27 4 1.22 4-1.22 6
A 1.22WA 1.22 3
1.06 5 1.10 50,82 13 0.87 141.53 30 1,53 30
A 1.17 19WA 1.08 5
= 1.08 5
1.70 8
1.61 8
1.18 9 1.25 9 •*•
1.75 9
9
1.22 3
laPJL-5
1.70 8
1.61 8
1.75 9

8
36-Kr CoTO ?
36-Kr Bq?2 MSchain38-Sr Bo55 RCbe38-Sr Cu57 RC2be38-Sr Pr58 RC be38-Sr Am58 ?38-Sr Br62 RC2be
toCO
chain38-Sr
Bq72
Br62
MS
38-Sr38-Sr Br6238-Sr Go68
RCbeRC2beDOR
100 3100 33.4 3
0.65 52.6 30.666 43
/0.659
2.54 28 /2.72 30/ 2.61 ?
98 188 23.3 32.30 120.55 33.02.0 2
— .*• •— * —
2.89 262.35 123.13 172.99
3.00 272.33 123.07 172.912.07 20
2.80 31
2.48 132.95 272.34 12 ..3.10 172.95 302.07 20 +
A 2.77 12WA 2.61 7
3.53 312.82 163.53 31
A 3.18 35WA 2.97 14
3.70 28
3.75 27 3.54 25 3.65 26
2.97 14
3.62 28 3.66 28 3.55 122.70 31 2.70 31 +

4 5 6 7 8
« 22 36-£r Ba72 MS 70 3 5.89 29 4.0? 20o
38-Sr38-Sr38-Sr38-Sr39-*
36-*rchain
36-£rchain38-6J?38-Sr38-Sr
36 rchain39-*39-*39-*
CoTO ?B171 DGBi?l BCbeDa73 DGCa57 HC2be
B%72 &B
Bq?2 MS
Bl?l DGDa73 DGDa73a DG
Bo.72 MS
Ja64 EC2beHe69 BCbftCoTO ?
4,03*613*605.472.78
94126
701384.193.564.31
30159
622289014
14
38504034
213
0.835 284.44.45
456
4.143*543.613.522.83
4*. 113.61
3.61
4,60
6222289114
4941
12
58
3.633.16
5*492.81
3.663.58
3.924.44.03
5419
9014
AWA
s
4440
AWA
13451
AWA
3.893.353.61%512,823.613.55
3.55
3.89
3.895*604*314.034.05
4.483.774.44.324*404.41
5821289014*712
12
29
4641 +341420
4213 +454526
26
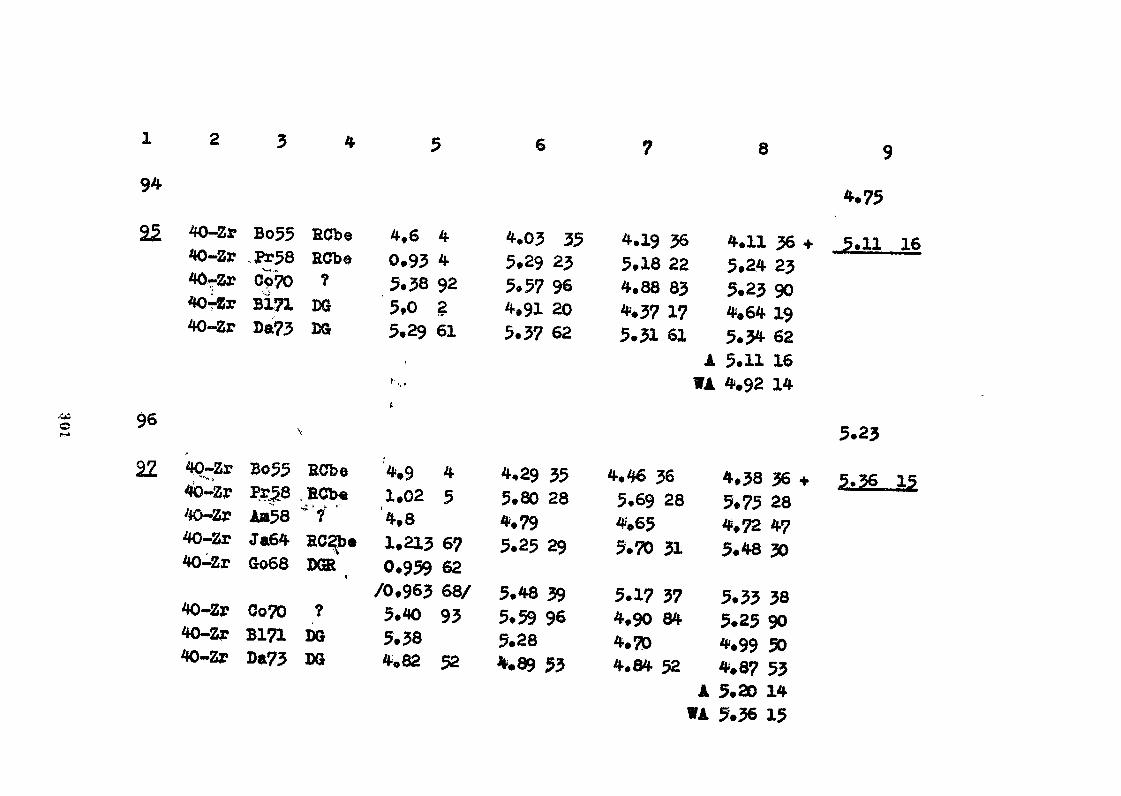
6 8
94
.too
40-Zr Bo55 SCbe40-Zr .Pr58 RCbe40-Zr CoTO ?40?*5r BIT! DG
DG
96
22 4Q»Zr Bo55 RCbe
40-Zr Go68 DGR
40-Zr CoTO ?40-Zr B171 DG40-Zr Da73 DG
4,9 41,02 54.81.213 670.959 62
/0.963 68/5,40 935,384,82 52
4.03 355,29 235,57 964.91 205.37 62
4.29 355.80 284.795.25 29
5,48 395,59 965.28*.89 53
4.19 365,18 224.88 834.37 175.31 61
AWA
4.46 365.69 284,655,70 31
5,17 374.90 844.704.84 52
AWA
4.11 365.24 235,23 904,64 195.34 625.11 164.92 14
4.38 365,75 284,72 475,48 30
5.33 385.25 904.99 504,87 535,20 145.36 15
9
4.75
5.11 16
5.23
5.36 15
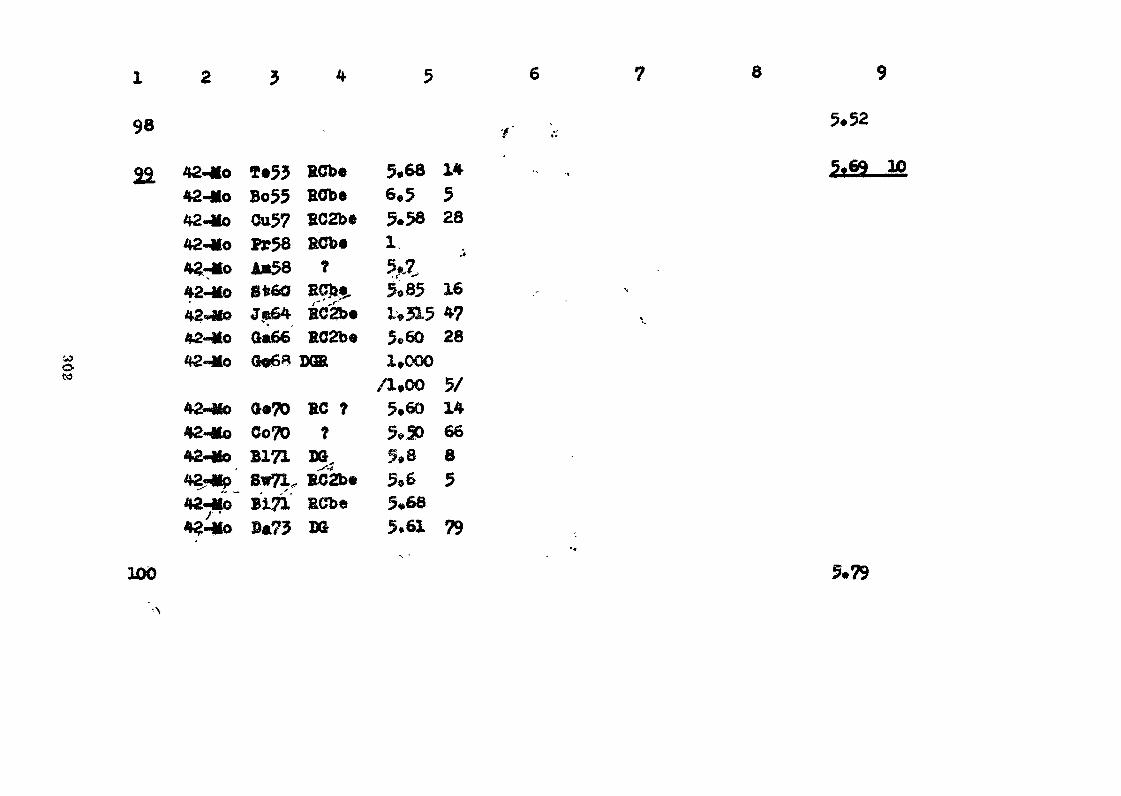
1 2 J 4 5 6 7 8
98 .. - 5.52
22. 42-*° T«53 BCbe 5*68 1442-Mo Bo55 R0b« 6,5 542-Mo Ctt57 BC2bt 5*58 28
42-Mo
Qa66 BC2b« 5«60 28S«6B DOE 1*000
A.OQ 5/42-tfo Ga?0 EC ? 5*60 1442-*o CoTO ? 5*50 6642-tfo B171 KJ. 5,8 8
EC2b« 5*6 5BiTl ECb* 5*68Ba73 BG 5.61 79
*m": ""
lod 5.79

(JOoCO
1 2 3 4 5
101
102
103
42-Mo42-Mo
42-Mo42-Mo
44-Rui i '"jtcm
44-Bu44-Ru44-Ru
PJ?58Ga66
Pr58Ga66
Bo55Go68
Ge70B171Da73
RCbeRC2be
RCbeRC2be
RGbdDGB
RC ?DGDG
0.996,35
0,712.85
3.00,936
/0,8544.444,644,14
430
830
3120126/154047
6
5,636.45
4,042.90
2.63
4.864.514.554,20
2330
4630
26
71153948
7
5.52
3.96
2.73
4.59
4.064.16
8
22
AWA
45
27
67
3547
AWA
5.586,456,025.90
4,002.90
2 ,68
4.734.514.314.184.434,47
23304418
45 +30 +
26 +
691537481213
5.90 18
5.12
4.43 12
104 5.62

8
wo
105
106
107
108
102
44-gu44-Ru44-Eu44-£u44-Ru44-Ru45-Bh.45-£fc
44-®u
45-Rb.
46-Pd46-Pd46-Pd
Pr58Ja64Ge?0B171Bi71Da73Bo55Am58
Bo55
BiTl
Ja64Po65GeTO
RCbeRC2beRC ?DGRCbeDGRCbe
?
RCbe
RCbe
RC2beRCbeRCbe
0.390.5393.003.793.703.623«33.4
2.4 3
1.74
0.2441.141.54
333104042403
5
41515
2.222.333.053.723o713.672.893.39
2*10
1.74
1,06
1.56
17141039424126
26
5
18
15
2,172.53
3.31
3.643.003.30
2.18
1.15
1716
35
4027
AWA
27
19
2.202.433.053.523.713.662.953.353.242.97
2.14
1.74
1.111.141.56
1715103742412634177
26
5
191115
9
2.97 7
2.14 26
1.74 5
1.53
3 .34 7

y * > 6 7 8
46-Pd CoTO ? 1.19 29 1.23 30 1.08 26 1.16 28• ; • 46-Pd Bi71 RCbe 1.56 12 1.56 12 1.56 12
A 1.31 10WA 1.34 7
1101.12
GOC
111 46-Pf Ja64 RC2be 0.132 16 0.571 69 0.620 75 0.596 72 + 0.955 2447-Ag Bo55 RCbe 1»06 12 0.928 105 OW965 110 0.947 107 ——47-Ag Cu57 RC2be 0.81 4 0.826 41 0.819 40 0.823 4147-Ag P*58 RCbe Q.18 1 1.02 6 1.00 6 1.01 647-Ag Am58 ? Q-,87 0,868 0.844 0.856 9047-Ag Br62 RC2be 0.6 1 1-12 5 0.622 104 0.622 104 +47-Ag Ja64 RC2be 0.199 33 0.861 143 0.935 155 0.898 14947-Ag Po65 RCbe 1.08 4 i.08 1147-Ag GeTO RC ? 1.10 5 i*^ 548-Ag CoTO ? 0.97 11 1.00 11 0.879 100 0^40 103
A 0.959 37' - . WA 0.953 24
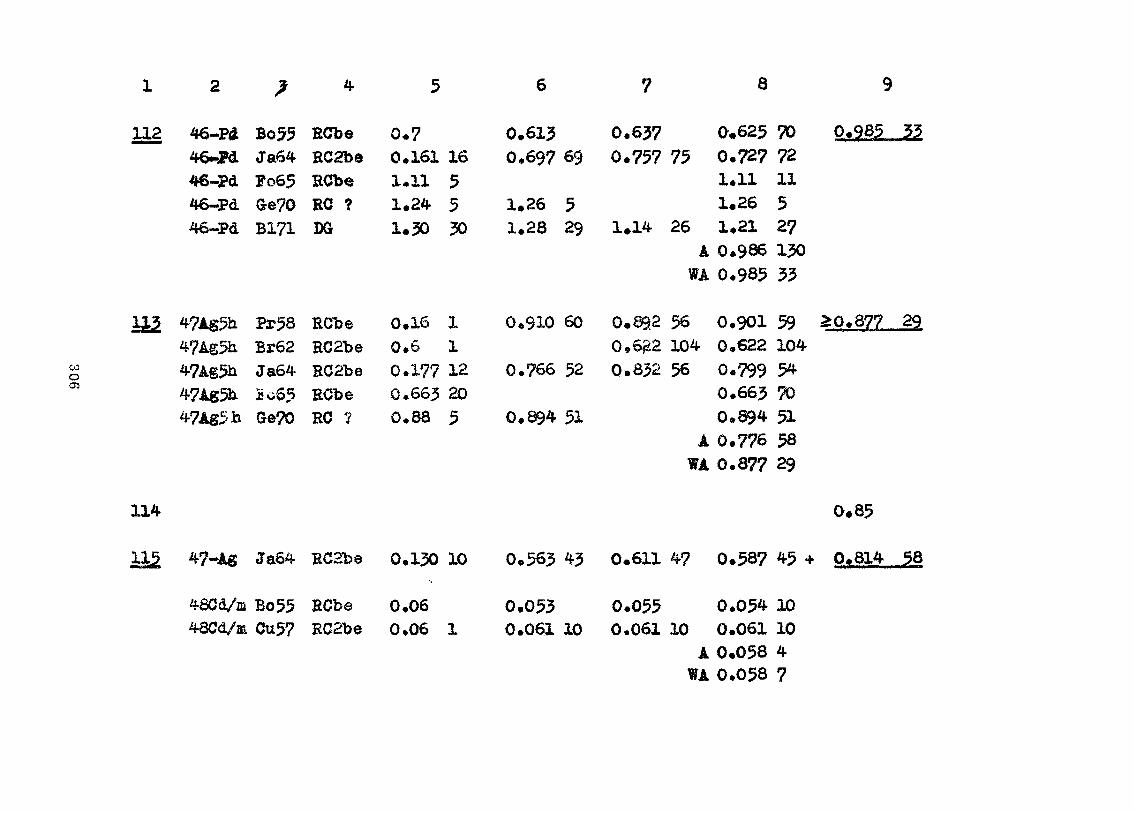
8
112 46-Pd Bo55 RCbe46*-?d Ja64 RC2bo46-Pd ?o65 RCbe46-Pd Ge?0 RC ?46-Pd B171 D&
ooo
Pr58 RCbeBr62 RC2be
RC2beRCbe
GeTO RC ?
00111
0
.7
.161
.11
.2*
.30
.160*6000
.177
.663*SS
0.613165530
1112205
0
11
0
0
0
.697
.26
.28
.910
.766
.894
69
529
60
52
51
0.6370.757 75
O.01.
.
62572711
1.261.14 26
AWA
0.892 560,622 1040.832 56
A
100
000000
.
.
.
.
.
.
.
«
.
21986985
901€22799663894776
WA 0.877
70 0. 85 33721152713033
59 £0.877 291045470515829
114 0.85
Ja64 RC2fce 0.130 10 0.563 43 0.611 4? 0.587 45 + 0.614 38
4SCd/m Bo55 RCbe 0.06 0.05348Cd/m Cu57 RC2be 0,06 1 0.061 10
0.055 0.054 100.061 10 0.061 10
A 0.058 4WA 0.058 7

J. * 5 4 5 6 7 8
48C<3/g Bo55 RCbe 0,80 9 0,700 79 0.730 80 0.715 8048Cd/g Cu57 RC2be 0.58 3 0.591 51 0,587 50 0,589 5048Cd/g Fr58 RCbe 0,16 1 0,910 57 0.892 56 0.901 5648Cd/g Am58 ? 0.71 0,709 0.688 0,699 7048Cd/g GeTO EC ? 0,86 9 0,874 91 0.874 9148Cd/g CoTO ? 0,96 12 0,995 124 0.870 109 0,952 116 *
A 0.756 58WA 0.681 25
116 0.8200
3 117 0.85
118 0.85
119 0.84
120 0.84
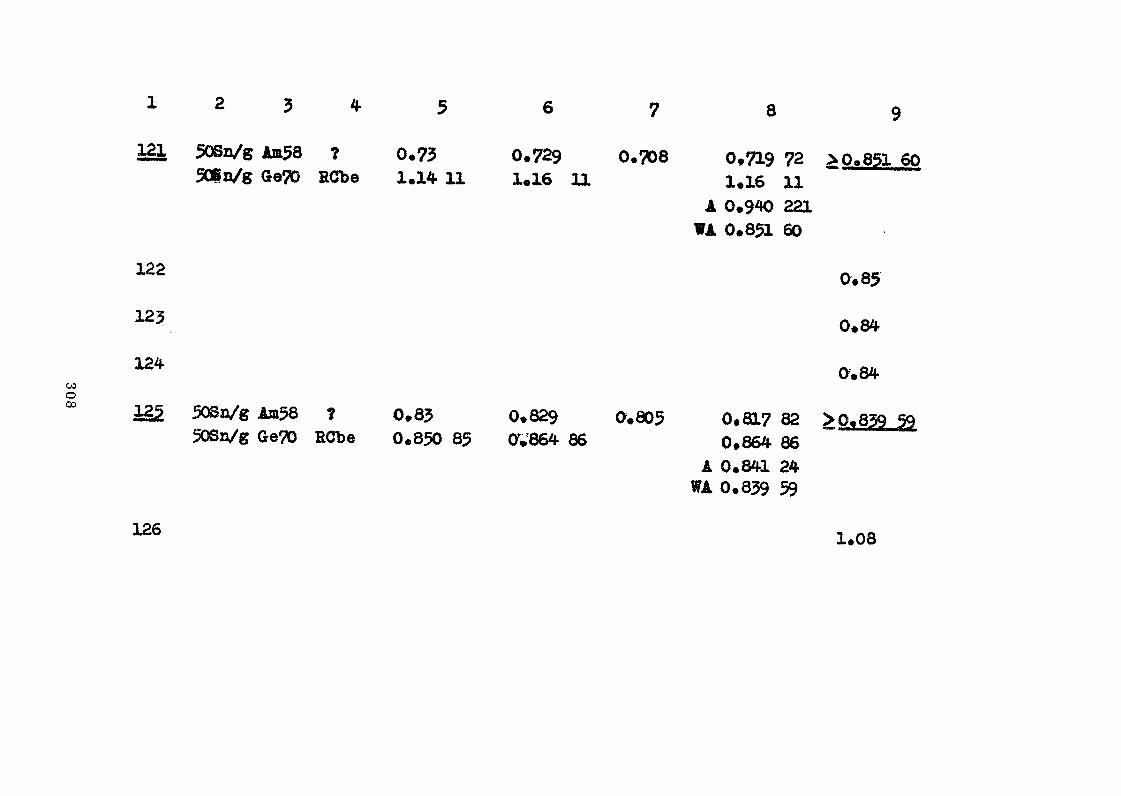
COo
A * 2 * 5 6 7 8 9
121 50Sn/g Am58 ? 0,73 0.729 0.708 0.719 72 >0.851 605Cf n/g GeTO RCbe 1.14 11 1,16 H 1.16 11
A 0.9^0 221WA 0.851 60
122 0.85
123 0.84
0.84
12J| 50Sn/g Am58 ? 0,8? 0.829 O.805 0,817 82 > 0.859 &50Sn/g GeTO RClJe 0.850 85 OV864 86 0.864 86
A 0.841 24WA 0.859 59
126 1.08
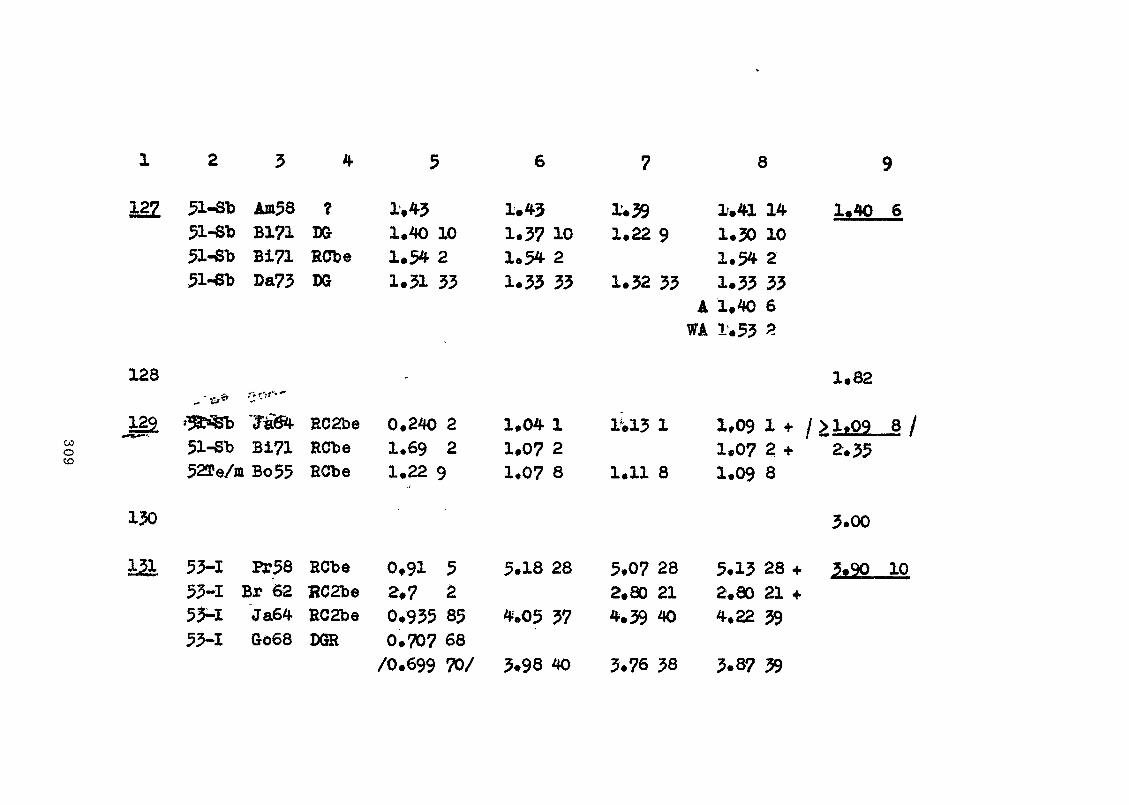
1 2 3 4 5 6 7 8 9
12Z 51-SD Am58 ? 1,43 1.43 1*39 1.41 14 1,40 651-Sb Bl?l DG 1.40 10 1.37 10 1.22 9 1.30 1051-Sb BiTl RCbe 1.54 2 1.54 2 1.54 25Mb Da73 DG 1.31 33 1.33 33 1.32 33 1.33 33
A 1.40 6WA 1.53 2
128 1.82
RC2be 0.240 2 1.04 1 1.13 1 1.09 1 + / >1.09 8 /51-Bb B171 RCDe 1.69 2 1.07 2 1,07 2 * ~2.35523?e/m Bo55 RCbe 1.22 9 1.07 8 1.11 8 1.09 8
130 3.00
1& 53-1 R?58 RCbe 0.91 5 5.18 28 5.07 28 5.13 28 + 3.90 1053-1 Br 152 BC2be 2,7 2 2.80 21 2.80 21 +55-1 Ja64 RC2be 0.935 85 4.05 37 4.39 40 4.22 3953-1 Go68 DGR 0.707 68
/0.699 TO/ 3.98 40 3.76 38 3.87 39
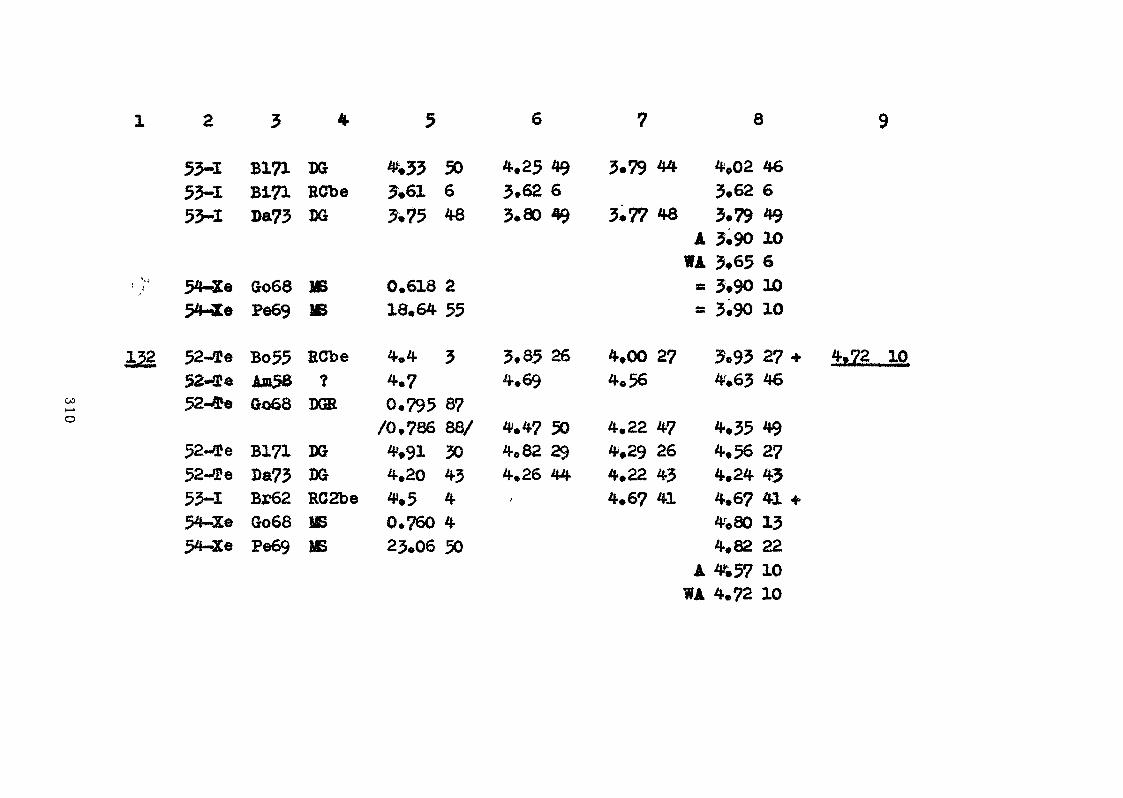
8
53-1 B171 DG 4,33 50 4*25 49 3.79 44 4,0253-1 B171 RCbe 3.61 6 3.62 6 3.62 653-1 Da73 DQ 3.75 48 3.80 49 3.77 48 3.79 49
A 3.90 10WA 3*65 6
54-Xe Go68 IK 0.618 2 * 3*90 3X>54-Xe Pe69 IB 18.64 55 = 3.90 10
132 52-£e Bo55 RCfce 4.4 3 3*85 26 4.00 27 3.93 27 + 4,72 1052-OJ* A«58 ? 4.7 4.69 4.56 4.63 4652^5»e Go68 DGB 0.795 87
/0*786 88/ 4.47 50 4.22 47 4,35 4952-0?e B171 DG 4.91 30 4*82 29 4.29 26 4.56 2752-#e Da73 DG 4.20 43 4.26 44 4.22 43 4.24 4353-1 Br62 RC2be 4.5 4 - 4.67 41 4.67 41 4-54-Xe Go68 IS O.?60 4 4^80 1354-Xe Pe69 MS 23.06 50 4.82 22
A 4.57 10WA 4.72 10
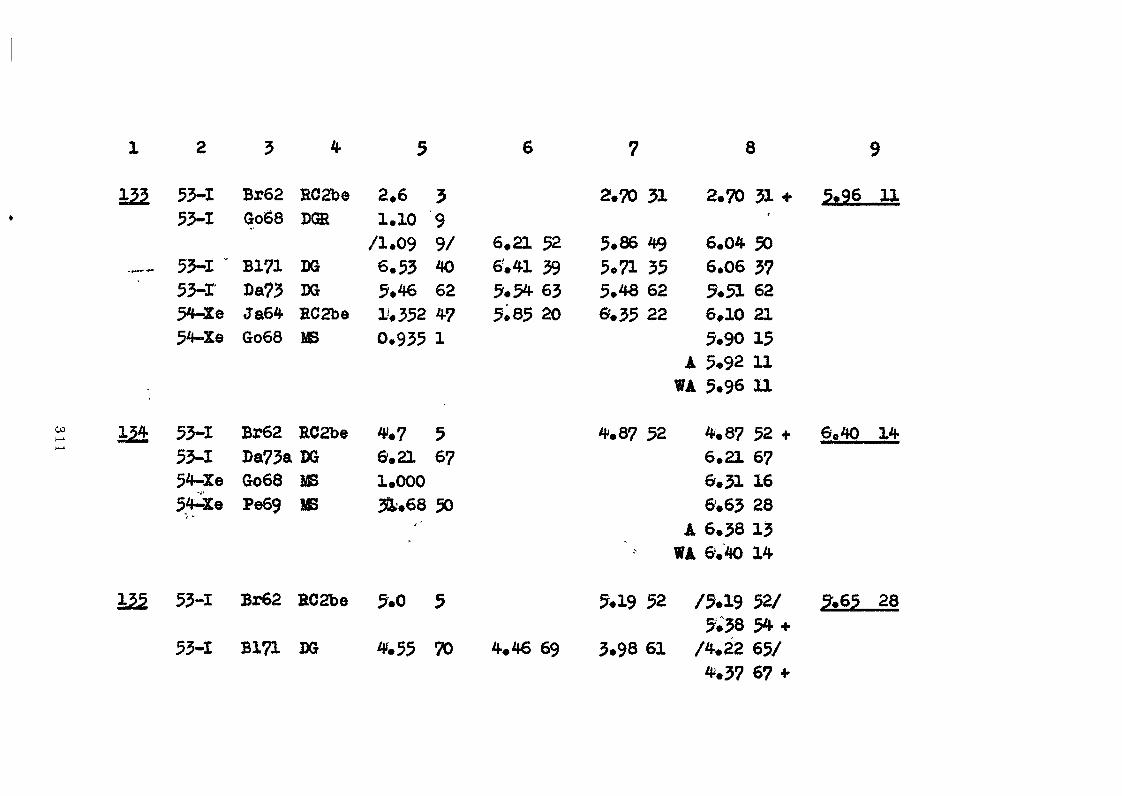
8
53-1 Br62 EC2be 2.6 3 2.70 31 2.70 31 5.96 11
oo
135
53-1
53-153-r54-Xe54-Xe
53-153-154-Xe54-Xe
53-1
53-1
Go68
B171Da73Ja64Go68
BF62Da73aGo66Pe69
Br62
B171
DGB
DGDGHC2beUS
RC2beDGMSMS
EC2be
DG
1.10A.09
6.535.461!.3520.935
4.76.211.00021.68
''
5.0
4-f.55
99/ 6.21 5240 £.41 3962 5.54 6347 5.85 201
567
50
5
70 4.46 69
5.86 49 6.045«71 35 6.065.48 62 5.516.35 22 6.10
5.90A 5.92
WA 5.96
4.87 52 4.876.216.316.63
A 6.38WA 6.40
?.19 52 /5.195*38
r
50376221151111
526716281314
52/54-.
3.98 61 /4.22 65/4.37 67-
So 40 14
5.65 28

1 2 3 4 5 6 7 8 9
53-1 Da73 BS 4.29 50 4.35 51 4.31 50 /4.33 51/4.49 53 +
54-Xe Ja64 EC2be 1.136 39 4.92 1? 5«34 18 5.13 1854-Xe Go68 DGE 1.11 6
/1.K) ?/ 6.26 40 5.91 38 &.09 3954-Xe Go68 IS 0.906 16 9.72 1855-Cs Go6;b MS 1.00 = 5.72 18 *
A 5*65 28WA 5*49 12
« 136 54-Xe ao68 MB 0.883 3 5.57 15 3.57 1354-Xe P069 m 26W63 60 5*57 25
A 5.57WA 5.57 13
s
54-Xe Bq72 MB 100 2 4.72 26chaija 100 2 4.65 3055-Ca Bo55 RCbe 0e6 6 5.78 53 6.01 55 5.90 54 +55-Cte ao68 MS 0.863 86 4.94 52
A 4.80 15WA 4.72 26
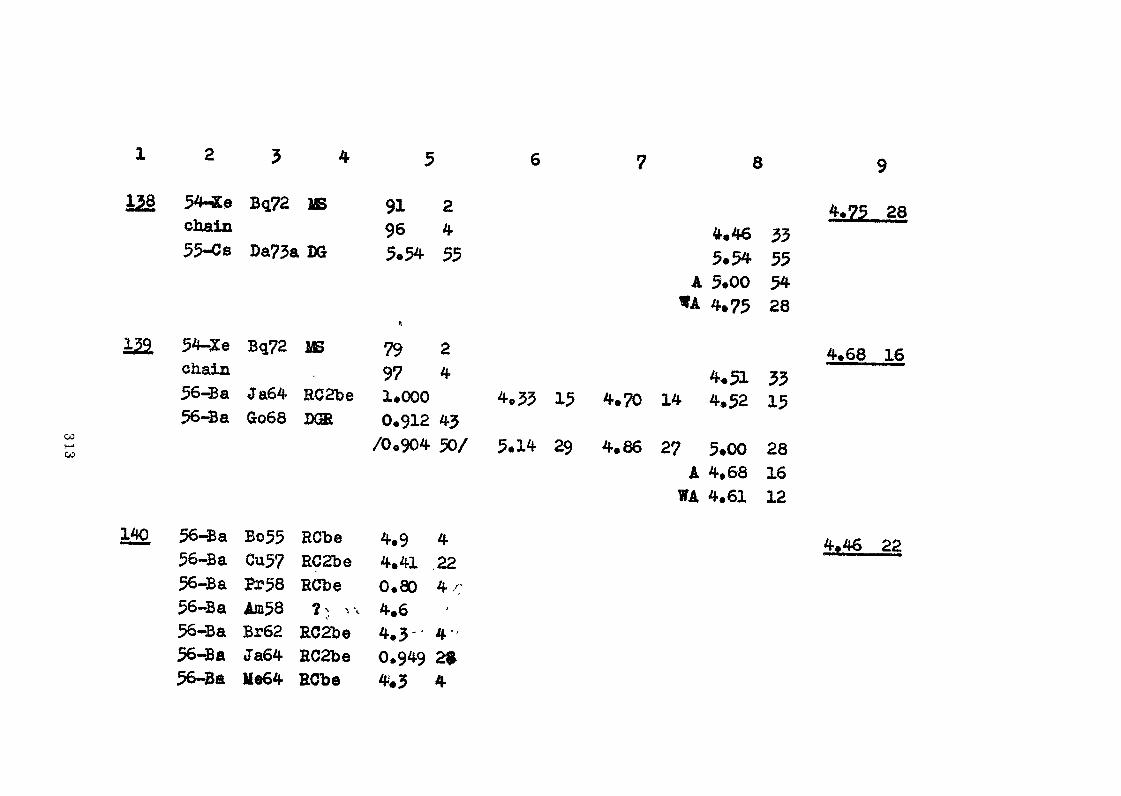
8
11§ 54-Xe Bq72 USchain55-Cs Da?3a DG
91 296 45.54 55
4.46 335.54 55
A 5.00 544,75 28
334.33 15 4.70 14 4.52 15
139 54-Ze Bq72 MS 79 2chain , <yj 456-Ba Ja64 RC2be 1.000
Go68 DGK 0.912 43/0.904 50/ 5.14 29 4.86 27 5.00 28
A 4.68 16WA 4.61 12
140 56-aa Bo55Cu57
RCbe 4.22
56-Ba56-Ba56-Ba56-Bft56-Ba
Am58Br62Ja64Ue64
RCbe1- ^ -
RC2beRC2beRCbe
4.94.410.804.64.3-0.949 2$4.3 4
4
4.73 28
4,68 16
4.46 22
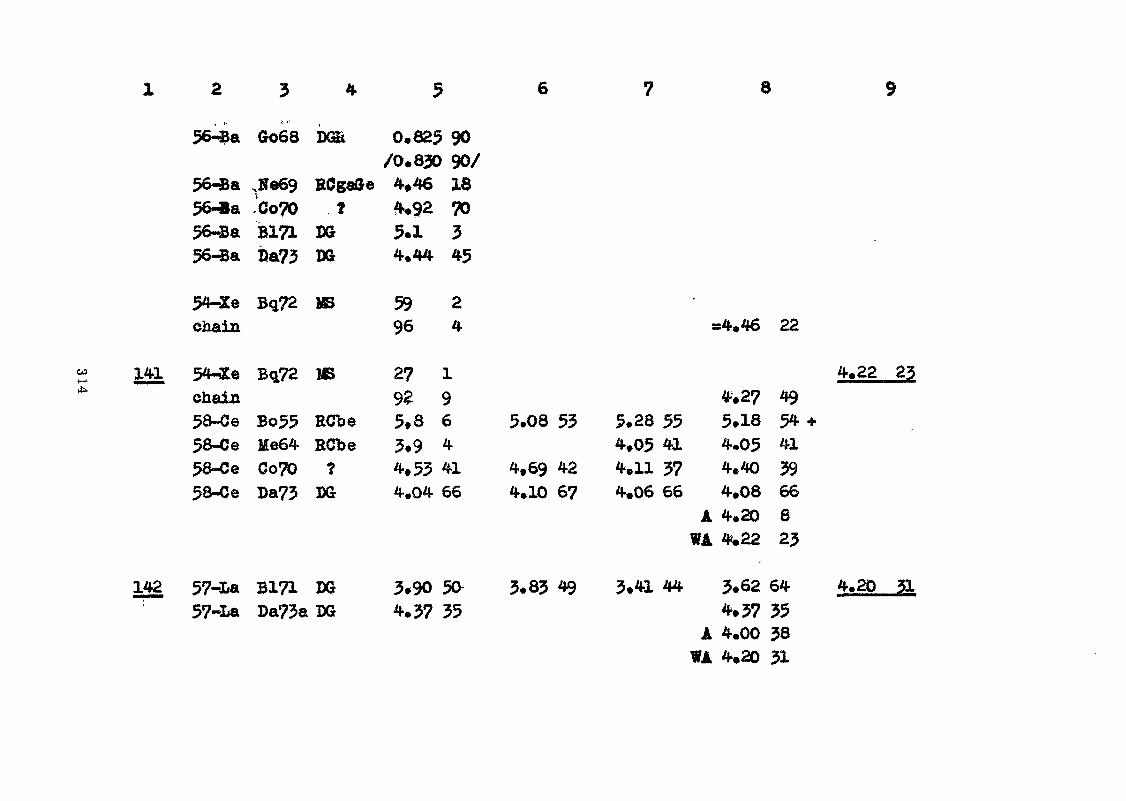
8
56-Ba Go68 DG& 0*825 90/0.830 90/
56-Ba ,Ne69 RCgaGe 4*46 1856-*a .Co?0 ? 4*92 7056-Ba B171 D& 5.1 356-Ba !>a73 3» 4.44 45
COI—*£>•
54-Xe Bq?2 US 59 2chain 96 4 =4,46 22
141 54-Xe Bq?2 W 2? 1 4,22 25chain 9$ 9 *»27 4958-Ce Bo55 RCTbe 5»8 6 5.08 53 5*28 55 5.18 54 +58-<Je Me64 RCbe 3*9 4 4.05 41 4.05 4158-Ce Co?0 ? 4,53 41 4,69 42 4011 37 4.40 3958-Ce Da?3 I» 4.04 66 4.10 6? 4.06 66 4,08 66
A 4.20 8WA 4,22 23
142 57-La Bl?l DG 3*90 5a 3*83 49 3*41 44 3*62 64 4.20 3157-La Da?3a 3» 4.37 35 4,37 35
A 4.00 38WA 4.20 31

8
co
3,91 270,713 1424^3 50,744 72
70,769 7473,45 413.76 254,64 363,05 373.73 35
Cu57 EC2be 3.16 16
58-Ce Cu5758-Ce Ja64 EC2be58-Ce Me64 BCbe58-Ce Go68 D(St
58-Ce CoTD ?58-Ce B171 DG58-Ce BiTl ECt>e58-Ce Da73 DG58-Ce Da73a DG
3.99 283.09 61
4,38 423.57 423.69 254,65 363.09 38
5.22 16
3,95 273.35 674,46 52
4*13 403.13 373.29 22
3.06 37
3.20 16
3.97 27 3.86 123,22 644.46 52
4,26 413.35 393.49 244.65 363.08 38 +3.73 353,21 16 +
A 3.89 19WA 3«86 12
144 58-Ce Cu57 EC2be 2,68 1658-Ce Am58 ? 5,458-Ce Me64 ECbe 4 2
B171 ECbe 3.11 16
2.73 17 2.71 16 2.72 16 3.04 313.39 3.30 5.35 34
4.15 2.10 4»15 £.10 +A 3.04 31
WA 2*83 14
3.12 16 3,12 16 3.12 16
146 2.58

2 3 4 5 6 ? 8 9
6Q-&d Cu57 BC2ba 1.99 10 2*03 10 2.01 10 2,02 10 2.15 j60-IId SFe69 BCgn&e 2.20 15 2,20 15 2,20 15SO«Hd E&73 B£ 2.78 64 2.82 65 2.79 64 2,81 64 *61<-Ba M»64 ECbs 2,3 3 2,39 31 2,39 3161«®m SoTO f 2.05 24 2.12 25 1»86 22 1.99 23
A 2,i5 9WA 2,08 8
1.62
1.22
150 0,93
151 0.71
152 0.54
Ou5? KC2bt 0*39 2 0.398 20 0^394 20 0*396 20 0.408 1262-Ssi H&69 ECbega 0,4?. 4 0.42 4 0*&2 46&-S& CoTO t 0*33^ ^ 0.346 51 0.303 44 0.325 48 *
A 0.408 12WA 0*401 18

9
154 0.2?
CO
155
3J56 63-Bu, Cu57 B02b© 0,13 1 0*13 1 0,13 1 0*13 1
63-Eu Fo65 BOb®Co?0 ?
0,220.109 70*13 *
0«22
0*13
0.21 0, £2 20*109 11
0,12 4- 0«13 *A 0*12 1
WA 0.12 1
0*18
158 0,043
HCbe 0«026 3 0.026 3
160
161
162
P172
0.0089
0.0145
0.0089 5 0.0089 5 + Q.OJ28JLJ;0*0085 4
0.0051

8
coi—ico
163
164
165
166 66-Dy
16?
168
68-Er Ke69
170
171
/1.29
/6.3
/1.29
/6.3
A.29
0.0029
0.0018
0.00105
76.3
/3.7
71.29
/3.8
.1 7/-5 7/-5 /2.1 7/-5

Table IV. Independent and fractional cumulative yields for 14- MeV neutron inducedfission of U-238
A
1
Element
2
Data of the measurementRef.3
Method4
IY %5
FH %6
FCT %7
Calculated Zp
[Bq72]8
[Ne72]9
[12310
00I—'CO
87
88
99
90
91
92
36-Kr
36-Kr
36-Kr
36-Kr
36-Kr36-Kr
36-Kr
Bq72
Bq72
Bq?2
Bq?2
Wo65Bq72
Wo65Bq72
US
MS
US
US
RCbeUS
RCbeMS
4.2 8
31.8 2.0
74.5 6.0
100 5
108.3 2.0
88.2 4.0
93 36-Kr Wo6536-Kr Bq72
RCbeUS 39.0 2.5
34*57 34.60 34.0
34.97 35.03 34.35
35.36 34.8
35.75 35*84 35.15
65 2 36.15 36.24 35.65
44 2 36.5* 36.64 36.05
16.4 1.1 36.93 37.05 36.41
96 41-Nb Ne72 RCGe /1.07 9/ 38.12 38.25 37.6

00IN?O
1
133
135
136
137
138
139
2
54Xe/ng
$4Xe/ing
55-Cs55-Cs55-Cs
54-Xe
53-154-Xe54-Xe54-Xe55-Cs
53-154-Xe54-Xe54-Xe55-Cs56-Ba
3
; A172
; A172
Bo55Po56Pi?2
Bq?2
Ap62aAp62aWp65Bq72Ap62a
Ap62Ap62Wo65Bq72Kr60KT60
4 5 6 7
BOGe 0.30 13
RCfce 5.6 3.7
RCbe 0.034 4? 0.0052 2? 0.0219 10
MS 100 3
RCbe 55*0RCbe 36.7RCbe 9* 2US 144 5RCbe 9.3 5
RCbe 18.3RCbe 47-5RCbe 80.5 6IB 160 5RCbe 28*6 1*5RCbe 5.6 1.3
8 9 10
51>,69 51*54 51.69
52.48 52.45 52.41
52.87 52.87 52.77
53.26 53.28 53.13
53.65 53.66 53.49
54-.04 54.08 54.14

8 10
140 54-Xe W«6554-Xe Bq?2
142
160 65-0?b
Bq?2
ECTbeM3 152 5
141 54-Xe Wo65 RCbe54-Xe Bq72 MB 77 5
5.
RCbe /2.1 2 / -5
61-.1 1.1
29 2 54.82 54*88 54'.9
55.21 55*28 55*3
62,25 62.36 62.25
00to

smeasured 13957%
interpolated.' 5743 %toted-19700 '/.
measured S4.52%interpolated 35.95%
total 10047%
60 70MASS NUMBER

Contributions toReview Paper No. 12

NEW MEASUREMENTS ON GAMMA-RAY EMISSION PROBABILITIES OP FISSIONPRODUCT NUCLIDES IMPORTANT FOR NONDESTRUCTIVE FUEL ANALYSIS
K.Debertin, U.SchOtzig, K.F.Walz, H.M.Wei?Physikaliach-Technisohe Bundesanstalt, Braunschweig, Germany
Abstract:
Nuclear data of medium - and long-lived fission products areknown with an accuracy generally sufficient in most applicationfields. An exception are y-ray emission probabilities whichhave relative uncertainties of 3 % and more for a number ofimportant cases. An attempt to reach an accuracy of 1 % forabsolute Y~ray emission probabilities is described.
The Symposium on Applications of Nuclear Data in Science and Tech-nology, 12-16 March 1973 in Paris, has shown up the status ofexisting experimental nuclear data of fission products Cl] • Thetables of Martin and Blichert-Toft f2j , though now about fouryears old, still reveal the degree of uncertainty of nuclear dataof the most important fission products. Half-lives of most medium-and long-lived fission products are known with an accuracy of 1 %
95or better. Only in the case of Zr a discrepancy of 2.3 % existsbetween the results of Flynn et al. [3j and Debertin [*Q . Gamma-rayenergies are very well known whereas mean beta-ray energies, nor-mally calculated from the maximum energies by means of semi-empiri-cal formulae, have an uncertainty of 1 % to 2 %. The situation isworse for y-ray emission probabilities (commonly called absoluteY-ray intensities). In Table 1 the emission probabilities of themost abundant y-rays of fission products important in burn-updetermination and safeguards techniques are listed as evaluatedin reference |VJ . The values given in the more recent tables ofTobias £5} deviate, if at all, only slightly from those in reference
325

1.2J . Because of the scarcity of new experimental results the errorlimits of reference £2} are believed to be still valid. For 9of the 18 lines of Table 1 the relative uncertainty is largerthan 3 %.
Table It Emission probabilities of abundant y-lines of important fissionproducts according to reference 2
Fissionproduct
95Zr
95Nb103Ru
106Rh
137Csll|0Ball+0La
1H1Ce14*CePr
Energyin keV
724.2756.9765.8496.9610,2511.8622.11050.1661.6537.4328.8487.01596.6
145.4133. 5696.5
1489.12185.7
Emission probabilityin %
43.5 - 0.554.3 i 0.599.80 ~ 0.0489 - 15.4 - 0.4
20.6 - 0.99.94 - 0.111.48 i 0.04
84.6 - 0.423.8 - 1.2
21 -2A
45 - 2
95.6 - 0.349.0 - 1.010.8 ~ 0.51.51 -i 0.050.29 i 0.020.74 - 0.03
In the Physikalisch-Teohnische Bundesanstalt (PTB), Germany, a pro-gram for the determination of y-ray emission 'probabilities witha relative measurement uncertainty of the order of 1 % has beenstarted,A powerful tool for the measurement of r e l a t i v ey-ray emission probabilities is a calibrated Ge(Li)-apectrometer
326

The efficiency calibration is usually done by means of standardsources of known activity. This method is applied in many labora-tories, 'it suffers, however, from the fact that commonly only asmall number of well-calibrated standards is available so thatthe efficiency for energies between the calibration points has tobe interpolated. The dependence of efficiency on energy can not berepresented by a simple analytical function, and errors introducedby the uncertainty of the interpolation may reach 2 % to 4 % inunfavourable cases. There are attempts to calculate the efficiencyby means of Monte Carlo methods; we do not believe, however, thatthe error limits can thus be reduced. A better approach to thisproblem is an increase of the number of calibration points. Inthe Laboratory for Radioactive Standards of the PTB severalprecision measuring facilities are available to determine theactivity of most Y-ray emitting radionuclides with half-lives grea'terthan a few hours. In the energy region between 250 and 3000 keVwe use about 15 nuclides as primary standards, the activity ofwhich is determined with an uncertainty of 0.2 % to 0.5 % (68 %confidence limit). Only those y-rays are accepted as calibrationlines for which the absolute "f~ray emission probability is knownto 0.5 % or better. A Ge(Li)-spectrometer calibrated in this waypermits the measurement of relative Y~ray emission probabilitieswith an uncertainty of about 1 %. Details of measuring and evaluationprocedures are outlined elsewhere
In order to arrive at a b s o l u t e Y-ray emission probabilitties the activity of the radionuclide source under investigationhas to be known. Otherwise, additional informations are needed,e.g. branching ratios or conversion electron intensities, theerrors of which propagate into the final result. A literaturesurvey shows that this latter method of interconnecting severaldata to determine absolute Y-ray emission probabilities is commonpractice. This is avoided by determining the activity of thesource by methods independent on the accurate decay scheme.
At present we are primarily concerned with fission products im-portant for burn-up and safeguards techniques. Measurements on95Zr, 106Ru/10$Rh and 141*Ce/14Vr are finished [?] measurementson other fission products (103Ru, 134Cs, 140Ba/1<*°La) are inprogress.
327

References
JjJ IAEA-Symposium on Applications of Nuclear Data in Sc enceand Technology, 12-16 March 1973, Parisje.g. papersSM-170/12 and SM-170/63
£2] M.J. Martin, P.M. Blichert-Toft, Nuclear Data Tables AS, 1(1970)
£3] K.F. Flynn, L.E. Glendenin, E.P. Steinberg, Nucl. Sci. Eng,22, <4l6 (1965)
[4] K. Debertin, Z. f. Naturf. 26a, 596 (1971)
1.5] A. Tobias, Report CEGB-RD/B/M 2H53, Oct. 1972
[e] U. SchStzig, K. Debertin, H.M. WeiB, PTB-Mitteilungen^31, 307 (1973)
[7] K. Debertin, U. Schotzig, K.F. Walz, H.M. Weiflto be published
328

STANDARDS FOR CALIBRATION OF SEHICGHDUCTOR DETECTORS
Mo LammerNuclear Data Section
Div.of Research & Labs.Vienna, Austria
Abstract:
Energy scales and fundamental standards are defined for gamma ray energies.A consistent set of primary and secondary energy calibration lines is tabulated.A set of detector efficiency calibration standards is presented that is de-rived from level schemes of the standard nuclei. The survey is restricted toy-rays up to about 3 MeV which is sufficient for fission product decay studies.
I. INTRODUCTION
In many application fields presently high resolution semiconductor de-tectors are used routine work, which have to be calibrated. In most practicalapplication high precision values for gamma energy call'Srallon' lines are notneeded due to limitations of detector resolution. However, it seems to beappropriate to make the user familiar with the definition and 'accuracy ofprimary and secondary standards and the limitations of accuracy that can beachieved. Similarly the role of standards in detector efficiency calibration isdiscussed. Since measurements of y-ray energies and intensities of "fission pro-ducts are based on standards and evaluations based on. measurements, "best"values of these data cannot be more accurate than those of the standards. There-fore this paper presents not only a set of calibration standards but may alsohelp the user to judge the accuracies of fission product gamma ray data pre-sented by evaluator.
II. GAMMA RAY ENERGY CALIBRATION STANDARDS
The survey given in the table is mainly based on the work of Greenwoodet al. [1] and Helmer et al. [2] (up to 1.3 MeV). Measurements of these authorsin the range of 1.3 - 3.6 MeV are in progress but yet unpublished.
For a more detailed discussion see £1,2,103
II»1* Energy scales
Gamma ray energies are generally measured in on* of two 'energy scales,the reference energies being
2- the electron rest-mass energy, mQc- the wavelength of the Koe, X-ray from tungsten.
3.39

The work [1,2] is basecT"on"'the most recent adjustment of fundamental constantsby Taylor et al. [3]» yielding a value for m c^ of:
*('-0~2) - 5H.0041 + 0.0016 keV ( + 3.1 ppm)
For crystal spectrograph measurements it is necessary to convert wavelength'smeasured in X-units into 5L It is agreed to fix the tungsten Ka^ line at:
X(w K o ) = 208.5770 XO
There are several conflicting results for the conversion of XU to A (see dis-cussion by Marion [4])» The "best agreement between the WKa, and m c basedenergy scales was reached (see ref. [l] for detailed discussion) using thefollowing readjusted conversion factors:
A= 1.0020960 m2/XU ( + 5.3 ppm).E = 12398.541 + 0,041 eV «8
yielding the energy (eV) of the W Ka-^ line:E (W Kax) - 59.31918 + 0.00035 keV ( + 5.9 ppm)
The most recent results of direct comparisons of the 412 keV Au-198 y-ray byMurray et al [5f6] with m c* were adjusted by Greenwood et al. to the new valuefor mQc . The result is:
Au-198: 411-794 + 0.008 keV (± 19 ppra)
II. 2. Standards and accuracies
Primary standards are defined as transition energies determined in adirect comparison with the W-K«, line or the Au-198 412 keV y-line*
Secondary standards are those calibrated against a primary standard.
It is evident that a measurement of a -y-ray energy is actually a measurementof the energy difference between the gamma line investigated and the standardused. Thus in such a measurement 3 types of errors are involved:
(1) The statistical error in the determination of the location of the y-peak.
(2) The error in the measurement of the energy difference including the de~. termination of the location of , the reference peak and the nonlinearity ofthe scale,
(3) The uncertainty of energy value of the reference line.
Errors (l) and (2) combined yield the error of the measured energy difference,.their composition with error (3) gives the absolute error of the measured•y-ray energy.
This has two consequences:
- The energy of any y-line cannot be more accurate than that of the standardused. In particular: primary standards are less accurate than either theAu-198 412 keV y-line or the VI Ka./ X-ray, and secondary standards cannot bemore accurate than primary standards.
330

- The same is true for a (weighted or unweighted) average obtained in anevaluation. If in several high precision measurements errors (l) and (2) areconsiderable smaller than error (3)1 the average may have lower uncertaintythan th' iuandard originally used. Therefore in principle it is the energydifferences together with the combined error of (l) and (2) that should beused in weighted averages, then the absolute value of the energy standardadded and the combined error calculated by the evaluator.
II•3- Set of selected energy standards
Energy calibration standards are collected in table I. Only primary andsecondary standards are included.
Below 1300 keV:
fie Greenwood et al [l] and Helmer et al [2] have evaluated energy differencesand have also adjusted other results of direct comparisons and included themin their set of recommended calibration energies, their values up to 1.3 MeVare preferred and reproduced here. Exceptions are the Th-228 d (Pb-212) 238.6keVy-ray (adjusted to the new value for Au-19/3), the Th-228d (Tl-208) 510.7 keVy-ray and the Ra-228d (Ac228) 911 keV y-ray which are taken from Marion'sevaluation [4]«
Above 1300 keV:
The energy of the Co-60 1332 keV y-ray is the unweighted average of the re-adjusted data of Murray et al [6] (as adjusted by Helmer et al [2]) and Gunniket al' [8] (adjusted here: difference between double escape peak at 310.5 keVand Ir-192 y-lines at 308.4 and 316.5 keV^ The uncertainty of + 15 eV quotedby Gunnik et al [8] is based on the uncertainties of the Ir-19?-lines adjacentto the double escape peak.
Helmer et al [73 a*"1 Gunnik et al [8] have pointed out that acceleration ofphoto electrons in the detector 'by the electric field causes a peak shiftdepending on the direction of the incoming y-ray relative to the electric fieldand the y-ray energy. This peak shift was determined to be •-'10 eV for ~500keVphotons [8] and -/200 - 300 eV for *>2 MeV photons [7,8]. The field effect on apositron is of opposite sign and exceeds that on the electron slightly (see[8]).Thus a comparison of double escape peaks with neighbouring full energy peaksmay yield erroneous results. This can be avoided if gamma rays enter thedetector perpendiculf to the field. When using data from such measurements,attention has to be payed to this.
Further, it has been pointed out [7] that positrons annihilate with slightlybound electrons and the annihilation gammas have an energy slightly less thanm c . This effect was determined [7] to be about 15 eV, which is the error oftRe 1.3 MeV Co-60 -y-ray measured by Gunnik et al. [8].'Therefore only the un-weighted averages of the two measurements are taken:
1332.515 ± Oo015 [8]1332.491 + 0*041 [6,2]1332.503 + 0.030 Co-60
In this case the assigned error of the energy differences and also theuncertainty of the average exceed that of the standards used and thus theuncertainty is acceptable„
331
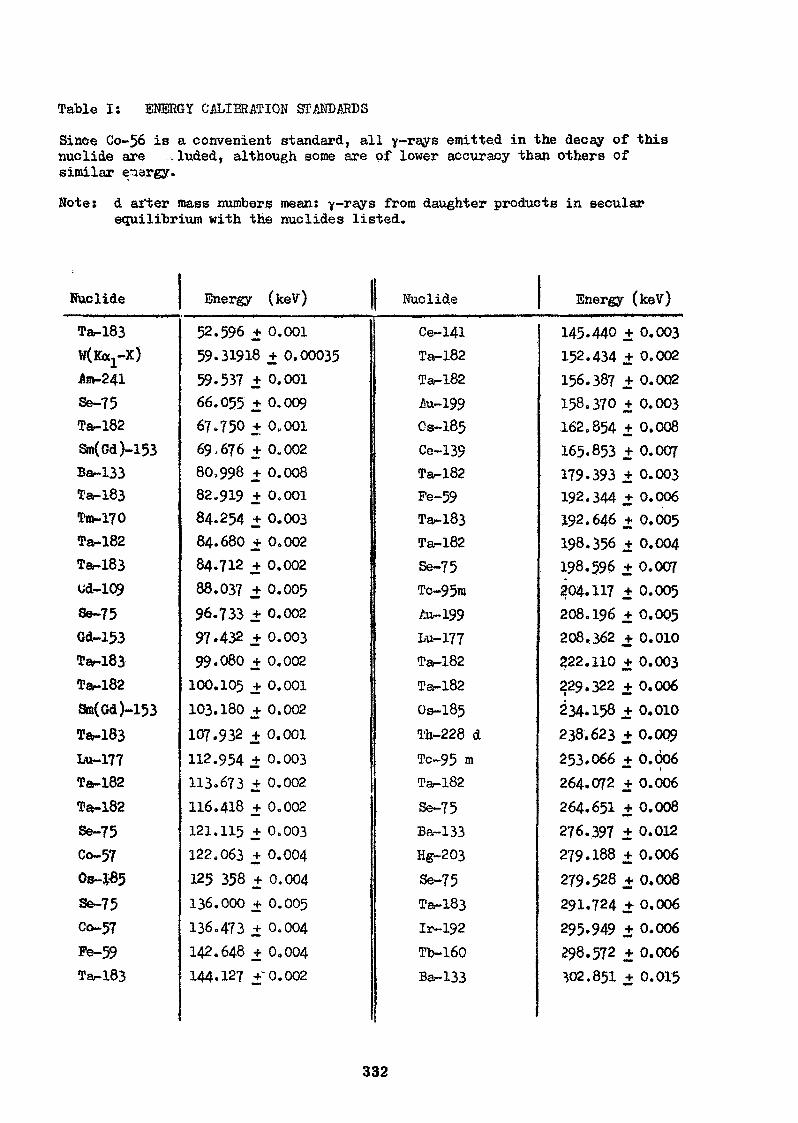
Table I: ENERGY CALIBRATION STANDARDS
Since Co-56 is a convenient standard, all y-rays emitted in the decay of thisnuclide are eluded, although some are of lower accuracy than others ofsimilar energy.
Note; d alter mass number? mean: y-rays from daughter products in secularequilibrium with the nuclides listed.
Nuclide
Ta-183WCKa-j-X)Ant-241Se-75Ta-182Sm(Gd)-153Ba-133Ta-183Tm-170Ta-182Ta-183cd-109Se-75Gd-153Ta-183Ta-182Sm(Gd)-153Ta-183Lu-177Ta-182Ta-182Se-75Co-57Os-*85Se-75Co-57Pe-59Ta-183
i;Energy (keV) || Nuclide
52.596 + o.ooi59.31918 + 0.0003559.537 + 0.00166.055 + 0.00967.750 + 0,00169,676 + 0..00280,998 + 0.00882.919 + o.ooi84.254 + 0.00384.680 + 0.00284.712 + 0.00288.037 + 0.00596.733 + 0.00297.432 + 0.00399.080 + 0,002
100.105 + o.ooi103.180 + 0.002
107.932 + o.ooi112.954 + 0.003^H
113.673 + 0.002116.418 + 0.002121.115 + 0.003
122.063 + 0.004125 358 + 0.004136.000 + 0.005
136.473 + 0.004142.648 + 0,004144.127 +- 0.002
Ce-141Ta-182Ta-182Au-199Cs-185Ce-139Ta-182Pe-59Ta-183Ta-182Se-75Tc-95ra/ja-199Lu-177Ta-182Ta-182Os-185Th-228 dTc-95 mTa-182
Se-75Ba-133Hg-203
Se-75Ta-183Ir-192Tb-160Ba-133
Energy (keV)
145.440 + 0.003152.434 +0.002156.387 +0.002158.370 + 0.003162.854 +0.008165.853 +0.007179.393 + 0.003192.344 + 0.006192.646 + 0.005198.356 + 0.004198.596 +0.007204^117 + 0.005208.196 + 0.005208,362 + 0.010222,110 + 0.003229.322 + 0.006234.158 + o.oio238,623 + O.OQ9253.066 + 0.006•• i
264.072 + 0.006264.651 +0.008276.397 + 0.012279.188 + 0.006279.528 +0.008291.724 + 0.006295.949 + 0.006298.572 + 0.006302.851 + 0.015
332

Table I: (cont.)
Nuclide
Se-75Ir-192 -Ir- 192Cr-51 -~ v
Ta~l83Bar-133 .Ta-183Ba-133Sn-113Se-75Pb-203.Au-198Ag'-llO mIr-192Be-7Ir-192Tb-228d
2m coSr-85Bi-207Tc-95mTJv228dIr-192Os-185Ir-192Ir-192Ag-llOraOs-185Ag-llOmUe-137Au-198Ag-llOmPb-203Ag-llOra
Energy (keV) j
303.913 +0.007308.445 + 0.007316.497 + 0.007320.078 + 0.008353.999 + 0.004356.005 + 0.017365.615 + 0.007383.851 + 0.020391.688 + 0.010400.646 + 0.009401.315 + 0.013 •411.794 + 0.008446.790 + 0.018'468.062 + 0.010477.593+0.012-464.570 + 0.011
' 510.721 + 0.020511.004; + 0.0016 ''-513.996 + 0.016569,689 + 0.013582.068 + 0.013583.174 + 0.013588.572 + 0.012592.066 +0.014604,401 _+ 0,012612.450 + 0.013620.305 +' 0.018646.111 + 0.017657.631 + 0.016661.638 + 0.019675.871 + 0.018677.590 + 0.020
680.495 + 0.017686.965 + 0.020
| Nuclide
Nb-94Ag-llOmOs-l85
Zr-95Ag-llOm
Zr-95Ag-llOmNb-95Tc-95mCo-56Co-58Ag-llOmTc-95 m
Mn-54To-95mCo-56
•• Nb-^4Os-185Tb-160Os-185Ir-192Ag-llOmSc-46Y-88Rar-228dig-HOmTb-160Tb-160Co-56Co-56To-95mBi-207Au-198
Pe-59
Energy (keV)
702.627 + 0.019706.660 + 0.018717.424 + 0.018724.184 + 0.018744.250 + 0.018756.715 + 0.019763.929 + 0.018765.786 + 0.019786.184 + 0.017787.79 + 0.06810.757 + 0.021818.006 + 0.020820.608 + 0.019834.827 + O.CS21835.132 + 0.018846.751 + 0.019871.099 + 0.018874.814 + 0.019879.364 + 0.018880.272 + 0.019884.523 + 0.018884.662 + 0.019889.258 + 0.018898.021 + 0.019911.07 + 0.07937.468 + 0.020962.295 + 0.020966.151 + 0.020977.46 + 0.06
1037.86 + 0.061039.247 + 0.022
1063.635 + 0.0241087.663 + 0.0241099.224 + 0.025
333
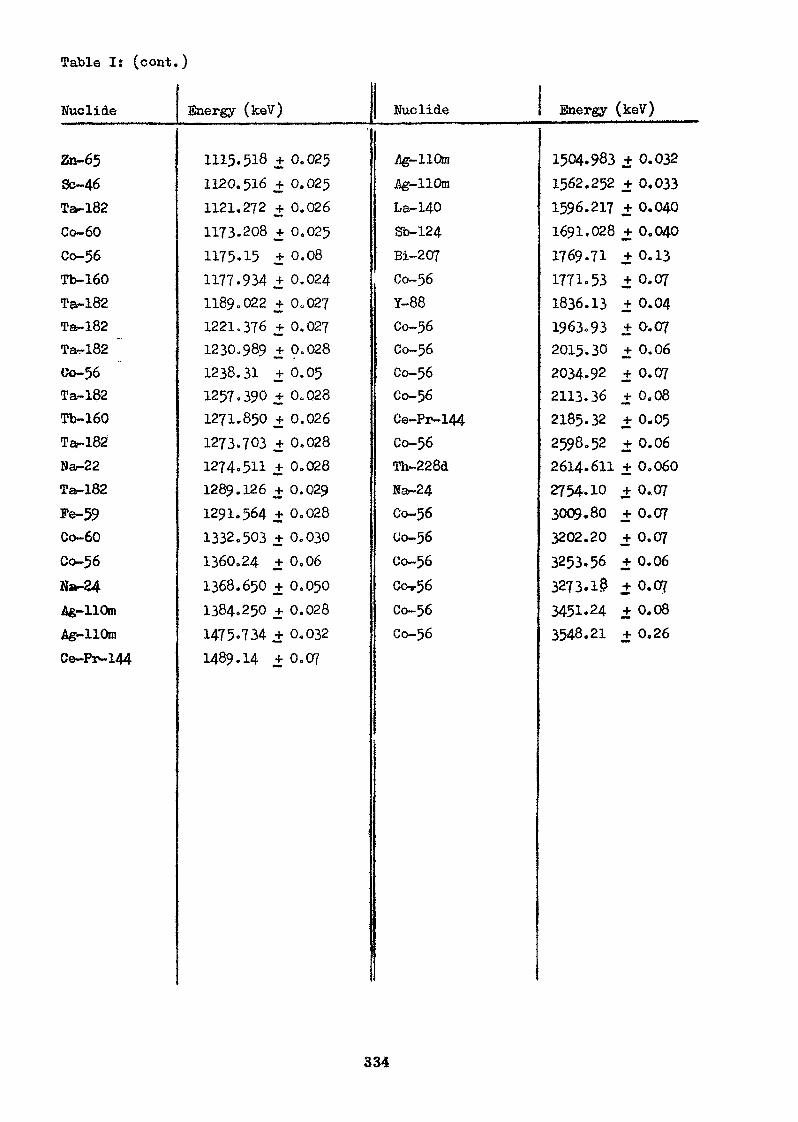
Table I: (cont.)
Nuclide
Zn^65So-46Ta-182Co-60Co-56Tb-160Ta-182Ta-182Tar-182Co-56Ta-182TV160Tar-182Na-22Ta-182
Fe-59Co-60Co-56Na-24Ag-llOmAg-llOm
Ce-Pi -144
Energy (keV)
1115.518 + 0.0251120.516 + 0.0251121,272 + 0.0261173.208 + 0.0251175.15 + 0.081177.934 + 0.0241189.022 + 0.0211221*376 + 0.0271230,989 + 9.0281238.31 + 0.051257.390 H- 0.0281271.850 + 0,0261273.703 + 0.0281274.511 +0.0281289.126 + 0.0291291.564 + 0.0281332.503 + 0.0301360,24 + 0,061368.650 + 0,0501384.250 + 0.0281475.734 + 0.0321489.14 + 0.07
Nuclide
j\g-110m.flg-HOmLa-140Sb-124Bi-207Co-56Y-88Co-56Co- 56Co-56Co-56Ce-P -144Co-56Th-228dNa-24Co-56Co-56Co-56Co^56Co-56Co-56
Energy (keV)
1504.983 + 0.0321562.252 + 0.0331596.217 + 0.0401691.028 + 0.0401769.71 +0.131771.53 + 0.071836.13 + 0.041963.93 ± 0-.072015.30 + 0.062034.92 +0.072113.36 +0,082185.32 + 0,052598.52 +0.062614.611 + 0.0602754.10 + 0..073009.80 +0.073202.20 + 0.073253.56 + 0.063273.18 + 0.073451.24 +0.083548,21 + 0.26
334

Sources of other data:
Bi-207, 1770 keV: Marion [4]Y-88, Ua-24, Th-228 d; HeattLCo-56: Kern [10]Ag-110 m: weighted average of [2,7] and [10]; the weighting and the overall
uncertainty was obtained as dis-cussed above.
La-140, Sb-124: Gunnik [8], corrected for reference energies (table l).Reservations with respect to the precise energy values and the quoted uncertain-ties have been discussed above.
III. STANDARDS FOR DETECTOR EFFICIENCY CALIBRATION
The standards shown in table II are only primary standards. Primarystandards are nuclides for which the values for absolute gamma ray branchingcan be calculated from the decay scheme with high confidence. Thus theselected values do not depend on a previous detector efficiency calibration.The values used depend only on:
- values for beta ray branching;-'internal conversion coefficients;- in some cases on relative intensities of weaker y-rays feedingor depopulating the same level, as the y-ray listed; however, theuncertainty of the intensity of the weak gamma rays does not severelyinfluence the uncertainty of the primary y-ray.
It is common practice to obtain a detector efficiency curve by interpolatingbetween and extrapolating beyond calibration points or by fitting a theoreticalcurve. While this is the only reasonable way to determine the detectorefficiency and the assumption of & smooth urve is supported by theoreticalconsiderations, it has to be born in mind that the detector efficiency isknown only at, and close to, the calibration point with the accuracy of thestandard used. This is not the case, however, for energy ranges not coveredby standards, as, e.g., the range 136 keV - 265 keV or 900 keV - 1.2 JfoVetc. in table II, where the value of the efficiency depends on how the curvewas obtained. Therefore the uncertainty of the detector efficiency in thisrange has to be estimated, but must be larger than in the vicinity ofcalibration points.
It can be observed quite frequently that experimenters quote a common, uncer-tainty for the whole efficiency curve. This'uncertainty is often the same as,sometimes even better than (in the case of a fit), that of the standardsused, neglecting the facts pointed out above. These observations have severalimportant consequences:
a) Uncertainties quoted by measurers sometimes differ widely althoughexperimental conditions were similar. Therefore the evaluator shouldcheck the calibration standards used, how the uncertainty of the efficiencycurve was determined and whether the quoted errors of measured y-ray intensi-
ties are reasonable. If necessary, he should assign errors according to hieown judgement before taking an average.
335

Table II: SMDARDS FOR DETECTOR EFFICIENCY CALIBRATION
Nuclide! Energy (keVl Intensity(^)
Am-241Hg-203
Co-57Co-57Ni-56Se-75Hg-2031-131Au-198Na-22Sr-85Sb-124
Cs-137Nb-95Co-58Mn-54Co-56Y-88Co-60Na-22Co-60Na-24La-140Y-88Na-24
59 . 53774.6
122.063136.473158.3264.651279.188364.49411.794511.004513.996602.71661.638765.786810.757834.827846.751898*021
1173.2081274.5111332.5031368.6501596.201836. 132754.10
350 + 0.512.8 + 0,285.6 + 0.210.6 + 0.298.7 + o.i59.1 + 0.281.5 + 0.282.4 +0.5
95.53+ 0.05181.08+ 0.0499.28+ 0.0198.2 + o.i84.6 + 0.499.80+ 0.0499.44+ 0.0299.978+0.00299.974+0.00193*4 + 0.799 086+ 0.0299.95+ 0.0799.986+0.001100
95*6 + 0.399.37+ 0.0299.85+ 0.02
\ <*)1.41,60.231.90.10.340.250.610.050.0220.010.1
0.470.040.020.0020.001
0.750.02
0.070.001-0.30.02
0.02
Ref,
111111
.111111111111111111111111111111
e)11
e)11111111
Note
a
abcbbba,bbb*bbbbbbabbbb,dbbb,d
Parent
Zr-95
Ba-140
a ... The {accuracy of 'the intensity is less than 0.5$ of the value. However,thefe ie no other more suitable .standard in this energy range.
b ... Higfe accuracy intensity value calculated from level scheme.c ... Low I accuracy , but reliable; as calculated from level scheme.d ... Limited usefulness because of short half life and/or difficult to
produce.P~ branch to 2505.7 keV levels 99.88 + 0.02$; no £ to ground state1173 keV transition: IT = 99.88 + 0.02 $, «m = 1.7 x 10~4
ground state transitions: 2158 keV (l. = 0.0012 $) and 1332 keVi332 keV transition: IT 99.9988 - 1.3 x 10~4
336

b) In principle, a measurement of a gamma ray intensity is always relative toa standard. Similar to y-ray energies, 3 types of errors are involved insuch a measurement and the evaluator should proceed as proposed in II.2.However, the main difference is that an additional error is that of theactivity of the standard at the time of measurement, which is composed ofthe errors of the determination of its activity at the time of preparation,the y-ray absorption in the sample cover and the decay correction for thetime elapsed between preparation of the'standard and the time of measurement,in most practical cases this error exceeds that of the absolute y-rayintensity if primary standards are used. However, the evaluator should takecare that his recommended value, if determined with a calibrated detectorand not deduced from a level scheme, is reasonably larger than the .intensityof primary standards,
c) Consequently, even relative y-ray intensities cannot be more accurate thanthe absolute intensities of standards listed in table II, if a calibratedy-ray detector is employed.
d) Absolute y-ray intensities measured close to a calibration point obtainedfrom a standard can be corrected by an evaluator, if more accurate data forthe standard are available. This is, however, hardly possible for measure-ments of y-ray intensities in an energy range not covered by standards, asit is uncertain, how the efficiency curve was obtained, unless it is givennumerically.
For the reasons given above a reliable set of primary standards as given intable II is recommended for use. However, in many practical applications itis more convenient to calibrate the detector with a standard source emittinga large number of prominent y-rays. This has the advantage of being fast andcovering a large range of the efficiency curve. Then the user has to bear inmind the limited accuracy of the data.
Since the activity of efficiency calibration sources has to be corrected fordecay, pertinent half-life data are given in table III.
REFERENCES:
[1] R.C. Greenwood, R.G. Helmer, R.J. Gehrke, Nucl. Instr. Meth. 21 (1970) 141
[2] R.Go Helmer, R.C U Greenwood, R.J. Gehrke, Nuclear Instr. Meth. 2£ (1971)173
[3] B.N. Taylor, W.Ho Parker, D.N. Langenberg, Rev. Mod. Phys. 4JL (1969) 375
[4] JoB. Marion, Nuclear Data A4 (1968) 301
[5] G. Murray, R.L. Graham, J.S. Geiger, Nucl. Phys. 4J2 (1963) 177
[6] G. Hurray, R.L. Graham, J.S. Geiger, Nucl. Phys. 63. (1965) 353
[7] R.G. Helmer, R.G. Greenwood, R.J. Gehrke, ANCR-10l6-(l97l) 403
[8] R. Gunnik, R.A. Meyer, J.B. Niday, R.P. Anderson, Nucl. Instr. Meth. 65.(1968) 26
R.L. Heath, "Table of Isotopes", Handbook of Chemistry and Physics,54th edition 1973-1974 (Chemical Rubber Co.), page B-248.
337

[10] J. Kern, IAEA Panel on Charged-Particle Induced Radiative Capture, Vienna,October 1972, Proceedings page 345«
[11] K.J. Martin, P.H. Blichert-Toft, Nuclear Data .A8J 1970) 1
[12] J.p. Emery et al., Nucl. Sci. Engg, 48 (1972) 319
[13] M.J. Cabell, M. Wilkins, J. inorg. nucl, Chem, 32 (1970) 1409
[14] K.F. Walz, H.M. Wciss, Zo Naturf. 25a (1970) 921
[15] J.S. Merrit, J.G.V. Taylor, AECL-3512 (1969) 30
[16] So Baba et al., J. inorg. nucl. dK,m. 33 (1971) 589
[17] K. Debertin, Z. Maturf. 26a (1971) 596
[18] M, Lammer, "Evaluations performed for the SGAE fission product nucleardata file", Contribution to Review paper no. 12, this Panel.
Table III: H/LF LIVES(sorted by mass number)
Ruclide
Na-22Na-24
Mn-54Co-56Ni-56Co-57Co-58Co-60
Se-75Sr-85Y-88
Half-life a^
2.60 * 0.01 a15.030+ 0.003 h312.5 + 0,5 d78.76 + 0.12 d
6.1 + 0.1 d269.8 + 0.4 d71.3 + 0.2 d
5.272+ 0.002 a
120 + 1 d
64.5 + 0.5 d10? + 1 d
Hef.
11
I2
1112
11123.1
14111111
Nuclide
Zr-95Nb-95Sb~l241-131Cs-137Ba-140La- 140Au-198
Hg-203Am-241
Half-life a^
63.98 +0.06 d35.045+ 0.005 d60.20 £ 0.02 d
80 040+ 0.001 d30.17 +0.10 a12.789+ 0.006 d40.27 + 0.05 h2.6946+ 0.0010 d46.59 +0.05 d
433 1 2 a
Ref.
17151112
181611131111
a) Half life units: h = hours, d = days, a = years
, 338—
EVALUATIONS PERFORMED FOR THE SCABFISSION PRODUCT NUOLEAR DATA FILE
M. Lammer
Nuclear Data Section, Div. of Researchand Laboratories
International Atomic Energy AgencyVienna, Austria
Abstract;
A brief description of the SGAE fission product nuclear data file wasgiven in [1] and recommended data tabulated without details. Thispaper discribes how the evaluation of half lives, y-ray energiesand absolute intensities and decay branching ratios was performed.References used for these data are listed and individual evaluationsof half lives and branching ratios are tabulated together with theexperimental data used.
1. INTRODUCTION
The investigations performed at SGAE are outlined in [l].They are restricted to applications using fission products withhalf lives of one day and more, that can be measured gamma spectro-metrically. In order to check the capability of predictions bycomputer calculations over a wide range of irradiation conditions,test samples of fissile material were irradiated for short times( ~ hours). Therefore fission products with half lives of several hoursthat can be measured gamma-spectrometrically were also includedrecently.
No literature search for gamma rays was performed for fission productswith half lives of less than 1 day. These data were taken from othersurveys. The most recent update incorporates the data of Tobias [2],
The purpose of the gamma ray table is to enable calculation offission product activities from measured gamma spectra. The tableof gamma rays sorted by energy serves to facilitate the identificationof measured gamma rays.

2. STATUS
Nuclear Data '•Recent References'* were scanned regularityup to issue 5/4 (April 1971}» Pertinent data found in this journalseries were incorporated into the evaluation if available. As theauthor left the SGAE to join the IAEA in October 1971, the regularliterature scan and update of the library stopped* Occasionally newdata were incorporated, only the half life data are fairly completeup to "Recent References" autumn 1972. For this paper new half lifedata found until end of 1973 are included in Appendix B.
Some new references found for gamma ray data are not yet evaluatedand incorporated into the file.
3. UNCERTAINTIES
3.1.____Weighted average
If experimental results (including errors) belong to thesame distribution, then the quoted errors to be used for weightingshould be proportional to the true errors. The standard deviationof the weighted mean can be calculated from:
c 8 I >-!• I - •» • , sb« l/Xv (i)where s. are errors of individual measurements.
As a consequence the deviations of the individual values (x.) fromthe mean (x) should have the same distribution as the s . This canbe tested for a set of n data by:
(2)
In statistics (2) is called the Chi-quared test, if the',distributionof the x. is gaussian. '
., •• ' • ' •In this evaluation also an uncertainty is calculated from (3)*
(3)
The larger value of S, and S2 is taken as estimate of the uncertaintyof the weighted average.

This is not strictly valids The additional factor in (3) (compared to(l)) can be interpreted as the mean error of individual measurementsleading to each x. ± s. used in the evaluation, assumingidentical conditions and purely random errors. This is, however, notthe case: Generally measurements suffer also from systematic errors.These systematic errors are only partially independent , sometimesnot taken into account by experimenters or unknown, but in any casenot common to all experiments and not random.
Therefore, if the left hand side of (2) is larger than 1, the weightsused are not correct and, strictly speaking, should be changedaccounting for systematic errors. However, in practice systematic errorsare not known to the evaluator. The evaluator can reduce the weightof individual data by estimating systematic errors according to hisown judgement or combine quoted errors with the common factor inequation (3). Then he runs the risk of treating very accurate resultsinjustly. Or he calculates the weighted average and its uncertaintyfrom equation (3)» Then the uncertainty reflects discrepances reason-ably! but the average itself may be wrong as some high precision data,which have undetected systematic errors, receive too high weight.Basically the latter approach is chosen in this evaluation aa dis-cussed in more detail below.
3.2, ____ Unwe i ght ed av erage
The standard deviation of the unweighted average is calculatedfrom the well known relation:
c1 ~ \
(4)
The unweighted average is sometimes calculated in cases where someof the data are given without errors. If the uncertainty has to beestimated from an unweighted average, also "SL is calculated from:
§,- (£*)••(*)
m ..... number of data with quoted errorsn ..... total number of data used for unweighted average*
Again the larger value of S. and Sg is used as uncertainty in orderto avoid too email values caused by chance effects.

4. SELECTION OF VALUES
In some cases selected values were considered superior to others,or data were taken from other evaluations. These are the "recommended" dataof half-lives and branching ratios for which individual evaluations are notreproduced and the references are given in appendix A. In the evaluationprocedure data were omitted if they were either of low accuracy or if theydisagreed drastically with a more consistent set of other data, rather thanusing equation (3).
Both, the selection of "superior1* data and the omission of discrepantvalues might be considered somewhat problematic, as in many cases theexperiments have not been studied in detail. However, if one value hasmuch higher precision than others, these other data will have no influenceon a weighted average. In the case of discrepancies it is often notpossible to resolve them by studying publications of measurements. To takea weighted average is not a satisfactory solution. This can be supported byarguments of statistics and theory of error analysis, but this is beyondthe scope of this paper. Prom a practical standpoint the following con-sideration is illustrative; It is not possible to clarify discrepanciesby additional measurements, if all data are included in a weighted average.The addition of a new measurement will not improve the uncertainty to thelevel of experimental accuracy and the average will still not clearly bein favour of one group of results. A good example is the half-life ofCs-137 (see appendix B) where the successive addition of the data of Wel70,Erne?2 and Die73 caused an oscillation of the average around 30 years anddid not improve the uncertainty.
In this work the following criteria were adopted in the selection of preferreddata:
- If data obtained in measurements employing different methods were found to beconsistent, it can be assumed that a systematic error due to the methoditself can be excluded, and inconsistent data were discarded.
- Data from laboratories that are known to produce reliable results andperform a thorough check of systematic errors were preferred.
- Criteria such as superior method or very thorough performance wereadopted in some cases.
5. HALF-LIVES AND BRANCHING BATIOS
Half lives of several fission products evaluated in [3] are usedin the SGAE file. If more recent experimental data not included in [3] becameavailable, a new average was calculated using the results of earlier ex-periments as published in [3]. Half lives of other fission products wereobtained from a literature search and evaluated. Sources of adopted valuesare listed in appendix A, detailed evaluations are reproduced in appendix B.
For each set of data a weighted and an unweighted (using equation (4) only)average is calculated. Final values are adopted from an inspection of theresults, sometimes according to the criteria discussed in section 4. Thecalculated uncertainties were generally increased to account for observeddiscrepancies and to obtain a higher confidence level. Accordingly, if theresult of one author was adopted, the quoted error was doubled if itcorresponded to 1 standard deviation, but remained unchanged if it wasgiven as an overall uncertainty or at least 2 standard deviations.

6. GAMMA-RAY DATA
As discussed in another contribution [4] to review paper 12 ofthis Panel, the uncertainties assigned by experimenters to measured gamma-ray intensities do not follow common criteria and have to be checked.Therefore the calculation of gamma ray intensities varies in this evaluation.Sometimes weighted averages are calculated using quoted uncertainties. Incases where the quoted uncertainties differed significantly among each other,the publications were checked more carefully (especially the spectra shown)and reasonable weights assigned accordingly. If data appeared to be equallyaccurate, unweighted averages were taken.
Often averages for intensities were calculated by different methods andthe results were checked against the input data. Finally the method waschosen that best reflected the input data. Accuracies were not allowedto be higher than those of commonly used standards*
Absolute intensities were calculated in 3 different wayss
- the absolute intensity for one gamma ray was taken from other evaluations.
- Or it is calculated from results of direct measurements.
- Or they are calculated from the level scheme, generally from an intensitybalance of all transitious feeding the ground state. In this case thefitted relative gamma ray intensities were used together with the betatransition to the ground state and, where necessary, with internal con-version coefficients supplemented by relative conversion electron intens-ities.
For the applications discussed in [l] gamma ray energies have to be knownto + 0.1 to 0.2 keV. This is generally satisfied by experimental and evaluateddata. The evaluation of y-ray energies is only a byproduct of the evaluationof intensities, using the same computer programme. A weighted average is cal-culated from selected data. In cases of very high accuracy the standards andenergy scale used were also checked. As the uncertainties of y~ray energiesare insignificant for the applications described in [l], they were notevaluated as discussed in [4]» but calculated according to equation (3)«They should therefore not be used, if reliable uncertainties are required.
Referencesi
[1] O.J. Eder, M. Lanuner, IAEA Symposium on Nuclear Data in Science andTechnology, Paris, March 1973, proceedings Vol. I, page 233.
[2] A. Tobias, CEGB (UK) report RD/B/M2669 (1973)
[3] M.J. Martin, P.H. Blichert-Toft, Nuclear Data .48 (1970) 1
M. Lammer, "Standards for Calibration of Semiconductor Detectors'*,Contribution to review paper no. 12, this Panel.

Appendix A: SOURCES OP ADOPTED DECAY DATA
Half lives
AS-77 S. A. Reynolds, Nucl. Sci. Engg. 32 (1968) 46Kr-85 [3] and D. Horen, Nucl. Data Sheets 5/2 (1971)Sr-90 Weighted average of [3]Sr-91 J.D. Knight et al., Nucl. Phys. A13Q (1969) 433Zr-95 K. Debertin, Z. Naturf. 26a (1971) 596Nb-95m [3]Nb-95 J-S. Merrittand J.G.V. Taylor, AECL-3512, page 31 (1969)Zr-97 KFK Chart of Nuclidee (1968), estimated uncertaintyRu-103 K. Debertin, Z. Naturf. 26 a (1971) 596Rh-105 Y. Kobayashi, JAERI-1178 (1969) 21
Ru-106 weighted average of [3]Pd-109 Nucl. Data B6/1 (1971)Ag-llOm J.P. Emery et al., ORNL-4466 (1970) page 75
Ag-111 [3](Pd-Ag)-112 S. Raman and H.J. Kirn, Nucl. Data Sheets J/l (1972)
Cd-115 g S. Baba et al. J. inorg. nucl. Chem. ^33_(l97l) 589Sn-12lm Nucl. Data Sheets 6/1 (1971)Sn-121 From data shown by Erdal et al.t J. inorg. Nucl. Chem. ^0(1968)
1985
Sn-123 see Sn-121Sb-124 [3]Sn-125 see Sn-121Te-125 m [3]Sb-126,Sb~127 E. Hagenbjrf, J. inorg. nucl. Chem. J9_ (196?) 2515Te-127m G. Andersson et al. Ark. Fys. .28_(l965) 37
Te-131m E.G. Sarantites et al, Phys.Rev. 138 (1965) B353 (30+ 2 h)(Te-l)-132 weighted average of [3]
Xe-133g J.F. Emery et al, Nucl. Sci. Engg. 48 (1972) 319(l~Xe)-135 R. Hawkxngs et al., Can.J. Phye. 49. U97l) 785
Cs-136,Ba-140 Baba, see Cd-115 gLa-140 [3]Pr-142 Radiochim. Ada. 9^(1968) 66Ce-143 Lederer et al., TaMe of Isotopes (1967)Ce-144 unweighted average of [3]
Pm-147 [3]
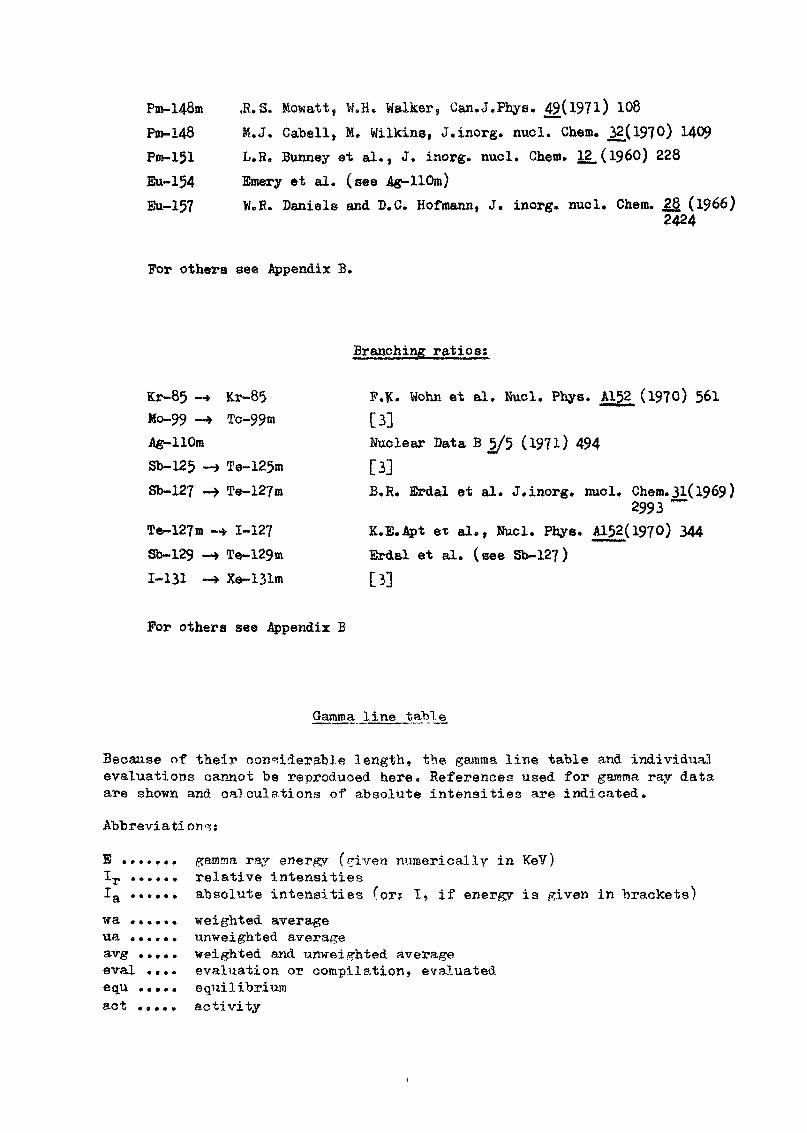
Put- 148m ,R.S. MowaU, W.B. Walker, Can.J.Phys. 49(l97l) 108Pm-148 H.J. Cabell, M. Wilkins, J.inorg. nuol. Chem. 32(1970) 1409PBft-151 L.R. Bunney et al.( J. inorg. nuol. Chem. 12. (i960) 228Eu-154 Emery et al. (see Aff-llOm)Eu-157 W.R. Daniels and B.C. Hofmann, J. inorg. nuol. Chem. 28 (1966)
2424
For others see Appendix B.
Branch ing rat i o s ;
Kr-85 ~*Mo-99 -» Tc-99mAg^llOmSb~125 -» Te~125mSb-127 -^ Te-127m
Te~127m -^ 1-12?Sb-129 ~» Te-129m1-131 ~» Xe-131m
P.K- Wohn et al. Nucl. Phys. A1 2 (1970) 561[3]Nuclear Data B 5/5 (1971) 494[3]B.R. Erdal et al. J.inorg. nuol. Chem. 31(1969)
2993 ~~K.E.Apt et al., Nucl. Phys. A152(1970) 344Erdal et al. (see Sb-127)
For others see Appendix B
Gamma line table
Because of their considerable length, the gamma line table and individualevaluations oannot be reproduced here. References used for gamma ray dataare shown and calculations of absolute intensities are indicated.
Abbreviations:
B ....... gamma ray energy ( iven numerically in KeV)Ir ...... relative intensitiesIa ...... absolute intensities (or? I» if energy is #iven in brackets)
weighted averageunweighted averageweighted and unweighted averageevaluation or compilation, evaluated
wa ......ua ......avg .....eval ....equ ..... equilibriumact ..... activity

trans ... transitiongs ...... ground stateIT ...... internal transitionbr ...... branching ratioa ....... conversion coefficient
"Explanations:
If neither of wa, ua or avg is given, best values have been selected froman eye-inspection of experimental data.
Underlined references are preferred for several reasons:
E: The authors have made measurements of higher accuracy than the othersshown or have made a careful calibration. Other measurements shownhave sometimes comparable accuracy or/and are the only ones.
IT: Contrary to E, accuracies are not so much different, at least forgammas of higher intensities. However, some authors (underlined)have measured with higher accuracy fusing different detectors and methods)and better resolution (important for doublets, better enhancement ofweak lines above background) and/or performed better calibration. Theirdata are preferred in cases of discrepancies, particularly for weakgamma rays. Other references listed are also used, those shown in bracketswere often discarded.
Ge-77 evalAs-77 E: wa of Yth66, Ard68 and Sar69
Ir: wa of Yth66 and Ard68Iai 1(239+250) = 2$ (aval 4rt66)
Br-82 E: wa of MerJO and Rei64Iri wa of MerJO, Ram7j3, Ram67 and Uu69Iai 1(776.5+1426) - 100$
evalKr-85 E: Hel71 (from Sr-S1? decay, see eval Lam73)
I0: wa of Rid60, aei6l,Lyo6l,Eas64,Den67,And66a and Fak66cl
Rb-86 EJ wa of Har63,Mar6l5,Noo65 and Pie67Ia$ wa of Lyo54,Eme5^,Cam60,Bra62,Gup6? and And66
Sr-89 eval Mar70
Sr-91 eval Tob73T-91 eval Mar70T-92 eval Tob73Y-93 eval Tob73
Zr-95 E: Hal71 (see eval Lam73)Ir: wa of Bru6I5,Bro67,Tsa66,Leg67b,Eme68,His68,Bra69 andIa: 3" to gs = 0.4*0.2$, B~ to NTb-g^m = 0.84±0.26$ (Appendix B)E: wa of Leg6?b, Bra69 and Foi69Iai from aT (see Appendix B)
Nb-9S E: He171 (see evai Lam?3)I : eval Mar?0
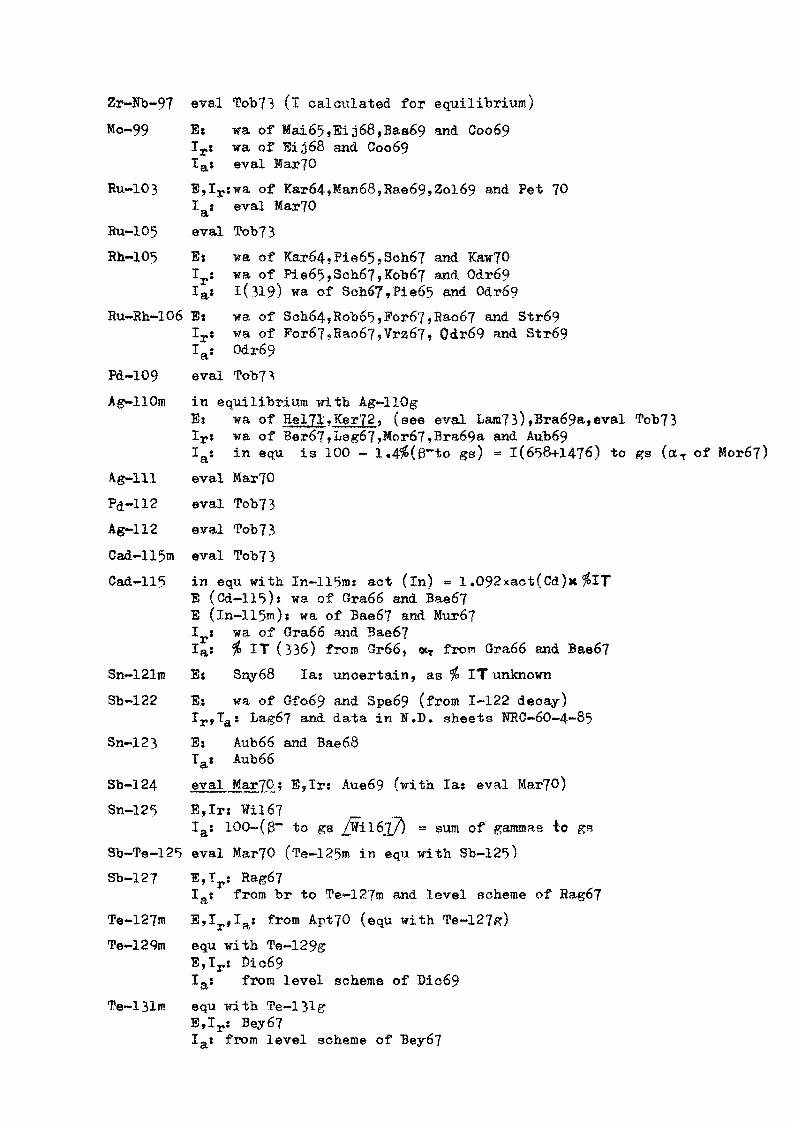
Zr-Fb-97 eval Tob73 (I calculated for equilibrium)Mo-99 Es wa of Mai65,Ei;j68,Bas69 and Coo69
Iri wa of Eij68 and Coo69I » eval
Ru-103 E,Ir:wa of Kar64»Man685Rae69,Zol69 and Pet 70!„» eval Mar 70
oL
Ru-105 eval Tob73
Rh-105 E: wa of Kar64»Pie65,Soh67 and Kaw7QIrs wa of Pie65,Sch67,Kob67 and Odr69Iai 1(319) wa of Sch67,Pie65 and Odr69
Ru-Rh-106 E: wa of Sch64sRob6E>,For67,,Rao67 and Str69Irj wa of Por67,Rao67,Vrz67, Odr69 and Str69Ia: Odr69
Pd-109 eval Tob7^
Agf-llOm in equilibrium with Ag-llOgEJ wa of Helj^ » fe>TjT,2 , (see eval Lara73)»Bra69a,eval Tob73Ir: wa of Ber67,Leg67,Mor67,Bra69a and Aub69Ia: in equ is 100 - 1.4^(e"to gs) = 1(6^8+1476) to ^s (aT of Mor67)
Ag-111 eval Mar70
Pd-112 eval Tob?3Ag~112 eval Tob73
Cad-1 15m eval Tob73Cad-11? in equ with. In-115m: act (in) - 1.092xact(Cd)x %IT
E (Cd-115)» wa of Gra66 and Bae6?E (ln-115m)j wa of Bae67 and Mur67I j wa of Qra66 and Bae67Iaj % IT (336) from Gr66j «T from Gra66 and Bae67
Sn-121m Es Sny68 Ia: uncertain, as % IT unknown
Sb-122 E: wa of Gfo69 and Spe69 (from 1-122 decay)Ir,Ias Lag67 and data in W.D. sheets TOC-60-4-85
Sn-123 E: Aub66 and Bae68Iai Aub66
Sb-124 eval. J?.ar7P ; E,Irs Aue69 (with Ia; eval Mar?0)
Sn-125 E,Ir: Wil67Ia: 100-(g~ to gs $±16]}) = sum of gammas to &s
Sb-Te-125 eval Mar70 (Te-125ro in equ with Sb-12'5)
Sb-127 E»Trs Rag67
Iat from br to Te-127m and level scheme of Rag67
Te-127m E,Ir,Ia» from Apt70 (©qu with Te-127*r)Te-129m equ with Te-129g
E,Ir: Dic69Ia$ from level scheme of Dic69
Te-131m equ with Te-131gE,Ir: Bey67Ia; from level scheme of Bey67

1-131 eval Mar?0Xe-131m Ej eval Mar?0
I » from br and ee/T of eval Mar70 (in Mar 70, Ia is given forequ with 1-131)
Te-I-132 in equ: act (l) = 1.026*0,001 * act (Te)Te: eval Mar70I: Ei avg of Ham63»Boy6%Joh6%A:rd66,Yth67,Car68,Hen69,Hen69a,
Car?0 and QuaTOIriwav of Car70>Ard67tHen67 and Hen69 (Ard66,Yth67,Ard69 and Hen6"9a)Ta»eval Mar70
1-133 eval Tob73Xe-133m E;
Ia : eval MarJOOb
Xe-133 E: Gre7Qa, wa of Sie64,Mai65,Thu66,Hen67a,Bar68,Bos68,I)on68 and Pra69Ir;Ale68Iateval Mar70
Cs~134 S: wa of Bro65 , Leg67a and Rea67Ir:wa of Bro6f),Leg67a,Pae67,Abd68,Nai9:68 and Hof70Iastrans T(605 + 1168) - lOOfo, otT (60^) *, 0.006
1-135 eval Tob73
Xe-131? eval Tob73
Cs-136 E,Ia« Pra67 (las l(8l8) - 1(X$)
Gs-137 E: Gei68 as eval by Hel71 (see also eval Lam73)IQ:eval Mar70
a.
Ba-140 B« Ker70Ir:wa of Kal69 and Ker70T_:eval Mar70
Of
La-140 E: wa of Bae66,Kar67,Bae68a, Qun68 and Ker70aIrswa of Vrz66,Bae68a and Kal70 (Dzh66,Kar67)Taseval Mar?0
Ce-141 Bs Gre70a (see eval Lam73)I a: eval Mar70
Ce-143 B,TriGre68Ia: from level scheme of Me^68
Ce-144 B: Gei60, av/s; of Ant?0 and P1aa70T rswa of Ant70 and Fa-^OJa:wa of OraSS^LyoSS, Por59 and Sil6l for 1(133)
Pr-144 E: wa of Ram68,Say68 and Pa.«?70Ir:wa of Port>9,Mon6l,Sara68,Say68 and Pas70Ia:eval Mar70
Nd-147 B: wa of Hil6_7_,Bae67a and T)ou67Irtwa of Bae67a,Can67»T>ou67 and H1167Ia:from Can67
Pm-147 E: Mow70 and Bel 71Ia:Mow70
Pm-148m B: wa of Har68 and Gre70IasGre70 (corrected for pure Pm-148m)

Pm-148 Ei from Pm-148m
Cab71: Mcl66
Pra-151 eval Tob73Sm-153 Et GreTOa (see eval Laro73)» Rae70 and Ung69
Ia» Vng 69Eu-154 E« of Mey68, Au69,Kel70,Rae70,Rei70 and Rie70
Irj ua of Mei68,Aub69,Var69,Kel70 and Rie70Iat from Mey68 (more accurate than from level scheme using a)
Eu-155 Es wa of RaeJO^eiJO and Mey69Irt wa of Mey69»Ala68a and Rei70Iat 1(60+86+105+146) - 100 - 13lj6(B" to gs),aT from aK, at and
multi polarity given "by Mey69»Eu-156 l) 8^+199 KeV Ys evaluated separately as severe discrepancies
in intensity ratio 89/812 and 199/812 exist.Ei wa of Sch6l and Hae70Ir: 199/89 wa of Ewa62 and Ale68a
89/812 8Ewa62 and Dah66a2) other gammas
E: ua of IjvajSS? and Pe_e64,,Dzh66aIr; strong lines and composite Nal peaks* avg of Cli6l,T5wa62,Ewa64
Pee64>Dzh66a and Gri69week lines and ratios for multiple peaksi avg of Dzh66a and Gri69
Bu-157 eval Tob73Tb-159 eval Tob73
Referencea for ^amma-ray datat
Abd68 A. Abdul-Malek and R.A. Naumann, Nucl.Phys. A 106 (1968)Ale68 P. Alexander and J.P. Lau, Nucl.Phys. A 121 7l968) 612Ale68a P. Alexander, Nucl.Phys. A 108 (1968) 145And66 S. Andre and P. Depommier, Compt. Rend. B 262 (1966) 214And66a H.J. Andrae et al, Z. Naturf. 21a (1966) 1987Ant70 A. Antilla and M. Piiparinen, Z.Phys. 237 (-1970) 126Apt70 K.E. Apt et al, Nucl.Phys. A ISg (1970) *44Ard66 G. Ardisson an<? P.X. Petit, Compt. Rend. C 26* Cl966) 1408Ard67 G. AtHip^on. no^nr>t. Tprd. CJ264 ^ l c >67) 1999Ard68 fJ» Ardisson et al, Oomnt. P^nfl. ^_?6£ (1^68) 344Ard69 G. Ardisson et al, Compt. T?f>nd. B ?68 (19^9) 96Art66 A. Artna, Nncl. Data B 1/4 (1966) SAxib66 F.I. Auble and W.F. Kelley, Nuol.Phys. 81 (1966) 442Aub69 0. Aubin et al, Nucl.Tnstr.Meth. £6 (1969) 93Bae66 R.W. Baer et al, Nucl.Phys. 86 (1966) 332Bae67 A. Baeoklin et al, Nucl.Phys. A__g6 (1967) ^*9Bae67a A. Baecklin and S.O. Malmsko^, Ark.Fys. j|4_ (1967) 459

Bae68 P.A. Baedecker et al, Nucl.Phys. A 10% (1968) 449Bae68a H.W. Baer et al, Nuol.Phyg. A 113"ll968) 33Bar68 J. Barette and S. Monero, Nucl.Instr.Meth. j53_ (1968) 235Bas69 E. Baehandy et al, Z.Naturf. 2£a (1969) 1893Bel71 K.A. Belt et al, Nucl.Phys. A_3J5_ (*97l) 129Ber6? P. Van Bercham and P.O. Roehmer, Helvet.Phys.Acta 40 (196?) 809Bey67 L.M. Beyer et al, Nucl.Phys. _AJ»j}_ (196?) 436BoB68 B.E. Bosch et al, IFuol .Phys. A__108 ('1968) 209Boy65 M.¥. Boyd and J.H. Hamilton, Nuol"phys. J2 (1965) 604Bra62 H.W. Brandhorst, Jr. and J.W. Cobble, Phys.Rev. 125 (1962) 1323Bra69 S.M. Brahroavar and J.H. Hamilton, PhysuRev. 18J (1969) 1487Bra69a S.M. Brahmavar et al, Nucl.Pbys. A 123 (1969) 217Bro65 R.A. Brown and G.T, Kvran, Nucl oPbys." 68 (1965) 32C>"Bro67 L. Broman and S. Boreving. Ark.?yr. ^JT (1967) 2^9Bru65 -T> . Brune et al, Nukleomk 7 (iQfi6!) 484Cab71 M.J. Cabell and M . WilkinsT J.Inor*.*acl.Chem. 3J (l97l) 19*>7Cam60 P.J. Campion et al, J.AtmL .Rad.Isot. 8 (i960) 8Can67 M.J. Canty and R.D. Connor, Ntiol.Phys. A^ 104 (1967) 35Car68 H.K. Carter and J.H. Hamilton, Kuol.Phys. A_ll_5 (1968) 417Car70 H.K. Carter et al, Phys.Rev. CJL (1970) 649Cli6l I.E. Cline and R.L. Heath, Nucl.Phys. 22 (1961) 598Coo69' W.B. Cook et al, Uucl .Ph,ya. A 13? (1969) 277Den67 B. Benecke et al, Wucl.Sci.Engg. 28 (1967) 305Dic69 tf.C. Dickinson et al, Nucl.Phyf. AJ2J (1969) 481Don68 D.P. Donnelly et al, Phys.Rev. 173 (1968) 1192Dou67 P.W. Dou^an and B. Erlandsson, 55.Ph.ys. 20J (1967) 108Dzb66 B.5. Dsihelepov et al, Izv. A.K.SSSR, Ser. Fiz ^0 (1966) 403Dzh66a B.S. Dzhelepov et al, lav. A.H.SSSR, Ser. Fi2 JO (1966) 394Eas64 T.A. Eastwood et al, Can.J,Phys. 42 (1964) 218Eij68 C.W.E. Van Eijk et al, Nuol.Phys. A_l£i (1968) 440Eme55 E.W. Emery and N. Veall, Proc.Phys.Soc. (London) A 68 (1955) 346Eme68 J.P. Emery, ORNL-4196(l968) 66Ewa62 G.T. Ewan et al, Mucl.Phys. _A....?3 (196?) 15^Eva64 G.T. Ewan and A 0 J . Tevendale, Can.J.Phya. 4.2 (1964) 2286Fas70 J.L. Paschinfret al, Phys.Rev. C _ l (1970) 1126Poi69 C. Poin et al, Nuol.Phys. A 123 (1969) 513Por67 H. Porest et al, Compt. Rend. B_2_64 (1967) 1614Pra67 J. Prana et al, Czech.J.Pbys. BJjf (1967) 1048Pra69 K. Pransson and P. Erman, Ark.Pys. J3_9. (1969) 7Gei60 J.S. fJei.ger et al, Hucl.Ph.ys. Ij6 (i960) 1Gei6l K.W. Geiger et al, Nucleonics 1_9/1 (1961) 97Gei68 J . S . Geiger, AECL-3166 (1968) 28Gfo69 »• Gfoeller et al, ?,.Phys. 22J (19^9) 45Gra58 R.L. Graham et al, Can.J.Phys. 36. (1958) 1084Gra66 G. Graeff© et al, Phys.Rev. 149 (1966) 886Gre68 P.R. Gregory, Can.J.Phya. 46 (1968) 2797Gre70 W.M. Greenber^ and H.J. Pischbeok, Z.Phys. 2JJ (1970) 391Gre?0a R.C. Greenwood et al, Nucl.Instr.Meth. 72 (1970) 141Gri69 Z. Gritchenko et al, Yad.Fiz,, 10 (1969) 929Gun68 R. Gunnifc et al, Nucl.Instr.Meth. 65_ (1968) 26Gup65 V.C. Gupta et al, Mucl.Phys. 13 (1965) 413

Ham63 J.H. Hamilton, Physica 2% (1963) 885Har63 J.W. Harpster et al, Nuol.Phys.47 (1963) 443Har68 B. Harmatz and T.H. Handley, Nucl.Phys. A 121 (1968) 481Hel71 R.G. Helmer et al, Nuol.Instr.Meth. 96 (l97l) 173 and
ANCR-1016 (Got 1971) 403Hen67 R. Henck et al, Buol.Fhys. A_jQ (1967) 601Hen67a H.J. Hennecke et al, Phys.Rev. 159 (1967) 655Hen69 H. Henc'k and A. Oizonf Gompt. Rend, B 269 (1969) 337Hen69a R. Henck, priv, comm. to Car70, (1969)H1167 J.C. Hill and M.L, Wiedenbeck, Hucl.Phys. AJ& (1967) 599Bi368 J.E. Hisoott, AERE-R 5342 (1968)Hof70 S. Hofmann et al, 2.Phys. 2JX> (1970) 37Joh65 N.R. Johnson et al, Nucl.Phys. J£ (1965) 617Kal69 V.G. Kallinikov and Kh.L. Ravn, Iav,A.N.SSSR,Ser.Fiz.3^ (1969) 2068Kal70 V.G. Kallinikov et al, Isv.A.tf.SSSR,Ser.Fiz.jl4_ (1970) 916Kar64 S.B. Karlsson et al, Ark.5ys.2J_ (1964) 61Kar67 S.E. Karlason et al, Nucl.Phya. A 100 (1967) 113Kaw70 H. Kawakami and K. Hisatake, Nuol.Phys. A 149 (1970) 523Kel70 G.E. Keller and E.P. Zganjar, Nucl.Phys. A l^ (1970) 647Ker70 J. Kern and G. Mauron, Helvet.Phys.Aota 4J (1970) 272Ker?0a J. Kem, 5uel.Instr.Meth. J£ (1970) 233Ker72 J. Kern, IAEA Panel on"Charged-Particle Induced Radiative Capture",
Vienna, Oct. 1972, Proceedings p. 345Kob67 Y. KoToayashi, J.Inorg.Nuol.Chem. 2£ (1967) 1376Lag67 J.M. Lagrange et al, Ann.Phys. (Paris) 2_ (1967) 141Latn73 M. Laramer, contribution to Review Paper 12, this Panel* "Standards for
Calibration of Semiconductor Detectors"Leg67 J. Legrand and J.P. Boulanger, Compt. Rend. B_265 (1967) 697Leg67a J. Legrand and J.P. Boulanger, Compt. Rend. B 265 (1967) 782Leg67b J. Legrand et al, CEA-R-3285 (1967)Liu69 E. Liukkonen, Hucl.Phys. A 138 (1969) 163Lyo54 W.S. Lyon and J.E. Strain, Phys.Rev. 25. (1954) 1500Lyo58 W.S. Lyon, Nucl .Sci .Engg. 4. (1958) 703Lyo6l W.S. Lyon, Kucl.Sci.Engg. £ (1968) 148Mai65 B.P.K. Maier, Z.Phys. 184. (1965) 143Man68 J.C. Manthurutil et al, Phys.Rev. 165 (1968) 1363Mar65 K.W. Marlow, Nucl.Phys, 61 (1965) 13Mar?0 M.J. Martin and P.H. Blichert-Toft, Nucl.Data A_8 (1970) 1Mcl66 L.B. Mclsaac and R.G. Helmer, Phys.Rev. 150 (1966) 1033Meg68 D.G. Megli et al, Nucl.Phys. A 10? (1968) 117Mer70 G.P. Meredith and R.A. Meyer, Buol.Phys. A 142 (1970) 513Mey68 R.A. Meyer, Pbyg.Rev. 170 (1968) 1089Mey69 R.A. Meyer and J.W.T. Meadows, Nuol.Phys. A 132 (1969) 177Mon6l J.E. Monahan et al, Phys.Rev. 12_3_ (l96l) 1373Mor67 J.A. Moragues et al, Huol.Phys. A__^2 (l967) 652Mow70 R.S. Mowatt and J.3. Merritt, Can.JoPhys. 48 (1970) 453Mur67 E.L. Murri et ai, Phys.Rev, 155 (1967) 1263Nag68 T.S. Hagpal, Can.J.Phys. 4j6 (1968) 2579Nak6l I.E. Nakhutin et al, Sovj.Phys. JETP 12 (1961) 687Noo65 B. Van Hooijen et al, Hucl.Phys. 63. (1965) 241Odr69 P. Odru, Rad.iochim.Acta 12 (1969) 64Pee64 B.P. Peek et al, Phys.Rev. B_l_3jS (1964) 330Pet70 H. Petterson et al, Z.Phys. 2,32 (1970) 260

Pie65 W.R. Pieraon, Phys.Rev. B 140 (1965) 1516Pie67 W.8. Pierson and K. Rengan, Phys.Rev. 139 (1967) 939Por59 P.T. Porter and P.P. Day, Pbys.Rev. 114 (1959) 1286QuaTO S.M, Quaim, Nucl.Phys. A 154 (1970 ) 145Rae6? D.B. Raeside et al, Nucl.Phys. A 93 (196?) 54Rae69 B.B. Raeside et al, Nucl.Phys. AJLM (1969) 347Rae70 D.E. Raeside, Huol.Instr.Meth. IlU970) 7Rag67 R.C. Ragani et al, Nucl.Phys. A_9_9_ (l.96?) 547Ram67 3. Raroan, Kucl.Phys. A 90 (1967) 508Ram68 S. Raman, Nuol.Phys. A 107 (19681) 402Ram70 S. Raman, Pbys.'Rev. C_2 (1970) 2176Rao67 P.V. Rao and R.W. Pink,' Nucl.Phys. A 103 (196?) 385Rei64 J.J. Reidy, TID-21826 (1964)Rei70 J.D. Reiers.cn et al, Nuol.Phys, A 153 (l9?0) 109Rid60 B.P. Rider ,and .7 .P. Peterson, Jr., fJBAP-3496 (i960) (revised Peb 196l)Rie70 L.L. Riedinger et al, Phys.Rev. C 2 (1970) 2358Rob65 R.L. Robinson et al, Nuol.Phya. 74 (1965) 28lSar69 V.G. Sarantites and B.R. Erdal, Phys.Rev. 1J7. (1969) 1631Say68 A.R. Sayres and C.C. Trail, Nucl.Phys. A 113 (1968) 521Soh6l O.H.B. Schult, Z.Naturf. I6a f l96l) 927Sch64 W. Scheuer et al, Nuol .PhysV ^4 (1964) 221Sch67 S.O. Sohriber and M.W. Johnfl,"¥ucl.Phy3. A_2.6 (19^7) ^7Sie64 K; Siegbahn et al, Nuol.TnstT.Meth. 21 (1964*)" 173•5il6l A.N. Silantev and B.S. Kusnetsov, Izv.A.N.SSSH,Ser.Piz.Sny68 R.B. Snyder and fl.B. Beard, Nuol.Phys. 1J._1_3_ (1968) 58lSpe69 'B.H. SiDe,iew9ky, Phys.Rev. TJ36 (1969) 1270"Str69 K.D. Struts et al , Z.Phys. £fl, (1969) 231Thu66 J.F, Thun et al, Nucl.Phys. 88 ^1966) 289Tob73 A. Tobias, C.B.O.B. (UK) report RD/B/M2669 (June 1973)Taa66 R. Tsaletka and Y. Vrsal , JINR-P-2739 (1966)Ung69 J. TJnsrin and M.W. Johns, Nucl.Phys. A_127_ (1969) 353Var69 L. Varnell et al, Nuol.Phys. AJjgJ (1969) 270Vrs66 Y. Vrsal et al , JINR-P6-2986 (1966)Vr?,67 Y. Vrzal et al, Tav.A.N.SSS^Ser.U1^. JI (196?) 696Wi]6? J.P. Wild and T*.B. Walters, Nucl.Phys. AJLO^ (1967) 601Yth66 C. Ythier et al, Physica 32 (1966) 1351Yth67 C. Ythier et al, Compt. Rend. B 264 (1967) 84Zol69 W.H. Zoller, Nucl.Phys. A__1JQ (1969) 293
(l96l) 1186

APPEKDIX B; BASIC DATA AND ADOPTED VALUES
presentation of basic half-life data and adopted values follows
essentially that of Martin and Blichert-Toft /3_/» Some of the evaluationsshown in Appendix B have been updated since the publication of /!_/• Thisis indicated by a remark to the adopted value.
Abbreyi ati.ons»
Headings:
Averages*Production*
Methods
Ref = reference, TV?. «= half -life
Wo = number of TV 2 followed decay (d ' = complete decay)
wa ss weighted average, ua = unweighted average
p = proton, n = neutron, f = fission,
chem ....... radiocheraical separation
ms ......... mass-spectrometry
©w-pc ...... end-window proportional counter
gf—pc ...... gas flow proportional counter
GM ......... Oei^er—Muller counter
hp-Y-ic .... high pressure 4lT^amma ionization chamberic ......... ionination chamberpc .......*. proportional countfir
p-scin ..*.. plastic scintillator
well- ...... well type orystal scinti]laterN .......... number of atoms determined
st ......... standard
Ral.f Lives
Br-82
RefMer62Rey68Col 7 3
TV 2 (hours)
35.344 -5.34 r"35.28 i
• .013.03.01
35.31 - .02 wa, 35.32 I 0.02 uaadopted 35.31 - .04
others: 36.0 i 0.1 /Ber^O/, 35*8? - 0.05 /Cob5o7, 35o7
35.10 i 0.13 /Win5!A 35.55 * 0.150.3

Rb-86
Ref
Eme55Nid55Wri57Bab71Eme72
all*omittedadopted
3r-89
Ref
Her55Her55Osm59Ans65Bab71
adoptedothers:
I=SB.RefBun54Her56Wya6lHof63Mar65Bab71
•W2 (days)18.66 - -0318.64 - .0418.68 t .0718.61 i .04
*18.82 i .1118.650 i .019 wa,18.645 - .020 wa,18.65 i .03
VV2 (days)
50.5 J .250.5 J .250.36^ .1850.52- .0350.55- .0950.5l8i.028 wa,50.52 i.0551 i 1 j/Kje 567,
TV2 (days)58.5 i 1.058.3 J 0.359.1 i 0.258.8 i 0.259.0 i 0.658.5li 0.06
No
495
192
18.18.
No
8
2.65.112
50.
53.6
No
1
26.6
11
Production Method
Rb(n,V) chemPP, chemRb(n,V) chem CMU-238(p,f) chem gf-pcRb(n,Y) ohem Nal
682 i 0.036 ua648 i 0.015 ua
Production Method
U(n , f ) , chemSr-88(n,"0» Y(n,p)Sr(n,Y)Sr-88(n,Y) chem GMSr-88(n,Y) pcU-238(p,f) chem . gf-po
486 i .033 ua
i ,4 Sat 62/, 52.7 - .5 fily ^
Production MethodU(n , f ) chem Nal, p-soinU(n,f)U(n, f ) chem 2^" -pcU(n, f ) chem gf-pcPu-239(n,f<) chem 4^r -pcU~238(p,f) , ... sf-pc
58.58i 0.08 wa, 58.70 i 0,13 uaadopted 58.51- 0.12

Ref fV2 (hours) No Production Method
Sei47Oun57Pro58New6lCro65Bal67Bal67Rey68Bab71Eme72all*omittedadopted
66.0 i 0.166.0oi 0.15
*67.2 t 0.265.6 - 0.2
*66.7 - 0.165.93- 0.2465. 95^ 0.04
*66.69i 0.06*66.5 i 0.266.02± 0.0166. 04^ 0.05 wa,
I 66.015*0.012 wa,L 66.0 * 0.1
88
111189
3-5335-4
66.2665-92
U(n,f) chemU(n,f)+Mo(n,Y) ohemU{n,f), chemU(n,f) chemMo-98(n»Y) chemMo(n,Y)Mo(n,V)tl(n,f)+Mo(n,Y) chemII-238(p,f) chemU(n,f) cherai 0.15 ua± 0.07 ua
icgf-pcGMpoWell-Nalew-pcsoinhp-Y-iogf-pcwell-ecin
The lower values are adopted, because the higher ones may be in error due_jtopossible contamination with induced activities or fission products Bnie72./.No clarification is possible without careful investigations of all sourcesof error.
Cd-115m
Ref
Wah59Bab71
TV? (days)
44.2 ± 0.544.8 1 Oc3
No
d
ProductionU-235(n,f)U-238(p,f)
Methodgf-pc«f-pc
adopted44.6 - 0.3 wa,44.6 - 0.5
44.5 - 0.3 ua
Sb-122
Ref
Hag67Bor68
TV2 (hour<0
64.34;67.7 J65.14
0.061.20.14
64.47 0.23 wa,
No Productionll(p,f) chemSb(n,2n) chem3b(n,Y)__chero._tl.O
Method
NaT
0. .. .
(supersedes fV? f iven in
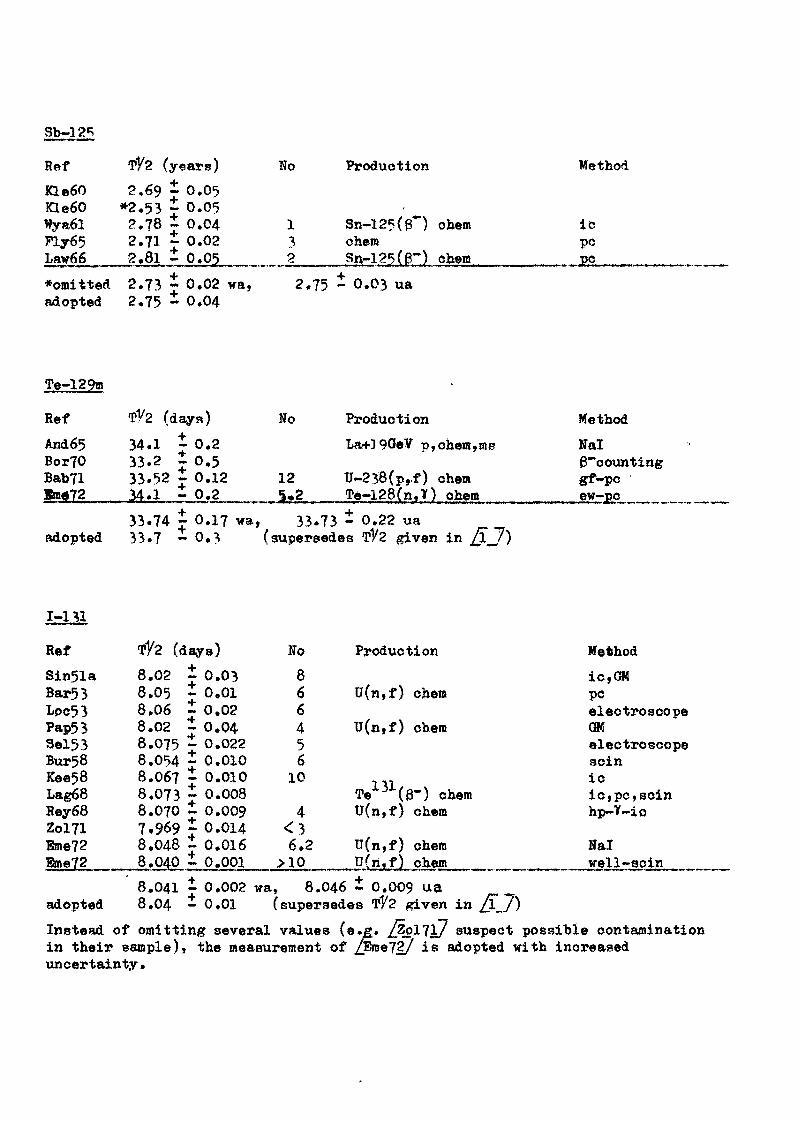
Ref TV2 (years)Kle60 2.69 i 0.05Kle60 *2.53 - 0.05Wya6l 2.78 i 0.04Ply65 2.71 i 0.02Law66 2.81 i 0.05*omitteA 2.73 - 0.02adopted 2.75 - 0.04
No
132
wa, 2.75
Production
Sn—125\P ) chemchemSn-125(P*") chemi 0.03 ua
Method
icPCj>C
Te-129m
RefAnd65Bor70Bal>71
adopted
TT2 (days)
34.1 j 0.233.2 J 0.533.52 J 0.1234.1 - 0.233.74 J 0.1733.7 - 0.3
No ProductionLa*190eV p,chem,ms
12 U-238(p,.f) chem5«2 Te-128(n,TO ohem
wa, 33.73 - 0.22 ua(supersedes TV 2 given in fcij}
MethodNal6""countinggf-pcew-pc
1-131
Ref fV2 (days) No ProductionSin51a 8.02 1 0.03 8Bar53 8.05 - 0.01 6 U(n,f) chemLpc53 8.06 i 0.02 6Pap53 8.02 i 0.04 4 U(n,f) chemSel53 8.075 - 0.022 5Bur58 8.054 - 0.010 6Kee58 8.067-0.010 10Lag68 8.073 - 0.008 Te 3 (0-) chemRey68 8.070 ~ 0.009 4 U(n,f) chemZol71 7.9^9 i 0.014 < 3Eme72 8.048 ~ 0.016 6.2 U(n,f) o^emBme72 8.040 i 0.001 >10 "(n^fj chem
8.041 i 0.002 wa, 8.046 i 0.009 ua _adopted 8.04 - 0.01 (supersedes fV2 given in j/T.y)Instead of omitting several values (e.g. /Zo\1\J suspect
Methodic,GMpcelectroscopeOMelectroscopesoinicic,pc,scinhp-Y-io
Nalwell -so in
possible contaminationin their sample), the measurement of ^ne!2_/ is adopted with increaseduncertainty*

Xe-131m
Kef
And65
Kha66
adopted
•tf'2 (days)12.011.8
11.9412.00
11.9811.98
I 0.3i o.ii 0.04i 0.02 >1 0.02 wa,i 0.05
No Production
2 I-13l(La+19
10 U(n,f)
11.94 i 0.05
3~) ohem,msGeV p,tl(n,f ) ;chem,ros
P~) chemchem
ua
Methodscinscin
scinwell-soin
T-133
Hef
Kat51Pa.p53Wah55And65Eic66Re.v68
TV2 (hours)20.8 i 0.221.5 i 0.220.9 ~ 0.320.3 - 0.320.8 i 0.220.9 ~ p.l
Wo Produi
14 "(n,f20.92i 0.12 wa,20.9 - 0.2
Method
20.8? - 0.16.
adoptedomitting /P~ap5j}/ and /And6^7 Rives essentially the same result,
Xe.-3.33n
Ref TV2 (hours) No Production MethodBer51Ber52Brm6lAle68
55.256.454.24
_ .,52.5 6,,,
I 1.97 1.9J 0.40- Q.i_ J Te-130(a,n) Qe(Li)
53.95 - 0.49 wa, 54.6 - 0.8 uaadopted 53 - 1 (supersedes value given in j/T_7)
CB-134
2.062 i 0.005 years _/5ie737 supersedes value given in /TJ7

Cs-137
Because of possible systematic differences, the measurements are sub<-divided into 3 groups according to the method applied. Cs-137 is pro-duced from fission in all cases.
measurementRef T72 (years) years Method
l) Specific activity (sa):Wil5*» *26.6 i 0.4 !f:ms, 4TT3Bro55 30.0 i 0.4 Nsras, 4 f f - po
*28.6 I f:tf N:ras,Ola6l *?9 * 1 Nims, . .. ,Coo62 29.40 - 0.18 N:ms, 4ft 8Fle62 30.1 i 0.7 ffsms, liquid scinLew65 30.72 - 0.10 Njms, absolute ¥ wellFly65a 30.9 - 0.7 N:ms, 4ft - po
2) Ba-growth(Ba), ms;Far6l 30.4 - 0.4 0.14Rid63 29.2 - 0.3 0.27Lew65 29.78 i 0.14 9.5
3) Cs-deeay(Cs), ex-neriment? in order of time followed decayGor63 29,68 - O.OS 3 ics, electrometerWal70 29.^01 i 0.04^ ^.3 4tl T - ic, Ra-226 ntPly65a *31.4 i 0.9 6.6 2% - pcLew 6^Fly65aHar70Bme72Bie73
30,55 - 1.55 9.529.3 - 0.6 10,230.64 - 0.43 1030.18 i 0.10 10.530.174 io.013af 11
ms2lT- pcinternalhp-Y-icms
gf - pc
without omissions:all 30.13 - O.OS wa, 29.82 ^ 0.24 ua* omitted tall 30.13 - 0.04 wa, 30.06 i 0.14 ua
Sa 30.39 - 0.28 wa, 30.22 i 0.27 uaBa 29.74 i 0.21 wa, 29.79 - °«35 uaCs 30.13 i 0.05 va, 30.06 i 0,18 ua
Sa,Ba (9.5y) and Cs30.176^ 0.031 va,^0.i6 i 0.16 ua
adopted_________ 30.17 - 0.10 (supersedes value given in n.J)
For comparison: Without /TEme727 aild_/Di«7^.7 the followingaverages were obtained (as adopted in /I j)
29.9fi 0.08 wa, 30.06 ^ 0.12 ua (adopted: 30.0 i 0.2)
*>}^Die7^7 quote i 0.034 at the 99^ confidence level. Tlie error shown herecorresponds to ] standard deviation (also shown in /Di
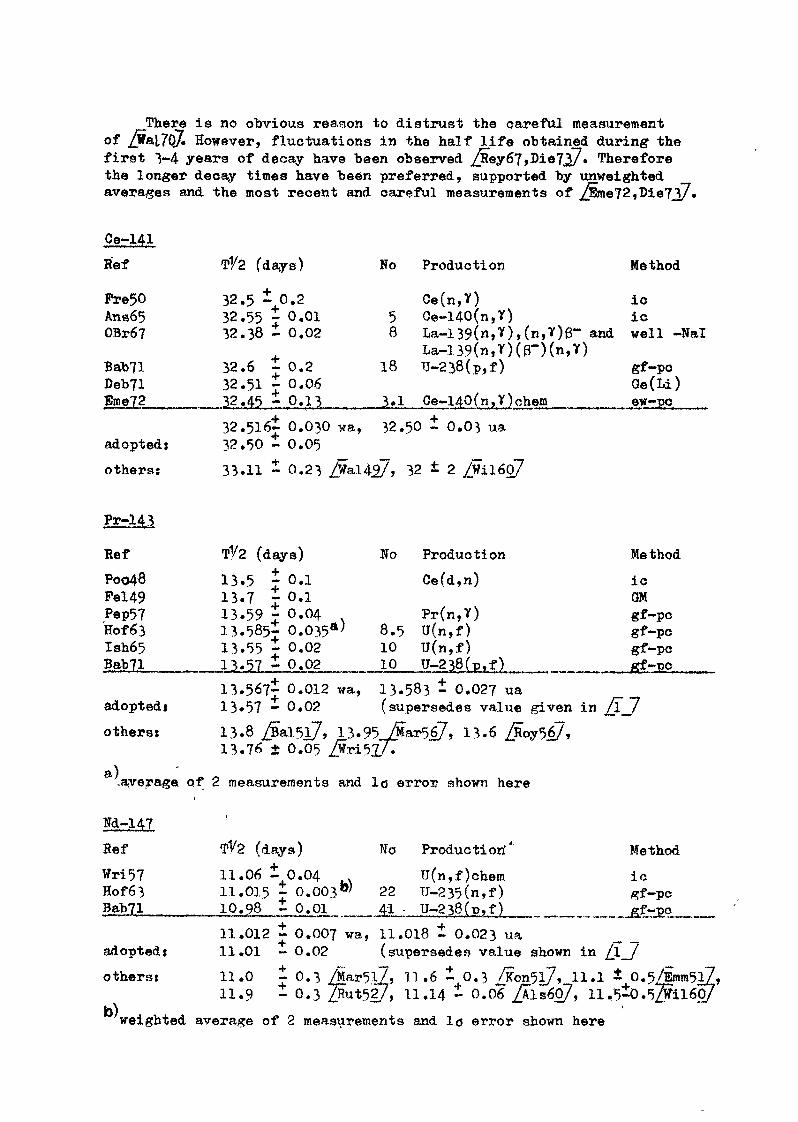
There is no obvious reason to distrust the careful measurementof Wal7Q/» However, fluctuations in the half life obtained during thefirst 3-4 years of decay have been observed ey67,Die7 7. Thereforethe longer decay times have been preferred, supported by unweightedaverages and the most recent and careful measurements of w Eme72,l>ie7J|7«
Ce-141Ref
Pre50Ans65OBr6?
Bab71Deb71Eme72
adopted:others:
Pr-143
RefPoo48Pel49Pep57Hof63Ish65Bab71
adopted:
others:
a).ayerage
Nd-147RefWri57Hof63Bab71
adopted:others:
T1/2 (days) No Production
32.5 i 0.2 Ce(n,Y)32.55 - 0.01 5 Ce-140(n,V)32.38 * 0.02 8 La-139(n,Y),(n,Y)6- an
La-139(n,r)(S-)(n,Y)32.6 - 0.2 18 Tj-238(p,f)32.51 i 0.0612.45 i 0.13 _3.1 Ce~14p(nJ)ohem
32.5l6i 0.030 wa, 32.50 i 0.03 ua32.50 i 0.0533.11 - 0.23 /Wal45/, 32 £ 2 /Wil6g7
TV2 (days) No Production13.5 - 0.1 Ce(d,n)13.7 - 0.113.59 J 0.04 Pr(n,Y)13.585- 0.035*' 8.5 U(n , f )13.55 - 0.02 10 U(n, f )13.57 - 0.02 10 U-238(p,f)13.567- 0.012 wa, 13.583 - 0.027 ua13*57 - 0.02 (supersedes value given in
13.8 ^al^i/* 13.^5 y?«ar567, 13.6 ^5oy567,13.76 ± 0.05 ^ri5jy7
of 2 measurements and lo error shown here
-
T1/2 (days) Wo Product! orf'
11.06 i 0.04 .x U(n,f)chem11.015 - 0.003W 22 U-235(n,f)10.98 i 0.01 41 - U-238(p,f)
11.012 ~ 0.007 wa, 11.018 i 0.023 ua11.01 - 0.02 (supersedes value shown in11.0 7 0.3 /^ar5l7, 11.6 i 0.3 /Kon5l7, 11.1
Method
icic
d well -Nal
gf-pcQe(Li)ew-pc
Method
icQMgf-pcgf-pcgf-pc
5J
Methodicgf-pc
. .fif-JL0
^ /**"" ~*7
to) 11.9 - 0.3 3ut52/, 11.14 - 0.0? /Als6o7,
weighted average of 2 measurements and lo error shown here

Pm-149
RefBun60Hof63McI66Bab71
adopted:others:
Sm-151
Ref
Kar52Mel55Par62
Ply65Re'y68
* omittedadoptedothers:
3n-153
".afBab71Hof63Chu70Rey68Lee54Cor58
Cab62all*omi ttedadoptedothers:
Eu-155
adopted:
others:
?V2 (hours) No Production Method53.09 i 0.09 Nd-148(n,V) 471--0-PO53.07 J 0.10 29 U-235(n,f) gf-po53.08 J OolO 2.2 Nd-148(n,Y) 4ir B-po53.08 - 0.10 13 U-238(p,f) pc-Mibsorber53.08 i 0.05 wa, 53.080 i 0.004 ua53*08 - 0.05 (errors are estimated overall uncertainties)52.8 i 0.3 /Art6o7
772 (years) Method (production: fission product inall cases)
•+•2^*73 -14 ros, change in Sm abundance after 3.8 years93 ms, change in Sm abundance after 7 years98 ms» change in Sro abundance after 15 years,
same sample as J/M6155/8 7 - 9 ?rrgf-pc, decay followed 10 years9 3 - 8 N j m s , specific activity, liquid scin,
error estimated92.8-2.3 ua (no wa as no errors assigned by /toel*)*} ,Far62/)93 i 51?? /Ing5o7
(sorted by increasing value of half life)
TV2 (hours) Wo Production Method
*46.44 i 0.08 13 U-238(p,f) gf-pc*46.5 J 0.3 U ( n , f ) gf-pc
46.75 - 0.0946.8 - 0.1 2.1 Sm(n ,Y) OM47.0 i 0.3 Sm-152(n,V) 6-spectroroeter47.1 - 0.1 Sin-i^n,?) B-spectrometer,
Nal47.1 -0.1 9 Sm-152(n,V) 47T P-pc46.79 i 0.13 WA, 46.81 i 0.10 ua46.93 - 0.07 wa, 46.95 - 0.07 ua46.8 - 0.2
460 5 - 1.0 /Rut52_7, 46.16 i 0.09 /Ore6l7
4.96 - 0.02 years j/5Bme72/ (uncertainty = 2o)supersedes value given in /!_/
1.811 i 0.002 /Pie557' 4.65 i 0.20 /MowTg/, 4.9 - 0.1 ar69/
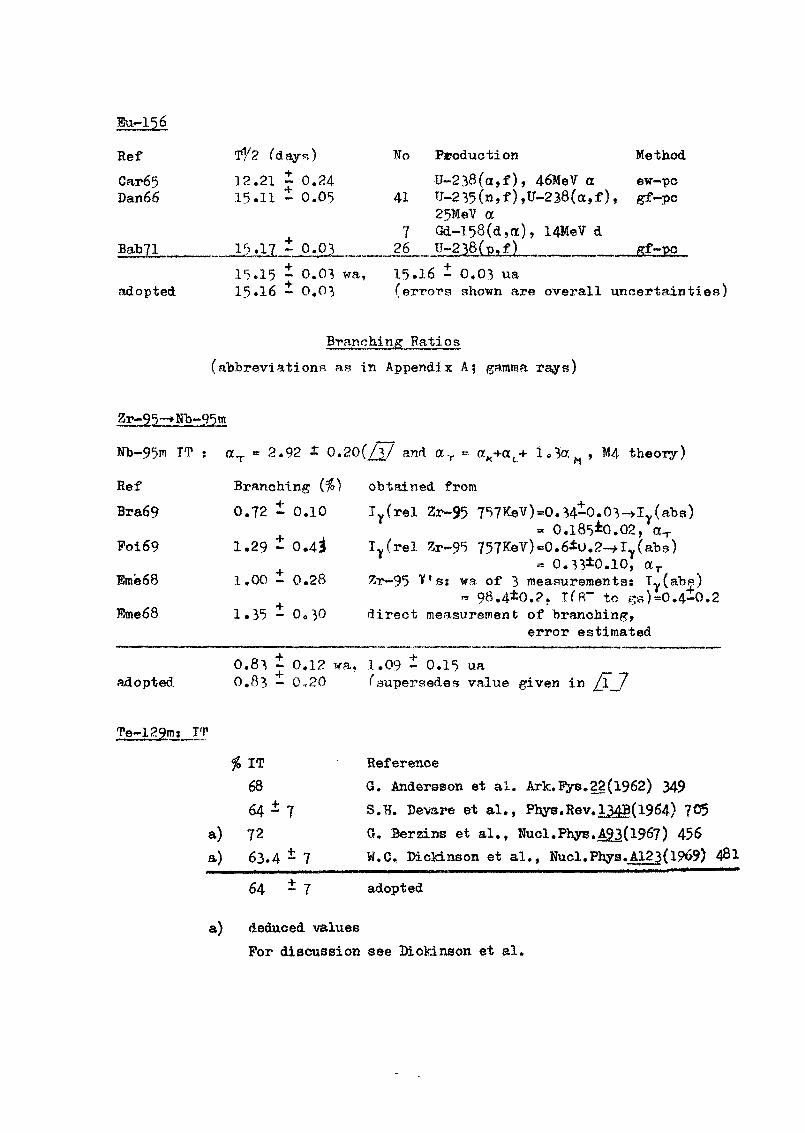
RefCar65Dan66
Bab71
adopted
1 /2 I'd ays)
12.21 i 0.24l^.ll i 0.05
'_ - O.Q315.15 i 0.03 wa,15,16 i 0.03
Wo Production MethodTJ-238(ct,f), 46MeV a ew-po
41 T.r_235(n,f),tf-238(a,f), gf-pc25MeV a
1 Gd-158(d,a), 14MeV d26 U~238(p,f) gf-pc15.16 i 0.03 ua(errors shown are overall uncertainties)
Branching Ratios
(abbreviations as in Appendix A $ gamma rays)
Nl>-95m TT :
Ref
Bra69
Poi69
Eme68
*T = 2.92 0.20(/3_/ and «T = o
Branching ($) obtained from
0.72 i 0.10 Iy(rel Zr-95
1.29 i 0.4-i
1.00 i 0.28
1.35 i Oc30
, M4 theory)
. 34-0. (aba)0.185*0.02,'a-r
= 0.33*0.10, ar^r-95 T f ' s : wa of 3 measurements: T^(abs)
« 98.4*0.?, TfFT to gs)-0.4io.2direct measurement of branching,
error estimated
0.8^ i 0.12 wa. 1.09 i 0.15 ua _adopted 0.83 - 0,,20 ('supersedes value given in /!_/
rPe-129m: TT
% IT Reference68 G. Andersson et al. Ark.5ys.22(1962) 34964 i 7 S.H. Devare et al., Phys.Rev.134B(1964)
a) 72 0. Berzins et al., »ucl.Phys.A9j(l967) 456a) 63.4 i 7 W.C. KLcldnson et al., Nucl.Phya.A123(l9<>9) 48l
64 ± 1 adopted
a) deduced valuesFor discussion see Dickinson et al.

1) P. Alexander and J.P. Lau, Nucl. Phys, A121 (1968) 612Population ratio Xe-133 m/Xe-133 in 1-133 decay was foundto be 0.029 i 0.001
Thus: the branching 1-133 —* Xe-133 m is:2.8 ± 0.1 %
2) R.N. Saxena and H.D. Sharma, Nucl. Phys. Alfl (1971) 593The intensity of the 510*4 fceV gamma ray relative to that of the529.5 keV gamma ray in the decay of 1-133 was found to be 1.6$,populating the 233.5 keV level of Xe-133 m. The absolute intensityof the 529*5 fceV gamma ray was deduced to be 87.4$. Thus the gammabranching to Xe-133 m (via 510 keV gamma) is 1.4$>.
E. Eichler et al., Phys. Rev. 146 (1966)B899, found the direct betafeeding of the metastable state to be~
Ihe total (gamma + beta) branching to 1-133-*Xe-133 m ia then2.J

References for Appendix 3t
Ale68Als60And65Ana65Art60Bab71Bal51
Bal67BarS3Bar69
Bor68Bor70Bra69
Bun60BurSSCab62Car65Chu70Cob50Col 73Coo62
Cor58Cro6SDen66Deb71Die73T5ic66
T!me68Eme72Emm51Par6lFar62Fel49Fle62
Fly65Fly65aFoi69Fre50OJa6lOor63Ore6lGun57Hag67Har70Her55
P. Alexander and J.P. Lau, Nucl.Phys. A 121 (1968) 612J, Aletad and A.C. Pappas, J.inorg.nucl.Chera. 1£ (i960) 222G. Andersaon et al, Ark. Fysik 28 (1965) 37S.C. Anspach et al, NP-15663 (1965)A. Artna and M.E. Law, Can.J.Phys. Jl8 (i960) 1577S. Baba et al, J.inorg.nucl. Chem. j£ (1971) 589N.K. Ballou et al, in "Radiochemir>al Studies* The Fission Products"
N.N.E.<5. Div TV, Vol. Q, p. Il8l (MoOraw-Hni, New York, 1951)M.N. Baldwin, Nuc.1 .Sci .Kn^p;. JJO. (196?) 144R.M. Bartholomew et al, Can.J.Chfm. ^ (l95>) 120D. Barr fT,o« M«mo^J T SA>l369, quoted in Nuo3.Ph.ys. A 132(1969)177R. ^rnft. Phv-. R«*v. 77 (1950)
C.LT.YJ.WK.BH.D
I. Berp-ntroem, Ark. TVs. 0^952) 191M. Borronrm, NunLPt^e. A Tl_5 (1968) 309M. Bormann ©t al . Nwcl.Phy^. A 157 (1^70) 48]S.M. Brahmarar a«d .T..H. Hamilton, Phy s .Rev . 1 87 ( 1 969 ) 1 48?P. Brown et al, J.inorg.nucl .Chem. 1 (IP'55) 241L.R. Bunney ftt al , Jeinorg.nuol*Chera. 12 (lP(f>0) 228L. Burkinshaw, Phyp. in Med.Biol. 2. (1958) 255M.J. Cabell, J.inorg.nuol.Chem. 2J. (1962) 749
Carnaham and L.R. Bunney, USNRDL-TR-868(l965)Chu et al, Phye. Rev. Cl. (1970) 1826Cobble and R.W. Attenberry, Phys. Rev. 80 (1950) 91?Collins et al, Radiochem.Radiofinal.Lett.iJJ^?}) 169Cook, Gatlinburp Conf. on Analytical Chemistry inNuclear Reactor Technology (1962) and WAPD-B1V30(l964) 31
J.M.Cork et al, Phys. Rev. 110 (1958) 526P. Orowther and J.S. Eldridfje, Uucl. Phye. 66 (1965) 472W.R. Daniels and B.C. Hoffmann, J.inorg.nuol.Chem .28(1966)2424K. Debertin, Z.Naturf. 26a (1971) 596L.A. Diets and C.P. Pachuoki, J.inorg.nuol.Chem. J 5_ (1973)1769R. Richler. Phyp.Rev. l_4jS (1966) 8Q9B.W. Bnwry et al. Nature 1J5 h Q5«0 34J.F. Emery, ORETL-4196 (1968) 66J.F. "Emer/Jr et ni.^ Nuel.Soi .Engff, 48 (1972) 319H.S. Emmerich and J,*D. Kurbatov, Phyp-.Rev. 8j. (1^51) 40H. Farrar et al . Can .J. Chem. J9. (l96l) 681 .H. Farrar and R.H. Tomlinpscn, Nucl.Phys. JJ4_ (1962) 367L. Feldmann et al, Phys. Rev. J6. (1949) 1888D.O. Fleishman et al, Atomnaya Bnerg. JQ (1962) 592»
engl.j Sov.i.J.Atom.En. 13. (1962) 1224,K.F. Flynn et al, Nucl.Sci.Bngg. g.2 (1965) 416K.F. Flynn et al, J.inorg.nuel.Chem. 2J (1965) 21C. Foin et al, Nucl.Ph.vs. AJL23. (1969) 513M.S. Freedman a«d D.W. Ensreiketneir, Phys .Rev. J9 (195.0) 897
Olazunov et al, Atomnaya Bn. 10 (1961) 622Gorbics et a], Wucsleonics 21/l*"(l963) 63Green and W.H. Walker, Can.J.Phye. 32 fl<»6l) 3216Gunn et al, Phys.Rev. 107 (1957) 1642
J.inore.nucl.Chem. '29. (l°67) 25150. Harbottle, Radioohim. Acta IJ, (1970) 132G. Herrmann and F. Strassmaran, Z.Naturf. Ipa (1955) 146
M.PS.OR.ES.R

Her56 0. Herrraann et al, Z. Naturf. lla (1956) 946Hof63 B.C. Hoffmann, J.inorg.nuol. Chera. 2J[ (1963) 1196Ing.50 M.O. Ittghram et al, Phys.Rev. ££ (1950) 271Ish65 T. Ishimori and Y. Kobayashi, J.nucl.Sci .Teohnol. £ (1965) l8lKar52 D.O. Karraker et al, Phys,Rev. 8j (1952) 390Kat51 S. Katooff et al, Phys.Rev. 9JL. (l95l) 1458Kee58 J.P. Keene et al, Phys.in Hed.Biol. 2 (1958) 360Kje56 A. Kjelberg ajod A.C. Pappas, Nuel.Phya. 1. (1956) 322Kle60 E.H. KLeer and A.P. Voigt, J.inorg.nucl.Chem. 16 (i960) 8Kha66 K. Khauf et al, Z.Phy*. 1J9J (1966) 101Kon51 E. Kondaiah, Ph.ys.Rev. 8l (1951) 1056Lag68 P. Lagoutine et al. Int.J.Appl.Rad.Tact, Ij9_ (1968) 475Law66 P.O. Lawrence et al, J.inorg.nucl.Chem. 28 (1966) 2477Lee54 M.R. Lee and R, Katz, Phys.Rev. (1954) 155Lew65 R.E. Lewis et al, Trans.Am.Nucl.Soc. 8_ (1965) 79Loc53 E.E. Lockett and R.H. Thomas, Nucleonics 11/3 (1^53) 14Mar51 J.A. Marinsky and L.E. Glendenin, ref.loc.cit. /Bal5l7 P. 1229Mar56 D.W. Martin et al, Phys.Rev. 101 (1956) 182Mar65 D.A. Marsden and L. Yaffe, Can.J.Chem. 43_ (1965) 249Mcl66 L.B. Mnlsaak and R.G. Helmer, Phya.Rev. 150(1966) 1033Mel55 E.A. Melaika et al, Can.J.Chem. H (1955) 830Mer62 J.3. Merritt and J.O.V. Taylor, Can.J.Phys. 4jO. (1962) 1044Mos58 Y. Moses and H. Cook, TID-7568, pt 2 (1958) 192Mow70 R.S. Mowatt and W.H, Walker, Can.J.Phys. 4j (1970) 1933New6l R.D. Newman, Ref. 6lWel5 in JJ._J (priv. comm. 1961)Nid55 J.B. Niday, Phys.Rev. j?8. (1955) 42OBr67 H.A. O'Brien Jr. and J.S. Eldridge, Nucleonics 25/2 (1967)4!Osm59 R.G. Osmond and M.J. Owers, J.inorg.nucl.Chem. £ (1959) 96Pap53 A.C. Pappas, MIT-Teohn.Rep. 63 (1953) p. 97 and AECU-2806(l953)Pep57 B.P. Peppard et al, J.inorg.nuol .Chem. 5_ (1957) 141Pie59 A. Pierroux et al, Bull.Soo.Roy.Sci. Liege 28 (1959) 180
and Nuol.Soi.Abstr. 16. (1962) No. 1053Poo48 *.!,. Pool and N.L. Krisberg, Phys.Rev.7^ (1948) 1035Pro58 A.N. Protopopov et al, Atonm.En.J5(l958)130,
engl. J.Nucl.En.lOA (1959) 80Rey67 S.A. Reynolds and E,I. Wyatt, ORNL-4039T196?) 59Rey68- S.A. Reynolds et 5,1, Rucl.Sci.Engg. 3g (1968) 46Rid63 B.F. Rider et et, Nucl.Sci.Engg. (1963) 284Roy56 L.P. Roy and \>. Yaffe, Can.J.Chem. M (1956) 1023Rut52 W.C. P-itledge et al, Phys. Rev. 8£ (1952) 775Sat62 A.R, 'iattler, Hucl. Phys. J^ (1962) 648Sei47 J.A. Seiler, AKL-4000 (1947) 119Sel53 H.H Seliger et al, Phys. Rev. £0 (1953) 443Sin51 W.I - . Sinclair and A.P. Holloway, Nature (1951)365Sitt51a W.i. Sinclair and B.W. Bmery , Brit.J.Radiology .2^ (1951) 576Wah55 .A.C. Wahl, Phys. Rev. °Q (1955) 730Wah59 i.C. Wahl, J.inorg.nucl.Chem. 10 (1959) 5Wal49 D. Walker, Proc. Phys. Soc, London jg (1U49) 799Wal70 K.P. Walz and H.M. Weiss, Z.Natu^f. 2^a (1970) 921Wil55 D.M. Wiles and R.H. Tomlinson, Ph.-<?. Rev. W (1955) 188Wil60 R.G. Wille and R.W. Pink, Phys. Re\ 118 (i960) 242Win51 P.P.W. Winteringham, Nature 167 (l9i,-T~155Wri57 H.W. Wright et al, Nucl.Sei.Engg. 2 (x957) 427Wya6l E.I. Wyatt et al, Nucl.Sci.Engg. lT (1961) 74Zol71 W.H. Zoller et al, Phys. Rev. J (l97l) 1699

Contributions toReview Paper No. 13_
M.Z. Tarasko5 B.P, MaksyutenkoA New Approach to Finding the Distribution ofDelayed Ueutron PrecursorsPublished in Yad.Piz. 17 (1973) 1149,English? Sovj.J.Nucl.Phys. 17 U973) 598

DELAYED NEUTRON SPECTROMETRY
S. Shalev , G. Rudstam
The Swedish Research Councils' Laboratory
Studsvik, Nykoping, Sweden
ABSTRACT
A number of delayed neutron precursors have been'.V
isolated by mass -separation. The delayed neutron energy
spectra were measured using a high resolution He rieutron87spectrometer, and preliminary results are given for Br,
88 ' l'36Ta 137T 138, . 139 rBr , Te , I , I and I .
*Permanent address: Department of Nuclaar Engineering
Technion - Israel Institute of TechnologyHaifa, Israel.

- 1 -
An intensive investigation is> currently being carried out of delayedneutron emission from mass-separated precursors. The OSIRIS isotope-separator-on-line facility ) is used to extract fission products from a
235sample of U located near the core of the 1 MW R2-0 reactor, and usefulintensities can be obtained for elements ranging from zinc to strontium(Z - 30-38) and from silver to barium (Z = 47-56) .
3A He neutron spectrometer has been developed with exceptionally good
energy resolution, ranging from 16 keV to 35 keV FWHM for neutrons withenergy up to 1 MeV. For each mass investigated the ion beam is allowed toimpinge on an aluminized mylar tape located close to the neutron spectro-meter. The tape is moved continuously at a rate adjusted to optimize theneutron counting rate while removing long-lived daughter products. A 1 mmthick lead shield is used to reduce the effect of 6-particles and lowenergy gamma rays. Data are accumulated in sequentially-routed sections ofa 4096 channel analyzer or an on-line PDP-9 computer.
Figures 1 - 6 show the pulse-height spectra obtained for the precursors87Br, 88Br, 136Te, 137I, 138I and 139I. The spectra have not beencorrected for spectrometer response function or detection efficiency and thesolid line passing through the experimental points is intended only as a
87 1 ftguide to the eye. P0r the cases Br; and I a. simple correction has-i. i.».~i!
been made for gaiana-ray pile-up at low energies, and the corrected -spectrumis shown as a dashed line. '•'
O"7 1 "Zfa ." *•" 1 •t'JThe sp«ctra for Br, Te and I are remarkable for their
discreteness and detailed structure. All three cases represent the emissionof a single neutron outside a closed shell, i.e. :
P2
where N = 50 or 82, Hen«s the neutron binding energies ) are exceptionallylow (5.46, 4.02 and 4.45 MeV respectively) with correspondingly low level-densities.
368
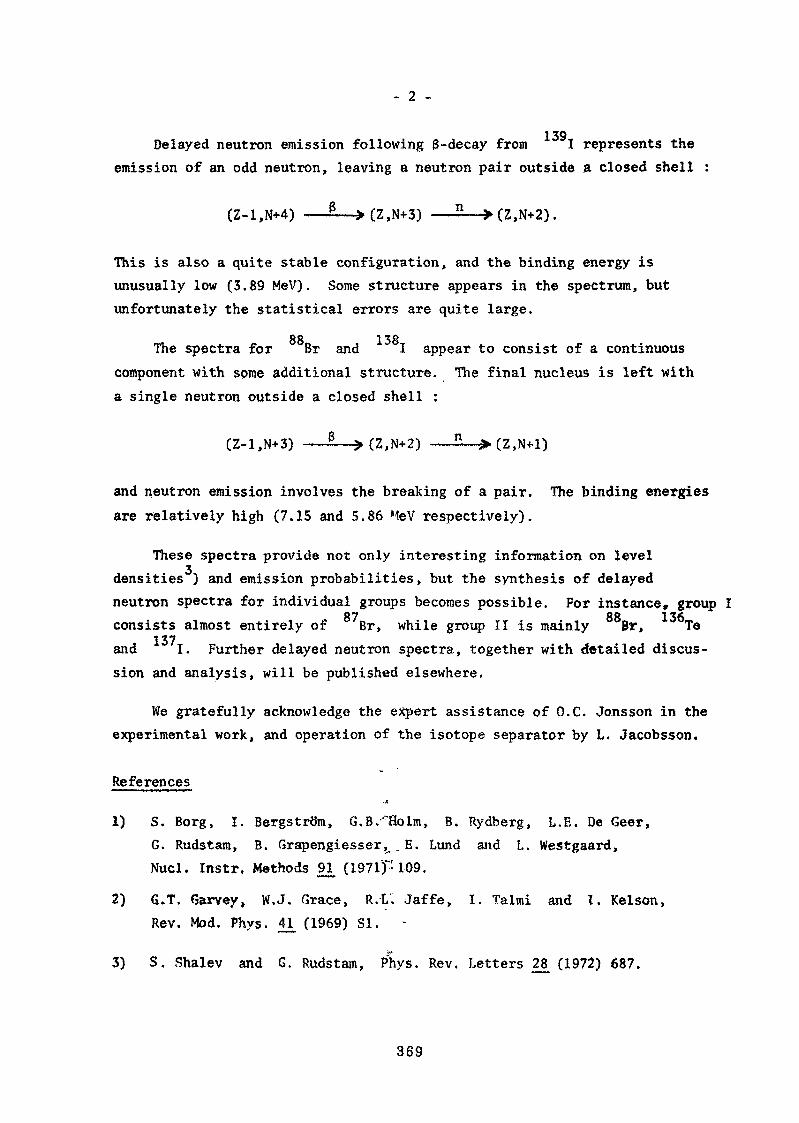
- 2 -
139Delayed neutron emission following $-decay from I represents theemission of an odd neutron, leaving a neutron pair outside a closed shell
- — >(Z,N+3) —— - — >(
This is also a quite stable configuration, and the binding energy isunusually low (3.89 MeV) . Some structure appears in the spectrum, butunfortunately the statistical errors are quite large.
88 138The spectra for Br and I appear to consist of a continuouscomponent with some additional structure. The final nucleus is left witha single neutron outside a closed shell :
»(Z,N+2)
and neutron emission involves the breaking of a pair. The binding energiesare relatively high (7.15 and 5.86 MeV respectively).
These spectra provide not only interesting information on leveldensities ) and emission probabilities, but the synthesis of delayedneutron spectra for individual groups becomes possible. For instance, group I
R7 fift 1 Aconsists almost entirely of Br, while group II is mainly Br, Teand I. Further delayed neutron spectra, together with detailed discus-sion and analysis, will be published elsewhere.
We gratefully acknowledge the expert assistance of O.C. Jonsson in theexperimental work, and operation of the isotope separator by L. Jacobsson.
References
1) S. Borg, I. BergstrGm, G.B.-'"Holm, B. Rydberg, L.E. De Geer,G. Rudstam, B. Grapengiesser, , E. Lund and L. Westgaard,Nucl. Instr. Methods 91_ (1971)" 109.
2) G.T. Garvey, W.J. Grace, R.L. Jaffe, I. Talmi and I. Kelson,Rev. Mod. Phys. 41 (1969) SI. -
3) S. Shalev and G. Rudstam, P>iys. Rev. Letters 28 (1972) 687.
369

Figure 1.
COH2DOO
5000
800
600 —
400
200 —
0200 400 600 800 1000 1200
NEUTRON ENERGY (keV)

Figure 2.
CO
1000
800
(f)\-zIDOO
600
400
200
88
200 400 600 800 1000 1200
NEUTRON ENERGY (keV)

Figure 3.
600
600 —
W-4to
400 —ou
200
0200 400 600 800 1000 1200
NEUTRON ENERGY (keV)

Figure 4.
CO-3CO
Z5oo
500
400
300
200 —
100 —
I I I I
137I
200 400 600 800 1000 IZOO
NEUTRON ENERGY (keV)

Figure 5.
200
CO
Io
150 —
100
50 —
200 400 600 800 1000 1200
NEUTRON ENERGY (keY)
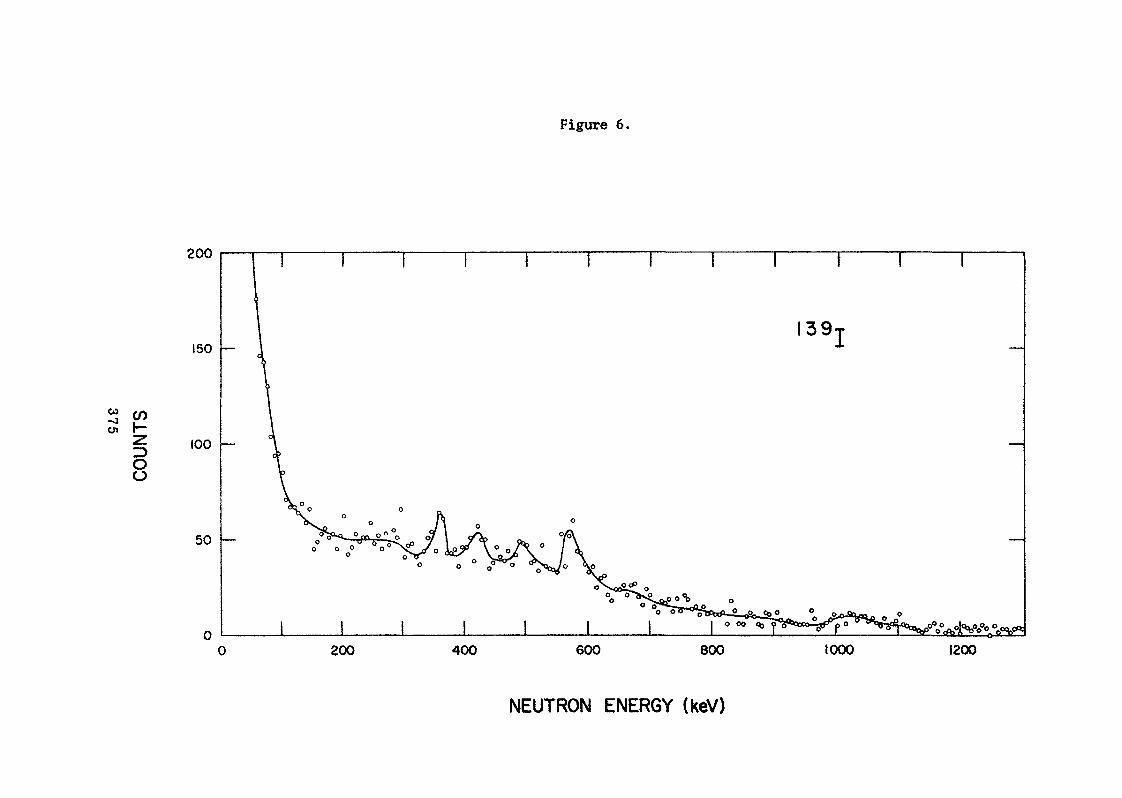
Figure 6.
01
oo
200
150
100
50
i r i r i r
I39j
i i200 400 600 800 1000 1200
NEUTRON ENERGY (keV)
DELAYED NEUTRONS FROM FISSION: PRESENT STATUSOF MEASUREMENTS OF YIELDS, GROUP HALF-LIVES
AND ABUNDANCES, AND SPECTRA*
A. E. Evans
Nuclear Analysis Research GroupUniversity of California
Los Alamos Scientific LaboratoryLos Alamos, New Mexico 87544
ABSTRACT
The present status of measurements of delayed-neutronyields from fission, half-lives and relative abundances of delayed-neutron groups from fission, and spectra of delayed neutrons fromfission is reviewed. Available data indicate that absolute delayed-
233 235 239neutron yields from fission of U, U, and Pu are known towithin ± 7% while a 10% uncertainty exists in the delayed-neutron
232yield from fission of Th, and a 17% discrepancy exists in theOOQ
case of U. The dependence of the delayed-neutron yield uponthe energy of neutron-causing fission has been studied and is quali-tatively understood. The question of incident-neutron energy de-pendence of relative delayed-neutron group abundancies and half-lives is not well resolved. Recent measurements of delayed-neutron spectra jndicate that these are of a complex, discreteenergy nature.
Work performed under the auspices of the U. S. Atomic EnergyCommission.,
377
I. INTRODUCTION
Delayed-neutron data are significant in the study of nuclear1 2structure physics, * in the development of techniques for the non-
destructive assay of fissionable materials, ' and in the design of5 6 7fast reactor systems. ' ' The effect of present uncertainties in
delayed-neutron data on Fast Reactor Calculations is pointed outo
by Saphier and Yiftah who indicate that very large errors in pre-dicting the dynamic behavior of large fast reactors result frompresent uncertainties in delayed-neutron yields and delayed-neutronspectra. Of particular interest is the effect of these uncertainties
gon the Fast Flux Test Reactor (FFTF) project. In reference 9,the urgency for precise measurement <± 2%) of delayed-neutronyields and for accompanying improvement in the measurement ofdelayed-neutron spectra are cited.
II. ABSOLUTE DELAYED-NEUTRON YIELDS , ,
The status of delayed-neutron yield measurements wasreviewed in 1964 by Keepin. The theory and systematics ofdelayed-neutron emission are discussed by Keepin, Amiel,
11 2Jahnsen et al. > and Amiel. ^The absolute total delayed-neutron yield, i. e. , the total
number 'of delayed neutrons generated per fission, was measured12by Keepin-.et al. in 1957. The authors of this work measured
e\ o c O O O
absolute delayed-neutron yields from fast fission of U, U,94QU, Pu, Pu, and Th, and from thermal fission of
U, and Pu. The authors reported results withprobable errors (probable error = 0. 6745 cr) of ~5%. The fast
fission results are shown in Table I.
An independent check of the delayed-neutron yields from233 235 239fast fission of U, U, and Pacomes from a measurement
of the mass increment between delayed and prompt critical fortoe bare metal asseri lies "Godiva" ( U), "Jezebel" ( Pu),
233and "Skidoo" ( U). <, ^ing the latest calculated values of effec-
378

1 fiTable I. Comparison of revised delayed-neutron yield data of Masters et al. and of Krickand Evans* for fission induced by neutrons of various energies with fast-fissionyield data of Keepin.
00~jto
Elemt-at ;
Kh
233U
235U238u239Fu
242PU
Absolute Delayed Neutrons per Fission (Author, Neutron Energy)
Keepih et al.Fission Spectrum
0. 0496 ± 0. 0035 j
0.0070 ±0.0006
0.0165 ±0.0007
0.0412 ± 0.0025
0.0063 ± 0.0005
Krick and EvansAveraged 0. 1-1. 8 MeV
0*0075 ± 0.0006
0.0163 ± 0.0013
- 0.0062 ± 0.0005
0.015 ±0 . 005a
Masters et al.3. 1-MeV Neutrons
0.057 ±0.005
0.0074 ±0.0006
0.0172 ± 0.0013
0. 0484 ± 0. 0036
0.0066 ± 0.0005
Masters et al.14. 9-MeV Neutrons
0.030 ±0.0020
0.0041 ± 0.0003
0.0091 ± 0.0004
0.0283 ± 0,0013
0.0041 ±0.0002
a'Averaged 0. 7 to 1. 3 MeV

* 13tive delayed-neutron fraction for these assemblies, one can235derive as the delayed-neutron yield in neutrons/fission for U,
900 233Pu, and U, respectively, 0.0163, 0.0064, and 0.0072,
with a precision of ^2-3% ( la) . However, the authors of thiswork have expressed uncertainty as to bias in this method of
14measuring delayed-neutron effective fractions.Another set of absolute delayed-neutron yield data is •
15available from the work of Smith et al.1 R
In 1967, Masters et al., in preparation for applicationof delayed-neutron phenomena to the nondestructive assay offissionable material, measured the absolute delayed-neutron
239yields from fission by 3.1- and 14.9-MeV neutrons of Pu,233U, 235U, 238U, and 232Th, These authors showed that thedelayed-neutron yield for fission due to 14.9-MeV neutrons issome 40% lower than the* yield due to 3.1-MeV neutrons, inagreement with theoretical predictions but in opposition to the
17-19results obtained by earlier wdrkers, who observed anincrease in delayed-neutron yield. Also of note in the work of
V
Masters et al. was the fact that measurement of absolute delayed-neutron yields at 3.1 MeV averaged some 10% higher than thedelayed-neutron yields from fission-spectrum neutrons as mea-
12sured by Keepin et al.20Following this experiment, Krick and Evans studied in
detail the dependence of delayed-neutron1 yields upon the energy
of the neutron causing fission. For neutron energies from 0.1233 235 ' 23-9to 1. 8 MeV, yields from U, U, and Pu werfe obtained,
233 235 238and yields from U, U, and U were .obtained for neutronsof energies between 4. 0 and 6. 7 MeV. The; delayed-neutron yield
242 '"'from Pu was obtained for neutron energies, from 0, 7 to 1.3 MeV.Krick and Evans found that for all isotopes studied, delayed-neutronyields were independent of incident neutron energy from 0.1 to around4 or 5 MeV, then fell off in a ~ 2-MeV interval to near the yield values
*The delayed-neutron fraction £ is the ratio of delayed neutronsemitted from fission to total neutrons (promt a) d delayed) emittedfrom fission.
380
at 14. 9 MeV as measured by Masters et al. Absolute yields in theenergy-independent region agreed in general with those obtained byMasters et al. for 3.1-MeV fission. However, the Masters and Krickvalues are not entirely independent, since fission-monitoring foils andthe isotopic neutron source used to calibrate the delayed-neutron de-tectors were common to both experimental programs. It was alsounfortunate that an independent absolute value for the delayed-neutron
OOp
yield from U, for which the Keepin and Masters values are in dis-agreement by 20%, was not obtained. The Krick data for" this isotopewere normalized to the Masters delayed-neutron yield value at 3.1 MeV.
oo oThe PuLi source used in the recent LASL measurements has
been recalibrated by the National Bureau of Standards. The value given5
was (3.74 ± 0.05) x 10 neutrons/sec on March 1. 1972. The old LASLg
value was 4.01 x 10 neutrons/sec on December 8, 1968. Using a half-238life for Pu of 88. 0 ± 2. 0 years, the old value becomes (3. 91 ± 0. 20)
5x 10 neutrons/sec on March 1, 1970. This implies that delayed-neu-
1R 9fttron yield values reported by Masters et al. and by Krick and Evansshould be multiplied by 0. 956 and the uncertainties can be reducedsomewhat. Recalibration of fission-chamber foils resulted in anupward correction of 3.35% for the delayed-neutron yield from
238fission of U, so that the total correction factor applied to the21yield from this isotope is 0. 988. The corrected values are
shown in Table I. The recent LASL data are now in good agree-1 O
ment (<±5%) with the work of Keepin et al.» except in the case'''238 •of U, in which case the 17% disagreement between the two
delayed-neutron yield values is unacceptable.22Among more recent developments, Conant and Palmedo'
have measured the delayed-neutron fractions from thermal fission235 239 233of U, Pu, and U. If one uses the current values of total
_ j[Qneutron yield-from fission (v) to convert delayed-neutron frac-tions to. absolute delayed-neutron yields, one obtains values simi-
12 23lar to those reported by Keepin. Cox and Whiting have mademeasurements of the energy dependence of the delayed-neutron
232 235 238yield from fission of Th, U, and U, which are in essentialagreement with the results of Krick and Evans.
381
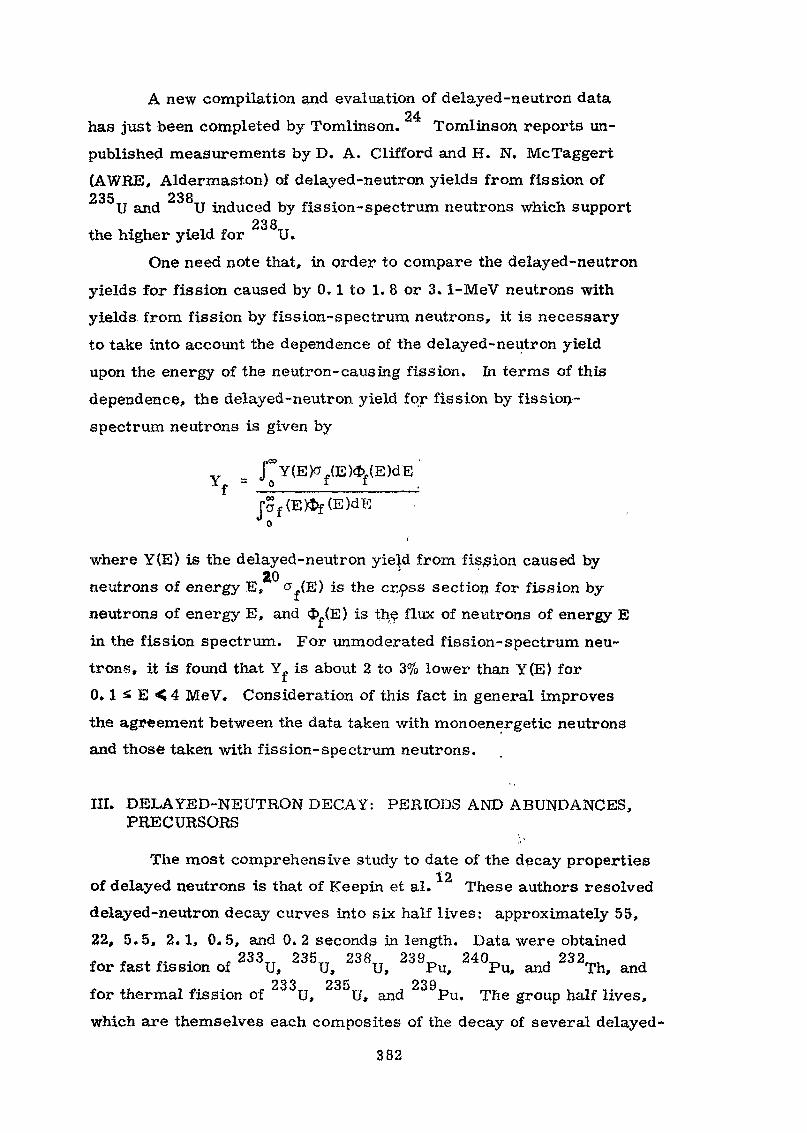
A new compilation and evaluation of delayed-neutron data24has just been completed by Tomlinson. Tomlinson reports un-
published measurements by D. A. Clifford and H. N. McTaggert{AWRE, Aldermaston) of delayed-neutron yields from fission of235 238U and U induced by fission-spectrum neutrons which supportthe higher yield for U.
One need note that, in order to compare the delayed-neutronyields for fission caused by 0. 1 to 1. 8 or 3. 1-MeV neutrons withyields from fission by fission-spectrum, neutrons, it is necessaryto take into account the dependence of the delayed-neutron yieldupon the energy of the neutron- causing fission. In terms of thisdependence, the delayed-neutron yield for fission by fission-spectrum neutrons is given by
(EWWE)dE 'I
Ja f(E)*f<E)dEo
where Y(E) is the delayed-neutron yield from fission caused by310 'neutrons of energy E, a ,(E) is the cross section for fission by
neutrons of energy E, and 4> (E) is the flux of neutrons of energy Ein the fission spectrum. For unmoderated fission- spectrum neu-trons, it is found that Y. is about 2 to 3% lower than Y(E) for0. 1 £ E < 4 MeV. Consideration of this fact in general improvesthe agreement between the data taken with monoenergetic neutronsand those taken with fission-spectrum neutrons.
III. DELAYED-NEUTRON DECAY: PERIODS AND ABUNDANCES,PRECURSORS
The most comprehensive study to date of the decay properties12of delayed neutrons is that of Keepin et al. These authors resolved
delayed-neutron decay curves into six half lives: approximately 55,22, 5.5, 2.1, 0.5, and 0.2 seconds in length. Data were obtained, . . „ . . , 233TT 235TT 238T 239^ 240^ , 232^,for fast fission of U, U, U, Pu, Pu, and Th, and
poofor thermal fission of U, U, and Pu. The group half lives,which are themselves each composites of the decay of several delayed-
382
neutron precursors vary slightly from isotope to isotope and betweenthermal and fast fission. There are marked differences between iso-topes, however, in the relative populations of the various decay groups.The energy dependence between thermal and fission -spectrum -inducedfission of the group abundances is not significant.
The energy dependence of the relative group abundances in25delayed-neutron decay was studied by Maksiutenko, whose data
indicate little change in group abundances from thermal to 15-MeV4
fission. East and Keepin, however, do note some differences in thedelayed-neutron decay curves from 14. 9-MeV fission as compared tothose from fission induced by thermal or fission-spectrum neutrons.
2fi 2VEast et al. ' have measured delayed-neutron groups and235 233 238 239abundances from fission of U, U, and U, Pu,
242^ . ml_Pu, and Th.241Thermal fission delayed-neutron parameters for Pu
op
have been published by Cox. Cox was unable to resolve theshortest (0. 2-sec) decay group since his technique involvedmechanical transfer of the sample. Fast fission group abun-
15dance data are available from the work of Smith et ai. Again,the shortest lived decay group was not resolved,
•Delayed neutrons are emitted when short half-lived fissionproducts decay into neutron-emitting excited states of daughternuclei. There are dozens of fission products, only some of whichhave been identified, which contribute to this process. Such fissionproducts are known as precursors. The studj' of individual pre-
. . , .. 1,2,10,11,29 .cursors has been going on for some time and promisesto yield much information of value to nuclear structure physics andreactor technology. Of some importance to reactor technology isthe identification of delayed-neutron precursors which are volatileand hence may escape from some reactor systems in a time com-parable to their half lives, thus reducing the control effectivenessof the delayed neutrons which they emit.
383
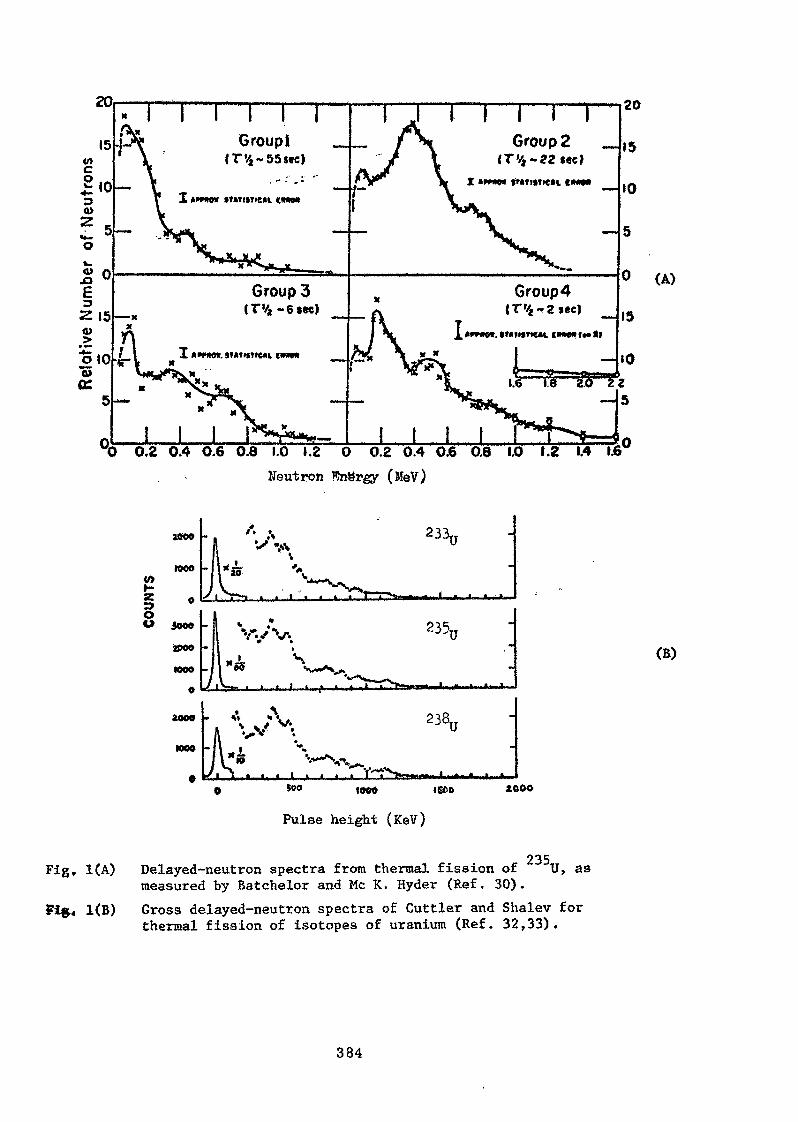
I I I I I
Group4(T'*~2 sec)
"O 0,2 0.4 0.6 0.8 1.0 1.2 0 0.2 0.4 O.6 O.8 I.O 1.2 1.4 16Neutron Wn^rgy (MeV)
(A)
100*
I °8 JOOO
MOO
23^
,>. I ».,
11.,,«ii. I.
Pulse height (KeV)
Fig, 1(A)
. 1(B)
235.Delayed-neutron spectra from thermal fission of """ll, asmeasured by Batchelor and Me K. Hyder (Ref. 30).Gross delayed-neutron spectra of Guttler and Shalev forthermal fission of isotopes of uranium (Ref. 32,33).
(B)
384
IV. DELAYED-NEUTRON SPECTRA
The most definitive published information on the delayed-30neutron spectra is found in the work of Batchelor and Hyder who
3used a He fast neutron spectrometer to measure the spectra ofdelayed neutrons from the four longest lived delayed-neutron groups
235resulting from the thermal fission of U. Errors on these spectrai C
are estimated at from % at zero energy to ± 8% at 1 MeV* Spectra
obtained by these workers, shown in Figure 1, are not adequate6 9for present-day needs of fast reactor design. *
3Shalev and co-workers, using a high-efficiency He
spectrometer tube developed especially for delayed-neutron31spectrometry, have measured spectra of delayed neutrons
1 * 32 33from thermal fission of isotopes of uranium * as well as232 239 33from Th and Pu, •. Using a reactor neutron beam and
sample-shuffling system,"they were able to study spectra ofthe two longest half-lived groups. Their spectra, which haveenergy .re solutions of the or.der of 70 keV for 1-MeV neutrons,show many discrete neutron-energy peaks, in accord with theaccepted theory of delayed-neutron emission. * This grouphas also measured delayed-neutron spectra from separated pre-
34 . -cursors.35Chulick et al. have measured energy spectra of delayed
252neutrons from spontaneous-fission of Cf, using a moving mylar*
tape to catch fission products from the sample and transfer themto a remote neutron-counting site. The spectrometi^r was a time-of-flight system using the &" decay of the precursorg' as a "start"timing signal for the neutron flight. They used pulse-shape dis-crimination techniques to suppress the gamma background which
oc ,plagued earlier efforts to apply the time-of-flight technique tothe measurement of delayed-neutron spectra from thernaally-
235induced fission of u.37Woodruff has measured the spectra of delayed neutrons
i "**-.
from fission using porton-recoil proportional counter tubes. -.Hefinds considerable structure and also a much larger fraction of

neutrons of energies less than 100 keV than had been observed byprevious authors.
REFERENCES
1. S. Amiel, "Delayed Neutrons and Photoneutrons from FissionProducts, " Physics and Chemistry of Fission, Vol. 2, Inter-national Atomic Energy Agency (1965).
2. S. Amiel, "Delayed Neutrons in Fission, " Proceedings of theSecond IAEA Symposium on the Physics and Chemistry of Fissionheld by the International Atomic Energy Agency in Vienna 28 July -1 August, 1969, IAEA, Vienna (1969), p. 569.
3. G. R, Keepin, R. H. Augustson, and R. B. Walton, "Los AlamosScientific Laboratory Safeguards Research and Development Program, "in Proceedings of the AEG Symposium on Safeguards Research andDevelopment, Los Alamos Scientific Laboratory, October 27-29, 1969,Report WASH-1147, p. 110.
4. L.-V. East and G. R. Keepin, "Fundamental Fission Signatures andTheir Applications to Nuclear Safeguards," Proceedings of the SecondIAEA Symposium on the Physics and Chemistry of Fission, IAEA,Vienna, 28 July - 1 August, 1969, p. 647.
5. G. R. Keepin, "Physics of Nuclear Kinetics," Chapters 6-10,Addison-Wesley Publishing Co., Inc., Reading, Massachusetts (1965).
6. G. R. Keepin, "Delayed Fission Neutron Data in Reactor Physics andDesign, " Dela>3d Fission Neutrons: Proceedings of a Panel held inVienna, 24-27/pril, 1967, IAEA, Vienna, 1968, p. 3.
7. S. Yiftah and D. Saphler, "The Importance of Exact Delayed NeutronData in Fast Reactor Dynamic Behavior, " Delayed Fission Neutrons;Proceedings of a Panel held in Vienna, 24-27 April, 1967, IAEA,Vienna, 1968, p. 23,
8. D. Saphier and S. Yiftah, "The Effect of Errors in the Delayed -Neutron Data on Fast Reactor Static and Dynamic Calculations, "Nuclear-Science and Eng. 42, 272 (1970).
9. S. Ramchandran and K. R. Birney, "impact of the New LASLDelayed-Neutron Data on FTR Design, " Proceedings NationalTopical Meeting on New Developments in Reactor Physics jxndShielding, September 12-15, 1972, Report CONF-720901, USAEC(1972) p, €60.
386

10. G. R. Keepin, "Physics of Nuclear Kinetics, " Chapter 4, Acldison-Wesley Publishing Co., Inc., Reading, Massachusetts (1965).
11. T. Jahnsen, A. C. Pappas, and T. Tunaal, "Delayed NeutronEmission Theory and Precursor Systematics, " Delayed FissionNeutrons; Proceedings of a Panel held in Vienna, 24-47 April,1967, IAEA, Vienna, 1968, p. 35.
12. G. R. Keepin, T. F. Wimmett, and R. K. Zeigler, "DelayedNeutrons from Fissionable Isotopes of Uranium, Plutonium, andThorium," Phys. Rev. 107, 1044 (1957) and J. Nuclear Energy 6,1 (1957).
13. Gordon E. Hansen, Los Alamos Scientific Laboratory internalmemorandum N-2-8182, June 3, 1968 (unpublished).
14. Gordon E. Hansen, private communication.
15. Smith, Rose, McVicar, and Thorne, J. Nuclear Energy I, 4, 133 (1957).
16. C. F. Masters, M. M. Thorpe, and D. B. Smith, "The Measurementof Absolute Delayed-Neutron Yields from 3.1 and 14. 9-MeV Fission, "Nucl. Sci. and Eng. 36, 202 (1969).
17. V. I. Shpakov, K. A. Petrzhak, M. A. Bak, S. S. Kovolenko, andO. I. Kostochkin, Atomnaya Energiya JU, 539 (1961).
18. B. P. Maksiutenko, Atomnaya Energiya J15, 321(1963).
19. W. I. McGarry, R. J. Omohundro, and G. E. Holloway, Bull. Am.Phys. Soc. Ser II jj, 33 (1960).
20. M. S. Krick and A. E. Evans, "The Measurement of Total Delayed-Neutron Yields as a Function of the Energy of the Neutron InducingFission,." Nucl. Sci. and Eng. 47, 311 (1972)..
'X? _ ——
21. A. E. Evans", M. M. Thorpe, and. M. S. Krick, Nucl. Sci. and Eng.5j), 80 (1973).
22. J. F. Conant and P. F. Palmedo, "Measurement of the DelayedNeutron Fractions for Thermal Fission of 235U, 239Pu, and 233U, "Nucl. Sci. and Eng. 44, 173 (1971).
23. S. A. Cox and E. E. D. Whiting, "Energy Dependence of the Delayed-Neutron Yield from Neutron-Induced Fission of 232Th, 235U, and 238U, "ANL 7610, p. 45, Argonne National Laboratory (1970).
24. L. Tomlinson, "Delayed Neutrons FromFission, " United KingdomAtomic Energy Authority Research Group Report AERE-R6993 (1972).
387

25. B. P. Maksiutenko, J. Exptl. Theoret. Phys. (USSR) ,35, 81$ (1958).
26. L. V. East, R. H. Augustson, and H. O. Menlove, "Delayed. NeutronAbundances and Half Lives from 14. 7-MeV Fission, " Los AlamosScientific Laboratory report LA-4605-MS (1970) p. 15.
27. R. H. Augustson, L. V. East, and H. O. Menlove, "Delayed NeutronAbundances and Half Lives from 14. 7-MeV Fission, " Los AlamosScientific Laboratory report LA-4368-MS [1969) p. 12.
28. S. A. Cox, Phys. Rev. 123, 1735 (1961).
29. W. L, Talbert, Jr., A. B. Tucker, and G. M. Day, "Delayed NeutronEmission in the Decays of Short-Lived Separated Isotopes of GaseousFission Products, "'Phys. Rev. 177, 1805 (1969).
30. R. -Batchelor and H. R. McK. Hyder, "The Energy of Delayed Neutronsfrom Fission," J. Nuclear Energy j5, 7 (1956),
31. S. Shalev, Progress Report No. 4, TNSD-R/412, Technion, Haifa (1970).
32. S. Shalev and J. Guttler, "Energy of Delayed Neutrons from Uranium, "Trans. Am. Nucl. Soc. 14, 1, 373 (1971).
33. S. Shalev, Final Report on IAEA Research Contract No. 611/R1/R13(1971);-
34. S. Shalev and G. Rudstam, "The 137I Delayed-Neutron Energy Spec-trum, " Trans. Am. Nucl. Soc. _14, 1, 373 (1971).
35. E. T. Chulick, P. L. Reader, C. E. Bemis, Jr. and E. Eichler,"Energy Spectrum of Delayed Neutrons from, the'Spontaneous Fissionof 252Cf, " Nuclear Physics A168, 250 (1971).
36. N. G. Chrysochoides, A. J. Nicolitsas, N. N. Papadopoulos, C. C.Zikides, and C. A. Mitsonias, "Work in Greece on Delayed Neutrons, "Delayed Fission Neutz-ons; Proceedings of a Panel held in Vienna,24-27 April, 1967, IAEA, Vienna, 1968, p. 213.
37. G. L. Woodruff, USAEC report RLO-2225-T17-4 (July 1972); alsoW. R. Sloan'and G. L. Woodruff, Trans. ANS 15, '202, 942 (Nov. 1972).
388