Fission product behaviour during molten core-concrete ...
222
Thermochemical properties of some alkaline-earth silicates and zirconates Fission product behaviour during molten core-concrete interactions ACADEMISCH PROEFSCHRIFT ter verkrijgen van de graad van doctor aan de Universltett van Amsterdam, op gezag van de Rector Magnificus prof. dr. P.W.M. de Meijer ten overstaan van een door het college van dekanen ingestelde commissie in het openbaar te verdedigen in de Aula der Universiteit op woensdag 19 juni 1996 te 15.00 uur door Mark Eduard Huntelaar geboren te Alkmaar *05009052400* KS002064689 R: FI DE009052400
-
Upload
khangminh22 -
Category
Documents
-
view
0 -
download
0
Transcript of Fission product behaviour during molten core-concrete ...

Thermochemical properties of some alkaline-earth
silicates and zirconatesFission product behaviour during molten core-concrete interactions
ACADEMISCH PROEFSCHRIFT
ter verkrijgen van de graad van doctor aan de Universltett van Amsterdam, op gezag van de Rector Magnificus
prof. dr. P.W.M. de Meijerten overstaan van een door het college van dekanen ingestelde
commissie in het openbaar te verdedigen in de Aula der Universiteit op woensdag 19 juni 1996 te 15.00 uur
door Mark Eduard Huntelaar geboren te Alkmaar
*05009052400*
KS002064689 R: FIDE009052400

Promotor: Prof. Dr. Ir. E.H.P. Cordfunke

’Het geeft vele formulen,’ mompelde hij in zijn baard. 'Maar dezer heb ik gans klaar in mijn kop. Wellicht heb ik hem eensmaal zelvers gevonden. Nah; wanneer het werkzaam is zal ik het kortheidswege der Prlwytzkofskidefensiepulvr noemen. Nog een weinig houtskool wellicht en der swefel niet vergeten...’
Marten Toonder, De Spalten (1983)
ill NEXT PAOE(S)left BLANK

Allereerst wil Ik mljn promotor, Erik Cordfunke, bedanken voor zljn enthauslasmerende begeleiding. In bet begin was het weleens moellljk "jouw oog voor detail" te volgen, toch ben Ik blij dat je het geduld hebt opgebracht ml] op het goede wetenschappelljke pad te brengen en te houden.
De vele experlmenten die In dlt proefschrift zljn beschreven heb Ik nlet allemaal zelf uitgevoerd. Daarom wll Ik bedanken: De ECN- directle voor het beschikbaar stellen van de tljd en de mankracht die nodig zljn geweest voor de uitvoering van de werkzaamheden, Annemiek Kok-Scheele voor de vele DTA-metlngen die zij voor mij heeft uitgevoerd, Arend Booij en Wijb Ouweltjes voor de oploscalorimetrlsche metingen, Ron van der Laan voor de val- calorimetrische metingen, Piet van Vlaanderen voor de kristallograflsche ondersteunlng en ten slotte Vera Smlt-Groen voor de grahsche hand en span diensten. Dankzlj Vera zitten uiteindelijk alle figuren op de julste plaats.
Wetenschap betekent ook natlonale en Internationale samenwerldng. Daarom wll Ik ook bedanken Daan IJdo van de Universiteit Leiden voor zljn aanwijzingen in onder andere de structuurbepaling van SrZrSl207 en Edgar Westrum van de Universiteit van Michigan (Ann Arbor, USA) voor zljn lage-temperatuur soortelijke warmte metingen.
Tenslotte wil ik bedanken Eddie & Jose, Jan & Annemiek, Toos & Johan en mijn moeder voor het zonder aflaten telkens maar weer informeren of "het nu al eens af was". Zie hier I
vNEXT PAQE(S)
left BLANK

CONTENTS
1 Introduction............................................................................11.1 General Introduction ................................................. 31.2 The formation and behaviour of the fission products
during normal operating conditions .......................... 71.3 Fission product behaviour during off-normal
operating conditions.................................................... 91.4 Molten Core Concrete Interactions .......................... 11
2 MCCI « The State of the Art» .........................................152.1 Introduction................................................................172.2 Type of Concrete......................................................... 192.3 Ablation......................................................................202.4 Corium Coolability and Core Catchers......................212.5 Thermochemical requirements .................................242.6 Concluding remarks.................................................. 26
3 Sample preparation..............................................................273.1 Introduction............................................................... 293.2 The TEOS method .................................................... 293.3 cr-SrSi03(s) and Sr2Si04(s)....................................... 303.4 SrSi03(am) and meta-SrS103(s) .............................. 313.5 BaSi03(s) and Ba2Si04(s)......................................... 333.6 BaZr03(s) and SrZr03(s)............................................333.7 SrZrSi207(s) and Sr6ZrSi5018(s) / Sr7ZrSi6021(s) . 343.8 ZrSi04(s) ....................................................................353.9 Auxiliary oxides for calorimetry.................................35
4 Heat capacity.......................................................................394.1 Introduction............................................................... 414.2 Procedures................................................................. 454.3 cr-SrSi03(s) and Sr2S104(s)....................................... 474.4 SrZrSi207(s)............................................................... 514.5 Sr7ZrSi6021(s) ........................................................... 534.6 SrZr03(s) and BaZrOa(s)............................................554.7 ZrSi04(s) ....................................................................614.8 BaSi03(s)....................................................................63
vii

5 Solution Calorimetric Measurements ............................... 675.1 Introduction............................................................... 695.2 Experimental............................................................. 705.3 Auxiliary values and solvents...................................725.4 Strontium silicates.................................................... 765.5 Barium silicates.........................................................795.6 Metazlrconates of barium and strontium................. 815.7 Strontium zirconium silicates...................................85
6 Structural Relations............................................................896.1 Crystal structure of SrZrSi207 ............................... 916.2 Crystal structure of 8-SrSiOg ...................................96
7 An assessment of the enthalpies of formationof BaO(g) and SrO(g) ..............................................99
7.1 Introduction..............................................................1017.2 The enthalpies of formation of BaO(g) and SrO(g) . 1057.3 Discussion and conclusion..................................... 113
8 Phase diagrams; measurements & assessments........1178.1 Introduction..............................................................1198.2 Experimental........................................................... 1198.3 The binary system Sr0-Si02................................... 1208.4 The binary system BaSi03-S102 .............................1268.5 The pseudo binary system SrSi03-BaSi03........... 1268.6 The binary system Si02-Zr02................................. 1288.7 The binary system Zr02-Sr0................................... 1358.8 The ternary system BaS103-SrSi03-Si02................137
9 Calculations in the ternary system Sr0-S102-Zr02 • • 1419.1 Introduction..............................................................1439.2 Models...................................................................... 1449.3 Computer programs................................................ 1489.4 Phase diagram calculations ................................... 151
10 MCCI calculations............................................................ 16510.1 Introduction..............................................................16710.2 ACE calculations with the ECN-database ............. 16810.3 Model calculations...................................................17310.4 Final conclusions.....................................................176
viii

References........................................................... -.............179List of abbreviations ............................................................193Summary ............................................................................. 195Samenvatting .......................................................................197Curriculum Vitae..................................................................201Appendices...........................................................................203
lx

1. Introduction
NEXT PAOBISIleft BLANK

1.1 General Introduction.
Nuclear energy contributes substantially to the world’s energy production, and plays unquestionably an Important role In our modem society. Approximately 423 nuclear power plants are situated throughout the world and can be found In many countries [Sch 95].
Initially, in the sixties, nuclear energy was thought to be the major source for the future energy demands. However, already in the seventies, serious doubts were raised about the correctness and the desirability of this choice, due to several safety-related problems encountered. Accidents or almost-accidents with nuclear power plants, the processing of spent fuel, the retrieving and storage problem of nuclear waste, the cold-war (which left the impression that every nuclear facility is a potential nuclear bomb), and proliferation issues, were a fertile soil for doubts to grow. In addition, the fact that nuclear energy was, and still is, a very abstract phenomenon and not
-3-

in o in o in O in o 1-H <N min VO VO r- r- 00 00 Ov ON ON On ONOn o\ OV Ov On ON ON Ov ON ON On On
yearFig. 1.2 The amount of installed nuclear power in the world in the last
decades [Sell 95].
very palpable, contributed to this image. As a result the public attitude towards nuclear energy altered gradually and, consequently, the forecast made in the sixties was never fulfilled. This is illustrated in figure 1.1, in which the percentage of the nuclear electricity produced in 1992 per country, is given. Although in some countries nuclear energy makes a large contribution to the total energy production, this is nevertheless not as much as predicted. Figure 1.2 shows that the increase of electrical power generated with nuclear energy abruptly came to a hold in the beginning of the nineties after a rapid increase in the decades before.
After a series of small accidents with nuclear facilities, a severe accident in the Three Mile Island (TMI) nuclear reactor in Harrisburg (U.S.A.) occurred on March 28, 1979. An initially minor event in the primary cooling circuit of the reactor ended after a series of
4
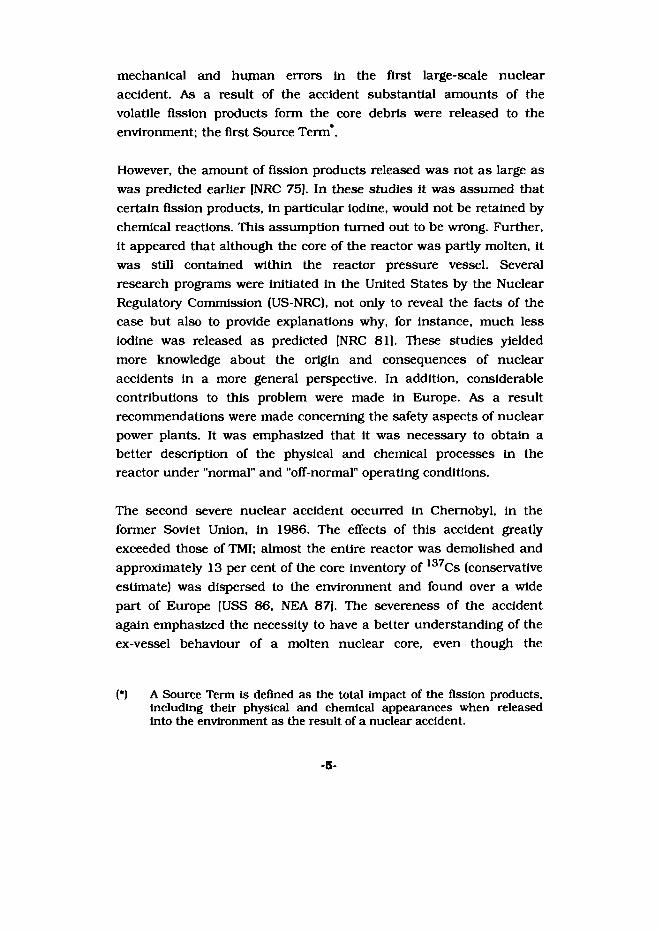
mechanical and human errors In the first large-scale nuclear accident. As a result of the accident substantial amounts of the volatile fission products form the core debris were released to the environment; the first Source Term*.
However, the amount of fission products released was not as large as was predicted earlier |NRC 75]. In these studies it was assumed that certain fission products, in particular iodine, would not be retained by chemical reactions. This assumption turned out to be wrong. Further, it appeared that although the core of the reactor was partly molten, it was still contained within the reactor pressure vessel. Several research programs were initiated in the United States by the Nuclear Regulatory Commission (US-NRC), not only to reveal the facts of the case but also to provide explanations why, for instance, much less iodine was released as predicted [NRC 81]. These studies yielded more knowledge about the origin and consequences of nuclear accidents in a more general perspective. In addition, considerable contributions to this problem were made in Europe. As a result recommendations were made concerning the safety aspects of nuclear power plants. It was emphasized that it was necessary to obtain a better description of the physical and chemical processes in the reactor under "normal" and "off-normal" operating conditions.
The second severe nuclear accident occurred in Chernobyl, in the former Soviet Union, in 1986. The effects of this accident greatly exceeded those of TMI; almost the entire reactor was demolished and approximately 13 per cent of the core inventory of 137Cs (conservative estimate) was dispersed to the environment and found over a wide part of Europe (USS 86, NEA 87], The severeness of the accident again emphasized the necessity to have a better understanding of the ex-vessel behaviour of a molten nuclear core, even though the
(*) A Source Term is defined as the total impact of the fission products, including their physical and chemical appearances when released into the environment as the result of a nuclear accident.
-5-

Chemobyl-type of reactor (graphite moderated) was different from the "western" nuclear power plants in almost every essential part. The research programs resulted in the development of various (mechanistic) computer codes for the prediction of fission product behaviour during nuclear accidents. For instance, codes especially designed for the behaviour of the fission products in the primary system, VICTORIA |Hea 90), and for the ex-vessel behaviour of a molten core, CORCON-VANESA (Col 84, Pow 86] or WECHSL (Rei 89, Foi 95], were developed.
The validation of these codes is mainly based on large-scale experiments, such as ACE, BETA, COMET and SURC [Fin 95, Als 87, Tro 95, Cop 89]. Although these experiments give a considerable insight in the overall processes occurring, such as the reaction of the molten core with various types of concrete, reaction propagation, concrete ablation, layer separation, the drawback is that they are very expensive. Moreover, the results can not be used for the prediction of release rates of fission products during reactor accidents, mainly because these processes are too complicated and rely too much on circumstances which can not be controlled, such as temperature, oxygen potential, and (fission product) concentration. It is thus essential to have a good chemical description of the fission products and their possible reactions with each other or with the matrix. In the past ten years much effort has been made to obtain a thermodynamic description of many of these fission products and their compounds either by measurement or by estimation. A great deal of this work was performed at the Netherlands Energy Research Foundation ECN. Once the thermodynamic descriptions are available, as is the case for the primary system, calculations can be performed without the drawbacks mentioned before.
To prove the correctness and completeness of the thermodynamic functions, a final validation has still to be made. This last stage of validation is one of the goals of the large PHEBUS-project (Cadarache, France) [Tat 94] in which a small-scale nuclear accident is simulated.
-6-
The results of these extremely costly series of experiments will be used, among others, to test the VICTORIA code on its prediction of the fission-product release behaviour during accidents involving the primary system only.
1.2 The formation and behaviour of the fission products during normal operating conditions.
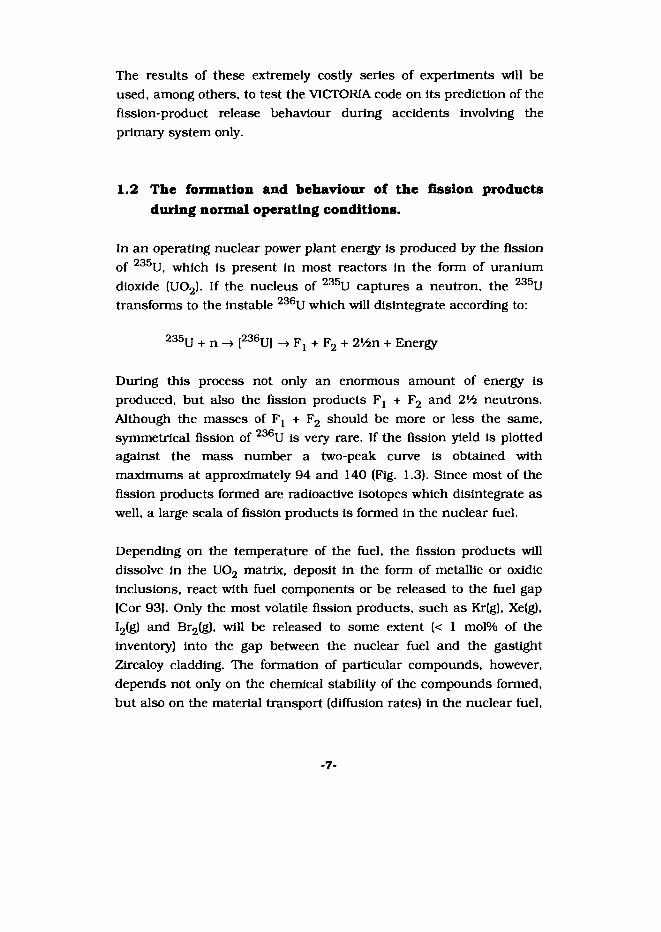
In an operating nuclear power plant energy is produced by the fission of 235U, which is present in most reactors in the form of uranium dioxide (U02). If the nucleus of 235U captures a neutron, the 235U transforms to the instable 236U which will disintegrate according to:
235U + n -> [236U] -> Fj + F2 + 2VSn + Energy
During this process not only an enormous amount of energy is produced, but also the fission products Fj + F2 and 2lA neutrons. Although the masses of F^ + F2 should be more or less the same, symmetrical fission of 236U is very rare. If the fission yield is plotted against the mass number a two-peak curve is obtained with maximums at approximately 94 and 140 (Fig. 1.3). Since most of the fission products formed are radioactive isotopes which disintegrate as well, a large scala of fission products is formed in the nuclear fuel.
Depending on the temperature of the fuel, the fission products will dissolve in the U02 matrix, deposit in the form of metallic or oxidic inclusions, react with fuel components or be released to the fuel gap [Cor 93]. Only the most volatile fission products, such as Kr(g), Xe(g), I2(g) and Br2(g), will be released to some extent (< 1 mol% of the inventory) into the gap between the nuclear fuel and the gastight Zircaloy cladding. The formation of particular compounds, however, depends not only on the chemical stability of the compounds formed, but also on the material transport (diffusion rates) in the nuclear fuel,
-7-

mass number
Fig. 1.3 The fission yield of 235U as a function of the mass number.
the temperature, the oxygen potential, and the reactant concentration [Cor 931.
The temperature in the fuel pellets is not constant but shows a rather steep radial temperature gradient due to the low thermal conductivity. In LWR fuel this gradient varies from approximately 1500 K in the centre to about 700 - 800 K at the fuel gap.
The oxygen potential is a thermodynamic expression related to the oxygen pressure, and is by definition:
A,.G° = RTln (pOa)
in which A^G° is the standard Gibbs energy of the reaction, R the gas constant, T the temperature in K, and p02 the oxygen pressure
-8-

relative to the standard pressure. In the LWR fuel mentioned earlier, the oxygen potential is initially -550 kJ-mol"1 and increases during the bum up to -450 kJ-mol"1, although recently some evidence is found that the oxygen potential can vary from -700 to -400 kJ-mol"1 [Mac 88]. The reason for the increase during the bum up is that fission of U02 liberates more oxygen than can be retained by the fission products.
Since temperature and oxygen potential determine the chemical form of the fission products, it can be calculated that, for instance, Mo02(s) is not a stable compoundin the centre of the nuclear fuel, whereas it may be stable near the fuel gap. Likewise, the formation of ternary compounds, such as Cs2Mo04(s) and Cs2Zr03(s), will be determined by the oxygen potential. Cordfunke and Konings [Cor 93] showed that under normal reactor operating conditions and low oxygen potentials Cs2Zr03(s) is more stable than Cs2Mo04(s). However, since the temperature in the fuel is generally low, the formation of most ternary compounds, although thermodynamically stable, is kinetically hindered. Independently of their chemical form, the fission products will not be released to the primary system or to the containment building under normal operating conditions. All the fission products remain within the inclusion of the cladding.
1.3 Fission product behaviour during off-normal operating conditions.
A different situation occurs when the heat removal from the nuclear fuel is blocked, for instance, by a failure in the primary cooling system. Since U02±x(s) has a poor thermal conductivity [Mar 82], the temperature in the fuel pellets will increase rapidly. As a direct result the fuel will start to swell and if attempts to restore the cooling capacity fail, the sequence of successive events as listed in Table 1.1, could occur. Although in the last step the fuel starts to melt, the
-9-

Table 1.1 A hypothetical progressive accident according to IAEA 82]®.
T/K phenomenon
973 - 1023 The Ag-In-Cd alloy inside the control rods starts to melt.
1073 The fuel rods start to swell and burst.
1173 The Zlrcaloy - H20 oxidation reaction starts as a result of which the temperature starts to rise even more rapidly.
1573 - 1773 The first liquid is formed due to eutectic reactions with Inconel - Zlrcaloy and U02 - Zlrcaloy
1673 - 1773 The control rods melt liberating the molten Ag-In-Cd alloy.
2123 - 2223 The Zlrcaloy clad starts to melt.
2673 - 2923 Melting of U02 - Zr02 mixtures.
§ temperatures on clad surface
accident will still be in-vessel (contained within the reactor vessel). It depends on the amount of molten fuel whether the lower head of the reactor vessel will melt, since the melting point of steel is much lower than the temperature of the debris. In that case the nuclear fuel is liberated towards the concrete basemat.
It is important to keep in mind that even if the reactor is scrammed (an emergency stop) the decay heat of the radioactive isotopes, still contributes to about 7 per cent of the initial heat production. This amount of heat is enough to generate the hypothetical accident listed above. It is evident that with the rise of the temperature the formation of compounds is also favoured. On the basis of severeness and possible consequences of nuclear reactor accidents, three different stages can roughly be distinguished: 1
1. Temporarily failure in the cooling Junction of the primary circuitAlthough the temperature rise in the fuel may have led to
-10-

enhanced compound formation and swelling of the fuel pellets, the safety of the reactor is not compromised.
2. In-vessel interaction of the (partly molten) core and the primary system. Unlike in stage 1 the temperature rise now leads to excessive compound formation in the fuel and with reactor materials like, for instance, control rods, Zlrcaloy cladding, steel pipes, and the coolant. Serious damage to the reactor building may lead to external contamination. This stage has had already much attention in the past [Kon 90; Cor 93).
3. Ex-vessel behaviour; Molten Core-Concrete Interactions (MCCI). Due to the high temperatures in the fuel, excessive compound formation with reactor materials and the concrete basemat underneath the core will occur. The integrity of the reactor building is probably damaged because of concrete erosion by the molten core debris, steam explosions, or hydrogen explosions fa- failure). External contamination is very likely to occur either by containment failure or deliberate pressure relieve.
Whereas scenarios (hypothetical accidents) involving only the primary system has been relatively well investigated in the past years, the "worst case" scenarios - the Molten Core Concrete Interactions or MCCI - remained under-exposed. Only after the Chernobyl accident, interest expanded seriously towards this type of accident.
1.4 Molten Core Concrete Interactions.
After the last step of the hypothetical accident mentioned in Table 1.1, the MCCI (Molten Core Concrete Interaction) starts. The molten core debris has penetrated the reactor vessel and drops on the concrete structure underneath the core, the so-called basemat. On the basemat the molten fuel starts to erode and to decompose the
-11-
concrete leading to the formation of gases (CO, C02, H20), aerosols and new compounds. It is needless to say that during this ex-vessel stage the temperature is extremely high (» 1500 K) and compound formation is very rapid. What type of compounds will be formed depends on many factors, such as the history of the accident and the type of concrete. For instance, in the earlier in-vessel stages the oxidation of the Zlrcaloy clad by steam leads to hydrogen production which, together with the water in the primary system, determines the oxygen potential (and thus controlled compound formation!). A different situation is obtained when the core debris reacts "gently" through the reactor vessel, or in case the reactor is ruptured by an invessel (steam, hydrogen) explosion. All these different scenarios lead to a different propagation in the MCCI stage.
As a direct result of the higher temperatures, the less-volatile fission products may be released. Particularly, those of barium, cerium, lanthanum, and strontium are of interest in this perspective since they are considered to be radiologically hazardous, and present a major risk to the environment. In this stage of the accident most of the volatile substances, as treated in the VICTORIA code, can be neglected because they are released during the earlier stages. However, recently it was suggested that core debris prior to MCCI could contain still up to 10% of the volatile fission product inventory [Cor 93[.
Another difference with in-vessel accidents is the necessity for additional thermodynamic descriptions to correct for non-ideal chemical behaviour. Two major matrix components zirconium dioxide (Zr02) from the oxidized clad, and silicon dioxide (Si02), a major constituent of concrete, are notorious substances with respect to nonideality [Sto 91, Sto 93], Let alone the fact that the formation of zirconates and silicates drastically changes the stability of the fission products and therefore their release behaviour, the incorporation of non-ideality, or chemical activity, will have an enormous influence on the release of this type of compounds as well. Unfortunately, the
-12-

availability of thermochemical data on zirconates and silicates of the fission products of barium, cerium, lanthanum, and strontium is very poor [Cor 91). Therefore, this thesis deals with a detailed physicochemical study of the system Sr0-Ba0-Si02-Zr02. It includes a determination of the thermodynamic properties, such as the low- temperature heat-capacity, the high-temperature enthalpy increment, the enthalpy of formation, but also the chemical relations in pseudobinary and higher-order phase diagrams, and chemical activity data, in order to provide the numerical requirements in the different codes used for the calculation of the release of fission products.
-13

2. MCCI
« The St&te-of-the-Art »
-15-

2.1 Introduction
During molten-core concrete Interactions the molten nuclear fuel has penetrated the reactor pressure vessel and fallen onto the concrete basemat underneath it. Mainly due to the decay heat of the fission products and the actinides the temperature is veiy high and well above the solidus temperature of concrete, 1400 - 1500 K. The aggressive molten core debris, which consists almost entirely of U02, Zr02 and Zr, starts to ablate (erode) the concrete, and large erosion depths can be obtained (six meters or more!) before the ablation process stops. As a result transport of fission products to the groundwater is possible when concrete erosion continues for too long a period. During the erosion process more and more concrete dissolves in the oxide mixture changing the physical properties, volume and temperature. As a consequence of the decomposition of the concrete and reactions with the core debris, large quantities of C02(g), CO(g), H20(g), and H2(g) are produced, which are the driving force behind the fission product aerosol transportation. The erosion stops long after the debris has solidified, when the contact surface to the surrounding is large enough to remove the decay heat. This, however, may take weeks or months (Als 95].
During core-concrete interactions a multi-component melt is formed roughly consisting of an oxide and a metal phase. The melt is vigorously stirred due to gases formed during the decomposition of the concrete. Therefore, in the early stages of MCCI the melt is probably a homogeneous mixture of metallic and oxide phases, although the density of these phases greatly differ. In the cool-down period phase separation may occur, as is observed in large-scale experiments, but this may be hindered due to the high viscosities at lower temperatures.
Due to the vigorous interaction of the molten-core debris with the concrete, fission products are transported by aerosol formation
-17-
sparging from the melt or by simple evaporation. The contribution of the fission products to the total amount of gas is, however, small compared to the gases produced during the decomposition of the concrete. As the concrete decomposes large quantities of hot COa(g) and H20(g) are produced which will be partly reduced to CO(g) and H2(g) by the metals in the molten debris. These gases contribute to a pressure build-up in the containment building which will almost certainly result in an overpressure with loss of the containment’s integrity, if no safety measures are taken [Als 95]. Venting, a controlled pressure relieve, is therefore necessary. Since the containment atmosphere is filled with aerosols and gaseous fission products this is a direct health hazard to the surrounding of the nuclear plant. The source term can be reduced if the pressure is relieved via a (water) scrubber, or if water sprays are installed in the containment. The latter also reduces the consequences of Direct Containment Heating [Als 95].
Since H2(g) is an easily inflammable gas, safety precautions should be made to prevent deflagration or detonation. It is obvious that an explosion in the containment building is a serious threat to the integrity.
Since MCCI depends on so many parameters, as will be discussed below, it is difficult to get a detailed insight in the processes occurring. Because of this it is impossible the make a general prediction for "the" MCCI valid for all types of accidents. Mechanistic computer codes, such as CORCON-VANEISA and WECHSL, are developed as a tool for understanding these processes, but also for source-term prediction reasons. The empirical input for these codes has been obtained by means of large-scale experiments, such as ACE, BETA, SURC. Knowledge was gained with respect to the controlling parameters, such as the type of concrete (e.g.: limestone, limestone/common sand, siliceous, basaltic), the amount of core debris and its composition, and temperature, and the influence of the parameters on the ablation rate.
-18-

2.2 Type of Concrete
The largest differences between the various types of concrete already mentioned, are the silicon dioxide content and the amount of carbonate. In Table 2.1 some essential chemical and physical differences between the most commonly used types of concrete are listed. On the basis of the solidus and liquldus temperature limestone concrete seems the best choice since It can withstand the highest temperatures, whereas basaltic concrete decomposes at much lower temperatures. However, there are other arguments which have to be taken Into consideration. Limestone concrete has the highest concentration of carbonate and will therefore release much more C02(g) than the other types of concrete.
The silicon content of the various types of concrete not only influences the solidus and liquldus temperatures of the concrete but also the fission product release. Experiments at Argonne National Laboratory [Roc 93] showed that fission product release is reduced considerably in a matrix containing high concentrations of silica. In the ACE-L experiments [Fin 95] it was shown that strontium and barium enrichment preferably occurs in a silica-enriched layer formed on solidified melts. From these experiments it can thus be concluded that the presence of silica is responsible for the reduced fission product release.
Table 2.1 Some chemical and physical properties of the most commonly used types of concrete [Fin 95, Roc 93].
Concrete sio2 co2mass %
h2o Tfsol)K
Tfllq)K
Limestone 6.2 33.3 6.1 1495 2577Limestone / common sand 28.3 21.4 6.1 1393 1568Siliceous 69.0 4.23 3.7 1403 1523Basaltic 52.8 4.4 1273
-19-

Thermodynamic release calculations of the ACE experiments show a reasonable agreement with the experimental results on barium and strontium If silicates and zirconates are Included (Cor 94a], Because the cerium and lanthanum releases show a similar behaviour with varying types and concentration of concrete [Fin 95], silicates and zirconates are expected to have the same Influence. However, since the thermodynamic data on most of these silicates and zirconates were lacking up to now, this could not be verified.
2.3 Ablation
It is rather difficult to predict the ablation rate of the concrete. Although it does depend on the type of concrete, other important factors such as the melt temperature, the amount of metals, and the presence of water have a drastic influence [Fin 95]. For instance, the presence of zirconium metal in the core melt increases the ablation rate because of the very exothermic reactions which the silica, e g. at 2400 K:
Zr(l) + SiO20) = Zr02(s) + Si(l) - 156.9 kJmol1 Zr(l) + H2Otg) = Zr02(s) + H2(g) - 833.1 kJmol 1
The second reaction is the major source for hydrogen gas production.
During the ablation the decomposition products of the concrete dissolve in the melt. As a result the mass (and volume) of the melt will increase continuously, whereas the amount of decay heat remains more or less constant. The temperature of the melt therefore decreases, and so does the rate of ablation with approximately 30% by every 100 K [Als 88].
-20-

2.4 Corium Coolabilty and Core Catchers
The horrifying consequences of MCCI demands an adequate solution. The most obvious one should be flooding of the melt with water Immediately after the accident. This approach, however, will have a preposterous effect since steam explosions cannot be ruled out. Moreover, the formation of more-volatile fission products Is enhanced, and run away chemical reactions between metals and water are very likely to occur. But the main drawback is that when the melt solidifies, a crust is formed which is not permeable to water but only to gases (Beta and Wetcor experiments). Even worse, the crust will serve as an Isolating blanket which will hinder the heat transport towards the water severely. The only advantage of a water layer on top Is the reduced aerosol formation since it works as a water scrubber [Als 95). In some types of reactors satisfactory results can be obtained when the reactor cavity Is flooded prior to the accident. This was demonstrated In the ZION (and follow up) experiments [Par 93). Already In the second CSNI specialist meeting on Core Debris Concrete Interactions in 1992 [Als 92[ it was recognized that It should be necessary to develop a code to describe the crust formation behaviour. However, since it is very difficult to model the solidification process and the heat transfer through the crust correctly, such a code still does not exist, although serious attempts have been made.
Since a core melt through of the reactor vessel cannot be ruled out and simply adding water to the system after an accident could make things even worse, several core catcher concepts are now under development. The type of design depends on the reactor concept and therefore the core catcher cannot be seen as a stand alone device; it has to be studied in relation to the reactor. The purpose for which the core catcher is designed and the unpredictability of core melt-through accidents dictate several requirements which have to be met. Obviously, it has to withstand the molten core. This means that either the core catcher itself should be able to withstand explosions or that
-21-

(new) reactor designs should rule out the possibility of such an event. Other requirements are that it should [Als 95]:- cool down the melt (heat removal),- retain fission products (this requirement is already met if the melt
cools down sufficiently),- have no effect on the containment integrity,- In general, the effectiveness should be based on easy-to-
understand concepts and should not involve difficult or vulnerable technologies.
The EPRI requirements of 0.02 m2 of basemat per MW^(nomlnal) for the reactor cavity size are perhaps enough to guarantee sufficient spreading of a hypothetical core-melt accident although there still is discussion whether or not it would be enough to dissipate decay heat if the cavity is flooded with water. To obtain more knowledge about the cooling aspects of corium and to have a tool to judge core-catcher concepts, the Corium 2D code of ENEL is under development (Als 95, Par 95]. This code simulates the thermal balances and heat transfers in multi-component structures to predict the temperature in those structures after corium relocation either in- or ex-vessel. A drawback of the code is that it presently only considers the energy balance (not the mass balance). Other flaws are that so far no concrete is included in the code, and that multi-component phases, like corium, are considered to be pure (to have one melting point instead of a solidus and liquidus temperature). In other words, it neglects the entire chemistry. Still, a lot of work has to be performed for the code to predict the behaviour of the various core-catcher concepts. Since little is understood of corium spreading, CEA has started the CORINE program to predict the spreading of high viscosity-melts (Als 95].
One of the most promising core catcher concepts will be discussed here in some detail. This core catcher, currently under development by FzK, Karlsruhe uses spreading and fragmentation to cool down the core melt, see Fig 2.1. The concept meets all requirements listed above and seems above all very effective seen the test results obtained
-22-
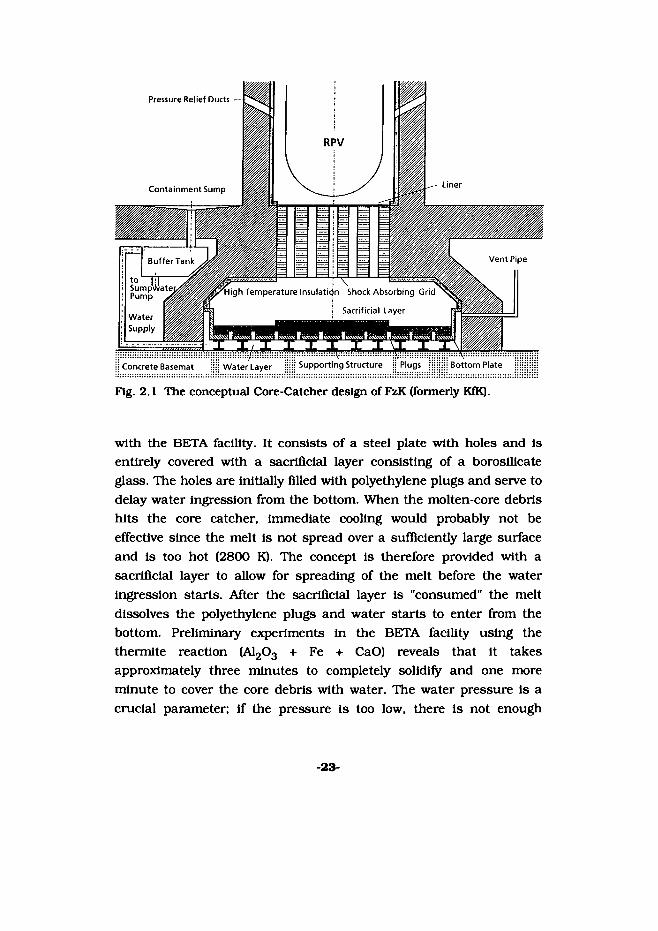
Pressure Relief Ducts — •
Containment Sump
Vent PipeBuffer Tank
Knigh Temperature Insulation Shock Absorbing Grid
i Sacrificial LayerWaterSupply
Supporting Structure i: Plugs Bottom PlateConcrete Basemat Water Layer
Fig. 2.1 The conceptual Core-Catcher design of FzK (formerly KfK).
with the BETA facility. It consists of a steel plate with holes and Is entirely covered with a sacrificial layer consisting of a boroslllcate glass. The holes are Initially filled with polyethylene plugs and serve to delay water ingression from the bottom. When the molten-core debris hits the core catcher, immediate cooling would probably not be effective since the melt is not spread over a sufficiently large surface and is too hot (2800 K). The concept is therefore provided with a sacrificial layer to allow for spreading of the melt before the water Ingression starts. After the sacrificial layer Is "consumed" the melt dissolves the polyethylene plugs and water starts to enter from the bottom. Preliminary experiments In the BETA facility using the thermite reaction (A1203 + Fe + CaO) reveals that it takes approximately three minutes to completely solidify and one more minute to cover the core debris with water. The water pressure is a crucial parameter; if the pressure is too low, there is not enough
-23~
cooling capacity, and too a pressure high may result in steam explosions. The quenched solid is found to be 60% porous in the oxide layer and 40% in the metal layer.
In the summer of 1994 a new series of experiments have started in the new facility* which includes the simulation of the decay heat. The only drawback is that the use of an induction coil indirectly heats up the oxide phase (90% of the decay heat) since only the metal layer is sensitive to the induction field. Consequently the oxide phases will have a lower temperature then the metal phases, whereas this will be reverse in real accidents.
2.5 Thermochemical requirements [Als 95, Cen 95]
The assessment of the consequences of severe accidents in nuclear rectors involving molten Core-Concrete Interactions (MCCIs) requires estimates of the quantities and the physico-chemical forms of the radioactive species released from the melt into the cavity and containment atmosphere. Such estimates in turn require a detailed knowledge of the complex chemical interactions which would occur between the fission products, fuel and the components of the core structural materials and the concrete. In recent years, effort has been put into the thermodynamic characterization of these processes (Als 92, Bal 93, Che 93]. With the results of such studies several aspects of the MCCI can be understood or predicted better, such as:- fission product release,- solidus and liquidus temperatures,- the composition of the liquid and the solid phases which
determines the viscosity.
($) The former BETA facility was destroyed by a steam explosion when in a corium coolability experiment hot metal interacted with water.
-24-
The fundamental requirements for these studies are reliable thermodynamic functions and phase diagrams. In the last couple of years efforts has been made to develop models for the nine component system U02-Zr02-Ca0 Si02 A1203 MgO-BaO SrO LagOg. Although the construction of this model Involved a critical assessment of the available thermodynamic data, improvements are certainly necessary on the La203 part, whereas Ce02/Ce203 still had to be included in the model. The results of the model have never been subject of a more detailed study to verify the chemical activities obtained. The necessity Is evident from the fact that there are several multi-component models which do not give similar results. Whereas in the chemical models every effort is made to include all Interaction terms, in the mechanistical codes this is simplified. However, during the second OECD meeting in 1992 [Als 92] it was finally recognised that the codes are sensitive to the oxygen potential, the thermodynamic data and the models used to describe the solid and the liquid. As long as the treatment of chemistry in these codes stays as it is, no real predictions on the liquidus and solidus temperatures can be made. Since not every scenario can be simulated in large-scale experiments, there are only two options: accept the large differences found, or improve the codes.
Unlike the condensed species, the amount of gaseous species Is fairly limited since complex ternary compounds need not to be considered In the gaseous phase. Nevertheless, the thermochemical data of many gaseous fission products are insufficiently known, especially the hydroxides of the less-volatile ones, and only estimates (La, Ru, Mo, Eu) exist [Jac 71, Kri 82). Of some species the existence has not even been proven experimentally. On the contrary, other gaseous species, like SrO and BaO, have been studied extensively with often conflicting results [Chapter 7 of this thesis). The low vapour pressure of the less- volatile fission products makes their experimental determination in situ very difficult.
-25-

A peculiar finding Is that the ruthenium release during steam explosions Is much higher than under "normal" conditions. Correlations are found with the particle sizes of the aerosols expelled after the steam explosion. The small aerosols were found to contain the highest Ru levels. A possible explanation may be found In the fact that the physical conditions In explosions are as a rule not homogeneous in gas composition. Local high oxygen potentials could result In the formation of volatile ruthenium species. This may be the reason why the CORCON-VANESA code still underpredicts the Ru- release by several orders of magnitude.
2.6 Concluding remarks
Knowledge about all the aspects of MCCI has significantly improved during the last five years. The mechanistic codes have become mature and give better predictions. However, still improvements have to be made such as better treatment of the solidus-liquidus temperatures of varying core-concrete mixtures.
As a result of the numerous amounts of large-scale experiments on dry molten MCCI a database can be constructed to make predictions in the field of [Als 92]:- hydraulics,- chemical reactions,- aerosol release,- fission product release, and- prototypical core-concrete interactions.
Predictions about the chemical behaviour of MCCI require, however, detailed knowledge of the individual substances. A database obtained from large-scale experiments, will result in a generalisation from which predictions on particular accident scenarios can only be calculated very roughly.
-26-

3. Sample Preparation
NEXT PAQEIS) I left BLANK I
3.1 Introduction
Pure and well-defined samples are a prerequisite for all thermodynamic measurements. However, such samples can often not be purchased commercially. As a consequence, most compounds had to be prepared in our laboratory. Depending on the type of sample, different routes of preparation can be applied, nevertheless the best route is never obvious before a crystallographically and chemically pure sample is obtained. For instance, early attempts to prepare BaZr03(s) in a purified argon atmosphere, starting from BaO(s) and Zr02(s), showed that very high temperatures (up to 1900 K) were needed to obtain a pure product. When applying the same method as described by Van Roosmalen et aL for SrZr03(s) [Roo 92), by starting from the carbonate and Zr02(s) and using air instead of purified argon, the preparation temperature could be lowered to 1373 K. The explanation has been found in separate experiments: it appears that the presence of a small amount of moisture has a catalytic effect on the reaction (see paragraph 3.7).
3.2 The TEOS-method
The silicates mentioned in the following paragraphs, were all prepared by the TEOS-method fTEOS = TetraEthyl OxySilane). This method, first applied to the preparation of SrS103(s) [Uen 90], uses the gelforming property of TEOS + ethanol + cation mixtures, when denaturated in a strong acid or basic environment. In general, the cation is dissolved in an acid - preferably nitric acid because it decomposes completely leaving no anions in the sample - after which the TEOS and ethanol are added. Immediately after this an excess amount of ammonia is added to the well-stirred solution and a gel is formed. The gel is allowed to solidify during the night after which it is dried in a hot stove. When dry, it is powdered and dried further in a vacuum stove.
-29-
The precursor powder still contains nitrates which have to be decomposed carefully. The decomposition reaction is performed in a gold boat in an atmosphere of purified oxygen. Depending on the cation the decomposition of the nitrates takes place between 673 and 873 K. It is important that during this decomposition reaction moisture is no longer present as this leads to the formation of highly aggressive nitric acid. After this, the final preparation of the silicates is performed in a purified argon atmosphere using platinum boats and temperatures up to 1800 K.
The main advantage of this method is that all the components are mixed at an atomic (ionic) level yielding a reactive precursor. The more reactive the precursor, the lower the temperature at which the reactions come to completion, and the less material problems are likely to be encountered during the preparation.
Other routes such as solid state reactions between, for instance, strontium oxide and silicon dioxide, have been tried as well. However, these are less suited, mainly because of severe reactions with the container materials due to the high temperatures required for the synthesis when oxidic precursors are used.
3.3 a-SrSiOg(s) and Sr2Si04(s)
SrSiOg(s) and Sr2S104(s) were prepared by heating the stoichiometric amounts of TEOS (Merck, mass fraction >0.98) and Sr(N03)2, prepared from SrC03 (Cerac, mass fraction 0.99999) after decomposition in oxygen in a gold boat at 975 K, according to Ueno et al. [Uen 90). The reactions were completed at gradually higher temperatures up to 1775 K in platinum boats in a purified argon atmosphere. X-ray powder diffraction (Guilder camera, Cu Ka12) and chemical analysis proved the samples to be chemically pure as well as phase pure. Si was determined by ICP-AES with an internal standard
-30-
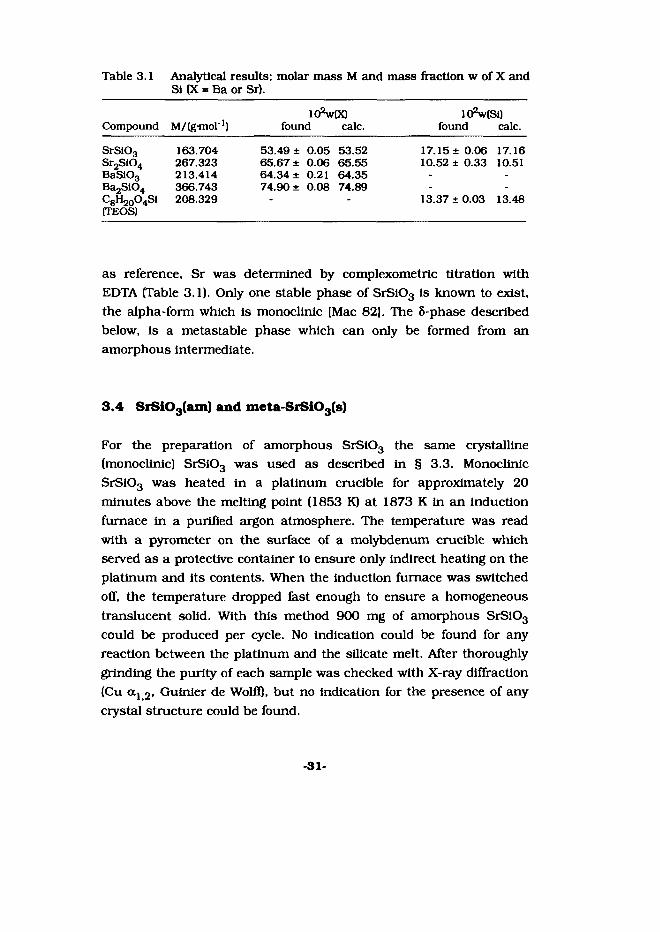
Table 3.1 Analytical results; molar mass M and mass fraction w of X and Si PC = Ba or Sr).
M/tgmol"1)ltiVtx) 102w(Sl)
Compound found calc. found calc.
SrS103 163.704 53.49 ± 0.05 53.52 17.15 ± 0.06 17.16Sr0S104 267.323 65.67 ± 0.06 65.55 10.52 ± 0.33 10.51BaSlOg 213.414 64.34 ± 0.21 64.35 - -
BaoSlOx 366.743 74.90 ± 0.08 74.89 - -
(TEOS)208.329 ' " 13.37 ± 0.03 13.48
as reference, Sr was determined by complexometrtc titration with EDTA (Table 3.1). Only one stable phase of SrS103 Is known to exist, the alpha-form which Is monocllnic [Mac 82], The 8-phase described below, Is a metastable phase which can only be formed from an amorphous Intermediate.
3.4 SrSi03(am) and meta-SrSiOg(s)
For the preparation of amorphous SrS103 the same ciystalllne (monocllnic) SrS103 was used as described In § 3.3. Monocllnic SrS103 was heated In a platinum crucible for approximately 20 minutes above the melting point (1853 K) at 1873 K in an Induction furnace In a purified argon atmosphere. The temperature was read with a pyrometer on the surface of a molybdenum crucible which served as a protective container to ensure only indirect heating on the platinum and Its contents. When the induction furnace was switched off, the temperature dropped fast enough to ensure a homogeneous translucent solid. With this method 900 mg of amorphous SrSl03 could be produced per cycle. No Indication could be found for any reaction between the platinum and the silicate melt. After thoroughly grinding the purity of each sample was checked with X-ray diffraction (Cu a12, Guinler de Wolff), but no indication for the presence of any crystal structure could be found.
-31-
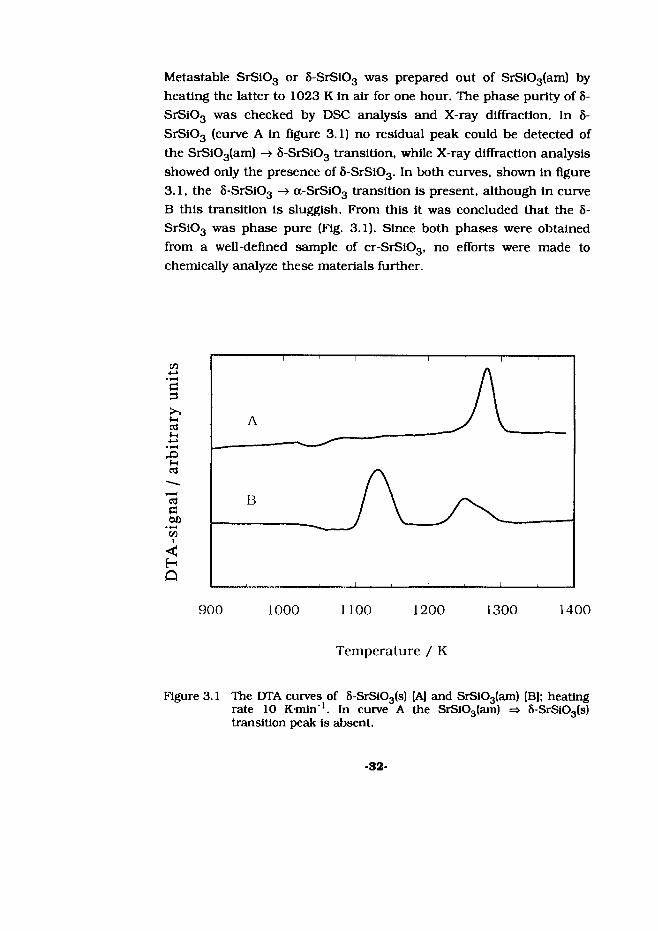
Metastable SrS103 or 8-SrS103 was prepared out of SrSi03(am) by heating the latter to 1023 K in air for one hour. The phase purity of 8- SrSi03 was checked by DSC analysis and X-ray diffraction. In 8- SrSi03 (curve A in figure 3.1) no residual peak could be detected of the SrS103(am) -> S-SrS103 transition, while X-ray diffraction analysis showed only the presence of 8-SrSi03. In both curves, shown in figure 3.1, the S-SrS103 —> a-SrSi03 transition is present, although in curve B this transition is sluggish. From this it was concluded that the 8- SrSi03 was phase pure (Fig. 3.1). Since both phases were obtained from a well-defined sample of cr-SrSi03, no efforts were made to chemically analyze these materials further.
t/3
ti3%•hcdlH
■ecd
cd
W>V)
<HQ
14001000 1100 1200 1300
Temperature / K
Figure 3.1 The DTA curves of 5-SrS103(s) [A] and SrS103(am) [B]; heating rate 10 K-min"1. In curve A the SrSi03(am) => 8-SrS103(s) transition peak is absent.
•32-

3.5 BaSi03(s) and Ba2Si04(s)
BaSi03(s) and Ba2S104(s) were prepared by heating the stoichiometric amounts of Ba(N03)2 (Baker) and TEOS (Merck) (Table 3.1) after decomposition in purified oxygen in a gold boat at 975 K, according to Ueno et aL (Uen 90); the reactions were completed at 1173 K. X-ray powder diffraction (Guinier camera, Cu Ka1 2) proved the samples to be phase pure. Although two forms of BaSi03 a- and J3, are reported in literature [NBS 76, Gre 67), no experimental evidence could be obtained for the existence of the a-form. The sample used in this study is the orthorhombic (fi) form (NBS 76). The Ba content of the samples was determined by complexometric titration with EDTA (Table 3.1).
3.6 BaZrOs(s) and SrZrOs(s)
Zr02(s) (Aldrich, mass per cent Hf < 2TO"4) was heated in an yttrium- stabilized Zirconia (8YSZ) crucible in a purified oxygen atmosphere at 1473 K to remove absorbed moisture. BaCG3 (Baker (69.64 ± 0.04) mass per cent Ba; 2 10 4 mass per cent Sr) and SrCG3 (Baker (59.38 ± 0.20) mass per cent Sr; 2TO"4 mass per cent Ba) were dried at 873 K in air. After drying the starting materials were stored in an argon- filled glove box.
Table 3.2 Molar mass M, and calculated molar ratio of XO (X = Ba, Sr),and Si02 relative to Zr02.
Compound M/fg-mol'1) n(X0)/n(Zr02) n(SI02)/n(Zr02)
BaZrOg 276.549 1.0000SrZrOg 226.842 1.0001 -SrZrSi207 347.011 0.9993 2.0013Sr6ZrSi50]8 1045.361 5.9968 5.0042ZrS104 183.307 - 1.0000
-33-
BaZrOg(s) and SrZrOg were prepared by thoroughly mixing the stoichiometric amounts of their composing oxides and carbonates. The mixtures were pressed and heated in an aluminum oxide crucible in air at 1423 K for 12 hr. An underlying pellet of the same composition was used to prevent reactions with the container. After each heating the samples were checked after thoroughly grinding by X-ray diffraction. This sequence was repeated until no further changes were observed in the diffraction patterns. Since it was not possible to analyze the pure samples and the solid solutions accurately, the molar quantities of the initial substances, were used to calculate the molar fractions (Table 3.2).
3.7 SrZrSigO^s) and Sr6ZrSig018(s) / Sr7ZrSi6021(s) *
SrZrSi207(s) and Sr6ZrSi5Oie(s) were prepared in two steps. In the first step SrC03(s) (Cerac) was slowly dissolved in HN03 and mixed with alcohol and TEOS(l) (Merck). After precipitation with NH4OH the samples were dried in a stove (353 K) and decomposed in purified oxygen in a gold boat at 1073 K (Uen 90). In the second step the calculated stoichiometric amounts of Zr02(s) (Aldrich, <200 ppm Hf) were added to the mixtures. The pure compounds were obtained by heating the samples in platinum boats in a purified argon atmosphere. After each heating the samples were ground in an alundum mortar and analyzed by X-ray diffraction (Guinier camera, Cu-Kctj 2). This sequence was repeated at gradually higher temperatures up to 1673 K until no further changes were observed in the diffraction patterns. Finally, the samples were heated in purified oxygen in a gold boat at 973 K to compensate for possible oxygen loss during the previous heatings. Accurate crystallographic data of these ternary silicates were not available in literature, therefore their
(#) From single crystal measurements of "Sr6ZrSi5018(s)", it became clear that the formula of the compound is Sr7ZrSi6021(s) [Pla 95). However, attempts to prepare this composition all failed since only mixtures of Sr2Si04, SrZr03 and Sr7ZrSi6021 were obtained.
-34-
diffraction patterns were indexed. From the results it was concluded that both samples were phase pure. Unfortunately, we were not able to analyze the samples on their silicon, strontium, or zirconium content accurately. However, on the assumption that during the preparation the constituents did not evaporate, the starting composition in combination with the X-ray results, is sufficient to define the samples. The molar masses of the samples and the calculated molar fractions are given in Table 3.2.
3.8 ZrSi04(s)
Zirconium silicate, ZrSi04, has been prepared according to the overall reaction:
ZrCl4 + Si02 + 2HaO = ZrSi04 + 4HC1
ZrCl4 (Aldrich, Hf < 20 ppm) was slowly dissolved in water, followed by a calculated amount of TEOS. After ethanol (30 ml) and an excess amount of ammonia has been added, the gel was allowed to form overnight. In the next steps the gel was dried in a vacuum stove and decomposed by heating it up to 1073 K in a stream of purified oxygen. In subsequent heatings in purified argon up to 1823 K ZrSi04 was obtained phase pure, as was checked by X-ray analysis (JCPDS 6- 266).
Since it was not possible to analyze ZrS104 chemically, only the initial composition of the composing oxides are given in Table 3.3.
3.9 Auxiliary oxides for calorimetry
In Chapter 5 of this thesis the procedures and results of the solution calorimetric measurements will be discussed. The preparation of the
-35-

auxiliary oxides used in the enthalpy-of-solutlon cycles, is given below.
The samples of SrO(s) and BaO(s) used in the thermochemical cycles are the same as used for the determination of their standard molar enthalpies of formation by Cordfunke et aL [Cor 90a]. For the preparation procedures and purities of these oxides, see that article.
Amorphous SiOa was prepared by the oxidation of TEOS in purified oxygen at 1175 K after precipitation with concentrated ammonia (Merck, 16.5 mol-dm"3). Chemical analysis by ICP-AES with an internal standard as reference, showed the amorphous SiOa to be pure. X-ray analysis did not show the presence of any crystalline phase. The a-Si02 used was the standard reference material from NIST® (NBS-SRM 1654).
Amorphous Zr02(s) was prepared by dissolving Zr(s) (Cerac, 70 ppm Hfi in concentrated HNOa (14.4 mol din'3), with a very small amount of HF added as a catalyst, followed by precipitation with ammonia (Merck, 16.5 mol dm'3). The precipitate was washed until no N03" could be detected with a diphenyl amine - H2S04 reagent, and dried at 575 K in purified oxygen. The resulting Zr02 was characterized by X-ray, infrared and gravimetric analyses; it was completely amorphous and contained still (2.73 ± 0.08) weight percent water possibly present as hydroxyl groups. For convenience, this amorphous Zr02 will be written as Zr02 0.192 H20(am).
A slightly different method for the preparation of amorphous Zr02 was used starting from ZrCl4(s) (Aldrich, mass per cent 99.999; Hf < 50 ppm). Zirconium tetrachloride was dissolved in water and precipitated with concentrated ammonia (Merck, 16.5 mol dm'3). The precipitate was washed twice with 250 ml 2 mol-dm"3 ammonia and twice with
(@) NIST = National Institute of Standardisation and Technology, formerly designated National Bureau of Standards (NBS).
-36-

250 ml purified water. No Cl" could be detected In the filtrate with a AgNOg solution. The product was first dried In a vacuum stove at 343 K and then In purified oxygen at 560 K. It was characterized by X-ray diffraction and gravimetric analysis; the resulting ZrOa was completely amorphous and contained (2.196 ± 0.081) mass per cent water. The residual chloride concentration in the sample was determined by ion-chromatography and found to be 1.5410"2 weight per cent of Cl". For convenience, this amorphous ZrOa will be written as Zr02 0.154 H20(am).
-37- INEXT PAGE(S)
left BLANK

4. Heat Capacity
Parts of this Chapter have been published previously as:
M.E. Huntelaar, E.H.P. Cordfunke, E.F Westrum (1993), The heat capacity and derived thermophysical properties of some alkaline earth silicates and zirconates from 5 to 1000 K: I. Crystalline SrSi03 and Sr2S104. J. Phys. Chem. Solids, 53, 801.
M.E. Huntelaar, E.H.P. Cordfunke, J.C. van Miltenburg (1995), The heat capacity and derived thermophysical properties of some alkaline earth silicates and zirconates from 5 to 1000 K: II. Crystalline SrZrSi207. Thermochimica Acta 254, 11.
M.E. Huntelaar, E.H.P. Cordfunke, (1996), Heat capacity and enthalpy increments of the metazirconates of Calcium, Strontium and Barium. Thermochimica Acta (in print).
-39-

Fig. 4.1 The adiabatic low-temperature heat capacity calorimeter [Wes 68J.
-40-

4.1 Introduction
The heat capacity of a substance Is an Important thermodynamic quantity since It provides the function of the various thermodynamic quantaties with temperature. Usually, the heat capacity is measured in two different temperature regions: sub-ambient and super-ambient.
The low-temperature heat capacity (or sub-ambient) measurements are mostly performed in an adiabatic calorimeter. In this type of calorimeter heat capacity measurements can be performed from 0 K to about 350 K using liquid helium and liquid nitrogen as a coolant. The calorimeter placed in a helium cryostat (Fig. 4.1), is surrounded by a heating wiring system. When an exactly known amount of heat as electrical power (Q) is applied through the wiring system of the calorimeter, this will result in a temperature rise AT. Since the heat capacity is defined as:
C = Q/AT,
the "true" heat-capacity can be obtained by applying an infinitesimal amount of heat. In practice, this is done by transferring a sufficiently small amount of heat, and by taking a large enough sample. The experimental technique is despite of its simple physical principle, very difficult. For instance, heat leakage must be avoided by means of complicated thermostatted heat-shields and extremely thin wiring. For a more detailed description of the equipment, see Westrum et aL [Wes 68], see Figure 4.1.
Although adiabatic measurements can also be made at super-ambient temperatures, usually another technique is applied, namely drop calorimetry, since the rapidly increasing heat radiation at higher temperatures makes it increasingly difficult for adiabatic calorimetry to avoid heat leakage out of the calorimeter. The drop calorimeter in its original form was developed by Bunsen in 1870 [Bun 70] and is called the Bunsen ice-calorimeter (see Fig. 4.2; insert).
-41-

Fig. 4.2 The diphenyl-ether drop calorimeter according to Cordfunke et aL [Cor 791; shown in the insert is the original ice-calorimeter by Bunsen [Bun 70]. For symbols, see text.
-42-
Nowadays, modem versions exist, such as the diphenyl-ether drop calorimeter [Cor 79], but the actual concept has remained the same since the last century. Briefly, the drop-calorimetric method can be described as follows (Fig. 4.2). A sample (A) is heated in an ampoule in a furnace (B) at temperature T. When the sample is in thermal equilibrium with the surroundings, the ampoule is dropped into the calorimeter (D). The energy of the ampoule plus sample melts the solid diphenyl-ether in equilibrium with its liquid in a closed system (Tfus = 300.06 K). As the diphenyl-ether melts, its volume increases pushing away liquid mercury (E). The amount of mercury displaced can be related to the enthalpy increment of temperature T relative to melting point of diphenyl-ether, when the equipment is calibrated with a known substance, for instance, sapphire (A1203). The maximum temperature at which these measurements with this type of method can be done, is approximately 900 K. At higher temperatures the amount of energy to be transferred by the sample to the diphenyl ether increases rapidly, thus disturbing thermal equilibrium in the calorimeter. Also the heat flow (radiation) from the furnace to the diphenyl ether increases dramatically, influencing the pre- and post period.
A somewhat different type of drop calorimeter, which can be used at higher temperatures, is the copper-block drop calorimeter. The main difference with the previous version is that the diphenyl-ether calorimeter is replaced by a copper-block. Due to this alteration, the calorimeter is able the measure larger enthalpy increments. This technique is not used in this thesis and will therefore not be discussed here.
A fundamental difference between drop-calorimetry and adiabatic calorimetry is that the heat-capacity in drop calorimetry is not measured directly. The measured enthalpy difference between the temperatures T2 and Tx (usualy 298.15 K) can be related to the heat capacity using:
-43-
4.1T2
H(T2)- HiT^jCpdTT,
The high-temperature enthalpy Increments are usually fitted to a polynomial function. The degree of the polynomial and the sign of the terms can be very Important. Shomate (Sho 541 has developed a method for fitting the enthalpy increments to the polynomial:
H°(D-H°(298.15) = AT + BT2 + CT1 - D 4.2
This function is one of the few simple functions that can describe the strong curvature in the heat capacity (the derivative), that often occurs at about room temperature, and increases continuously monotone, so that the function can be extrapolated beyond the experimental data points. However, in many cases no good fit can be obtained with this "standard" polynomial. In that case additional terms can be added to the function which then cannot be extrapolated outside the temperture range of the measurements any more.
In the computer programme ENTHAL [Ent 94) developed at ECN, the measured enthalpy increment data can be fitted to the "standard" polynomial or to a "variable" polynomial with additional (or fewer) terms. If necessary the enthalpy increment data can be fitted to two polynomials in order to split a "difficult" temperature region into two separate regions. To all the functions additional boundary conditions can be set, C° and H°(T)-H°(298.15), which have to meet at a temperature T (usually 298.15 K).
Since the low-temperature heat-capacity up to 298.15 K and the enthalpy-increment, starting from room-temperature, are obtained with different techniques, both types are often plotted as the reduced enthalpy increment, H°(T)-H°(298.15)/(T-298.15). This functions is extremely sensitive around room temperature and is therefore used to check if the two independent series of measurements join smoothly in
-44-
this this temperature region. At 298.15 K the function is equal to the heat capacity.
With the development of computer-controled DSC equipment a new technique to measure heat capacities has become available. In separate runs DSC-signals of the sample, the crucibles, and the reference material are compared yielding in the end the heat capacity- function of the sample in the scanned temperature region. The advantage of this method is its speed, the disadvantage is the accuracy. The usual accuracy of the diphenyl-ether drop calorimeter described above is 0.3%, whereas with DSC accuracies of about 5 to 10% can be obtained typically. This makes this method unsuitable if accurate Cps are needed. As a first estimate, however, it may be useful.
For the heat-capacity experiments described below, only the adiabatic low-temperature calorimeter and the diphenyl-ether drop calorimeter have been used. The former type of measurements have been performed at the University of Michigan, Ann Arbor (MI), U.S.A. (Professor E.F. Westrum Jr.), and at the University of Utrecht (dr. J.C. van Miltenburg, The Netherlands), the latter technique at ECN.
4.2 Procedures
Low-temperature heat capacityThe low-temperature heat capacities as obtained at Ann Arbor, were measured in an adiabatic calorimeter (laboratory designation Mark XIII) over the temperature 5 to 350 K [Wes 68). A gold-plated, high- conductivity, oxygen free, copper calorimeter (laboratory designation W-99) was used. The calorimeter has a mass of 10.003 g and an internal volume of 10.0 cm3. The temperature of the calorimeter was measured with a Leeds & Northrup encapsulated platinum resistance thermometer in an entrant well. The thermometer was calibrated by
-45-

NIST against IPTS-48 (Stimson 1965), and Is considered to reproduce the thermodynamic temperature scale within 0.03 K from 5 to 300 K.
The low-temperature heat capacities obtained in Utrecht were measured in an adiabatic calorimeter (laboratory designation CAL V) over the temperature 10 to 319 K; the calorimeter and its calibration have been described before (Mil 87]. The temperature of the sample was measured with a 100 Ohm platinum thermometer (minco encapsulated type, calibrated Oxford Instruments against IPTS-68).
After the samples were introduced 1.0 to 4.0 kPa helium gas was inflated into the evacuated calorimeter to facilitate rapid thermal equilibration. The calorimeter containing the sample, was sealed in inert atmosphere and then reopened on the vacuum line for the introduction of helium. The calorimeter was then sealed, placed in the cryostat, and cooled.
Enthalpy incrementThe enthalpy increments above 298.15 K were measured in the isothermal diphenyl-ether calorimeter. The samples were enclosed in a spherical high-purity silver or quartz ampoules. The ampoules were heated in a furnace the temperature of which was measured with calibrated Pt/(Pt +10 mass per cent Rh) thermocouples to 0.1 K. The ratio of the heat input to the mass of mercury making up the volume change, is a constant for the apparatus, (79.9903 ± 0.0649) Jg"1, and is obtained by calibration with the NBS (now designated NIST) standard reference material No. 720, synthetic sapphire, A1203. Our results with sapphire all agree within 0.2% with the data given by NIST. The enthalpy contributions of the silver ampoule were determined separately [Cor 90b].
-46-
4.3 a-SiSI03(s) and Sr2S104(s)
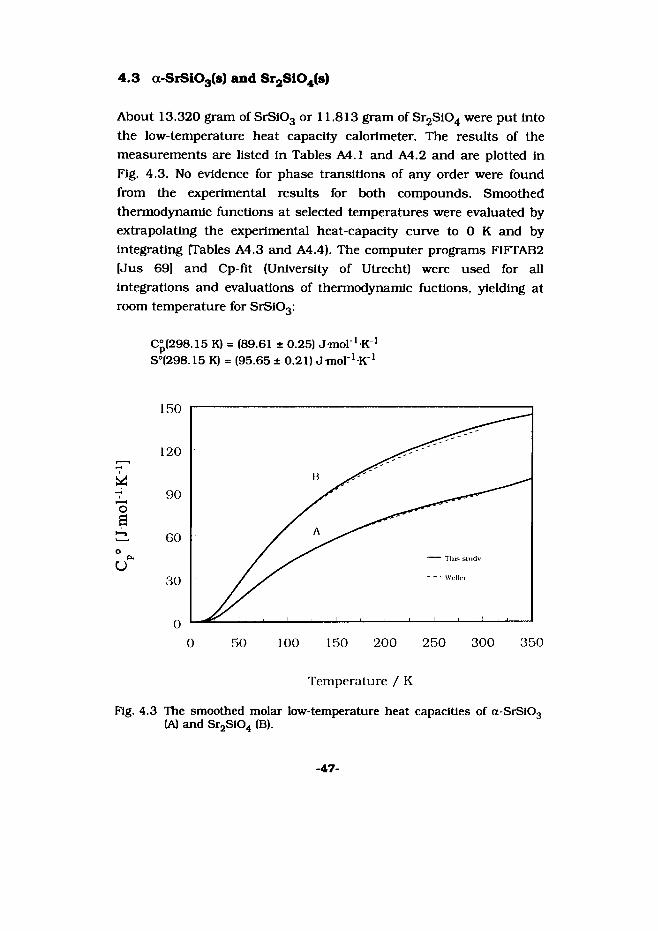
About 13.320 gram of SrSiOg or 11.813 gram of Sr2Si04 were put Into the low-temperature heat capacity calorimeter. The results of the measurements are listed In Tables A4.1 and A4.2 and are plotted in Fig. 4.3. No evidence for phase transitions of any order were found from the experimental results for both compounds. Smoothed thermodynamic functions at selected temperatures were evaluated by extrapolating the experimental heat-capacity curve to 0 K and by integrating (Tables A4.3 and A4.4). The computer programs FIFTAB2 (Jus 69] and Cp-fit (University of Utrecht) were used for all integrations and evaluations of thermodynamic fuctions, yielding at room temperature for SrS103:
C°(298.15 K) = (89.61 ± 0.25) J mol ^K1S°(298.15 K) = (95.65 ±0.21) Jmol^K1
- ' Weller
Temperature / K
Fig. 4.3 The smoothed molar low-temperature heat capacities of a-SrS103 (A) and Sr2Si04 (B).
-47-
C°(298.15 K) = (136.89 ± 0.30) J mol ^K"1 S°(298.15 K) = (155.44 ± 0.25)
For the drop-calorimetric measurements 5.20487 g of SrSi03 and 4.72655 g Sr2Si04 were enclosed in silver ampoules of 4.60654 g and 4.62860 g, respectively. All weights were corrected for buoyancy in argon. The results of the measurements, 14 for SrSiOg and 11 for Sr2S104, are listed in the Table A4.5. A correction was made for the difference in enthalpy between the final calorimeter temperature (300.06 K) and the standard reference temperature, 298.15 K, using Cp°(298.15 K) from this study.
The high-temperature enthalpy increments of SrSi03 (Table A4.5) were fitted to the polynomial using as the boundary conditions (H°(T)- H°(298.15 K)) = 0 at 298.15 K, and Cp°(298.15 K) = (89.61 ± 0.25) J-mol'-K1. For SrSi03 we thus obtain (298.15 to 886.4 K):
{H°(T)-H°(298.15 K))/J mol 1 = 98.30627(T/K) + 16.27781 10 3(T/K)2+ 16.35881-103(T/K) i - 36243.8
In the literature two phase transitions for Sr2S104 have been reported. At 355 K monoclinic J3-Sr2Si04 (space group P21/n) transforms reversibly to a’-Sr2Si04 (space group Pnmb) with an enthalpy of transition of 213 J-mol"1 [Pie 72], At about 775 K another reversible transition to the a-phase is reported to occur [Wit 87]. This has been confirmed by high temperature X-ray diffraction in this study. However, the enthalpy of this transition is too small to be measured in our DTA apparatus and will therefore be neglected in the calculations.
The enthalpy increment for the intermediate temperature region from 298.15 to 355 K, has been calculated by extrapolating and integrating the fit of the low-temperature heat capacity data. As usual the highest
and for Sr2S104:
-48"

it
B
VI00
(Nsc
£X
mooo\Nh
355 K
1000
Temperature / K
Fig. 4.4 The reduced enthalpy increments of cr-SrS103 (A) and Sr2Si04 (B) from 5 to 1000 K.
experimental points (above 325 K) have relatively large errors, and have therefore been omitted In the calculations. Thus, for J3-Sr2Si04 we obtain for 298.15 to 355 K:
(H°m-H°(298.15 K))/J mol 1 = - 37.3652(T/K) + 75.637810"2(T/K)2- 1.99360T0'3(T/K)3 + 3.30362 10 6(T/K)4- 2.4148410"9(T/K)5- 53.4461 TO2(T/K)"1 - 23657.1
Using this polynomial the boundary condition for the high- temperature enthalpy increment of a’-Sr2S104 is calculated to be 8261 J at 355 K. We thus obtain, for the a’ (and a) phase in the temperature range 355 to 886.2 K:
{H°(T)-H°(298.15 KD/Jmol"1 = 121.4700(T/K) + 36.61196 10 3fT/K)2- 39474.9
-49-

The standard deviations are 127 J-mol"1 for SrS103, and 100 J-mol"1 and 252 J-mol"1 for the Intermediate and high-temperature region of Sr2Si04, respectively. The smoothed high temperature thermodynamic quantities of SrS103 and Sr2S104 are listed in Table A4.6. They have been calculated using the values for the enthalpies of formation of SrSi03 and Sr2Si04 given in Chapter 5 of this thesis, -(1635.3 ± 1.8) and -(2305.7 ± 2.2) kJ-mol"1, respectively.
DiscussionWeller and Kelley [Wei 641 measured the low-temperature heat capacities from 51 to 300 K; high-temperature heat capacities have not been measured. The low-temperature heat capacities and the high-temperature enthalpy increments have been measured using the same samples. As can be seen in Fig. 4.4 the two sets of data join smoothly at 298.15 K for SrSi03 as well as for Sr2Si04. The low- temperature heat capacities [Wei 64], in the temperature region 51 to 300 K are somewhat lower for SrSi03 and Sr2Si04, the discrepancies increasing with temperature. The entropies calculated by these authors, S° (298.15 K) = (96.48 ± 0.85) J-mol"1*'1 for SrS103 and (153.34 ± 1.26) J-mol"'-K'1 for Sr2S104, are in reasonable agreement with the present results, being 0.9% higher and 1.4% lower, respectively. The slightly higher value for the entropy of SrSi03, compared with our value, can be explained by their estimated value for S°(51 K) which is about 20% higher than our measured value.
High-temperature enthalpy increments of SrSi03(s) and Sr2Si04(s) have not been measured before, and only estimates by Spencer, quoted by [Bar 77], were available in literature. These estimates are in good agreement with our measurements. For SrSi03 the estimated values in the temperature region of 500 to 900 K are approximately 1.5% higher and for Sr2Si04 approximately 0.7% lower than the values measured by us.
-50-
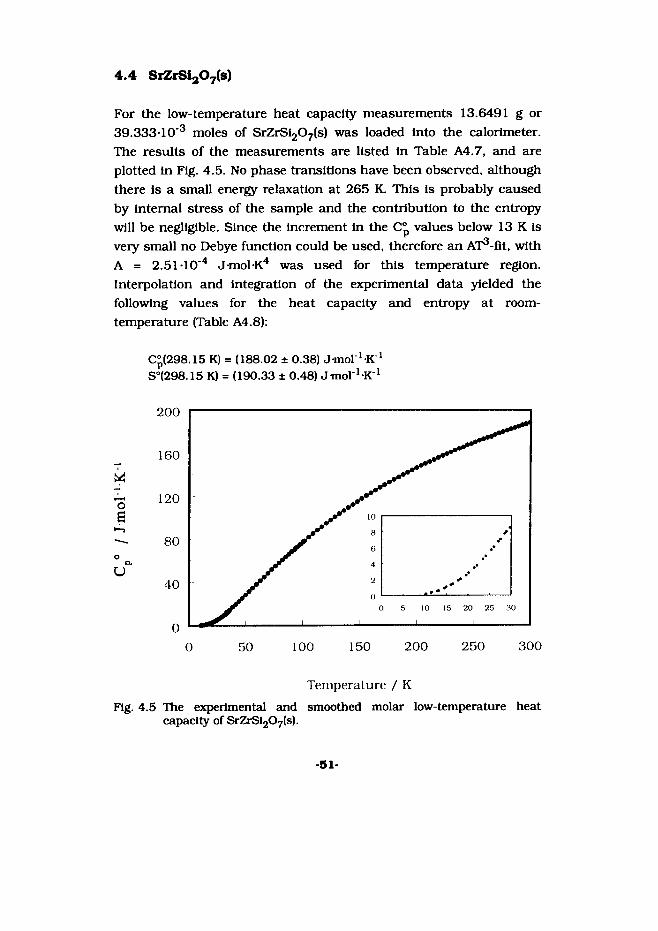
4.4 SiZrSijOyls)
For the low-temperature heat capacity measurements 13.6491 g or 39.333-1 O'3 moles of SrZrSl207(s) was loaded Into the calorimeter. The results of the measurements are listed In Table A4.7, and are plotted In Fig. 4.5. No phase transitions have been observed, although there Is a small energy relaxation at 265 K. This Is probably caused by Internal stress of the sample and the contribution to the entropy will be negligible. Since the Increment In the Cp values below 13 K Is very small no Debye function could be used, therefore an AT^-flt, with A = 2.51 TO"4 J-mol-K4 was used for this temperature region. Interpolation and integration of the experimental data yielded the following values for the heat capacity and entropy at room- temperature (Table A4.8):
C°(298.15 K) = (188.02 ± 0.38) J mol ^K1S°(298.15 K) = (190.33 ± 0.48) J-mol'-K 1
0 50 100 150 200 250 300
Temperature / KFig. 4.5 The experimental and smoothed molar low-temperature heat
capacity of SrZrSi207(s).
-51-
a
00
MX
HX
inooox<sH
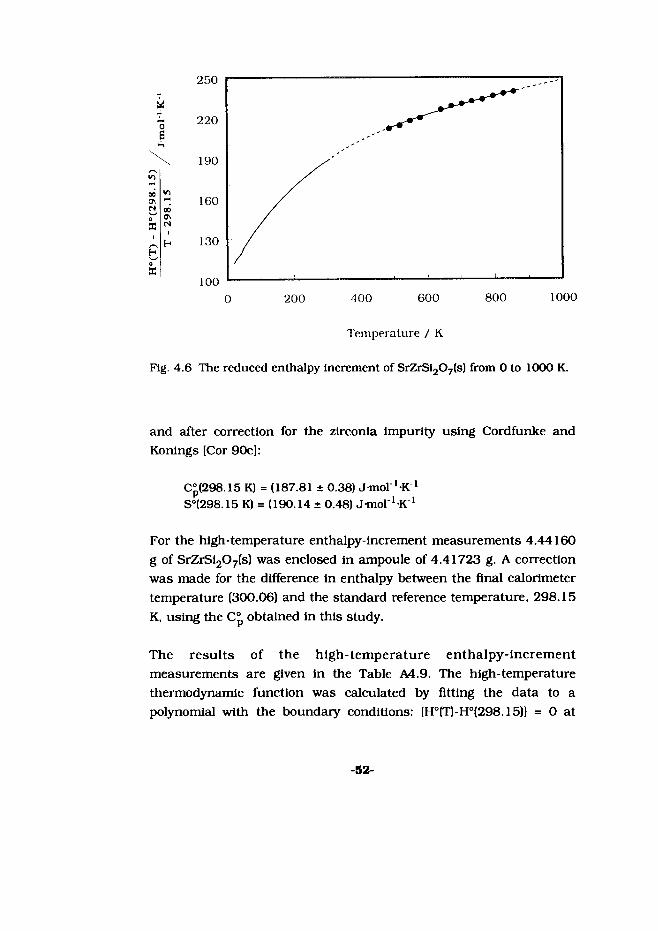
Fig. 4.6
1000
Temperature / K
The reduced enthalpy increment of SrZrSi207(s) from 0 to 1000 K.
and after correction for the zlrconia impurity using Cordfunke and Konlngs [Cor 90c]:
C°(298.15 K) = (187.81 ± 0.38) J-mol '-K 1 S°(298.15 K) = (190.14 ± 0.48) Jmol^K 1
For the high-temperature enthalpy-increment measurements 4.44160 g of SrZrSi207(s) was enclosed in ampoule of 4.41723 g. A correction was made for the difference in enthalpy between the final calorimeter temperature (300.06) and the standard reference temperature, 298.15 K, using the C° obtained in this study.
The results of the high-temperature enthalpy-increment measurements are given in the Table A4.9. The high-temperature thermodynamic function was calculated by fitting the data to a polynomial with the boundary conditions: (H°(T)-H°(298.15)} = 0 at
-52-

298.15 K and using the C°p(298.15 K) obtained In this study. For SrZrSi207(s) we thus obtain from 298.15 to 855.2 K:
1H°m -H°(298.15))/J mol"1 = 204.6077fT/K) + 43.63192 10"3(T/K)2+ 38.06008 103(T/K)' - 77647.8
The differences between measured and calculated values are also listed in Table A4.9. As can be seen in Fig. 4.6, there is a smooth fit between the low and the high-temperature data. With the function derived in this study and the standard molar enthalpy of formation of SrZrSi207 (Chapter 5], the smoothed thermodynamic properties of Table A4.10 have been calculated.
Since no thermodynamic data were available no comparison could be made with the literature.
4.5 Sr7ZrSi6021(s)
As already mentioned in Chapter three instead of Sr7ZrSi6021, "Sr6ZrSi5018" was prepared. Since Sr6ZrSi5018 does not exist; this means that our sample is a mixture of Sr7ZrSi6021 and SrZr03 in the ratio 5:1. All the measurements have therefore been corrected for SrZrOg using the functions derived in this thesis. The assumption made is that excess heat-capacity parameters can be neglected.
Low-temperature heat capacity measurements have been performed at Ann Arbor. However, due to an unknown phenomenon the measurements are in a bad shape and will therefore be presented here as an estimate. The estimated values for the heat capacity and the entropy at room temperature give, after correction for SrZr03:
C°(298.15 K) = (656 ± 2) J mol'^K1 S°(298.15 K) = (700 ± 15) J-mol ' -K1
-53-

300 400 500 600 700 800 900 1000
Temperature / K
Fig. 4.7 The reduced enthalpy increment of Sr7ZrSi602i(s) from 298.15 to 1000 K.
The value for S° is in good agreement with estimates based on the assumption of a zero reaction entropy reaction; the entropy would be 715 J-mol^K"1 upon formation from the oxides or 688 J-mol^K"1 from SrSiOg and SrZr03.
For the high-temperature enthalpy-increment measurements 4.82481 g of "Sr6ZrSi5018" was enclosed in a quartz capsule of 4.43197 g. The uncorrected results are given in Table A4.1 la, the corrected in Table A4.1 lb. Using the estimated heat-capcity at room temperature and H°(T)-H°(298.15) = 0 as a boundary condition the following function has been calculated for the temperature region 298.15 to 855.2 K:
{H0(D-H°(298.15 KH/Jmor1 = 585.6346(T/K) + 204.69310 3(T/K)2+ 45.9515 105(T/K)"1 - 208215.0
The standard deviation of the fit in the temperature region given is
-54-

533 J-mol"1. The fit Is also shown In Fig. 4.7. Since no other measurements were available, no comparison with literature data could be made. The smoothed higher temperature thermodynamic quantities of Sr7ZrSig021 are listed In Table A4.12. They have been calculated using the value for the enthalpy of formation determined in Chapter 5 of this thesis.
4.6 SrZrOa(s) and BaZrOs
For the present measurements 6.12437 g of SrZr03 was enclosed in a quartz ampoule of 1.24663 g. Additional measurements on BaZrOg have been performed with the same sample as in previous measurements [Cor 89]. A correction was made for the difference in enthalpy between the final calorimeter temperature (300.06 K) and the standard reference temperature, 298.15 K, using C°(SrZr03, s, 298.15 K) = (103.43 ± 0.31) J-mol"1-K"1 and C°(BaZr03, s, 298.15 K) = (101.71 ± 0.31) from King and Weller [Kin 60], respectively.
ResultsThe high-temperature enthalpy-increment data for SrZr03(s) and BaZr03(s) are given in Table A4.10. The high-temperature thermodynamic functions were calculated by fitting the data to a polynomial with the boundary conditions: |H°(T) - H°(298.15)| = 0 at 298.15 K and using the C°(298.15 K) values obtained by King and Weller. For SrZr03(s) we thus obtain from 298.15 to 906.5 K:
{H°(T)-H°(298.15 K)}/Jmol 1 = 105.7740(T/K) + 15.30911 10"3fT/K)2+ 10.19858-103(T/K) 1 - 36318.0
For BaZr03(s) we obtain using the combined results of the previous [Cor 89] and the present study from 298.15 to 899.3 K:
{H°(T)-H°(298.15 K)}/J-mol1 = 121.7139(T/K) + 3.847778-10 3fT/K)2+ 19.82171 lO^fT/K)1 - 43279.3
-55-
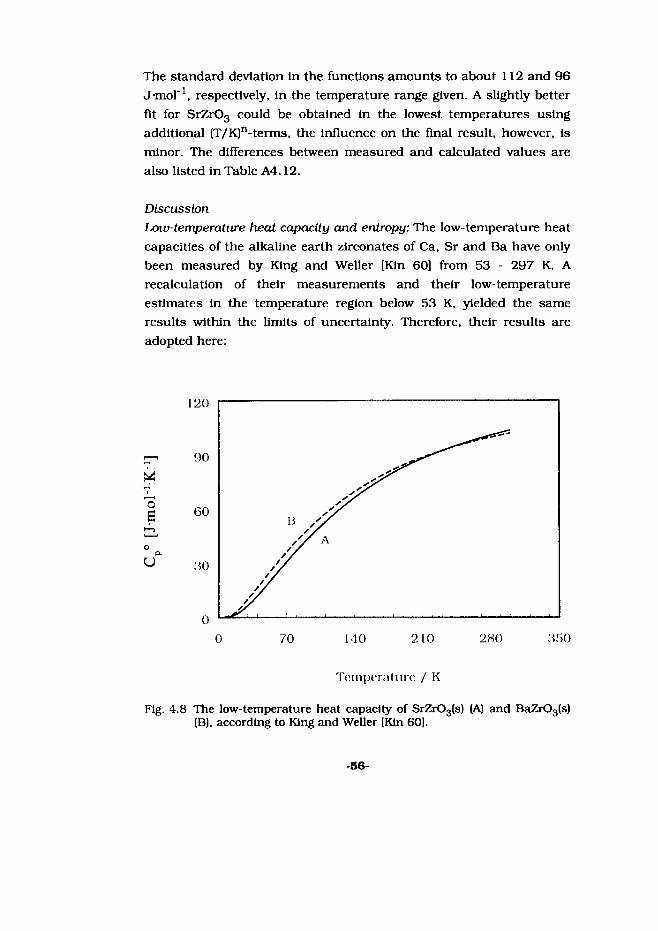
The standard deviation in the functions amounts to about 112 and 96 Jmol"1, respectively, in the temperature range given. A slightly better fit for SrZr03 could be obtained in the lowest temperatures using additional (T/K)n-terms, the influence on the final result, however, is minor. The differences between measured and calculated values are also listed in Table A4.12.
DiscussionLow-temperature heat capacity and entropy: The low-temperature heat capacities of the alkaline earth zirconates of Ca, Sr and Ba have only been measured by King and Weller [Kin 60] from 53 - 297 K. A recalculation of their measurements and their low-temperature estimates in the temperature region below 53 K, yielded the same results within the limits of uncertainty. Therefore, their results are adopted here:
Temperature / K
Fig. 4.8 The low-temperature heat capacity of SrZr03(s) (A) and BaZr03(s) (B), according to King and Weller [Kin 60].
-56-
C°(SrZr03, (s), 298.15 K) = (103.43 ± 0.31) Jmol 1 K 1 C°(BaZr03, (s), 298.15 K) = (101.71 ± 0.31) Jmol"1 K"1
The derived entropies at room temperature are:
S°(SrZr03, (s), 298.15 K) = (115.06 ± 0.84) Jmol1 K 1 S°(BaZr03, (s). 298.15 K) = (124.68 ± 1.26) Jmol1 K 1
Remarkable is the fact that at room temperature the numerical value for the heat capacity of strontium zirconate is higher than for barium zlrconate, whereas the entropies show the normal order. It can be seen in Fig. 4.8 that up to 100 K there is a "normal" behaviour. At higher temperatures the heat capacity increment of barium zirconate decreases, finally resulting in a heat capacity at 298.15 K.
High-temperature enthalpy incrementsSrZr03(s): The high-temperature functions of SrZr03(s) have been measured by several authors: Gospodinov and Marchev [Gos 93, Fomichev et cd. [Fom 73], Levitski! et al [Lev 76], and Nagarajan et aL [Nag 85], The results obtained in these studies do not agree, as can be seen in Fig. 4.9. The most likely explanation for these differences is the purity of the samples and small differences in the crystal structures. SrZr03(s) is reported to have crystal structures vaiying from cubic to orthorhombic. Recently Van Roosmalen [Roo 92] suggested that SrZr03 probably is cubic, but that the crystal structure is very sensitive to lattice defects caused by impurities or high preparation temperatures, finally resulting in a distortion of the perovskite structure.
Fomichev et aL [Fom 73] and Nagarajan et al. [Nag 85] did not report the crystal structure of their samples. In view of the preparation temperatures of 1750 K and 1373 K, respectively, they are probably orthorhombic and tetragonal. The sample of Levitski! et al. was described as tetragonal [Lev 76]. The measurements by Gospodinov and Marchev [Gos 93] will be disregarded since they have no physical
-57-

meaning. In Fig. 4.9 the possible Influence of the crystal structure on the reduced enthalpy Increment is shown. The dotted curves A and B indicate enthalpy increment functions of the orthorhombic and the tetragonal structure, respectively. It is evident that the higher the crystallographic symmetry of the sample the lower the enthalpy increment of SrZr03(s) becomes, in agreement with the present measurements in which care was taken to use a cubic sample.
As can be seen in Fig. 4.9, most of the reduced high-temperature enthalpy increment series join the low-temperature heat-capacity measurements of King and Weller [Kin 60]. The crystallographic structure and purity of the sample used by these authors is not described very clearly. The preparation temperature of their sample is not in agreement with the cubic structure they reported to have. Moreover, they refer to the NBS Circular [Swa 60], in which only orthorhombic strontium zirconate is mentioned. In view of the preparation temperature (1743 K), their sample was most likely
King/Weller
♦ Fomichev
Levitskil
° This study
Op"(298.15 K)
1000 2000 2500
Temperature / K
Fig. 4.9 The reduced enthalpy increment of SrZr03(s).
-58-

orhorhombic. This could be an explanation for the remarkable low- temperature heat-capacity behaviour of this compound compared to BaZrOg.
Figure 4.9 (curve C) shows the extrapolated enthalpy increment function based on the present measurements, indicating a significant lower heat capacity at 298.15 K than observed by King and Weller. Extrapolation of this function to above 906.5 K is not recommended. Due to the high boundary condition for the heat capacity at room temperature the curvature of the function is too small and, consequently, the enthalpy-increment above 906.5 K becomes too large. Since all other high-temperature enthalpy increment measurements on strontium zirconate have been performed on non- cubic structures, the temperature function for the cubic phase above 906.5 is unknown. However, based on structural similarity with barium zirconate the following function has been calculated for the temperature range above 906.5 K:
(H°(T)-H°(298.15 KJI/J-mol1 = 147.4092fT/K) - 7.541551 10"7fT/K)2+ 1.242432 107(T/K)"1 - 74060.3
BaZr03(s): Unlike SrZr03(s), more agreement exists on the high- temperature functions of BaZrOg(s). Four series of measurements are available (Fig. 4.10): Gospodinov and Marchev [Gos 93], Fomichev et aL [Fom 73], Nagarajan et aL (Nag 85], and Cordfunke and Konings [Cor 89]. In addition to the results of the latter authors, some measurements at higher temperatures have been performed (Table A4.12). Again, the measurements of Gospodinov are disregarded. Fomichev et aL found two phase transitions. High-temperature crystallographic measurements by Mathews et aL (Mat 91] revealed, however, no phase transitions. The measurements by Nagarajan et aL are practically over the entire temperature region lower than our extrapolated high-temperature enthalpy increment function, the differences with the function derived in the present study being 2-3.5 %. In a subsequent discussion, Nagarajan [Nag 91] pointed out that
-59-
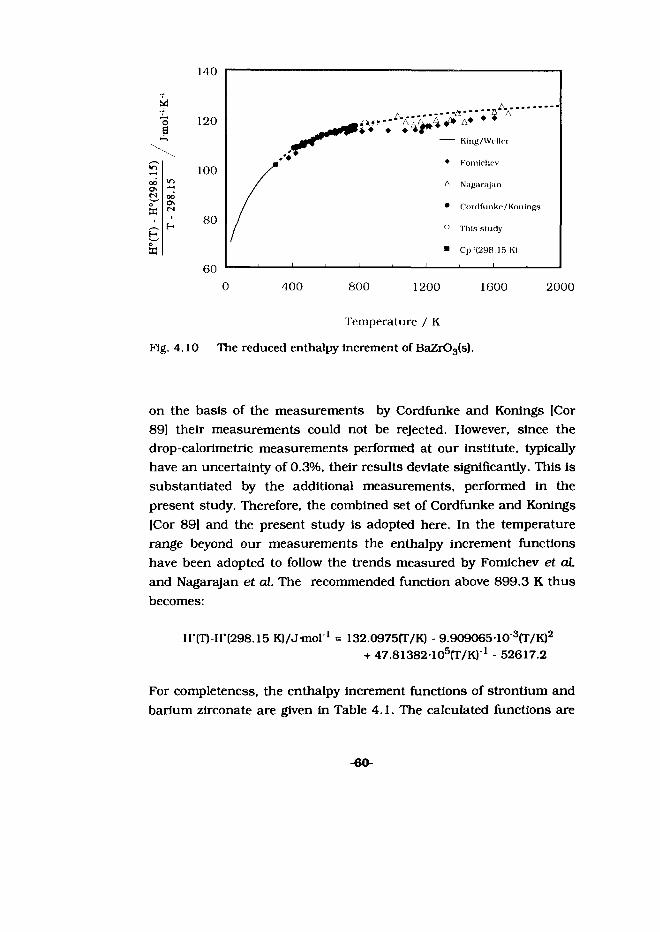
140
bd120
100
80
60
. ........................A* ♦ *♦ + if*
------ King/Wrller
♦ Fomichev
A Nagarajan
/ • Cordfunke/Konings
j ° Tills study
_______ _________i________
■ Cp”(298.15 K|
________1 i________ 1________ i________ ' ________
0 400 800 1200 1600 2000
Temperature / K
Fig. 4.10 The reduced enthalpy Increment of BaZr03(s).
on the basis of the measurements by Cordfunke and Konings [Cor 89] their measurements could not be rejected. However, since the drop-calorimetric measurements performed at our institute, typically have an uncertainty of 0.3%, their results deviate significantly. This is substantiated by the additional measurements, performed in the present study. Therefore, the combined set of Cordfunke and Konings [Cor 89] and the present study is adopted here. In the temperature range beyond our measurements the enthalpy increment functions have been adopted to follow the trends measured by Fomichev et aL and Nagarajan et aL The recommended function above 899.3 K thus becomes:
H'(T)-H*(298.15 K)/J mol 1 = 132.0975fT/K) - 9.90906510"3(T/K)2+ 47.81382 105(T/K)'1 - 52617.2
For completeness, the enthalpy increment functions of strontium and barium zirconate are given in Table 4.1. The calculated functions are
-60-

Table 4.1. The recommended high -temperature enthalpy-increment coefficients for AZr03(s) where A = Sr, Ba In the temperature range 298.15 to 2000 K.
compound Temperature region coefficientsT/K H'tT) - H'(298.15 KVkJmol*1 = AT + BT8 + CT1 + D
A B C D
SrZr03 298.15 - 906.5 105.7740 1.530911-10"2 10.19858-10^ -36318.0906.5 -2000.0 147.4092 -7.541551 10 7 12.42432-106 -74060.3
BaZrOa 298.15 - 899.3 121.7139 3.847778-10 2 19.82171-105 -43279.3899.3 - 2000.0 132.0975 -9.909065-10 2 47.81382-105 -52617.2
continuous monotone In both enthalpy Increment and Cp, and can be extrapolated beyond the temperature limit given, If necessary. The smoothed high-temperature thermodynamic quantities of SrZr03 and BaZr03 are listed in Table A4.14. They have been calculated using the values for the enthalpies of formation of SrZr03 and BaZr03 determined in Chapter 5 of this thesis.
4.7 ZrS104(s)
For the drop-calorimetrical measurements 5.18764 g of ZrS104 was enclosed in a quartz capsule of 1.67942 g. The results of the measurements are presented in Table A4.13. As can be seen in Fig. 4.11 there is a smooth fit with the recalculated low-temperature heat- capacity measurements of Kelley [Kel 411. Using the calculated C° (298.15 K) and H°(T)-H°(298.15 K) = 0 as a boundary condition the following enthalpy increment function is found for the temperature region from 298.15 to 888.8 K:
(H°(T)-H°(298.15 K)}/Jmol 1 = 53.49998CT/K) + 105.189710 3(T/K)2- 4.100570-10 5(T/K)3 + 6.230696 103(T/K) l - 26304.7
The standard deviation of the fit in the temperature region given is 88
-61-

Id
8
HX
h
----- Kelley
Coughlin
v Victor
• ECN
1200 1600 2000
Temperature / K
Fig. 4.11 The reduced enthalpy-increment functions of Kelley [Kel 41], Coughlin and King [Cou 50], Victor and Douglas [Vic 60], Neel and Pears [Nee 62], and the present study. The recommended enthalpy-increment function is shown as the dashed line.
J-mol"1. Extrapolation of the function is not recommended because of the T^-term.
DiscussionThe low-temperature heat-capacity has been measured by Kelley [Kel 41] from 52.7 to 294.8 K on a sample of natural origin [Zircon sands, Lincoln, CA, U.S.A.]. From these measurements the heat capacity in the low-temperature region from 0 to 52 K has been estimated by fitting all the data to a set of Debye and Einstein functions. The entropy has been derived by integration over the two regions yielding: S°(52.7 K) - S°(0 K) = (2.47 ± 0.20) J-mol'1-K'1 and S°(298.15 K) - S°(52.7 K) = (81.29 ± 0.15) J-mol'1*1. Consequently, for the heat capacity and entropy at room temperature it has been found:
-62-

C°(298.15 K) = (98.28 ± 0.30) J-mol"1 K1S°(298.15 K) = (83.76 ± 0.25) Jmol1 K 1
Enthalpy Increments have been measured by Coughlin and King [Cou 50], Victor and Douglas [Vic 60], and Neel and Pears [Nee 62]. The measurements by Coughlin and King have been performed on a sample from the same natural origin as the sample used by Kelley; It contained about 1.15 mass per cent Hf. The results obtained were corrected for this amount of hafnium assuming a similar molar heat capacity for HfSi04 as for ZrS104. Victor and Douglas performed their measurements on a sample containing an unknown amount of Hf between 1 or 10 mass per cent. The enthalpy-increment measurements by Neel and Pears show a large deviation from the other measurements. Since no smooth fit to the low-temperature measurements by Kelley can be obtained, they have been omitted in this assessment. The ECN-measurements perfectly coincide with those of Coughlin and King and are therefore both selected (Fig 4.11). They can be represented, in the temperature range from 298.15 to 1100 K, by:
(H°(T)-H°(298.15 K)/J-mol"1 = 93.0405(T/K) + 51.1414-10"3fT/K)2- 15.0301-10'5rr/K)3+ 18.8880-103(T/K) 1 - 38222.9
and above 1100 K by :
(H°(T)-H°(298.15 KJ/Jmol"1 = 152.361(T/K) + 35.4467•105(T/K)"1- 63104.0
Using these set of equations and the assessed enthalpy of formation [Chapters 8 and 9], the thermodynamic functions of ZrS104(s) have been derived (Table A4.13)
4.8 BaS103(s)
For the drop-calorimetric measurements 4.69009 g of BaS103 was enclosed in a quartz capsule of 4.43037 g [Hun]. The results of the
-63-

130
Temperature / K
Fig. 4.12 The reduced enthalpy-increment function of BaS103(s) from 0 to 1000 K.
measurements are presented In Table A4.14. As can be seen in Fig. 4.12 there Is a smooth fit with the recalculated low-temperature heat- capacity measurements of Weller and Kelley (Wei 64|. Using the calculated C°(298.15 K) and H°(T)-H°(298.15 K) = 0 as a boundary condition the following enthalpy increment function is found in the temperature region 298.15 to 904.3 K:
(H°(T)-H°(298.15 KH/Jmol1 = 103.4214(T/K) + 14.248610"3fT/K)2+ 19.7235105(T/K)'1 - 38717.0
The standard deviation of the fit in the temperature region given is 106 J-mol"1. Slightly better fit results could have been obtained using an additional T^-term. This is, however, not recommended since that function cannot be extrapolated beyond the temperature region in which measurements have been performed.
-64-

DiscussionThe low-temperature heat capacity of BaS103 has been measured by Weller and Kelley [Wei 64] from 52.7 to 294.8 K. From these measurements the heat capacity in the low-temperature region from 0 to 52 K has been estimated by fitting all the data to a set of Debye and Einstein functions. The entropy has been derived by integration over the two regions yielding: S°(52.7 K) - S°(0 K) = (12.99 ± 0.65) Jrnol^K"1 and S°(298.15 K) - S°(52.7 K) = (96.61 ± 0.29) J mol ^K"1. Consequently, for the heat capacity and entropy at room temperature there has been found:
C°(298.15 K) = (89.73 ± 0.50) J-mol '-K1S°(298.15 K) = (109.60 ± 0.71) Jmol^K 1
High-temperature enthalpy increments have not been measured before, only an estimate quoted in Barin and Knacke [Bar 73], exists (Fig 4.12). Using the enthalpy-increment equation and the standard molar enthalpy of formation [Chapter 5], the thermodynamic functions of BaSi03(s) have been calculated up to 1000 K (Table 4.15).
NEXT PAOE(S) left BLANK
-65*
5. Solution Calorimetric Measurements
Parts of this Chapter have been published previously as:
M.E. Huntelaar, E.H.P. Cordfunke, W. Ouweltjes (1992), The standard molar enthalpies of formation of SrS103 and Sr2Si04, J. Chem. Thermodynamics 24, 139.
M.E. Huntelaar, E.H.P. Cordfunke, W. Ouweltjes (1992), The standard molar enthalpies of formation of BaSi03 and Ba2Si04, J. Chem. Thermodynamics 25, 1099.
M.E. Huntelaar, E.H.P. Cordfunke, W. Ouweltjes (1993), The standard molar enthalpies of formation of SrZrSi207 and Sr6ZrSi5018, J. Chem. Thermodynamics 25, 1211.
M.E. Huntelaar, E.H.P. Cordfunke, AS. Bool) (1994), The standard molar enthalpies of formation of BaZr03(s) and SrZr03(s), J. Chem. Thermodynamics 26, 1095.
-67-NEXT PAOEIS)
loft BLANK
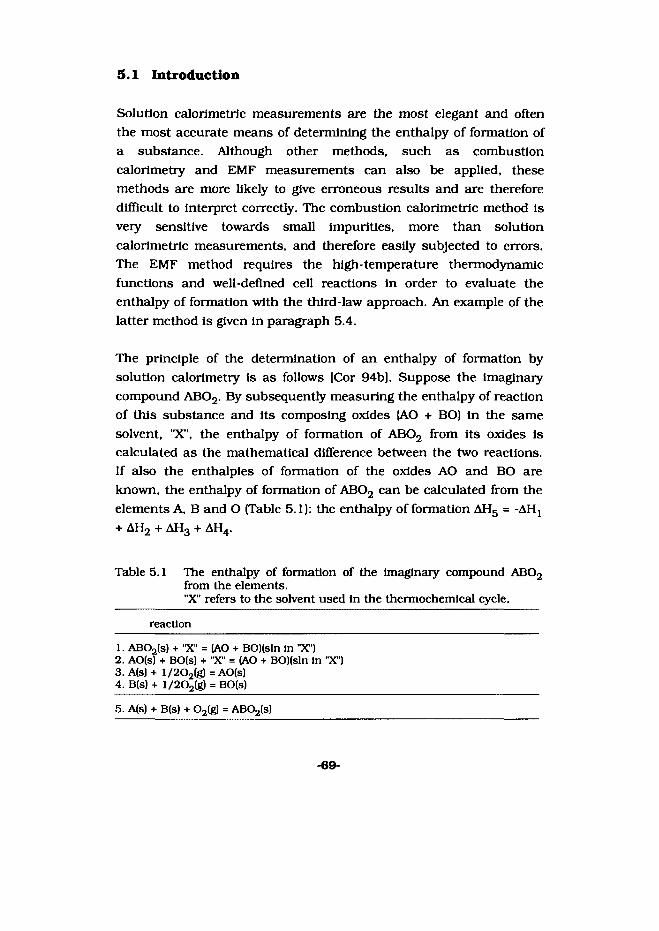
5.1 Introduction
Solution calorimetric measurements are the most elegant and often the most accurate means of determining the enthalpy of formation of a substance. Although other methods, such as combustion calorimetry and EMF measurements can also be applied, these methods are more likely to give erroneous results and are therefore difficult to interpret correctly. The combustion calorimetric method is veiy sensitive towards small impurities, more than solution calorimetric measurements, and therefore easily subjected to errors. The EMF method requires the high-temperature thermodynamic functions and well-defined cell reactions In order to evaluate the enthalpy of formation with the third-law approach. An example of the latter method is given in paragraph 5.4.
The principle of the determination of an enthalpy of formation by solution calorimetry is as follows [Cor 94b]. Suppose the imaginary compound AB02. By subsequently measuring the enthalpy of reaction of this substance and its composing oxides (AO + BO} in the same solvent, "X", the enthalpy of formation of AB02 from its oxides is calculated as the mathematical difference between the two reactions. If also the enthalpies of formation of the oxides AO and BO are known, the enthalpy of formation of ABOa can be calculated from the elements A, B and O (Table 5.1): the enthalpy of formation AH5 = -AH1 + AH2 + AHg + AH4.
Table 5.1 The enthalpy of formation of the imaginary compound ABOa from the elements."X" refers to the solvent used in the thermochemical cycle,
reaction
1. ABQ2(s) + "X" = (AO + BOMsln in "X")2. AO(s) + BO(s) + "X' = (AO + BO)(sln in X")3. A(s) + l/202(g) = AO(s)4. B(s) + l/202(g) = BO(s)
5. A(s) + B(s) + 02(g) = AB02(s)
-69-

The enthalpies of reaction mentioned above, are not measured directly, but indirectly as a temperature rise. After calibration of a comparable temperature rise, under similar conditions, with an exactly known amount of energy, the enthalpies of formation can be calculated, as explained below.
5.2 Experimental
The solution-calorimetric measurements have been performed in an isoperibol-type calorimeter, developed at ECN [Cor 64, Cor 751. Two types of calorimeters are available: one consisting of a glass Dewar vessel and another with a Teflon inlay for use with more agressive solvents, such as hydrogen fluoric acid. The Dewar is placed in a 10 dm3 water bath (inner bath) which is kept at the constant
Fig. 5.1 A schematic drawing of the solution calorimeter.
-70“
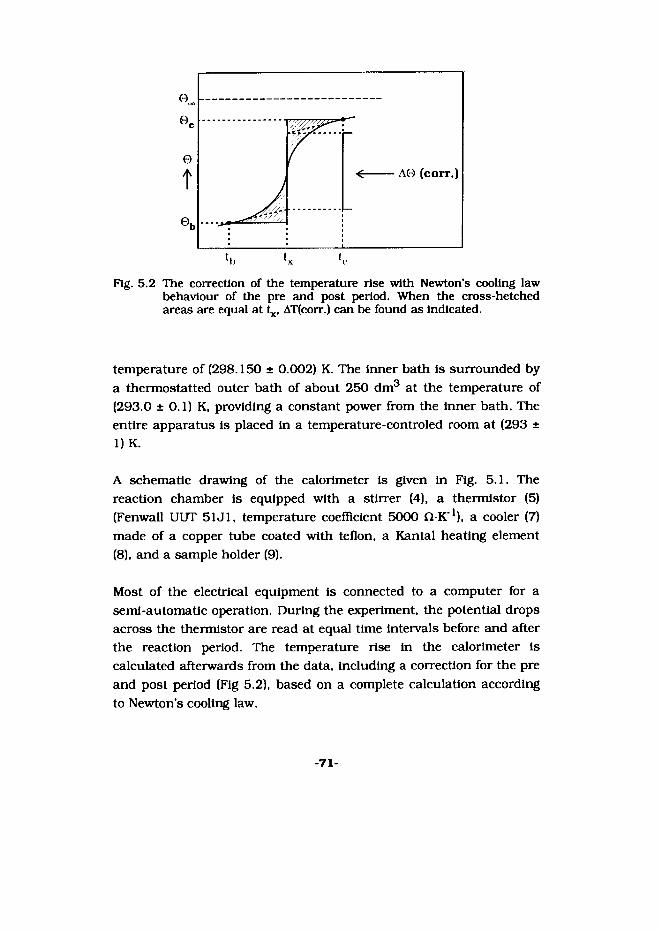
A0 (corr.)
Fig. 5.2 The correction of the temperature rise with Newton’s cooling law behaviour of the pre and post period. When the cross-hetched areas are equal at tx. ATfcorr.) can be found as indicated.
temperature of (298.150 ± 0.002) K. The Inner bath Is surrounded by a thermostatted outer bath of about 250 dm3 at the temperature of (293.0 ± 0.1) K, providing a constant power from the inner bath. The entire apparatus is placed in a temperature-controled room at (293 ± 1) K.
A schematic drawing of the calorimeter is given in Fig. 5.1. The reaction chamber is equipped with a stirrer (4), a thermistor (5) (Fenwall UUT 51 Jl, temperature coefficient 5000 Q-K'1), a cooler (7) made of a copper tube coated with teflon, a Kantal heating element (8), and a sample holder (9).
Most of the electrical equipment is connected to a computer for a semi-automatic operation. During the experiment, the potential drops across the thermistor are read at equal time intervals before and after the reaction period. The temperature rise in the calorimeter is calculated afterwards from the data, including a correction for the pre and post period (Fig 5.2), based on a complete calculation according to Newton's cooling law.
-71-

After each experiment a calibration Is performed to obtain the energy equivalent of the calorimeter. To this purpose a current Is passed through a standard resistor (1.000 £2) and the heating wire In series across which the potential drops are measured as described above. For each experiment, the sample holder Is loaded In an argon-filled glove box with an accurately known amount of solute. After the calorimeter Is placed In the Inner bath and the pre period has been recorded, after a reasonable equilibration time (two hours), the reaction period Is started by pushing the teflon bottom out of the sample holder.
The results of the enthalpy-of-solution measurements are given In the Tables A5.1 through A5.9 (Appendices), where m denotes the mass of the sample dissolved, e the energy equivalent of the calorimeter, A0 the temperature range where 6 is an arbitrary temperature, and AslnH° the molar enthalpy of solution. All masses are corrected for buoyancy in argon.
5.3 Auxiliary values and solvents
In the thermochemical cycles In the next paragraphs use has been made of several auxiliary thermodynamic values. Most of these values have been taken from the literature, whereas the enthalpies of formation of the amorphous products had to be determined. In Table 5.2 a list of all auxiliary values is presented.
The type of solvent used in the thermochemical cycles is very important. Since the energy efects are only relative towards the same final situation, the same solvent has to be used for all the reactions. A different solvent will have a different energy effect. Likewise, precipitates cannot be allowed to be formed since precipitation reactions are not fully defined. For instance, in the determination of the standard molar enthalpies of formation of the barium and
-72-
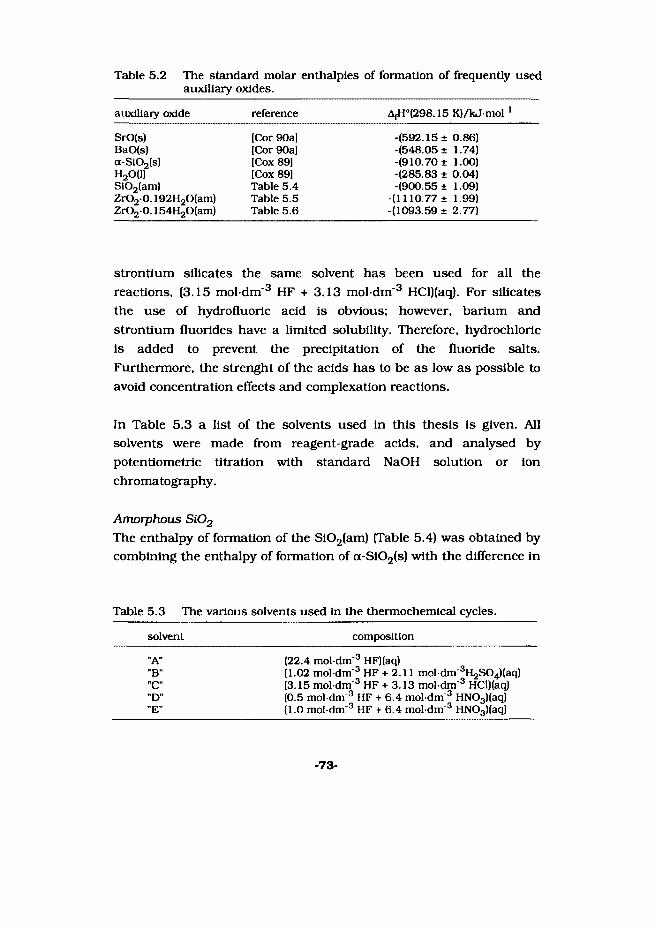
Table 5.2 The standard molar enthalpies of formation of frequently used auxiliary oxides.
auxiliary oxide reference AfH°(298.15 K)/kJ mol"'
SrO(s) (Cor 90a] -(592.15+ 0.86)BaO(s) [Cor 90a] -(548.05 ± 1.74)a-Si02(s) [Cox 89] -(910.70 ± 1.00)H20(1) [Cox 89] -(285.83 ± 0.04)Si02(am) Table 5.4 (900.55 + 1.09)ZrO2-0.192H20(am) Table 5.5 (1110.77 ± 1.99)ZrO2-0.154H20(am) Table 5.6 -(1093.59 ± 2.77)
strontium silicates the same solvent has been used for all the reactions, (3.15 moldm'3 HF + 3.13 mol dm"3 HCl)(aq). For silicates the use of hydrofluoric acid is obvious; however, barium and strontium fluorides have a limited solubility. Therefore, hydrochloric is added to prevent the precipitation of the fluoride salts. Furthermore, the strenght of the acids has to be as low as possible to avoid concentration effects and complexation reactions.
In Table 5.3 a list of the solvents used in this thesis is given. All solvents were made from reagent-grade acids, and analysed by potentiometric titration with standard NaOH solution or ion chromatography.
Amorphous Si02The enthalpy of formation of the Si02(am) (Table 5.4) was obtained by combining the enthalpy of formation of a-Si02(s) with the difference in
Table 5.3 The various solvents used in the thermochemical cycles.
solvent composition
"A" (22.4 mol dm"3 HF)(aq)"B" (1.02 mol dm 3 HF + 2.11 mol dm"3H2S04)(aq)"C" (3.15 mol dm 3 HF + 3.13 mol dm 3 HCl)(aq)"D" (0.5 mol dm 3 HF + 6.4 mol dm 3 HN03)(aq)*'E" (1.0 mol dm 3 HF + 6.4 mol dm"3 HN03)(aq)
-73-

Table 5.4 Reaction scheme for the standard molar enthalpy of the formation of amorphous S102 at 298.15 K.AH4 = -AH j + AH2 + AH3
reaction A^HVOcJmoV1)
1. Si02(am) + 6HF(sln in "A") = (H2SIF6 + 2H20)(sln in "A")2. a-S102(s) + 6HF(sln in "A") = (H2S1F6 + 2H20)(sln In "A")3. Si(s) + 02(g) = a-S102(s)
-149.68 ± 0.36 -139.53+0.26 -910.70 ± 1.00
4. Si(s) + 02(g) = Si02(am) -900.55 ± 1.09
Table 5.5 Reaction scheme for the standard molar enthalpy of formation of ZrO2 0.192H20(am) at 298.15 K.AHg = - AHj + AH2 + AH3 + AH4
Reaction A^HVfcJ-mol"1)
1. ZrO20.192H20(am) + 4HF(sln in "B") =(ZrF4 + 2.192H2OMsln in "B")
2. Zr(s) + 4HF(sln in "B") = ZrF4(sln in "B") + 2H2(g)3. 2.192Ha(g) + 1.096O2(g) = 2.192H20(1)4. 2.192H20(1) + "B" = 2.192H20(sln in "B")
-175.28 ±0.30 -659.17 ±0.95 -626.54 ± 1.72*
-0.34 ± 0.05
5. Zr(s) + 0.192H2(g) + 1.096O2(g) = ZrO20.192H2O(am) -1110.77 ± 1.99
(•) Corrected for the uncertainty In the water content of ZrO20.192HgO(am)
Table 5.6 Reaction scheme for the standard molar enthalpy of formation of ZrO2 0.154H2O(am) at the temperature 298.15 K.AH5 = - AH1 + AH2 + AH3 + AH4
Reaction A^HVOtJ-mol1)
1. Zr02-0.154H20(am) + 4HF(sln in "B") =(ZrF4 + 2.154HaO)(sln in "B")
2. Zr(s) + 4HF(sln In ”B") = ZrF4(sln in "B") + 2H2(g)3. 2.154112(g) + 1.077O2(g) = 2.154H20(1)4. 2.154H2O0) + "B" = 2.154H20(sln in "B")
-181.59 ±2.18 -659.17 ±0.95 -615.68 ± 1.43*
-0.33 ± 0.05
5. Zr(s) + 0.154H2(g) + 1.077O2(g) = ZrO2 0.154H2O(am) -1093.59 ±2.77
(•) Corrected for the uncertainty In the water content of ZrO2 0.154H2C(am)
74-

the enthalpies of solution of a-Si02(s), -(139.53 ± 0.27) kJ-mol"1, and Si02(am), -(149.68 ± 0.36) kJ-moT1, in 22.5 moldin'3 HF (Table A5.1), to obtain: AjH° (298.15 K) = (900.55 ± 1.09) kJ-mol"1.
Amorphous ZrOzThe standard molar enthalpy of formation of ZrO2 0.192H2O(am) was derived according to the thermochemical cycle in Table 5.5. No HN03- containing solvent could be used since the presence of HNOa would give rise to a chemically undefined reaction with zirconium metal, due to the formation of NOx(g). The presence of another strong acid besides HF was, however, necessary to avoid a sluggish post period in the calorimeter due to complexation. Therefore, solvent "B" was applied.
The measured enthalpy of solution of ZrO2 0.192H20(am) is, after correction for the uncertainty of the water content of the sample, -(175.28 ± 0.30) kJ-mol'1 (Table A5.2). The enthalpy of solution of Zr(s), (657.49 ± 0.77) kJ-mol"1 (Table A5.2), has to be corrected for the evaporation of water, since H2(g) is evolving from the solution. The vapour pressure of water above the solvent was measured manometrically to be 2.57 kPa. If we assume a saturation percentage of (75 ± 25), a correction of (1.68 ± 0.56) kJ-mol"1 must be applied yielding for the molar enthalpy of solution of Zr(s): (659.17 ± 0.95) kJ-mol'1. Combining these results with the standard molar enthalpy of formation of H20(1) and the experimentally determined enthalpy of solution of H20(1) in solvent "B", (0.155 ± 0.022) kJ-mol"1, thestandard molar enthalpy of formation of Zr02 0.192H2O(am), AfH°(298.15 K) = (1110.77 ± 1.99) kJ-mol'1, is obtained. Theuncertainty in the water content of Zr02 (0.192 ± 0.006)H20(am) has been incorporated in the enthalpy of formation of water in Table 5.5, as a result of which the uncertainty in the latter value increases from 0.04 to 0.78 kJ mol1.
Similarly, the standard molar enthalpy of formation of Zr02 0.154H20(am) was derived according to the thermochemical cycle in Table 5.6. The enthalpies-of-solution are listed in Table A5.3.
-75-

5.4 Strontium silicates
Unlike many other silicates, those of strontium are of less geothermal Interest and, consequently, the thermodynamic properties of the strontium silicates are poorly known. Discrepancies In the literature regarding the standard molar enthalpies of formation of SrSl03 and Sr2S104 amount to about 50 and 75 kJ-mol"1, respectively.
cr-SrSi03(s)The thermochemical cycle from which the enthalpy of formation of cr- SrS103(s) has been derived, Is given in Table 5.7. The molar enthalpy of solution of cr-SrS103(s) in solvent "C", -(262.46 ± 0.47) kJ-mol"1 (Table A5.4), was combined with the molar enthalpy of solution of the stoichiometric mixture of the oxides SrO(s) and S102(am), -(405.10 ± 1.05) kJ-mol"1, in the same solvent, and with the enthalpies of formation of SrO(s) and Si02(am), to give the standard enthalpy of formation of cr-SrS103(s): AfH°(298.15 K) = -(1635.3 + 1.8) kJ-mol"1.
The components of the combined samples (SrO + S102(am)) were not weighed in the exact ratios, and the molar enthalpies of solution at the mole ratio (r) = n(Sr0)/n(Si02) =1.0 and 2.0 were calculated from the values listed in Table A5.4 by means of the least squares, a linear dependence of AH on r being assumed.
Table 5.7 Reaction scheme for the enthalpy of the formation of SrS103(s). AH5 = -AHj + AH2 + AH3 + AH4reaction A^HVOUmol"1)
1. SrSiCUs) + (2HC1 + 6HF)(sln In "C") =(H2S1F6 + SrCU + 3H,0)(sln In "C") -262.46 ± 0.47
2. SrO(s) + SiOo(am) + (2HC1 + 6HF)(sln In "C") =(H2S1F6 + SrClg + 3H2OJ(sIn In "C") -405.10 ± 1.05
3. Sr(s) + (l/2)02(g) = SrO(s) -592.15 ± 0.864. Sl(s) + 02(g) = S102(am) -900.55 ± 1.09
5. Sr(s) + Sl(s) + (3/2)02(g) = SrSIOa(s) -1635.34 ± 1.80
-76-

Table 5.8 Reaction scheme for the enthalpy of the formation of Sr2Si04(s). AHg = -AHj + AH 2 + AHg + AH4
reaction AslnHV(kJmoT1)
1. Sr2Si04(s) + (6HF + 4HCl)(sln in "C") =(H2SiF6 + 2SrCl2 + 4H20)(sln in "C")
2. 2SrO(s) + S102(am) + (6HF + 4HCI)(sln in "C”) =(H2SiF6 + 2SrCl2 + 4H20)(sln In "C")
3. 2Sr(s) + 02(g) = 2SrO(s)4. Sl(sj + 02(g) = Si02(am)
-438.88 ± 0.48
-659.72 ± 0.77 -1184.30 ± 1.72 -900.55 ± 1.09
5. 2Sr(s) + Sl(s) + 2Q2(g) = Sr2Si04(s) -2305.69 ± 2.23
Sr2Si04(s)The thermochemical cycle from which the enthalpy of formation of Sr2Sl04(s) has been derived, is given in Table 5.8. The molar enthalpy of solution of Sr2Si04(s) In solvent "C", -(438.88 ± 0.48) kJ mol'1 [Table ASA), was combined with the molar enthalpy of solution of the stoichiometric mixture of SrO(s) and Si02(am) in the same solvent, as described for cr-SrSi03(s), -(659.72 ± 0.77) kJ-mol"1. Combining this with the enthalpies of formation of SrO(s) and S102(am) finally results in the enthalpy of formation of Sr2Sl04(s): AfH°(298.15 K) = -(2305.7 ± 2.2) kJmol"1.
DiscussionSeveral authors have measured the standard molar enthalpies of formation of cr-SrS103(s) and Sr2Si04(s) with varying results (Table 5.9). The measurements performed by Nacken [Nac 30) were based on chemically undefined materials. Rog et al. [Rog 74] measured the Gibbs energies of formation of cr-SrS103(s) and Sr2Si04(s) by EMF measurements. From their results the standard molar enthalpies of formation have been recalculated with a third-law calculation using the enthalpy increment data obtained in this thesis. Nevertheless, the results from this study deviate considerably from the results obtained in this thesis. This may be caused by secundaiy electrode reactions in their electrochemical cycle, since the formation of SrZrSi207(s) can
-77-

Table 5.9 The standard molar enthalpies of formation of cr-SrS103(s) and Sr2S104(s).
Authors Method" AJl°(298.15K)/(kJ mol ')SrS103(s) Sr2S104(s)
Nacken |Nac 301 S -1596.7 ± 3.8 -2223.6 ± 5.0Rog et al. [Rog 751 E -1579.9 ± 1.5 -2216.7 ± 3.7Barany et aL |Bar 57| S -1633.6 ± 1.4 -2304.4 ± 2.2this study S -1635.3 ±1.8 -2305.7 ± 2.2
" S = solution calorimetry, E = electromotive force measurements
not be ruled out; the authors were not aware of the existence of this compound. Barany et al. [Bar 57) measured the enthalpies of solution of cr-SrS103(s) and Sr2Sl04(s) in concentrated HF at 346.9 K. The absence of a fore period and the presence of a precipitate of SrF2(s) make these measurements uncertain. The results of the present study, nevertheless, appear to be in good agreement with Barany’s measurements.
SrSi03(am) and meta-SrSi03(s)The standard molar enthalpies of formation of amorphous SrSi03 and 8-SrSi03 have not been measured previously. They have been derived using a similar thermochemical cycle as used in Table 5.7. Since use has been made of the same solvent, "C", the formation properties can be calculated using the enthalpies of solution of the auxiliary oxides already determined in the previous measurements (Table ASA).
Table 5.10 Enthalpies of solution and the standard molar enthalpies of formation of amorphous SrS103 and 8-SrSi03.
Sample A^HVfkJmor1) AfH°(298.15 K)/(kJ mor')
SrSi03(am) -(296.40 ±0.34) (1601.40 ± 1.77)S-SrSi03(s) -(275.95 ± 0.29) (1621.89 ± 1.76)
-78-

The molar enthalpies of solution of SrS103(am) and meta-SrSl03(s) In solvent "C", -(275.952 ± 0.285) kJ mol1 and -(296.398 ± 0.336) kJ-mol1, respectively, are given In the Tables 5.10 and A5.5. Using the results from Table A5.4 the standard molar enthalpies of formation of SrS103(am) and meta-SrS103(s) were calculated to be AfH°(298.15 K) = (1640.4 ± 1.8) kJ mol1 and AfH°(298.15 K) = -(1621.9 ± 1.8) kJ mol1, respectively.
5.5 Barium silicates
The thermodynamic properties of the barium silicates are, like the corresponding strontium silicates, poorly known. Discrepancies in the literature regarding the standard molar enthalpies of formation of BaS103(s) and Ba2S104(s) amount to no less than 84 kJ mol1 and 174 kJ mol1, respectively [Nac 30, Bar 57],
BaSi03(s)The thermochemical cycle from which the standard molar enthalpy of formation of BaSi03(s) has been derived, is given in Table 5.11. The molar enthalpy of solution of BaSi03(s) in solvent "C", (276.16 ± 0.78) kJ mol 1 (Table A5.6), was combined with the molar enthalpy of solution of a stoichiometric mixture of BaO(s) and amorphous Si02(s),
Table 5.11 Reaction scheme for the standard molar enthalpy of the formation of BaSi03(s) at 298.15 K.AHg = -AHj + AH 2 + AH3 + AH4Reaction A^HVtkJmol"1)
1. BaSi03(s) + (2HC1 + 6HF)(sln In "C") =(H2S1F6 + BaCl2 + 3HaO)(sln In "C") -276.16 ±0.78
2. BaO + SI02(am) + (2HC1 + 6HF)(sln in "C”) =(H2SIF6 + BaCl2 + SHgOKsIn In "C") -433.95 ± 1.39
3. Ba(s) + (l/2)02(g) = BaO(s) -548.05 ± 1.744. Si(s) + 02(g) = S102(am) -900.55 ± 1.09
5. Ba(s) + SICs) + (3/2)02(g) = BaS103(s) -1606.39 ±2.60
-79-
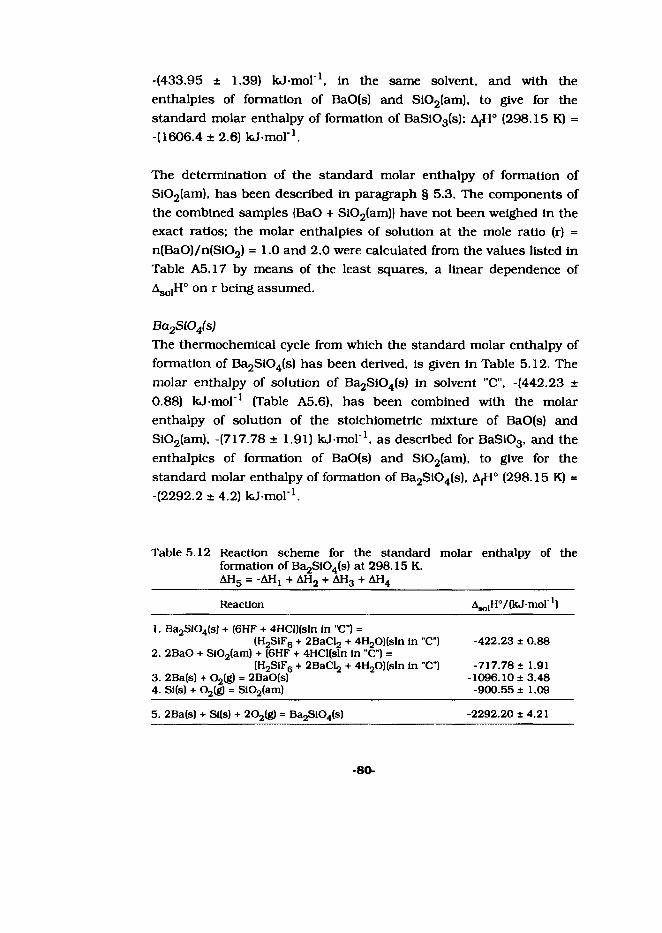
-(433.95 ± 1.39) kJ mol'1, In the same solvent, and with the enthalpies of formation of BaO(s) and Si02(am), to give for the standard molar enthalpy of formation of BaS103(s): A[H° (298.15 K) = (1606.4 ± 2.6) kJ mol'1.
The determination of the standard molar enthalpy of formation of Si02(am), has been described in paragraph § 5.3. The components of the combined samples (BaO + Si02(am)| have not been weighed in the exact ratios; the molar enthalpies of solution at the mole ratio (r) = n(Ba0)/n(Si02) = 1.0 and 2.0 were calculated from the values listed in Table A5.17 by means of the least squares, a linear dependence of AsolH° on r being assumed.
Ba.2Si04(s)The thermochemical cycle from which the standard molar enthalpy of formation of Ba2Si04(s) has been derived, is given in Table 5.12. The molar enthalpy of solution of Ba2Si04(s) in solvent "C", (442.23 ± 0.88) kJ mol 1 (Table A5.6), has been combined with the molar enthalpy of solution of the stoichiometric mixture of BaO(s) and Si02(am), -(717.78 ± 1.91) kJ mol'1, as described for BaSi03, and the enthalpies of formation of BaO(s) and Si02(am), to give for the standard molar enthalpy of formation of Ba2Si04(s), AjH° (298.15 K) = (2292.2 ± 4.2) kJmol'1.
Table 5.12 Reaction scheme for the standard molar enthalpy of theformation of BagSlO^s) at 298.15 K.AHg = -AHj + AH2 + AH3 + AH4
Reaction AaolH<’/(kJmol"1)
1. Ba^SIO^s) + (6HF + 4HCl)(sln In "C") =(H2SiFg + 2BaCl2 + 4H20)(sln In "C")
2. 2BaO + SI02(am) + (6HF + 4HCl(sln In "C") =(H2SIF6 + 2BaCl2 + 4H20)(sln in "C")
3. 2Ba(s) + 02(g) = 2BaO(s)4. Si(s) + 02(g) = SI02(am)
-422.23 ± 0.88
-717.78 ± 1.91 -1096.10 ± 3.48
-900.55 * 1.09
5. 2Ba(s) + Sl(s) + 202(g) = Ba2SI04(s) -2292.20 * 4.21
-80-
Table 5.13 The standard molar enthalpies of formation of BaSi03(s) and Ba2SK)4(s) at 298.15 K.
Authors Method* AfH°(298.15 K)/(kJ mor')BaSi03(s) BagSIO^s)
Nacken [Nac 30| S -1534.0 ±10.4 -2102.8 ±23.5Barany et aL [Bar 57| S -1617.8 ± 2.4 -2276.5 ± 4.3this thesis S -1606.4 + 2.6 -2292.2 ± 4.2
* S = solution calorimetry
DiscussionThe standard molar enthalpies of formation of BaS103(s) and Ba2S104(s) have been measured by several authors (Table 5.13). The measurements performed by Nacken [Nac 30) were based on chemically undefined materials. Barany et al. [Bar 57) measured the enthalpies of solution of BaSi03(s) and Ba2Si04(s) in concentrated HF at 346.9 K. The absence of a fore period and the presence of a precipitate of BaF2(s) due to the high fluoride concentration, make the results of these measurements doubtful. The relatively low solubility of BaF2 is a serious problem in the determination of the enthalpy of formation of the barium silicates in this way. In the present study care has been taken to avoid these problems by using a diluted HC1 + HF solution and by taking low sample concentrations.
5.6 Metazlrconates of barium and strontium
During fission of U02 many fission products are formed which, depending on temperature, will dissolve in the nuclear fuel. Post- irradiation studies on nuclear fuel have indicated the formation of the perovskite-type solid solution (Ba,Sr)(Zr,Pu,U)03: the so-called grey phase [Kle 85, Me 88). Although for a good understanding of the chemical behaviour of this phase its thermophysical properties are needed, these have never been investigated thoroughly. For instance, recent investigations by Cordfunke and IJdo [Cor 94c] revealed that
-81-
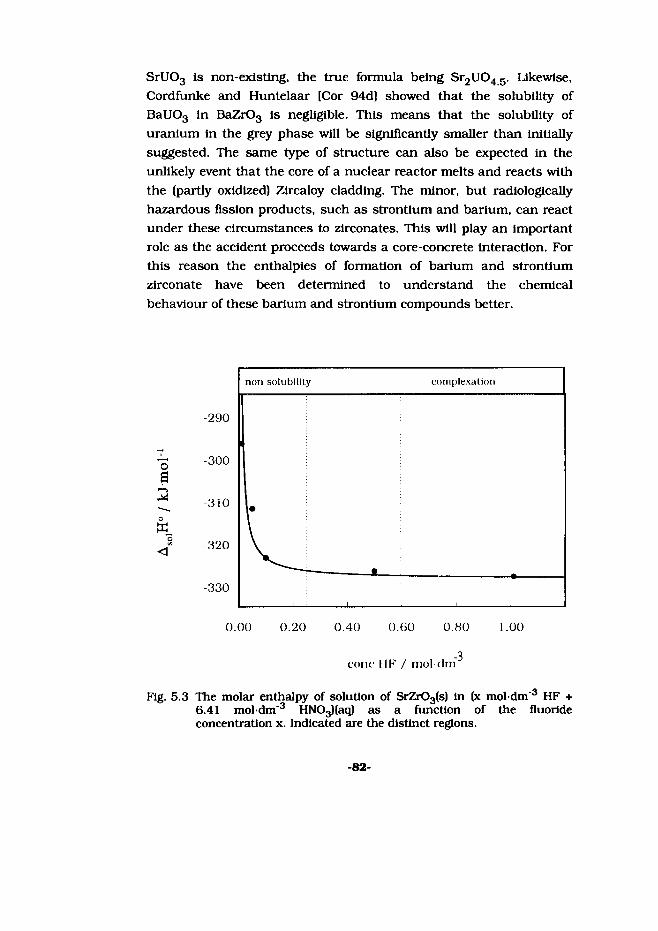
SrU03 is non-existing, the true formula being Sr2U04 5. Likewise, Cordfunke and Huntelaar [Cor 94d) showed that the solubility of BaUOg in BaZr03 is negligible. This means that the solubility of uranium in the grey phase will be significantly smaller than initially suggested. The same type of structure can also be expected in the unlikely event that the core of a nuclear reactor melts and reacts with the (partly oxidized) Zircaloy cladding. The minor, but radiologically hazardous fission products, such as strontium and barium, can react under these circumstances to zirconates. This will play an important role as the accident proceeds towards a core-concrete interaction. For this reason the enthalpies of formation of barium and strontium zirconate have been determined to understand the chemical behaviour of these barium and strontium compounds better.
non solubility complexation
-290
-300
-320
0.800.00
cone I IF / mol dm-3
Fig. 5.3 The molar enthalpy of solution of SrZr03(s) in (x mol-dm"3 HF + 6.41 mol-dm"3 HN03)(aq) as a function of the fluoride concentration x. Indicated are the distinct regions.
>82-

linear dependence of Ag0lH° on r being assumed, yielding: -(492.13 ± 1.35) kJ-mol"1.
Combining the enthalpies of solution with the standard molar enthalpy of formation of BaO(s) and ZrO2-0.154H2O(am), together with the enthalpy of formation of H20(1) and from other experiments the estimated enthalpy of solution of H20(1) in solvent "D", -(0.8 ± 0.0) kJ-mol'1, finally gives for the standard molar enthalpy of formation of BaZr03(s): A,H0(298.15 K) = (1763.0 ± 3.7) kJ-mol"1.
SrZr03(s)The standard molar enthalpy of formation of SrZr03(s) has been calculated similar to that of BaZr03(s) using the thermochemical cycle given in Table 5.15. The standard molar enthalpy of solution of SrZr03(s), (328.42 ± 1.56) kJ-mol"1, is given in Table A5.8. The standard molar enthalpy of solution of the auxiliary oxides at the mole ratio (r) = n(Sr0)/n(Zr02) = 1 was calculated using the values listed in Table A5.8, similar as described for BaZr03(s), yielding: (450.26 ± 0.29) kJ-mol"1. Combining the standard molar enthalpy of
solution with the standard molar enthalpies of formation of SrO(s), Zr02 0.154H20(am), and H20(1), finally gives, after correction for the estimated enthalpy of solution of H20(1) in solvent "D", for the
Table 5.15 Reaction scheme for the standard molar enthalpy of formation of SrZr03(s) at the temperature 298.15 K.AH7 = - AH1 + AH2 + AH3 + AH4 - AH5 - AH6
Reaction A9o]H°/(kJmorl)
1. SrZr03(s) + (2HN03 + 4F)(sln in "D") =(Sr(NO.j)2 + ZrF4 + 3H20)(sln in "D")
2. SrO(s) + Zr02 0. 154H20(am) + (2HN03 + 4HF)(sln in "D") =(SrfNOglg + ZrF4 + 3.154H2OJ(sln In "D")
3. Sr(s) + (l/2)02(g) = SrO(s)4. Zr(s) + 0.154H2(g) + 1.0775O2(g) = ZrO2-0.154H2O(am)5. 0.154H2(g) +■ 0.07702(g) = 0.154H2O(l)6. 0.154H20(1) + "D" = 0.154H20(sln in "D")
-328.42 ± 1.56
-450.27 ± 0.29 -592.15 ±0.86
-1093.59 ±2.77 -44.02 ±0.01
-0.10 ±0.00
7. Sr(s) + Zr(s) + (3/2)02(g) = SrZrOa(s) -1763.47 ±3.30
-84-

The solvent used for the solution calorimetric measurements is: (0.5 mol-dm"3 HF + 6.4 mol-dm"3 HN03)(aq) or solvent "D". The final fluoride concentration in solvent "D" was found to play a very distinctive role in the dissolution process. With high fluoride concentrations the post period became sluggish and had to be increased significantly to obtain a good fit according to Newton’s cooling law, whereas low fluoride concentrations resulted in a rapid increase (less negative) value for the enthalpy of solution. As the former process can be attributed to complexation, the latter arises from solubility problems. In order to find a solvent with a minimum concentration of HF, the enthalpy of solution of SrZr03 has been measured as a function of the HF concentration the results of which are given in Figure 5.3. From the results the optimized solvent "D" was found.
BaZr03(s)The thermochemical cycle from which the standard molar enthalpy of formation of BaZr03(s) has been derived, is given in Table 5.14. The enthalpy of solution of BaZr03(s) in solvent "D" is: -(326.70 ± 1.13) kJ-mol'1, Table A5.7. The molar enthalpy of solution at the mole ratio (r) = n(Ba0)/n(Zr02) = 1.0 was calculated from the values listed in Table A5.7 by means of the least squares fitting program [Kra 89], a
Table 5.14 Reaction scheme for the standard molar enthalpy of formation of BaZr03(s) at the temperature 298.15 K.AH7 = - AH1 + AH2 + AH3 + AH4 - AH5 - AH6
Reaction AsolH°/(kJ-mor1) 1 2 3 4 5 6
1. BaZr03(s) + (2HNOa + 4F)(sln in "D") =(Ba(N0^2 + ZrF4 + 3HgO)(sln in "D")
2. BaO(s) + ZrO2-0.154H2O(am) + (2HNOa + 4HF)(sln in "D") =(Ba(NO;j)2 + ZrF4 + 3.154H20)(sln in "D")
3. Ba(s) + (l/2)02(g) = BaO(s)4. Zr(s) + 0.154H2(g) + 1.0775O2(g) = ZrO2-0.154H2O(am)5. 0.154H2(g) + 0.07702(g) = 0.154H200)6. 0.1541120(1) + "D" = 0.154H20(sln in "D")
-326.70 ±1.13
-492.13 ± 1.35 -548.05 ± 1.74
-1093.59 ±2.77 -44.02 ± 0.01 -0.10 ±0.00
7. Ba(s) + Zr(s) + (3/2)02(g) = BaZr03(s) -1762.95 ±3.71
-83-

standard molar enthalpy of formation of SrZr03(s): AfH° (298.15 K) = -(1763.5 ± 3.3) kJ-mol"1.
DiscussionValues for the standard molar enthalpies of formation of BaZrOg(s) and SrZr03 have been assessed by Cordfunke and Konlngs [Cor 90c]. A re-assessment of these values, using new values for the thermodynamic functions of BaZr03(s) and SrZr03(s) (Chapter four), BaO(s) and SrO(s) [Cor 90a], and BaO(g) (see Chapter 7) yielded for the standard molar enthalpies of formation of BaZr03(s) and SrZr03(s), (1771 + 5) kJ-mol"1 and -(1766 ± 5) kJ-mol'1, respectively. The value obtained in the present study for BaZr03(s) is slightly less negative than from the assessment, whereas our results for SrZr03(s) are in good agreement with it.
5.7 Strontium zirconium silicates
In the pseudo-ternary system (Sr0+Si02+Zr02) two ternary compounds have been identified: SrZrSi207(s) and Sr6ZrSi5018(s) [Gha 88, Dea 58|. The latter compound was, however, later identified as Sr7ZrSi6021(s) by Plaisier et oL (Pla 95] (Chapter 3). These compounds are of importance in nuclear safety studies as they may be formed upon reaction between the molten core of a nuclear reactor and the concrete base-mat during a severe accident.As already mentioned, the structural formula of Sr6ZrSi5018(s) appeared to be Sr7ZrSi6021(s) after the measurements had been performed. The solution calorimetric measurements on this compound have therefore to be corrected for SrZr03(s). Since SrZr03(s) has been measured in almost the same solvent these corrections can be made with confidence, however, with the assumption that SrZr03(s) has no solubility in Sr7ZrSi6021(s).
-85-
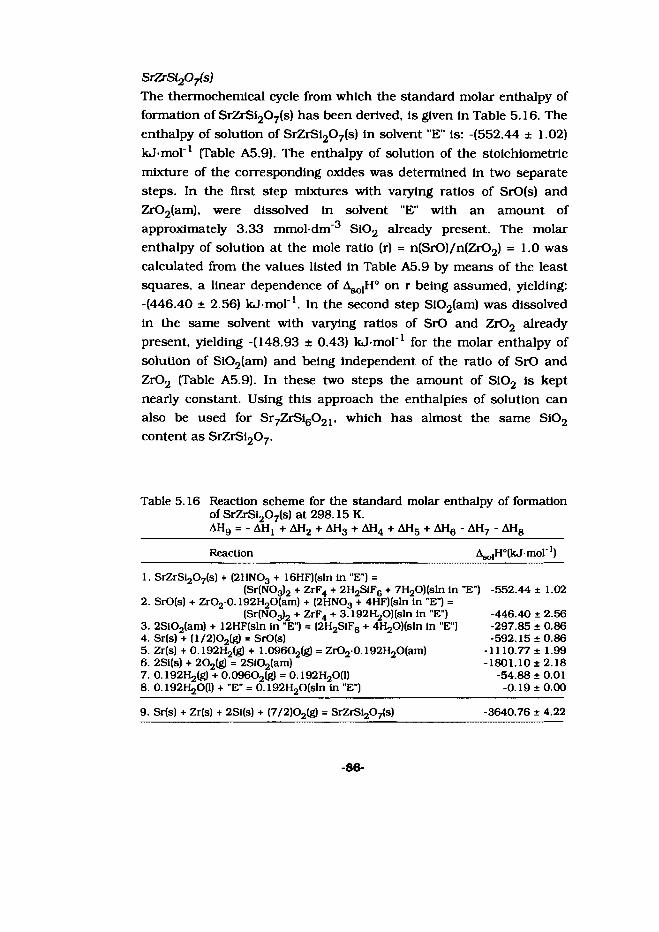
SrZrS^O^s)The thermochemical cycle from which the standard molar enthalpy of formation of SrZrSi207(s) has been derived, is given in Table 5.16. The enthalpy of solution of SrZrSi207(s) in solvent "E" is: -(552.44 ± 1.02) kJ-mol"1 (Table A5.9). The enthalpy of solution of the stoichiometric mixture of the corresponding oxides was determined in two separate steps. In the first step mixtures with varying ratios of SrO(s) and Zr02(am), were dissolved in solvent "E" with an amount of approximately 3.33 mmol dm"1 2 3 4 5 6 7 8 Si02 already present. The molar enthalpy of solution at the mole ratio (r) = n(SrO)/n(Zr02) = 1.0 was calculated from the values listed in Table A5.9 by means of the least squares, a linear dependence of Aso]H° on r being assumed, yielding: -(446.40 ± 2.56) kJ-mol"1. In the second step Si02(am) was dissolved in the same solvent with varying ratios of SrO and ZrOa already present, yielding -(148.93 + 0.43) kJ-mol"1 for the molar enthalpy of solution of S102(am) and being independent of the ratio of SrO and ZrOa (Table A5.9). In these two steps the amount of Si02 is kept nearly constant. Using this approach the enthalpies of solution can also be used for Sr7ZrSi6021, which has almost the same Si02 content as SrZrSi207.
Table 5.16 Reaction scheme for the standard molar enthalpy of formation of SrZrSi207(s) at 298.15 K.AHg = - AHj + AH2 + AHg + AH4 + AHg + AHg - AH7 - AHg
Reaction AsolH°(kJmor1)
1. SrZrSIgOyfs) + (2HNOa + 16HF)(sln in "E") =(Sr(NC>3)2 + ZrF4 + 2H2S1F6 + 7H2Q)(sln in "E")
2. SrO(s) + ZrO2 0.192H2O(am) + (2HN03 + 4HF)(sln in "E") =(SrfNO^ + ZrF4 + 3.192H20)(sln in "E")
3. 2Si02(am) + 12HF(sln in "E ") = (2H2S1F6 + 4H20)(sln In "E")4. Sr(s) + (l/2)02(g) = SrO(s)5. Zr(s) + 0.192H2(g) + 1.096O2(g) = ZrO20.192H20(am)6. 2Si(s) + 202(g) = 2SI02(am)7. 0. igZHgtg) + 0.09602(g) = 0.192H20(1)8. 0.192H20(1) + "E" = 0.192H2O(sln in "E")
-552.44 ± 1.02
-446.40 ± 2.56 -297.85 ± 0.86 -592.15 ± 0.86
-1110.77 ± 1.99 -1801.10 ± 2.18
-54.88 ± 0.01 -0.19 ± 0.00
9. Sr(s) + Zr(s) + 2Si(s) + (7/2)Q2(g) = SrZrS^Oyts) -3640.76 ± 4.22
-86“

Combination of the enthalpies of solutions with the standard molar enthalpy of formation of SrO(s), Si02(am), and ZrO2 0.192H20(am), together with the enthalpy of formation of H20(1), and the experimentally determined enthalpy of solution of H20(1) in the solvent, -(0.973 ± 0.011) kJ-mol"1, finally gives for the standard molar enthalpy of formation of SrZrSi207(s): AjH° (298.15 K) = -(3640.8 ± 4.2) kJ-mol"1.
SryZrSi^O2 j (s)The thermochemical cycle from which the standard molar enthalpy of formation of Sr7ZrSi6021(s) has been derived, is given in Table 5.17. The molar enthalpy of solution of Sr6ZrSi5018(s) in solvent "E",(1779.94 + 2.09) mol"\ is given in Table A5.9. Correcting for SrZrOg
as mentioned, gives for the enthalpy of solution of Sr7ZrSi6021(s):(1741.82 ± 3.13) kJ-mol"1. The molar enthalpy of solution at the mole
ratio (r) = n(Sr0)/n(Zr02) = 7.0 was calculated from the values listed in Table A5.9 by means of the least squares, a linear dependence of AsoiH° on r being assumed, yielding: -(2061.00 ± 2.59) kJ-mol"1. The molar enthalpy of solution of Si02(am) in the solution to which (SrO + ZrO2-0.192H2O(am)| has been added, as described before, is (148.93 ± 0.43) kJ-mol'1. Combining the enthalpies of solution with the molar
Table 5.17 Reaction scheme for the standard molar enthalpy of formation of Sr7ZrSi602i(s) at 298.15 K.AHg = - AH j + AH2 + AH3 + AH4 + AHg + AHg - AH7 - AHg
Reaction Ag^HVfcJ-mor1) 1 2 3 4 5 6 7 8
1. Sr7ZrSlg021(s) + (14HN03 + 40HF)(sln in "E") =(7Sr(NOg)2 + ZrF4 + 6H2SiF6 + 21H2OJ(sln in "E")
2. 7SrO(s) + ZrO2 0.192H2O(am) + (14HN03 + 4HF)(sln in "E") =(7SrtN03)2 + ZrF4 + 8.192H20)(sln in "E")
3. 6Si02(am) + 36HF(sln in "E") = (6H2SiF6 + 12H20)(sln in "E")4. 7Sr(s) + (7/2)02(g) = 7SrO(s)5. Zr(s) + 0.192H2(g) + 1.096O2(g) = ZrO2-0.192H20(am)6. 6Si(s) + 602(g) = 6Si02(am)7. 0.192H2(g) + 0.09602(g) = 0.192^00)8. 0.192H20(1) + "E" = 0.192H20(sln in "E")
-1741.82 ± 3.13
-2061.00 ± 2.59 -893.56 ± 2.57
-4145.05 ± 6.02 -1110.77 ± 1.99 -5403.30 ± 6.54
-54.88 ± 0.01 -0.19 ± 0.00
9. 7Sr(s) + Zr(s) + 6Si(s) + (21/2)02(g) = Sr7ZrSi602I(s) -11816.79 ± 10.30
-87-

enthalpies of formation of SrO(s), Si02(am), ZrO20.192H20(am), and H20(1) gives, after correction for the enthalpy of solution of H20(1) in the solvent, for the standard molar enthalpy of formation of Sr7ZrSi6021(s), AfH° (298.15 K) = -(11816.8 ± 10.3) kJ-mol"1.
DiscussionThe enthalpy of formation of SrZrSi207(s) has not been measured before, therefore no comparison with previous measurements can be made. Shibanov and Chukhlantsev (Shi 70] estimated the enthalpy of formation of Sr6ZrSi5018(s) on basis of structural analogy with other complex zirconium containing silicates. Their estimated value, AjH°(298.15 K) = (9900 ± 200) kJ-mol"1, becomes after correction of the results to Sr7ZrSi5021(s): A(H°(298.15 K) = (11550 ± 230)kJ-mol"1. This value is in a poor agreement with our experimental value.
-88-

6. Structural Relations
Parts of this Chapter have been published previously as:
M.E. Huntelaar, E.H.P. Cordfunke, P. van Vlaanderen, D.J.W. IJdo (1994), The crystal structure of SrZrSl207, Acta Crystallographica, C50, 988.
-89- left BLANK |
6.1 Crystal structure of SrZrSi207
IntroductionThe existence of SrZrSl207 was first reported by Ghanbari-Ahari and Brett [Gha 88] who studied phase relations In the pseudo-ternary system Sr0-Si02-Zr02. SrZrSi207 is a compound in the section SrSi03-ZrSi04. In order to understand the chemical activity of this compound in complex systems, such as Sr0-Si02-Zr02, its crystallographic structure has been studied.
ExperimentalThe density of SrZrSi207(s) was measured with double-distilled carbon tetrachloride (CC14, Merck) in a pycnometer with a contents of approximately 25 cm3. Per experiment between 2 and 5 grams of the compound was used to reduce the uncertainty in the density due to the temperature dependency. Afterwards the SrZrSi2G7 was checked with X-ray diffraction, but no change in structure could be observed. The value found is (3.928 ± 0.022) g-cm"3, and compares nicely with the theoretical density of (3.935 ± 0.001) gem"3.
The X-ray powder diffraction pattern was obtained with a Philips PW 1130/90 generator and a Delft Instruments Guinier-de Wolff camera using Cu-Kaj radiation with X = 1.540598 A. A mixture of silicon and tungsten was used as an internal standard. Si from NBS (now designated NIST), Standard Reference Material (SRM 640a) with a0 = 5.430825(36) A (Hub 83], and W from Schuchardt, with a0 = 3.16540(9) A, converted to the wave length mentioned above [Par 60]. All diffraction lines could be indexed with the ITO method (Vis 69] yielding a figure of merit F20 = 38 (0.008, 41). The absent reflections in the X-ray diffraction pattern indicate the space group P21/c. The agreement with the unindexed d-values of Ghanbari-Ahari and Brett (Gha 88], also obtained with X-ray powder diffraction, is rather good. The lattice parameters and intensity distribution suggest a strong similarity with the high-temperature structure of NaFeP2G7 [Gab 82],
-91-

Because no single crystals could be obtained, Rietveld’s method [Rie 69] was used for refinement of neutron powder-diffraction data, collected with the Petten High-Flux reactor: 5 < 2© < 152.6 in steps of 0.1°. Neutrons of X = 2.5717(3) A were obtained using the beam reflected from (111) planes of a single crystal of copper and reducing the X/n contamination to less than 0.1% by means of a pyrolytic graphite filter. Seller slits with a horizontal divergence of 30' were placed between the reactor and the monochromator and in front of the four 3He counters. The sample holder (0 = 10 mm) consisted of a V tube filled up with Cd slices and closed with Cu plugs fitted with O- rings. No precautions were taken to avoid preferred orientation. The neutron powder-diffraction results were analyzed with the program DBW3.2 version 8804 [Wil 81). The structure of high temperature NaFeP207 [Gab 82] was used as a trial model. Coherent scattering lengths: Sr 7.02, Zr 7.16, Si 4.149, and O 5.805 fm (Koe 81). 61 parameters were used in the refinement: a scale factor, three halfwidth parameters defining the Gaussian-like shape of the reflections, six background parameters, the counter zero error, the unit-cell parameters, the atomic positional parameters, isotopic thermal parameters. The largest correlation matrix element for structural parameters is 0.46. The results of the Rietveld-refinement together with other properties are given in Table 6.1.
DiscussionAtomic parameters are given in Table 6.2 and selected distances in Table A6.1. The agreement between the observed and the calculated
Table 6.1 The observed and calculated crystallographic and physical properties of SrZrSi207 at 294.85 K.
Molar mass 347.011 ao 7.7617(9) Aspacegroup monoclinic, P2,/c bo 8.0713(10) AZ 4 co 10.0559(11) AV 584.51(7) A3 P 111.90(1)'Dx^neutron
3.943(1) gem32.5717(3) A
®exp 3.928(22) gem 3
-92-

I I
r'UW L/ V'
I II I I HI
dlLWE^W
I |.| ill Ill'll 111:11 lill Ilium Ml I llillll I'll I 1161 Hint IMMIIM If II Hill HI j
10 2C 30 40 SC
1WV 1HHA IN DEGREE;
Fig. 6.1 Observed (dots) and calculated (full line) neutron diffraction profile of SrZrSl207 at 295 K, position of nuclear lines and Hobs.) - /(calc.) Is indicated.
Table 6.2 Fractional atomic coordinates and thermal parameters (A3) of SrZrSi207 at 295 K.
atom X y z B
Sr 0.2825(4) 0.4817(4) 0.2945(3) 0.72(10)Zr 0.2597(5) 0.0110(4) 0.2640(4) 0.48(7)Si(i) 0.0650(8) 0.2484(7) 0.4577(5) 0.22(15)Si (2) 0.6737(7) 0.2136(7) 0.4605(5) 0.65(17)0(1) 0.8675(5) 0.1539(5) 0.4390(4) 0.54(12)0(2) 0.1918(5) 0.2689(5) 0.6250(4) 0.88(10)0(3) 0.0115(5) 0.4214(4) 0.3695(4) 0.79(12)0(4) 0.1698(5) 0.1344(5) 0.3809(4) 0.57(14)0(5) 0.5257(6) 0.0195(5) 0.3492(4) 0.72(11)0(6) 0.6943(5) 0.2050(5) 0.6239(4) 0.06(12)0(7) 0.6331(6) 0.4044(4) 0.4064(4) 0.08(11)
Rp = 2.05%; Rwp = 2.72%; DW-d = 1.52; xLi = 2.03
-93-

Fig. 6.2 An artist's impression of the SrZrSi207 structure; in the left part the irregular SrOg dodecahedrons are left out. showing the cages and the characteristic linkage between the Si207 groups and the ZrOe octahedra.
profiles of the data is shown in Fig 6.1. The structure can be described [Gab 82) as a cage structure built up from comer-sharing ZrOg octahedra and Si207 groups (Fig. 6.2). The Sig07 group is formed from slightly distorted Si04 groups having one common oxygen. The two tetrahedra are in a nearly eclipsed configuration. The Sr ions are in irregular eight coordination. In Fig. 6.3 the structure is shown once again, only this time as a projection along [001].
The di-silicates AgSl207 (A = lanthanide, Sc, Y) have received some attention in the structural literature. For small A the thortveitite (Sc2Si207) structure has been found (A = Sc, Tb, Tm) in which Si207 groups exist in staggered conformation and A has six coordination. With increasing radii of A the structure changes (Table 6.3) and the bridged angle Si-O-Si decreases. Also the coordination of A increases
-94-
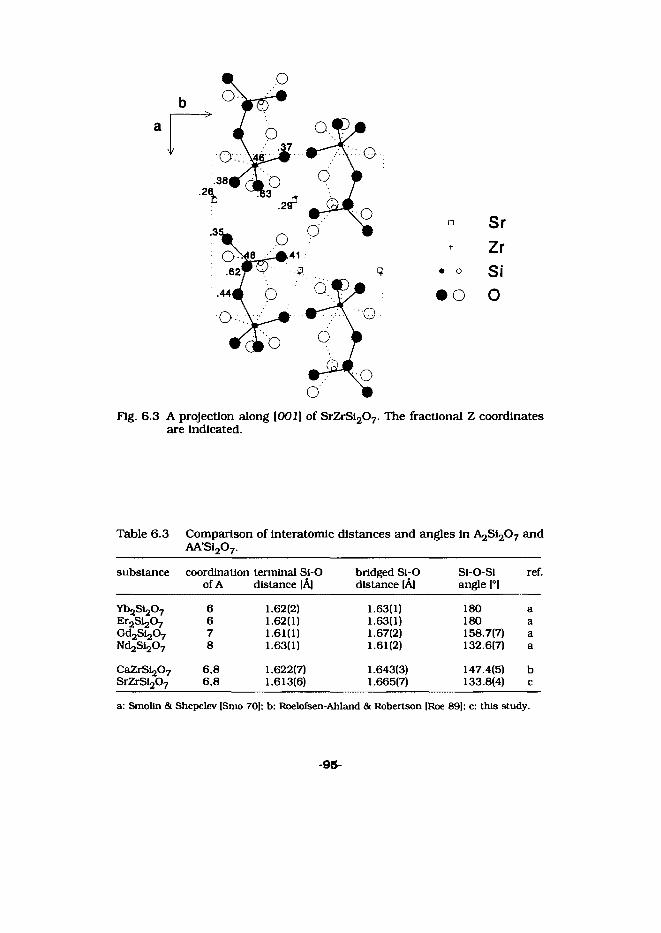
□ Sr + Zr
• ° Si
• o o
Fig. 6.3 A projection along [001] of SrZrSi207. The fractional Z coordinates are indicated.
Table 6.3 Comparison of interatomic distances and angles in A2SI207 and AA’Si207.
substance coordination terminal Si-O of A distance [A]
bridged Si O distance |A)
Si-O-Si angle |°|
ref.
YbgSigOy 6 1.62(2) 1.63(1) 180 aEr2Si207 6 1.62(1) 1.63(1) 180 aGd2Sl207 7 1.61(1) 1.67(2) 158.7(7) aNdgSigC^ 8 1.63(1) 1.61(2) 132.6(7) a
CaZrSlgOy 6,8 1.622(7) 1.643(3) 147.4(5) bSrZrSl207 6,8 1.613(6) 1.665(7) 133.8(4) c
a: Smolin & Shepelev [Smo 70|; b: Roelofsen-Ahland & Robertson |Roe 89|: c: this study.
-95-
[Smo 70]. At low temperature for A = La, Pr, Nd, and Sm the Ca2P207 structure has been reported [Fel 69]. Mixed di-silicates AA’ are less well known, only CaZrSi207 with deformed thortveitite structure [Roe 89] has been studied. The Si-O-Si angle in this compound, has been decreased to 147.4°. In the title compound the bridged angle is further decreased to 133.8° (Table 6.3). Replacing Zr at the octahedral site by the much smaller V, as in SrVSi207 [Tak 67], causes the structure with Si207 groups to become a chain structure built up of Si4012 groups.
The relative charge on the oxygen atoms is calculated with Brown's formalism [Bro 85]:
K,=2S„=Se 8 1 i
in which Vt is the relative charge on the ion (i), R@ bond valence parameter, Ry is the bond distance and B a constant; both B and R^ are empirical constants. For the calculation we used for the bond distances the values given in Table 6.2, for B the value 0.37 and 2.118, 1.624, or 1.928 A for the bond valence parameter of respectively Sr, Si or Zr. The results given in Table A6.2, show how the long-bond distances between Si and Ol only have a relatively small partial contribution to the overall charge on Ol.
6.2 Crystal structure of 5-SrSiOa
IntroductionIn their experimental work on the rapid-crystallization behaviour of non-crystalline solids Takamori and Roy (Tak 75] did report the formation of a metastable SrSi03(s) out of quenched SrSi03. In the present study the crystallographic properties of this metastable SrSi03(s) - hereafter called 8-SrSi03(s) - has been studied in more detail.
96-
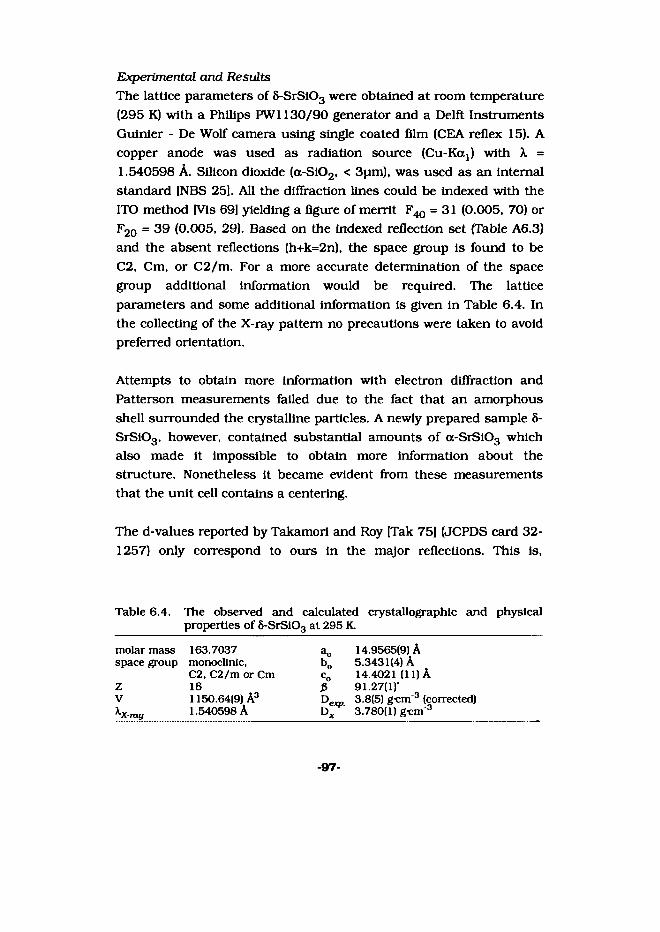
Experimental and ResultsThe lattice parameters of 8-SrS103 were obtained at room temperature (295 K) with a Philips PW1130/90 generator and a Delft Instruments Gulnier - De Wolf camera using single coated film (CEA reflex 15). A copper anode was used as radiation source (Cu-Kocj) with X = 1.540598 A. Silicon dioxide (a-S102, < 3pm), was used as an internal standard [NBS 25). All the diffraction lines could be indexed with the ITO method [Vis 69] yielding a figure of merrit F^ = 31 (0.005, 70) or F20 = 39 (0.005, 29). Based on the indexed reflection set (Table A6.3) and the absent reflections (h+k=2n), the space group is found to be C2, Cm, or C2/m. For a more accurate determination of the space group additional information would be required. The lattice parameters and some additional information is given in Table 6.4. In the collecting of the X-ray pattern no precautions were taken to avoid preferred orientation.
Attempts to obtain more information with electron diffraction and Patterson measurements failed due to the fact that an amorphous shell surrounded the crystalline particles. A newly prepared sample 8- SrSi03, however, contained substantial amounts of a-SrS103 which also made it impossible to obtain more information about the structure. Nonetheless it became evident from these measurements that the unit cell contains a centering.
The d-values reported by Takamori and Roy [Tak 75] (JCPDS card 32- 1257) only correspond to ours in the major reflections. This is,
Table 6.4. The observed and calculated crystallographic and physical properties of S-SrS103 at 295 K.
molar mass 163.7037 a„ 14.9565(9) Aspace group monoclinic, bQ 5.3431(4) A
C2. C2/m or Cm c„ 14.4021 (11) AZ 16 5 91.27(1)-V\xray
1150.64(9) A3 1.540598 A
®exp.D,
3.8(5) gem 3 (corrected)3.780(1) gem 3
-97-
however, not surprising since their sample was evidently less crystalline.
The density of 8-SrSi03 was measured, as described above, with tetrachloride in a pycnometer, similar as for SrZrSi207. The value found, (3.773 ± 0.007) gem"3, however, had to be corrected for the a- SrSiOg impurity. The amount of a-SrS103 was established by calorimetric measurements using the same solvent as described in Chapter 5. If we compare the enthalpy of solution of the sample used for the density measurements, -(272.331 ± 0.725) kJ-mol"1, with the values of pure samples of a- and S-SrSi03 (Tables 5.7 and 5.10), the amount of a-SrSi03 is (24.8 ± 6.5) mol%. The density of 8-SrSi03 therefore becomes, using for a-SrSi03 a density of 3.667 gem"3 [Mac 82): (3.8 ± 0.5) gem'3. This yields for Z the value of 16.
-98-

7. An assessment of the enthalpies of formation of
BaO(g) and SrO(g)
NEXT PAQEISI left BLANK
-99-

7.1 Introduction
It is not always necessary to perform time-consuming and expensive experimental work to obtain the thermodynamic properties of relevant chemical species. In cases that sufficient non-contradictory experimental values are available in literature, the "best" value can be assessed.
A powerful tool in the evalution of the results of high-temperature experiments, such as EMF measurements, mass spectrometry, or flame spectroscopy, is the third-law method. This method enables us to calculate the enthalpy of reaction of an equilibrium at room temperature from high-temperature equilibria. This can easily be seen by starting with one of the basic equations in thermodynamics for the description of a chemical equilibrium:
AG°m = AH°m - TAS°m. 7.1
in which AG°(T), AH°(T), and AS°(T) are the standard Gibbs energy, enthalpy, and entropy of a chemical reaction at the temperature T. These functions are related to room temperature using the - also temperature-dependent - heat capacity, thus:
T
AH°m = AH°(298.15) + J ACp dT298.15 y 2
AS°(T) = AS °(298.15) + J —EdT298.15 T
Rewriting eq. 7.1 gives:
|AG°(T) - AH(298.15)| = AH°(T) - AH°(298.15) - TAS°(T) 7.3
-101-
and:
AG°m-AH°(298.15) _ AQO[^ _ AH°(7)-AH°(298.15) 7 4T J T
The left side of eq. 7.4 Is called the Free Energy Function or FEF. When the right side of the equation Is known from thermodynamic measurements, the enthalpy at 298.15 K can be calculated for any determined value of AG°(T). Thus, from equation 7.4 we obtain:
AH°(298.15) = AG°(T) - [AFEF-T ] 7 5
For Instance, the dissociation reaction BaO(g) = Ba(g) + 0(g) has been studied by measuring the partial pressures of BaO(g), Ba(g) and 0(g) with various techniques, and at various temperatures. For each temperature the Gibbs energy of reaction can be written as:
ArG°(T) = G°(T, Ba. g) + G°(T, O, g) - G°(T, BaO, g) = - RT ln(Kp) 7.6
with
Kp = dGd t*°]p(BaO)
Using the sum of the FEFs% of the compounds participating in the reaction at temperature T, equation 7.5 gives Aj.H°(298.15) for each data point independently. Finally, by using the enthalpies of formation of Ba(g) and O(g), the enthalpy of formation of BaO(g) can be calculated.
The strength of the third-law method is that the procedure yields an Independent solution for every data point. In the final result the error in the measurements is thus directly expressed in the uncertainty of the enthalpy of reaction at room temperature. Another advantage is
(%) FEFs are often tabulated in thermodynamic tables, or can be easily calculated from the right lid of eq. 7.4.
-102-
that, if there is something wrong with the measurements or with the thermodynamic equilibrium, no constant value for the ArH°(298.15) will be obtained within the limits of the uncertainty. Instead, a distinct temperature trend will be observed.
In the next step of the assessment, the enthalpy of reaction has to be related to whatever quantity is useful. For instance, in a third-law evaluation of the dissociation reaction BaO(g) = Ba(g) + 0(g), the enthalpy of reaction has the following relation to the enthalpy of formation of BaO(g):
1. BaO(g) = Ba(g) + 0(g) A,H0 = AdlsaH°(BaO) = D°(BaO) AH2. Ba(s) = Ba(g) AsubH°(Ba) = A^t°(Ba. g) AH.3. -A02(g) = Q(g) -AA^H^Oa, g) = A^°(G, g) AH.
4. Ba(s) + >/*02(g) = BaO(g) AjH^BaO, g) AH,
where AfH°(BaO, g) = AH4 = -AH, + AH2 + AH3= -DVis + A8ubH°(298.15) + ViAdlssH°(298.15)
The dissociation enthalpy, D°, is often expressed at 0 (zero) K (Dq)
while enthalpies of reaction obtained with the third-law method are given at room temperature (298.15 K). Therefore, the enthalpies of dissociation have to be calculated at 298.15 using the relation shown in 7.2. Thus,
298.15
D "(298.15) = Dq + J ACp dT = D0° + A[H°(298.15) - H°(0)]0
BaO(g)** H°(298.15) - H°(0) = 9.014 kJ-mol"1 (-)Ba(g)‘* H°(298.15) - H°(0) = 6.197 kJ mol 1 (+)o(g)“ H°(298.15) - H°(0) = 6.725 kJ-mol1 (+)
AH°(298.15) - H°(0) = 3.908 kJmol"1
(**) The enthalpy increment values, H°(T) - H°(298.15), have been taken from Gurvich et aL (Gur 94).
-103-

Finally, we obtain for the relationship between Dq and A1H°(298.15):
AfH°(298.15) = - Dq - 3.908 + 190.0 + 249.18= - Dq + 435.3 kJmoV1 7.7
and, similarly for SrO(g):
AjH°(298.15) = - Dq + 406.5 kJ-mol'1. 7.8
In the two relationships the sublimation enthalpy of the pure metal plays a dominant role; the uncertainty in this number is therefore directly reflected in the final value for the enthalpy of formation.
The enthalpy of formation of BaO(g) can also be obtained from the sublimation reaction, BaO(s) = BaO(g). A third-law analysis of this type of reaction yields: AsubH°(298.15) = AfH°(BaO, g, 298.15) - A(H°(BaO, s, 298.15). Since the enthalpy of formation of BaO(s) is well known [Cor 90a] the enthalpy of formation of BaO(g) can be calculated from the third-law value of AsubH°(298.15).
Having thus recalculated different series of measurements a weight has to be given to the measurements. This means that one has to judge: is the technique chosen appropriate, are the experimental settings meaningful and, not to the least, is the sample with which the measurements are performed pure enough? For instance, the presence of steam in an acetylene flame during spectroscopic line intensity measurements of BaO(g) will alter the amount of BaO(g) due to the formation of Ba(OH)x molecules, thereby lowering the line intensity. Translation of these line intensities to partial pressures of BaO(g) will result in an underestimation, and thus in a value for the calculated enthalpy of formation of BaO(g) which is too low .
The recommended value, as a result of the assessment, is not the mean of all data sets but is based on a carefully selected group of measurements. In this manner the selected value is more than just a
-104-

number [Cor 93b], and has to be preferred over the Individual measurements.
In this Chapter an assessment of the enthalpies of formation of the gaseous BaO and SrO species will be given and discussed.
7.2 The enthalpies of formation of BaO(g) and SrO(g)
BaO(g)The enthalpy of formation of BaO(g) has been measured during the last century by a large number of authors, and with different kinds of methods [Table 7.1).
Claassen and Veenemans [Cla 33], and Hermann [Her 37] measured the rate of evaporation from an oxide surface. Blewett et aL [Ble 39], who discussed the disagreeing results of the previous authors, remeasured the vapour pressure of BaO using a Knudsen cell. Their results agree with those of Claassen and Veenemans. However, all assumed the vapour over BaO(s) to be BaO(g) exclusively. It was found later that this is not the case since other Ba-bearing species, such as Ba(g) and Ba20(g), have to be taken into account.
The results of Electron Impact Measurements made by Panchenkov et aL [Pan 73], are higher than obtained in other studies. The authors made corrections for the kinetic energy, the electronic and the thermal excitation of the fragments in their reactions, and they obtained for BaO the value Dq = (563 ±21) kJ-mol"1.
Lagerqvist and Huldt [Lag 54], Hinnov and Kohn [Hin 57], Kalff et aL [Kal 65], Kalff and Alkemade [Kal 73] determined the enthalpy of formation of BaO(g) by Flame Spectroscopy. Lagerqvist and Huldt, assuming for the ground state of BaO(g), obtained D° = (536 ± 33) kJ-moT1 at 2300 K. The results obtained by Hinnov and Kohn were
-105-
obtained In an acetylene air flame; the water content after combustion may have resulted In the formation of hydroxides. Kalff et at. stated that they obtained the same results with and without moisture In a CO(g) flame. Their value, Dq = (525 ±17) kJ-rnol"1, however, leads to an enthalpy of formation which deviates largely from the recommended value in this assessment; this may indicate the formation of hydroxides just as in Hinnov’s measurements.
A large number of studies has been performed by mass spectrometry: Aldrich [Aid 51], Pelchowitch [Pel 54], and Shchukarev and Semenov [She 57], measured the rate of evaporation from a filament, whereas Inghram et al. ling 55], Colin et al. [Col 64], Newbury et al. [New 68], Semenov et al. [Sem 72], Farber and Srivastava [Far 75], Hilpert and Gerads |Hll 75] used a Knudsen cell. The studies of Aldrich and Pelchowitch cannot be recalculated because experimental data points are not available. Inghram et al. calculated partial pressures of all Ba species in equilibrium with solid BaO(s) as a function of temperature (1530 - 1758 K) from the measured ion intensities. Their results for BaO(g) were confirmed by measurements of Hilpert and Gerads, who used different liners in their Knudsen cells, and by Farber and Srivastava. Other measurements by Colin et al., Newbury et aL, and Semenov et aL differ from the preceding measurements to some extent. Due to a lack of experimental details, it is very difficult to recalculate Colin's measurements accurately.
Another method used is the crossed-beam reaction method, with which the chemiluminescent process In gases can be studied. From the spectrum the emitting species and their population distribution can be determined. The results from these studies tend to be consequently more negative than obtained in mass spectrometric studies. Since we failed to recalculate the measurements of Jonah et aL [Jon 71], Herm et al. [Her 73], and Engelke et aL [Eng 76], their results are not given much weight In this assessment. Dagdlglan et al. [Dag 74] used a laser-induced fluorescention reaction. The results
-106-

-107-
Table 7.1 The standard molar enthalpy of formation of BaO(g) at 298.15 K and the enthalpy of dissociation at 0 K according to various authors. The values on which the selected value is based are bold.
Source Method* TIK)
AjH°(298.15)IkJ-mol"1]
D%IkJ-mol"1)
Claassen and Veenemans (1933) T 1200 -1600 -117.9 ± 8.2Hermann (1937) T 1200 -1600 -119 ± 25Blewett et al (1939) T 1200 -1800 -113 ± 18Aldrich (1951) LM 1725 -1810 —
Pelchowitch (1954) LM —
Inghram et at (1955) M 1530 -1758 -110.4 ± 4.1Shchukarev and Semenov (1957) LM 1173 -1473 -119.8 ± 9.3Newbury et aL (1968) KM 1365 -1917 -115.6 * 1.8Semenov et aL (1972) M 1423 -1723 -115.2 ± 3.5Farber and Srivastava (1975) KM 1643 -1803 -111.8 ± 1.8Hllpert and Gerads (1975) KM 1332 -1681 -109.7 ± 1.8Lagerqvlst and Huldt (1954) F 2240 -2430 546 ± 20Hlnnov and Kohn (1957) F 509Colin et oL (1964) M 1846 -2170 557 ± 6KalffetoL (1965) F 525 ± 17Jonah et aL (1971) C 561Kalff and Alkemade (1973) F 561 * 10Panchenkov et oL (1973) E 563 * 21Dagdlglan (1974) L 569 ± 6Engelke et aL (1976) C 569
selected value: -112 ± 5 see text
#) C = crossed-beam reaction, E = electron Impact method. F = flame spectrofotometry, KM = Knudsen cell mass spectrometry, L = laser-induced fluorescention, LM = Langmuir mass spectrometry, T = evaporation method.

from this study are just as the crossed-beam reactions more negative than those obtained with other methods and could not be recalculated.
In previous assessments by Brewer [Bre 53], Ackermann and Thom [Ack 61], and Lamouraeux et aL (Lam 86] outdated auxiliary values for the solid or gaseous BaO were used. In their review Pedley and Marshall [Ped 83a] emphasized that results obtained in mass spectrometric studies, should be used with great care. The presence of metals, such as Mo or Ta, would reduce BaO(g) to Ba(g), altering chemical equilibrium. However, the study by Hilpert and Gerads [Hil 75] shows that results obtained in A1203, C, Mo, and Pt Knud sen cells all yield, within the experimental error, the same results. Moreover, they show an excellent agreement between the second- and third-law evaluation, -112.3 and - (109.7 ± 1.8) kJ-mol"1, respectively.
As a result of the present assessment (Table 7.1) the recommended value for the enthalpy of formation of BaO(g) is:
AfH°(298.15) = -(112 ±5) kJ-mol"1
This selection is mainly based on the Knud sen cell effusion measurements, as indicated above.
This value differs somewhat from a recent assessment by Gurvitch et aL ]Gur 94], who selected AfH°(298.15) = - (118.0 ± 3.6) kJ-mol"1. However, this difference is mainly caused by the use of different enthalpy increment functions for BaO(s), which have been recently determined [Cor 90a].
From the enthalpy of formation of BaO(g) we calculate for the dissociation energy:
Dq = + 112 + 435.3 = 547.3 kJ-mol"1
-108-
This value is in reasonable agreement with the values obtained from the spectroscopic measurements.
SrO(g)As for BaO(g), the enthalpy of formation of SrO(g) has been studied by a large number of authors. However, contrary to BaO(g), the various types of techniques used, such as vapour transport, mass spectrometry, flame ionisation, and crossed-beam reaction methods, yield more conflicting results (Table 7.2).
In the mass transport measurements by Claassen and Veenemans [Cla 33], and Moore et aL [Moo 50], the rate of evaporation of SrO(s) was measured. The assumption was made that SrO(s) evaporates only as SrO(g). Mass-spectrometrical analysis shows, however, that Sr(g) is the predominant species.
Lagerqvist [Lag 50], Lagerqvist and Huldt [lag 54], Hinnov and Kohn [Hin 57], Veits and Gurvich [Vei 57], Kalff et aL [Kal 65], and Kalff and Alkemade [Kal 73] determined the enthalpy of formation of SrO(g) by flame spectroscopy. The results obtained in the first three studies deviate largely from results obtained in the latter two. The most probable reason for this is the formation of mono- and dihydroxides due conditions in the flame. More recently Kalff et aL, and Kalff and Alkemade also studied the dissociation of SrO(g). The former measurements are, however, suspect to hydroxide formation since the authors claim to have found identical results with and without moisture in the CO(g) flame. Because of this, only the latter flame spectroscopic study is given any significant weight.
The mass-spectrometrical technique has been applied by a large number of authors: Aldrich [Aid 51], Bickel and Holroyd [Bic 54], Pelchowitch [Pel 54], and Asano et aL [Asa 72] measured the rate of evaporation from a filament, whereas Porter et aL [Por 55], Brewer and Drowart [Bre 59], Colin et aL [Col 64], Drowart et aL [Dro 64],
-109-
Farber and Srivastava [Far 751, Murad [Mur 811, and Somoilova and Kazenas [Som 94] used a Knudsen cell. The studies of Aldrich and Pelchowitch cannot be recalculated due to fact that experimental data points are not available. Besides, Pelchowitch reports, similar to Bickel and Holroyd, only to have measured Sr-evaporation rates. The measurements of Brewer and Drowart cannot be recalculated because of the absence of oxygen pressure data. Measurements by Colin et aL are regarded not to be very accurate because of undefined oxide- samples containing sulphides. Since SrO(s) and SrS(s) are crystallographically quite identical, SrS can be expected to dissolve SrO in the lattice. Since the activities in this system are not known, the reaction SrO(s) = SrO(g) can not be calculated. The exchange experiments performed by Drowart et aL, have been recalculated for the reactions:
(I)
(II)G(g) + SrO(g) = Sr(g) + 02(g) Mo02(g) + SrO(g) = Sr(g) + Mo03(g)
The first reaction yields for SrO(g): AfH°(298.15 K) = (10 ± 30) kJ-mol"1, whereas the second reaction yields -(40 ± 60) kJ mol"1. The uncertainty in the latter enthalpy of formation is entirely caused by the large uncertainties in the enthalpies of formation of the gaseous molybdenum oxides. Asano et aL made some unauthorized assumptions for the 0(g) = 1/&02(g) equilibrium. However, using only their SrO vapour pressures yields: AIH°(298.15 K) = (4.8 ± 2.5) kJ-mol1.
The measurements by Farber and Srivastava, Murad, and Somoilova and Kazenas are considered to be of good quality. Nevertheless, the results obtained as Dq scatter by as much as 20 kJ-mol'1, indicating the large uncertainties involved in the determination of the enthalpy of formation of SrO(g).
Scepticism about the mass-spectrometrical method was raised by Medvedev [Med 611, who stated that SrO+ dissociates in the gas phase
-110-

-Ill-
Table 7.2 The standard molar enthalpy of formation of SrO(g) at 298.15 K and the dlssosciatlon enthalpy at 0 K according to various authors. The values on which the selected value Is based are bold.
Source Method* TIK)
AfH°(298.15)IkJ-mol']
D%[kj-mol" *1
Claassen and Veenemans (1932) T 1500 -1610 -54 ± 6Moore et aL (1950) T 1150 -1550 -63 ± 2Aldrich (1951) LM 1725 -1810 ....
Pelchowltch (1954) LM —
Porter et oL (1955) KM 2100 45Asano et aL (1972) LM 1747 -1850 4.8 ± 2.5Samoilova and Kazenas (1994) KM 1949 -1996 12 ± 2Lagerqvist (1950) F 449Lager qvist and Huldt (1954) F 464 ± 17Hinnov and Kohn (1957) F 398Veits and Gurvlch (1957) F 2965 482Brewer and Drowart (1959) KM 1250 -2000 (65 ± 20 342 ± 20)Colin et aL (1964) KM 1931 -2170 387 ± 25Drowart et aL (1964) KM 2156 -2321 397 ± 30
KM 1992 -2233 447 ± 60KalfTet aL (1965) F 411 ± 9Kaufman et aL (1965) R 417 ± 50Batalli and Michel (1972) C 477 ± 10Berm et aL (1973) C 384.6 ± 2.7Kalff and Alkemade (1973) F 392.1 ± 9.7Farber and Srtvastava (1976) KM 2010 -2102 411.9 ± 1.0Engelke et aL (1976) C 452 ± 15Murad (1981) KM 1896 -1986 400.0 ± 2.3Samoilova and Kazenas (1994) KM 1949 -1996 422.0 ± 3
selected value: see text 410 ± 15
#) T = mass transport, KM = Knudsen cell mass spectroscopy, R = resonance spectroscopy, C = crossed beam reaction, F = flame spectrophotometric, LM = Langmuir mass spectroscopy.

due to the (high) ionisation potential. Experiments by Aldrich (Aid 51] showed, however, that the SrO(g) pressure becomes higher on higher ionisation potentials, in contradiction to Medvedev's hypothesis. Moreover, the Sr/SrO ratio varies with temperature, which suggests equilibrium conditions between the two species.
Herm et aL [Her 73], Batalli and Michel |Bat 72], and Engelke et of. [Eng 76] studied the enthalpy of formation of SrO(g) with a crossed beam reaction method. The results from these three studies widely scatter and range from AjH°(298.15 K) = (22.3 ± 2.7) kJ-mol"1 to AfH°(298.15 K) = -(70 ± 10) kJ-mol"1. Since we failed to recalculate the results and we could not differentiate between the various experiments, these results are not given any weight here.
Kaufman et al. [Kau 65] estimated the enthalpy of formation of SrO(g) by a spectrometrical resonance method with microwaves, from which he obtained the dissociation energy: Dq(SiO) = (415 ± 48) kJ-mol"1. Recalculation of this value yields for the enthalpy of formation of SrO(g): AfH°(298.15 K) = (10 ± 50) kJ-mol"1.
In previous assessments by Drummond (Dru 51], Brewer (Bre 53], Ackerman and Thom [Ack 61], Gaydon [Gay 68], Pedley (Ped 83b] and Lamoureaux et al. |Lam 86] outdated auxiliairy values for solid and gaseous SrO were used and are therefore no longer valid.
Since the scatter in the direct determinations of the enthalpy of formation of SrO(g) is too high, we prefer in this case to select the dissociation energy (Table 7.2), to give:
Dq = (410 ± 15) kJ-mol1
From this value we calculate for the enthalpy of formation of SrO(g) (eq. 7.8):
A(H°(298.15 K) = - Dq + 406.5 = - (3.5 ± 15) kJmol 1
-112-
The error in the enthalpy of formation is mainly determined by the uncertainty in the Dq.
7.3 Discussion and conclusion
As discussed, many different techniques can be applied to determine the enthalpies of dissociation and formation of gaseous molecules. In the case of the enthalpy of formation of BaO(g) this leads, after a critical evaluation of the literature, to a more or less unambiguous answer. Unfortunately, this is definitely not true for the enthalpy of dissociation of SrO(g). After a careful evaluation of the available literature a considerable scatter in the enthalpy of formation of SrO(g) still remains (Table 7.2). This difference cannot be explained by the previously determined new thermodynamic functions of the solid oxides [Cor 94e], Even in the gas phase reactions - on which the thermodynamic functions of SrO(s) have no influence - the differences remain. An explanation for this difference follows from the fact that SrO(g) is far less stable than BaO(g). As a consquence, other gaseous products bearing strontium become relatively more stable, and can therefore easily disturb the measurements.
Let us consider the formation of the volatile dihydroxides of barium and strontium at 1500 K in the presence of 10"6 atm H20(g) and 10'6 atm BaO(g) or SrO(g),
SrO(g) + HaO(g) = Sr(OH)2(g)ArG°(1500) = -211 kJ-mol'1 -> p[Sr(OH)2] = 2-10'5 atm
BaO(g) + H20(g) = Ba(OH)2(g)ArG°(1500) = -117 kJ mol 1 -» p[Ba(OH)2] = 1-10 * atm
This example shows that under identical circumstances the Sr(OH)2 partial pressure is much larger that of Ba(OH)2. Therefore, the disturbing influence of (relatively) volatile hydroxides will be much
-113-
larger In the case of SrO(g) than It will be for BaO(g). In flame- spectroscopic measurements, for Instance, the quality and composition of the flame Is of utmost importance. If the temperature In the flame Is not constant, the results will show much scatter. If, however, the composition of the flame does not allow for a certain type of reaction solely, the results may look allright, but can be very wrong. Reactions which are sensitive to hydroxide formation, cannot be measured In an acetylene flame since the combustion will result In the formation of steam, what In turn will react to form hydroxides, thereby changing the equilibrium.
By using mass-spectrometrical equipment, the formation of compounds or other reactions can easily be detected. However, the results obtained have the dimension of IT [Intensity Temperature]. These ITs are related to pressures by a cross section which depends on the type of ion. In some cases the cross sections are known, but more often they are not and must be estimated. Other types of determinations, such as crossed-beam reaction, laser-induced fluorescence, are not very suitable for an accurate determination of enthalpies of formation or enthalpies of dissociation due to the large uncertainties involved in the measurements. It can therefore be concluded that the existing techniques do not give a satisfactoiy value for the enthalpy of formation of SrO(g) and we prefer to derive AfH°(298.15) from the D°0.
The value of Dq can also be obtained directly from the rotation and vibration spectra of the molecule in the gaseous phase. In the case of the alkaline-earth monoxides, uncertainties concerning the configuration of the ground state exist in the older literature. These uncertainties will influence the derived thermophysical properties, such as as S' and H"(T)-H'(0). In an early assessment by Brewer [Bre 53] the ground states of the gaseous oxides were assumed to be 3S. Field [Fie 73], however, established the ground states of the alkaline- earth monoxides definitely to be X1!"1". Since the direct method is based on spectroscopic parameters which depend only on the
-114-

dissociating molecule, straightforward relationships based on the spectroscopic levels can be used. Thus, the dissociation energy calculated under the assumption that there is only a finite number of vibrational levels present, is given by [Her 501:
Do = ^_.4(»eXe
where coe is the vibrational contant and oyCg the vibrational anharmonic constant, both in cm'1,
The Birge-Sponer formalism quoted in [Hil 79], an extension of Herzberg’s equation, gives an extrapolation of the vibrational energy levels to the dissiociation limit:
D° =co„
4ioeXe
to which a correction should be applied with an ionicity parameter to find the true Dq value [Hil 79]. However, since these corrections are seldom known, the result obtained is only indicative. In Fig 7.1 the dissociation enthalpies of the alkaline-earth oxides and sulphides are shown. The theoretical dissociation energies, according to Birge- Sponer (Table 7.3) are shown as a solid line whereas the experimental or assessed values are given with markers. Figure 7.1 shows that the alkaline earth oxides and sulphides both follow the trend predicted by
Table 7.3 The calculated D° values for the alkaline earth oxides according to relations given by [Her 50] and [Hil 79],
x‘z+ “e MA D°[Her 50] D°|Hil 79]cm 1 kJ-mol"1 cm"1 kj-mol"1
BeO 1487.32 11.83 46184 552 45440 544MgO 785.06 5.18 29745 356 29352 351CaO 733.40 5.28 25468 305 25101 300SrO 653.20 3.92 27211 326 26884 322BaO 669.81 2.054 54606 653 54271 649
1 cm"1 = 11.96296 10 3 kJ-mol 1
-115-
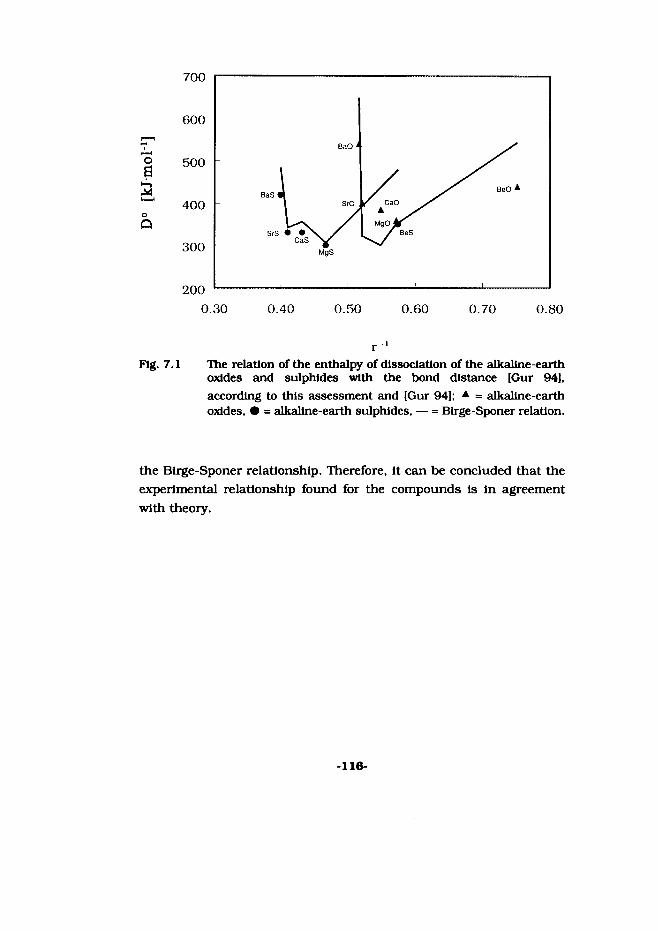
[kJm
ol1]
SrS • •
0.30 0.40 0.50 0.60 0.70 0.80
r 1Fig. 7.1 The relation of the enthalpy of dissociation of the alkaline earth
oxides and sulphides with the bond distance [Gur 941,according to this assessment and [Gur 94]; A = alkaline-earth oxides, • = alkaline-earth sulphides, — = Blrge-Sponer relation.
the Blrge-Sponer relationship. Therefore, It can be concluded that the experimental relationship found for the compounds Is in agreement with theory.
-116-
8. Phase diagrams:measurements &
assessments
Parts of this Chapter have been published previously as:
M.E. Huntelaar, E.H.P. Cordfunke, A. Scheele (1992), Phase relations in the system Sr0-Si02-Zr02 system: I. The system SrO-Si02, J. Alloys and Compounds 191, 87.
M.E. Huntelaar, E.H.P. Cordfunke (1993), The ternary system BaS103 - SrS103 - Si02, J. NucL Mater.(Proceedings IUPAC Symposium 1992) 201, 250.
117 Iffixrnkml
WIBWWJJ

8.1 Introduction
The vapour pressures of the oxides of BaO and SrO over the core - concrete melt are. In view of the high temperatures involved, of special concern as a source of transport of these radiological hazardous fission products. In the presence of steam they will be volatilized as hydroxides which are, compared to the oxides, more volatile by a factor of three. It is therefore important to have an accurate description of the activities of BaO and SrO In the core-debris matrix. To this purpose the phase relations in the system Ba0-Sr0-S102-Zr02 have been studied in detail. In this Chapter the results of selected binary and pseudo-binary sections of the phase diagrams will be presented.
8.2 Experimental
The DTA measurements were carried out in a Mettler TA 13-2000 apparatus using platinum crucibles. All measurements were made in a purified argon atmosphere to prevent the formation of volatile platinum oxides. The maximum temperature which can be obtained with the DTA-fumace is 1873 K. The temperatures were corrected using the melting point of high purity palladium (1825 K) as a reference. Almost all measurements were reproducible within 3 K. The sensitivity of the DTA apparatus was calibrated against the enthalpies of fusion of silver, gold, and palladium. The measurements were performed with ramp speeds between 1 and 25 K-min"1.
Quenching experiments were performed to obtain information on the phase relations at elevated temperatures up to 1640 K. For each quenching experiment a platinum crucible was sealed in a partly evacuated (Ar pressure ± 104Pa) Al203-stabilized quartz capsule. Before quenching, the capsule was equilibrated for at least 45 minutes at the temperature of interest in a high-temperature furnace, after which the capsule was dropped into ice-water. The temperature
-119-

was measured using a Pt-Pt/10%Rh thermocouple directly adjacent to the capsule.
Most handlings, such as weighing, were done in an argon-filled glove box. All masses were corrected for buoyancy in argon.
8.3 The binary system SrO-Si02
IntroductionThree compounds have been identified in this system: SrS103, Sr2Si04, and Sr3Si05. The phase diagram of the system (or parts of it) has been determined by Eskola [Esk 22], Greig [Gre 27], Fields et al. [Fie 72], and Hageman and Oonk [Hag 86]. The investigations of Eskola and Greig cover only the silica-rich side of the system. In addition, Hageman and Oonk measured the liquid immiscibility at this side of the system, and calculated the critical point to be at 2015 K and 8.7 mol% SrSi03. Eskola and Greig were not aware of the existence of Sr3SiOs which was first reported by Nurse [Nur 52]. According to Eyssel [Eys 70], Sr3SiOs(s) is not stable at room temperature, but decomposes into SrO(s) and Sr2S104(s), similar to Ca3SiOs in the CaO-Si02 system. Nevertheless, thermodynamic properties of this compound which could prove this, are completely lacking.
The phase diagram analysis by Fields et aL covers only the strontium oxide-rich side of the system. The liquidus curve of strontium oxide as proposed by these authors, is not compatible with the melting point of strontium oxide reported by Noguchi [Nog 69], and Traverse and Foex [Tra 69]. Fields et aL adopted the measurements made by Eskola and by Greig for the silica-rich side to construct a phase diagram of the Sr0-Si02 system.
Since the amount of strontium in irradiated nuclear fuel is small compared to the amount of silica present in the concrete, phase
-120-

relations in the SrSi03-Si02 subsystem are of particular interest in nuclear technology. This system is insufficiently known and has therefore been (re)investigated in the present thesis.
ExperimentalThe samples used in the DTA study, have been prepared by mixing known amounts of Sr2S104(s) and SrSi03(s), or SrSi03(s) and amorphous Si02(s) (Aldrich, 99.995% purity). The pure samples of Sr2Si04(s) and SrSi03(s) are the same as used for the solution calorimetric measurements (§ 5.4). All mixtures prepared for the SrSi03-Si02 subsystem, were at first partly melted at ± 1625 K and then recrystallized at 1550 K in a purified argon atmosphere. Before and after each measurement the samples were analysed by X-ray diffraction. In all mixtures containing Si02, cristobalite was found to be the crystalline phase at room temperature. However, in some of the mixtures with a high Si02-content small traces of tridymite were found as well, as will be discussed later in this Chapter.
DTA measurementsThe measured solidus and liquidus temperatures of the Sr2S104- SrSi03 and SrSi03-Si02 subsystems are listed in Table A8.1. Only a few points in the Sr2Si04-SrSi03 subsystem could be measured because of the very high temperatures and the steep liquidus curve of Sr2Si04. Temperatures on the Si02-branch of the SrS103-Si02 system were difficult to measure due to the relatively small enthalpy of fusion of Si02.
The melting temperature of pure SrSi03 was found to be (1853 ± 5) K, which is in excellent agreement with all previous measurements by Jaeger and van Klooster [Jea 15], (1851 ± 1), Eskola |Esk 22], (1853 ± 4) K, and Fields et aL [Fie 72], (1853 ± 15) K. For the melting temperature of SrSi03 the value (1853 ± 4) is selected.
-121-

Enthalpy of JusionThe enthalpy of fusion of SrS103 was very difficult to obtain, because SrSiOg melts 20 degrees below the maximum obtainable temperature of our DTA apparatus. Another problem was the determination of the peak area under the melting peak. Due to the A^Cp the base line is leaping and therefore the peak area could not be determined unequivocally. Values between 50 and 62 kJ-mol"1 were calculated, depending on the calculational method applied. For the enthalpy of fusion of SrSlOg the value of (56 ± 6) kJmol'1 is therefore suggested.
Phase relationsThe crystal structure of SrS103 is monoclinic as reported by Machida et aL [Mac 82], and Marsh and Herbstein [Mar 83]. We found that on addition of even small amounts of Si02 the crystal structures became a little distorted, indicating that a small solubility area for SrO in Si02 may exist. The size of this solubility region is, however, not established in this study and will be neglected here.
In all our attempts to obtain tridymite as a stable phase, cristobalite was found as the major Si02 phase. Experiments were performed in which several mixtures of SrO(s) and Si02 were heated up to 1573 K for a 240 hours period. In these experiments tridymite was not found after slowly cooling down to room temperature. A similar experiment with CaO(s) and Si02 also yielded cristobalite only. This is in contrast with our experiments with Si02 and Na2Q in which tridymite was readily obtained.
Quenching experiments at higher temperatures were performed with the sample Sr/Si-80 (molar ratio Sr0/Si02 = 0.4290) to establish the phase relations at higher temperatures. A quenching experiment at 1600 K yielded tridymite, cristobalite, and SrSi03 as the crystalline phases whereas at 1640 K only tridymite could be found in the partly molten sample. Equilibria at still higher temperatures could not be measured, because the capsules started to deform at already 1640 K. The presence of tridymite in the quenched samples indicates that at
-122-

2100
I860
184020001820
46 48 50 52 54
19001853
1640
1800
1700
1615141600
Fig. 8.1 The experimental phase diagram of the SrS103-S102 system.Insert: The eutectical region of the Sr2Si04-SrSi03 phase diagram. Symbols: □ = Eskola, V = Greig, ■ = Hageman and Oonk, and O = present study, ■■■ = tridymite «-» cristobalite transition.
higher temperatures the tridymite phase does exist. However, if mixtures are cooled down slowly from the same temperatures (1625 - 1640 K) only SrS103, cristobalite and, sometimes, a small amount of tridymite is obtained.
It can be concluded from these experiments that, although tridymite is formed in the liquid, the formation of cristobalite is kinetically more favourable. The presence of tridymite or cristobalite will, however, hardly effect the activities in the system because the energy
-123-

Eskola Fields et al.GreigHageman and Oonk2700
2300
1900 1853
1500
mol % SIO.
Fig. 8.2 The assessed phase diagram of the Sr0-S102 system; C = Cristoballte, T = Tridymite. The dashed lines Indicate the previous phase equilibria.
Table 8.1 Melting points, eutectic compositions, and eutectic temperatures In the system Sr0-Sl02.
Compound ^melt Te„tIK] IK] mol% S102
SrO 2938 235324231840
= 23 = 27
49.3SroSI05Sr^SiO^SrSi03
244325981853
sio2 " 1996 1615 65.8
-124-

differences between the two phases are extremely small [Hal 92]. For this reason, and the fact that tridymite is not a stable phase of pure (unstabilized) Si02 [Wri 90], the tridymite <-> cristobalite transition (c. 1743 K) will be disregarded here.
DiscussionOur DTA measurements show that previous measurements in the SrSi03-Si02 system by Eskola and Greig, who determined only a few points using a quenching method, are in fair agreement with the present results. According to our findings the eutecticum in the SrSi03-Si02 system is situated at (1615 ± 3) K and 65.8 mol% Si02, which is only slightly different from the 1631 K and 66.49 mol% Si02, obtained by Eskola. In Fig. 8.1 a new phase diagram of the SrS103- Si02 is presented; the Sr2Si04-SrSi03 system is given in the insert. The tridymite <-» cristobalite transtition temperature (1743 K) has been taken from the assessment of Wriedt [Wri 901.
In the Sr2Si04-SrSi03 subsystem the eutecticum is found to be situated at approximately (1840 ± 3) K and 49.3 mol% Si02. These results are different from the results obtained by Eskola and by Fields et aL, who found (1818 K, 46.4 mol% Si02) and (1818 K, ± 47 mol% Si02), respectively. The lower temperature found by Fields et aL can probably be explained by the use of the oxygen - acetylene torch which might have resulted in the formation of volatile hydroxides.
An assessed phase diagram of the whole Sr0-Si02 system is given in Fig. 8.2. The liquidus measurements by Fields et aL on the SrO-rich side, are possibly subjected to errors since they are in serious disagreement with the determinations of the melting point of SrO by Noguchi [Nog 69[, (2872 ± 20) K, and Traverse and Foex [Tra 69J, (2938 ± 20) K. We here select the value (2900 ± 40) K for the melting point of strontium oxide, the mean of the latter two authors. A list of melting points, eutectic temperatures, and eutectic compositions is given in Table 8.1.
-125-

Fig. 8.3 The assessed phase diagram of the Ba0-S102 system. Insert: part of the BaS103-Sl02 sub system.
8.4 The BaSi03-Si02 system
The binary system Ba0-S102 has been assessed from the literature [Esk 22, Gre 27, Rot 59]. In the system seven compounds have been Identified: Ba3S105, Ba2S104, BaSlOg, Ba2Si3Og, Ba5Si8021,Ba3Sl5G13, and BaSi205. The thermodynamic properties of most of these compounds are Insufficiently known or even completely lacking. The assessed phase diagram of the system Is given in Fig. 8.3.
8.5 The pseudo binary system SrS103-BaSi03
Experimented procedureAll the samples have been prepared by mixing known amounts of BaSi03(s) and SrS103(s). The starting materials, BaS103(s) and
-126-
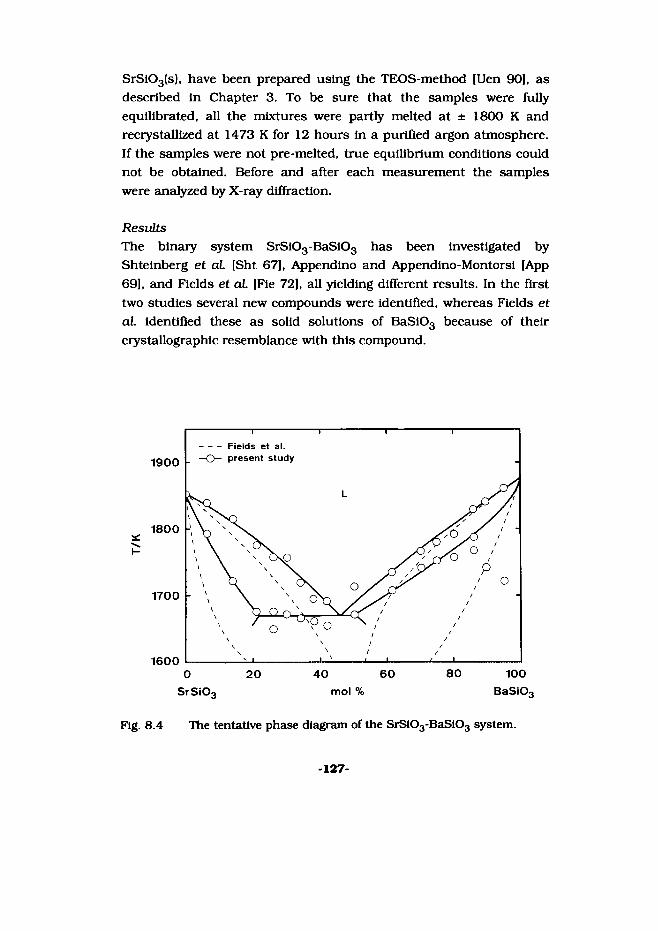
SrS103(s), have been prepared using the TEOS-method [Uen 90), as described In Chapter 3. To be sure that the samples were fully equilibrated, all the mixtures were partly melted at + 1800 K and reciystallized at 1473 K for 12 hours In a purified argon atmosphere. If the samples were not pre-melted, true equilibrium conditions could not be obtained. Before and after each measurement the samples were analyzed by X-ray diffraction.
ResultsThe binary system SrSi03-BaS103 has been investigated by Shteinberg et oL [Sht 67), Appendino and Appendino-Montorsi |App 69], and Fields et al [Fie 72], all yielding different results. In the first two studies several new compounds were identified, whereas Fields et aL identified these as solid solutions of BaSi03 because of their crystallographic resemblance with this compound.
Fields et al. present study1900
1800
1700
1600
BaSiO.SrSiO
Fig. 8.4 The tentative phase diagram of the SrS103-BaSi03 system.
-127-
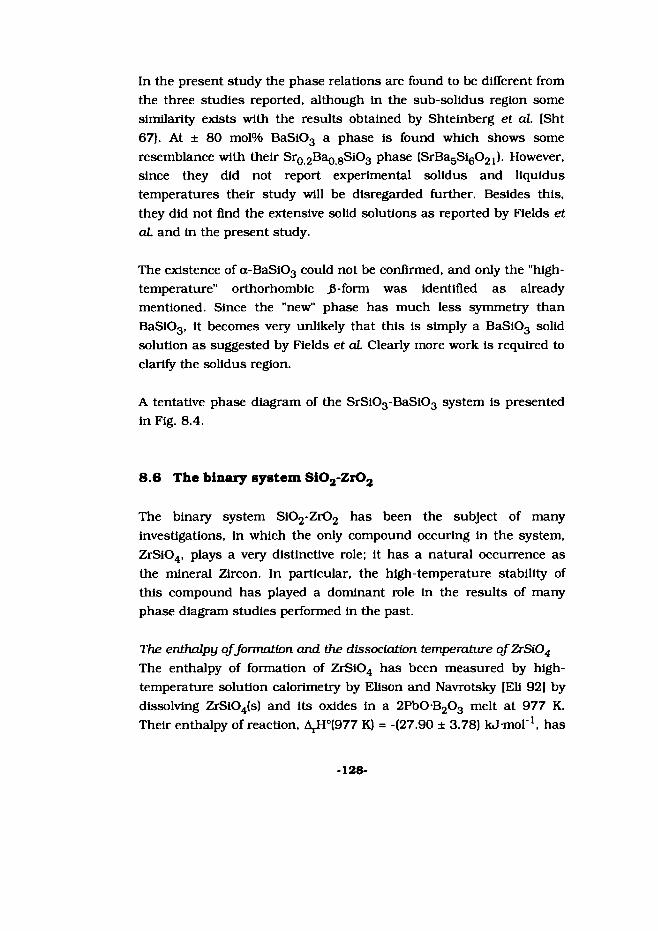
In the present study the phase relations are found to be different from the three studies reported, although in the sub-solldus region some similarity exists with the results obtained by Shteinberg et aL [Sht 67). At ± 80 mol% BaSi03 a phase is found which shows some resemblance with their Sr0 2Bao8Si03 phase (SrBa5Si6021). However, since they did not report experimental solidus and liquidus temperatures their study will be disregarded further. Besides this, they did not find the extensive solid solutions as reported by Fields et aL and in the present study.
The existence of a-BaSi03 could not be confirmed, and only the "high- temperature" orthorhombic J3-form was identified as already mentioned. Since the "new" phase has much less symmetry than BaSi03, it becomes very unlikely that this is simply a BaSi03 solid solution as suggested by Fields et aL Clearly more work is required to clarify the solidus region.
A tentative phase diagram of the SrSi03-BaSi03 system is presented in Fig. 8.4.
8.6 The binary system Si02-Zr02
The binary system Si02-Zr02 has been the subject of many investigations, in which the only compound occuring in the system, ZrS104, plays a very distinctive role; it has a natural occurrence as the mineral Zircon. In particular, the high-temperature stability of this compound has played a dominant role in the results of many phase diagram studies performed in the past.
The enthalpy of formation and the dissociation temperature of ZrSi04 The enthalpy of formation of ZrS104 has been measured by high- temperature solution calorimetiy by Elison and Navrotsky [Eli 92] by dissolving ZrSi04(s) and its oxides in a 2Pb0 B203 melt at 977 K. Their enthalpy of reaction, A,H0(977 K) = -(27.90 ± 3.78) kJ-mol'1, has
-128-

been used, together with the enthalpy increment functions obtained in Chapter 4, to calculate the enthalpy of formation at room temperature and we derive: AfH°(298.15 K) = -(2037.3 ± 4.1) kJ-mol"1.
Rosen and Muan [Ros 65) derived the Gibbs energy of formation of ZrSi04 in the temperature range of 1453 to 1639 K from equilibrium C02/C0 measurements of the reactions:
Co2S104(s) + Zr02(s) +2CO(g) = 2Co(s) + ZrS104(s) + 2COa(g) (1)and:
Co2S104(s) + 2CO(g) = 2Co(s) + Si02(s) + 2CG2(g) (2)
Combining reactions (1) and (2), one obtains:
Zr02(s) + Si02(s) = ZrSi04(s) (3)
for which the Gibbs energy of formation of ZrSi04 from the oxides has been derived. A third-law calculation of the results yields for the enthalpy of reaction: ArH°(298.15 K) = - (23.43 ± 0.72) kJ-mol"1. Combining these results with the enthalpies of formation Zr02 and Si02 (ECN, Tbase), we derive for the enthalpy of formation of ZrSi04(s) the value: AjH°(298.15 K) = - (2034.4 ± 1.4) kJ-mol"1.
Schuiling and Vergouwen [Sch 76] estimated the Gibbs energy of reaction of Zr02(s) + Si02(s) = ZrSi04(s) at 1000 K and lOMPa argon pressure by comparing the Gibbs energies of formation of several silicates from ZrSi04 and obtained, ArG°(298.15 K) = - (24.6 ± 3.9) kJ-mol"1. Combining this value with S°(298.15 K) of Si02 and Zr02 (ECN, Tbase), and S°(298.15 K) of ZrSi04 from this assessment, the enthalpy of formation of ZrSi04 is calculated to be: AfH°(298.15 K) = - (2038.0 ± 3.9) kJ-mol"1.
Curtis and Sowman [Cur 53] determined the decomposition temperature of (natural) ZrSi04 to be 1810 K. Since at this temperature A^G° = 0, the enthalpy of formation at 298.15 K can be
-129-

Table 8.2 The enthalpy of formation of ZrS104 at 298.15 K.
authors method T/K AfH,(298.15)/kJ-moV1
Curls and Sowman [Cur 53) DRosen and Muan [Ros 65] ESchulling and Vergouwen [Sch 76] EElison and Navrotsky |Elt 92] SMursic et aL |Mur 92] D
18101450 - 1639
10009771750
-2031.0+1.6 -2034.4+1.4 -2038.0 ±3.9 -2037.3 +4.1 -2030.1 +1.6
selected value: -2035.0 + 4.0
S = solution calorimetry, E = equilibrium measurements, D = decomposition measurements
calculated from a third-law calculation, assuming no solid solubility regions and an uncertainty in the temperature of 50 K, to give AfH°(298.15 K) = -(2031.0 ± 1.6) kJmol"1.
In a recent high-temperature neutron diffraction study Mursic et aL [Mur 92[ determined the decomposition temperature by the appearance of J3-cristobalite and the change in the crystallographic structure of ZrS104. The observed decomposition temperature of c. 1750 K corresponds with an enthalpy of formation of ZrSi04: AjH°(298.15 K) = -(2030.1 ± 1.6) kJmol"1.
The value selected for the enthalpy of formation of ZrSi04(s), is based on the assessed values in Table 8.2:
AfH°(298.15 K) = (2035.0 ± 4.0) J-mol"1
Since the decomposition measurements show a significant different result compared to the other measurements, the assumption that there is no solid solubility in the high-temperature phase regions is probably not justified. From Table 8.2 and Fig. 8.5 is clear that there exists a distinct influence between the enthalpy of formation and the temperature at which it has been determined at. This indicates that there does exist a solid solubility range for ZrSi04 at higher
-130-
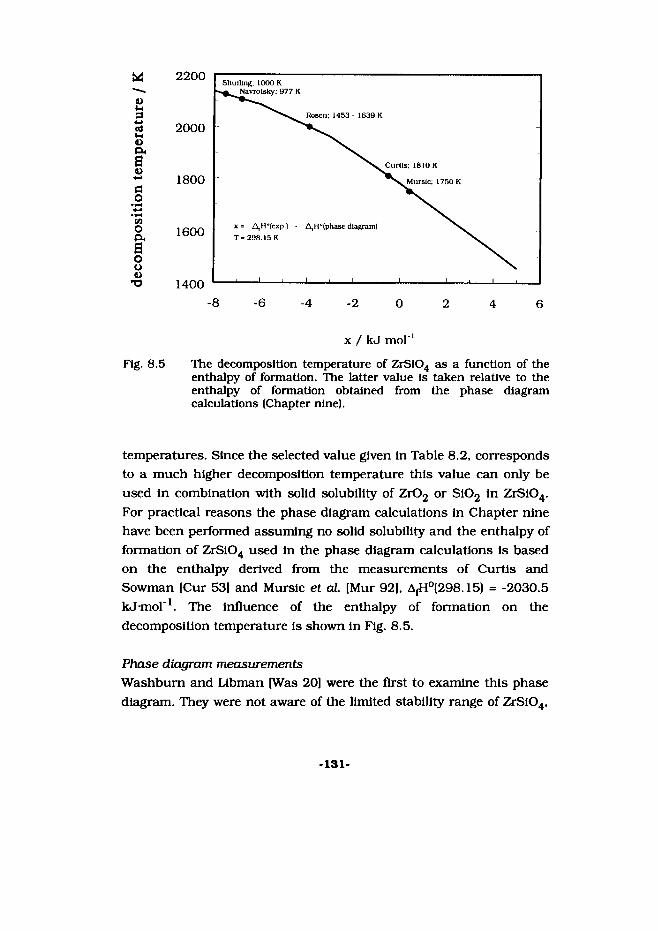
16IflotnOaoo1)
13
2200 Shulllng; 1000 KNavrolskv: 977 K
Rosen; 1453 - 1639 K
2000
Curtis; 1810 K
1800 Murslc; 1750 K
x = A,H°(exp.) - AfH°(phase diagram) T= 298.15 K1600
1400
x / kJ mol 1Fig. 8.5 The decomposition temperature of ZrS104 as a function of the
enthalpy of formation. The latter value is taken relative to the enthalpy of formation obtained from the phase diagram calculations (Chapter nine).
temperatures. Since the selected value given in Table 8.2, corresponds to a much higher decomposition temperature this value can only be used in combination with solid solubility of Zr02 or Si02 in ZrSi04. For practical reasons the phase diagram calculations in Chapter nine have been performed assuming no solid solubility and the enthalpy of formation of ZrSi04 used in the phase diagram calculations is based on the enthalpy derived from the measurements of Curtis and Sowman [Cur 53) and Murslc et aL [Mur 92[, A1H°(298.15) = -2030.5 kJmol1. The influence of the enthalpy of formation on the decomposition temperature is shown in Fig. 8.5.
Phase diagram measurementsWashburn and Libman [Was 20] were the first to examine this phase diagram. They were not aware of the limited stability range of ZrSi04,
-131-

(a) (b)
2720
7650
7250
X1L' \l +\
JRg %77o/.X
a/sbto so w/osotixx?
(c) (d)
2800
2600
------ ,------ 1------ r
^r-_2700e—I—i—i—r 1 1
-1 'X -
2400p
-
2200-i h OjSS '
Liquid(U
2000 - j \
18008i
1 1775**10*SiOj»L
or
Zr02 SS ZrSiQ4+L B75-, 5*
1600 -iZrSi04
1 l l
ZrSi04* SiOj
1 1 1 l88 X ""
1 !l0
Zr0220 40 60 80 100
Si02
Fig. 8.6 The system Zr02 - S102 according to various authors; (a) Wasbum and Libman [Was 20]; (b) Zimova [Zir 34]; (c) Curtis and Sowman [Cur 53]; (d) Geller and Lang (Gel 49] and, Cocco and Schromek [Coc 58].
-132-

and determined the melting (liquidus) points of several mixtures, including pure ZrSi04, with an oxygen-acetylene torch and an optical pyrometer, as the temperature on which small droplets would form on bulk material with the same composition (Fig. 8.6a)
Structural studies on Zr02 - S102 have been performed by Barlett [Bar 32], She found that ZrS104 dissociates into Zr02 and a silica-rich liquid and under other undefined conditions into Zr02 and Si02, and was therefore the first - although not fully aware of if - to acknowledge the decomposition of this compound. Besides this she found a two liquid region which was, however, not confirmed before 1956 [Tor 56].
Wartenberg and Gurr [War 31] already made clear that the method used by [Was 20] must have yielded wrong results, due to evaporation of S102. Zimowa [Zir 34] also measured the liquidus points in the system Zr02-Si02 using an oxygen-acetylene torch. In view of the comments Wartenberg and Gurr made on the technique applied by Wasbum and Libman, the composition of the samples was determined analytically after the measurements. Notwithstanding these precautions, the measurements are in error since the samples are in equilibrium with (slowly decomposing) ZrSi04. Also the conclusion that approximately 10 mol% Si02 dissolves in Zr02 cannot be sustained by later studies (Fig 8.6b).
Curtis and Sowman [Cur 53], and Dietzel and Tober [Die 53], almost simultaneously assessed the phase diagram of the Zr02-Si02 system. Whereas the former includes a detailed study to the decomposition temperature of natural ZrSi04 (1810 K), the latter refers to Geller and Yavorski [Gel 45], who obtained (2050 ± 10) K. These large differences in decomposition temperature, determine whether or not ZrSi04 decomposes in the solid state or has an incongruent melting point (Fig. 8.6c and d). Direct experimental evidence which support the solid state decomposition has only been obtained very recently by Mursic et aL [Mur 92a], using high-temperature neutron diffraction. In this study they found synthetic ZrSi04 to decompose at approximately 1750 K into tetragonal Zr02 and cristobalite (SiOa).
-133-

(e) (f)
2800
2600
2430*\ Liquid
-Tetnapana/ ZrO± + Liquid
Tetr ZrGf + Cristo6aiitc2200
Zircon + Cristob*htc
Zr02 s s + Liquid2000
Zircon * Tndymiit
1800 Si02 + Liquid -" 3adeh/tyiie
(MonoiZrOg)
Zircon + High Quartz1600
Zircon i*- Lor/ Quartz1400
Fig. 8.6icont ) The system Zr02 - Si02 according to various authors; (e) Toropov and Galakhov [Tor 56]; (f) Butterman and Foster [But 67],
Toropov and Galakhov [Tor 56] established the phase diagram by determining the liquidus temperatures in the composition range from 15 to 65 mol% Zr02 (Fig 8.6e). In this region they found evidence for the two-liquid region earlier suggested by Barlett [Bar 32]. In a theoretical study Glasser and Warshaw [Gla 60] postulates, on the basis of the phase diagram suggested by Geller and Lang [Gel 59], a liquid miscibility gap between Zr02 and 50 mol% Si02. However, since the data they used, are in error due to incorrect phase equilibria, their postulate Is obviously based on the wrong assumption. Moreover, Toropov and Galakhov had already determined the high- temperature phase-equilibria in this system, three years earlier.
In a crystallographic study Cocca and Schromek [Coc 58] conclude that their results are in contradiction with the results obtained in the phase diagram study by Curtis and Sowman [Cur 53] (Fig. 8.6d).
-134-

However, due to the very slow decomposition of ZrSi04 above its decomposition temperature, the Debye patterns recorded do not necessarily reflect equilibrium circumstances.
Keler and Andreyeva [Kel 62] studied the X-ray patterns of samples of Zr02 and Si02 after being fired at temperatures between 1773 and 2323 K. Their study revealed no sign of any relevant solid solution of Si02 in Zr02. Besides, they found extensive formation of ZrS104 in the samples heated between 1973 and 2023 K. The samples heated above 2073 K dissociated into Zr02 and Si02.
Butterman and Foster [But 67] studied the Zr02-S102 system by assessment and measurement. There results (Fig 8.6f) are in good agreement with the present assessment and with the present calculated phase diagram shown in Fig 9.5 (next Chapter).
As already mentioned in the previous section the decomposition temperature and the enthalpy of formation of ZrSi04 are not consistent. Whereas indirect (thermochemical) evidence support a high decomposition temperature (2000 to 2150 K), direct (crystallographic) measurements by Mursic et al. [Mur 92] suggest a much lower value (1750 K). Since the phase diagram studies nor the assessment are not conclusive**, it is decided to use the of the decomposition temperature of Mursic et aL in the phase diagram optimizations given in the next Chapter.
8.7 The binary system Zr02-Sr0
The phase relations in the system ZrOa-SrO have been thoroughly studied by Noguchi et aL [Nog 69], and Traverse and Foex [Tra 69]
($$) The selected enthalpy of formation of ZrS104, AjH"(298.15) = - (2035 + 4) kJ-mol"1 (Table 8.2), corresponds to a decomposition temperature of (2025 ± 215) K.
-135-
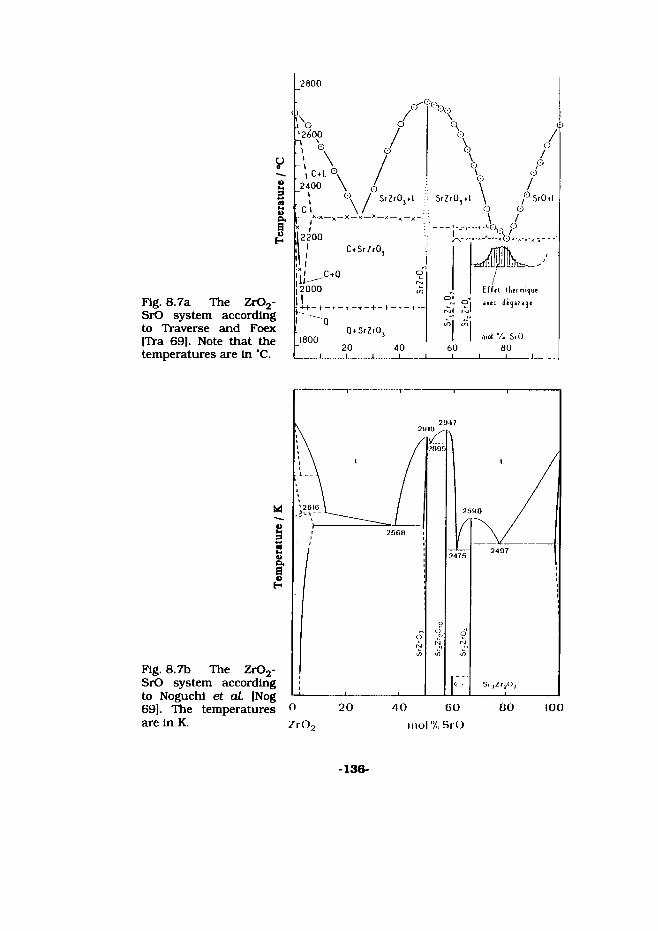
2800
SrZrO +L SrO+LSrZrO,+L
C+SrZrO
2000Fig. 8.7a The ZrOa- SrO system according to Traverse and Foex [Tra 69]. Note that the temperatures are in "C.
mol V. SfO
2590
2560
2497
Fig. 8.7b The Zr02- SrO system according to Noguchi et ai [Nog 69]. The temperatures are in K. mol % SrO
-136-
who both used a solar furnace (Fig. 8.7). According to Tiloca and Jorba (Til 64] four compounds have been reported to exist: SrZr03, Sr4Zr3O10, Sr3Zr207, and Sr2Zr04. Whereas the existence of three of these compounds have been confirmed in other studies [Coc 65, Nog 69, Tra 69], the existence of Sr4Zr3O10 is somewhat controversial and only confirmed by [Nog 69]. Besides that, the phase diagram studies by [Nog 69] and [Tra 69] are contradictory in the obtained melting and decomposition temperatures of the compounds they both agree on. Based on the phase diagram optimization performed in Chapter 9, the system as proposed by Traverse and Foex, is considered the most feasible here, and the assessment by Cordfunke and Huntelaar [Cor 89] is superseded.
8.8 The ternary system BaSi03-SrSi03-Si02
In this study results of a completely revised SrSi03-BaS103 system are presented. The activities in the binary systems SrSi03-Si02, BaS103-Si02, and SrS103-BaS103 have been calculated. From the functions thus obtained, the ternary system BaSi03-SrS103-Si02 has been calculated.
Thermodynamic description of the pure compounds The phase relations have been calculated using for the enthalpy of fusion of SrSi03 the recently determined value of (56 ± 6) kJ-mol"1 (§ 8.2). The enthalpy of fusion of BaSi03 is assumed to be identical to this value. The melting temperatures of BaS103 and SrSi03 are 1877 K and 1853 K, respectively. The melting temperature, 1996 K, and the enthalpy of fusion of Si02 (9.6 kJ-mol'1) have been taken from [Glu 94].
The ternary system BaSi03-SrSi03-Si02In the ternary system the compound BaSrSi3Og has been found by Fields et al. [Fie 72]. Since this compound has, according to their results, a very limited stability range - between 1498 K and 1548 K -
-137-

BaSiOy
1800 K
SrSiO.
Fig. 8.8 The calculated ternary system BaSi03-SrSi03-Si02 at 1800 K.
it will be neglected in the activity calculations. Another compound, SrBa5Si10O2e. was reported by Appendino and Appendino-Montorsi. However, these compounds have not been confirmed by any other author.
For the calculations only the solidus-liquidus equilibria were considered, thus neglecting sub-solidus contributions. From the binary systems Redlich-Kister expressions were obtained using the EXTXD and the UQFIT computer programs [RUU 89]. The temaiy system was calculated using the obtained expressions neglecting ternary interactions. Is was assumed that AfusC° was negligible for the temperature region chosen. The ternary system calculated for T = 1800 K is given in Fig. 8.8.
-138-
DiscussionConsiderable deviations from ideal behaviour occur in both the BaSi03-Si02 (Fig. 8.3) and the SrSi03-Si02 (Fig. 8.1) system, particularly on the Si02-rich side of the systems. In the SrSi03- BaSi03 system deviations in the liquid are relatively small. A minimum value of -4500 J-mol"1 for the GE is reached at the ratio n(BaS103)/n(SrSi03) = 1. This means that the activity coefficient has the value 0.74 at 1800 K. The behaviour of the solid and the liquid near the 80 mol % BaSi03 will have larger deviations due to the ternary phase present.
mxTPAeeteitell BLANK
-139-

9. Calculations in the ternary system Sr0-Si02-Zr02
Parts of this Chapter will be published in:
M.E. Huntelaar, E.H.P. Cordfunke and H.L. Lukas, Calphad: "Calculations in the binary system SrO-Si02" •
-141-
9.1 Introduction
As already mentioned In the first Chapter, one of the goals of this thesis Is to calculate the chemical behaviour (= chemical activity) of the fission product SrO in the multi-component system Sr0-Si02- Zr02. It Is expected that the presence S102 and Zr02 will have a strong Influence on the release behaviour of SrO and on the source term. In order to be able to calculate the chemical activity of SrO, the ternary system has to be approximated mathematically by phase diagram calculations. However, before doing that the activity coefficients In the binary systems will have to be dealt with first.
The basis of phase diagram calculations is that at chemical equilibrium the following thermodynamic expression is valid:
L p( = 0 9.11=1
In which,
p{ = p° + RT In a, 92where pj is the Gibbs energy of the pure substance (1) and a1 the chemical activity of the same substance in a chemical system. The chemical activity is defined as: a = xy, where y stands for the activity coefficient, so equation 9.2 becomes,
p, = p° + RT In x, + RT In y, 9.3
For a two phase system A-B, where xA = 1 - xB, the Gibbs energy of the system can thus be expressed as:
ga,b = x pA + (1 pg + RT ( x In xA+ (1 -x) In Xg) g 4+ RT ( x In yA+ (1 -x) In yB)
-143-

In this equation the term RT (x In xA + (1-x) In xB) is the Gibbs energy of mixing which depends only on the temperature and the composition, and can thus be calculated. The only unknown expression in the equation is the term RT ( x In yA + (1-x) In yB). In other words, for the description of a binary phase diagram we need a formulation of the latter term, also called the excess Gibbs energy, Ge, preferably as a function of composition and temperature.
9.2 Models
Finding an expression for y as f(x,T) is the goal in phase diagram modelling. Ininitally, only mathematical "curve fitting" procedures were used, such as the Redlich-Kister polynomial. However, with the increase of computational power more exotic functions were "built" using a more theoretical background. Although, these functions are often called "physical models", they only origin from a physical background and are by no means real physical models. The predictive capability of these functions for unmeasured and unknown interactions in chemical systems is fairly limited. Not denying the practical use of the quasi-physical models in particular fields, the "physical model" covering the range from salt systems to slags still has to be found.
Notwithstanding this, the influence of different chemical models can be distinct, even in binary systems. Visually the calculated phase diagrams using two different models may look alike, however in terms of excess enthalpy (HE) or excess entropy (SE) they may not. This is indicated in Fig 9.1, in which the influence of various models on the shape of GE or HE is shown.
Redlich-Kister modelAs already mentioned, the Redlich-Kister model is an "old type" of model, just as the Legendre polynomial, and does not relate to any physical background. The general notation is given in equation 9.5:
-144-

G E
[arb
itrar
y uni
ts]
------ Redlich Kisler
Associate IQ. Chemical
composition xFig. 9.1 The Influence of a regular description on the shape of the Gibbs
energy curve for various chemical Interaction models (Redllch- Kister, Associate and Quasi-Chemical) using identical parameter settings.
c uT=NGe = xfl-x) I \Kj 9.5
1
In this expression, Kj can be expressed as a function of T:
Kj= Aj + BjT + CjT InT + DJT2 + E/T3........ 9.6
However, normally two terms, a constant and a T-term are sufficient. Due to the similarity with G = H - TS, A and B are called HE and SE, respectively. The first line of coefficients, where J = 1, is independent of the composition since J-l Is zero. If at J = 1 also no temperature dependency exists the Redlich-Klster expression becomes a regular
-145-

model, Ge = x(l-x)A. The use of more coefficient lines Kj introduces the composition depedency into the model. Since this model is based on an expansion of polynomials with no physical background, the use is merely as a "curve fitting" model.
Quasi-Chemical modelThe Quasi-Chemical and the Associate models on the contrary do have a physical background. The Quasi-Chemical model [Pel 86] is based on the interaction between two different particles, e g. A and B. Solving the equilibrium constant for the reaction, AA + BB = 2AB, based on both enthalpy and entropy. This makes the model in principle suitable for chemical systems in which highly ordered liquids are present. Although the basic principles are easy, the calculations to obtain the excess Gibbs energy are elaborate and simplifications need to be made. For instance, the model is based on a one-dimensional quasi-lattice (with A and B positions). This approximation is necessary to ensure that the mathematical expressions can be solved unequivocally. Inherent to the form of the initial chemical equation - which gave the model its name - it will automatically produce an extreme in the excess Gibbs energy curve at the AB composition (at x = V6). By introducing what is called "equivalent fractions" - giving the A # AB and AB «• B equilibria different weights - , the model can be made asymmetric so that the extreme will appear at any composition chosen.
Associate modelIn the Associate Model less deeper thoughts have been expressed. Whereas in the Quasi Chemical model the amount of association in the liquid is determined by the "equilibrium constants", in the Associate Model a specific compound (associate), with its own thermodynamic stability, is assumed (in the liquid). The interaction of the associate, e g. ApBq, with pure A and B is then treated independently of each other. The composition of the associate can be chosen freely. In the optimization process the stability of the associate, which has no physical meaning, as well as the interaction parameters of the associate, with A and B, are determined.
-146-

aybcd
cd
mo
— Associate
~ ” Quasi Chemical
0.00 0.20 0.40 0.60 0.80 1.00
composition xFig. 9.2 The Influence of a constant (negative) excess enthalpy on the
shape of the excess Gibbs energy curve using an Associate and Quasl-Chemlcal model with minima at x = 0.5, 0.65, 0.75, 0.80, and 0.85, respectively.
In Fig. 9.1 the excess Gibbs energy Is shown, calculated using the three models mentioned using Identical regular solutions. The figure shows the difference In the shape as calculated from the three models, the round curvature of the Redlich-Kister and the pronounced V-shape of the other two models (on top of each other). Differences between the Quasl-Chemlcal model and the Associate model show up when calculating the excess Gibbs energy curves for several "associate" compositions (Fig 9.2). The minimum value of the associate model becomes less negative compared to that of the Quasl- Chemlcal model, also the slopes of both excess curves become different. This means that in the case of "regular" solutions all the models will produce a different Interaction parameter In order to give finally the same excess value.
-147-

The strong V-shape of the Integral excess Gibbs energy In the liquid of the Associate and Quasl-Chemlcal models Indicates that the liquid at the position of the minimum is very stable, In other words, that there exists a highly ordered liquid (an associate). Particularly in systems which have proven to contain highly orded liquid melts, such as silica and zirconia systems, the use of models incorporating these properties could be very beneficial. From previous modelling excercises on the alkaline-earth silicates [Hal 94], associates have proven to exist. Similarly an associate is expected in the Sr0-S102 system at Sr2S104.
9.3 Computer programs
The activity coefficient (phase diagram optimization)As pointed out in the previous paragraphs the sole purpose of phase diagram modelling is to find a mathematical expression for the chemical activity coefficient. Finding that mathematical expression can be difficult because there are many boundaiy conditions to fulfil. First of all there are the input parameters determining the y. Not only liquldus points, but also solidus points. Invariant points (e g. fusion temperatures of pure substances, eutectic temperatures and compositions), incongruent melting points, enthalpies of reaction, and so on, have to be used. Secondly, choslng a chemical model implies a certain mathematical format, and this may need computational power. And, last but not least, all calculations will have to be performed relative to the reference states, p°, of the pure substances involved. It will not come as a total surprise that all these relations are Impossible to solve with an abacus. It is therefore only with the increase of computational power in the last few decades, that phase diagram modelling and calculation have become increasingly popular.
Keeping in mind the demands a phase diagram program will have to address, it was chosen to use the phase diagram optimization programs BINGSS and TERGSS of Hans Leo Lukas [Zim 76, Luk 77a,
-148-
Luk 77b, Luk 92], These programs are least square fitting programs which are able to use phase diagram data and thermodynamic data simultaneously. Besides, the BINGSS program is suited for optimizations using the chemical models mentioned earlier.
Phase diagram calculationsAfter the activity coefficients have been calculated (optimization), the phase relations can be visualized in a calculated (assessed) phase diagram. To this purpose use have been made of the BINFKT and the TERFKT computer programs, also by Hans Leo Lukas. The optimization and visualization is a iterative process which finally yields the definitive excess parameters and the calculated phase diagram (Luk 82).
The actual displaying of the phase diagrams in this thesis has been performed with the commercial MTDATA computer program [Eri 90). The latter program has the advantage that it can automatically display the stable phase boundaries in a phase digram, whereas in the BINFKT and TERFKT programs every phase boundary has to defined specifically. Furthermore, MTDATA also contains a CHEMSAGE-like [Dav 94] Gibbs energy optimizer which allows for the calculation of multi-phase multi-component equilibria (Chapter 10). Therefore, the use of the Lukas-programs was restricted to the optimization of the phase diagram only.
Ternary (and higher order) phase diagramsAs shown in the previous paragraphs, a (binary) phase diagram is determined by the activity coefficient, and the thermodynamic stabilities of the pure compounds. The activity coefficient can be expressed mathematically as a function of temperature, y = f(x,T), and in this description the deviations from ideal behaviour are stored. It is evident that in a ternary system (A-B-C) a relation exists between the
excess functions of the ternary system (G^c) and the binary systems
-149-

(GfD G^J- This relation is given in equation 9.7,Ao* dC’ Un
=/(G^) */(g£c) >/(G^) + Gfenuyy interaction 9 7
Due to the fact that in a binary system the composition relation is given by xA + xB = 1, and in a ternary system by xA + xB + Xq = 1, the excess function in the ternary system is not a straight forward addition of the binaries.
In equation 9.7 the excess Gibbs energy of the ternary system is presented as a function of the binary excess functions. Since there does not exist a mathematical consensus how to arrive from a binary to a ternary system, several different methods (e.g. Kohler, Muggianu, Toop, Colinet) have been developed in the past years. The mathematics behind the different formalisms will not be discussed here, but are described in detail in [Mug 75, Jac 90]. The excess Gibbs energy at any point in the ternary system at temperature T is related to the Gibbs energies in the binary systems at the same temperature. In the method according to Mugiannu these binary compositions are found by dropping perpendiculars from the ternary point towards the binary axis. At the composition of the intersection with the binary axis the excess Gibbs energies of the binaries are calculated. The GE at the ternary composition is then found by a summation of binaries using weighing factors to ensure that the total mole fraction does not exceeds one. In general, however, the differences in results between the models are limited.
Also in equation 9.7 a ternary interaction coefficient is introduced with which a correction can be made for the three-particle interaction ABC. Whether or not a ternary interaction coefficient is required, depends on a number of things. First of all, if the chemical and physical behaviour of the binary end members is totally different (basic, acidic, ionic) it can be expected that this requires an additional
-150-
correction in the ternary system. Another point is the occurence of compounds in the ternary system, such as in the Sr0-Si02-Zr02 system. The chemical stability of these compounds can influence the ternary excess Gibbs energy, and may thus require an interaction coefficient.
9.4 Phase diagram calculations
The binary system Sr0-Si02Using the thermochemical data of the pure substances, Sr2S104 and SrSi03 obtained in the previous Chapters, SrO from the ECN thermochemical database TBASE##, and the Si02-polymorphs from the assessment of Hallstedt [Hal 92] (Table A9.1), a description for the activity coefficients in the binary system SrO-SiOa has been calculated. The phase diagram information has been taken from the assessment, given in Chapter 8.
During the modelling process it turned out to be very difficult to describe the system using the Quasi-Chemical and the Associate model. Both models turned out to be incompatible with the chemical stabilities of Sr2Si04 and SrSiOg in combination with the liquid immiscibility gap on the Si02-rich side of the system. Due to the strong V-shape produced by the models, the boundary conditions could only be fulfilled by using a large number of excess parameters to overcome this particular shape. Since this is a contradiction, the use of both models was abandoned. Only the Redlich-Kister model could describe the system accurately enough within a fairly limited number of excess parameters. The reason not to use too many excess parameters is given by the fact that for MCCI calculations the excess functions will have to be extrapolated far beyond the temperature they
(##) The thermochemical database TBASE has been described previously in J. Phase EquiL [Cor 93b] and contains over 700 substances, with applications in the nuclear field, and is the computerized version of the Thermochemical Databook [Cor 90c].
-151-
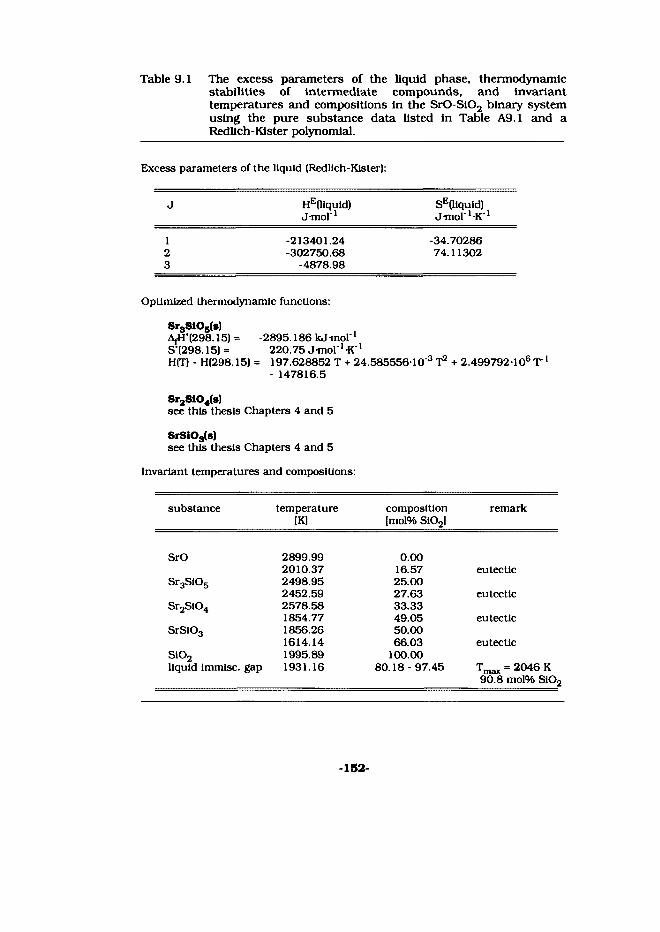
Table 9.1 The excess parameters of the liquid phase, thermodynamicstabilities of intermediate compounds, and invarianttemperatures and compositions in the Sr0-S102 binary systemusing the pure substance data listed in Table A9.1 and aRedlich-Kister polynomial.
Excess parameters of the liquid (Redlich-Kister):
J HE(liquid)J mol1
SE(liquid) Jmol1 K 1
1 -213401.24 -34.702862 -302750.68 74.113023 -4878.98
Optimized thermodynamic functions:
Sr3SiOg(s)AjH'(298.15) = -2895.186 kj mol"1 $•(298.15) = 220.75 Jmol ’-K"1H(T) - H(298.15) = 197.628852 T + 24.585556 10 ^ T2 + 2.499792 106 T 1
- 147816.5
Sr3S104(s)see this thesis Chapters 4 and 5
SrS103(s)see this thesis Chapters 4 and 5
Invariant temperatures and compositions:
substance temperature[K|
composition [mol% SI02]
remark
SrO 2899.99 0.002010.37 16.57 eutectic
Sr3S105 2498.95 25.002452.59 27.63 eutectic
Sr2Si04 2578.58 33.331854.77 49.05 eutectic
SrSi03 1856.26 50.001614.14 66.03 eutectic
SiOo 1995.89 100.00liquid tmmisc. gap 1931.16 80.18 - 97.45 Tmax = 2046 K
90.8 mol% Si02
-152-

have been obtained at. Very complex functions may result under those (MCCI) circumstances in mathematical artefacts - like solid regions appearing stable in the liquid ! - in the phase diagram. Nonetheless the SrO-side of the system does not correspond with the assessed phase diagram shown in Chapter 8. Especially the eutectic temperature of SrO-Sr3SiOs is considerably lower. Attemps to increase the eutectic temperature by allowing solid solubility in SrO(s), incongruent melting of Sr3S105 and further adjustment of the thermodynamic stability of this compound, did not decrease the uncertainty in this part of the system.
3000
a Greig (1927)0 Eskola (1922) x Fields et al. (1972) n Hageman and Oonk (1986) O Huntelaar et al. (1993)
L + crislobalite
SrSi03 + Iridymile
SrSi03 + quartz
Fig 9.3 The calculated phase diagram of the Sr0-S102 system using thefunctions listed in Tables 9.1 and A9.1.
-153-

1.00
oUcco
">u03cdO
<oo
0.80
0.60
0.40
0.20
0.00 —
0.00 0.20 0.40 0.60
------- 2000K
------2500 K
------.'10(10 K
0.80 1.00
mol% SiQ
Fig 9.4 The calculated chemical activity of SrO In the liquid phase In the SrO-S102 system at 2000, 2500 and 3000 K. Insert: The logaritmic chemical actvlty of SrO in the same system.
Using the excess parameters obtained in the optimization process (Table 9.1), the phase diagram shown in Fig 9.3 has been calculated. Also listed in Table 9.1 are the optimized thermodynamic functions of Sr3SiOs and the invariant temperatures and compositions. The calculated chemical activity of SrO in the liquid phase as a function of the mole fraction of Si02 at 2000, 2500 and 3000 K is shown in Fig 9.4.
The binary system Si02-Zr02Using the assessment given in the previous Chapter the activity coefficients in the binairy system Si02-Zr02 have been determined. The thermodynamic stabilities of the modifications Si02 and Zr02 have been taken from TEASE, whereas the stability of ZrS104 has been taken from this thesis (Table A9.1).
-154-
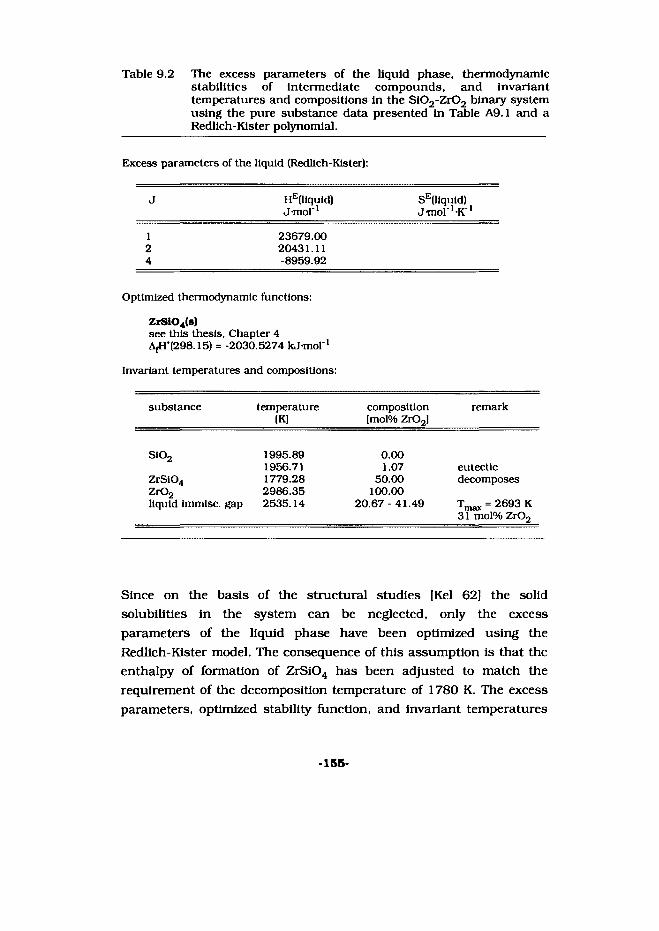
Table 9.2 The excess parameters of the liquid phase, thermodynamicstabilities of intermediate compounds, and invarianttemperatures and compositions in the Si02-Zr02 binary systemusing the pure substance data presented in Table A9.1 and aRedlich-Kister polynomial.
Excess parameters of the liquid (Redlich-Kister):
J HE(liqutd) SE(liquid)J mol ' Jmol'-K"1
1 23679.002 20431.114 -8959.92
Optimized thermodynamic functions:
ZrS104(s)see this thesis. Chapter 4 AfH‘1298.15) = -2030.5274 kJ-mol"1
Invariant temperatures and compositions:
substance temperature composition remarkIK] [mol% Zr02|
S102 1995.89 0.001956.71 1.07 eutectic
ZrS104 1779.28 50.00 decomposesZr02 2986.35 100.00liquid immisc. gap 2535.14 20.67-41.49 Tmax = 2693 K
31 mol% Zr02
Since on the basis of the structural studies |Kel 62] the solid solubilities in the system can be neglected, only the excess parameters of the liquid phase have been optimized using the Redlich-Kister model. The consequence of this assumption is that the enthalpy of formation of ZrSi04 has been adjusted to match the requirement of the decomposition temperature of 1780 K. The excess parameters, optimized stability function, and invariant temperatures
-155-

and compositions are shown in Table 9.2, the corresponding phase diagram is shown in Figure 9.5.
As already mentioned in the assessement in Chapter 8 the measurements by Washburn and Libman [Was 201, and Zimova [Zir 34] give erromous results, and therefore, do not fit the calculated diagram. Apart from the decomposition temperature there is a large resemblance of the calculated diagram with the assessment of Butterman and Foster [But 67].
3000
Liquid
cristobalite t 1-ZrC)2
trkiymite . ZrSi04X = Wasburn et al. (1920) 0 = Zimova (1934)A = Curtis el al (1953)O = Toropov et al. (1956) HI = Huntelaar et al. (1995)
Fig 9.5 The calculated phase diagram of the Si02-Zr02 system usingthe functions listed in the Tables 9.2 and A9.1.
-156-
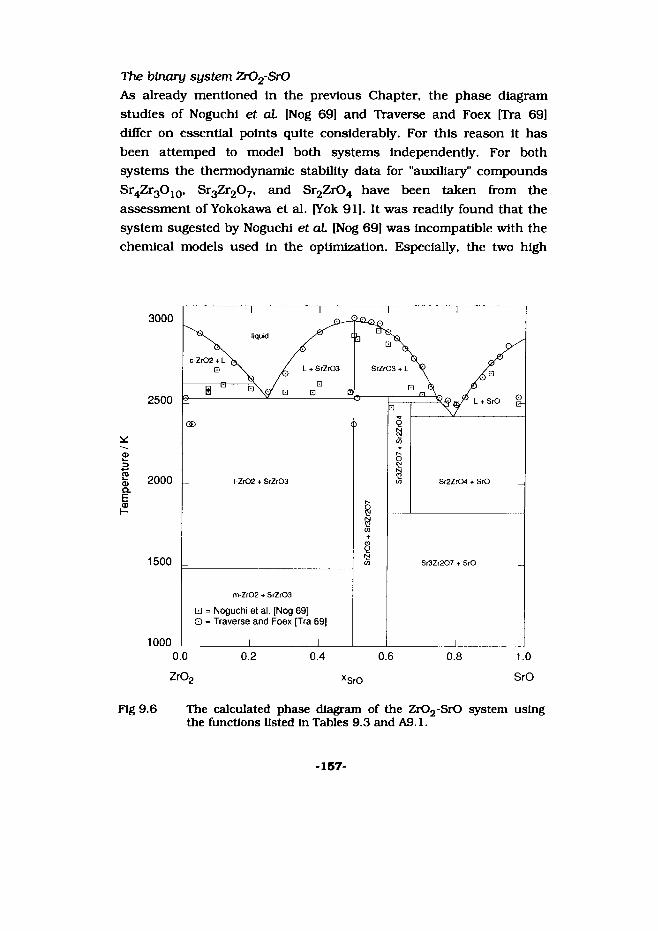
The binary system Zr02-Sr0As already mentioned In the previous Chapter, the phase diagram studies of Noguchi et aL [Nog 69] and Traverse and Foex [Tra 69] differ on essential points quite considerably. For this reason it has been attemped to model both systems independently. For both systems the thermodynamic stability data for "auxiliary" compounds Sr4Zr3O10, Sr3Zr207, and Sr2Zr04 have been taken from the assessment of Yokokawa et al. [Yok 91]. It was readily found that the system sugested by Noguchi et aL [Nog 69] was incompatible with the chemical models used in the optimization. Especially, the two high
L + SrZrOS SrZrOS + L
L + SrO
t-Zr02 + SrZr03 Sr2Zr04 + SrO
Sr3Zr207 + SrO
m-Zr02 + SrZrOS
0 = Noguchi et al. [Nog 69]O = Traverse and Foex [Tra 69]
0.0 0.2 0.4 0.6 0.8 1.0
Zr02 xSr0 SrO
Fig 9.6 The calculated phase diagram of the Zr02-Sr0 system usingthe functions listed in Tables 9.3 and A9.1.
-157-

Table 9.3 The excess parameters of the liquid phase, thermodynamicstabilities of Intermediate compounds, and invarianttemperatures and compositions In the Zr02-SrO binary systemusing the pure substance data presented In Table A9.1 and aRedllch-Kister polynomial.
Excess parameters of the liquid (Redllch-Kister):
J HE(llquld)Jmol"1
SE(liquid)Jmol '-K 1
1 -259009.93 43.767732 3953.894 -3297.87
Optimized thermodynamic functions:
SrZrOa(s)see this thesis Chapters 4 and 5
Sr3Zr207(s)^'(298.15) = -4136.4 kJmol'1S"(298.15) = 284.6 J-mol ' -K"1H(T) - H(298.15) = 289.420 T + 1.7410'2T2 + 4.678-106T"1 - 103527.4
Sr3Zr04(s)AjH"(298.15) = -2364.6 kJmol"1S'(298.15)= 169.5 Jmol 1 K 1H(T) - H(298.15) = 167.90T+ 1.129 10 ^ + 2.516106T"1 - 59522.6
Invariant temperatures and compositions:
substance temperatureIK]
composition |mol% SrO]
remark
Zr02 2986.35 0.002532.24 24.78 eutectic
SrZrOa 3006.86 50.00Sr3zr207 2543.69 60.00 decomposes
liquid comp. 74.22Sr^ZrO^ 2508.07 66.67 decomposes
liquid comp. 75.412419.90 79.13 eutectic
SrO 2899.99 100.00
-188-

ou.CO
oedcdoa<uo
0.80
0.60
O.fiO0 400.40
— 2500 K
------ 3000 K
0.00 0.20 0.40 0.60 0.80 1.00
mol% Zr02
Fig.9.7 Hie calculated chemical activity of SrO In the liquid phase inthe Zr02-SrO system at 2500 and 3000 K. Insert: The logaritmlc chemical actvlty of SrO In the same system.
melting compounds, SrZrOg and Sr4Zr3O10, with their steep liquidus curves were impossible to model properly. On the contrary, the system suggested by Traverse and Foex [Tra 69], modelled with great ease. Since the reported solid solutions in the system are of no importance to MCCI they have been neglected in the calculations. Because of the reason mentioned above, the modelled phase diagram reflects the measurements by [Tra 69]. During the modelling proces the thermodynamic properties of Sr3Zr207, and Sr2Zr04 have been further optimized (Table 9.3). In the same Table 9.3 also the invariant temperatures and compositions are listed. The calculated phase diagram is shown in Figure 9.6. The calculated chemical activity of SrO in the liquid phase as a function of the mole fraction of Zr02 at 2500 and 3000 K is shown in Figure 9.7.
-159-

The ternary system Sr0-Sl02-Zr02Using the excess functions obtained in the previous paragraphs, the ternary system can be calculated in principle. However, as already mentioned in paragraph 9.4, the existance of ternary compounds may introduce the necessity for ternary interaction parameters. In the determination of speudo-binary systems SrSi03-ZrS104 and SrSi03- SrZr03, the ternary compounds SrZrSi207 and Sr7ZrSi6021 were found to melt incongruently at respectively, 1711 and 1874 K. Since these temperatures are relatively low for MCCI accidents, these compounds will not play any role in MCCI calculations.
Fig.9.8 The calculated ternary system Sr0-Si02-Zr02 at 2000 K.
-160-
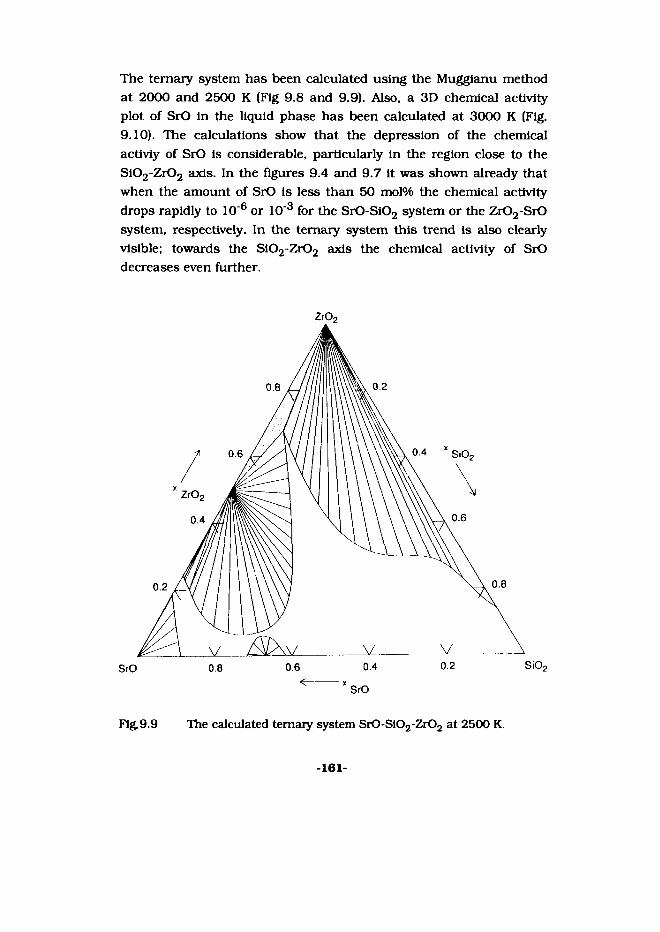
The ternary system has been calculated using the Muggianu method at 2000 and 2500 K (Fig 9.8 and 9.9). Also, a 3D chemical activity plot of SrO in the liquid phase has been calculated at 3000 K (Fig. 9.10). The calculations show that the depression of the chemical activiy of SrO is considerable, particularly in the region close to the Si02-Zr02 axis. In the figures 9.4 and 9.7 it was shown already that when the amount of SrO is less than 50 mol% the chemical activity drops rapidly to 10"6 or 10'3 for the Sr0-Si02 system or the Zr02-Sr0 system, respectively. In the ternary system this trend is also clearly visible; towards the Si02 Zr02 axis the chemical activity of SrO decreases even further.
Fig.9.9 The calculated temaiy system Sr0-Si02-Zr02 at 2500 K.
-161-

r 0.20
0.80
Fig, 9.10 A three dimensional representation of the change In the chemical activity of SrO In the liquid phase as a function of S102 and Zr02 composition at 3000 K.
DiscussionA direct translation of these results to a hypothetical MCCI accident is difficult due to the limited amound of components considered here. But let us assume that the fuel - cladding debris contains 84.0 mol% U02, 15.5 mol% Zr02, and 0.5 mol% SrO, thus relative to Zr02: 96.9 mol% Zr02 and 3.1 mol% SrO. If the system Zr02-Sr0 would have been (chemically) ideal the chemical activity of SrO should be 0.031, whereas in the non-ideal system we find: ± 5-1 O'4 (3000 K) I If we start adding Si02 (from the concrete) to the system the depression of SrO-activity will increase. At equivocal amounts of Zr02 and Si02 the SrO concentration has dropped to 1.6 mol%, the chemical activity however dropped to ± 410"6 at 3000 K (4000 times as low). Since the vapour pressures of SrO(g) and Sr(OH)x are directly related to the chemical activity of SrO(l) by:
-162-

SrOfl) = SrO(g)
ArG°(71 = -RT InK = -RT In r oSrO(0
a 4000 times smaller chemical activity also means that the vapour pressure becomes 4000 times as small as well.
-163- NEXT PAQE(S) left BLANK

10. MCCI calculations
-165- IWEXTPAOBiS)
teftBLAMK

10.1 Introduction
In the previous Chapters much effort has been undertaken to determine or to assess the thermodynamic properties of barium and strontium silicates and zirconates which finally resulted in the calculation of sections of the ternary system Sr0-Si02-Zr02. In this Chapter we will deal with the applications of these thermochemical calculations in nuclear technology.
The main problem encountered in thermochemical code-calculations of large multi-component problems, such as in Molten Core Concrete Interactions, is the thermodynamic database. The accuracy and usefulness of the final result of the calculations depend not only on a good definition of the chemical problem to be calculated, but also on the thermodynamic description of the substances occurring in that system. Whereas the former item can be tackled by a sound analysis of the problem, the latter is often difficult to judge properly, being dependent on the database used. Even in cases where all, or almost all, thermodynamic data are already present in one single database, questions remain to be answered, such as:- are the data consistent ?- are data or compounds missing ?- should interactions parameters, GE(T,x), be included ?The fact that data are already present in one database does not automatically imply that they are consistent. In fact, the larger a database the more difficult it becomes to maintain its consistency. It is therefore better to use smaller dedicated databases for one particular subject.
Whether or not compounds are missing in a database is difficult to judge. Besides the obvious ones, such as zirconates in a zirconia- containing system, the necessity of "new" compounds has either to be deduced from validation calculations or from experiments. Finally, whether or not the use of activity coefficients is relevant, does depend
-167-

on the type of problem and the purpose of the calculations. Moreover, by the introduction of interaction parameters, problems tend to become increasingly more difficult with eveiy component added to the system.
In particular, the latter two points will be addressed in this Chapter. In paragraph 10.2 results of MCCI calculations will be discussed which have been performed with a thermodynamic database in which interaction coefficients have not been included. Thereafter, in paragraph 10.3 the results of model calculations will be discussed in which the interaction parameters for all the components are included. Finally, in paragraph 10.4 the differences between the two types of calculations will be discussed and compared with the results obtained in Chapter 9 of this thesis.
10.2 ACE calculations with the ECN database
To the purpose of MCCI calculations, ECN has compiled a large thermodynamic database, in cooperation with GRS-K61n and Siemens/KWU-Erlangen and within the third Framework Programme of the European Union. The use of this database is especially important for the calculation of MCCI-related problems, such as the development of Core Catchers, and the distribution of aerosols in the containment building as a result of a severe nuclear accident.
The database, KWUECN, originated from three different databases:- GRS-L68GRSV3,- GTT-RSIEHOO1.13T,- ECN-TEASE.
The ECN-database was chosen as the primary source, since it contains thermodynamic data based on critical assessments. Besides this, the ECN-database is updated on a regular basis. The second
-168-
source is the GRS-database. Finally, for the thermodynamic data not covered in the first two databases, the GTT database was used. The priority in the order of the GRS and the GTT databases was established in an elaborate database comparison in which all the essential compounds were compared with the thermodynamic descriptions in TEASE [Cor 93b].
The final database contained 30 elements and 685 compounds. For a more detailed description of the database and the database comparison prior to it, see [Cor 94eJ. Partly due to the amount of elements it was unfeasible to include interaction parameters (as in the previous Chapter). Therefore, it was chosen to describe all solid compounds as (individual) stoichiometric phases and include separate ideal solution phases for liquid oxides and metals
ValidationBefore using the new database, validation calculations were performed. In dialogue with Siemens/KWU and GRS it was decided to validate the database by recalculation of the Advanced Containment Experiments (ACE) L6 and L8, performed at ANL for EPRI. The main difference between these two ACE experiments is that L6 uses a siliceous type of concrete, whereas L8 uses limestone concrete [Fin 95].
The calculational tool for the validation calculations was the modified ChemSage code of GRS, called SageProg. The ChemSage Code of GRS was modified in such a way that it is able to include experimental results, such as erosion data (ablation velocity) and temperatures, time-dependently. After the validation calculation the integral calculated release of selected elements should match the release found in the original experiment.
The results were obtained using the same input amounts of chemical species as used in the ACE-L6 and -L8 experiments. The erosion data (ablation velocity) and the temperature development obtained in these
-169-

frac
tiona
l rel
ease
^
frac
tiona
l rel
ease
10 1
Ba Ce La Mo Ru Sr Te U Zr Ag In element released
10.1 The results from the validation calculations for the ACE-Lb experiment using the KWUECN database.
Ba Ce La Mo Sr Te U Zr Ag In element released
Fig. 10.2 The results from the validation calculations for the ACE-L8 experiment using the KWUECN database.
-170-
experiments were used as boundary conditions. The results are presented as the fractional release of several fission products, and are compared with the experimental results from the L6 and L8 experiments. In Fig. 10.1 the results from the ACE-L6 calculations are shown, whereas Fig. 10.2 shows the results of the ACE-L8 validation calculations. Note that in the "L6" calculation, the experimental and the calculated results are in good agreement, whereas In the "L8" calculation larger differences remain. These differences between the experimental and the calculated results can originate from several sources:(1) The calculations were performed under the assumption of ideal
behaviour. It is, however, not possible to give an indication of the influence of chemical activities since this depends on the (unknown) values for GE.
(2) The thermodynamic data of solid substances are only well- defined up to about 1500 K (for most substances); above this temperature the accuracy of the (extrapolated) data will decline. Seen the high melting temperatures of most oxides occurring in MCCI, this certainly will also hold for the liquid data.
(3) Lack of essential compounds in the database.
Due to the reasons mentioned above, calculations concerning systems, such as MCCI, are considered satisfactory when the calculated results compared to the experimental ones fall within the- one-order-of-magnitude-difference boundary limits. Seen the amount of uncertainties in the calculations, the results of the ACE-L6 calculations can therefore be called very reasonable. Although most of the results from the ACE-L8 calculations fall within the acceptable error range, a further explanation is required in this case. This will be done in the next section (10.3).
Prior to the validation calculations just mentioned, some introductory calculations were performed with a number of essential compounds lacking (the silicates and zirconates of lanthanum and cerium). In Fig.10.3 the results from these calculations are shown compared to the
-171-

uCOelUUcsaoocd
element / experiment
Fig. 10.3 The results of the ACE-L6 and L8 calculations showing the Influence of essential and missing compounds on the results.
results obtained In the ACE-L6 and L8 experiments. They clearly indicate that the calculated releases decrease drastically when essential compounds are added to the database. Note that, at the time these calculations were performed, only estimated thermodynamic functions of the silicates and zlrconates of cerium and lanthanum existed. In the meantime these functions have been measured [Bol 96).
The results from the L6 calculations indicate clearly that omitting silicates and zlrconates of lanthanum and cerium In the calculations, results in a considerable increase of the calculated release of these fission products. However, in the L8 experiment this Is not the case. As will be shown in the next section (10.3) zlrconates and silicates play a less dominant role with limestone-concrete since the formation of solid solutions is more favourable than the formation of silicates.
-172-

10.3 Model calculations
As a part of the third frame-work programme of the EU. thermochemical calculations have also been performed using the non- ideal approach. In collaboration with AEA-Technology (Harwell), the chemical interaction database containing the system U02-Zr02-Si02- Ca0-Al203-Mg0-Sr0-Ba0-La203 (Che 92, Bal 93), has been updated (Boe 94) and expanded with Ce02/Ce203. Using this database, calculations of the chemical activity of BaO, SrO, Ce02 and La203 have been performed as a function of the corium/concrete composition and temperature. Furthermore, the oxide database has also been extended to include the gas-phase species of the 11- component system, and calculations have been performed to determine the extent of vaporization of the components.
Two types of models have been used to describe the solution phases. For the liquid phase the Associate Redlich-Kister model has been used, whereas for the solid solutions a sublattice model has been used. To obtain more insight in the chemical behaviour of the four species mentioned above, some aditional calculations have been performed using the ideal approach, see [Cor 96] for a detailed description of the work.
A matrix of calculations has been produced in order to study the less volatile fission products BaO, SrO, La203 and Ce02/Ce203. In this Chapter only the calculations for SrO will be discussed in detail. Thermochemical equilibrium calculations have been performed at temperatures of 1000, 1500, 2000, 2500 and 3000 K for five different compositions of corium/concrete with 90%, 80%, 60%, 40%, and 20% corium. Furthermore, two types of concrete have been considered: siliceous (silica-rich) and limestone (CaO and MgO-rich). The amount of Zr02 in the corium was considered to be 30% of the amount of Zr present in the core.
-173-

ResultsAs is shown in figure 10.4, the partial pressure of SrO(g) is suppressed considerably at the higher Si02 concentrations. Although it was expected Si02 to be the major substance determining the chemical activity of SrO, it is found from the model calculations that this is only true at higher Si02 concentrations. Unexpectedly, the vapour pressure of SrO(g) is enhanced (activity coefficient > 1) at lower Si02 concentrations, while the results obtained in Chapter nine show an activity coefficient < 1 for SrO in the Henrian region (low solute concentrations). One, or more, of the other matrix components must have a positive Henrian deviation, as normally expected. Studying the influence of the other matrix components (U02, Zr02, CaO, MgO, Al2Og) on SrO. reveals that all binary systems give a depression of the chemical activity of SrO in the Henrian region, with the exeption of CaO. Since CaO is the major component in limestone- concrete, the influence of this oxide on SrO will be the strongest at
" siliceous, ideal
siliceous, non Ideal
limestone, ideal
limestone, non-Ideal
mol % SiO 2
Fig. 10.4 The partial pressure of SrO(g) at 3000 K as a function of the amount of Si02 for the ideal and the non-ideal system, and the two types of concrete.
-174-
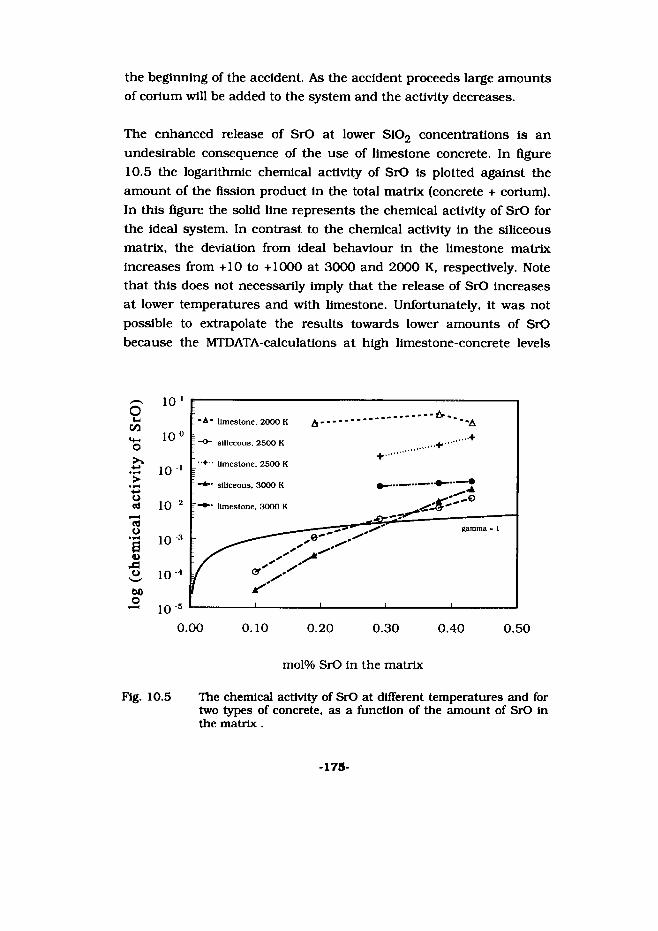
the beginning of the accident. As the accident proceeds large amounts of cerium will be added to the system and the activity decreases.
The enhanced release of SrO at lower Si02 concentrations is an undesirable consequence of the use of limestone concrete. In figure 10.5 the logarithmic chemical activity of SrO is plotted against the amount of the fission product in the total matrix (concrete + corium). In this figure the solid line represents the chemical activity of SrO for the ideal system. In contrast to the chemical activity in the siliceous matrix, the deviation from ideal behaviour in the limestone matrix increases from +10 to +1000 at 3000 and 2000 K, respectively. Note that this does not necessarily imply that the release of SrO increases at lower temperatures and with limestone. Unfortunately, it was not possible to extrapolate the results towards lower amounts of SrO because the MTDATA-calculations at high limestone-concrete levels
A- limestone. 2000 K
I -O- siliceous. 2500 K
limestone. 2500 K
" siliceous. 3000 K
" limestone, 3000 K
gamma = 1
mol% SrO in the matrix
Fig. 10.5 The chemical activity of SrO at different temperatures and for two types of concrete, as a function of the amount of SrO in the matrix .
-175-

failed. It Is, however, expected that since the enhancement Is possibly due to a lack of S102, the chemical activity of SrO will remain high.
10.4 Final conclusions
The results of the present calculations cannot be related directly to large-scale experiments, because the use of chemical models prohibits a mechanistic approach to the problem. Due to allready time- consuming calculational effort in mechanistical codes, the introduction of chemical models would leed to an excessive increase of CPU-tlme. However, the use of the non-ideal thermochemical calculations serves another purpose: the study of specific chemical problems and the validation of more simplified approaches.
The model calculations with the siliceous type of concrete, as shown in the previous section, indicate that at higher concentration of SiOa the chemical activity of SrO is lowered by two orders of magnitude compared to the ideal assumption. If we compare the relative chemical activity coefficient of the non-ideal system shown in Fig. 10.4, with the values calculated in Chapter nine, a good agreement in found. In Fig. 10.4 the partial pressure of SrO at 0 mol% Si02 starts at approximately 2-10'5 atm. and drops to 10"8 atm at 60 mol% Si02, a suppression with a factor 3-103. This value is very close to the factor 4TO3 obtained above. The difference is that in the ternary system SrO Sl02-Zr02 the suppression factor was calculated relatively towards pure SrO, whereas in the "real" system the initial composition already contained several components with a particular Influence on the SrO release. Besides this, a real MCCI system is much more diluted with other species.
Since we know how the chemical activity of SrO behaves as a function of composition (Fig. 10.5), we can also better understand the results obtained in section 10.2. In the early start of MCCI the temperatures
-176-
are high and the matrix contains relatively high levels of fission products. In the ACE experiments, we start with approximately 0.45 mol% SrO; according to Fig. 10.5 the activity coefficient of SrO is then about 10 (siliceous concrete). While the concrete starts to ablate, the fission products become more and more diluted and the chemical activity will drop. At the same time the temperature will slowly decrease as a result of which the system becomes more ideal, thus activity increases. As a whole the activity coefficient will not change very drastically since both movements cancel each other out. This explains why the (ideal) ACE-L6 calculations on siliceous concrete turn out so well. However, in the limestone-concrete cases no large activity depression occurs due to a lack of SiOa, and consequently the releases remain high and are not predicted very well.
The final conclusion therefore is that for an understanding of MCCI phenomena it is necessary to have a detailed knowledge of the chemical processes occurring. If the variation in the activity coefficients is relatively small and not too far from unity (as in the ACE-L6 experiment), calculations can be performed using the ideal assumption. Provided, of course, that no esential compounds are missing from the thermochemical database. This simplification cannot, so far, be made for the ACE-L8 experiment; the use of an ideal database with only stoichiometric compounds will result in an underprediction of the accident, caused by the absence of silica and due to fact that solid solutions are formed rather than line compounds.
-177-

References
-179-
INEXT PAQE(S)
toft BLANK

[Ack 611
IAEA 82] [Aid 51] [Als 87] [Als 88] [Als 92]
[Als 95]
[App 69]
[Asa 72]
|Bal 93]
[Bar 32] [Bar 57]
[Bar 73]
[Bar 77]
[Bat 72]
[Bic 54] [Ble 39]
Ackermann R.J., R.J. Thom (1961), Ceramic Science voL 1, Pergamon Press, New York, Oxford, London, Paris.PWR Degraded Core Analysis (1982), Report ND-R-610(S). Aldrich L.T. (1951), J. AppL Phys. 22, 1168.Alsmeyer H. (1987), NucL Engrg. Des. 103 115.Alsmeyer H. (1988), Kemtechnik 53(1), 30.Alsmeyer H. (editor) (1992), Fission Product Release from Molton Corium Concrete Interactions (MCCI) Proc. of the second OECD (NEA) CSNI specialist meeting on Molton Core Debris-Concrete Interactions, Karlsruhe, Germany, 1-3 April, Report KJK 5108 (NEA/CSNI/R(92)10.Alsmeyer H., Cenerlno G., Cordfunke E.H.P., Fioravanti D., Fischer M., Foit J.J., Howe L.D., Huntelaar M E.. Locatelli S., Parozzi F„ Szabo I„ Turland B.D., Vidard M., Wegener D. (1995), Molten Corium / Concrete Interaction and Corium Coolability - A State of the Art Report, Commission of the European Communities, Directorate-General XII, Science, Research and Development Report UER 16649 EN.Appendino P., Appendino-Montorsi M. (1969), Ann. Chim. Roma 59, 806Asano M., Yamamoto Y., Sasaki N., Kubo K. (1972), Bull Chem Soc. Jpn. 45, 82.Ball R.G.J., Mignanelli M.A., Barry T.I., Gisby J.A. (1993), J. Nuc Mater. 201, 238.Barlett H.B. (1932), J. Am. Ceram. Soc. 14, 837.Barany R„ King E.G., Todd S.S. (1957), J. Am. Chem. Soc. 79, 3639.Barin I., Knacke O (1973), Thermochemical properties of Inorganic Substances Springer-Verlag, Berlin.Barin I„ Knacke O., Kubaschewski O. (1977), Thermodynamic Properties of Inorganic Substances; Supplement, Springer Verlag. Berlin, Heidelberg, New York.Batalli-Cosmovici C., Michel K.W. (1972), Chem. Phys. Lett. 16, 77.Bickel P.W., Holroyd L.N. (1954), J. Chem. Phys. 22, 1793. Blewett J.P., Liebhafsky H.A., Hennelly E.F. (1939), J. Chem. Phys. 7, 478.
-181-

[Boe 95]
[Bol 96] [Bre 53] [Bre 59]
[Bro 85] [Bun 70] |But 67] [Cen 95]
[Che 93] [Cla 33] [Coc 58] [Col 64]
[Col 84]
[Cop 89]
[Cor 64] [Cor 75]
[Cor 79]
[Cor 89]
[Cor 90a]
[Cor 90b]
Boer R. de, Cordfunke E.H.P., Huntelaar M.E., Konlngs Mason P.K., Vis M.G.M. van der. (1995), Data
comparison AEA-ECN (EU refuelling programme) ECN-Report ECN-CX--95-039.Bolech M., Thesis University of Amsterdam, In preparation. Brewer L. (1953), Chem. Rev. 52, 1.Brewer L., Drowart J. (1959), Rep. UCRL-8686 University of California, Berkeley, California.Brown I D.. Altermatt D. (1985), Acta Cryst B41, 244.Bunsen R.W. (1870), Ann. Phys. 141, 1.Butterman W.C., Foster W.R. (1967), Am. Miner. 52, 880. Cenerino G., Cordfunke E.H.P., Huntelaar M E. (1995), Fission Product Release During MCCI: CEC Nuclear Safety program: MCCI project Report ECN-RX-95-003.Chevalier P.Y. (1993), J. NucL Mat. 186, 212.Claassen A., Veenemans C.F. (1933), Z. Physik 80, 342.Cocca A., Schromek N. (1958), Ceramica 12, 45.Colin R., Goldflnger P„ Jeunehomme M. (1964), Trans. Faraday Soc. 60, 306.Cole R.K. Jr.. Kelly D P. Ellis M.A. (1984), A Computer Program for Analysis of Molten-Core Concrete Interactions Report SAND84-1246 (NUREG/CR-3920).Copus E.R., Blose R.E., Brochemann J.E., Gomez R.D., Lucero A.D. (1989), Core-Concrete Interactions Using Molton Steel with Zirconium on a basaltic Basement: The SURC-4 Experiment Report SAND87-2008 (NUNREG/CR 4994). Cordfunke E.H.P. (1964), J. Phys. Chem. 68, 3353.Cordfunke E.H.P., Ouweltjes W., Prlns G. (1975), J. Chem. Thermodynamics 7, 1137.Cordfunke E.H.P., Muis R.P., Prlns G. (1979), J. Chem. Thermodynamics 11, 819.Cordfunke E.H.P., Konlngs R.J.M. (1989), Thermochim Acta, 156, 45.Cordfunke E.H.P., Konlngs R.J.M., Ouweltjes W. (1990), J. Chem. Thermodynamics 22, 991.Cordfunke E.H.P., Konlngs R.J.M., Laan R.R. van der, (1990), Thermochim Acta 157, 315.
-182-
[Cor 90c]
[Cor 91]
[Cor 93a]
[Cor 93b[
[Cor 94a]
[Cor 94b|
[Cor 94c]
[Cor 94d]
[Cor 94e]
[Cor 96]
[Cou 50[ [Cox 89]
[Cur 53]
[Dav 94]
[Dag 74[
Cordfunke E.H.P., R.J.M. Konlngs (Editors) (1990), Thermochemical Data for Reactor Materials and Fission Products North-Holland: Amsterdam, New York, Oxford, Tokyo.Cordfunke E.H.P., Huntelaar M.E. (1991), Thermochemical data for the silicates and zlrconates of barium, strontium, lanthanum and cerium ECN Report ECN-C—91-017.Cordfunke E.H.P., Konlngs R.J.M. (1993), J. Nuc. Mater. 301, 57.Cordfunke E.H.P., Konlngs R.J.M. (1993), J. Phase EquiL 14(4), 457.Cordfunke E.H.P., Huntelaar M.E. (1994), Fission Product Release Calculations for ACE L6 and L8 - a database optimization for MCCI calculations, ECN NC-037-94.Cordfunke E.H.P., Ouweltjes W. (1994), Experimental Thermochemistry IUPAC, Chapter 3, Blackwell Scientific Publications, Oxford.Cordfunke, E.H.P., IJdo D.J.W. (1994), J. Solid State Chem. 109, 272.Cordfunke E.H.P., Huntelaar M.E. (1994), unpublished results.Cordfunke E.H.P., Laan R.R. van der, Miltenburg J.C. van (1994), J. Phys. Chem. Solids 55(1), 77.Cordfunke E.H.P., Huntelaar M.E., Mason P.K. (1996), Thermochemical Data and Modelling In the Multi Comnponent Oxide Systems" 3th Frame Work Programme of the European Union, in preparation.Coughlin J.P., King E G. (1950), J. Am. Chem. Soc. 72, 2262. Cox J.D., Wagman D.D., Medvedev V.A. (1989), Key Values for Thermodynamics CODATA, Hemisphere: New York, N.Y. Curtis C.E., Sowman H.G. (1953), J. Am. Ceram. Soc. 36, 190.Davies R.H., Dinsdale AT.. Gisby J.A. Hod son S.M., Barry T. (1994), MTDATA Handbook: NPL Databank for Metallurgical Thermochemistry.Dagdigian P.J., Cruse H.W., Schultz A., Zare R.N. (1974), J. Chem. Phys. 61, 4450.
-183-

[Dea 581
[Die 53]
[Dro 64]
[Dm 51]
(Eli 92]
[Eng 76]
[Ent 94]
[Eri 90] [Esk 22] [Eys 70] [Far 75] [Far 76] [Fel 69] [Fie 72]
[Fie 74] [Fin 95]
[Foi 95]
[Fom 73]
[Gab 82]
[Gay 68]
[Gel 45]
Dear P S. (1958), Bull Via. Polytech. Inst. Eng. Exp. Sta. Ser. 51, 6 (quoted in: Levin E.M., Robbins C.R., MacMurdie H.F. (Ed.) (1964), Phase Diagrams for Ceramists p 258).Dietzel A. von, Tober H. (1953), Ber. Deu. Keram. GeselL 30, 71.Drowart J., Exsteen G., Verhaegen G. (1964), Thins. Faraday Soc. 503, 1920.Drummond G., Barrow R.F. (1951), Trans. Faraday Soc. 47, 1275.Elison A.J.G., Navrotsky A. (1992), J. Am. Ceram. Soc. 75, 1430.Engelke F., Sander R.K., Zare R.N. (1976), J. Chem. Phys. 65, 1146.Enthal Enthalpy increment and heat capacity fitting programme, ECN-Nuclear Energy, Nuclear Chemistry, 1994. Erikson G., Hack K. (1990), Met. Trans. 21B, 1013.Eskola P. (1922), Am. J. Set 5th series 4, 331.Eyssel W. (1970), NeuesJahrb. Mineral Monatsh. 23, 534. Farber M., Srivastava R.D. (1975), High Temp. Set 7, 74. Farber M., Srivastava R.D. (1976), High Temp. Set 8, 73. Felsche J., Hirsiger W. (1969), J. Less comm. Metals 18, 131. Fields J.M., Dear P.S., Brown J.J. (1972), J. Am. Ceram. Soc. 55, 585.Field R.W. (1974), J. Chem. Phys. 60, 2400.Fink J.K., Thompson D.H., Armstrong D.R., Spencer B.W., Sehgal B.R. (1995), High Temp. Mat. Set 33, 51.Folt J.J.. Reinmann M., Adroguer B., Cenerino G., Stiefel S. (1995), The WECHSL-MOD3 Code: A Computer Program for the Interaction of a Core Melt with Concrete Including the long term behaviour Report FZKA 5416.Fomlchev E.N., Slyusar N.P., Krivorontenko A.D., Tolstaya, V.Ya. (1973), Ognuepory, 7, 36. [Engl, transl. 7, 432] Gabellca-Robert M., Goreaud M., Labbe Ph., Raveau B. (1982), J. Solid State Chem. 45, 389.Gaydon A.G. (1968), Dissociation Energies of Diatomic Molecules (Chapmann and Hall) p.267.Geller R.F., Yavorski P.J. (1945), J. Res. Nat Bur. Stand. 35,
-184-

[Gel 49]
[Gha 88]
[Gla 60]
|Gos 93]
[Gre 27] [Gre 67] [Gur 94]
[Hag 86]
[Hal 92] [Hal 94]
[Hea 90]
[Her 37] [Her 50]
[Her 73]
[HU 75] [HU 79] [Hln 57] [Hub 83] [Hun]
[IAE 93] [Ing 55]
Geller R.F., Lang S.M. (1949), Phase diagrams for Ceramists; The AmCeram Soc. Suppl. 1. 157.Ghanbarl-Ahari K„ Brett N.H. (1988), Br. Ceram. Trans. J. 87, 27.Glasser F.P., Warshaw I., Roy R. (1960), Phys. Chem Glasses 1. 39.Gospodinov G.G., Marchev V.M. (1993), Thermochim Acta 222, 137.GrelgJ.W. (1927), Am J. Set 5th series 13, 1.Grebenshchikov (1967), hxorg. Mater. 3, 1410.Gurvitch L.V., Veyts I V. Alcock C.B. (editors) (1994), Thermodynamic Properties of Individual Substances, Volume 3, CRC Press, London.Hageman V.B.M., Oonk H.A.J. (1986), Phys. Chem Glasses 27, 194.Hallstedt B. (1992), Calphad, 16, 53.HaUstedt B., HlUert M., Sellbey M., Sundman B. (1994), Calphad 18, 31.Heames T.J., Williams D.A., Bixler N.E., Grimley A.J., Wheatley C.J., Johns N.A., Chown N.M. (1990), VICTORIA: A Mechanistic Model of Radionuclide Behaviour in the Reactor Coolant System Under Severe Accident Conditions Report SAND 90-0756 (NUREG/CR-5545).Hermann G. (1937), Z. Physik. Chemie 35B, 298.Herzberg G. (1950), Spectra of Diatomic Molecules second edition. Nostrand Reinhold, New York.Herm R.R., Lin S.M.. Mims C.A. (1973), J. Chem Phys. 77, 2231.Hilpert K., Gerards H. (1975), High Temp. ScL 7, 11. Hlldenbrand D.L. (1979), J. Electrochem Soc. 126 1396. Hinnov E„ Kohn H. (1957), J. Opt Soc. Am 47, 156.Hubbard C.R. (1983), J. AppL Cryst. 16, 285.Huntelaar M E.. Cordfunke E.H.P., Laan R.R. van der, unpublished results.IAEA (1993), quoted In NRC/Handelsblad 21 december 1993. Inghram M.G., Chupka W.A., Porter R.F. (1955), J. Chem
87.
185

[Jac 71] [Jac 90]
[Jae 15]
IJon 71]
[Jus 69]
[Kal 65]
[Kal 73] [Kau 65]
[Kel 41] [Kel 62] [Kho 901
[Kin 60] [Kle 85] [Kle 88] [Koe 81]
[Kon 90]
|Kra 89]
[Kri 82][Lag 50] [Lag 54] [Lam 86]
Phys. 23, 2159.Jackson D.D. (1971), Report UCRL-51137.Jacops M.H.G. (1990), The calculation of ternary phase diagrams from binary phase diagrams. Thesis University Utrecht.Jaeger F.M., Van Klooster H.S. (1915), Proc. Kon. Akad. Amsterdam 6, 896.Jonah C D.. Zare R.N., Ottlnger Ch. (1971), J. Chem. Phys. 56, 263.Justice B.H. Thermal data fitting with orthogonal functions and combined table generation. The FITAB Program Project Report COO-1149-143, February 1969. Department of Chemistry, The University of Michigan, Ann Arbor.Kalff P.J., Hollander I)., Alkemade C.Th.J. (1965), J. Chem. Phys. 43. 2299.Kalff P.J., Alkemade C.Th.J. (1973), J. Chem. Phys. 59, 2272. Kaufman M., Wharton L., Klemperer W. (1965), J. Chem. Phys. 43, 943.Kelley K.K. (1941), J. Am. Chem. Soc. 63. 2750.Keler E., Andreyeva A.B. (1962), Ogneupory 27, 327. Khodakovsky I.L., Westrum E.F. Jr. (1990), International Geothermodynamic Tables; draft version.King E G.. Weller W.W. (I960), Report BMI5571.Kleykamp H. (1985), J. NucL Mat. 131, 221.Kleykamp H. (1988), NucL Techn. 80, 412.Koester L., Rauch H., Herkens M., Schroeder K. (1981),
Report 1755, Kemforschungsanlage Jullch, Germany.Konings R.J.M. (1990), Thermochemical properties of certain metal hydroxides; A contribution to nuclear reactor safety studies Thesis University of Amsterdam.Krachten J. (1989), University of Amsterdam, Laboratory of Analytical Chemistry Statcal version 5.01 .Krikorian O H. (1982), HighTemp.- High Press. 14 363. Lagerqvist A. (1950), Arkiv fur Fysik 31(2), 333.Lagerqvist A., Huldt L. (1954), Z Natuiforsch. 9a, 991. Lamoreaux R.H., Hildenbrand D.L., Brewer L. (1986), J. Chem Phys. Ref. Data 16, 419.
-186-

[Lev 76]
[Luk 77a]
[Luk 77b]
[Luk 82] [Luk 92] [Lvo 59[ [Mac 82]
[Mar 82] [Mar 83] [Mat 91]
[Med 61] [Mil 87]
[Moo 50]
[Mug 75]
[Mur 92]
[Mur 81] [Nac 30] [Nag 85[
[Nag 91]
[MBS 76] [NBA 87]
[Nee 62]
[New 68]
Levitski! V.A., Tsagareishvtll D.Sh., Gveleiani G.G. (1976),
Teploviz. Vys. Temp. 14, 78. [High Temp., 14, 69]Lukas H.L., Henlg E.Th., Zimmerman B. (1977), Calphad 1, 225.Lukas H.L., Henlg E.Th. (1977), project meeting Calphad Harwell, UK, April.Lukas H.L., Weiss J., Henlg E.Th. (1982), Calphad 6, 235. Lukas H.L., Fries S.G. (1992), J. Phase EqulL 13, 532.L vov. (1959), Fiz. Zhur. Akad. Nauk. Bieloruss SSSR, 2, 44. Machida K., Adachl G., Shiokawa J., Shimlda M., Kazuml M. (1982), Acta Cryst. B38, 386.Martin D.G. (1982), J. Nucl Mat. 188, 295.Marsh R.E., Herbstein F.H. (1983), Acta Cryst. B39, 280. Mathews M.D., Mirza E.B., Momin A.C. (1991), J. Mat. Set Letters 10, 305.Medvedev V.A. (1961), Russ. J. Phys. Chem. 35, 729. Miltenburg J.C. van, Berg G.J.K. van den, Bommel M.J. van, (1987), J. Chem. Thermodynamics 19, 1129.Moore G.E., Allison H.W., Struthers J.D. (1950), J. Chem. Phys. 18, 1572.Muggianu Y.M., Cambino M., Bros J.P. (1975), J. Chtm. Phys. 72, 83.Murslc Z., Vogt T., Frey F. (1992), Acta Cryst. B48, 584. and Mursic Z., Vogt T., Boysen H„ Frey F. (1992), J. Appl. Cryst. 25. 519.Murad E. (1981), J. Chem. Phys. 75, 4080.Nacken R. (1930), Zement 19, 818.Nagarajan K„ Saha R„ Babu R„ Mathews C.K. (1985), Thermochim. Acta 90, 297.Nagarajan K., Babu R., Mathews C.K. (1991), Thermochim. Acta 179, 337.NBS Monograph 25 (1976), 13, 8.Nuclear Energy Agency (1987), The radiological impact of the Chernobyl accident In OECD countries. NEA/OECD.Neel D.S., Pears C D. Oglesby S. Jr. (1962), WADD TR 60-924 1-216.Newbury R.S., Barton G.W., Searcy A.W. (1968), J. Chem.
187

[Nog 60]
[Nog 69] [Nur 52] [NRC 75]
[NRC 811
[Pan 731
[Par 931
[Par 95]
[Par 601 [Ped 83al
[Ped 83b]
(Pel 54] [Pel 861 [Pie 72]
[For 55]
[Pow 86]
[Rei 89]
[Rie 69]
Phys. 48, 793.Noguchi T., Okubo T., Yonemochi O. (1960), J. Am. Ceram. Soc. 52(4), 178.Noguchi T. (1969), Adu. High Temp. Chem. 2, 235.Nurse R.W. (1952), J. AppL Chem. 2, 244.USNRC Reactor Safety Study: An Assessment of Accident Risks In US Commercial Nuclear Power Plants (1975), Report NUREG 75/74 (WASH1400).USNRC Technical Bases for Estlnating Fission Product Behaviour during LWR Accidents (1981), Report NUREG-0772. Panchenkov I.G., Gusarov A.V., Gorokhov L.N. (1973), Russ. J. Phys. Chem. 47, 55.Park C.K., Cazzoll E G.. Grimshaw et aL (1993), Evaluation of Severe Accident Risks: ZION, Report BNL-NUREG CR 4551. Parozzi F., Sandrelli G., Brigoli B., Floravantl D., Lombardi C., Maran L., Messeri S. (1995), Study of a LWR cavity Configuration capable of long-term Cortum Cooling and Confinement, Report ENEL June 1995.Parrish W. (1960), Acta Cryst. 13, 838.Pedley J.B., Marshall E.M. (1983), J. Phys. Chem Ref. Data 12, 967.Pedley J.B., Marshall E.M. (1983), J. Phys. Chem ref. Data 12, 1025.Pelchowltch 1. (1954), Philips Res. Rep. 9, 42.Pelton A.D., Blander M. (1986), MetalL Trans. 17B, 805.Pieper G„ Eyssel W., Hahn Th. (1972), J. Am Ceram Soc. 55, 619.Porter R.F.. Chupka W.A., Inghram M.G. (1955), J. Chem Phys. 23, 1347.Powers D A. (1986), VANESA: A Mehanistlc Model of Radio nuclide Release and Aerosol Generation during Core Debris Interactions with Concrete Report SAND 85-1370 (NUREG/CR- 4308).Reimann M., Stiefel S. (1989), The Wechsl MOD2 Code: A computer Program for the Interaction of a Core Melt with Concrete Including the long term behaviour Report KfK 4477. Rietveld H.M. (1969), J. AppL Cryst. 2, 65.
-188-
[Pla 95]
[Roc 93]
(Roe 89]
[Rog 74]
[Roo 92]
[Ros 65] [Rot 59]
[RUU 89]
I Sam 94]
[Sch 76]
[Sch 95]
[Sem 72]
[She 57] [Shi 70]
[Sho 54] [Sht 67]
[Smo 70] [Sri 76] [Sti 65] [Sto 91]
[Sto 93]
Flakier J.R., Huntelaar M.E., Graaff R A G. de, IJdo D.J.W. (1995), Mat. Res. BuL 29, 701.Roche M.F., Leibowitz L., Fink J.K., Baker L. Jr. (1993), Solidus and Liquidus temperatures of Ciore Concrete Mixtures, Report ANL-93/9.Roelofsen-Ahland J.N., Peterson R.C. (1989), Can. Mineral. 27, 703.Rog G.. Langanke B., Borchardt G., Schmalzried H. (1974), J. Chem. Thermodynamics 6, 1113.Roosmalen J.A.M. van, Vlaanderen P. van, Cordfunke E.H.P. (1992), J. Solid State Chem 101. 59.Rosen E., Muan A. (1965), J. Am Ceram Soc. 48, 603.Roth R.S., Levin E.M. (1959), J. Res. Natl Bur. Stand. 62, 193.University of Utrecht, General Chemistry, Thermodynamics Group.Samoilova. I.O., Kazenas E.K. (1994), Russian J. Metallurgy 3, 36.Schuiling R.D., Vergouwen L., Rijst H. van der (1976), Am Mineral 61. 166.Schweizerische Vereningung fur Atomenergie (SVA) (1995), Kemkraftwerke der Welt.Semenov G.A., Popkov O.S., Soleveichik A.I., Persiyaninova S.N. (1972), Russ. J. Phys. Chem 46, 898.Shchukarev S.A., Semenov G.A. (1957), J. Inorg. Chem 6, 1. Shibanov E.V., Chukhlantsev V.G. (1970), Russ. J. Phys. Chem 44, 872.Shomate C.H. (1954), J. Phys. Chem 58, 368.Shteinberg Yu.G., Gerasimov V.N., Gubar V.N. (1967), J. AppL Chem USSR 40, 1378.Smolin Yu.I., Shepelev Yu.F. (1970), Acta Cryst. B26, 484. Srivastava R.D. (1976), HighTemp. Science 8, 225.Stimson H.F. (1965), J. Res. Natl Bur. Stand. 65A, 39. Stolyarova V.L., Shomikov S.I., Ivanov G.G., Shultz M.M. (1991), J. Electmchem Soc. 138(12), 3710.Stolyarova V.L. (1993), Rapid Communicatins in Mass Spectrometry 7, 1022.
-189-
[Swa 60]
[Tak 67] [Tak 75] [Tat 94] [Tho 88]
[Til 64]
[Tor 56]
[Tra 69]
[Tro 95]
[Uen 90]
[USS86]
[Vel 57] [Vic 60]
[Vis 69] [War 31]
[Was 20]
[Wei 64]
[Wes 68]
[Wil 81] [Wit 87]
Swanson H E.. Cook M.I., Isaacs T., EVans E.H. (1960), NBS Circular 539,9, 51.Takeuchl Y., Joswlg W. (1967), Miner. J. (Japan) 5, 98. Takamori T„ Roy R. (1975), J. Am Ceram. Soc. 58, 348 Tattegrain A. (1994), Safety March , 36.Thompson D.H., Fink J.K. (1988), ACE MCCI test L5 Data Report" Argonne National Laboratory, ACE-TR-C7.Tilloca G., Jorba P.Y. (1964), Rev. Intern. Hautes Temper, et Refract. 1. 331.Toropov N.A., Galakhov F.Y. (1956), Izv. Akad. Nauk. SSSR 2, 153.Traverse J.P., Foex M. (1969), High Temp. - High Press. 1, 1409.Tromm W„ Alsmeyer H., Burger M., Wldmann W„ Buck M. (1995), COMET Experiments and theoretical modelling, FISA- 95 Symposium - EU Research on Severe Accidents, Luxembourg, Nov. 20-22, 1995.Ueno A., Hayashi S., Okada K., Otsuka N. (1990), J. Mat. Scl Letters 9, 9.USSR State Committee on the Utilisation of Atomic Energy, The Accident at the Chernobyl Nuclear Power Plant and its Consequences, IAEA Expert-meeting 25-29 August, Vienna. Veits I.V., Gurvich L.V. (1957), Zhur. Fiz. Khim. 31, 2306. Victor A.C., Douglas T.B. (1960), WADD TR 57-374 Pt VI, 1- 16.Visser J.W. (1969), J. AppL Cryst. 2, 89.Wartenberg H. von, Gurr W, (1931), Z. Anorg. AUgem. Chem 196, 374.Washburn E.W., Libman E.E (1920), J. Amer Ceram. Soc. 3, 634.Weller W.W., Kelley K.K. (1964), U.S. Bureau of Mines Rep. Invest 6556.Westrum, E.F. Jr., Furuka, G.T., McCullough, J.P. (1968),
Experimental Thermodynamics (Eds.: J.P. McCullough and D.W. Scott), Vol. 1, p. 133, Butterworth.Willes D.B., Young R.A. (1981), J. AppL Cryst. 14, 149. Withers, R.L., Hyde, B.G., Thompson, J.G. (1987), J. Phys. C:
-190-

Solid State Phys. 20, 1653.[Wri 90) Wrledt H.A. (1990), BulL Alloy Phase Diagrams 11, 43 [Yok 91) Yokokawa et al. (1991), J. Solid State Chem 94, 106. [Zim 76] Zimmerman B. (1976), Thesis University Stuttgart. [2ir 34] Zlmowa N. (1934), Z Anorg. AUgem. Chem. 218, 193.
191 I NEXT PAQE(S)
toft BLANK

List of abbreviations
AEAACEECN
EUFzKGRSGTTKfKMCCINBSNISTNRCTEASETMI
Atomic Energy AgencyAdvanced Containment ExperimentsEnergleonderzoek Centrum Nederland (Energy Research Foundation)European UnionForschungszentrum KarlsruheGesellschaft fur Anlagen- und Reaktorslcherhelt.Gesellschaft fur Technlsche Thermochemle und -PhyslkKemforschungszentrum KarlsruheMolten Core Concrete InteractionNational Bureau of StandardsNational Institute of Standards and TechnologyNuclear Regulatory CommissionECN Thermochemical database of materialsThree Miles Island
I NEXT PAGEIS)
toft BLANK
Summary
In the nuclear industry there is traditionally a great interest in thermodynamic properties of materials to calculate the chemical processes occurring in, for instance, nuclear power plants. In particular, the possibility to calculate the release behaviour of fission products and their compounds plays an important role. The use of chemical thermodynamics has proven to be the tool to achieve this.
After a very promising start in the sixties, the development of nuclear power as the primary source of energy stagnated in the eighties as a result of the growing public awareness of the risks involved. This change in attitude was, among others, the result of the accident with the TMI-reactor in 1979. Also as a result of the TMI accident, governments started programmes on nuclear safety, and as part of it the determination of the thermodynamic properties of many substances in relation to in-vessel accidents. Large-scale ex-vessel accidents remained relatively under-exposed. This changed after the more severe accident with the Chemobyl-reactor in 1986; from then on interest shifted towards ex-vessel accidents, in particular, the Molten Core Concrete Interactions (MCCI).
This thesis aims to make a contribution to a better understanding of the chemical processes occurring during an ex-vessel MCCI accident with a western-type of nuclear reactor. Chosen is for a detailed thermochemical study of the silicates and zirconates of barium and strontium.
In Chapter one a short introduction in the history of (research in) nuclear safety is given, followed by the state-of-the-art of molten coreconcrete interactions in Chapter two. In both Chapters the role of chemical thermodynamics on this particular subject is dealt with .
The experimental work on the silicates and zirconates of barium and
-195-
I strontium performed for this thesis, is described In the Chapters i; three, four, five, six, and parts of eight. In Chapter three the basis for I all thermochemical measurements, the sample preparation is given. | Because the sample preparation effects the accuracy of the ' thermodynamic measurements, a great deal of effort is spent in
optimizing the synthesis of the silicates which resulted in the TEOS- method widely employed here. In the next Chapters the different thermochemical techniques used, are described: the low-temperature heat capacity measurements and the enthalpy increment measurements in Chapter four, the enthalpy-of-solution measurements in Chapter five, and measurements to determine the crystal structures in Chapter six.
Whereas the previous "experimental" Chapters all dealt with condensed species, the equally important gaseous species are discussed in Chapter seven, and a literature assessment on the enthalpies of formation of BaO(g) and SrO(g) is given. Furthermore, assessments and DTA-measurements on the determination of phase relations in binary and pseudo-binary systems, such as the system SlOg-SrO are given in Chapter eight. Based on the results obtained in this Chapter, the results of phase diagram calculations of the ternary system Sr0-Si02-Zr02, are given in Chapter nine. Although originally the use of different chemical models was intended, only the Redlich- Kister model yielded acceptable results.
In Chapter ten the results obtained in Chapter nine, are compared with other calculations using the ideal as well as the non-ideal approach. The differences are discussed and a recommendation for thermochemical calculations on complex chemical systems, such as MCCI, is given.
-196-
Samenvatting
Tradltloneel hecht de nuclealre Industrie veel waarde aan thermody- namische grootheden voor het berekenen van de chemlsche processen die rich afspelen in een in bedrijf rijnde nuclealre reactor. Met name het berekenen van het vrijkomen van radiologisch gevaarlijke splij- tingsproducten tijdens ongevalssituaties is hierbij erg belangrijk. De thermochemie van de vaste stof is bij dit type berekening erg waarde- vol gebleken.
Na een veelbelovende start van het nuclealre tijdperk in de jaren zes- tig, waarin kemenergie de energievorm van de toekomst werd ge- noemd, stagneerde de ontwikkeling reeds in de jaren tachtig door een groeiend publiek besef van de hieraan verbonden risico’s. Het ongeval met de TMI-reactor in 1979 in Harrisburg in de Verenigde Staten van Amerika, was daar mede de oorzaak van. Als gevolg van dit ongeval werden er verschillende wetenschappelijke programma’s gestart welke onder meer als doel hadden inricht te krijgen in de chemische)proces- sen tijdens ongevalscondities. Een deel van die programma’s bestond uit het bepalen van de thermodynamische grootheden van die ver- bindingen, waarvan verwacht werd dat ze gevormd zouden worden tijdens ongevallen die beperkt bleven tot de kern van de reactor of het primaire koelsysteem. De veel emstiger ongevallen waarbij de reactor- kern smelt, het reactorvat beschadigt en uiteindelijk in het onderlig- gende beton valt, bleven tijdens de eerdere onderzoeksprogramma’s veelal buiten beeld. Dit veranderde echter als gevolg van het ongeval met de Tsjemobyl-reactor in 1986; het aandachtsgebied verschoof nu naar de gesmolten kem-beton interacties (Molten Core-Concrete Inte- rations of MCCI).
In dit proefschrift wordt getracht een bijdrage te leveren aan een beter begrip van de chemlsche processen die rich afspelen tijdens een MCCI-ongeval. Omdat een experimented onderzoek naar een dergelijk type ongeval meer werk oplevert dan in een mensenleven kan worden
-197-
uitgevoerd, is gekozen voor een gedetailleerde studie van de silicaten en zirconaten van strontium en barium. De keuze voor dit systeem is eenvoudig. Zowel strontium- als bariumoxide zijn gevaarlijke splij- tingsproducten, de oxidatie van de splijtstofomhulling (Zircaloy) tijdens een eerder stadium van het ongeval levert veel Zr02, en silica (Si02) is het hoofdbestanddeel van een veel gebruikte betonsoort.De indeling van het proefschrift is als volgt. In hoofdstuk een wordt een korte introductie op de geschiedenis van nucleair-gerelateerd on- derzoek gegeven, waama in hoofdstuk twee de huidige stand van zaken betreffende gesmolten kem-beton interacties wordt geschetst. Uiteraard staat in beide hoofdstukken de rol van de thermochemie centraal.
Vervolgens wordt het experimented werk beschreven in de hoofdstukken drie, vier, vijf, zes en een gedeelte van acht. In hoofdstuk drie wordt de basis gelegd voor goede en betrouwbare thermodynamische bepalingen, de bereiding van de in de volgende hoofdstukken gebruikte silicaten. zirconaten en hulpstoffen. In de volgende hoofdstukken worden achtereenvolgens de verschillende thermodynamische tech- nieken beschreven: de lage-temperatuur soortelijk warmte metingen en de hoge-temperatuur valcalorimetrie in hoofdstuk vier, de oplosca- lorimetrie in hoofdstuk vijf en de bepaling van enkele kristalstruc- turen in hoofdstuk zes.
Vervolgens wordt in hoofdstuk zeven een uitgebreide en kritische li- teratuurstudie gegeven van de vormingswarmte van gasvormig strontium- en bariumoxide. Alhoewel in de overige hoofdstukken de nadruk op de vaste stof ligt, zijn het uiteindelijk de gasvormige verbindingen die met name zorgen voor de verspreiding van de splij tingsproducten; de hoeveelheid wordt vooral bepaald door de chemlsche stabiliteit van de vaste stof. In hoofdstuk acht volgt een literatuurstudie naar en DTA-metingen van de bepaling van fasenevenwichten in relevante chemlsche systemen, zoals SrO-Si02. Gebaseerd op de in hoofdstuk acht behaalde resultaten worden fasendiagram-berekeningen be- sproken in hoofdstuk negen. Alhoewel oorspronkelijk de berekeningen
-198-

met meer chemische modeller! zouden worden ultgevoerd, Is uiteinde- lljk alleen het Redllch-Klster model succesvol gebleken.
In hoofdstuk tlen, ten slotte, worden de behaalde resultaten verge- leken met sterk vereenvoudlgde berekeningen, en met berekenlngen die betrekking hebben op een groter chemisch systeem dat gesmolten kem-beton interacties dichter benadert. De verschillen worden besproken, waarbij vooral de vraag centraal staat of complexe syste- men eenvoudig zijn te beschrijven zonder al te veel informa tie te verliezen.
-199-

Curriculum Vitae
11 augustus 1964 Geboren te Alkmaar
mel 1980 Diploma MAVO-4 aan bet Hermann Wesselink College te Amstelveen.
juni 1982 Diploma HAVO aan bet Hermann Wesselink College te Amstelveen.
junl 1986 Diploma HLO chemlsch-analytisch aan bet Ir.W. van den Broek Instltuut te Amsterdam (tegenwoordlg Hogeschool Amsterdam).
September 1986 Mllitalre dlenst blj de geneeskundlge troepen van bet 104e Verkennlngs Batalllon te Nunspeet.
februarl 1988 In dlensttredlng blj ECN-Fysische (Nuclealre) Chemle, In de functle van research mede-werker.
September 1988 Start Avond en Weekend Opleidlng Scheikunde (AWOS) aan de Unlversltelt van Amsterdam met als onderzoeksspeclallsme:
Thermochemie van de vaste stof.
maart 1991 Doctoraal diploma scheikunde
aprll 1991 - heden Werkzaam blj ECN-Nucleaire Chemle als wetenschappelljk medewerker.
-201- INEXT PAQE(S)
left BLANK

Appendices
NEXT PAQEIS)toft BLANK
-203-
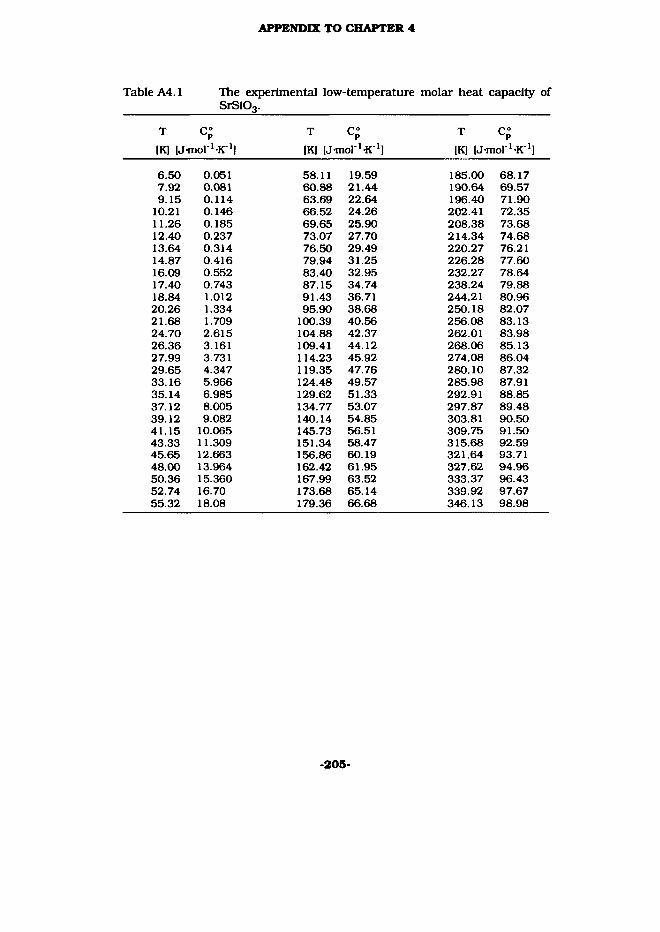
APPENDIX TO CHAPTER 4
Table A4.1 The experimental low-temperature molar heat capacity of SrSi03.
T C° T C° T C°|K] [J-mol'-K1] |K] IJ-mol'1 K''| |K] [J-mol'-K1!
6.507.929.15
10.2111.2612.4013.64 14.87 16.0917.40 18.84 20.26 21.68 24.7026.36 27.9929.65 33.1635.1437.1239.1241.15 43.3345.65 48.0050.36 52.74 55.32
0.0510.0810.1140.1460.1850.2370.3140.4160.5520.7431.0121.3341.7092.6153.1613.7314.3475.9666.9858.0059.082
10.06511.30912.66313.96415.36016.7018.08
58.1160.8863.6966.5269.6573.0776.5079.9483.4087.1591.4395.90
100.39104.88109.41 114.23119.35 124.48 129.62 134.77 140.14 145.73 151.34 156.86162.42 167.99 173.68179.36
19.5921.4422.6424.2625.9027.70 29.49 31.2532.95 34.7436.7138.6840.56 42.37 44.12 45.92 47.7649.57 51.33 53.07 54.8556.51 58.47 60.1961.9563.52 65.1466.68
185.00190.64196.40202.41 208.38 214.34220.27226.28 232.27 238.24 244.21 250.18256.08262.01 268.06274.08 280.10 285.98292.91 297.87 303.81 309.75 315.68321.64 327.62 333.37339.92 346.13
68.1769.5771.90 72.3573.6874.68 76.21 77.60 78.64 79.8880.96 82.0783.1383.9885.13 86.04 87.3287.91 88.85 89.4890.5091.50 92.59 93.7194.96 96.43 97.6798.98
-205-

APPENDIX TO CHAPTER 4
Table A4.2 The experimental low-temperature molar heat capacity of Sr2S104.
[K| |J-mol"1-K',| [K] [J-mol ' -K h IK] IJ-mol ^K"1]
6.76 0.160 55.248.29 0.233 58.119.22 0.280 61.01
10.24 0.332 63.9211.36 0.401 66.8412.35 0.483 70.0213.55 0.626 73.4614.71 0.832 80.3515.84 1.065 83.8217.13 1.548 87.4218.55 2.163 91.5219.98 2.889 95.9121.41 3.679 100.3124.42 5.346 104.7026.07 6.251 109.1427.73 7.232 113.5229.42 8.391 118.4131.13 9.772 123.7032.94 11.368 129.0434.91 13.077 134.3836.91 14.735 139.7338.93 16.51 145.1440.96 18.56 150.7043.16 20.38 156.4045.50 22.56 162.1247.85 24.88 167.8650.22 27.03 173.5752.61 29.29
31.62 179.32 106.1934.46 185.06 108.2737.12 190.86 110.2239.73 196.61 111.9642.35 202.46 113.6144.97 208.30 115.2347.80 214.20 116.5853.20 220.06 117.9955.77 225.93 119.4158.37 231.84 120.9061.22 237.62 122.4064.13 249.35 125.7666.92 267.00 130.9669.61 272.91 132.4672.20 278.86 133.9374.17 284.91 135.1477.36 290.77 136.0880.32 296.54 136.8182.95 302.44 137.4485.65 308.34 138.0688.33 314.25 138.8390.99 320.13 139.8593.70 326.03 141.2896.38 331.94 143.1599.01 337.80 145.30
101.55 343.70 147.48103.93 348.13 148.78
-206-

152025
3035404550
60708090
100
110120130140150
160170180190200
210220230240250
260270280290298.
300
APPENDIX TO CHAPTER 4
Smoothed thermodynamic properties of SrSiOa at selected temperatures.
C° S°m-S°(0) H°(T)-H°(0) -(G°(T)-H°(0))/TUrnor'-H"1! [Jmol'-K1) Imol"1! [J-moV'-K1]
0.026 0.0090.139 0.0570.429 0.1571.272 0.3792.711 0.810
4.512 1.4566.908 2.3259.461 3.415
12.309 4.68915.16 6.135
20.67 9.38826.09 12.98331.28 16.8136.07 20.7740.40 24.80
44.35 28.8448.00 32.8651.46 36.8454.81 40.7758.04 44.67
61.15 48.5164.10 52.3166.86 56.0569.42 59.7471.80 63.36
74.40 66.9276.16 70.4178.20 73.8480.17 77.2182.04 80.52
83.81 83.7785.44 86.9786.95 90.1088.40 93.1889.61 95.65
89.90 96.20
0.035 0.0020.411 0.0161.693 0.0445.645 0.097
15.433 0.192
33.302 0.34661.62 0.564
102.58 0.850156.81 1.204225.58 1.624
404.82 2.641638.7 3.858925.8 5.236
1262.9 6.7411645.6 8.346
2069.7 10.0262531.6 11.7613029.0 13.5373560.4 15.344124.8 17.17
4720.9 19.015347 20.856002 22.716684 24.567390 26.41
8119 28.258870 30.099642 31.92
10434 33.7311245 35.54
12075 37.3312921 39.1113783 40.8814660 42.6315385 44.04
15551 44.36
-207-
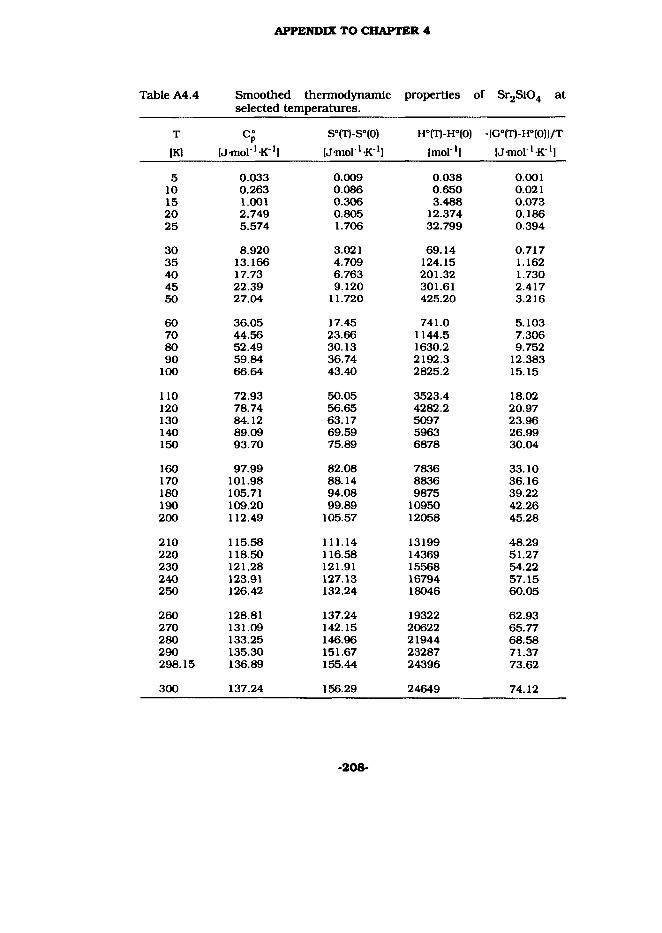
APPENDIX TO CHAPTER 4
Table A4.4 Smoothed thermodynamic properties of selected temperatures.
Sr2Sl04 at
T cp S°m-So(0) H°(T)-H°(0) ■•|G°(T)-H°(0))/TIK] [Jmor'-K1] IJ-mor'-K'1] Imol"1] IJ-mol 1-K ']
5 0.033 0.009 0.038 0.00110 0.263 0.086 0.650 0.02115 1.001 0.306 3.488 0.07320 2.749 0.805 12.374 0.18625 5.574 1.706 32.799 0.394
30 8.920 3.021 69.14 0.71735 13.166 4.709 124.15 1.16240 17.73 6.763 201.32 1.73045 22.39 9.120 301.61 2.41750 27.04 11.720 425.20 3.216
60 36.05 17.45 741.0 5.10370 44.56 23.66 1144.5 7.30680 52.49 30.13 1630.2 9.75290 59.84 36.74 2192.3 12.383
100 66.64 43.40 2825.2 15.15
110 72.93 50.05 3523.4 18.02120 78.74 56.65 4282.2 20.97130 84.12 63.17 5097 23.96140 89.09 69.59 5963 26.99150 93.70 75.89 6878 30.04
160 97.99 82.08 7836 33.10170 101.98 88.14 8836 36.16180 105.71 94.08 9875 39.22190 109.20 99.89 10950 42.26200 112.49 105.57 12058 45.28
210 115.58 111.14 13199 48.29220 118.50 116.58 14369 51.27230 121.28 121.91 15568 54.22240 123.91 127.13 16794 57.15250 126.42 132.24 18046 60.05
260 128.81 137.24 19322 62.93270 131.09 142.15 20622 65.77280 133.25 146.96 21944 68.58290 135.30 151.67 23287 71.37298.15 136.89 155.44 24396 73.62
300 137.24 156.29 24649 74.12
-208-

APPENDIX TO CHAPTER 4
Table A4.5 Experimental and calculated molar enthalpy Increments of SrS103 and Sr2S104.
TIK]
(H°m - exp.
H°(298.15 K))/|Jmor’] calc.
8%
(a) SrS103
503.0 20413 20575 -0.79552.8 25882 26033 -0.59577.9 28746 28834 -0.31603.7 31688 31746 -0.18629.4 34628 34677 -0.14655.1 37504 37639 -0.36667.3 39151 39056 0.24680.7 40805 40619 0.46706.2 43738 43615 0.28731.2 46742 46578 0.35784.4 53034 52969 0.12808.5 55866 55901 -0.06835.3 59202 59187 0.02886.4 65384 65530 -0.22
(b) Sr2S104
503.0 30676 30892 -0.70527.9 34618 34856 -0.69552.9 38676 38882 -0.53603.7 47150 47203 -0.11629.7 51440 51536 -0.19654.8 55965 55766 0.36705.9 64854 64518 0.52731.7 69182 69010 0.25784.5 78525 78355 0.22834.0 87508 87301 0.24886.2 96459 96929 -0.49
-209-

APPENDIX TO CHAPTER 4
Table A4.6 The smoothed high-temperature thermodynamic properties of SrSl03 and Sr2S104 from 298.15 to 1000 K.
T
IK]
CPUmoV1*"1)
S°
p-mol'-K'l
FEF*
Umol"1*"1
H°(T)-H°(298)
1 Umol"1]
A^-fT)
Umol"1!
AfG°(T)
Umol"1)
a) SrSIO'3
298.15 89.610 95.650 95.650 0 -1635300 -1549903300 89.897 96.205 95.652 166 -1635302 -1549373400 101.104 123.766 99.333 9773 -1635003 -1520757500 108.041 147.117 106.616 20251 -1634242 -1492276
600 113.296 167.296 115.086 31326 -1633243 -1463975700 117.757 185.103 123.841 42884 -1632084 -1435854800 121.795 201.095 132.515 54864 -1630791 -1407908900 125.587 215.661 140.956 67235 -1629995 -1380061
1000 129.226 229.082 149.106 79976 -1628115 -1352388
b) Sr2S10
298.15
’4
136.889 155.440 155.440 0 -2305700 -2190955300 137.239 156.288 155.443 254 -2305692 -2190244355.0 145.410 180.124 157.454 8048 -2305332 -2169593355.0 147.465 180.724 157.454 8261 -2305119 -2169593400 150.760 198.516 161.089 14971 -2304495 -2151912500 158.082 232.944 172.118 30413 -2303128 -2113920
600 165.404 262.413 184.767 46587 -2301540 -2076225700 172.727 288.460 197.754 63494 -2299694 -2038816800 180.049 312.003 210.587 81133 -2297551 -2001692900 187.372 333.632 223.072 99504 -2296332 -1964712
1000 194.694 353.753 235.146 11860 -2292855 -1928045
FEF = -(G°-H°(298.15 K))/T
-210-

APPENDIX TO CHAPTER 4
Table A4.7 The experimental low-temperature molar heat capacity of SrZrSl207(s).
|K| U-mol ' K '| |K] [J mol1-K1| |K| [J-mol l K"1]
10.22 0.179 56.26 34.67 184.32 137.7710.29 0.187 59.50 37.99 188.29 139.9911.51 0.341 62.81 41.36 192.24 142.0911.68 0.406 66.17 44.74 196.15 144.1712.91 0.557 69.59 48.18 200.02 146.2713.22 0.575 72.98 51.82 203.86 148.3214.51 0.873 76.24 54.60 207.67 150.2314.93 1.04 79.35 57.80 211.46 152.0516.08 1.29 82.31 60.61 215.22 153.9116.52 1.42 85.16 63.39 218.95 155.7417.76 1.85 87.92 65.91 222.66 157.5518.27 2.03 90.44 68.51 226.34 159.3119.59 2.50 90.59 68.41 230.00 160.9820.17 2.81 93.19 70.21 233.64 162.7121.52 3.45 94.16 71.81 237.26 164.2922.12 3.71 95.72 72.88 240.86 165.8623.53 4.54 97.87 75.11 244.44 167.7824.15 4.91 98.19 75.13 248.00 168.9225.45 5.69 100.61 77.18 251.54 170.5626.03 6.06 101.64 78.27 255.07 172.1427.08 6.74 105.42 81.83 258.58 173.3627.57 7.01 109.22 85.09 262.06 174.8228.48 7.74 113.05 88.32 265.52 175.4828.91 7.98 116.90 91.46 268.97 177.4129.72 8.49 120.78 94.69 272.41 178.8530.10 8.75 124.67 97.67 275.83 179.9730.83 9.31 128.57 100.67 279.24 181.3431.18 9.55 132.49 103.68 282.63 182.6432.16 10.11 136.42 106.60 286.01 183.8033.08 10.88 140.36 109.38 289.38 185.0233.36 12.29 144.31 112.32 292.74 186.2433.94 11.85 148.28 115.02 296.08 187.3434.74 12.39 152.25 117.88 299.42 188.4435.98 14.42 156.24 120.63 302.74 189.6138.49 16.91 160.23 123.17 306.05 190.5141.22 19.58 164.23 125.75 309.36 191.5344.06 22.31 168.24 128.34 312.66 192.6146.99 25.23 172.25 130.70 315.95 193.6845.00 28.30 176.28 133.09 319.23 194.7253.09 31.47 180.30 135.43
-211-

APPENDIX TO CHAPTER 4
Table A4.8 Smoothed thermodynamic properties of SrZrSl207(s) at selected temperatures.
T
IK] [J-moV'-K1]
S°(T)-S°(0)
IJ-mol 1KI]
H°(T)-H°(0)
Imol"1]
-|G°(T)-H°(0)]/T
[Juiol1* *|
20 2.716 0.7973 12.29 0.182930 8.678 2.952 67.44 0.703740 18.39 6.684 199.61 1.69450 28.30 11.84 432.43 3.190
60 38.49 17.90 766.39 5.12670 48.61 24.59 1202 7.42380 58.41 31.75 1739 10.0190 68.09 39.18 2371 12.84
100 76.59 46.78 3093 15.85
110 85.75 54.53 3907 19.01120 94.07 62.35 4806 22.30130 101.77 70.18 5785 25.68140 109.12 78.00 6840 29.14150 116.26 85.77 7968 32.66
160 123.02 93.50 9165 36.22170 129.39 101.15 10427 39.81180 135.25 108.71 11751 43.43190 140.90 116.18 13132 47.06200 146.26 123.54 14568 50.70
210 151.34 130.80 16056 54.35220 156.25 137.96 17594 57.98230 160.98 145.01 19181 61.61240 165.48 151.96 20814 65.23250 169.85 158.81 22491 68.84
260 173.94 165.55 24211 72.43270 177.87 172.18 25968 76.00280 181.64 178.72 27766 79.56290 185.25 185.16 29600 83.09298.15 188.02 190.33 31122 85.95
300 188.64 191.49 31470 86.59
-212-

APPENDIX TO CHAPTER 4
Table A4.9 Experimental and calculated molar enthalpy Increments ofSrZrSl207(s).
TIK)
iH°m-exp.
H°(298.15 KJl/U-mor'l calc.
8%
485.4 39723 39790 -0.17516.9 46925 47135 -0.45517.1 46897 47182 -0.61548.4 54533 54621 -0.16578.0 61562 61777 -0.35639.6 77229 77019 0.27671.1 85350 84986 0.43701.4 92909 92756 0.17731.4 100681 100547 0.13763.3 108749 108937 -0.17794.5 117319 117245 0.06825.9 125719 125708 0.01855.2 133509 133694 -0.14
Table A4.10 The smoothed high-temperature thermodynamic properties of SrZrSl207(s) from 298.15 to 1000 K.
T CP S° FEF H°(T)-H°(298) AfH°(T) A,G0(T)IK] (Jmol'-K"1'l [Jmol'-K1] IJmor'-K"1 1 [Jmor1] UmoV'l ymoV'l
298.15 187.810 190.140 190.140 0 -3640800 -3444018300.0 188.498 191.304 190.144 348 -3640813 -3442796400.0 215.726 249.642 197.913 20691 -3640506 -3376790500.0 233.016 299.743 213.391 43176 -3638934 -3311024
600.0 246.394 343.448 231.502 67168 -3636618 -3245650700.0 257.925 382.313 250.320 92394 -3633753 -3180711800.0 268.472 417.450 269.050 118720 -3630390 -3116215900.0 278.447 449.652 287.352 146070 -3627167 -3052098000.0 288.066 479.490 305.092 174398 -3622501 -2988444
-213-

APPENDIX TO CHAPTER 4
Table A4.11 Experimental and calculated molar enthalpy Increments ofSr 7ZrSi602 j (s).
TIK]
|H°m - H°(298.15 KM/U-mol'1] exp. calc.
8%
a: "Sr6ZrSI50j8(s)"
455.8 94746486.6 115562516.9 135757548.3 156950577.9 176748610.3 200113639.6 220791671.2 243672702.7 267331763.1 313117794.5 336731825.8 361131856.5 384389886.8 405215
b: Sr7ZrSl602, (s) (recalc.)
455.8 110233 rejected ....486.6 134500 134665 -0.12516.9 158024 158080 -0.04548.3 182712 182807 -0.05577.9 205760 206536 -0.38610.3 233014 232968 0.02639.6 257111 257279 -0.07671.2 283788 283925 -0.05702.7 311393 310924 0.15763.1 364810 363901 0.25794.5 392344 392064 0.07825.8 420816 420556 0.06856.5 447927 448907 -0.22886.8 462872 rejected
-214-
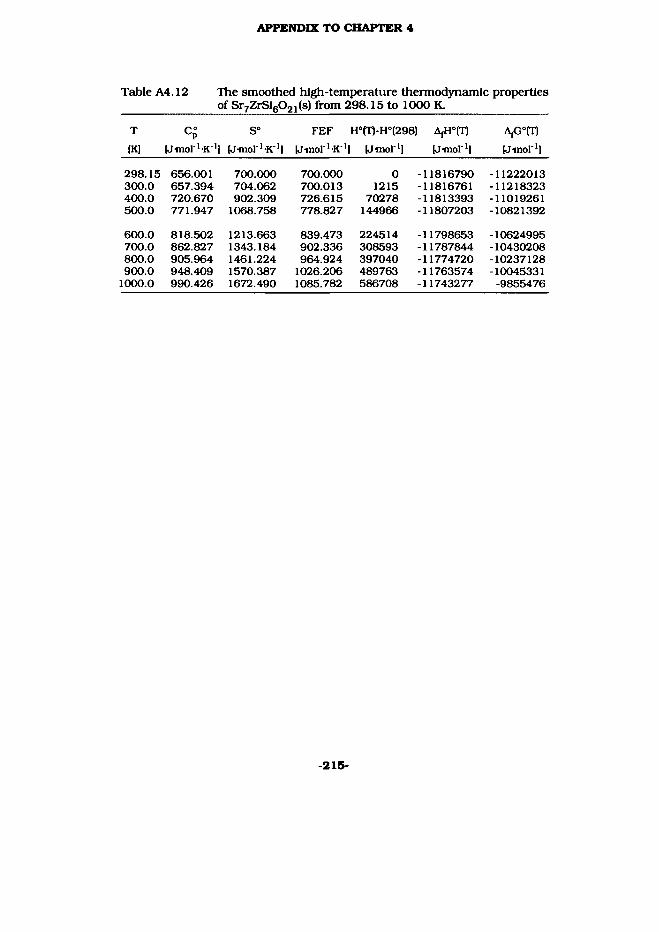
APPENDIX TO CHAPTER 4
Table A4.12 The smoothed high-temperature thermodynamic properties of Sr7ZrSi6021(s) from 298.15 to 1000 K.
T
IK]
Cr(Jmol l-K ']
S°
(Jiiiol 1K,|
FEF
Umor'K1]
H°fH-H°(298) AjH°(T)
klmol"1] Umol"1]
AjG°(T)[JtooI"1]
298.15 656.001 700.000 700.000 0 -11816790 -11222013300.0 657.394 704.062 700.013 1215 -11816761 -11218323400.0 720.670 902.309 726.615 70278 -11813393 -11019261500.0 771.947 1068.758 778.827 144966 -11807203 -10821392
600.0 818.502 1213.663 839.473 224514 -11798653 -10624995700.0 862.827 1343.184 902.336 308593 -11787844 -10430208800.0 905.964 1461.224 964.924 397040 -11774720 -10237128900.0 948.409 1570.387 1026.206 489763 -11763574 -10045331
1000.0 990.426 1672.490 1085.782 586708 -11743277 -9855476
-215-
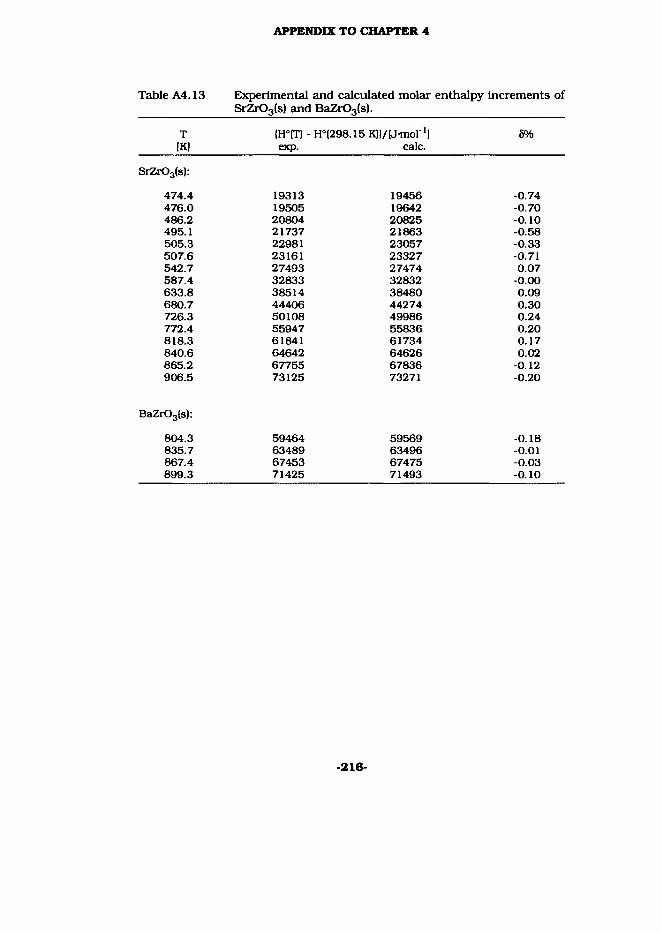
APPENDIX TO CHAPTER 4
Table A4.13 Experimental and calculated molar enthalpy Increments of SrZr03(s) and BaZr03(s).
T[K]
{H°m-exp.
H°(298.15 KMJmol"1] calc.
5%
SrZrOa(s):
474.4 19313 19456 -0.74476.0 19505 19642 -0.70486.2 20804 20825 -0.10495.1 21737 21863 -0.58505.3 22981 23057 -0.33507.6 23161 23327 -0.71542.7 27493 27474 0.07587.4 32833 32832 -0.00633.8 38514 38480 0.09680.7 44406 44274 0.30726.3 50108 49986 0.24772.4 55947 55836 0.20818.3 61841 61734 0.17840.6 64642 64626 0.02865.2 67755 67836 -0.12906.5 73125 73271 -0.20
BaZrG3(s):
804.3 59464 59569 -0.18835.7 63489 63496 -0.01867.4 67453 67475 -0.03899.3 71425 71493 -0.10
-216-
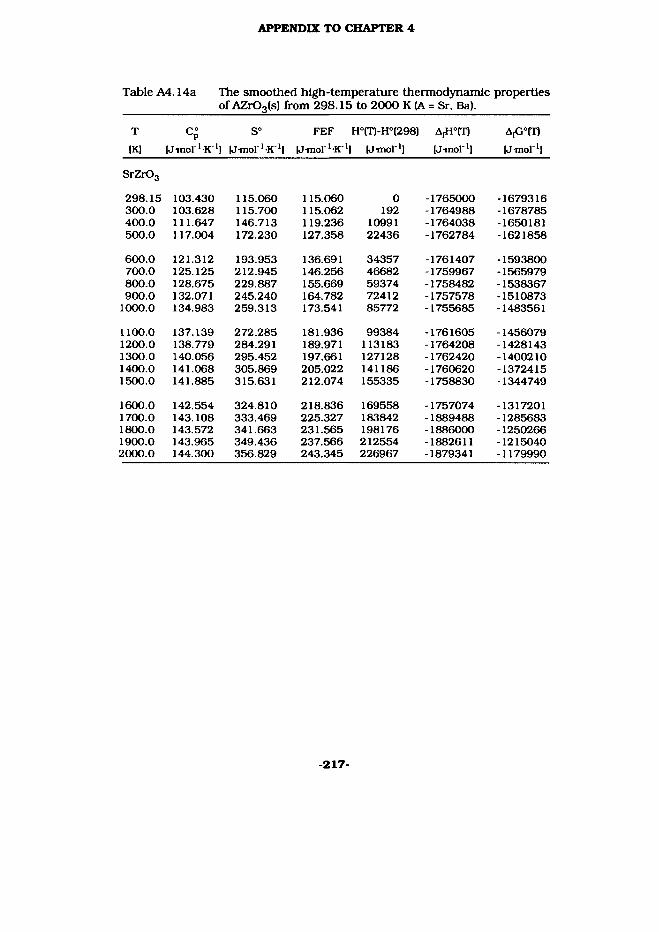
APPENDIX TO CHAPTER 4
Table A4.14a The smoothed high-temperature thermodynamic propertiesof AZr03(s) from 298.15 to 2000 K (A = Sr, Ba).
TIK]
CP[Jmol'-K1]
S°IJmol ’ k1]
FEF[J-mol1K'1|
H°(T)-H°(298)IJmol"1]
A(H0(T)IJmol'1]
A,G°m[J-mol ']
SrZrOg
298.15 103.430 115.060 115.060 0 -1765000 -1679316300.0 103.628 115.700 115.062 192 -1764988 -1678785400.0 111.647 146.713 119.236 10991 -1764038 -1650181500.0 117.004 172.230 127.358 22436 -1762784 -1621858
600.0 121.312 193.953 136.691 34357 -1761407 -1593800700.0 125.125 212.945 146.256 46682 -1759967 -1565979800.0 128.675 229.887 155.669 59374 -1758482 -1538367900.0 132.071 245.240 164.782 72412 -1757578 -1510873
1000.0 134.983 259.313 173.541 85772 -1755685 -1483561
1100.0 137.139 272.285 181.936 99384 -1761605 -14560791200.0 138.779 284.291 189.971 113183 -1764208 -14281431300.0 140.056 295.452 197.661 127128 -1762420 -14002101400.0 141.068 305.869 205.022 141186 -1760620 -13724151500.0 141.885 315.631 212.074 155335 -1758830 -1344749
1600.0 142.554 324.810 218.836 169558 -1757074 -13172011700.0 143.108 333.469 225.327 183842 -1889488 -12856831800.0 143.572 341.663 231.565 198176 -1886000 -12502661900.0 143.965 349.436 237.566 212554 -1882611 -12150402000.0 144.300 356.829 243.345 226967 -1879341 -1179990
-217-
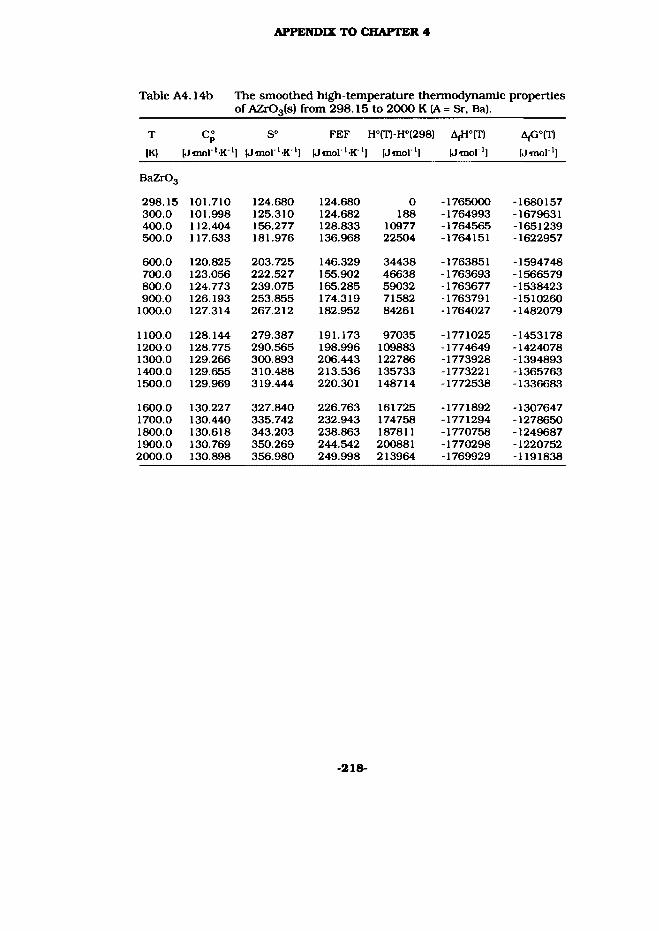
APPENDIX TO CHAPTER 4
Table A4.14b The smoothed high-temperature thermodynamic properties of AZr03(s) from 298.15 to 2000 K (A = Sr, Ba).
T
|K1
CPUmol'K-'l
S°
y-mor'K1]
FEF
U-mol'-K"1
H°(T)-H°(298)
] [Jmor'l Umol *|
AjG°(T)
(J-mol *1
BaZrOg
298.15 101.710 124.680 124.680 0 -1765000 -1680157300.0 101.998 125.310 124.682 188 -1764993 -1679631400.0 112.404 156.277 128.833 10977 -1764565 -1651239500.0 117.633 181.976 136.968 22504 -1764151 -1622957
600.0 120.825 203.725 146.329 34438 -1763851 -1594748700.0 123.056 222.527 155.902 46638 -1763693 -1566579800.0 124.773 239.075 165.285 59032 -1763677 -1538423900.0 126.193 253.855 174.319 71582 -1763791 -1510260
1000.0 127.314 267.212 182.952 84261 -1764027 -1482079
1100.0 128.144 279.387 191.173 97035 -1771025 -14531781200.0 128.775 290.565 198.996 109883 -1774649 -14240781300.0 129.266 300.893 206.443 122786 -1773928 -13948931400.0 129.655 310.488 213.536 135733 -1773221 -13657631500.0 129.969 319.444 220.301 148714 -1772538 -1336683
1600.0 130.227 327.840 226.763 161725 -1771892 -13076471700.0 130.440 335.742 232.943 174758 -1771294 -12786501800.0 130.618 343.203 238.863 187811 -1770758 -12496871900.0 130.769 350.269 244.542 200881 -1770298 -12207522000.0 130.898 356.980 249.998 213964 -1769929 -1191838
-218-
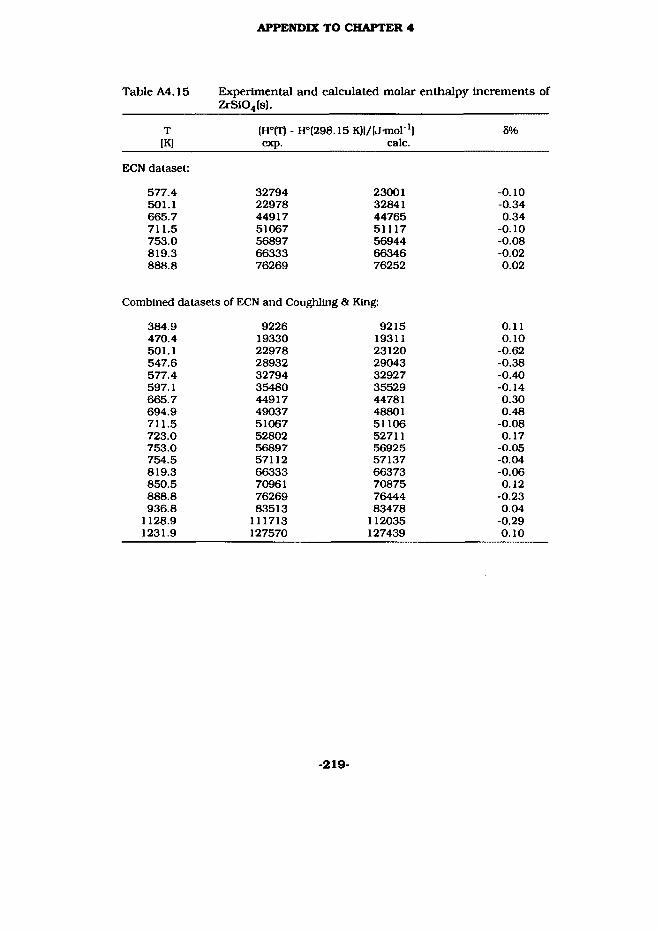
APPENDIX TO CHAPTER 4
Table A4.15 Experimental and calculated molar enthalpy Increments ofZrS104(s).
TIK]
{H°m -exp.
tmgS.lSKM/IJmol"1]calc.
6%
ECN dataset:
577.4 32794 23001 -0.10501.1 22978 32841 -0.34665.7 44917 44765 0.34711.5 51067 51117 -0.10753.0 56897 56944 -0.08819.3 66333 66346 -0.02888.8 76269 76252 0.02
Combined datasets of ECN and Coughllng & King:
384.9 9226 9215 0.11470.4 19330 19311 0.10501.1 22978 23120 -0.62547.6 28932 29043 -0.38577.4 32794 32927 -0.40597.1 35480 35529 -0.14665.7 44917 44781 0.30694.9 49037 48801 0.48711.5 51067 51106 -0.08723.0 52802 52711 0.17753.0 56897 56925 -0.05754.5 57112 57137 -0.04819.3 66333 66373 -0.06850.5 70961 70875 0.12888.8 76269 76444 -0.23936.8 83513 83478 0.04
1128.9 111713 112035 -0.291231.9 127570 127439 0.10
-219-

APPENDIX TO CHAPTER 4
Table A4.16 The smoothed high-temperature thermodynamic properties of ZrSiQ4(s) from 298.15 to 2000 K.
TIK|
CP[Jtnol ' -K M
S°[Jmor’-K-'l
FEF[J-mol"'-H"1
H°(T)-H°{298)1 IJmor'l
AjH°(T)[J-mol1]
AjG°(T)[J-mol1]
298.15 98.280 83.760 83.760 0 -2030527 -1915944300.0 98.681 84.369 83.762 182 -2030539 -1915233400.0 114.934 115.195 87.854 10936 -2030513 -1876771500.0 125.354 142.030 96.067 22982 -2029662 -1838421
600.0 132.931 165.588 105.731 35914 -2028330 -1800291700.0 138.690 186.531 115.806 49508 -2026697 -1762411800.0 143.058 205.350 125.843 63606 -2024874 -1724778900.0 146.240 222.394 135.639 78080 -2022953 -1687381
1000.0 148.344 237.920 145.103 92818 -2021017 -1650199
1100.0 149.431 252.118 154.195 107715 -2019147 -16132091200.0 149.899 265.141 162.906 122682 -2021127 -15761731300.0 150.264 277.154 171.238 137691 -2018876 -15391861400.0 150.552 288.301 179.206 152733 -2016745 -15023671500.0 150.786 298.696 186.830 167800 -2014741 -1465697
1600.0 150.976 308.434 194.129 182888 -2012872 -14291561700.0 151.134 317.592 201.125 197994 -2061340 -13924301800.0 151.267 326.234 207.838 213114 -2059560 -13531341900.0 151.379 334.416 214.286 228247 -2057915 -13139342000.0 151.475 342.183 220.489 243390 -2056420 -1274816
-220-
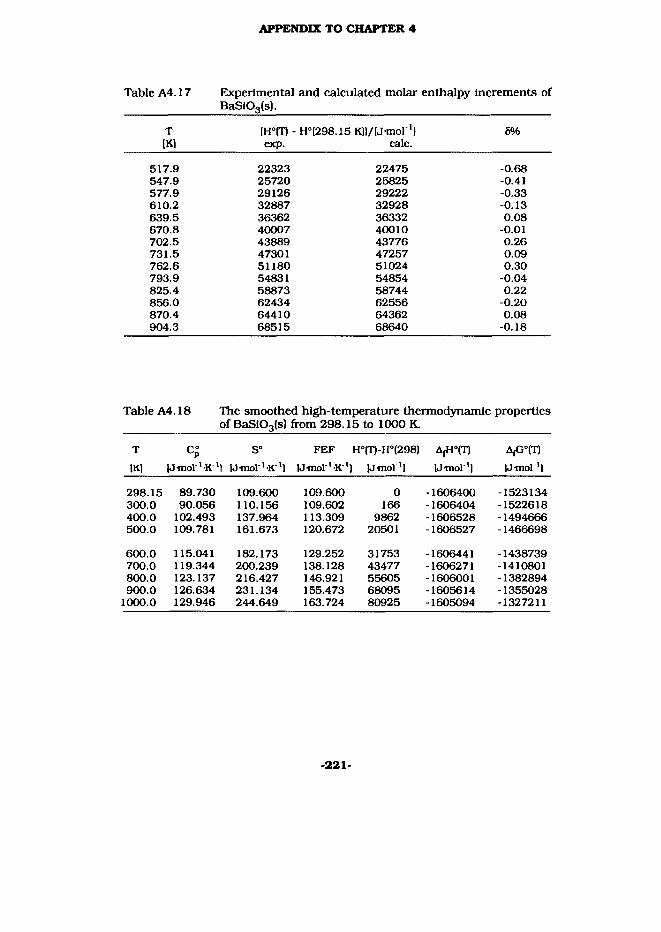
APPENDIX TO CHAPTER 4
Table A4.17 Experimental and calculated molar enthalpy Increments of BaS103(s).
TIK1
(H°(T) - exp.
H°(298.15 KJI/lJ-mol 'l calc.
8%
517.9 22323 22475 -0.68547.9 25720 25825 -0.41577.9 29126 29222 -0.33610.2 32887 32928 -0.13639.5 36362 36332 0.08670.8 40007 40010 -0.01702.5 43889 43776 0.26731.5 47301 47257 0.09762.6 51180 51024 0.30793.9 54831 54854 -0.04825.4 58873 58744 0.22856.0 62434 62556 -0.20870.4 64410 64362 0.08904.3 68515 68640 -0.18
Table A4.18 The smoothed high-temperature thermodynamic propertiesof BaSiOg(s) from 298.15 to 1000 K.
T CP S° FEF H°(T)-H°(298) AfG°(T)
IK] M-moV'-K1'] IJmoV'-K1] IJmol'K"1 I IJmol"1] IJmol"1] IJmol1]
298.15 89.730 109.600 109.600 0 -1606400 -1523134300.0 90.056 110.156 109.602 166 -1606404 -1522618400.0 102.493 137.964 113.309 9862 -1606528 -1494666500.0 109.781 161.673 120.672 20501 -1606527 -1466698
600.0 115.041 182.173 129.252 31753 -1606441 -1438739700.0 119.344 200.239 138.128 43477 -1606271 -1410801800.0 123.137 216.427 146.921 55605 -1606001 -1382894900.0 126.634 231.134 155.473 68095 -1605614 -1355028
1000.0 129.946 244.649 163.724 80925 -1605094 -1327211
-221-
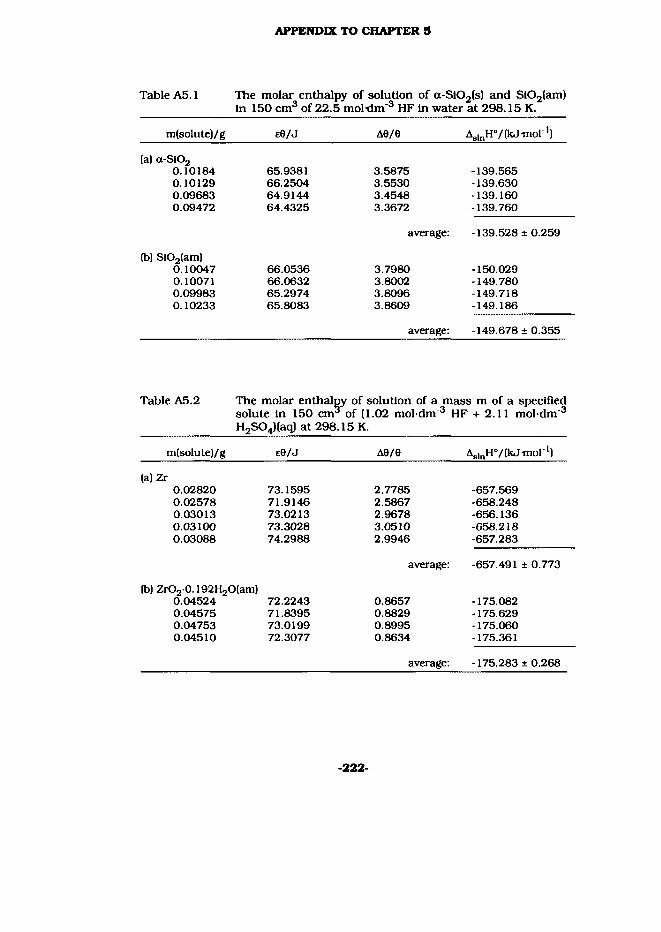
APPENDIX TO CHAPTER 5
Table A5.1 The molar enthalpy of solution of a-Sl02(s) and Sl02(am)In 150 cm3 of 22.5 mol dm"3 HF In water at 298.15 K.
m(solute)/g e0/J A0/0 AalnH°/(kJtnorl)
(a) a-SiOa0.10184 65.9381 3.5875 -139.5650.10129 66.2504 3.5530 -139.6300.09683 64.9144 3.4548 -139.1600.09472 64.4325 3.3672 -139.760
average: -139.528 ±0.259
(b) Si02(am)0.10047 66.0536 3.7980 -150.0290.10071 66.0632 3.8002 -149.7800.09983 65.2974 3.8096 -149.7180.10233 65.8083 3.8609 -149.186
average: -149.678 ± 0.355
Table A5.2 The molar enthalpy of solution of a mass m of a specified solute In 150 cm3 of (1.02 mol dm 3 HF + 2.11 mol dm 3
H2SQ4)(aq) at 298.15 K.m(solute)/g E0/J A0/0 As|nH°/(kJmor1)
(a)Zr0.02820 73.1595 2.7785 -657.5690.02578 71.9146 2.5867 -658.2480.03013 73.0213 2.9678 -656.1360.03100 73.3028 3.0510 -658.2180.03088 74.2988 2.9946 -657.283
average: -657.491 ± 0.773
D20.192H2O(am)0.04524 72.2243 0.8657 -175.0820.04575 71.8395 0.8829 -175.6290.04753 73.0199 0.8995 -175.0600.04510 72.3077 0.8634 -175.361
average: -175.283 ± 0.268
-222-

APPENDIX TO CHAPTER 5
Table A5.3 The molar enthalpy of solution of ZrO20.154H2O(am) In150 cm3 of (1.02 mol dm 3 HF + 2.11 mol dm 3 H2S04)(aq)at 298.15 K.
m(solute)/g e9/J A9/6 Ag^HV (kJ mol"1)
0.04667 76.5344 0.8874 -183.3840.04465 79.5586 0.8122 -182.3690.04663 76.3438 0.8648 -178.4210.04501 77.9655 0.8347 -182.199
average: -181.593 ± 2.179
-223-
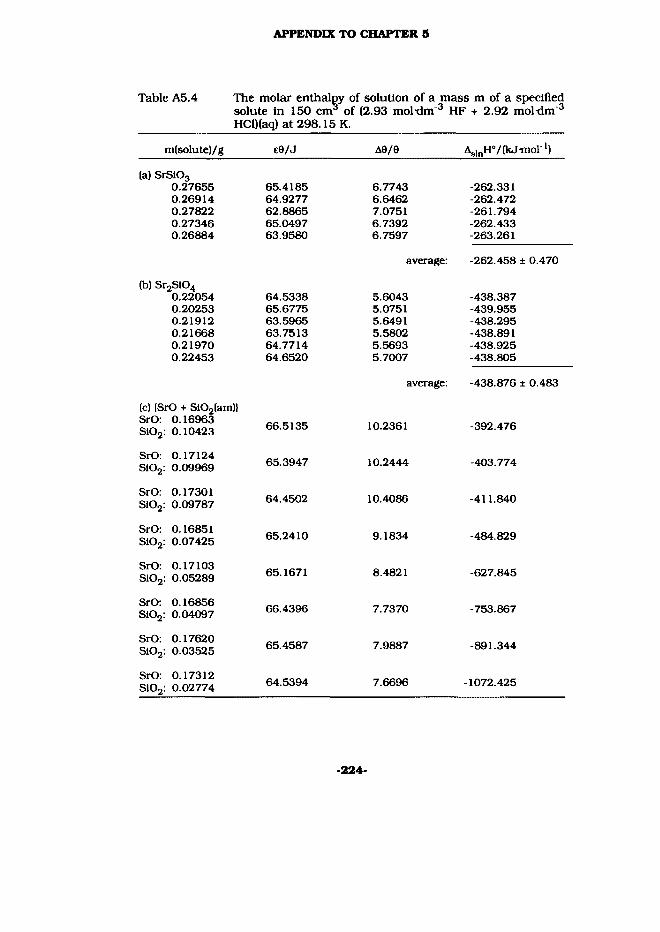
APPENDIX TO CHAPTER 5
Table A5.4 The molar enthalpy of solution of a mass m of a specifiedsolute In 150 cnr of (2.93 mol-dm"3 HF + 2.92 mol-dm 3HCD(aq) at 298.15 K.
m(solute)/g e9/J A9/9 AslnH°/(kJinor1)
(a) SrS1030.27655 65.4185 6.7743 -262.3310.26914 64.9277 6.6462 -262.4720.27822 62.8865 7.0751 -261.7940.27346 65.0497 6.7392 -262.4330.26884 63.9580 6.7597 -263.261
average: -262.458 ± 0.470
(b) Sr2S1040.22054 64.5338 5.6043 -438.3870.20253 65.6775 5.0751 -439.9550.21912 63.5965 5.6491 -438.2950.21668 63.7513 5.5802 -438.8910.21970 64.7714 5.5693 -438.9250.22453 64.6520 5.7007 -438.805
(c) (SrO + Si02(am)| SrO: 0.16963SI02: 0.10423 66.5135
average: -438.876 ± 0.483
10.2361 -392.476
SrO: 0.17124SI02: 0.09969 65.3947 10.2444 -403.774
SrO: 0.17301Si02: 0.09787 64.4502 10.4086 -411.840
SrO: 0.16851S102: 0.07425 65.2410 9.1834 -484.829
SrO: 0.17103S102: 0.05289 65.1671 8.4821 -627.845
SrO: 0.16856S102: 0.04097 66.4396 7.7370 -753.867
SrO: 0.17620S102: 0.03525 65.4587 7.9887 -891.344
SrO: 0.17312Si02: 0.02774 64.5394 7.6696 -1072.425
-224-

APPENDIX TO CHAPTER 5
Table A5.5 The molar enthalpy of solution of a mass m of a specified solute In 150 cnr of (3.17 mol-dm"3 HF + 3.10 mol dm 3 HC1) at 298.15 K.
m(solute)/g e6/J A6/8 A^HVtkJuiol1)
(a) am-SrSt03(s)0.27550 67.2517 7.4075 -296.0140.26604 66.5603 7.2511 -296.9820.27078 67.1350 7.3053 -296.5030.26588 65.5144 7.3417 -296.1460.28066 66.9110 7.5931 -296.343
average: -296.398 ± 0.336
(b) 8-SrS103(s)0.24563 65.5884 6.3183 -276.1880.24006 65.2652 6.2061 -276.2100.23545 66.1499 6.0711 -275.7130.23775 66.3102 6.0383 -275.698
average: -275.952 ± 0.285
-225-

APPENDIX TO CHAPTER 5
Table A5.6 The molar enthalpy of solution of a mass M of a specifiedsolute In 150 cnr of (3.15 mol dm ^ HF + 3.13 mol dm ^HCl)(aq) at 298.15 K.
m(solute)/g e9/J A6/9 A,,„H°/(kJ-mol ')
(a) BaS103(s)0.03240 66.1368 0.6359 -277.0190.03491 65.0862 0.6947 -276.4130.03320 64.3901 0.6672 -276.1590.03380 66.0945 0.6626 -276.5170.03409 65.5240 0.6697 -274.711
average: -276.164* 0.778
(b) Ba2S104(s)0.03517 66.0625 0.6425 -442.6060.03687 65.7445 0.6771 -442.7930.03204 66.1435 0.5846 -442.6050.03613 66.9930 0.6484 -440.927
average: -442.233 * 0.875
(c) |BaO(s) + SI02(am)) BaO: 0.02299Si02: 0.01124 65.1249 1.0842 -377.443
BaO: 0.02364Si02: 0.00990 65.4246 1.0438 -414.461
BaO: 0.02687S102: 0.00905 65.5715 1.1006 -479.134
BaO: 0.02698SiOa: 0.00706 65.3254 1.0401 -578.247
BaO: 0.02997S102: 0.00699 64.6253 1.1332 -629.496
BaO: 0.02908S102: 0.00552 64.5852 1.0428 -733.088
-226-
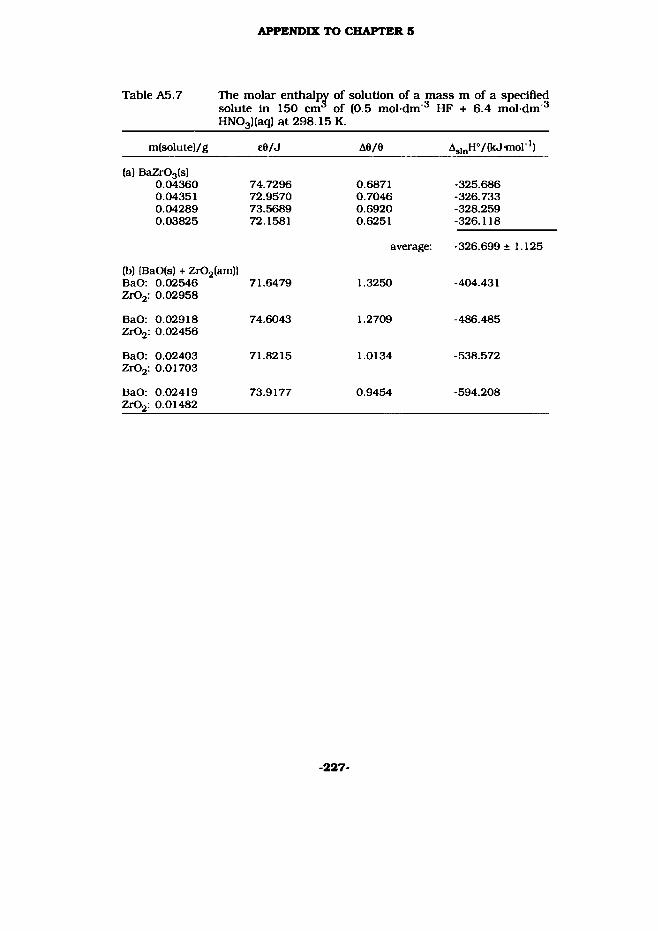
APPENDIX TO CHAPTER 5
Table A5.7 The molar enthalpy of solution of a mass m of a specifiedsolute In 150 cnv of (0.5 mol dm ^ HF + 6.4 mol dm ^HN03)(aq) at 298.15 K.
m(solute)/g 60/J A6/6 As,„H°/(kJ-mol ')
(a) BaZr03(s)0.04360 74.7296 0.6871 -325.6860.04351 72.9570 0.7046 -326.7330.04289 73.5689 0.6920 -328.2590.03825 72.1581 0.6251 -326.118
average: -326.699 ± 1.125
(b) (BaO(s) + Zr02(am)| BaO: 0.02546 71.6479 1.3250 -404.431Zr02: 0.02958
BaO: 0.02918ZrOa: 0.02456
74.6043 1.2709 -486.485
BaO: 0.02403Zr02: 0.01703
71.8215 1.0134 -538.572
BaO: 0.02419Zr02: 0.01482
73.9177 0.9454 -594.208
-227-
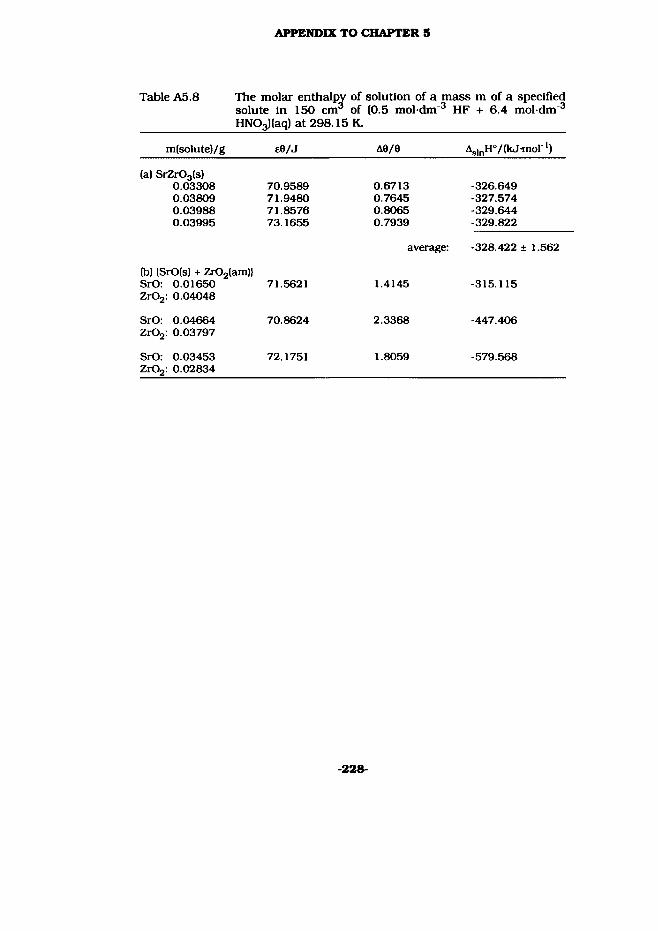
APPENDIX TO CHAPTER 5
Table A5.8 The molar enthalpy of solution of a mass m of a specifiedsolute In 150 cm^ of (0.5 mol dm ^ HF + 6.4 mol dm ^
HNQ3)(aq) at 298.15 K.
m(solute)/g e6/J A9/6 As|nH°/(kJ-morl)
(a) SrZr03(s)0.033080.038090.039880.03995
70.958971.948071.857673.1655
0.67130.76450.80650.7939
-326.649-327.574-329.644-329.822
average: -328.422 ± 1.562
(b) (SrO(s) + Zr02(am)l SrO: 0.01650Zr02: 0.04048
71.5621 1.4145 -315.115
SrO: 0.04664Zr02: 0.03797
70.8624 2.3368 -447.406
SrO: 0.03453Zr02: 0.02834
72.1751 1.8059 -579.568
-228-

APPENDIX TO CHAPTER 5
Table A5.9 The molar enthalpy of solution of a mass m of a specified solute in 150 cnr of (1.01 mol dm 3 HF + 6.41 mol dm 3HN03)(aq) at 298.15 K.
m(solute)/g e0/J A9/6 AslnH0/(kJ'm°r1)
(a) SrZrSIgOy0.09518 66.8778 2.2641 -552.0460.10526 67.3426 2.4826 -551.1580.09405 66.9556 2.2369 -552.6090.10234 69.0469 2.3674 -554.2600.10344 67.8789 2.4246
average:
-552.115
-552.438 ± 1.024
(b) "Sr6ZrSl5018"0.10519 67.8608 2.6361 -1777.7570.10638 67.4330 2.6845 -1778.8610.10538 68.2332 2.6335 -1782.5310.10386 68.4446 2.5847
average:
-1780.598
-1779.937 ± 2.088
(c) SrO + Zr02(am) (+ c. 3.33 mmol-dm'3 SrO- 0 03714
sio2)ZrOa: 0.04578 68.7534 2.3394 -445.077
SrO: 0 04244
Zr02: 0.02913 70.4480 2.1595 -661.597
SrO: 0 04403
ZrOa: 0.02966 69.7216 2.1897 -716.574
SrO: 0 04971
Zr02: 0.02059 66.9597 2.3400 -964.018
SrO: OOSfifU
Zr02: 0.01614 66.9200 2.5340 -1330.979
SrO 0 06412
Zr02: 0.01204 67.9796 2.3180 -1657.974
SrO 0 00113
Zr02: 0.00733 68.2055 2.4795 -2922.750
-229-

APPENDIX TO CHAPTER 5
Table A5.9(cont.) The molar enthalpy of solution of a mass m of a specified solute in 150 cnr of (1.01 mol dm ^ HF + 6.41 mol dm ^
HNQ3)(aq) at 298,15 K.
m(solute)/g e9/J A9/9 A„,„H°/(kJ-mol ')
(d) Si02(am) (+ SrO SiOz: 0.03244SrO: 0.04892 Zr02: 0.02185
+ Zr02(am))68.9811 1.1590 -148.079
Si02: 0.02869SrO: 0.06084 Zr02: 0.01018
68.9583 1.0321 -149.052
S102: 0.03333SrO: 0.05217 Zr02: 0.01680
68.4093 1.2060 -148.726
S102: 0.02945SrO: 0.03415 Zr02: 0.03115
66.4870 1.0993 -149.118
S102: 0.03051SrO: 0.04331 Zr02: 0.02605
67.7419 1.1220 -149.682
S102: 0.03141SrO: 0.05832 Zr02: 0.12210
69.0294 1.1280 -148.949
average: -148.926 ±0.428
-230-
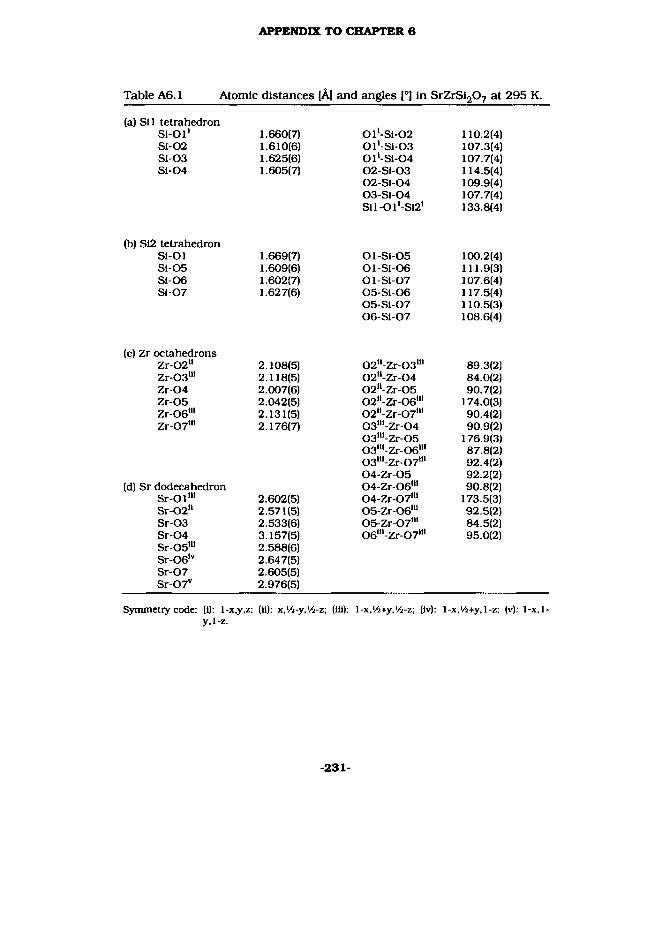
APPENDIX TO CHAPTER 6
Table A6.1 Atomic distances [A] and angles [°1 in SrZrSi207 at 295 K.
(a) Sll tetrahedronSi-Ol' 1.660(7) 0l‘-Sl-02 110.2(4)Si-02 1.610(6) 01*-Si-03 107.3(4)Si-03 1.625(6) 0l‘-Si-04 107.7(4)Si-04 1.605(7) 02-S1-03 114.5(4)
02 Si 04 109.9(4)03-81-04 107.7(4)Sll-Ol'-Si2' 133.8(4)
(b) Si2 tetrahedronSi-Ol 1.669(7) Ol-Si-OS 100.2(4)81-05 1.609(6) 01-51-06 111.9(3)Si-06 1.602(7) Ol-Si-07 107.6(4)SI 07 1.627(6) 05-51-06 117.5(4)
05-51-07 110.5(3)06-S1-07 108.6(4)
(c) Zr octahedronsZr-02" 2.108(5) 02ll-Zr-03m 89.3(2)Zr-03m 2.118(5) 02ll-Zr-04 84.0(2)Zr-04 2.007(6) 02"-Zr-05 90.7(2)Zr 05 2.042(5) 02,l-Zr-06111 174.0(3)Zr-06m 2.131(5) 02"-Zr-07l“ 90.4(2)Zr-07m 2.176(7) 03"'-Zr-04 90.9(2)
03hl-Zr-05 176.9(3)03III-Zr-06I" 87.8(2)03III-Zr-07I" 92.4(2)04-Zr 05 92.2(2)
(d) Sr dodecahedron 04-Zr-06111 90.8(2)Sr-Ol"1 2.602(5) 04-Zr-07IH 173.5(3)Sr-0211 2.571(5) 05-Zr-06nl 92.5(2)Sr-03 2.533(6) 05-Zr-07™ 84.5(2)Sr-04 3.157(5) 06lll-Zr-07111 95.0(2)Sr-05"1 2.588(6)Sr-oelv 2.647(5)Sr-07 2.605(5)Sr-07v 2.976(5)
Symmetry code: (1): 1-x.y.z: (11): x.'/i-y.'/i-z; (ill): l-x.'/.+y.'/i-z; (iv): l-x.'/i+y.l-z; (v): 1-x, 1-y.i-z.
-231-

APPENDIX TO CHAPTER 6
Table A6.2 Relative charge on the oxygen atoms according to theformalism of Brown and Altermatt [Bro 851.
bonding S.i bonding SU
Ol-Sil 0.91 05-812 1.0401-512 0.89 05-Zr 0.75Ol-Sr 0.27 05-Sr 0.28V(01): 2.07 V(05): 2.07
02-511 1.04 06-512 1.0602-Zr 0.63 06 Zr 0.5902-Sr 0.29 06-Sr 0.24V(02): 1.96 V(06): 1.89
03-511 1.00 07-812 0.9903-Zr 0.61 07-Zr 0.5303-Sr 0.33 07-Sr 0.27V(OS): 1.94 07-Sr 0.10
V(OT): 1.8804-Sil 1.0504 Zr 0.8304-Sr 0.06V(04): 1.94
-232-

APPENDIX TO CHAPTER 6
Table A6.3. The HKL, observed and calculated d- values, andestimated Intensities of 5-SrS103.
H K L d (observed) d(calculated) estimated relative Intensity
2 0 0 7.4789 7.4764 < 52 0 1 6.5727 6.5761 < 5
-2 0 2 5.2498 5.2441 < 51 1 0 5.0320 5.0315 15
-1 1 1 4.7610 4.7609 15-1 1 2 4.1363 4.1386 10
1 1 2 4.1079 4.1098 5-2 0 3 4.0817 4.0801 102 0 3 3.9981 3.9990 54 0 0 3.7389 3.7382 < 5
f o 0 4 1 [ 3.5996 1l 4 0 1 J 3.5993 l 3.5990 J 30-3 1 1 3.5470 3.5469 < 5-1 1 3 3.4875 3.4859 20
1 1 3 3.4614 3.4601 30-4 0 2 3.3475 3.3480 604 0 2 3.2898 3.2881 70
-2 0 4 3.2708 3.2717 1003 1 2 3.2300 3.2308 90
-4 0 3 2.9818 2.9813 40-1 1 4 2.9382 2.9379 604 0 3 2.9175 2.9181 800 0 5 2.8799 2.8797 20
-2 0 5 2.7077 2.7074 200 2 0 2.6715 2.6715 805 1 0 2.6099 2.6096 30
-5 1 1 2.5764 2.5765 105 1 1 2.5592 2.5591 156 0 0 2.4921 2.4921 60
-2 2 1 2.4814 2.4813 5-5 1 2 2.4688 2.4687 205 1 2 2.4380 2.4384 30
-2 2 2 2.3806 2.3804 < 5-6 0 2 2.3710 2.3713 < 50 2 3 2.3345 2.3343 30
-5 1 3 2.3114 2.3114 20-2 0 6 2.2997 2.2998 105 1 3 2.2748 2.2743 < 54 0 5 2.2570 2.2573 30
-2 2 3 2.2345 2.2350 102 2 3 2.2215 2.2214 < 5
-233-
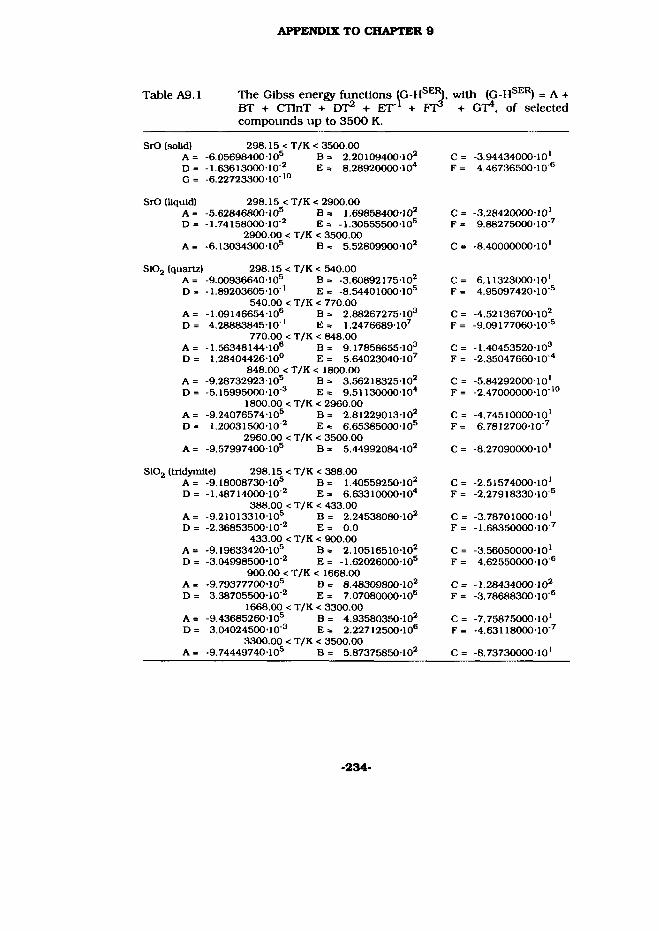
APPENDIX TO CHAPTER 9
Table A9.1 The Glbss energy functions (G-HSER), with (G-HSER) = A + BT + CTlnT + DT2 + ET1 + FT3 + GT4. of selected compounds up to 3500 K.
SrO (solid)AI) = G =
298.15 < T/K < 3500.00 -6.05698400• 105 B = 2.20109400-102-1.63613000 10 2 E = 8.28920000-10" -6.22723300 10'10
C = -3.9443400010* F = 4.46736500-10'6
SrO (liquid) A = D =
A =
298.15 < T/K < 2900.00 -5.62846800-105 B = 1.69858400-102-1.74158000-10 2 E= -1.30555500-10®
2900.00 < T/K < 3500.00 -6.13034300-105 B = 5.52809900-102
C = -3.28420000-10* F = 9.88275000-10"7
C = -8.40000000-10*
S102 (quartz) 298.15 < T/K < 540.00A = -9.00936640 10s B = -3.60892175-10® C = 6.11323000-10*D = -1.89203605-10 * E = -8.5440100010s F = 4.95097420-10 s
540.00 < T/K < 770.00A = -1.09146654-10® B = 2.88267275-10® C = -4.52136700-102D = 4.28883845-10 ' E = 1.2476689-107 F = -9.09177060-10 ®
770.00 < T/K < 848.00A = -1.56348144-10® B = 9.17858655-10® C = -1.40453520TO3D = 1.28404426-10° E = 5.64023040-107 F = -2.35047660-10 "
848.00 < T/K < 1800.00A = -9.28732923 10s B = 3.56218325 102 C = -5.84292000-10*D = -5.15995000-10 2 E = 9.51130000-10'* F = -2.47000000-10'10
1800.00 < T/K < 2960.00A = -9.24076574 10s B = 2.81229013-102 C = -4.74510000 10*D = 1.20031500-1 O'2 E = 6.6538500010s F = 6.7812700-10 7
2960.00 < T/K < 3500.00A= -9.57997400-105 B = 5.44992084-102 C = -8.27090000-10*
S102 (tridymite) 298.15 < T/K < 388.00A = -9.1800873010s B = 1.40559250-10® C = -2.51574000-10*D = -1.48714000-10 2 E = 6.63310000-10" F = -2.27918330 10 s
388.00 < T/K < 433.00A = -9.2101331010s B = 2.24538080 102 C = -3.78701000-10*D = -2.36853500 10 2 E = 0.0 F = -1.68350000-10 7
433.00 < T/K < 900.00A = -9.19633420 10s B = 2.10516510-102 C = -3.56050000-10*D = -3.04998500-10 2 E = -1.6202600010s F = 4.62550000-10®
900.00 < T/K < 1668.00A = -9.79377700-10® B = 8.48309800-102 C = -1.28434000-102D = 3.38705500-10"2 E = 7.07080000-10® F = -3.78688300-10®
1668.00 < T/K < 3300.00A= -9.43685260 10® B = 4.93580350-102 C = -7.75875000 10*D = 3.04024500-10 2 E = 2.22712500-10® F = -4.63118000-10 7
3300.00 < T/K < 3500.00A = -9.74449740-10® B = 5.87375850-102 C = -8.73730000-10*
-234-

APPENDIX TO CHAPTER 9
Table A9.1 (cont.) The Glbss energy functions (G-HSER), BT + CTlnT + DT2 + ET1 + FT3 compounds up to 3500 K.
S102 (crlstobalite) 298.15 < T/K < 373.00A = -6.01467730-105 B = -8.14022550-103 D = -2.85790850T0° E= -1.31440160-107
373.00 < T/K < 453.00A = -1.49871130-10® B= 1.30759130 10"D = 3.49360900 10° E = 2.91002730 107
453.00 < T/K < 543.00A = -3.22453870 10° B= 4.78549380-104D = 1.18171490 10' E= 1.27502720 10°
543.00 < T/K < 3300.00A = -9.43127510 10° B= 4.93260560 103D = 3.04024500 10 3 E = 2.22712500 10°
3300.00 < T/K < 3500.00A = -9.73891990 10° B= 5.87056060 103
Si02 (liquid) A - D =
A =
298.15 < T/K < 2980.00 -9.23689980-10° B= 3.16247660-102-1.20020000-10"2 E = 6.65550000-10°
2980.00 < T/K < 3500.00 -9.57614210-10° B= 5.80014190-102
Zr02 (monoclinic) 298.15 < T/K < 3500.00A = -1.12610800-10° B = 4.26153000-102D = -3.76600000 10 3 E = 7.02900000-10°
Zr02 (tetregonal) 298.15 < T/K < 1475.00A = -1.10110800-10° B = 2.82523800-102 D = -7.8069000010 3
1475.00 < T/K < 1675.00A = -1.1856800-10° B= 4.53233800-102
1675.00 < T/K < 3500.00A = -9.99956600-10® B= -5.95913500-102 D = -4.20700000-10 2
Zr02 (cubic) A = D =
A =
298.15 < T/K <2620.00 -1.11154700-10° B = 2.67815700-102-1.61300000 10 2
2620.00 < T/K < 3500.00 -1.22229000-10° B= 9.33145300-102
Zr02 (liquid) A - D =
A =
298.15 < T/K < 2983.00 -1.04256300-10° B= 6.31786400-1029.80220000-10° E = 1.30217000-10°
2983.00 < T/K < 3500.00 -1.03994300-10® B= 6.24322200-102
With (G-HSER) = A + + GT4, of selected
C = 1.39989080-103F = 1.04081450-103
C = -2.17835610-103 F= -1.07621320 10 3
C= -7.86021250-103 F = -3.36518320-10 3
C = -7.75875000-101 F = -4.6311800-10 7
C = -8.73730000-101
C = -5.21700000-10' F = 6.78000000-10 7
C = -8.74280000 10'
C = -6.96220000-101
C = -5.13977000-10'
C = -7.47500000-1 O'
C = 6.65300000-10'
C = -4.64300000-101
C = -1.30959000-102
C = -1.00878000-102
C = -1.00000000-102
-235-
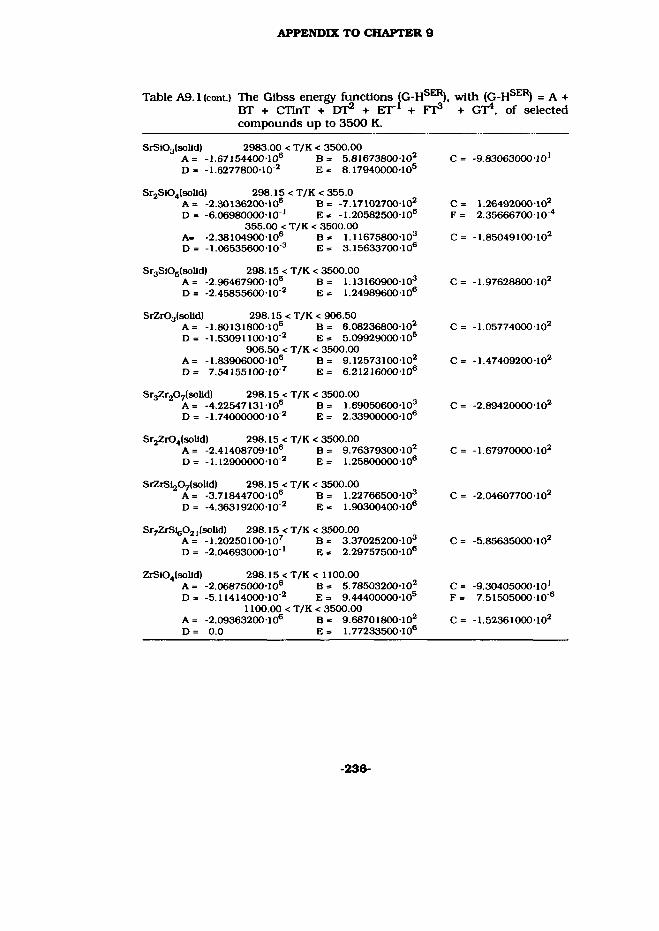
APPENDIX TO CHAPTER 9
Table A9.1 (cont.) The Glbss energy functions (G-HSER), with (G-HSER) = A + BT + CITnT + DT2 + ET"1 + FT3 + GT4, of selected compounds up to 3500 K.
SrSlOg(soUd) 2983.00 < T/K < 3500.00A= -1.6715440010® B= 5.81673800-102 C = -9.83063000-101D = -1.6277800 10 2 E = 8.17940000-10®
Sr2Sl04(solld) 298.15 < T/K < 355.0A= -2.30136200-10® B= -7.17102700 102D = -6.06980000-10 ' E= -1.20582500-10®
355.00 < T/K < 3500.00A= -2.3810490010® B = 1.11675800-103D = -1.0653560010 3 E= 3.1563370010®
C = 1.26492000 102F = 2.35666700 10 4
C = -1.85049100 102
Sr3S105(soUd) 298.15 < T/K < 3500.00A = -2.96467900 10® B = 1.13160900 103 C= -1.97628800 102D = -2.45855600 10 2 E= 1.2498960010®
SrZrOg(solld) 298.15 < T/K < 906.50A = -1.80131800 10® B = 6.08236800 102D = -1.53091100-10 2 E = 5.09929000-10s
906.50 < T/K < 3500.00A = -1.83906000-10® B = 9.12573100-102D= 7.54155100-10"7 E= 6.21216000-10®
C = -1.05774000-102
C = -1.47409200-102
Sr3Zr207(soUd) 298.15 < T/K < 3500.00A = -4.22547131-10® B = 1.69050600-103 C= -2.89420000102D = -1.74000000-10 2 E = 2.33900000-10®
Sr2Zi04(solld) 298.15 < T/K < 3500.00A = -2.41408709-10® B = 9.76379300-102 C= -1.67970000-102D= -1.12900000 10 2 E = 1.25800000-10®
SrZrSl207(soUd) 298.15 < T/K < 3500.00A = -3.71844700-10® B = 1.22766500-103 C = -2.04607700-102D = -4.36319200-102 E= 1.90300400-10®
Sr7ZrS%02I(solid) 298.15 < T/K < 3500.00A= -1.20250100-107 B = 3.37025200-103 C= -5.85635000 102D= -2.04693000-10"1 E = 2.29757500-10®
ZrSt04(solld) 298.15 < T/K < 1100.00A = -2.06875000-10® B = 5.78503200-102D= -5.11414000-10 2 E = 9.44400000-10®
1100.00 < T/K < 3500.00 A = -2.09363200-10® B = 9.68701800-102D = 0.0 E = 1.77233500-10®
C = -9.30405000-101 F = 7.51505000-10®
C = -1.52361000-102
-236-