Research reactor core conversion guidebook
567
IAEA-TECDOC-643 Research reactor core conversion guidebook Volume 4: Fuels (Appendices I-K) INTERNATIONAL ATOMIC ENERGY AGENCY /A\
-
Upload
khangminh22 -
Category
Documents
-
view
2 -
download
0
Transcript of Research reactor core conversion guidebook

IAEA-TECDOC-643
Research reactorcore conversion guidebook
Volume 4: Fuels(Appendices I-K)
INTERNATIONAL ATOMIC ENERGY AGENCY /A\

RESEARCH REACTOR CORE CONVERSION GUIDEBOOKVOLUME 4: FUELS (APPENDICES I-K)
IAEA, VIENNA, 1992IAEA-TECDOC-643ISSN 1011-4289
Printed by the IAEA in AustriaApril 1992

FOREWORD
In view of the proliferation concerns caused by the use of highlyenriched uranium (HEU) and in anticipation that the supply of HEU to researchand test reactors will be more restricted in the future, this guidebook hasbeen prepared to assist research reactor operators in addressing the safetyand licensing issues for conversion of their reactor cores from the use of HEUfuel to the use of low enriched uranium (LEU) fuel.
Two previous guidebooks on research reactor core conversion have beenpublished by the IAEA. The first guidebook (IAEA-TECDOC-233) addressedfeasibility studies and fuel development potential for light-water-moderatedresearch reactors and the second guidebook (IAEA-TECDOC-324) addressed thesetopics for heavy-water-moderated research reactors. This guidebook, in fivevolumes, addresses the effects of changes in the safety-related parameters ofmixed cores and the converted core. It provides an information base whichshould enable the appropriate approvals processes for implementation of aspecific conversion proposal, whether for a light or for a heavy watermoderated research reactor, to be greatly facilitated.
This guidebook has been prepared at a number of Technical CommitteeMeetings and Consultants Meetings and coordinated by the Physics Section ofthe International Atomic Energy Agency, with contributions volunteered bydifferent organizations. The IAEA is grateful for these contributions andthanks the experts from the various organizations for preparing the detailedinvestigations and for evaluating and summarizing the results.
EDITORIAL NOTE
In preparing this material for the press, staff of the International Atomic Energy Agency havemounted and paginated the original manuscripts as submitted by the authors and given some attentionto the presentation.
The views expressed in the papers, the statements made and the general style adopted are theresponsibility of the named authors. The views do not necessarily reflect those of the governments ofthe Member States or organizations under whose auspices the manuscripts were produced.
The use in this book of particular designations of countries or territories does not imply anyjudgement by the publisher, the IAEA, as to the legal status of such countries or territories, of theirauthorities and institutions or of the delimitation of their boundaries.
The mention of specific companies or of their products or brand names does not imply anyendorsement or recommendation on the part of the IAEA.
Authors are themselves responsible for obtaining the necessary permission to reproduce copyrightmaterial from other sources.
This text was compiled before the unification of Germany in October 1990. Therefore the namesGerman Democratic Republic and Federal Republic of Germany have been retained.

PLEASE BE AWARE THATALL OF THE MISSING PAGES IN THIS DOCUMENT
WERE ORIGINALLY BLANK

PREFACE
Volume 4 consists of detailed Appendices I - K, which contain usefulinformation on the properties, irradiation testing, and specifications andinspection procedures for fuels with reduced uranium enrichments.Summaries of these appendices can be found in Chapters 9 - 11 of Volume 1(SUMMARY) of this guidebook.
Appendix I contains information on the properties of aluminide, oxide,and suicide dispersion fuel materials, cladding and structural materials,corrosion resistance of aluminum alloy claddings, exothermic reactions, andstructural stability of MTR fuel elements. Descriptions are also providedon the design, development, and qualification of LEU(8%) "Caramel" fuel andon the development, testing, and general specifications of uranium-zirconium hydride TRIGA-LEU fuel.
Appendix J summarizes requirements on the reliability of LEU fuel fromthe point of view of a reactor operator and outlines the philosophy andprocedures that were utilized by the U.S. RERTR Program for non-destructiveand destructive PIE of miniplates and full-size elements. Extensive dataare provided on the irradiation and post-irradiation examination of HEU andLEU dispersion fuels with high uranium density (> 1.7 g/crrr^). Dataincludes burnup results, swelling and blister threshold temperaturebehavior, results of metallographic examinations, and fission productrelease behavior.
Appendix K discusses standardization of specifications and inspectionprocedures for LEU plate-type fuels. Detailed examples of fuelspecifications and inspection procedures are provided for several fuelelement geometries and fuel types. Methodology for determination ofcladding thickness is also described.
The topics which are addressed in Volume 4, the appendices in whichdetailed information can be found, and the summary chapters of Volume 1 arelisted below.
VOLUME 1VOLUME 4 SUMMARY
Topic APPENDIX Chapter
Fuel Materials Data I 9Irradiation and Post-Irradiation Examination (PIE)of Dispersion Fuels with High Uranium Density J 10
Examples of Fuel Specifications and InspectionProcedures K 11

CONTRIBUTING ORGANIZATIONS
Argonne National Laboratory ANL
Atlas-Danmark A/S ATLAS
Babcock & Wilcox BSW
Chalk River Nuclear Laboratories CRNL
Comisiôn Nacional de Energia Atômica CNEA
Commissariat a l'Énergie Atomique CEA
Compagnie Pour l'Étude et la Réalisationde Combustibles Atomiques CERCA
EG&G - Idaho EG&G
GA Technologies Inc. GA
GEC Energy Systems, Ltd. GEC
GKSS-Forschungszentrum Geesthacht GmbH GKSS
Japan Atomic Energy Research Institute JAERI
Kernforschungsanlage Julich KfA
Kernforschungszentrum Karlsruhe KfK
Kyoto University Research ReactorInstitute KURRI
Netherlands Energy Research Foundation ECN
NUKEM GmbH NUKEM
Oak Ridge National Laboratory ORNL
Ris0 National Laboratory RIS0
United Kingdom Atomic Energy Authority
United Kingdom Atomic Energy Authority
University of Michigan -Ford Nuclear Reactor FNR
United States of AmericaDenmark
United States of America
CanadaArgentina
France
France
United States of America
United States of America
United Kingdom
Federal Republic ofGermany
JapanFederal Republic ofGermanyFederal Republic ofGermany
JapanNetherlands
Federal Republic ofGermany
United States of AmericaDenmark
HARWELL United Kingdom
DOUNREAY United Kingdom
United States of America
The IAEA is grateful for the contributions volunteered by theseorganizations and thanks their experts for preparing the detailedinvestigations and for evaluating and summarizing the resultspresented in this Guidebook.

CONTENTS
APPENDIX I. FUEL MATERIALS DATA
1-1. Properties of fuel meat materialsI-1.1. ANL: Selected thermal properties and uranium density relations
for alloy, aluminide, oxide, and suicide fuels .......................................... 13J.E. Matos, J.L. Snelgrove
1-1.2. ANL: Phases in U-Si alloys ............................................................... 31R.F. Domagala
1-2. Properties of cladding and structural materials1-2.1. CERCA: Description and qualification of some aluminum alloys used by
CERCA as cladding materials ............................................................. 411-2.2. NUKEM: NUKEM cladding and structural materials ................................ 451-2.3. B&W: Babcock and Wilcox cladding and structural materials ...................... 47
1-3. Corrosion resistance and experience with aluminum alloy claddings1-3.1. ANL: Water corrosion of aluminum alloy claddings ................................. 491-3.2. GKSS: Point corrosion defects of FRG-2 fuel elements ............................. 53
W. Krull1-3.3. HARWELL: Note on UK experience relating to corrosion of MTR fuel ........ 57
R. Panter1-3.4. GEC: Aluminium corrosion data .......................................................... 59
C. Baglin1-3.5. CRNL: CRNL experience with aluminum cladding corrosion ...................... 61
R.D. Graham1-3.6. KfA: Water and corrosion technology of light water research reactors ........... 69
H. Pieper1-4. Exothermic reactions
1-4.1. ANL/ORNL: Exothermic reactions in U3O8 dispersion fuel ........................ 791-4.2. ANL: A differential thermal analysis study of U3Si-Al and
U3Si2-Al reactions ............................................................................ 89R.F. Domagala, T.C. Wiencek, J.L. Snelgrove, M.I. Homa,R.R. Heinrich
1-4.3. KfK: Reaction behaviour of UxSiy-Al and U6Fe-Al dispersions .................... 1075". Nazaré
1-4.4. ATLAS: Differential thermal analysis and metallographic examinations ofU3Si2 powder and U3Si2/Al (38 w/o) miniplates ....................................... 115
P. Toft, A. Jensen1-5. Structural stability
1-5.1. ANL: Structural stability of plate-type fuel elements used in US research andtest reactors ................................................................................... 123
1-5.2. JAERI: Hydraulic tests on dummy fuel elements for JAERI reactors ............. 133K. Tsuchihashi, T. Sato, K. Simizu, K. Kurosawa, M. Banba,S. Yamaguchi, J. Tsunoda, F. Nakayama, Y. Itabashi, H. Kanekawa,R. Oyamada, M. Saito, T. Nagamatsuya
1-6. CEA: 'Caramel' — French LEU fuel for research reactors with emphasis on theOSIRIS experience of core conversion ............................................................. 143
1-7. GA: Uranium-zirconium hydride TRIGA-LEU fuel ............................................. 1611-7.1. GA/ORNL: Final results from TRIGA LEU fuel post-irradiation examination
and evaluation following long term irradiation testing in the ORR ................ 187G.B. West, M.T. Simnad, G.L. Copeland
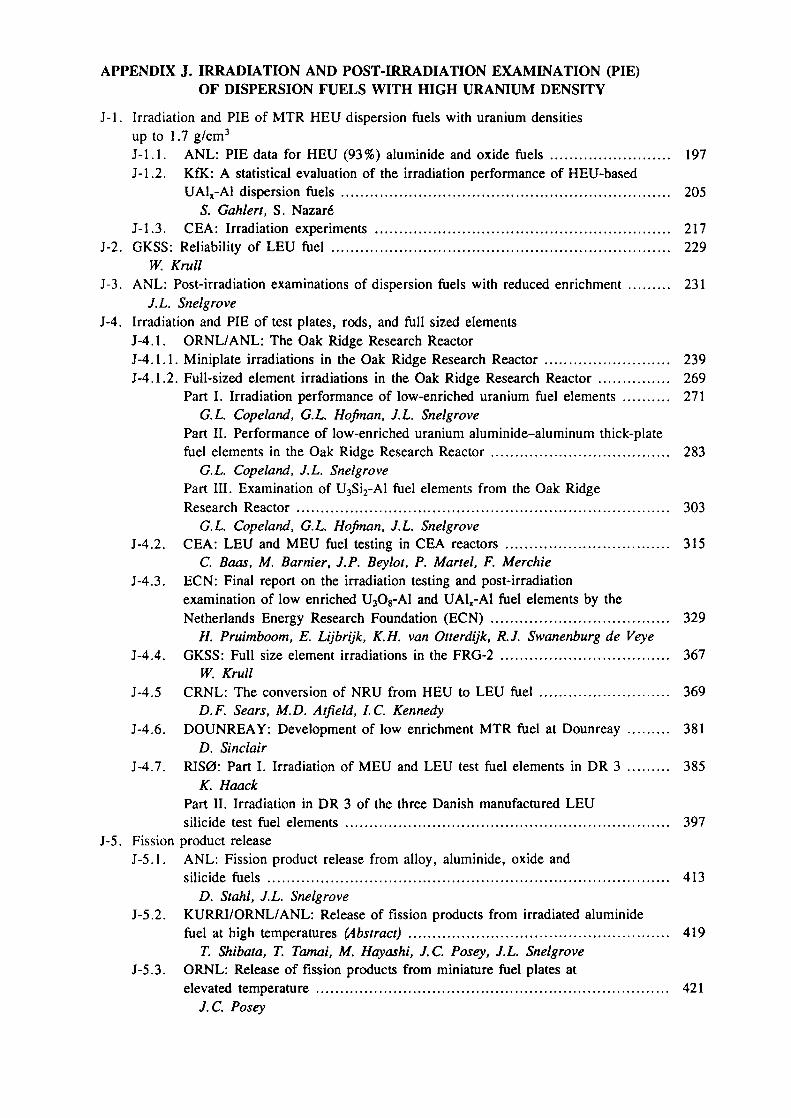
APPENDIX J. IRRADIATION AND POST-IRRADIATION EXAMINATION (PIE)OF DISPERSION FUELS WITH HIGH URANIUM DENSITY
J-l. Irradiation and PIE of MTR HEU dispersion fuels with uranium densitiesup to 1.7 g/cm3
J-l.l . ANL: PIE data for HEU (93%) aluminide and oxide fuels ......................... 197J-l.2. KfK: A statistical evaluation of the irradiation performance of HEU-based
UA1X-A1 dispersion fuels .................................................................... 205S. Gahlert, S. Nazaré
J-l.3. CEA: Irradiation experiments ............................................................. 217J-2. GKSS: Reliability of LEU fuel ...................................................................... 229
W. KrullJ-3. ANL: Post-irradiation examinations of dispersion fuels with reduced enrichment ......... 231
J.L. SnelgroveJ-4. Irradiation and PIE of test plates, rods, and full sized elements
J-4.1. ORNL/ANL: The Oak Ridge Research ReactorJ-4.1.1. Miniplate irradiations in the Oak Ridge Research Reactor .......................... 239J-4.1.2. Full-sized element irradiations in the Oak Ridge Research Reactor ............... 269
Part I. Irradiation performance of low-enriched uranium fuel elements .......... 271G.L. Copeland, G.L. Hofinan, J.L. Snelgrove
Part II. Performance of low-enriched uranium aluminide-aluminum thick-platefuel elements in the Oak Ridge Research Reactor ..................................... 283
G.L. Copeland, J.L. SnelgrovePart III. Examination of U3Si2-Al fuel elements from the Oak RidgeResearch Reactor ............................................................................. 303
G.L. Copeland, G.L. Hofinan, J.L. SnelgroveJ-4.2. CEA: LEU and MEU fuel testing in CEA reactors .................................. 315
C. Baas, M. Barnier, J.P. Beylot, P. Martel, F. MerchieJ-4.3. ECN: Final report on the irradiation testing and post-irradiation
examination of low enriched U3O8-A1 and UA1X-A1 fuel elements by theNetherlands Energy Research Foundation (ECN) ..................................... 329
H. Pruimboom, E. Lijbrijk, K.H. van Otterdijk, R.J. Swanenburg de VeyeJ-4.4. GKSS: Full size element irradiations in the FRG-2 ................................... 367
W. KrullJ-4.5 CRNL: The conversion of NRU from HEU to LEU fuel ........................... 369
D.F. Sears, M.D. Atfield, I.C. KennedyJ-4.6. DOUNREAY: Development of low enrichment MTR fuel at Dounreay ......... 381
D. SinclairJ-4.1. RIS0: Part I. Irradiation of MEU and LEU test fuel elements in DR 3 ......... 385
K. HaackPart II. Irradiation in DR 3 of the three Danish manufactured LEUsuicide test fuel elements ................................................................... 397
J-5. Fission product releaseJ-5.1. ANL: Fission product release from alloy, aluminide, oxide and
suicide fuels ................................................................................... 413D. Stahl, J.L. Snelgrove
J-5.2. KURRI/ORNL/ANL: Release of fission products from irradiated aluminidefuel at high temperatures (Abstract) ...................................................... 419
T. Shibata, T. Tamai, M. Hayashi, J.C. Posey, J.L. SnelgroveJ-5.3. ORNL: Release of fission products from miniature fuel plates at
elevated temperature ......................................................................... 421J.C. Posey
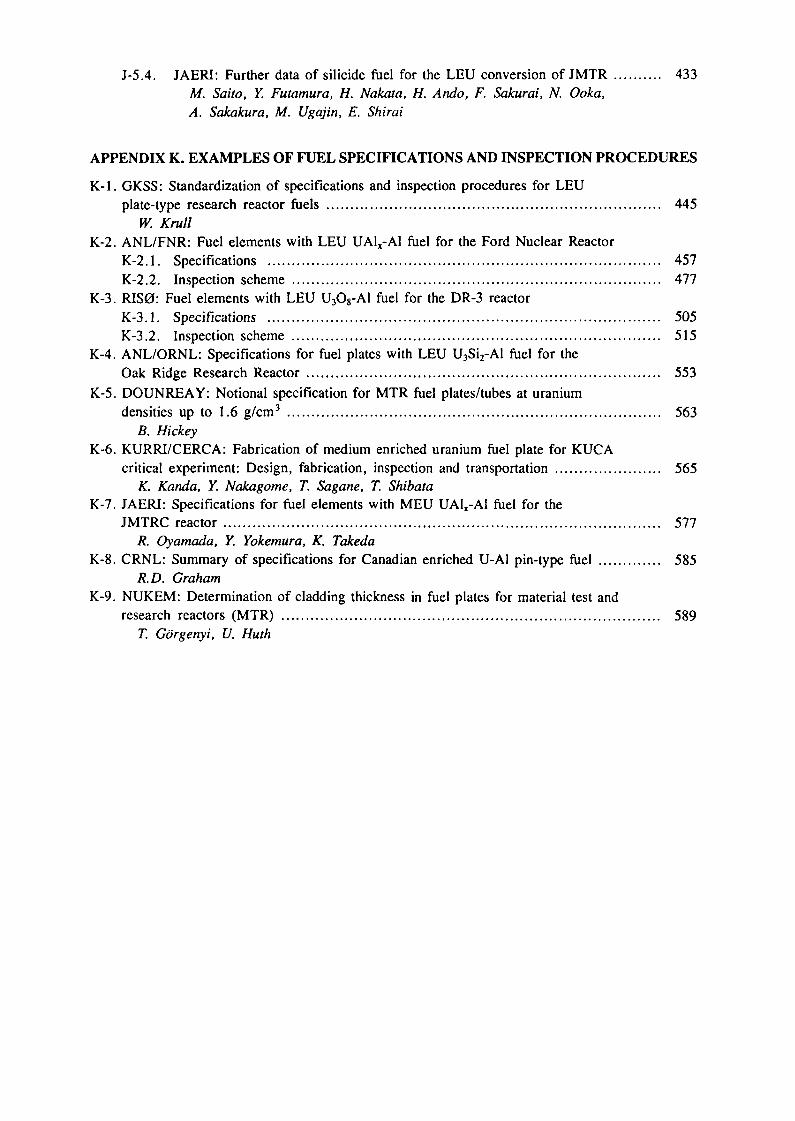
J-5.4. JAERI: Further data of suicide fuel for the LEU conversion of JMTR .......... 433M. Saito, Y. Futamura, H. Nakata, H. Ando, F. Sakurai, N. Ooka,A. Sakakura, M. Ugajin, E. Shirai
APPENDIX K. EXAMPLES OF FUEL SPECIFICATIONS AND INSPECTION PROCEDURES
K-l. GKSS: Standardization of specifications and inspection procedures for LEUplate-type research reactor fuels ..................................................................... 445
W. KrullK-2. ANL/FNR: Fuel elements with LEU UA1X-A1 fuel for the Ford Nuclear Reactor
K-2.1. Specifications ................................................................................. 457K-2.2. Inspection scheme ............................................................................ 477
K-3. RIS0: Fuel elements with LEU U3O8-A1 fuel for the DR-3 reactorK-3.1. Specifications ................................................................................. 505K-3.2. Inspection scheme ............................................................................ 515
K-4. ANL/ORNL: Specifications for fuel plates with LEU U3Si2-Al fuel for theOak Ridge Research Reactor ......................................................................... 553
K-5. DOUNREAY: Notional specification for MTR fuel plates/tubes at uraniumdensities up to 1.6 g/cm3 ............................................................................. 563
B. HickeyK-6. KURRI/CERCA: Fabrication of medium enriched uranium fuel plate for KUCA
critical experiment: Design, fabrication, inspection and transportation ...................... 565K. Kanda, Y. Nakagome, T. Sagane, T. Shibata
K-7. JAERI: Specifications for fuel elements with MEU UA1X-A1 fuel for theJMTRC reactor .......................................................................................... 577
R. Oyamada, Y. Yokemura, K. TakedaK-8. CRNL: Summary of specifications for Canadian enriched U-A1 pin-type fuel ............. 585
R.D. GrahamK-9. NUKEM: Determination of cladding thickness in fuel plates for material test and
research reactors (MTR) .............................................................................. 589T. Görgenyi, U. Huth

Appendix IFUEL MATERIALS DATA
Abstract
Information is provided on the properties of aluminide,oxide, and suicide dispersion fuel materials, cladding andstructural materials, corrosion resistance of aluminum alloycladdings, exothermic reactions, and structural stability ofMTR fuel elements.
Descriptions are also provided on the design, development,and qualification of LEU(8%) "Caramel" fuel with emphasis onthe OSIRIS experience of core conversion and on thedevelopment, testing, and general specifications of uranium-zirconium hydride TRIGA-LEU fuel with up to 45 wt-% U.

Appendix 1-1PROPERTIES OF FUEL MEAT MATERIALS
Appendix 1-1.1
SELECTED THERMAL PROPERTIES AND URANIUMDENSITY RELATIONS FOR ALLOY, ALUMINIDE,OXIDE, AND SILICIDE FUELS
I.E. MATOS, J.L. SNELGROVERERTR Program,Argonne National Laboratory,Argonne, Illinois,United States of America
AbstractThis appendix presents data on the specific heat, thermal
conductivity, and other properties of fuel meat materials commonly used,or considered for use, in research and test reactors. Also included areformulae relating the density of uranium in the fuel meat with the weightfraction of uranium and the volume fraction of the dispersed phase.
1.0 URANIUM DENSITY RELATIONS
In general, the density and weight fraction of uranium in fuel meatcomposed of aluminum, a dispersed phase, and voids can be written as:
Pu (1 - P) Pu/P.Al
PAI- a W0 (1 - P) + a (1)
where
wu"l ^PD
(2)
P = Porosity = Volume of VoidsVolume of Solids + Volume of Voids
= Weight Fraction of Uranium in the Fuel Meat
W = Weight Fraction of Uranium in the Dispersed Phase
pA1 = Density of Aluminum =2.7
D = Density of the Dispersed Phase
13
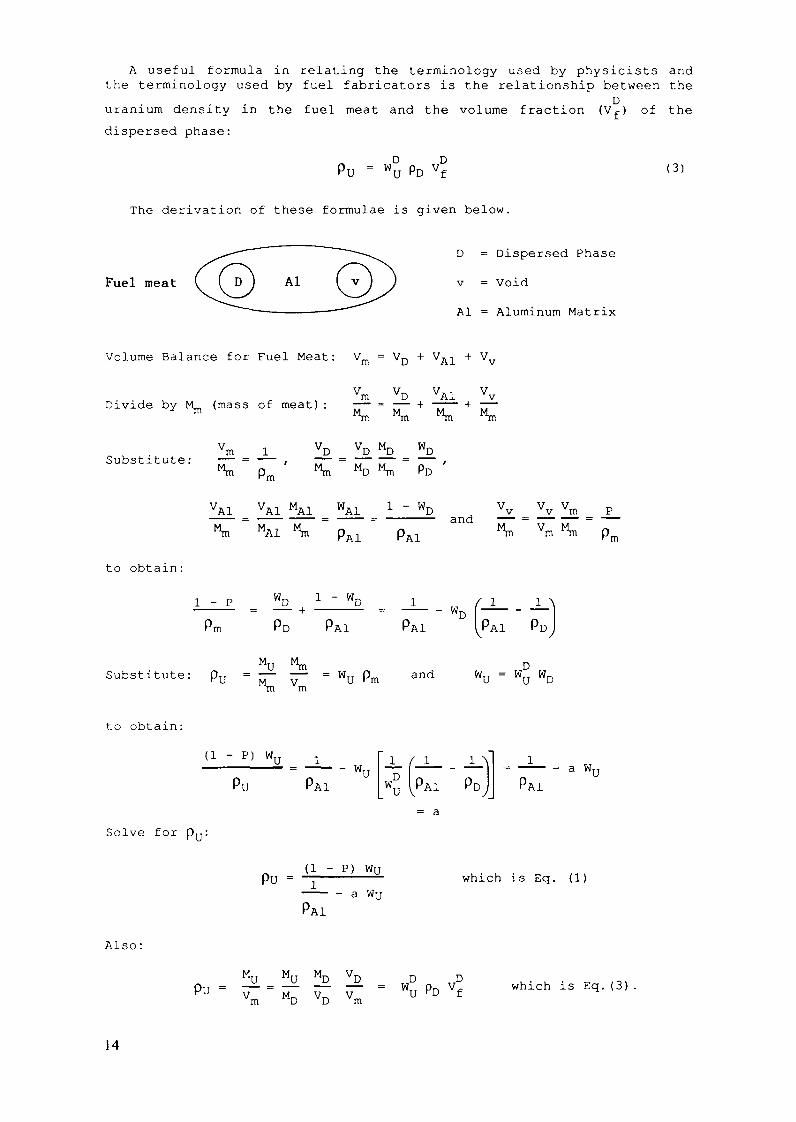
A useful formula in relating the terminology used by physicists andthe terminology used by fuel fabricators is the relationship between the
Duranium density in the fuel meat and the volume fraction (Vf) of thedispersed phase:
Pu = wu (3)
The derivation of these formulae is given below.
Fuel meat AlD = Dispersed Phase
v = Void
Al = Aluminum Matrix
Volume Balance for Fuel Meat: Vm = VD + VAI + Vv
Divide by M_ (mass of meat) : —— = —— + —— + —-™ Mm "m "m "m
Substitute :VD VD MD WD.
MD "m
VA1 VA1 MA1 W'AI"m MA1
1 - WD ÏY. _ Xz. X™ _ -Land ^ ' Vffl ^ - pff
to obtain:
I - P - Wr
PD PAI +~ - «D (~PAI PAI PD
Substitute: = —— —— = WU Pm and WU = WU WDm
to obtain:
Solve for
Also:
(l - P) W,- WT
PAIi / i
Pu = (i - P) wu
PAI
i "PD
- a WTPAI
= a
which is Eq. (1)
ÜLL = ÎÎLL ÎÎ2. Ï2. = WD
Vm MD VD Vm ~ "Uv which is Eq.(3)
14

Atomic Percentage Uranium6 8 10
if UU
lOOO'
1600
zeoo*
1500
2600F
14002SOOF
1300ZÎOOF
1200Î IOO«
1100
1900 F
1000
I7OOF
900I6OOF
800•400 F
700IZOOF
600
— - - — i ——1000«oor
900
800
''00
6009<
66037'~ —— • ——
1 '
\^
719-
663*
).6
// I55i
13
\\
998'
tr-u
\_T76-
— •?"
"£\
99ia
998Weight %
\J\
Ul-^
1U
y
S"
J
/
/
/
•'
/
/
732'
646'
L
xx
''
U
UA
i
I
1'-64
Al f
]v-
16
/
1352*
W 1 ~~
"'?""
?2.
\
IK
759'
665*
\
\\\
\\\
——— \-111
———— \-
-<»J
(r-u)-
(ß-u)-
(a-u)-
AI 10 20 30 40 50 60 70 80 90 UWeight Percentage Uranium
Fig. 1. AI-U Aluminum-Uranium
2 . 0 THE URANIUM-ALUMINUM SYSTEM
The uranium-aluminum system-'- (Fig. 1) contains three compounds -UA13, and UA14 - which are formed during cooling down from the molten2state. Some properties^ of these compounds are listed in Table 1:
Table 1. Some Properties of Uranium-Aluminum Compounds
Compound
UA12
UA13
UA14*
Density,3/CHr
8.1
6.8
6.1 (Theoretical)5.7 ± 0.3 (Measured3)
HUD
0.8130.744
0.6850.640
MeltingEûiûL, °C
1590
1350
730
*The compound UA14 has a defect structure^ in which some of theuranium sites are unoccupied. The compound corresponds stoi-chiometrically to UAl4.g (also referred to as UQ gAl4).
Since UA12 and UA13 react with an excess of aluminum at moderatetemperatures to form UAl^, the relative amounts of these compounds thatare present in the fuel meat of a finished plate or tube is a function ofthe wt-% of the uranium and the fabrication processes and heat treatmentsthat are utilized.
15
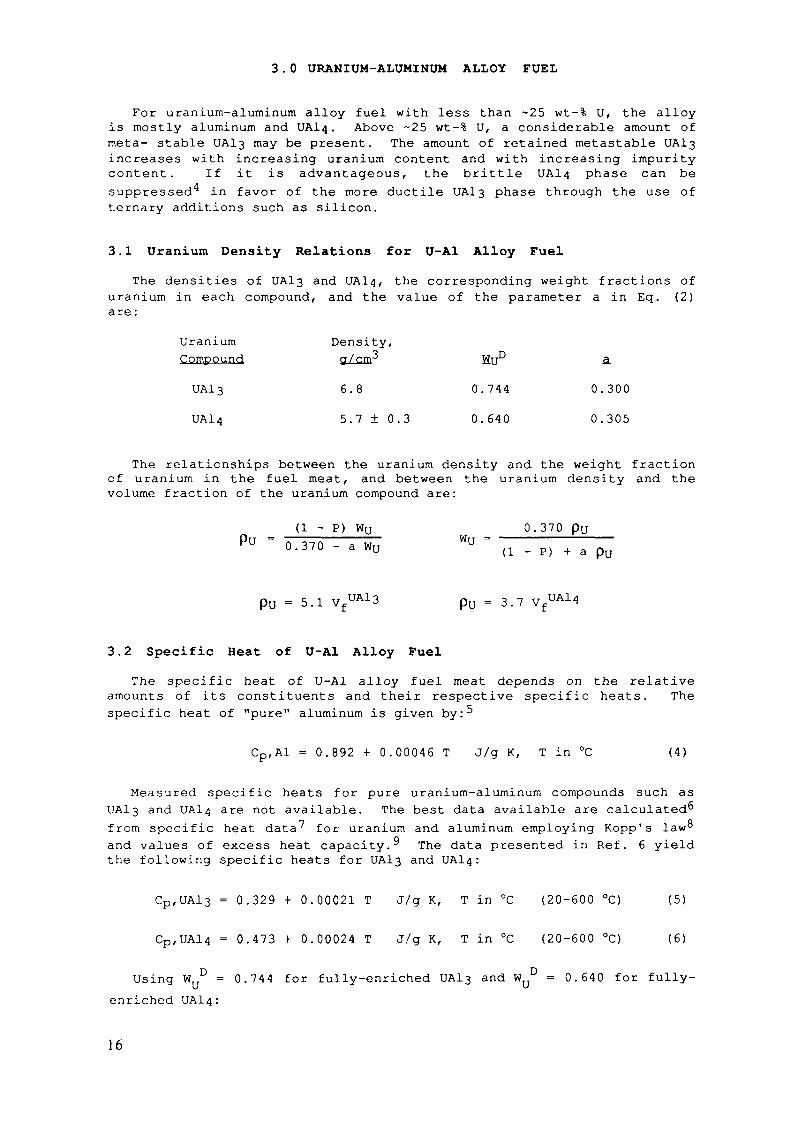
3 . 0 URANIUM-ALUMINUM ALLOY FUEL
For uranium-aluminum alloy fuel with less than ~25 wt-% U, the alloyis mostly aluminum and UA14. Above ~25 wt-% U, a considerable amount ofmeta- stable UA13 may be present. The amount of retained metastable UA13increases with increasing uranium content and with increasing impuritycontent. If it is advantageous, the brittle UA14 phase can besuppressed^ in favor of the more ductile UAl3 phase through the use ofternary additions such as silicon.
3.1 Uranium Density Relations for U-Al Alloy FuelThe densities of UAlß and UA14, the corresponding weight fractions of
uranium in each compound, and the value of the parameter a in Eq. (2)are:
UraniumCompound
UA13
UA14
Density,a/cm6.85.7 ± 0.3
ÏÏUD
0.744
0.640
a.0.300
0.305
The relationships between the uranium density and the weight fractionof uranium in the fuel meat, and between the uranium density and thevolume fraction of the uranium compound are:
(1 - P) Wu _ 0.370 puP" - 0.370 - a Wu W" - (1 _ P) + a pu
PU = 5.1 VfUA13 pu = 3.7 VfUA14
3.2 Specific Heat of U-Al Alloy Fuel
The specific heat of U-Al alloy fuel meat depends on the relativeamounts of its constituents and their respective specific heats. Thespecific heat of "pure" aluminum is given by:5
Cp,Al = 0.892 + 0.00046 T J/g K, T in °C (4)
Measured specific heats for pure uranium-aluminum compounds such asUAl3 and UA14 are not available. The best data available are calculated^from specific heat data for uranium and aluminum employing Kopp's law"and values of excess heat capacity. The data presented in Ref. 6 yieldthe following specific heats for UA13 and UA14 :
Cp,UAl3 = 0.329 + 0.00021 T J/g K, T in °C (20-600 °C) (5)
Cp,UAl4 = 0.473 + 0.00024 T J/g K, T in °C (20-600 °C) (6)
Using W D = 0.744 for fully-enriched UAl3 and Wy0 = 0.640 for fully-enriched UA14:
16
Cp,U-Al alloy = (1.0 - Wu/0.744) Cp,Al + (Wu/0.744) Cp,UAl3(100% UA13)
= 0.892 + 0.00046 T - Wu (0.757 + 0.00034 T) J/g K, T in °C
Cp,U-Al alloy = (1.0 - Wu/0.640) Cp,Al + (Wu/0.640) Cp,UAl4(100% UA14)
= 0.892 + 0.00046 T - Wö (0.655 + 0.00034 T) J/g K, T in °C
Since most plate-type research reactor fuels contain < 25 wt-% U, theuranium compound in the fuel meat is mostly UA14. At 25 wt-% U and 40°C,for example, specific heats for U-A1 alloy calculated assuming 100% UA14and 100% UA13 differ by less than 4%. In practice, only a small fractionof the uranium compound is likely to be UA13.
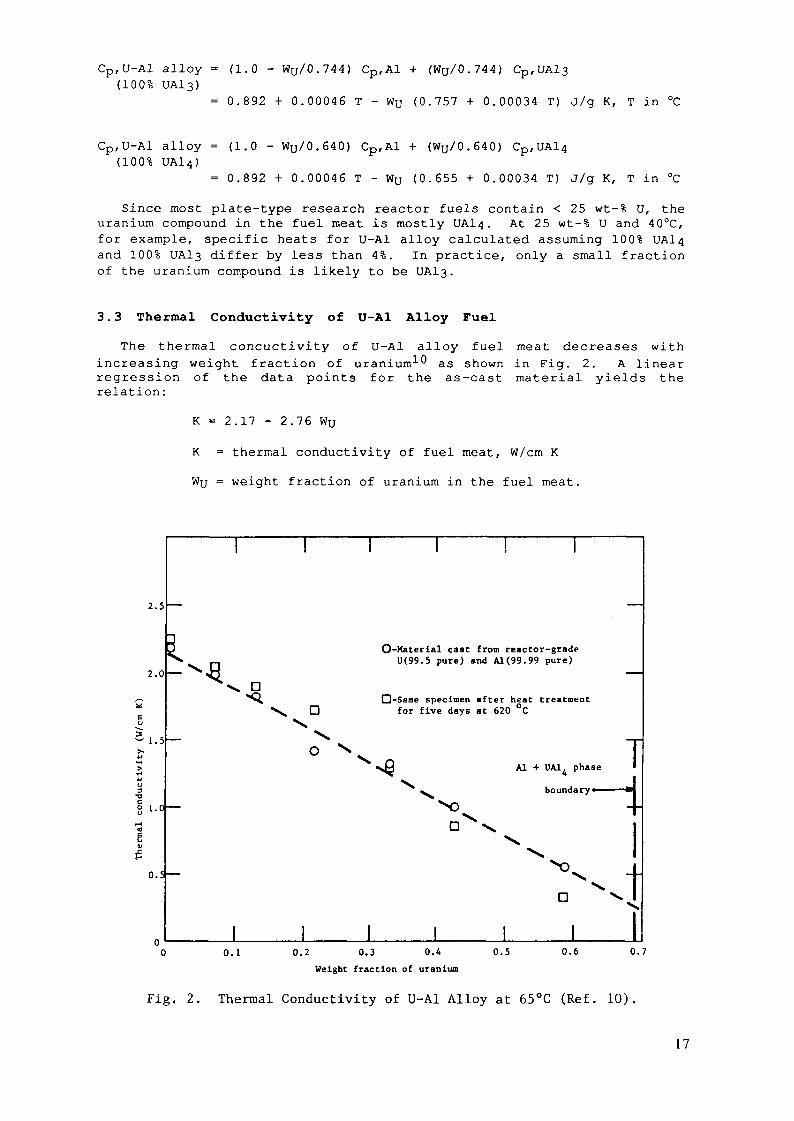
3.3 Thermal Conductivity of U-A1 Alloy Fuel
The thermal concuctivity of U-A1 alloy fuel meat decreases withincreasing weight fraction of uranium-^ as shown in Fig. 2. A linearregression of the data points for the as-cast material yields therelation:
K = 2.17 - 2.76 Wu
K = thermal conductivity of fuel meat, W/cm KWy = weight fraction of uranium in the fuel meat.
2.5
2.0
1.5
a•DP.I.
0.5
O-Material cast from reactor-gradeU(99.5 pure) and Al(99.99 pure)
Q-Same specimen after heat treatmentfor five days at 620 °C
•xQ AI + UA14 phase
boundary •^-•o
0.1 0.2 0.3 0.4 0.5Weight fraction of uranium
0.6
T«
0.7
Fig. 2. Thermal Conductivity of U-A1 Alloy at 65°C (Ref. 10).
17
u Iu o3 «•OC i-<O lU B
2.4
2.2
2.0
1.8
1.6
1.4
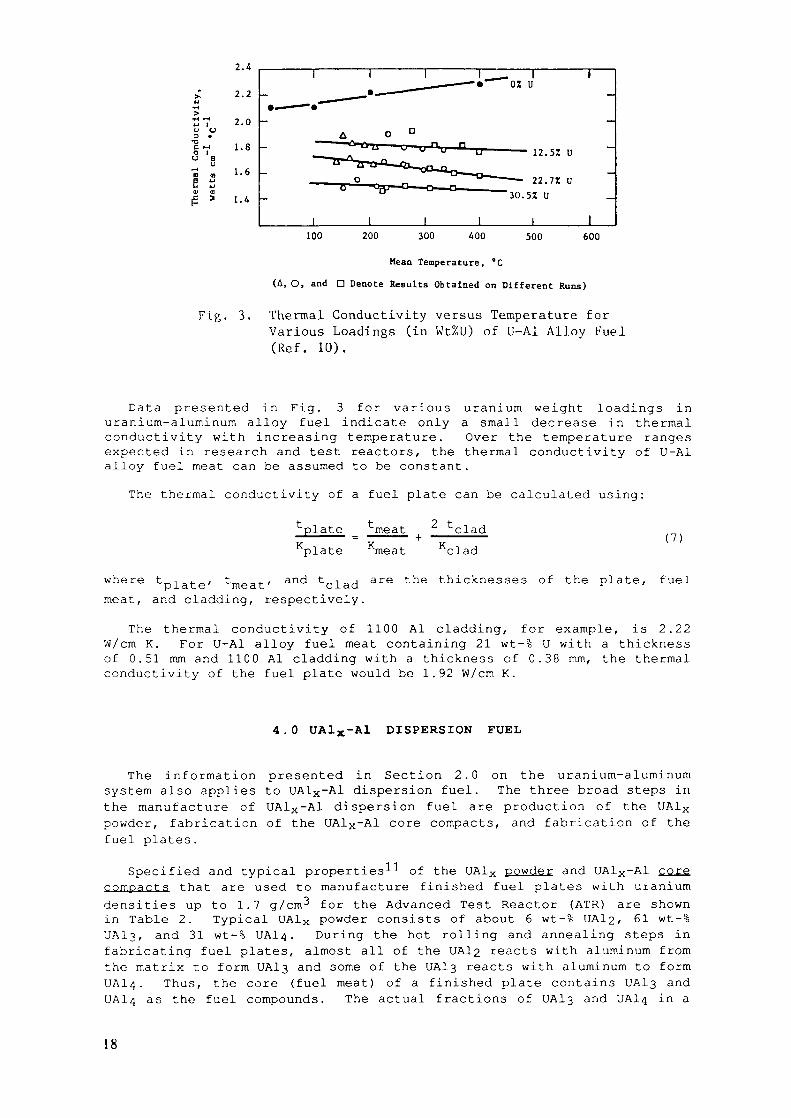
Fig. 3.
12.5Z U
22.7Z U30.5Z U
100 200 300 400 500 600
Mean Temperature, "C
(A, O, and D Denote Results Obtained on Different Runs)
Thermal Conductivity versus Temperature forVarious Loadings (in Wt%U) of U-A1 Alloy Fuel(Ref. 10).
Data presented in Fig. 3 for various uranium weight loadings inuranium-aluminum alloy fuel indicate only a small decrease in thermalconductivity with increasing temperature. Over the temperature rangesexpected in research and test reactors, the thermal conductivity of U-A1alloy fuel meat can be assumed to be constant.
The thermal conductivity of a fuel plate can be calculated using:
'plate "meat 2 tclad'clad
(7)
where tpiate' '"meat' anc* tclad are tne thicknesses of the plate, fuelmeat, and cladding, respectively.
The thermal conductivity of 1100 Al cladding, for example, is 2.22W/cm K. For U-Al alloy fuel meat containing 21 wt-% U with a thicknessof 0.51 mm and 1100 Al cladding with a thickness of 0.38 mm, the thermalconductivity of the fuel plate would be 1.92 W/cm K.
4.0 UA1X-A1 DISPERSION FUEL
The information presented in Section 2.0 on the uranium-aluminumsystem also applies to UAlx-Al dispersion fuel. The three broad steps inthe manufacture of UA1X-A1 dispersion fuel are production of the UA1Xpowder, fabrication of the UA1X-A1 core compacts, and fabrication of thefuel plates.
Specified and typical properties-'--'- of the UA1X powder and UA1X-A1 corecompacts that are used to manufacture finished fuel plates with uraniumdensities up to 1.7 g/cm^ for the Advanced Test Reactor (ATR) are shownin Table 2. Typical UA1X powder consists of about 6 wt-% UA12, 61 wt-%UA13, and 31 wt-% UA14. During the hot rolling and annealing steps infabricating fuel plates, almost all of the UA12 reacts with aluminum fromthe matrix to form UA13 and some of the UAlß reacts with aluminum to formUA14. Thus, the core (fuel meat) of a finished plate contains UA13 andUA14 as the fuel compounds. The actual fractions of UA13 and UA14 in a
18
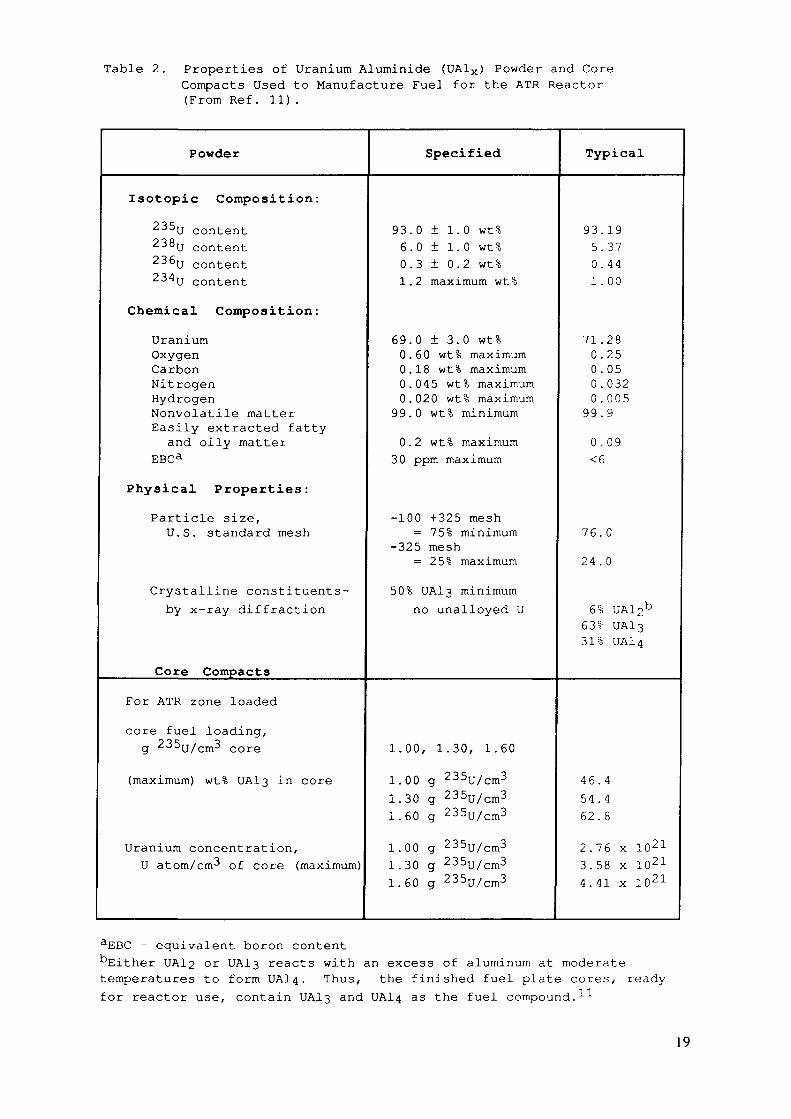
Table 2. Properties of Uranium Aluminide (UAlx) Powder and CoreCompacts Used to Manufacture Fuel for the ATR Reactor(From Ref. 11).
Powder
Isotopic Composition:235U content238U content236U content234U content
Chemical Composition:
UraniumOxygenCarbonNitrogenHydrogenNonvolatile matterEasily extracted fatty
and oily matterEBCa
Physical Properties:
Particle size,U.S. standard mesh
Crystalline constituents-by x-ray diffraction
Core Compacts
For ATR zone loaded
core fuel loading,g 23^U/cm3 core
(maximum) wt% UA13 in core
Uranium concentration,U atom/cm3 of core (maximum)
Specified
93.0 + 1.0 wt%6.0 ± 1.0 wt%0.3 ± 0.2 wt%1.2 maximum wt%
69.0 ± 3.0 wt%0.60 wt% maximum0.18 wt% maximum0.045 wt% maximum0.020 wt% maximum
99.0 wt% minimum
0.2 wt% maximum30 ppm maximum
-100 +325 mesh= 75% minimum
-325 mesh= 25% maximum
50% UAl3 minimumno unalloyed U
1.00, 1.30, 1.60
1.00 g 235U/cm31.30 g 235U/cm31.60 g 235U/cm3
1.00 g 235U/cm31.30 g 235U/cm31.60 g 235U/cm3
Typical
93.195.370.441.00
71.280.250.050.0320.005
99.9
0.09<6
76.024.0
6% UAl2b63% UA1331% UA14
46.454.462.8
2.76 x 10213.58 x 10214.41 x 1021
aEBC = equivalent boron content"Either UA12 or UA13 reacts with an excess of aluminum at moderatetemperatures to form UAl4. Thus, the finished fuel plate cores, readyfor reactor use, contain UAlß and UA14 as the fuel compound. 1
19
finished plate will vary from manufacturer to manufacturer depending onthe processes and heat treatments that are utilized in fabricating thepowder, core compacts, and fuel plates.
In the following discussions, it is assumed that the UA1X in the fuelmeat of finished fuel plates consists of 60 wt-% UAl3 and 40 wt-% UA14.
4.1 Uranium Density Relations for Aluminide Fuel
For UA1X in the meat of finished fuel plates that consists of 60 wt-%UA13 and 40 wt-% UA14, the density of the UA1X is:
PUAIX = WUA13 PUAI3 + WUA14 PUAI4= 0.6 (6.8) +0.4 (5.7) =6.4 g/cm3
using the measured densities of UA13 and UA14 from Table I.Additionally, the weighted value of x in UA1X (taking 4.9 aluminum atomsper uranium atom in UA14) is about 3.8 and the uranium weight fraction(WUD) in the UAlx is about 0.70.
Substituting these values into Eq. (2), a value of "a" = 0.306 isobtained. The relationships between the uranium density and the weightfraction of uranium in the fuel meat, and between the uranium density andthe volume fraction of the dispersed phase are then:
(1 - P) Wu ____0.370 pu____Pu = 0.370 - 0.306 Wu Wu =
{1 _ P) + 0.306 py
PU = 4.5 VfUA1*
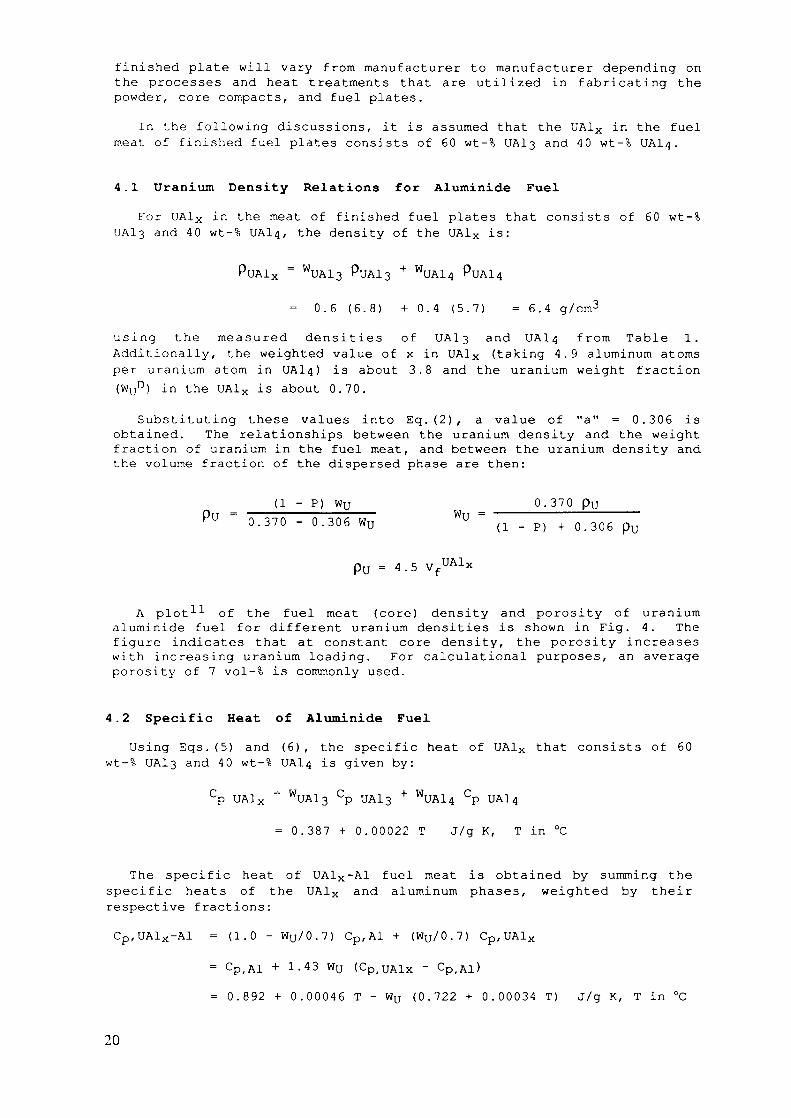
A plot-'--'- of the fuel meat (core) density and porosity of uraniumaluminide fuel for different uranium densities is shown in Fig. 4. Thefigure indicates that at constant core density, the porosity increaseswith increasing uranium loading. For calculational purposes, an averageporosity of 7 vol-% is commonly used.
4.2 Specific Heat of Aluminide FuelUsing Eqs. (5) and (6), the specific heat of UA1X that consists of 60
wt-% UA13 and 40 wt-% UA14 is given by:
Cp UA1X = WUAl3 Cp UA13 + WUAl4 Cp UAl4
= 0.387 + 0.00022 T J/g K, T in °C
The specific heat of UA1X-A1 fuel meat is obtained by summing thespecific heats of the UA1X and aluminum phases, weighted by theirrespective fractions:
Cp,UAlx-Al = (1.0 - Wu/0.7) Cp,Al + (Wu/0.7) Cp,UAlx
= Cp^Al + 1-43 Wu (Cp(UAlx ~ CprAl)
= 0 .892 + 0 . 0 0 0 4 6 T - Wy ( 0 . 7 2 2 + 0 . 0 0 0 3 4 T) J/g K, T in °C
20

4.00
3.95
3.90
3.85
3.80
*!" 3.75.y2? 3.70
-g 3.65<a
O 3.60
1.64 - 1.72 g U/cm 3
1.29 - 1.37 g U/cm 3
1.02 - 1.07 g U/cm 3
7 8Core porosity (vol %)
10 11 12INEL-A-11 B37
Fig. 4. Core Density and Porosity of Uranium Aluminide Fuel Plateswith Different Fuel Loadings (Ref. 11).
4.3 Thermal Conductivity of Aluminide Fuel
Available data on the thermal conductivity of aluminide fuels (thatare typical of those in reactor use) are limited to three data points(Ref. 6) calculated for ATR sample fuel plates using thermal diffusivitymeasurements (Ref. 10) at Battelle Northwest Laboratories on MTR-ETR typefuel plates. The data from Table II of Ref. 6 are reproduced in Table 3below.
Table 3. Thermal Conductivity of ATR Sample Fuel Plates Calculated (Ref.6)from Thermal Diffusivity Measurements (Battelle Northwest,Ref.10).
Plate Fuel
ThermalDiffusivity,
cm^/s25°C 600°C
Fuel PlateDensity, g/cm^
25°C 600°C
HeatCapacity,
J/g °C25°C 600°C
ThermalConductivity,
W/cm K25°C 600°C
P-l-1047 UA1X 0.32 0.25 2.953 2.830 0.766 0.996 0.724 0.703
P-l-1048 UA1X 0.38 0.33 2.980 2.855 0.758 0.984 0.858 0.925
P-5-576 UA1X 0.33 0.24 3.00 2.872 0.737 0.963 0.728 0.661
21
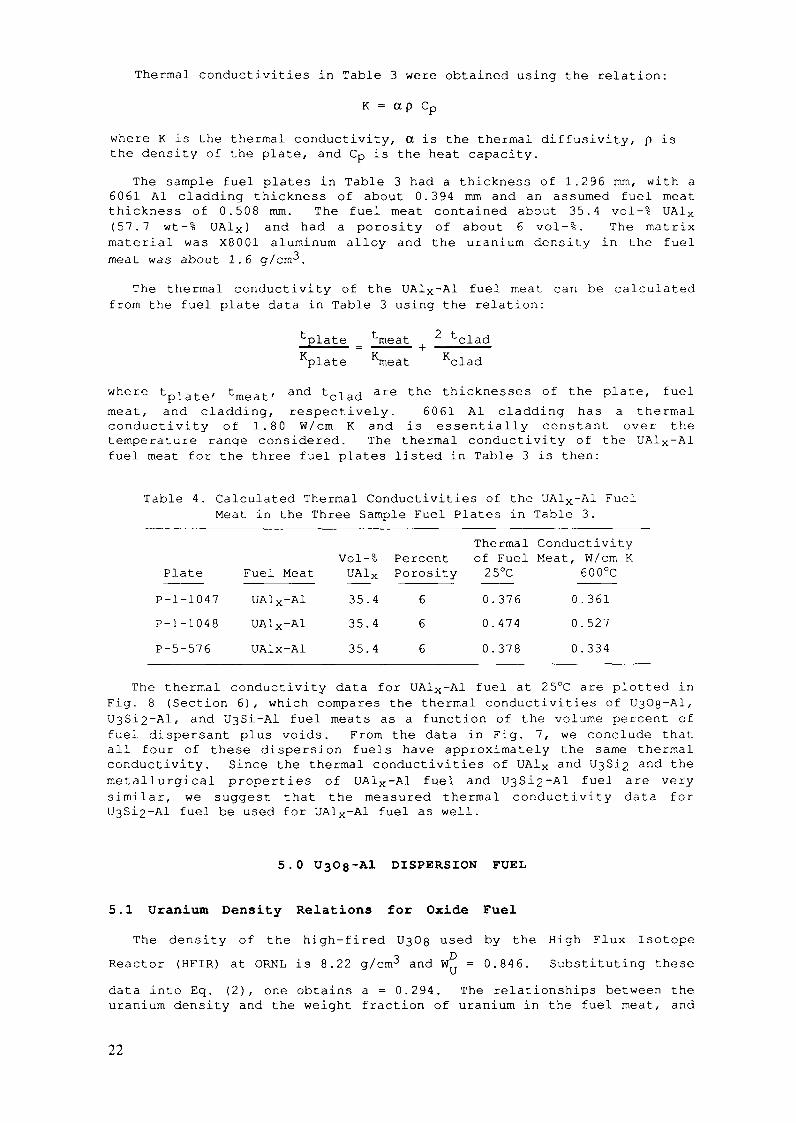
Thermal conductivities in Table 3 were obtained using the relation:
K = a p Cpwhere K is the thermal conductivity, a is the thermal diffusivity, p isthe density of the plate, and Cp is the heat capacity.
The sample fuel plates in Table 3 had a thickness of 1.296 mm, with a6061 Al cladding thickness of about 0.394 mm and an assumed fuel meatthickness of 0.508 mm. The fuel meat contained about 35.4 vol-% UA1X(57.7 wt-% UA1X) and had a porosity of about 6 vol-%. The matrixmaterial was X8001 aluminum alloy and the uranium density in the fuelmeat was about 1.6 g/cm3.
The thermal conductivity of the UA1X-A1 fuel meat can be calculatedfrom the fuel plate data in Table 3 using the relation:
'plate "meat 2 tcladKplate Kmeat Kclad
where t iate, tmea^, and tc^a(^ are the thicknesses of the plate, fuelmeat, and cladding, respectively. 6061 Al cladding has a thermalconductivity of 1.80 W/cm K and is essentially constant over thetemperature range considered. The thermal conductivity of the UA1X-A1fuel meat for the three fuel plates listed in Table 3 is then:
Table 4. Calculated Thermal Conductivities of the UA1X-A1 FuelMeat in the Three Sample Fuel Plates in Table 3.
Vol-% PercentThermal Conductivityof Fuel Meat, W/cm K
Ppp
Plate-1-1047-1-1048-5-576
FuelUA1UA1
Meatx-Alx-Al
UAlx-Al
UA1
35.35.35.
X
444
Porosity666
25°C0.0.0.
,376.474,378
000
600°.361.527.334
C
The thermal conductivity data for UA1X-A1 fuel at 25°C are plotted inFig. 8 (Section 6), which compares the thermal conductivities of UsOg-Al,U3Si2-Al, and UßSi-Al fuel meats as a function of the volume percent offuel dispersant plus voids. From the data in Fig. 7, we conclude thatall four of these dispersion fuels have approximately the same thermalconductivity. Since the thermal conductivities of UA1X and 03812 and themetallurgical properties of UA1X-A1 fuel and U3Si2~Al fuel are verysimilar, we suggest that the measured thermal conductivity data for
l fuel be used for UA1X-A1 fuel as well.
5.0 DISPERSION FUEL
5.1 Uranium Density Relations for Oxide Fuel
The density of the high-fired 0303 used by the High Flux IsotopeReactor (HFIR) at ORNL is 8.22 g/cm3 and W = 0.846. Substituting thesedata into Eq. (2), one obtains a = 0.294. The relationships between theuranium density and the weight fraction of uranium in the fuel meat, and

^£.
H
1O
VOIDCONTENT 9
(vol. %)
8
7
G.
\ 1
• -0.64mm MEAT~ 0-0.89mm MEAT
^-TOLERANCELIMITS
~ CONFIDENCE: 95%POPULATION :90%
T
t
I
- j
! 1
1
T
1 --
-
-
i60 65 70 75 80CONCENTRATION OF U308 (wt. %)
Fig. 5, Void Content of U O -AI Fuel Meatversus Concentration of U~0„ andFuel Meat Thickness.
between the uranium density and the volume fraction of the dispersedphase are then:
Pu =(1 - P)
0.370 - 0.2940.370 Pu
(1 - P) + 0.294 pu
Pu = 7.0 VfU3°8
The void content of U30g-Al fuel meat depends on the concentration of0303 and to a lesser extent on the fuel meat thickness. The void contentas a function of UßOs concentration for plates with two fuel meatthicknesses fabricated by ORNL-'-^ are shown in Fig. 5. Appropriate valuesof P for use in the uranium density relations should be obtained fromthis figure or from similar data supplied by the fuel manufacturer.
5.2 Specific Heat of Oxide Fuel
Specific heat data-^ for UßOg in the temperature range from 0-300°C isrepresented approximately by the linear relationship:
= 0.27 + 0.00030 T J/g K, T in °C
If Wu is the uranium weight fraction and Cp,Al is the specific heat ofaluminum [Eq. (4)], the specific heat of the U3Û8-A1 fuel meat is givenby:
Cp, = (1 - Wu/0.848) Cp,Ai + (Wu/0.848) C
= 0.892 + 0.00046 T - Wu (0.734 + 0.00019 T) J/g K, T in °C
23

ô 60Êg 50
t 40
§ 30Q
I 20
10o:LUX
TEMPERATURE = 60°CA = 0.76-mmCOREo = 0.51-mm CORE
()=wt%UjO»IN FUEL
H 0.3 0.4 0.5 0.6 0.7VOLUME FRACTION (U3OS + VOIDS)
Fig. 6. Thermal conductivity of U308-A1 core region dependssignificantly on the volume fraction of U308 + voids.
5.3 Thermal Conductivity of Oxide Fuel
Figure 6 shows a curve of measured-'-'' thermal conductivity versusuranium loading for l^Oß-Al dispersion material. For the lightly loadeddispersions, the decrease in conductivity with increasing volume fractionof U3Û8 is linear, primarily due to the substitution of the lowconductivity oxide (k ~ 0.3-0.5 W/m K)15 for aluminum. As more U30g isadded, however, the thermal conductivity drops more dramatically. In therange of uranium loadings between 2.5 and 3.1 g/cm^, the thermalconductivity ranges from 30 to 12 W/m K.
6.0 U3Si2~Al AND U3Si-Al DISPERSION FUELS
The development and testing of uranium suicide fuels has been aninternational effort, involving national reduced enrichment programs,several commercial fuel fabricators, and several test reactor operators.Numerous results of this effort have been published previously. Some ofthe results are summarized in this section.
As with the uranium-aluminum system, the uranium-silicon systemnormally consists of a mixture of intermetallic compounds, or phases.The quantity of each phase present depends upon the composition andhomogeneity of the alloy and on its heat treatment. Since the differentphases behave differently under irradiation, knowledge of the phases tobe expected in the fuel is necessary to correctly interpret test resultsand to prepare specifications. For this reason, a detailed discussion ofthe phases in the uranium-silicon system is presented in Appendix 1-1.2(Ref. 16). Further properties of uranium suicide fuels can be found inRefs. 17-19.
6.1 Uranium Density Relations for Suicide Fuels
The densities of the U3Si2 and U3Si dispersants that were measured atANL, the corresponding weight fractions of uranium in each dispersant,and the value of the paramater "a" in Eq.(2) are given below.
24

SuicideDispersant
U3SÎ2
UsSi
wt-% Si
7 .5
4 . 0
MeasuredDensity g/cm3
12. 2a
15. 2b
Wu
0 . 9 2 5
0 . 9 6 0
a
0.312
0.317
aAs-arc-cast.bAfter heat treatment of 72 h at 800°C.
The relationships between the uranium density and the weight fractionof uranium in the fuel meat, and between the uranium density and thevolume fraction of the dispersed phase are then:
Pu =(1 - P) 0.370 pu
0.370 - a Wu (1 - P) + a pu
with appropriate values of the parameter "a" for each dispersant.
= 11.3 Vfu3si2 = 14.6 VfU3Si
Porosity remaining after fabrication of dispersion fuel meat providesspace to accomodate the initial swelling of the fuel particles underirradiation. Data obtained at ANL from measurements^ onminiplates are plotted in Fig. 7. These data are well fit-'-' by the cubicfunction:
2 3Vp = 0.072 VF - 0.275 Vp + 1.32 Vp
where Vp and VF are the volume fractions of porosity and fuel dispersantin the meat, respectively. The amount of as-fabricated porosityincreases significantly as the volume loading of fuel dispersantincreases because it becomes more difficult for the matrix aluminummatrix to flow completely around all fuel particles, especially those incontact with one another^O.
10 15 20 25 30 55VOLUME FRACTION, 7,
40 45 50
Fig. 7. Percent Porosity as a Function of the Volume Percent of U.Si inU3Si2-Al Fuel Meat.
25
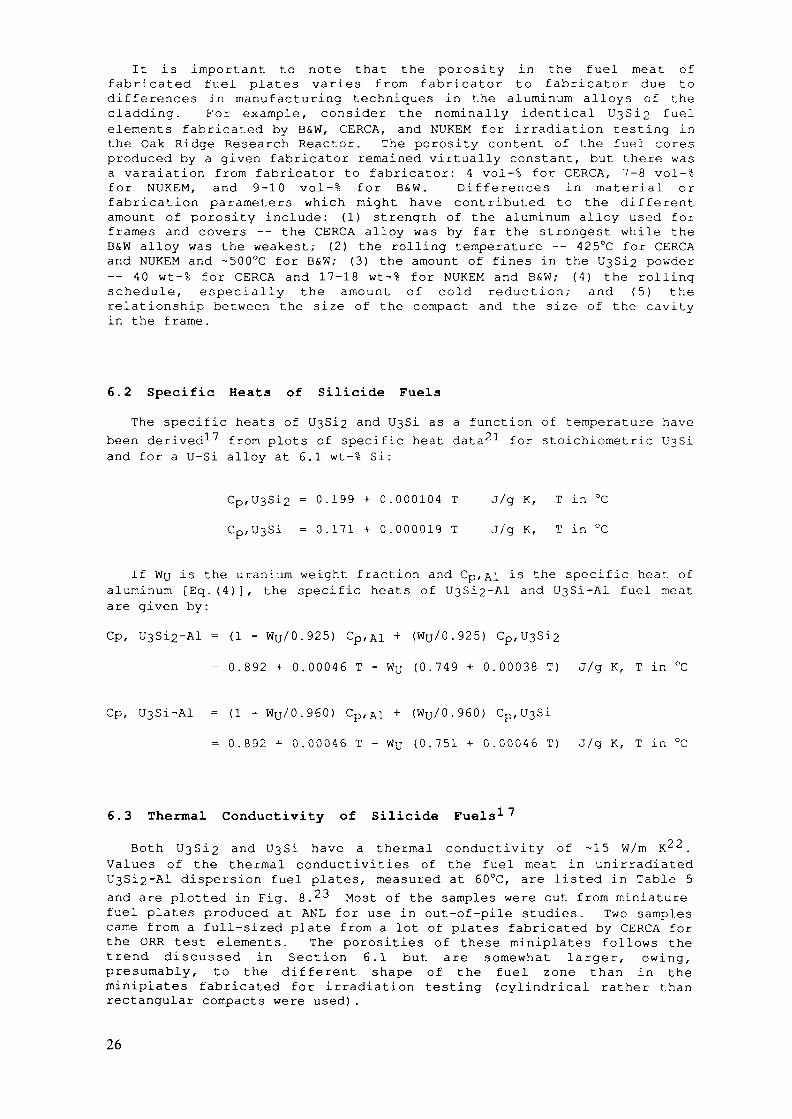
It is important to note that the porosity in the fuel meat offabricated fuel plates varies from fabricator to fabricator due todifferences in manufacturing techniques in the aluminum alloys of thecladding. For example, consider the nominally identical U3Si2 fuelelements fabricated by B&W, CERCA, and NUKEM for irradiation testing inthe Oak Ridge Research Reactor. The porosity content of the fuel coresproduced by a given fabricator remained virtually constant, but there wasa varaiation from fabricator to fabricator: 4 vol-% for CERCA, 7-8 vol-%for NUKEM, and 9-10 vol-% for B&W. Differences in material orfabrication parameters which might have contributed to the differentamount of porosity include: (1) strength of the aluminum alloy used forframes and covers -- the CERCA alloy was by far the strongest while theB&W alloy was the weakest; (2) the rolling temperature — 425°C for CERCAand NUKEM and ~500°C for B&W; (3) the amount of fines in the UsSi2 powder— 40 wt-% for CERCA and 17-18 wt-% for NUKEM and B&W; (4) the rollingschedule, especially the amount of cold reduction; and (5) therelationship between the size of the compact and the size of the cavityin the frame.
6.2 Specific Heats of Suicide Fuels
The specific heats of U3Si2 and U3Si as a function of temperature havebeen derived-^ from plots of specific heat data^l for stoichiometric 038!and for a U-Si alloy at 6.1 wt-% Si:
Cp,U3Si2 = 0.199 + 0.000104 T J/g K, T in °C
Cp,U3Si = 0.171 + 0.000019 T J/g K, T in °C
If Wu is the uranium weight fraction and Cp,A]_ is the specific heat ofaluminum [Eq. (4)], the specific heats of U3Si2~Al and U3Si-Al fuel meatare given by:
Cp, U3Si2-Al = (1 - Wu/0.925) Cp,Al + (Wu/0.925) Cp,UsSi2
= 0.892 + 0.00046 T - Wu (0.749 + 0.00038 T) J/g K, T in °C
Cp, U3Si-Al = (1 - Wu/0.960) Cp,Ai + (Wy/0.960) Cp,U3Si
= 0.892 + 0.00046 T - Wu (0.751 + 0.00046 T) J/g K, T in °C
6.3 Thermal Conductivity of Suicide
Both U3Si2 and U3Si have a thermal conductivity of -15 W/m K22.Values of the thermal conductivities of the fuel meat in unirradiatedU3Si2~Al dispersion fuel plates, measured at 60°C, are listed in Table 5and are plotted in Fig. 8.^3 Most of the samples were cut from miniaturefuel plates produced at ANL for use in out-of-pile studies. Two samplescame from a full-sized plate from a lot of plates fabricated by CERCA forthe ORR test elements. The porosities of these miniplates follows thetrend discussed in Section 6.1 but are somewhat larger, owing,presumably, to the different shape of the fuel zone than in theminiplates fabricated for irradiation testing (cylindrical rather thanrectangular compacts were used).
26
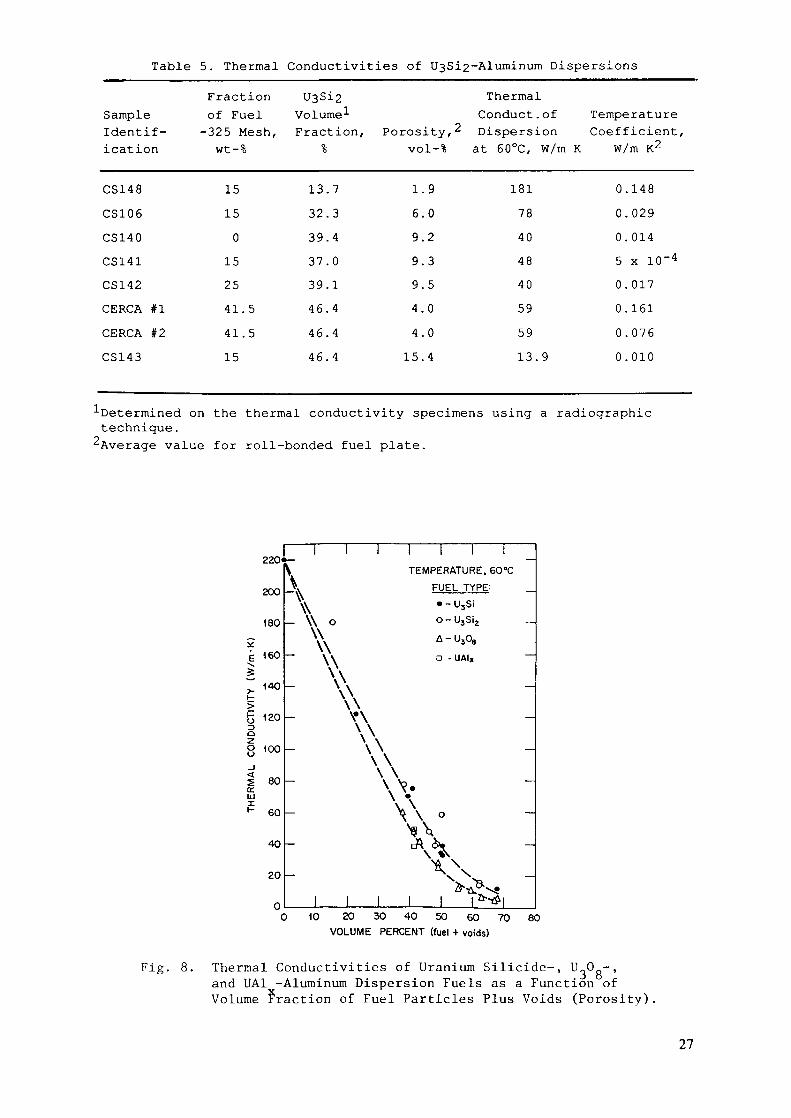
Table 5. Thermal Conductivities of UsSi2-Aluminum Dispersions
SampleIdentif-ication
CS148CS106CS140CS141CS142CERCA #1CERCA #2CS143
Fractionof Fuel
-325 Mesh,wt-%
15150
152541.541.515
U3Si2Volume-'-Fraction, Porosity, 2
% vol-%
13.32.39.37.39.46.46.46.
73401444
169994415
.9
.0
.2
.3
.5
.0
.0
.4
ThermalConduct . ofDispersionat 60°C, W/m K
18178404840595913.9
TemperatureCoefficient,
W/m K2
00050000
.148
.029
.014x 10~4
.017
.161
.076
.010
•'•Determined on the thermal conductivity specimens using a radiographietechnique.
2Average value for roll-bonded fuel plate.
i l 1 1 1 !220« — -
200
180
È 160
~ 140H
5 120Q
8 10°_iI 80a:LJ
K 60
40
20
0
\ TEMPERATURE. 60°C
A FUEL TYPE: _
\\ — U,Si- \\ 0 0-U5Si2
\\ A-U308- , ., -\'\
- \\\ \\ \ *\ 0
\\°
•\^
Xx\^ B -
I I I t^l10 20 30 40 50 60 70
VOLUME PERCENT (fuel + voids)80
Fig. 8. Thermal Conductivities of Uranium Suicide-, U_0 -,and UA1 -Aluminum Dispersion Fuels as a Function ofVolume Fraction of Fuel Particles Plus Voids (Porosity)
27
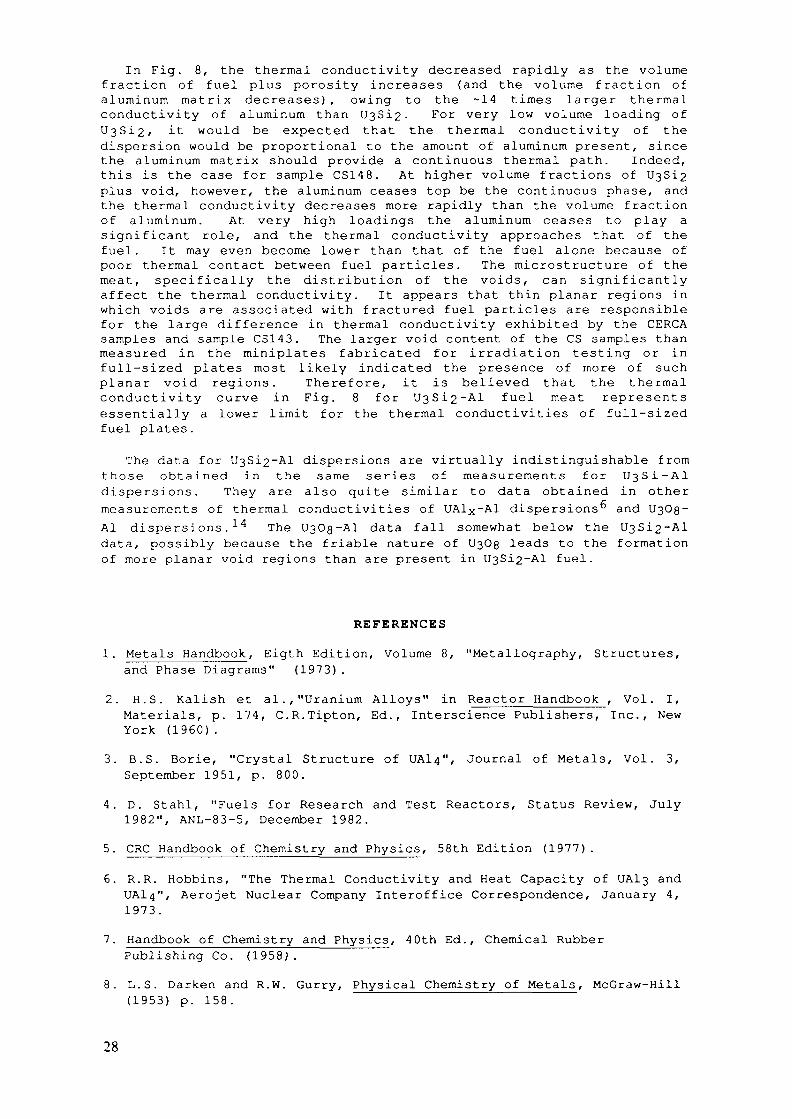
In Fig. 8, the thermal conductivity decreased rapidly as the volumefraction of fuel plus porosity increases (and the volume fraction ofaluminum matrix decreases), owing to the -14 times larger thermalconductivity of aluminum than U3Si2- For very low volume loading ofU3Si2» it would be expected that the thermal conductivity of thedispersion would be proportional to the amount of aluminum present, sincethe aluminum matrix should provide a continuous thermal path. Indeed,this is the case for sample CS148. At higher volume fractions of U3Si2plus void, however, the aluminum ceases top be the continuous phase, andthe thermal conductivity decreases more rapidly than the volume fractionof aluminum. At very high loadings the aluminum ceases to play asignificant role, and the thermal conductivity approaches that of thefuel. It may even become lower than that of the fuel alone because ofpoor thermal contact between fuel particles. The microstructure of themeat, specifically the distribution of the voids, can significantlyaffect the thermal conductivity. It appears that thin planar regions inwhich voids are associated with fractured fuel particles are responsiblefor the large difference in thermal conductivity exhibited by the CERCAsamples and sample CS143. The larger void content of the CS samples thanmeasured in the miniplates fabricated for irradiation testing or infull-sized plates most likely indicated the presence of more of suchplanar void regions. Therefore, it is believed that the thermalconductivity curve in Fig. 8 for U3Si2~Al fuel meat representsessentially a lower limit for the thermal conductivities of full-sizedfuel plates.
The data for U3Si2~Al dispersions are virtually indistinguishable fromthose obtained in the same series of measurements for U3S1-A1dispersions. They are also quite similar to data obtained in othermeasurements of thermal conductivities of UA1X-A1 dispersions" and 0303-Al dispersions.-*-^ The U3O8-A1 data fall somewhat below the U3Si2~Aldata, possibly because the friable nature of U3Og leads to the formationof more planar void regions than are present in U3Si2~Al fuel.
REFERENCES
1. Metals Handbook, Eigth Edition, Volume 8, "Metallography, Structures,and Phase Diagrams" (1973).
2. H.S. Kalish et al.,"Uranium Alloys" in Reactor Handbook , Vol. I,Materials, p. 174, C.R.Tipton, Ed., Interscience Publishers, Inc., NewYork (1960) .
3. B.S. Borie, "Crystal Structure of UAl,}", Journal of Metals, Vol. 3,September 1951, p. 800.
4. D. Stahl, "Fuels for Research and Test Reactors, Status Review, July1982", ANL-83-5, December 1982.
5. CRC Handbook of Chemistry and Physics, 58th Edition (1977).
6. R.R. Hobbins, "The Thermal Conductivity and Heat Capacity of UA13 andUA14", Aerojet Nuclear Company Interoffice Correspondence, January 4,1973.
7. Handbook of Chemistry and Physics, 40th Ed., Chemical RubberPublishing Co.(1958).
8. L.S. Darken and R.W. Gurry, Physical Chemistry of Metals, McGraw-Hill(1953) p. 158.
28
9. P. Chiotti and J.A. Kateley, "Thermodynamic Properties of Uranium-Aluminum Alloys", J. Nucl. Mat. 32, 135 (1969).
10. J.L. Bates, "Thermal Diffusivity of MTR-ETR Type Fuel Plates,Battelle Pacific Northwest Laboratories Report BNWL-CC-456 (Jan. 10,1966) .
11. J.M. Beeston, R.R. Hobbins, G.W. Gibson, and W.C. Francis,"Development and Irradiation Performance of Uranium Aluminide Fuels inTest Reactors", Nuclear Technology 49, 136 (1980) .
12. G.L. Copeland and M.M. Martin, "Fabrication of High-Uranium-LoadedU3O8-A1 Developmental Fuel Plates," Proc. International Meeting onDevelopment, Fabrication, and Application of Reduced-Enrichment Fuelsfor Research and Test Reactors, Argonne National Laboratory, Argonne,Illinois, November 12-14, 1980.
13. Y.S. Youloukian and E.H. Buyco, Thermophysical Properties of Matter,Vol. V, "Specific Heat - Nonmetallic Substances" (1970).
14. G.L. Copeland and M.M. Martin, "Development of High-Uranium-Loadedl Fuel Plates," Nucl. Tech. 56, 547 (1982).
15. Y.S. Youloukian and E.H. Buyco, Thermophysical Properties of Matter,Vol. I, "Thermal Conductivity" (1970) .
16. R.F. Domagala, "Phases in U-Si Alloys", Proc. 1986 Int. Mtg. onReduced Enrichment for Research and Test Reactors, Gatlinburg,Tennessee, November 3-6, 1986, Argonne National Laboratory ReportANL/RERTR/TM-9, CONF-861185 (May 1988) p. 45.
17. J.L. Snelgrove, R.F. Domagala, G.L. Hofman, T.C. Weincek, G.L.Copeland, R.W. Hobbs, and R.L. Senn "The Use of U3SÏ2 Dispersed inAluminum in Plate-Type Fuel Elements for Research and Test Reactors",ANL/RERTR/TM-11, October 1987.
18. R.F. Domagala, T.C. Weincek, and H.R. Thresh, "Some Properties of U-Si Alloys in the Composition Range from UßSi to U3Si2", Proc. 1984Int. Mtg. on Reduced Enrichment for Research and Test Reactors,Argonne, Illinois, October 15-18, 1984, Argonne National LaboratoryReport ANL/RERTR/TM-6, CONF-8410173 (July 1985) p. 47.
19. T.C. Weincek, R.F. Domagala, and H.R. Thresh, " Thermal compatibilityStudies of Unirradiated Uranium Suicide Dispersed in Aluminum", Proc.1984 Int. Mtg. on Reduced Enrichment for Research and Test Reactors,Argonne, Illinois, October 15-18, 1984, Argonne National LaboratoryReport ANL/RERTR/TM-6, CONF-8410173 (July 1985) p. 61.
20. T.C. Weincek, "A Study of the Effect of Fabrication Variables on theQuality of Fuel Plates," Proc. 1986 Int. Mtg. on Reduced Enrichmentfor Research and Test Reactors, Gatlinburg, Tennessee, November 3-6,1986, Argonne National Laboratory Report ANL/RERTR/TM-9, CONF-861185(May 1988) p. 54.
21. H. Shimizu, "The Properties and Irradiation Behavior of U3Si2"/Atomics International Report NAA-SR-10621 , p. 14 (July 25, 1965).
22. A.G. Samoilov, A.I. Kashtanov, and V.S. Volkov, Dispersion-FuelNuclear Reactor Elements, (1965), translated from the Russian by A.Aladjem, Israel Program for Scientific Translations Ltd. . Jerusalem,pp. 54-57 (1968) .
23. R.K. Williams, R.S. Graves, R.F. Domagala, and T.C. Weincek, "ThermalConductivities of U3Si and U3Si2-Al Dispersion Fuels", Proc. 19th Int.Conf. on Thermal Conductivity, Cookville, Tennessee, October 21-23,1985, in press.
29

Appendix 1-1.2
PHASES IN U-Si ALLOYS*
R.F. DOMAGALARERTR Program,Argonne National Laboratory,Argonne, Illinois,United States of America
Abstract
The binary (two-component) U-Si system contains atotal of seven "compounds." The most U-rich compounds areof interest to the RERTR community because they are nowbeing employed as fuels in research and test reactors.The nomenclature used in describing these fuels and themetallurgical significance of the notations recorded mayhave different meanings to people from different technicalbackgrounds. This paper is a succinct exploration of theprinciples of phase equilibria and the realities of com-mercial fabrication as applied to U-Si alloys. It is anattempt to record in referenceable and retrievable forminformation of value to the continued development, appli-cation and understanding of suicide fuels.
INTRODUCTION
Discussions of suicide fuels as applied to the RERTR Program often in-volve considerations of the relative amounts of the various phases (distin-guishable crystalline entities) present in U-Si alloys at different Si levels.This topic is being reexamined more carefully as the requirements for certainreactors exceed the U levels possible with "pure" U Si . In many ways thisreport is a supplement to the paper on the properties of selected U-Si alloysas well as the work of A. E. Dwight on the U-Si and U-Si-Al systems. It isintended to serve as a brief exposition of the nature of binary systems asapplied to an understanding of the microstructural situations likely to beencountered in utilizing U-Si alloys as fuels for nuclear reactors.
Within this paper certain rules and principles of binary diagrams areemployed. More detailed discussions of these principles may be found in anytextbook on physical metallurgy. Two "classic" monographs on the subject maybe of interest to those who wish to pursue the subject in depth. '
DISCUSSION
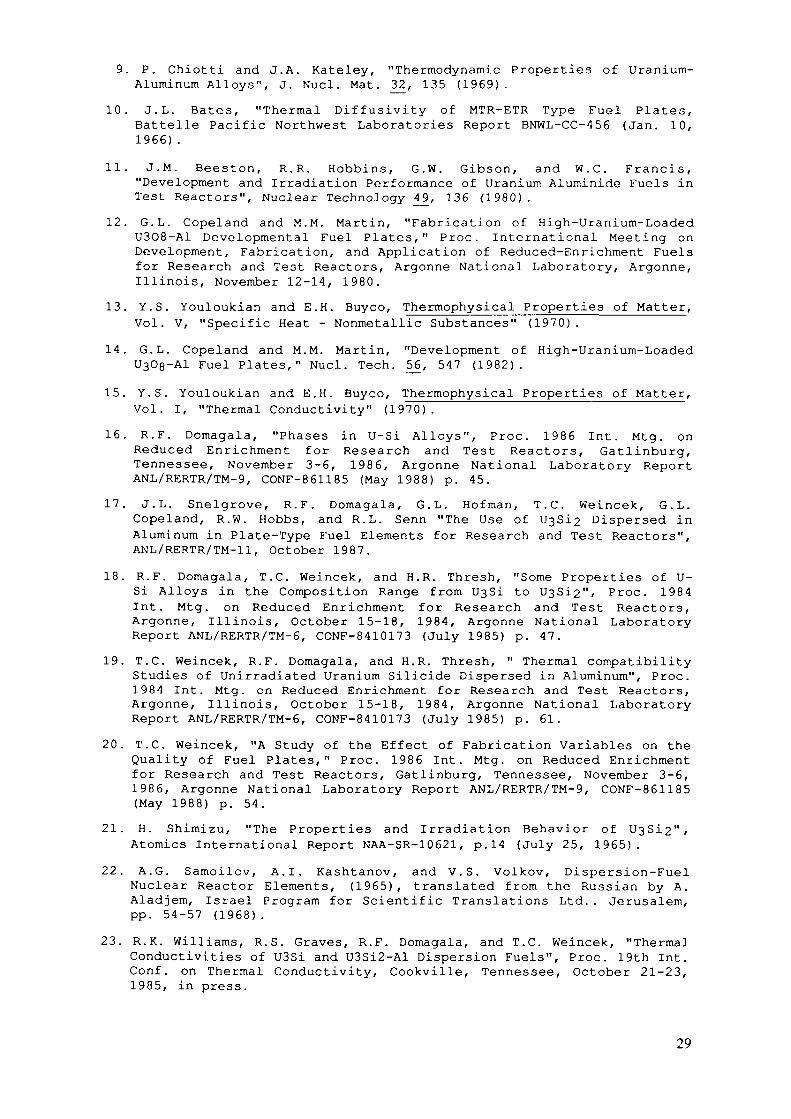
Table 1 is a list of the calculated and experimentally measured compo-sitions of U Si, U Si and USi, the three most U-rich phases in the U-Si sys-tem, which is shown in Fig. 1.
* Work supported by the US Department of Energy, Office of Spent Fuel Management and ReprocessingSystems, under contract W-31-109-Eng-38.
31

Table 1. Weight Percent Silicon and Density forU-Si, U„Si2 and USi
i Lid O 1Z
Method (a)
U3Si 3.78
U3Si2 7.29
USi 10.56
wt.% Si
Method (b)
3.79
7.31
10.58
Method (c)
3.97.310.6
Density Determinedat ANL, g-cm
15. 2d
12.2e
10. 9f
(a) Calculated for natural U (a.w. 238.03).(b) Calculated for 20% enriched U (a.w. 237.4).(c) Experimentally determined for depleted U.(d) For 4.0 wt.% Si alloy heat treated at 800°C, presumed to be at
equilibrium.(e) For 7.3 wt.% Si as-arc-caat alloy.(f) For 10.6 wt.% Si as-arc-cast alloy.
In all calculations and plots that follow, I have used the 3.9 wt.% Sifigure for the composition of U_Si and have rounded off the value for U_Si„at 7.3 wt.% Si and for USi at 10.6 wt.% Si. The densities recorded in Table 1for these phases have been used as necessary.
The density figures and the microstructural conditions they representrequire some amplification. The three compounds (the terms "phases,""intermetallic compounds," and "intermediate phases" may be used inter-changeably) of interest here are often described as "line compounds." In thelanguage of phase diagrams this means that within the experimental ability todefine composition, a single formula and composition is assigned to eachcompound. They are represented, therefore, as vertical lines in the diagram.From a practical point of view — even in terms of research activity — itmay be considered essentially impossible to produce an alloy at the exactstoichiometry of a line compound and of such atomistic homogeneity that onlythe "pure" phase is present. One always expects to see in a microstructure asmall but finite amount of the phase to the left or the right of the compoundof interest. It is even possible, with minor perturbations in the distribu-tion of the two components (U and Si in this case), that there may be regionswhere the phase to the left of the compound of interest is present and otherregions in the same piece of material where the phase to the right of thecompound is present.
The statement in the preceding paragraph regarding the possible presenceof three (or more) phases in a binary (two-component) system violates one ofthe fundamental tenets of phase equilibria — Gibbs's Phase Rule. This rulestates that in a binary system at equilibrium, there may be at most two phasescoexisting in any area of the diagram. Three phases may exist at equilibriumonly along a horizontal line in such a diagram. Such horizontal lines in abinary system are called "invariant reaction lines" or "invariant reactionisotherms." The boundary conditions for Gibbs's Phase Rule as stated aboveare as follows: the alloy is at equilibrium, the pressure is constant, andthe vapor phase is considered non-existent. "Constant pressure" for systems
32
WEIGHT PERCENT SILICON
2 5 10 20 30 40 60 80
1700
1600
1500
1400
1300
1200
—
—
—
—
—
1100 K-1 \
1000
900
1 \
P
i1
i,'
1
11
11
1-1665
,X
/'
/
985*925a
Fy^Si
800 J— 785«[7~l~Upi
700 F" 665'
600 —
500
400
a + UjSi
—
(^=
^765* _
fO
1
• ~I7^--
c^N "•$•
(n=
irt
K>
! Ioa
\ ~~BIO* \
X
V> <S)^> ^
450°
I
\\AI3iy ^^ J1J—
—
——
—
—
—
——
—
U 10 20 30 40 50 60 70 80 90 SiATOMIC PERCENT SILICON
Fig. 1. U-Si Phase Diagram.
of the U-Si type may be considered to encompass values ranging from very highvacuum to pressures of several hundred atmospheres.
Gibbs's Rule further demands that at constant pressure and equilibrium,no more than three phases can coexist in a binary alloy under any conditions.Therefore, any discussion regarding more than two phases coexisting in abinary alloy (except on an invariant reaction isotherm) describes, by defini-tion, a non-equilibrium state.
To potentially complicate the story a bit more, the presence of impuri-ties (and they are inevitably present) can lead to the existence of otherphases which may or may not be distinguishable under the microscope, dependingon their size and the magnification employed. Impurities must also be ex-pected to be in "solid solution" (i.e., within the crystalline lattice) ineach of the phases present. The presence of such impurities in solid solutionis discernible only with analytical procedures capable of accurately detectingvery small quantities of a foreign species. Often such equipment and tech-niques are not available, or simply do not exist.
The density figures recorded in Table 1 were used for all calculations.The value of 10.9 g-cm~ for USi is probably accurate to+0.1 g-cm . Valuesdetermined for U-Si» have varied from 11.9 to„12.2 g-cm ; I have arbitrarilyused the 12.2 figure. The value of 15.2 g-cm~ for U Si represents our best
33
3O 35 4O 45 5O 5.5 60 65 70 75
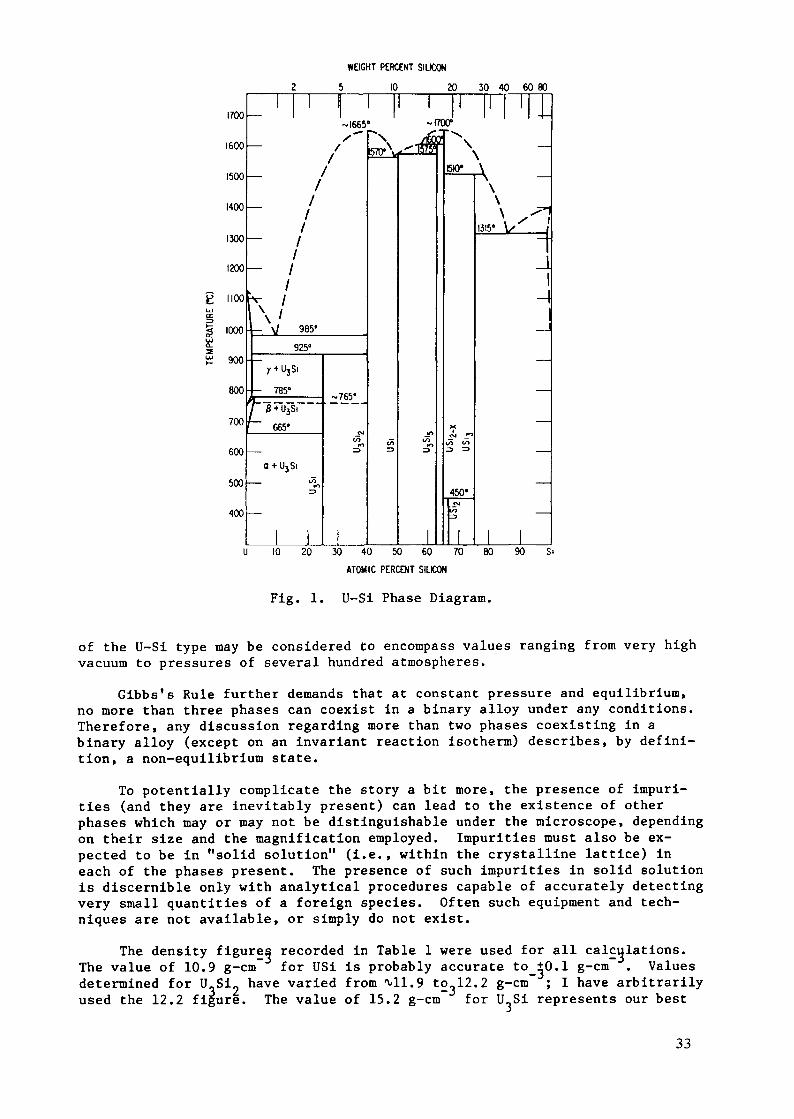
Fig. 2. Weight % (w/o) and vol.% (v/o)of U_Si vs. w/o Si. Alloys at equilibrium.Temperature < 925°C.
value for an equilibrated alloy at 4.0 wt.% Si. We know that there is afinite amount of U Si in such an alloy, but I chose not to adjust the densityfigure accordingly.
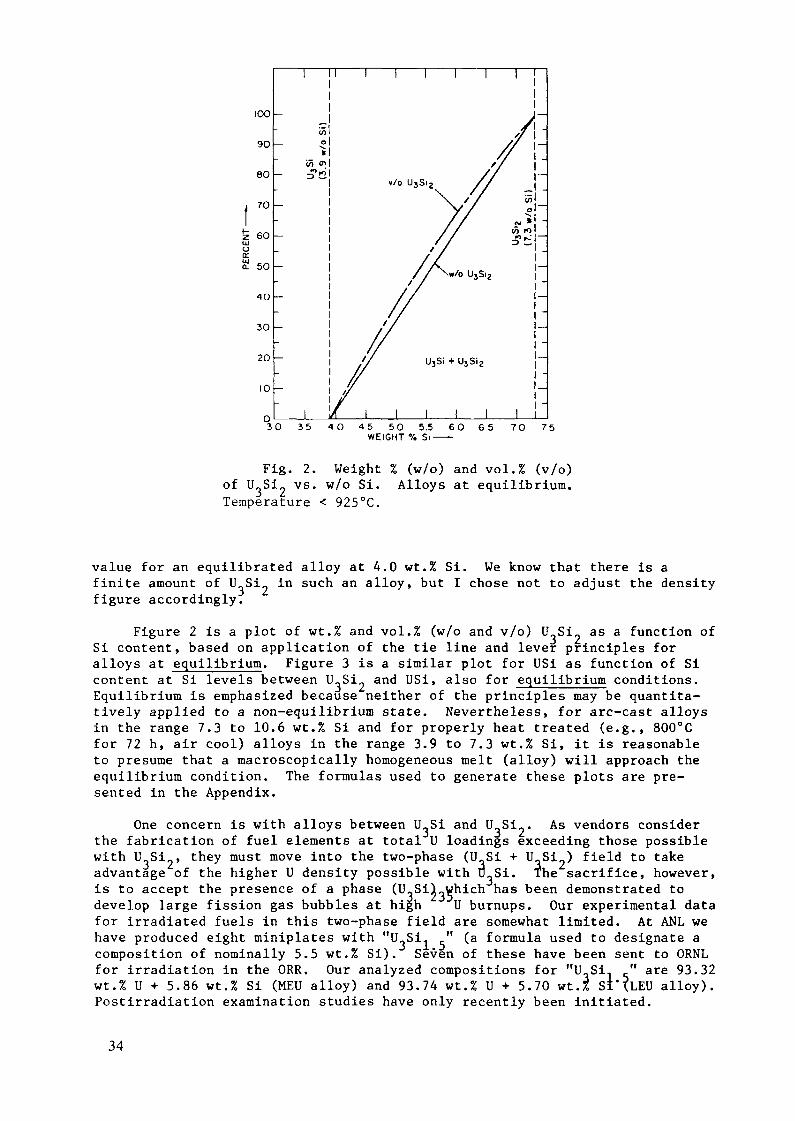
Figure 2 is a plot of wt.% and vol.% (w/o and v/o) U Si_ as a function ofSi content, based on application of the tie line and lever principles foralloys at equilibrium. Figure 3 is a similar plot for USi as function of Sicontent at Si levels between U_Si and USi, also for equilibrium conditions.Equilibrium is emphasized because neither of the principles may be quantita-tively applied to a non-equilibrium state. Nevertheless, for arc-cast alloysin the range 7.3 to 10.6 wt.% Si and for properly heat treated (e.g., 800°Cfor 72 h, air cool) alloys in the range 3.9 to 7.3 wt.% Si, it is reasonableto presume that a macroscopically homogeneous melt (alloy) will approach theequilibrium condition. The formulas used to generate these plots are pre-sented in the Appendix.
One concern is with alloys between U_Si and U Si~. As vendors considerthe fabrication of fuel elements at total U loadings exceeding those possiblewith U Si they must move into the two-phase (U Si + U Si ) field to takeadvantage of the higher U density possible with U_Si. The sacrifice, however,is to accept the presence of a phase (U,Sii_which has been demonstrated todevelop large fission gas bubbles at high U burnups. Our experimental datafor irradiated fuels in this two-phase field are somewhat limited. At ANL wehave produced eight miniplates with "U.Si.. " (a formula used to designate acomposition of nominally 5.5 wt.% Si). Seven of these have been sent to ORNLfor irradiation in the ORR. Our analyzed compositions for "U-Si.. " are 93.32wt.% U + 5.86 wt.% Si (MEU alloy) and 93.74 wt.% U + 5.70 wt.% SI'XLEU alloy).Postirradiation examination studies have only recently been initiated.
34
too
90
80
70
60
50
40
30
20
10
070 75 80 85 90 95 lOO 105
WEIGHT % Si ——
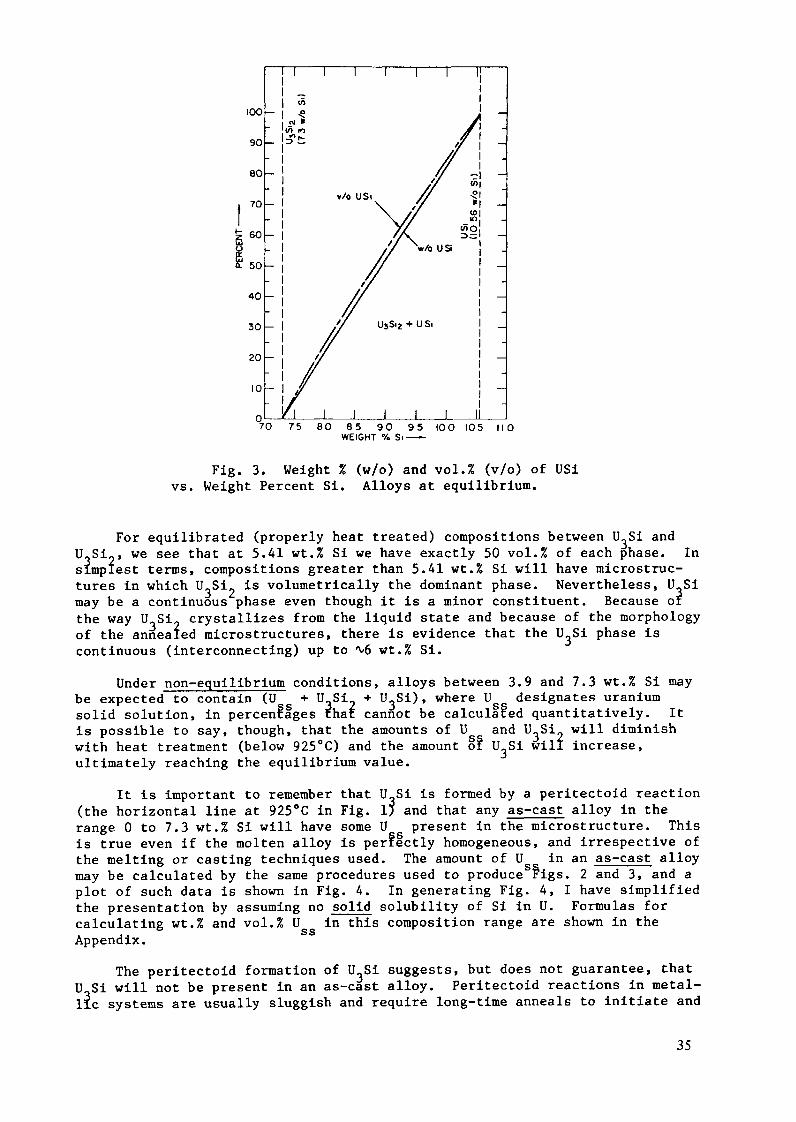
Fig. 3. Weight % (w/o) and vol.% (v/o) of USivs. Weight Percent Si. Alloys at equilibrium.
For equilibrated (properly heat treated) compositions between U„Si andU„Si„, we see that at 5.41 wt.% Si we have exactly 50 vol.% of each phase. Insimplest terms, compositions greater than 5.41 wt.% Si will have microstruc-tures in which U.,Si7 is volumetrically the dominant phase. Nevertheless, U_Simay be a continuous phase even though it is a minor constituent. Because orthe way U»Si9 crystallizes from the liquid state and because of the morphologyof the annealed microstructures, there is evidence that the U_Si phase iscontinuous (interconnecting) up to 6 wt.% Si.
Under non-equilibrium conditions, alloys between 3.9 and 7.3 wt.% Si maybe expected to contain (U + UiSi? + uosi)» where U designates uraniumsolid solution, in percenfiges that cannot be calculated quantitatively. Itis possible to say, though, that the amounts of Uwith heat treatment (below 925°C) and the amount oïultimately reaching the equilibrium value.
and UoSi- will diminishU_Si will increase,
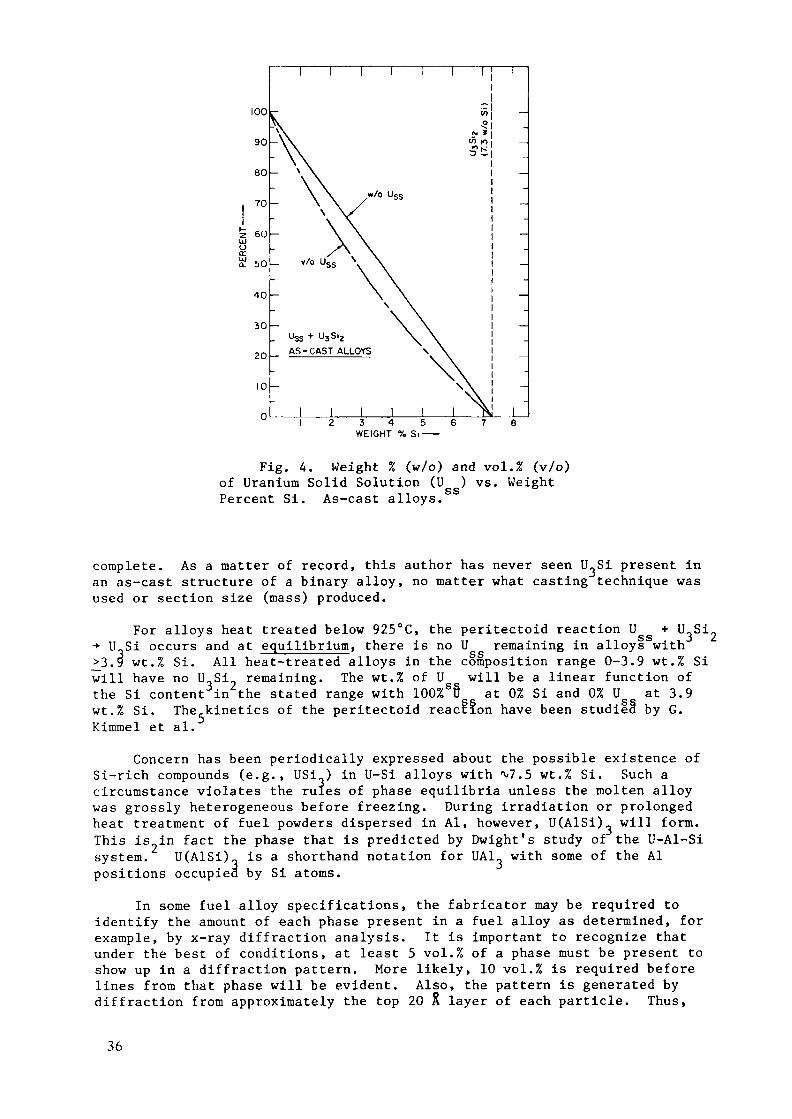
It is important to remember that U.,Si is formed by a peritectoid reaction(the horizontal line at 925°C in Fig. 1) and that any as-cast alloy in therange 0 to 7.3 wt.% Si will have some U present in the microstructure. Thisis true even if the molten alloy is perfectly homogeneous, and irrespective ofthe melting or casting techniques used. The amount of U in an as-cast alloymay be calculated by the same procedures used to produce Figs. 2 and 3, and aplot of such data is shown in Fig. 4. In generating Fig. 4, I have simplifiedthe presentation by assuming no solid solubility of Si in U. Formulas forcalculating wt.% and vol.% U in this composition range are shown in theAppendix.
The peritectoid formation of U-Si suggests, but does not guarantee, thatU Si will not be present in an as-cast alloy. Peritectoid reactions in metal-lic systems are usually sluggish and require long-time anneals to initiate and
35
3 4 5WEIGHT % Si
Fig. 4. Weight % (w/o) and vol.% (v/o)of Uranium Solid Solution (U ) vs. WeightegPercent Si. As-cast alloys.
complete. As a matter of record, this author has never seen U_Si present inan as-cast structure of a binary alloy, no matter what casting technique wasused or section size (mass) produced.
For alloys heat treated below 925°C, the peritectoid reaction U + U3Si?•* U„Si occurs and at equilibrium, there is no U remaining in alloys with3.9 wt.% Si. All heat-treated alloys in the composition range 0-3.9 wt.% Siwill have no U Si remaining. The wt.% of U will be a linear function ofthe Si content in the stated range with 100%SS at 0% Si and 0% U at 3.9wt.% Si. The kinetics of the peritectoid readKimmel et al.
ion have been studied by G.
Concern has been periodically expressed about the possible existence ofSi-rich compounds (e.g., USi ) in U-Si alloys with 7.5 wt.% Si. Such acircumstance violates the rules of phase equilibria unless the molten alloywas grossly heterogeneous before freezing. During irradiation or prolongedheat treatment of fuel powders dispersed in Al, however, U(AlSi)_ will form.This is in fact the phase that is predicted by Dwight's study oF the U-Al-Sisystem. U(AlSi)„ is a shorthand notation for UA1. with some of the Alpositions occupied by Si atoms.
In some fuel alloy specifications, the fabricator may be required toidentify the amount of each phase present in a fuel alloy as determined, forexample, by x-ray diffraction analysis. It is important to recognize thatunder the best of conditions, at least 5 vol.% of a phase must be present toshow up in a diffraction pattern. More likely, 10 vol.% is required beforelines from that phase will be evident. Also, the pattern is generated bydiffraction from approximately the top 20 A layer of each particle. Thus,
36
depending on particle size, the diffraction pattern may represent the phasespresent in only a small percentage of the bulk of the sample. Therefore,x-ray diffraction of powders is not a good analytical tool for the identifi-cation of the amount of each phase present in a multiple-phase alloy.
SUMMARY AND CONCLUSIONSA principal point of this paper as it applies to RERTR fuel alloy
development and fabrication is simply this:
Whenever a U-Si fuel is described, a notation such as U_Si, U_Si1 ,U-Si„ or USi may be recorded or spoken. For other fuels, equivalent notationsmight be U.Fe, U,Mn, or U„SiAl, for example. The descriptive formulas mustnot be taken literally. In all cases, at least one other phase is present;the amount of the second phase is quantitatively related to the content ofdeliberate additions (and impurities) in the alloy.
In all the development and fabrication work with U-Si alloys, composi-tions have always been selected to be on the Si-rich side of the stoichio-metric compound. This choice was deliberately made to preclude the presenceof U in the alloy and therefore in the fuel particles. Uranium solidsolution will be absent only if the molten alloy is homogeneous beforefreezing and, in the case of alloys between 3.9 and 7.3 wt.% Si, after properheat treatment. It had been presumed that the presence of U would be detri-mental to the irradiation performance of suicide fuels. However, recentevidence from postirradiation examinations indicates that the presence of someU is not detrimental to the performance of an Al-matrix dispersion fuel.The U primarily reacts with Al to form uranium-aluminide, a very stablefuel, during irradiation.
Recognizing that perfect homogeneity and equilibrium are goals which onecan approach but cannot achieve, we must always expect to have more than onephase in a fuel alloy.
37
APPENDIX
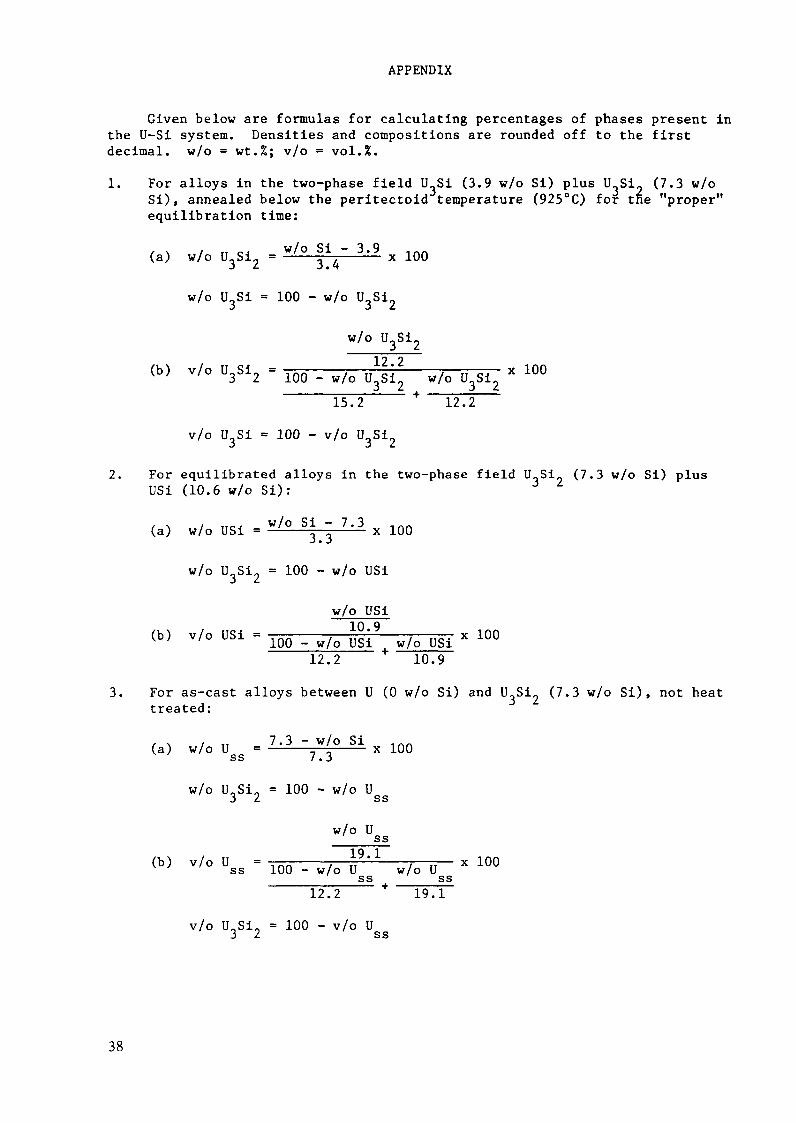
Given below are formulas for calculating percentages of phases present inthe U-Si system. Densities and compositions are rounded off to the firstdecimal, w/o = wt.%; v/o = vol.%.
1. For alloys in the two-phase field l Si (3.9 w/o Si) plus U Si (7.3 w/oSi), annealed below the peritectoid temperature (925°C) for tne "proper"equilibration time:
/ \ / „ 0.1 w/o Si - 3.9(a) w/o U3Si2 = — —— 2~4 ———— x
w/o U.Si = 100 - w/o U_Si2
w/o U
<b) V/° U3S12 " Too-- w/o Usl wATU^ * 10°
IsTz + izTzv/o U.Si = 100 - v/o U3Si2
2. For equilibrated alloys in the two-phase field U„Si (7.3 w/o Si) plusUSi (10.6 w/o Si):
(a) w/o USi = W/° S " 7'3 x 100
w/o U Si = 100 - w/o USi
w/o USiin Q(b) V/° USi = ÏÔÔ-T w/o USi w/o USÎ X 10°
12.2 + 10.93. For as-cast alloys between U (0 w/o Si) and U Si (7.3 w/o Si), not heat
treated:
t ^ t „ 7.3 - w/o Si ,,.-(a) w/o U = ———— =— ——— x 100ss 7.3
w/o U_Si_ = 100 - w/o U3 2 s s
w/o Uss
(b) v/o U = -r-r-7———-.— -i——7—-— x 100ss 100 - w/o U w/o U_____ ss ____ss12.2 + 19.1
v/o U.Si0 = 100 - v/o U3 2 s s
38

REFERENCES
1. R. F. Domagala, T. C. Wiencek and H. R. Thresh, "Some Properties of U-SiAlloys in the Composition Range U Si to U Si-," in Proceedings of the 1984Intl. Meeting on Reduced Enrichment for Research and Test Reactors.ANL/RERTR/TM-6 CONF-8410173 (July 1985), pp. 47-60.
2. A. E. Dwight, A Study of the Uranium-Aluminum-Silicon System, ANL-82-14(Sept. 1982).
3. F. E. W. Wetmore and D. J. LeRoy, Principles of Phase Equilibria,McGraw-Hill Book Co., New York (1951). Reprinted by Dover Publications,New York (1969).
4. A. Prince, Alloy Phase Equilibria, Elsevier Publ. Co. (1966).
G. Kimmel, A. Tomer and A. Bar-Or, "The Kinetic:U3Si Alloy," J. Nucl. Mater. 40. 242-248 (1971)
5. G. Kimmel, A. Tomer and A. Bar-Or, "The Kinetics of U Si Formation in Cast
39

Appendix 1-2PROPERTIES OF CLADDING AND STRUCTURAL MATERIALS
Appendix 1-2.1
DESCRIPTION AND QUALIFICATION OF SOME ALUMINUMALLOYS USED BY CERCA AS CLADDING MATERIALS
COMPAGNIE POUR L'ETUDE ET LA REALISATIONDE COMBUSTIBLES ATOMIQUES (CERCA)France
Abstract
The specifications, physical and mechanical properties, andqualification of some of the aluminum alloys used by CERCA ascladding materials for MTR fuel elements are described.
The aluminum alloys used in France for cladding MTR elementsproduced by CERCA were specially developped in the earlysixties by the French CEA to resist water corrosion in operatingconditions of research reactors.
I - Specifications and Properties
I - 1 AG 1 N. E. . AC 2 N. E. and AG 3 N. E. aluminum a l l n y « * 1 »The threealloys are aluminum - magnesium alloys with thefollowing chemical composition :
AGAGAG
23
NENENE
!:2.
85
4
4MßMgMg
ic
4i.2.3.
430
WWW
l%Other elements specifications are the same for the twoalloys, namely, in weight percentage :
0,2
0,2 <
Other
BCdCu
^ FeSi
£F^SiLiCrMn
elements
< 0,001< 0,001< 0,008^ 0,4< 0,3< 0,5< 0,001< 0,3< 0,7
( each ) < 0,03
NE means " Nuclear Grade - water ".
41

Physical and mechanical properties are not part of specifi-cations. Information about these properties can be derivedfrom published data relating to standard, non nuclear,AG alloys, although it should be pointed out that toleranceson their impurities levels are different from those specified forthe nuclear grade N. E. alloys :
Standard AG 2 Standard AG 3( mean values j
Density ( g/cc ) 3». 2.7 jv 2.7
Melting Point ( deg. C ) ^j. 650 a, 650
Specific Heat ( J/g/deg. C ) - ru 0. 96
Thermal conductivity - 2 / 1 . 3( w/cm/deg. C )
Linear Expansion Coefficient - t» 25. 7between 20 and 300°C( 1 öVdeg. C )
Average Tensile Strength(hbars ) ( 1 )at 20'C ~ 20 si 24at 200'C ~. 16,5 ^ 20
Average Yield Strength ( at 0,2%alongation in h bars )
at 20°C v 9.5 jrw 13at 150eC _v 9 ^ 1 2at 200*C ^ 8 *, 11.5at 250'C v 7.5 ^ 10•v
(1 ) S0me references indicate significantly lower valuesfor these characteristics.
1-2 AlFeNi ( N. E. grade ) alloyThis alloy is generally preferred to AG 2 NE and AG 3 NEin cases where unusually high coolant or plate surfacetemperature are to be expected.
Chemical composition ( weight per cent )
0.
0.
1.0.
0.
0.
0.
0.
8
8
8
8
2
2
06
02
4<4
4<<^<
Fe ^Ni 4
Fe + Ni
Mg ^
Cr ^
Mn 4
Zn 4
Ti <^
1.
1.
1.
0.
0.
0.
0.
2
2
2
5
6
14
08
42
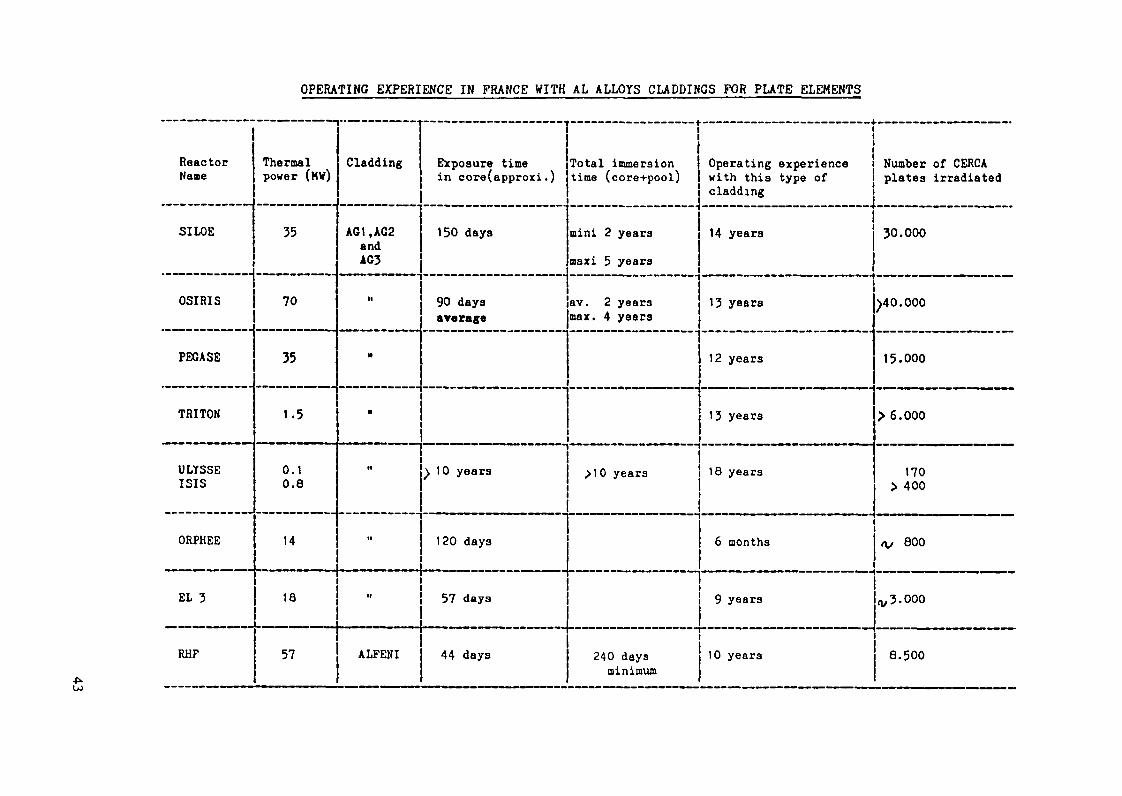
OPERATING EXPERIENCE IN PRANCE WITH AL ALLOYS CLADDINGS FOR PLATE ELEMENTS
!ReactorName
SILOE
- ——— !OSIRIS
PECASB
TRITON
ULYSSEISIS
ORPHEE
EL 3
RUF
Thermalpower (MW)
35
-T-r .. JJ J. -
70
35
1.5
0.10.8
14
18
57
Cladding
AGI ,AG2andAG3
M
H
-"" ——— "•'
M
tl
II
ALFENI
Exposure timein core(approxi . )
150 days
90 daysarerag«
———— —————— 1
. „ -,^ 1 0 years
120 days
57 days
44 days
———————————— j!
Total immersiontime (core-t-pool)
mini 2 yearsmaxi 5 years
av. 2 yearsmax. 4 years
....... -r. _ „ .*..*_--..-__ -|
>10 years
""" ™™ ™ ————— -- LLL1«_»«. Lj
|__ ———————————— ————————————————————————
!240 daysminimum
Operating experiencewith this type ofcladding_____________-J14 years
13 years
12 years
13 years
18 years
6 months
'- '^ —' " - -^
9 years
10 years
Number of CERCAplates irradiated
30.000
40.000
15.000
>6.000
170> 400
ox 800
0,3.000
8.500
u>
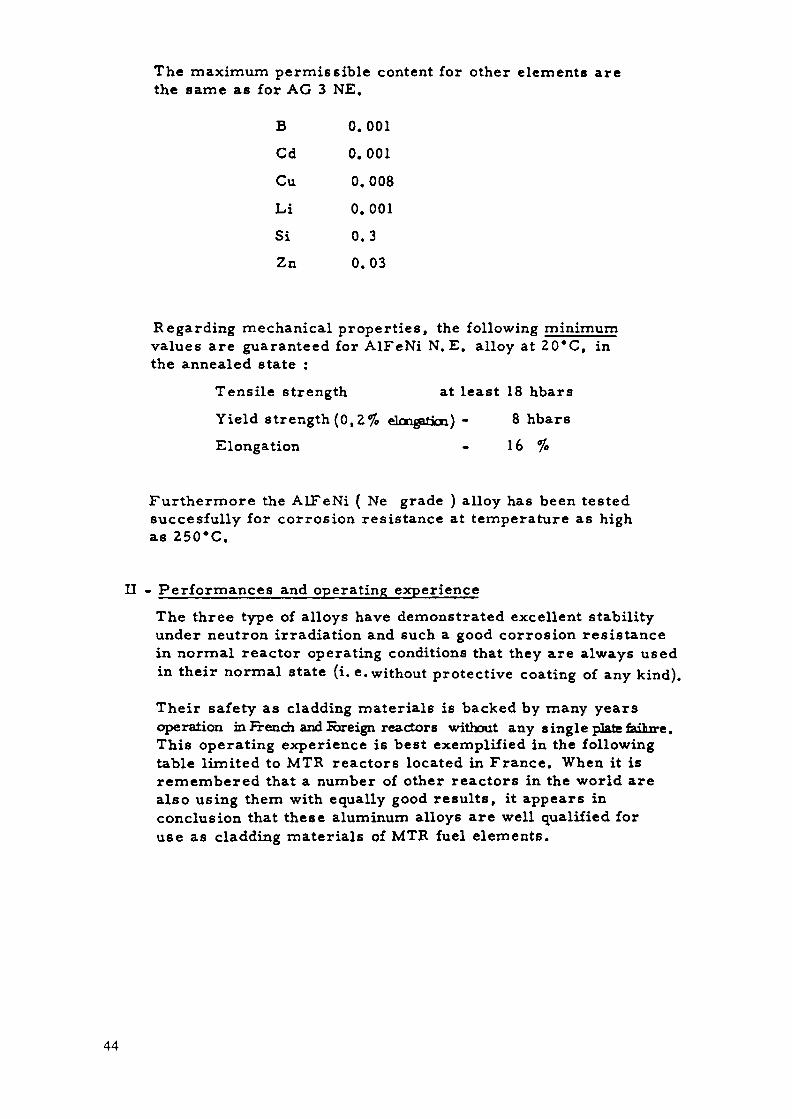
The maximum permissible content for other elements arethe same as for AC 3 NE.
B
Cd
Cu
Li
SiZn
0.001
0.001
0.008
0.001
0.3
0.03
Regarding mechanical properties, the following minimumvalues are guaranteed for AlFeNi N. E. alloy at 20*C, inthe annealed state :
Tensile strength at least 18 hbars
Yield strength (0 ,2% elongatioi) - 8 hbars
Elongation - 16 %
Furthermore the ALFeNi ( Ne grade ) alloy has been testedsuccesfully for corrosion resistance at temperature as highas 250*C.
II - Performances and operating experience
The three type of alloys have demonstrated excellent stabilityunder neutron irradiation and such a good corrosion resistancein normal reactor operating conditions that they are always usedin their normal state (i. e. without protective coating of any kind).
Their safety as cladding materials is backed by many yearsoperation in French and loreign reactors without any single plate failure.This operating experience is best exemplified in the followingtable limited to MTR reactors located in France. When it isremembered that a number of other reactors in the world arealso using them with equally good results, it appears inconclusion that these aluminum alloys are well qualified foruse as cladding materials of MTR fuel elements.
44

Appendix 1-2.2
NUKEM CLADDING AND STRUCTURAL MATERIALS
NUKEM GmbHHanau,Federal Republic of Germany
Abstract
The composition and maximum content of some of the aluminumalloys used by NUKEM as cladding and structural materialsfor MTR fuel elements are described.
SHEETS OF AI Mg l
Composition and Maximum Content of Alloys
The alloy AlMgl (Material No. 3.3315) DIN 1725 Tl. l is produced fromthe material Al 99.5 H (Material No. 3.0250) DIN 1712 Tl. l by adding magnesiumwhereby the special tolerances as to boron, cadmium, lithium, cobalt, copper,and zinc have to be adhered to.
Composition in Weight Percentage
Mg 0.7 - 1.1Al rest
Maximum Content of Alloys in Weight Percentage
B 0.001 Fe 0.45Cd 0.001 Li 0.001Co 0.003 Mn 0.15Cr 0.10 Si 0.30Cu 0.008 Zn 0.05Other elements 0.05 eachOther elements 0.15 in total
SHEETS OF Al Mg 2
Composition and Maximum Content of Alloys
The alloy AlMg2 (as Material No. 3.3525 DIN 1725 Tl.l edition 1967) isproduced from the material Al 99.5 H (Material No. 3.0250) DIN 1712 Tl.l byadding magnesium whereby the special tolerances as to boron, cadmium, lithium,cobalt, copper, and zinc have to be adhered to.
45
Composition in Weight Percentage
Mg 1.7 - 2.4Al rest
Maximum Content of Alloys in Weight Percentage
B 0.001 Fe 0.40Cd 0.001 Li 0.001Co 0.003 Mn 0.30Cr 0.30 Si 0.30Cu 0.008 Zn 0.03
Ti 0.1Other elements 0.05 eachOther elements 0.15 in total
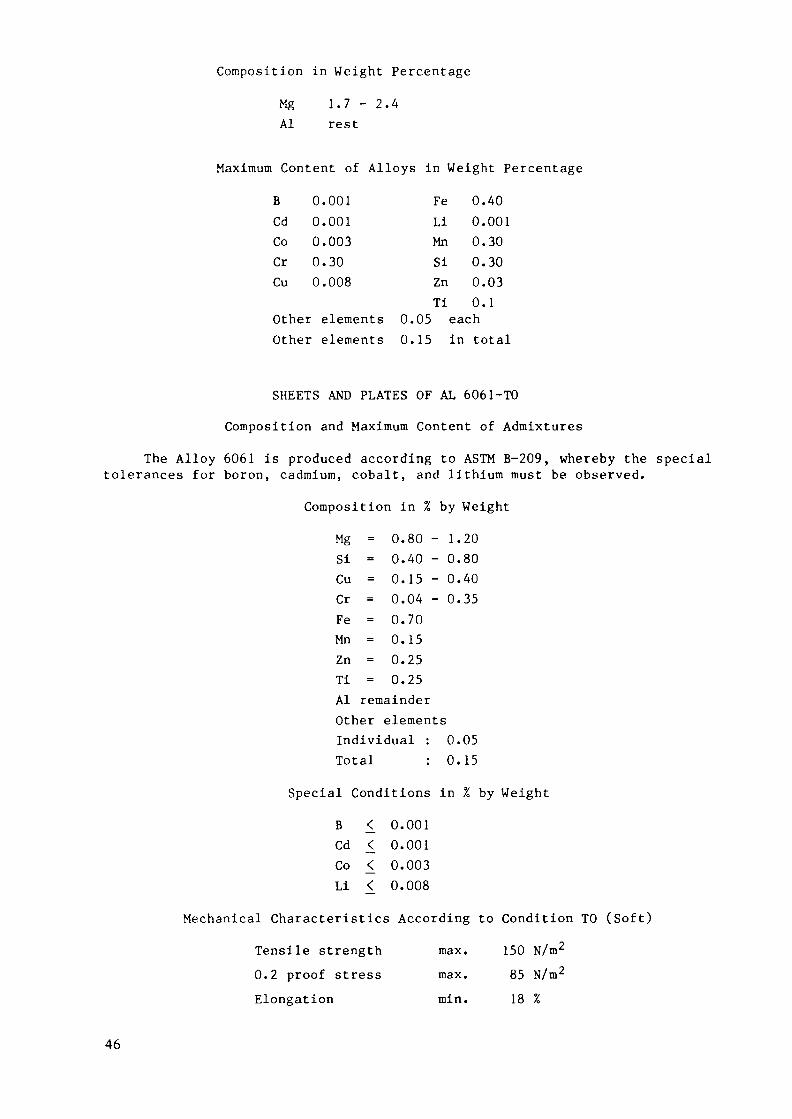
SHEETS AND PLATES OF AL 6061-TO
Composition and Maximum Content of Admixtures
The Alloy 6061 is produced according to ASTM B-209, whereby the specialtolerances for boron, cadmium, cobalt, and lithium must be observed.
Composition in % by Weight
Mg = 0.80-1.20Si = 0.40 - 0.80Cu = 0.15 - 0.40Cr = 0.04 - 0.35Fe = 0.70Mn = 0.15Zn = 0.25Ti = 0.25Al remainderOther elementsIndividual : 0.05Total : 0.15
Special Conditions in % by Weight
B £ 0.001Cd <_ 0.001Co < 0.003Li £ 0.008
Mechanical Characteristics According to Condition TO (Soft)
Tensile strength max. 150 N/m2
0.2 proof stress max. 85 N/m2
Elongation min. 18 %
46

Appendix 1-2.3
BABCOCK AND WILCOX CLADDINGAND STRUCTURAL MATERIALS
BABCOCK AND WILCOXUnited States of America
Abstract
A listing of specifications for the aluminum alloys used byBabcock & Wilcox as cladding and structural materials forfabrication of research reactor fuel elements is provided.
The following table shows materials used by B&W for research reactorelement fabrication. The list is not inclusive but represents materials usedsuccessfully to fabricate research reactor elements. The current revision ofthe specifications listed is used.
Aluminum Alloy Specifications
Plate Cladding, Dummy Plates, Side Plates
HOOF ASTM B209 aluminum-alloy plate
6061 Clad with 1100, QAA-200 aluminum alloy6061-T6, bar, rod, shapes, and6061-TO extruded tube 6061, 60626061-T651 (U.S. Federal
Specification)ASTM B221-81, extrudedtubing
6061-T6511 (Tubes)6063-T5 (Tubes)
End Fittings (adapters, combs, bails, handles, etc.)356-T6 ASTM B26 aluminum alloys356-T21 and casting or ASTM B618
aluminum alloy investmentcasting
5G70A-T65G70A-68 ASTM B108-68 aluminum alloy
permanent mold casting6061-T651 ASTM B211 or B221 aluminum
alloy6061-T6 bars, rods, wire
ASTM B209 aluminum alloysheet and plate
47

The maximum impurity content for aluminum components except end fittingsis reported in ppm with boron not to exceed 15 ppm. Otherwise the materialcomposition must conform to the standard specification (ASTM).
For aluminum cladding and structurais, the chemistry specification isbased on the chemistry of the melt. Results of the chemical analyses andmechanical property tests, including yield strength, are also provided bythe supplier and overchecked as necessary by B&W.
48

Appendix 1-3CORROSION RESISTANCE AND EXPERIENCE WITH
ALUMINUM ALLOY CLADDINGS
Appendix 1-3.1
WATER CORROSION OF ALUMINUM ALLOY CLADDINGS
ARGONNE NATIONAL LABORATORYRERTR Program,Argonne, Illinois,United States of America
Abstract
Literature applicable to the water corrosion of aluminum alloycladdings in research reactors is reviewed for the purposes ofspecifying operating parameters and estimating reasonableservice lifetimes.
IntroductionAluminum alloys have been, and are, being used In water-cooled production,
research, and test reactors since the beginning of the nuclear enterprise.Thus, there Is a voluminous literature dealing with the aqueous corrosion ofaluminum and its alloys under a variety of conditions. It Is not the purposeof this section to present a comprehensive review of this literature. Rather,a portion of the literature relevant to research rectors, i.e. that applicableto corrosion In reclrculatory systems operating below 200°C and with provisionfor pH and Impurity control, will be considered for the purposes of specifyingoperating parameters and estimating resonable service lifetimes.
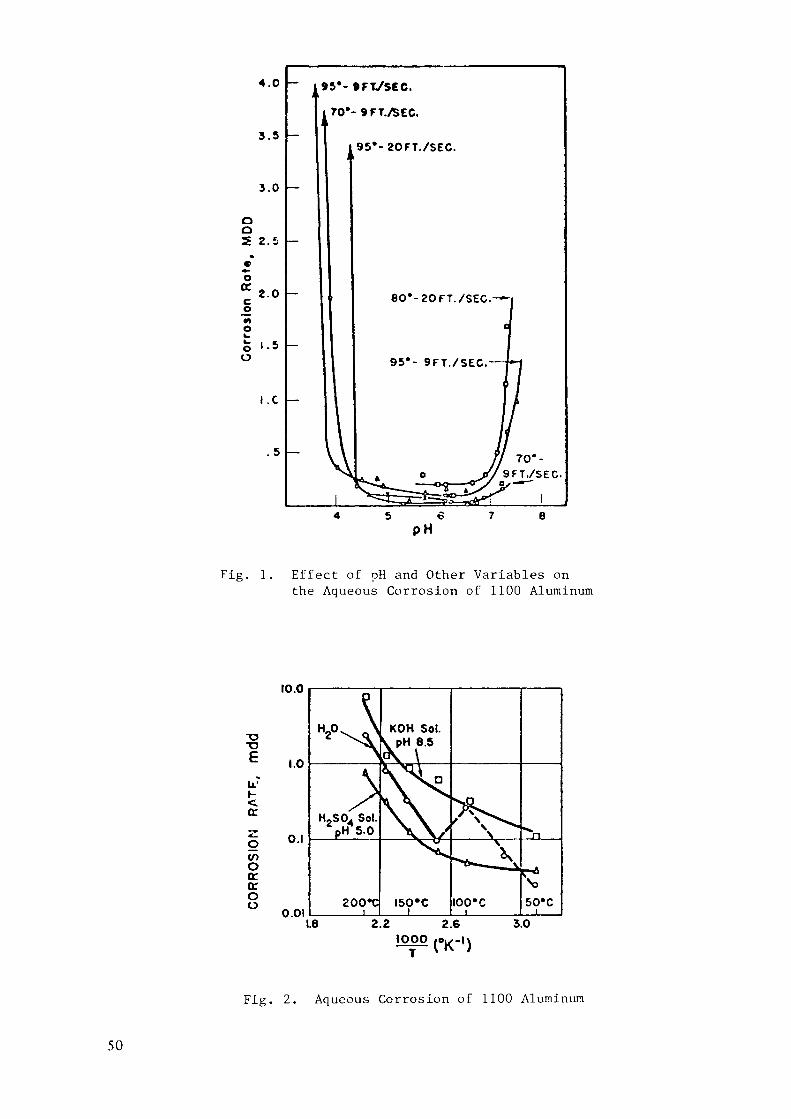
Corrosion BehaviorThe corrosion behavior of aluminum alloys Is sensitive to temperature,
pH, and flow rate. The behavior of alloy 1100 (99% min. Al) at tempertures upto 95°C Is summarized in Fig. I.1 Figure 2 summarizes the corrosion behaviorof the same alloy over a wider range of temperatures.2 In evaluating therelevance of the data in Figs. 1 and 2 to particular cases it should be notedthat 1 HDD (mg/cm2/day) is equivalent to 13.5 pm/yr (0.53 mils/yr).
The data summarized in Figs. 1 and 2 were obtained in high purity water(except for the acid and alkali used for pH control) and in the absence ofreactor radiation. Chlorides and heavy metals e.g. Ni, Cu, Co, Pb, Sn andHg, in concentrations above ~0.1 ppm (above 0.02 ppm for Cu), particularly insolutions of pH below 6 lead to severe pitting.1»3 At temperatures up to~150°C, water velocities up to 7.6 m/sec (25 ft/sec) do not adversely affectcorrosion behavior.2 At higher temperatures, the effects of flow rate andsurface/volume ratio are complex.1* Corrosion rate Increases slightly withtemperature in the range of interest to research reactors and increases alsowith flow rate in an unsaturated (with respect to corrosion product)system.5
49
4.0
3.5
3.0
Oo2.5
ooc•oO
2.0
i.c
[«•-»FT/SEC.TO*-9FT./5EC.
95*-20FT./SEC.
8O*-20FT./SEC.
95'- 9FT./SEC.
5 6PH
Fig. 1. Effect of pH and Other Variables onthe Aqueous Corrosion of 1100 Aluminum
10.0
T3E
trzotrtroo 0.01
Fig. 2. Aqueous Corrosion of 1100 Aluminum
50

The corrosion rate of freshly exposed alloy is rapid, but it decreases paraboli-cally to a lower constant rate as corrosion product builds up.6 This corrosionproduct is a multi-layered aluminum oxide and there is evidence that dissolu-tion of at least one of these layers can have a significant effect on thecorrosion rate.?"11 The dissolution rate is a function at least of tempera-ture, pH, and refreshment rate but there is no generally acceptable model ofthe detailed behavior.
Alloys with improved corrosion behavior at higher temperatures have beendeveloped.2»1«»12 However, it is expected that the commonly used aluminum alloys(e.g. 6061 - 0.25 Cu, 0.6 Si, 1.0 Mg, 0.25 Cr and 5052 - 2.5 Mg, 0.25 Cr) willbehave similarly to 1100 and these improved alloys under research reactorconditions.2 Although quantitative data are limited, there is evidence thatreactor irradiation does not adversely affect the corrosion behavior ofaluminum alloys.12 For example, specimens Of 6061 aluminum exposed in thecore of the ORR at 57°C (135°F) for one year showed a very low corrosion rateof less than 1.3 ym/yr «0.1 mils/yr).13
Conclusions and Recommendations
Based upon the data presented above it is clear that research reactorscan be operated in such a manner that corrosion of the aluminum cladding isnot a practical limit on fuel element lifetime. The recommended conditions toachieve the desired long service life are pH between ~5 and ~6.7, preferrably~6, and chloride and heavy metal concentrations as low as can be achieved, atleast ~0.02 ppm for Cu and below 0.1 ppm for the others. It is emphasizedthat these recommendations apply to periods of down-time as well as to thoseperiods when the reactor is operating. The effect on uniform corrosion rate ofperiods of exposure at pH outside the recommended range can be estimated fromthe data in Figs. 1 and 2. Increase in concentration of chlorides and/orheavy metals will lead to severe pitting, including complete penetration of thecladding, in relatively short time.
It is also worth noting that care should be taken during storage in airto keep humidity or contamination (e.g., from fingerprints) from plate surfaces,particularly if the plates have not been cleaned and passivated.
REFERENCES
1. J. E. Draley and A. Greenberg, "The Applications of Materials in LowTemperature Water and Organic Liquid Cooled Reactors," Nuclear Metallurgy,IMD, Special Report No. 2, AIME (Feb. 1956).
2. J. E. Draley and W. E. Ruther, "Aqueous Corrosion of Aluminum Alloys atElevated Temperatures," Geneva Conference Paper 535 (1955).
3. C. R. Schmitt, J. M. Schneyer, and J. M. Googin, "Corrosion Behaviorof Aluminium in Water," Report Y/DA-7055 (Feb. 1977).
4. J. E. Draley and W. E. Ruther, "The Corrosion of Aluminum Alloys inHigh-Temperature Water," in Corrosion of Reactor Materials, Vol. 1,pp. 477-498, IAEA (June 1962).
5. R. L. Dillon, "Dissolution of Aluminium Oxide As A Regulating Factorin Aqueous Aluminum Corrosion," HW-61089 (August 31, 1959).
51
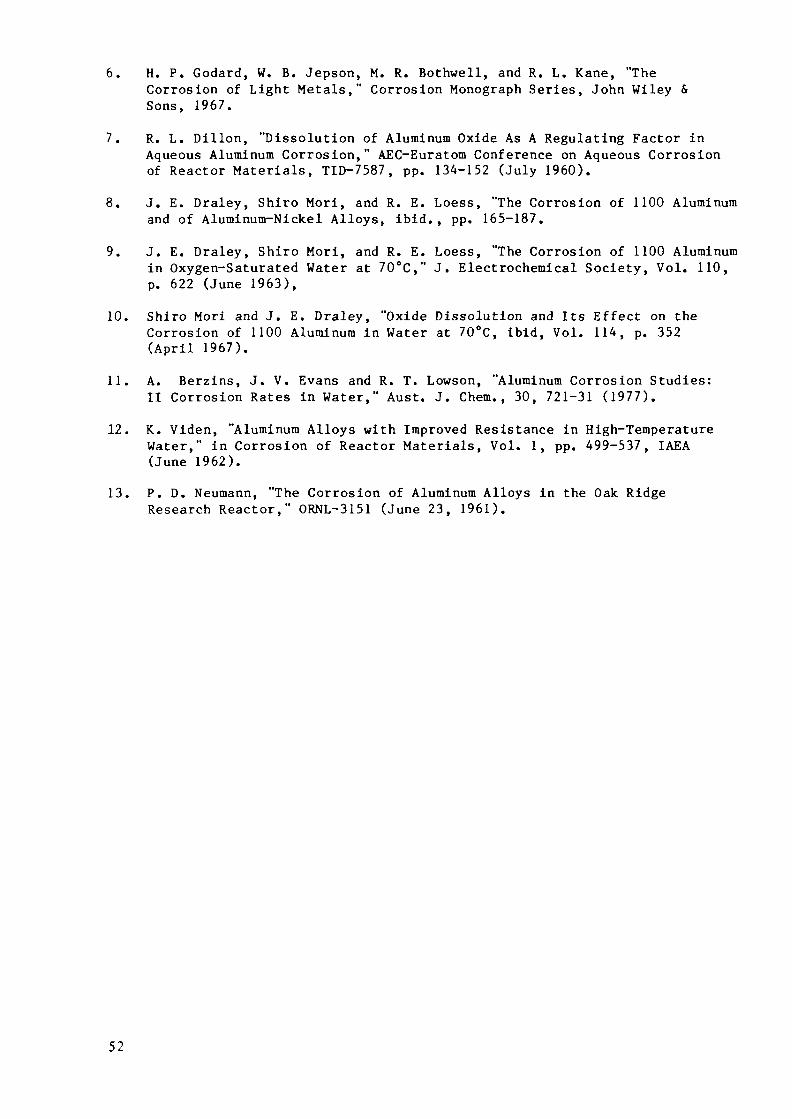
6. H. P. Godard, W. B. Jepson, M. R. Bothwell, and R. L. Kane, "TheCorrosion of Light Metals," Corrosion Monograph Series, John Wiley &Sons, 1967.
7. R. L. Dillon, "Dissolution of Aluminum Oxide As A Regulating Factor inAqueous Aluminum Corrosion," AEC-Euratom Conference on Aqueous Corrosionof Reactor Materials, TID-7587, pp. 134-152 (July 1960).
8. J. E. Draley, Shiro Mori, and R. E. Loess, "The Corrosion of 1100 Aluminumand of Aluminum-Nickel Alloys, ibid., pp. 165-187.
9. J. E. Draley, Shiro Mori, and R. E. Loess, "The Corrosion of 1100 Aluminumin Oxygen-Saturated Water at 70°C," J. Electrochemical Society, Vol. 110,p. 622 (June 1963),
10. Shiro Mori and J. E. Draley, "Oxide Dissolution and Its Effect on theCorrosion of 1100 Aluminum in Water at 70°C, ibid, Vol. 114, p. 352(April 1967).
11. A. Berzins, J. V. Evans and R. T. Lowson, "Aluminum Corrosion Studies:II Corrosion Rates in Water," Aust. J. Chem., 30, 721-31 (1977).
12. K. Viden, "Aluminum Alloys with Improved Resistance in High-TemperatureWater," in Corrosion of Reactor Materials, Vol. 1, pp. 499-537, IAEA(June 1962).
13. P.D. Neumann, "The Corrosion of Aluminum Alloys in the Oak RidgeResearch Reactor," ORNL-3151 (June 23, 1961).
52

Appendix 1-3.2
POINT CORROSION DEFECTS OF FRG-2 FUEL ELEMENTS
W. KRULLGKSS — Forschungszentrum Geesthacht GmbH,Geesthacht, Federal Republic of Germany
Abstract
Experience with point corrosion defects of FRG-2 fuel elementsis described along with the measures that were taken to overcomepoint corrosion problems.
At the end of 1970 an increasing activity concentration in the airof the reactor hall of the FRG-reactors was measured. Using the wetsipping method, defect fuel elements could be localized in thereactor core of the FRG-2 (15 MW). Point defects (0 < 1,2 mm) havebeen detected in the hot cells. Typical defects are shown in fig.1-3. The electric conductivity of the primary coolant (light) waterwas below 1 uS and e.g. no Cl- and Cu-ions could be found.
The FRG-1 (5 MW) and the FRG-2 (15 MW) use the same MTR-type fuelelement: 23 plates, UAlx meat, 180 g U-235, 93 % enriched, Al 99,5canning material and anodic treatment coating.To overcome the point corrosion problems the following parameterswere changed
canning materialAl 99,5 to Al 99,85, AlFeNi, AlMgl
- surface treatmentanodic treatment to chromatisation, only etching, cooking 0,5 hand cooking 16 h (to provide a so-called corrosion resistantboehmite coating /!/)reduction of the max. permissible surface defects from 100 [t to60 u.
By far the best experience was obtained with fuel elements with Mg-based Al-alloy canning materials and 16 h cooked (boehmite) surfacetreatment.
53
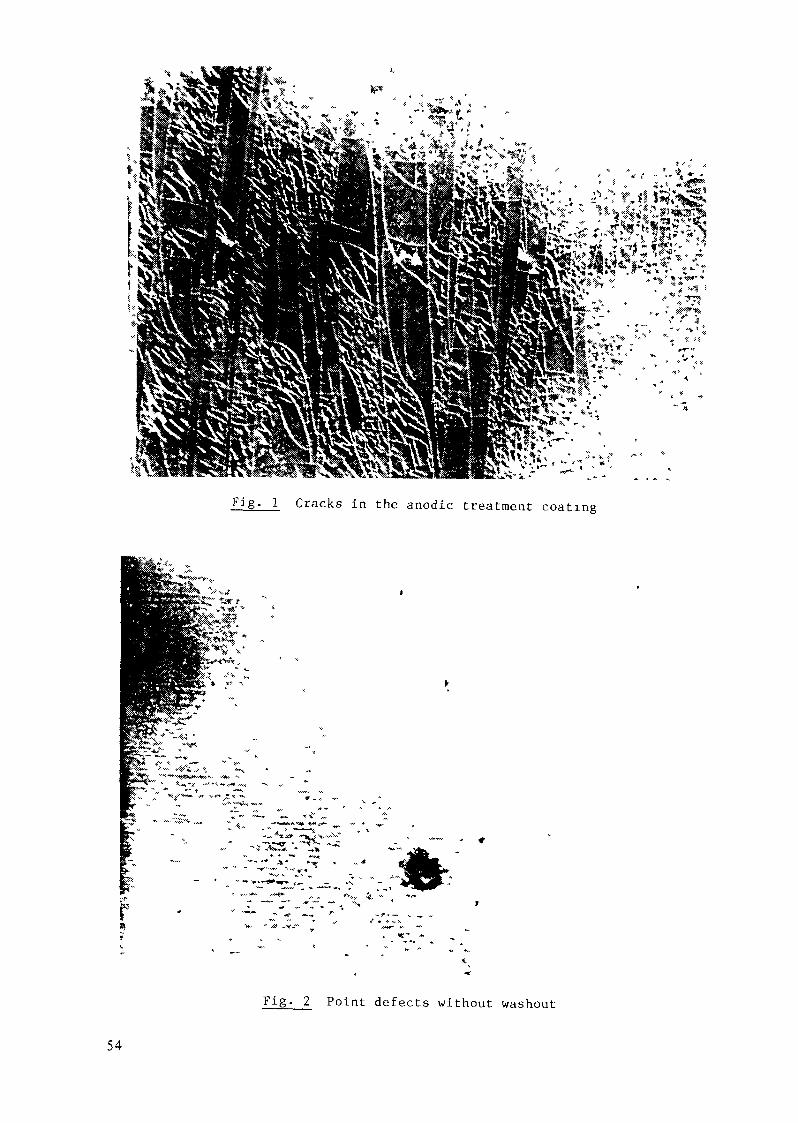
.'..**•>
1 Cracks in the anodic treatment coating
Fig- 2 Point defects without washout
54
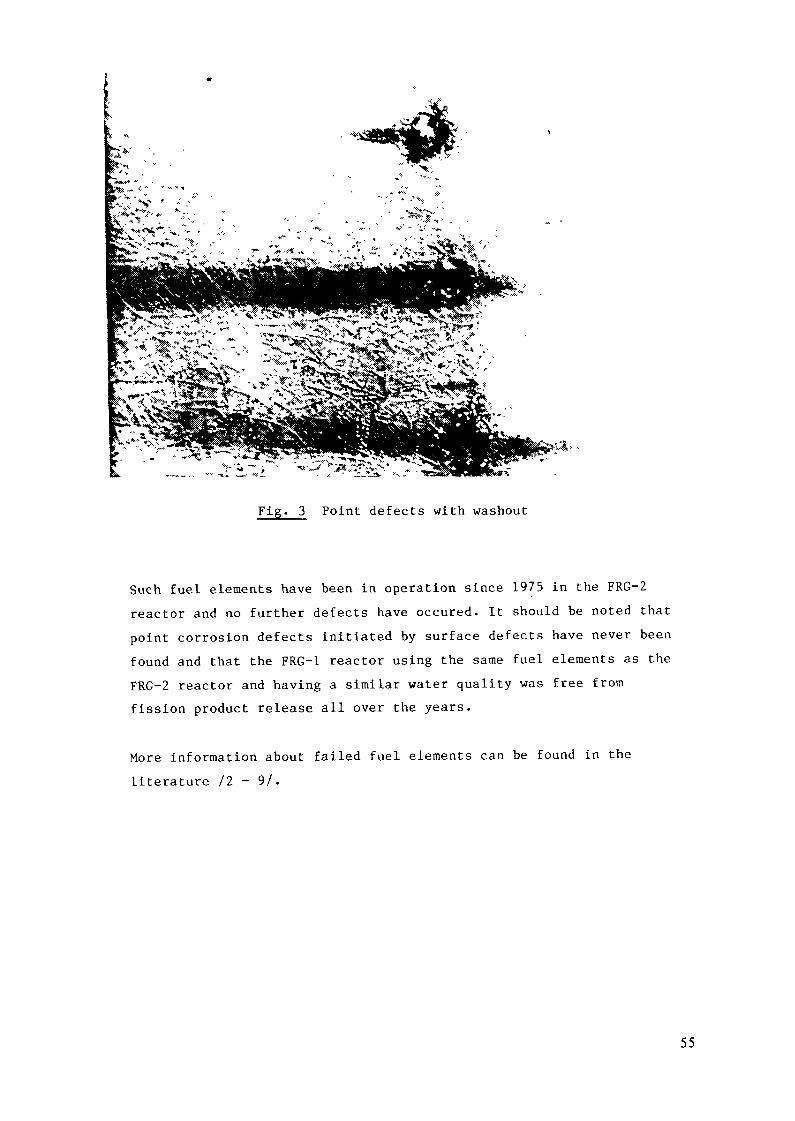
Fig. 3 Point defects with washout
Such fuel elements have been in operation since 1975 in the FRG-2reactor and no further defects have occured. It should be noted thatpoint corrosion defects initiated by surface defects have never beenfound and that the FRG-1 reactor using the same fuel elements as theFRG-2 reactor and having a similar water quality was free fromfission product release all over the years.
More information about failed fuel elements can be found in theliterature /2 - 9/.
55
REFERENCES
/!/ D.G. Altenpohl: Use of boehmite films for corrosion protectionof aluminium, Corrosion 18_ (1962) 4, p. 143-153
/2/ W. Krull, G. Robert: The operation and utilization of theresearch reactors at the research center Geesthacht, Confe-rence on research and test reactors, ANS-Transactions (1974),p. 26-27
/3/ M.H. Brooks: Detection and identification of failed fuel ele-ments - HFBR, ANS-Transactions, Conference of Reactor Operat-ing Experience /1977) 37-38
/4/ D.R. Boisblanc, C.F. Leyes, M.H. Barts: Process water fissionproduct activity from MTR fuel assemblies, MTRL-54-62
/5/ L.J. Harrison: In-pile mechanical failure of MTR fuel assem-blies, (1963) IDO 16862
/6/ J.W. Dykes, J.D. Ford, K.R. Hoopingarner: A summary of the1962 fuel element fission break in the MTR, /1965) IDO 17064
111 R.H. Clark, J.W. Cure: Detecting leaks in plate-type elements,ANS-Transactions Supplement 2 p. 5-6 (1971)
/8/ H.R. Hilker, F.C. Fogarty: Test reactor operating experienceswith failure-prove fuel, ANS-Transactions Supplement 2p. 20-22 (1971)
/9/ J.L. Eagan: Multiple failure of MTR-type fuel elements atLPTR, ANS-Transaction Supplement to Volume 12 p. 61-62 (1969)
Remarks More experiences with fuel elements failures are wellknown. As these defects are not documented in the openliterature no citation can be given.
56
Appendix 1-3.3
NOTE ON UK EXPERIENCE RELATING TOCORROSION OF MTR FUEL
R. PANTERUnited Kingdom Atomic Energy Authority,Harwell, Didcot, Oxfordshire,United Kingdom
Abstract
Experience in the U.K. related to corrosion of MTR fuel elementsclad in pure aluminium is described. Recommended conditions fordemineralized water are provided along with the surface treat-ment used to passivate complete Harwell fuel elements.
U.K. experience relates only to fuel clad in pure aluminium, assembledby mechanical means or by inert gas shielded welding or brazing with eitherpure aluminium or aluminium-silicon alloy.
Elements have been used for up to 15 years in low power reactors, insome cases followed by high power use to normal burn-up. Prior to repro-cessing, elements are stored in water for between two and five years. Nocases of corrosion failure have been experienced in water of good quality.
The conditions recommended are demineralised water ofconductivity 0.2 to 1.5y mho/cm2
pH 5.5 to 6.5Fe not more than 0.01 ppmCu " " " 0.01 ppmCl " " " 0.2 ppm
Any particles of rust from unprotected mild steel in the water causerapid pitting corrosion of aluminium.
It is worth noting that storage in air prior to use also requires dryand clean conditions, particularly if the aluminium surface has not beenchemically cleaned and passivated. Some cases of failure prior to irradiation,in elements assembled by salt-bath dip brazing, were due to brazing fluxtrapped in crevices in the structural elements. This method of assembly isno longer used.
It has been found advantageous to passivate complete elements to removeany particles of foreign metal on the surface and to reduce the initial oxida-tion in the reactor water. The treatment used for Harwell elements is:
1. Clean mechanically if necessary, degrease using methanol and blowoff any dust with compressed air.
2. Soak in 10% w/w nitric acid at 40°C for 5 minutes.3. Rinse in running water.4. Soak in demineralised water at 40°C for 5 minutes.
57
5. Soak in clean demineralised water at 70°C for 15 minutes - thisprovides an opportunity to check that no contamination has beencarried over.
6. Dry in air at 100°C.The visual result of this treatment is less attractive than mechanical
or chemical cleaning, but the surface is less susceptible to corrosion indamp air or in water.
58
Appendix 1-3.4
ALUMINIUM CORROSION DATA
C. BAGLINGEC Energy Systems Limited,Whetstone, Leicester,United Kingdom
Abstract
Literature related to pitting corrosion of the aluminium used inthe cladding of research reactor fuel elements is reviewed. Keydata and conclusions are summarized.
The corrosion rate of aluminium and its alloys under normal researchreactor conditions of relatively low temperature and high water purity, canbe kept very low. Generally the higher the degree of purity of thealuminium the greater its corrosion resistance. However, certain elementssuch as magnesium and zinc can be alloyed in amounts up to 1% with refined(99.99%, AA-1099) aluminium without reducing the corrosion resistance ofthe pure metal (Ref. l). Under research reactor conditions either commercial -purity aluminium or 2S (99.0%, AA-1100) are used because high-purity aluminiumis susceptible to intergranular corrosion in deoxygenated water at slightlyelevated temperature (Ref. 2). A corrosion rate of 0.01 ml/yr at 50°C hasbeen achieved using AA-1100 (Ref. 3). The control of the pH of the watersystem between 5 and 7 is essential and this produced little significantchanges in the latter corrosion rate (Ref. 3). An increase in the tempertureof the water system causes an increase in the film formation on the surface ofthe aluminium, which at 80°C was sufficient to prevent further pitting corrosionto AA-1100 (Ref. 4). Pitting corrosion was found to be sensitive to watercomposition at different temperatures with even a small addition of copper tothe water causing some pitting to occur even at higher temperatues (Ref. 4).The initiation and rate of pitting are influenced by the flowrate of the waterand a velocity of only 8 fpm suppresses the pitting of AA-1100 sheet completely(Ref. 5). The effects of water conductivity on the corrosion resistance ofaluminium has been little documented, but a value of between 0-5 umho isgenerally desirable.
Low Temperature References
1. Godard, H. P., W. B. Jepson, M. R. Bothwell and R. L. Kane. Thecorrosion of light metals. Corrosion monograph series 1967.
2. Ferryman, E. C. W., J. Inst. Met., 88, 62 (1959/60).3. Draley, J. E., and W. E. Ruther, Corrosion, 12, 441 (1956).
4. Porter, F. C., and S. E. Hadden, J. Appl. Chem., 3, 385 (1953).5. Wright, T. E., and H. P. Godard, Corrosion, 10, 195 (1954).
59
High Temperature References
6. Huddle, R. A. U., and N. J. M. Wilkins, U.K. Atomic EnergyEstablishment Report - M/R-1669 (1955).
7. Huddle, R. A. U., and N. J. M. Wilkins, U.K. Atomic EnergyEstablishment Report - M/R-1669A (1956).
8. Bowen, H. C., U.S. Atomic Energy Commission ReportHW-68253, March 1961.
9. Lobsinger, R. J., U.S. Atomic Energy Commission ReportHW-59778, Feb. 1, 1961.
10. Draley, J. E., AEC Euration Conf. Aq. CorrosionReactor Materials, Brussels, TID-7587, (1960) 165.
11. Troutner, V. H. , U.S. Atomic Energy Commission ReportHW-50133, June 10, 1957.
12. Dillion, R. L., Corrosion, 15, 13 (1959).
13. Krenz, F. H. , Corrosion, 13, 575 (1957).
14. Draley, J. E., C. R. Bredon, and W. E. Ruther, Conference onPeaceful Uses of Atomic Energy, Geneva, 1958, A/Conf./15, page 714.
15. Wilkins, N. J. M., J. T. Dalton, and J. N. Wanklyn, U.K. Atomic EnergyEstablishment Report-R-3649 (1961).
16. Dillon, R. L., et al., Hanford Works (USA) HW-37636 (1956).
17. Strom, P. 0., and M. H. Boyer, Livermore Lab. (USA), LRL-64 (1953).
60

Appendix 1-3.5
CRNL EXPERIENCE WITH ALUMINUM CLADDING CORROSION
R.D. GRAHAMReactor Technology Branch,Chalk River Nuclear Laboratories,Atomic Energy of Canada Limited,Chalk River, Ontario,Canada
AbstractCRNL experience with corrosion of the aluminum fuel claddingused in the NRU and NRX research reactors is described. Bothreactors currently use HEU(93%) uranium-aluminum alloy rod-typefuel.NRU has had no problems with corrosion of the aluminum fuelcladding. NRX, which uses single pass, untreated water for fuelcooling and for which the fuel residence time is much longerthan NRU, has generally had good performance from aluminumcladding. However, from 1975 to 1979, NRX had considerabletrouble with cladding corrosion. That problem appears to havebeen resolved.
1. INTRODUCTIONThe Chalk River Nuclear Laboratories (CRNL) at Chalk River,Canada, have two high power research reactors, NRX which began operation in
1947, and NRU which began operation in 1957 (see Table 1). Both reactorshave used aluminum fuel cladding throughout their lives. Both reactorscurrently use highly enriched (93% U-235) uranium-aluminum alloy rod-typefuel. NRU has had no problems with corrosion of aluminum fuel cladding.NRX, which uses single pass, untreated water for fuel cooling, and for whichthe fuel residence time is much longer than NRU, has generally had goodperformance from aluminum cladding, but from 1975 to 1979 NRX hadconsiderable trouble with cladding corrosion. That problem now appears tohave been solved.2. NRX2.1 Fuel Cladding Corrosion
The current NRX fuel design, the Mark IV, has been in regular usesince 1971. Details of the design and operating conditions of the Mark IV,and the previous Mark I design which was in use from 1962 to 1974, are givenin Table 2. Briefly, both designs consist of bundles of seven fuel rods.,the Mark IV fuel being 274 cm long and clad with 0.076 cm of Alcan 6102aluminum, compared to a fuel length of 245 cm and a clad thickness of0.114 cm of Alcan 2S (AA #1100) aluminum for the Mark I design.
Alcan 6102 is a "customer alloy" having purity similar to or higher thanIS, but with more rigid specifications of alloy content.
61
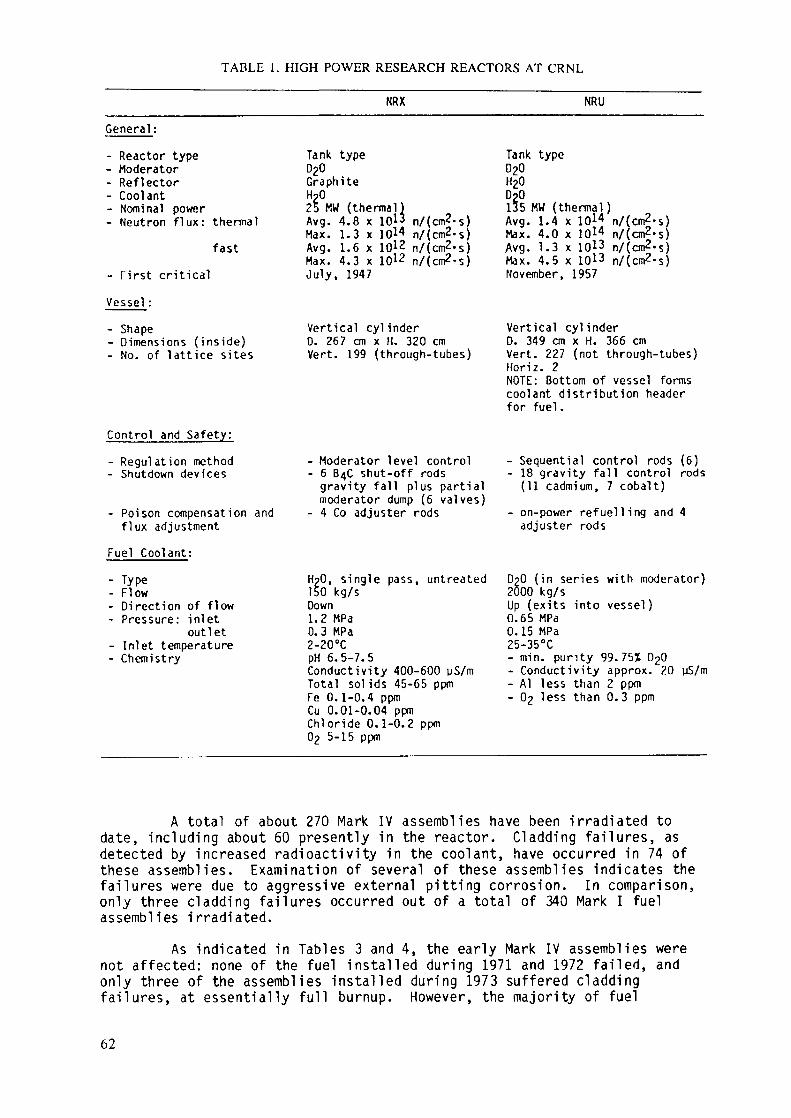
TABLE 1. HIGH POWER RESEARCH REACTORS AT CRNL
NRX NRU
General:
- Reactor type- Moderator- Reflector- Coolant- Nominal power- Neutron flux: thermal
fast
- First critical
Vessel :
- Shape- Dimensions (inside)- No. of lattice sites
Control and Safety:- Regulation method- Shutdown devices
- Poison compensation andflux adjustment
Fuel Coolant:- Type- Flow- Direction of flow- Pressure: inletoutlet- Inlet temperature- Chemistry
Tank typeD20GraphiteH2025 MW (thermal)Avg. 4.8 x 10¹³ n/(cm2-s)Max. 1.3 x 10*4 n/(cm2-s)Avg. 1.6 x 10*2 n/(cm2.s)Max. 4.3 x 10¹² n/(cm2-s)July, 1947
Vertical cylinder0. 267 cm x H. 320 cmVert. 199 (through-tubes)
- Moderator level control- 6 640 shut-off rods
gravity fall plus partialmoderator dump (6 valves)
- 4 Co adjuster rods
H20, single pass, untreated150 kg/sDown1.2 MPa0.3 MPa2-20°CpH 6.5-7.5Conductivity 400-600 uS/mTotal sol ids 45-65 ppmFe 0.1-0.4 ppmCu 0.01-0.04 ppmChlor ide 0.1-0.2 pom02 5-15 ppm
Tank type020H20D20135 MW ( thermal )Avg. 1.4 x 10¹⁴ n/(cm2-s)Max. 4.0 x lOl4 n/(cm2.s)Avg. 1.3 x 10*3 n/(cm2-s)'Max. 4.5 x 10¹³ n/(cm2-s)November, 1957
Vertical cylinderD. 349 cm x H. 366 cmVert. 227 (not through-tubes)Horiz. 2NOTE: Bottom of vessel formscoolant distribution headerfor fuel.
Sequential control rods (6)18 gravity fall control rods(11 cadmium, 7 cobalt)
on-power refuelling and 4adjuster rods
D20 (in series with moderator)2000 kg/sUp (exits into vessel)0.65 MPa0.15 MPa25-35°C- min. purity 99.75% D20- Conductivity approx. 20- Al less than 2 ppm- 02 less than 0.3 ppm
A total of about 270 Mark IV assemblies have been irradiated todate, including about 60 presently in the reactor. Cladding failures, asdetected by increased radioactivity in the coolant, have occurred in 74 ofthese assemblies. Examination of several of these assemblies indicates thefailures were due to aggressive external pitting corrosion. In comparison,only three cladding failures occurred out of a total of 340 Mark I fuelassemblies irradiated.
As indicated in Tables 3 and 4, the early Mark IV assemblies werenot affected: none of the fuel installed during 1971 and 1972 failed, andonly three of the assemblies installed during 1973 suffered claddingfailures, at essentially full burnup. However, the majority of fuel
62

TABLE 2. REACTOR FUEL ASSEMBLIES
NRX NRUMark I Mark IV
Fuel Material:
- Type- Composition
- U density- % U-235
Fuel Elements:
- Type
- Diameter (unclad)- Length
Cladding:
- Type
- Material- Thickness- No. fins/ rod
- Fin size: WH
Assembly:
- General
- No. rods/assembly
- Spacing of fuel centres
U-A1 alloy72 wt% Al-28 wt% U
0.97 g/cm3
93%
Rods(pencils)0.635 on245 cm
ExtrudedAluminum
2 S (AA 1100)0.114 cm3 (helical)
0.102 cm0.094 cm
Rodssuspendedinside Alflow tube
7 (1 central,6 outer)
-1.12 cm
U-A1 alloy72 wt% Al-
28 wt% U0.97 g/cm3
93%
Rods(pencils)0.635 cm274 cm
ExtrudedAluminum
Alcan 161020.076 cmOuter 4 (hel.)Inner 6 (hel.)0.076 cm0.127 cm
Rodssuspendedinside Alflow tube
7 (1 central,6 outer)
-1.054 cm
U-A1 alloy79% wt% AI-21 wt% U
0.69 g/ cm3
93%
Rods (pencils)
0.549 cm274 cm
Extruded Aluminum
Alcan #61020.076 cm6 (straight)
0.076 cm0.127 cm
Rods suspended insideAl flow tube
12 (3 inner, 9 outer)
Inner - on radius 0.65 cm
Maintained by
- Coolant area over fuel
Operating Conditions:
- Coolant flow- Coolant velocity- Maximum power to coolant
(Limit)- Max. surface heat flux- Max. clad surface
temperature (calculated)- Residence time in reactor- Lifetime energy output- Fuel management scheme
Spacers Fins (hel.)every 43 cm
-5.7 cm2 -4.2 on?
2.1-2.4 kg/s3.7-4.2 m/s740 kW
2.1-2.4 kg/s5.0-5.7 m/s800 kW
180 W/cm2 200 W/cm2
140°C 135°C600-800 d 900-1500 d180-240 MW'd 290-350 MW'd(Normally) assembly startslife near centre of core -moved (about 5 times)progressively to outside ofcore
Outer - on radius 1.72 cmSpacers (6 over length)
-14.3 on2
12-14.5 kg/s7.7-9.1 m/s2100 kW260 W/cm2135°CApprox. 300 days305 MW'dAssembly starts near outsideof core - moved towards centre
assemblies installed in 1974, 1975 and 1976 failed. The failure ratedeclined for fuel installed during 1977 and 1978 although there was atendency to schedule removals earlier than usual. As of June 1982, nocladding failures have occurred in fuel assemblies installed after the thirdquarter of 1978, and no cladding failures at all have occurred since the endof 1979.
63
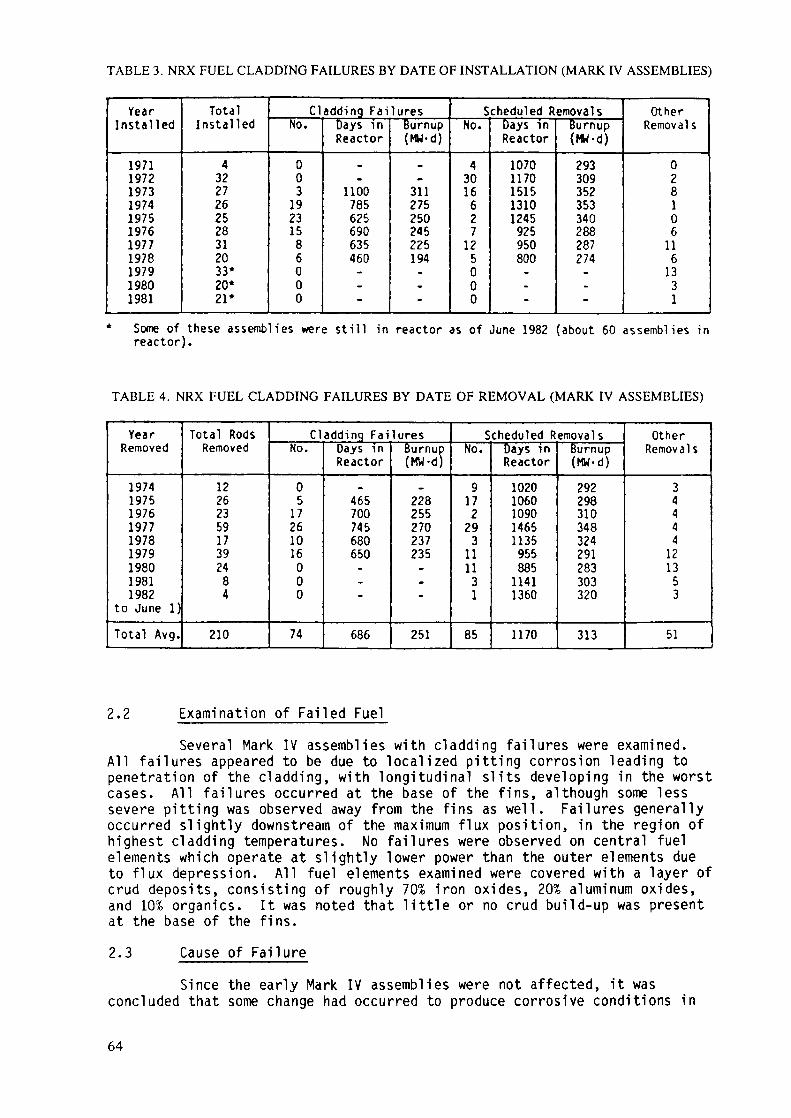
TABLE 3. NRX FUEL CLADDING FAILURES BY DATE OF INSTALLATION (MARK IV ASSEMBLIES)
YearInstalled
19711972197319741975197619771978197919801981
TotalInstalled
43227262528312033*20*21*
Cladding FailuresNo.
00319231586000
Days inReactor
_.
1100785625690635460.--
Burnup(MU-d)..
311275250245225194..-
Scheduled RemovalsNo.
43016627125000
Days inReactor10701170151513101245925950800-.-
Burnup(MH-d)293309352353340288287274---
OtherRemovals
028106
1161331
Some of these assemblies were still in reactor as of June 1982 (about 60 assemblies inreactor).
TABLE 4. NRX FUEL CLADDING FAILURES BY DATE OF REMOVAL (MARK IV ASSEMBLIES)
YearRemoved
197419751976197719781979198019811982
to June 1)Total Avg.
Total RodsRemoved
1226235917392484
210
Cladding FailuresNo.
0517261016000
74
Days inReactor
_465700745680650.-.
686
Burnup(MW-d)
_
228255270237235_.-
251
Scheduled RemovalsNo.
9172293
111131
85
Days inReactor10201060109014651135955885
11411360
1170
Burnup(KW-d)292298310348324291283303320
313
OtherRemovals
34444121353
51
2.2 Examination of Failed FuelSeveral Mark IV assemblies with cladding failures were examined.
All failures appeared to be due to localized pitting corrosion leading topenetration of the cladding, with longitudinal slits developing in the worstcases. All failures occurred at the base of the fins, although some lesssevere pitting was observed away from the fins as well. Failures generallyoccurred slightly downstream of the maximum flux position, in the region ofhighest cladding temperatures. No failures were observed on central fuelelements which operate at slightly lower power than the outer elements dueto flux depression. All fuel elements examined were covered with a layer ofcrud deposits, consisting of roughly 70% iron oxides, 20% aluminum oxides,and 10% organics. It was noted that little or no crud build-up was presentat the base of the fins.2.3 Cause of Failure
Since the early Mark IV assemblies were not affected, it wasconcluded that some change had occurred to produce corrosive conditions in
64
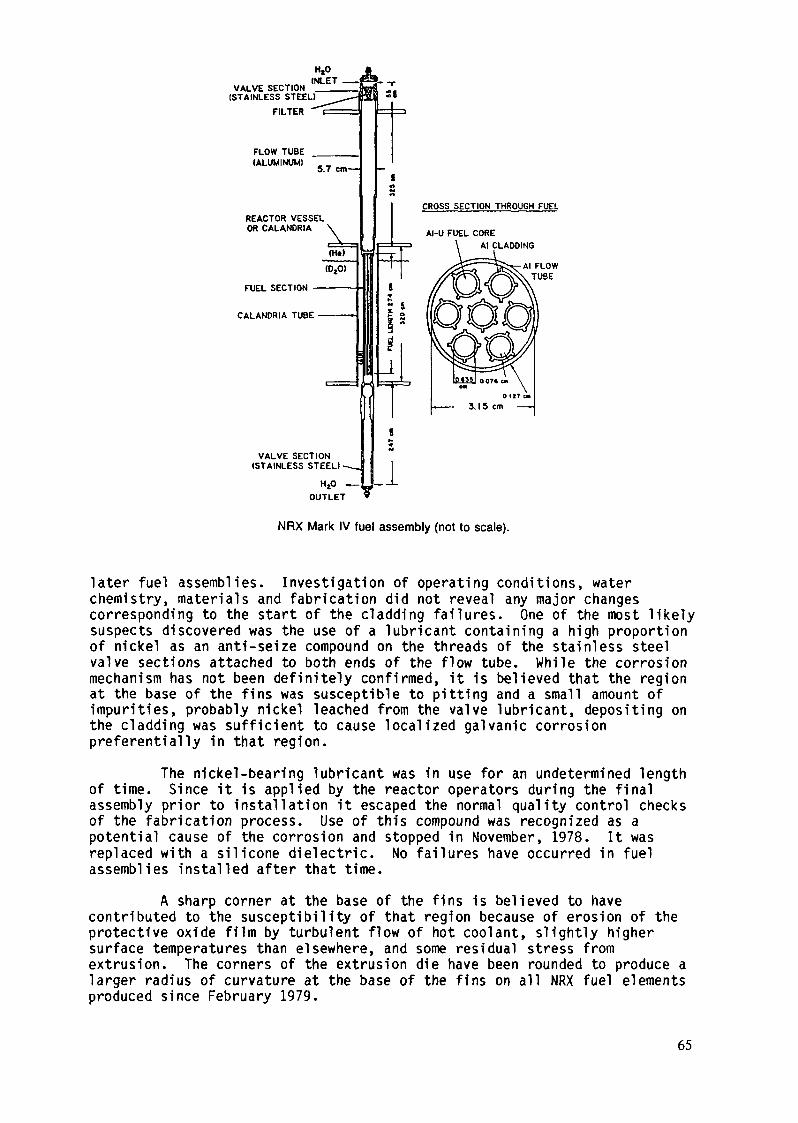
HtOINLET
VALVE SECTION(STAINLESS STEEL)
FILTER
CROSS SECTION THROUGH FUELREACTOR VESSELOR CALANDRIA
FUEL SECTION
CALANDRIA TUBE
VALVE SECTION(STAINLESS STEELI
HjO ——OUTLET
NRX Mark IV fuel assembly (not to scale).
later fuel assemblies. Investigation of operating conditions, waterchemistry, materials and fabrication did not reveal any major changescorresponding to the start of the cladding failures. One of the most likelysuspects discovered was the use of a lubricant containing a high proportionof nickel as an anti-seize compound on the threads of the stainless steelvalve sections attached to both ends of the flow tube. While the corrosionmechanism has not been definitely confirmed, it is believed that the regionat the base of the fins was susceptible to pitting and a small amount ofimpurities, probably nickel leached from the valve lubricant, depositing onthe cladding was sufficient to cause localized galvanic corrosionpreferentially in that region.
The nickel-bearing lubricant was in use for an undetermined lengthof time. Since it is applied by the reactor operators during the finalassembly prior to installation it escaped the normal quality control checksof the fabrication process. Use of this compound was recognized as apotential cause of the corrosion and stopped in November, 1978. It wasreplaced with a silicone dielectric. No failures have occurred in fuelassemblies installed after that time.
A sharp corner at the base of the fins is believed to havecontributed to the susceptibility of that region because of erosion of theprotective oxide film by turbulent flow of hot coolant, slightly highersurface temperatures than elsewhere, and some residual stress fromextrusion. The corners of the extrusion die have been rounded to produce alarger radius of curvature at the base of the fins on all NRX fuel elementsproduced since February 1979.
65

Other things probably contributing to the general susceptibilityof the cladding to corrosion are the general water chemistry particularlythe traces of copper and the long residence time of the Mark IV assembliesin the reactor.
2.4 Activity Releases Due to Cladding FailuresReleases of radioactivity to the NRX coolant as a result of these
cladding failures are relatively small. Typically the failures areinitially almost undetectable on monitoring instruments and the release rateslowly increases over a period of 2 to 4 weeks (occasionally longer) until afailure is confirmed, and the failed fuel assembly located and removed.
Routine analysis of non-gaseous fission product releases indicatethat the average cladding failure resulted in releases in the order of0.005% of the inventory for each fission product nuclide in the entire fuelassembly. In general the fission products appear to be retained in themetal matrix of the fuel alloy, being released only through erosion of thealloy and recoil from the exposed surface. In one of the worst claddingfailures examined, about 0.08 cm3 of fuel meat had been eroded away and itwas estimated that this represented a release of about 0.017X of the fissionproduct inventory of that fuel assembly. In all cases the quantities offission products released were very small fractions of the release limitsfor the CRNL site.
Releases of individual gaseous fission product nuclides have notbeen measured, but the fact that no significant release of activity isinitially detectable suggests that there is little or no diffusion of gasesout of the fuel. It is believed that gaseous fission product releases areof the same order of magnitude as non-gaseous releases.
3. NRUThe present NRU fuel design has been in use since 1964, although
the uranium density has changed several times: from 0.29 g/cm3 to0.42 g/cm~ in 1966, to 0.54 g/cnr in 1968, and to the present0.69 g/cm3 in 1969. The fuel assembly consists of twelve rods, with fuellength 274 cm, and clad with 0.076 cm of Alcan 6102 aluminum (see Table 2).
Operating conditions for NRU fuel assemblies are slightly moresevere than for NRX fuel, but there is a much shorter residence time in thereactor and better quality coolant. Over 1200 of these assemblies have beenirradiated in the reactor. To date there has been no evidence of claddingfailure or excess corrosion.
4. CONCLUSIONSAluminum has been used successfully at CRNL as a cladding material
for highly enriched fuel, with surface heat flux to 260 W/cm2, within-reactor residence times in some cases over four years, and in both goodquality and untreated coolant. General operating limits applied to thiscladding at CRNL are: coolant velocity less than 9.1 cm/s; and surfacetemperature less than 135°C for Alcan 6102, or less than 160°C for 2S(AA .1100).
66

CROSS SECTION THROUGH FUEL
GUIDE TUBE
TOP OF REACTORVESSEL
D20 OUTLET
FUEL ELEMENTSFLOW SPACER
FLOW TUBE
HANGER PLATE
DOUBLE BULGE END
BOTTOM OFREACTORVESSEL
NRU fuel assembly (not to scale).
Experience with corrosion indicates that sharp corners should beavoided, and care taken to maintain quality control throughout fabrication,assembly, and operation of the fuel to avoid introducing impurities.
67
Appendix 1-3.6
WATER AND CORROSION TECHNOLOGY OFLIGHT WATER RESEARCH REACTORS
H. PIEPERKernforschungsanlage Julien GmbH,Julien, Federal Republic of Germany
Abstract
Light water is used as primary coolant and as moderator in mostof the research reactors. In order to keep the corrosion of thestructural materials used in the reactor as small as possible,specific requirements must be fulfilled both with respect to thewater quality and also the engineering design of the system.The values which are associated with the fulfillment of theseobjectives may be termed "chemical parameters."
Suitable measures will be discussed which influence these chemi-cal parameters and which satisfactorily fulfil l the requirementto be met by water chemistry. In addition, experience gained inoperating the Jülich FRJ-1 reactor will be demonstrated.
Light water used in the reactor as a primary coo lant se rves asa heat transfer medium and as a moderator . The influence of thiswater on the structural mater ia ls normally used such as:
- aus ten i t i c chrome nickel s tee ls (we ld c ladd ings , p iping, pumps,f i t t ings and heat exchange rs ) ,
- and high-puri ty a luminium or a lumin ium-magnes ium a l loys(fuel element c ladd ing, reactor v e s s e l , in ternals e t c . )
must in this case be as s l ight as p o s s i b l e .
The fo l lowing requirements must be ful f i l led by the water qual i tyquite general ly :
1. No or only little a g g r e s s i v e n e s s in order to main ta in a min ima lrate of metal loss from the st ructura l mate r ia ls -
2. The probabi l i ty of the occurrence of selective co r ros ion formsthrough ionogenic or so l i d water impuri t ies shou ld be as sma l las p o s s i b l e -
3. Rad iochemica l hydrogen and oxygen format ion ( r a d i o l y s i s )must be suppressed by suitable measures .
69
In a d d i t i o n the engineering design of the system should guaranteethat the formation of activatedcorrosion products can be m i n i -mized, wich means that:
4. Transport and deposition of corrosion products should be in-fluenced in such a way that contamination of the primaryc i r c u i t remains s l i g h t , i.e. if p o s s i b l e no material s h o u l ddeposite in the core zone and only short residence timesshould occur here -
5. The deposition of corrosion products on the heat transfersurfaces (fuel elements and heat exchangers) should there-fore also be avoided as far as possible.
The de-ionized water used in the reactor primary coolant loopis more or less aggressive towards the structural materialsused in the research reactor, especially if it is contaminatedwith oxygen and other substances such as chloride, sulphideor also traces of heavy metals. In order to minimize thesei m p u r i t i e s ' chemical attack on the structural material as faras possible water chemistry for its part aims at preventingdamage and operational impairments by an appropriate mode ofoperation.
The data exhibiting a connection with the f u l f i l l m e n t of thisobjective can be designated "chemical parameters". By suitablemeasures which influence the chemical parameters the demandsmade on water chemistry can be satisfactorily fulfilled.
Among these measures is the d e f i n i t i o n of di rectly measurablequanti ti es. In the Federal R e p u b l i c of Germany these measurableq u a n t i t i e s are for example la i d down in the water specificationsfor reactor primary cooling water in BWR's and PWR's.
Even today these v a l u e s are strictly speaking not g u i d e l i n e sfor research reactors, although some of the reactors have beenin operation for more than 20 years. In this respect one ad-heres rather to the various operating regulations, usuallytaken over from other reactor stations, to the manufacturers'technical specifications, as well as to the fuel element war-ranty clauses, which as a rule all determine the maximum permis-
70

Table 1: VGB*standards for reactor water and reactor feed waterin BWR installations in continuous operation (1973)
conducc h 1 o r is i l i c atotaltotalsodi urn
ti vi tyde
i roncopperand potass
25°C(CD(Si02)(Fe)(Cu)i urn
uS/cmmg/kgmg/kgmg/kgmg/kgmg/kg
reactorwater
< 1<0.2< 4
--
reacfeed
<0
00
torwater
.15-
.025
.003-
* VGB = Technische Vereinigung der Großkraftwerksbetreiber e.V-Technical Association of Major Power StationOperators
sible concentrations of various substances in the reactor primarywater and feed water which may not be exceeded in operation.
Stainless steel as a structural material in the primary systemis susceptible to stress-corrosion cracking if chloride is alsopresent in the water in addition to oxygen. In the case ofa l u m i n i u m and aluminium-magnesium alloys there is a danger ofpitting corrosion at higher chloride concentrations. Since re-search reactors favour a swimming pool design as a reactor typeone does not in any case have any influence on the oxygen con-centration in the pool water, and therefore only the chlorideconcentration can be limit e d as a function of the oxygen content.However, selective forms of corrosion can be largely e l i m i n a t e dby such a restriction of the chloride concentration. The maximumpermissible concentration of chloride ions in the primary coolingwater is identical to the value of the VGB g u i d e l i n e . Today, how-ever, in the operation of a research reactor with a we!1-function-ing p u r i f i c a t i o n system values remain clearly below this l i m i t .
Other ionogenic impurities or dissolved substances need not nec-essarily be specified with respect to their maximum p e r m i s s i b l econcentration. Nevertheless, with careful monitoring they cang i v e indications of whether the behaviour of the primary coolingwater which is to be expected on the basis of the given waterchemistry actually occurs. This behaviour could in p r i n c i p l e
71

also be observed from the analysis of certain activation prod-ucts (e.g. Co-60, Co-58, Mn-54, Na-24), if this e x a m i n a t i o n werecarried out regularly.
The determination of l i m i t s becomes senseless however, iforders of magnitude are thereby obtained which are no longeranalytically detectable. Therefore the observation of the waterspecification is not always sufficient to avoid damage. Theconsideration of further, not directly measurable values ise q u a l l y important.There are substances which cause detrimental effects even ifpresent in non-analytically detectable amounts . Tab! e 2 givesa rough survey of this type of substance; it does not claimto be exhaustive. A closer quantification is not normally carriedout. The introduction of these substances into the primary cool-ing water can only be prevented, or rather kept under control,by counter measures .The following are among the necessary measures for influencingthe c h e m i c a l parameters:
1 • !?l§nt_op_erati on
In respect of the chemical parameters the plant operationw i l l concentrate on the observation of the water specifi-cation. The values are monitored by instrumentation andlaboratory analyses and can be controlled by means of thewater p u r i f i c a t i o n systems' mode of operation and the flowof water in the circuit.
ng_measures
Among these are the correct design and the proper functioningof the water p u r i f i c a t i o n system (filtration, ion exchanger),r e l i a b l e make-up water c o n d i t i o n i n g , an optimal c i r c u l a t i o nsystem (purification bypass) and sufficient d i m e n s i o n i n gin terms of flow mechanics (no dead legs).
The composition of the high-grade steels, a l u m i n i u m and alum i n i u m - m a g n e s i u m alloys used with respect to their content
72

Table 2: Survey of "forbidden" substances
substance typical occurrence effect
halogen-containingmaterials
mercury
lead, cadmium,tinsulphidecobalt, zinc,silveroil, grease
mechanical dirt
ionogenic contam-inantsdetergents
antistatic agents
decreasing agents,Teflon, PVC, Neoprene
thermometers,pressure gaugesshieldings, tools
molybdenum disulphidematerials, absorbermaterialspreserving agents,lubricantsdrops of sweat, Kleenex-tissues, residues offoils, disposable glovessalts, chemicals
soaps, derusting agents,organic solvents
new plastic filtercartridges
ion exchange resins leakages from purificationsystems
decomposition to formhalogenstress-corrosioncrackingintercrystallinecorrosionintercrystallinecorrosionpittingextensive activationin the neutron fielddecomposition intoacids corrosionclogging, jamming
increased conductivitycorrosionincreased conductivity,pH value change, corrosionfoamingincreased conductivity,corrosion, foamingdecompositioncorrosion
of a l loy ing const i tuents and normal impurit ies must be speci-f ied in such a way that, in the case of corros ion, if p o s s i b l eno long- l i ved a c t i v a t i o n products can occur, or rather thatno s e l e c t i v e c o r r o s i o n s ( loca l e l e m e n t s , p i t t ing) can takep l a c e under the p reva i l i ng cond i t i ons . Th i s inc ludes e .g .the s p e c i f i c a t i o n s about the max imum c o b a l t , z inc or coppercon ten ts in these ma te r ia l s . Fur thermore , a t ten t ion mus t bepa id that no " fo rb idden" s u b s t a n c e s ( T a b l e 2) be i n t r oducedinto the cool ing system by means of aux i l iary d e v i c e s , too ls ,m e a s u r i n g i ns t rumen ts e tc . (mercu ry , h a l o g e n s , mo lybdenumsu lph ide, heavy m e t a l s ) .
4. C l e a n l i n e s s
Part icu lar care must be e x e r c i s e d when work ing on the opencoo l ing sys tem and reactor v e s s e l . Bas ica l l y only parts and
73

experimental devices perfectly clean, indeed as a rule onlywith pickled surf aces, shoul d be introduced into the primarycool i ng water .
The water p u r i f i c a t i o n system was s p e c i a l l y mentionedamong the plant engineering measures for i n f l u e n c i n g thec h e m i c a l parameters in the reactor primary coolant loop. Itis a p a r t i c u l a r task of t h i s purification system toensure the observation of the water specifications duringthe operation of the reactor. This is why we s h a l l here oncemore consider the major sources of the p o s s i b l e occurrenceof contami nation.
" ^§!SCiyß_*ä ter _cond i ti_oni_ ng
S l i p p a g e of unwan ted i o n s : ( C l ~ , S 0 , ~ ~ , Na , SiCk", CO ~wi th depleted exchanger ma te r i a l s ,
- l eakages
In the heat exchanger in the case of pressure differencesbetween the primary and secondary or a n c i l l a r y coolantloop ,
tu " teri a l s
S u r f a c e e r o s i o n s o r the normal c o r r o s i o n r a t e s o f h i g h - g r a d es t e e l a n d a l u m i n i u m ( t h e s e a r e a p p r o x . 0 . 0 0 5 m m / y e a r ) . T h e s edissolv ing impu r i t i es a r e a c t i v a t e d ( C r - 5 1 , M n - 5 4 , N a - 2 4 ) a n dform a not i n c o n s i d e r a b l e r a d i a t i o n s o u r c e ,
- a c t i v a t i o n p r o d u c t s
o f the w a t e r , e s p e c i a l l y the n i t rogen i s o t o p e s N - 1 6 ( lha l f - l i fe= 7 .2 s e c . ) and N - 1 7 ( h a l f - l i f e = 4 .2 s e c . ) , w h i c h b e c a u s e o ftheir short ha l f - l i f e are only e f f e c t i v e dur ing o p e r a t i o n , neithershou ld the a rgon i s o t o p e A - 4 1 be fo rgo t ten , wh i ch is formed as ana c t i v a t i o n product due to the continual a i r c o n t a c t be tween thepool wa te r su r f ace and the ha l l a i r . The hydrogen i s o t o p e H-3,w h i c h is a l s o o b t a i n e d in the case of light water moderated research reactors
74

with a s l i g h t b u i l d - u p rate, only plays a minor role as an activa-tion product and radiation source, however it may on the basis ofits long half-life cause problems with respect to release duringprimary cooling water leakages or system drainages.
- and f i n a l l y the impurities due to fiss i l e materi al s from leakyfuel c l a d d i n g s (corrosion, h a i r l i n e cracks,diffus ion processesduring film b o i l i n g ) must also be mentioned. Above all iodine,theinert gases xenon and krypton,but also uranium itself or Np-239must be mentioned here. Even though the f i s s i l e product activitydoes not influence the chemistry of the reactor water, it has nosignificance in terms of weight, it does however have a consider-able effect on the h a n d l i n g of the reactor water during analysis,leakages or disturbances. The possible high specific activitiesalways affect the radiation protection measures which have to betaken and therefore require particular attention during operation.
In respect of these possible sources of contamination in the reactorprimary cooling water specified above it is therefore the major taskof the water p u r i f i c a t i o n system to efficiently remove these impu-rities from the reactor water where they have dissolved or have appearecin the form of solids or c o l l o i d s , and thereby to achieve safe oper-ation of the reactor and a good a v a i l a b i l i t y of the plant.
The combination of a mechanical cartridge filter with a2 - 5 urn filter fineness (as a preliminary filter) with amixed-bed ion exchanger, whereby the ratio of the absorptioncapacity cation.- to anion - exchange resin varies between1 : 1, 1.5 : 1 up to 3 : 1 depending on the reactor plant,has proved successful in all research reactors. The through-put of the purification system is as a rule between 0.1 - 1 %,in the case of i n d i v i d u a l systems even up to approx. 10 %of the hourly c o o l i n g water circulation. In the same way puri-fication variations are being operated in which the throughputthrough the mechanical filter amounts to several times (e.g.4-5 times) that of the mixed-bed filter. It is necessary toadditionally i n s t a l l a collecting filter for decomposed resinparticles (approx. 10 - 25 urn fineness) behind the mixed-bedfilter.
75

We can report from our own experience on FRJ-1 that the primaryco o l i n g water is operated with the addition of free s i l i c a ata concentration between 10 - 30 mg/kg. Extensive laboratory testsat the b e g i n n i n g of the s i x t i e s showed that corrosion damage toa l u m i n i u m as a structural material in contact with high-gradesteel or ferritic surface i m p u r i t i e s could largely be avoidedby the a d d i t i o n of s i l i c a . Our many years' experience w i t h FRJ-1have completely confirmed this i n h i b i t i n g property of s i l i c a asa protective c o l l o i d .
One of the accidents w h i c h occurred must be mentioned wherebys l i g h t traces of c h l o r i d e , w h i c h had been left b e h i n d on the a l u -m i n i u m c l a d d i n g after the hot water s e a l i n g of the finished fuelplates, led to considerable p i t t i n g corrosion in the core afterthe fuel elements in question had been briefly u t i l i z e d . Thisbrought about an extensive contamination of the primary c o o l i n gwater by escaping f i s s i o n products. W i t h respect to time thedetection of damage and exact preservation of evid e n c e for thecause of corrosion presented a much greater problem thanthe e l i m i n a t i o n of contamination in the primary system.
Another case of c o n t a m i n a t i o n , namely with Ag - 110, resultedfrom the fact that the g a l v a n i c a l l y a p p l i e d nickel c l a d d i n gof approx. 50 urn on the absorber rods previously used in ourf a c i l i t y was not completely non-porous. On this occasiononly a structural modification to the rods u t i l i z i n g a s o l i dencasing made from high-grade steel plate could provide thenecessary impermeability.
We did not have any other type of corrosion problem in theprevious operating years. We can however in general mention thata deterioration in water quality can occur r e l a t i v e l y r a p i d l yas a result of the e l u t i o n of ions w h i c h have already been takenup if the ion-exchange resins in the p u r i f i c a t i o n system arenot renewed in good time. This can indeed lead to increased corro-sion rates in the core zone, possibly even to p i t t i n g . Thereforethe most important task of chemical system monitoring is to reg-ister the b e g i n n i n g s of resin depletion in good time and toarrange for appropriate measures to be taken. Nevertheless, itmust be emphasized that such processes do not take place at shortnotice, rather they are indicated as a rule by certain tendencies.
76

In our case the chemical analytical monitoring comprises one weeklylaboratory investigation during which the pH v a l u e , conductivity,s i l i c a and c h l o r i d e content, turbidity and y- a ctivity are deter-mined. The determination of all the i o n o g e n i c a l l y d i s s o l v e d impu-rities and the y-spectrum is undertaken once during each operatingperi od.
In summing up one can say that with appropriate efforts and thepresent state of knowledge - there are no basic d i f f i c u l t i e s inproducing good and satisfactory conditions on the primary side ofa lig h t water moderated research reactor from a corrosion chemistrypoint of view and that these conditions can be f u l f i l l e d over along period of time. I n d i v i d u a l difficulties which may occur arepart of the chemist's bread and butter and must in each case bei n d i v i d u a l l y overcome.
77
Appendix 1-4EXOTHERMIC REACTIONS
Appendix 1-4.1
EXOTHERMIC REACTIONS IN U3O8 DISPERSION FUEL
ARGONNE NATIONAL LABORATORYRERTR Program,Argonne, Illinois
OAK RIDGE NATIONAL LABORATORYOak Ridge, Tennessee
United States of America
Abstract
A summary is provided of the experiments conductedsince 1963 to study exothermic reactions in theU3Og-Al system.
1 . INTRODUCTION
A dispersion of uranium oxide (U30e) in an aluminum matrix has been usedas the fuel material for several research and test reactors. Higheruranium loadings in such material can be achieved by increasing therelative amount of the U3O8 phase.[1]
The fact that a U3Oa and aluminum mixture is not in chemical equilibriumwas recognized very early. The possibility of a chemical reaction betweenthe oxide and the metal phase has been investigated by several independentexperimental efforts over two decades. The first experiments at GeorgiaTech indicated a potential for a rapid exothermic reaction when a UaOg-Almixture reached a sufficiently high temperature. Subsequent tests at theOak Ridge National Laboratory, Argonne National Laboratory, and SavannahRiver Laboratory yielded much more information and understanding.
This appendix summarizes the experiments conducted since 1963 to studyexothermic reactions in the U3Og-Al system.
2 . EXPERIMENTAL STUDIES OF EXOTHERMIC REACTION
2.1 Georgia Tech Experiments
The exothermic reactions in the U3Og-Al system have been studied byFleming and Johnson.'2'3' As indicated by X-ray diffraction studies, thereactions occur in two stages. The first is the reduction of U3O8 to UO2
U3O8 + 4/3 Al -» 3 UO2 + 2/3 A12O3 (1)
which releases 798 kJ/mole of U3O8 (based on heats of formation of U3O8,UO2, and A12O3 of 3574.8, [4] 1085.0,M1 and 1676.8[5] kJ/mole, respectively).
79
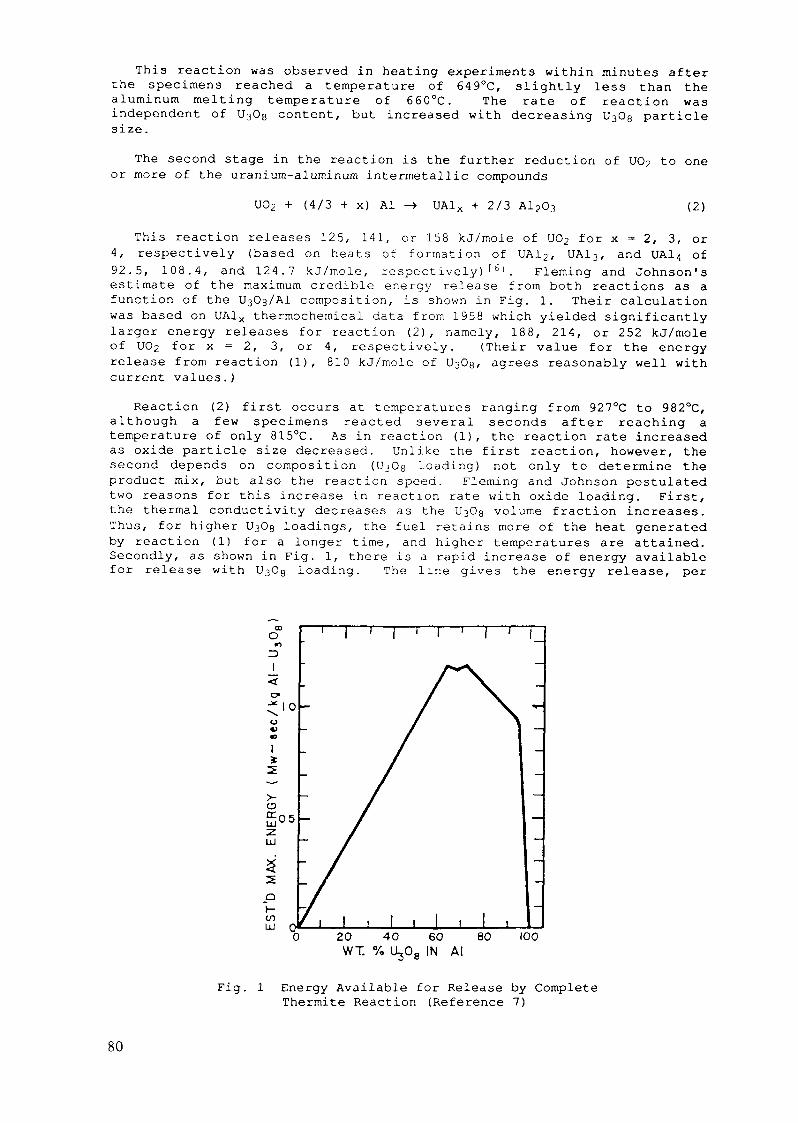
This reaction was observed in heating experiments within minutes afterthe specimens reached a temperature of 649°C, slightly less than thea luminum melting temperature of 660°C. The rate of reaction wasindependent of U3O8 content, but increased with decreasing U3O8 particlesize.
The second stage in the reaction is the further reduction of UO2 to oneor more of the uranium-aluminum intermetallic compounds
U02 + (4/3 + x) Al -» UA1X + 2/3 A1203 (2)
This reaction releases 125, 141, or 158 kJ/mole of UO2 for x = 2, 3, or4, respectively (based on heats of formation of UA12, UA13, and UA14 of92.5, 108.4, and 124.7 kJ/mole, respectively) [6j . Fleming and Johnson'sestimate of the maximum credible energy release from both reactions as afunction of the U3Og/Al composition, is shown in Fig. 1. Their calculationwas based on UA1X thermochemical data from 1958 which yielded significantlylarger energy releases for reaction (2), namely, 188, 214, or 252 kJ/moleof U02 for x = 2, 3, or 4, respectively. (Their value for the energyrelease from reaction (1), 810 kJ/mole of U3O8, agrees reasonably well withcurrent values.)
Reaction (2) first occurs at temperatures ranging from 927°C to 982°C,although a few specimens reacted several seconds after reaching atemperature of only 815°C. As in reaction (1), the reaction rate increasedas oxide particle size decreased. Unlike the first reaction, however, thesecond depends on composition (U30g loading) not only to determine theproduct mix, but also the reaction speed. Fleming and Johnson postulatedtwo reasons for this increase in reaction rate with oxide loading. First,the thermal conductivity decreases as the U30s volume fraction increases.Thus, for higher 030g loadings, the fuel retains more of the heat generatedby reaction (1) for a longer time, and higher temperatures are attained.Secondly, as shown in Fig. 1, there is a rapid increase of energy availablefor release with U30a loading. The line gives the energy release, per
100
Fig. 1 Energy Available for Release by CompleteThermite Reaction (Reference 7)
80

Table 1. Effect of U3O8 Particle Size on Ignition Temperature
UsOg Particle Size ((im)
>149 (+100 mesh)105-149 (100+140 mesh)74-105 (-140+200 mesh)53-74 (-200+270 mesh)44-53 (-270+325 mesh)<44 (-325 mesh)
IgnitionTemperature
1,0651,0501,015995970970
Peak Area(mv-sec)
093
130181165118
Peak Height(mv)
01.481.852.962.181.16
Source: Reference 2
Table 2. Effect of U3O8 Content on Ignition Temperature
UaOe Content w/o
85.479.574.5
IgnitionTemperature
(°C)
993932815
Peak Area(mv-sec)
184319401
Peak Height(mv)
2.984.562.85
Source: Reference 2
kilogram of fuel material, computed from the previously stated heats ofreaction, assuming the reactions proceed to the stoichiometric product mix.Post-experiment analysis found no free uranium metal in the fuel specimens.
Fleming and Johnson utilized the technique of differential thermalanalysis'81 (DTA) to study the effect of U3O8 particle size and composition(wt% UßOs) on the exothermic reaction. In DTA, reactions in a materialduring slow heating are indicated by comparing the outputs of thermocouplesimbedded in the test specimen and in a nonreacting reference material.Phase transitions and chemical reactions are indicated by variations in thedifference of the thermocouple readings. In the U3O8 exothermic reactionexperiments, a peak in the temperature difference indicated the exothermicreaction.
The DTA results for various UßOg particle sizes showed that ignitiontemperatures decreased with decreasing particle size in specimenscontaining 85.4 wt% U3O8 (see Table 1). It was postulated that smallerparticle sizes resulted in a larger specific surface area and bettercontact between the UßOg and aluminum phases. This enhances theirreactivity as indicated by the decline in ignition temperatures in Table 1.The unexpected decline in DTA peak area and peak height for particle sizessmaller than 53 (am was attributed to poor mixing of fine powders duringspecimen fabrication, which caused the incomplete reaction.
The effect of fuel composition was also studied. Three samples, withUaOe contents shown in Table 2, were heated and DTA indicated lowerignition temperatures for lower loadings (in the composition range shown).
81
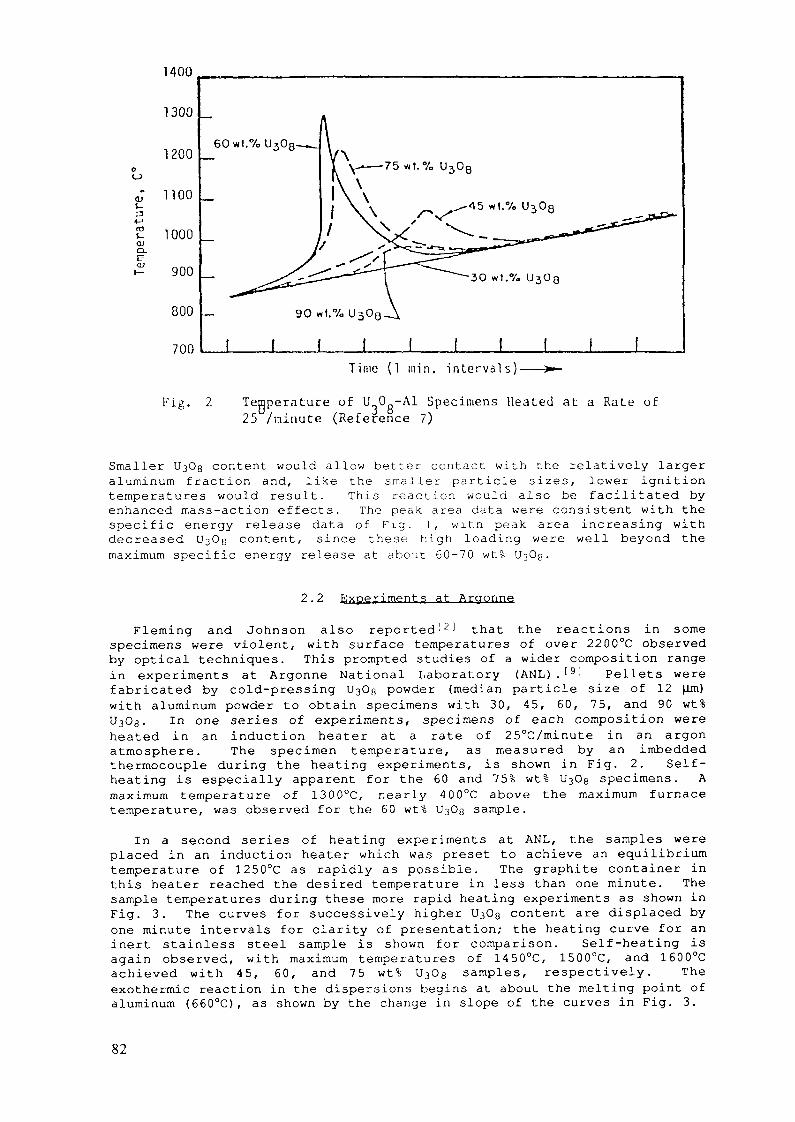
<DJ-
O)O-e<D
1400
1300
1200
1100
1000
900
800
700
60 wt.%
!Time (l min. intervals)-
Fig. 2 Temperature of U 0 -Al Specimens Heated at a Rate of25 /minute (Reference 7)
Smaller UaOg content would allow better contact with the relatively largeraluminum fraction and, like the smaller particle sizes, lower ignitiontemperatures would result. This reaction would also be facilitated byenhanced mass-action effects. The peak area data were consistent with thespecific energy release data of Fig. 1, witn peak area increasing withdecreased UaOg content, since these high loading were well beyond themaximum specific energy release at about 60-70 wt% UTOg.
2 . 2 Experiments at Argonne
Fleming and Johnson also reported121 that the reactions in somespecimens were violent, with surface temperatures of over 2200°C observedby optical techniques. This prompted studies of a wider composition rangein experiments at Argonne National Laboratory (ANL) ,'9' Pellets werefabricated by cold-pressing UjOg powder (median particle size of 12 Jim)with aluminum powder to obtain specimens with 30, 45, 60, 75, and 90 wt%U30g. In one series of experiments, specimens of each composition wereheated in an induction heater at a rate of 25°C/minute in an argonatmosphere. The specimen temperature, as measured by an imbeddedthermocouple during the heating experiments, is shown in Fig. 2. Self-heating is especially apparent for the 60 and 75% wt% U30e specimens. Amaximum temperature of 1300°C, nearly 400°C above the maximum furnacetemperature, was observed for the 60 wt% U3Ug sample.
In a second series of heating experiments at ANL, the samples wereplaced in an induction heater which was preset to achieve an equilibriumtemperature of 1250°C as rapidly as possible. The graphite container inthis heater reached the desired temperature in less than one minute. Thesample temperatures during these more rapid heating experiments as shown inFig. 3. The curves for successively higher UaOg content are displaced byone minute intervals for clarity of presentation; the heating curve for aninert stainless steel sample is shown for comparison. Self-heating isagain observed, with maximum temperatures of 1450°C, 1500°C, and 1600°Cachieved with 45, 60, and 75 wt% U3O8 samples, respectively. Theexothermic reaction in the dispersions begins at about the melting point ofaluminum (660°C) , as shown by the change in slope of the curves in Fig. 3.
82
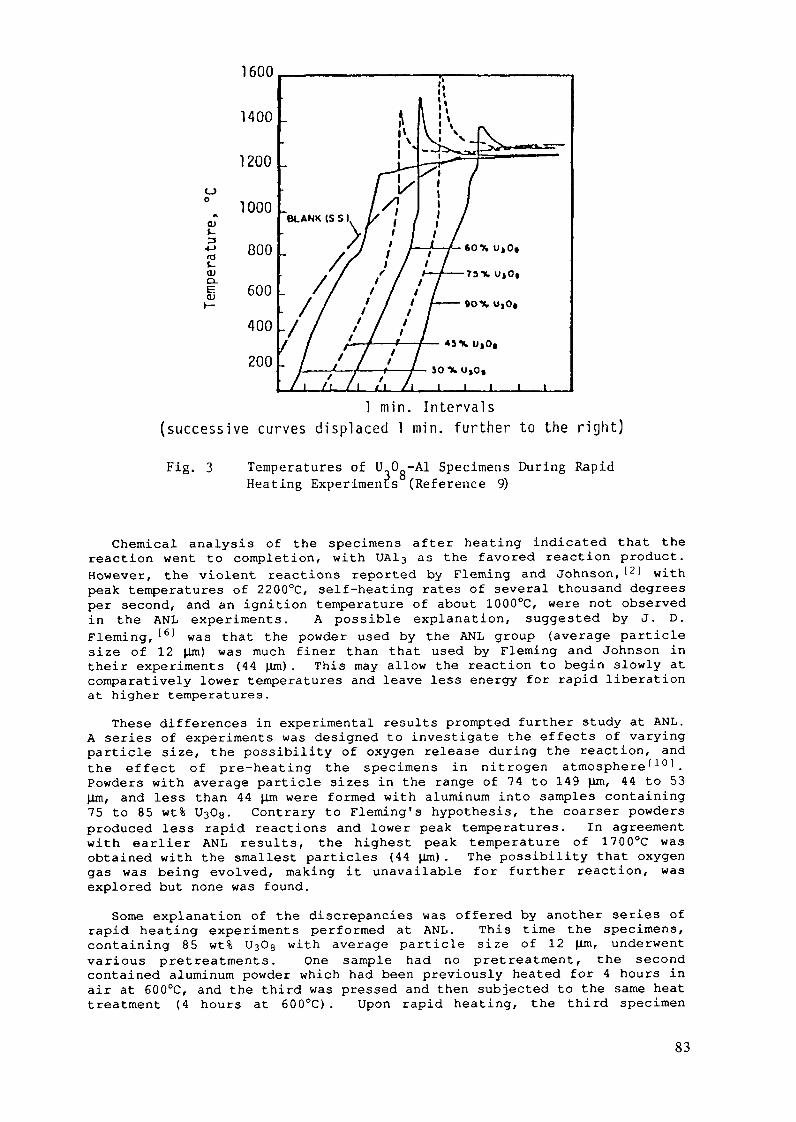
o«tO)
ro0)Q-EO)
1600
1400
1200
1000
800
600400200
BLANK IS 5)
l min. Intervals(successive curves displaced l min. further to the right)Fig. 3 Temperatures of U 0 -Al Specimens During Rapid
Heating Experiments (Reference 9)
Chemical analysis of the specimens after heating indicated that thereaction went to completion, with UA13 as the favored reaction product.However, the violent reactions reported by Fleming and Johnson, t2' withpeak temperatures of 2200°C, self-heating rates of several thousand degreesper second, and an ignition temperature of about 1000°C, were not observedin the ANL experiments. A possible explanation, suggested by J. D.Fleming,[6) was that the powder used by the ANL group (average particlesize of 12 Urn) was much finer than that used by Fleming and Johnson intheir experiments (44 (im). This may allow the reaction to begin slowly atcomparatively lower temperatures and leave less energy for rapid liberationat higher temperatures.
These differences in experimental results prompted further study at ANL.A series of experiments was designed to investigate the effects of varyingparticle size, the possibility of oxygen release during the reaction, andthe effect of pre-heating the specimens in nitrogen atmosphere'101.Powders with average particle sizes in the range of 74 to 149 (im, 44 to 53(im, and less than 44 urn were formed with aluminum into samples containing75 to 85 wt% UaOs- Contrary to Fleming's hypothesis, the coarser powdersproduced less rapid reactions and lower peak temperatures. In agreementwith earlier ANL results, the highest peak temperature of 1700°C wasobtained with the smallest particles (44 pm). The possibility that oxygengas was being evolved, making it unavailable for further reaction, wasexplored but none was found.
Some explanation of the discrepancies was offered by another series ofrapid heating experiments performed at ANL. This time the specimens,containing 85 wt% U308 with average particle size of 12 (im, underwentvarious pretreatments. One sample had no pretreatment, the secondcontained aluminum powder which had been previously heated for 4 hours inair at 600°C, and the third was pressed and then subjected to the same heattreatment (4 hours at 600°C). Upon rapid heating, the third specimen
83

1700
1500
1300rtf£_ 1100EtuOJf—Q-E
900
700
500
NO P R E T R f & T W E N T Of SAMPLE
SPECIMEN PflEVlOuSLT S I N T E R E D
Time After Insertion In Furnace, min.(Add l min. for 1000°C Furnace Traces)
Fig. 4 Temperatures of AO wt.% U 0 Samples DuringHeating Experiments (Reference 10)
exhibited a violent reaction with a temperature peak of approximately2200°C and a heating rate similar to the thousands of degrees per secondobserved by Fleming and Johnson. A fourth sample, containing only 75 wt%U30g, but sintered in the same fashion as the third specimen, alsoexhibited this rapid energy release, with a peak near 1900°C. Thus, thesintering of the sample, or some phenomenon induced by sintering, seems tobe the cause, at least in part, of the violent energy release. To checkthe ramifications of this conclusion on the conventional U3O8 dispersionfuels, specimens containing 40 wt% U3O8 were fabricated and half weresintered while the remainder were left untreated. Rapid heatingexperiments indicated an increase in reactivity in the sintered samples, asseen in Fig. 4. Also, the self-heating rates were only 100 to 200°C persecond, much lower than those observed by Fleming and Johnson.
2.3 Experiments at Oak Ridge
The potential use of highly loaded U30g-Al cermet fuel to achieveenrichment reduction, and the theoretical potential for large energyreleases from the exothermic reaction in such fuel prompted additionalexperiments at Oak Ridge National Laboratory.1111 Differential thermalanalysis was employed to determine the temperature of onset, and enthalpychanges during, the exothermic and other reactions. Also, X-raydiffraction was used to determine which reactions were occurring during theheating of U3Og-Al powder, and the mechanical properties of U3Og-Al fuelplates were observed as the plates were heated past the temperatures atwhich the exothermic reactions occur. Power mixtures and miniature fuelplates of loadings ranging from 50 to 79 wt% U30e were studied.
The Oak Ridge group reported that differential thermal analysisindicated that the U30g-Al mixture underwent an exothermic reaction between600°C and the melting point of aluminum. X-ray diffraction studies of thesamples loaded with 50 wt% U30g showed no reaction products (A12O3),
84

TIME ——
Fig. 5 Differential Thermal Analysis Results for U O -AI SampleLoaded at 79 wt.% U.OQ (Reference 11)J o
however, even after heating to 725°C. The diffraction technique wassufficiently sensitive to detect A12O3 if more than 10% of the mixture hadreacted, setting an upper limit on the degree of reaction attained up tothat temperature.
The melting of aluminum produced an endotherm at an onset temperature of654°C, while the exothermic reaction caused by an exotherm with an onsettemperature near 880°C. Two more exotherms were observed at temperaturesgreater than 1200°C. These features can be seen in Fig. 5, which presentsthe results for a cold-pressed mixture containing 79 wt% UsOe. The areasunder the peaks can be analyzed to provide the enthalpy changes of thereactions. This procedure is validated by the aluminum endothermcalculations, which yield results very close to the heat of melting, asshown in Table 3. The same procedure yields exothermic reaction heats forthe exotherm near 900°C of 445 ± 232 kJ/mole of U3O8 for fuel plate samplescontaining ~46 wt% UsOe and 171 ± 43 kJ/mole of V^Og for fuel plate samplescontaining ~35 wt% UßOe- No calibration was available for the higher-temperature exotherms. The Oak Ridge group speculated that this failure toeven approach completion of the exothermic reaction may be due to (1)reaction rate being inversely proportional to UjOg particle size; (2)Fleming and Johnson have overestimated the heats of reaction; (3) part ofthe exothermic reaction energy being released at higher temperatureexotherms around 1200°C; or (4) the reaction being diffusion controlled.The last possibility results from the likely reaction sequence of aluminumatoms diffusing through an A12Û3 crust before reaching and reacting withthe core material of a particle of 0303.
Since the heat evolved by the exothermic reaction was shown to berelatively small, its effect should be negligible compared to: (1) thesensible heat required to reach the aluminum melting point from operatingtemperatures; (2) the aluminum heat of melting; and (3) the sensible heatrequired to attain the exothermic reaction threshold at about 880°C.However, if another energy source, like decay heat, could bring the fueltemperature to the exothermic reaction threshold, reaction energysufficient to heat the material to the second reaction stage at about1200°C may be liberated. This hypothesis was tested by heating miniature
85
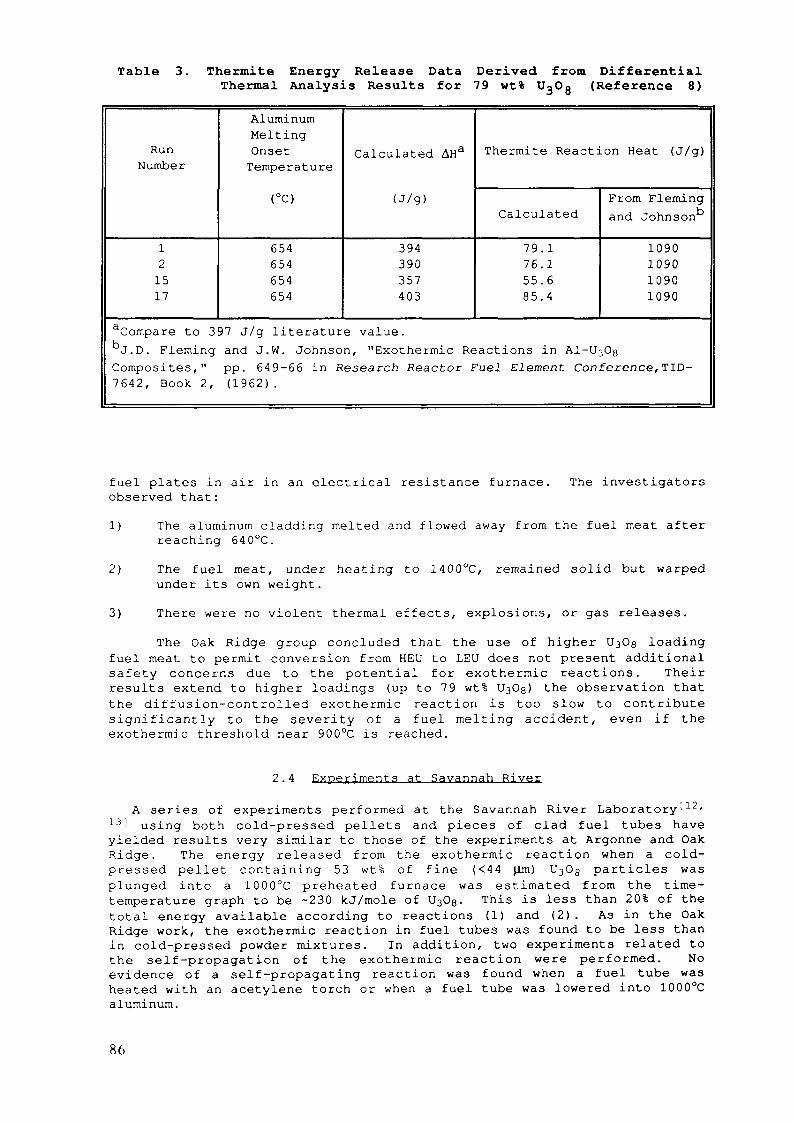
Table 3. Thermite Energy Release Data Derived from DifferentialThermal Analysis Results for 79 wt% UO (Reference 8)
RunNumber
121517
AluminumMeltingOnsetTemperature
<°C)
654654654654
Calculated AHa
(J/g)
394390357403
Thermite Reaction Heat (J/g)
Calculated
79.176.155.685.4
From Flemingand Johnson
1090109010901090
aCompare to 397 J/g literature value.J.D. Fleming and J.W. Johnson, "Exothermic Reactions in Al-U30g
Composites," pp. 649-66 in Research Reactor Fuel Element Conference, TID-7642, Book 2, (1962) .
fuel plates in air in an electrical resistance furnace.observed that:
The investigators
1) The aluminum cladding melted and flowed away from the fuel meat afterreaching 640°C.
2) The fuel meat, under heating to 1400°C, remained solid but warpedunder its own weight.
3) There were no violent thermal effects, explosions, or gas releases.
The Oak Ridge group concluded that the use of higher UaOg loadingfuel meat to permit conversion from HEU to LEU does not present additionalsafety concerns due to the potential for exothermic reactions. Theirresults extend to higher loadings (up to 79 wt% UsOg) the observation thatthe diffusion-controlled exothermic reaction is too slow to contributesignificantly to the severity of a fuel melting accident, even if theexothermic threshold near 900°C is reached.
2.4 Experiments at Savannah River
A series of experiments performed at the Savannah River Laboratory'12-13 ' using both cold-pressed pellets and pieces of clad fuel tubes haveyielded results very similar to those of the experiments at Argonne and OakRidge. The energy released from the exothermic reaction when a cold-pressed pellet containing 53 wt% of fine (<44 |im) ^Og particles wasplunged into a 1000°C preheated furnace was estimated from the time-temperature graph to be -230 kJ/mole of U308. This is less than 20% of thetotal energy available according to reactions (1) and (2). As in the OakRidge work, the exothermic reaction in fuel tubes was found to be less thanin cold-pressed powder mixtures. In addition, two experiments related tothe self-propagation of the exothermic reaction were performed. Noevidence of a self-propagating reaction was found when a fuel tube washeated with an acetylene torch or when a fuel tube was lowered into 1000°Caluminum.
86

An important discovery made at Savannah River provides at least apartial explanation of why the exothermic reaction in fabricated fuelplates is less energetic than in cold-pressed powder mixtures. They foundthat, during processing, a solid-state reaction converts UsOg to U,jOg:
U3O8 + 5/6 Al -> 3/4 U4Og + A1203 (3)
Approximately 50% of the 0303 was converted to l^Og during fuel tubefabrication. U<jOg also reacts with Al to form UO2 and A12U3, as follows:
U40g + 2/3 Al -» 4 U02 + 1/3 Al20a (4)
but the reaction only releases ~387 kJ/mole of U^Og. Therefore, theexothermic reaction (4) of the U4Og produced from one mole of UaOg releasesonly 290 kJ of energy compared to the 798 kJ produced had it reacteddirectly.
3. IMPLICATIONS FOR ADVANCED FUELS
Consideration of the exothermic reaction between l^Oe and aluminumindicate the following:
1) The reactor occurs in two stages: the reduction by aluminum ofto UO2 , followed by reaction of UO2 with aluminum to produceintermetallic compounds of the form UA1X . The first reactionproceeds slowly at temperatures around the melting of aluminum, butboth reactions may occur rapidly once the fuel temperature risesabove 850°C.
2. If the UsOg-aluminum mixture is heated at temperatures and for timestypical of fabrication of fuel plates, approximately 50% of the UaOgis converted to U/jOg. The exothermic reaction of U<jOg also occurs intwo stages, but releases significantly less energy than the directexothermic reaction of UaOg and aluminum.
3. Thermodynamically, the maximum energy available from the exothermicreaction of l^Og and aluminum is 1271 kJ/mole of U^Og (~81% of thevalue estimated by Fleming and Johnson using the data available atthat time) . The corresponding value of the maximum energy availablefrom the exothermic reaction of U,jOg and aluminum is 1017 kJ/mole ofUijOg. Since one mole of U^Og produces only 3/4 of a mole of U^Og, theU^Og-aluminum reaction releases an equivalent of 763 kJ/mole oforiginal
4. The reaction is diffusion-controlled and therefore cannot addsignificant, rapidly liberated thermal energy during a hightemperature transient.
5. The exothermic reaction is not a barrier to utilization of highlyloaded UaOg-Al dispersion fuel to reduce the uranium enrichment inresearch and test reactors.
REFERENCES
1. D. Stahl, "The Status and Development Potential of Plate-Type Fuelsfor Research and Test Reactors," ANL-79-11 (March 1979).
2. J. D. Fleming and J. W. Johnson, "Aluminum-UsOg ExothermicReactions," Nucleonics 21 (5), 84-87 (May 1963).
87

3. J. D. Fleming and J. W. Johnson, "Reactions in Al/l^Og Dispersions,",Trans, of the Amer. Nue. Society 6, 158-159 (1963) .
4. E. H. P. Cordfronke and R. J. M. Konings, eds . , Thermochemical Datafor Reactor Materials and Fission Products. North Holland PublishingCompany, Amsterdam (1990) .
5. G. V. Samsonov, ed., The Oxide Handbook 2nd Ed., Trans by R. K.Johnston, IFI/Plenum, New York, pp. 20-31 (1982) .
6. P. Chiotti and J. A. Kateley, "Thermodynamic Properties of Uranium-Aluminum Alloys, " J. Nucl. Mat. 32, pp. 135-145 (1969).
7. L. Baker and R. Liimatainen, "Chemical Reactions," Chapter 17 in T.J. Thompson and J. G. Beckerley, eds., The Technology of NuclearReactor Safety. Vol. 2, 495-497, The M.I.T. Press (1973).
8. C. B. Murphy and J. A. Hill, "Detection of Irradiation Effects byDifferential Thermal Analysis," Nucleonics 18 (2), 78-80 (February1960) .
9. L. Baker, et al., "Aluminum-U3O8 Thermite Reaction," in ANL/CENSemiannual Report for July/December 1963. ANL-6800, 390-402 (1964) .
10. L. Baker, and J. D. Bingle, "Aluminum-UsOg Thermite Reaction," inANL/CEN Semiannual Report for January /June 1964. ANL-6900, 298-303(1964) .
11. A. E. Pasto, et al., A Quantitative Differential Thermal AnalysisStudy of U^Oa-Al Thermite Reaction. ORNL-5659 (June 1980) .
12. H. B. Peacock, "Study of the UaOg-Al Thermite Reaction and Strengthof Reactor Fuel Tubes," Proc. of the International Meeting on ReducedEnrichment for Research and Test Reactorsr October 24-27, 1983fTokaif Japanf Japan Atomic Energy Research Institute Report, JAERI-M84-073 (May 1984) .
13. H.B. Peacock, "Properties of l^Oe-Aluminum Cermet Fuel," WestinghouseSavannah River Laboratory Report WSRC-RP-89-981 , Rev. 1, pp. 32-45(March 1990) .
Appendix 1-4.2
A DIFFERENTIAL THERMAL ANALYSIS STUDY OFUjSi-Al AND U3Si2-Al REACTIONS
R.F. DOMAGALA, T.C. WIENCEK, J.L. SNELGROVE,M.I. HOMA, R.R. HEINRICHRERTR Program,Argonne National Laboratory,Argonne, Illinois,United States of America
Abstract
As part of the Reduced Enrichment Research and TestReactor (RERTR) Program, high density uranium compounds arebeing evaluated as possible replacements for the fuels cur-rently in use. UoSi and U-jSi» powders dispersed in an Almatrix and roll bonded within 6061 Al alloy clad have per-formed well under irradiation in the ORR. A consideration ofthe heats of reaction between the suicides and the Alcomponents of a reactor fuel plate has now been addressed.
By following standard quantitative differential thermalanalysis (DTA) procedures, it has been demonstrated thatneither suicide shows any measurable heat of reaction untilthe solidus temperature of 6061 (582°C) is exceeded. On heat-ing, the exothermic reaction is quenched by the endothermicchange of state as the Al species melt. All detectable eventstake place in the temperature regime from ~580 to ~660°C.
The heats of reaction per gram of fuel ranged from 304 ±18 J for samples with 32 vol.% U^Si« in the fuel zone to486 ± 54 J for samples containing 45 vol.% UoSi in the fuel zone.
I. INTRODUCTION
The Argonne National Laboratory (ANL) is managing the U.S. ReducedEnrichment Research and Test Reactor (RERTR) program to developproliferation-resistant fuels. The main thrust of this effort is directedtoward a reduction of U enrichment of the uranium employed in the fuelalloys from >90% (currently employed) to <20% (typically 19.7 ± 0.2%). Asa consequence of this enrichment reduction, an increase in the total amount ofuranium contained in a fuel element is required. However, at the lower en-richment, the total U required in an element for the most advanced reactorsexceeds the amount that can be fabricated with present fuels and manufac-turing techniques. For plate-type elements, the present fuels includepowders of U^Og or "UA1 " (a U-A1 alloy at about the composition of UA1,,i.e., ~70 wt.% U) dispersed in a matrix of commercially pure Al powder androll bonded within a cladding of 6061 aluminum alloy. The plates so gener-ated, which might typically be ~3 in. (~76 mm) wide by ~26 in. (~660 mm)long and 0.050 to 0.060 in. (1.27 to 1.52 mm) thick, are assembled into afuel element for insertion into the reactor core.
89

In order to meet the requirements of the most demanding reactors, afuel alloy development effort was, and still is, an important aspect of theRERTR Program. The work in the Materials Science and Technology Division ofANL has focused on uranium suicides, U Si, U Si , and "U SiAl" (a ternaryalloy of U + 3.5 wt.% Si + 1.5 wt.% Al). The silicides have high densitiesand high uranium contents and are quite corrosion resistant in hot water —the normal coolant for these reactors.
A description of the fuel alloy development work with suicide powdersand "miniplates" is detailed in Ref. l; comparable information on work withlow-enrichment U 0 may be found in Ref. 2. As a result of irradiationexperience with fuel plates containing uranium silicides, the fuel alloysU Si and U„Si„ have emerged as contenders for satisfying the goals of theprogram; U SiAl has been abandoned as a fuel alloy powder for plate-typeelements.
Once the silicides were determined to have a significant potential forcommercial use, considerations beyond those of fabricability and stabilityin a normal irradiation environment had to be addressed. One such concernis the stability of the silicide-plus-aluminum mixture under off-normalconditions where the fuel element might be heated up to and beyond themelting point of Al. That is, what reactions might occur and what heatevolution might be expected to accompany such reactions? One report sug-gests that uranium silicides react rapidly with Al at MJ20°C.
The purpose of this study, then, was to determine by differentialthermal analysis (DTA) techniques the temperature regime and enthalpiesassociated with reactions that occur between the suicide fuel particlesand the aluminum matrix as well as the 6061 clad at elevated temperatures.A similar study has already been conducted for U 0 -type fuel plates.
J O
II. REACTIONS
In Al plus U Si or U Si dispersion fuels (in the absence of oxygen),three possible reaction products are UA1 , UA1 , and UA1 . At least threeconcurrent possibilities may be examined. First, the formation of free Sican be postulated, although it has never been observed to form. Second, theSi may form USi-. Third, the Si may substitute in the lattice of UA1 toform U(Al,Si)_. The third possibility is the one that has been documentedin phase equilibria studies by A. E. Dwight.
For a reaction between one mole of U.Si and a stoichiometric amount ofAl, at least six equations can be written and balanced for a complete reac-tion. These are recorded in Table I. In Eqs. (A) through (6) the forma-tion of USi„ in combination with UA1„, UAl., or UA1. is shown. This is aj 2. j Abookkeeping simplification since, as noted above, it has been demonstratedthat USi as a discrete phase is not formed, but U(Al,Si) is the product.
Table II summarizes a similar set of six equations for possiblereactions between U Si and Al. Completely analogous to the discussion ofU Si + Al reactions, trie most predictable event is the formation of UA1which dissolves Si to form U(Al,Si) , i.e., reaction (11).
All reactions are diffusion controlled, and in each case the reactionproducts are less dense than the reacting phases. This inevitably leads toa growth of the fuel zone volume and, consequently, the fuel plate.
90
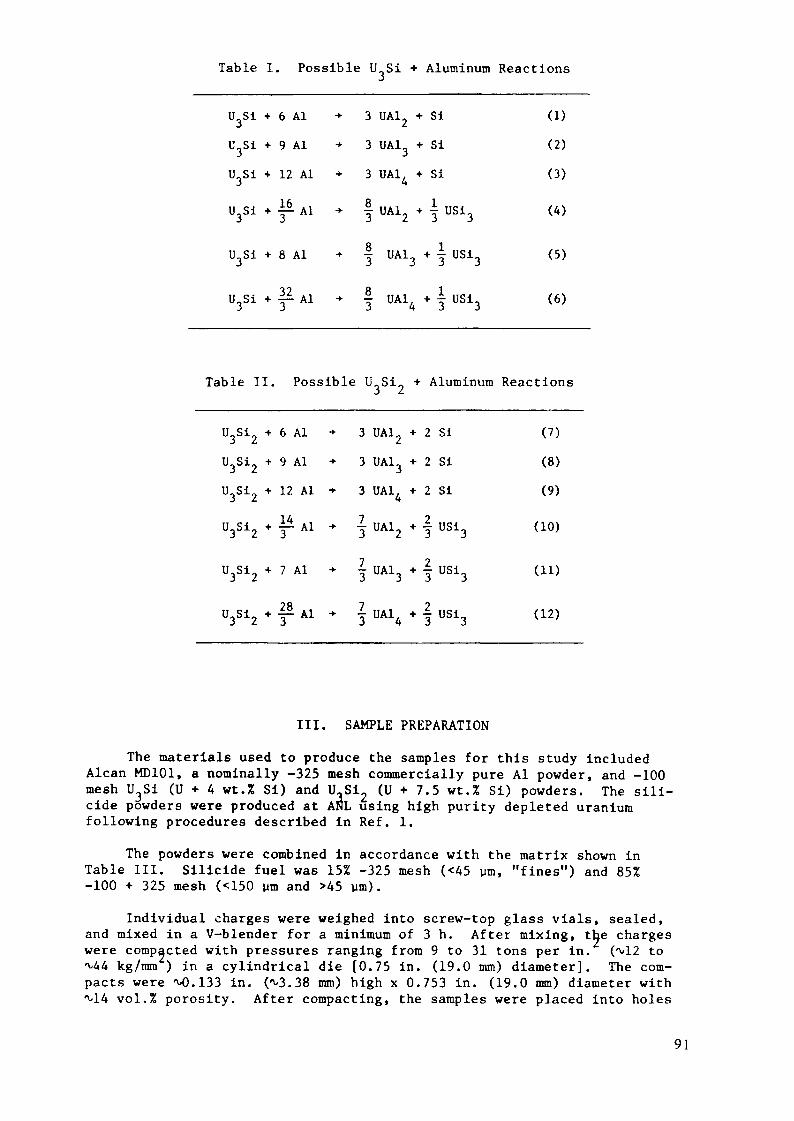
Table I. Possible U Si + Aluminum Reactions
u.u.
Si + 6 Al
Si * 9 Al
Si 4 12 Al
jSi + — Al
Si + 8 Al
Si + 21 Al -}Si + 3 Al
>• 3 UA1
•• 3 UA13»• 3 UA1.4
*• -r- UA1«
•• | UA1
- | UA1
+ Si+ Si
+ Si
13 + I US13
4 + I US13
(1)(2)
(3)
(4)
(5)
(6)
Table II. Possible tLSi„ + Aluminum Reactions
U3Si2 + 6 Al •»
U3Si2 + 9 Al -
U3Si2 t- 12 Al *
U3S±2 * "F A1 *
U3Si2 -t- 7 Al +
,3sl2 . a « ,
3 UA123 UA133 UA14
IUA12
IUA13
IUA14
+ 2 Si
•«- 2 Si
+ 2 Si
* I US13
+ 23 3
* ! USi3
(7)(8)(9)
(10)
(11)
(12)
III. SAMPLE PREPARATION
The materials used to produce the samples for this study includedAlcan MD101, a nominally -325 mesh commercially pure Al powder, and -100mesh U3Si (U + 4 wt.% Si) and U»Si2 (U + 7.5 wt.% Si) powders. The sui-cide powders were produced at ARL using high purity depleted uraniumfollowing procedures described in Ref. l.
The powders were combined in accordance with the matrix shown inTable III. Suicide fuel was 15% -325 mesh (<45 urn, "fines") and 85%-100 + 325 mesh (<150 urn and >45 ym).
Individual charges were weighed into screw-top glass vials, sealed,and mixed in a V-blender for a minimum of 3 h. After mixing, the chargeswere compacted with pressures ranging from 9 to 31 tons per in. ( 12 to44 kg/mm ) in a cylindrical die [0.75 in. (19.0 mm) diameter]. The com-pacts were M5.133 in. ( 3.38 mm) high x 0.753 in. (19.0 mm) diameter with
vol.% porosity. After compacting, the samples were placed into holes
91
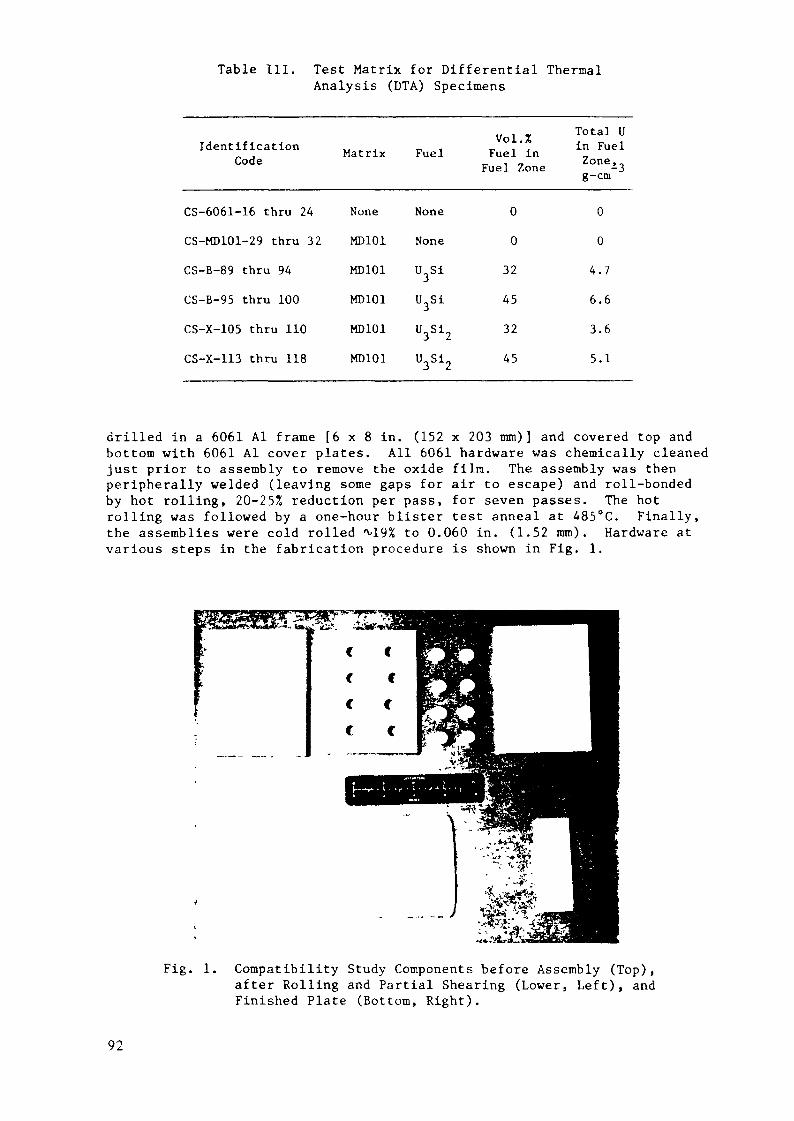
Table III. Test Matrix for Differential ThermalAnalysis (DTA) Specimens
IdentificationCode
CS-6061-16 thru 24
CS-MD101-29 thru 32
CS-B-89 thru 94
CS-B-95 thru 100
CS-X-105 thru 110
CS-X-113 thru 118
Matrix Fuel
None None
MD101 None
MD101 U Si
MD101 U3Si
MD101 U3S12
MD101 U3S12
Vol. ZFuel in
Fuel Zone
0
0
32
45
32
45
Total Uin FuelZone,g-cm
0
0
4.7
6.6
3.6
5.1
drilled in a 6061 Al frame [6x8 in. (152 x 203 mm)] and covered top andbottom with 6061 Al cover plates. All 6061 hardware was chemically cleanedjust prior to assembly to remove the oxide film. The assembly was thenperipherally welded (leaving some gaps for air to escape) and roll-bondedby hot rolling, 20-25% reduction per pass, for seven passes. The hotrolling was followed by a one-hour blister test anneal at 485°C. Finally,the assemblies were cold rolled 19% to 0.060 in. (1.52 mm). Hardware atvarious steps in the fabrication procedure is shown in Fig. 1.
Fig. 1. Compatibility Study Components before Assembly (Top),after Rolling and Partial Shearing (Lower, Left), andFinished Plate (Bottom, Right).
92

0.020_ 0.1632 _(4.14mm)
6061 ALUMINUM CLAD.020 FUEL + ALUMINUM MEAT 0.51mm 1.52mm
6061 ALUMINUM CLAD
0.020"
Fig. 2. Geometry of Samples Used for DTA Study.Dimensions are Nominal.
The finished plates have an elliptical fuel zone [MD.75 x 4.8 in.x 122 mm)]; the overall dimensions are 2 x6 in. ( 51 x 152 mm).
Fuel zone volumes, suicide concentration values, and porosities of thefuel zones were calculated from the known quantities, chemistries, anddensities of the components, and immersion densities measured in distilledwater for several plates in each category. Radiographie films of thesuicide plates were made to determine fuel location and homogeneity.Samples were manually punched out of uniform areas using a commerciallyavailable punch; the resulting sample geometry is illustrated in Fig. 2.As reference standards, similar discs were produced from plates whichcontained no "fuel." That is, samples were taken from plates wherein thefuel zone was 100% MD101 Al and from plates that were solid 6061 Al or pureAl. All samples, with or without fuel, were 0.060 in. (1.52 mm) thick.
IV. EQUIPMENT AND CALIBRATION
The system employed for this study was a Rigaku TG 2000 - a unit cap-able of being heated to 1500°C. Sample and reference pans were aluminumoxide and the atmosphere was high purity helium obtained by passing 99.999%pure helium through a six-foot ( 2 meters) length of 3/16 in. (4.8 mm)copper tubing filled with 60/80 mesh Chromatographie grade molecular sievematerial. The copper tubing was coiled and immersed in liquid nitrogen.
The thermo-gravimétrie analysis (TGA) section of the system, which wasnot used for this study, was joined to the DTA portion and terminated in a3/4 in. (14.0 mm) "T" at the back of the unit. One leg of the "T" was con-nected to a 1405 Sargent-Welch mechanical vacuum pump while the other legwent to a flow meter that could be isolated from the vacuum by a three-portstopcock. The system is illustrated schematically in Figs. 3 and 4.
93
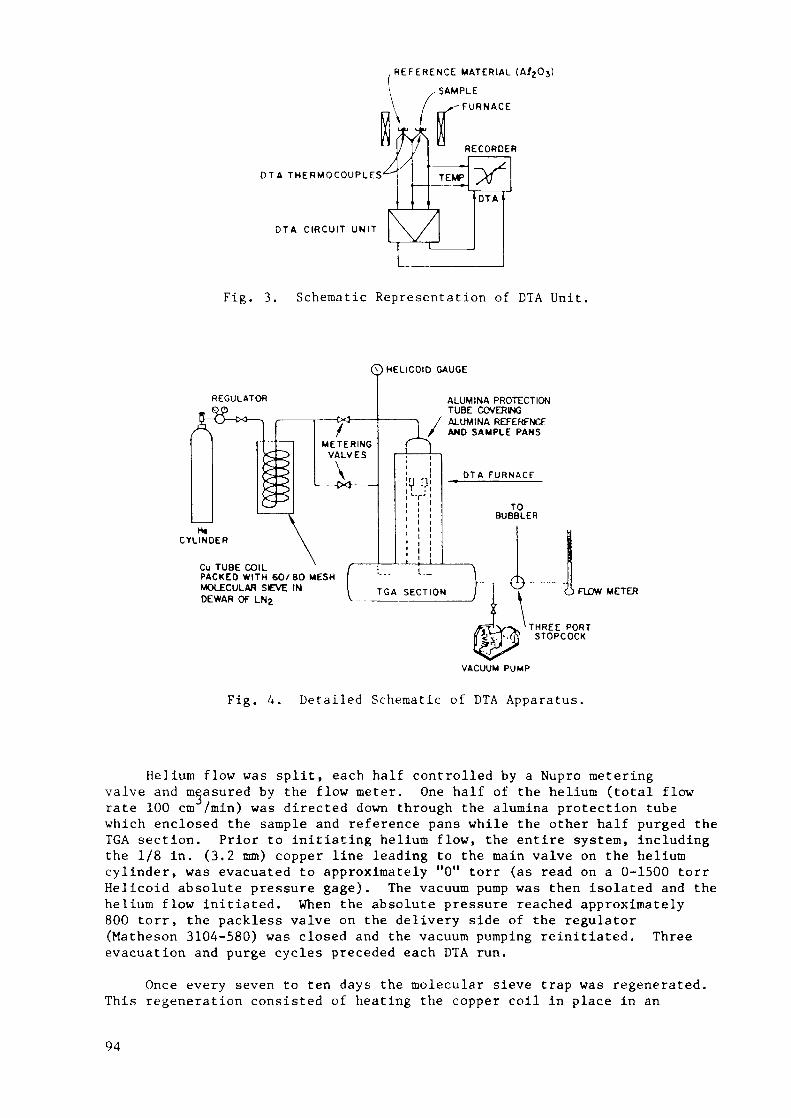
. R E F E R E N C E MATERIAL (A/2Oj)-SAMPLE
- F U R N A C E
O T A THERMOCOUPLES'
OTA CIRCUIT UNIT
Fig. 3. Schematic Representation of DTA Unit,
QHELICOID GAUGE
REGULATOR
———C~J
\CYLINDER
Cu TUBE COILPACKED WITH 60/80 MESHMOLECULAR SIEVE INOEWAR OF LN2
RING/ES
1 ———
1
Y«••
h
*f
r"
/ALUMAND
o:
ALUMINA PROTECTIONTUBE COVERINGALUMINA REFERENCE
DTA FURNACE
TOBUBBLER
TGA SECTION FLOW METER
THREE PORTSTOPCOCK
VACUUM PUMP
Fig. A. Detailed Schematic of DTA Apparatus.
Helium flow was split, each half controlled by a Nupro meteringvalve and measured by the flow meter. One half of the helium (total flowrate 100 cm /min) was directed down through the alumina protection tubewhich enclosed the sample and reference pans while the other half purged theTGA section. Prior to initiating helium flow, the entire system, includingthe 1/8 in. (3.2 mm) copper line leading to the main valve on the heliumcylinder, was evacuated to approximately "0" torr (as read on a 0-1500 torrHelicoid absolute pressure gage). The vacuum pump was then isolated and thehelium flow initiated. When the absolute pressure reached approximately800 torr, the packless valve on the delivery side of the regulator(Matheson 3104-580) was closed and the vacuum pumping reinitiated. Threeevacuation and purge cycles preceded each DTA run.
Once every seven to ten days the molecular sieve trap was regenerated.This regeneration consisted of heating the copper coil in place in an
94
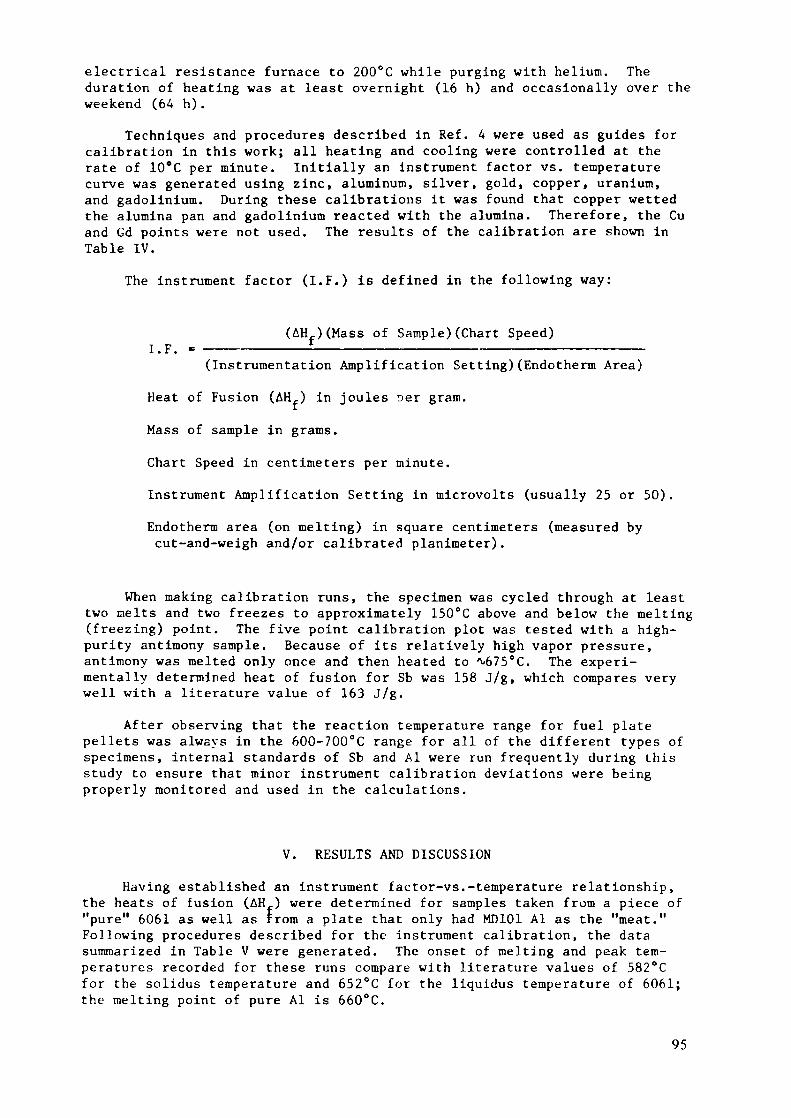
electrical resistance furnace to 200°C while purging with helium. Theduration of heating was at least overnight (16 h) and occasionally over theweekend (64 h).
Techniques and procedures described in Ref. 4 were used as guides forcalibration in this work; all heating and cooling were controlled at therate of 10°C per minute. Initially an instrument factor vs. temperaturecurve was generated using zinc, aluminum, silver, gold, copper, uranium,and gadolinium. During these calibrations it was found that copper wettedthe alumina pan and gadolinium reacted with the alumina. Therefore, the Cuand Gd points were not used. The results of the calibration are shown inTable IV.
The instrument factor (I.F.) is defined in the following way:
(AHf)(Mass of Sample)(Chart Speed)!.F. = ——————————i—————————————————————————————————(Instrumentation Amplification Setting)(Endotherm Area)
Heat of Fusion (AHf) in joules ner gram.
Mass of sample in grams.
Chart Speed in centimeters per minute.
Instrument Amplification Setting in microvolts (usually 25 or 50).
Endotherm area (on melting) in square centimeters (measured bycut-and-weigh and/or calibrated planimeter).
When making calibration runs, the specimen was cycled through at leasttwo melts and two freezes to approximately 150°C above and below the melting(freezing) point. The five point calibration plot was tested with a high-purity antimony sample. Because of its relatively high vapor pressure,antimony was melted only once and then heated to 675°C. The experi-mentally determined heat of fusion for Sb was 158 J/g, which compares verywell with a literature value of 163 J/g.
After observing that the reaction temperature range for fuel platepellets was always in the 600-700°C range for all of the different types ofspecimens, internal standards of Sb and Al were run frequently during thisstudy to ensure that minor instrument calibration deviations were beingproperly monitored and used in the calculations.
V. RESULTS AND DISCUSSION
Having established an instrument factor-vs.-temperature relationship,the heats of fusion (AHf) were determined for samples taken from a piece of"pure" 6061 as well as from a plate that only had MD101 Al as the "meat."Following procedures described for the instrument calibration, the datasummarized in Table V were generated. The onset of melting and peak tem-peratures recorded for these runs compare with literature values of 582°Cfor the solidus temperature and 652°C for the liquidus temperature of 6061;the melting point of pure Al is 660°C.
95
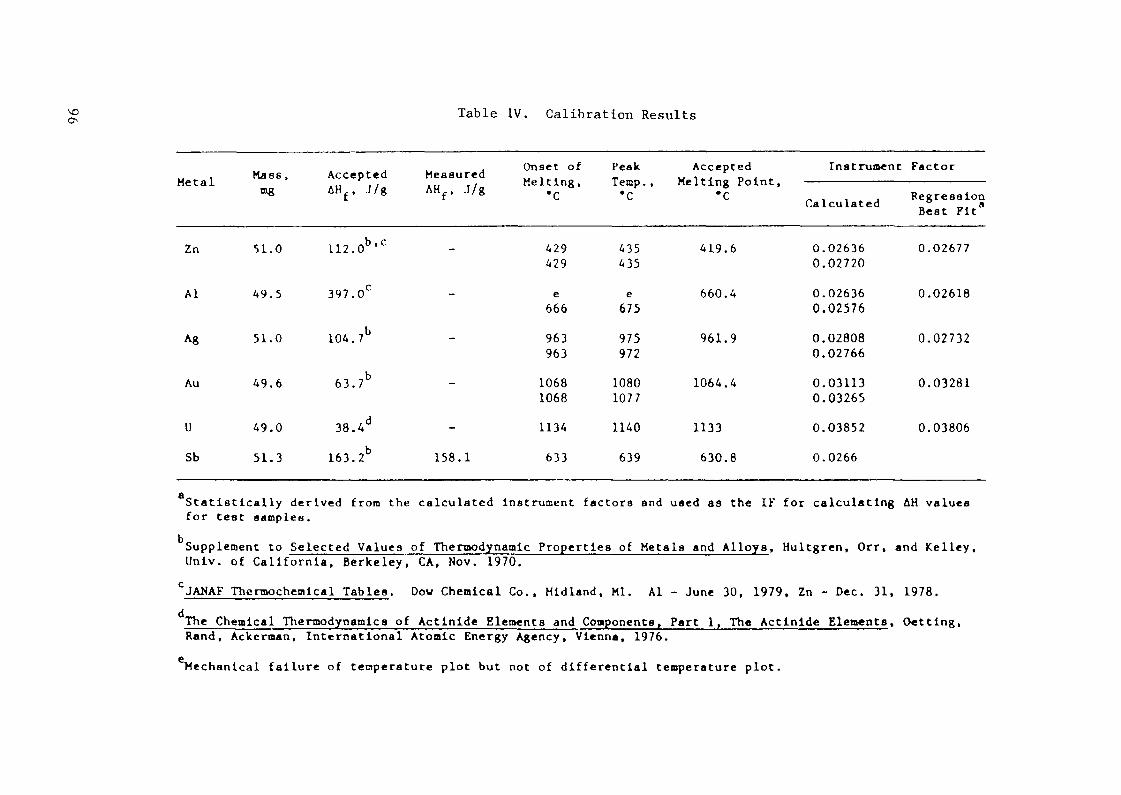
Table IV. Calibration Results
Metal Hass ,mg
Accepted MeasuredAHf. J/g AHf, J/g
Onset of Peak AcceptedTemp., Melting Point,•c *c
Instrument Factor
Calculated RegressionBest Fit"
Zn
Al
Au
U
Sb
51.0
49.5
51.0
49.6
49.0
51.3
112.0
397. 0
104. 7
63. 7
38. 4
163. 2
blC
158.1
429429
e666963963106810681134
633
435435e675975972108010771140639
419.6
660.4
961.9
1064.4
1133
630.8
0.026360.02720
0.026360.025760.028080.02766
0.031130.032650.038520.0266
0.02677
0.02618
0.02732
0.03281
0.03806
Statistically derived from the calculated instrument factors and used as the IF for calculating AH valuesfor teat samples.
Supplement to Selected Values of Therrnodynamic Properties of Metals and Alloys, Hultgren, Orr, and Kelley.Univ. of California, Berkeley, CA, Nov. 1970.JAHAF Thennochemical Tables. Dow Chemical Co., Midland, Ml. Al - June 30, 1979, Zn - Dec. 31, 1978.
The Chemical Thermodynamics of Actinide Elements and Components, Part 1, The Actinide Elements. Getting,Rand, Ackerman, International Atomic Energy Agency, Vienna, 1976.
Mechanical failure of temperature plot but not of differential temperature plot.
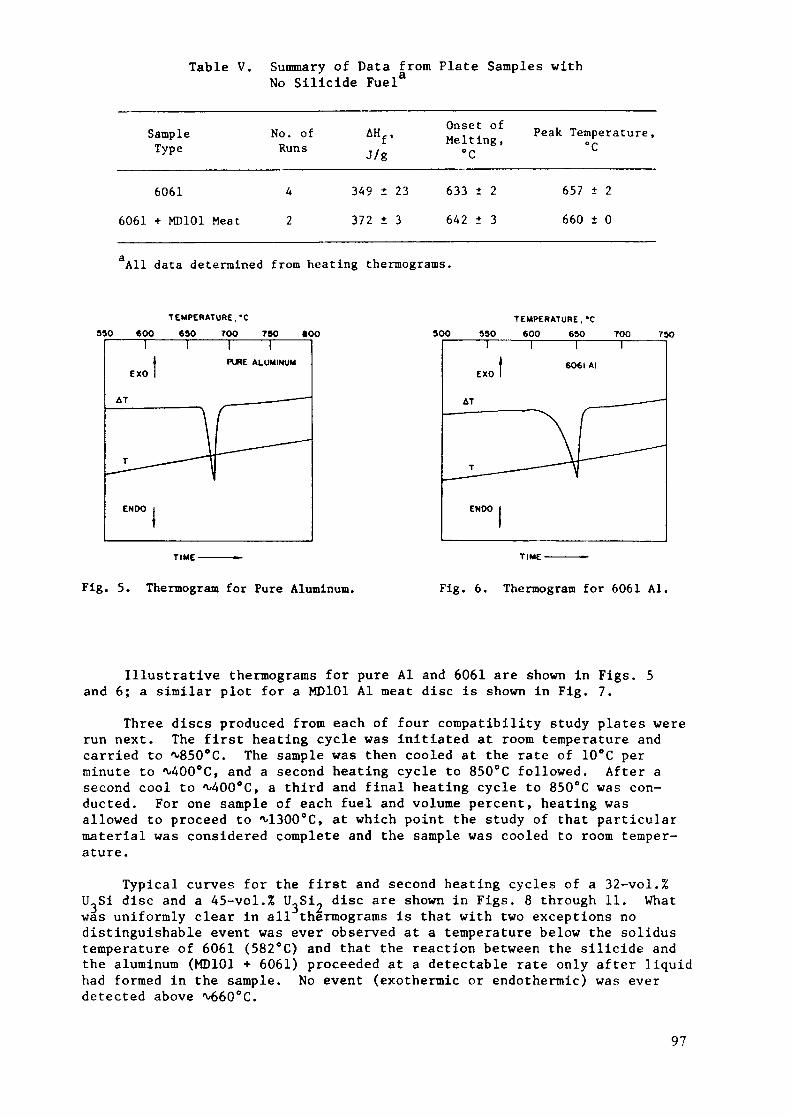
Table V. Summary of Data from Plate Samples withNo Suicide Fuel8
SampleType
6061
6061 «• MD101 Meat
No. ofRuns
4
2
AHf.J/g
349 ± 23372 ± 3
Onset ofMelting,
°C
633 ± 2642 ± 3
Peak Temperature,°C
657 ± 2
660 ± 0
All data determined from heating thermograms.
TEMPERATURE.-C
950 600 690 TOO 7 BO BOO 9OOTEMPERATURE. *C
350 600 65O 700 750I I
PURE ALUMINUMEXO
ENDO
EXO6O6I AI
ENOO
TIME- T I M E -
Fig. 5. Thermogram for Pure Aluminum. Fig. 6. Thennogram for 6061 Al.
Illustrative thermograms for pure Al and 6061 are shown in Figs. 5and 6; a similar plot for a MD101 Al meat disc is shown in Fig. 7.
Three discs produced from each of four compatibility study plates wererun next. The first heating cycle was initiated at room temperature andcarried to 850°C. The sample was then cooled at the rate of 10°C perminute to /v<400°C, and a second heating cycle to 850°C followed. After asecond cool to 400°C, a third and final heating cycle to 850°C was con-ducted. For one sample of each fuel and volume percent, heating wasallowed to proceed to <vl300°C, at which point the study of that particularmaterial was considered complete and the sample was cooled to room temper-ature.
Typical curves for the first and second heating cycles of a 32-vol.%U Si disc and a A5-vol.% U_Si? disc are shown in Figs. 8 through 11. Whatwas uniformly clear in all thermograms is that with two exceptions nodistinguishable event was ever observed at a temperature below the solidustemperature of 6061 (582°C) and that the reaction between the suicide andthe aluminum (MD101 + 6061) proceeded at a detectable rate only after liquidhad formed in the sample. No event (exothermic or endothermic) was everdetected above M>60°C.
97
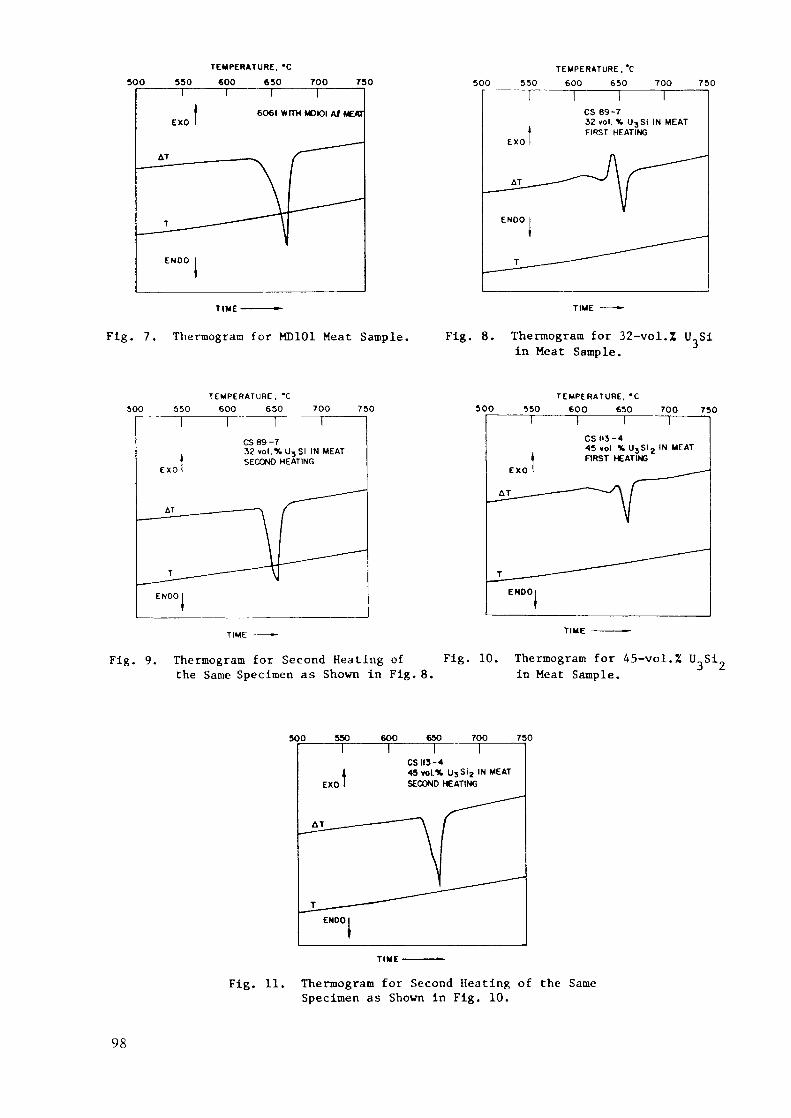
500 530TEMPERATURE, "C«00 630 700 730 5OO
TEMPERATURE. 'C
350 600 650 700
EXO6061 WrTHMOIOI A/MEAT
ENOO
EXO
AT
TIME-
750
CS 89-732vol. X U3Si IN MEATFIRST HEATING
TIME
Fig. 7. Thermogram for MD101 Meat Sample. Fig. 8. Thermogram for 32-vol.Z U,Siin Meat Sample.
soo 55OTEMPERATURE. *C
600 650 700 750T" T
CS 89-732 vol .%UjSI IN MEATSECOND HEATING
300TEMPERATURE. 'C
550 600 650
EXO
ENDOl
700 750
CSIIÎ-445 vol %U 3 SI 2 IN MEATFIRST HEATING
TIME
Fig. 9. Thermogram for Second Heating ofthe Same Specimen as Shown in Fig. 8,
Fig. 10. Thermogram for 45-vol.Z U Siin Meat Sample.
500 530~~
EXO
ENOO I
600~ ~
650 700 750
CSII3-445voL% USSI2 INMEATSECOND HEATING
TIME
Fig. 11. Thermogram for Second Heating of the SameSpecimen as Shown in Fig. 10.
98
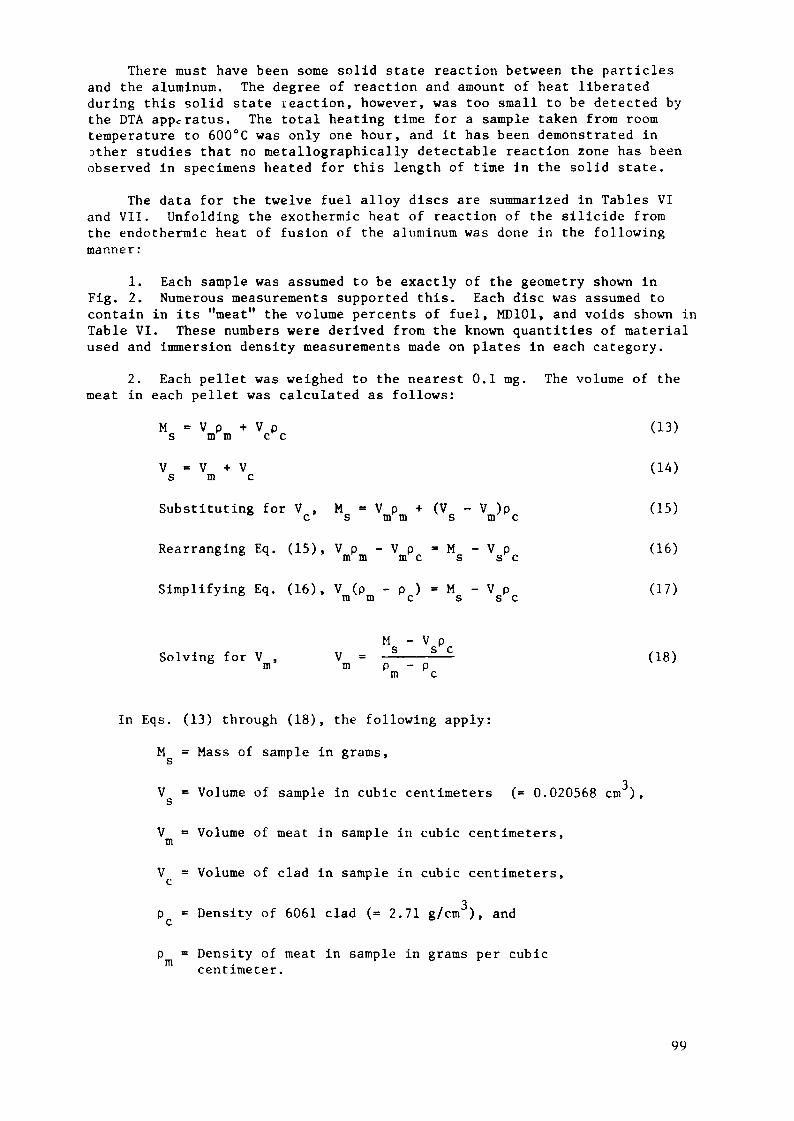
There must have been some solid state reaction between the particlesand the aluminum. The degree of reaction and amount of heat liberatedduring this solid state reaction, however, was too small to be detected bythe DTA appcratus. The total heating time for a sample taken from roomtemperature to 600°C was only one hour, and it has been demonstrated inDther studies that no metallographically detectable reaction zone has beenobserved in specimens heated for this length of time in the solid state.
The data for the twelve fuel alloy discs are summarized in Tables VIand VII. Unfolding the exothermic heat of reaction of the suicide fromthe endotherraic heat of fusion of the aluminum was done in the followingmanner:
1. Each sample was assumed to be exactly of the geometry shown inFig. 2. Numerous measurements supported this. Each disc was assumed tocontain in its "meat" the volume percents of fuel, MD101, and voids shown inTable VI. These numbers were derived from the known quantities of materialused and immersion density measurements made on plates in each category.
2. Each pellet was weighed to the nearest 0.1 mg. The volume of themeat in each pellet was calculated as follows:
M = V p + V p (13)s m m c e
V = V + V (14)s m c
Substituting for V , M = V p + (V - V )p (15)6 e s m m s m c
Rearranging Eq. (15), Vp -Vp -M -Vp (16)m m m e s s e
Simplifying Eq. (16), V (p - p ) = M -Vp (17)m m c s s e
M - V pSolving for V , V = —————— (18)m m p - pm c
In Eqs. (13) through (18), the following apply:
M = Mass of sample in grams,5
V = Volume of sample in cubic centimeters (= 0.020568 cm ),S
V = Volume of meat in sample in cubic centimeters,m
V = Volume of clad in sample in cubic centimeters,
p = Density of 6061 clad (= 2.71 g/cm ), and
p = Density of meat in sample in grams per cubiccentimeter.
99

oo
Table VI. Data on Fuel Containing Samples for DTA Study
SampleNo.
CS105-4-5-8
CS113-1-2-U
CS89-4-5-7
CS96-1-3-5
, Vol. ZType of . .i . Fuel inFuel .aHeat
U Si 32.0(3.6 gU/cni )
U Si 45.0(5.1 gU/cmJ)
U Si 32.0(4.7 gU/cni )
U Si 45.0(6.0 gU/cin )
„ i'*, Vol-Z M010* u"" i°fVoids in . H Sample,in HeatHeat ng
6.0 62.0 73.572.674.0
12.4 42.6 82.181.282.2
7.0 61.0 81.679.178.9
13.9 41.1 91.592.190.7
Mass ofFuel.
24.1622.9424.84
36.8335.5736.9733.1029.9029.6546.6847.4645.64
Mass ofHD101,ng
10.369.8410.657.727.457.74
11.2110.1310.047.577.707.40
Mass of6061 Clad,
ng
38.9839.8338.5137.5638.1837.4937.2939.0739.2137.2436.9337.66
CalculatedAH for
MD101 + 6061,J
17.7217.8117.6716.1716.2816.1617.4617.6617.6716.0015.9516.08
Parenthetical values are total U contained per unit volume of the fuel zone (• meat).

Table VII. DTA Data and Heats of Reaction for Fuelled Samples
SampleNo.
CS105-4-5-8
CS113-1-2-4
CS 89-4-5-7
CS 96-1-3-5
Calculated, „ „ AH, forFuel in H«at .
6061. J
32 vol.! U SI 17.7217.8117.67
45 vol.! U,Sl 16.173 Z 16.28
16.1632 vol.! U SI 17.46
J 17.6617.67
45 vol.! U SI 16.00J 15.95
16.08
OnsetTemper-atureFirstHeating.*C
595600585575590595560590580570605600
AH FirstHeating,
J
9.7511.107.785.695.314.533.544.072.04-0.77-2.12-0.66
FndotheralcAH. SecondHeating.
J
15.8414.4316.1713.2911.0811.2111.4711.1612.407.158.659.38
AH ThirdHeating.
J
15.9814.9116.04(a)(a)11.4111.9311.9612.877.479.129.94
AH (MD101 +606D-AH ,
J
7.976.719.8910.4810.9711.6313.9213.5915.6316.7718.0716.74
AH3-AH2, fAH*
(AH
0.140.48-_-0.200.460.800.470.320.470.56
Exotheralc(HD101 »
061) -AH ]+
3-AH2). J
8.117.199.8910.4810.9711.8314.3814.3916.1017.0918.5417.30
AN forReaction,J/g offuel
336313398285308320435481543366391379
Mean.J/goffuel
349
304
486
379
StapleStandardDeviation,
J/8
«.44
118
154
113
Third Belting cycle not run.
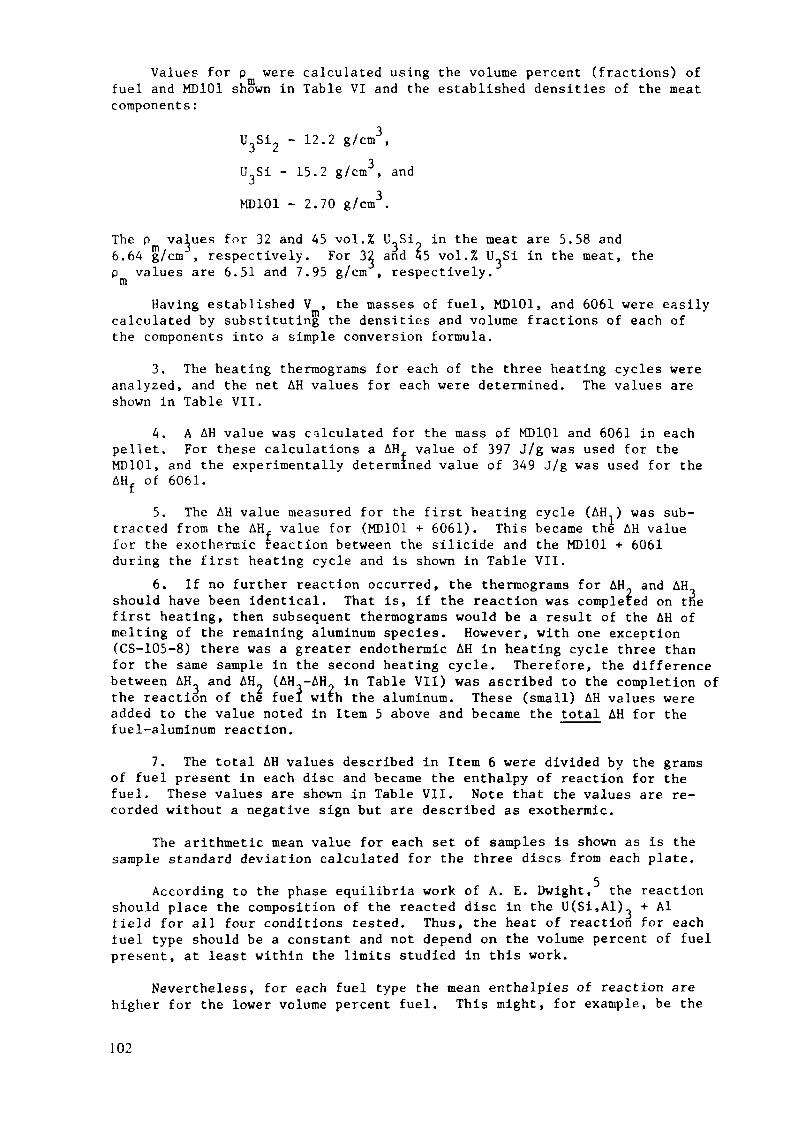
Values for p were calculated using the volume percent (fractions) offuel and MD101 shown in Table VI and the established densities of the meatcomponents :
U3Si2 - 12.2 g/cm3,U Si - 15.2 g/cm3, and
MD101 - 2.70 g/cm3.
The p values for 32 and 45 vol.% U^Si in the meat are 5.58 and6.64 g/cm , respectively. For 32 and 55 vol.% U_Si in the meat, thep values are 6.51 and 7.95 g/cm , respectively.m
Having established V , the masses of fuel, MD101, and 6061 were easilycalculated by substituting the densities and volume fractions of each ofthe components into a simple conversion formula.
3. The heating thermograms for each of the three heating cycles wereanalyzed, and the net AH values for each were determined. The values areshown in Table VII.
4. A AH value was calculated for the mass of MD101 and 6061 in eachpellet. For these calculations a AHf value of 397 J/g was used for theMD101, and the experimentally determined value of 349 J/g was used for theAHf of 6061.
5. The AH value measured for the first heating cycle (AH ) was sub-tracted from the AH value for (MD101 + 6061). This became the AH valuefor the exothermic reaction between the suicide and the MD101 + 6061during the first heating cycle and is shown in Table VII.
6. If no further reaction occurred, the thermograms for AH and AHshould have been identical. That is, if the reaction was completed on thefirst heating, then subsequent thermograms would be a result of the AH ofmelting of the remaining aluminum species. However, with one exception(CS-105-8) there was a greater endotheraic AH in heating cycle three thanfor the same sample in the second heating cycle. Therefore, the differencebetween AH and AH (AH -AH in Table VII) was ascribed to the completion ofthe reaction of the fuel with the aluminum. These (small) AH values wereadded to the value noted in Item 5 above and became the total AH for thefuel-aluminum reaction.
7. The total AH values described in Item 6 were divided by the gramsof fuel present in each disc and became the enthalpy of reaction for thefuel. These values are shown in Table VII. Note that the values are re-corded without a negative sign but are described as exothermic.
The arithmetic mean value for each set of samples is shown as is thesample standard deviation calculated for the three discs from each plate.
According to the phase equilibria work of A. E. Dwight, the reactionshould place the composition of the reacted disc in the U(Si,Al) + Alfield for all four conditions tested. Thus, the heat of reaction for eachfuel type should be a constant and not depend on the volume percent of fuelpresent, at least within the limits studied in this work.
Nevertheless, for each fuel type the mean enthalpies of reaction arehigher for the lower volume percent fuel. This might, for example, be the
102

result of a change in reaction kinetics as the fuel-to-aluminum ratio ischanged. If part of the reaction occurred at a very slow rate, DTA mightnot detect the heat released. If this was in fact the case, the true heatsof reaction would be somewhat larger than the measured values. Noanalytical modeling has been performed on which to base such an extrapola-tion.
The column in Table VII identified as "Onset Temperature FirstHeating, °C" requires some amplification. As stated in Sec. IV, the con-ventions for treating DTA thermograms described in Ref. 4 were used for allcalibrating pure metals as well as for 6061. The procedure requiresdrawing tangents to the AT line and the "V"-shaped curve resulting from theendothermic (on melting) AH of fusion. Because the melting of the 6061 andAl initiates and is superimposed on the reaction exotherm, it is verydifficult to define accurately an "onset of reaction" temperature. It wasnot unusual to have thermograms of the type shown in Fig. 8, where theonset of the reaction caused a very slight but detectable exotherm whichwas immediately quenched by the endotherm of melting of the aluminum com-ponents of the specimen. However, other thermograms displayed no initialexotherm; instead, the "onset temperature" was that for an endothermicevent. Therefore, the "Onset ..." temperatures recorded in Table VIIrepresent the first event on heating identified by the tangent-constructiontechnique and in effect identify the first departure from linearity for theAT plot.
It is clear that all detectable exothermic as well as endothermicevents take place in the 570° to <700°C temperature regime.
VI. SOURCES OF UNCERTAINTY
A number of assumptions and calculations were made in determining theneats of reaction. Each assumption is a potential source of error in thefinal value. For example, the description of each fuel zone as beingexactly of the volume percent of fuel and porosity indicated and beinguniformly of the geometry shown in Fig. 2 cannot be proven; it is, never-theless, a reasonable assumption.
Tests were run with pure Al samples at 5°C as well as 20°C per minuteheating and cooling rates. In some cases the instrument amplificationsetting was changed. None of these experimental runs resulted in datadifferent from those recorded in Table V. It is possible that the heats ofreaction could have been different from those recorded here if otherheating rates had been used for fueled samples. It is believed that ifdifferences do exist as a function of heating rate, such differences wouldbe small.
The variations in AH value from disc to disc for a given fuel andconcentration and for different concentrations of fuel in the meat might bea function of fuel particle size. There was no way to define the effect ofthis variable in this study.A. Instrumentation Calibration
As mentioned elsewhere in the text, the instrument calibration curvewas checked frequently during the data collection period using Sb and pureAl as reference points covering the major temperature range of interest(650-660°C) for these fuels. The uncertainty in the instrument constant didnot exceed ±2%.
103
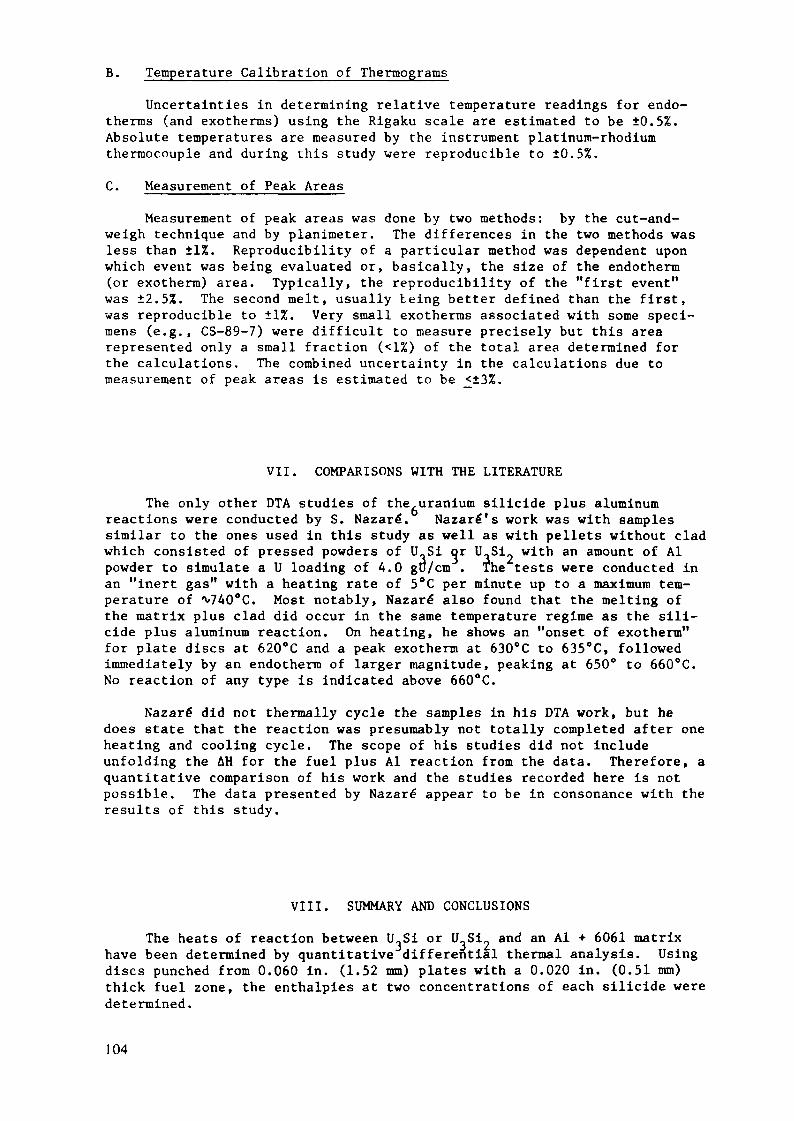
B. Temperature Calibration of Thermograms
Uncertainties in determining relative temperature readings for endo-therras (and exotherms) using the Rigaku scale are estimated to be ±0.5%.Absolute temperatures are measured by the instrument platinum-rhodiumthermocouple and during this study were reproducible to ±0.5%.
C. Measurement of Peak Areas
Measurement of peak areas was done by two methods: by the cut-and-weigh technique and by planimeter. The differences in the two methods wasless than ±1%. Reproducibility of a particular method was dependent uponwhich event was being evaluated or, basically, the size of the endotherm(or exotherm) area. Typically, the reproducibility of the "first event"was ±2.5%. The second melt, usually being better defined than the first,was reproducible to ±1%. Very small exotherms associated with some speci-mens (e.g., CS-89-7) were difficult to measure precisely but this arearepresented only a small fraction (<1%) of the total area determined forthe calculations. The combined uncertainty in the calculations due tomeasurement of peak areas is estimated to be £±3%.
VII. COMPARISONS WITH THE LITERATURE
The only other DTA studies of the uranium suicide plus aluminumreactions were conducted by S. Nazaré. Nazaré's work was with samplessimilar to the ones used in this study as well as with pellets without cladwhich consisted of pressed powders of U„Si or U.Si„ with an amount of Alpowder to simulate a U loading of 4.0 gu/cm . The tests were conducted inan "inert gas" with a heating rate of 5°C per minute up to a maximum tem-perature of (v-740°C. Most notably, Nazaré also found that the melting ofthe matrix plus clad did occur in the same temperature regime as the sui-cide plus aluminum reaction. On heating, he shows an "onset of exotherm"for plate discs at 620°C and a peak exotherm at 630°C to 635°C, followedimmediately by an endotherm of larger magnitude, peaking at 650° to 660°C.No reaction of any type is indicated above 660°C.
Nazaré did not thermally cycle the samples in his DTA work, but hedoes state that the reaction was presumably not totally completed after oneheating and cooling cycle. The scope of his studies did not includeunfolding the AH for the fuel plus Al reaction from the data. Therefore, aquantitative comparison of his work and the studies recorded here is notpossible. The data presented by Nazaré appear to be in consonance with theresults of this study.
VIII. SUMMARY AND CONCLUSIONS
The heats of reaction between U-Si or U_Si„ and an Al + 6061 matrixhave been determined by quantitative differential thermal analysis. Usingdiscs punched from 0.060 in. (1.52 mm) plates with a 0.020 in. (0.51 mm)thick fuel zone, the enthalpies at two concentrations of each silicide weredetermined.
104

The exothermic AH values unfolded from the experimental curves are:
Meat AH, J per gram of fuel
32 vol.% U Si 349 ± 4445 vol.% UJjSi^ 304 ± 1832 vol.% U Si 486 ± 5445 vol.% U^Si 379 ± 13
On heating, the U Si + Al as well as the U_Si~ + Al reactions areinitiated by the formation of some liquid. That is, no event was observedin the DTA plots until the solidus temperature of 6061 (582°C) was exceeded.In the temperature regime from 582°C to *\»660°C the endothermic melting of6061 and the MD101 Al is superimposed on the exothermic reaction betweenthe fuel and the aluminum species. The net effect for fuel loadings up to^5 gU/cm is always an endotherm. For samples at 45 vol.% U.Si in the fuelzone (M>.6 gU per cm ), the net effect for the first heating was a veryslight exotherm.
For all specimens tested, a very slight reaction between the fuelparticles and the aluminum occurred during a second heating cycle duringwhich the reaction is completed; subsequent heating cycles up to as high as1300°C demonstrated only the endothermic melting of the residual aluminumspecies.
The results of this study are in agreement with qualitative DTAstudies conducted by one other independent investigator.
ACKNOWLEDGMENTS
The work described in this paper could not have been successfullyaccomplished without the efforts of many individuals in ANL's MaterialsScience and Technology Division, the Analytical Chemistry Laboratory andthe Chemical Technology Division. Special thanks are due to D. R. Schmitt,J. A. Zic, F. J. Karasek, C. Steves, G. K. Johnson, and J. L. Settle fortheir contributions.
REFERENCES
1. R. F. Domagala, T. C. Wiencek, and H. R. Thresh, J-Si and J-Si-Al Dis-persion Fuel Alloy Development for Research and Test Reactors, Nucl.Tech. 62, 383 (1983).
2. G. L. Copeland and M. M. Martin, Development of High-Uranium-LoadedUs08-Al Fuel Plates, Nucl. Tech. _56, 547 (1982).
3. C. E. Weber, Progress on Dispersion Elements, in Progress in NuclearEnergy, Ser. V, 2, Pergamon Press, N.Y. (1959).
4. A. E. Pasto, G. L. Copeland, and M. M. Martin, A Quantitative Differ-ential Thermal Analysis Study of the U^Og-Al Thermite Reaction,Oak Ridge National Laboratory Report, ORNL-5659 (June 1980). Also,Ceramit Bulletin, 61, No. 4, 491 (1982).
105

5. A. E. Dwight, A Study of the Uraniwn-Aluminum-Silicon System, ArgonneNational Laboratory Report, ANL-82-14 (Sept. 1982).
6. S. Nazaré, Low Enrichment Fuels for Research and Test Reactors, J. Nucl.Mat., 124, 14 (1984).
106

Appendix 1-4.3
REACTION BEHAVIOUR OF UxSiy-AlAND U6Fe-Al DISPERSIONS
S. NAZARÉInstitut für Material- und Festkörperforschung,Kernforschungszentrum Karlsruhe GmbH,Karlsruhe, Federal Republic of Germany
Abstract
The paper describes the experiments carried out using differ-ential thermal analysis (DTA) to investigate the reactions in fuelplates with UaSi-, UaSi2~ and UeFe-Al dispersions up to and beyondclad melting. In all cases, exothermic reactions are observed at about630°C. In the case of the suicides,UA13 with silicon in solutionis the main reaction product; in the case of UeFe, UAli* is the mainreaction product. The enthalpies of reaction were determined aftercalibration with suitable standards. The values obtained reveal thelargest energy release in the case of the UeFe-Al dispersions. Re-actions in the U3Si2~Al system are less exothermic than in the
l system.
INTRODUCTION
It was well known at the outset, that the high U-density dispersants U3Si,and UeFe are thermodynamically unstable in conjunction with an Al-matrix.
Investigations were therefore initially focussed on the study of the compati-bility of these dispersants with the Al-matrix under equilibrium conditions/1-4/, as well as the consequences of the reactions for the dimensional stabi-lity of the fuel plates after prolonged heat treatment. Post irradiation exa-mination of the irradiated plates with the suicides revealed however, thatunder the test conditions only minor reaction zones (3-6 ym) between the par-ticles and the matrix occurred even at high burnup /5/. Apart from the irra-diation enhanced Al-diffusion, which particularly in the case of UaSi-Al dis-persions could be a cause of fission gas bubble nucleation /6/, the reactionbehaviour and the energy release involved is important from the safety view-point in the case of an overtemperature excursion under off normal conditions.
The objective of this paper is to describe and discuss the experimentscarried out to study the exothermic reactions between UaSi, UsSia andand aluminium.
EXPERIMENTAL
Differential thermal analysis (DTA) was used to investigate the reactionsquantitatively. The equipment was calibrated using metals with well known heatof fusion namely aluminium tin, lead, copper.
107
•20
/ 1/ 1
/500 'fXO fürt plot«10 Mg Um'3
111
futlptat*4.0 Mg Um"3
111
p»«it
111
fu«l plot*4.5Mg Um"3
Temperature (Tor
Fig. 1: Segments of DTA-thennograms of dispersion fuel plates.
The experiments were carried out with samples punched out of miniatureplates (particle size of the dispersant 63-90 ym) as well as with pellets ofpowder mixtures. The samples were heated in inert gas at a rate of 5 K/min upto 970 K; the heating and cooling runs being repeated up to 3 times.
U3Si2"Al dispersions
Fig.1 shows segments of DTA-thennograms of U3Si2~Al plate samples withU-densities in the meat of 3.0, 4.0 and 4.5 MgUm"3. It can be seen that inall cases during heating an exothermic reaction occurs at about 630°C. Thisreaction is in the vicinity of the endothermic melting of the excess aluminium.During the cooling cycle, an exothermic peak is observed which corresponds tothe solidification of the excess Al-matrix/cladding. Repetition of the heatingand cooling cycles does not show any additional changes except for the meltingand solidification of the aluminium. X-ray diffraction analysis of the samplesafter DTA showed U(Si,Al)s to be the main product of the reaction. Fig.2 showsthe microstructure of a typical sample of the fuel plate with a U-density of4.0 MgUm"3 in the meat. The microstructure reveals the reacted particles ofthe original UsSi2 as well as the excess Al. A quantitative analysis of thereaction enthalpy gave the following values: 191 kJ/kg dispersant for3.0 MgUm"3; 299 kJ/kg dispersant for 4.0 MgUm"3 and 285 kJ/kg dispersant for4.5 MgUnT3.
UsSi-Al dispersionsFig.3 shows segments of DTA thermograms of UaSi-Al plates samples with
U-densities in the meat of 3.0, 4.0 and 6.0 MgUm"3 in the meat. It can beseen again that in all cases a more pronounced exothermic reaction occurs againat about 630°C in the vicinity of the endothermic melting of the Al-matrixand cladding. During the cooling cycle an exothermic reaction which corres-ponds to the solidification of the excess Al-matrix and cladding is observed.Repetition of the heating and cooling cycles also did not reveal additionalchanges except for the melting and solidification of the aluminium. X-ray dif-fraction analysis of the samples after the DTA showed again that U(Si,Al)3 wasthe main product of the reaction. Fig.4 shows the microstructure of the fuel
108

20 ym
Fig. 2; Microstructure of UîSi2-Al fuel plate sample (4.0 Mg Um"3) after DTA
Temperature ( Tor AT)°C
Fig. 3: Segments of DTA thermograms of U3Si-Al dispersion fuel plates.
plates with 4.0 and 6.0 M g U m 3 in the meat. They reveal that the originalparticles of UsSi have reacted to form U(S i ,Al )3 . The remaining aluminium canalso be seen in the microstructure.
Quantitative evaluation of the reaction enthalpies gave the following re-sults: 348 kJ/kg dispersant for 3.0 MgJJrn"3; 289 kJ/kg dispersant for 4.0 Mg U m~ 3
and 304 kJ/kg dispersant for 6.0 M g U n T 3 .
UeFe-Al dispersions
Fig.5 shows segments of DTA thermograms of UgFe-Al fuel plates with U-densities of 4.0, 6.0 and 7.0 MgUm" 3 in the meat. It can be seen that in allcases an exothermic reaction is observed at about 630°C during the heating
109

Fig. 4; Microstructures of U3Si-Al fuel plates [4.0 MgUm"3 (a) and6.0 M g U n f 3 (b)] after DTA.
c£
01
730
Temperature (Tor uT)°C
Fig. 5; Segments of DTA-thermograms of U6Fe-Al dispersion fuel plates.
110

(a) 20 ym (b)
Fig. 6; Microstructures of UgFe-Al fuel plates [4.0 MgUm 3 (a) and7.0 MgUnf3 (b)] after DTA.
cycle. In this case, the enthalpy of reaction is large enough to mask the endo-thermic melting of the Al-matrix and cladding. Another significant feature ofthese therraograms is that during the heating cycle, endothermic peaks at about730°C which can be attributed to the melting of UAl^ can be seen. During thecooling cycle, an exothermic peak is observed that corresponds to the solidi-fication of the excess aluminium which was masked during the heating cycle.X-ray diffraction analysis of the samples after cooling showed that UAli» pro-ably with Fe in solution was the main product of the reaction.
The microstructures of the fuel plates with 4.0 and 7.0 Mg U m 3 are shownin Fig.6. They reveal that the original particles of UeFe have reacted formingUAli». The remaining parts of the Al-matrix are also visible in the microstruc-ture. Quantitative evaluation of the reaction enthalpies gave the following re-sults: 320 kJ/kg dispersant for 4.0 MgUm"3; 360 kJ/kg dispersant for
-36.0 MgUm and 445 kJ/kg dispersant for 7.0 MgUm
Additional experiments with powder mixtures
The experiments with fuel plates described thus far show that the mainreaction product in the case of the suicides is U(Si,Al)3 and in the case ofUeFe, UAli». Therefore additional DTA experiments were carried out using powdermixtures. In these cases the pellets were prepared from stoichiometric amountsof U3Si, U3Si2, U6Fe and Al required to form U(Si,Al)3 or UA14 (77.4 wt.-%U3Si, 80.2 wt.-% U3SÏ2 and 69.6 wt.-% U6Fe).In order to study the effect ofthe particle size, two powder fractions were used namely 63-90 ym and- 45 ym. The results are shown in Fig.7.
I l l

Ttn>p«rotui»ITor/J)«C
Fig. 7: Segments of DTA-thermograms of pellets of UaSi-, U6Fe-Al.
A comparison of these results with those of the fuel plates shows:
In all cases no endothennic melting of the Al can be seen. It can thusbe inferred that practically no excess aluminium remains after the re-action.In the case of the UaSi-Al dispersions, there is small increase in thepeak temperature when finer particles are used. It is hypotesised thatthe apparently unexpected effect could be related to the presence oflarger quantities of UsSia in the finer powder fraction of UsSi.In the case of the UsSia and UgFe powder mixtures additional exothermsare observed at lower temperatures (580°C for thSi; 550-575°C for UeFe)which probably can be attributed to the effect of size, distribution,aswell as surface morphology of the particles.Quantitative evaluation of the enthalpies of the reaction gave the follo-
wing results: 210 kJ/kg 1)3812 and 265 kJ/kg U3Si for the formation of U(Si,Al)3and 405 kJ/kg U6Fe for the formation of UAli«.
SUMMARY AND CONCLUSIONS
Differential thermal analysis, metallography and X-ray diffraction wereused to investigate the exothermic reactions in fuel plates and powder mixturesof UaSi-, UaSi2~ and UeFe-Al dispersions. The experiments revealed that:
On heating, UaSi2~Al fuel plates show an exothermic reaction at about630 C, followed by an endothennic melting of the unreacted aluminium.The reaction product is U(Si,Al)a.On heating, UsSi-Al fuel plates also show an exothermic reaction at about630 C, followed by an endothermic melting of the unreacted aluminium.The reaction product is again U(Si,Al)3.On heating, UeFe-Al fuel plates also show an exothermic reaction at about630°C. The reaction product is UAli», which shows an endothermic meltingpeak at 730°C.
112
Quantitative analysis of the areas encompassed by these exothenns wasused to estimate the enthalpy of reaction. The values obtained indicatethat the enthalpy of reaction per unit weight of dispersant is lowest inthe U3Si2-Al system and highest in the U6Fe-Al system. In addition, theexperiments reveal that the heat is released over varying time intervalswhich are largest in the case of UaSia'Al and smaller in the case ofU3Si- and U6Fe-Al.
REFERENCES
/!/ S. Nazaré, "Investigations of Uraniumsilicide-based Dispersion Fuels forUse of Low Enrichment Uranium (LEU) in Research and Test Reactors",Report of the Kernforschungszentrum Karlsruhe, KfK 3372B, 1982
/2/ S. Nazaré, "Low Enrichment Dispersion Fuels for Research and Test Reac-tors", Journal of Nuclear Materials, 124 (1984) 14-24
/3/ A.E. Dwight, Argonne National Laboratory, Report ANL-82-14 (1982)
/4/ S. Nazaré, Proc. of the Intern. Meeting on Research and Test ReactorCore Conversion from HEU to LEU Fuels, Argonne/Ill., CONF-821155,ANL-RERTR/TM4, p. 47
/5/ G.L. Hofmann, L.A. Neimark, R.F. Mattas, ibid, p. 88
/6/ G.L. Hofmann, L.A. Neimark, Proc. of the Intern. Meeting on Reduced En-richment for Research and Test Reactors, 1983, Tokai, Japan, JAERI-M-84-073
113
Appendix 1-4.4
DIFFERENTIAL THERMAL ANALYSIS ANDMETALLOGRAPHIC EXAMINATIONS OF U3Si2 POWDERAND U3Si2/Al (38 w/o) MINIPLATES
P. TOFT, A. JENSENAdvanced Engineering Division,Atlas-Danmark A/S,Denmark
Abstract
The paper describes the thermodynamic and metallurgicalbehavior of U"3Si2 powder and miniplates with regard tothe following aspects:
- increasing temperatures op to 1400 C- fuel plate stability- formation of ternery intermetallic compounds- growht of the formed ternery intermetalliccrystals at increasing temperatures.
The miniplate core is U„Si?/Al(38w/o) and the claddingis Al 6061.The study concludes, that fuel plates will not remainstable under accident conditions. A fuel element willmost likely melt down before a stable structure isestablished.The work is performed under contract with RIS0 NationalLaboratories, Denmark.
INTRODUCTION
The aim of the work is to examine the thermodynamic andmetallurgical behavior of 113812 powder and U3SÏ2/A1(38w/o) miniplates at increasing temperatures.The powder and miniplates were manufactured at ArgonneNational Laboratories, Chicago, USA.
EXPERIMENTS
DTA examinations (Differential thermal analysis)Samples of UsSi2 powder and of U3SÏ2/A1 (38w/o) mini-plates are heated and cooled at the same rate(20°C/min) in a DTA apparatus. The maximum heatingtemperature is 1400 C. The samples are heated in heliumor in air. Solidification/liquidation temperatures,oxidation and phasetransformations are registered on aplotter as endothermic and exothermic reactions.
115
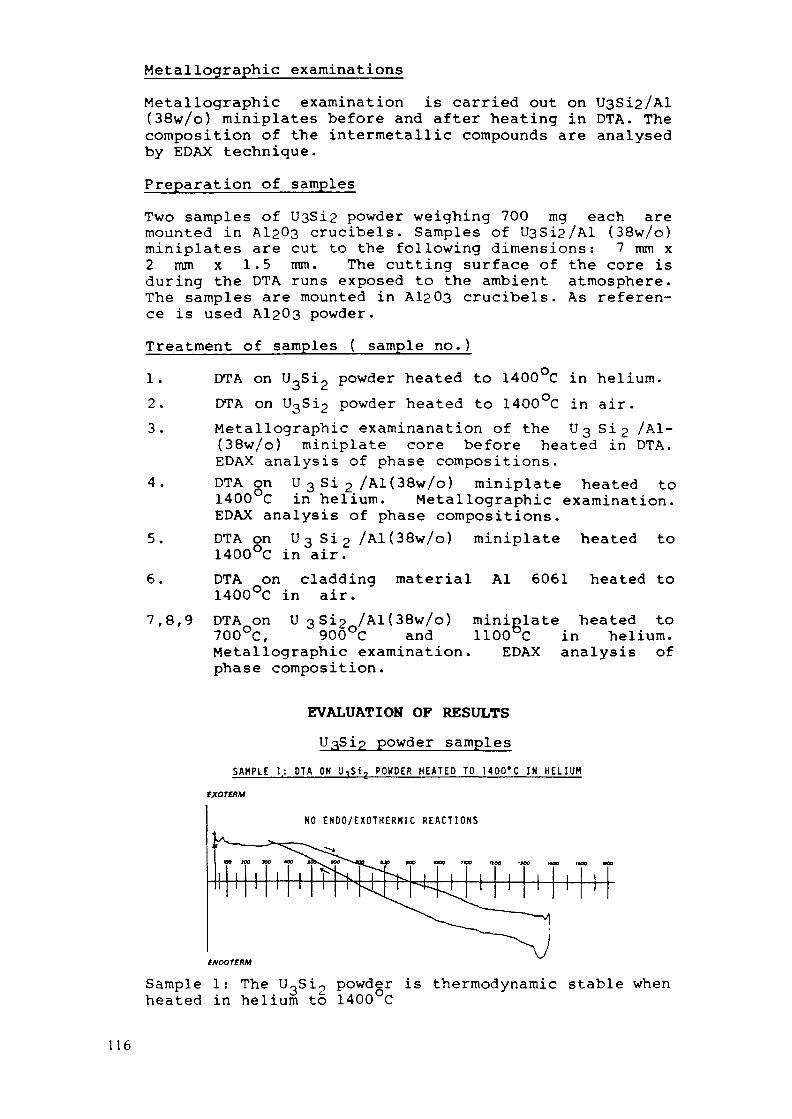
Metallographie examinationsMetallographie examination is carried out on U3SÎ2/A1(38w/o) miniplates before and after heating in DTA. Thecomposition of the intermetallic compounds are analysedby EDAX technique.Preparation of samplesTwo samples of U3Si2 powder weighing 700 mg each aremounted in A12Û3 crucibels. Samples of U3Si2/Al (38w/o)miniplates are cut to the following dimensions: 7 mm x2 mm x 1.5 mm. The cutting surface of the core isduring the DTA runs exposed to the ambient atmosphere.The samples are mounted in A12Û3 crucibels. As referen-ce is used A12Û3 powder.Treatment of samples ( sample no.)1.2.3.
4.
5.
6.
7,8,9
DTA on U3Si2 powder heated to 1400 C in helium.DTA on U3Si2 powder heated to 1400°C in air.Metallographie examinanation of the 13 Si 2 /Al-(38w/o) miniplate core before heated in DTA.EDAX analysis of phase compositions.DTA on U 3 Si 2 /Al(38w/o) miniplate heated to1400 C in helium. Metallographie examination.EDAX analysis of phase compositions.DTA on U 3 Si 2 /Al(38w/o) miniplate heated to1400°C in air.DTA on cladding material Al 6061 heated to1400°C in air.DTA on U3Si2 /Al(38w/o)700°C, 900°C and
miniplate heated to1100°C in helium.
Metallographie examination. EDAX analysis ofphase composition.
EVALUATION OF RESULTSU.gSip powder samples
SAMPLE 1.: DTA ON U,S1, POWDER HEATED TO 1400'C IN H E L I U MtxoratM
NO E N D O / E X O T H E R M I C R E A C T I O N S
CNDOrCKM
Sample 1: The U^Sij powder is thermodynamic stable whenheated in helium to 1400 C
116

SAMPLE 2: DTA ON U,S1, POWDER HEATED TO 1400'C IN AIR
1. OXIDATION OF U 3Si 2 POWDER
Sample 2: A powerfull exothermic reaction occurs in thetemperature range 150-950 C caused by oxidation of theU3si2 powder. The oxidation occurs mainly in to steps,at approx. 300°C and at approx. 630°C, both silicon anduranium oxides are probably formed.
U^5J2/A1(38 w/o) miniplate samples
Micrograph 1 (xlOO)Sample 3: The metallographic examination (micrograph 1)of the miniplate core before heating in DTA shows thatthe core material consists of 113 Si 2 (1) particlesembedded in a pure aluminium matrix(2). The EDAXanalysis gives the following composition: U3Si2 par-ticles: U 90.3 w/o (52.2 a/o), Si 7.3 w/o (35.6 a/o).Matrix material: 99% Al.
117

SAMPLE 4: DTA ON U7Si ,/A1 ( 3Bw/.) HIN1PLATE HEATED TO 1400'C IN HELIUM
exerça/* 2. 610'C 1. A L U M I N I U M S MELTING POINT2. A L U M I N I U M S S O L I D I F I C A T I O N POINT
Sample 4: The endothermic (1) reaction is due tomelting of both the cladding material and the matrixmaterial in the core. The exothermic (2) reaction showsthe solidification of the micro segreated aluminium.The metallographic examinination of the sample showsthat there is an reaction between U3Si2 and Al at orimmediately above aluminiums melting point. Theternery intermetallic compound which is formed hasaccording to EDAX analysis the following composition:U: 72.1 w/o (22.9 a/o), Si: 6.6 w/o (17.6 a/o), Al:21.3 w/o (59.5 a/o).
Micrograph 2, 1400°C (xlOO)
118
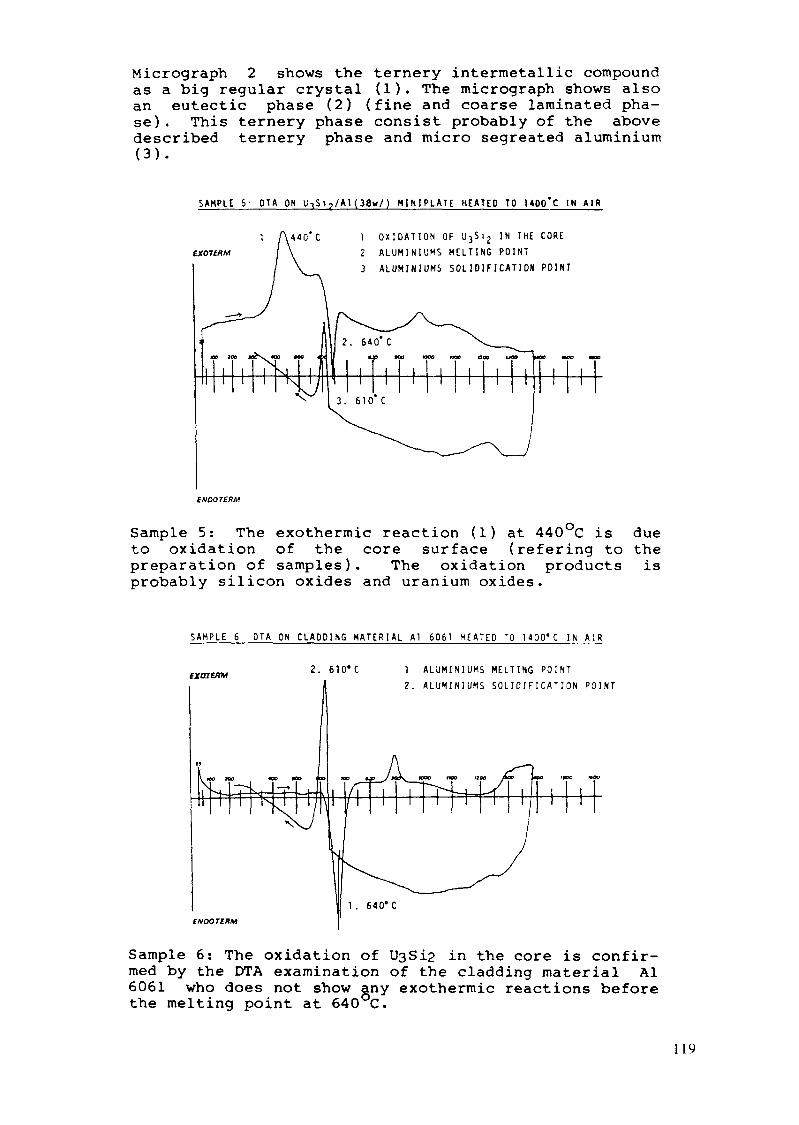
Micrograph 2 shows the ternary intermetallic compoundas a big regular crystal (1). The micrograph shows alsoan eutectic phase (2) (fine and coarse laminated pha-se). This ternery phase consist probably of the abovedescribed ternery phase and micro segreated aluminium(3).
SAMPLE 5- DTA ON UiSi ?/Al ( 38w/) H I M P L A T E H E A T E D TO HOO'C IN AIR
; 1 OXIDATION OF U 3Sl 2 IN THE COREA L U M I N I U M S MELTING POINTALUMINIUMS SOLIDIFICATION POINT
INOOTERM
Sample 5: The exothermic reaction (1) at 440 C is dueto oxidation of the core surface (refering to thepreparation of samples). The oxidation products isprobably silicon oxides and uranium oxides.
SAMPLE 6 DTA ON CLADDING MATERIAL Al 6061 HEATED *0 1400°C IN AIR
exaifmi 2. 610«C 1 A L U M I N I U M S MELTING POINT2. ALUMINIUMS SOLIDIFICA TION POINT
'«DO WOO
fNDOTERM
Sample 6: The oxidation of U3Si2 in the core is confir-med by the DTA examination of the cladding material Al6061 who does not show any exothermic reactions beforethe melting point at 640 C.
119
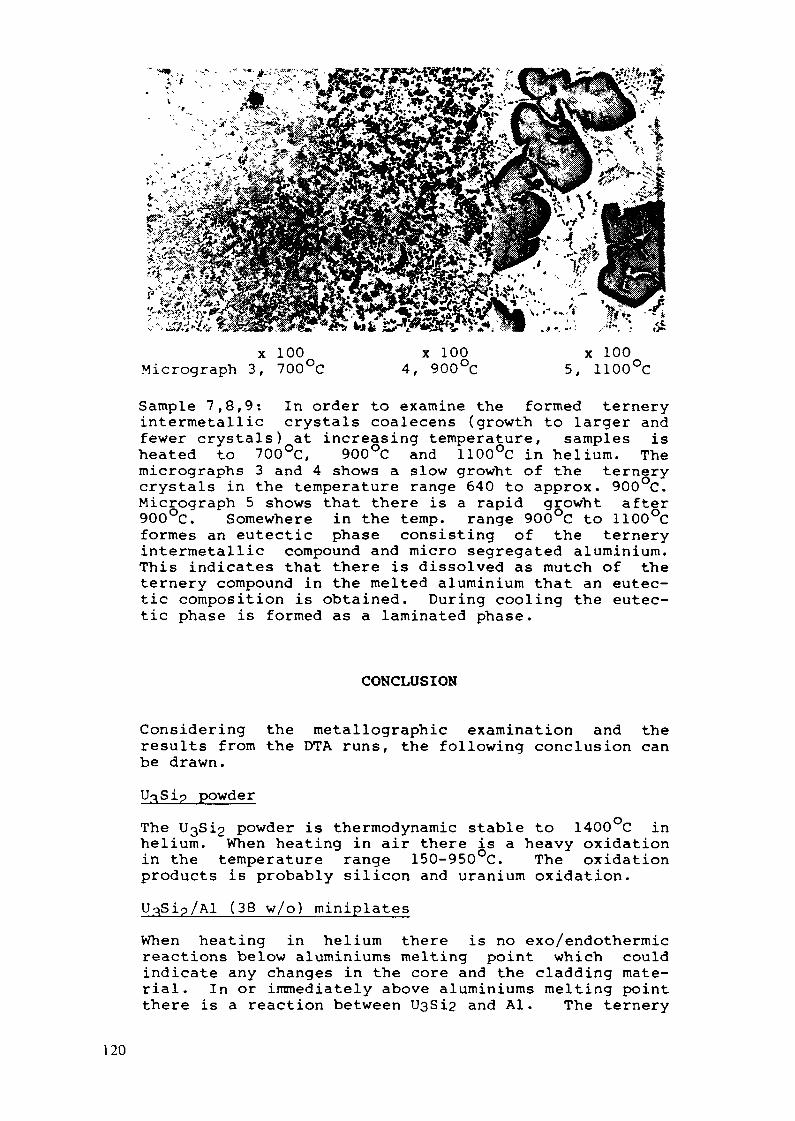
.->'*•-
x 100Micrograph 3, 700°C
x 1004, 900°C
x 1005, 1100°C
Sample 7,8,9: In order to examine the formed terneryintermetallic crystals coalecens (growth to larger andfewer crystals) at increasing temperature, samples isheated to 700°C, 900°C and 1100°C in helium. Themicrographs 3 and 4 shows a slow growht of the ternerycrystals in the temperature range 640 to approx. 900°C.Micrograph 5 shows that there is a rapid growht after
" Somewhere in the temp. range 900°C to 1100°C900°C.formes an eutectic phase consisting of the terneryintermetallic compound and micro segregated aluminium.This indicates that there is dissolved as mutch of theternery compound in the melted aluminium that an eutec-tic composition is obtained. During cooling the eutec-tic phase is formed as a laminated phase.
CONCLUSION
Considering the metallographic examination and theresults from the DTA runs, the following conclusion canbe drawn.
powderThe U3Si2 powder is thermodynamic stable to 1400 C inhelium. When heating in air there is a heavy oxidationin the temperature range 150-950°C. The oxidationproducts is probably silicon and uranium oxidation.
(38 w/o) miniplatesWhen heating in helium there is no exo/endothermicreactions below aluminiums melting point which couldindicate any changes in the core and the cladding mate-rial. In or immediately above aluminiums melting pointthere is a reaction between UsSi2 and Al. The ternery
120

intermetallic compound which is formed has according toEDAX analysis the following composition: U: 72.1 w/o22.9 a/o) Si: 6.6 w/o (17.6 a/o), Al: 21.3 w/o (59.5 -a/o). All the U Si in the core is transformed to theternery intermetallic compound at this temperature(approx. 640 C). The stoecheometric composition onceformed is fixed at increasing temperature. The terneryintermetallic phase is in the temperature range 640 Cto approx. 900°C homogenious distributed in the form ofcrystals embedded in an aluminium matrix.This concludes that the miniplate will not remainstable after aluminiums melting point. After 640°Cthere is a coalecens (growht to larger and fewercrystals) of the ternery crystals at increasingtemperatures. During heating and during the growthprocess the crystals have a tendency to move towardsthe surface of the sample. This will result in an in-homogenious distribution of ternery crystals in thealuminium matrix.At temperatures above 900°C an eutectic phase is formedin the aluminium matrix. In order exactly to measurethe ternery intermetallic composition,and when and howthe eutectic phase is formed, further examinations isrequired. When heating in air there is a nonreversible exothermic reaction at approx. 440°C. Thisreaction is due to oxidation of the USi core surface.
ACKNOWLEDGMENTS
The authors are indebted to RIS0 Metallurgical Depart-ment for the accès to and the use of the departmentsequipment. Special thanks to Ole Olsen for preparingand photographing the metallographic specimens and toKjeld Larsen for assistance with the differential ther-mal analysis. The assistance of Jan Borring in prepa-ring the paper is gratefully acknowledge.
121

Appendix 1-5STRUCTURAL STABILITY
Appendix 1-5.1
STRUCTURAL STABILITY OF PLATE-TYPE FUEL ELEMENTSUSED IN US RESEARCH AND TEST REACTORS
ARGONNE NATIONAL LABORATORYRERTR Program,Argonne, Illinois,United States of America
Abstract
Information is presented on the methods that have been used todesign fuel elements for several research and test reactors inthe U.S. The emphasis is on the methods of analysis and thetests used to ensure stability of the fuel elements under normaloperating conditions of full flow and design power.
1, INTRODUCTION
The aluminum based fuel element of curved-plate design was a productof an Oak Ridge National Laboratory (ORNL) development program. These typeelements were first utilized in 1950 to power the Bulk Shielding Reactor, alight water-cooled, moderated and reflected 1 MW pool-type reactor. Theelements were next used in the Materials Testing Reactor (MTR), one of thefirst of the forced-circulation high power density testing and researchreactors Subsequent high power density tank-type reactor designs have usedmodified versions of the MTR-type element. Examples of some of these varia-tions are the curved-plate serpentine elements used in the ATR, the flat-plateassemblies used in the ETR, the involute-type fuel design of the HFIR, and theconcentric circular elements that were used in the CP-5 reactor. These arethe exception, however, and the majority of the pool-type reactors in use inuniversities and research establishments around the world use plate-typeelements similar to the MTR design.
Because of the differences in application, pool-type and tank-typeresearch reactor fuel elements have some design differences. With pool-typeelements in low power reactors the limiting condition normally is corrosion ofaluminum. The most significant effect observed during examination of irra-diated pool elements has been pitting and corrosion of the aluminum. Thiscondition is attributed mainly to improper water quality control. With properpH control, corrosion can be held in check
The limiting factors in tank-type reactor fuel elements in highpower reactors are reactivity lifetime and burn-up rate of the fissile U-235Because of the high power densities, the lifetime of these fuel elementstypically is from 3 to 6 weeks; therefore, there has been a trend towardincreasing the loading of fissile material to increase fuel lifetime. Incontrast to pool reactors, mechanical strength of the fuel element is also an
123
important factor. At the required high water velocities (typically ~>10m/sec),pressure differentials often develop across the plates which can causepermanent deformation. In order to increase the strength of fuel elements forapplication in high power density reactors, the original relatively soft 1100aluminum alloy used in MTR-type assemblies has been replaced by much strongeraluminum alloys such as 6061. In addition, some of the early fabricationmethods such as brazing and pinning of the fuel plates to the side plates haslargely been supplanted by a roll swaging technique which has been found togive a superior finished element. Swaged joints also allow some slippagebetween the hot fuel plates and cooler fuel element side plates, therebyreducing thermal stresses in operation.
2. EXPERIENCE WITH FUEL FAILURES DURING REACTOR OPERATION
Failures of fuel plates in pool-type and tank-type research re-actors, resulting in a release of fission products, have been relativelyrare. The failures that have occurred in the U.S. fall into the followingmajor categories:
1. Failure of cladding due to corrosion and/or pinhole manufacturingdefects.
2. Fabrication deficiencies such as non-homogeneousfuel distribution, improper assembly of fuel plates to the sideplates, defective brazing, etc.
3. Cooling starvation because of coolant channel blockage by foreignmaterials in reactor cooling system.
4. Thermal stresses and/or hydraulic pressure forces on fuel platesproducing buckling.
Most of the reported instances of failures accompanied by fission productrelease fall in the first three categories, with blockage of coolant channelsby foreign materials and fabrication deficiencies being predominate in themore serious incidents with high power density reactors, j3»1*
The one reported instance of buckling failure of fuel plates due tostresses caused during operation by hydraulic pressure differentials andthermal gradients occurred in the MTR in 1954. For two years from reactorstartup in 1952 to July of 1954, all the MTR fuel elements functioned asintended. Immediately prior to a fuel plate buckling failure in 1954, anumber of changes were made to the original MTR fuel assembly design.These were:
1. The thickness of the fuel plates was reduced from 1.52 to 1.27mm.
2. The thickness of the fuel side plates was reduced from 4.75 to2.69mm.
3. The number of fuel plates was increased from 18 to 19.4. The fuel element fissile content was increased from 140 to
200 grams per assembly.5. The opening in the lower fuel end box casting was decreased from
2400 to 2000 mm2.
124

There were two effects of these changes:
1. The element was weakened by thinning the fuel and side plates.2. The water pressure within the element was raised in comparison with
the pressure outside as a result of restricting the flow of water through thelower end box. This change had the effect of increasing the lateral pressuredifferential across the outside concave plates from about 7 to 70 kPa.Furthermore, the thinning of the plates, as shown by subsequent tests, reducedthe resistance to outward buckling from a capability to withstand about 160kPa outward buckling from a capability to withstand about 169kPa differentialto a value of only 60kPa.
The problem was corrected by taking the following remedial action:
1. The two outside fuel plates in the fuel element were increased inthickness from 1.27 to 1.65 mm.
2. The side plate thickness was increased from 2.69 to 3.00 mm.
3. The cross sectional area of the water exit channel in the lowerbox was restored to the original 2400 mm .
These changes reduced the lateral pressure differences to less than34kPa and increased the resistance to buckling from about 60 to 160 kPa.There was no evidence that irradiation damage and accompanying changes inmechanical properties of the cladding and fuel alloy meat were responsible forthe failure.
This early experience with the MTR is probably one reason why similarproblems have not occurred in other high power density research and testreactors. Table 1 lists information on temperatures, flow velocities, andpressure drops for the five reactors currently operating in the U.S. whichoperate at power levels greater than 10 Mw and heat fluxes in excess of 150W/cm2. it is primarily this group of reactors, all having average flowvelocities in excess of 9 m/s, where problems with fuel element structuralstability due to thermal and hydraulic pressure stresses could be encountered.As shown, the ORR and the HFBR operate at conditions similar to the MTR anduse a similar fuel element. Therefore, the extensive experience with MTRfuel elements under similar conditions has been adequate to assure satis-factory performance of the fuel elements for these reactors.
In going to the different fuel configurations, higher flow rates andconsiderably higher core pressure drops encountered in the ETR, ATR, and HFIR,MTR experience is no longer directly applicable, since the higher heat fluxesmean higher temperature differences and larger thermal stresses. Also,differences in channel thickness or configuration, which would not causeproblems at lower flow rates and pressure drops, become significant and cancause problems at flow velocities in excess of 15 m/s and total core pres-sure drops greater than 0.7 mPa. Therefore, in order to assure performance ofthe fuel elements for these reactors, some stress analyses were usuallyperformed for the fuel plates operating under the most severe conditions. Thegreatest reliance in proving the performance of these fuel elements prior touse in the reactor, however, was placed on an extensive series of flow andheating tests. The following sections describe some of the analytic and testprocedures used in qualifying the ATR and ETR fuel elements.
125

Table 1. Fuel Operating Conditions in U.S. High Power Research and Test Reactor«
Advanced Test EngineeringReactor Test Reactor
Power Level (MW)Average Power
Per Assembly (kW)Maximum Power
Per Assembly (kw)Maximum Fuel PlateSurface Temperature (*C)Coolant Inlet
Temperature (*C)Coolant Exit
Tempe ra ture ( *C )Heat Fluxes (W/cm2)
AverageMaximum
Plate Thickness (mm) 2.Flow Velocity (m/sec)
AverageMaximum
Core Pressure Drop (MPa)
(ATR)250
6250
7500168
51.774.7185700
54, 1.27, 2.0314.618.30.69
(ETR)175
3200
4500
20443.0
57.01304101.27
9.110.40.30
High FluxIsotope
Reactor (HPIR)100
NA
NA
30449.0
72.0
2453871.27
16.216.20.76
Oak RidgeResearchReactor (ORR)
3012001730122
47.2
53.3521891.279.811.60.17
High FluxBeam Reactor
(HFBR)40
1430
1960
16848.956.71204181.27
11.712.40.17
MaterialsTesting *
Reactor (KTR)40
1500210015440.047.0110260
1.65, 1.27, 110.012.20.28
.65
Shutdownidata Included for comparison

3. STRESS ANALYSES OF FUEL PLATES
The following is a summary of the analytic approaches that have beenused in estimating the stresses to be expected in reactor fuel elements duringnormal operation.
3.1 ATR Reactor
The ATR reactor core consists of 40 fuel elements arranged in aserpentine annulus configuration which provides 4 inner flux trap positions,four side flux trap positions and one center flux trap position.^ Theindividual fuel assemblies are 45° annular segments of a circle with an innerradius of 81 mm and an outer radius of 132 mm and contain 19 plates (Fig. 1).The overall length of the fuel plates is 1.26 m. The fuel plates are 1.27 mmthick overall with 0.38 mm cladding on each side of the fuel meat. The fuelmeat is UA1X dispersed in type-1100 aluminum (1.6-1.7 gU/cra3), and thecladding is type-6061 aluminum. As shown in Table A.5-1, the ATR has the highestpower density of any U.S. research and test reactor, with a peak heat flux of700 W/cm2 and a core pressure drop of 0.7 mPa. It is currently operatingon a 45 day fuel cycle with a peak fission density of 2.3 x 10²* fissions/cm^.Based on prior experience with the MTR and ETR reactors, it was recognizedthat operating under these conditions would require careful fuel element designand thorough testing.
2.54 mm
Plate 19
Plate 18
Plate 1
Figure 1 Cross Section of ATR Fuel Element
127

The original analysis done for the ATR fuel elements7 was basically ahand calculation method which considered only the two outermost fuel plates ina fuel assembly (plates 18 and 19) located in the highest power density regionof the core. The assumptions used in these calculations were:
1. The fuel plates were considered to be homogeneous aluminum. Thatis, mechanical properties of the cladding were used for the wholeplate,including the fuel meat.
2. The plate temperature difference was assumed to be one dimensionalin the azimuthal direction.
3. The axial fuel plate elongation due to thermal expansion was assumedto be restrained only by the fuel element side plates.
4. Fuel plate failure was assumed to occur when the azimuthal stressreaches the yield strength in the plate center region.
In the ATR fuel, axial thermal stresses are produced in the fuel platebecause its average operating temperature is about 110°C hotter than the assemblyside plates. Furthermore, the neutron flux peaks at the outside edge of the fuelassembly, producing the highest power density and fuel temperatures in theplates close to where it joins the side plate, rather than the center.
Azimuthal stresses are generated in the fuel plate because of differencesin channel flow characteristics as well as the temperature gradients. Differential hydraulic pressures are caused by differences in entrance and exitlosses in adjacent channels of different thicknesses. The largest potentialpressure differential occurs on the innermost plate (plate 1) or the outermostplate (plate 19) because an accmulation of manufacturing tolerances can createa large difference in channel thickness on the outside of these two plates.Plate 19 has a much larger radius and arc length than plate 1; therefore,bending stresses and transverse plate deflections will be much greater forplate 19. Since the maximum deviations in interior channel thicknesses areless than for the exterior coolant channels (channels 1 and 20) the potentialpressure differences across the interior plates (2 to 18) are smaller thanthose for plates 1 and 19. The interior plates must be analyzed, however,since they are 1.27 mm thick, while plate 19 is 2.54 mm thick and plate 1 is2.03 mm thick. Plate 18 has the largest arc length of the interior plates;consequently, it is potentially the critical interior plate with respect toazimuthal stress. The largest axial thermal stresses will also occur inplates 18 and 19 because they are hotter than the remaining plates and receivethe same elongation restraint from the cooler side plates. Therefore, these twoplates are the only ones that need be analyzed to define the limiting cases.7
The input pressure and temperature differentials for stress calculationswere obtained for several different channel configurations using the MACABREcomputer program, which was written specifically for ATR fuel element geome-try. The calculated maximum fuel plate azimuthal stress of 2.19 mPa was foundto occur at the exterior surface of plate 19 of the peak power element. Thisis well below the yield strength of type 6061-0 aluminum of 50.5 mPa at theplate surface temperature of 180°C. The calculated pressure differentialacross plate 19 was 30.6 kPa, toward channel 20. In performing these cal-culations it was found that only 9-36% (depending on the thickness) of theplate section modulus was provided by the fuel meat. Therefore, it wasconcluded that assuming the fuel meat had the same mechanical properties asthe cladding introduced little error. The calculated axial thermal stressesexceeded the yield strength of the type 6061-0 aluminum over small regions for
128

the peak power element. However, since yielding occurs near the support (dueto slipping in the swaged joint at the side plate) and tends to relieve thesestresses, this was considered to be acceptable.7
Currently the two criteria used in the operation of the ATR reactor are:(1) the axial thermal stress should remain below the yield at the platemid-point, although it may exceed yield near point of attachment to the sideplate, and (2) the azimuthal stresses due to temperature and hydraulic forcesshould remain below the yield point. These have proven in practice to besatisfactory, as no failure due to buckling has occurred while operatingwithin these constraints.
3.2 ETR Reactor
Fuel elements for the ETR consist of 19, 1.27 mm thick, flat plates7.24 cm wide by approximately 90 cm long. The fuel meat is a UA1X composite(0.95 g U/cm3) clad with 1100 - H12 aluminium. The fuel plates are assembledinto the side plates by roll swaging; the spacing between plates is 2.74 mm.Like the ATR, the side plates of the fuel element are slotted to relievepressure differentials between plates.
The analysis used to estimate whether or not the ETR fuel plates willbuckle under normal reactor operation is somewhat different and less elaboratethan that outlined above for the ATR. Basically the approach was to use theformula which describes the critical stress level in a flat plate prior tobuckling based on classical plate theory.8 The analysis, which did notinclude consideration of hydraulic forces, established that the yield stressrepresented the critical stress for buckling. Therefore the approach used forthe ETR plates is to limit the maximum compressive thermal stress computed atnominal operating temperatures, plus two standard deviations, to less than thelowest yield stress expected in irradiated fuel plates. The results showedthat the fuel plates, with properties typical of irradiated fuel and operatingat 204°C, can withstand a maximum average temperature differential of 55°Cbetween the side plates and the fuel plates, and an approximately 22°C maximumtemperature differential between the hottest fuel plate and the average of allother plates. It was stated that this method assures that ETR fuel plateswill not exceed the buckling criterion, with 95% certainty. Furthermore,since the buckling criterion is conservative for a swaged joint construction,the probability of buckling is even smaller when using this approach.
The ETR has operated under conditions more severe than this a number oftimes with no apparent permanent plate deformations unless the fuel plateswere mechanically pinned to the side plates. When a mechanical joint was madeby pinning, which allows no relative motion between the fuel plates and theside plates, some fuel plate buckling did result. The ability of the fuelplate to slip in the swaged joint relieves the constraint which causes thebuckling. The actual approach that has been used in operating the ETR is tokeep the temperature in the hottest plate below that at which there have beenproblems with plate buckling, so heavy reliance is placed on reactor operatingexperience.9
4. FUEL ELEMENT PROOF TESTING
4.1 Hydraulic Flow Tests
As stated, the tolerance on coolant channel spacing of 2.0 mm isvery critical in the ATR, not only because of heat transfer considerations,
129
but because of hydraulic pressure forces which can act on a fuel plate separa-ting two coolant channels which are of unequal width. The two externalcoolant channels, numbers 1 and 20 (Fig. A.5-1) are bounded on one side by fuelplates and either by the flux trap baffle (channel 20). The core componentsare arranged to give a nominal 2.74 mm channel 1 and 2.87 mm channel 20thickness. However, because of the tolerances involved in positioning theassemblies in the fuel annulus, these external channels vary considerably. Astatistical evaluation of the tolerances was performed and this indicated thatchannel 20, the more critical of the two external channels because of thegreater unrestrained fuel plate span, had a 2o maximum thickness of 4.44 mm.Therefore, to withstand the hydraulic forces developed across these twoexternal fuel plates, the thickness of plate 1 was increased to 2.03 mm andplate 19 was increased to 2.54 mm.
Isothermal hydraulic tests of the first ATR fuel assemblies indicatedthat, even with the thicker outer fuel plates (1 and 19) and close fabricationtolerances, lateral pressures between coolant channels were excessive.
These pressures were relieved by putting slots in the fuel assembly sideplates at various locations. The slots allow the coolant to flow betweenchannels and partially equalize pressures. An extensive series of pre-operational out-of-pile flow tests with the fuel assemblies modified in thisfashion indicated that the maximum hydraulic pressure force occurred acrossplate 19 (between channels 19 and 20) approximately 86 cm above the lower edgeof the 126 cm long fuel plate.10 This pressure differential was f40 kPa at115% flow and is well within the fuel plate's capability to withstand withoutbuckling at operating temperatures.
Hydraulic flow tests still play a predominant role in assuring reli-ability of fuel elements in the ATR core. All new fuel elements are tested at130% of flow at a temperature of 175°C before being placed in the reactorcore. Similar procedures are followed for the ETR reactor.
4.2 Differential Thermal Expansion Tests
As part of the development program for the ATR fuel, tests were runto determine if the compressive thermal stresses, discussed above, resultingfrom temperature differences between the aluminium clad fuel plates and thecooler side plates would distort or ripple the fuel plates.H The fuel platesare about 1.2 m long and of various widths ranging form 5.6 to 10.2 cm. Tosimulate the stress condition across the width of a fuel plate, steel barswere clamped to the edges of the individual test plates. A bar material wasselected with a thermal expansion coefficient sufficiently different from thealuminum fuel plate to cause a compressive stress in the restrained plate whenheated in a furnace. Two different size plates were tested; plate 18 with a13.3 cm radius of curvature and plate 2 with a 8.13 cm radius (see Fig. A.5-1).The fuel plates, restrained by the steel bars, were placed electrically heatedfurnaces, and surface displacement measurements were made at 150°, 205°, and260°C. These measurements were taken at 2.5 cm increments along the lengthdown the axial centerline, and at the two 1/4 point intervals halfway betweenthe center and the edge of the plate.
The results of these tests showed that there was no rippling of theplates, but merely an increase in the overall end-to-end curvature of theplate over that which existed at room temperature. In contrast, a number offlat plates tested in a similar manner exhibited a distinct ripple patternwith a wave length approximately equal to the plate width and with a maximumpeak-to-peak surface displacement of 3.0 mm. Thus, this series of tests gave
130

confidence that the prototype ATR fuel assembly would withstand the expectedthermal stresses and that the curved plate design provided considerablygreater stability than a flat plate.
5. FUEL BEHAVIOR OVER DURATION OF FUEL CYCLE
5.1 Irradiation Effects
Irradiation experience with aluminum clad, UAlx-alutninum plateletsand full size ATR fuel elements indicates that irradiation growth is essen-tially all in the thickness (1.27 mm) dimension.12
Post irradiation measurements with ATR fuel elements indicated that there wasonly a 0.51 to 0.76 mm increase in the length (126 cm) at volumetric increasesof 3 to 5%. This is consistent with experience in other high power densityresearch and test reactors in that there have been no particular problems withirradiation induced volumetric or dimensional changes causing structuralinstability in the fuel plates. In spite of relatively large volume increasesup to 6%, the measurements of fuel plates after irradiation have shown insign-ificant increases in length and width; all the increase has been in thethickness dimension. This has been explained by the fact that the cladmaterial has a higher strength than the fuel meat in the length and widthdirections. Therefore the fuel meat flows plastically at operating temper-atures when its compressive yield stress is reached, well below the tensionyield stress of the cladding. The cladding, however, produces very littlerestraint in the thickness direction, and plastic flow of the fuel meat occursin this direction.12
5.2 Buildup of Oxide Film on Fuel PlatesAt the beginning of the ATR fuel cycle, the fuel plates heat up to a
temperature 150-200°C while the side plates, heated by gamma absorption,operate at approximately 100°C. As discussed above, this temperature differ-ential results in a compressive loading on the fuel plates which creates apotential for buckling. During prolonged irradiation in the reactor, therelatively hot fuel plate cladding reacts with the primary coolant to producea hydrated aluminum oxide layer on the plate. This layer, which acts as athermal insulator, causes the maximum plate temperature and thermal stress toinitially increase over the fuel cycle life. Eventually the decreased powergeneration due to increased fuel burnup in high power regions overrides thecorrosion layer effect, causing a peaking of the temperature at some point intime over the fuel cycle. Actual experience over the 700-900 hour ATR fuelcycle duration has shown that the oxide film is self-limiting in thickness,such that a maximum thickness of approximately 13-25 ym occurs after about 400hours11*. The overall effect of this film buildup is combination withincreased fuel burnup is that the maximum fuel temperature increases fromabout 180°C to approximately 215°C. Because peak heat fluxes are 700 W/cm2,and the thermal conductivity of the oxide layer is only 0.022 W/cm°C, thebuildup of the oxide layer is an important parameter in determining the peakthermal stresses in the ATR fuel plates during operation. This same phenome-non occurs in the ETR reactor.
131

REFERENCES
1. R. J. Beaver and J. E. Cunningham, "Recent Cevelopments in Aluminum-BaseFuel Elements for Research Reactors," Paper No. 4, pg. 40, TID-7559 PartI, Proceedings of Fuel Element Conference at Gatlinburg, TN, May 14-16,1958.
2. Westinghouse Staff Report on WTR Fuel Element Failure, April 3, 1960,WTR-49 (July 7, 1960).
3. F. R. Keller, "Fuel Element Flow Blockage in the Engineering Test Re-actor," IDO-16780 (May 10, 1962).
4. R. A. Costner, Jr., "MTR Fission Break Incident," Nuclear Safety 4, 4(1963).
5. M. H. Bartz, "Performance of Metals During Six Years Service in the MTR,"P/1878 U.S.A., Proceddings of the Second International Conference on thePeaceful Uses of Atomic Energy, Geneva, 1958.
6. D. R. de Boisblanc and S. Cohen, "Safety Analysis Report, Advanced TestReactor," IDO-17021 (April, 1965).
7. C. A. Moore, "Calculations of Pressure Induced and Thermal Stresses forAdvanced Test Reactor Fuel elements," IN-1303 (August, 1969).
8. "Design Basis Analysis of ETR-Phase II," Tech. Specs. CI-123 (February,1972).
9. J. L. Liebenthal, EG&G-INEL, personal communication.
10. M. L. Griebenow, "Isothermal Hydraulic Measurements in Fuel Elements inATR Core," Idaho Nuclear Corp. (September, 1968).
11. R. E. Deville, "Differential Thermal Expansion Tests on Advanced TestReactor Fuel Plates," IDO-24461 (October 15, 1963).
12. M. L. Griebenow, "ATR Extended Burnup Program," ANCR-1015, AerojetNuclear Co. (November, 1971).
13. M. L. Griebenow and G. H. Hanson, "ATR Core-1 Thermal-HydraulicsTestsResults," TR-727, INEL (September, 1976).
14. G. N. Fillmore, EG&G-INEL, personal communication.
132
Appendix 1-5.2
HYDRAULIC TESTS ON DUMMY FUEL ELEMENTSFOR JAERI REACTORS
T. SATO, K. SIMIZU, K. KUROSAWA, M. BANBA,S. YAMAGUCHI, J. TSUNODAJRR-2 Section,Japan Atomic Energy Research Institute
F. NAKAYAMA, Y. ITABASHI, H. KANEKAWA,R. OYAMADA, M. SAITO, T. NAGAMATSUYAJMTR Section,Japan Atomic Energy Research Institute
Tokai-mura, Naka-gun, Ibaraki-ken,Japan
Edited by K. Tsuchihashi
Abstract
For the JRR-2 reactor and the JMTR reactor, dummy fuel elementsusing depleted uranium were fabricated and hydraulic tests werecarried out for two purposes. One purpose was to confirm fabri-cation techniques and inspection methods in order to establishreasonable specifications for succeeding MEU fuel elements. Theother purpose was to confirm the integrity of the fuel elementsunder normal and abnormal hydraulic conditions.
Along the RERTR program, JAERI selected the steady and availablesolution to convert the cores of the JRR-2 and JMTR, although it didnot yet meet the goal of the program. This is to use of MEU (45 %enriched) fuels with UA1X dispersion type instead of current HEU (93 %enriched) fuels with U-A1 alloy type. As the unique domestic fuelfabricator announced to retire from the supplier of research reactorfuels, the contracts had to be made between any of foreign fabricators.Consequently, not only the qualification of new type fuel but also thequalification of fabricator became the item of the licensing procedure.
For each reactor of the JRR-2 and the JMTR, the dummy fuel ele-ments using depleted uranium were faricated and the hydraulic testswere carried out for two purposes. One is to confirm fabricationtechnique and inspection methods resulting to the establishment ofreasonable specifications for the succeeding MEU fuel elements. Theother is to confirm the integrity against normal and abnormal hydraulicconditions.
These tests were included in the activities in Phase B of theANL-JAERI Joint Study on the RERTR program.
This paper describes briefly the fabrications and the experiments.
133

1
i 
JRR-2
The JRR-2 is a 10 MW research reactor moderated and cooled by heavywater. The core has been operated by 17 MTR type and 7 cylindrical typefuel elements with 93 % EU arranged in hexagonal pitch.
In the MEU core we intend to use only the cylindrical elements toextend the cycle length by its larger reactivity worth and increase thecapsule irradiation capability by utilizing the central channel of eachelement. In one cylindrical element. 15 fuel plates compose coaxial 5cylindrical layers connected by 3 support plate. These layers areprotected by an inner and an outer tubes. No change in geometry hadbeen intended. It happened successively twice just after making thecontract between JAERI and the CERCA in France for the fabrication ofone dummy fuel element for hydraulic test. That is, we had breakage ofthe whole screws to fix the fuel support plates to the outer tube of acylindrical element in the current core. It resulted in the floatage ofthe fuel plate group (support plates and fuel plates). It was concludedthat the thermal stress due to the difference of temperature betweenthe support plate and the outer tube broke the connecting screws.
FabricationBy reflecting on the above defect, the supporting system of the
dummy element was modified so as to fix all of lower ends of plategroup and outer tubes to the lower adapter and release their upper endsfor thermal expansion. The specifications for fabrication are shown inFig. 1.The following items were inspected at the site;
(1) Material analyses and mechanical properties(2 ) U and U-A1 analyses(3) Determination of UAlß-UA^ percentage(4) Uranium weight percentage in fuel core(5) Fuel core void content(6) Micrographs(7) Tensile test(8) Dimension of structural parts(9) Surface contamination
Results of the above inspections were satisfactory.
Hydraulic TestsA diagram of measurement device constructed for this experiment is
shown in Fig.2. Velocity was measured at each outlet fuel plate by athree-hole arrow head type yaw meter. An example of measured velocityprofile is given in Fig. 3. Figure 4 shows a comparison of the measuredand calculated velocity distributions. The calculation was made bysolving hydro-dynamic equations in the fuel plates channel. The calcu-lated profile agrees well with the measured one.
The endurance test was also performed during the continuous3,000 hours under 1.3 times of the nominal flow. The visual inspectionand the dimension measurement did not find any anomaly.
135

Three-hole arrow head tVDe
Flow direction
Fig.2 Diagram of measurement device
8
7
6
^ 5v%
E 4
J R R - J c y l l n d r i c . i l type fue l e l e m e n tQt- I . 2 1 ( m ' / m i n |
0 10 20 nùûrtT C m m J
F 1 g . 3 Measured ve loc i ty p r o f i l e
136

1.0
0.8
0.6
XIDE
0.4
O JRR-2 cylindrical type elementUmax=8.
• JRR-2 cylindrical type element»Capsule
Re=î.7xlO* Umax=7.8[m/s]
Numerical Analysis
0.2
0.2 0.4 0.6 0.8 1 0
Fig.4 Measured and calculatedvelocity profiles
Vibration test was performed for possible combinations of theelement and two kinds of irradiation capsules under several flowconditions. Results showed that the proper vibrations of the fuel plategroup and the outer tube were different and no resonant vibration wouldoccur under any flow condition.
The data obtained in these tests will be used as fundamentaldata for the SAR.
137
JMTRThe JMTR is a 50 MW MTR type reactor moderated and cooled by
light water Two standard fuel elements and one fuel follower withdepleted uranium of 1 6 gU cc were ordered to the NUKEM in FRG so thatthey might have the identical mechanical properties with those of theJMTR MEU (45%- > fuels.
The hydraulic tests were designed to (\) measure the coolantvelocity distribution between fuel plates, '2) confirm the strengthof the standard fuel elements by exposing them in the hydraulic forcesincreased to 140 °,0 of the nominal flow, '3) determine the criticalvelocity, and (4.) confirm withstanding of the fuel follower in droptests
SpecificationsNo alteration in the dimensions of MEU elements from those of HEU
was intended because it seemed impossible to complete this time-consuming optimization within the rather short period allowed However,it became evident that minimum cladding thickness of MEU by powdermetallurgical technique was thinner than that of HEU by alloyingtechnique because uranium-aluminum grain in the dispersed fuel coreprojects into the aluminum cladding. To mitigate this problem, severalefforts such as alteration of powder grain size and cladding materialswere attempted, but the results were not improved yet. Consequently,the specifications for cladding and core thickness were changed asfollows, after confirming that no problem would occur concerning thecorrosion margin, the neutronics and the hot spot factor in thethermal hydraulics,
Cladding Thickness Core thicknessHEU nom 0.385 mm mm. 0.36 mm 0.50 ± 0.03 mmMEU ave. 0.36 mm - 0.41 mm ave 0.50 ± 0.03 mm
mm. 0.30 mm at projected pointThe cladding and core thickness were inspected in the following
way; Three fuel plates were selected out of each roll batch, and fromeach plate three sections in the width direction and two sections inlongitudial direction were chosen as specimen. After abrasion of asection, cladding and fuel core thickness were measured by a microscopeevery 1 mm along the width of a plate, 60 mm, to evaluate the averagevalue and to find projection points This inspection was continuedthrough the trials to improve the minimum cladding thickness. Totally,more than 45 sections were inspected.
Test MethodsThe tests were conducted in the out-of pile single element hydrau-
lic test loop. A sketch of the loop is shown in Fig. 1. The coolantvelocity between fuel plates was measured with one set of arrow-head-type Pi tot-tubes installed at the outlet of coolant channel. A sketchof the installed Pi tot tubes is shown in Fig. 2.
Test ResultsThe results of the coolant velocity distribution measurement among
the coolant channels of both standard and fuel-follower elements are
138

Ai r Compressor
CLDOri f i ce
f (PdR)o
00-,
rtxj-1
Cool ing Watar
-»-* Hater Supply
Fig.l JMTR Hydraulic Test Loop.
Arrow-Head-TypePi toe Tube
.Standard Fuel Element
.Fuel Plate £>I S.
Flange
Fuel Adapter
Oimensioo ; in
Fig.2 Installation of Pitoh Tube.
139
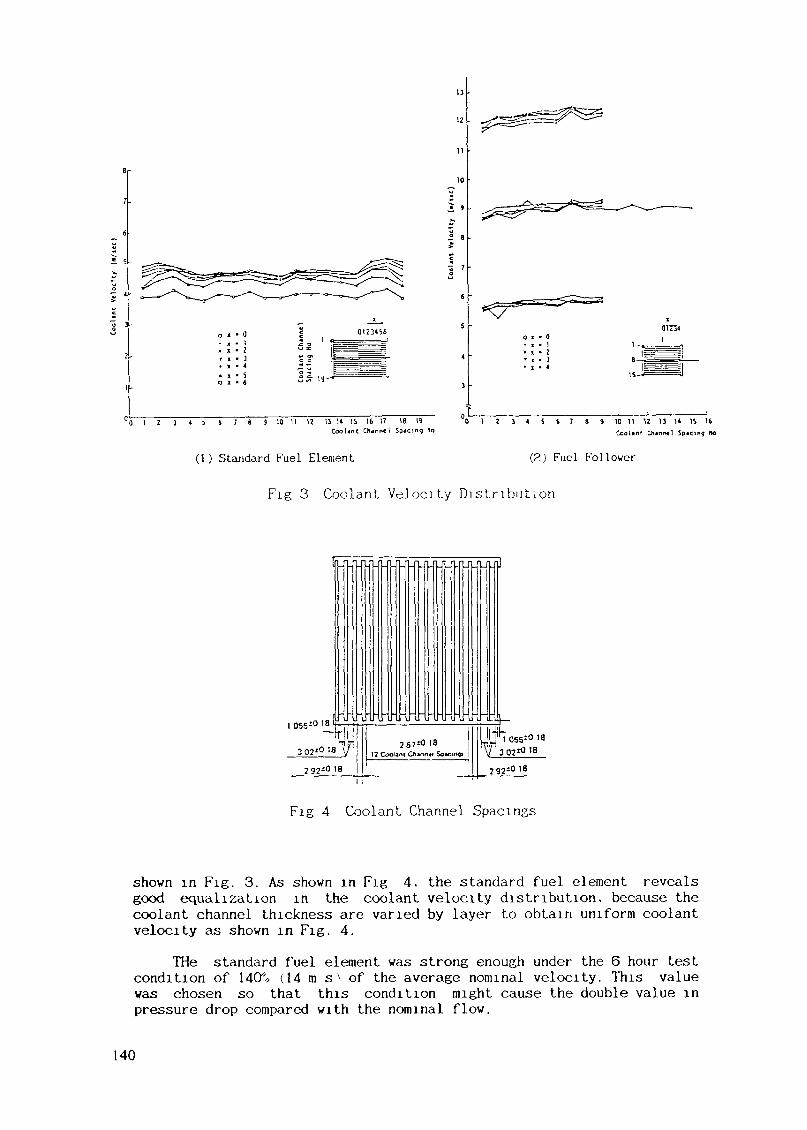
• o. i• 2• J
3TT541 -
S-
15-
U0 I 2 3 43 6 78 3 ID II 12 13 14 15 16 17 18 19Coolinc Chanrwl Spacing 10
(1 ) Standard Fuel Element
0 1 2 3 « S 6 7 8 3 10 11 12 13 1« IS 16Ceolin* Chjnn«] Spicing No
(2) Fuel Follower
Fig 3 Coolant Velocity Distr ibution
1 055-0 iaj_
292*0 18
267*0 1812 CooUm Oijnn«« S
^ ff 055-0 18
V 3 02*0'B
707*0 18
Fig 4 Coolant Channel Spacings
shown in Fig. 3. As shown in Fig 4, the standard fuel element revealsgood equalization in the coolant velocity distribution, because thecoolant channel thickness are varied by layer to obtain uniform coolantvelocity as shown in Fig. 4.
THe standard fuel element was strong enough under the 6 hour testcondition of 140%. (14 m s^ of the average nominal velocity. This valuewas chosen so that this condition might cause the double value inpressure drop compared with the nominal flow.
140

The critical velocity for MEU fuel is estimated approximately 18m/s on the assumption that fuel core has the same strength as thecladding material. The critical velocity is estimated conservatively tobe approximately 15 m/s in disregard of the strength of fuel core,because the mechanical properties of fuel core were not clear. Theresults of the critical velocity test show that MEU fuel was withstand-ing against hydraulic force of at least 20 m 's which is the maximumvelocity of the test system.
The drop-test for the dummy fuel-follower was repeated up to 100times under the condition that the downward coolant flow was increasedto 14Q*o (14 m/s) of the nominal velocity. Further drop tests wereperformed up to 20 times each at 160 and 180% of nominal velocity (16m/s and 18 m/s).
After all the tests, the fuel elements were visually inspected andtheir coolant channel spacings were measured with a strain gaugedevice. Both standard and fuel-follower elements were proved to bewithstanding under the above hydraulic test conditions.Conclusions for the JITTR elements(1) While the minimum cladding thickness for the dummy elements was
specified to 0.30 mm, it seemed difficult to apply this standardto the MEU elements. It was decided to loosen the standard to 0.25mm at projected points of UA1X grains.
(2) Integrity of dummy fuels was enough under the hydraulic testconditions which were more severe than will be encountered in thenormal operation of the JMTR.
141
Appendix 1-6
'CARAMEL' - FRENCH LEU FUEL FOR RESEARCH REACTORSWITH EMPHASIS ON THE OSIRIS EXPERIENCEOF CORE CONVERSION
COMMISSARIAT A L'ENERGIE ATOMIQUECentre d'études nucléaires de Saclay,Gif-sur-Yvette, France
Abstract
Key aspects of the design, development, and qualification ofFrench LEU "Caramel" fuel are discussed. These aspects includedescriptions of the fabrication steps, the quality control pro-cedures that are employed in fuel fabrication, and the extensivequalification program to determine first the technologicallimits and then the safe and reliable operating ranges for thistype of fuel.Experience in utilizing "Caramel" fuel in the high performanceOSIRIS reactor is emphasized. Necessary adaptations of theplant primary cooling circuit are described along with operatingexperience, changes in the experimental conditions, and possibleapplication in other research reactors.
K INTRODUCTION
One of the various activities carried out in France concerned with the design,fabrication and development of nuclear fuels was the development by the CEA of aplace type fuel (Caramel fuel). A Caramel fuel element is in the form of a plateconsisting of two tight covering zircaloy sheets in which the UO platelets areconfined themselves within the network of a zircaloy grid. The plane geometry pro-vides an effective means of overcoming the drawback of poor uranium oxide conduc-tivity, and makes it possible to combine high specific power with low fuel tempe-rature.
The different materials used in the Caramel type fuel assemblies i.e. UO andZy, are very well known after their extensive use in LWR's. Their physical proper-ties, in pile behaviour, manufacturing features etc... are well mastered, and willtherefore not be dealt with in this presentation.
The chief advantages of this fuel are the following :
(1) It is a very low enriched fuel. It can be used in research reactors demandinghigh volumetric powers and neutron fluxes, with a required enrichment signi-ficantly lower than 20 Z 235U.
143
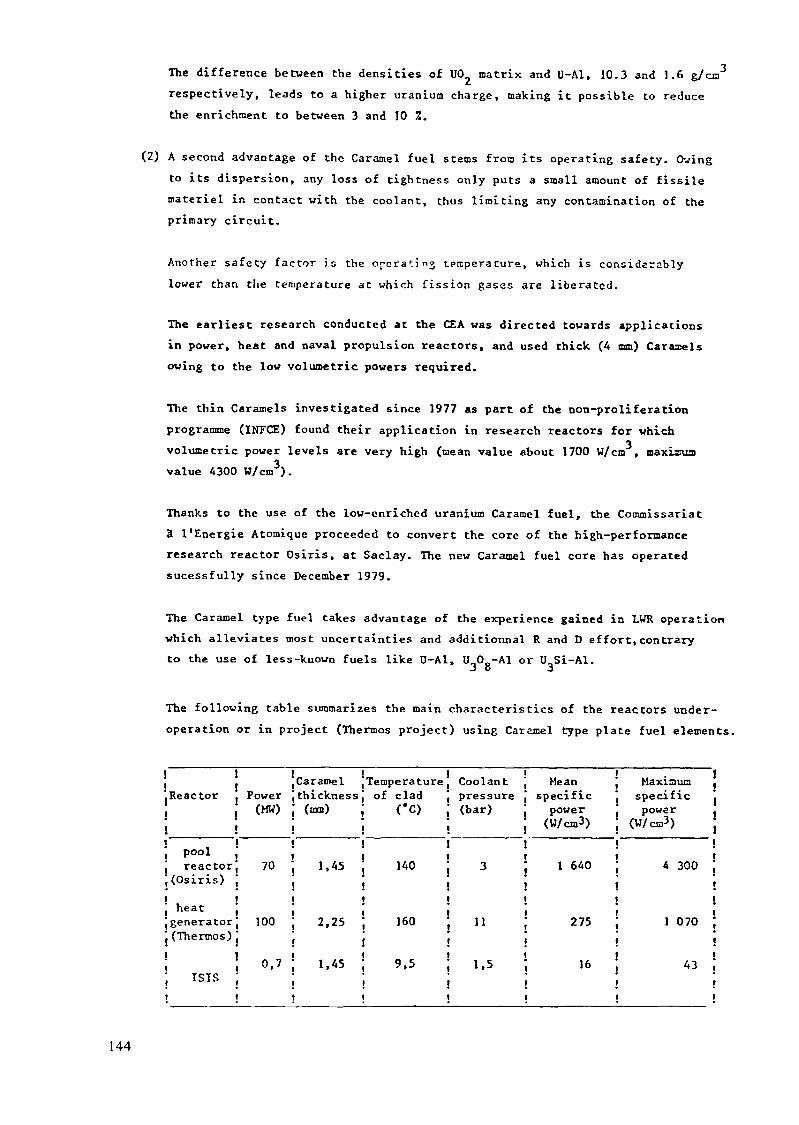
The difference between the densities of UO matrix and U-A1, 10.3 and 1.6 g/cmrespectively, leads to a higher uranium charge, making it possible to reducethe enrichment to between 3 and 10 %.
(2) A second advantage of the Caramel fuel stems from its operating safety. Owingto its dispersion, any loss of tightness only puts a small amount of fissilemateriel in contact with the coolant, thus limiting any contamination of theprimary circuit.
Another safety factor is the opera1:! 13 température, which is considerablylower than the temperature at whir.h fission gases are liberated.
The earliest research conducted at the CEA was directed towards applicationsin power, heat and naval propulsion reactors, and used thick (4 mm) Caramelsowing to the low volumetric powers required.
The thin Caramels investigated since 1977 as part of the non-proliferationprogramme (INFCE) found their application in research reactors for whichvolumetric power levels are very high (nean value about 1700 W/cm , maxiauavalue 4300 W/cm3).
Thanks to the use of the low-enriched uranium Caramel fuel, the Commissariatà l'Energie Atomique proceeded to convert the core of the high-performanceresearch reactor Osiris, at Saclay. The new Caramel fuel core has operatedsucessfully since December 1979.
The Caramel type fuel takes advantage of the experience gained in LWR operationwhich alleviates most uncertainties and additionnai R and D effort,contraryto the use of less-known fuels like U-A1, U,00-A1 or U,Si-Al.J o 3
The following table summarizes the main characteristics of the reactors under-
operation or in project (Thermos project) using Caramel type plate fuel elements.
! ! i ! F ~. ,Caramel (Temperature ( Coolant J. Power ', thickness J of clad J pressure Jj (MW) j (mm) j ("G) ; (bar) j
ii . 11*0 & ouït? j. , xeujfjci auut.c j vyuu ion i_ j Me an _ Maximum'.Reactor . Power ', thickness J of clad J pressure J specific j specif i
'--" ' ' -" ' "^ • " • power(W/cm3)
!
lc 1i i vri«/ , vuuj/ , v w t voary . power . power .J , j ; ; ; (w/cm^) ; (w/co3) J! I ! ! 1———————j , j jP°o1 i t i i i • freactorj 70 j 1,45 \ 140 j 3 J 1 640 J 4 300 '(osiris) ; ; ; ; ; ;
; ? i j j jheat i i i i i igenerator; 100 \ 2,25 j 160 j 11 j 275 j 1 070(Thermos); ! ! ! ! !
i l l i t t, 0,7 ; 1,45 ; 9,5 ; 1.5 ; 16 ; 43ISIS i i i i i it t i i i i
144

FIG 1 Components of a Caramel plate
2. DESCRIPTION
The Caramel type Osiris fuel element is in the form of a plate 700 mm long,80 mm wide and 2,25 mm thick. Figure 1 shows the different components of a Caramelplate of the Osiris reactor. The sintered UO. fuel is in the form of a square-section parallelepiped measuring 17,1 x 17,1 mm and 1,45 mm thick. It is placed ina regular array within a square-pitched grid and confined between two zircaloysheets. This assembly, fitted with zircaloy edge and end pieces, undergoes a seriesof welding operations designed to guarantee the perfect tightness of each U0_ pla-telet to the exterior and to its neighbours.
Simultaneously, good contact is achieved between the oxide and the cladding. Thefuel assemblies consist of several plates (14 or 17) in parallel position, heldrigidly by slotted side-plates. They are equipped with a foot for water supply anda handling head.
The Caramel fuel is distinguished from the standard fuel pin by :. its plane geometry,. the absence of free volume,. good oxide/clad contact (no clearance)
The special features of the Caramel fuel impose specific operating conditions.Owing to the absence of voids (except for the open porosity of the fuel), thetemperature of incipient fission gas evolution must never be exceeded. To achievethis condition, it is essential to guarantee excellent oxide/clad contact for tbefuel element from the very beginning and to maintain this throughout its servicelife.
145
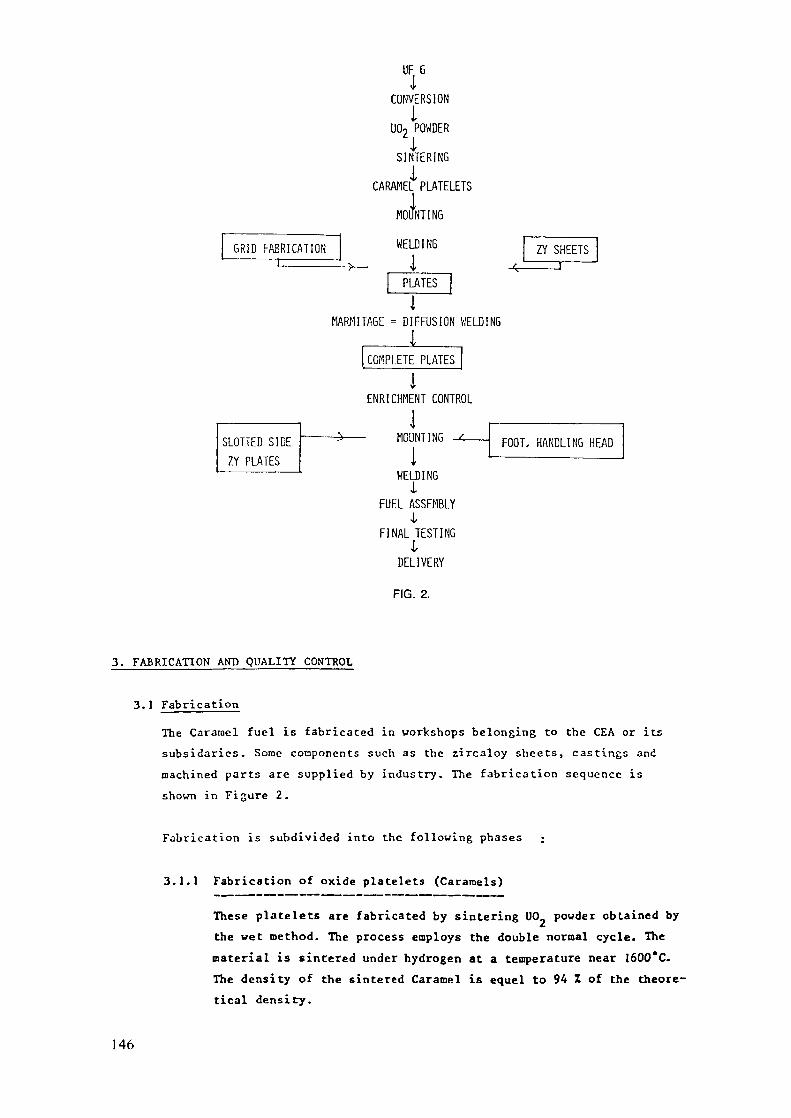
UF 6CONVERSION
IUO, POWDERISINTERINGICARAMEL PLATELETS
MOUF
GRID FABRICATION—————l
NT INGWELDINGI
PLATESI
MARMITAGE = DIFFUSION HELD ING___I
COMPLETE PLATES
ENRICHMENT CONTROL1
MOUNTING -c_i
WELDINGI
FUEL ASSEMBLY1
FINAL TESTINGI
DELIVERY
FIG. 2.
FOOT, HANDLING HEAD
3. FABRICATION ANP QUALITY CONTROL
3.1 Fabrication
The Caramel fuel is fabricated in workshops belonging to the CEA or itssubsidarics. Some components such as the zircaloy sheets, castings andmachined parts are supplied by industry. The fabrication sequence isshown in Figure 2.
Fabrication is subdivided into the following phases ;
3.1.1 Fabrication of oxide platelets (Caramels)
These platelets are fabricated by sintering UO powder obtained bythe wet method. The process employs the double normal cycle. Thematerial is sintered under hydrogen at a temperature near 1600*C.The density of the sintered Caramel is equel to 94 I of the theore-tical density.
146
It should be noted that the fabrication of Caramel fuels benefitsfrom the experience gained in this area with PWR fuels.
Deposit of anti-diffusion barrierEach Caramel is covered by a layer of chromium deposited by cathodicsputtering. This chromium performs the role of a barrier, by preven-ting the diffusion of oxygen into the zircaloy, that is liable to OCCLduring the diffusion welding operation, also called "marmitage"(marmite «= HP cooking pan) and described below.
3.1.2 Plate fabrication
The component parts of a plate are the following (figure 1) :. oxide platelets,. zircaloy grid obtained by welding zircaloy wires,. nickel foot that plays a role with respect to neutrons,. zircaloy side pieces,. zircaloy end pieces,. zircaloy sheet cladding.
The Caramels are placed within the grid cavities. The assemblyincluding the grid with its Caramel load, the side pieces and endpieces is placed between two zircaloy sheets and welded tight. Theplate closure operations are performed in the following order.
After .resistance spot welding of the different parts, the sides arewelded by a resistance seam welding unit.
The end pieces are then welded by electron borabardtsent welding thatalso places the plate under vacuum.
The closed plate is transferred to a diffusion welding enclosure andundergoes high temperature (greater than 900°C) and high pressure(~ 1000 bar) treatment for four hours, also called "marmitage". Thistreatment guarantees the welding of all zircaloy components andespecially between the grids and sheets, by ensuring the separationof each UO. platelet and good oxide/clad contact.
This marmitage treatment is followed by a control treatment undervacuum at 700"C.
The rough plates are then machined to the required dimensions. Afterundergoing the controls described in the next section, they aremounted on side plates. Electron bombardment welding is then used tojoin the Caramel plates and the side plates.
147
3.2 Quality control
All the materials and components are required to meet specifications.
Owing to its geometric characteristics and its operating conditions, theCaramel fuel must meet especially severe requirements, corresponding tospecific control procedures.
These controls are carried out at all fabrication levels and include :. metrology of components and of the assembly (e.g. metrology of channels). enrichment of each fuel platelet,. quality of the weld between metal components,. quality of oxide/clad contact.
These controls take place during fabrication as follows :
3.2.1 Controls in the fabrication of basic components
UP platelet : metrology (length, width, thickness, density, visualappearence, chromium deposit inspection).
Tolerable surface defects have been defined on the basis of correla-tions between defect dimensions and the residual clad thicknessafter diffusion welding.
Zircaloy parts : metrology (surface condition after abrasion)
3.2.2 Controls applied to the finished plate
. Visual appearance
. Metrology
. Checking of the absence of occluded gases, by heat treatment at700°C under vacuum, with free-standing plates
. Quality control of welds by micrography and corrosion test
. Enrichment test
The enrichment test of Caramel plates consists in the déterminationof the charge of Ü per unit area by neutronometry. This checkoffers several advantages :
. overall checking of various Caramel fabrication tolerances :. enrichment,. uranium content of UO-. density of UO sinter. Caramel thickness
148

. possibility of systematic checking of all platelets making up afuel plate
. speed of control in comparison with traditional methods,
. exact measurement of accounting for fabrication ranges,
. control of a characteristic (charge of U per unit area) ofdirect use for the calculation of reactor performance,
. quality control of oxide/clad contact.
The quality of oxidt/clid contact appears to be an importantparameter in the design of the Caramel fuel. A thermal analysiso>elbod by infrared tberraovi tior> was developed for thi.£ purpo;-.
Actually it is not used, because the test performed at 800"C under vacuumserves to test the places in conditions that are more severe than thoseof operation in a pool reactor. This test has proved highly satisfactoryuntil now.
3.2.3 Control of finished assembly
. Overall metrology of assembly (passage through a gauge)
. Metrology of all channels
. Check of surface pollution
Control procedures and final acceptance are carried out by an orga-nization that is independent of the fuel manufacturer. In addition,a quality assurance system is implemented, covering design, fabri-cation and tests.
A preirradiation characterization report is written for each fuelassembly. All the data related to the assembly are included in this report :
Data about assembly components : origin, fabrication procedure,mechanical characteristics, measurements, weight, chemical analyses.
Measurement results for each plate.
Remarks after visual examination for each plate.
Results of enrichment control performed on each UO. platelet
Measurement results of all water subchannels (a recording is made ofeach platelet row)
A few examples of data recorded for each fuel assembly and contained inthe characterization report are annexed at the end of this paper.
149

Fabrication experienceConsiderable fabrication experience' has been gained, because aside tro=fabrications for experimental irradiations, a large number of assemblieshas been fabricated, as summarized below.
Reactor
PATCAPOSIRIS
TOTAL
j Numberof
assemblies
16A
200— — ™-. -r
220
Numberof
plates
576AA
3 AOO
A 020
Numberof U02
platelets
101 95213 728
462 AOO
478 080
U0_ weight(kg)
1 497192
2 019
3 708
CAP - Prototype Advanced Boiler. PWR type reactor of a power of 100 MWth,located at Cadarache.
PAT - Land Eased Prototype. PWR type reactor used as a prototype for navalpropulsion, located at Cadarache.
At present, the fabrication shops have a total capacity of 200 Osiris - typeassemblies per year.
A. QUALIFICATION OF CARAMEL FUEL
An extensive programme involving experiments and qualification of theCaramel fuel has been undertaken and implemented in a broad range of spe-cific powers and burnups. It was intended to determine initially thetechnological limits, and then the safe and reliable operating ranges forthis type of fuel. This programme includes both parameter tests in irra-diation test loops on specimens including a limited number of Caramels,and also irradiations of experimental assemblies carried out in theOsiris reactor and in the CAP and PAT prototype reactors.
The most important features of the programme are then exposed togetherwith the main results obtained.
A.1 TIP programme
An exploratory programme was conducted during the 1965 to 1970period with the EL 3 reactor at Saclay in order to define thetechnological limits of this fuel.
Seventeen test samples (containing 5 and 9 caramels) were irra-diated at variable burnups and specific powers.
150
The specific power range explored ranged from 1000 to 3000 W/cm .The cladding temperature was between 280 and 340*C.
The results of these test showed that :- it is possible to reach a burnup of 30000 MWD/T with specificpowers as high as 3000 W/cm without any deterioration of thefuel. Above 30000 MWD/T, if this specific power is retained,there is a risk that the platelets will swell and release gas.This phenomenon does not necessarily lead to cladding failure.
- if, on the other hand, the specific power is reduced at thisstage of the irradiation, a burnup as high as 50000 MHQ/T canbe achieved without significantly modifying the structure ofthe U02 platelets.
4.2 SILOE programme (1976)
In this programme, two irradiations were performed without anyexternal pressure in the pool reactor Siloé at Grenoble. Twosmall assemblies, each containing a few samples, were irradiated.
The following irradiation conditions were employed :3 3Specific power 106° w/cm a"d 1500 W/cm
Irradiation period 245 days ! 202 daysBurnup 18300 MWD/T j 25 ICC :WD/TTemperature 100°C ! 100°C
Results obtained : Very good in-pile performance was obtainedwith the assemblies. Their appearance after irradiation wasvery satisfactory.
A. 3 Irradiation programme in the Osiris reactorAs before, experimental test samples each containing fewCaramels, were irradiated. The irradiations were carriedout in the NaK loop at 300°C with an external pressure of140 bars. Two series of irradiations were realized :
1973 - 1974 on 3 and 4 mm thick caramels1975 - 1978 only on 4 mm thick caramels in order to define
technological operating limits.
Specimens of the first series exhibited burnups exceeding40000 MWD/T for the 3 mm thick caramels and 37500 MWD/T forthe 4 mm thick caramels. The examinations carried out demons-trated that no gas had been released in the compartments andthat the separators had performed very well.
151
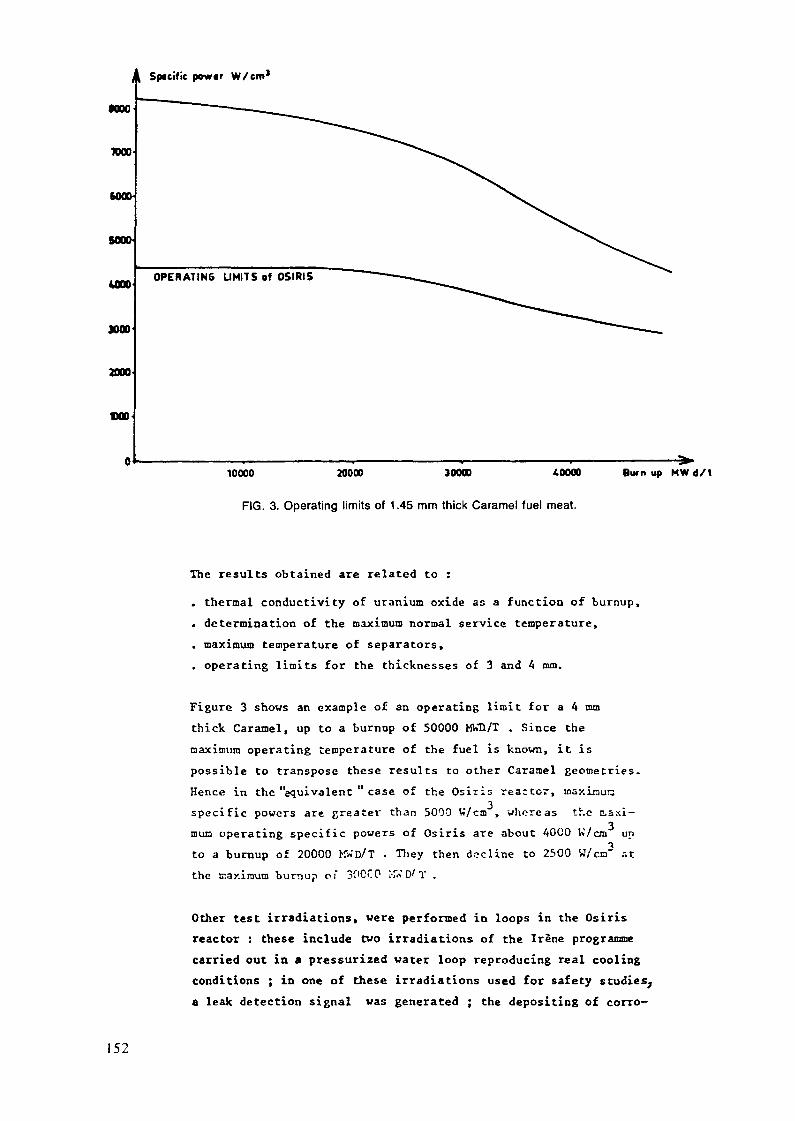
Sptcific powtr W/cm1
MOO
WOO
OPERATING UNITS of OSIRIS
two
10000 20000 30000 «0000
FIG. 3. Operating limits of 1.45 mm thick Caramel fuel meat.
Burn up MW d/t
The results obtained are related to :
. thermal conductivity of uranium oxide as a function of burnup,
. determination of the maximum normal service temperature,
. maximum temperature of separators,
. operating limits for the thicknesses of 3 and 4 mm.
Figure 3 shows an example of an operating limit for a 4 mmthick Caramel, up to a burnop of 50000 MWÜ/T . Since themaximum operating temperature of the fuel is known, it ispossible to transpose these results to other Caramel geometries.Hence in the "equivalent " case of the Osiris reactor, inaxiraunspecific powers are greater than 5000 Vî/cm , whereas the c,=xi-
operating specific powers of Osiris are about AOCO W/cra upto a burnup of 20000 hf«D/T . They then decline to 2500 W/cia" itthe maximum bumup of 30GCP iT« D/ T .
Other test irradiations, were performed in loops in the Osirisreactor : these include two irradiations of the Irène programmecarried out in a pressurized water loop reproducing real coolingconditions ; in one of these irradiations used for safety studies,a leak detection signal was generated ; the depositing of corro-
152

•ion products under low flow rate conditions was studied in theother irradiation.
Power cycling studies were performed on 4 mm thick caramels insamples having reached a bumup of 30000 MWD/T in the Osirisreactor before it was shut down in July 1978. These cycles werecarried out under the following conditions :
uppermost part 1250 W/ctnlowest part 375 W/cmwithdrawal and descent velocity : AOO W.cm mnnumber of cycles 3634
Finally, the start-up of the new core of Osiris was preceeded bythe qualification of three precursor assemblies in the previouscore j these tests widely covered the range of operating conditionsencountered with Osiris.
5. CAKINE EXPERIMENT CARAMEL FUEL CLADDING FAILURE FOLLOWUP
To appraise the operational safety of such a fuel regarding risks of fissionproduct or fissile material release into the reactor primary system, a claddingfailure followup test has been carried out under conditions corresponding toOSIRIS operation and using a test loop independent of the EL 3 reactor.
This cell, located in the D_0 tank of EL 3, forms a heavy-water cooling sys-tem separate from the reactor cooling system. The possible pollution of heavywater is thus limited to that system.
A cladding burst detection device using delayed neutrons with He counter:; i?installed in the system. This device is similar to that used in OSIRIS.
TEST CONDITIONS
The fuel element, manufactured by the same process as standard elements,comprised 32 IK>2 platelets enriched to 7 Z.
The cladding defect is an *v» 1mm circular hole. The fuel rating during ir-radiation was raised to 3050W/cm , cooling being ensured by heavy water cir-culating at 10 m/s. These conditions are very like those encountered in OSIRIS.
The fuel element was installed in an aluminium sleeve channeling water onboth sides of the fuel plate to cool it.
153

The power released in the fuel was measured by establishing a heat balance.
The cooling water temperatures were recorded by three thernocouples at the
inlet and three triple thermocouples at the outlet to limit uncertainties
arising from uniform temperatures in a cross section. The flow rate was measu-
red by a calibrated turbine iqserted in the system.
Cladding failure was detected by two parallel systems ; one uses a BF 3
counter normally operated on the EL 3 independent cell installation ; the other,
of higher performance and used on OSIRIS, is fi t ted with an He counter.
TEST RESULTS
The evolution of the signal showing the amount of delayed neutrons during
irradiation is given in fig. 4. It should be noted that 3 pseudo-plateaus of
activity arc present at increasing levels. Their duration is of about 5 h for
the first , 30 h for the second, and 3 h for the third. During the first two
pseudo-plateaus, fission product wafts have given rise to activity peaks whose
amplitude is near th° average signal.
Between these pseudo-plateaus, the evolution of the signal is Caster and
fas te r , fo l lowing an exponential law. The time to double the signal value, 30 h
dur ing the f i rs t phase of fast evolution, goes dov,n to 3 h during the second
phase.
After the third pseudo-plateau, severe activity variations due to fission
product wafts are recorded, the average signal first increasing very rapidly,
then stabilizing for about 1 h, 40 min.
DOUBLING TIME ( D . T . ) = 30 h~
24 48 720 1 2 3 4 days
FIG. 4. CARINE — delayed neutron counting evolution during irradiation.
154
The delayed-neutron detection device used is completely representative ofthat installed in the OSIRIS reactor, which has allowed the time to déterminewhen a cladding failure detection threshold is reached.
The results obtained show that this threshold is exceeded after the thirdpseudo-plateau and that irradiation still lasts for about 2 h in these condi-tions. Despite this fact, a very low level of activity of the radionuclidescorresponding to fuel release was recorded.
The examinations carried out on the fuel after irradiation have shown thatthe hole previously drilled and the underlying fuel have not been spoiledsignificantly.
Moreover, the sequence of the experiment has proved the excellent behaviorof the cladding failure detection system (CBD) installed on OSIRIS.
In conclusion the CARINE experiment has shown the excellent behavior of Caramefuel in the case of a cladding failure and the possibility of detecting a failurein Osiris before serious pollution occurs in the reactor systems.
6. THE OSIRIS EXPERIENCE
6.1 Adaptation of the plantThe OSIRIS reactor has been chosen for this experience of a LEU fuel in aresearch reactor because of its very high performances. The fuel is Ur_sused in severe conditions which are going well beyond the needs of researchreactors on the whole.
These severe conditions and the absence of margins except those necessaryto the safety, with the U-A1 HEU fuel mainly explain the necessity of thetransformations of the core primary cooling circuit. It must indeed beremembered that this reactor was first designed for an operation at a rateof 50 MW ; the level of 70 MW was reached in 1968 only, after a small adap-tation of the circulating pumps which were so driven to their limits.
The primary cooling system consisting of four groups of heat exchangers andpumps in parallel, each pump was associated with a heat exchanger. Three ofthese pumps were used simultaneously.
For the new fuel, the decrease of the number of plates of each fuel element(17 compared with 24 previously) had to be compensated by increasing theprimary cooling flow rate to improve the removal conditions of the corepower.
155

Because of the impossibility to increase the flow rate in each one of theexchangers, an adaptation of the main piping allows the connecting of thefour exchangers to the outlet of each one of the four pumps. A main pipeconnects the discharge of the pumps to the inlet of the heat exchangers.The puirps have been changed and their power increased. In this new situa-tion the reactor is operated with three pumps and three heat exchangers.
The very works linked to the change of the fuel ran from the end of 1973to August 1979. It was made use of a longer shutdown of the reactor forimportant maintenance works on the coatings of the storage capacities andof the decay tanks.
The other adaptations for the operation of the new oxide fuel were reallylesser and limited to some strengthening of the structure of the dry storagetanks of the non irradiated fuels.
The codification of the cladding ruptui'e detection system was alieady aproject with U-A1 fuel.
6.2 Changes in experimental conditions
For the experimental irradiations, the important parameters are thethermal and fast neutron fluxes levels. The gamma flux causes the libe-ration of additional heat energy which can be detrimental for the cooling.A certain quality of the neutron spectrum is aimed at for certain inves-tigations of damage (better ratio of fast to thermal flux). We shall exa-mine the irradiation conditions with the oxide fuel and compare them withthe previous situation (U-A1).
The first calculations, then a scrie of measuraments taken in ISIS out, atlast, the experience of 18 month of OSIRIS operation provide us with anaccurate idea of the changes in experimental conditions in OSIRIS.
6.2.1 The fast neutron flux (E > 1 MeV)
It was showed by the first calculations that the fast flux levelwas not modified with the new fuel if the core size was kept. Thisresult has been verified from ISIS and OSIRIS. The loss in averagefast flux level is indeed equal to the increase of the size of thecore the number of fuel elements being passed from 39 to 44 becauseof the hydraulic and mechanical behavior of the reactor structures.
6.2.2 The thermal neutron flux
The very large absorption cross section of the new fuel, due to itshigh 235U loading is reflected at an equivalent total power, by a
156
significant drop in thermal flux in the network (35 + 40 Z for theseexperiments). The spectrum quality is however better (gain of about40 Z in the fast / thermal flux ratio) for experiments on damage onstructure materials.
The drop in thermal flux in the network has no detrimental consequen-ces on the experimental prc'S aa, the network being exclusively usedfor its characteristics in fast fluxes.
The loss on the thermal flux in the periphery of the core is, on anaverage, of 15 Z. But here also,it has to be taken into account theincrease of the size of the core and of the number of availableexperimental location on the external grids.
6.2.3 Gamma heating
Gamma heating decreases in the network and this is an advantagefor some experiments. In the network irradiation locationU-A1 core : 10 to 15 Watt/goxide core : 4 to 8 Watt/g
6.3 S täte of the experience on OSIRIS
6.3.1 The reactor operation
The Osiris reactor was loaded with the new oxide LEU fuel in October1979. A start-up test cycle took place in January/February 1980.From that time to July 1981, in addition of the start-up cycle, 12cycles of roughly A weeks for each one took place. The total energydelivered by the reactor during this period is 21600 MWD at 70 MW.
The following table gives for each cycle, the U loading in thebeginning of the cycle the energy delivered by the reactor the nunberof EFPD of the cycle, the average burn-up of the unloaded fuel ele-ments. It has to be pointed out that, for the first cycle, theaverage enrichment was only 6 Z with fuel elements at A,75 Z, 5,627,and 7 Z. The reloadings are done now with 7 Z enriched fuel. At theend of 1982, this enrichment will be raised to 7,5 Z
Each fuel element remains in the core for 5 or 6 cycles. At theend of each cycle it is proceeded to a partial refuelling and toa shuffling of the remaining fuels.
157
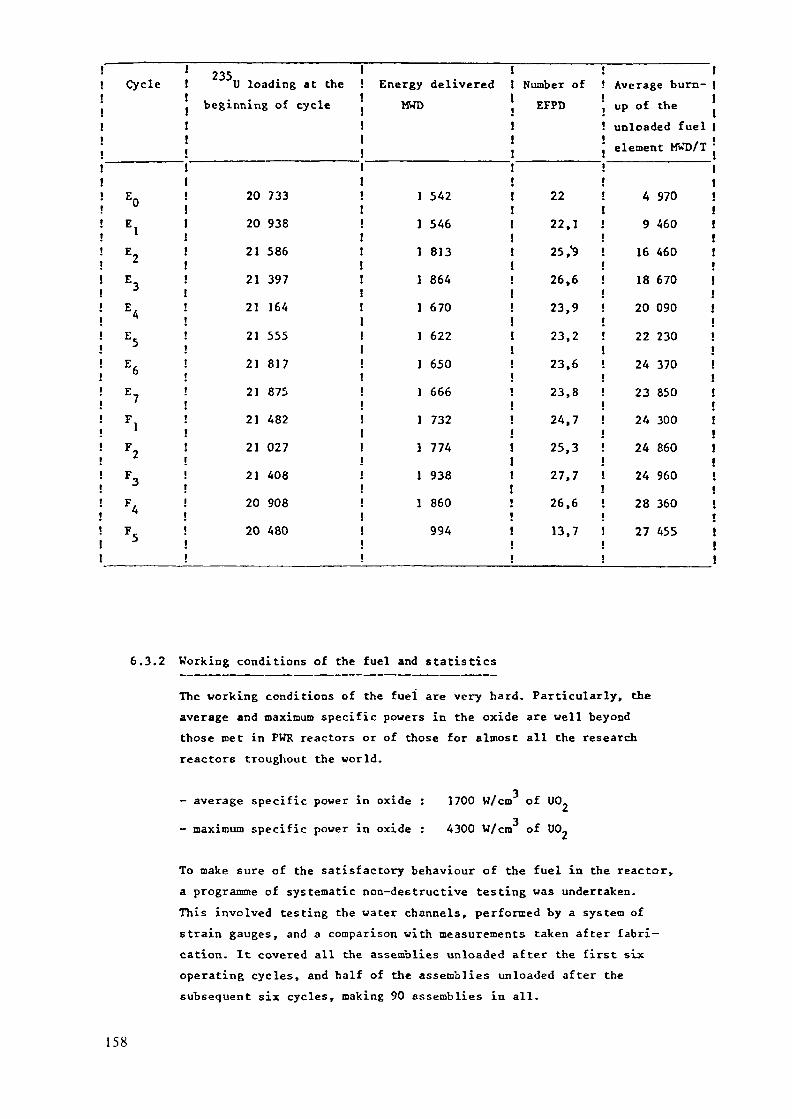
' 235! Cycle ! U loading at thej beginning of cycle
j J] !! 1! EQ ! 201 |
! E ! 20! !! E ! 21! !! E ! 21! !! E ! 21! !! E ! 21! !! E6 ! 21
! E? ! 21
! F ! 21! ' !! F ! 21! !! F3 ! 21
! F ! 20! !! F ! 20! !! !
733938586397164555817875482027408908480
EnergyMWD
1
1
1
1
1
1
1
1
1
1
1
1
!!
Jdelivered I Number
j EFPD
542
546813864670622
650
666732774938860994
!!! 22j! 22,!
! tof ! Average burn- 1
i tJ up of the! unloaded fuel !j element MWD/T 'j!ij
1 !!
t 25 ,"9 !!! 26,1! 23,1! 23,i! 23,! 23,! 24.j! 25,1! 27,! 26,i! 13,!!
!6 !j9 !
!2 !
i6 !8 !7 !
13 !i7 !
6 !i7 !
!!
491618202224232424242827
970460460670090230370850300860960360455
11Ij!i!!Jijiij1
S!•!;!itji!
6.3.2 Working conditions of the fuel and statistics
The working conditions of the fuel are very hard. Particularly, theaverage and maximum specific powers in the oxide are well beyondthose met in PWR reactors or of those for almost all the researchreactors troughout the world.
- average specific power in oxide : 1700 W/cm of U0_
— maximum specific power in oxide : 4300 W/cm of UO-
To make sure of the satisfactory behaviour of the fuel in the reactor,a programme of systematic non-destructive testing was undertaken.This involved testing the water channels, performed by a system ofstrain gauges, and a comparison with measurements taken after fabri-cation. It covered all the assemblies unloaded after the first sixoperating cycles, and half of the assemblies unloaded after thesubsequent six cycles, making 90 assemblies in all.
158
This programme, currently under way, will be supplemented by destruc-
tive testing of one of the most irradiated assemblies, which has
reached a burnup of 30000 MWD/T .
The overall measurements thus taken serve to provide a global es t imate
that is statistically representative of the changes in the characte-
ristics and of the behaviour of the Osiris Caramel element under ir-radiation.
At the start-up with the oxide fuel, the licensing conditions allo-
wed 20000 MWD/T average burn-up for a fuel decent. This lirait vas
raised to 25000 MWD/T in Novanbre 1980 and up to 30000 KWD/T. ia
February 1981. These improvements were founded upon the good behavior
of the fuel conf i rmed by the systematic non-destructive testings on
unloaded i r r ad ia t ed ele^--"!^- "or tlie iroœent this overage burn-up
(30000 MUD/T ) is not reached on the whole of the elements. It
needs to raise the enrichenent to 7,5 T..
Presently 63 elements have got an average burn-up above 20 000 MV.'D/T
among, them, 26 have passed beyond 25000 HWD/T and 8 have reached anaverage burn-up between 28000 and 30000 MWD/T . It has to be pointed
out that at an average burn-up of 30000 MWD/T corresponds to a maxi-
mum burn-up of 40000 to 43000 MWD/T for the most irradiated platelet
7. THE CASE OF OTHER RESEARCH REACTORS
The performance of the fuel in Osirie are high enough to cover all the possi-
bilities of research reactors.
On the other hand, the adaptation of Osiris is not representative of the ma-
jority of the existing reactors, the power of which is of the order of the MW ora few MW. In those cases, the change of tlie fuel might be done without any inpor-
tant modification and with a shorter shut-down time than for Osiris. An exenple
for a low power reactor is given by ISIS, the neutronic mock-up of OSIRIS, the
power of which is limited to 700 KW. The change of the fuel has been realized
without any modification of the core structures of the cooling circuit or ofthe control. The work has been limited to a strengthening of the structures ofthe storage racks. Its for the shut-down time, it was limited to the time neces-
sary to the unloading of the old fuel, to the reloading with the new fuel and tothe measurements of the core parameters for a safe operation (racks efficiency,power mapping, neutron f lux) . OSIRIS and ISIS are clearly situated at the two
ends of the scale. Between the two, all the situations are possible and eachcase is a particular one.
159
Appendix 1-7
URANIUM-ZIRCONIUM HYDRIDE TRIGA-LEU FUEL
GA TECHNOLOGIES, INC.San Diego, California,United States of America
Abstract
The development and testing of TRIGA-LEU fuel with upto 45 wt-% Ü is described. Topics that are discussedinclude properties of hydride fuels, the promptnegative temperature coefficient, pulse heating tests,fission product retention, and the limiting designbasis parameter and values.
General specifications for Er-U-ZrH TRIGA-LEU fuelwith 8.5 to 45 wt-% U and an outline of theinspections during manufacture of the fuel are alsoincluded.
1. INTRODUCTION
The development and use of U-ZrHx fuels for the TRIGA reactor have been
underway at GA since 1957. Over 6000 fuel elements of 7 distinct types havebeen fabricated for the 60 TRIGA research reactors which are under construc-
tion or have been placed in operation. The earliest of these has now passed
25 yrs of operation. U-ZrH fuel has exhibited unique safety features
including a prompt negative temperature coefficient of reactivity, high
fission product retentivity, chemical stability when quenched from high tem-peratures in water, and dimensional stability over large swings of tempera-
ture. The first TRIGA reactor to be exported was for the U.S. exhibit at
the Second Geneva Conference on the Peaceful Uses of Atomic Energy in 1958.
The standard TRIGA fuel contains 8.5 wt-% uranium (20% enriched) as a
fine metallic dispersion in a zirconium hydride matrix. The H/Zr ratio is
nominally 1.6 (in the face-centered cubic delta phase). The equilibrium
hydrogen dissociation pressure is governed by the composition and tempera-
ture. For ZrHi.6 the equilibrium hydrogen pressure is 1 atm at about 760°C.The single-phase, high-hydride composition eliminates the problems of den-
sity changes associated with phase changes and with thermal diffusion of the
hydrogen. TRIGA fuel with 12 wt-% U has been proven through successfulreactor operation for over a decade. Highly enriched versions of TRIGA
161
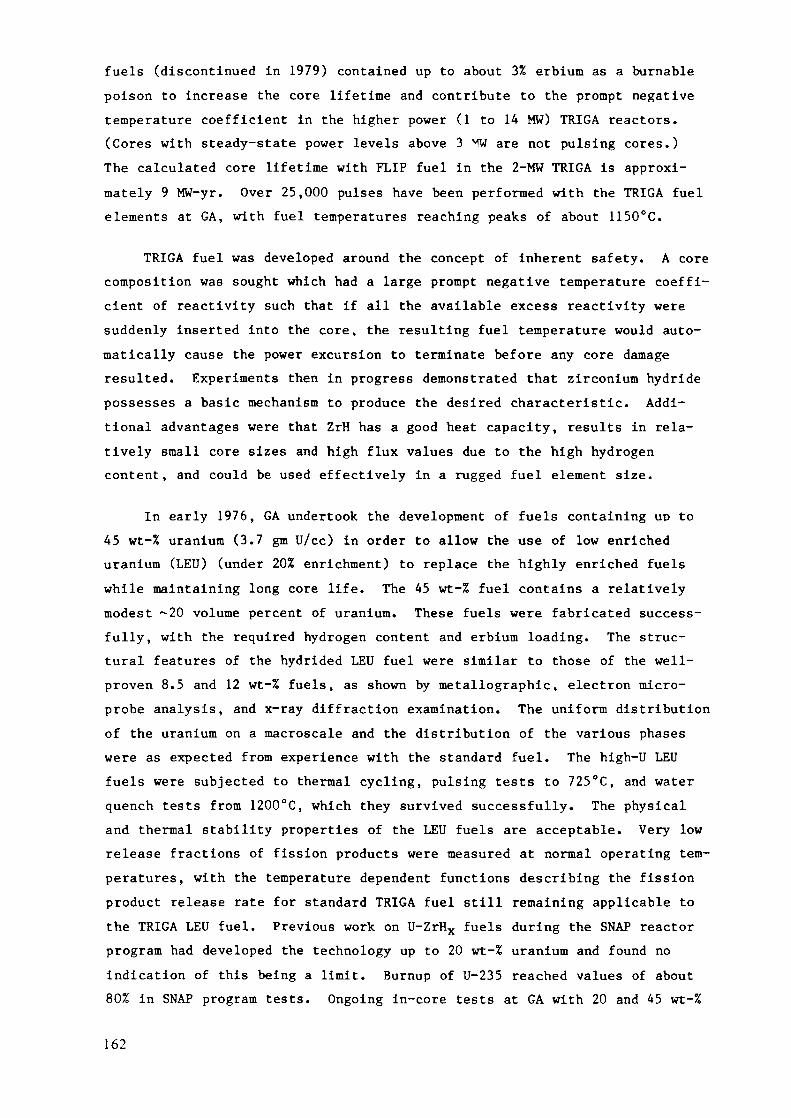
fuels (discontinued in 1979) contained up to about 3% erbium as a burnablepoison to increase the core lifetime and contribute to the prompt negativetemperature coefficient in the higher power (1 to 14 MW) TRIGA reactors.(Cores with steady-state power levels above 3 MW are not pulsing cores.)The calculated core lifetime with FLIP fuel in the 2-MW TRIGA is approxi-mately 9 MW-yr. Over 25,000 pulses have been performed with the TRIGA fuelelements at GA, with fuel temperatures reaching peaks of about 1150°C.
TRIGA fuel was developed around the concept of inherent safety. A corecomposition was sought which had a large prompt negative temperature coeffi-cient of reactivity such that if all the available excess reactivity weresuddenly inserted into the core, the resulting fuel temperature would auto-matically cause the power excursion to terminate before any core damageresulted. Experiments then in progress demonstrated that zirconium hydridepossesses a basic mechanism to produce the desired characteristic. Addi-tional advantages were that ZrH has a good heat capacity, results in rela-tively small core sizes and high flux values due to the high hydrogencontent, and could be used effectively in a rugged fuel element size.
In early 1976, GA undertook the development of fuels containing up to45 wt-% uranium (3.7 gm U/cc) in order to allow the use of low enricheduranium (LEU) (under 20% enrichment) to replace the highly enriched fuelswhile maintaining long core life. The 45 wt-% fuel contains a relativelymodest "20 volume percent of uranium. These fuels were fabricated success-fully, with the required hydrogen content and erbium loading. The struc-tural features of the hydrided LEU fuel were similar to those of the well-proven 8.5 and 12 wt-% fuels, as shown by metallographic, electron micro-probe analysis, and x-ray diffraction examination. The uniform distributionof the uranium on a macroscale and the distribution of the various phaseswere as expected from experience with the standard fuel. The high-U LEUfuels were subjected to thermal cycling, pulsing tests to 725°C, and waterquench tests from 1200°C, which they survived successfully. The physicaland thermal stability properties of the LEU fuels are acceptable. Very lowrelease fractions of fission products were measured at normal operating tem-peratures, with the temperature dependent functions describing the fissionproduct release rate for standard TRIGA fuel still remaining applicable tothe TRIGA LEU fuel. Previous work on U-ZrHx fuels during the SNAP reactorprogram had developed the technology up to 20 wt-% uranium and found noindication of this being a limit. Burnup of U-235 reached values of about80% in SNAP program tests. Ongoing in-core tests at GA with 20 and 45 wt-%
162

fuel started in April 1978. These tests have been an unqualified successduring pulsing and steady-state operation including over 2000 thermal cycleswhere the reactor has gone from shutdown to powers of 1 to 1.5 MW.
The final demonstration of the TRIGA LEU fuel is being performed by afull-scale, long-term fuel burnup test which is under way at the 30-MW OakRidge Research Reactor as part of the U.S. Department of Energy RERTR pro-gram managed by Argonne National Laboratory. A standard geometry 16-rodTRIGA LEU cluster containing uranium loadings of 20, 30, and 45 wt-% isbeing tested. The fuel rods are 12.95 mm O.D., clad with 4.06 mm Incoloy,and the fuel length is 559 mm.
The test objectives are to reach burnup values of 35, 40, and 50% ofcontained U-235 respectively in the fuels with 20, 30, and 45 wt-% uranium.The test began in December 1979 and these objectives have been successfullymet in all but the 45 wt-% fuel and it should complete testing by the end of1983.
The high-U LEU fuel was also subjected to water-quench safety tests byquenching from temperatures up to 1200°C. The results showed that this fuelalso survives the quench tests with a benign response, with only minorcracking, volume shrinkage, loss of hydrogen, and surface oxidation.
The remaining evaluations included analytical assessments of theprompt negative temperature coefficient of reactivity and the core lifetime(Table 1). Nuclear design and analytical studies have shown that the promptnegative temperature coefficient for the 20 wt-% uranium fuel is essentiallythe same as that for standard fuel over the temperature range of interest(20° to 700°C) and greater than that for the FLIP fuel which it replaces.The prompt negative temperature coefficient for the more highly loaded LEUfuel shows a temperature dependence, whereas the coefficient is relativelyconstant for standard fuel. The value of the prompt negative temperaturecoefficient of reactivity is slightly lower for the 45 wt-% uranium fuelcompared to the highly enriched fuel it replaces; however, it is still largeand significantly higher than the prompt negative temperature coefficientsfor any other type of reactor fuel.
Inclusion of erbium burnable poison in the TRIGA LEU fuel has enabledcore lifetimes of up to 7000 MWd to be predicted for the 45 wt-% fuel. Itis emphasized that this is the core life to the time of initial refueling.
163

TABLE 1CALCULATED BEGINNING OF LIFE PROMPT NEGATIVE
TEMPERATURE COEFFICIENT (a) AND CORE LIFETIME
TRIGAFuel Type
StandardLEULEUFLIP10 MW10 MW-LEU14 MW14 MW-LEU
Diameter(in.)
1.51.51.51.50.50.50.50.5
Length(in.)
1515151522222222
Wt % UraniumEnrichmen
U
8.520308.510451045
Er
0.000.500.921.581.700.662.801.40
/ o/ \\ m /
2020207093209320
x 10~5 = at Average
(23°-700°C)
10118106586
CoreLifetime^3)(MWd)
-1001200300035004800400080007000
(a)Before initial reload.
For an equilibrium cycle core starting with 45 wt-% U fuel and removing fuel
with 50% burnup of the contained uranium, the core life would be over 14000MWd for the 14-MW core configuration.
2. PROPERTIES OF HYDRIDE FUELS
2.1. PHASE SYSTEMS
The ZrH and U-ZrH systems are essentially simple eutectoids containingat least four separate hydride phases in addition to the zirconium anduranium allotropes (Fig. 1). The hydride phases consist of the following:
1. Alpha phase:
2. Beta phase:
3. Delta phase:
a low-temperature terminal solid solution of
hydrogen in the hexagonal, close-packed, alphazirconium lattice.
a solid solution of hydrogen dissolved in the
high-temperature, body-centered cubic zirconium
phase.
a face-centered cubic hydride phase. A delta-
prime phase has also been reported, formed below
240°C from the delta phase.
164
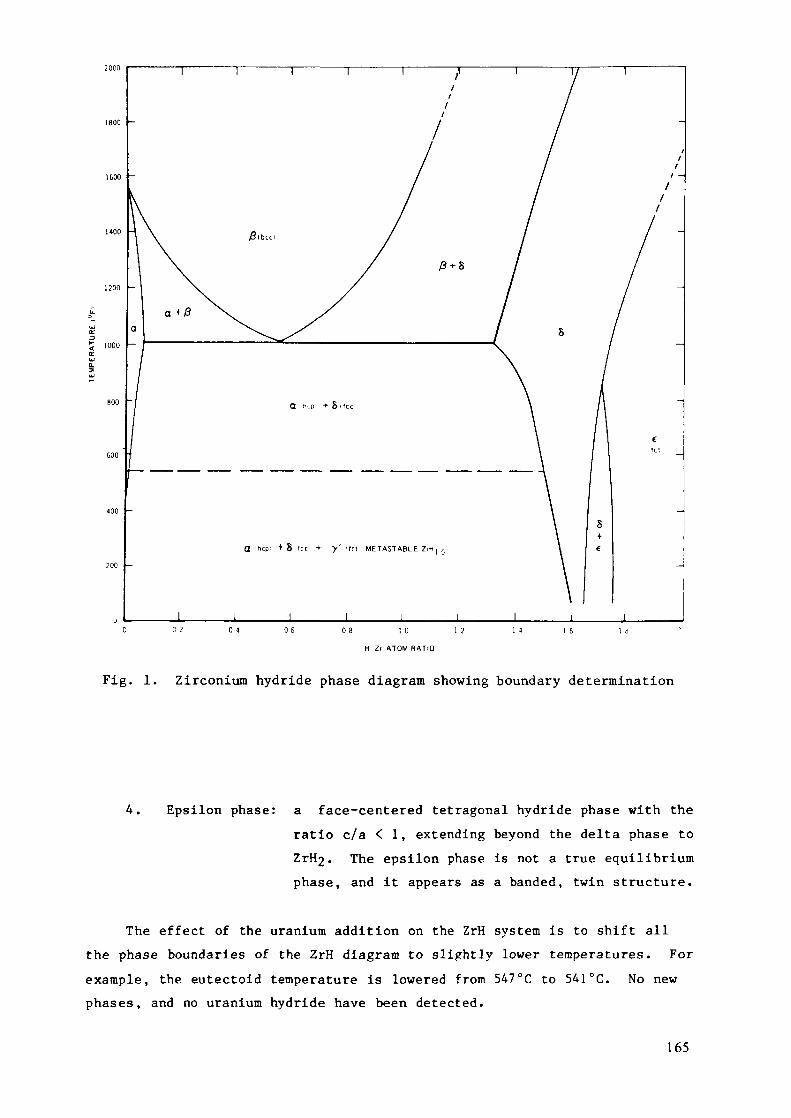
1600
C 2 04
H Zt ATOM RATIO
Fig. 1. Zirconium hydride phase diagram showing boundary determination
4. Epsilon phase: a face-centered tetragonal hydride phase with theratio c/a < 1, extending beyond the delta phase toZrH2« The epsilon phase is not a true equilibriumphase, and it appears as a banded, twin structure.
The effect of the uranium addition on the ZrH system is to shift allthe phase boundaries of the ZrH diagram to slightly lower temperatures. Forexample, the eutectoid temperature is lowered from 547°C to 541°C. No newphases, and no uranium hydride have been detected.
165

O•iH4.)
O
MSI
A
œ
•o0)CßW(U)-lG.X0)
O)•o•HSJ
13
g
vHdoop•HN
tn0)!-iOx;oow
3cnto0)
do
uotncn
•H[K
(WiV)
166
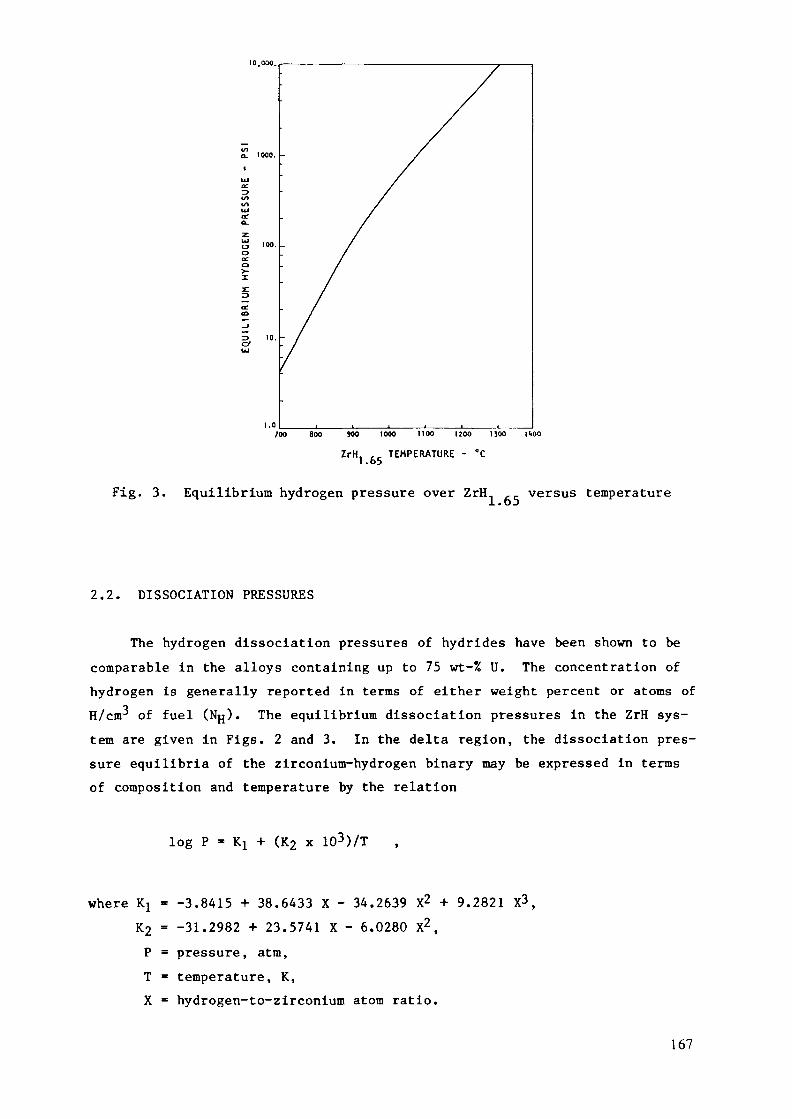
10,000.
1.0700 800 900 1000 1100 1200 1300 HOO
ZrH. ,.. TEMPERATURE - °C1 .05
Fig. 3. Equilibrium hydrogen pressure over ZrH.. AC. versus temperature.L * O J
2.2. DISSOCIATION PRESSURES
The hydrogen dissociation pressures of hydrides have been shown to becomparable in the alloys containing up to 75 wt-% U. The concentration ofhydrogen is generally reported in terms of either weight percent or atoms ofH/cm of fuel (Njj). The equilibrium dissociation pressures in the ZrH sys-tem are given in Figs. 2 and 3. In the delta region, the dissociation pres-sure equilibria of the zirconium-hydrogen binary may be expressed in termsof composition and temperature by the relation
log P = K! + (K2 x 103)/T
where iq = -3.8415 + 38.6433 X - 34.2639 X2 + 9.2821K2 = -31.2982 + 23.5741 X - 6.0280 X2,P = pressure, atm,T = temperature, K,X = hydrogen-to-zirconium atom ratio.
167

The higher-hydride compositions (H/Zr > 1.5) are single-phase (delta orepsilon) and are not subject to thermal phase separation on thermal cycling.For a composition of about ZrH^g, the equilibrium hydrogen dissociationpressure is 1 atm at about 760°C. The absence of a second phase in thehigher hydrides eliminates the problem of large volume changes associatedwith phase transformation at approximately 540°C in the lower hydride compo-sitions. Similarly, the absence of significant thermal diffusion of hydro-gen in the higher hydrides precludes concomitant volume change and cracking.The clad material of stainless steel or nickel alloys will provide a satis-factory diffusion barrier to hydrogen at long-term (several years) sustainedcladding temperatures below about 300°C.
2.3. HYDROGEN MIGRATION
Under nonisothermal conditions, hydrogen migrates to lower-temperatureregions from higher-temperature regions. The equilibrium dissociationpressure obtained when the redistribution is complete is lower than thedissociation pressure before redistribution. The dimensional changes ofrods resulting from hydrogen migration are of minor importance in the deltaand epsilon phases.
2.4. HYDROGEN RETENTION
The rates of hydrogen loss through 250-ym-thick stainless steelcladding are low at cladding temperatures characteristic of TRIGA fuel ele-ments. A 1% loss of hydrogen per year occurs at about 500°C (900°F) cladtemperature.
2.5. DENSITY
The density of ZrH decreases with an increase in the hydrogen content.The density change is quite high up to the delta phase (H/Zr = 1.5) and thenchanges little with further increases in hydrogen. The bulk density of mas-sively hydrided zirconium is reported to be about 2% lower than the x-raydensity.
For hydrogen to zirconium ratios, x, of less than 1.6, the density ofZrHx used for TRIGA design calculations is
PZrH = 1.7(0.1541 + 0.0145 X)
168
and for X greater than or equal to 1.6
PZrH = l./(0.1706 + 0.0042 X)
The density of uranium-zirconium hydride is
PUZrH = I./(WU/PU + wzrH/PZrH)
where wy, v^^ = weight fraction of uranium and zirconium hydride respec-tively and PU = uranium density (19.07 gm/cnr).
By combining the above formulae, and using X = 1.6, the followingrelationships are obtained for the uranium density and weight fraction inthe U-ZrHi.6 alloy:
PU(A) 0.177 - 0.125 wjj
m 0.177PU(A)^ 1 + 0.125pu(A)
The relationship between the uranium density and the volume fraction ofuranium in the alloy is given by:
pu(A) = 19.07
where Vf^(A) = volume fraction of uranium in the U-ZrHj^ alloy.
2.6. THERMAL CONDUCTIVITY
Thermal conductivity measurements have been made over a range oftemperatures. A problem in carrying out these measurements by conventionalmethods is the disturbing effect of hydrogen migration under the thermalgradients imposed on the specimens during the experiments. This has beenminimized at GA by using a short-pulse heating technique to determine thethermal diffusivity and hence to permit calculation of the thermal conduc-tivity. From the recent measurements at GA of thermal diffusivity coupledwith the data on density and specific heat, the thermal conductivity ofuranium-zirconium hydride with an H/Zr ratio of 1.6 is 0.042 ± 0.002cal/sec-cm-°C and is insensitive both to the weight fraction of uraniumand to the temperature.
169

2.7. HEAT CAPACITY
The heat content of zirconium hydride as a function of temperature andcomposition (ZrHx) is approximated well by the following relationship:
(H-H25)ZrHx = 0.03488 T2 + [34.446 + 14.8071 (x - 1.65)]T- 882.95 - 370.18 (x - 1.65) J/mole
where T is in °C.
The specific heat of ZrH^g is
Cp = (0.06976 T + 33.706)/M J/g °C
where M = the molecular weight of ZrHj^ = 92.83 g/mole.
The specific heat of uranium is
Cp = (1.305 x 10~4 T + 0.1094; J/g °C.
The specific heat of uranium-zirconium hydride is taken to be
CP(UZrH) = W(U) CP(u) + W(ZrH) Cp(ZrH) .
The volumetric specific heat of 8.5 wt-% U-ZrHjw5 is calculated to be
Cp = 2.04 +4.17 x 10~3 T W-sec/cm3 °C (from 0°C)
2.8. CHEMICAL REACTIVITY
Zirconium hydride has a relatively low reactivity in water, steam, andair at temperatures up to about 600°C. Massive zirconium hydride has beenheated in air for extended periods of time at temperatures up to 600°C withnegligible loss of hydrogen. An oxide film forms which inhibits the loss ofhydrogen.
The hydride fuel has excellent corrosion resistance in water. Barefuel specimens have been subjected to a pressurized water environment at570°F and 1230 psi during a 400 hr period in an autoclave. The average cor-
170

rosion rate was 350 nig/cm^-month weight gain, accompanied by a conversion ofthe surface layer of the hydride to an adherent oxide film. The maximumextent of corrosion penetration after 400 hr was less than 2 mils.
In the early phases of development of the TRIGA fuel, water-quenchtests were carried out from elevated temperatures. Fuel rods (1-in. diam)were heated to 800°C and end-quenched to test for thermal shock and corro-sion resistance. No deleterious effects were observed. Also, a 6-mm diamfuel rod was heated electrically to about 800°C and a rapid stream of waterwas sprayed on it; no significant reaction was observed. Small and largesamples were heated to 900°C and quenched in water; the only effect observedwas a slight surface discoloration. Finely divided U-ZrH powder was heatedto 300°C and quenched in 80°C water; no reaction was observed. Later, thesetests were extended to temperatures as high as 1200°C, in which tapered fuelrods were dropped into tapered aluminum cans in water. Although the samplescracked and lost hydrogen, no safety problem arose in these tests.Recently, the low-enriched TRIGA fuels have been subjected to water-quenchsafety tests at GA.
Quench tests were performed on 20%-enriched TRIGA fuel samples (45 wt-%uranium, 53 wt-% zirconium, 1 wt-% erbium, 1 wt-% hydrogen) to simulatecladding rupture and water ingress into the TRIGA reactor fuel rods duringoperation.
These results indicate satisfactory behavior of TRIGA fuel for tempera-tures to at least 1200°C. Under conditions where the clad temperature canapproach the fuel temperature for several minutes (which may allow formationof eutectics with the clad), the results indicate satisfactory behavior toabout 1050°C. This is still about 50° to 100°C higher than the temperatureat which internal hydrogen pressure is expected to rupture the clad, shouldthe clad temperature approach that of the fuel. It should be pointed outthat thermocouples have performed well in instrumented TRIGA fuel elementsat temperatures up to 650°C in long-term steady-state operations, and up to1150°C in very short time pulse tests.
2.9. IRRADIATION EFFECTS
Most of the irradiation experience to date has been with the uranium-zirconium hydride fuels used in the SNAP (containing about 10 wt-% uranium)
171

and TRIGA reactors. The presence of uranium influences the radiationeffects because of the damage resulting from fission recoils and fissiongases. Some significant conclusions may be drawn from the results of theseexperiments. The uranium is present as a fine dispersal (about 1 pm diam)in the U-ZrH fuels, and hence the recoil damage is limited to small regionswithin the short (~10 ym) range of the fission recoils. The U-ZrH fuelexhibits high growth rate during initial operation, the so-called "offset"growth period, which has been ascribed to the vacancy-condensation type ofgrowth phenomenon over the temperature range where voids are stable.
The swelling of the U-ZrH fuels at high burnups is governed by threebasic mechanisms:
1. The accommodation of solid fission products resulting from fissionof U-235. This growth is approximately 3% AV/V per metal atom %burnup. This mechanism is relatively temperature insensitive.
2. The agglomeration of fission gases at elevated temperatures (above1300°F). This takes place by diffusion of the xenon and kryptonto form gas bubbles.
3. A saturable cavity nucleation phenomenon which results from thenucleation and growth of irradiation-formed vacancies into voidsover a certain range of temperatures where the voids are stable.The saturation of growth by this mechanism was termed offsetswelling. It was deduced from the rapid decrease in fuel-to-cladding AT experienced during the early part of the irradia-tion. The saturation was reached in approximately 1500 hr.
The effect of fuel operating temperature (at offset) on fuel growth fora constant burnup rate (burnup per 10,000 hr) is shown in Fig. 4. Theeffect of burnup rate on fuel growth for a constant offset temperature isshown in Fig. 5. Note the decreased growth with higher burnup rates.
Burnups of up to about 0.52 total metal atom % (75% burnup of theU-235) have been attained in standard TRIGA fuel. The TRIGA LEU fuels con-tain 1.8, 2.9, and 4.8 metal atom % as U-235 for the fuels with 20, 30, and45 wt-% U, respectively. Burnups of 35% and 40% of the contained uranium in20 and 30 wt-% U fuels have been successfully completed in the Oak Ridgeirradiation and the burnup of about 50% of the contained U in the fuel with45 wt-% U should be completed by the end of 1983.
172
BURNUPRATE = 0 1 MET AT %
Fig. 4.
0 01 02 03 04 05 06 07
BURNUP<MET AT %)
U-ZrH volume increase versus burnup for different fuel operatingtemperatures
BURNUPRATE(MET AT %/10,OOOHR) 0 1
760°C
OFFSET GROWTH PERIOD
I_____I I01 02 03 04 05
BURNUP (MET AT %l06 0 7
Fig. 5. U-Zrh volume increase versus burnup for different fuel burnuprates
2.10. ERBIUM ADDITIONS
All available evidence and extensive operating experience indicatesthat the addition of erbium to the U-ZrH introduces no deleterious effectsto the fuel. Erbium has a high boiling point and a relatively low vapor
173

pressure so that it can be melted into the uranium-zirconium uniformly. Theerbium is incorporated into the fuel during the melting process. All theanalyses that have been made on the alloy show that the erbium is disperseduniformly, much as is the uranium. Erbium is a metal and forms a metallicsolution with the uranium-zirconium; thus there is no reason to believe thatthere will be any segregation of the erbium. Erbium forms a stable hydride(as stable as zirconium hydride) which also indicates that the erbium willremain uniformly dispersed through the alloy. Also, since neutron capturein erbium is an n-y reaction, there are no recoil products.
3. PROMPT NEGATIVE TEMPERATURE COEFFICIENT
The basic parameter which provides the greatest degree of safety in theoperation of a TRIGA reactor system is the prompt negative temperature coef-ficient. This temperature coefficient (a) allows great freedom in steady-state operation, since the effect of accidental reactivity changes occurringfrom experimental devices in the core is minimized.
The prompt negative temperature coefficient for the TRIGA LEU core isbased on the same core spectrum hardening characteristic that occurs in astandard TRIGA core. The spectrum hardening is caused by heating of thefuel-moderator elements. The rise in temperature of the hydride increasesthe probability that a thermal neutron in the fuel element will gain energyfrom an excited state of an oscillating hydrogen atom in the lattice. Asthe neutrons gain energy from the ZrH, the thermal neutron spectrum in thefuel element shifts to a higher average energy (the spectrum is hardened),and the mean free path for neutrons in the element is increased appreciably.For a standard TRIGA element, the average chord length is comparable to amean free path, and the probability of escape from the element before beingcaptured is significantly increased as the fuel temperature is raised. Inthe water, the neutrons are rapidly rethermalized so that the capture andescape probabilities are relatively insensitive to the energy with which theneutron enters the water. The heating of the moderator mixed with the fuelin a standard TRIGA element thus causes the spectrum to harden more in thefuel than in the water. As a result, there is a temperature-dependent dis-
*A standard TRIGA core contains U-ZrH fuel with no erbium. The uraniumenrichment is 20%, and the fuel element (rod) diameter is about 1.5 in. (3.8cm) with a core water volume fraction of about 0.33.
174
advantage factor for the unit cell in which the ratio of absorptions in thefuel to total cell absorptions decreases as fuel element temperature isincreased. This brings about a shift in the core neutron balance, giving aloss of reactivity.
In the TRIGA LEU fuel, the temperature-hardened spectrum is used todecrease reactivity through its interactions with a low-energy-resonancematerial. Thus, erbium, with its double resonance at ~0.5 eV, is used inthe TRIGA LEU fuel as both a burnable poison and a material to enhance theprompt negative temperature coefficient. The ratio of the absorption proba-bility to the neutron leakage probability is increased for TRIGA LEU fuelrelative to the standard TRIGA fuel because the U-235 density in the fuelrod is greater and also because of the use of erbium. When the fuel-moderator material is heated, the neutron spectrum is hardened, and the neu-trons have an increasing probability of being captured by the low-energyresonance in erbium. This increased parasitic absorption with temperaturecauses the reactivity to decrease as the fuel temperature increases. Theneutron spectrum shift, pushing more of the thermal neutrons into the Er-167resonance as the fuel temperature increases, is illustrated in Fig. 6, wherecold and hot neutron spectra are plotted along with the energy-dependentabsorption cross-section for Er-167. As with a standard TRIGA core, thetemperature coefficient is prompt because the fuel is intimately mixed witha large portion of the moderator; thus, fuel and solid moderator tempera-tures rise simultaneously, producing the temperature-dependent spectrum shift.
100
FUEL TEMP = 23 °CWATER TEMP = 23 °C
FUEL TEMP = 700 °CWATER TEMP = 23 °C
0.001 0 . 0 1 0. 1
ENERGY (eV)
1.0
Fig. 6. Thermal neutron spectra versus fuel temperature relative to0 versus energy for Er-167
175

For the reasons just discussed, more than 50% of the temperaturecoefficient for a standard TRIGA core comes from the temperature-dependentdisadvantage factor, or cell effect, and ~20% each come from Doppler broad-ening of the U-238 resonances and temperature-dependent leakage from thecore. These effects produce a temperature coefficient of - -10 x 10~V°C,which is essentially constant with temperature. On the other hand, for aTRIGA LEU core, the effect of cell structure on the temperature coefficientis smaller. Over the temperature range 23° to 700°C, about 70% of the coef-ficient comes from temperature-dependent changes in the parasitic absorptionwithin the core, and more than half of this effect is independent of thecell structure. Almost all the remaining part of the prompt negativetemperature coefficient is contributed by Doppler broadening of the U-238resonances. Over the temperature range 23° to 700°C, the temperaturecoefficient for the TRIGA LEU fuel with 20 wt-% U is about 1.07 x 10⁻⁴/°C,thus being somewhat greater than the value for standard TRIGA fuel. It isalso temperature dependent.
4. PULSE HEATING
The U-ZrH fuel used in TRIGA reactors is capable of operation underconditions of transient experiments for delivery of high-intensity bursts ofneutrons. For these experiments, done in reactors with steady-state powerratings of up to 3 MW, the reactor is equipped with a special control rodmechanism that provides a method of obtaining a step reactivity change ofpredetermined magnitude in the reactor. During the nuclear pulse, nearlyall the energy is stored as thermal energy in the fuel material. Thisresults in an almost instantaneous rise in the temperature of the fuel body.Fuel elements with 8.5 wt-% U have operated repeatedly in the advanced TRIGAprototype reactor (ATPR) to peak power levels of over 8000 MW providing aneutron fluence per pulse of about 10^-> nvt.
The ATPR fuel elements have been subjected to thousands of pulses of2000 MW and more. The nuclear safety stems from the large prompt negativetemperature coefficient of reactivity of the uranium-zirconium hydride fuel-moderator material. The inherent prompt shutdown mechanism of TRIGA reac-tors has been demonstrated extensively during the tens of thousands ofpulses conducted on TRIGA reactors. These tests involved step insertions ofreactivity of up to 3-1/2% 5k/k. An in-pile test has been performed on fuelelements of a modified design (gapped) for high performance in the TRIGA
176

annular core pulse reactor (ACPR). As expected, there was satisfactory fuelbody performance after 400 pulses at temperatures up to the design point of1000°C. There was no evidence of interaction between the clad and the fuel.The transient gap pressure in the space between the fuel and the clad wasmeasured during the pulse, and peak pressures were found to be less than 40psia - well below the upper bound implied by the equilibrium pressure data.As testing at higher temperatures continued, there was some evidence that athot-spot regions, where the temperature near the fuel surface reached about1200°C, the fuel gradually swelled slightly over a large number of pulsesunder the influence of the hydrogen pressure in small bubbles that nucleatedin the hot spots (~1200°C, U-ZrHj.55-1.79) and formed a gray patch.
From the results of these tests, it can be concluded that U-ZrH fuelelements can be safely pulsed even to very high fuel temperatures. Aftermore than 400 pulses to fuel temperatures over 1100°C, measurements showedthat two of the five test elements exceeded the conservative dimensionaltolerances. In the first 200 pulses, there was no external evidence ofchange in any of the five special test elements. The practical consequencesof this are several-fold. First, small power reactors using U-ZrH fuel cansafely sustain accidental power excursions to high fuel temperature. Sec-ond, and perhaps more significant, high-level pulsing reactors (fluence of10^5 nvt) can be operated with U-ZrH fuel with a reasonable fuel lifetime.For example, the annular core TRIGA reactor at JAERI (Japan) has operatedsince 1975, with over 1000 pulses of all sizes at fuel temperatures of up to1000°C. Further, with regard to standard types of TRIGA research reactors,it is evident that present peak fuel temperatures are conservative.
5. FISSION PRODUCT RETENTION
A number of experiments have been performed to determine the extent towhich fission products are retained by U-ZrH (TRIGA) fuel. Experiments onfuel with a uranium density of 0.5 g/cm^ (8.5 wt-% U) were conducted over aperiod of 11 yr and under a variety of conditions. Results prove that onlya small fraction of the fission oroducts are released, even in completelyunclad U-ZrH fuel. The release fraction varies from 1.5 x 10~5 for anirradiation temperature of 350°C to ~10~2 at 800°C.
The experiments show that there are two mechanisms involved in therelease of fission products from U-ZrH fuel, each of which predominates over
177
a different temperature range. The first mechanism is that of fission frag-ment recoil into the gap between the fuel and clad. This effect predomi-nates in fuel at temperatures up to ~-400°C; the recoil release rate isdependent on the fuel surface-to-volume ratio but is independent of fueltemperature. Above ~400°C, the controlling mechanism for fission productrelease from U-ZrH fuel is a diffusion-like process, and the amount releasedis dependent on the fuel temperature, the fuel surface-to-volume ratio, thetime of irradiation, and the isotope half-life.
The results of the U-ZrH experiments, and measurements by others offission product release from Space Nuclear Auxiliary Power Program (SNAP)fuel, have been compared and found to be in good agreement.
The fractional release, <J> , of fission product gases into the gapbetween fuel and clad from a full-size standard U-ZrH fuel element is givenby:
4. = 1.5 x 1CT5 + 3.6 x K^e'1-34 x 10A/T + 273) >
where T = fuel temperature, °C.
This function is plotted in Fig. 7. The first term of this function isa constant for low-temperature release; the second term is the high-temperature portion.
The release fractions have all been normalized to a standard ratio offuel-clad gap to fuel diameter, although individual measurements were madewith different geometry.
The curve in Fig. 7 applies to a fuel element which has been irradiatedfor a time sufficiently long that all fission product activity is at equi-librium. Figure 7 shows that the measured values of fractional releasesfall well below the curve. Therefore, for safety considerations, this curvegives conservative values for the high-temperature release from U-ZrH fuel.
The results of recent studies in the TR1GA reactor at GA on fissionproduct release from fuel elements with high uranium loadings (up to 3.7 gU/cm , 45 wt-% U) agree well with data just presented from similar experi-ments with lower U loadings. As was the case with the lower U loadings, therelease was determined to be predominantly recoil controlled at temperatures
178
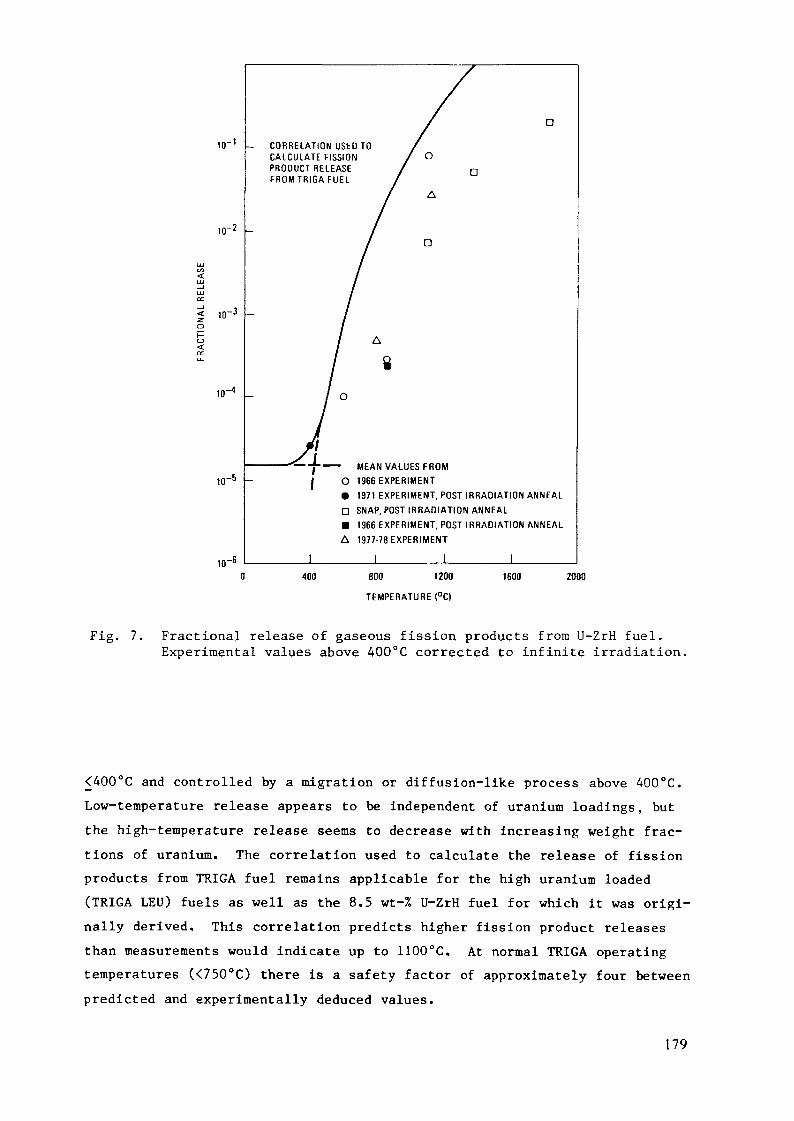
10,-1 CORRELATION USED TOCALCULATE FISSIONPRODUCT RELEASEF R O M T R I G A F U E L
10-2
10,-3
10-5
10"
MEAN VALUES FROMO 1966 EXPERIMENT• 1971 EXPERIMENT, POST IRRADIATION ANNEALD SNAP, POST IRRADIATION ANNEAL• 1966 EXPERIMENT, POST IRRADIATION ANNEALA 1977-78 EXPERIMENT
I_________|_________|_______
400 800 1200
TEMPERATURE (°C|
1600 2000
Fig. 7. Fractional release of gaseous fission products from U-ZrH fuel.Experimental values above 400°C corrected to infinite irradiation.
<400°C and controlled by a migration or diffusion-like process above 400°C.Low-temperature release appears to be independent of uranium loadings, butthe high-temperature release seems to decrease with increasing weight frac-tions of uranium. The correlation used to calculate the release of fissionproducts from TRIGA fuel remains applicable for the high uranium loaded(TRIGA LEU) fuels as well as the 8.5 wt-% U-ZrH fuel for which it was origi-nally derived. This correlation predicts higher fission product releasesthan measurements would indicate up to 1100°C. At normal TRIGA operatingtemperatures (<750°C) there is a safety factor of approximately four betweenpredicted and experimentally deduced values.
179

6. LIMITING DESIGN BASIS PARAMETER AND VALUES
Fuel-moderator temperature is the basic limit of TRIGA reactor opera-tion. This limit stems from the out-gassing of hydrogen from the ZrHx andthe subsequent stress produced in the fuel element clad material. Thestrength of the clad as a function of temperature can set the upper limit onthe fuel temperature. A fuel temperature safety limit of 1150°C for puls-ing, stainless steel U-ZrHi.65 fuel is used as a design value to precludethe loss of clad integrity when the clad temperature is below 500°C. Whenclad temperatures can equal the fuel temperature, the fuel temperature limitis 950°C. There is also a steady-state operational fuel temperature designlimit of 750°C based on consideration of irradiation- and fission-product-induced fuel growth and deformation. This is a time and temperature-dependent fuel growth as discussed earlier. A maximum temperature of 750°Chas been used as the operational design basis temperature because resultingaverage fuel temperatures result in insignificant calculated fuel growthfrom temperature-dependent irradiation effects. (For ACPR fuel, whereburnup is extremely low, the steady-state operational fuel temperaturedesign criterion is 800°C.)
The dissociation pressure of the zirconium-hydrogen system is theprincipal contributor to the fuel element internal pressure at fuel tempera-tures above ~800°C. Below ~800°C, trapped air and fission product gases canbe the major contributors to the internal pressure. At equilibrium condi-tion, this pressure is a strong function not only of temperature but also ofthe ratio of hydrogen to zirconium atoms and the carbon content of the mate-rial. The current upper limit for the hydrogen-to-zirconium ratio is 1.65;the design value is 1.6. The carbon content is currently about 0.2% (2000ppm). The equilibrium hydrogen pressure as a function of temperature forthe fuel is shown in Fig. 3.
The equilibrium condition defined above never occurs, however, becausethe fuel is not a constant temperature over the whole volume. Consequently,the hydrogen pressures will be much lower than the equilibrium values calcu-lated for the maximum temperature. As hydrogen is released from the hotfuel region, it is taken up in the cooler regions and the equilibrium thatis obtained is characteristic of some temperature lower than the maximum.To evaluate this reduced pressure, diffusion theory is used to calculate therate at which hydrogen is evolved and reabsorbed at the fuel surface. Inthe closed system considered here, the hydrogen not only diffuses into the
180

.001.001 .01 O.I 1. 10 100TIME AFTER INCREASES IN TEMPERATURE - (SEC)
Fig. 8. Fuel element internal pressure versus time after a step increasein maximum fuel temperature
fuel/fuel clad gap, but also diffuses back into the fuel in the regions oflower fuel temperature. When the diffusion rates are equal, an equilibriumcondition will exist.
In Fig. 8, the ratio of the fuel element internal pressure to theequilibrium hydrogen pressure is plotted as a function of time after a stepincrease in temperature. The maximum fuel temperature is 1150°C for whichthe equilibrium hydrogen pressure in ZrH1>65 is 2080 psi. The calculationindicates, however, that the internal pressure increases for about 0.3 sec,when the pressure is -420 psi, or -20% of the equilibrium value. After thistime, the pressure slowly decreases as the hydrogen continues to be redis-tributed along the length of the element from the hot regions to the coolerregions. Calculations were also made for step increases in power to thepeak fuel temperatures of 1200° and 1350°C. Over this range, the time tothe peak pressure and the fraction of the equilibrium pressure valueachieved were approximately the same as for the 1150°C case. Thus, if theclad remains below ~138°C, the maximum internal pressure that would producethe yield stress in the clad is 1025 psi, and the corresponding equilibriumhydrogen pressure could be five times greater or ~5000 psi. This pressurecorresponds to a maximum fuel temperature of ~1240°C in ZrHj^s. Similarly,
181

the equilibrium hydrogen pressure could be 5 x 1840 or 9200 psi before theultimate clad strength was reached corresponding to a fuel temperature of~1300°C.
The ultimate strength of the clad decreases slowly to about 57,000 psiat 500°C. Since the pressure is a strong function of fuel temperature, thefuel temperature to produce rupture decreases very slowly over this range,remaining at 1300°C for a clad temperature up to 300°C and decreasing to~1293°C and 1282°C for clad temperatures of 400°C and 500°C respectively.For nongapped TRIGA pulsing fuel elements, the clad temperature during heatflow from a pulse is greater than the 138°C ACPR value but normally <500°C.
Measurements of hydrogen pressure in TRIGA fuel elements during steady-state operation have not been made. However, measurements have been madeduring transient operations and compared with the results of an analysissimilar to that described here.
These measurements indicated that in a pulse in which the maximumtemperature in the fuel was greater than 1000°C, the maximum pressure wasonly ~6% of the equilibrium value evaluated at the peak temperature. Calcu-lations of the pressure resulting from such a pulse using the methodsdescribed above gave calculated pressure values above three times greaterthan the measured values.
An instantaneous increase in fuel temperature will produce the mostsevere pressure conditions. When a peak fuel temperature of 1150°C isreached by increasing the power over a finite period of time, the resultingpressure will be no greater than that for the step change in power analyzedabove. As the temperature rise times become long compared with the diffu-sion time of hydrogen, the pressure will become increasingly less than forthe case of a step change in power. The reason for this is that the pres-sure in the clad element results from the hot fuel dehydriding faster thanthe cooler fuel rehydrides (takes up the excess hydrogen to reach an equi-librium with the hydrogen over-pressure in the can). The slower the rise topeak temperature, the lower the pressure because of the additional timeavailable for rehydriding.
The foregoing analysis gives a strong indication that the clad will notbe ruptured if fuel temperatures are never greater than in the range of1240°C to 1300°C, providing the clad temperature is less than 500°C. How-
182
ever, a conservative safety limit of 1150°C has been chosen for thiscondition. As a result, at this safety limit temperature the pressure is atleast a factor of 5 (and up to a factor of 18) lower than would be necessaryfor clad failure. A factor of 5 is more than adequate to account for uncer-tainties in clad strength and manufacturing tolerances. The integrity ofthe clad has been demonstrated by TRIGA reactor pulse experiments to fueltemperatures >1150°C.
Under any condition in which the clad temperature increases above500°C, such as during a loss-of-coolant accident or under film boiling con-ditions, the temperature safety limit must be decreased as the clad materialloses much of its strength at elevated temperatures. To establish thislimit, it is assumed that the fuel and the clad are at the same temperature.An analysis for this condition indicates that at a fuel and clad temperatureof ~950°C the equilibrium hydrogen pressure produces a stress on the cladequal to its ultimate strength. There are no conceivable circumstances thatcould give rise to a situation in which the clad temperature was higher thanthe fuel.
The same argument about the redistribution of the hydrogen within thefuel presented earlier is valid for this case also. In addition, at ele-vated temperatures the clad becomes permeable to hydrogen. Thus, hydrogennot only will redistribute itself within the fuel to reduce the pressure,but also some hydrogen will escape from the system entirely.
The use of the ultimate strength of the clad material in the establish-ment of the safety limit under these conditions is justified because of thetransient nature of such accidents.
7. GENERAL SPECIFICATIONS FOR ER-U-ZrH TRIGA LEU FUEL
Uranium content - 8.5, 12, 20, 30, 45 wt-% depending on fuel elementmodel.
Range of AcceptanceNominal (wt-%) (wt-%)
8.5 8.25 - 8.7512 11.75 - 12.2520 19.75 - 20.2530 29.65 - 30.3545 44.50 - 45.5
183
Uranium enrichment - 19.7 ± 0.2.
Jranium homogeneity - Manufacturing process produces homogenousdistribution of uranium.
Erbium - Nominal range is 0.5 to 1.4 wt-% depending on fuelelement model. Fuel with 8.5 wt-% U has no erbium.The range of acceptance (from the nominal value) is+5% to -10% for an element and 40% to -3% for acore.
Erbium homogeneity - Manufacturing process produces homogenous distribu-tion of erbium.
H/Zr ratio -
Cladding material
1.60 nominal (range 1.57 to 1.65).
304 stainless steel or Incoloy 800 depending onfuel element model (B + Cd < 20 ppm).
Thickness - NominalElement O.P. (in.)
1.50.5
Nominal CladThickness (in.)
0.0200.016
Leak test - A helium pressure leak test is performed whereelements are subjected to helium pressure of 200psig for 10 min and then put into a calibratedhelium leak detector chamber.
Dimensional inspection - Elements are thoroughly checked for proper length,diameter (especially at welds), bow, and end-fitting straightness.
Visual inspection ofcladding surface
184
Detailed inspection is performed for marredsurfaces, porosity, or other faults which extendmore than 0.001 in. below the surface; cracks ofany type; and weld condition and appearance.

8. OUTLINE OF INSPECTIONS DURING MANUFACTURE OF TRIGA FUEL
Title: INSPECTION OF TRIGA FUEL ELEMENTS
Doc. No. QDI 32-4 Issue A Date 8/10/79 Page of
TABLE OF CONTENTS
Issue1.0 Scope A2.0 Release of Uranium for Fabrication A3.0 Sampling and Testing of Uranium Metal A4.0 Sampling and Testing of Zirconium Sponge A5.0 Sampling and Testing of Erbium Metal A6.0 Testing of Tubing Used as Cladding for Fuel Elements A7.0 Testing and Inspection of Graphite Plugs for Fuel Elements A8.0 Verification of Uranium, Erbium, and Zirconium Content A
in Casting (Melt) Charge9.0 Sampling of Disks for Historical Purposes and Sampling A
for Percent Uranium and Percent Erbium from EachCasting After Zone Melting
10.0 Verification of Hydrogen-to-Zirconium Atom Ratio A11.0 Dimensional and Visual Inspection of Hydrided Melts A12.0 Witness of Element Assembly A13.0 Inspection of TRIGA Cladding Welds A14.0 Helium Backfill Check for Only 1/2 in. Diameter Fuel A15.0 Dimensional Inspection of Fuel Elements A16.0 Ferroxyl Test A17.0 Helium Pressure Leak Test of Fuel Elements A18.0 Overcheck of TRIGA Fuel Elements A19.0 Visual Inspection of Fuel and Control Rod Cladding A
Surfaces20.0 Inspection and Witness of the Packaging of Completed A
Fuel Elements21.0 TRIGA Special Element Test Procedure A22.0 Data Packages - When Requested A23.0 Calibration and Control of Measuring, Test and A
Inspection Devices
185
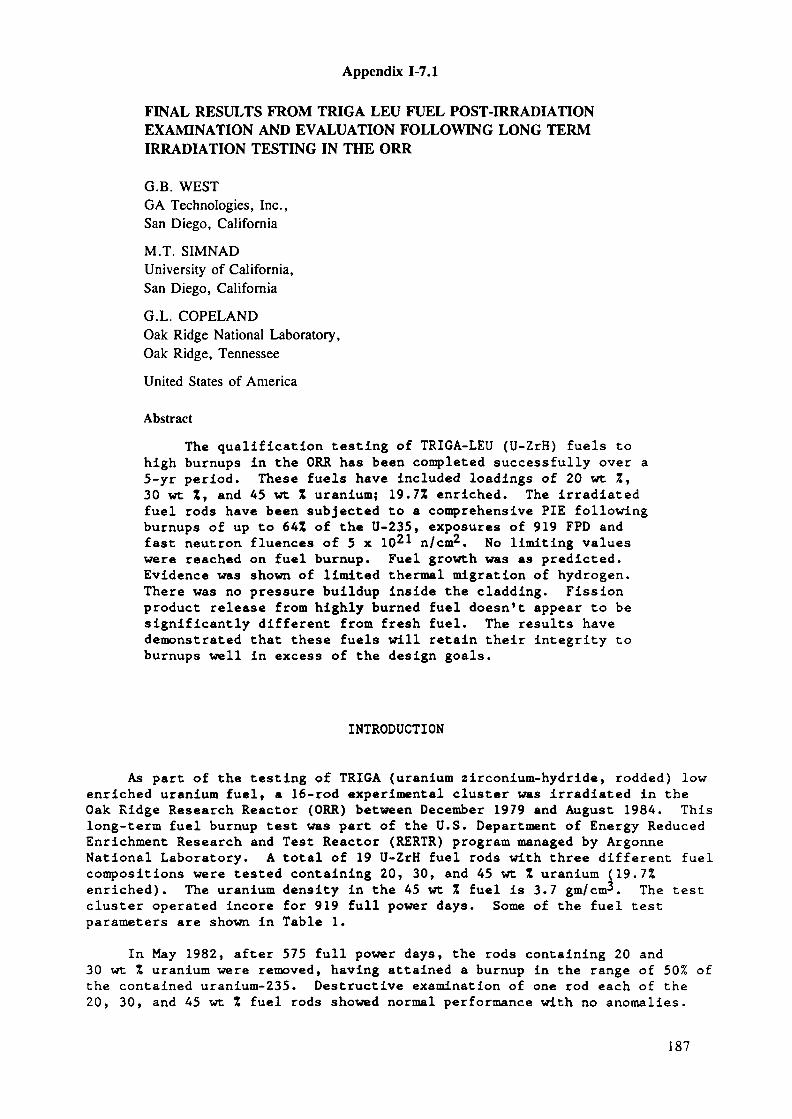
Appendix 1-7.1
FINAL RESULTS FROM TRIGA LEU FUEL POST-IRRADIATIONEXAMINATION AND EVALUATION FOLLOWING LONG TERMIRRADIATION TESTING IN THE ORR
G.B. WESTGA Technologies, Inc.,San Diego, California
M.T. SIMNADUniversity of California,San Diego, California
G.L. COPELANDOak Ridge National Laboratory,Oak Ridge, Tennessee
United States of America
Abstract
The qualification testing of TRIGA-LEU (U-ZrH) fuels tohigh burnups in the ORR has been completed successfully over a5-yr period. These fuels have included loadings of 20 wt %,30 wt Z, and 45 wt Z uranium; 19.7Z enriched. The irradiatedfuel rods have been subjected to a comprehensive PIE followingburnups of up to 64Z of the U-235, exposures of 919 FPD andfast neutron fluences of 5 x 10^1 n/cm^. No limiting valueswere reached on fuel burnup. Fuel growth was as predicted.Evidence was shown of limited thermal migration of hydrogen.There was no pressure buildup inside the cladding. Fissionproduct release from highly burned fuel doesn't appear to besignificantly different from fresh fuel. The results havedemonstrated that these fuels will retain their integrity toburnups well in excess of the design goals.
INTRODUCTION
As part of the testing of TRIGA (uranium zirconium-hydride, rodded) lowenriched uranium fuel, a 16-rod experimental cluster was irradiated in theOak Ridge Research Reactor (ORR) between December 1979 and August 1984. Thislong-term fuel burnup test was part of the U.S. Department of Energy ReducedEnrichment Research and Test Reactor (RERTR) program managed by ArgonneNational Laboratory. A total of 19 U-ZrH fuel rods with three different fuelcompositions were tested containing 20, 30, and 45 wt Z uranium (19.7%enriched). The uranium density in the 45 wt Z fuel is 3.7 gm/cm^. The testcluster operated incore for 919 full power days. Some of the fuel testparameters are shown in Table 1.
In May 1982, after 575 full power days, the rods containing 20 and30 wt Z uranium were removed, having attained a burnup in the range of 50% ofthe contained uranium-235. Destructive examination of one rod each of the20, 30, and 45 wt Z fuel rods showed normal performance with no anomalies.
187
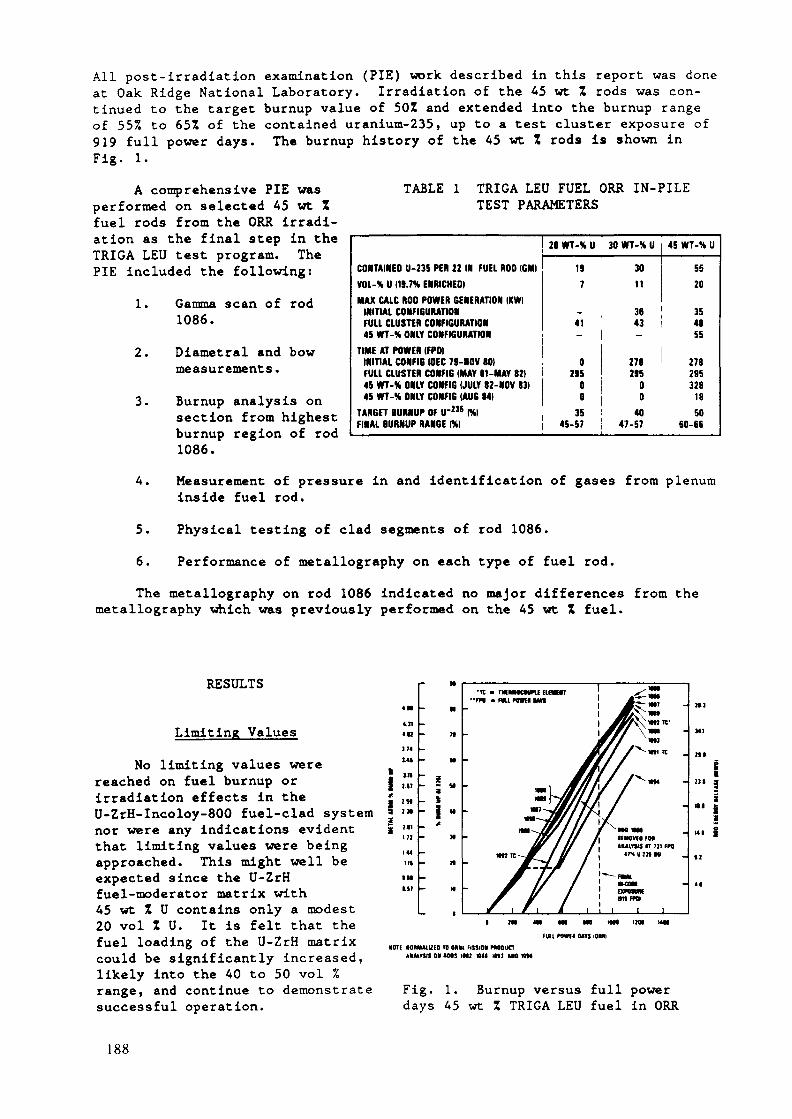
All post-irradiation examination (PIE) work described in this report was doneat Oak Ridge National Laboratory. Irradiation of the 45 wt Z rods was con-tinued to the target burnup value of 50Z and extended into the burnup rangeof 55% to 65% of the contained uranium-235, up to a test cluster exposure of919 full power days. The burnup history of the 45 wt X rods is shown inFig. 1.
A comprehensive PIE wasperformed on selected 45 wt Zfuel rods from the ORR irradi-ation as the final step in theTRIGA LEU test program. ThePIE included the following:
1. Gamma scan of rod1086.
2. Diametral and bowmeasurements.
3. Burnup analysis onsection from highestburnup region of rod1086.
TABLE 1 TRIGA LEU FUEL ORR IN-PILETEST PARAMETERS
20 WT-S U
CONTAINED U-235 PER 22 IN FUEL ROD IGMIVOl-% U (19.7S ENRICHED!MAX CAIC ROD POWER GENERATION IKW)
INITIAI CONFIGURATIONFULL CLUSTER CONFIGURATION45 WT-S ONLY CONFIGURATION
TIME AT POWER (FPDIINITIAL CONFIG IOEC 79-NOV BO)FULL CLUSTER CONFIG (MAY 11 -MAY 82145 WT-S ONLY CONFIG (JULY »2-NOV 13145 WT-S ONLY CONFIG (AUG Ml
TARGET BURNUP OF IT2" IS)FINAL BURNUP RANGE (SI
197
30 WT-S U
3011
_ 3641 43-
0295
0Q
3545-57
45 WT-S U
5520
354855
27S 278295 295
0 3280 18
40 5047-57 60-66
4. Measurement of pressure in and identification of gases from plenuminside fuel rod.
5. Physical testing of clad segments of rod 1086.
6. Performance of metallography on each type of fuel rod.The metallography on rod 1086 indicated no major differences from the
metallography which was previously performed on the 45 wt Z fuel.
RESULTS
Limiting ValuesNo limiting values were
reached on fuel burnup orirradiation effects in theU-ZrH-Incoloy-800 fuel-clad systemnor were any indications evidentthat limiting values were beingapproached. This might well beexpected since the U-ZrHfuel-moderator matrix with45 wt Z U contains only a modest20 vol ZU. It is felt that thefuel loading of the U-ZrH matrixcould be significantly increased,likely into the 40 to 50 vol 7,range, and continue to demonstratesuccessful operation.
IK117
, g „
. I~ I «
•It • TMMMCNm [LMHT'rn • «u ma un
" Iu, i
FUU MWf I (Utn IOMI•OTE lOMHJUUEO ÎD OftlH FI33IOI MQOUCT
Muunis oi mes mi wi mi »o MM
Fig. 1. Burnup versus full powerdays 45 wt Z TRIGA LEU fuel in ORR
188

Diametral Fuel Growth and Cladding DuctilityThe agreement between predicted and average measured fuel growth during
burnup was very good, especially considering the ovalities and small inac-curacies of the measurements. It is concluded that the expected maximumaverage diametral growth was about 25 mils or about 4.6Z, and the measuredgrowth agreed with the predicted value within the accuracy of the measure-ments. Maximum ovalities were in the range of 20 to 30 mils. The Incoloy-800 clad yields during this growth, but maintains uniformity and very goodductility with end-of-life ductility estimated to be in the range of 10% to20Z. The good ductility was well demonstrated by the ring bend tests(Fig. 2) where several clad segments from a highly burned up fuel rod werecompressed radially flat in a vice. The compressed rings experienced somespring-back on release, but no cracks were detected in the severelydeformed areas.
RBT
1
2
3
4
5
ROD 1086 45/20ORR EXPOSURE:
919 FULL POWER DAYS-5X10 2 1 NVT(FAST)
NO CRACKS ON SEVERELYDEFORMED AREAS
SUFFICIENT DUCTILITY TOACCOMMODATE BENDING STRAINS
Fig. 2. Irradiated TRIGA LEU Incoloy 800 clad ring bend test results
Axial Length ChangesMeasured axial length changes of the fuel rods ranged between 34 and
61 mils. These are small and acceptable values. This growth is not a directmeasure of fuel growth, as there is a plenum region which can accommodateaxial fuel growth, but rather is an important measure of fuel-clad inter-action. Any serious ratcheting interaction between the fuel and clad wouldresult in much larger fuel rod axial growth values than those encountered.The fuel rods were cycled through over 100 startup and shutdown cycles of theORR. In addition, previous tests with several hundred power cycles have beenperformed in the TRIGA Mark F reactor at GA. The tests at GA also included
189
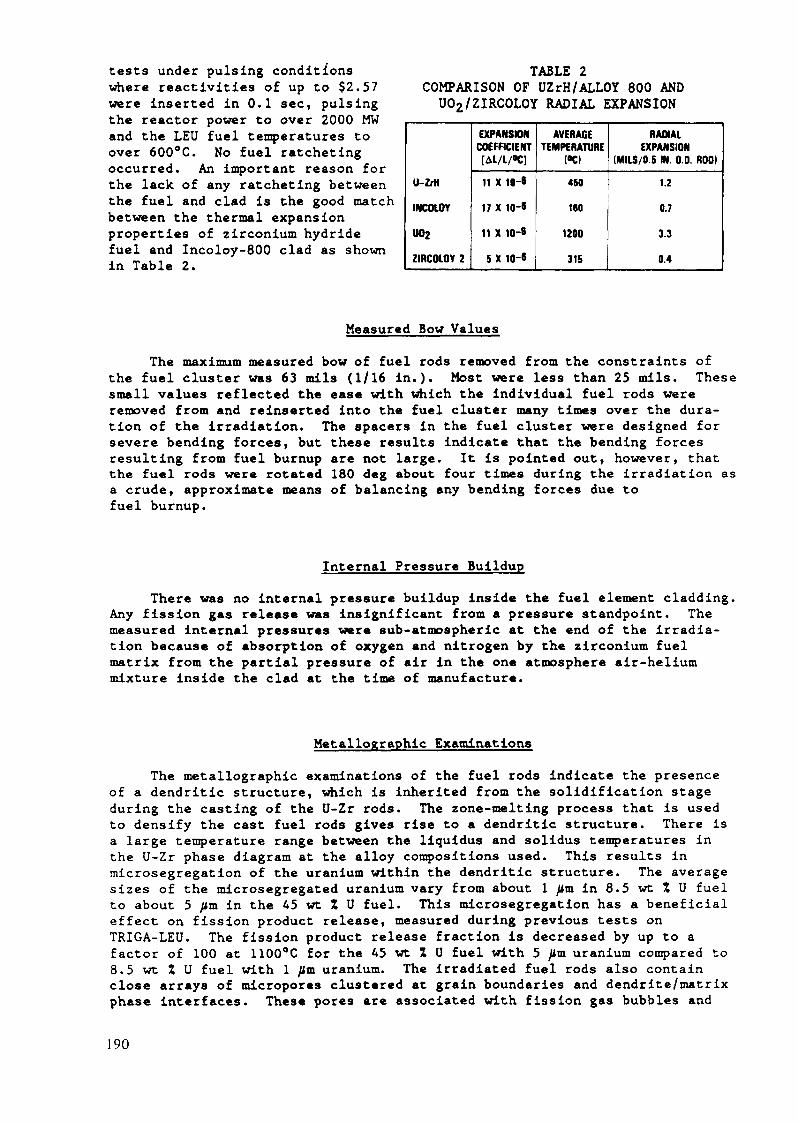
tests under pulsing conditionswhere reactivities of up to $2.57were inserted in 0.1 sec, pulsingthe reactor power to over 2000 MWand the LEU fuel temperatures toover 600°C. No fuel ratchetingoccurred. An important reason forthe lack of any ratcheting betweenthe fuel and clad is the good matchbetween the thermal expansionproperties of zirconium hydridefuel and Incoloy-800 clad as shownin Table 2.
TABLE 2COMPARISON OF UZrH/ALLOY 800 ANDU02/ZIRCOLOY RADIAL EXPANSION
U-Zrfl
INCOIOY
U02
ZIRCOLOY 2
EXPANSIONCOEFFICIENT[AL/L/OC]
11 X 10-«
17 X 10-8
11 X 10-8
5 X 10⁻⁸
AVERAGETEMPERATURE
(«CI
450
1BO
1200
315
RADIALEXPANSION
(MILS/0.5 IN. O.D. ROD)
1.2
0.7
3.3
0.4
Measured Bow Values
The maximum measured bow of fuel rods removed from the constraints ofthe fuel cluster was 63 mils (1/16 in.). Most were less than 25 mils. Thesesmall values reflected the ease with which the individual fuel rods wereremoved from and reinserted into the fuel cluster many times over the dura-tion of the irradiation. The spacers in the fuel cluster were designed forsevere bending forces, but these results indicate that the bending forcesresulting from fuel burnup are not large. It is pointed out, however, thatthe fuel rods were rotated 180 deg about four times during the irradiation asa crude, approximate means of balancing any bending forces due tofuel burnup.
Internal Pressure BuildupThere was no internal pressure buildup inside the fuel element cladding.
Any fission gas release was insignificant from a pressure standpoint. Themeasured internal pressures were sub-atmospheric at the end of the irradia-tion because of absorption of oxygen and nitrogen by the zirconium fuelmatrix from the partial pressure of air in the one atmosphere air-heliummixture inside the clad at the time of manufacture.
Metallographie ExaminationsThe metallographic examinations of the fuel rods indicate the presence
of a dendritic structure, which is inherited from the solidification stageduring the casting of the U-Zr rods. The zone-melting process that is usedto densify the cast fuel rods gives rise to a dendritic structure. There isa large temperature range between the liquidus and solidus temperatures inthe U-Zr phase diagram at the alloy compositions used. This results inmicrosegregation of the uranium within the dendritic structure. The averagesizes of the microsegregated uranium vary from about 1 /1m in 8.5 wt Z U fuelto about 5 /im in the 45 wt Z Ü fuel. This microsegregation has a beneficialeffect on fission product release, measured during previous tests onTRIGA-LEU. The fission product release fraction is decreased by up to afactor of 100 at 1100°C for the 45 wt Z U fuel with 5 fim uranium compared to8.5 wt Z U fuel with l /Im uranium. The irradiated fuel rods also containclose arrays of micropores clustered at grain boundaries and dendrite/matrixphase interfaces. These pores are associated with fission gas bubbles and
190

etched solid fission products, which would be expected under long burnupconditions and do not have a harmful effect on fuel performance. Uraniumwould not be expected to migrate to any significant degree at temperaturescharacteristic of TRIGÂ fuel and there is no evidence of diffusion or migra-tion of the uranium in even the most highly loaded and burned up fuel rods.
Hydrogen MigrationThe metallographic studies of the irradiated fuel rods show evidence of
limited but significant thermal migration of the hydrogen down the tempera-ture gradients. The hydrogen migrates from the higher temperature centralregion towards the cooler surface regions of the fuel rods. The hydrogenmigration reaches an equilibrium for any given temperature distribution. Thetime period necessary for this equilibrium to be reached and the variationsin the hydrogen concentration depend upon the temperatures involved; thegreater the temperature and temperature gradient, the faster the hydrogenmoves. In any case the time to equilibrium would be relatively short com-pared to the irradiation time of this test and the hydrogen concentrationsmight vary by *10Z to 15Z from their initial values. The hydrogen migrationgives rise to four distinct annular regions (Fig. 3) with characteristiclight and dark appearances and structural variations. However, the fuel rodsare not significantly deformed by the redistribution of the hydrogen withinthe single gamma phase as strongly evidenced by their retention of dimen-sional and mechanical stability. These results reinforce conclusions reachedthrough other operational results and fuel examination programs with U-ZrHfuel; namely that peak limitpulsing operations shouldnot be performed with longerlife fuel where equilibriumhydrogen redistribution hasoccurred. The increasedH/Zr ratio at the outerradius of the fuel, coupledwith high peak fuel tempera-tures which occur at theouter radius during a pulse,can cause excessive hydrogenpressures in the fuel matrixwhich can weaken and deformthe fuel matrix and evencause excessive swelling andfuel element deformation.Pulse sizes should bemodestly reduced in longerburning cores to account forthe limited hydrogen Fig. 3. Rod 1093, section met 2, macro-redistribution, graph showing locations of micrographs
Incoloy-800 CompatibilityThe compatibility of the Incoloy-800 cladding with both the fuel and the
coolant is excellent. A mechanical bond developed between the fuel and cladduring the long term burnup swelling. No other type of fuel-clad bondingoccurred. There is no evidence of corrosion by the coolant water after four
191
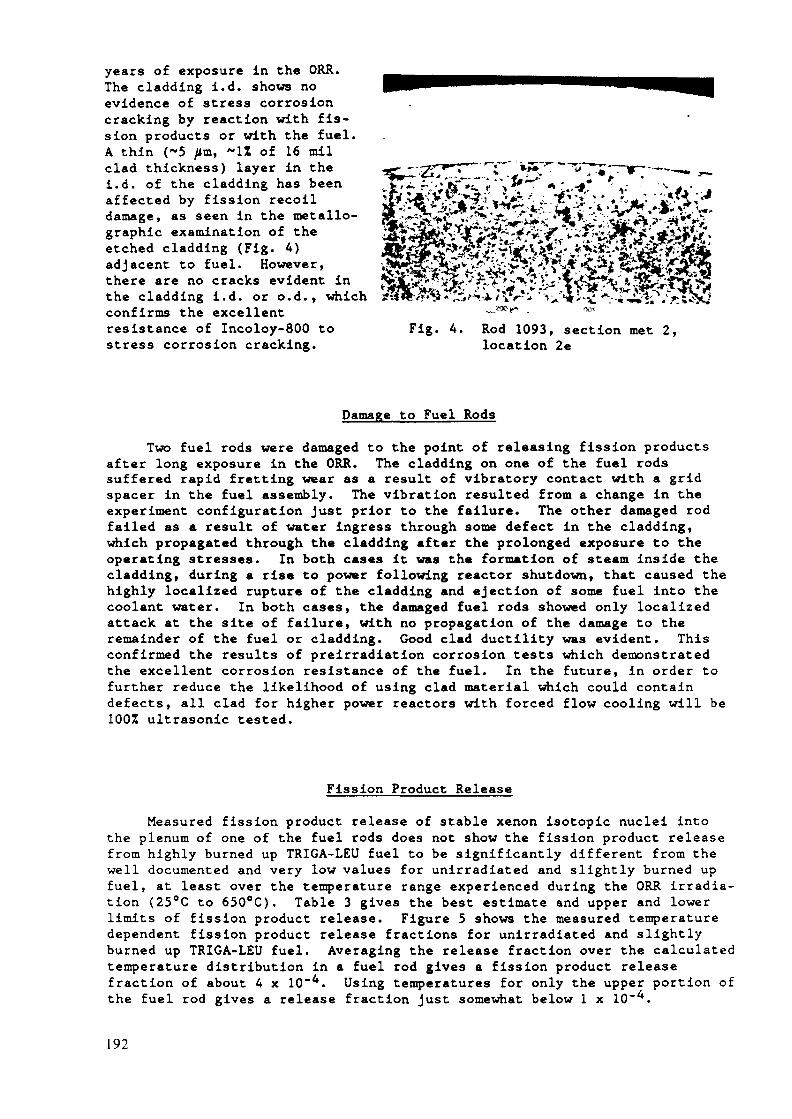
years of exposure in the ORR.The cladding i.d. shows noevidence of stress corrosioncracking by reaction with fis-sion products or with the fuel.A thin (~5 /»m, ~1X of 16 milclad thickness) layer in thei.d. of the cladding has beenaffected by fission recoildamage, as seen in the métallo-graphie examination of theetched cladding (Fig. 4)adjacent to fuel. However,there are no cracks evident inthe cladding i.d. or o.d., whichconfirms the excellentresistance of Incoloy-800 tostress corrosion cracking.
Fig. 4. Rod 1093, section met 2,location 2e
Damage to Fuel Rods
Two fuel rods were damaged to the point of releasing fission productsafter long exposure in the ORR. The cladding on one of the fuel rodssuffered rapid fretting wear as a result of vibratory contact with a gridspacer in the fuel assembly. The vibration resulted from a change in theexperiment configuration just prior to the failure. The other damaged rodfailed as a result of water ingress through some defect in the cladding,which propagated through the cladding after the prolonged exposure to theoperating stresses. In both cases it was the formation of steam inside thecladding, during a rise to power following reactor shutdown, that caused thehighly localized rupture of the cladding and ejection of some fuel into thecoolant water. In both cases, the damaged fuel rods showed only localizedattack at the site of failure, with no propagation of the damage to theremainder of the fuel or cladding. Good clad ductility was evident. Thisconfirmed the results of preirradiation corrosion tests which demonstratedthe excellent corrosion resistance of the fuel. In the future, in order tofurther reduce the likelihood of using clad material which could containdefects, all clad for higher power reactors with forced flow cooling will be100Z ultrasonic tested.
Fission Product Release
Measured fission product release of stable xenon isotopic nuclei intothe plenum of one of the fuel rods does not show the fission product releasefrom highly burned up TRIGA-LEU fuel to be significantly different from thewell documented and very low values for unirradiated and slightly burned upfuel, at least over the temperature range experienced during the ORR irradia-tion (25°C to 650°C). Table 3 gives the best estimate and upper and lowerlimits of fission product release. Figure 5 shows the measured temperaturedependent fission product release fractions for unirradiated and slightlyburned up TRIGA-LEU fuel. Averaging the release fraction over the calculatedtemperature distribution in a fuel rod gives a fission product releasefraction of about 4 x 10" . Using temperatures for only the upper portion ofthe fuel rod gives a release fraction just somewhat below 1 x 10~^.
192
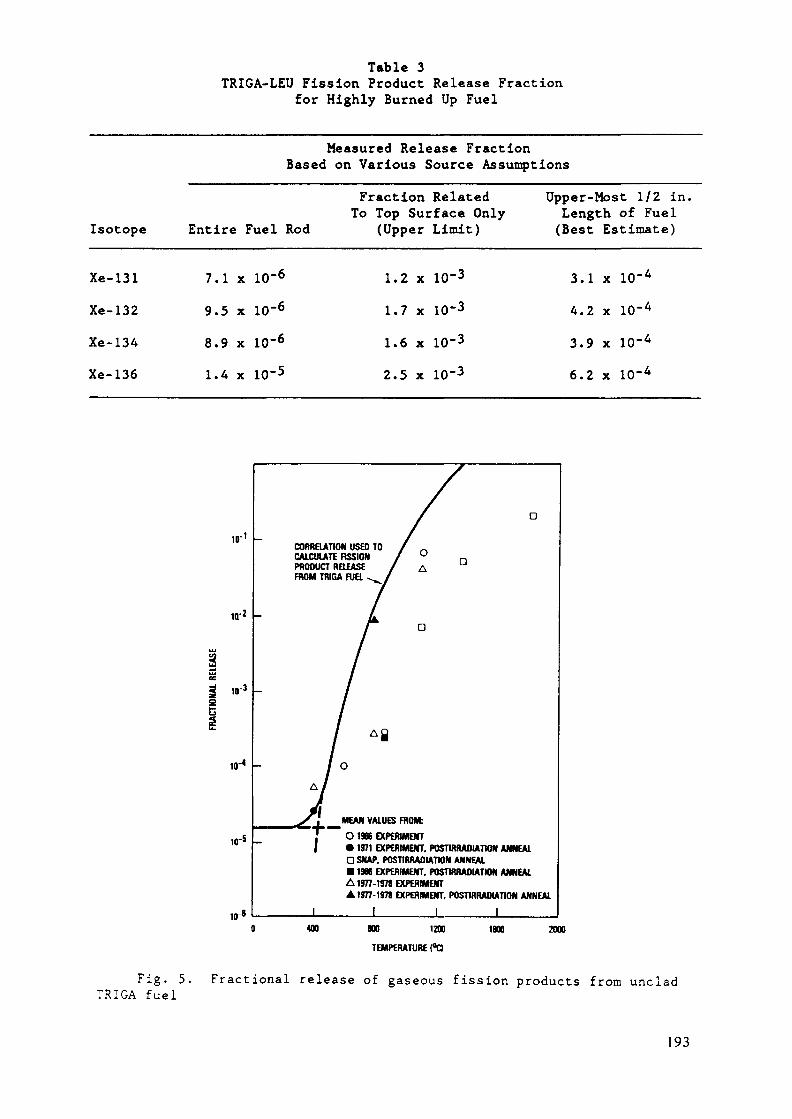
Table 3TRIGA-LEU Fission Product Release Fraction
for Highly Burned Up Fuel
Measured Release FractionBased on Various Source Assumptions
Fraction Related Upper-Most 1/2 in.To Top Surface Only Length of Fuel
Isotope Entire Fuel Rod (Upper Limit) (Best Estimate)
Xe-131 7.1 x 1(T6 1.2 x 10'3 3.1 x 10~A
Xe-132 9.5 x 1CT6 1.7 x 10'3 4.2 x 10~A
Xe-134 8.9 x 10~6 1.6 x 1CT3 3.9 x 10~4
Xe-136 1.4 x 1CT5 2.5 x 1(T3 6.2 x 10~4
10-'
10'2
ëg 10-3
10"4
10-5
HT«(
/ D
CORRELATION USED TO / _CALCULATE FISSION / nPRODUCT RELEASE / AFROM TRIGA WfL /
r a
- /
/ 0
A/
^/J MEAN VALUES FROM:
T O 1966 EXPERIMENTI • 1971 EXPERIMENT. POSTIRRADIATION ANNEAL
Q SNAP. POSTIRRADIATION ANNEAL• 1966 EXPERIMENT. POSTIRRADIATION ANNEALA 1977- 1976 EXPERIMENTA 1977-1978 EXPERIMENT, POSTIRRADIATION ANNEAL
1 1 1 1
UO 800 1200 1800 2000
TEMPERATURE Cd
Fig. 5.TRIGA fuel
Fractional release of gaseous fission products from unclad
193

CONCLUSIONS
The qualification testing of TRIGA-LEU fuels to high burnups, up to 64%of initially contained U-235, has been completed successfully over a 5-yrperiod. The burnups were well in excess of design goals. No limiting valueswere reached. The results have demonstrated the fuel material to be stableand retentive, even when exposed to water and steam. The Incoloy-800 cladhas proven to be compatible and corrosion resistant, retaining its integritywith good ductility after long exposure.
194

Appendix JIRRADIATION AND POST-IRRADIATION EXAMINATION (PIE)
OF DISPERSION FUELS WITH HIGH URANIUM DENSITY
Abstract
Requirements on the reliability of LEU fuel are summarizedfrom the point of view of a reactor operator and an outlineof the philosophy and procedures that were utilized by theU.S. RERTR Program for non-destructive and destructive PIE ofminiplates and full-size elements is described.
Extensive data are provided on the irradiation and post-irradiation examination of HEU and LEU dispersion fuels withhigh uranium density (> 1.7 g/cm3). Data includes burnupresults, swelling and blister threshold temperature behavior,results of metallographic examinations, and fission productrelease behavior.
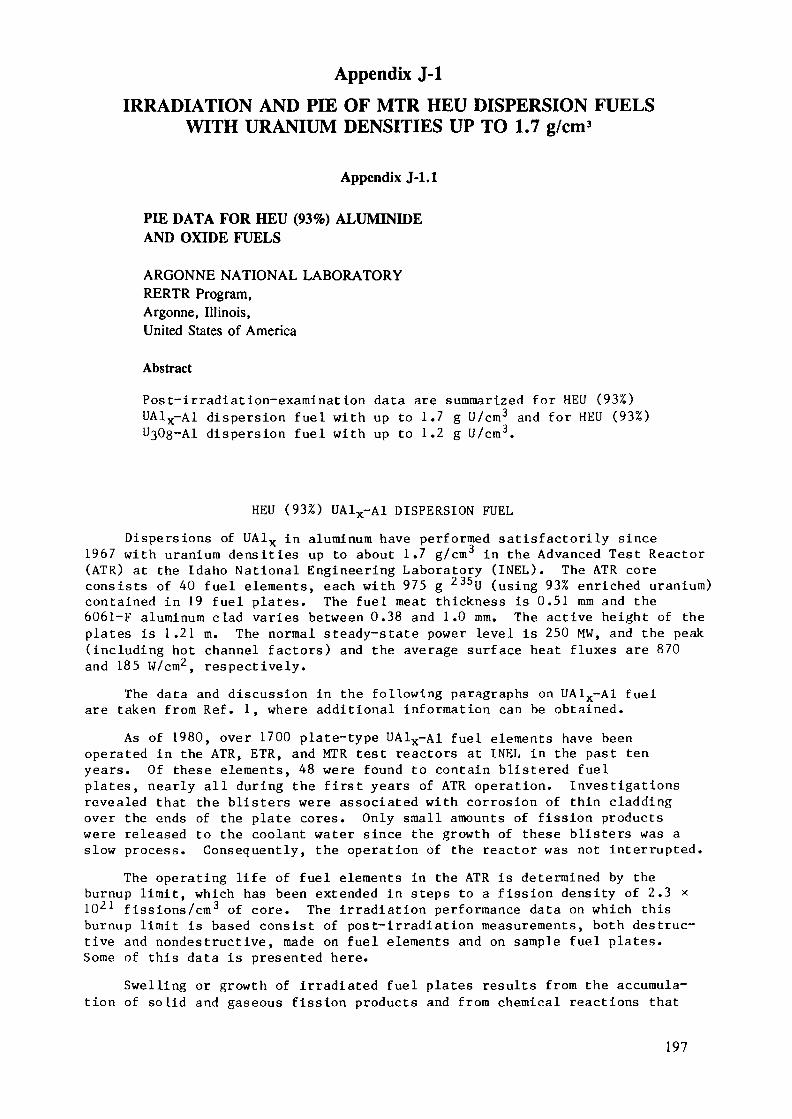
Appendix J-lIRRADIATION AND PIE OF MTR HEU DISPERSION FUELS
WITH URANIUM DENSITIES UP TO 1.7 g/cm3
Appendix J-l.l
PIE DATA FOR HEU (93%) ALUMINIDEAND OXIDE FUELS
ARGONNE NATIONAL LABORATORYRERTR Program,Argonne, Illinois,United States of America
Abstract
Post-irradiation-examination data are summarized for HEU (93%)UA1X-A1 dispersion fuel with up to 1.7 g U/cm3 and for HEU (93%)
l dispersion fuel with up to 1.2 g U/cm3.
HEU (93%) UA1X-A1 DISPERSION FUELDispersions of UA1X in aluminum have performed satisfactorily since
1967 with uranium densities up to about 1.7 g/cm in the Advanced Test Reactor(ATR) at the Idaho National Engineering Laboratory (INEL). The ATR coreconsists of 40 fuel elements, each with 975 g 235U (using 93% enriched uranium)contained in 19 fuel plates. The fuel meat thickness is 0.51 mm and the6061-F aluminum clad varies between 0.38 and 1.0 mm. The active height of theplates is 1.21 m. The normal steady-state power level is 250 MW, and the peak(including hot channel factors) and the average surface heat fluxes are 870and 185 W/cm , respectively.
The data and discussion in the following paragraphs on UA1X-A1 fuelare taken from Ref. l, where additional information can be obtained.
As of 1980, over 1700 plate-type UA1X-A1 fuel elements have beenoperated in the ATR, ETR, and MTR test reactors at INEL in the past tenyears. Of these elements, 48 were found to contain blistered fuelplates, nearly all during the first years of ATR operation. Investigationsrevealed that the blisters were associated with corrosion of thin claddingover the ends of the plate cores. Only small amounts of fission productswere released to the coolant water since the growth of these blisters was aslow process. Consequently, the operation of the reactor was not interrupted.
The operating life of fuel elements in the ATR is determined by theburnup limit, which has been extended in steps to a fission density of 2.3 xlO^1 fissions/cm3 of core. The irradiation performance data on which thisburnup limit is based consist of post-irradiation measurements, both destruc-tive and nondestructive, made on fuel elements and on sample fuel plates.Some of this data is presented here.
Swelling or growth of irradiated fuel plates results from the accumula-tion of solid and gaseous fission products and from chemical reactions that
197

Table 1 Growth and Swelling of UA1 -Al Fuel Plate Cores for theATR Reactor and for Test Samples.
Elementand Simple
Number
Com p 3Comp 4Comp 9
584587621622623625
169 11169 12169 1916936169371693816939XA8GXA8C
XA20GXA8GXA8GXA8GXA8GFuel elementsXA130KiA135K169-4169-5XA20G
U atom/cm1
(xio ")248C
3322483403403653653653653383392653 34334339335269339
3392694 103394 10
425422420339
Fission Density(XIO 5 1 )
0751 00750681 521 180801 130482162 2 71 842352382342230.720.99021040068054042
20246269069
IrradiationTemperature
W
423-473423473423-473423473423-473423473423473423473423473373-473373473373473373473373473373473423473423473423473
423473423473423473423473423473
423473423473b
423473b
423473
CorePorosity(vol%)
10514010546464 1624 54 5848466797870753113-113113113113114-11
594116120311
Swelling
(¥*)1 4031 0065 1251 02 51 547594 76460745 724"291 82 230a
1.71 5
63*204 737»
Reference
171717181818181818191919191919191414
1414141414
19191914
*Averjges of growth data on fuel elements where fission density is within 0 15 X 10J1 fiss/cm3.'Temperature range is for fission densities between 1 2 X 10²¹ fiss/cm1 and value gnen
1.0 x 10 U atoms/cm corresponds to a uranium density of 0.39 g/cm3.
occur between the fuel and the matrix. The gaseous atoms (xenon and krypton)constitute ~15% of the fission products and are principally in solution in themicrostructure. The solid fission product swelling would be expected to beproportional to the fission density less any volume accommodation from the fuelcore porosity. The accommodation of solid fission products in the core porosityappears to be related to the core temperature and fission rate.
The swelling data2"5 from four fuel elements and sixteen samples aregiven in Table 1 and are plotted in Fig. 1. The empirical equation for 24data points obtained by least-squares linear regression is
^~ % = 2.6% F/(1021 fissions/cm3 of core)
where F = fission density (fissions/cm3 of core). This equation indicatesthat swelling starts with fissioning. If burnup is defined as the fraction oforiginal 2 35U atoms that are lost by fission or capture, the fission densitycan be expressed as
F x l(r21 fissions/cm3 = 2.15 ewhere e = uranium enrichment
P., = uranium density, g/cm3B = 235U fractional burnup
PU
198
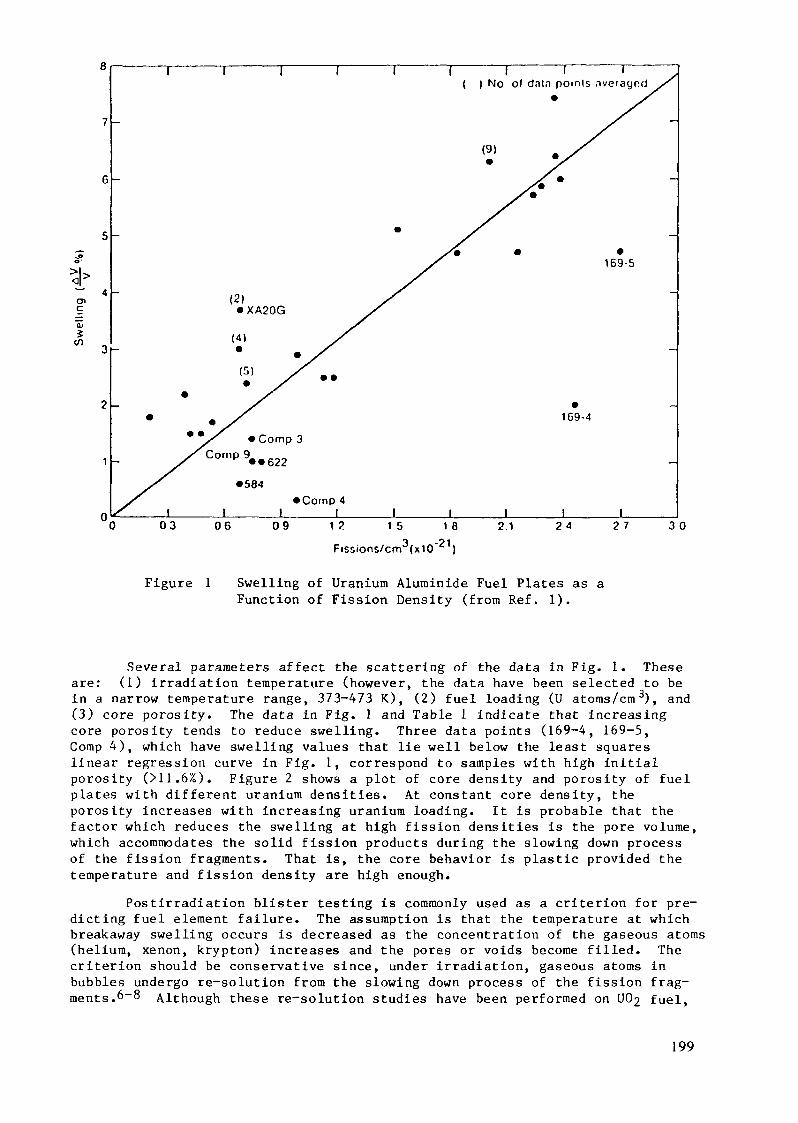
0>C
to
( ) No of data pomis averaged
Fissions/cm3(x10~21)
Figure I Swelling of Uranium Aluminide Fuel Plates as aFunction of Fission Density (from Ref, 1).
Several parameters affect the scattering of the data in Fig. 1. Theseare: (1) irradiation temperature (however, the data have been selected to bein a narrow temperature range, 373-473 K), (2) fuel loading (U atoms/cm3), and(3) core porosity. The data in Fig. 1 and Table 1 indicate that increasingcore porosity tends to reduce swelling. Three data points (169-4, 169-5,Comp 4), which have swelling values that lie well below the least squareslinear regression curve in Fig. 1, correspond to samples with high initialporosity (Ml.6%). Figure 2 shows a plot of core density and porosity of fuelplates with different uranium densities. At constant core density, theporosity increases with increasing uranium loading. It is probable that thefactor which reduces the swelling at high fission densities is the pore volume,which accommodates the solid fission products during the slowing down processof the fission fragments. That is, the core behavior is plastic provided thetemperature and fission density are high enough.
Postirradiation blister testing is commonly used as a criterion for pre-dicting fuel element failure. The assumption is that the temperature at whichbreakaway swelling occurs is decreased as the concentration of the gaseous atoms(helium, xenon, krypton) increases and the pores or voids become filled. Thecriterion should be conservative since, under irradiation, gaseous atoms inbubbles undergo re-solution from the slowing down process of the fission frag-ments. 6~8 Although these re-solution studies have been performed on UÛ2 fuel,
199
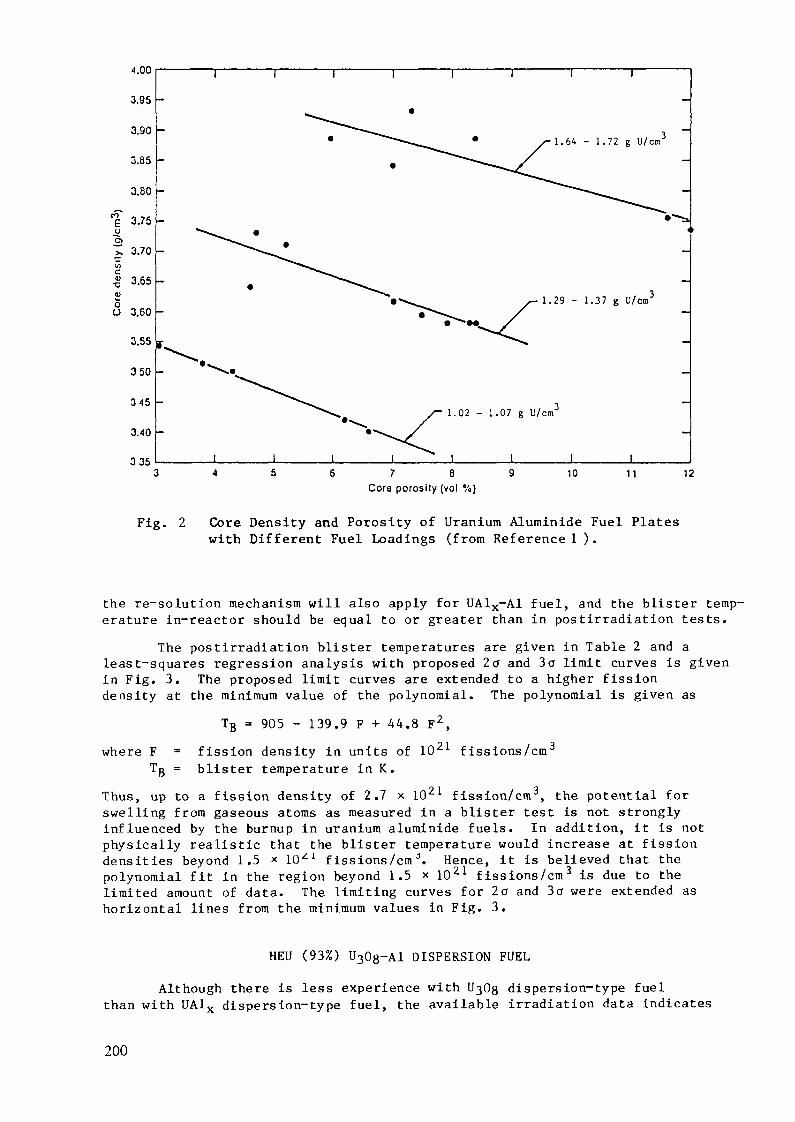
jj"S>
4.00
3,95
3.90
3.85
3.80
3.75
3.70
I 3.65
O 3.60
3.55
350
345
3.40
335
• 1.64 - 1.72 g U/cm
1.29 - 1.37 g U/cm3
I
1.02 - 1.07 g U/cm
I
Fig.
7 8Cora porosity (vol %)
10 11 12
2 Core Density and Porosity of Uranium Aluminide Fuel Plateswith Different Fuel Loadings (from Reference 1 ).
the re-solution mechanism will also apply for UA1X-A1 fuel, and the blister temp-erature in-reactor should be equal to or greater than in postirradiation tests.
The postirradiation blister temperatures are given in Table 2 and aleast-squares regression analysis with proposed 2o~ and 3a limit curves is givenin Fig. 3. The proposed limit curves are extended to a higher fissiondensity at the minimum value of the polynomial. The polynomial is given as
where FTB =
TB = 905 - 139.9 F + 44.8 F2,fission density in units of 1021 fissions/cm3blister temperature in K.
Thus, up to a fission density of 2.7 x 10²¹ fission/cm3, the potential forswelling from gaseous atoms as measured in a blister test is not stronglyinfluenced by the burnup in uranium aluminide fuels. In addition, it is notphysically realistic that the blister temperature would increase at fissiondensities beyond 1.5 x 10Z1 fissions/cmd. Hence, it is believed that thepolynomial fit in the region beyond 1.5 x 10²¹ fissions/cm3 is due to thelimited amount of data. The limiting curves for 2a and 3a were extended ashorizontal lines from the minimum values in Fig. 3.
HEU (93%) U30s-Al DISPERSION FUEL
Although there is less experience with U^OQ dispersion-type fuelthan with UAlx dispersion-type fuel, the available irradiation data indicates
200
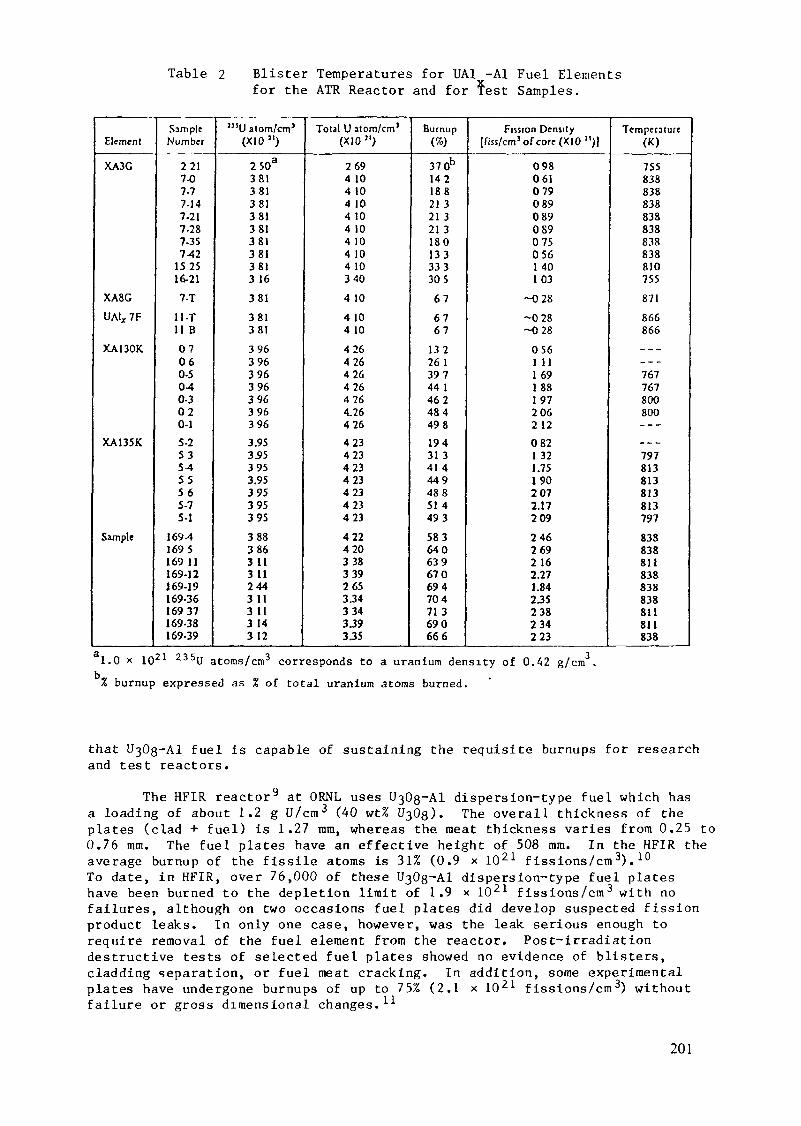
Table 2 Blister Temperatures for UA1 -Al Fuel Elementsfor the ATR Reactor and for fest Samples.
Element
XA3G
XA8GUA1X7F
XA130K
XA135K
Sample
SampleNumber
2 2 17-07-77-147-217-287-35742
152516-21
7-T
11-T11 B07060-50-40-3020-15-2S3SA55565-75-1
169-41695169 11169-12169-19169-3616937169-38169-39
"'U atom/cm'(X10 ")
2503
381381381381381381381381316
381381381
3963963963963963963963.953.953953.95395395395
3883863 113 112443113 113 14312
Total U atom/cm'(X10")
2694 104 104 104 104 104 10A 104 103404 10
4104 10
4264264264264264.26426423423423423423423423
4224203383392653343343.393.35
Burnup(%)
37 Ob
14218821 321 321 318013333330567
6767
13226 139744 146248449819431 341 444948851 4493583640639670694704713690666
Fission Density[Rss/cm Jofcore(XIO"j]
0980610790890890890750561 40103
-028-028-028
0561 111691881972062 120821 321.751902072.172092462692162.271.842.35238234223
Temperature(K)
755838838838838838838838810755
871866866_ _ __ _ _767767800800---_ _ _797813813813813797838838811838838838811811838
1.0 x 10²¹ 2 3 5U atoms/cm3 corresponds to a uranium density of 0.42 g/cm
% burnup expressed as % of total uranium atoms burned.
that UßOg-Al fuel is capable of sustaining the requisite burnups for researchand test reactors.
The HFIR reactor9 at ORNL uses UßOg-Al dispersion-type fuel which hasa loading of about 1.2 g U/cm 3 (40 wt% 1)303). The overall thickness of theplates (clad + fuel ) is 1.27 mm, whereas the meat thickness varies from 0.25 to0.76 mm. The fuel plates have an effective height of 508 mm. In the HFIR theaverage burnup of the fissile atoms is 31% (0.9 x 10²¹ fissions/cm3).1 0
To date, in HFIR, over 76,000 of these UßOß-Al dispersion-type fuel plateshave been burned to the depletion limit of 1 .9 x 1021 f issions/cm3 with nofailures, although on two occasions fuel plates did develop suspected fissionproduct leaks. In only one case, however, was the leak serious enough torequire removal of the fuel element from the reactor. Post-irradiationdestructive tests of selected fuel plates showed no evidence of blisters,cladding separation, or fuel meat cracking. In addition, some experimentalplates have undergone burnups of up to 75% (2.1 x 10²¹ f issions/cm3) withoutfailure or gross dimensional changes.11
201
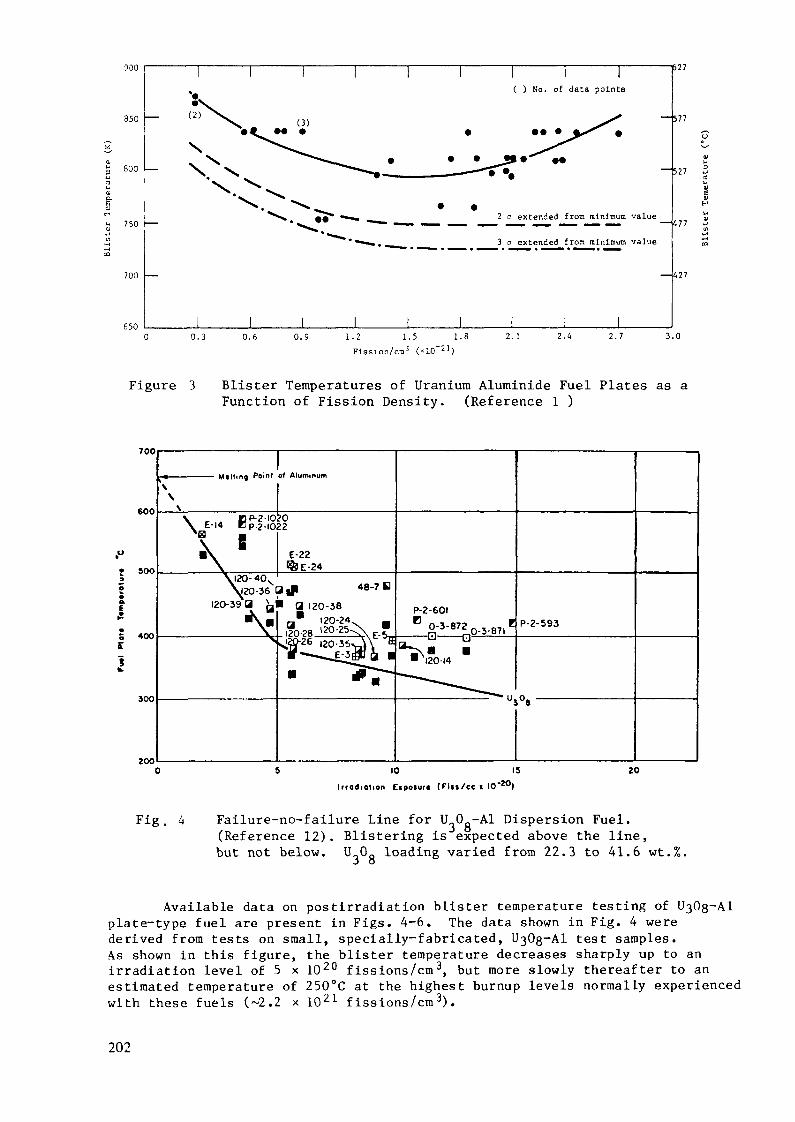
900
350
BOO
750
700
650
— 577
527
2 c extended fron minimum value
3 a extended from minimum value.77
,27
0.3 0.6 0.9 1.2 1.5 1.8 2.1 2 .4 2.7 3.0Fisslon/CTi (*10 }
Figure 3 Blister Temperatures of Uranium Aluminide Fuel Plates as aFunction of Fission Density. (Reference 1 )
E1
TOO
600
soo
400
ÎOO
zooI r r o d i o l i o n tipoiurl (Titj /cc l
Fig. 4 Failure-no-failure Line for U 0 -Al Dispersion Fuel.(Reference 12). Blistering is expected above the line,but not below. U_00 loading varied from 22.3 to 41.6 wt.%.
J O
Available data on postirradiation blister temperature testing ofplate-type fuel are present in Figs. 4-6. The data shown in Fig. 4 werederived from tests on small, specially-fabricated, UßOg-Al test samples.As shown in this figure, the blister temperature decreases sharply up to anirradiation level of 5 x 10²⁰ fissions/cm3, but more slowly thereafter to anestimated temperature of 250°C at the highest burnup levels normally experiencedwith these fuels (-2.2 x 10²¹ fissions/cm3).
202

TOO
6OO
SOO
400
30O -
200
•00
BLtSTERtC TEMPERATUREFOR y,o.»o.«9 wtx B«C DISPERSONFUELS. OAHO MJCLEAR CORPORATCN
20{X1G?0)BURNUP
Fig. 5 Postirradiation Blistering Temperature of Inner HFIRFuel plates (Reference 13). Idaho Nuclear Corporationresults are from Marchbanks and Graber (Reference 14).
700
•600
900
£y 4oo300
200
too
OFUCL ELEMENT 21-0• FUEL ELEMENT S-O
ING RANGEFOR HFIR FUEL PLATES
BLISTERING TEMPERATURE' I - —FOR u/3,+0 »«ntBv: DISPERSION FUELS. IDAHO NUCLEAR CORPORATION
K> IS 20 («10»*)
Fig. 6 Postirradiation Blistering Temperatures of Outer HFIRFuel Plates (Reference 13). Idaho Nuclear Corporationresults are from Marchbanks and Graber (Reference 14).
For purposes of comparison, the data in Fig. 4 are compared with theexperience with a large number of HFIR fuel plates. These comparisons, whichare presented in Figs. 5 and 6, show that the irradiation experience with theproduction run HFIR fuel has been better than that indicated by the smallsample data. The solid line in Figs. 5 and 6 is the same line that representsthe lower bound of the data in Fig. 4. Comparison of Figs. 5 and 6 shows thatthe higher loaded outer elements of the HFIR, which operate at a somewhat
203
higher temperature, exhibit more favorable (higher) blistering temperatures.This suggests that the fuel operating temperature is an important parameter indetermining the post-irradiation blistering behavior.
Comparison of these data with those for uranium-aluminide fuel presentedin Fig. 3 indicates that the blistering temperature for the 0303 dispersion-type fuel at the higher burnup levels (1.5 to 2.0 x 10²¹) is from 100 to 200°Clower depending upon the irradiation temperature. Higher irradiation tempera-tures yield higher post-irradiation blistering temperatures.
REFERENCES
1. J. M. Beeston, R. R. Bobbins, G. W. Gibson, and W. C. Francis,"Development and Irradiation Performance of Uranium Aluminide Fuelsin Test Reactors," Nuclear Technology 49, 136 (1980).
2. M. J. Graber, G. 0. Hayner, R. R. Bobbins, and G. W. Gibson, "PerformanceEvaluation of Core II and III Advanced Test Reactor Fuel Elements,"ANCR-1027, Aerojet Nuclear Company (1971).
3. M. J. Graber, G. W. Gibson, V. A. Walker, and W. C. Francis, "Resultsof ATR Sample Fuel Plate Irradiation Experiment," IDO-16958, IdahoOperation Office, Atomic Energy Commission (1964).
4. V. A. Walker, M. J. Graber, and G. W. Gibson, "ATR Fuel MaterialsDevelopment Irradiation Results - Part II," IDO-17157, Idaho OperationsOffice, Atomic Energy Commission (1966).
5. Unpublished Internal Data, EG&G, Idaho, Inc.
6. A. D. Whapham, "Electron Microscope Observations of the Fission-GasBubble Distribution in U02," Nucl. Appl. 2,_123 (1966).
7. R. M. Cornell, M. V. Speight, and B. C. Masters, "The Role of Bubblesin Fission Gas Release from Uranium Dioxide," J. Nucl. Mater. 30, 170 (1969),
8. R. S. Nelson, "The Stability of Gas Bubbles in an Irradiation Environment,"J. Nucl. Mater. 31, 153 (1969).
9. R. D. Cheverton, and T. M. Sims, "HFIR Core Nuclear Design," Oak RidgeNational Laboratory Report ORNL-4621 (July 1971).
10. "Reactor Safety Evaluation of ORNL Proposal to Modify Fuel in ORR,"Oak Ridge National Laboratory (Feb. 1977).
11. M. M. Martin, Oak Ridge National Laboraotry, Oak Ridge, TN, personalcommunication (April 1978).
12. M. J. Graber and M. F. Marchbanks, "Blister Resistance of Various AluminumDispersion Fuel Systems," Idaho Nuclear Corporation Annual ProgressReport on Reactor Fuels and Materials Development for FY 1967, IN-1121(Feb. 1968), pp. 43-47.
13. A. E. Rieht, R. W. Knight, and G. M. Adamson, Jr., "PostirradiationExamination and Evaluation of the Performance of HFIR Fuel Elements," OakRidge Natonal Laboratory Report ORNL-4714 (Dec. 1971).
14. M. Marchbanks and M. J. Graber, "ORNL Versus Commercially ManufacturedUßOs, " Idaho Nuclear Corp. Annual Progress Report on Reactor Fuelsand Materials Development for FY 1967, IN-1121 (Feb. 1968) pp. 37-39.
204
Appendix J-1.2
A STATISTICAL EVALUATION OF THE IRRADIATIONPERFORMANCE OF HEU-BASED UA1X-AI DISPERSION FUELS
S. GAHLERT, S. NAZARÉKernforschungszentrum Karlsruhe GmbH,Karlsruhe, Federal Republic of Germany
Abstract
A large body of data was generated during the developmentand testing of HEU (93%) UA1 -Al fuel with U-densities up to1.7 Mg U/m3. The data reveals a large scatter which can beexpected not only from the parameter variation (metal-lurgical and testing) but also from the difficultiesencountered in post-irradiation examinations.
This paper provides a statistical evaluation of the influ-ence of various parameters such as fission density, burnup,fuel loading, boron content, and irradiation temperature onthe two major performance criteria—namely swelling andblistering, and develops empirical equations capable ofpredicting the swelling and blistering behavior.
1. Introduction
UAl -Al dispersion fuel elements with U-densities up to about 1.7 Mg U mhave been in operation in various test reactors since almost 20 years.Because of its excellent performance under high flux and high burnupconditions UAl -Al can be considered to be a classical fuel for research andxtest reactors. During the development and testing,which was done mainlyat INEL, ORNL and KfK, and subsequent operation, a large body of datawas generated. The data reveals a large scatter which can be expectednot only from the parameter variation (metallurgical and testing) butalso from the difficulties encountered in post-irradiation examinations.
The objectives of this paper are:
to statistically evaluate the influence of various parameters suchas fission density, burnup, fuel loading, boron content, irradiationtemperature, on the two major performance criteria - namely swellingand blistering;
to develop empirical equations capable of predicting the swelling andblistering behaviour.
205
Wherever possible an attempt has been made to outline the relative im-portance of the individual parameters for the overall behaviour.
All plates considered in this paper were prepared by powder metallur-gical techniques using the well known roll bonding method /3,9/. The fuelmeat thickness of miniature as well as full size plates was typicallyO.51 mm. The cladding thickness was generally O.38 mm. Some full sizeplates had a thicker cladding up to l.OO mm. Various commercial aluminumalloys were initially used as cladding materials (e.g. 6061, X8OO1, 11OO,XAPOO1, APM-768, MD1O1). The alloy 6061 is the now prefered cladding material.
An extensive irradiation testing program was carried out at INEL.Miniature plates were tested mainly in the ETR in a pressured water
14 -2 -1loop under maximum thermal neutron fluxes of 5.5-10 n cm s and6 —2heat fluxes of 7.6 10 W m /12/. Irradiation temperatures were varied
in a wide range from about 350 K to 55O K. Most full size elements wereirradiated in the ATR, a high power reactor which allows very high ther-
15 -2 -1mal neutron fluxes up to 1-1O n cm s /6/. Miniature plates tested atORNL were irradiated in the HFIR under a maximum thermal neutron flux
14 -2 -1of about 3.1*10 n cm s at temperatures between 320 and 37O K /5/.Irradiation testing at KfK was carried out in the FR 2 under maximum
13 -2-1thermal neutron fluxes of 8.5-10 n cm s and maximum heat fluxes of1-106 WnT2 /4/.
2. Swelling behaviour
Swelling is one of the main performance criteria for the evaluationof dispersion fuels. For the design and safe operation of the reactor,the dimensional stability under normal and off-normal conditions is veryimportant. Multiple regression analysis was used to evaluate the effectof various irradiation parameters on swelling behaviour.
Table 1 summarizes the data of miniature plates used in the re-gression analysis.It is well known that swelling depends on fission density. Discarding allother parameters and considering only fission density,the linear leastsquare method yields the following equation:
AV/V =-1.87 + (3.21-10~27) , FD (1)
with :AV/V = swelling of the dispersion [%]FD = fission density [fiss-m ]
206
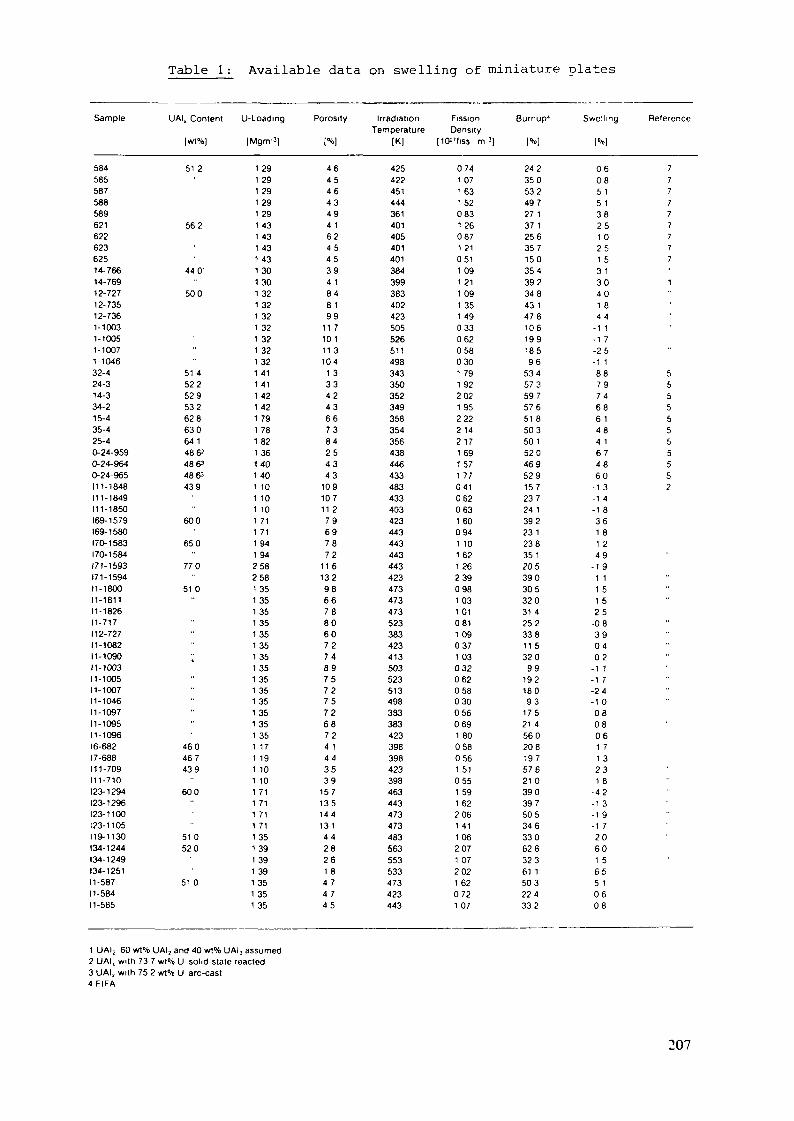
Table 1 : Available data on swelling of miniature plates
Sample
58458558758858962162262362514-76614-76912-72712-73512-7361-10031-10051-10071-104632-424-314-334-215-435-425-40-24-9590-24-9640-24-965111-1848111-1849111-1850169-1579169-1580170-1583170-1584171-1593171-159411-180011-181111-182611-717112-72711-108211-109011-100311-100511-100711-104611-109711-109511-109616-6821 7-688111-709111-710123-1294123-1296123-1100123-1105119-1130134-1244134-1249134-125111-58711-584II -585
UAI, Content
|wt%]
51 2
562
440'
500
51 452252953262863064148&1
48 &>4863439
600
650
770
51 0
'•
460467439
600
51 0520
51 0
U-Loadmg
|Mgrrv3]
1 291 291 291 291 291 431 431 431 431 301 301 321 321 321 321 321 321 321 411 411 421 421 791 781 821 361401 401 101 101 101 711 711 941 942582581 351 351 351 351 351 351 351 351 351 351 351 351 351 351 171 191 101 101 711 711 711 711 351 391 391 391 351 351 35
Porosity
[%]
46454 643494 1624 545394 1848199
11 710111 3104
1 3334 24 3667 38 42 5434 3
10910711 279697872
11 613298667 880607 27489757 2757 2687 24 14 43539
1571351441314 428261 84 74 745
IrradiationTemperature
(K|
425422451444361401405401401384399383402423505526511498343350352349358354356438446433483433403423443443443443423473473473523383423413503523513498383383423398398423398463443473473483563553533473423443
FissionDensity
[10"(iss m 3)
0741 071 631 520831 260871 210511 091 211 091 351 490330620580301 791 922021 952222 142171 691 571 770410620631 600941 101 621 262390981 031 010811 090371 030320620580300560691 800580561 510551 591 622061 411 062071 072021 620721 07
Burnup*
|%]
2 4 235053249727 137 125635715035439234843147610619918596
53457359757651 850350152046952915723724 139223123835 120539030532031 425233811 532099
1921809 3
17521 456020819757621 039039750534633062632361 1503224332
Swelling
l%)
06085 15 138251 02 51 53 1304 01 84 4
-1 1-1 7-25-1 1887 97 4686 1484 16 74860
-1 3-1 4-1 8361 81 249
-1 91 11 51 525
-0839040 2
-1 1-1 7-24-1 00808061 71 3231 8
- 4 2-1 3-1 9-1 720601 5655 1060 8
Reference
77777777711
55555555552
1 UAlp 60 wt% UAI2 and 40 wt% UAI3 assumed2 UAI, with 73 7 wt% U solid-state reacted3 UAI, with 75 2 w1% U arc-cast4 FIFA
207
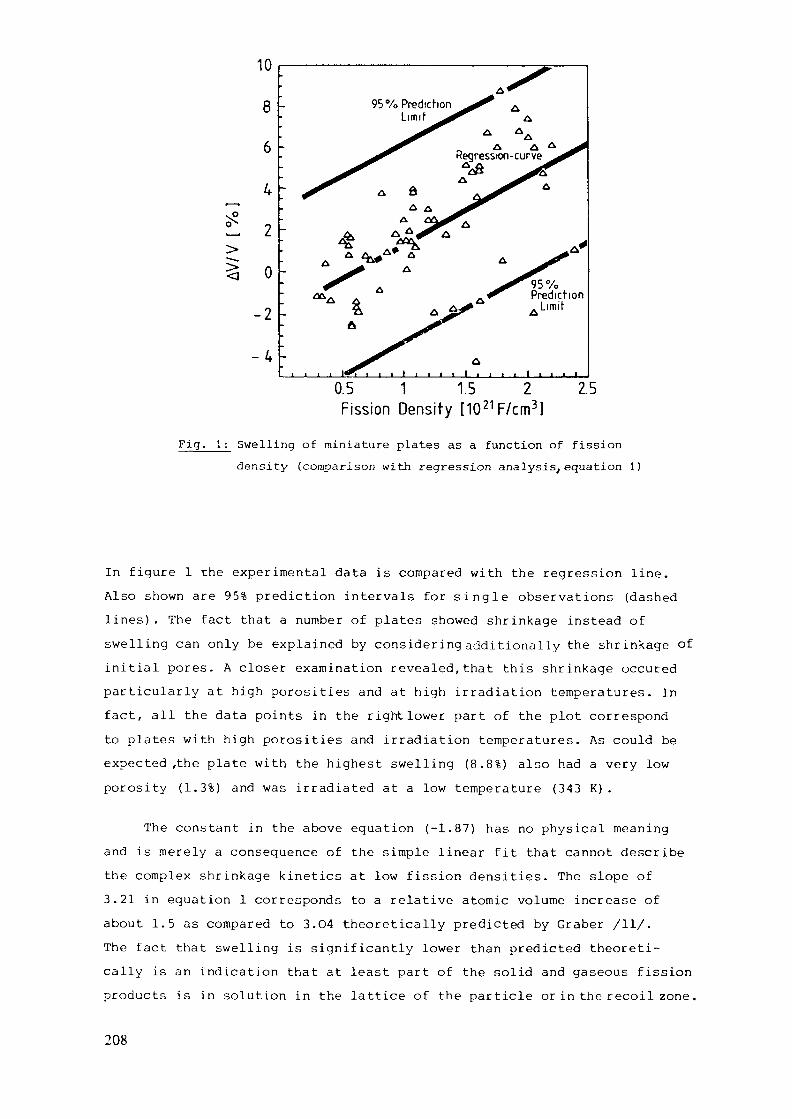
10
8
6
U
2
0
-2
- 4
95%PredicfionLimif
95%Prediction. Limit
0.5 1 1.5 2Fission Density [1021F/cm3]
2.5
Fig. 1 : Swelling of miniature plates as a function of fissiondensity (comparison with regression analysis/equation 1)
In figure 1 the experimental data is compared with the regression line.Also shown are 95% prediction intervals for single observations (dashedlines). The fact that a number of plates showed shrinkage instead ofswelling can only be explained by consider ing additionally the shrinkage ofinitial pores. A closer examination revealed,that this shrinkage occuredparticularly at high porosities and at high irradiation temperatures. Infact, all the data points in the right lower part of the plot correspondto plates with high porosities and irradiation temperatures. As could beexpected ,the plate with the highest swelling (8.8%) also had a very lowporosity (1.3%) and was irradiated at a low temperature (343 K).
The constant in the above equation (-1.87) has no physical meaningand is merely a consequence of the simple linear fit that cannot describethe complex shrinkage kinetics at low fission densities. The slope of3.21 in equation 1 corresponds to a relative atomic volume increase ofabout 1.5 as compared to 3.O4 theoretically predicted by Graber /11/.The fact that swelling is significantly lower than predicted theoreti-cally is an indication that at least part of the solid and gaseous fissionproducts is in solution in the lattice of the particle or in the recoil zone.
208

Naturally,a better fit can be obtained by discarding those datapoints that correspond to plates with high porosities (> 1O%). The empi-rical equation is then given by:
AV/V = -2.00 + (3.96'10~27) • FD . (2)
The effect of porosity on swelling can be better described by con-sidering porosity as an additional parameter in the regression analysis.The linear least squares fit obtained is given by:
AV/V = 2.48 + (2.86-10~27) • FD - O.566 P (3)
with :
P = initial core porosity [%].
The above equation yields a much higher coefficient of correlation (88.2%)as compared to equation 1 (61.95%). The equation also indicates that onlypart of the porosity available compensates the swelling by shrinkage duringirradiation. In fact, microstructures of irradiated UA1 -Al dispersionsXhave usually revealed a rest porosity even after high burnup at hightemperatures /10/.
There have been attempts in the past to take into account the effectof porosity merely by deducting it from swelling /5,9/. However, equation3 indicates that this approach could lead to an underestimate of totalswelling.
Including irradiation temperature as an additional parameter in theregression model gives the following equation:
AV/V = 6.68 + (2.64-10~27) • FD - O.554 P - O.OO956 T (4)
with :
T = irradiation temperature [K].
Equation 4 indicates that irradiation temperature has only a minor influencein comparison to fission density and porosity (the t-statictics being 8.71for fission density, -10.27 for porosity and only 2.91 for temperature). Ofcourse, equation 4 gives the best coefficient of correlation (89.7%).
It has been postulated, that swelling is influenced by fuel loading.However,the multiple regression analysis led to the conclusion that fuelloading does not effect swelling (t = O.83). Nevertheless, fuel loading
209
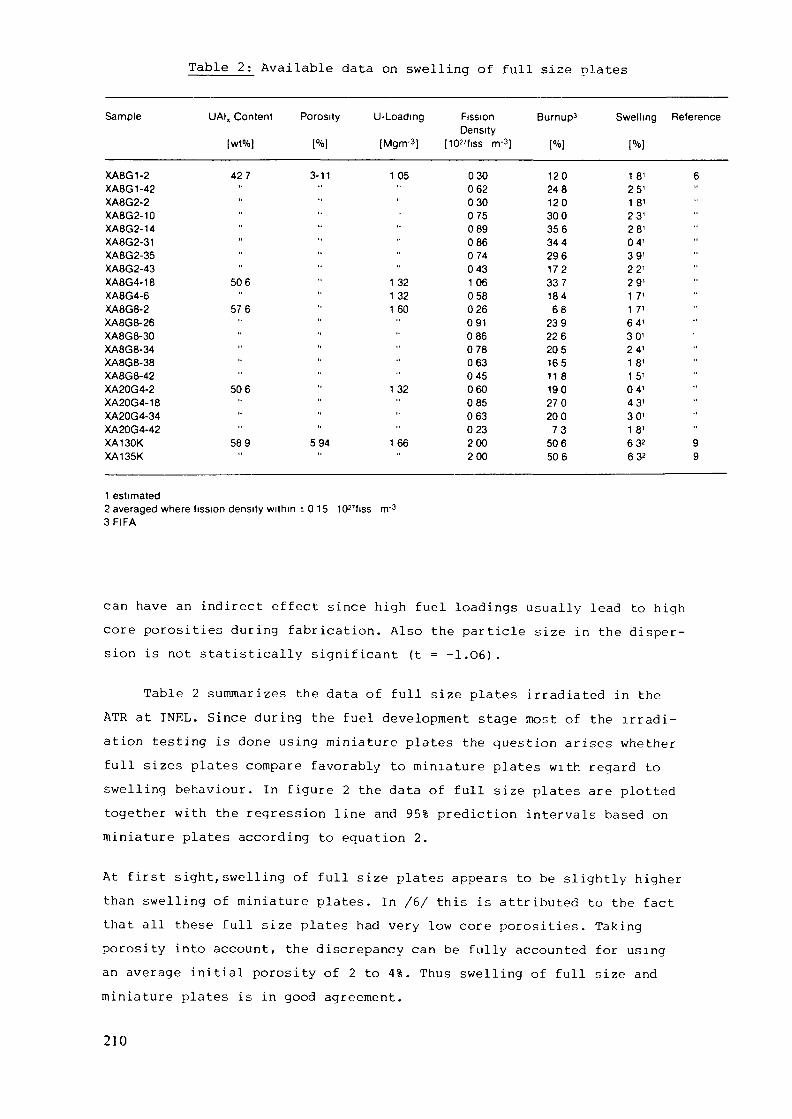
Table 2 ; Available data on swelling of full size plates
Sample
XA8G1-2XA8G1-42XA8G2-2XA8G2-10XA8G2-14XA8G2-31XA8G2-35XA8G2-43XA8G4-18XA8G4-6XA8G8-2XA8G8-26XA8G8-30XA8G8-34XA8G8-38XA8G8-42XA20G4-2XA20G4-18XA20G4-34XA20G4-42XA130KXA135K
UAIX Content Porosity U-Loading FissionDensity
[wt%] [%] [Mgnv3] [10"fiss nv3]
427 3-11 105 030062030075089086074043
50 6 " 1 32 1 061 32 0 58
57 6 " 1 60 0 26091086078063045
50 6 " 1 32 0 60085063023
58 9 5 94 1 66 2 00200
Burnup3
12024812030035634429617233718468
23922620516511 819027020073
506506
Swelling
18'25'1 81
23'28'04'39'22 '29'1 7'1 7'64'30'24 '1 8'1 5'04'43'30'18'632
632
Reference
6"""
"""""""
"
99
1 estimated2 averaged where fission density within ± 0 1 53 FIFA
ICF'fiss
can have an indirect effect since high fuel loadings usually lead to highcore porosities during fabrication. Also the particle size in the disper-sion is not statistically significant (t = -1.O6).
Table 2 summarizes the data of full size plates irradiated in theATR at INEL. Since during the fuel development stage most of the irradi-ation testing is done using miniature plates the question arises whetherfull sizes plates compare favorably to miniature plates with regard toswelling behaviour. In figure 2 the data of full size plates are plottedtogether with the regression line and 95% prediction intervals based onminiature plates according to equation 2.
At first sight,swelling of full size plates appears to be slightly higherthan swelling of miniature plates. In /6/ this is attributed to the factthat all these full size plates had very low core porosities. Takingporosity into account, the discrepancy can be fully accounted for usingan average initial porosity of 2 to 4%. Thus swelling of full size andminiature plates is in good agreement.
210
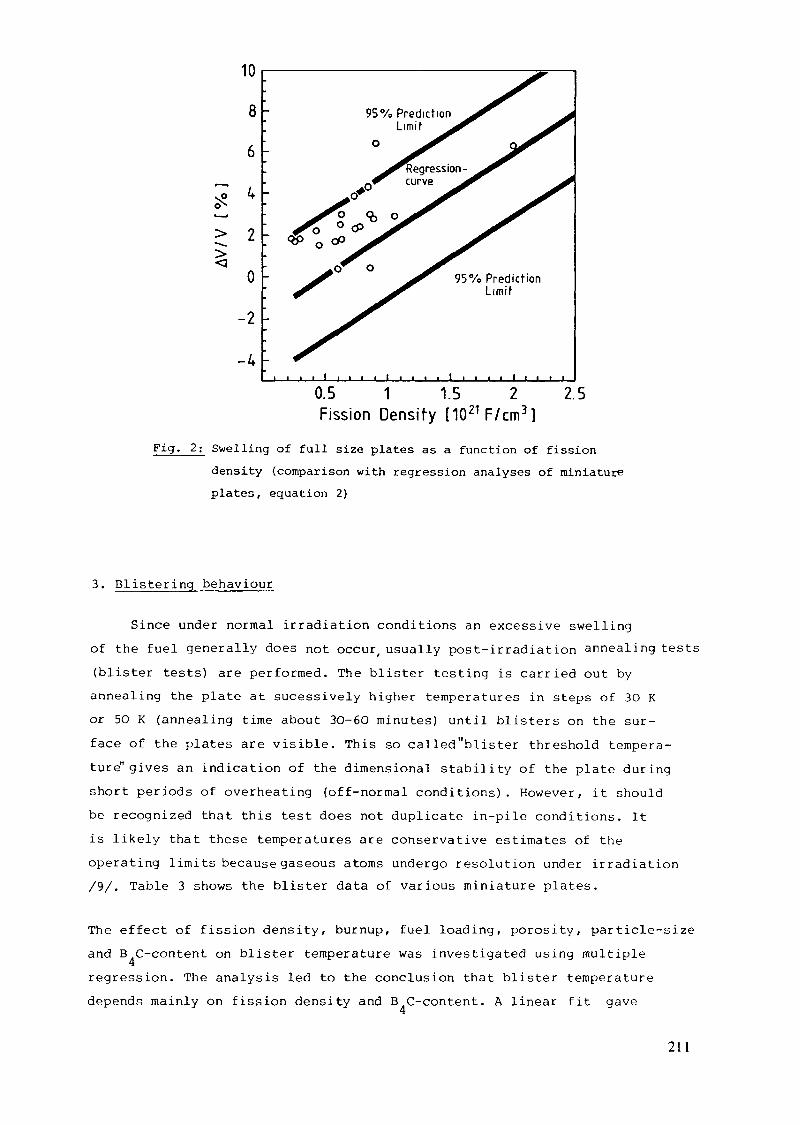
10
8
6
> 2
0
-2-4
95% Predict ionLimit
PredictionLimit
0.5 1 1.5 2 2.5Fission Density [1021F/cm3]
Fig. 2; Swelling of full size plates as a function of fissiondensity (comparison with regression analyses of miniatureplates, equation 2)
3. Blistering behaviour
Since under normal irradiation conditions an excessive swellingof the fuel generally does not occur, usually post-irradiation annealing tests(blister tests) are performed. The blister testing is carried out byannealing the plate at sucessively higher temperatures in steps of 3O Kor 50 K (annealing time about 3O-6O minutes) until blisters on the sur-face of the plates are visible. This so called"blister threshold tempera-ture" gives an indication of the dimensional stability of the plate duringshort periods of overheating (off-normal conditions). However, it shouldbe recognized that this test does not duplicate in-pile conditions. Itis likely that these temperatures are conservative estimates of theoperating limits because gaseous atoms undergo resolution under irradiation/9/. Table 3 shows the blister data of various miniature plates.
The effect of fission density, burnup, fuel loading, porosity, particle-sizeand B C-content on blister temperature was investigated using multipleregression. The analysis led to the conclusion that blister temperaturedepends mainly on fission density and B C-content. A linear fit gave4
211

Table 3 ; Available data on blister threshold temperature of miniature plates
Sample
112-727112-73611-100311-104611-109711-108211-109011-109511-109616-682111-709I 12-737134-1244134-1249134-125111-58511-588111-1848111-1849111-1850169-1579169-1580170-1583170-1584171-1593171-1594123-1294123-1296123-1100123-110511-180011-1811M-1826E-100113-30113-12113-13P20-1051P8-697118-2£-90113-4113-7P24-1146129-37129-7129-51129-63129-23129-60129-66129-64
LIAI, Content
[wt%)
51 0
46043951 0520
51 0
439
600
650••
770
600••••
51 0
398501
42140050 1398501
526437
••
U-Loading
[Mgnr3!
1 35
1 171 101 351 391391 391 351 351 101 101 101 711 711 941 942582581 711 711 711 711351 351 350961 321 321 321 020981 320961 321 321 381 10
••
"
Porosity
[%]
607 48975727 27 4687 241356128261 8454 5
10910711 27969787 2
11 6132157135144131986678
not available
••••
••••
"
B.C Content FissionDensity
(wt%) [10"fiss m J)
019 1 091 490320300560371 030691 80058
— 1 51019 084
2071.072021071 52
— 041- 062— 063— 160— 094— 1 10— 1 62— 1 26— 239
019 1591 622061 410.981031 010 12«051'0 77«0 95«
0 65 0 83«0 05 0 89«0 19 1 06«
094«200«2 03«
- 1 19«— 016«— 038«- 039«— 071«— 080«— 098«- 1 06«— 1 30«
Burnup'
[%)
3384639993
17511 532021456020857626162632361 133247315723724139223123835120539039039750534630532031453
162246304343384338
•41 363864836462
146150273308377408500
BlisterTemperature
IK)
813375338633
S633
8133
8633
81 33
81338133
8633
S633
7533
78338433
7833
7133
7033
8733
>8733
87338733
87338733873s
8733
7033
75338133
7233
7531
75338133
643s
8752«8103«8103«8103«7802«810?«BIO3«800*57751«765« «82S24
9132«8982«8972«87B2«8612«S462«8433«8622«
Reference
2
11
"
••••
••
-
••11
••
"
••
••
12
•
••
••
"
11
1 10 K incrémentals2 30 K Incrémentals3 50 K incrémentals4 data taken from plot therefore only approximations5 last temperature before blistering T-90 K6 last temperature before blistering T-190 K7 FIFA
the best results (logarithmic, exponential and higher order models werealso investigated). It could also be shown that blister temperature doesnot depend on fuel loading (t = O.O9) or particle size (t = O.16). The in-fluence of initial core porosity is only marginal (t = -1.53, a 5* in-crease of porosity leads to a decrease of blister temperature of only 15 K) .
212
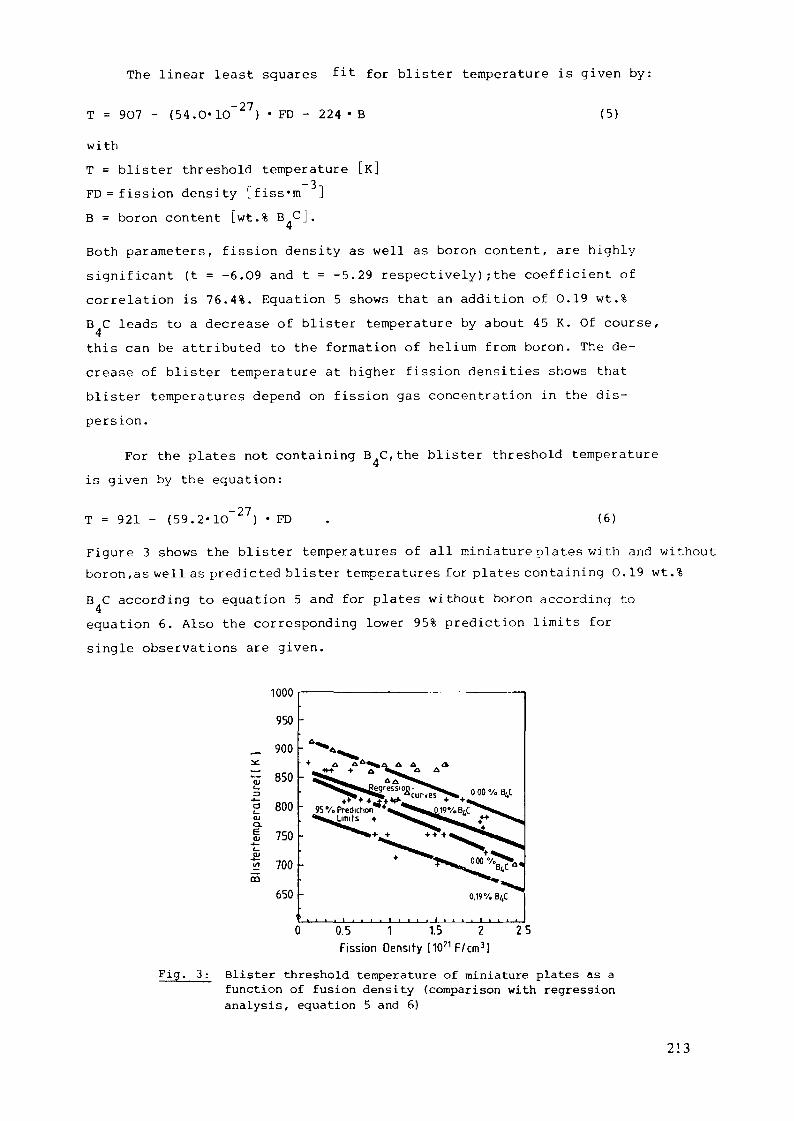
The linear least squares fit for blister temperature is given by:
T = 907 - (54.O-1O
with
-27, • FD - 224 • B (5)
T = blister threshold temperature [K]FD =fission density [fiss*m ]B = boron content [wt.% B C].
Both parameters, fission density as well as boron content, are highlysignificant (t = -6.O9 and t = -5.29 respectively); the coefficient ofcorrelation is 76.4%. Equation 5 shows that an addition of O.19 wt.%B C leads to a decrease of blister temperature by about 45 K. Of course,4this can be attributed to the formation of helium from boron. The de-crease of blister temperature at higher fission densities shows thatblister temperatures depend on fission gas concentration in the dis-persion.
For the plates not containing B C,the blister threshold temperatureis given by the equation:
T = 921 - (59.2-10~27) • FD (6)
Figure 3 shows the blister temperatures of all miniature plates with and withoutboron,as well as predicted blister temperatures for plates containing O.19 wt.%B C according to equation 5 and for plates without boron according to4equation 6. Also the corresponding lower 95% prediction limits forsingle observations are given.
1000
950
„ 900
£ 850
ö 800tuo.Ü 750
2 700CQ
650 0,19%B(,C
0.5 1 1.5 2Fission Density [1021F/cm3]
25
Fig. 3: Blister threshold temperature of miniature plates as afunction of fusion density (comparison with regressionanalysis , equation 5 and 6)
213
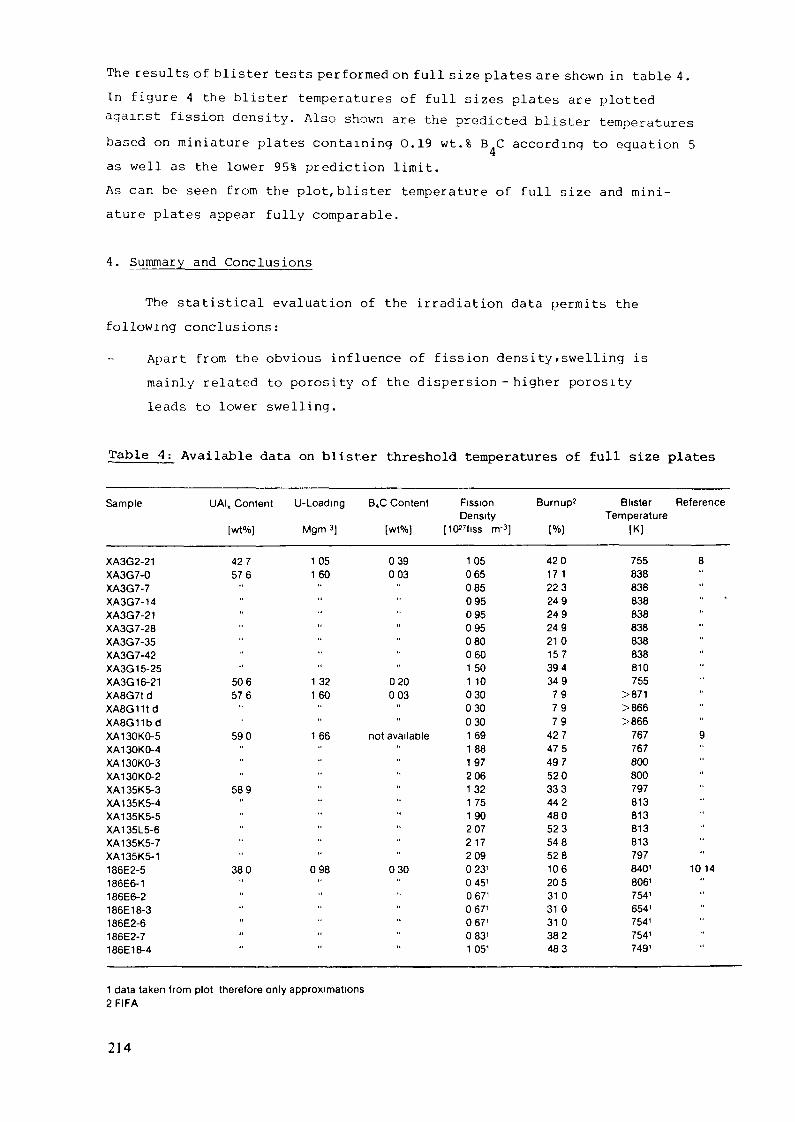
The results of blister tests performed on full size plates are shown in table 4.In figure 4 the blister temperatures of full sizes plates are plottedagainst fission density. Also shown are the predicted blister temperaturesbased on miniature plates containing O.19 wt.% B C according to equation 5as well as the lower 95% prediction limit.As can be seen from the plot,blister temperature of full size and mini-ature plates appear fully comparable.
4. Summary and Conclusions
The statistical evaluation of the irradiation data permits thefollowing conclusions:
Apart from the obvious influence of fission density»swelling ismainly related to porosity of the dispersion - higher porosityleads to lower swelling.
Table 4 : Available data on blister threshold temperatures of full size plates
Sample
XA3G2-21XA3G7-0XA3G7-7XA3G7-14XA3G7-21XA3G7-28XA3G7-35XA3G7-42XA3G 15-25XA3G 16-21XA8G7t dXA8G11tdXA8G11bdXA130KO-5XA130KO-4XA130KO-3XA130KO-2XA135K5-3XA135K5-4XA135K5-5XA135L5-6XA135K5-7XA135K5-1186E2-5186E6-1186E6-2186E18-3186E2-6186E2-7186E18-4
UAIX Content U-Loadmg BtC Content FissionDensity
[wt%) MgmS] [wt%] [1027fiss nrr3]
42 7 1 05 0 39 1 0557 6 1 60 0 03 0 65
0850950950950800601 50
506 132 020 11057 6 1 60 0 03 0 30
030030
590 166 not available 1691 881 97206
5 8 9 " " 1 3 21 751 90207217209
380 098 030 023'045'067'067'067'083'1 051
Burnup2
42017122324924924921015739434979797 9
42747549752033344248052354852810620531031 031 0382483
BlisterTemperature
[K]
755838838838838838838838810755
>871>866>866
767767800800797813813813813797840'8061
754'654'754'7541
749'
Reference
8"
"
"
"
"
"
"
9
"
"
1014""
"
1 data taken from plot therefore only approximations2 FIFA
214
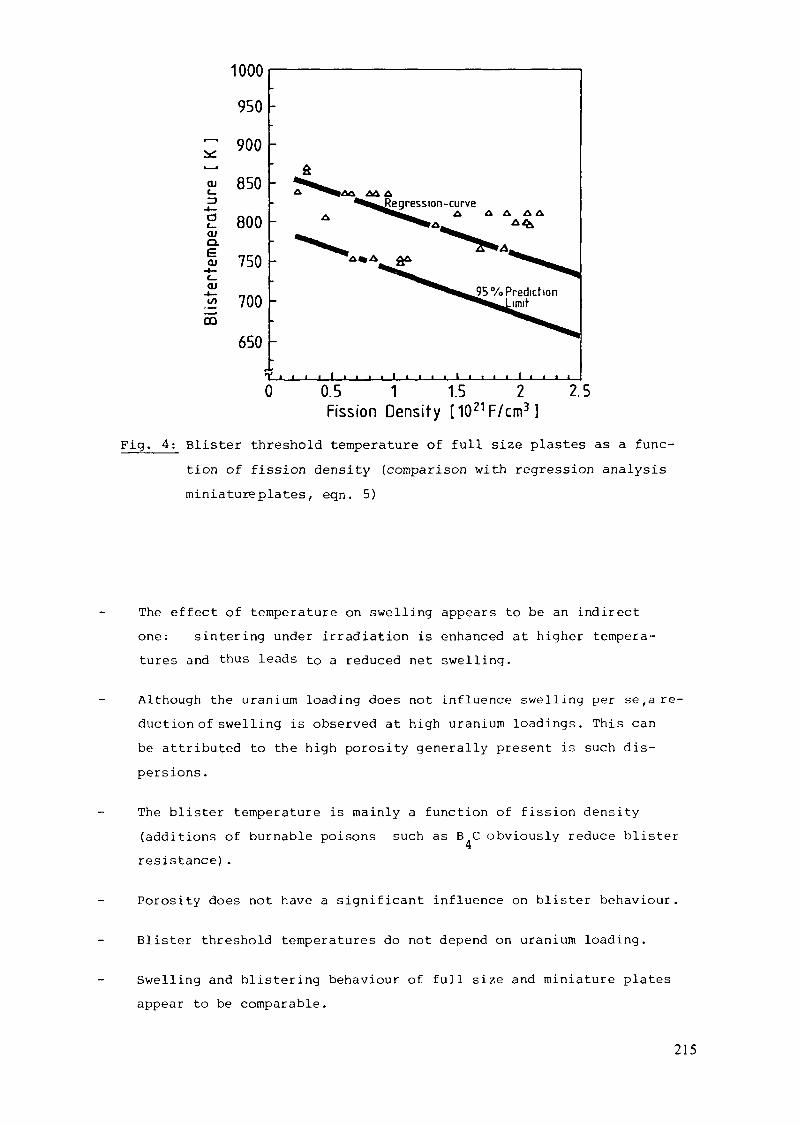
:SÉeu
-4—ac_CUCLEeu
aioom
1000
950
900
850
800
750
700
650
i i l i È
0 0.5 1 1.5 2Fission Density [1021F/cm3]
2.5
Fig. 4: Blister threshold temperature of full size plastes as a func-tion of fission density (comparison with regression analysisminiature plates, eqn. 5)
The effect of temperature on swelling appears to be an indirectone: sintering under irradiation is enhanced at higher tempera-tures and thus leads to a reduced net swelling.
Although the uranium loading does not influence swelling per se,a re-duction of swelling is observed at high uranium loadings. This canbe attributed to the high porosity generally present is such dis-persions .
The blister temperature is mainly a function of fission density(additions of burnable poisons such as B C obviously reduce blisterresistance).
Porosity does not have a significant influence on blister behaviour.
Blister threshold temperatures do not depend on uranium loading.
Swelling and blistering behaviour of full size and miniature platesappear to be comparable.
215

References
/!/ Francis W.C., Moen R.A. (eds.), IDO-17/218 (1966)
/2/ Brugger R.M. , Francis W.C. (eds.), IN-1437 (197O)
/3/ Nazaré S., Ondracek G., Thümmler F., J. Nucl. Mater. J56 (1975) 251
/4/ Dienst W., Nazaré S-, Thümmler F., J. Nucl. Mater. 64 (1977) l
/5/ Martin M.M., Martin W.R., Rieht A.E., ORNL-4856 (1973)
/6/ Graber M.J. et al., ANCR-1027 (1971)
/7/ Gibson G.W., Graber M.J., Walker V.A., IDO-17157 (1966)
/8/ Griebenow M.L. (ed.), ANCR-1O15 (1971)
/9/ Beeston J.M. et al., Nucl. Technology 4_9 (198O) 136
/1O/ Gibson G.W., IN-1133 (1967)
/11/ Francis W.C. (ed.), IDO-17154 (1965)
/12/ Gibson G. W., Graber M.J. (eds.), IN-1131 (1967)
/13/ Nazaré S, Ondracek G, Thümmler F., KfK 1252 (197O)
/14/ Covington E.D. (ed.), IN-1228 (1969)
216
Appendix J-1.3
IRRADIATION EXPERIMENTS
COMMISSARIAT A L'ENERGIE ATOMIQUECentre d'études nucléaires de Saclay,Gif-sur-Yvette, France
Abstract
Irradiation experiments conducted in 1972-1973 in the OSIRISreactor on fuel plates containing 93% enriched uranium aredescribed. Eight plates contained UAl^-Al fuel with 35 wt%U (1.3 g U/cm3) and 43 wt% U (1.7 g U/cm3) and two platescontained U-jOg-Al fuel with 43 wt% U (1.7 g U/cm3). Theaverage burnup of the 235U was 58.5% and the maximum burnupwas 70%.Results of the post-irradiation-examinations include data ondimensional measurements and metallographic examinations,the influence of grain size and the percentage of finesbelow 40 microns in the UAl-^-Al plates with 35 wt% U, andthe minimum temperature at which swelling appears with theoccurrence of blisters after post-irradiation annealing.All of the tested plates behaved satisfactorily underirradiation.
In 1973, the trench CEA has inspected the OAZ-K-OU2 tuel-element after ithad been irradiated in the OSIRIS reactor, as well as unirradiated iuel-plates oi the same tabrication lot.
This element and the unirradiated fuel-plates had been fabricated by CERCA.
The examination tests purposes were the following :
- to compare the irradiation behaviour of plates containing 35 and 43 weightper cent of total uranium ;
- to observe the influence of grain size and percentage of particles below4Û microns ,
- to observe the behaviour of a U-j 08 dispersion in Al matrix (43 w %total U)
- to determine the minimum temperature at which swelling appears with theoccurrence of blisters after the post-irradiation annealing treatment.
The fuel-element OAZ-K-002 was geometrically identical to standard OSIRISfuel-elements fabricated in 1971. It was consisting of 24 tuel-plates roll-swaged into 2 side-plates according to the standard technique.
217

The fuel-plates were of different kinds :
- UAlx dispersion named "CERCA", containing 35 or 43 w % of 93 % enricheduranium
- LAlx dispersion named "UAL3 dispersions" (in tact LA14 + UAL3) containing35 or 43 w % of 93 % enriched uranium
- UßOg dispersion, in an aluminium matrix, containing 43 w % of 93 %enriched uranium.
The fuel-plates in position number 1-2 and 9 to 24 (35 w % of uranium) weregeometrically identical to fuel-plates of standard elements ; fuel-corethickness 0,51 mm, cladding thickness 0,38 mm.
The fuel-plates in position number 3 to 8 (43 w /„ uranium) contained afuel-core 0,40 mm thick and cladding 0,44 nun thick.
Table I indicates the type of fuel contained in the different fuel-plates.
The following summary will be concerned with fuel-plates ol the second typewhich corresponds, as far as the fabrication method is concerned, to thefuel-plates, for which a quotation has been sent by JAER1, and to the thirdtype : L'ßüg dispersions.
I - UNIRRADIATEU FUEL-PLATES
I - 1. Micrographie examination :
For UAL3 dispersions, whatever the type of UALx dispersion (35 or43 w % U, grain size 40-90 or 40-100 yu, percentage of particles below40^ : 25 or 50 %), the fuel metallurgical structure was comparablefrom one type to the other.
In all cases including t^O^ dispersions, the bonding betweencore and cladding was perfect.
1 - 2 . Dimensional measurements :
They have been performed on the samples punched out of the unir-radiated fuel-plates according to fig. 1.
- J -£te _£h_i cjtnjjs s :
The measurements carried out using a micrometer, are recorded intable II. Each value in this table was calculated by averaging5 measurements.
218

TABLE I
DISPOSITION OF PLATES IN THE OAZ-K-002 TEST FUEL ELEMENT
Position inside | Plate id. number | Fuel compositionthe fuel-element j OAZ-K |
1 et 2 | 0006 | CERCA 35 w % Uj 0126 j
3 et 4 | 0022 bis | CERCA 35 w % Uj 003 bis j
5 et 6
7 et 8
9 et 10
11 et 12
13 et 14
15 à 24
00380039
0043
00540056
00640069
00770078
0139 *0147 *0141 *0142 *0143 *0144 *0145 *0146 *0127 *0001 bis
UA13 dispersion 43 w % UGrain size : same as HFR GRENOBLE
U30g dispersion 43 w % U
UA13 dispersion 35 w % UGrain size : same as HFR GRENOBLE
UA13 dispersion 35 w % UGrain size 40 - 100 /u25 % fine powder (<40/u)
UA13 dispersion 35 w % UGrain size 40 - 100 /u50 % fine powder ( < 40 /u)
CERCA 35 w % U
11
-—— 11
1
1
i—H
11—H
— -
* Plate with intentionally provoked USj type defects.
thicknesses :
The measurements, under 100 times magnification, are recorded intable III. Each value was calculated by averaging 5 measurementsperformed every 3 mm.
219
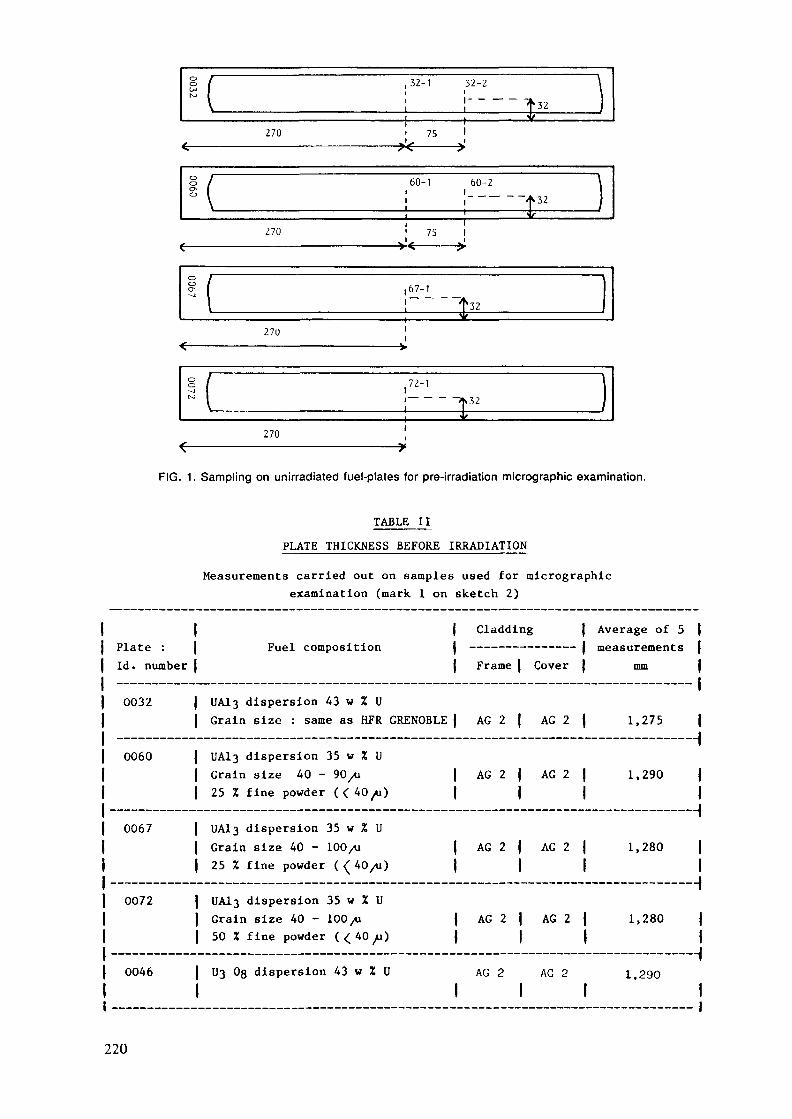
o /o /L-* 1v
270/• ._.. -
32-1 32-2i
i————————— ———————— 1 ———————
75 1—————— v .. ..._,., !
\l
"^32 |J/
o /° /0- lo 1\
270
60-1
75
60-2 '-- — "f 32
V
0 /<=> /0 (M
270
67-1
332
270
72-,
2FIG. 1. Sampling on unirradiated fuel-plates for pré-irradiation micrographie examination.
TABLE IIPLATE THICKNESS BEFORE IRRADIATION
Measurements carried out on samples used for micrographieexamination (mark I on sketch 2)
t JLd CC •
Id. number
0032
0060
0067
0072
0046
Fuel composition |1
UA13 dispersion 43 w Z UGrain size : same as HFR GRENOBLE j
UA13 dispersion 35 w Z UGrain size 40 - 90 /i |25 Z fine powder « 40/u) |
UA13 dispersion 35 w Z UGrain size 40 - 100 /u |25 Z fine powder ( { 40/u) |
UA13 dispersion 35 w Z UGrain size 40 - 100 /u |50 Z fine powder (<40yu) j
03 Og dispersion 43 w Z U1
Cladding |
Frame | Cover j
AG 2 | AG 2 j
AG 2 | AG 2 J1 1
AG 2 j AG 2 |1 1
AG 2 j AG 2 |1 1
AG 2 AG 21 !
Average of 5 \measurements |
mm |
1,275 |————-H
1,290 j1
————-H1,280 j
1————-H1,280 |
1-————H1,290
1
220

TABLE III
MICROSCOPE MEASUREMENTS OF FUEL-CORE AND CLADDING BEFORE AND AFTER IRRADIATION - UNITS : MILLIMETRES
| Cladding | Fuel Core | Plate cover |i __ _ _ _ _ __ _ __ ____ i1
FUEL COMPOSITION |
(UA1 dispersion) Frame
3 1
35 w Z U grain size : HFR |Plates (unlrradlated : 0060 | AG 2number (Irradiated : 0054 |
35 w Z U grain size : 40 - 100 /u |25 Z fine powder ( < 40/u) |Plates (unirradiated : 0067 | AG 2number (Irradiated : 0069 |
35 w 2 U grain size : 40 - 100 /u |50 Z fine powder ( <40 /u ) | AG 2Plates (unirratiaded : 0072 |
(irradiated : 0077 |
43 w Z U grain size : HFR fPlates (unirradiated : 0032 | AG 2number (irradiated : 0038 |
43 u Z U lPlates (unirradiated : 0046 | AG 2number (irradiated : 0043 |
i| Unirradiated plate | Irradiated plate | Unirradiated plate | Irradiated plate |
| Average | Min - Max | Average | Min - Max | Average | Min - Max | Average | Mln - Max |
I f I I I I I I IAG 2 | 0,542 | 0,43-0,60 | 0,50 | 0,44-0,56 | 0,371 | 0,28-0,46 | 0,39 | 0,34-0,47 |
I I I I I I I I I_____-_______-_._____-__-__._.-.._____.______-_________._._____..___.._.____-.._-___.-._______-.__.-_.H
I I I I I I I I II I I I I I I I I
AG 2 | 0,488 | 0,42-0,57 | 0,523 | 0,44-0,594 | 0,396 | 0,30-0,45 | 0,376 | 0,321-0,44^
I I I I I I I I I..._........_......„„„„._......____..____„„____„._.__„„..„„„.....„_._„„„_.„..„„....H
I I I I I I I I IAG 2 | 0,498 | 0,44 - 0,58 | 0,54 | 0,49-0,584 | 0,392 | 0,31-0,46 | 0,37 | 0,306-0,42 |
I I I I I I I I II I I I I I I I I
I I I I I I I I IAG 2 | 0,422 | 0,30-0,49 | 0,405 | 0,32-0,49 | 0,429 | 0,38-0,52 | 0,459 | 0,42-0,52 |
I I I I 1 I " 1 1 1__....___._..__....._____....„....„._....._.._.„„.__._.___._._...__._..._._._.____......„_..„.„„,
I I I I I I I I IAG 2 | 0,406 | 0,37-0,47 | 0,409 | 0,321-0,445 | 0,416 | 0,36-0,46 | 0,426 | 0,391-0,455)
I I I I I I I I IK»
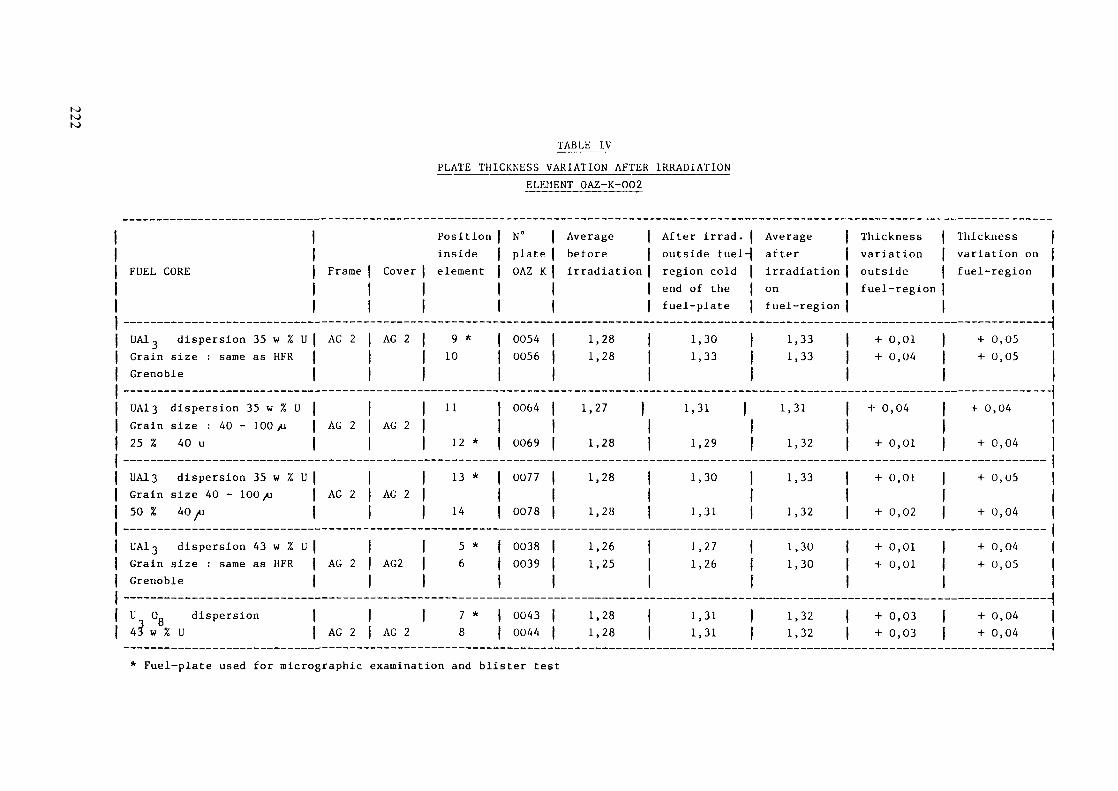
K)K)K)
TABLE IVPLATE THICKNESS VARIATION AFTER IRRADIATION
ELEMENT OAZ-K-002
FUEL CORE
UA13 dispersion 35 w % UGrain size : same as HFRGrenoble
UA13 dispersion 35 w % UGrain size : 40 - 100 /u25 % 40 u
UA13 dispersion 35 w % UGrain size 40 - 100 /u50 % 40 p.
UA13 dispersion 43 w % UGrain size : same as HFRGrenoble
U O,, dispersion43* w % U
Frame | Cover11
AG 2 | AC 211
1AG 2 | AG 2
1
IAG 2 | AG 2
1
1AG 2 | AG2
1
!AG 2 | AG 2
Positioninsideelement
9 *10
11
12 *
13 *
14
5 *6
7 *8
N°plateOAZ K
00540056
0064
0069
0077
0078
00380039
00430044
Average | After irrad. | Averagebetöre | outside fuel-j afterirradiation | region cold | irradiation
| end of the | on| fuel-plate | fuel-region
1,28 | 1,30 | 1,331,28 | 1,33 | 1,33
1 1
1,27 | 1,31 | 1,311 I
1,28 | 1,29 | 1,32
1,28 | 1,30 | 1,331 1
1,28 | 1,31 | 1,32
1,26 | 1,27 | 1,301,25 j 1,26 | 1,30
1 I
1,28 | 1,31 | 1,321,28 | 1,31 | 1,32
Thicknessvariationoutsidefuel-region
+ 0,01+ 0,04
+ 0,04
+ 0,01
+ 0,01
+ 0,02
+ 0,01+ 0,01
+ 0,03+ 0,03
Thicknessvariation onfuel-region
________________+ 0,05+ 0,05
+ 0,04
+ 0,04
+ 0,05
+ 0,04
+ 0,04+ 0,05
________________+ 0,04+ 0,04
* Fuel-plate used for micrographie examination and blister test
II - IRRADIATION TEST
Characteristics of the OAZ-K-OQ2 Fuel-element irradiation test :
- OSIRIS reactor working at 70 HW- Inlet water temperature ; 36 to 43° C- Outlet water temperature : 48 to 55° C- Average temperature of cladding at the inlet : '^ 60° C- Average temperature of cladding at the outlet : 75° C- Percentage of total power (70 UK) per position in the core :
. position 21 : 1,80 - 2,10 %
. position 31 : 1,47 - 1,61 %
. position 37 : 1,40 - 1,62 %- Irradiation of the element :
. introduction into the reactor core : January 27, 1972 Position 37removal : burn-up : 3,5 % February 15, 1972
. reloading : March 16, 1972 Position 37removal : burn-up 14,6 % May 8, 1972
. reloading : May 19, 1972 Position 37removal : burn-up 19,2 % June 6, 1972
. reloading : October 9, 1972 Position 21October 24, 1972 Position 31
Final removal from the reactor core :April 2, 1973average burn-up 58,5 %maximum burn-up 70 % in the center.
- Total irradiation exposure : 265 days- Total irradiation test length : 430 days- Storage time before inspection . 6 months
III - INSPECTION AFTER IRRADIATION
III - 1. Visual inspection ot fuel-plates after disassembling :
Each one of the 24 plates has been inspected over its whole are ausing a periscope.
All the plates named "UAlß dispersions" and "UßOg dis-persions" were intact except for some microscopic corrosion pits,which were not severe, located on scratches, whatever the U content(35 or 43 W %), the kind of dispersed material (L'Alß or l^Og)or the percentage of particles below 40^ (25 or 50 %)•
III - 2. Plate thickness measurements : (please refer to table IV)
Thickness measurements have been carried out in seven points regu-larly spacea along each fuel-plate axis, according to fig. 2.
223
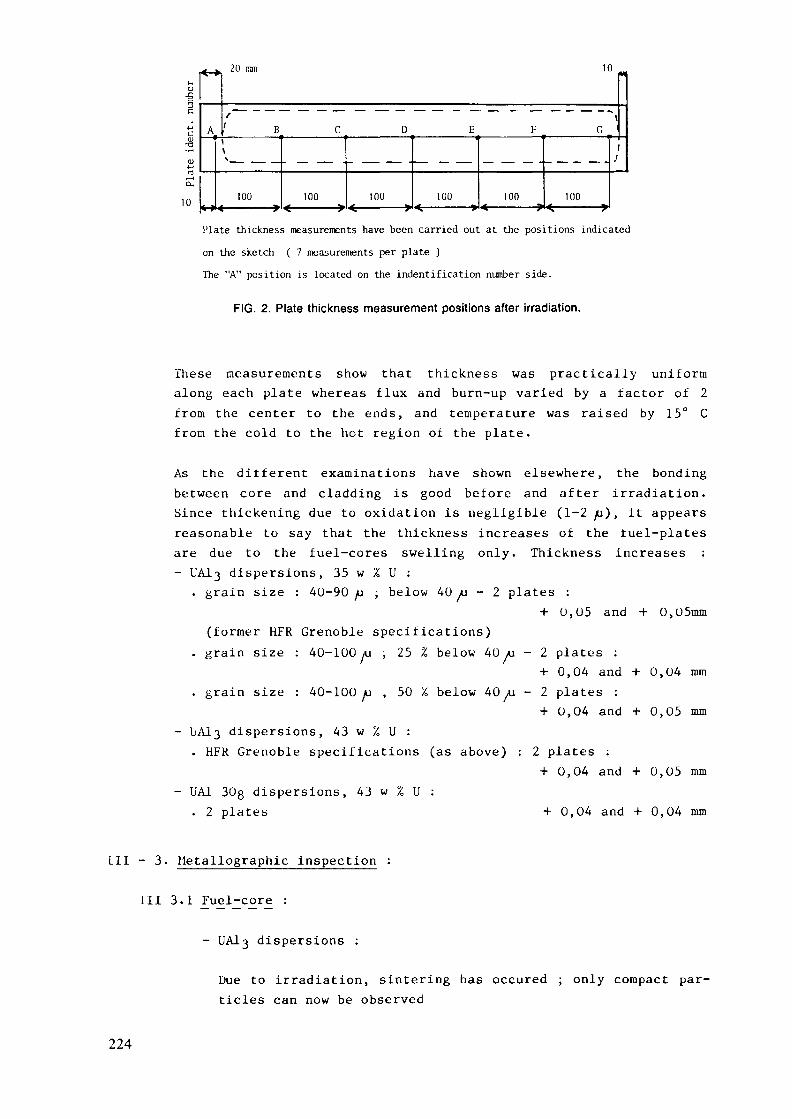
20 mm 10o
c
•Mc
:§(D
Cu
10
A -
4
r1 B
\v —— —— —
100IM ————————————— *
C
- — — -
100
D
- —— —— •
1004 —————— — »
E
— — ——
100
F
— — — -
100
G
— — — — -
100
^1
1
Plate thickness measurements have been carried out at the positions indicatedon the sketch ( 7 measurements per plate )The "A" position is located on the indentification number side.
FIG. 2. Plate thickness measurement positions after irradiation.
These measurements show that thickness was practically uniformalong each plate whereas flux and burn-up varied by a factor of 2from the center to the ends, and temperature was raised by 15° Cfrom the cold to the hot region of the plate.
As the different examinations have shown elsewhere, the bondingbetween core and cladding is good before and after irradiation.Since thickening due to oxidation is negligible (1-2 yu), it appearsreasonable to say that the thickness increases of the fuel-platesare due to the fuel-cores swelling only. Thickness increases :- UA13 dispersions, 35 w % U :
. grain size : 4U-90 yu ; below 40 >u - 2 plates :+ 0,05 and + 0,05mm
(former HFR Grenoble specifications). grain size : 40-100 /u , 25 % below 40 AJ - 2 plates ;
+ 0,04 and + 0,04 mm. grain size : 40-100 yu , 50 % below 40 - 2 plates :
+ 0,04 and + 0,05 mm- liAlß dispersions, 43 w % U :
. HFR Grenoble specifications (as above) : 2 plates :+ 0,04 and + 0,05 mm
- UA1 30g dispersions, 43 w % U :. 2 plates + 0,04 and + 0,04 mm
III - 3. Metallographie inspection
III 3.1 .Fuel -co re :
dispersions :
Due to irradiation, sintering has occured ; only compact particles can now be observed
224
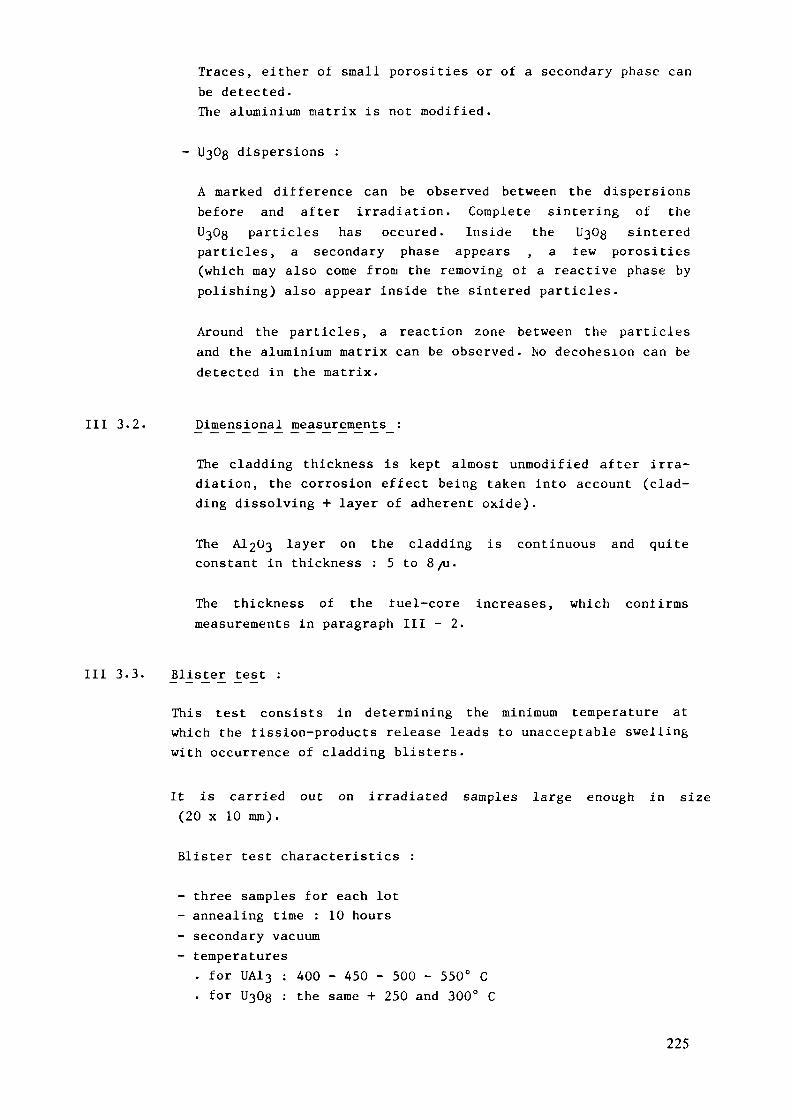
Traces, either of small porosities or of a secondary phase canbe detected.The aluminium matrix is not modified.
dispersions :
A marked difference can be observed between the dispersionsbefore and after irradiation. Complete sintering of theUjOß particles has occured. Inside the UßOg sinteredparticles, a secondary phase appears , a few porosities(which may also come from the removing of a reactive phase bypolishing) also appear inside the sintered particles.
Around the particles, a reaction zone between the particlesand the aluminium matrix can be observed. No decohesion can bedetected in the matrix.
Ill 3-2. Dimesonal. measurement s :
The cladding thickness is kept almost unmodified after irra-diation, the corrosion effect being taken into account (clad-ding dissolving + layer of adherent oxide).
The A12Ü3 layer on the cladding is continuous and quiteconstant in thickness : 5 to 8/u.
The thickness of the fuel-core increases, which confirmsmeasurements in paragraph III - 2.
Ill 3.3. JMser :e>t :
This test consists in determining the minimum temperature atwhich the fission-products release leads to unacceptable swellingwith occurrence of cladding blisters.
It is carried out on irradiated samples large enough in size(20 x 10 mm).
Blister test characteristics :
- three samples for each lot- annealing time : 10 hours- secondary vacuum- temperatures. for UA13 : 400 - 450 - 500 - 550° C. for UßOs : the same + 250 and 300° C
225

Since the results were very similar for the samples of a same lotof three, the examinations have been carried out on only onesample of each lot.
The following conclusions can be drawn from this test :
- the critical temperature leading to blistering is 500° C forUA13 dispersions and 300° C only for UßOg dispersions.
as tar as external aspect and thickness variations are concer-ned there is no apparent diiterence between the differentUAlß dispersion fuels (grain size, percentage of particlesbelow 40 /u, U content).
as tar as microscopic aspect is concerned, microscope examina-tion shows that :. for UAlß dispersions :
The percentage of particles below 40 /u (25 or 50 %) as well asthe U content (35 or 43 w %) do not modify the evolution of thecore after the annealing treatment. In particular, dispersionscontaining 43 w % U behave as well as 35 w % U dispersions.Bonding between meat and cladding is good.
. for UßOg dispersions :
The fuel core is more cracked (inside the U-jOg particles aswell as inside the Al matrix) than the fuel core of UAl^dispersions. Decohesions between matrix and particles are alsolarger and appear at lower temperature than in UA13dispersions .
IV - DISCUSSION
Swelling measurements have been compared to American results (1) correspon-ding to irradiation conditions, uranium loadings and burn-up that weresimilar.
For the UA13 dispersions as well as for the UßOg dispersions theresults are very similar.
After irradiation, annealing temperatures leading to blister formation havebeen compared to these published by american authors (2). The results are ingood agreement (fig. 3).
226
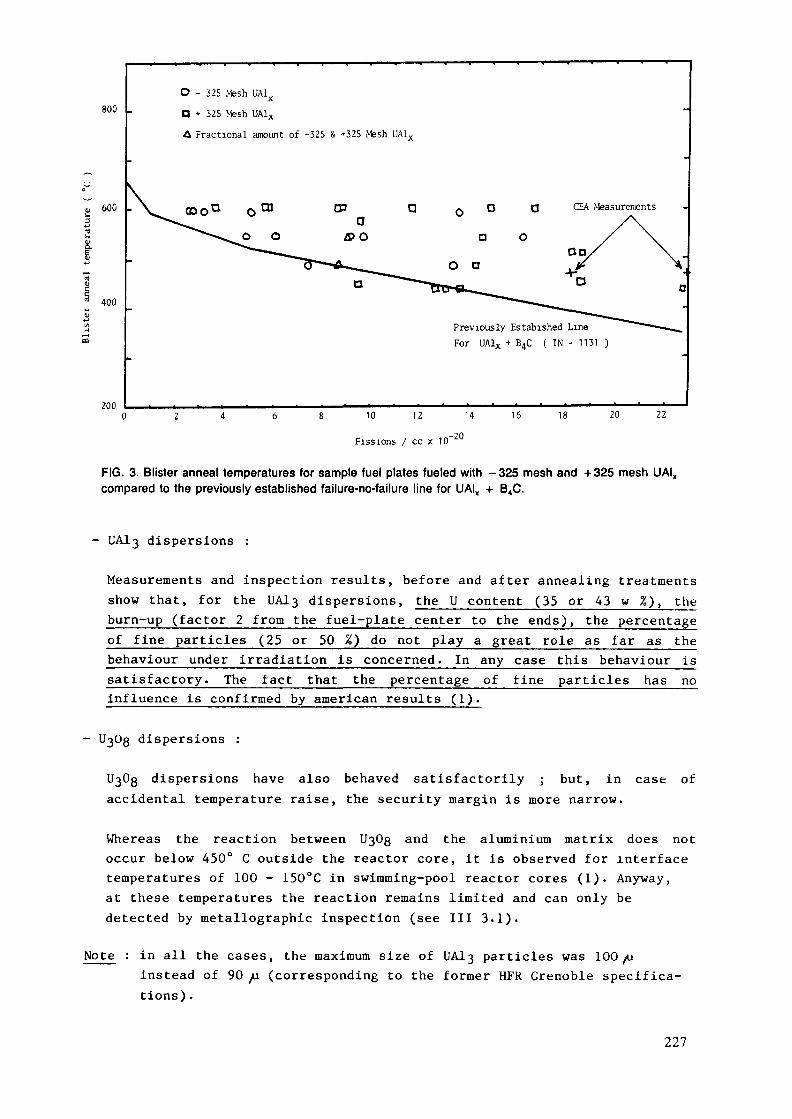
800
600
400
200
O - 325 Mesh UA1XQ + 325 Mesh UA1Xu Fractional amount of -325 & +325 Mesh UA1X
CEA Measurements
Previously Estabished LineFor UA1X + B4C ( IN - 1131 )
10 12 14 16 18 20 22
Fissions / cc x 10-20
FIG. 3. Blister anneal temperatures for sample fuel plates fueled with -325 mesh and +325 mesh UAIXcompared to the previously established failure-no-failure line for UAIX + B4C.
dispersions :
Measurements and inspection results, before and after annealing treatmentsshow that, for the UA13 dispersions, the U content (35 or 43 w %), theburn-up (factor 2 from the fuel-plate center to the ends), the percentageof fine particles (25 or 50 %) do not play a great role as far as thebehaviour under irradiation is concerned. In any case this behaviour issatisfactory. The fact that the percentage of tine particles has noinfluence is confirmed by american results (1)»
dispersions :
dispersions have also behaved satisfactorily ; but, in case ofaccidental temperature raise, the security margin is more narrow.
Whereas the reaction between UßOg and the aluminium matrix does notoccur below 450° C outside the reactor core, it is observed for interfacetemperatures of 100 - 150°C in swimming-pool reactor cores (1). Anyway,at these temperatures the reaction remains limited and can only bedetected by metallographic inspection (see III 3.1).
Note : in all the cases, the maximum size of UA13 particles was 100 /uinstead of 90 yu (corresponding to the former HFR Grenoble specifica-tions) .
227

V - CONCLUSION
- The fuel-plates ot the irradiation-test ÛAZ-K-002 fuel-element have beenexamined after irradiation at an average burn-up of 58,5 % and maximumburn-up of 70 %.
- Under irradiation, the cores of the fuel-plates have behaved satisfacto-rily without any exception. No significant difference has appeared betweenfuel-plates whatever the fabrication procedure (CERCA or UA13 disper-sion), the U content (35 or 43 w %), the kind of fuel (UAl^, UAl^ +UA13, U3Û8), the particle size (25 or 50 % of particles below 40 /i,the maximum size beeing 100 /u), and even the burn-up (40 to 70 %).
- After irradiation, microscopic inspection shows that the UßOg disper-sion cores where a surface reaction between UßOg and Al takes placeare more modified than the UAlß dispersion cores. In any case, thesemodifications are only of minor importance and are not able to influencethe fuel-element behaviour in the reactor core.
- For all the types of fuel-plates, the bonding between cladding and core,and between frame and cladding was not damaged by irradiation.
- Blistering during the annealing treatment occurs :
. at 500°C tor the UAlß dispersions, whatever the U content or thefabrication procedure
. at 300° C for the UßOs dispersions.
Following this irradiation test, the HFR Grenoble specificationsconcerning the powder have been modified as follows :. the maximum content of fine particles (below 40 AI) has been raised from25 to 50 %.
. the size-range of big particles has become 40-125 yu instead of 40-90 yu.
R E F E R E N C E S
(1) Irradiation behavior ot aluminium-base fuel dispersionsMM. Î1ARTIN - A.E. RIGHT - W.R. MARTINONRL 4856 - Mai 1973
(2) Metallurgy and materials science branch annual report FY 1970Idaho Nuclear Corporation IN 1437R.li. BRUGGER - W.C. FRANCIS
228
Appendix J-2
RELIABILITY OF LEU FUEL
W. KRULLGKSS — Forschungszentrum Geesthacht Gmbh,Geesthacht, Federal Republic of Germany
Abstract
Requirements on the reliability of LEU fuel are summarizedfrom the point of view of a German reactor operator and hisindependent experts.
From the view of a German reactor operator and his independent expertsthe demands on fuel reliability are /!/:
a) The fabrication of the LEU fuel plates should be on a high qualitystandard. This includes, of course, quality control as before but asa good indication a minor number of unacceptable fuel plates, too.
b) Irradiation of miniplates for getting esp. from post irradiationexamination (PIE) detailed information about
- corrosion behaviourfission product releaseswelling
- limitations of relative burnup or fissions/cm3(irradiation conditions should be well known e.g. thermal flux,burnup, power cycle, irradiation time, water quality)
c) Stepwise examination of LEU fuel
- ca. 10 miniplates irradiated up to max. burnup- PIE of these miniplates
- >10% of the number of fuel elements of the reactor core(more than five fuel elements) up to max. burnup. Higher U-density and higher burnup values as those needed for the actualcore conversion will be very helpful in the licensing procedure.
PIE of some fuel elements will be helpful
- conversion of the whole cored) Of interest are fuel plate irradiation experiments from different
manufacturers. But for the final core conversion there should beenough tested fuel plates or fuel elements from the chosen manu-facturer. These tests can be performed in different reactors. But
229

it will be very helpful in the licensing procedure for the wholecore conversion to have tests performed in the reactor underconsideration.
e) Guarantee for reprocessing the LEU fuel.
REFERENCE
/!/ W. Krull: Remarks on the demands for the qualification of highdensity fuel, GKSS 84/E/40, 1984
230
Appendix J-3
POST-IRRADIATION EXAMINATIONS OF DISPERSIONFUELS WITH REDUCED ENRICHEMENT
J.L. SNELGROVERERTR Program,Argonne National Laboratory,Argonne, Illinois,United States of America
Abstract
This appendix outlines the philosophy and procedures thatwere utilized by the U.S. RERTR Program for non-destructive anddestructive post-irradiation examination of miniplates andfull-size elements utilizing low enriched (<20%) uranium fuelswith high uranium densities.
Introduction
In order to attain its goal of providing the technical means forreducing the enrichment of uranium used in research and test reactor fuels,the U.S. Reduced Enrichment Research and Test Reactor (RERTR) Program hasbeen active in the development and testing of high-density fuels.Irradiation testing has been performed on miniature fuel plates(miniplates) to establish fission-density limits as a function of uraniumdensity for the various fuel types. Based upon successful results from theminiplates, full-size fuel elements of various fuel types, uraniumdensities, and designs were tested to demonstrate that full-size fuelplates fabricated under normal conditions by "commercial" fabricatorsbehave as expected. The irradiations of full-size fuel elements providedboth better statistics on fuel behavior than did the miniplates and aqualification of the participating fuel fabricators.
During the course of the irradiations, evidence of satisfactory fuelperformance was obtained through periodic visual inspections and byperiodic measurements of the water channel thicknesses. However, moredetailed information was obtained during post-irradiation examinations(PIE's). The philosophy of the PIE's and an explanation of the variousexaminations performed are given below.
Philosophy
The purpose of the PIE's was to provide detailed information aboutthe metallurgical behavior of the fuel during irradiation and about theanticipated behavior of the fuel following an accident in which the fuel isoverheated but not melted. The data obtained had to be of sufficientquality and quantity to provide a sound basis for the licensing of thesefuels. The philosophy of the PIE's under the RERTR Program was to obtainthe primary data of fuel behavior from examinations of the miniplates andto obtain confirmatory data from examinations of the full-size elements.This implied much more extensive PIE's on the miniplates than on the full-size elements. In general, the miniplates embraced a wider range ofuranium densities than did the full-size elements.
231
The major goals of the PIE's were: 1) to determine the amount ofswelling as a function or uranium loading and burnup, 2) to determine theblister threshold temperature as a function of uranium loading and burnup,and 3) to ensure that there was no evidence of incipient failure in those fuelsamples which appeared to be satisfactory. The extent of examinations ofsectioned miniplates and full-sized plates was determined by what was observedduring these and other examinations. It was anticipated that extensiveexaminations of plate sections would not be required for the uranium-aluminideand uranium-oxide fuels since they had been studied thoroughly at loweruranium densities. Much more detailed studies were made of the uranium-suicide fuels in order to fully characterize them. As stated previously,most of the metallurgical studies were performed using the miniplates. Onlylimited metallographic examinations for the full-size plates were made toconfirm expected behavior unless anomalies were discovered during thenondestructive examinations.
Miniplate Examinations
Post-irradiation examinations of the RERTR Program miniplates wereperformed at Argonne National Laboratory and at Oak Ridge National Laboratory,depending upon the particular type of fuel being examined. The various typesof examinations that were made are explained below.
1. Visual examination of module containing the miniplates. Theseexaminations were made to determine if any abnormalities could bedetected prior to removing plates from the module.
2. Visual examination of individual plates. During these examinationsblisters or other unusual features were detected and photographed.Photographs were also made of typical miniplates.
3. Gamma scanning. The plates were scanned longitudinally andtransversely to determine the distribution of one or more fissionproducts. Typically, a long-lived isotope which was not expected tomigrate, such as 13 Cs, was studied. Therefore, the relativedistribution of fission products was the same as the relativedistribution of fission events. These data were used to determine therelative fission densities in the various miniplates.
4. Dimensional measurements. The length, width, and thickness of eachminiplate are measured to determine dimensional changes resulting fromthe irradiation. These data were of limited use in determining volumechanges (swelling) of the miniplates due to relatively largeuncertainties in the thickness measurements.
5. Weight and density measurements. The weight of the miniplates andtheir densities as determined by immersion techniques were used toaccurately determine the volume changes of the miniplates.
6. Blister threshold temperature measurements. The threshold temperaturefor the formation of blisters was determined by the standard techniqueof heating the plate in a furnace to a specified temperature, holdingat that temperature for approximately 30 minutes, and removing theplate for visual examination. The sequence was repeated for successivehigher temperatures until blistering was observed. The thresholdtemperatures for other phenomena, such as significant fuel plate
232
warping, were also determined. Variations of the standard blister testtechnique were also employed when needed to more fully explain theobserved phenomena.
7. Chemical or radiochemical burnup analysis. Samples of one or moreminiplates from each batch were analyzed to determine the absoluteburnup of 235U. These data were used with gamma scanning data to assignabsolute burnups (fission densities) to each miniplate.
8. Metallographie examination. Samples were removed from selectedminiplates an examined metallographically to determine the swellingcharacteristics of individual fuel particles, chemical interactions offuel and aluminum matrix, changes in bonding of cladding to fuel meat,changes in porosity, and the distribution of fission-gas bubbles.
9. Scanning electron microscopy. Samples from selected miniplates wereexamined with a scanning electron microscope to determine thedistributions of fission-gas bubbles and other fission products in thefuel meat.
10. Electron microprobe analysis. An electron microprobe was used to studythe distribution of fission products in the fuel meat.
11. Scanning Auger microscopy. A scanning Auger microscope was used tostudy the interaction layers in the fuel and aluminum matrix.
12. Gas release measurements. A miniplate was punctured under vacuumconditions at room temperature to determine the amount of gas releasedfrom the plate. The interconnected void volume of the fuel core wasdetermined by backfilling with gas under standard conditions..
13. Measurement of fission-product release as a function of temperature.Using a series of temperature steps as was done for blister thresholdtemperature determination, the threshold temperature for the release offission products and the amounts of fission products released as afunction of temperature above threshold were determined.
The examinations listed in Nos. 1 through 8 and No. 13 were performedon all of the types of fuel being developed by the RERTR Program. Theexaminations listed in Nos. 9 through 11 were performed primarily on samplesfrom the uranium-suicide miniplates that were examined at Argonne NationalLaboratory. The gas release measurements (No. 12) were made at Oak RidgeNational Laboratory on selected t^Og-Al miniplates.
Full-size Element Examinations
Post-irradiation examinations of full-size fuel elements irradiatedunder the RERTR Program were performed at Argonne National Laboratory, OakRidge National Laboratory, The Netherlands Energy Research Foundation(Petten), and the Saclay Nuclear Research Centre (France), depending uponwhere the fuel elements were irradiated. The following examination steps forelements irradiated in the ORR illustrate the types of examinations made oneach fuel element.
233

Nondestructive PIE
1. Visual Inspection
Purpose: To observe general appearance and photograph.
a. Observe general external appearance.b. Note any unusual features.c. Photograph element exterior with close-ups of unusual features.d. Photograph through channels with element backlighted.
2. External Dimensions
Purpose: To determine dimensional changes during irradiation.
a. Measure major external dimensions (length, width, depth),b. Determine amount of warp, twist, or bow.
3. Gamma Scanning of Fuel Element
Purpose: To determine relative longitudinal burnup (fissionproduct) distribution for entire element and to determinerelative burnup from element to element.
a. Scan using Ge(Li) detector and multichannel analyzer forfission-product peaks in the energy range 100 to 1400 keV,including 106Ru and 137Cs.
b. Scan longitudinally in 1.0-in. increments along centerline ofelement.
4. Measure Channel Gaps
Purpose: To detect unusual amounts of plate swelling or warping.
a. Remove end fittings.b. Measure channel gaps on both sides of comb.
Destructive (Full) PIE
1. - 4. Same as above
5. Dismantling of Element
Purpose: To prepare plates for individual examination,
a. Separate individual fuel plates from side plates.
234
6. Visual Inspection of Plates
Purpose: To detect blisters or other unusual features.
a. Observe general external appearance of each plate and note anyunusual features.
b. Photograph typical plates (2 or 3) and any areas of unusualfeatures.
7. Thickness Measurements
Purpose: To provide data for estimation of plate swelling. Sincemeasured thickness changes always overestimate the volumechange (only the "high" points on the surface aremeasured), these measurements served mainly to show thatno unexpected swelling had occurred.
a. Measure thickness at ~24 points on plates Nos. 1, 5, 9, 13, 17,including at least two points outside the fuel meat zone.
b. Measure thickness at conspicuous spots.
8. Gamma Scanning
Purpose: To determine relative longitudinal and transverse burnup(fission product) distributions.
a. Perform analog scan longitudinally along centerline for allplates, for both integral above 0.5 MeV and 137Cs.
b. Perform multichannel spectrum measurements along centerline atpeak, as determined from analog scan, at 6 in. below peak, andat 10 in. above peak for plates Nos. 1, 5, 9, 13, and 17.
c. Perform analog scan transversely at peak of longitudinal scan,at 6 in. below peak, and at 10 in. above peak for plates Nos. 1and 9, for both integral above 0.5 MeV and 137Cs.
9. Blister Testing
Purpose: To determine the threshold temperature for the formationof blisters. The threshold temperature was measured bythe standard technique of heating the entire plate in afurnace to a specified temperature, holding at thattemperature for approximately 30 minutes and removing theplate for visual examination. The sequence was repeatedfor successively higher temperatures until blistering wasobserved.
a. Blister test two plates (Nos. 2 and 8).b. If results are not consistent, test also plate No. 18.
10. Metallography
Purpose: To confirm that the behavior of the fuel is as expected,based upon previous examinations of miniplates.
a. Obtain two sections (high and low burnup) from the plate (otherthan No. 1) showing the highest burnup.
b. Perform optical metallographic examination.235

11. Burnup Analysis
Purpose: To determine the absolute number of fissions (burnup).These data were used with gamma scanning data to assignabsolute burnups to each element.
a. Obtain burnup samples from high- and low-burnup regions ofplate sectioned for metallography.
b. Determine burnup by 148Nd method.
As was stated in the section on Philosophy, the examinations of full-size elements and fuel plates removed from them were intended to beconfirmatory in nature; therefore, they were much less detailed than thecorresponding examinations on the miniplates. Of course, any anomaliesdetected were fully investigated.
236

Appendix J-4IRRADIATION AND PIE OF TEST PLATES, RODS,
AND FULL SIZED ELEMENTS

Appendix J-4.1THE OAK RIDGE RESEARCH REACTOR
Appendix J-4.1.1
MINIPLATE IRRADIATIONS IN THEOAK RIDGE RESEARCH REACTOR
OAK RIDGE NATIONAL LABORATORYOak Rigde, Tennessee
ARGONNE NATIONAL LABORATORYArgonne, Illinois
United States of America
Abstract
The miniplate irradiation program was designed to screen a largenumber of possible LEU fuel types for use in research and testreactors. Two hundred and forty-four miniplates fabricated byANL, CNEA, EG&G Idaho, NUKEM, and ORNL were irradiated in theOak Ridge Research Reactor (ORR). Eleven types of fuel weretested: U3Si2, U3Sii.5/ U3Si, USi, U3SiCu, U3SiAl, U3O8, UA1X,UA12, UgFe, and U6Mn1-3. The samples included a wide range (0.2%- 93%) of enrichments and uranium densities up to 8 Mg/m3. Mostof the miniplates were irradiated beyond the 50% burnup levelthat is typical for research reactor fuel. Some were irradiatedbeyond 90% burnup of the contained 235U. Extensive post-irradiation-examinations were performed. These examinationsincluded measurement of swelling, blister thresholdtemperatures, fission product release temperatures, andmetallurgical analyses.
1.INTRODUCTION
Since its inception in 1978, the U.S. Reduced Enrichment Research andTest Reactor (RERTR) Program has pursued the development of high densitydispersion fuels as one method of making feasible the conversion ofresearch and test reactors from the use of highly enriched uranium (HEU) tolow enriched uranium (LEU) fuel. This program required irradiation ofvarious fuel types to normal burnup levels and beyond, and examination todetermine the effects of the irradiation. The irradiation program wasconducted at the Oak Ridge Research Reactor (ORR) , and the post-irradiationexaminations took place at ORNL and at ANL. Both miniature plates(miniplates) and complete fuel elements were irradiated.
The miniplate irradiation program was designed to screen manydifferent types of reduced enrichment fuel that might be suitable for usein research reactors. Miniplates with various fuel loadings were placedinto a holder (module) which was in turn loaded into one of the regularfuel element positions in the ORR. Up to sixty miniplates contained in
239
five modules could be irradiated in a single fuel element position. Theminiplates were irradiated until the desired burnup had been achieved, oruntil examination showed a failure of some type.
In the ORR program1'2, some 244 miniplates of various candidate fuelmaterials were irradiated in the special irradiation test facility,designated as High-Uranium-Loaded Fuel Element Development (HFED). Theminiplates were manufactured by ANL, Comision Nacional de Energie Atomicaof Argentina (CNEA), EG&G Idaho, Inc., NUKEM GmbH, Hanau, Federal Republicof Germany (NUKEM) and ORNL.
The program required development of a number of pieces of hardware.These included the modules for holding twelve miniplates, and the moduleholder which could hold five modules. When properly loaded, the HFEDassembly was loaded into a fuel element location within the reactor forirradiation. A poolside station was installed in the ORR pool to permitexamination after irradiation. A channel gap measuring device (CGMD),obtained from EG&G Idaho, Inc., allowed the gaps between plates in themodules to be measured accurately.
During each of the reactor refueling shutdowns, gap measurements weremade in each of the coolant channels in the HFED. Miniplates showing anysignificant swelling were removed for further testing and examination, andto prevent a serious fuel failure while in the reactor core.
After reaching the designated burnup level, or when swelling wasdetected, the miniplates were removed from the holders and stored in theORR pool until they could be examined further. Most of the post-irradiation examination was performed at ORNL and ANL, but a number ofplates were shipped to the Savannah River Laboratory for reprocessingtests. These tests and examinations formed the basis for the decision toproceed with U3$i2 fuel as the most likely successful material for the LEUprogram.
To ensure that the miniplates could be safely irradiated in the ORRfacility, specifications were developed to control the manufacture andinspection of the plates. This Specification is included in this appendixas Attachment A.
It was necessary to ship many of the irradiated miniplates from ORNLfor post-irradiation examination. These shipments had to conform to thevarious regulations controlling shipments of irradiated fuel. A smallcomputer code to determine the remaining uranium content of the plates, thecurie level and the heat load of the shipment was developed1 at ORNL. Thiscode, titled HFEDSHIP.BAS, is reproduced in Attachment B.
2. MINIPLATE IRRADIATION PROGRAM
The objectives of this irradiation program were to screen LEU fuelmaterials to determine their suitability for replacing the HEU materialscurrently in use and to provide a database of fuel characteristics leadingto the development of full-sized LEU fuel elements for full-core reactortests and operation. (A review of research reactor fuels as of 1982 can befound in Ref. 3.) To accomplish these objectives, miniplates wereirradiated in a core positions in the ORR with peak neutron fluxes of -1.96x 10¹⁸ neutrons m s . Burnups of up to 2.2 x 1027 fission/m of fuelcore volume were reached. At intervals during irradiation, measurements
240
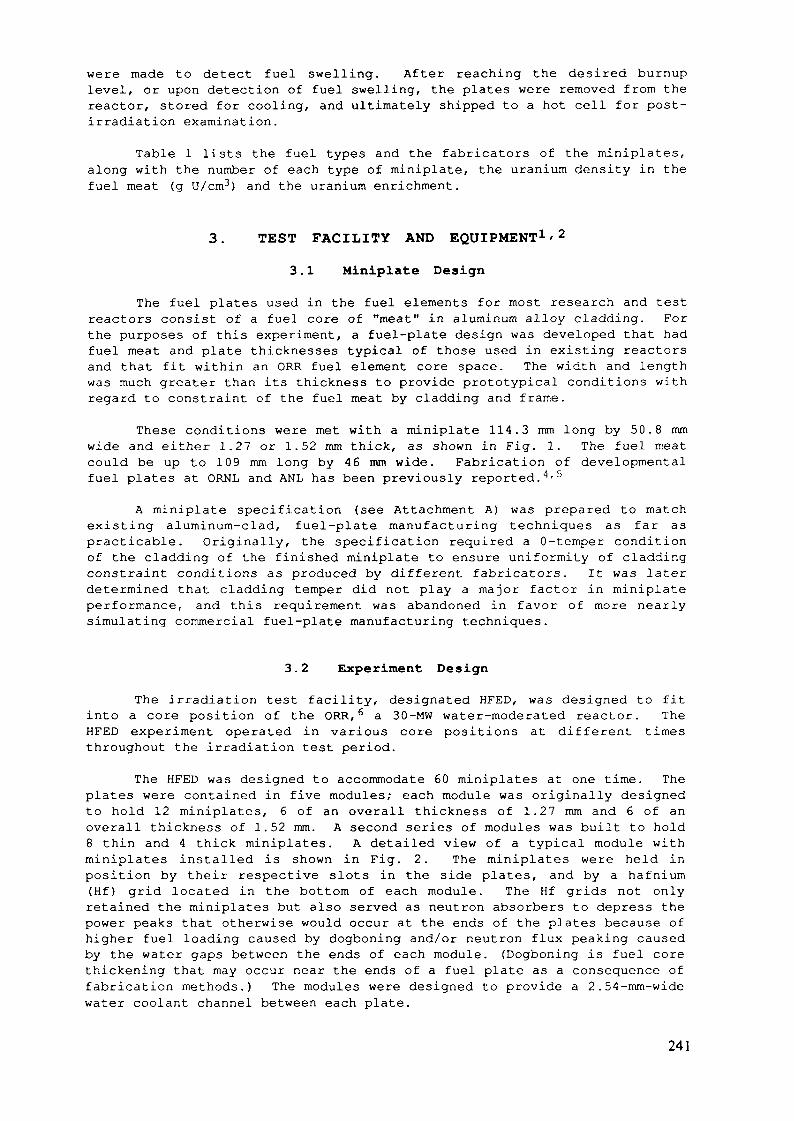
were made to detect fuel swelling. After reaching the desired burnuplevel, or upon detection of fuel swelling, the plates were removed from thereactor, stored for cooling, and ultimately shipped to a hot cell for post-irradiation examination.
Table 1 lists the fuel types and the fabricators of the miniplates,along with the number of each type of miniplate, the uranium density in thefuel meat (g U/cm3) and the uranium enrichment.
3. TEST FACILITY AND EQUIPMENT1'2
3.1 Miniplate Design
The fuel plates used in the fuel elements for most research and testreactors consist of a fuel core of "meat" in aluminum alloy cladding. Forthe purposes of this experiment, a fuel-plate design was developed that hadfuel meat and plate thicknesses typical of those used in existing reactorsand that fit within an ORR fuel element core space. The width and lengthwas much greater than its thickness to provide prototypical conditions withregard to constraint of the fuel meat by cladding and frame.
These conditions were met with a miniplate 114.3 mm long by 50.8 mmwide and either 1.27 or 1.52 mm thick, as shown in Fig. 1. The fuel meatcould be up to 109 mm long by 46 mm wide. Fabrication of developmentalfuel plates at ORNL and ANL has been previously reported.4'5
A miniplate specification (see Attachment A) was prepared to matchexisting aluminum-clad, fuel-plate manufacturing techniques as far aspracticable. Originally, the specification required a 0-temper conditionof the cladding of the finished miniplate to ensure uniformity of claddingconstraint conditions as produced by different fabricators. It was laterdetermined that cladding temper did not play a major factor in miniplateperformance, and this requirement was abandoned in favor of more nearlysimulating commercial fuel-plate manufacturing techniques.
3.2 Experiment Design
The irradiation test facility, designated HFED, was designed to fitinto a core position of the ORR,6 a 30-MW water-moderated reactor. TheHFED experiment operated in various core positions at different timesthroughout the irradiation test period.
The HFED was designed to accommodate 60 miniplates at one time. Theplates were contained in five modules; each module was originally designedto hold 12 miniplates, 6 of an overall thickness of 1.27 mm and 6 of anoverall thickness of 1.52 mm. A second series of modules was built to hold8 thin and 4 thick miniplates. A detailed view of a typical module withminiplates installed is shown in Fig. 2. The miniplates were held inposition by their respective slots in the side plates, and by a hafnium(Hf) grid located in the bottom of each module. The Hf grids not onlyretained the miniplates but also served as neutron absorbers to depress thepower peaks that otherwise would occur at the ends of the plates because ofhigher fuel loading caused by dogboning and/or neutron flux peaking causedby the water gaps between the ends of each module. (Dogboning is fuel corethickening that may occur near the ends of a fuel plate as a consequence offabrication methods.) The modules were designed to provide a 2.54-mm-widewater coolant channel between each plate.
241

Table 1. Miniplates That Were Irradiated in the ORR.
Fabri- Enrich-Fuel Type cat or ment g
U3Si2 ANL 9
4
1
CNEA 1
U a S i i . s ANL 4
1
3
0
9
0
9
0
9
U3Si ANL 92
4
19.
CNEA 1
N U K E M 1
USi ANL 41
U3SiCu ANL 4
U3SiAl ANL 19.
0
. 0
. 1
. 8
. 2
. 7
. 0
. 8
. 6
. 0
8-19.9
0
9
9
090
0
5
. 22
. 8
. 4
. 1
. 8
.2
. 0
-19.9
1
35
345
4
4
3
55
2
45
45666
6
456
6
333
3556
4566
U /cm3
. 7
. 9
. 0
. 7
. 9
. 6
. 7
. 8
. 8
. 0
. 8
. 0
. 5
. 9
. 8
. 6
. 0
. 3
. 9
. 1
. 8
. 2
. 1
. 9
. 8
. 8
. 7
. 8
. 3
. 9
. 8
. 5
. 6
. 1
. 9
-4-5
-3-5-5
-4
-3
-5-6
-6
-5-6-6-7
-6
-3-3-3
-4
-6-7
-4-5-6-7
. 0
.2
. 8
.2
. 7
. 9
. 9
.2
. 0
. 4
. 7
. 2
. 5
.2
.2
. 9
. 9
. 8
. 1
. 1
. 0
. 7
. 9
. 4
. 0
No. ofPlates
2
23
413
7
2
6
2
32
2
24
114755
2
121
6
343
3234
14796
Subtotal = 156
242

Table 1 (cont'd)
Fabri- Enrich-Fuel Type cat or ment
U O CNEA 19.3 B
NUKEM 39.27 .
20 .
ORNL 93.45 .
19.
Aluminides
UA1X CNEA 45.2 0 .
E G & G 4 0 .
19.
NUKEM 39.27.
UA12 ANL 44.
CNEA 19.
Others
U Fe ANL 19.6
o .U.JMn i 3 ANL 40.
19.
7
73
4
20
5
02
2
9
81
8
8
8
22
08
g
2 .2 .3.
2 .2 .3.3.
0 .2 .3.2 .2 .3.
1 .2 .
1 .2.
1 .2 .
2 .2 .
3 .
3.
7 .7 .7 .
6 .6 .
U /cm3
59-3. 15-3. 6
4311
75-2 . 814-2 . 581
53-2 . 5
9-2. 02-2 . 3
9-2 . 03
1-2 .21
0
0-3.1
08-8. 00-7.1
2 - 6 . 39-7. 0
No. ofPlates
233
2222
1235
119
15
44
31
22
2
5
1
32
33
Subtotal = 8 8
TOTAL = 244
243

50 8 flEF
lOENTIFICATION NO ONTHIS OUTER PLATE (REF )
2 S* MINTYP HEF
CORE
— CLADDING.6061 ALUMINUM
- 0 2 MIN CLADDING
-CORE- 1 271 0 025 PLATE 'A' (REF )- 1 52 10 025 PLATE 'B' (REF |
TOP OUTER PLATE (REF )
FUEL PLATE SLOT NO 12
FUEL PLATE SLOT NO 1
BOTTOMOUTER PLATE (REF ) SIDE PLATE
TYPICAL MODULE ISOMETRIC
-MAX CORE OUTLINE
t 6 i 4S* CHAMFER
SECTION A-A
r-1 6 « 45-BREAK ALL SHARP
EDGES APPROX 0132 54 MIN
IDENTIFICATION NO16 HIGH «013 DEEP (MAX)
LOCATED AS SHOWN~\FUEL PLATE NOTES:1 - THERE SHALL BE NO SCRATCHES OR PITS
MORE THAN 0 05 mm DEEP OR DENTS LARGERTHAN 5 1 mm DIAM LOCATED WITHIN THEMAX CORE OUTLINE
2 - URANIUM SHALL NOT EXTEND BEYONDTHE MAX CORE OUTLINE
3 - NO FUEL PLATE SHALL HAVE VISUALEVIDENCE OF A BLISTER
4 - FUEL PLATES SHALL BE FREE OFIMBEDDED FOREIGN MATERIAL
5 - EACH FUEL PLATE SHALL BE FLATWITHIN 0 1 mm T l R.
6 - MIN CLADDING THICKNESS SHALL BE 0 2 mm
HIAI005
1
1
t
t
1
*
11
[•• — 2S4MIN
s v
t '..„_.... -jl
2 54 MIN —H
.-.-1141*00 fc1U3-013 '
T 'SC 81005
JL» LAJ1-254 MIN
* 127*0025-»llAlOQSl PLATE 'A'
PI AlP *n*
7
FUEL PLATEDIMENSIONS IN
Fig. 1. HFED Irradiation Experiment Miniplate and Module Details.
W $
Fig. 2. Closeup view of a module with typical installation ofminiplates. Note electron-beam welds along edges and widened slots alongtop edge to aid in miniplate insertion.
244
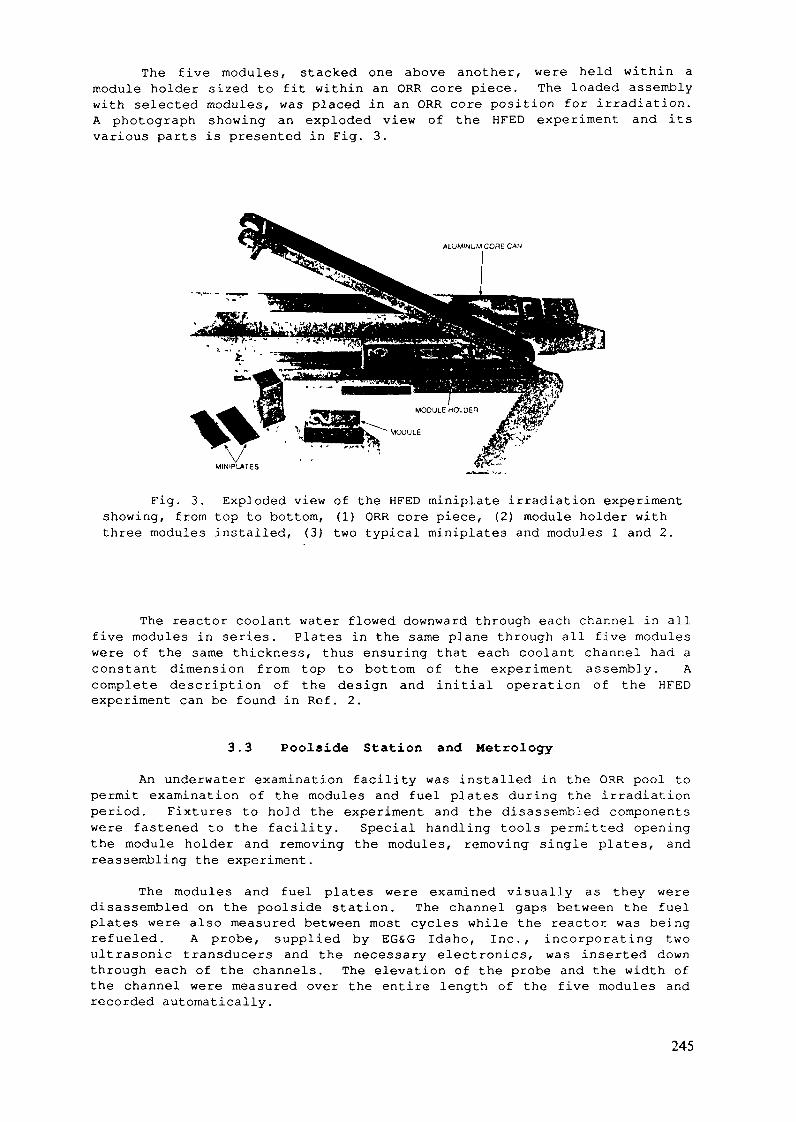
The five modules, stacked one above another, were held within amodule holder sized to fit within an ORR core piece. The loaded assemblywith selected modules, was placed in an ORR core position for irradiation.A photograph showing an exploded view of the HFED experiment and itsvarious parts is presented in Fig. 3.
ALUMINUM CORE CAN
Fig. 3. Exploded view of the HFED miniplate irradiation experimentshowing, from top to bottom, (1) ORR core piece, (2) module holder withthree modules installed, (3) two typical miniplates and modules 1 and 2.
The reactor coolant water flowed downward through each channel in allfive modules in series. Plates in the same plane through all five moduleswere of the same thickness, thus ensuring that each coolant channel had aconstant dimension from top to bottom of the experiment assembly. Acomplete description of the design and initial operation of the HFEDexperiment can be found in Ref. 2.
3.3 Poolside Station and Metrology
An underwater examination facility was installed in the ORR pool topermit examination of the modules and fuel plates during the irradiationperiod. Fixtures to hold the experiment and the disassembled componentswere fastened to the facility. Special handling tools permitted openingthe module holder and removing the modules, removing single plates, andreassembling the experiment.
The modules and fuel plates were examined visually as they weredisassembled on the poolside station. The channel gaps between the fuelplates were also measured between most cycles while the reactor was beingrefueled. A probe, supplied by EG&G Idaho, Inc., incorporating twoultrasonic transducers and the necessary electronics, was inserted downthrough each of the channels. The elevation of the probe and the width ofthe channel were measured over the entire length of the five modules andrecorded automatically.
245

4. CONDUCT OF EXPERIMENTS1
4 .1 Module Management
The Operations Division of ORNL had the responsibility to see thatthe acceptable operating limits for this experiment were not exceeded. Tomeet these requirements, they conducted extensive thermal-hydrauliccalculations for the various materials proposed for irradiation. Thesecalculations were confirmed with out-of-reactor flow tests and various fluxmeasurements made in the ORNL Pool Critical Assembly. Measurements weremade to compare the HFED assembly with a standard ORR fuel element and todetermine the effects of the hafnium grid and the water spaces within theHFED assembly. The flux level for each module could be adjusted byselecting its position in the module holder, and by properly choosing thecore position for the HFED. This permitted modules to be irradiated to thedesired burnup levels. Of course, indications of swelling prompted theremoval of some of the miniplates before reaching their burnup goals.
The initial series of miniplate irradiations in ORR began on July 18,1980, and ended on June 13, 1983. There were 132 miniplates in 12 modulesirradiated in this series. This series included miniplates manufactured byANL, CNEA, EG&G Idaho, Inc., NUKEM, and ORNL. They were fueled with UA12,UA1X, U3O8, U3Si, and U3Si2 with enrichments from 20% to 93% 235U, and fueldensities up to 7.16 Mg/m3.
The second series of irradiations began March 30, 1984 and endedJanuary 30, 1987. In this series 112 miniplates were contained in 13modules. Some modules included plates that had been irradiated earlier.This series included plates manufactured by ANL, CNEA, and NUKEM. Theywere fueled with USi, U3Si2, UsSii.5, U3Si, U3SiCu, UA12, U6Fe, and U6Mn1-3.Enrichments of from 0.2% (depleted) to 93% with fuel densities up to 8.0Mg/m3 were used in the process.
Between the fuel cycles, the experiment was removed from the core andplaced in the poolside station for channel gap measurements. This meas-urement provided a means to detect swelling and possible incipient failureof the miniplates. During the irradiation program, some swelling andpillowing was detected, and the suspected plates were removed for hot cellexamination. (Pillowing is gross swelling characterized by large-scale,fission-gas-driven separations within the fuel meat or at the meat/cladinterface. The plate resembles a pillow after swelling.)
During the course of its irradiation, each miniplate experienced manythermal cycles owing to normal startups and shutdowns and power set backsrequired by other experiments. Fuel meat centerline temperatures areestimated to have been between 75 and 125°C during irradiation.
4.2 Results from Channel Gap Measurements
During the experiment, 86 sets of channel gap measurements were made.Each set of measurements resulted in 22 X-Y plots showing the gap andelevation of the probe as it passed through both the north and south sidesof each of the 11 accessible channels. Typical X-Y plots of three adjacentslots are shown in Fig. 4. Careful analysis of all plots from run-to-runwas necessary to distinguish bowing from swelling. Bowing could bediscerned by gap narrowing on one side and equivalent enlargement of thegap on the opposite side of the plate. True swelling was detected bynarrowing of the gap on both sides of a plate.
246
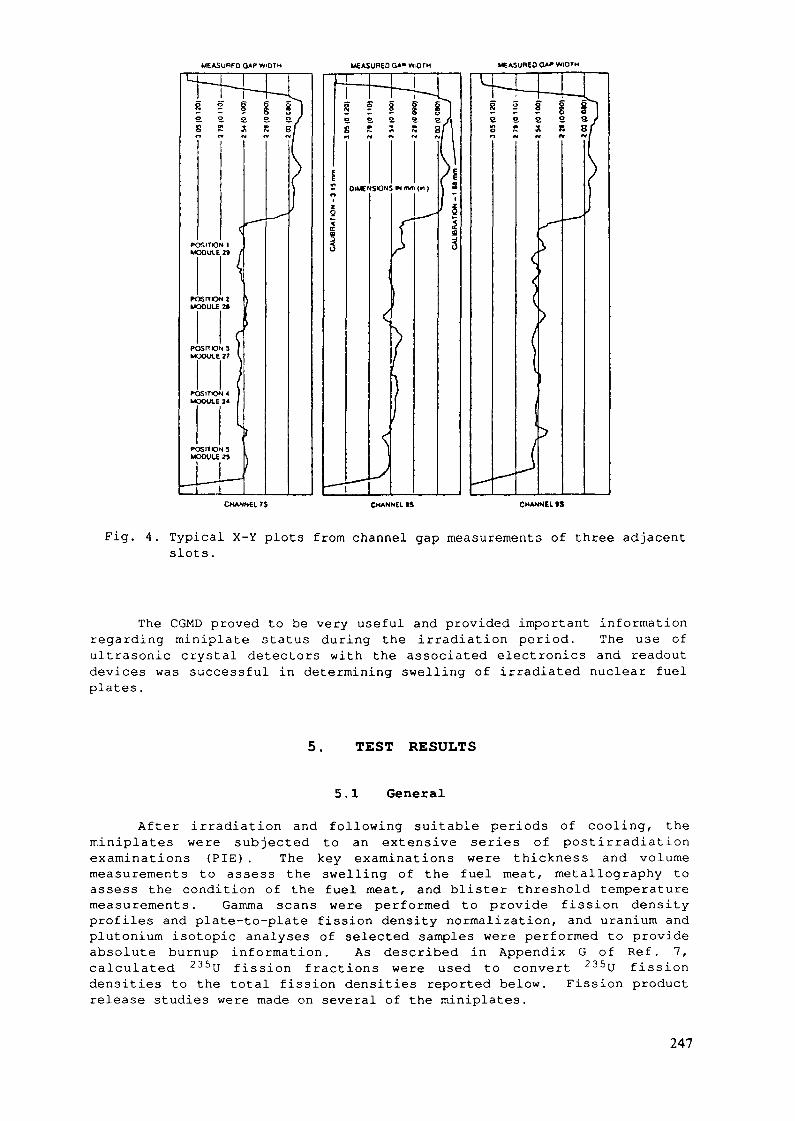
MEASURED OAP WIDTH MS ASUREOOA» WIDTH
§ ! I I Ia s e s. eS S 5 R S
CHANNil 7$ CHANNEL IS CHANNEL fS
Fig. 4. Typical X-Y plots from channel gap measurements of three adjacentslots.
The CGMD proved to be very useful and provided important informationregarding miniplate status during the irradiation period. The use ofultrasonic crystal detectors with the associated electronics and readoutdevices was successful in determining swelling of irradiated nuclear fuelplates.
5. TEST RESULTS
5.1 General
After irradiation and following suitable periods of cooling, theminiplates were subjected to an extensive series of postirradiationexaminations (PIE). The key examinations were thickness and volumemeasurements to assess the swelling of the fuel meat, metallography toassess the condition of the fuel meat, and blister threshold temperaturemeasurements. Gamma scans were performed to provide fission densityprofiles and plate-to-plate fission density normalization, and uranium andplutonium isotopic analyses of selected samples were performed to provideabsolute burnup information. As described in Appendix G of Ref. 7,calculated 235U fission fractions were used to convert 235U fissiondensities to the total fission densities reported below. Fission productrelease studies were made on several of the miniplates.
247
5.2 Fuel Data and MicrostructureFuel meat swelling data obtained from immersion density measurements
and data from blister-threshold temperature measurements on the miniplatesare summarized in Table 2.
UA1X Fuel: Eleven plates contained medium-enriched uranium (MEU,40-45%) with uranium densities ranging between 1.5 and 2.3 g/cm3. Nineplates contained LEU(<20%) and two plates contained uranium with anenrichment of ~27%. The latter eleven plates had uranium densities rangingbetween 1.9 and 2.5 g/cm3. For all of these plates, swelling8'11 of thefuel meat ranged between -0.3 and 4.3% for fission densities between 0.8 x10²¹ and 1.8 x 10²¹ fissions/cm3. Two of the MEU plates were fabricatedwith 100% fine (<44 (im) fuel particles. These plates showed the lowest netswelling even though their fission densities were 1.5 x 10²¹ fissions/cm3,probably because of a high initial void content of the fuel meat. Allswelling data are consistent with similar data measured for HEU UAlx fuelover the same range of fission densities (see Appendices J-l . 1 and J-1.2and Ref. 12) .
Blister-threshold temperature tests8-11'13 on LEU and MEU miniplateswith UA1X fuel are consistent with blister-threshold temperatures in therange of 550 - 565°C. Metallographie examinations8 of sections of one LEUand two MEU (including a high fines) miniplates showed each plate to be inexcellent condition. There were no indications of actual or incipientfailures. A photomicrograph of a section from the MEU miniplate with thehighest fission density is shown in Fig. 5. The few large voids seen maybe remnants of the voids initially in the fuel meat. No other gas bubblesare evident in the fuel particles.
Based upon all of the results obtained, UA1X appears to be anextremely well-behaved fuel for LEU and MEU applications requiring uraniumdensities of up to 2.5 g/cm3.
UA12 Fuel: Five LEU miniplates with 3.0 - 3.1 g U/cm3 and twominiplates with 45% enriched fuel and 3.0 g U/cm3 were irradiated in theORR. Data1/5 on fuel meat swelling and blister-threshold temperaturemeasurements are shown in Table 2.
Fuel: A total of 47 miniplates containing U3O8 fuel wereirradiated in the ORR. Selected data on the miniplate characteristics areshown in Table 1 and are summarized below. Data on the irradiations andpost-irradiation-examinations have been published in Ref s . 9-11, and 14-17.
Miniplates Irradiated in the ORR.
Enrich-ment, %
19 - 2027
40 - 4593
Numbe r ofMiniplates
35471
U Density,Range, g/cm3
2.4 - 3.62.3 - 3.12.4 - 3.1
0.7
19-27% Enrichment Range: As shown in Table 2, miniplates in the 19-27%enrichment range showed either shrinkage or moderate swelling for fissiondensities between 0.8 and 1.6 x 10²¹ fissions/cm3. The higher-loadedplates with more as-fabricated void volume densified slightly while thelower-loaded plates began to swell. This result is in agreement withprevious work which showed that fabrication voids are effective inaccomodating irradiation swelling.18
248

Table 2. Summary of Swelling and Blister Threshold TemperatureData for High-Density Dispersion Fuels Irradiated inthe ORR (Prom PIE of Miniature Fuel Plates).
FuelType
UA1XUA1XUA1XUA1XUA1XUA1XUA12
U308U308U308U308«3°8U308U30a
U3Si2U3Si2U3Si2U3Si2U3Si2U3Si2U3Si2U3Si2U3Si2
U3SiU3SiU3SiU3SiU3SiU3SiU3SiU3SiU3SiU3SiU3SiU3Si
Fabri-cator
CE
E, NE
E,N,CCC
0,K0O
O,N,C0
0,N,CC
AAAAACAAA
AAAAAA,CCAA,CANA
DensityRange ,Mg/m3
Low High
1.2.1.2.2.2.
2.
2.2.23.
3
534455
1.
6.4.4.5.5.6.6.6.6.
1..88.13.88.144899
.402.3.
,30.76.91.49
1..94
4..13.72.81.92.1.60
9845.
237977.186505238992
471.2.1.2.2.3.
2.77102.2.3.3.
663.
,955.3.4.4.S.5.
1..5916.4.4.5.S.6.6.6.7.
953199335209
46
48791358
95
18768899267
99
408381207216339313
Enrichment
4540
.1
.239.8-40.2
19 .919.9-27.3
20,19,
39.7-4545
.2
.8
45.0.0.0
19.5-27.319 .5
19.5-27.319
934040401919191919
92,40.40.40.19.19.19.19.
.7
.0
.1
.1
.1
.9
.7
.8
.8
.8
.6
.1
.1
.1
.9
.9
.8
.919.8-19.9
19.19.
19.8-
.8
.419.9
No. ofPlates
1463625
3139
11163
221246457
221357245465
FissionDensity Range
10"/n>3Low High
1.11.30.81.0
1.7
2.10.80.91.0
1.41.5
1.61.71.21.02.2
1.71.9
2.4
1.7
1.52.4
1.4
1.31101
1.11.3
22.3
2111
1.5
22
1.41.6
11122
22
1.42
0.72
2.21.9
22
2.52
.5
.8
.9
.1
.0
.5
.1
.2
.6
.1
.4
.8
.8
.3
.3
.5
.1
.3
.5
.1
.6
.5
.6
, Swelling Range,% AV/Vm
Low High
-0.31.90.7-1.7-3.9-7.2
2.9
11.20.0-0.7-3.8-5.4
4.90.7
-2.13.71.50.20.00.1
8.87.3
9.6
5.210.30.40.825.413.31.7
4.30324
-3-2
9P+
P2112-3
1110
~0-172042
910
1.539
~012116
20382144
.6
.4
.9
.0
.3
.7
.7
+. 0.3.6.4
.6
.6
.1
.0
.8
.8
. 6
.7
.7
.3
.6
.0
.4
.8
.4
.8
.7
.3
Blister-Threshold
Temperature, °C
_550-565550-561>550>550550
475-500
470--
490->550>550
478-550450
----
530525--
515
----
510500->550
500525----
Fabricators: ANL, EGSG Idaho, ORNL, NUKEM, CNEA.^Indicates that plates "pillowed" during irradiation.
The blister threshold temperatures for these plates are notsubstantially different than the 375 - 600°C temperatures historicallyexperienced for highly-enriched low-loaded plates.19 Figure 6 is aphotomicrograph15 of a section of an LEU plate containing 75 wt% UßOe (3.1g U/cm3) in the fuel meat. This plate had been blister-tested to 500°C.The meat is essentially a mixture of reaction products with islands ofunreacted aluminum remaining. In the two plates examined after blister-testing the blisters occurred at the meat/cladding interface.
249
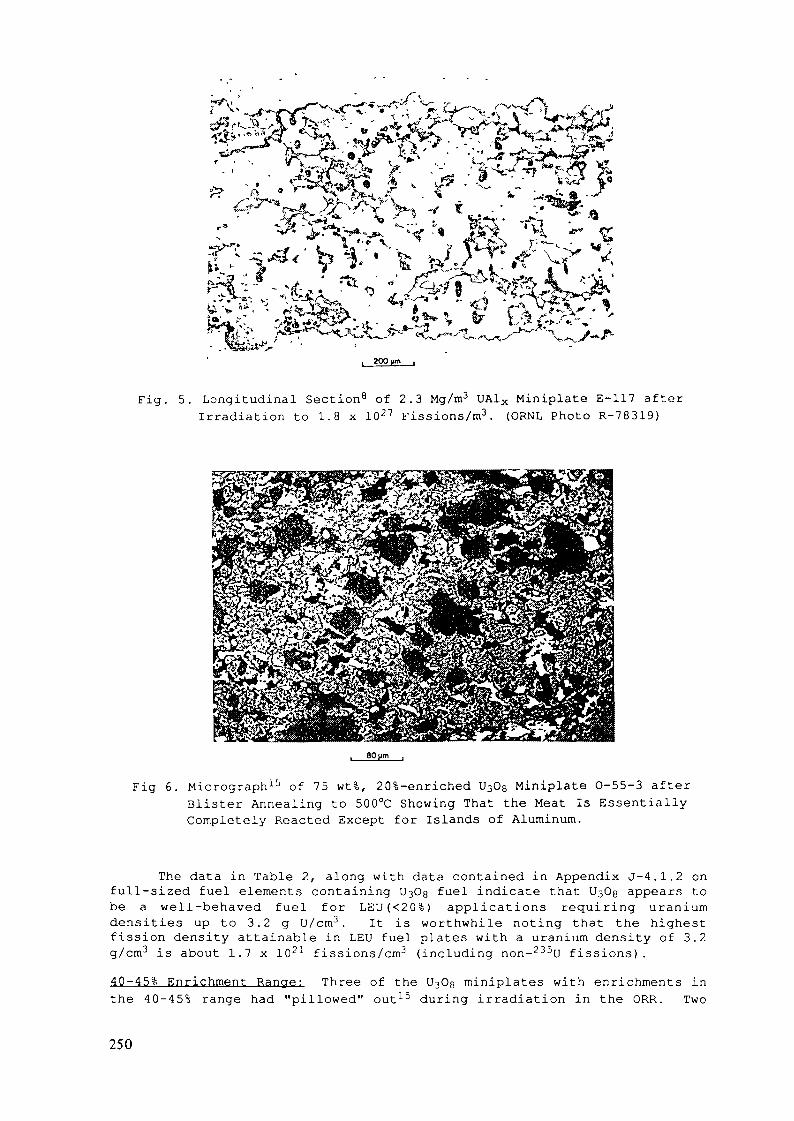
• i/"8?» vS». • ' x. s* "* t_-^ ^ «* -Ûr- ^ï*vJ: --v5« IB' ••'! - \p; yf<\ V-v^V^/ss' f-
, 200 lim ,
Fig. 5. Longitudinal Section8 of 2.3 Mg/m3 UA1X Miniplate E-117 afterIrradiation to 1.8 x 1027 Fissions/m3. (ORNL Photo R-78319)
80|jin
Fig 6. Micrographlb of 75 wt%, 20%-enriched U308 Miniplate O-55-3 afterBlister Annealing to 500°C Showing That the Meat Is EssentiallyCompletely Reacted Except for Islands of Aluminum.
The data in Table 2, along with data contained in Appendix J-4.1.2 onfull-sized fuel elements containing l^Og fuel indicate that l^Og appears tobe a well-behaved fuel for LEU(<20%) applications requiring uraniumdensities up to 3.2 g U/cm3. It is worthwhile noting that the highestfission density attainable in LEU fuel plates with a uranium density of 3.2g/cm3 is about 1.7 x 10?1 fissions/cm3 (including non-235U fissions).40-45% Enrichment Range: Three of the U3<Dg miniplates with enrichments inthe 40-45% range had "pillowed" out15 during irradiation in the ORR. Two
250
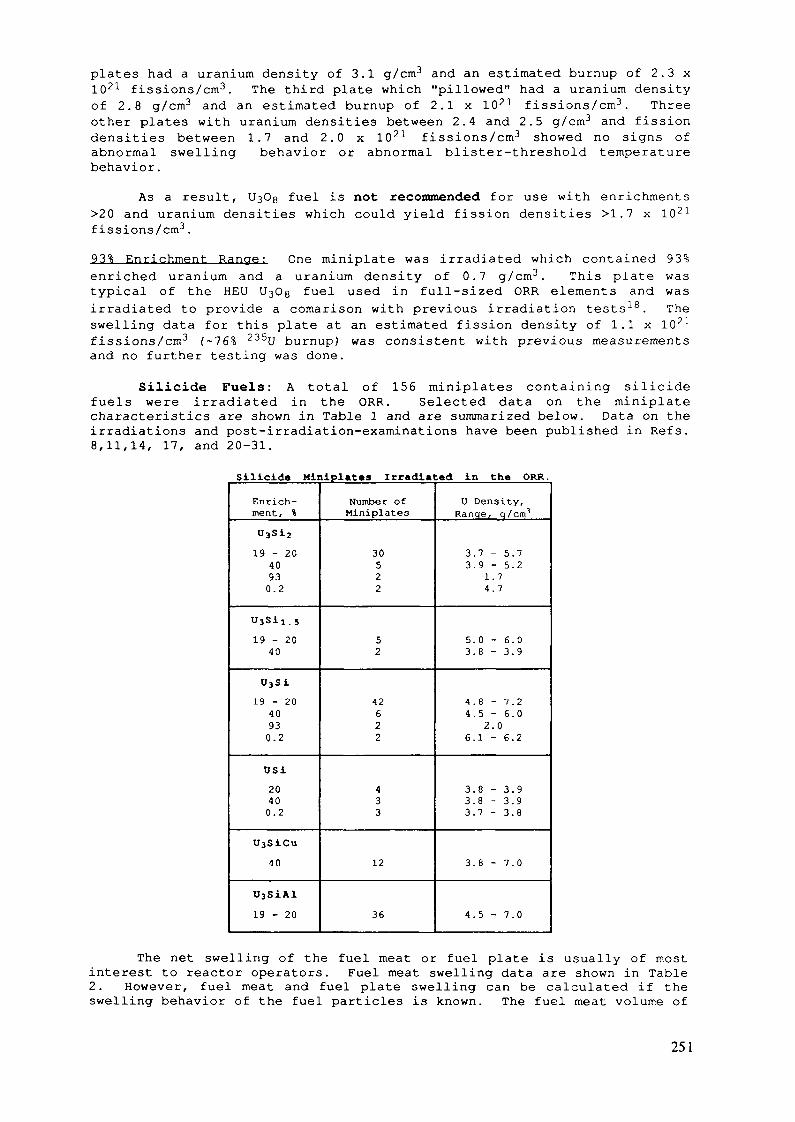
plates had a uranium density of 3.1 g/cm3 and an estimated burnup of 2.3 x10²¹ fissions/cm3. The third plate which "pillowed" had a uranium densityof 2.8 g/cm3 and an estimated burnup of 2.1 x 10²¹ fissions/cm3. Threeother plates with uranium densities between 2.4 and 2.5 g/cm3 and fissiondensities between 1.7 and 2.0 x 10²¹ fissions/cm3 showed no signs ofabnormal swelling behavior or abnormal blister-threshold temperaturebehavior.
As a result, U3O8 fuel is not recommended for use with enrichments>20 and uranium densities which could yield fission densities >1.7 x 10²¹
fissions/cm3.
93% Enrichment Range: One miniplate was irradiated which contained 93%enriched uranium and a uranium density of 0.7 g/cm3. This plate wastypical of the HEU l^Og fuel used in full-sized ORR elements and wasirradiated to provide a comarison with previous irradiation tests18. Theswelling data for this plate at an estimated fission density of 1.1 x 10²¹
fissions/cm3 (~76% 235U burnup) was consistent with previous measurementsand no further testing was done.
Suicide Fuels: A total of 156 miniplates containing suicidefuels were irradiated in the ORR. Selected data on the miniplatecharacteristics are shown in Table 1 and are summarized below. Data on theirradiations and post-irradiation-examinations have been published in Refs.8,11,14, 17, and 20-31.
Suicide Miniplataa Irradiated in the ORR
Enrich-ment, %U3S1219 - 20
40930.2
19 - 2040
U3Si19 - 20
40930.2
OSi20400.2
U3SiCu40
U3SiAl19 - 20
Number ofMiniplates
30522
52
42622
433
12
36
U Density,Ranqe, q/cra3
33
53
44
6
333
3
4
.7 - 5.7
.9 - 5.21 .74.7
.0 - 6.0
.8 - 3.9
.8 - 7.2
.5 - 6.02.0
.1 - 6.2
.8 - 3.9
.8 - 3.9
.7 - 3.8
.8 - 7.0
.5 - 7.0
The net swelling of the fuel meat or fuel plate is usually of mostinterest to reactor operators. Fuel meat swelling data are shown in Table2. However, fuel meat and fuel plate swelling can be calculated if theswelling behavior of the fuel particles is known. The fuel meat volume of
251

. 40 -
FISSION DENSITY, 1 O27 fissions / m3
Fig. 7. Swelling of Uranium Suicide and UA1 Fuel Particlesvs. Fission Density in the Particle. Dashed LinesIndicate Fission Densities Not Attainable in LEU Fuel.
an unirradiated fuel plate is occupied by the fuel particles, the aluminummatrix, and pores created when matrix aluminum does not flow around allfuel particles and into the cracks produced in fuel particles during therolling of the plate. Such pores can occupy from approximately 4% togreater than 12% of the volume of high-density fuel meats. During theearly stages of irradiation, irradiation-induced sintering results in someconsolidation of the pores, and the volume of the fuel meat can actuallydecrease. As the fuel particles begin to swell from the buildup of solidand gaseous fission products, the pores begin to be filled. The fuel meatexhibits a net positive volume change only after the volume of the fuelparticles has increased by approximately the amount of the original porevolume. Since the amount of as-fabricated porosity is influenced by manyfactors32, the effect of the porosity must be removed to ascertain theswelling behavior of the fuel itself.
Thus, a clear picture of the swelling behavior of the various uraniumsuicides can be obtained by calculating the swelling of the fuel particlesthemselves, assuming that the as-fabricated porosity has been completelyfilled. The general trends of these data27 and, for comparison, data forUA1X,12 are shown in Fig. 7. The swelling of UA1X, USi, and U3Si2 fuelparticles is very stable, being a linear function of the fission density tofission densities well beyond those which can be achieved in LEU fuel (2.4,5.0, and 5.8 x 1027 f/m3 in the fuel particles of UAlx, USi, and U3Si2/respectively). On the other hand, U3Si fuel particles in highly loadedfuel plates exhibit an unstable behavior, called breakaway swelling, forfission densities greater than -4.5 x 1027 f/m3 (-65% 235U burnup for LEU).The swelling rates per unit fission density of U3Si2 and UA1X fuel particlesare the same within the accuracy of the data. The slopes of the linearswelling curves are 4.8%, 6.0%, and 6.2% per 1027 f/m3 for USi, UA1X, and
252
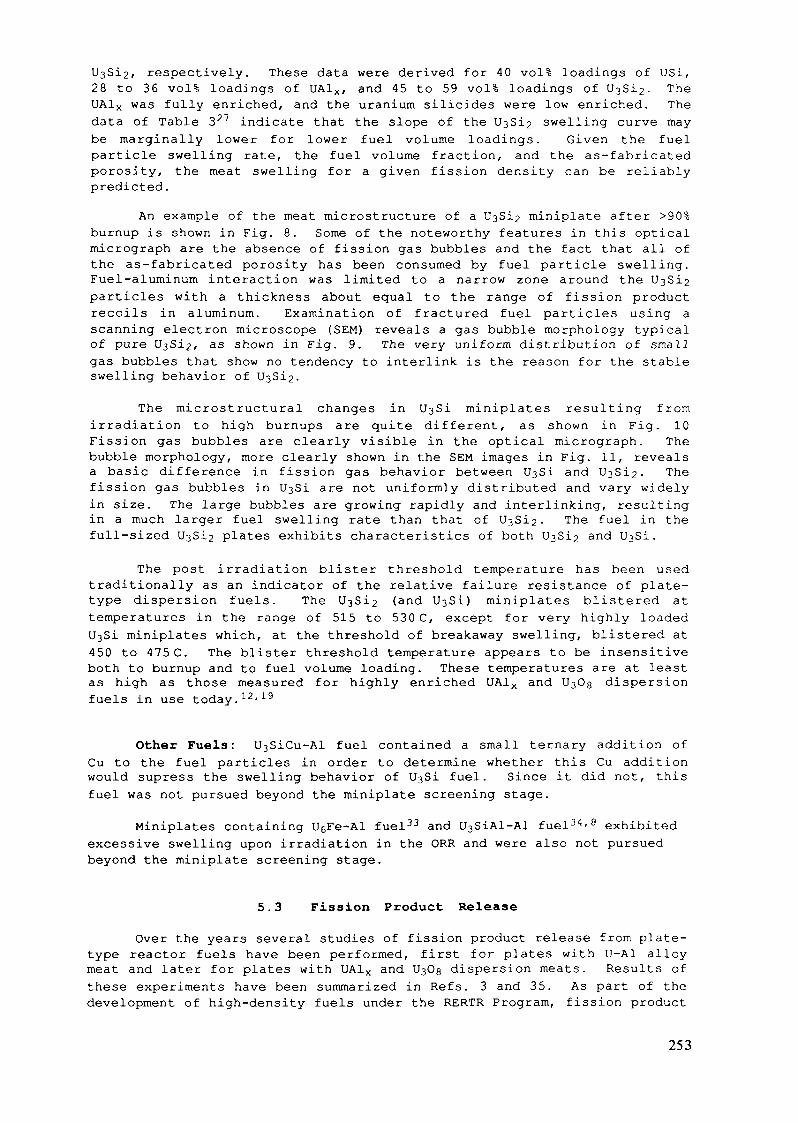
respectively. These data were derived for 40 voll loadings of USi,28 to 36 vol% loadings of UA1X, and 45 to 59 vol% loadings of U3Si2. TheUA1X was fully enriched, and the uranium suicides were low enriched. Thedata of Table 321 indicate that the slope of the U3Si2 swelling curve maybe marginally lower for lower fuel volume loadings. Given the fuelparticle swelling rate, the fuel volume fraction, and the as-fabricatedporosity, the meat swelling for a given fission density can be reliablypredicted.
An example of the meat microstructure of a UßSij miniplate after >90%burnup is shown in Fig. 8. Some of the noteworthy features in this opticalmicrograph are the absence of fission gas bubbles and the fact that all ofthe as-fabricated porosity has been consumed by fuel particle swelling.Fuel-aluminum interaction was limited to a narrow zone around the U3$i2particles with a thickness about equal to the range of fission productrecoils in aluminum. Examination of fractured fuel particles using ascanning electron microscope (SEM) reveals a gas bubble morphology typicalof pure UsSia, as shown in Fig. 9. The very uniform distribution of smallgas bubbles that show no tendency to interlink is the reason for the stableswelling behavior of
The microstructural changes in UsSi miniplates resulting fromirradiation to high burnups are quite different, as shown in Fig. 10Fission gas bubbles are clearly visible in the optical micrograph. Thebubble morphology, more clearly shown in the SEM images in Fig. 11, revealsa basic difference in fission gas behavior between U^SL and U3$i2. Thefission gas bubbles in 1)38! are not uniformly distributed and vary widelyin size. The large bubbles are growing rapidly and interlinking, resultingin a much larger fuel swelling rate than that of U3Si2- The fuel in thefull-sized U3Si2 plates exhibits characteristics of both U3Si2 and
The post irradiation blister threshold temperature has been usedtraditionally as an indicator of the relative failure resistance of plate-type dispersion fuels. The U3Si2 (and UsSi) miniplates blistered attemperatures in the range of 515 to 530 C, except for very highly loaded1138! miniplates which, at the threshold of breakaway swelling, blistered at450 to 475 C. The blister threshold temperature appears to be insensitiveboth to burnup and to fuel volume loading. These temperatures are at leastas high as those measured for highly enriched UAlx and UsOg dispersionfuels in use today.12-19
Other Fuels: l^SiCu-Al fuel contained a small ternary addition ofCu to the fuel particles in order to determine whether this Cu additionwould supress the swelling behavior of UjSi fuel. Since it did not, thisfuel was not pursued beyond the miniplate screening stage.
Miniplates containing U6Fe-Al fuel33 and U3SiAl-Al fuel34-8 exhibitedexcessive swelling upon irradiation in the ORR and were also not pursuedbeyond the miniplate screening stage.
5.3 Fission Product Release
Over the years several studies of fission product release from plate-type reactor fuels have been performed, first for plates with U-Al alloymeat and later for plates with UA1X and l^Gg dispersion meats. Results ofthese experiments have been summarized in Refs. 3 and 35. As part of thedevelopment of high-density fuels under the RERTR Program, fission product
253

to Table 3. Miniplate Swelling Data Summary
PlateNo.*
A32A34A36
A46
A100A85A99A87A88
A89A90A91A92A93A94
A123MA124MA125MA126M
A121HA122H
U Dens.,Mg/m3
3.3.3.
3.
5.5.5.5.5.
5.5.5.5.5.5.
4.3.5.5.
1.1.
888
7
20212
666667
0912
77
Fuel Vol.Fraction,
333333
33
4645454545
494949505050
35354546
1414
.3
.4
.3
.1
.2
.4
.9
.6
.8
.8
.9
.7
.0
.0
.4
.1
.0
.6
.0
.7
.7
Fuel Meat 235UPorosity,
444
5
810999
131313121312
44
1111
00
.5
.3
.5
.2
.5
.3
.1
.8
.5
.4
.3
.5
.9
.0
.4
.2
.3
.8
.0
.8
.8
Burnup,
909090969096
4279798585
858585858585
42693939
4169
Fuel MeatFission Dens . ,
1027/m3
111111
11122
222222
1211
12
.6
.6
.6
.8
. 6
.8
.0
.8
.9
.1
.1
.3
.3
.3
.3
.3
.3
.5
.5
.8
.8
.4
.3
Fuel ParticleFission Dens . ,
1027/m3
444545
24444
444444
4733
915
.8
.8
.8
.5
.8
.5
.1
.2
.2
.6
.6
.6
.6
.6
.6
.6
.6
.2
.1
.9
.9
.3
.7
Fuel MeatSwelling,
Vol%
344736
01232
000102
01121
411
.8
.1
.3
.1
.7
.8
.0
.6
.0
.3
.6
.9
.2
.1
.5
.4
.9
.7
.6
.1
.1
.9
.6
Fuel ParticleSwelling,
Vol%
252526352736
<1826242926
292727292630
<14453026
3884
All plates LEU except those with plate number ending in M (MEU) or H (HEU).

Fig. 8. Meat Microstructure of U3Si2 Miniplate After 90% Burnup (Bu)
Fig. 9. Fission Gas Bubble Morphology in u"3Si2 After 90% Bu.
255
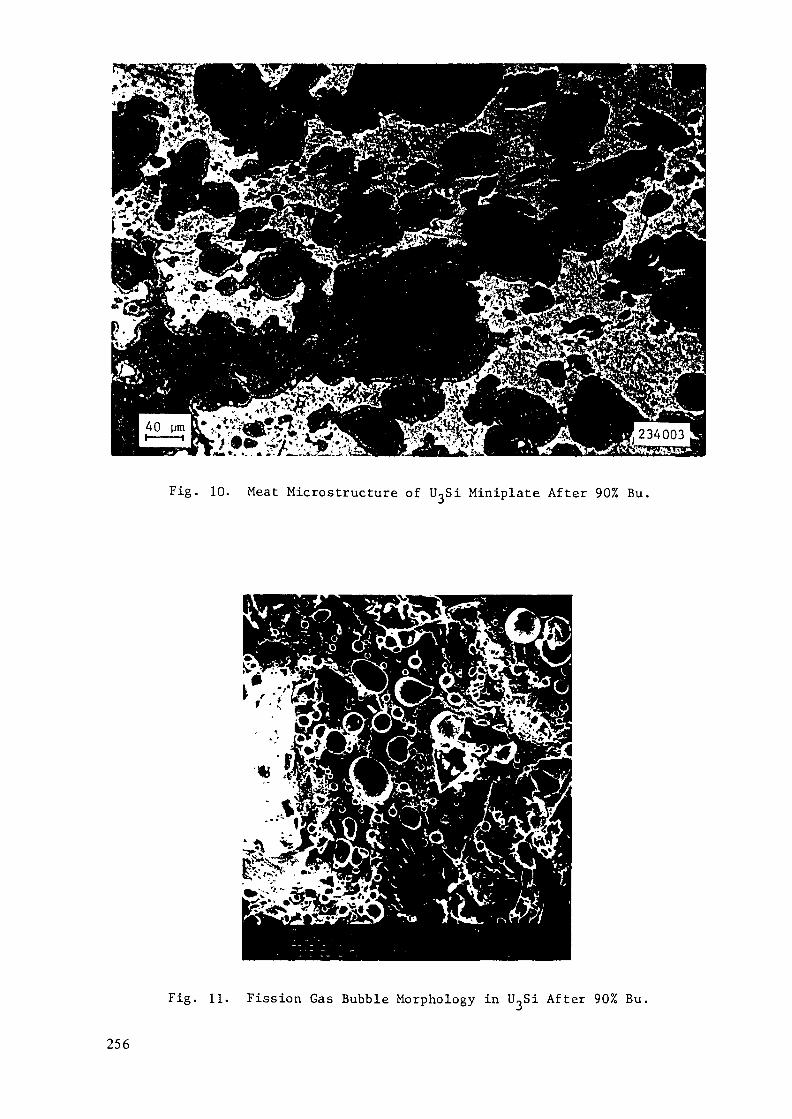
40 ym t?-$?lj§ß'*CtiV&1 ' Ehr'l ftfib •4a-'.>Sr'V
Fig. 10. Meat Microstructure of U-jSi Miniplate After 90% Bu.
Fig. 11. Fission Gas Bubble Morphology in U.,Si After 90% Bu.
256
release measurements of limited scope have been performed. Detailed dataon these measurements are provided in Appendix J-5. A brief summary of themain conclusions is given below.
Measurements using UA1X miniplates were performed at ORNL incollaboration with the Kyoto University Research Reactor Instituteprimarily to determine the threshold temperature for fission productrelease and to measure release rates above that temperature.13 These testsshowed that the first significant release of gaseous fission productsoccurred when the fuel plate blistered. Another significant releaseoccurred at about the solidus temperature of the cladding, and a thirdsignificant release occurred at about the UAl^-Al eutectic temperature.
Similar measurements, using the same equipment, were made usingand UaSi miniplates, with similar results.36 The first release of gaseousfission products was detected when the plates blistered, at 500°C for theUaOg plates. Essentially all of the gaseous fission products had beenreleased by the end of the test at 650°C. From the amounts of Cs detectedin the traps and from visual observations of deposits on the sample holderfollowing the 650°C test, it was determined that much more Cs was releasedfrom the UaSi plate than from the U^Og plate.
Release/Born (R/B) ratio data of fission products for U-A1 alloy,UA1X-A1, and UaSi2-Al fuels were measured37 by JAERI in order to assess theintegrity of uranium suicide fuel in the safety assessment for LEUconversion of the JMTR reactor. The results showed that the release rateof Iodine-131 at 700 °C for suicide and aluminide fuel are lower than theU-A1 alloy fuel by approximately a factor of three. The release of raregases in suicide and aluminide fuels are almost 100%, similar to alloyfuel.
REFERENCES
1. R. L. Senn, Summary .Report on the HFED Miniplate Irradiations for theRERTR Program, ORNL-6539, Martin Marietta Energy Systems, Oak RidgeNational Laboratory, April 1989
2. R. L. Senn and M. M. Martin, Irradiation Testing of Miniature FuelPlates for the RERTR Program, Union Carbide Corp. Nuclear Div., OakRidge Natl. Lab., ORNL/TM-7761, July 1981.
3. D. Stahl, Fuels for Research and Test Reactors, Status Review: July1982, Argonne National Laboratory Report ANL-83-5, 37-39, December1982.
4. G. L. Copeland and M. M. Martin, Fabrication of High-Uranium-LoadedUjOg-Al Developmental Fuel Plates, ORNL-TM-7607, Union Carbide Corp.Nuclear Div., Oak Ridge Natl. Lab., December 1980.
5. R. F. Domagala, T. C. Wiencek and H. R. Thresh, U-Si and U-Si-AlDispersion Fuel Alloy Development for Research and Test Reactors,Nucl. Tech. £2., 353-60 (1983).
6. T. P. Hamrick and J. H. Swanks, The Oak Ridge Research Reactor - AFunctional Description, ORNL-4169, Union Carbide Corp. Nuclear Div.,Oak Ridge Nat. Lab., September 1968.
257
7. G. L. Copeland, R. W. Hobbs, G. L. Hofman, and J. L. Snelgrove,Performance of Low-Enriched U3Si2-Aluminum Dispersion Fuel Elementsin the Oak Ridge Research Reactor, Argonne National Laboratory ReportANL/RERTR/TM-10, October 1987.
8. J. L. Snelgrove, R. F. Domagala, T. C. Weincek, and G. L. Copeland,Fuel Development Activities of the U.S. RERTR Program, Proc.International Meeting on Reduced Enrichment for Research and TestReactors, Tokai, Japan, October 24-27, 1983, JAERI-M 84-073, May1984.
9. E. Perez, C. Kohut, D. Giorsetti, G. Copeland, and J. Snelgrove,Irradiation Performance on CNEA UA1X and U^Og Miniplates, Proc.International Meeting on Reduced Enrichment for Research and TestReactors, Tokai, Japan, October 24-27, 1983, JAERI-M 84-073, May1984.
10. M. F. Hrovat and H. W. Hassel, Recent Status of Development andIrradiation Performance for Plate Type Fuel Elements with Reduced235U Enrichment at NUKEM, Proc. International Meeting on ReducedEnrichment for Research and Test Reactors, Tokai, Japan, October 24-27, 1983, JAERI-M 84-073, May 1984.
11. J. L. Snelgrove, RERTR Program Fuel Testing and Demonstration - AnUpdate, Proc. 1984 International Meeting on Reduced Enrichment forResearch and Test Reactors, Argonne , Illinois, October 15-18, 1984,ANL/RERTR/TM-6 (CONF-8410173), July 1985.
12. J. M. Beeston, R. R. Bobbins, G. W. Gibson, and W. C. Francis,Development and Irradiation Performance of Uranium Aluminide Fuels inTest Reactors, Nucl. Tech. 49. 136-149, June 1980.
13. T. Shibata, T. Tamai, M. Hayashi, J. C. Posey, and J. L. Snelgrove,.Release of Fission Products from Irradiated Aluminide Fuel at HighTemperatures, Nucl. Sei. and Eng. 87r 405-417, 1984.
14. J. Gomez, R. Morando, E. E. Pérez and D. R. Giorsetti, CNEA; G. L.Copeland, ORNL: G. L. Hofman and J. L. Snelgrove, ANL,Postirradiation Examination of High-U-Loaded Low-Enriched UjOg,UA12, and U3Si Test Fuel Plates, Proc. 1984 International Meeting onReduced Enrichment for Research and Test Reactors, Argonne ,Illinois, October 15-18, 1984, ANL/RERTR/TM-6 (CONF-8410173), May1988.
15. G. L. Copeland and J. L. Snelgrove, Examination of Irradiated High-U-Loaded UsOg-Al Fuel Plates, Proc. International Meeting on Researchand Test Reactor Core Conversions from HEU to LEU Fuels, Argonne,Illinois, November 8-10, 1982, ANL/RERTR/TM-4 (CONF-821155),September 1983.
16. G.L. Hofman, G.L. Copeland, and J.E. Sanecki, MicroscopicInvestigation into the Irradiation Behavior of UjOg-Al DispersionFuel, Nucl. Tech. 72, 338-44 (1986).
17. G. L. Hofman, Crystal Structure Stability and Fission Gas Swelling inIntermetallic Uranium Compounds, J. Nucl. Mat. 140, 256-63 (1986).
18. M. M. Martin, A. E. Rieht, and W. R. Martin, Irradiation Behavior ofAluminum-Base Fuel Dispersions, ORNL-4856 (May 1973).
258

19. A. E. Rieht, R. W. Knight, and G. M. Adamson, Jr., PostIrradiationExamination and Evaluation of the Performance of HFIR Fuel Elements,Oak Ridge National Laboratory Report ORNL-4714, December 1971.
20. G. L. Hofman and L. Neimark, Irradiation Behavior of Uranium-SuicideDispersion Fuels, Proc. International Meeting on Reduced Enrichmentfor Research and Test Reactors, Tokai, Japan, October 24-27, 1983,JAERI-M 84-073, May 1984.
21. G. L. Hofman and L. A. Neimark, Postirradiation Analysis of Uranium-Suicide Dispersion Fuels, Proc. 1984 International Meeting onReduced Enrichment for Research and Test Reactors, Argonne ,Illinois, October 15-18, 1984, ANL/RERTR/TM-6 (CONF-8410173), May1988.
22. J.L. Snelgrove, G. L. Hofman, and G. L. Copeland, IrradiationPerformance of Reduced Enrichment Fuels Tested under the U.S. RERTRProgram, Reduced Enrichment for Research and Test ReactorsProceedings of an International Meeting, Petten, The Netherlands,October 14-16, 1985, D. Reidel Publ. Co., 1986.
23. G. L. Hofman, L. A. Neimark, ANL and F. L. Olquin, ININ, The Effectof Fabrication Variables on the Irradiation Performance of UraniumSuicide Dispersion Fuel Plates, Proc. 1986 International Meeting onReduced Enrichment for Research and Test Reactors, Gatlinburg,Tennessee, November 3-6, 1986, ANL/RERTR/TM-9 (CONF-861185) , May1988.
24. J. L. Snelgrove, RERTR Program Fuel Development and Testing -- thePast Year and the Next, Proc. 1986 International Meeting on ReducedEnrichment for Research and Test Reactors, Gatlinburg, Tennessee,November 3-6, 1986, ANL/RERTR/TM-9 (CONF-861185), May 1988.
25. J. L. Snelgrove, Qualification Status of LEU Fuels, Proc. 1987International Meeting on Reduced Enrichment for Research and TestReactors (RERTR), Buenos Aires, Argentina, September 28-October 2,1987 (to be published).
26. G. L. Hofman, Prospects for Stableigh Density Dispersion Fuels, Proc.1987 International Meeting on Reduced Enrichment for Research andTest Reactors (RERTR), Buenos Aires, Argentina, September 28-October2, 1987 (to be published).
27. J. L. Snelgrove, R. F. Domagala, G. L. Hofman, T. C. Wiencek, G. L.Copeland, R. W. Hobbs, and R. L. Senn, The Use of U^Si^ Dispersed inAluminum in Plate-Type Fuel Elements for Research and Test Reactors,Argonne National Laboratory Report ANL/RERTR/TM-11, October 1987.
28. G. L. Hofman, Some .Recent Observations on the Irradiation Behavior ofUranium Suicide Dispersion Fuel, Proc. 1988 International Meeting onReduced Enrichment for Research and Test Reactors, San Diego,California, September 19-22, 1988, ANL/RERTR/TM-13 (to be published).
29. J. Rest, G. L. Hofman, and R.C. Birtcher, The Effect of CrystalStructure Stability on Swelling in Intermetallic Uranium Compounds,Proc. 1988 International Meeting on Reduced Enrichment for Researchand Test Reactors, San Diego, California, September 19-22, 1988,ANL/RERTR/TM-13 (to be published).
259
30. G. L. Hofman, A. Marajofsky, and C Kohut, Irradiation Behavior of theCNEA's Experimental Uranium Suicide Dispersion Fuel Plates, Proc.1988 International Meeting on Reduced Enrichment for Research andTest Reactors, San Diego, California, September 19-22, 1988,ANL/RERTR/TM-13 (to be published).
31. G. L. Hofman and W-S. Ryu, Detailed Analysis of Uranium SuicideDispersion Fuel Swelling, Proc. 1989 International Meeting on ReducedEnrichment for Research and Test Reactors, Berlin, Federal Repubic ofGermany, September 19-22, 1989 (to be published).
32. T. C. Weincek, A Study of the Effect of Fabrication Variables on theQuality of Fuel Plates, Proc. 1986 International Meeting on ReducedEnrichment for Research and Test Reactors, Gatlinburg, Tennessee,November 3-6, 1986, ANL/RERTR/TM-9 (CONF-861185), May 1988.
33. G. L. Hofman, R. F. Domagala, and G. L. Copeland, IrradiationBehavior of Low-Enriched UgFe-All Dispersion Fuel Elements, J. Nucl.Mat. 150. 238-43 (1987).
34. G. L. Hofman, L. A. Neimark, and R. F. Mattas, Irradiation Behaviorof Experimental Miniature Uranium Suicide Fuel Plates, Proc. Intl.Mtg. on Research and Test Reactor Core Conversions from HEU to LEUFuels, Argonne, Illinois, November 8-10, 1982, Argonne NationalLaboratory Report ANL/RERTR/TM-4 (CONF-821155), 117-133, September1983.
35. R. E. Woodley, The Release of Fission Products from Irradiated SRPFuels at Elevated Temperature, Hanford Engineering DevelopmentLaboratory Report HEDL-7598, June 1986.
36. J. C. Posey, Release of Fission Products from Miniature Fuel Platesat Elevated Temperatures, Proc. Intl. Mtg. on Research and TestReactor Core Conversions from HEU to LEU Fuels, Argonne, Illinois,November 8-10, 1982, Argonne National Laboratory ReportANL/RERTR/TM-4 (CONF-821155), 117-133, September 1983.
37. M. Saito, Y. Futamura, H. Nakata, H. Ando, F. Sakurai, N. Aoka, ASakakura, M. Ugajin, and E. Shirai, Further Data of Suicide Fuel forthe LEU Conversion of JMTR, IAEA International Symposium on ResearchReactor Safety, Operations and Modifications, Chalk River, Ontario,Canada, 23-27 October 1989, IAEA-SM-310/59P.
260

ATTACHMENT A
Reproduced fromORNL-6539 (Ref. l)
Document No:Issue Date :Revision:
Q-11821-ET-002-S-0January 31, 19800
FUEL PLATE SPECIFICATION
forRERTR IRRADIATION TESTS
located at
OAK RIDGE RESEARCH REACTOR
BUILDING 3042, ORNL
OAK RIDGE, TENNESSEE
ENGINEERING TECHNOLOGY DIVISION
OAK RIDGE NATIONAL LABORATORY
PREPARED BY
Project Date
APPROVALS
/Coordinator Dat/e
Section Head
Program Manager' Date
DISTRIBUTIONH. C. AustinR. J. BeaverC. D. CagleW. R. CastoJ. A. ConlinG. L. CopelandR. F. Domagala, ANL.T. P. HamrickR. E. MacPhersonR. F. Mattas, ANLM. M. MartinC. A. Mills (2)F. H. Neill (A)D. G. Newton, EG&GR. A. SchmidtS. L. Seiffert, EG&GR. L. SennM. SimsD. Stahl, ANLV. W. Storhok, EG&GH. E. Trammell
261
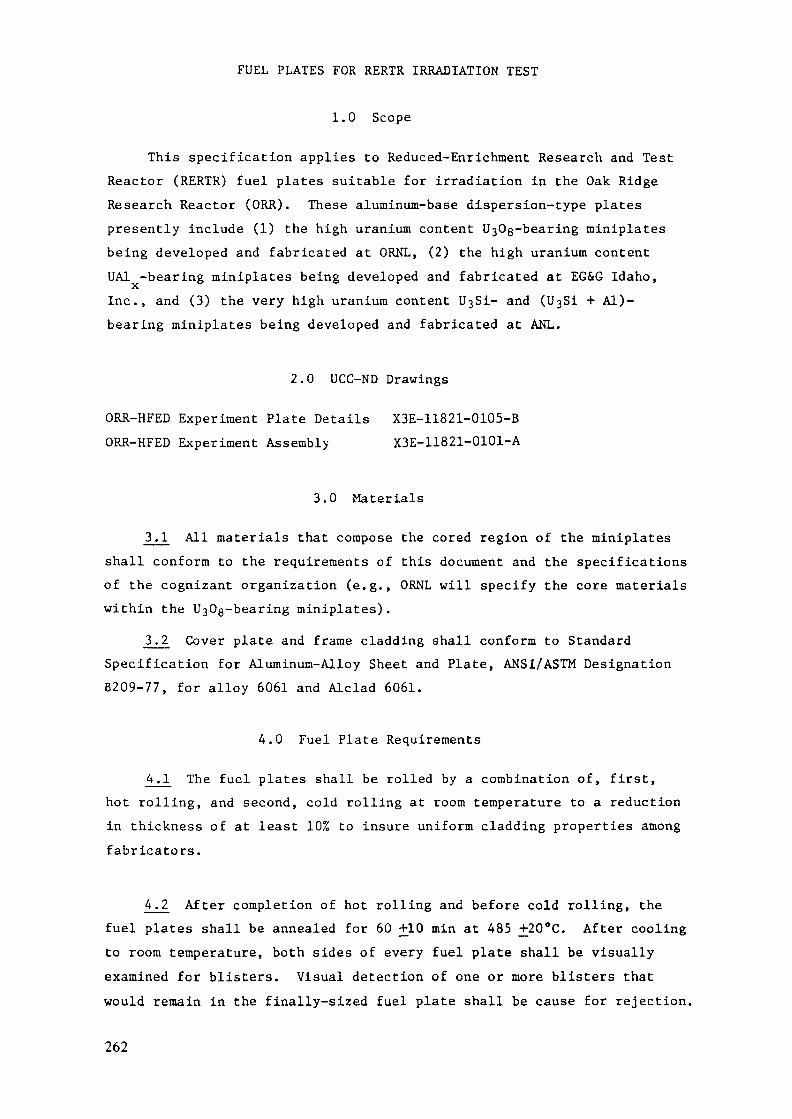
FUEL PLATES FOR RERTR IRRADIATION TEST
1.0 Scope
This specification applies to Reduced-Enrichment Research and TestReactor (RERTR) fuel plates suitable for irradiation in the Oak RidgeResearch Reactor (ORR). These aluminum-base dispersion-type platespresently include (1) the high uranium content l^Og-bearing miniplatesbeing developed and fabricated at ORNL, (2) the high uranium contentUA1 -bearing miniplates being developed and fabricated at EG&G Idaho,XInc., and (3) the very high uranium content l Si- and (UßSi + Al)-bearing miniplates being developed and fabricated at ANL.
2.0 UCC-ND Drawings
ORR-HFED Experiment Plate Details X3E-11821-0105-BORR-HFED Experiment Assembly X3E-11821-0101-A
3.0 Materials
3.1 All materials that compose the cored region of the miniplatesshall conform to the requirements of this document and the specificationsof the cognizant organization (e.g., ORNL will specify the core materialswithin the UsOß-bearing miniplates).
3.2 Cover plate and frame cladding shall conform to StandardSpecification for Aluminum-Alloy Sheet and Plate, ANSI/ASTM DesignationB209-77, for alloy 6061 and Alclad 6061.
4.0 Fuel Plate Requirements
4.1 The fuel plates shall be rolled by a combination of, first,hot rolling, and second, cold rolling at room temperature to a reductionin thickness of at least 10% to insure uniform cladding properties amongfabricators.
4.2 After completion of hot rolling and before cold rolling, thefuel plates shall be annealed for 60 +10 min at 485 +20°C. After coolingto room temperature, both sides of every fuel plate shall be visuallyexamined for blisters. Visual detection of one or more blisters thatwould remain in the finally-sized fuel plate shall be cause for rejection.
262
A.3 After completion of cold rolling, the fuel plates shall beheat-treated at 485 +20°C for 60 +10 min followed by a cooling at a rateof _<28°C/hr to <260°C. After further cooling to room temperature, bothsides of every fuel plate shall be visually examined for blisters.Visual detection of one or more blisters that would remain in the finally-sized fuel plates shall be cause for rejection.
4.4 Fuel plate, core, and cladding dimensions shall conform toUCC-ND Drawing X3E11821-0105-A.
4.5 Within the maximum core outline of UCC-ND Drawing X3E11821-0105-A and for any 4-mm to 2-mm-diam spot, the U235 surface density, ing/m2 of core surface area, shall be 290 for fuel plates to be irradiatedin Modules 3, 4, and 5 (see UCC-ND Drawing X3E11821-0101-A for modulenumbering scheme); and 500 for fuel plates to be irradiated in Modules1 and 2.
4.6 The interfaces between the cover plates and frames of the fuelplates shall be metallurgically bonded. Grains that have grown acrossthese interfaces for a minimum of 50% of the interfacial length constituteacceptable bonding.
4.7 The surfaces of the fuel plates shall be free from all foreignmatter including moisture, dirt, oil, organic compounds, scale, paint,ink, graphite, all solders, silver, lead, mercury, thorium, chlorine,and fluorine.
4.8 The exterior surfaces of the fuel plates shall be free fromuranium after fabrication. A final pickling treatment, which shall beperformed before packaging for shipment to ORNL, of submerging the fuelplates in 45 vol% HN03-55 vol% H20 solution for 2 to 4 minutes at roomtemperature followed by rinsing in either demineralized or distilledwater meets the intent of this requirement.
4.9 The fuel plates shall be identified as shown on UCC-ND DrawingX3E-11821-0105-A. Serial numbers of 0-001 through 0-999, E-001 throughE-999, and A-001 through A-999 are permitted, respectively, for fuelplates supplied by ORNL, EG&G Idaho, Inc., and ANL.
5.0 Inspection
The fuel plate fabricator shall be responsible for inspection andcertification of the achievement of requirements set forth in paragraphs3 and 4 above and in paragraph 6 below.
263

6.0 Quality Assurance Documentation
6.1 The preirradiation data package for the fuel plates shallinclude the following items:(1) dimensional inspection reports (including an estimation of minimum
clad thickness) for each plate;(2) radiographs of each plate; and(3) results from determination of the meat attributes including a
tabulation of (a) plate number, (b) weight of plate, (c) weight ofmeat, (d) elemental composition of the meat, (e) 235U enrichment(wt %), and (f) total 235U loading.
6.2 Certified copies of inspection and test records to assurecompliance with this specification and the preirradiation data packageshall be supplied to R. L. Senn, Bldg. 9201-3, MS-5, P. 0. Box "Y", OakRidge, Tennessee 37830.
7.0 Shipping
7.1 Storage of the fuel plates and final assembly of the HFEDexperiment will be conducted in Building 3012, ORNL. The fuel platefabricators shall provide shipping containers and shall have full respon-sibility for the fuel plates while in transit to the site designatedbelow. A duplicate copy of the tabulation of 6.1 (3) shall be includedin the shipping container with the plates.
7.2 Fuel plate fabricators shall ship the fuel plates by acceptablemeans to the Oak Ridge National Laboratory, Building 3012, Oak Ridge,Tennessee 37830, Attention: H. C. Austin, Bldg. 3037 for M. M. Martin,Bldg. 4508, ORNL.
7.3 Accountability shall be transferred to facility F.Z.C.,H. C. Austin, Bldg. 3037, ORNL.
264
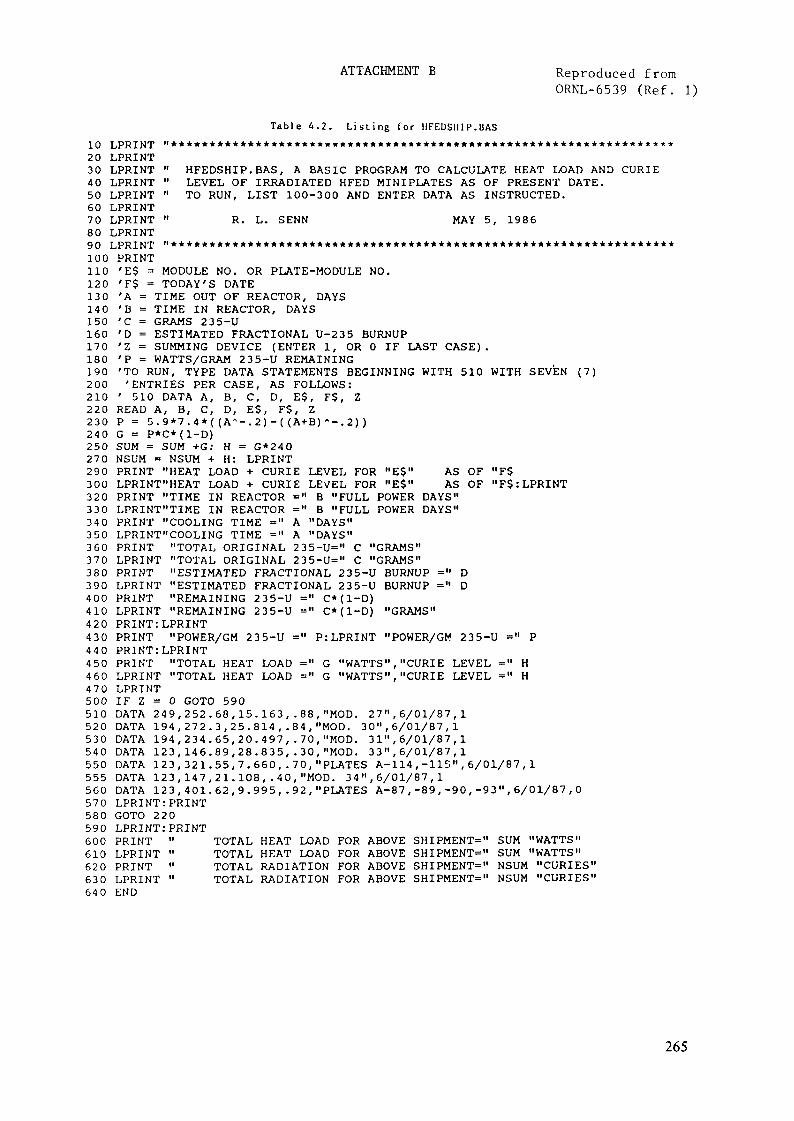
ATTACHMENT B Reproduced fromORNL-6539 (Ref. l)
Table 4 . 2 . L i s t i n g for 1IFEDSH1 P.BAS,**************!10 LPRINT "*****************«'
20 LPRINTHFEDSHIP.BAS, A BASIC PROGRAM TO CALCULATE HEAT LOAD AND CURIELEVEL OF IRRADIATED HFED MINIPLATES AS OF PRESENT DATE.TO RUN, LIST 100-300 AND ENTER DATA AS INSTRUCTED.
AS OF "F$AS OF "F$:LPRINT
30 LPRINT "40 LPRINT "50 LPP.INT "60 LPRINT70 LPRINT " R. L. SENN MAY 5, 198680 LPRINT90 LPRINT "********************************************************100 PRINT110 'E$ = MODULE NO. OR PLATE-MODULE NO.120 'F$ = TODAY'S DATE130 'A = TIME OUT OF REACTOR, DAYS140 'B = TIME IN REACTOR, DAYS150 'C = GRAMS 235-U160 'D = ESTIMATED FRACTIONAL U-235 BURNUP170 'Z = SUMMING DEVICE (ENTER 1, OR 0 IF LAST CASE).180 'P = WATTS/GRAM 235-U REMAINING190 'TO RUN, TYPE DATA STATEMENTS BEGINNING WITH 510 WITH SEVEN (7)200 'ENTRIES PER CASE, AS FOLLOWS:210 ' 510 DATA A, B, C, D, E$, F$, Z220 READ A, B, C, D, E$, F$, Z230 P = 5.9*7.4*((A*-.2)-((A+B)*-.2))240 G = P*C*(1-D)250 SUM = SUM +G: H = G*240270 NSUM = NSUM + H: LPRINT290 PRINT "HEAT LOAD + CURIE LEVEL FOR "E$"300 LPRINT"HEAT LOAD + CURIE LEVEL FOR "E$"320 PRINT "TIME IN REACTOR =" B "FULL POWER DAYS"330 LPRINT"TIME IN REACTOR =" B "FULL POWER DAYS"340 PRINT "COOLING TIME =" A "DAYS"350 LPRINT"COOLING TIME =" A "DAYS"360 PRINT "TOTAL ORIGINAL 235-U=" C "GRAMS"370 LPRINT "TOTAL ORIGINAL 235-U=" C "GRAMS"380 PRINT "ESTIMATED FRACTIONAL 235-U BURNUP =" D390 LPRINT "ESTIMATED FRACTIONAL 235-U BURNUP =" D400 PRINT "REMAINING 235-U =" C*(1-D)410 LPRINT "REMAINING 235-U =" C*(1-D) "GRAMS"420 PRINT:LPRINT430 PRINT "POWER/GM 235-U =" P:LPRINT "POWER/GM 235-U ="440 PRINT:LPRINT450 PRINT "TOTAL HEAT LOAD460 LPRINT "TOTAL HEAT LOAD470 LPRINT500 IF Z = 0 GOTO 590510 DATA 249,252.68,15.163,.88,"MOD520 DATA 194,272.3,25.814,.84,"MOD.530 DATA 194,234.65,20.497,.70,"MOD. 31",6/01/87,1540 DATA 123,146.89,28.835,.30,"MOD. 33",6/01/87,1550 DATA 123,321.55,7.660,.70,"PLATES A-114,-115",6/01/87,1555 DATA 123,147,21.108,.40,"MOD. 34",6/01/87,1560 DATA 123, 401.62,9.995, .92,"PLATES A-87,-89,-90,-93",6/01/87,0570 LPRINT:PRINT580 GOTO 220590 LPRINT:PRINT600 PRINT "610 LPRINT "620 PRINT "630 LPRINT "640 END
G "WATTS","CURIE LEVEL ="G "WATTS","CURIE LEVEL ="
27",6/01/87,130",6/01/87,1
TOTAL HEAT LOAD FOR ABOVE SHIPMENT=" SUM "WATTS"TOTAL HEAT LOAD FOR ABOVE SHIPMENT=" SUM "WATTS"TOTAL RADIATION FOR ABOVE SHIPMENT=" NSUM "CURIES"TOTAL RADIATION FOR ABOVE SHIPMENT=" NSUM "CURIES"
265

Table 4.3. Output from HFEDSHIP.BAS for typical shipment
HFEDSHIP.BAS, A BASIC PROGRAM TO CALCULATE HEAT LOAD AND CURIELEVEL OF IRRADIATED HFED MINIPLATES AS OF PRESENT DATE.TO RUN, LIST 100-300 AND ENTER DATA AS INSTRUCTED.
R. L. SENN MAY 5, 1986
HEAT LOAD + CURIE LEVEL FOR MOD. 27 AS OF 6/01/87
TIME IN REACTOR = 252.68 FULL POWER DAYSCOOLING TIME =249 DAYSTOTAL ORIGINAL 235-U= 15.163 GRAMSESTIMATED FRACTIONAL 235-U BURNUP = .88REMAINING 235-U = 1.81956 GRAMS
POWER/GM 235-U = 1.893304TOTAL HEAT LOAD = 3.444981 WATTS CURIE LEVEL = 826.7954
HEAT LOAD + CURIE LEVEL FOR MOD. 30 AS OF 6/01/87
TIME IN REACTOR = 272.3 FULL POWER DAYSCOOLING TIME = 194 DAYSTOTAL ORIGINAL 235-U= 25.814 GRAMSESTIMATED FRACTIONAL 235-U BURNUP = .84REMAINING 235-U = 4.130241 GRAMS
POWER/GM 235-U = 2.449113
TOTAL HEAT LOAD = 10.11543 WATTS CURIE LEVEL = 2427.702
HEAT LOAD + CURIE LEVEL FOR MOD. 31 AS OF 6/01/87
TIME IN REACTOR = 234.65 FULL POWER DAYSCOOLING TIME = 194 DAYSTOTAL ORIGINAL 235-U= 20.497 GRAMSESTIMATED FRACTIONAL 235-U BURNUP = .7REMAINING 235-U = 6.149101 GRAMS
POWER/GM 235-U = 2.232195
TOTAL HEAT LOAD = 13.72599 WATTS CURIE LEVEL = 3294.238
HEAT LOAD + CURIE LEVEL FOR MOD. 33 AS OF 6/01/87
TIME IN REACTOR = 146.89 FULL POWER DAYSCOOLING TIME = 123 DAYSTOTAL ORIGINAL 235-U= 28.835 GRAMSESTIMATED FRACTIONAL 235-U BURNUP = .3REMAINING 235-U = 20.1845 GRAMS
POWER/GM 235-U = 2.425384
TOTAL HEAT LOAD = 48.95515 WATTS CURIE LEVEL = 11749.24
266

Table 4.3 (continued)
HEAT LOAD + CURIE LEVEL FOR PLATES A-114,-115 AS OF 6/01/87
TIME IN REACTOR = 321.55 FULL POWER DAYSCOOLING TIME = 123 DAYSTOTAL ORIGINAL 235-U= 7.66 GRAMSESTIMATED FRACTIONAL 235-U BURNUP = .7REMAINING 235-U = 2.298 GRAMS
POWER/GM 235-U = 3.779093
TOTAL HEAT LOAD = 8.684356 WATTS CURIE LEVEL = 2084.245
HEAT LOAD + CURIE LEVEL FOR MOD. 34 AS OF 6/01/87
TIME IN REACTOR = 147 FULL POWER DAYSCOOLING TIME = 123 DAYSTOTAL ORIGINAL 235-U= 21.108 GRAMSESTIMATED FRACTIONAL 235-U BURNUP = .4REMAINING 235-U = 12.6648 GRAMS
POWER/GM 235-U = 2.426544TOTAL HEAT LOAD = 30.7317 WATTS CURIE LEVEL = 7375.608
HEAT LOAD + CURIE LEVEL FOR PLATES A-87,-89,-90,-93 AS OF 6/01/87
TIME IN REACTOR = 401.62 FULL POWER DAYSCOOLING TIME = 123 DAYSTOTAL ORIGINAL 235-U= 9.995 GRAMSESTIMATED FRACTIONAL 235-U BURNUP = .92REMAINING 235-U = .7995998 GRAMS
POWER/GM 235-U = 4.199284
TOTAL HEAT LOAD = 3.357747 WATTS CURIE LEVEL = 805.8592
TOTAL HEAT LOAD FOR ABOVE SHIPMENT= 119.0154 WATTSTOTAL RADIATION FOR ABOVE SHIPMENT= 28563.68 CURIES
267

Appendix J-4.1.2
FULL-SIZED ELEMENT IRRADIATIONSIN THE OAK RIDGE RESEARCH REACTOR
OAK RIDGE NATIONAL LABORATORYOak Rigde, Tennessee
ARGONNE NATIONAL LABORATORYArgonne, Illinois
United States of America
Abstract
Twenty-one full-size test elements were irradiated in the ORRbetween 1981 and 1985 as part of the RERTR Program. Thepurpose of these irradiations was to confirm that the dataobtained from the miniplate irradiations was applicable tocomplete elements. Table 1 lists the key characteristics ofthese elements: element number, fuel type, enrichment, initialuranium density and fissile loading, percentage 235U depletion,and the date at which each irradiation was completed. Thisappendix consists of three papers that provide the main resultsof the irradiations and post-irradiation examinations.
CONTENTS
Part I
G.L. Copeland, G.L. Hofman, and J.L. Snelgrove, "Irradiation Performance ofLow-Enriched Uranium Fuel Elements", Proc. 1984 International Meeting onReduced Enrichment for Research and Test Reactors, October 15-18, 1984,Argonne, Illinois, ANL/RERTR/TM-6, CONF-8410173 (July 1985), pp. 152-166.
Part II
G.L. Copeland and J.L. Snelgrove, "Performance of Low-Enriched UraniumAluminide-Aluminum Thick-Plate Fuel Elements in the Oak Ridge ResearchReactor," paper excerpted from a draft of ANL/RERTR/TM-16, "Performance ofReduced Enrichment UA1X-A1 and UaOg-Al Fuel Elements in the Oak RidgeResearch Reactor," by G.L. Copeland and J.L. Snelgrove (to be published) .
Part III
G.L. Copeland, G.L. Hofman, and J.L. Snelgrove, "Examination of U3Si2~AlFuel Elements from the Oak Ridge Research Reactor", Proc. 1986International Meeting on Reduced Enrichment for Research and Test Reactors,November 3-6, 1986, Gatlinburg, Tennessee, ANL/RERTR/TM-9, CONF-861185 (May1988), pp. 211-221.
Following successful irradiation testing of the six U3Si2 fuel elementsdescribed in Part III, a whole-core demonstration of the U3Si2 fuel wasconducted in the ORR between 1985 and 1987 to provide both reactor physicsdata and proof that commercially fabricated elements would perform well.
269

The fuel elements for the demonstration were fabricated by CERCA, NUKEM,and Babcock & Wilcox and were essentially identical with the test elements.The HEU-LEU transition phase of ORR demonstration is described in Volume 5,Appendix M-4.
Table Full-Sized Fuel Elements Irradiated in the ORR.
ElementNo.a
T291XT292XT293XT294X
NLE451NLE452
CLE451CLE452CLE453
NLE201NLE202
CLE201CLE202CLE203CLE204
NSI201NSI202
CSI201CSI202
BSI201BSI202
FuelType
U O3 8U O3 8U 03 8U 03 8
UAlX
UAlX
UAlX
UAlX
UAlX
U 03 8U O3 8
UAlX
UAlX
U 03 8U O3 8
U Si3 2U Si3 2
u3si2V1'
U Si3 2U Si3 2
No. ofPlates
19191919
1919
191919
1313
13131818
1919
1919
1919
Enrich-ment
45454545
4444
444444
1919
19191919
1919
1919
1919
.0
.0
.0
.0
.9
.9
.9
.9
.9
.6
.6
.8
.8
.7
.7
.7
.7
.8
.8
.8
.8
Initial InitialU density 235UMg/m3 g
1111
11
111
22
2233
44
44
44
.7
.7
.7
.7
.7
.7
.7
.7
.7
.3
.3
.1
.3
.2
.2
.8
.8
.8
.8
.8
.8
280280280280
284284
282282284
340340
312336326326
340340
339339
339339
235U DateDepletion Irrad.
% Complete
56b70e
55b
58b
75C
59b
71C
56b75b
77b58b
517174b
54C
3582
5282
5477
10/31/814/16/8210/11/826/22/82
10/11/826/11/82
11/18/824/16/829/15/83
1/20/855/30/85
5/30/851/20/854/22/849/29/83
1/14/838/14/84
10/13/838/14/84
4/22/8412/19/84
First letter in element no. designates fabricator:CERCA (C), NUKEM (N), or Texas Instruments (T).
bEstimated burnup.cBased on preliminary evaluations of measurements.
Babcock & Wilcox (B),
270

Appendix J-4.1.2Part I
IRRADIATION PERFORMANCE OF LOW-ENRICHEDURANIUM FUEL ELEMENTS*
G.L. COPELANDOak Ridge National Laboratory,Oak Ridge, Tennessee
G.L. HOFMAN, J.L. SNELGROVEArgonne National Laboratory,Argonne, Illinois
United States of America
Abstract
The status of the testing and evaluation of full-sizedexperimental low- and medium-enriched uranium fuel elementsin the Oak Ridge Research Reactor is presented. Medium-enriched elements containing oxide and aluminide have beencompletely evaluated at burnups up to 75%. A low-enricheduaSi2 element has been evaluated at 41% burnup. Other sui-cide and oxide elements have completed irradiation satisfac-torily to burnups of 75% and are now being evaluated. Allresults to date confirm the expected good performance ofthese elements in the medium power research reactorenvironment.
INTRODUCTION
This paper presents the results of irradiation of experimental medium-and low-enriched uranium fuel emements in the Oak Ridge Research Reactor(ORR). The purpose of the test irradiations is to confirm the expected goodperformance of these elements in a medium power research reactor to burnupsin excess of that normally achieved in routine operation. This expectationof good performance is based on niniplate irradiations at even higher fuelconcentrations and burnups.^"^ Nine medium-enriched and 12 low-enriched ele-ments have been produced by commercial fuel fabricators and irradiated in theORR. Five elements remain in the reactor while the others have satisfac-torily completed irradiation and have been evaluated or are now awaitingpostirradiation examination (PIE).
ELEMENT DESCRIPTION
The experimental elements were designed to replace a standard ORR ele-ment. The standard element is a box type containing 19 curved plates and atotal of 285 g of 235U (highly enriched). The nominal plate thickness is
*Research sponsored by the Reduced Enrichment for Research and TestReactors Program, U.S. Department of Energy, under contract DE-AC05-850R21400with Martin Marietta Energy Systems, Inc., and Argonne National Laboratory,operated by The University of Chicago, under contract W-31-109-Eng-38.
271
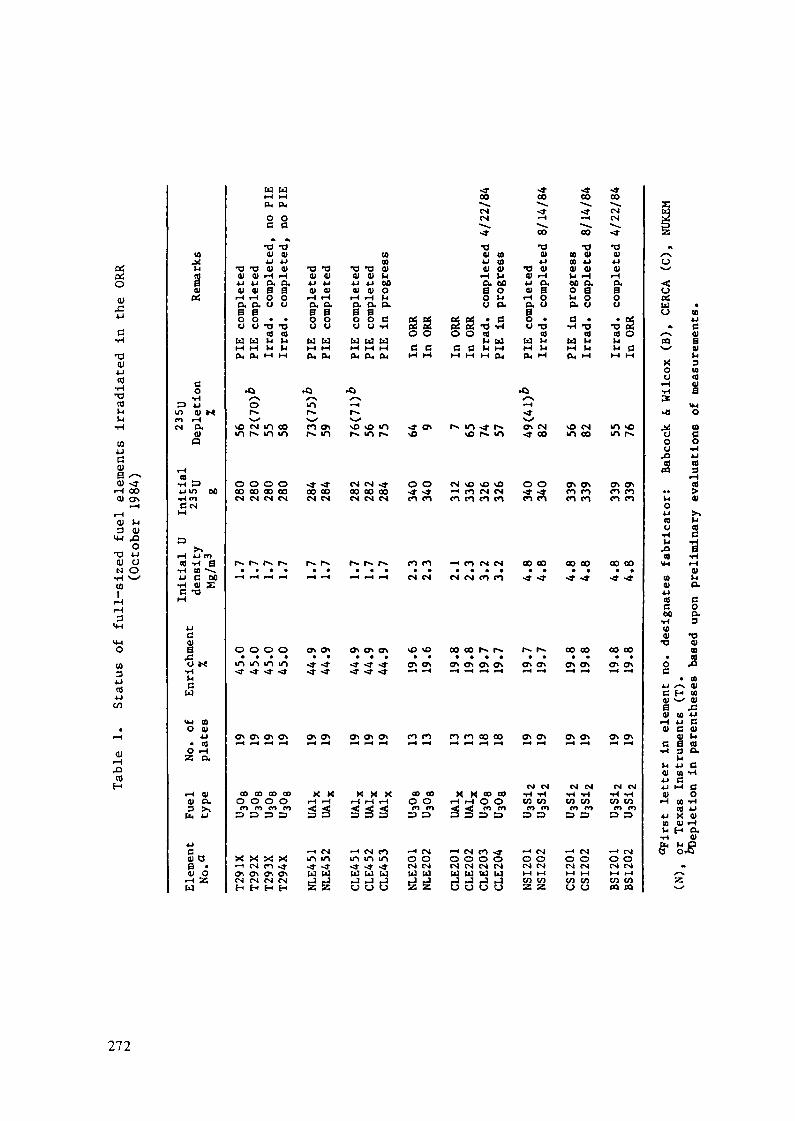
oai
ai4-1co
Mkl
co4-1CCUB a) <3-
i-l OOai ON
0) M3 <U
U-( 43O
73 4-10) ON O•H ^-*COl
34-1
Ul3
cdH
to^^l_j
B01
OS
do•H
3 4-1m o> KCO (HCM CX
01a
IHcd•3 34J l/> 00•HCOdCMl-l
•-I 4-1 mcd -H 0
•H CO ~~,4-1 d 00i-l eu JEd T3M
4Jd0)
U »4•Hkldtd
MJ COO Ol
4-1
0 i-lZ CX
•-I 0101 CXD >\
(X 4J
4Jdeu aB •Ol O
-H Z(d
T3 T3Ol 014-1 4-1Ol OliH i-lCX CXB So oy uW (dl-l MPL, PH
•OOr^\«^
vO CMin r-»
o o00 00es es
O Om m
ON ON
CO 00o oCO CO3 3
X Xr— t CM
ON ONCM CMH H
Id (dl-l t-tPH PH
O Od dM M
TJ ~O01 014-1 4-101 Ol•H iHCX CXB ao oy 0
T3 T3Cd Cdki klkl kl
m oom in
o o00 03CM CM
O O
m m
ON ON
CO COo om ro3 3
X Xro .»ON ONCM CMH H
•oOl
01iH
Ba8tdl-lPH
«oinr-»\^ro
^00CM
ON
-*
ON
X
3
1—4
m>W£
t3014JatexBoy
EdIHPH
ONin
^00CM
ON
-»
ON
X•H
CMm.H;
td
z1
•a014JOliHCXBoyWIHPH
•QCH"f^\^NOr-»
CM00CM
-1
ON
.»
ON
X
3
i-Hin-td
O
COCO•a at
01 kl4-1 00Ol OiH kl0. CXBo dU i-l
[d (dM IHCX, OH
NO mm r>»
es .»00 00CM CS
•— < «-HJ
ON ON
-» -*
ON ON
X X•-I iH
33
CM COin m• -^U Cddd
pâ S §i Sa o o od d d d
»^ ON r~ mtfN ^Q
O O CM VO
co ro ro co
ro ro ^ roCM CM CM CS
vO NO CO CO
ON ON ON ON
ro co ro ro
oo oo XXO O iH r-j(0 CO ^ <
-H CS »-I CSO O O OCM CM CM CMtd [d td td
22 du
^H-
OO-^CSCS
-*•001 (04-1 (O01 OliH klex ooB 0O klu ex• a
•0 -rlcdkl IH
-* r-.r« m
VO NOCM CSCO CO
CM CS
r~ r»ON ON
00 CO
oo oo0 0
CO CO
CO •»o oCM CMCd td
d d
•3-00^s^
^^H^^CO
•oOl4-1
T3 0101 iH4J CXoi B•H OCX O§ .o -a
cdCd kiM klPH *H
•Q_l^\^ON CM-4- 00
0 0
co co
00 03
r~ r»ON ON
ON ON•H iH
CM CM•H -HCO COco co3 3
*-• CMO OCM CMM M
Z Z
^CO--^^•-H^^^00
•a03 01CO 4J01 0)kl iH00 CX0 Bkl OCX 0
d ••H -acd(d klM klPH IH
NO CSm oo
ON ONco roro ro
00 00
00 00
ON ON~Hj ^H
ON ON
CM CM•H i-lCO COm co3 3
•H CMO OCM CMM MCO COU O
^oo-»s^
CSes• ^•*•aOl4-101
•HCXgQ
U
•ô e2cd O
M d
m NOm r«.
ON ONro coCO CO
co oo
00 00
ON ON
ON ON•H «H
CM CM•H -HCO COco co3 3
•H CSo oCM CMM MCO COCQ CO
clPiö à
4J« d^> 01m B
N^ 01
XOu 10
cdë
3 VMt£ O
j<: cou do oy -H.o ucd cdpq s
iHça
kl 01o4J >NCd kly cd•H dÄ Bcd -H
VM
u01
01kl(X
ai dd oeo ex•H 3(001 T3
•O 01CO
i *• co
4J /-» 01d H coOl ^^ OlB f4) CO 4J
•-< 4J dO) d 01
d S a•H 3 a.kiIH u d
01 M i-l4J d4J M d01 o•H CO -H
X 014J X 01m oi f-lki H CX•H 01
272

1.27-mm (0.050-in.) with a 0.51-mm (0.020-in.) fuel meat. The experimentalelements are similar except for the 18 plate and 13 (flat) plate elementswhich have thicker meats and plates. The elements have been treatedroutinely for fuel shuffling except for the 13 plate elements which wererestricted to low-flux positions early in life to meet heat-flux restrictionsof the reactor. The water channels of the elements were periodicallymeasured during reactor shutdowns. No abnormal changes were found on any ofthe elements.
A description of the elements and their current status is in Table 1.The elements contain 1)303, 03A1X (x ~ 3), or 03812 dispersed in aluminum.The fuel fabricators were Texas Instruments (TI) and Babcock and Wilcox (B&W)in the United States, Compagnie pour l'Etude et la Realisation de CombustibleAtomiques (CERCA) in France, and NUKEM in the Federal Republic of Germany.At least two elements of each type were irradiated, one of which was intendedfor normal burnup of about 50% depletion of 235^ ancj one of which wasintended to achieve a burnup of 75% (substantially higher than would beachieved in normal reactor operation).
POSTIRRADIATION EXAMINATION PROCEDURES
Postirradiation examinations of the plate-type fuel elements irradiatedin the ORR are conducted in the High-Radiation Level Examination Laboratory(IIRLEL) at ORNL, with the exception of metallography of uranium-suicidespecimens, which is performed at the Argonne National Laboratory (ANL ).Since the full-sized element irradiations are meant to be confirmatory innature and not to provide basic irradiation-behavior data for the fuel, theemphasis of the PIEs is on checking the dimensional stability of the elementand plates, on measuring blister-threshold temperatures and burnup levels,and on performing limited metallography. A summary of the PIE steps for atypical element is included in the Appendix. In some cases, such as for af irst-of-a-kind element, more samples might be taken for certain steps, asfor example plate thickness measurements. If any unusual or unexpectedfeatures are noted, more extensive examinations are performed as needed. Ingeneral, a nondestructive PIE is performed on the normal burnup element of apair and a destructive (full) PIE is performed on the high burnup element.In some cases, a full PIE is performed on the normal burnup element.
As shown in Table 1, PIEs of six MEU elements and one LEU U3Si£ elementhave been completed. Nine other elements have completed irradiation with noapparent problems. Postirradiation examination is in progress on three ofthese, four are cooling prior to PIE, and no PIE is planned for the twoadditional TI elements.
RESULTS
Postirradiation examination results to date show completely satisfactoryperformance for all the elements.
Element Visual and Dimensional Inspection
A careful visual examination of each element has revealed no abnormalfeatures. The elements appear to be essentially as-fabricated with theexception of the normal corrosion film and scuff marks from handling.
273

Measurements for length, width, thickness, twist, and bow reveal no signifi-cant changes. The elements are within the original fabrication specificationenvelope.
Channel Spacing Measurements
Each water channel was measured in two locations for the full length of theelement. These measurements showed the channels to meet the minimum fabrica-tion specification in each case. The channel spacings were very uniform withthe exception of one channel in NLE-451 which opened up near one end. Thisapparently did not occur during irradiation since the adjacent channels wereuniform.
Plate Visual Inspection
After removing the plates from the full-PIE elements, they were visually exa-mined for defects. The plates were bowed and warped to some extent afterremoving from the element. The plates appeared to be in excellent conditionwith a uniform corrosion film over the meat and no apparent blisters, unusualswelling, or other defects.
Plate Thickness Measurements
Selected plates from each element were measured in 24 locations for thicknesschange. The accuracy of measurement for these plates is not sufficient forswelling data due to the curvature, warping, bowing, and lack of accuratepreirradiation measurements. The thickness measurements showed uniformlyvarying swelling up to about 50 ym as a maximum with one exception. One areaof one plate showed thickness changes up to 150 ym over a small area, whichlater proved to be erroneous measurements. This was a central plate fromelement CLE-451. Metallography of this area showed the plate to be of normalthickness with no unusual features in the microstructure which could haveresulted in abnormal swelling.
Blister AnnealingBlister annealing of selected plates from each full-PIE element wasaccomplished by heating the plates singly in a tube furnace. The furnace wasable to maintain a uniform maximum-temperature zone about 7-in. long in themaxiraum-burnup region of the plate. Temperatures decreased toward the endsof the plate by up to 10°C. The plates were sequentially heated for 30 minat 400, 450, 475, 500, 525, and 550°C or until blisters were observed. Theplates, their maximum heating temperature, and the type blisters observed arelisted in Table 2.
These data show that the blister threshold temperature of these high-loaded,low-enriched fuels is not significantly different from the low-loaded,highly-enriched fuels currently in use.
Metallography
The highest burnup plate (other than a side plate) based on gamma scanningwas selected from each full-PIE element for metallographic examination.Metallographie sections were taken from the peak—burnup and low-burnup areas
274

Table 2. Results of blister anneals of full-sized platesfrom various fuel elements
Elementno.
T292X
T292X
NLEA51
NLE451CLE451
CLE451
NSI201NSI201NSI201
Plateposition
2
82
82
8
2819
Plate Maximumtemperatureno. *.c
12-2-4
12-2-8
ORR-044
ORR-050OMIU-34
OMIU-40
ORR-092ORR-100ORR- 144
500483550550550
550
550550550
, Description of blisters01
Many blisters over 15 in. ofplate, both sides, typical PI
Small, typical PI, over ~10 in.of plate, both sides
Small, typical PI, over about7 in. of plate, both sides
NoneVery small blisters over non-fuel zone, both ends ofplate, no blisters over fuel
Very snail blisters similar toabove over nonfuel zone butless noticeable, no blistersover fuel
NoneNoneNone
°Typical PI — typical of postirradiation blisters observed previously inlow-volume fraction fuels (i.e., appear to be discrete blisters between meatand cladding with no "pillowing").
of these plates (adjacent to the burnup analysis sample). Representativemicrostructures from the peak burnup areas of each fuel are shown in. Figs,through 6. In general, the microstructures are as expected from previousminiplate irradiations and reveal no abnormal conditions. The plates appearto be in excellent condition.
1
CONCLUSION
Postirradiation evaluation to date of medium- and low-enriched uraniumelements from the ORR confirm their expected satisfactory performance in thismedium powered research reactor. Medium-enriched elements containing oxideand aluminide fuel have been completely evaluated at up to 75% burnup. Alow-enriched element containing U3Si2 has been completely evaluated at about41% burnup. Low-enriched elements of 03812 and oxide have satisfactorilycompleted irradiation up to 75% burnup and are now awaiting completeevaluation.
275

200 IOOX
40 pm 500X
Fig. l. Microstructure of MEU oxide plate from element T292X,plate 7, peak-burnup région, 86%. (R78807 top, R78808 bottom).
276

•XauJ
. 20O IOOX
40 pm 500X
Fig. 2. Microstructure of MEU aluminide plate from element CLE-451,plate 17, peak-burnup région, 87%. (R78795 top, R78795 bottom).
277
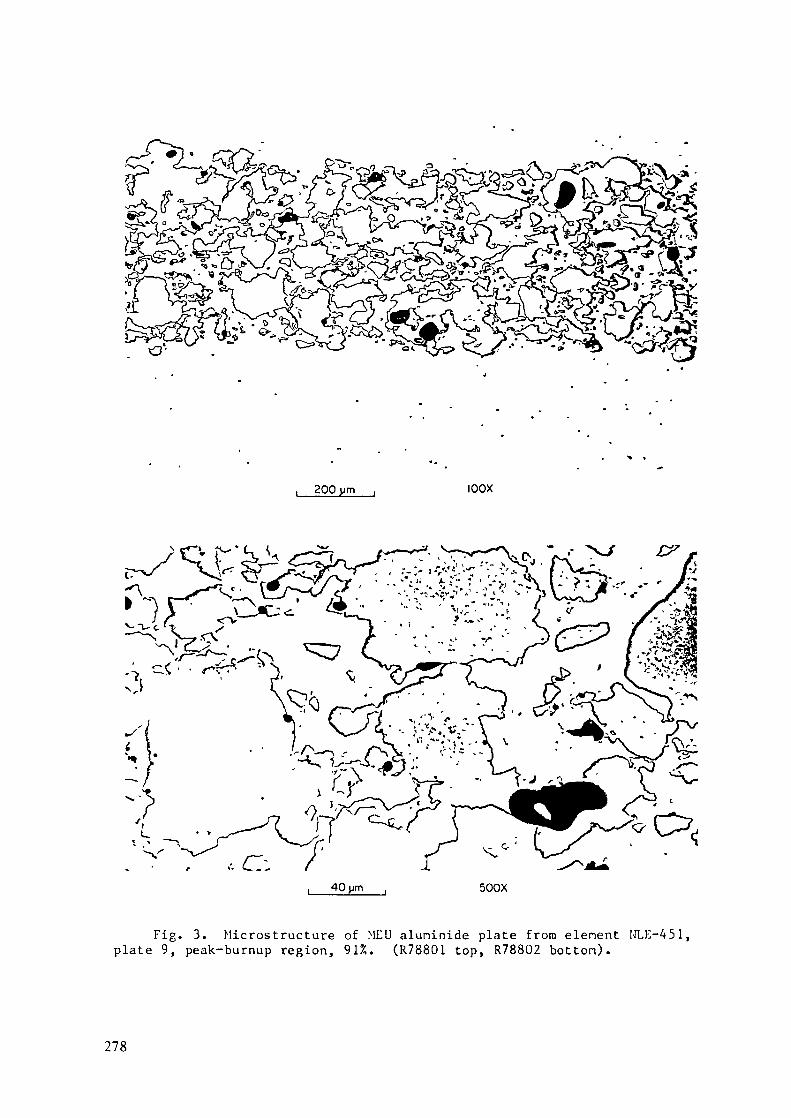
r '-&&
200 IOOX
/•S-. • r(^
40 pm 500X
Fig. 3. Microstructure of MEU aluninide plate from elenent NLE-451,plate 9, peak-burnup region, 91%. (R78801 top, R78802 botton).
278

Fig. 4. Microstructure of LEU U3Si2 plate from element NSI-201, peak-burning region, 507». The large voids are remnants of as-fabricated porosity.Reaction zones and absence of gas bubbles are similar to mini-plates.
279

Fig. 5. Scanning Electron Micrograph of U-jSio from element NSI-201 at% 2 U depletion (using backscattered electrons;. The dark area is
aluminum, grey area is reaction zone, and the lighter area is the fuelparticle. Note the presence of small stable gas bubbles in some grains andthe lack of bubbles in other grains.
280

Fig. 6. Scanning Electron Micrograph of 113812 from element NSI-201 atburnup showing a grain with a distribution small uniform and stable gas
bubbles. These observations are consistent with those from miniplateevaluations.
281

REFERENCES
1. G. L. Copeland and J. L. Snelgrove, "Examination of IrradiatedHigh-U-Loaded 1)309—Al Fuel Plates," in Proceedings of the InternationalMeeting on Research and Test Reactor Core Conversions from HEU to LEUFuels, Argonne, Illinois, November 8-10, 1982, ANL/RERTR/TM-4,CONF-821155 (September 1983), pp. 79-87.
2. G. L. Hof man and L. A. Neimark, "Irradiation Behavior of Uranium-SuicideDispersion Fuels," in Proceedings of the International Meeting on ReducedEnrichment for Research and Test Reactors, 24—27 October 1983, Tokai,Japan, JAERI-M 84-073 (May 1984), pp. 43-53.
3. E. E. Ferez, C. A. Kohut, D. R. Giorsetti, G. L. Copeland, andJ. L. Snelgrove, "Irradiation Performance of CNEA UA1X andUaOg Miniplates," in Proceedings of the International Meeting on ReducedEnrichment for Research and Test Reactors, 24—27 October 1983, Tokai,Japan, JAERI-M 84-073 (May 1984), pp. 67—76.
4. M. F. Hrovat and H. W. Kassel, "Recent Status of Development andIrradiation Performance for Plate Type Fuel Elements with ReducedEnrichment at NUKEM," in Proceedings of the International Meeting onReduced Enrichment for Research and Test Reactors, 24—27 October 191T3,Tokai, Japan, JAERI-M 84-073 (May 1984), pp. 95-99.
5. J. L. Snelgrove, R. F. Domagala, T. C. Wiencek, and G. L. Copeland, "FuelDevelopment Activities of the U.S. RERTR Program," in Proceedings of theInternational Meeting on Reduced Enrichment for Research and TestReactors, 24-27 October 1983, Tokai, Japan, JAERI-M 84-073 (May 1984),pp. 34-42.
282

Appendix J-4.1.2Part II
PERFORMANCE OF LOW-ENRICHED URANIUMALUMINIDE-ALUMINUM THICK-PLATE FUEL ELEMENTSIN THE OAK RIDGE RESEARCH REACTOR
G.L. COPELANDOak Ridge National Laboratory,Oak Ridge, Tennessee
J.L. SNELGROVEArgonne National Laboratory,Argonne, Illinois
United States of America
Abstract
Two high-density, low-enriched, thick-plate UA1X-A1 dispersionfuel elements, fabricated by CERCA, have been tested in the OakRidge Research Reactor (ORR). The fuel meat was nominally 1.5 mmthick, and the uranium density in the fuel meat was 2.1 Mg/m3 inone element and 2.3 Mg/m3 in the other. The elements wereirradiated in several core positions. The lower-density elementwas irradiated to approximately normal ORR burnup (50 to 56% 235Udepletion), and the higher-density element was irradiated to anaverage burnup of 72%, well above the burnups normally achieved inresearch and test reactors. Peak burnups over 97% were achieved.
Following suitable cooling periods, the elements weresubjected to a series of nondestructive and destructive (higher-density element only) examinations, including visual inspection anddimensional measurements, channel gap thickness measurements, gammascans, plate thickness measurements, blister threshold temperaturetests, metallography, and isotopic burnup analyses. Externally,the elements were essentially unchanged from their as-fabricatedcondition. The behavior of the fuel wag found to be entirelyconsistent with that expected on the basis of results of previoustests using miniature fuel plates. The plates showed small,uniform thickness changes, ranging up to 100 jun in regions of ~97%burnup. No blisters formed over the fuel meat duringpostirradiation anneals, even at 575°C.
It is concluded that high-density low-enriched UA1X-A1dispersion fuel elements with fuel meat thicknesses up to 1.5 mmwill perform at least as well in research and test reactors with upto medium power density as the high-enriched UAlx-Al dispersionfuel elements currently being used in many reactors.
1. INTRODUCTION
Since its inception in 1978, the U. S. Reduced Enrichment Research andTest Reactor (RERTR) Program1 has pursued the development of high-densitydispersion fuels as one means of making feasible the conversion of researchand test reactors from the use of highly enriched uranium (HEU) fuel to theuse of low-enriched uranium (LEU) fuel. At that time the highest densityfuels in common use in plate-type research reactor fuel elements were dis-persions of uranium aluminide (UA1X) and uranium oxide (U3Og) in aluminum
283

with uranium densities in the fuel meat of 1.7 and 1.3 Mg/m3, respectively.These two types of dispersion fuels have now been developed and tested forLEU applications up to their practical fabrication limits—2.4 Mg U/m3 forUA1X and 3.2 Mg U/m3 for U3O8.2 In addition, dispersions of uraniumsuicide (U3Si2) in aluminum has been developed and tested up to about5.2 Mg U/m3.3' *
Before the success of the high-density fuels was assured, a parallelconcept for increasing the uranium content of fuel elements was pursued--increasing the volume fraction of fuel in the element by using fuel plateswith much thicker fuel meat (-1.5 mm instead of -0.5 mm) while decreasingthe number of plates to maintain an adequate coolant channel thickness. Inthis way conversion of reactors with low to moderate power densities wouldhave been possible with UA1X or U3O8. Irradiation testing of elements ofthis type containing UA1X and U308 was conducted in the Oak Ridge ResearchReactor (ORR) and in the High Flux Reactor (HFR) at Petten, The Nether-lands.5 However, the unqualified success of the U3Si2 dispersion fuel haseliminated the need for such large increases in fuel meat thickness.Nevertheless, irradiation of the four thick-plate UA1X elements provided ademonstration of the good performance of highly loaded, low-enriched,aluminide dispersion fuel.
The two UA1X elements irradiated in the ORR, their irradiationhistories, and the results of their detailed postirradiation examinationare described and discussed in this report.
2. DESCRIPTION OF FUEL ELEMENTS
2.1 General Description
The standard box-type ORR element contains 19 curved plates, eachnominally 1.27 mm thick with 0.51-mm-thick meat and 0.38-mm-thick cladding.The standard ORR high-enriched U308 element contained 285 g of 235U(0.85 Mg U/m3, 12 vol% U3O8) while the low-enriched U3Si2 element with thesame geometry contained 340 g of 235U (4.75 Mg U/m3, 42.1 vol% U3Si2). Thelow-enriched UAlx elements discussed in this report contained 312 and 336 gof 235U. The additional uranium loading was achieved by increasing thevolume loading of fuel in the meat and by increasing the meat thickness anddecreasing the number of plates (giving a coolant channel thickness onlyslightly less than the 2.95-mm nominal of the standard element). Thenominal meat thickness was 1.50 mm with 0.43-mm-thick cladding, giving atotal plate thickness of 2.36 mm. The rigidity of these thick plates wasgreat enough to provide stability without curving so they were left flat.Outer plates of unfueled aluminum were used to adapt the flat-plate elementto the curved-plate ORR geometry. A cross-section of the element is shownin Fig. 1.
The uranium densities of the meat in these elements were 2.1 and2.3 Mg U/m3 (~45 and 50 vol% UA1X) , which are near the upper limit offabricability for UA1X fuels (-2.4 Mg U/m3 for x=3) . The lower- andhigher-density elements were identified as CLE-201 and CLE-202,respectively.
2.2 Specifications
The elements were fabricated by CERCA (Compagnie pour l'Étude et laRéalisation de Combustibles Atomiques, Romans-sur-Isere, France) usingspecifications developed by them and approved by ANL/ORNL. The materials
284

ORNL-DWG88-8I86
—
78M/
, 1
41.E
18iX
it
36.É
fiyp)"
3+0
>5
i
— • • ——————— / o
H —— 4.56
a&<zttÇZF&&s"U| \ N N ^ 1
^ N N \ \ \ \ \
^
^v?J N ^ ^ N N N X > X k
*À -\
*\(.J'I|> N N>lXl>>Nl
NNN^N
/H
ALUMINUM \END PLATE — x
ï fedi?^/ ^
k ^ ^N^N'^ Ç\ \ \ \ \ \ \N \^
.w^;;;.rf\?$
\\\N\\ y
\ \ \N\ \ \ \ \ \^
r^P
140R;fl NOTE;
/ Al 1 DIMFN
— 140R-ALUMINUM
END PLATE
j-13 FUELT PI ATFS1 2.36 thk
[-14 SPACESf 2.83 WIDE
F; low«;ARE IN MILLIMETERS
Fig. 1. Cross Section of 13-Flat-Thick-Plate ORR Test Element.
and fabrication and inspection procedures were essentially those used byCERCA in their standard production. The materials used in the testelements are listed in Table I. The composition and properties of thealuminum alloys used in the elements are listed in Table II.
The fuel plate specifications for the ORR HEU elements required aminimum cladding thickness of 0.33 mm. Surface defects with depths up to0.13 mm were allowed, leaving a minimum of 0.20 mm of cladding over thefuel meat at any point. These specifications were retained for the UA1Xelements and were met with no apparent difficulty, probably because of theextra 0.05 mm of cladding.
Related to the high volume loading of fuel in the meat is an increasednumber of fuel particles at the surface of the fuel compact and, conse-quently, an increased probability for fuel particles to become dislodgedand spread into nominally fuel-free zones during the rolling process. Thisphenomenon, referred to as fuel flaking or fuel out of zone, is identifiedby the occurrence of white spots on an X radiograph of the fuel plate.Although the specifications did not specifically address this problem, itwas known to exist from previous development work, and ORNL used realisticcriteria in judging the acceptability of plates with fuel out of zone.Since the amount of fission energy liberated in these relatively isolatedparticles is so small as to preclude any cooling problems, the only concernis the isolation of the fission products. In general, it was required thatno particle be within 0.5 mm of the edges or ends of the plates. As dis-cussed in Section 5.4, small blisters which formed during postirradiationannealing tests are believed to be associated with some of these out-of-zone particles. The formation of such blisters after out-of-pile annealingverifies that the fission products were retained within or near theseparticles during irradiation.
285

Table I. Materials Used in UA1X Test Elements.
Part Name Material
Fuel Plate
Frame AG 3 NEa/AG 5 NEb
Cover AG 3 NE
Fuel Core
Fuel UA1X
Matrix A5 NE
Adapter Plate AG 3 NE
Side Plate AG 3 NE
End Adapter 356 Alc
Welding Wire AG 3 NE
aCLE-201bCLE-202cSupplied by ORNL/ANL
2.3 As-Fabricated Attributes
Three lots of UA1X powder were used in the fabrication of plates forthese elements. The compositions of these powders are listed in Table III.All of the powder was required to pass through a 150-nm-mesh sieve, and upto 25 wt% was allowed to pass through a 44-nm-mesh sieve.
A variable which influences the plate thickness change, or swelling,during irradiation is the void content of the as-fabricated plates. Thevoid content depends on the fuel particle size, fuel volume fraction, andmeat thickness (and probably on other properties as well). The void con-tent was not determined for these plates. However, based on the amountresidual porosity in the irradiated fuel and on our knowledge of porositiesin other UA1X and U3Si2 plates, we estimate that the as-fabricated porositywas of the order of 8 to 10%.
3. IRRADIATION HISTORY
Because the 235U was contained in considerably fewer fuel plates thanin a standard element, it was necessary to begin their irradiations in low-flux positions in order to remain within heat flux limits. Consequently,
286
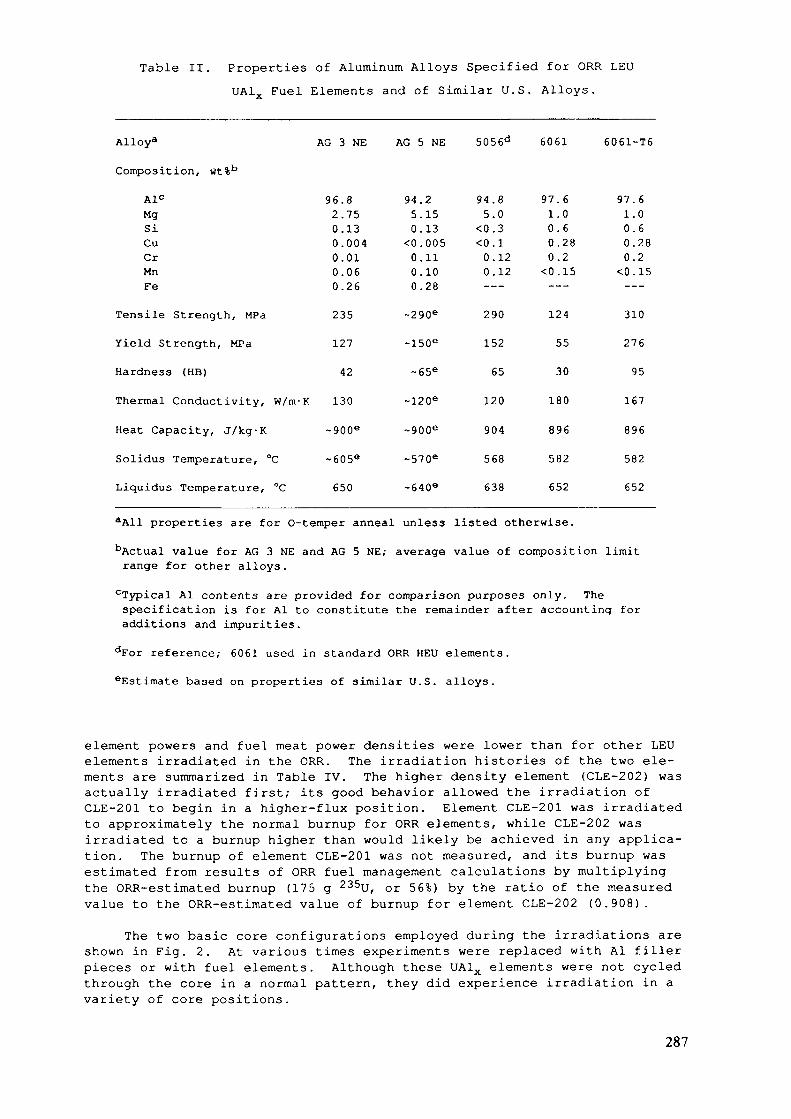
Table II. Properties of Aluminum Alloys Specified for ORR LEUUA1X Fuel Elements and of Similar U.S. Alloys.
Alloy3
Composition, «t%bAG 3 NE AG 5 NE 5056d 6061 6061-T6
AlcMgSiCuCrMnFe
Tensile Strength, MPa
Yield Strength, MPa
Hardness (HB)
Thermal Conductivity, W/m-K
Heat Capacity, J/kg-K
Solidus Temperature, °C
Liquidus Temperature, °C
96.82.750.130.0040.010.060.26
235
127
42
130
~900e
~605e
650
94.25.150.13
<0.0050.110.100.28
-290e
~150e
~65e
~120e
~900e
~570e
~640e
94.85.0
<0.3<0.10.120.12——
290
152
65
120
904
568
638
97.61.00.60.280.2
<0.15- —
124
55
30
180
896
582
652
97.61.00.60.280.2
<0.15——
310
276
95
167
896
582
652
aAll properties are for O-temper anneal unless listed otherwise.
'•'Actual value for AG 3 NE and AG 5 NE; average value of composition limitrange for other alloys.
cTypical Al contents are provided for comparison purposes only. Thespecification is for Al to constitute the remainder after accounting foradditions and impurities.
dFor reference; 6061 used in standard ORR HEU elements.eEstimate based on properties of similar U.S. alloys.
element powers and fuel meat power densities were lower than for other LEUelements irradiated in the ORR. The irradiation histories of the two ele-ments are summarized in Table IV. The higher density element (CLE-202) wasactually irradiated first; its good behavior allowed the irradiation ofCLE-201 to begin in a higher-flux position. Element CLE-201 was irradiatedto approximately the normal burnup for ORR elements, while CLE-202 wasirradiated to a burnup higher than would likely be achieved in any applica-tion. The burnup of element CLE-201 was not measured, and its burnup wasestimated from results of ORR fuel management calculations by multiplyingthe ORR-estimated burnup (175 g 235U, or 56%) by the ratio of the measuredvalue to the ORR-estimated value of burnup for element CLE-202 (0.908).
The two basic core configurations employed during the irradiations areshown in Fig. 2. At various times experiments were replaced with Al fillerpieces or with fuel elements. Although these UA1X elements were not cycledthrough the core in a normal pattern, they did experience irradiation in avariety of core positions.
287
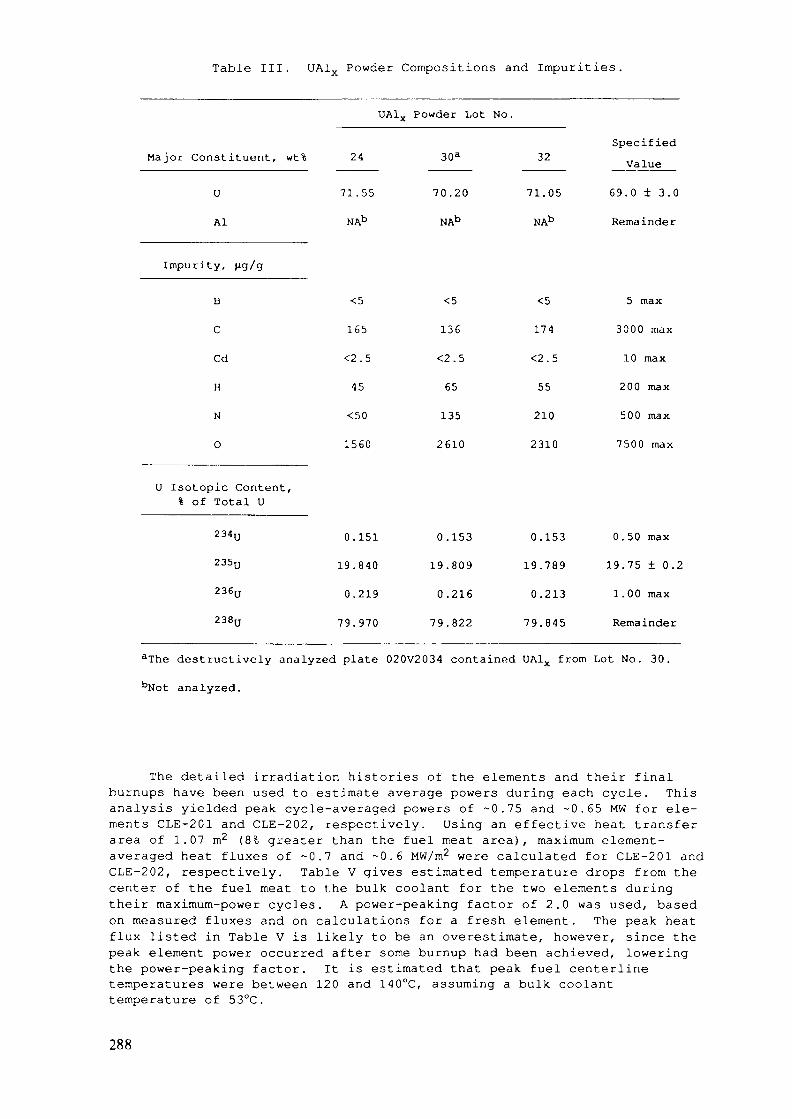
Table III. UA1X Powder Compositions and Impurities.
Major Constituent, wt%
U
Al
24
71.55
NAC
30a
70.20
NAC
32
71.05
NAC
SpecifiedValue
69.0 ± 3.0
Remainder
Impurity,
B
C
Cd
H
N
O
<5
165
<2.5
45
<50
1560
<5
136
<2.5
65
135
2610
<5
174
<2.5
55
210
2310
5 max
3000 max
10 max
200 max
500 max
7500 max
U Isotopic Content,% of Total U
0.151
19.840
0.219
79.970
0.153
19.809
0.216
79.822
0.153
19.789
0.213
79.845
0.50 max
19.75 ± 0.2
1.00 max
Remainder
aThe destructively analyzed plate 020V2034 contained UA1X from Lot No. 30.bNot analyzed.
The detailed irradiation histories of the elements and their finalburnups have been used to estimate average powers during each cycle. Thisanalysis yielded peak cycle-averaged powers of -0.75 and -0.65 MW for ele-ments CLE-201 and CLE-202, respectively. Using an effective heat transferarea of 1.07 m2 (8% greater than the fuel meat area), maximum element-averaged heat fluxes of -0.7 and -0.6 MW/m2 were calculated for CLE-201 andCLE-202, respectively. Table V gives estimated temperature drops from thecenter of the fuel meat to the bulk coolant for the two elements duringtheir maximum-power cycles. A power-peaking factor of 2.0 was used, basedon measured fluxes and on calculations for a fresh element. The peak heatflux listed in Table V is likely to be an overestimate, however, since thepeak element power occurred after some burnup had been achieved, loweringthe power-peaking factor. It is estimated that peak fuel centerlinetemperatures were between 120 and 140°C, assuming a bulk coolanttemperature of 53°C.
288

Table IV. Irradiation History Summary for UA1 Test Elements
CorePosition
A- 9
B-2
B-9
C-6
A-2
A- 8
D-8
Total
Begin Irrad.
End Irrad.
Irradiation Time, fpd
CLE-201 CLE-20240.02
84.34
131.56
152.04
82.72
88.92
39.36
211.00 407.96
09/06/84 12/18/82
05/30/85 01/20/85
Total No.of Cycles 17 32
Ave. Burnup,235U 51a
Ave. Burnup,cMWd 128 195
Ave. Power,MW 0.61 0.48
aBased on ORR fuel management estimate normalized to measuredvalue for element CLE-202, as explained in the text.
bBased on gamma scanning and isotopic analysis.C8ased on the following calculated 235U burnup rate correlation:
Burnup rate (g/MWd) = 1.2608 - 0.0004103 • Burnup (MWd).
4. POSTIRRADIATION EXAMINATION OF ELEMENTS
During November 1985 the two UA1X elements, along with others, weretransported to the ORNL High-Radiation-Level Examination Laboratory(HRLEL). The high-burnup element, CLE-202, was given a complete non-destructive and destructive examination, while the low-burnup element,CLE-201, was given only a nondestructive examination. The nondestructiveportion consisted of visual examination, dimensional inspection, gamma
289
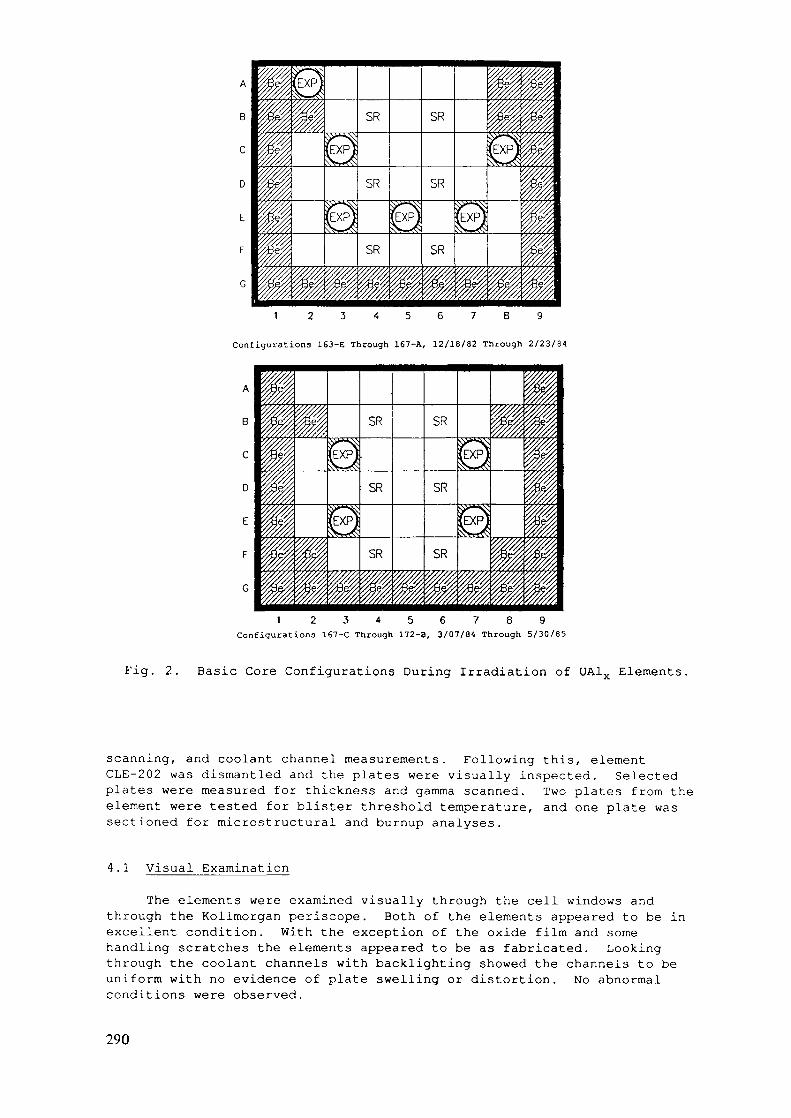
1 2 3 4 5 6 7 8 9
Configurations 163-E Through 167-A, 12/18/82 Through 2 /23 /84
SR
SR
SR
SR
SR
SR
1 2 3 4 5 6 7 8 9Configurations 167-C Through 172-B, 3/07/94 Through 5/30/85
Fig. 2. Basic Core Configurations During Irradiation of UAlx Elements.
scanning, and coolant channel measurements. Following this, elementCLE-202 was dismantled and the plates were visually inspected. Selectedplates were measured for thickness and gamma scanned. Two plates from theelement were tested for blister threshold temperature, and one plate wassectioned for microstructural and burnup analyses.
4.1 Visual Examination
The elements were examined visually through the cell windows andthrough the Kollmorgan periscope. Both of the elements appeared to be inexcellent condition. With the exception of the oxide film and somehandling scratches the elements appeared to be as fabricated. Lookingthrough the coolant channels with backlighting showed the channels to beuniform with no evidence of plate swelling or distortion. No abnormalconditions were observed.
290

Table V. Estimated Average and Peak Fuel Temperature Drops
Thickness, mm Thermal Conductivity, W/m-K
Fuel Meat (CLE-201)Fuel Meat (CLE-202)CladdingBoehmite Layer
0.74a
0.74a
0.430 - 0.025
40b
25b
130C
2.25
Temperature Drops, °C
CLE-201 CLE-202
Fuel Meat
Cladding
Boehmite25 jun thick
Water Filmd
TotalMinimum(no Boehmite)
Maximum
7.8
20.6
35.9
43.7
15.6
41.2
71.6
87.2
6.7
17.6
37.4
44.1
Average Peak Average Peak
(0.70 MW/m2) (1.40 MW/m2) (0.60 MW/m2) (1.20 MW/m2)
13.0 25.9 17.8 35.5
2.3 4.6 2.0 4.0
13.3
35.2
74.7
88.0
aHalf-thickness.bBased on assumption that U3Si2 data is valid for UA1X. See R. K.Williams, R. S. Graves, R. F. Domagala, and T. C. Wiencek, "ThermalConductivities of U3Si and U3Si-Al Dispersion Fuels," Proc. 19thInternational Conference on Thermal Conductivity, Cookeville, Tennessee,USA, October 21-23, 1985, Thermal Conductivity, Vol. 19, Ed. D. W,Yarbrough, Plenum Pub. Corp. (1988).
°See Table II.dFilm coefficient calculated using the Dittus-Boelter correlation for abulk water temperature of 53.3°C.
4.2 Dimensional Inspection
The width (between side plate outer surfaces) and stack height(between adapter plate curved surfaces) of each element were measured atthe front, center, and back at six axial locations. The measurements weremade by moving the element to given x-y coordinates between opposing dialmicrometers and comparing the readings to a standard. By comparing read-ings from the upper and lower micrometers, bow or twist could be detected.The length of each element was determined by comparison to a standard usinga fixture and a dial indicator. No unusual bow, twist, or swelling was
291

Table VI. Results of Dimensional Inspection of Irradiated Elements.
Width,mm in.
Stack Height, Length,
FabricationLimitMaximum 76.10 2.996 78.18 3.078Minimum 75.84 2.986 77.67 3.058
ElementNo.
975.1 38.390973.5 38.328
CLE-201
CLE-202
76.0175.87
75.9575.79
2.99252.9871
2.99032. 9839
78.6677.90
78.7478.00
3.09693.0668
3.10003.0710
974.4 38.362
976.1 38.429
observed for any of the elements. A summary of the dimensional measure-ments is given in Table VI. The width of CLE-202 was slightly less thanthe fabrication limit at two points near the bottom of the element, and thestack heights for both elements were slightly greater than the fabricationlimit at most points. Also, the length of CLE-202 was measured to begreater than the as-fabricated value.
4.3 Gamma Scanning of Elements
The elements were passed in front of a collimator (1.6-mm-diam x432-mm-long), and analog profiles of gamma intensity versus axial positionwere obtained, using a Nal detector, for integrated energies greater than0.5 Mev and for a narrow energy band containing the 137Cs peak, at about0.67 Mev. One spectrum covering the full energy band of fission productgamma rays was obtained with a Ge(Li) detector in order to identify thefission products contributing to the integral data. The burnup profilesindicated by the scans were similar to those of other test elements withsimilar burnup (see, for example, Appendix D of Ref. 3). These data werenot used to evaluate the element-averaged burnup and will not be discussedfurther.
4.4 Coolant Channel Measurements
Following removal of the end boxes from the elements, the coolantchannel thicknesses were measured midway between the side plates along theentire length of the channel. The measuring technique was based on capaci-tances between the plates and the probe. These data show that the channelsexceed the as-fabricated minimum dimension of 0.104 in. No comparablepreirradiation data are available to determine changes during irradiation.However, the uniformity of the channels indicates that no excessiveswelling or warping of the plates occurred.
5. EXAMINATION OF FUEL PLATES
All of the fuel plates were removed from element CLE-202 individuallyby cutting through the side plates into the coolant channels with a milling
292

machine. The strips of aluminum clinging to the fuel plate were thenpulled off easily without damaging the plate.
5.1 Visual Inspection of Plates
The first examination of the plates following removal from the elementwas verification of the plate numbers and a thorough visual inspection.The plates exhibited some warping and bowing after removal from the ele-ment. This is typical of all plates from irradiated elements. All of theplates from the element appeared to be in good condition with no evidenceof blisters, excessive swelling, or any other unusual condition.
5.2 Plate Thickness Measurements
Plate thickness was determined by positioning the plate between oppos-ing dial micrometers at the desired point of measurement and comparing thereading to a standard. The indicator tip for the top surface was a 1/4-in.(6.35-mm)-diam flat and for the bottom surface was a 1/8-in. (3.18-mm)-diamball. Measurements were made along tracks at the center of the plate andnear each edge. The accuracy of the measurements was greatest along thecenter track due to more reproducible alignment; therefore, these data wereused to estimate plate swelling. No attempt was made to remove the oxidefilm from the plates so this is included in the plate thickness. Near theend of the examinations, a new device which measures the capacitance of theair gap between two probes and the plate and compares that to a standardbecame available to measure the plate thickness. This device was used toconfirm the thicknesses of several plates.
Five plates from the element (CLE-202) were selected for measurement.Plate thickness increases were determined from the thicknesses measured ateach position by subtracting the plate thickness measured outside the fuelzone, near the end of the plate. This method at least partially correctsfor the oxide film buildup, since the normalization region also has anoxide film, though probably not as thick a one as in the fuel zone, whereheat fluxes are higher. Measurements made by CERCA were used to determinethe amount of thickness difference between unfueled and fueled positionsprior to irradiation. The average thickness changes of the five plateswere 1.6 mils (41 urn) near the low-burnup position and 1.9 mils (48 urn)near the peak burnup position. These values correspond to 2.7 and 3.2% ofthe meat thickness. The data indicate considerable variation from plate toplate; however, the largest individual measurement would correspond to aswelling of only 7%, which should cause no concern. Because of uncertain-ties in the "correction" for the oxide film and because mechanical measur-ing devices always measure between "high" points on the surfaces, themeasured thickness increases are upper limits on the actual increase.Since virtually all volume swelling in plate-type fuel occurs in the thick-ness direction, the measured thickness increases also represent upperlimits on the actual meat volume swelling.
5.3 Plate Gamma Scanning and Burnup Analysis
Five plates from the element (including the one which was analyzedlater for burnup) were selected for determination of the burnup profilealong the length by gamma scanning. Each of these plates was passed infront of a collimator (0.51-mm-high x 25.4-mm-wide x 432-mm-long), and pro-files of gamma intensity versus axial position were obtained, using a Naldetector, for integrated energies greater than 0.5 Mev and for energiescorresponding to the 137Cs peak at about 0.67 Mev. A full energy spectrumwas obtained using a Ge(Li) detector at the peak burnup point of each ofthe thirteen plates of the element. The average-to-maximum ratio from the
293

profile (Nal) measurements and the average area (Ge(Li)) of the 137Cs peaksat the maximum-burnup position of each plate were correlated with the ana-lyzed burnup at the maximum-burnup point of one plate to obtain the averageburnup of the element.
The burnup estimated by the ORR fuel management algorithm was about10% higher than the average obtained from the above analysis, consistentwith experience with other test elements. Note that the average burnup ofelement CLE-202 was intentionally pushed well beyond the approximately 50%normally achieved in reactors using this type of fuel. This resulted in apeak burnup of over 97% for the outer plate in position 1, based on themeasured burnup for the plate in position 13 and the ratio the 137Cs gammaintensities (Ge(Li)) at the peaks of the two plates. Accounting for non-235U fissions, the fission density in element CLE-202 ranged between -0.5 x1027 and l.lx 1027 f/m3.
5.4 Blister Threshold Testing
A method which has been used historically to compare the relativeirradiation performance of dispersion plate-type research reactor fuels,especially under abnormally high operating temperatures, is their resis-tance to blistering during postirradiation annealing. This "blisterthreshold test" is performed by sequentially heating the plate (or portionsthereof) to higher and higher temperatures and visually examining the plateafter each heating for evidence of blisters. Two plates (from positions 2and 6) of the element were blister threshold tested. The entire plate washeated to preclude the possibility of fission gas diffusing out of theplate rather than causing blisters at these relatively high volume frac-tions of fuel. The plates were held at the following temperatures for 30minutes, removed from the furnace and cooled and examined, then heated tothe next higher temperature (or removed from testing if blistering wasobserved): 400, 450, 475, 500, 525, 550, and 575°C. This correspondsclosely to the testing done previously on highly enriched, low-volume-fraction oxide and aluminide fuels for which the current fuels are beingconsidered as replacements. Typical blister threshold temperatures for thehighly enriched uranium aluminide fuels in use today range from 480 to>565°C.6 Helium gas from the 10B(n,a) reaction in many of the ATR-typesamples listed in Ref. 6 is believed to be responsible for some blistertemperatures being lower than 550°C. Hofman7 found that the presence of10B in the fuel meat of uranium suicide dispersion fuel plates resulted inlowering of the blister threshold temperature by ~100°C.
No typical postirradiation blisters (small isolated blisters betweenthe meat and the cladding) were found on the two plates even after the575°C heating. However, small blisters formed near the ends of both platesover the non-fueled regions. These small blisters started during the 450°Cheating for the position-2 plate and during the 475°C heating for theposition-6 plate. The appearance of these blisters is illustrated in Fig.3. Blisters such as this have been previously found8 to be due to fuelflaking (individual particles of fuel between the frame and cladding in thenonfuel zone at the end of the plate). More recently it has been estab-lished7 that blisters tend to form first where fuel particles have beenoxidized (for instance, during preheating before the first hot-rollingpass). It is highly likely that the fuel flakes near the ends of theseUA1X plates had been oxidized during fabrication. This flaking did notappear to effect the performance of the fuel during irradiation.
We conclude that the blister threshold temperature for the low-enriched, higher-loaded aluminide fuels is about the same as for the high-
294

Fig. 3. Blisters over Nonfuel Region of Plate 020V2040, Element CLE-202,After Annealing at 475°C. (R79723)
enriched, lower-loaded aluminide fuels they are proposed to replace. Fromthis testing we infer that the probability for a fuel plate to blister overthe fuel zone in-reactor will not be increased by switching to thesehigher-density, low-enriched UA1X fuels.
5.5 Metallography
Plate 020V2034 (the bottom fuel plate, position 13) from elementCLE-202 was sectioned for destructive examination. The burnup analysissections were taken from the minimum and maximum burnup areas of the plateas determined by the gamma scan profile. Metallography sections werelocated immediately adjacent to the burnup analysis sections.
The metallography sections were prepared for viewing (transverse tothe length direction of the plate) using conventional techniques. Thesection was mounted in epoxy, ground on progressively finer silicon carbidepaper through 600 grit, then vibratorily polished. The vibratory polishingwas a three step process. The first and second steps were on a Texmet*cloth with a water medium and 3-jjm and l-|im diamond paste, respectively.The final polish was on Microcloth* with a thick water slurry of Magomet*for 12 minutes.
The microstructure at the top of the plate where the burnup level is53.5% is shown in Figs. 4 and 5. The fuel (darker gray area) is now thecontinuous phase after its volume growth both by swelling and reaction withthe aluminum matrix (UAl-j transforms to UA14). The aluminum phase remain-ing is discontinuous and is seen as the lighter gray constituent. Theblack areas are voids (now probably containing some fission gas) which areremnants of the voids introduced during fabrication. The microstructure
*Texmet, Microcloth, and Magomet are trademarks of Buehler, Ltd.
295
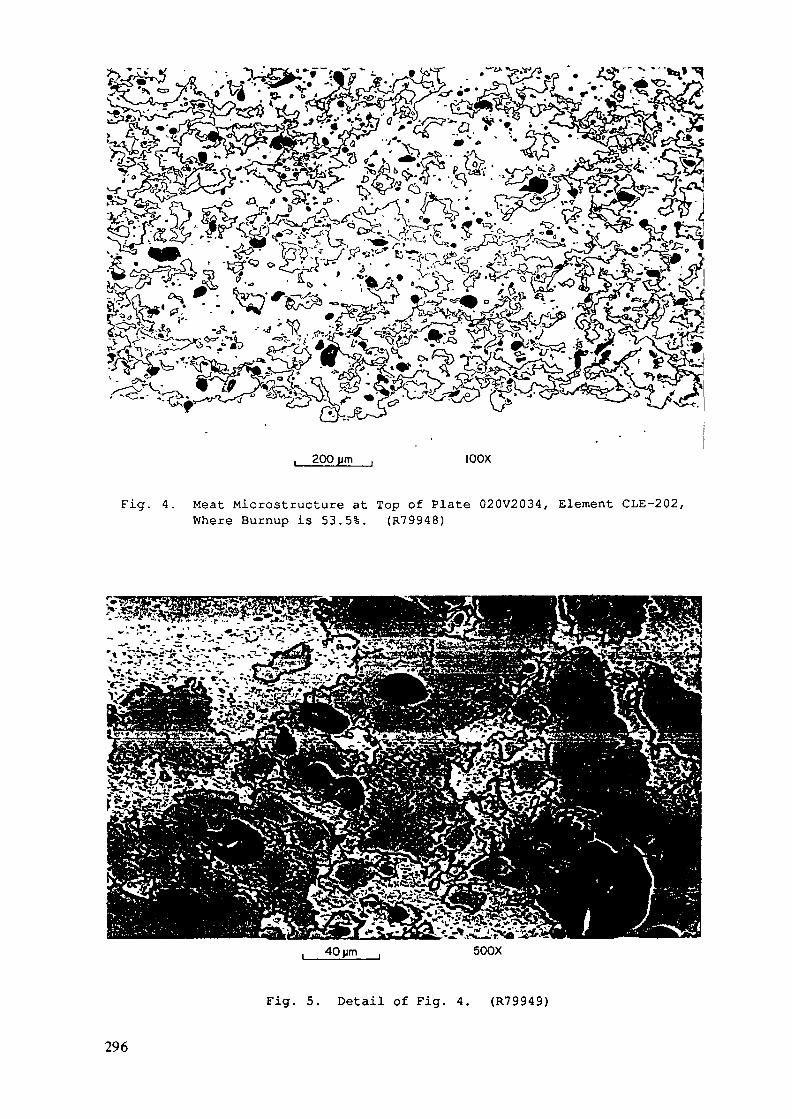
x «=>J&"*:'"+&^
r^- ^sfe.«
Pts$i.*«?7-' 'r%t? 0 -I<
T-
m\=,*'*
4À iv
>-7^-U^
, 200pm IOOX
Fig. 4. Meat Microstructure at Top of Plate 020V2034, Element CLE-202,Where Burnup is 53.5%. (R79948)
40 p 500X
Fig. 5. Detail of Fig. 4. (R79949)
296
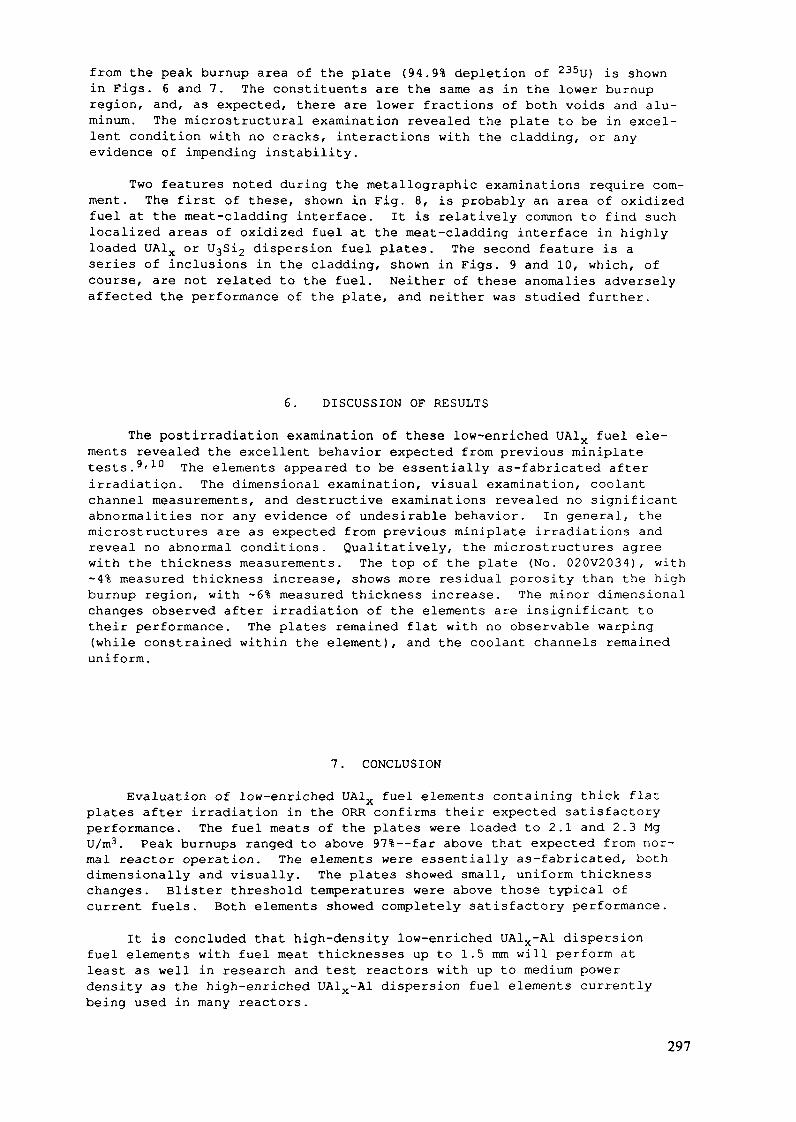
from the peak burnup area of the plate (94.9% depletion of 235U) is shownin Figs. 6 and 7. The constituents are the same as in the lower burnupregion, and, as expected, there are lower fractions of both voids and alu-minum. The microstructural examination revealed the plate to be in excel-lent condition with no cracks, interactions with the cladding, or anyevidence of impending instability.
Two features noted during the metallographic examinations require com-ment. The first of these, shown in Fig. 8, is probably an area of oxidizedfuel at the meat-cladding interface. It is relatively common to find suchlocalized areas of oxidized fuel at the meat-cladding interface in highlyloaded UA1X or U3Si2 dispersion fuel plates. The second feature is aseries of inclusions in the cladding, shown in Figs. 9 and 10, which, ofcourse, are not related to the fuel. Neither of these anomalies adverselyaffected the performance of the plate, and neither was studied further.
6. DISCUSSION OF RESULTS
The postirradiation examination of these low-enriched UA1X fuel ele-ments revealed the excellent behavior expected from previous miniplatetests. 9rlO The elements appeared to be essentially as-fabricated afterirradiation. The dimensional examination, visual examination, coolantchannel measurements, and destructive examinations revealed no significantabnormalities nor any evidence of undesirable behavior. In general, themicrostructures are as expected from previous miniplate irradiations andreveal no abnormal conditions. Qualitatively, the microstructures agreewith the thickness measurements. The top of the plate (No. 020V2034), with~4% measured thickness increase, shows more residual porosity than the highburnup region, with ~6% measured thickness increase. The minor dimensionalchanges observed after irradiation of the elements are insignificant totheir performance. The plates remained flat with no observable warping(while constrained within the element), and the coolant channels remaineduniform.
7. CONCLUSION
Evaluation of low-enriched UA1X fuel elements containing thick flatplates after irradiation in the ORR confirms their expected satisfactoryperformance. The fuel meats of the plates were loaded to 2.1 and 2.3 MgU/m3. Peak burnups ranged to above 97% — far above that expected from nor-mal reactor operation. The elements were essentially as-fabricated, bothdimensionally and visually. The plates showed small, uniform thicknesschanges. Blister threshold temperatures were above those typical ofcurrent fuels. Both elements showed completely satisfactory performance.
It is concluded that high-density low-enriched UA1X-A1 dispersionfuel elements with fuel meat thicknesses up to 1.5 mm will perform atleast as well in research and test reactors with up to medium powerdensity as the high-enriched UA1X-A1 dispersion fuel elements currentlybeing used in many reactors.
297

• • *<& ' < ? S?;S> .
200 um IOOX
Fig. 6. Méat Microstructure at Peak Burnup Region of Plate 020V2034,Element CLE-202, Where Burnup is 94.9%. (R79952)
-* "••.**. v .. ".; v \;j
40pm 500X
Fig. 7. Detail of Fig. 6. (R79953)
298

-"»
40pm 500X
Fig. 8. Area of Probable Oxidation of UAlx at Meat-Cladding Interface inPeak Burnup Section of Plate 020V2034, Element CLE-202. (R79954)
200pm IOOXFig. 9. Inclusion in Cladding in Section from Top of
Plate 020V2034, Element CLE-202. (R79950)
299

40 pm , 500X
Fig. 10. Detail of Fig. 9. (R79951)
ACKNOWLEDGMENT S
Many persons made important contributions to the work reported here inthe years involved in planning and performing the work and analyzing theresults. The authors especially acknowledge the contributions of personnelassociated with the ORR and the HRLEL at ORNL. Particular thanks areextended to R. W. Hobbs for his assistance in obtaining safety approval forthe irradiations, to E. D. Clemmer for assistance during the irradiations,and to L. G. Shrader for assistance in following the progress of the hotcell examinations.
REFERENCES
A. Travelli, "Current Status of the RERTR Program," Proc. Int. Mtg. onDevelopment, Fabrication and Application of Reduced Enrichment Fuelsfor Research and Test Reactors, Argonne Illinois, November 12-14,1980, Argonne National Laboratory Report ANL/RERTR/TM-3 (CONF-801144),pp. 3-13 (1983) .
J. L Snelgrove, G. L. Hofman, and G. L. Copeland, "IrradiationPerformance of Reduced-Enrichment Fuels Tested Under the U.S. RERTRProgram," Reduced Enrichment for Research and Test Reactors--Proceedings of an International Meeting, Petten, The Netherlands,October 14-16, 1985, P. von der Hardt and A. Travelli, Eds., D. ReidelPublishing Company, Dordrect, pp. 59-68 (1986).
G. L. Copeland, R. W. Hobbs, G. L. Hofman, and J. L. Snelgrove,"Performance of Low-Enriched U3Si2-Aluminum Dispersion Fuel Elementsin the Oak Ridge Research Reactor," Argonne National Laboratory ReportANL/RERTR/TM-10 (October 1987)
300
4. J. L. Snelgrove, R. F. Domagala, G. L. Hofman, T. C. Wiencek,G. L. Copeland, R. W. Hobbs, and R. L. Senn, "The Use of U3Si2Dispersed in Aluminum in Plate-Type Fuel Elements for Research andTest Reactors," Argonne National Laboratory Report ANL/RERTR/TM-11(October 1987) .
5. H. Pruimboom, E. Lijbrink, K. van Otterdijk, and R. J. Swanenburg deVeye, "Status Report on thé Irradiation Testing and Post-IrradiationExamination of Low-Enriched U308-A1 and UA1X-A1 Fuel Elements by theNetherlands Energy Research Foundation (ECN) , " Proc. Int. Mtg. onReduced Enrichment for Research and Test Reactors, 24-27 October,1983. Tokai, Japan, Japan Atomic Energy Research Institute ReportJAERI-M 84-073, pp. 148-202 (May 1984) .
6. J. M. Beeston, R. R. Bobbins, G. W. Gibson, and W. C. Francis,"Development and Irradiation Performance of Uranium Aluminide Fuels inTest Reactors," Nucl. Tech. 49, 136-149 (June 1980).
7. G. L. Hofman, "Some Recent Observations on the Irradiation Behavior ofUranium Suicide Dispersion Fuel," Proc. 1988 Int. Mtg. on ReducedEnrichment for Research and Test Reactors, September 19-22, 1988, SanDiego, California, Argonne National Laboratory Report ANL/RERTR/TM-13(CONF 8809221), in press.
8. G. L. Copeland, G. L. Hofman, and J. L. Snelgrove, "IrradiationPerformance of Low-Enriched Fuel Elements," Proc. 1984 Int. Mtg. onReduced Enrichment for Research and Test Reactors, October 15-18,1984. Argonne, Illinois, Argonne National Laboratory ReportANL/RERTR/TM-6 (CONF-8410173), pp. 152-166.
9. J. L. Snelgrove, R. F. Domagala, T. C. Wiencek, and G. L. Copeland,"Fuel Development Activities of the U.S. RERTR Program," Proc. Int.Mtg. on Reduced Enrichment for Research and Test Reactors, 24-27October, 1983, Tokai, Japan, Japan Atomic Energy Research InstituteReport JAERI-M 84-073, pp. 34-42 (May 1984) .
10. E. Pérez, C. Kohut, D. Giorsetti, G. Copeland, and J. Snelgrove,"Irradiation Performance on CNEA UA1X and U3O8 Miniplates," Proc. Int.Mtg. on Reduced Enrichment for Research and Test Reactors, 24-27October, 1983, Tokai, Japan, Japan Atomic Energy Research InstituteReport JAERI-M 84-073, pp. 67-76 (May 1984) .
301

Appendix J-4.1.2Part m
EXAMINATION OF U3SirAl FUEL ELEMENTSFROM THE OAK RIDGE RESEARCH REACTOR
G.L. COPELANDOak Ridge National Laboratory,Oak Ridge, Tennessee
G.L. HOFMAN, J.L. SNELGROVEArgonne National Laboratory,Argonne, Illinois
United States of America
Abstract
The results of postirradiation examination of low-enriched UoSi- fuel elements from the Oak Ridge ResearchReactor are presented. The elements replaced standardhighly-enriched elements and were handled routinely exceptthat the burnup of three of the elements was extendedbeyond normal limits—up to about 98% peak. The elementswere manufactured by commercial fuel suppliers. The per-formance of all elements was completely satisfactory.
INTRODUCTION
This paper presents the results of the irradiation of low-enriched U^Siofuel elements in the Oak Ridge Research Reactor (ORR). The purpose of thetest irradiations was to confirm the expected good performance of these ele-ments in a medium-powered research reactor under typical operating conditionsto burnups in excess of those normally achieved. This expectation of goodperformance was based on miniplate irradiations at even higher fuel concen-trations and burnups.1 3 Six experimental elements, two from each of thecommercial manufacturers of UoSio fuel, were irradiated. One element fromeach manufacturer was irradiated to normal burnup (~50% average) and one wasIrradiated well beyond this point (~75% average). Postirradiation examination(PIE) of the six elements has been completed with completely satisfactoryresults for all.
ELEMENT DESCRIPTION
The experimental elements were designed to replace a standard ORR ele-ment. The box-type standard element contains 19 curved fuel plates and atotal of 285 g of 235U (highly enriched) as U^Oo dispersed in aluminum. Thenominal plate thickness is 1.27 mm (0.050 in.) with a 0.51-mm (0.020-in.) fuelmeat. The experimental elements were physically identical but contained a totalof 340 g of 235U (19.7 to 19.8% enriched) as U3Si2 dispersed in aluminum.
303

The additional 235U more than compensates the neutronic poisoning of theadditional 238U. This loading requires 4.8 Mg/m3 of uranium in the fuel meat(about 43 vol% U^Si«)« Two elements were fabricated by each of three commer-cial research reactor fuel element suppliers. The fuel fabricators were Babcockand Wilcox in the United States, Compagnie pour l'Etude et la Realisation deCombustibles Atomiques (CERCA) in France, and NUKEM in the Federal Republic ofGermany. The elements have been treated routinely for fuel shuffling. One ofthe elements from each manufacturer was irradiated to ~50% depletion of theoriginally contained 235U (normal burnup), and one was irradiated to a burnup of~75% (substantially higher than would be achieved in normal reactor operation).
POSTIRRADIATION EXAMINATION PROCEDURES
Postirradiation examinations of these elements were conducted at theHigh-Radiation-Level Examination Laboratory (HRLEL) at ORNL with the excep-tions of scanning electron microscopy and some metallography, which wereperformed at Argonne National Laboratory. Since the irradiations of full-sized elements are meant to be confirmatory in nature rather than to providebasic irradiation behavior data for the fuel, the emphasis of the PIE is onchecking the dimensional stability of the element and plates, on measuring theblister-threshold temperatures and burnup levels, and on performing limitedmetallography. A summary of the PIE steps has been published previously.1*Each of these elements was given a full destructive examination.
RESULTS
Postirradiation results confirm the completely satisfactory performanceof all elements.
Element Visual and Dimensional InspectionA careful visual examination of each element revealed no abnormal
features. The elements appeared to be essentially as-fabricated with theexception of the normal corrosion film and scuff marks from handling.Measurements for length, width, crown height, twist, and bow revealed nosignificant changes. The element dimensions were essentially within theoriginal fabrication specification envelope.
Channel Spacing MeasurementsEach water channel was measured in two locations for the full length of
the element. These measurements showed the channels to meet the minimumfabrication specification in each case. The channels were generally uniformwith no abnormalities noted.
Plate Visual InspectionAfter removing the plates from the elements, they were given a careful
visual examination. The plates were bowed and warped to some extent aftertheir removal from the element. The plates appeared to be in excellentcondition with a uniform corrosion film over the meat and no apparentblisters, unusual swelling, or other defects.
304

Plate Thickness Measurements and Burnup AnalysisSelected plates from each element were measured in 24 locations for
thickness change. In order to approximately account for effects of platecurvature on the thickness measurement and for the buildup of the oxide layeron the plate surfaces, thickness changes were computed relative to the platethickness measured outside of the fuel zone, rather than relative to preirra-diation measurements on flat plates. Due to warping, bowing, and other localsurface irregularities, volumetric swellings of the fuel meat calculated fromthickness changes are always larger than the actual volumetric swelling. Thisfact must be kept in mind if one should compare the swelling of these platesto the accurately measured swelling of similar miniplates. Average thicknessincreases (based on five plates) are shown in Table 1 and indicate uniform,low swelling for all elements. The data are separated into the low burnupregion (the top two inches of the fuel zone) and the peak burnup region (aboutten inches from the bottom of the fuel zone) and show the effect of burnup.The 235U burnup (depletion) was determined at the peak and minimum points ofone plate using 235U isotopic ratios measured before and after irradiation bymass spectroraetry and calculated correction factors to account for the buildupor depletion of the other uranium isotopes. The burnup data listed in Table 1were obtained by averaging the 137Cs gamma scan counts for the appropriateplate regions or for all of the plates and normalizing to the measured peakburnup.
The plate thickness changes also correlate with the amount of preirradia-tion voids (i.e., the onset of swelling is delayed by fabrication-inducedporosity) and with the phases present (as discussed below in the metallographysection). No unusual swelling was detected, indicating that there were noblisters or other indications of the onset of rapid swelling.
Table 1. Average Thickness Increase and BurnupLow Burnup Region Peak
ThicknessElementNo.
BSI-201BSI-202CSI-201CSI-202NSI-201NSI-202
Burnup(%)
285332551953
Increase(mils)
0.00.00.10.90.71.2
(ym)
003231830
Burnup(*)
699766984698
Burnup RegionThicknessIncrease(mils)
1.51.81.74.41.04.1
(pm)
38464311225104
ElementAverageBurnup(Z)
547752823582
Blister Annealing
Blister annealing of selected plates from each element was accomplishedby heating the plates singly in a tube furnace. The furnace was able tomaintain a uniform maximun-temperature zone about seven inches long in themaximum burnup region of the plate. Temperatures decreased toward the ends ofthe plate by up to 10°C. The plates were sequentially heated for 30 minutesat 400, 450, 475, 500, 525, 550, and 575°C or until blisters were observed.The plates were cooled and visually examined for blisters between each heatingcycle. The plates, their maximum heating temperature (blister thresholdtemperature), and the type of blisters observed are listed in Table 2.
305
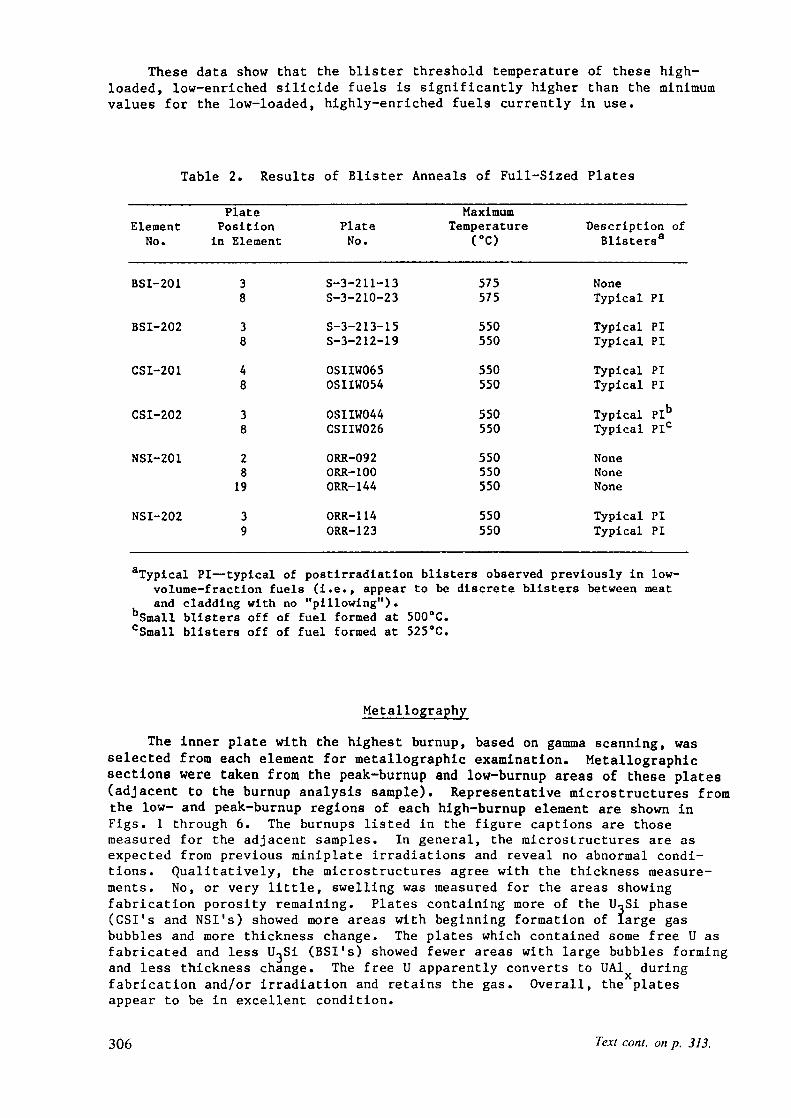
These data show that the blister threshold temperature of these high-loaded, low-enriched suicide fuels is significantly higher than the minimumvalues for the low-loaded, highly-enriched fuels currently in use.
Table 2. Results of Blister Anneals of Full-Sized Plates
ElementNo.
BSI-201
BSI-202
CSI-201
CSI-202
NSI-201
NSI-202
PlatePositionin Element
38384838281939
PlateNo.
S-3-211-13S-3-210-23S-3-213-15S-3-212-19
OSIIW065OSIIW054OSIIW044CSIIW026ORR-092ORR-100ORR-144
ORR-114ORR-123
MaximumTemperature
(°C)
575575550550550550550550550550550550550
Description ofBlisters8
NoneTypical PITypical PITypical PITypical PITypical PITypical PIbTypical PIC
NoneNoneNone
Typical PITypical PI
aTypical PI—typical of postirradiation blisters observed previously in low-volume-fraction fuels (i.e., appear to be discrete blisters between meatand cladding with no "pillowing")«
bSmall blisters off of fuel formed at 500°C.GSmall blisters off of fuel formed at 525°C.
MetallographyThe inner plate with the highest burnup, based on gamma scanning, was
selected from each element for metallographic examination. Metallographiesections were taken from the peak-burnup and low-burnup areas of these plates(adjacent to the burnup analysis sample). Representative microstructures fromthe low- and peak-burnup regions of each high-burnup element are shown inFigs. 1 through 6. The burnups listed in the figure captions are thosemeasured for the adjacent samples. In general, the microstructures are asexpected from previous rainiplate irradiations and reveal no abnormal condi-tions. Qualitatively, the microstructures agree with the thickness measure-ments. No, or very little, swelling was measured for the areas showingfabrication porosity remaining. Plates containing more of the U^Si phase(CSI's and NSI's) showed more areas with beginning formation of large gasbubbles and more thickness change. The plates which contained some free U asfabricated and less UoSi (BSI's) showed fewer areas with large bubbles formingand less thickness change. The free U apparently converts to UA1 duringfabrication and/or irradiation and retains the gas. Overall, the platesappear to be in excellent condition.
306 Text cont. on p. 313.

•2 4te3^& . - . • . " • " • . . •^o-
200 pm
rv ri ^ 'f.v'./H, £WJ; \;^ rt
v A .« tr v4 :Acfe| -o -v ep •U3x. 7 * » y£ < iFig. 1. Microstructure of BSI-202 at 51% burnup showing fabrication
porosity remaining and small gas bubbles. (R79963 top and R79964 bottom).
307

n-. •*"v.. l
T. •••
V < vJ>rv.3fc i - ^ - ^e : 5> c-i -- gg iftCI -SgUïV.4»!
40 pm
Fig. 2. Microstructure of BSI-202 at 977, burnup showing no fabricationporosity and beginning formation of large gas bubbles in some areas. (R79965top and R79966 bottom).
308
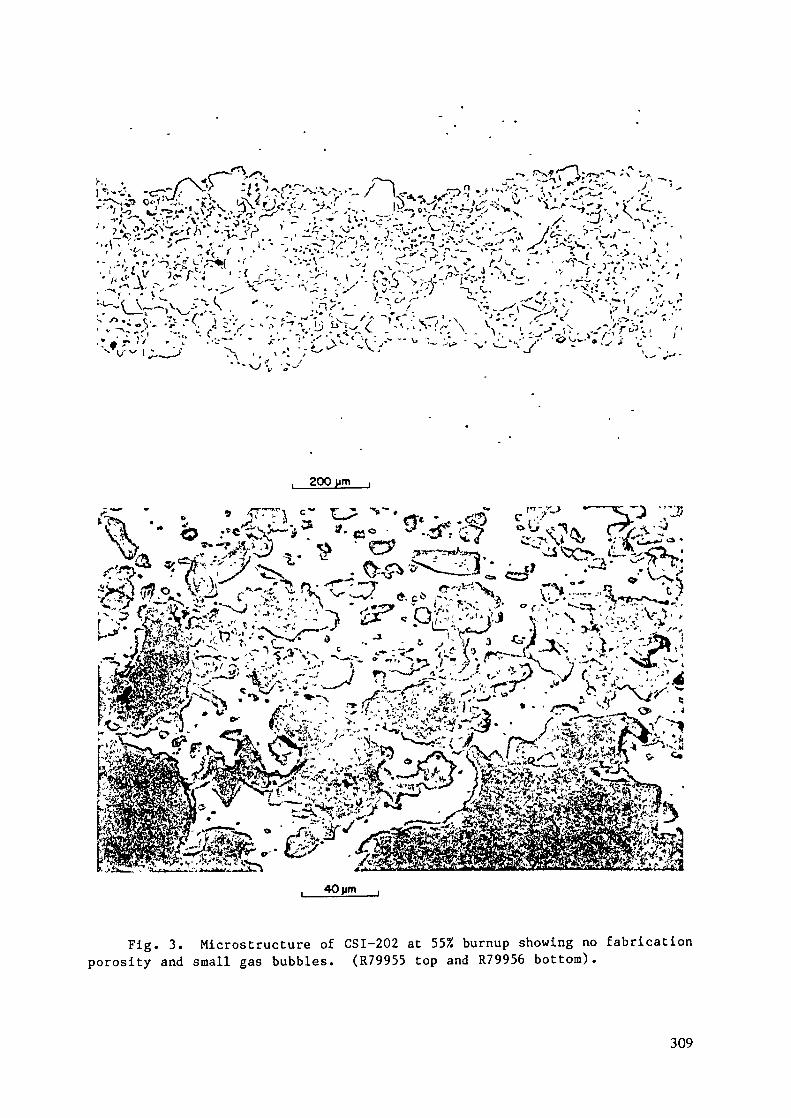
•-.;,^H«-v**[ •'• ,/o.vV '--.; ^^O^v^s •- •/-K-- V.Vvi.v•--,<;*y v/-!•; • :'_£>.- <.;>', t ,-; <\e:;- A'~^¥-- • -v-- -^ -"•?('•• • '• '.-r.-A-r"" -->- v^-^j:-. v- \^ ^^) • s.^, - ,;/-^x'v.;.- -:^^_\_> .--k, -v ff,?-. - <-'\<T' ^^,<^V ^•*'71i /.-^ ts'^ir^ V.^r->v/ - --v-'TV^r//-^'-^'^, t--:-1-' x^^ W--; î;. v -c .v, - 'r_. • vc r« -- / - - - \ r . \- u ? .•;-<, <1 . - ' • - • >-- ! r, \ S . - •« . . -s ',>. V-.'X> "'J - '. r » r ' V -.7 '^- ' - *'\-\'X'S*"\:'"'-* - --vvL-y^ ^^-6i ;r.N \ r w I ** J ^^ f \ * T —^ ' *-* ^V l ^"».^r,,*** - \ ' . * * / V^-1 _/•"
"-^1 V-'
200 pm ,
fi "•- k .!e*sPi=" Var"'9*.rf:v!f ' oa""?\ îr^v'^ F 4- ^^«ir ^'7J/-tx . 0^*^-^3^i-i' . •~4
»015<ta c l. '-p. «... ,sr^X î?.;-'^ fejfe-?^; ;:^- v:S OP- . o£: '--p -p.- N n '• lLJST* «--¥l^¥-- - t-iW'^C^V—"^ t_t«„c^/ 4 ' . ' . '>^ ;Vr* t J5«'CR>' y, / V3 *- «>~-N^Î ^ -a , < _ \ r » f-f „ - V .. •ije£s'Sfr<^ • *.-.-iw. « - ...^& x *y s -L. « .Jk\ -il.-
Fig. 3. Microstructure of CSI-202 at 55% burnup showing no fabricationporosity and small gas bubbles. (R79955 top and R79956 bottom).
309

20O urn
40pm
Fig. 4. Microstructure of CSI-202 at 97% burnup showing no fabricationporosity and early stage of linking of gas bubbles in some areas. (R79957 topand R79958 bottom).
310

i 200 pm ,
40pm
Fig. 5. Microstructure of NSI-202 at 54% burnup showing fabricationporosity remaining and small gas bubbles. (R79559 top and R79558 bottom).
311

200 pm
Fig. 6. Microstructure of NSI-202 at 96% burnup showing no fabricationporosity remaining and formation of large gas bubbles. (R79564 top and R79565bottom).
312
CONCLUSION
Postirradiation evaluation of low-enriched U^Si- fuel elements from theORR confirmed their expected satisfactory performance in this medium-poweredresearch reactor. Peak burnups ranged up to 98%—far above that expected fromnormal reactor operation. The elements were essentially as-fabricated, bothdimensionally and visually. The plates showed small, uniform thicknesschanges. Blister threshold temperatures were above those typical of currentfuels. Both elements from each manufacturer showed completely satisfactoryperformance.
REFERENCES
1. G. L. Hof man and L. A. Neimark, "Irradiation Behavior of Uranium-SuicideDispersion Fuels," Proceedings of the International Meeting of ReducedEnrichment for Research and Test Reactors, 24-27 October 1983, Tokai,Japan, JAERI-M 84-073, pp.43-53 (May 1984).
2. J. L. Snelgrove, G. L. Hofraan, and G. L. Copeland, "IrradiationPerformance of Reduced-Enrichment Fuels Tested Under the U. S. RERTRProgram," Reduced Enrichment for Research and Test Reactors, Proceedingsof an International Meeting, Petten, The Netherlands, October 14-16, 1985,P. von der Hardt and A. Travelli, Eds., D. Reidel, Dordrecht, pp. 59-68(1986).
3. G. L. Hofman and L. A. Neimark, "Postirradiation Analysis of ExperimentalUranium-Suicide Dispersion Fuel Plates," Proceedings of the 1984International Meeting on Reduced Enrichment for Research and TestReactors, Argonne, Illinois, October 15-18, 1984, ANL/RERTR/TM-6, CONF-8410173, pp. 75-85, (July 1985).
4. G. L. Copeland, G. L. Hofman, and J. L. Snelgrove, "IrradiationPerformance of Low-Enriched Uranium Fuel Elements," Proceedings of the1984 International Meeting on Reduced Enrichment for Research and TestReactors, Argonne, Illinois, October 15-18, 1984, ANL/RERTR/TM-6, CONF-8410173, pp. 152-166, (July 1985).
313

Appendix J-4.2
LEU AND MEU FUEL TESTING IN CEA REACTORS
C. BAAS*, M. BARNIER**, J.P. BEYLOT**,P. MARTEL*, F. MERCHIE*
*Centre d'études nucléaires de Grenoble,Commissariat à l'énergie atomique,Grenoble
*!)Centre d'études nucléaires de Saclay,Commissariat à l'énergie atomique,Gif-sur-Yvette
France
Abstract
The progress achieved in the qualification of LEU andMEU fuels in the SILOE reactor and LEU fuel in theOSIRIS reactor is presented. This program, whichbegan in the SILOE reactor in 1980 involvesirradiation of a complete UA1 element with 45%enriched uranium and 2.2 g U/cm3, full-sized plateswith LEU UßSi and U3&i2 fuels, and complete elementswith LEU loadings of 6.0 g U/cm3 with Si and 5.2 gU/cm3 with U3Si2. Periodical examinations werecarried out during irradiation, in particular platethickness and water channel width measurements.Finally, the characteristics and status of a mixedU3Si-U3Si2 element under irradiation in the OSIRISreactor is presented.
1. GENERAL OUTLINES OF THE PROGRAM
Irradiation testing of LEU and MEU research reactor fuels began inthe SILOE reactor in 1980 within the framework of agreements concludedbetween the CEA, ANL, and CERCA as part of the Reduced EnrichmentResearch and Test Reactor (RERTR) Program. Also as part of this program,irradiation testing of LEU suicide fuel began in the OSIRIS reactor in1986.
The program is comprised of essentially three phases aimed atqualification of reduced enrichment fuels manufactured by CERCA.
The first phase, completed in 1983, involved irradiation in SILOEand post-irradiation-examination at Saclay of a complete fuel elementcontaining UAlx fuel with a uranium density of 2.2 g/cm3.
The second phase began in June 1982 and involved irradiation inSILOE of 4 U3Si fuel plates with LEU densities of 5.5 g/cm3 and 6.0 g/cm3using a special casing located in the reactor reflector. The intentionwas to examine the behaviour of these separate plates before irradiationtesting of a complete fuel element. Similarly, 4 separate U3Si2 plates
315
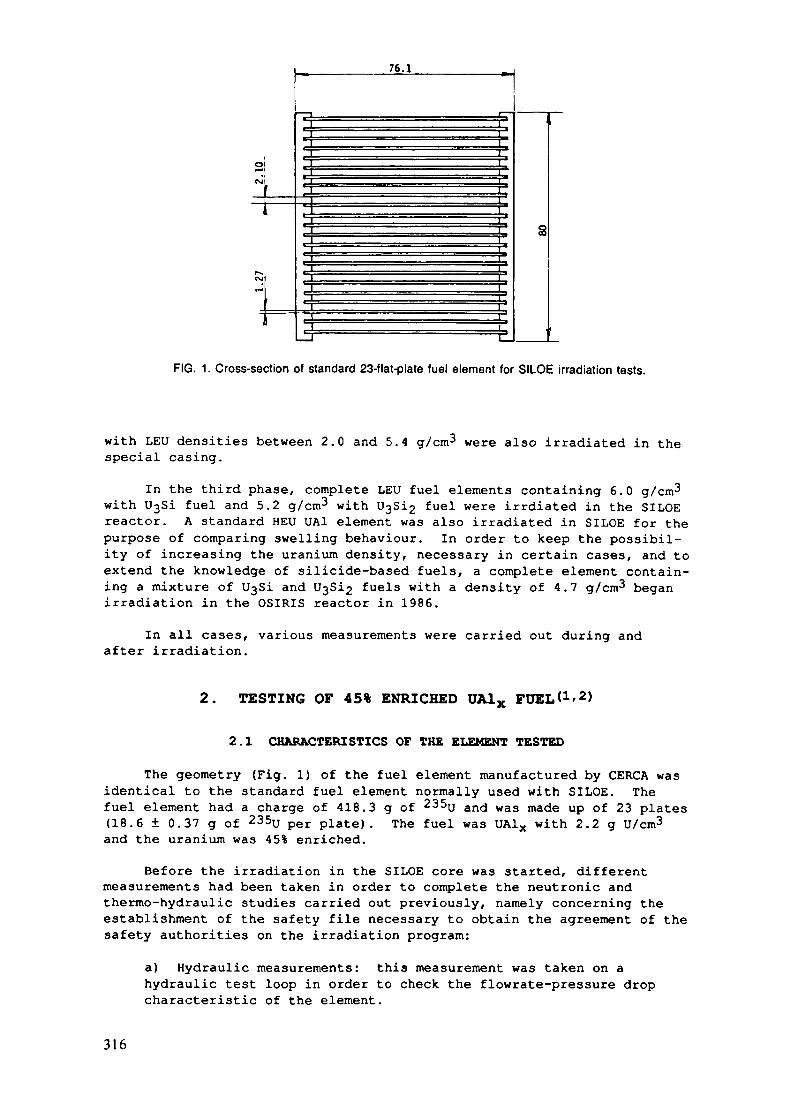
76.1
3
FIG. 1. Cross-section of standard 23-flat-plate fuel element for SILOE irradiation tests.
with LEU densities between 2.0 and 5.4 g/cm3 were also irradiated in thespecial casing.
In the third phase, complete LEU fuel elements containing 6.0 g/cm3with U3Si fuel and 5.2 g/cm3 with U3Si2 fuel were irrdiated in the SILOEreactor. A standard HEU UAl element was also irradiated in SILOE for thepurpose of comparing swelling behaviour. In order to keep the possibil-ity of increasing the uranium density, necessary in certain cases, and toextend the knowledge of silicide-based fuels, a complete element contain-ing a mixture of U3Si and U3Si2 fuels with a density of 4.7 g/cm3 beganirradiation in the OSIRIS reactor in 1986.
In all cases, various measurements were carried out during andafter irradiation.
2. TESTING OF 45% ENRICHED UA1X FUEL«1'2)
2.1 CHARACTERISTICS OF THE ELEMENT TESTED
The geometry (Fig. 1) of the fuel element manufactured by CERCA wasidentical to the standard fuel element normally used with SILOE. Thefuel element had a charge of 418.3 g of 235y and was made up of 23 plates(18.6 ± 0.37 g of 235U per plate),and the uranium was 45% enriched.
The fuel was UA1X with 2.2 g U/cm3
Before the irradiation in the SILOE core was started, differentmeasurements had been taken in order to complete the neutronic andthermo-hydraulic studies carried out previously, namely concerning theestablishment of the safety file necessary to obtain the agreement of thesafety authorities on the irradiation program:
a) Hydraulic measurements: this measurement was taken on ahydraulic test loop in order to check the flowrate-pressure dropcharacteristic of the element.
316
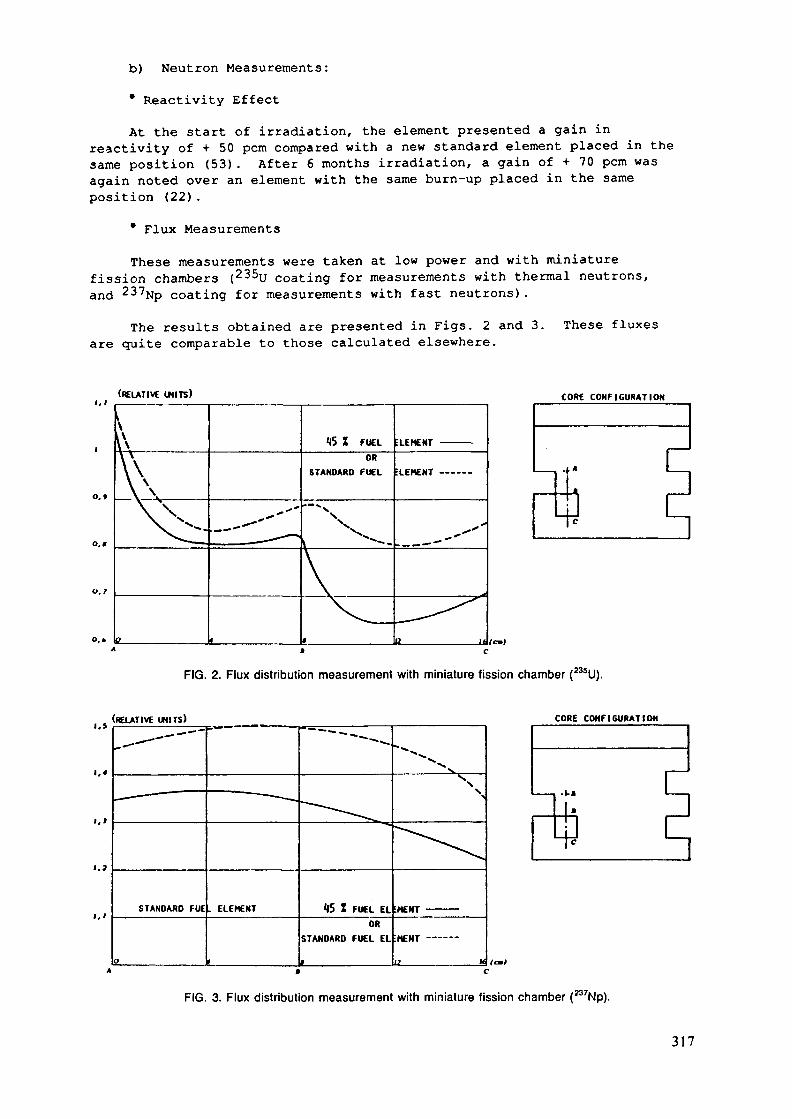
b) Neutron Measurements:
* Reactivity Effect
At the start of irradiation, the element presented a gain inreactivity of + 50 pcm compared with a new standard element placed in thesame position (53). After 6 months irradiation, a gain of + 70 pcm wasagain noted over an element with the same burn-up placed in the sameposition (22).
* Flux Measurements
These measurements were taken at low power and with miniaturefission chambers (235U coating for measurements with thermal neutrons,and 237Np coating for measurements with fast neutrons).
The results obtained are presented in Figs. 2 and 3. These fluxesare quite comparable to those calculated elsewhere.
(RELATIVE UNITS) CORE CONFIGURATION
-f*
—h
FIG. 2. Flux distribution measurement with miniature fission chamber (235U).
(RELATIVE UNITS) CORE CONFIGURAT 10«
----""""
STANDARD FUE
o l
»««. ^-""*~~*^
---^
US 1 FUEL ELOR
STANDARD FUEL EL
•
~\N
^\
>ncn •
:MEHT ———
a u
-I-A
FIG. 3. Flux distribution measurement with miniature fission chamber (W7Np).
317
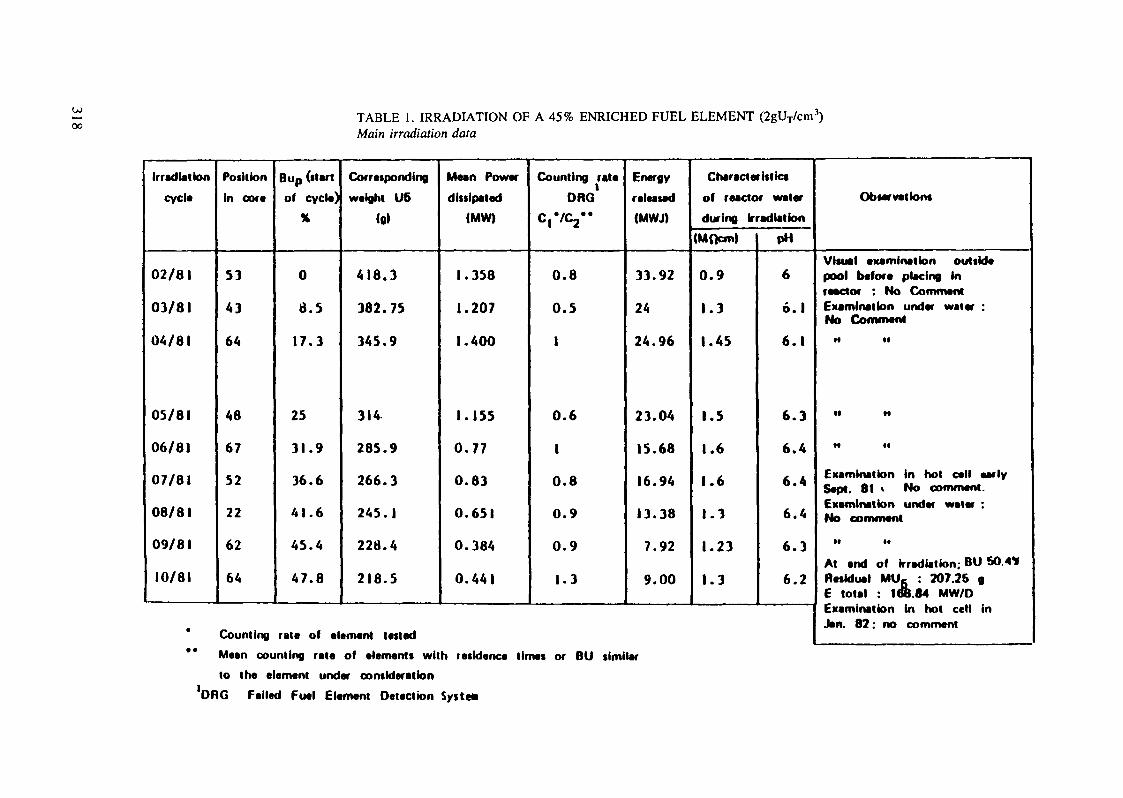
ooTABLE 1. IRRADIATION OF A 45% ENRICHED FUEL ELEMENT (2gUT/cm3)Main irradiation data
Irradiationcycla
02/81
03/81
04/81
OS/81
06/81
07/81
08/81
09/81
10/81
Position
in oora
53
43
64
48
67
52
22
62
64
B up («tartof cycla)
%
0
8.5
17.3
25
31.9
36.6
41.6
45.4
47.8
Correspondingweight US
<Q>
418.3
382.75
345.9
314
285.9
266.3
245.1
228.4
218.5
Maan Powerdissipated
(MW)
1.358
1.207
1.400
1.155
0.77
0.83
0.651
0.384
0.441
Counting rataDRQ
c,vc2"
0.8
0.5
1
0.6
1
0.8
0.9
0.9
1.3
Energy
raleasad
(MWJ)
33.92
24
24.96
23.04
15.68
16.94
13.38
7.92
9.00
Characteristics
of reactor water
during Irradiation(Mficm)
0.9
1.3
1.45
1.5
1.6
1.6
1.1
1.23
1.3
PH
6
6.1
6.1
6.3
6.4
6.4
6.4
6.3
6.2
Counting rat« of clamant tatted
Observations
Visual examination outsidepool before placing Inreactor : No CommentExamination under water :No Comment
M •(
tf II
II II
Examination in hot cell earlySept. 81 t No comment.Examination under water :No comment
n ii
At end of irradiation; BU SO.«*Residual MUfi : 207.26 gE total : 168.64 MW/DExamination in hot cell inJan. 82: no comment
Mean counting rate of elements with residence times or BU similarto the element under consideration
'DBG Failed Fuel Element Detection Systea

2.2 IRRADIATION CONDITIONS
The element for testing was placed in the SILOE reactor core onFebruary 2, 1981 and its irradiation was terminated on November 26, 1981.The fuel element stayed in the core in different positions for 9 cycles.The main irradiation data are presented in Table 1.
Between the cycles, the fuel element was submitted to:
a visual inspection under water or in the reactor hot cell
a DRG test of the cladding (DRG: Fuel cladding failuredetection system).
It is worth noting that from the results of the Failed Fuel ElementDetection (DRG) test, carried out between each cycle, the behaviour ofthe element was ideal, since no fuel element failure was evidenced duringirradiation. This good behaviour is confirmed moreover by the visualexaminations performed each month (under water) and twice in a hot cell,in particular at the end of irradiation (January 1982).
The behaviour of the fuel element was excellent, and a final meanburn-up of 50.4% was reached.
2.3 POST-IRRADIATION-EXAMINATIONS (PIE)
The fuel element was loaded into a special transport cask andtransferred to the hot laboratories of SACLAY (LECI*), in December 1982,in order to perform different non-destructive and destructive tests. Thefollowing operations were carried out:
measuring the width of the 22 water channels between the fuelplates with special equipment allowing the exploration of 3 tracksin the axis of each channel. These measurements showed nothingparticular.
dismantling of the fuel element plate by plate.
- measuring the thickness of the plates longitudinally andtransversely and comparing with the thickness measurements takenduring fabrication, before assembling the plates. No significantdifference was observed.
- metallographic examination of one plate presenting a high burn-up (57%). The photographs do not give any particular indications.
At the end of all these examinations, which terminated in June1983, the plates were placed into a special support box and loaded intothe transport cask to be transferred back into the SILOE reactor pool.Moreover, some of the plates were examined by spectrometry. All of theplates will be reprocessed.
Finally, it can be concluded that the behaviour of the fuel elementproved excellent and that the UAlx fuel with 2.2 g of total uranium percubic centimeter (E = 45%) is qualified to be used in research and testreactors.
»Laboratoire d'Examen des Combustibles Irradies (Irradiated FuelTesting Hot Lab.) C.E.A. C.E.N. SACLAY, France
319

3. TESTING OF 19.75% ENRICHED URANIUM-SI LI CON FUEL<2~6>
The program up to October 1987 comprised irradiation of thefollowing fuels, fabricated by CERCA, in the SILOE and OSIRIS reactors:
In SILOE:
4 separate t Si fuel plates4 separate 113812 fuel plates1 complete 1)381 fuel element1 complete l?3Si2 fuel element1 complete HEU UA1 fuel element
In OSIRIS:
- 1 complete fuel element
3.1 IRRADIATIONS IN THE SILOE REACTOR
3.1.1 Irradiation of Separate Fuel Plates (U3Si and U3Si2)
The eight separate fuel plates had the same dimensions andthickness as the plates of the standard fuel elements for SILOE (Fig. 4)
U3Si Fuel Platesg U/cm3 g 235U/Plate
5.55.56.06.0
20.220.221.221.2
U3SÏ2 Fuel Platesg U/cm3 g 235U/Plate
2.03.75.25.4
7.413.619.119.9
The alloy used for the frame and cover of the fuel plates was analuminum alloy containing 3% magnesium (alloy AG3 as per Frenchstandards).
641.9
.6Q6.5
FUEL HEAT
FIG. 4. Uranium-suicide plate for SILOE irradiation tests.
CROSS-SECTIONOF PUTE
320

4 ALUMINUM PLATES
8 WATER CHANNEL (3 MM WIPP)
4 FIEL PLATES
80
FIG. 5. Cross-section of the U3Si plates holder.
Four fueled plates (either U3Si or 03812) were placed in a specialirradiation casing (shown in Fig. 5) located at the periphery of thecore. Four other aluminum plates are roll-swaged in the sideplates ofthe casing. Two holes dia. 36 mm (on the rear end in relation to thereactor core) allow production of artificial elements, if required.
Each plate could be removed from the casing for examination at theend of each reactor operating cycle, i.e. after three weeks' irradiation.They were then examined visually under water and then placed on animmersed metrology bench to check fuel swelling under irradiation bymeasuring their thickness. The checks made also included claddingfailure detection carried out before each new reactor operating cycle.
3.1.2 Irradiation of Complete Fuel Elements (U3Si, U3Si2 and UA1)The three complete fuel elements had the same geometry as a
standard SILOE fuel element with 23 plates. The standard HEU UA1 elementwas irradiated to compare the behaviour of U-A1 alloys and suicides,from a swelling point of view.
Fuel Type
U3SiU3Si2UAl
Complete Fuel ElementsEnr., % g U/cm3
19.7519.7593
6.05.20.85
g 235u/Element
507434340
321
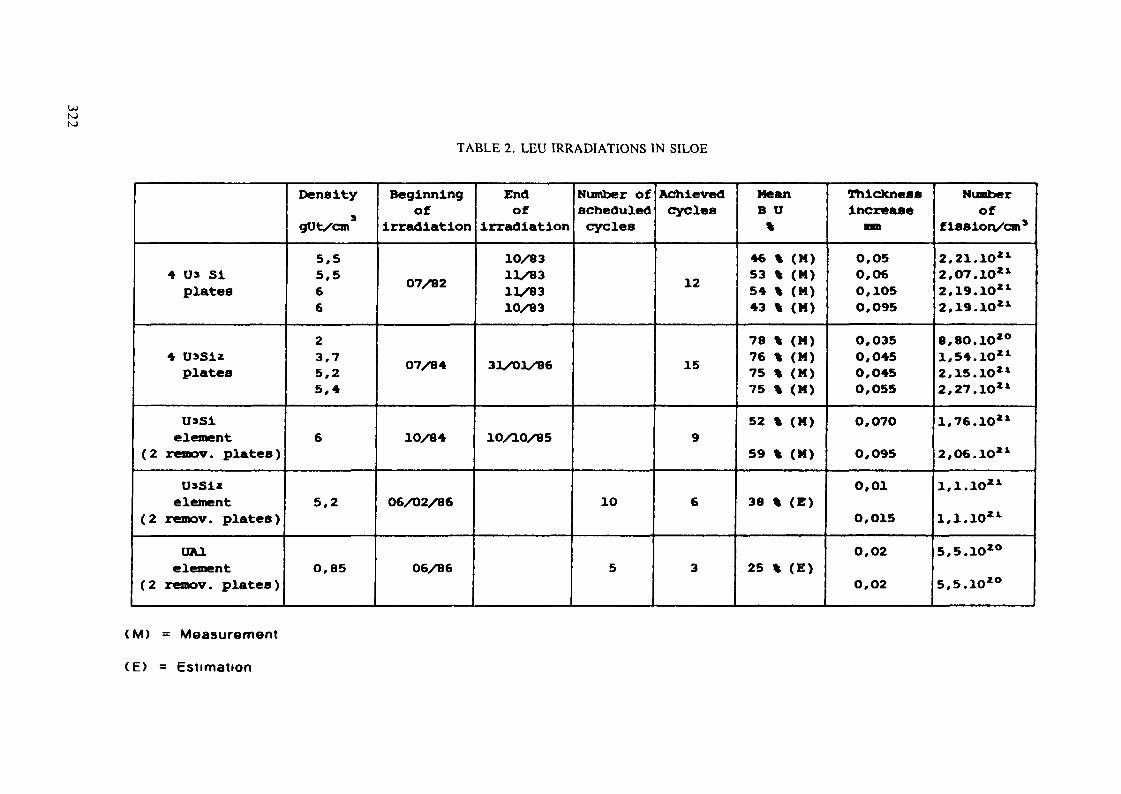
U)K)K)
TABLE 2. LEU IRRADIATIONS IN SILOE
4 Us Siplates
4 UsSizplates
Ussielement
(2 remov. plates)U»Sizelement
(2 remov. plates)UA1element
(2 remov. plates)
Densitygot/can5,55,566
23,75,25,4
6
5,2
o,es
Beginningof
irradiation
O7/82
07/84
10/84
06/02/86
06/86
Endof
irradiation10/8311/8311/8310/83
31/03 86
10/10/85
Number ofscheduledcycles
1O
5
Achievedcycles
12
15
9
6
3
MeanB D%
46 % (M)53 % (M)54 % (M)43 % (M)
78 % (M)76 % (M)75 % (M)75 % (M)
52 % (M)
59 % (M)
38 % (E)
25 % (E)
ThicXnesaincrease
O,O50,060,1050,095
0,0350,045O,O45O,O55
O.O7O
0,095
0,01
O,O1S
0,02
O,O2
Numberof
fission/cm3
2,21.10"2,07.10"2.19.1O"2,19.10"
8,8O.1O*°1,54.10"2.15.1O"2,27.10"
1,76.10"
2,O6.1O"
1,1.10"
1,1.10"
5,5.10ZO
5,5.10"
(M) = Measurement
(E) = Estimation
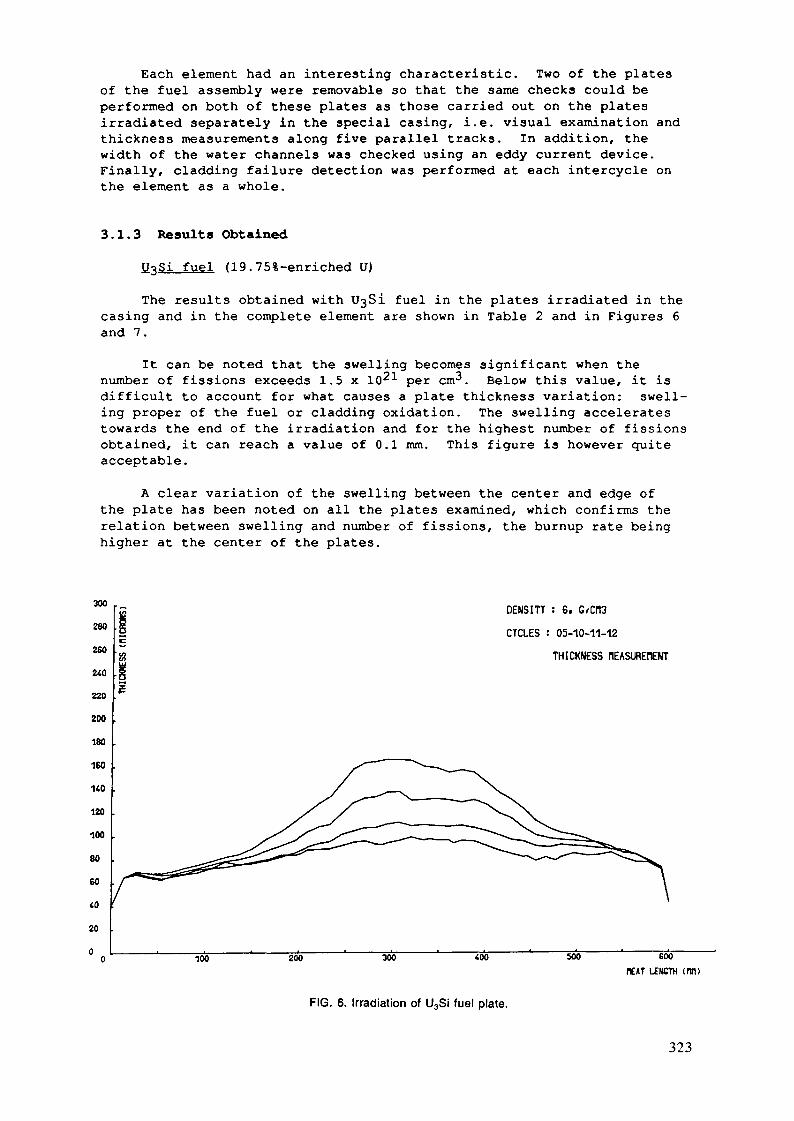
Each element had an interesting characteristic. Two of the platesof the fuel assembly were removable so that the same checks could beperformed on both of these plates as those carried out on the platesirradiated separately in the special casing, i.e. visual examination andthickness measurements along five parallel tracks. In addition, thewidth of the water channels was checked using an eddy current device.Finally, cladding failure detection was performed at each intercycle onthe element as a whole.
3.1.3 Results Obtained
U3Si fuel (19.75%-enriched U)
The results obtained with l Si fuel in the plates irradiated in thecasing and in the complete element are shown in Table 2 and in Figures 6and 7.
It can be noted that the swelling becomes significant when thenumber of fissions exceeds 1.5 x 10^1 per cm^. Below this value, it isdifficult to account for what causes a plate thickness variation: swell-ing proper of the fuel or cladding oxidation. The swelling acceleratestowards the end of the irradiation and for the highest number of fissionsobtained, it can reach a value of 0.1 mm. This figure is however quiteacceptable.
A clear variation of the swelling between the center and edge ofthe plate has been noted on all the plates examined, which confirms therelation between swelling and number of fissions, the burnup rate beinghigher at the center of the plates.
*W1"- DENSITT : 6. C/CP13
280"" CTCLES : 05-10-11-12
THICKNESS PlEASUREtlENTa240
220
200
180
160
120
100
80
60
to20
0 100 200 300 «0 500 600HEAT LENGTH (W)
FIG. 6. Irradiation of U3Si fuel plate.
323

DENSITT : B. G/CH3CYCLES : 00-05-<n-08-09
THICKNESS MEASUREMENT
500 600flEAT LENGTH (fW>
FIG. 7. Irradiation of U3Si fuel element.
U3Si2 fuel (19.75%-enriched U)
The results obtained with 03812 fuel in the plates irradiated inthe casing and in the complete element are shown in Table 2 and inFigures 8 and 9.
On these curves, it can be seen that the U3Si2 fuel presents a verysmall swelling, which leads to a less clear correlation between swellingand number of fissions than in the previous case. On the most heavilyloaded plate (5.4 g/cm3) , the number of fissions (estimated figure) isequal to 2.27 x 10 cm~3 i.e. a value close to the physically possiblemaximum (approx. 2.7 x 1021 cm"). The swellings observed are generallysmaller by a factor 2 than those observed with the
Irradiation of a UAl element (93%-enriched U)
This irradiation involved a standard element normally used in theSILOE core, but two plates were not swaged so as to make them removable.This special feature enabled us to perform what had not been done up tonow, swelling measurements of the UAl fuel used for over 20 years withoutany problem, so as to compare them with those carried out on the UßSi andU3$i2 fuels. This irradiation program is now more than 50% completed andthe results make it possible to forecast an identical behaviour to thatof the U3Si2 fuel (Figure 10).
324
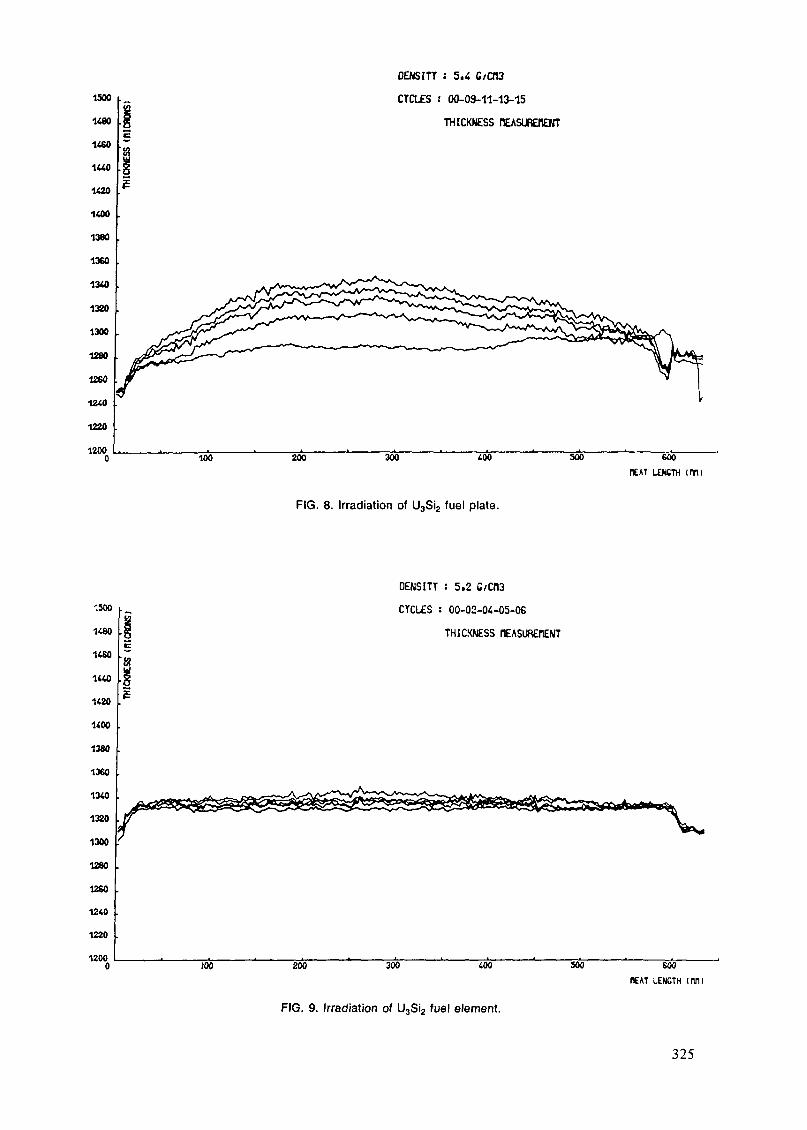
1500
1480
1460
1440
1420
1400
1380
1360
1340
1320
1300
1280
1260
1240
1220
1200
DENSITT : 5.4 G/OU
CTCLES : 00-09-11-13-15
THICKNESS nEASURBlENT
100 200 300 400 300 600
(lEM LOtfTH (Wl)
FIG. 8. Irradiation of U3Si2 fuel plate.
'.500
1480
1460
1440
1420
1400
1380
1360
1340
1320
1300
1280
1260
1240
1220
1200
DENSITT : 5.2 G/CH3
CTCLES : 00-02-04-05-06
THICKNESS ClEASUREflENT
IOO 200 300 400 500 600flEAT LENGTH (Wll
FIG. 9. Irradiation of U3Si2 fuel element.
325
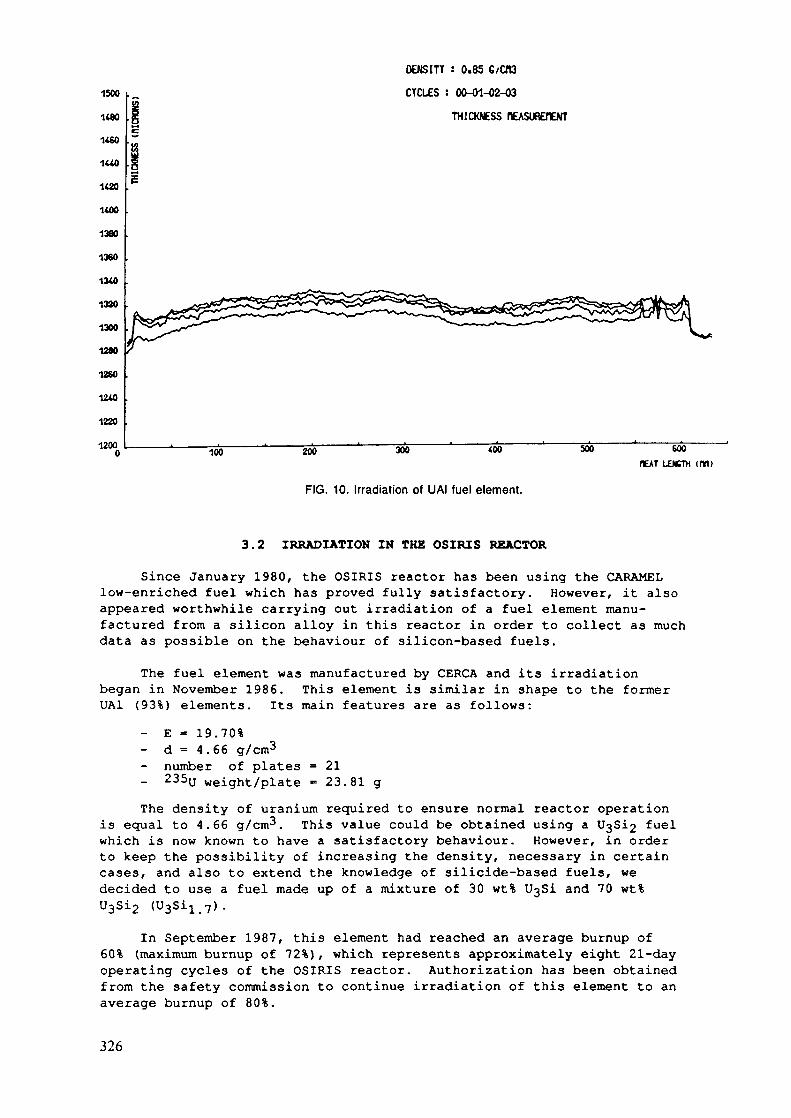
1500
1*801160
100
1420
1380
1360
13X0
1320
1300
1280
1280
1240
1220
12000
DENSITY : 0.85 G/CfüCYCLES : 00-01-02-03
THICKNESS HEASUREnBIT
100 200 300 400 600ftAT LENCTH («I)
FIG. 10. Irradiation of UAI fuel element.
3.2 IRRADIATION IN THE OSIRIS REACTOR
Since January 1980, the OSIRIS reactor has been using the CARAMELlow-enriched fuel which has proved fully satisfactory. However, it alsoappeared worthwhile carrying out irradiation of a fuel element manu-factured from a silicon alloy in this reactor in order to collect as muchdata as possible on the behaviour of silicon-based fuels.
The fuel element was manufactured by CERCA and its irradiationbegan in November 1986. This element is similar in shape to the formerUAI (93%) elements. Its main features are as follows:
E = 19.70%d = 4.66 g/cm3number of plates235U weight/plate
2123.81 g
The density of uranium required to ensure normal reactor operationis equal to 4.66 g/cm3. This value could be obtained using a 1 3812 fuelwhich is now known to have a satisfactory behaviour. However, in orderto keep the possibility of increasing the density, necessary in certaincases, and also to extend the knowledge of silicide-based fuels, wedecided to use a fuel made up of a mixture of 30 wt% t Si and 70 wt%U3Si2
In September 1987, this element had reached an average burnup of60% (maximum burnup of 72%) , which represents approximately eight 21-dayoperating cycles of the OSIRIS reactor. Authorization has been obtainedfrom the safety commission to continue irradiation of this element to anaverage burnup of 80%.
326
Before the element was inserted in the reactor, a channel measuringapparatus which had already been used elsewhere was fitted to this newelement to achieve a zero point before irradiation and to enable thevariations of the channel thickness measurements after each cycle to befollowed.
4. CONCLUSIONAll the qualification tests either in progress or scheduled in our
reactors involve these silicon-based fuels. The results obtained up tonow are satisfactory and enable more detailed studies to be carried outon the optimized performances which can be expected from complete coresmade up of this type of fuel.
REFERENCES1. F. Merchie, C. Baas, M. Ploujoux, "Qualification in the Reactor
SILOE of Low Enriched Fuels for Research and Test Reactors,"Proceedings of the International Meeting on Research and TestReactor Core Conversions from HEU to LEU Fuels," November 8-10,1982, Argonne, Illinois, USA, ANL/RERTR/TM-4, CONF-821155 (September1983), pp. 242-253.
2. F. Merchie, C. Baas, and Mme M. Trotabas, "Progress Report on theQualification in the Reactor SILOE of Low Enriched Fuels forResearch and Test Reactors," Proceedings of the InternationalMeeting on Reduced Enrichment for Research and Test Reactors, 24-27October 1983, Tokai, Japan, JAERI-M 84-073 (May 1984), pp. 131-138.
3. F. Merchie, C. Baas, and P. Martel, "Irradiation Testing of LEUFuels in the SILOE Reactor - Progress Report," Proceedings of the1984 International Meeting on Reduced Enrichment for Research andTest Reactors, October 15-18, 1984, Argonne, Illinois, USA,ANL/RERTR/TM-6, CONF-8410173, pp. 146-151.
4. C. Baas, M. Barnier, J. P. Beylot, P. Martel, and F. Merchie,"Rapport D'Avancement sur la Reduction de l'Enrichissement duCombustible dans les Reacteurs Expérimentaux du CEA," Proceedings ofan International Meeting on Reduced Enrichment for Research and TestReactors, October 14-16, 1985, Petten, The Netherlands, D. ReidelPublishing Company, Dordrecht, Holland (1986), pp. 49-57.
5. C. Baas, M. Barnier, J. P. Beylot, P. Martel, and F. Merchie,"Progress Report on LEU Fuel Testing in CEA Reactors," Proceedngs ofthe 1986 International Meeting on Reduced Enrichment for Reserarchand Test Reactors, November 3-6, 1986, Gatlinburg, Tennessee, USA,(to be published).
6. M. Barnier and J. P. Beylot, "OSIRIS, a MTR Adapted and Well Fittedto LEU Utilization - Qualification and Development," Proceedings ofthe International Meeting on Reduced Enrichment for Research andTest Reactors, 24-27 October 1983, Tokai, Japan, JAERI-M 84-073 (May1984), pp. 256-267.
7. Y. Fanjas, "Suicide Fuel at CERCA - Status as of September 1987,"Proceedings of the 1987 International Meeting on Reduced Enrichmentfor Research and Test Reactors," September 28 - October 2, 1987,Buenos Aires, Argentina (to be published).
327
Appendix J-4.3
FINAL REPORT ON THE IRRADIATION TESTING ANDPOST-IRRADIATION EXAMINATION OF LOW ENRICHEDU3Og-Al AND UAl^-Al FUEL ELEMENTS BY THENETHERLANDS ENERGY RESEARCH FOUNDATION (ECN)
H. PRUIMBOOM, E. LIJBRIJK, K.H. VAN OTTERDIJK,R.J. SWANENBURG DE VEYENetherlands Energy Research Foundation,Petten, Netherlands
Abstract
Within the framework of the RERTR-programme four low-enriched (20%)MTR-type fuel elements have been irradiated in the High Flux Reactor atPetten (The Netherlands) and subjected to post-irradiation examination.Two of the elements contain UA1 -Al and two contain U.O--A1 fuel. Thetest irradiation has been completed up to the target Burn-up values of50% and 75% respectively. An extensive surveillance programme carriedout during the test period has confirmed the excellent in-reactorbehaviour of both types. Post-irradiation examination of the testelements, comprising of dimensional measurements, burn-up determination,fuel metallography and blister testing, has confirmed the irradiationexperiences. Good agreement between calculated and measured power andburn-up characteristics has been found.A survey of the test element characteristics, their irradiation history,the irradiation tests and the PIE results is given in this report.
1. INTRODUCTIONFour 20% enriched MTR-type fuel elements have been test irradiated inthe 45 MW High Flux Reactor at Petten (The Netherlands) in the frame ofan agreement between the Netherlands Energy Research Foundation (ECN),Argonne National Laboratory (ANL), NUKEM (F.R.G.) and CERCA (France).The purpose of the irradiation programme was to demonstrate the reliableand safe behaviour of high density UA1 -Al and U 0 -Al type fuel elementsunder application conditions Which are typical for medium poweredmaterial testing reactors at U burn-ups up to 75%. Further verifi-cation of this behaviour has been achieved bv extensive Pest IrradiationExamination (PIE).All irradiations have been completed and the ppsoc-fated t urveil n i rreprogrammes, such as intermittent neutron dosimetry, plate defoiir?ticrcortro] arc1 \ista] inspection have been rounded off. PIF has beencompleted on all four elements. The results will be reported in thisreport.A detailed description of the test elements, of the irradiation charac-teristics and of the methods applied for inspection and characterizationof the elements before and during irradiation is given in |1|. A summaryof this information is given below.
2. THE PETTEN HIGH FLUX REACTORThe High Flux Reactor (HFR) is part of the Joint Research Centre of theEuropean Community at Petten (The Netherlands). It is a multi-purposetest reactor of the ORR-type and utilized for fundamental research,
329
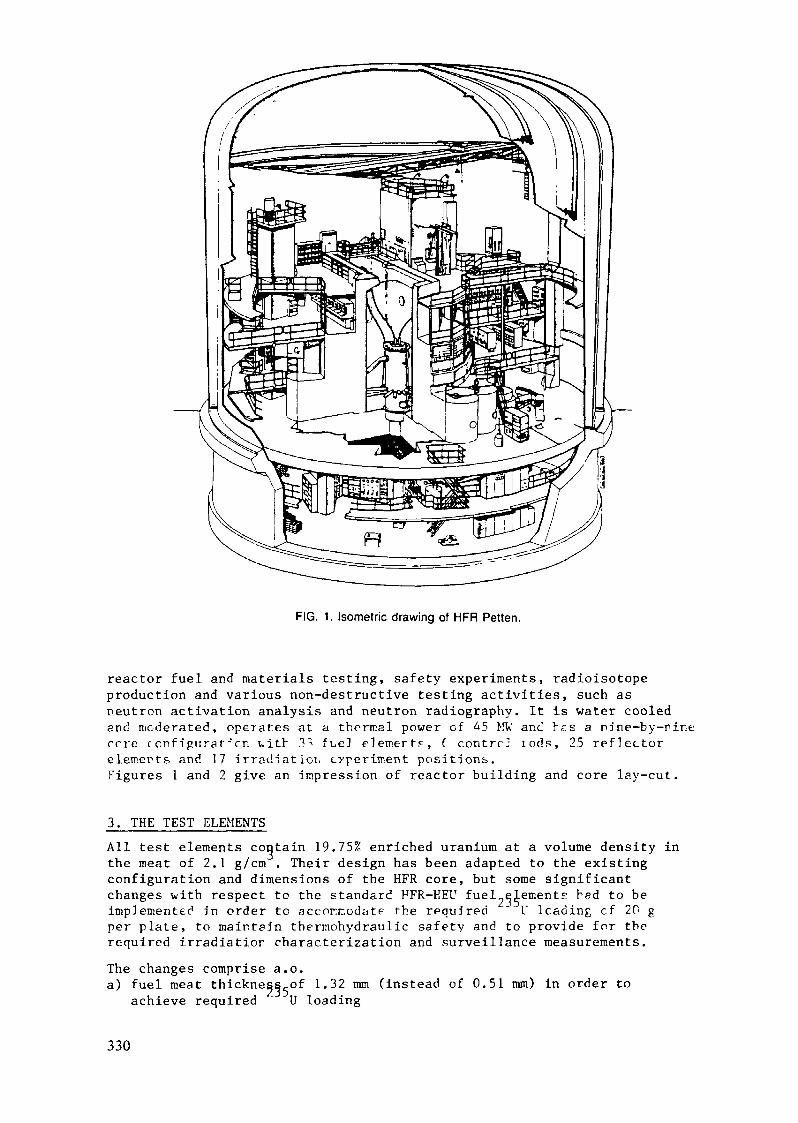
FIG. 1. Isometric drawing of HFR Petten.
reactor fuel and materials testing, safety experiments, radioisotopeproduction and various non-destructive testing activities, such asneutron activation analysis and neutron radiography. It is water cooledand moderated, opeiates at a thermal power of 45 MW anc tes a nine-by-rinecere c onf iguraf' rn v,ith 3^ fuel eUemertF, ( contre] rods, 25 reflectorelements and 17 irradiation cyperiment positions.Figures 1 and 2 give an impression of reactor building and core lay-cut.
3. THE TEST ELEMENTSAll test elements contain 19.75% enriched uranium at a volume density inthe meat of 2.1 g/cm . Their design has been adapted to the existingconfiguration and dimensions of the HFR core, but some significantchanges vith respect to the standard HFR-KEU fuel.elements bad to beimplemented in order to accor.ir.odatf the required " U leading cf 20 gper plate, to maintain thermohydraulic safety and to provide for therequired irradiatior, characterization and surveillance measurements.The changes comprise a.o.a) fuel meat thickness_of 1.32 mm (instead of 0.51 mm) in order to
achieve required U loading
330

A B C D E F G H I4-L
•
<
L
4-
+
L
J
L
+
4-
4-
4-
4-
4-
4-
+
4-
4-
(L>
(U
4-
4-
4-
4-
4-
4-
4-
4-
4-
4-
4-
4-
1
23U56789
FTJEL ELEMENT CONTROL ROD EXPERIMENT
+ Be ELEMENT L LEU
FIG. 2. Standard core loading pattern for the HFR Petten.
b) 16 flat fuel plates (instead of 23 curved plates and non fuelledouter plates, in order to maintain required cooling channel widths
c) square (instead of round) upper inlet sections in cider to improveaccessibility for coo]ing channel width measurements and neutrondosimetry
d) lorgitucir? 1 plots in cut or plati: -*n order tc fiprl> ptrnar^rt ardreloadable neutron fluence monitors.
Tn addition, one cf each type test element has been provided withcadmiuir-wires (10 wires in each side plate, 0.5 nan diameter, 20yaluminium clad) in order to test the effectiveness of cadmium as aburnable poison in comparison to the presently applied boron-absorber.The materials specification for the test elements is given in Table 1.Fipurts 3 and A show various technical details.
4.__T_R_P_AI. TICI. u:r YPFP core pcsiticrr //, A8, B2, Pf, CI arc ( '<• -'rec fip. T') VE i c stltct<dfor the irradiations. Test element power in these positions ranged frm0.5 to 19MW, which corresponds with maximum heat flux densities of 75 to150 W/cm . In order to compensate for such power differences and for theflux gradients at the peripheral core positions the elements wereperiodically switched between the north and south position. The overallirradiation peiiod for all foui test elements extended from November 1981to April 19F2.
5. IRRADIATION SURVEILLANCE
5.1. Visual inspectionEach test element was subjected to careful visual observation after eachirradiation cycle. No abnormalities have been observed.
331

TABLE 1. MATERIAL SPECIFICATIONS FOR LEU TEST ELEMENTS
FuelFuel meat compositionUranium - loading- per element- per plate- surface density- volume density
Enrichment
0-235 loading- per element- per plate- surface density- volume density
Cadmium - composition (1)- nr. of wires- diameter- weight per element
Aluminium- in meat- clad and frame- side boxes and outside plates- end boxes- welding additure
Type : LN-O1-CDUM-02U308-A1(Nukem)
U 0 -Al3 8
1660 ± 35104 ± 2280 10~3
2.119.75 + 0.2
- 0.5
328 t 620.5 ± 0.454.1 10~30.41
99.92200.0520.4
pure Al .Al Mg 1 (or 2)Al Mg Si 7, F32Gk Al Si 5 MgAl Si 5 (or 12)
Type :Ü AljAI(Cerca)
U Al -AlX
1687 t 35105 ± 2280 10~3
2.J19.5
329 t 620.6 ± 0.454.2 10~30.41
99. 9Z200.0520.4
A 5 NEAG 2 NE (3 NEAG 3 NECr-Al Si 5 MgAG 3 NE
LCXM-COLC-02
ggg / cm2g / cm3
ggg / an2g / cm3
pure grade
cmg
, 4 SE)
(1) Only in cas« of LN-01-CD and LC-01-CD.
5.2. Cooling channel width measurementsMeasurements of the width of several preselected cooling channels havebeen taken on each test element at regular intervals during the irradiation.The measurements were taken by means of a specially developed ultrasonicscanring device with the following technical featurer- throe fsprirg loaded) IS-fensors pei coolirp chtrrel , providing threevertical scans with a resolution of 5y
- automatic recording of sensor position, signal and temperature- very precise lateral positioning of the measuring device, allowing
fast and easy access to the selected cooling channel- special device for intermediate sensor recalibration.
332
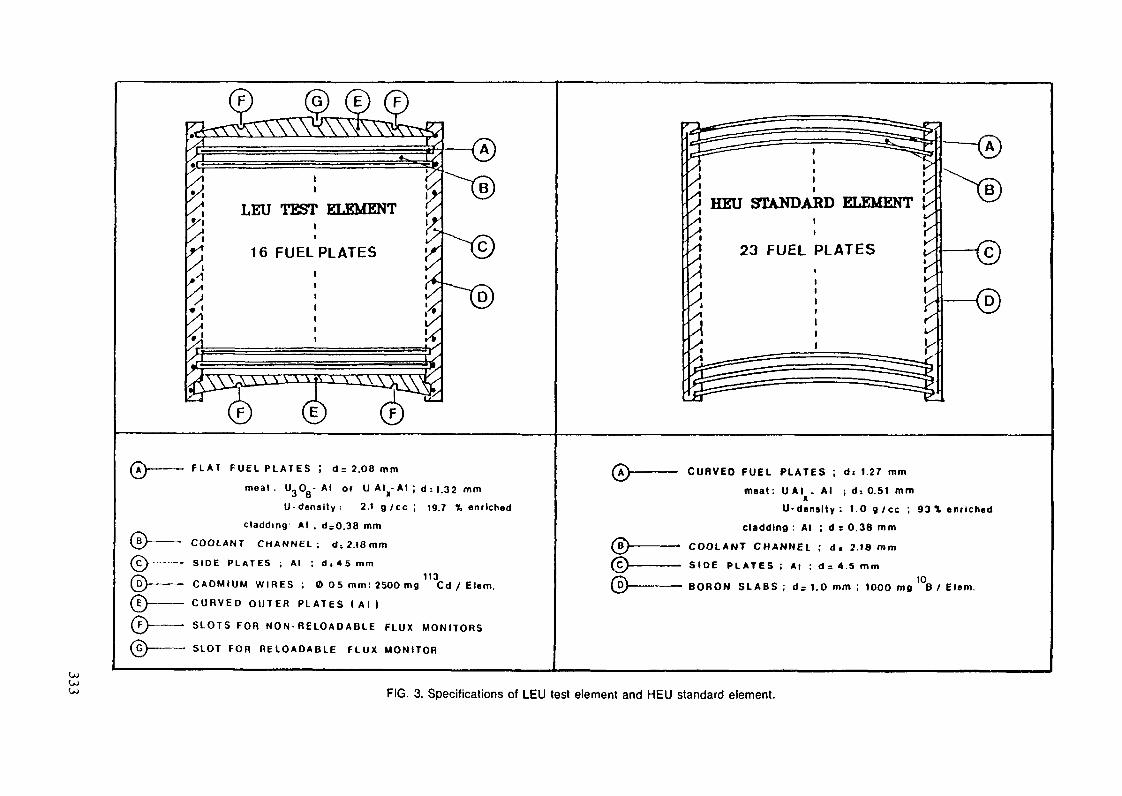
0 HEU STANDARD ELEMENT
x23 FUEL PLATES
F L A T FUEL P L A T E S ! d= 2.08 mm
meal. U_0 0 -A I or U AI - AI ; d : 1.32 mmJ o *
U- densi ty: 2.1 g /ce ; 19.7 % enriched
cladding- AI . d-0.38 mm
COOLANT CHANNEL; d-. 2.18 mm
SIDE P L A T E S ; AI ; d , 4 5 mm113
CADMIUM W I R E S ; O 05 mm! 2500 mg Cd / Elem.
C U R V E D O U T E R P L A T E S ( A I )
SLOTS FOR N O N - R E L O A D A B L E FLUX MONITORS
SLOT FOR R E L O A D A B L E FLUX MONITOR
0-
CURVED FUEL PLATES ; d: 1.27 mm
meat: U AI . AI ; d-. 0.51 mm
U-dens l ty : 1 . 0 g / c c ; 93% enriched
cladding : AI : d s 0.38 mm
COOLANT CHANNEL ; d. 2.18 mm
SIDE P L A T E S ; Al ; d = 4.5 mm
BORON SLABS ; d = 1.0 mm ; 1000 mg B / Elem.
U)FIG. 3. Specifications of LEU test element and HEU standard element.
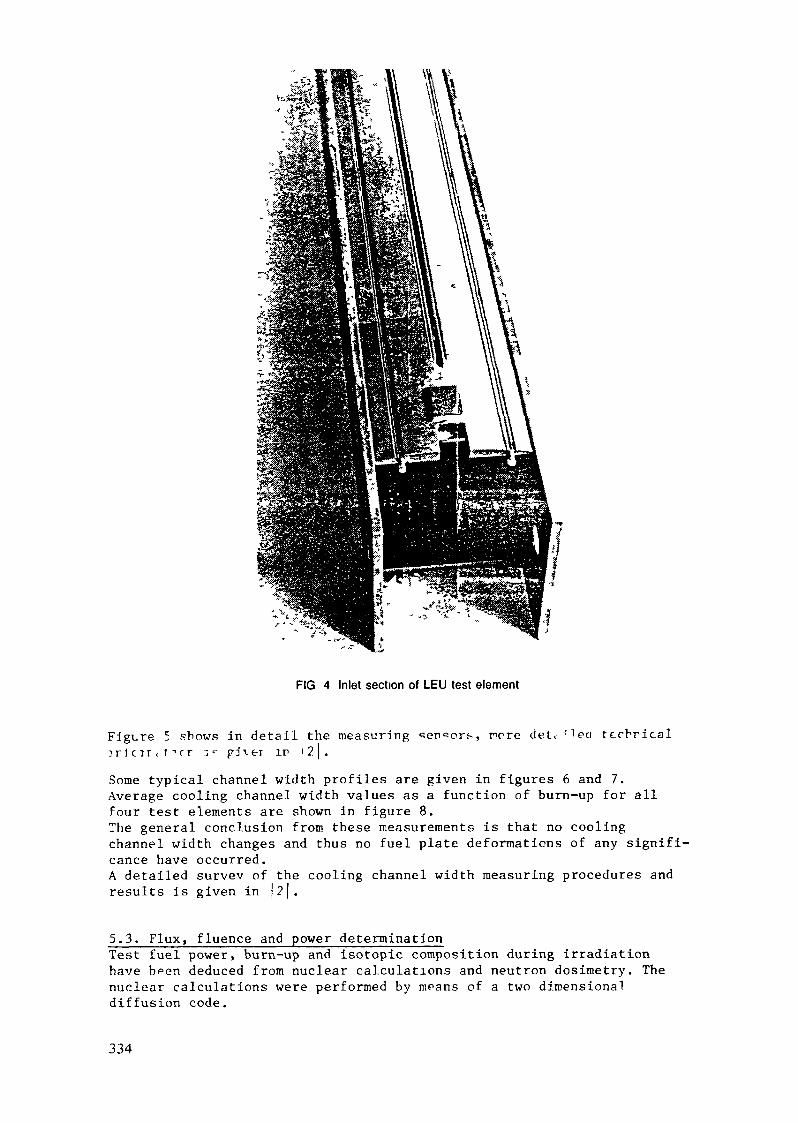
FIG 4 Inlet section of LEU test element
Figure 5 shows in detai l the measuring ^en^ors, riorej r l c t i c i T r : r i \er in i 2 .
technica l
Some typical channel width profiles are given in figures 6 and 7.Average cooling channel width values as a function of burn-up for allfour test elements are shown in figure 8.The general conclusion from these measurements is that no coolingchannel width changes and thus no fuel plate deformations of any signifi-cance have occurred.A detailed survev of the cooling channel width measuring procedures andresults is given in |?|.
5.3. Flux, fluence and power determinationTest fuel power, burn-up and isotopic composition during irradiationhave b<=en deduced from nuclear calculations and neutron dosimetry. Thenuclear calculations were performed by means of a two dimensionaldiffusion code.
334

FIG. 5. Mounting configuration of ultrasonic sensors
For the test elements a representative calculation model consisting of afuel region surrounded by two side plates and two outer puâtes has beendefined. 2^ U3For several U and Cd depletion values the nuclear data for thiscalculation model were determined and stored on a library file. For theactual U/ Cd combination a quadratic interpolation procedure wasapplied.The depletion of the uranium contents of the-LEU-elements was calculatedaccounting for burn-up rhains of U and U. The calculations indicatedthat for a burn-up value of 15% the energy produced by Pu and Puamounts to about 24% of the total power (see figure 10). The conversionratio for the elements is about 0.17.
335

284 MM
C E N T R EF U E LP L A T E
TOLERANCELIMIT
ELEMENT . LC-02
C H A N N E L . 2
T R A C K ' M
1.9 2.0 2.1 2.2 2.3 2.4 2.5
FIG. 6. Channel width as a function of height, with the burn-up as a parameter.
C E N T R EF U E LP L A T E
TOLERANCELIMIT
ELEMENT : LN 01 CD
CHANNEL : 4TRACK . M
1.9 2.0 2.1 2.2 2.3 2.4 2.5
FIG. 7. Channel width as a function of height, with the burn-up as a parameter.
336

LN-OI-CD LC-OI-CD
2.30
2.20
2.10
(
2.30
220
i.10
-
-
' ' • 'l
3 50 10
LN-O2
.
•
: • -\
0
3azO
'
1 230
i*
2.20
2.10
C
2.30
2.20
2.10
-
-
l T • • • • •
1•
1) 50 IOC
LC-O2
:•-
• r •l
50 100 50 100
FIG. 8. Average coolant channel width as a function of burn-up.
For verification of the nuclear calculations extensive neutron dosimetrymeasurements were carried out, comprising- application of four permanently installed fluence monitors in the
outer plates of each test element (for overall burn-up verification)- application of one reloadable fluence monitor in one of the outer
plates, which was exchanged after each reactor cycle (for stepwiseburn-up determination)
- application of up to 15 flux monitors devided over 5 cooling channelsper element for flux distribution measurements at regular irradiationintervals.
From the detailed flux measurements some conclusions could be drawn :- Especially in the LEU-elements without cadmium wires the radial flux
and power gradients were somewhat (10 tc 157) hiphci than_thosc ir theE-poisoned FFl elements. 11 iL is ivrrJy cr.vF^< rj fr c " I i t t f ^ i r i
abporbtion, by the non fuel containing outer plates ETC by the- ahfrr.rrof poison in the side plates.
- The presence of cadmium wires in the side plates of LEU-elementsLN-OI-CD and LC-OI-CD, resulted in a minor reduction of above mentionedpower peaking (5%).
- Power production values as derived from measured flux results and fromcalculations were in good agreement (± 7%).
The results of the flux measurements over the total irradiation period£.it- ir gord agreement, with the result? of gairira scanning and cherrdrr lburr-up f i r?] \ F t f v} ici. c. ic ; < < ' ( r^pr1 ; t i < - . i _ U < I . T. r r rf ~i 11 r t .
337

500
: LH-02 (0308-AL)
: Lc-ae (OALT-AL)
-20000 1 0 3 ) 3 0 4 0 5 0 6 0 7 0 8 0
FIG. 9. Reactivity as a function of burn-up for LEU test elements as measured in position D5 of the HRF Petten.
5.4. Reactivity measurementsPeriodical reactivity measurements K-we beer performed for two rea) determination of the reactivity of LEU-elements as a functicr of
burn-up.b) determination of effectiveness of cadmium as a burnable poison.The measurements have been performed by comparing the reactivity of theLEU-e]ements with that of a fresh HEU-element containing 404 U and1000 mg B. Central core position D5 was selected for this purpose. Itappeared that the reactivity value for the fresh LEU-elements withoutcadmium wires (LN-02 and l.C-02) is equal to that of the fresh HEU-element,
338
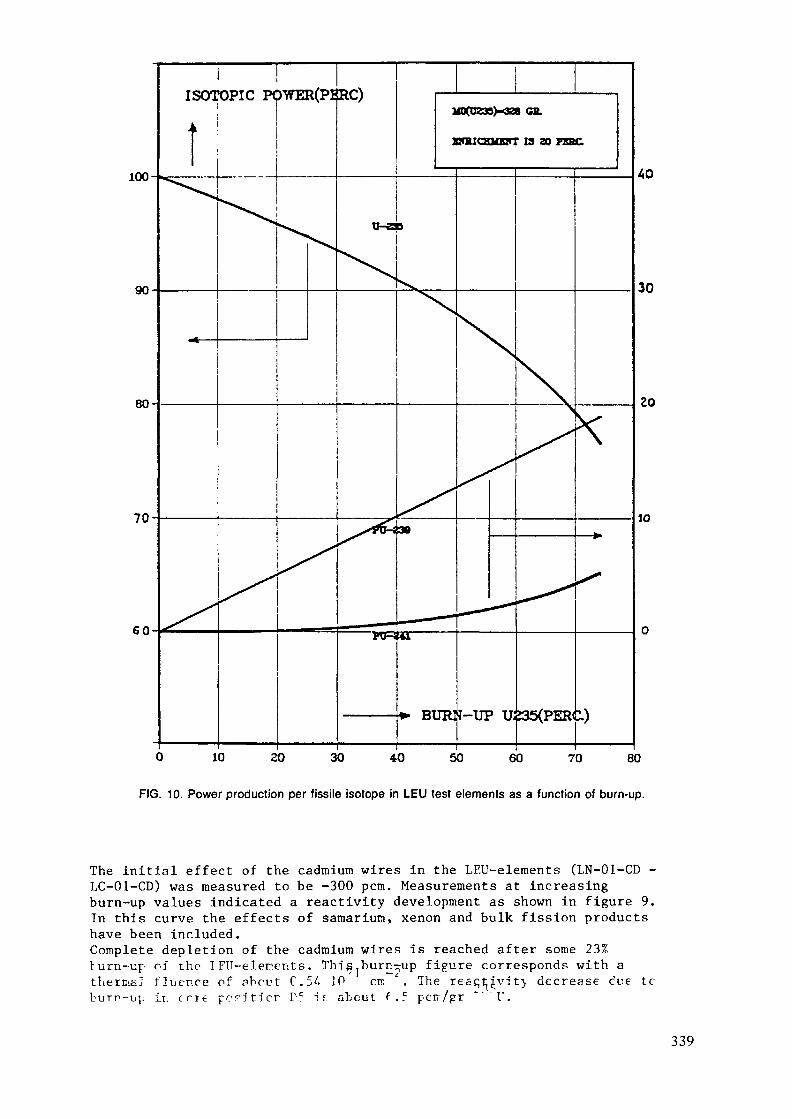
100
ISO1OPIC POWER(MD(DE3S)-3Za GH.
is ao FKBC
10 20 30 40 50 60 70 80
FIG. 10. Power production per fissile isotope in LEU test elements as a function of burn-up.
The initial effect of theLC-01-CD) was measured toburn-up values indicatedIn this curve the effectshave been included.Complete depletion of theturn-up of the I FU-eleir.enthermal fluence of about
iap ir. cri€ peri tier
cadmium wires in the LEU-elements (LN-01-CD -be -300 pcm. Measurements at increasinga reactivity development as shown in figure 9.of samarium, xenon and bulk fission productscadmium wires is reached after some 23%s. This,burn-up figure corresponds with a
C.54 10 cm * . The resqt;^vit> decrease due torc 1 £ about f.5 pcrr/pr "%"U.
339
r . pop--] FP/.I. ] A" : (•?•
6.1. PIE methodsThe P IE-prog ramme has been carried out to verify the following testelement characteristics- external appearance (corrosion effects, blisters, local deformations,cracks, etc.)
- fuel element and fuel plate dimensions- burn-up and burn-up distribution- isotopic content of fuel- temperature required for blister formation- m e t a l l u r g i c a l rercpof- ' i t ioi; f . r f F t rum- re cf f u e l
Special measuring device? end auxiliary equipment have beer eevelcpe-rfor the dismantling, handling and examination activities, such as- an electrically heated dummy element in order to determine the fuel
plate temperatures which could be expected during PIE- measuring devices for fuel plate thickness scanning and fuel element
length, bow and twist determination- cutting devices for fuel plate sampling and segmentation- an electrically heated furnace for blister temperature determination- s» special fuel pl^te container for intermediate fuel plate storage
adapted tc pcst-FTF fuel disposal transport requirements.In addition to these hardware developments the software required forexecution and evaluation of the y~scanning measurements had to beadapted.The scanning and measuring pattern for the various examinations has beenchosen such that precise comparisons with pre-irradiation characterizationresults would be possible.PIE has been completed on each of the four test elements.
6.2. PIE results6^2 . 1 ,_External_appearance o f _ t h e test_elerients
Apart from some superficial scratches on the outer plates (probablycaused by in-reactor handling) no damage or local deformations have beenobserved.Temperature sensing strips were used by means of which the temperaturepredictions obtained by the electrical dummy element have been verified.Maximum fuel element temperature was 80°C.
'By means of a special measuring device all essential external dimensionsas well as bow and twist of the elements were determined and comparedwith pre-irradiation measured data. No irradiation-induced changes havebeen detected.
6^213^_External_agpearance_and_dimensions of fuel_p_latesDismantling of the 16 fuel plates was carried out by longitudinalmilling of the side plates. For fuel plate storage and identification aspecial container has been trade.I'tiel plate inspection revealed no abnormalities. Some temperatureinduced colouring of the fuel plates as well as some irinor corrosioneffects could be observed. Measurements of corrosion layer thickness andstructure have not been carried out.For fuel plate thickness measurements a device shown in figure 12 hasbeen applied. It consists of two opposite spherical shaped sensors (onefixed and the other movable) with the fuel plate in between.
340

COOLANT CHANNELNUMBERS VIEW B
TOP —
OVERALL VIEWOF
LEU ELEMENT
"V-i- y -." i§8
1
I'H-!**••:
»iBOTTOM
FUEL USATEDGE
20 MM 20 MM
ABSOLUTE BURN-UP ANALTSES
METALLOGRAPBT
TRACES FOR GAMMA SPECTROMETRT
AND FOR THICKNESS MEASUREMENTS
FIG. 11. Definition of plate and channel numbers and locations of measuring tracks and sampling.
341
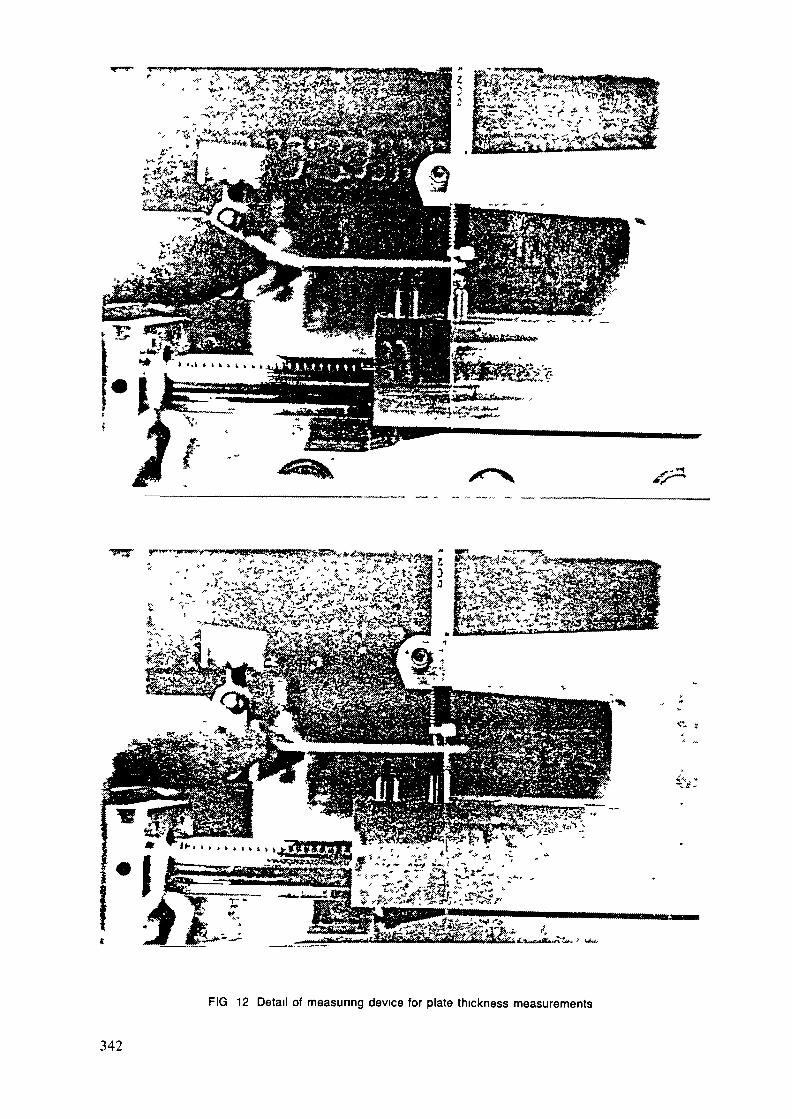
FIG 12 Detail of measuring device for plate thickness measurements
342
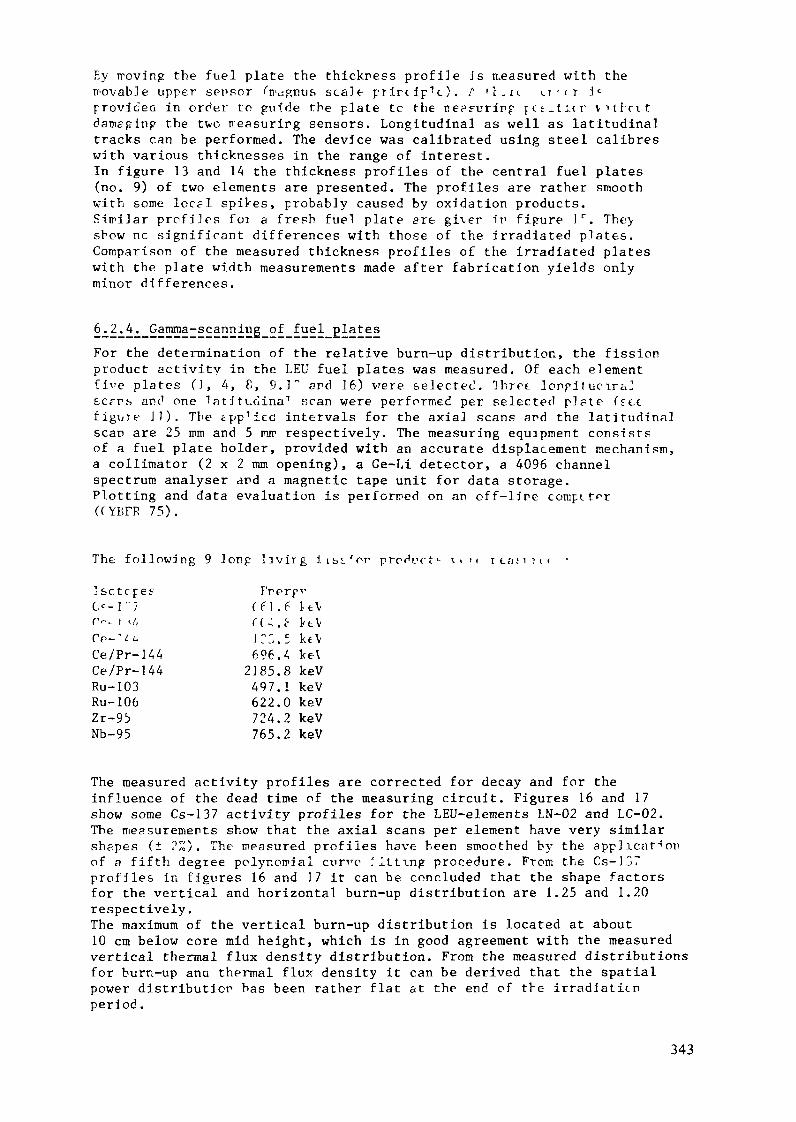
Ey moving the fuel plate the thickness profile i s measured with themovable upper sersor fnvjptius scale prircip1«:). / i'r.ii u rrr icproviceG in order to guide the plate tc the treasuring p c s _ t i < r v idamaging the two ireasurirg sensors. Longitudinal as well as latitudinaltracks can be performed. The device was calibrated using steel calibreswith various thicknesses in the range of interest.In figure 13 and 14 the thickness profiles of the central fuel plates(no. 9) of two elements are presented. The profiles are rather smoothwith some local spikes, probably caused by oxidation products.Similar profiles foi a fresh fuel plate are gi\er ir figure Jr. The>show nc significant differences with those of the irradiated plates.Comparison of the measured thickness profiles of the irradiated plateswith the plate width measurements made after fabrication yields onlyminor differences.
'For the determination of the relative burn-up distribution, the fissionproduct activity in the LEU fuel plates was measured. Of each elementfive plates (], 4, 8, 9.1" ard 16) were selectee'. Ihrrt lonpit uciraltears and one "lati ti-cina1 scan were performed per selected plate (seefigure J l ) . The épp^ec intervals for the axial scans ard the latitudinalscar are 25 mm and 5 mrr respectively. The measuring equipment consistsof a fuel plate holder, provided with an accurate displacement mechanism,a collimator (2 x 2 mm opening), a Ge-Li detector, a 4096 channelspectrum analyser and a magnetic tape unit for data storage.Plotting and data evaluation is performed on an off-lire compttr-r(CYBFF 75).
T h e fo l lowing 9 lonp l iv i rg iibf'or prodvrt1- V I M t e a ; i i t <
I s c t c p e s FrerpvL ^ - r / ff 1 .6 UVr--1 /, rt;.f uvrr-Vi. i::.5 k«vCe/Pr-144 696.4 ke\Ce/Pr-144 2185.8 keVRu-103 497.1 keVRu-106 622.0 keVZr-95 724.2 keVNb-95 765.2 keV
The measured activity profiles are corrected for decay and for theinfluence of the dead time of the measuring circuit. Figures 16 and 17show some Cs-137 activity profiles for the LEU-elements LN-02 and LC-02.The measurements show that the axial scans per element have very similarshapes (± ?«)• The measured profiles have been smoothed by the applicationof a fifth degree polynomial curve fitting procedure. From the Cs-137profiles in figures 16 and 17 it can be concluded that the shape factorsfor the vertical and horizontal burn-up distribution are 1.25 and 1.20respectively.The maximum of the vertical burn-up distribution is located at about10 cm below core mid height, which is in good agreement with the measuredvertical thermal flux density distribution. From the measured distributionsfor burn-up ana thermal flux density it can be derived that the spatialpower distributicr has been rather flat at the end of the irradiationperiod.
343
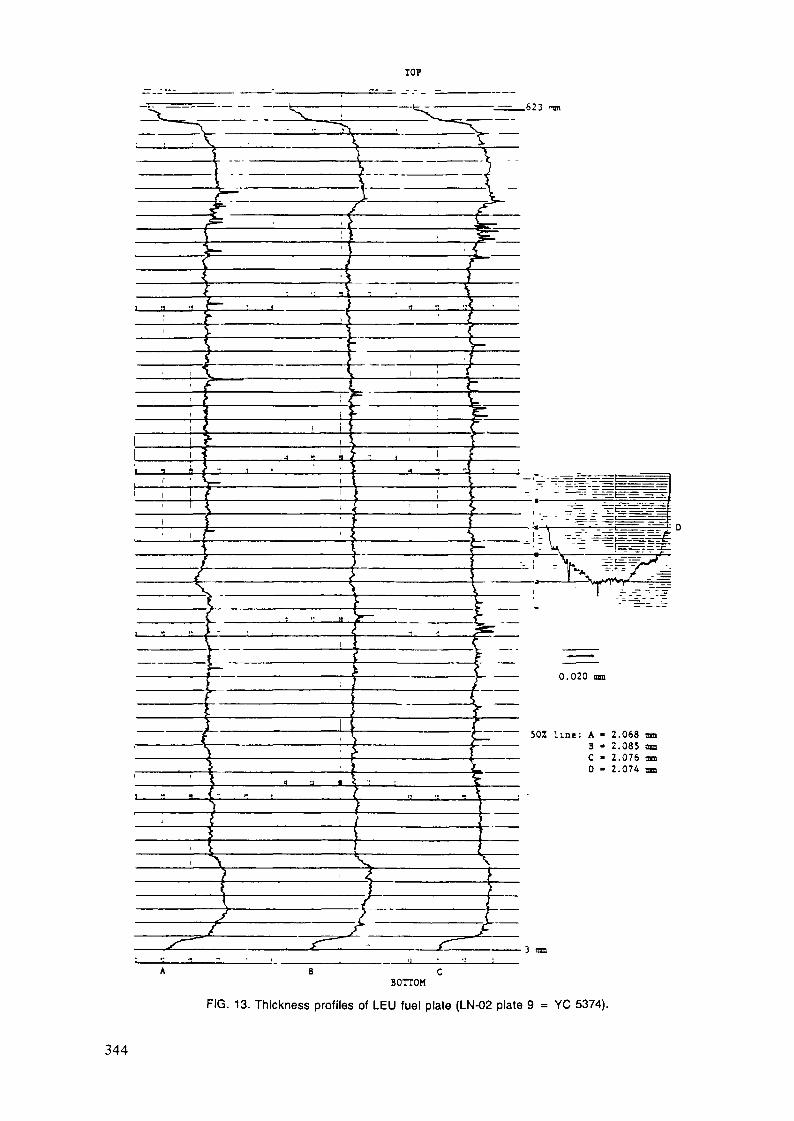
TOP
., f—
I I
,623 -m
^
IF
J_
0.020
50Z line: A • 2.068 am5 • 2.085 amC - 2.076 amD • 2.074 am
} )i ' i
—— 1 ————— ! ———— i
• 3 mni
BOTTOM
FIG. 13. Thickness profiles of LEU fuel plate (LN-02 plate 9 = YC 5374).
344

TOP
—— l—st1}\FrS—
, f
———— f—-4-4{- \ ,.\
Lii j"j
l
r r- - r-
—————— f——1
1 1cf
! fi f
———— 4 ——— 1 —
iî=E^=/
i T
) ' '1. s\ \} ' e
v 1 " >- i Îf- ' /l ' ii \t t
.. r - ?.. ^ K r - } '
{ /
i j^ <
/ ' f
f ' (J> — !1 ,
1 '[ ' • - - _ " • 1 -- - —V ' _ _ - ! - _
i - " ~~ - ~ -
/ - . - " - -
» 1- * ) ' • " - - .--"-=-_ — : _ _ - - _s i ] ~ -=^ H: - . - - - - - r
) i | . z. =n. ^ . -^~ - |1 } ^ t_=r- —— -L. —— - .-. _ - - _]
' f 1 —— __ — _ _ — ———— _ _ _ —1 1 *~ ———— r—.- ——— —~ —————— —
i ! ' ' l-= ——————————— ——— —————————————i 1
l . : .i . . . — ±r) . \ * — .——————— | ————— f ————————————— : ———— < ———— 0.020 mm
' S 1 c1 \—— i ————
/ 50Z line: A • 2.064 nm/ ' / B " 2.066 an} i ; i > C - 2.069 an
... . ...J ————— 1_ ....... l_. . D - 2.085 am
S l j ^J ^
• ' ' /C ' I I I
—— i ———— ï——— f ———— l-^ \? ^^_x _>*
^ r :] " C 1 r * •; •
BOTTOM
FIG. 14. Thickness profiles of LEU fuel plate (LC-02 plate 9 = H20-V2012).
345

IZi
TOP
623 na
±±-
4=<-1f
f ^-Tfb — i==i:=_i-.=u :-ff -= -- '-. r=^r-'_- ___T
i V r^rr- ^-£Î> " *Su -S*^ . "-*——,' <*~
1 -^^ "*-—-:i±- ..— ^^( — — _ - - - - =1 - - -'
rT.3
0.020 am
SO! line: A - 2.066 anB • 2.074 anC - 2.072 ma3 - 2.069 an
3 ran
BOTTOM
FIG. 15. Thickness profiles of unirradiated LEU fuel plate (U3O8-AI, plate YC5361).
346
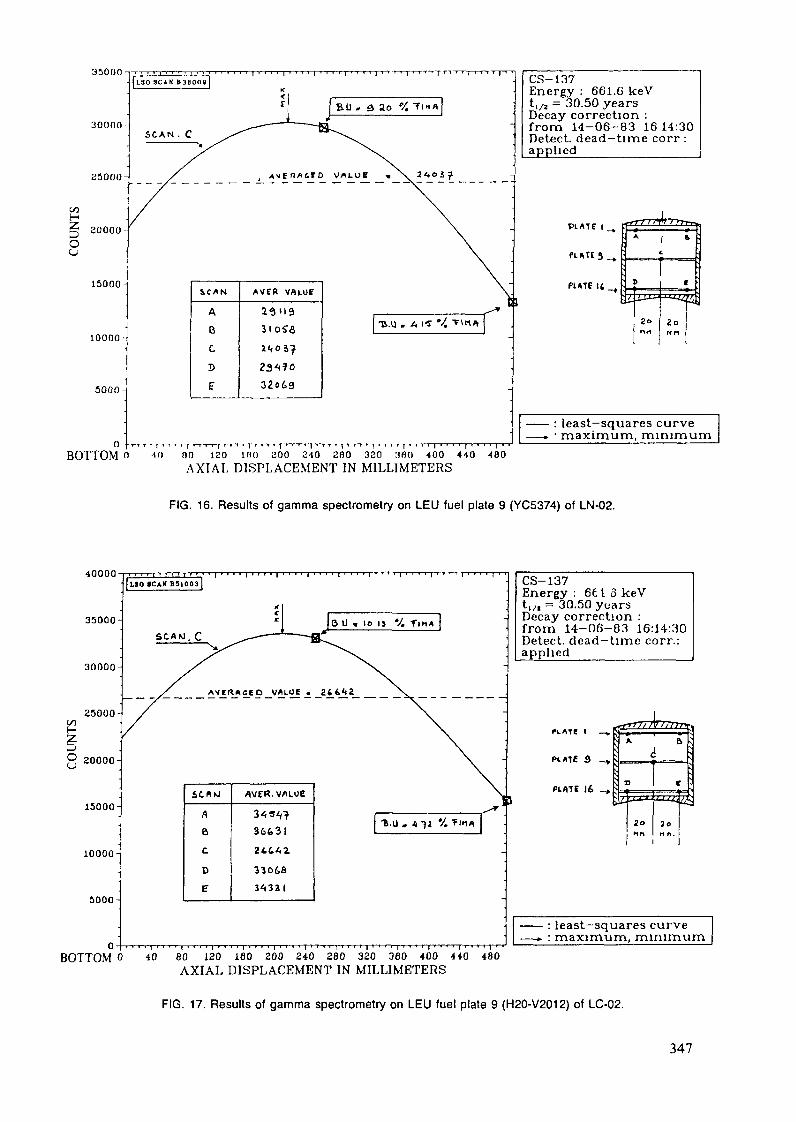
35000
30000-
25000-
C/5
5, 20000Ou
15000-
10000-
i5000-1
BOTTOM n
iC*N
ABC3E
A V f R vfluur291193 1 o£ôl<<0 J?
2.347032o69
, , , i I I I I I I i I I I I . l l l l r l i i • , i i i I I , T-I-, , I , i ,. i . . . . i , . , , , .
00 120 100 200 240 200 320 300 400 440 480A X I A L DISPLACEMENT IN MILLIMETERS
CS-137Energy : 661.6 keVt,/s = 30.50 yearsDecay correction :from 14-06-83 16 14:30Detect, dead—time corr :applied_______________
PLATT I .
PL UTE 3.
PLATE 14.
la
least-squares curvemaximum, minimum
FIG. 16. Results of gamma spectrometry on LEU fuel plate 9 (YC5374) of LN-02.
40000
35000-
30000-
25000-C/5HZ
20000-
15000-
10000-
5000-
LSO SCAN B 5 I 0 0 3 I
S C A M . C
sc«uA
B
C
D
£
AVER.v/i-ue34-svf36. 3l
at tAz33068
3^331
• • i • • • i i • * • • i • • ' • i » ' • • i ' • • ' i ' ' * • t • ' • • i • • • • i • • ' ' i • » • ' i • ' • • i •BOTTOM o 40 80 lao lao aoo E40 aao 220 360 400 440 480AXIAL DISPLACEMENT IN MILLIMETERS
CS—137Energy : 66 l o keVt1/t = 30.50 yuarsDecay correction :from 14-06-83 16:14:30Detect, dead-time corn:applied_____________
et «re
3
PLflTE 16
fffrrvnX
<
•D
SfFF?
1«nn
T77TT
1i
ttT.
3°rt n.
r"•>
— i
least—squares curvemaximum, minimum
FIG. 17. Results of gamma spectrometry on LEU fuel plate 9 (H20-V2012) of LC-02.
347
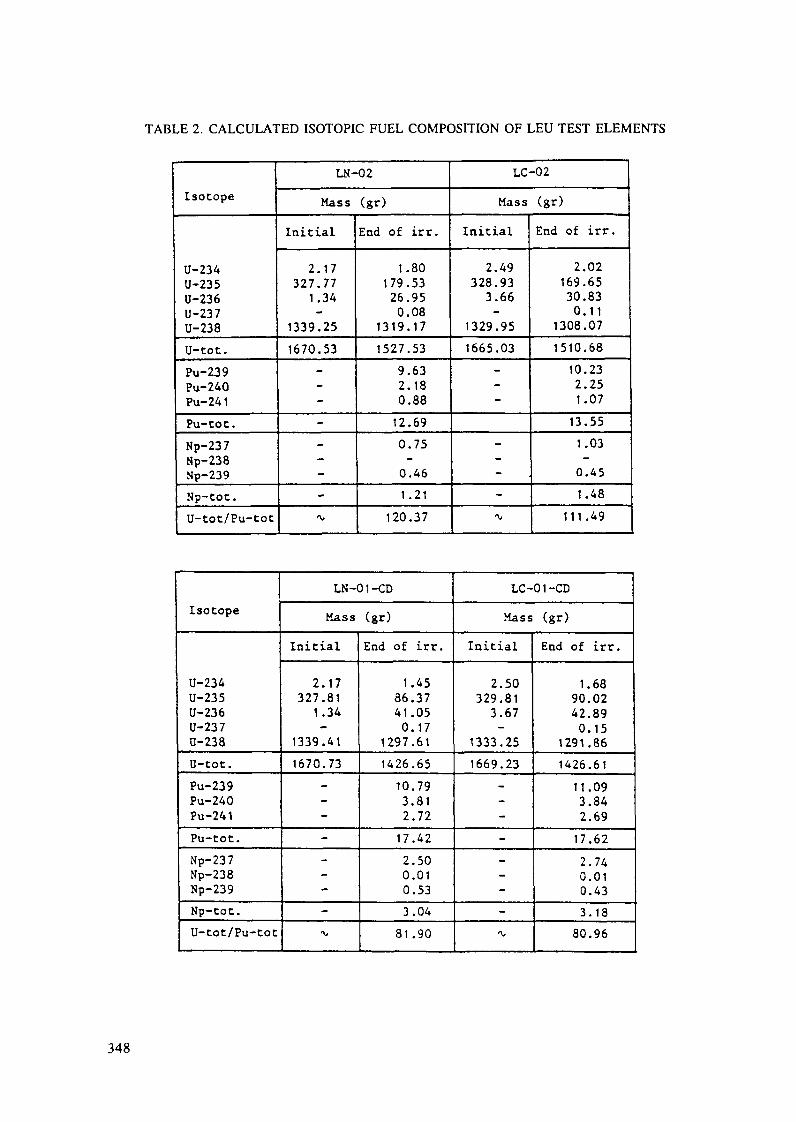
TABLE 2. CALCULATED ISOTOPIC FUEL COMPOSITION OF LEU TEST ELEMENTS
Isotope
U-234U-235U-236U- 23 7U-238U-tot.Pu-239Pu-240Pu-241Pu- toc.Np-237Np-238Np-239Np-tot.U-tot/Pu-tot
LN-02Mass (gr)
Initial
2.17327.77
1.341339.251670.53
\-—
-'V
End of irr.
1.80179.5326.950.08
1319.171527.53
9.632.180.8812.690.750.461.21
120.37
LC-02Mass (gr)
Initial
2.49328.933.66
1329.951665.03
—
-
-^
End of irr.
2.02169.6530.830.11
1308.071510.68
10.232.251.07
13.551.030.451.48
111.49
Isotope
ü-234U-235U-236U-237ü-2380-tot.Pu-239Pu-240Pu-241Pu-tot.Np-237Np-238Np-239Np-tot.U-tot/Pu-tot
LN-01-CDMass (gr)
Initial
2.17327.81
1.341339.411670.73
-
-
^
-•v,
End of irr.
1.4586.3741.050.17
1297.611426.65
10.793.812.7217.422.500.010.533.04
81.90
LC-01-CD
Mass (gr)Initial
2.50329.81
3.671333.251669.23
-
-
-
--v
End of irr.
1.6890.0242.890.15
1291.861426.61
11.093.842.6917.622.740.010.433.1880.96
348
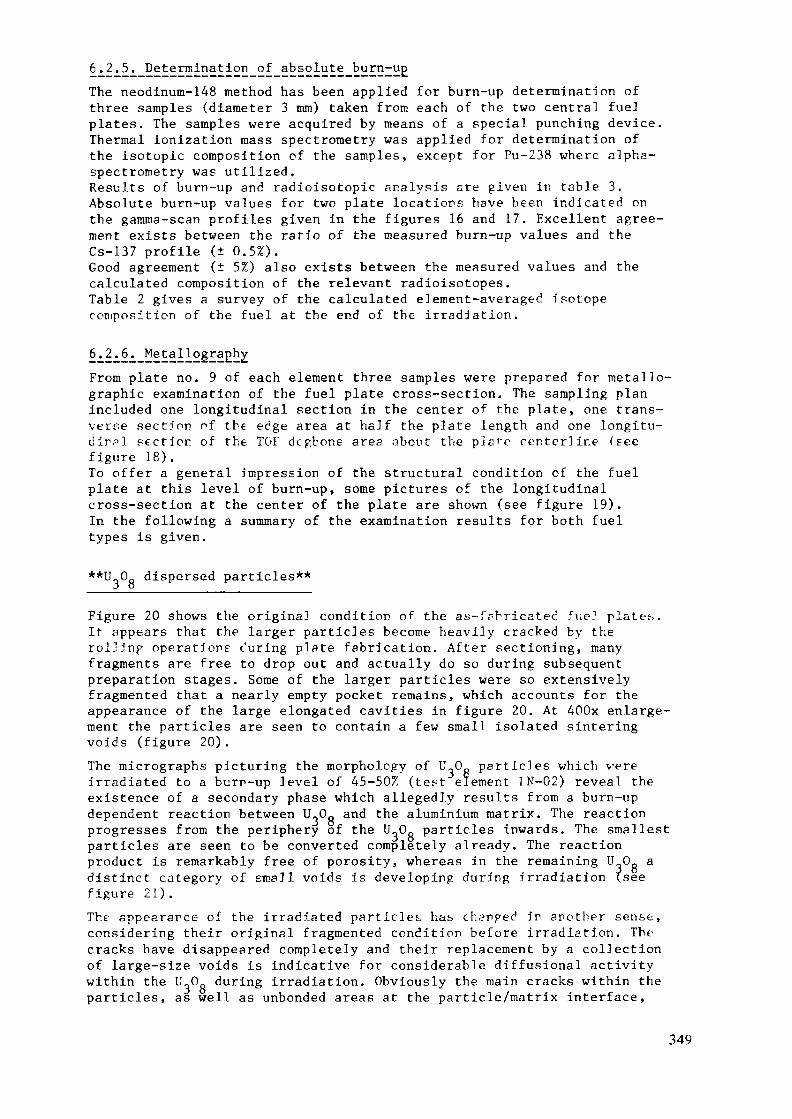
absolute_burn-U£The neodinum-148 method has been applied for burn-up determination ofthree samples (diameter 3 mm) taken from each of the two central fuelplates. The samples were acquired by means of a special punching device.Thermal ionization mass spectrometry was applied for determination ofthe isotopic composition of the samples, except for Pu-238 where alpha-spectrometry was utilized.Results of burn-up and radioisotopic analysis are given in table 3.Absolute burn-up values for two plate locations have been indicated onthe gamma-scan profiles given in the figures 16 and 17. Excellent agree-ment exists between the ratio of the measured burn-up values and theCs-137 profile (± 0.5%).Good agreement (± 5%) also exists between the measured values and thecalculated composition of the relevant radioisotopes.Table 2 gives a survey of the calculated element-averaged isotopecomposition of the fuel at the end of the irradiation.
6 2.6. Metallograp_hy_From plate no. 9 of each element three samples were prepared for métallo-graphie examination of the fuel plate cross-section. The sampling planincluded one longitudinal section in the center of the plate, one trans-verse section of the edge area at ha]f the plate length and one longitu-dinal section of the TOP dcgbone area about the plsi'e center! ine (seefigure 18).To offer a general Impression of the structural condition of the fuelplate at this level of burn-up, some pictures of the longitudinalcross-section at the center of the plate are shown (see figure 19).In the following a summary of the examination results for both fueltypes is given.
**U„00 dispersed particles**j o__________________
Figure 20 shows the original condition of the as-fr-bricatec1 fueJ plates.It appears that the larger particles become heavily cracked by therolling operations curing plate fabrication. After sectioning, manyfragments are free to drop out and actually do so during subsequentpreparation stages. Some of the larger particles were so extensivelyfragmented that a nearly empty pocket remains, which accounts for theappearance of the large elongated cavities in figure 20. At 400x enlarge-ment the particles are seen to contain a few small isolated sinteringvoids (figure 20).
which were-up level of 45-50% (tesf'eïement IN-02) reveal the
existence of a secondary phase which allegedly results from a burn-updependent reaction between U_0_ and the aluminium matrix. The reactionprogresses from the periphery of the U_0„ particles inwards. The smallestparticles are seen to be converted completely already. The reactionproduct is remarkably free of porosity, whereas in the remaining U^Oc» adistinct category of small voids is developing during Irradiation {seefigure 21).The appearance of the irradiated particles has chanpec1 In another sense,considering their original fragmented condition before irradiation. Thecracks have disappeared completely and their replacement by a collectionof large-size voids is indicative for considerable diffusional activitywithin the U 0 during irradiation. Obviously the main cracks within theparticles, as well as unbonded areas at the particle/matrix interface,
The micrographs picturing the morphology of U.O particlesirradiated to a burn-up level of 45-50% (test element IN-0^
349
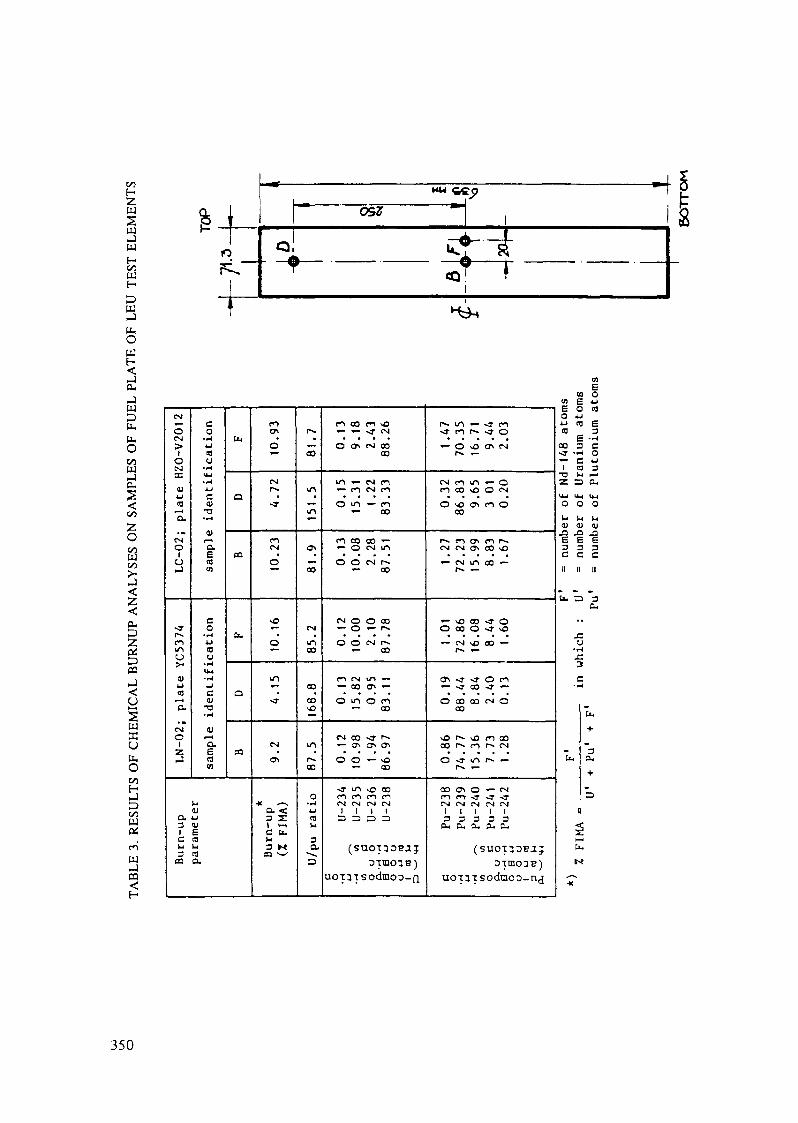
ooZUJS
lWJp-ouH<ft.WDputuOV)Seu00ZOS00
cuDZöSPPSyuKuu.O
ait*"!WJea<H
I
CN
O
>oCv]32
(U4J0)
^HO.
• •»CNO
O
ST
foinC_>>
Uu^a
CNO1z
a.31CU3
03
CO
u<au•i-*
ide
ntif
0)1— <D.EM05
O
UaoU-l.-i-tC<u
T3• «^
OJf— tQ.
nn
pa
ram
ete
r
o
nC7*
0
CNr^
-»
nCN
O
vO
o
m
S3-
CN
c\
* .—sa <3 Z1 >->C U.M3 K
03 v^
r»
OO
m
in
o>
00
CN
U1CO
00
COvO
lA
1 *CO
O• *44-1<uu3a
=3
fi oo rn vo«- »- -J CN
O er» CN oo00
m «- CN c-i»- M CN <nO «n — m
— 00
c*"l CO CO ^— o CN inO O CN f~-
— CO
CN O O CO— O — r»
O O CN r~«- 00
m CN m —•- CO CT* —
O m o n— co
CN CO <T ^^*— O^ CT^ O^
o o — *o— co
<T in ^ coco co m onCN CN CN CN
1 1 1 13 3 3 =
(SUOT1OBJJ
aimons)UOT3TSOdmOD-Q
r~- in — -* n-» n r«- <r o•— O vO (Ti CN
P^ T——
CN n m ••- om co »o o <NO >i> cri en o
co
r^ co o> fn r»CN CN CTN CO O
•— CN in co •—r»- —
•- vO co <T OO co O <r \o— CN VJ3 CO —
(>» >—
ON ST ST O CO— ST CO ST «—
O CO CO CN OCO
vO r» o ro oooo P^ ro rs CNO ST in r^ »—
rs .—
CO CT\ O — CNCO fr ST -T STCN CN CN CN INI
1 1 1 1 13 3 3 3 3eu a, a, a, eu
(suoi3onajDimoan)
UOT3T sodmoo-nj
atn EE CO 4.4-1 C|n)
oo :ST •-
1 aT3 t2 -
U-l 14.O C
t-l t<U 4•ei3 :c c» i
u. =
c.• r
•«
C
bL,
1
<
>-
S-
*
cnJ O: 4J) cali e3 - 23 C•l O: u1 3J 1—— *
3 CU
4 IM5 O
4 WJ (UE - y3 3
II
OH
J4
4
k.
+
3CU
-t-
3
$H
«
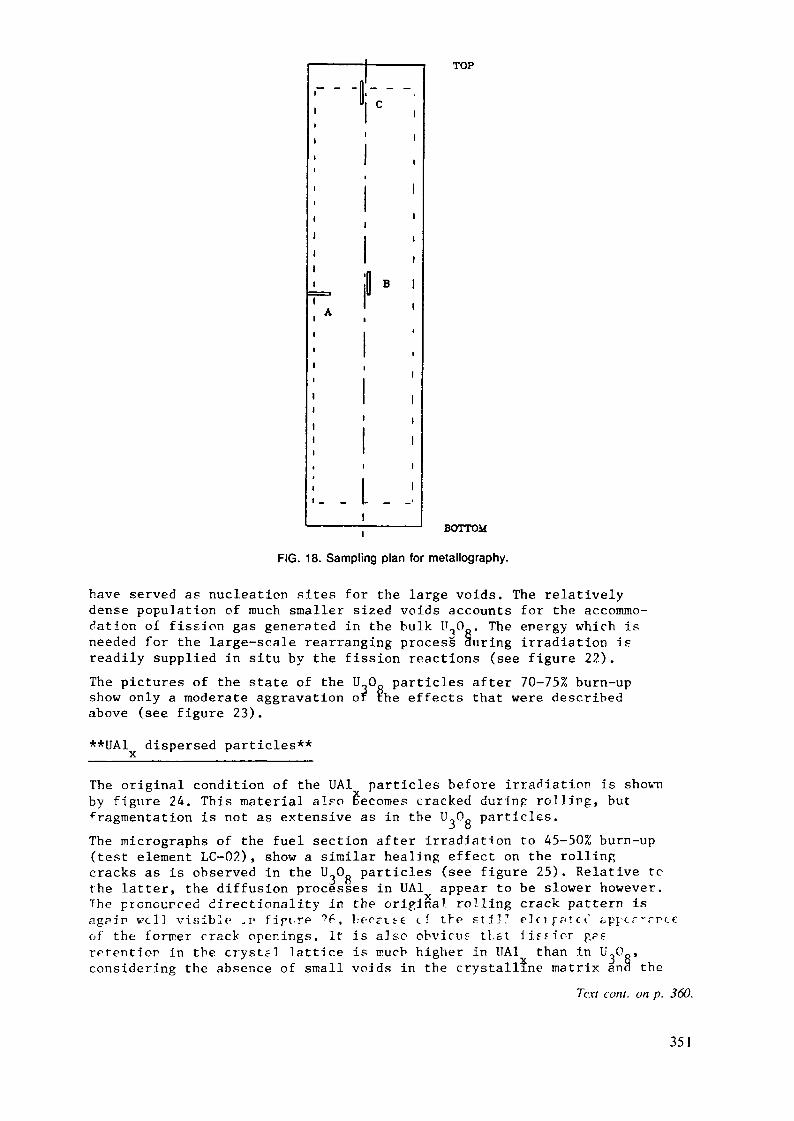
•--I1
t
.
'
ijiiii, Alii
l
1i
t1
< i
i. J
c1
1 11
1
1
1nI B '
1
1
1
i
1i1il
TOP
BOTTOM
FIG. 18. Sampling plan for metallography.
have served as nucleation sites for the large voids. The relativelydense population of much smaller sized voids accounts for the accommo-dation of fission gas generated in the bulk t'70_. The energy which isneeded for the large-scale rearranging process during irradiation isreadily supplied in situ by the fission reactions (see figure 22).The pictures of the state of the Ushow only a moderate aggravation oabove (see figure 23).
particles after 70-75% burn-uphe effects that were described
**UA1 dispersed particles**X
The original condition of the UA1 particles before irradiation is shownby figure 24. This material alfo becomes cracked during rolling, butfragmentation is not as extensive as in the U 0 particles.
J OThe micrographs of the fuel section after irradiation to 45-50% burn-up(test element LC-02), show a similar healing effect on the rollingcracks as is observed in the U»0 particles (see figure 25). Relative tcthe latter, the diffusion processes in UA1 appear to be slower however.The pronourred directionality in the original rolling crack pattern isagr<ir> veil visible :i' fipi-rp ^f-, be-crtfe cf the s t i l - plcifntcc* opj-cr-rrceof the former crack openings. It is also obvicuf that iiffior g?srrrentier in the crystal lattice is much higher in IIA1 than in U,0.,,considering the absence of small voids in the crystalline matrix ana the
Text cont. on p. 360.
351
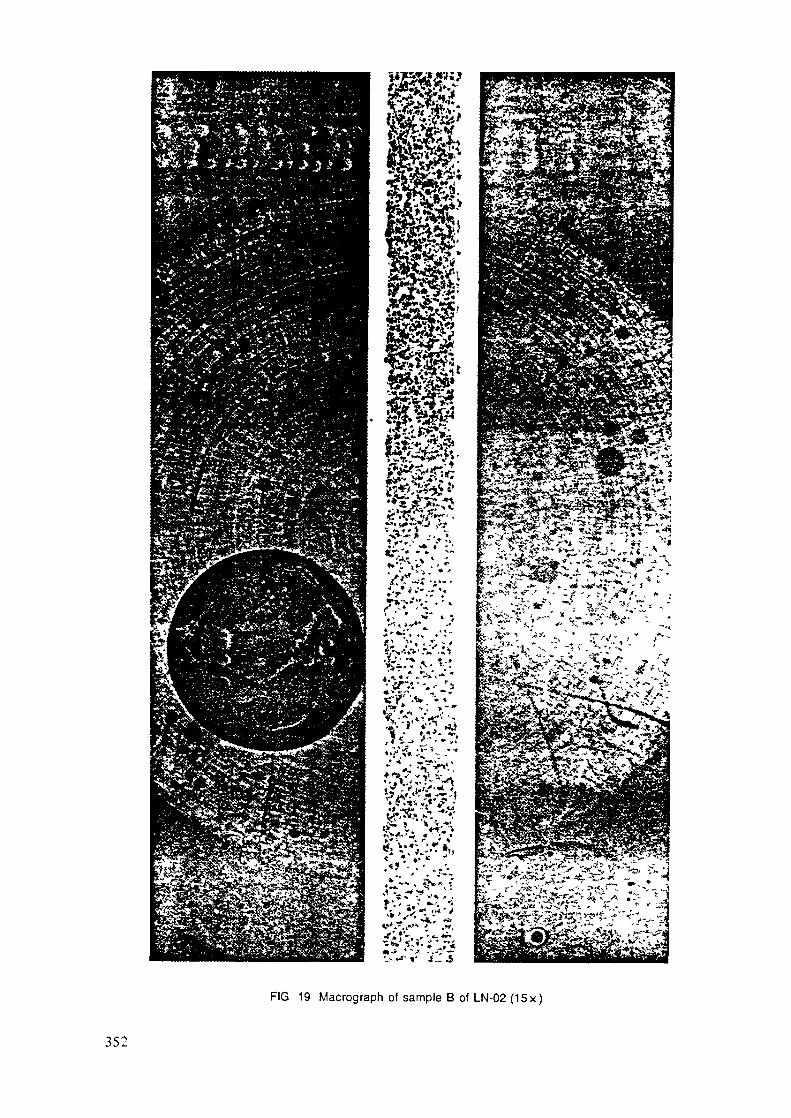
FIG 19 Macrograph of sample B of LN-02 (15x)
352

V J
400 X -r ^
FIG. 20. Unirradiated U3OB-AI (LN-02).
353

•v.«•. .*
.'%*'
FIG. 21. Irradiated U3O8-AI (LN-02, BU = 0.45).
354
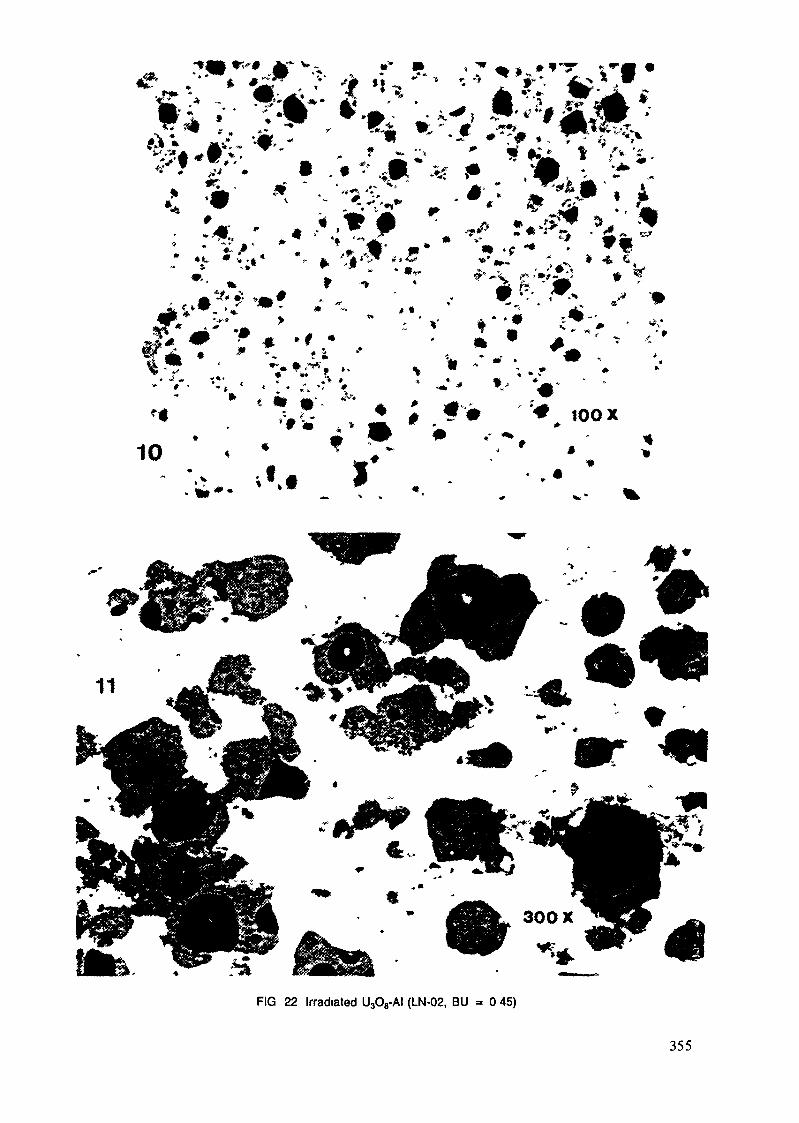
- .- .
*ft"
10
*
•*•, ^
fe Ar
— •*f. r100 X
FIG 22 Irradiated U3O8-AI (LN-02, BU = 0 45)
355
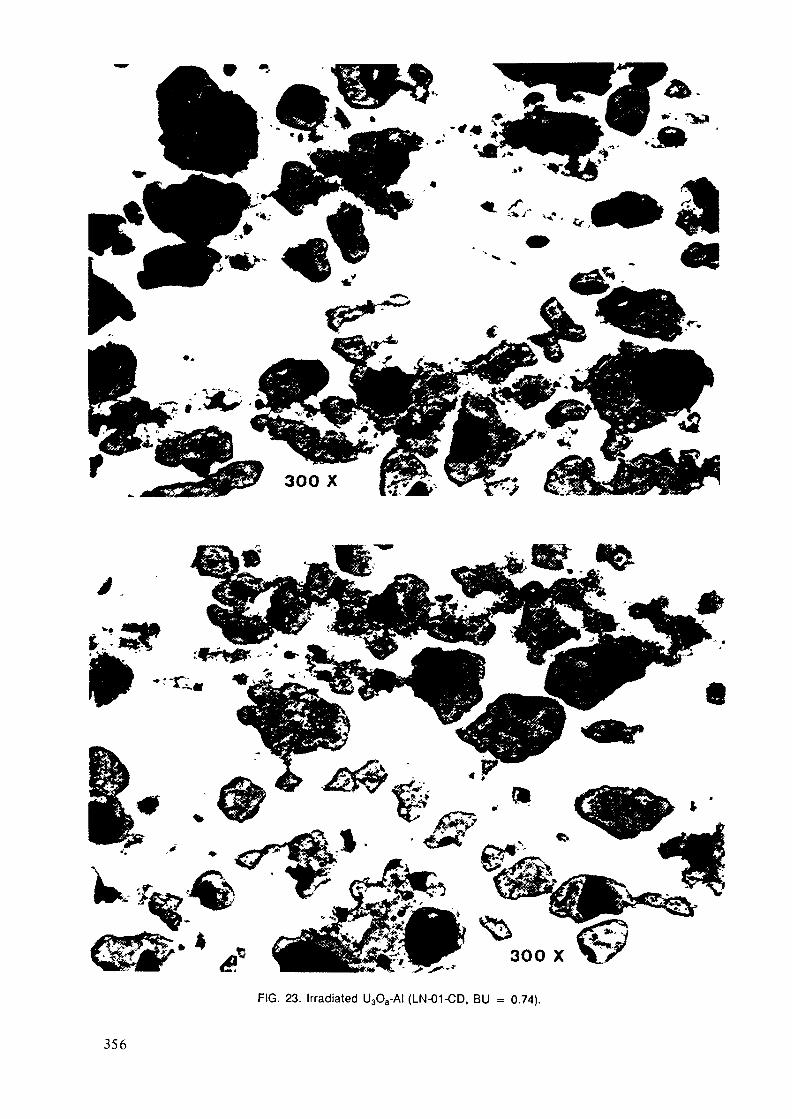
étzsatp •'•n
*•• %fr'^l
FIG. 23. Irradiated U3O8-AI (LN-01-CD, BU = 0.74).
356

.« -J-50 X
«* "^
* * * » * * / ^^ » "* ~ " " • * vC* * ^ *" * * ***v ** *"•* « •* *& ** *% ** *^* * * * % « »T * »>** * > > " * " » * , * <*
, * ** * - * ° 1 *U *"/. » A f**^ h * • • % , * * 1 f * jr «• * * '.,,- —— > • ,?! * ' , ^-" ; • , '- -; J- ' .'\ : . v V • „.- V*. ,'C» • « * . . - -^ ,»*» • »».,» ' — v , . » A**,_ « *t, •«• ,• , - • * , - * ''i ' • *.-•••*• -
'**<*! "'l*v * : v * t" *>% '^^- . v •*..-. '• A-'v^^-^r; -•>•-.-' - ^' •>• v--S5 • •'.. 'v-v?ar-^ .»- ." • - ' - r - - ^v.fJ^..- - : -<T*^ ' r.. - • . , - . * - ~-~ %*-.J-H^< - • ,-%-v - • .. . t. - ; * -. ^*„r» -5 «, • ». "^ -' - - • , •.. r*.t £*, * .... .1,- „ • t
^^^:?v5--/-^" ' ^
ç rf »-• %- * |*';t *»t v ^ ^ » « ^ ' v - ' * *•''\X<\^5^,<.:r:.r\^ \ , ,g6.vt>v. . /-fc^Nx;; .j. v 3 ^ -I* *•- . r-«*? VC^ '- *•* ' » * - - '.^ . <•• -., ^^ » * ^« •* i « # j7 1 I 4PMHM. * t f
*. *%^ » *- »•• ', A» \ « ^ « * • ? > . ^^ * " •
100 x
FIG. 24. Unirradiated UAI„-AI (LC-02).
357
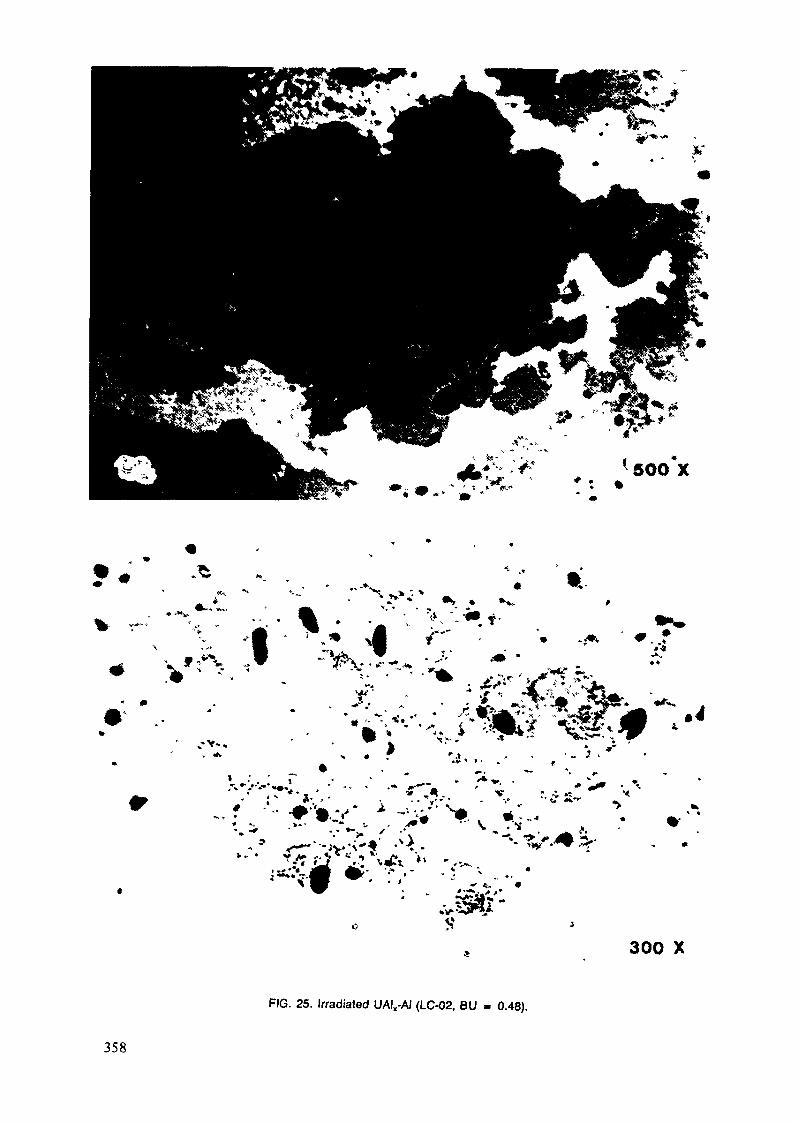
500 X* *r *•
«I
*
- -
% j» *•*.
x^-** ?"
f
300 X
FIG. 25. Irradiated UAI,-AI (LC-02, BU = 0.48).
358
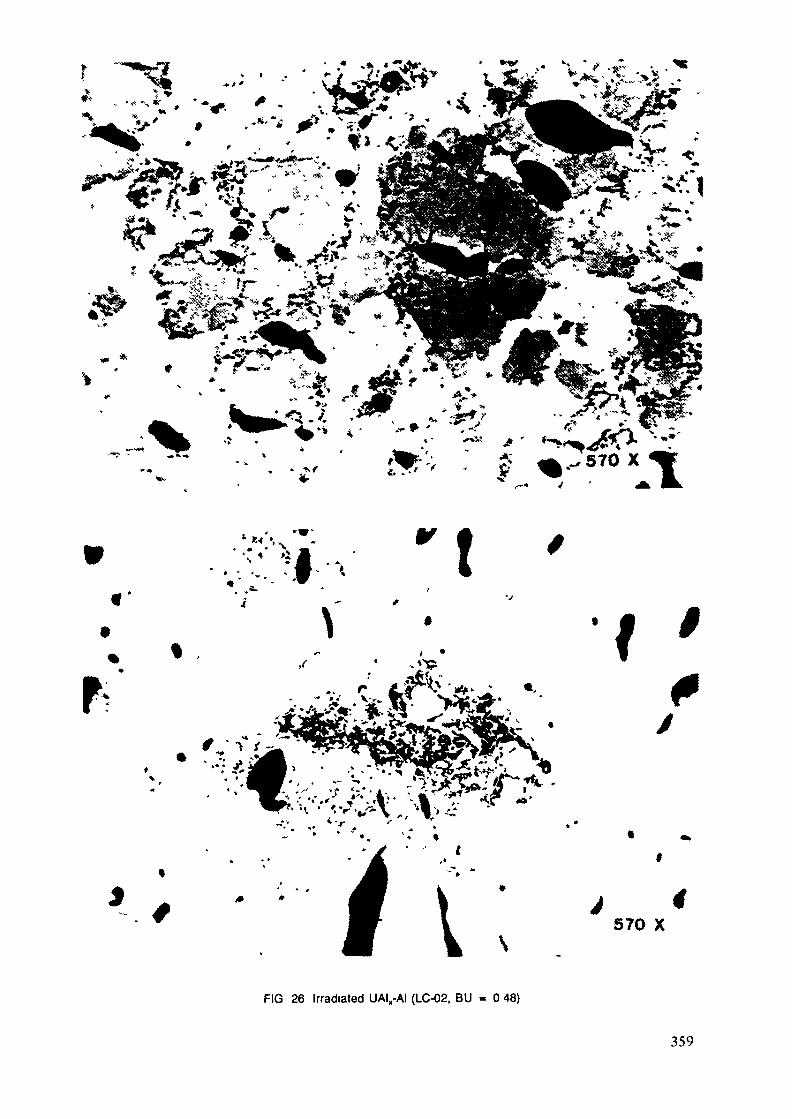
I tW
/
X» *
570 X
FIG 26 Irradiated UAI„-AI (LC-02, BU = 0 48)
359

limited extent of their incidence in the grain boundaries (see figure25). The practical reality of this was evident when samples for burn-upanalysis were taken. For this purpose small diameter discs were cut fromthe fuel plates by means of a punch-and-die device. Whenever the U„0„plates were punched, the hct-cell of^-pas alarm was triggered system-atically. Punching the UA1 puâtes had no such effect.yDuring post-irradiation examination of UA1 particulate material, oneadditional observation was made that may well be of secondary significance.In the dispersed fuel particles there is a more or less scatteredoccurrence of partial liquation at subgrain boundaries or other areas oflattice disorder, as illustrated by figure 26. As a matter of fact,during irradiation a secondary phase is formed that seems to agglomeratein the liquid state at the conditions which exist during reactoroperation. It could be assumed that the mixture of U and Al with agrowing fission product content, eventually attains a composition with asolidus temperature that is exceeded by the service temperature of thereactor fuel.The morphological changes that are associated with the increase of theburn-up level to 70-75% (test element LC-01-Cd), again are characterizedby an aggravation of the effects which have been observed at the inter-mediate burr-up level (see figure 27). The striking appearance ofbrittle cracks in the samples A and B of the particular fuel plate is aresult of bending forces occurring during the disengagement of the fuelplate from the test element structure. The extreme hardness of the UA1particles, which is the reason for their apparent brittleness, is anotherindication of very nearly complete retention of fission gas atoms in theUA1 crystal lattice, up to burn-up levels as high as 70-75%.
X
6.2.7. Blister testsIn order to investigate the tendency of irradiated fuel plates todevelop blisters at elevated temperatures, a nuirber of teet plate? vTeresubjected tc P hert trectirert up tc t er perrfuroj. of 55CCC.For this purpose a special furnace was designed and manufacturée?.Principally this furnace consists of two electrically heated copperblocks with a 4 mm gap in between for insertion of the test plate. Theheated section is supported by ceramic insulators and mounted in analuminium containment. An accurate (± 1°C) temperature measuring andcontrol system is connected to the furnace. Additional provisions tomeasure ai.d collect the released volatile fission product? veie rv?i!ab?p.The heat treatment of the test plates consists of a one step temperatureincrease from room temperature to 250°C, followed by steps of 50°C up to550°C. Each temperature step in turn is followed by a holdtime of 30minutes and subsequent visual inspection of the plate.From the results of the blister tests it appeared that only the U.O -Alfuel plates with high burn-up (75%) develop blisters in the fuel meatzone above 5?5°C. These blisters are located at mid l.cipht near the fueledge zone (see figure 28).For the remaining test plates no blister formatier ir the meat zone wasdetected for temperatures up to 550°C.Apart from the blistering in the meat zone some secondary observationswere made :- All the tested plates showed a discolouration on the surface of theAl-cladding in the meat zone, at temperatures of 475°C to 550°C (seefigure 29).
- For all the plates a permanent length increase of about 5 mm was foundafter heating up to 550°C (see figure 30).
- The plates with the UA1 -Al type fuel showed minor blister formationat the top and bottom or the plate, outside the fuel region (seefigure 31).
360

» •»*
.»* èI I
r300 X
300 X
FIG. 27. Irradiated UAI.-AI (LC-01-CD, BU = 0.73).
361
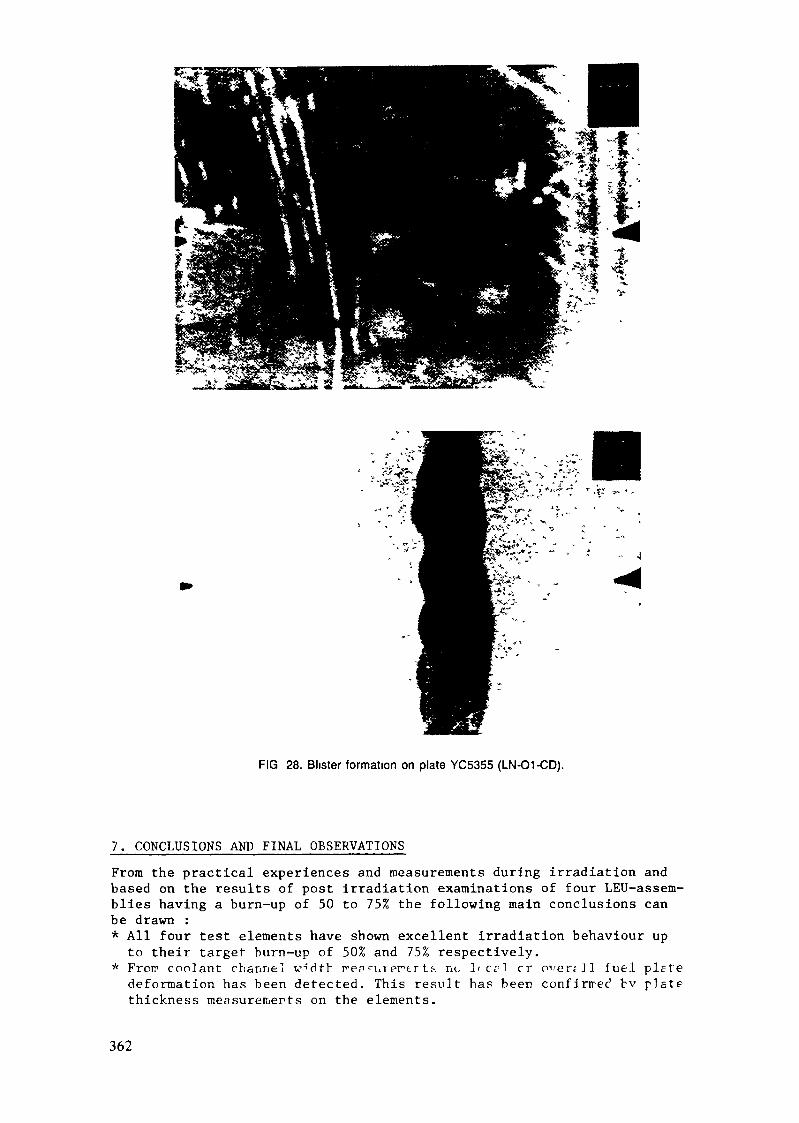
FIG 28. Blister formation on plate YC5355 (LN-O1-CD).
7. CONCLUSIONS AND FINAL OBSERVATIONSFrom the practical experiences and measurements during irradiation andbased on the results of post irradiation examinations of four LEU-assem-blies having a burn-up of 50 to 75% the following main conclusions canbe drawn :* All four test elements have shown excellent irradiation behaviour up
to their target burn-up of 50% and 75% respectively.* Froir coolant channel v'dtb rep^urertr ts no lr crl rr f"ert]l fuel plftedeformation has been detected. This result has been confirmed bv pistethickness measurements on the elements.
362

FIG. 29. Discolouration of the cladding surface.
631
630-
629-
628.
627-
626-
625-
ÉRI96-LC02Plate H20V20I I X
X
X
XX
X
TEMPERATURE (°C)
300—I—
«00 S 00 550
FIG. 30. Length increase of the test plate after heating.
* From detailed flux measurements it was found that LEU test elementswith non-fueled outer plates show distinct radial power peaking (20%)at the begin of irradiation. Application of cadmium poisoned sideplates reduces this power peaking in E-W direction (5-10%).
* Reactivity measurements show that the depletion of cadmium wires(d = 0.5 mm)nis completed at r. thermal r.eutrrr. flucrre cf0.5.10 cm~\1er future application cf crciriur-. PP s turrsble abrcrber in r LEl'-FFLcore the number of wires per side plate should be increased frcr 1C to
363

FIG 31 Minor blister formation outside the meat region
20. In that case the initial negative reactivity of the cadmiumpresent in the first (6 x 500 pcm) and second (6 x 125 pcm) fuel zonewill amount to 3750 pcm. At the end^of cycle (26 days, 45 MW) about750 pen remains. In this way the U burn-up effect will be,compen-sated properly by the cadmium depletion. In comparison with B, theapplication of cadmium will lead to a lower fuel inventory of theHFR-core.* Calculated and measured burn-up data are in good agreement (± 5%).* The results of chemical burn-up analyses on fuel plate samples fitwell with the burn-up distribution as measured with gamma-scanning(± 5%).
* At burn-up levels of 50% and 75% the calculated Pu-content amounts to12.5 g and 17.5 g per element respectively.
* At burn-up levels of 50% and 75% the calculated relative power productionof plutonium in 20% enriched LEU-elements amounts to 13% and 24% respec-tively.
* Metallography of ILO -Al fuel plates has indicated undisturbed bondintegrity between fuel meat and cladding. Fabrication induced internal
364

cracks have disappeared, whereas central cavities have formed withinthe fuel particles due to fission product diffusion and coalescingprocesses. An irradiation-induced U„0 -Al reaction zone of lowporosity has formed on the inner periphery of the fuel particles.
* Metallography of UA1 -Al fuel plates has equally shown good bondintegrity. Certain irradiation-induced changes in the porositystructure have been observed.
* Metallography of U»0R-A1 fuel plates has indicated undisturbed bondintegrity between fuel meat and cladding. Fabrication induced internalcracks have disappeared, whereas central cavities have formed withinthe fuel particles due to fission product diffusion and coalescingprocesses. A irradiation-induced U_0_-A1 reaction zone of low porosityhas formed on the inner periphery of the fuel particles.
* Metallography of UA1 -Al fuel plates has equally shown good bondintegrity. Certain irradiation-induced changes in the porositystructure have been observed.
* Blister test on irradiated U_0 -Al fuel plates with a burn-up of 75%have shown significant blister formation in the meat zone at midheight at 525°C (see figure 28). For lower burn-up levels (50%) noblisters have been detected for the same fuel type.
* As regards the UA1 -Al plates no blister formation in the meat zonehas been observed up to 550°C.
* During the blister tests a thermal expansion of the plates of 1% at525°C was measured (see figure 30). Some of the plates had becomesomewhat warped after heating.
* For all the tested plates a clear discolouration of the plate surfacein the meat region was observed at 500°C (see figure 29).
* The UA1 plates show a minor blister development in the outer meatregion at the top and bottom of the plate at 550°C (see figure 31).
REFERENCES
|1| Pruimboom, H. and Swanenburg de Veye, R.J."Status report on the irradiation of LEU-test elements in the PettenHigh FLux Reactor"
|2| Van Otterdijk, K.H.Coolant channel measurements on irradiated LEU-elemerts(LOUISE-PI 96)ECN-83-157October 1983.
J3l Passei, G. and BruggelJng, F.J.Gainina scan measurements on irradiated LFU test elements LC-0?,LC-01-CD, LN-02 and LN-01-CDECN-85-044, ECN-85-045, ECN-85-042 and ECN-85-043March 1985
|4| Lijbrink, E.Effects of fission process on the morphology of the uraniumcontaining material component in reduced enrichment HFR test elementfuel platesECN-85-002October 1984
|5| de Haan, K.W.Visual inspection, dismantling and blister testing of irradiated LEUtest elements LN02, LC02, LN01CD and LC01CD (LOUISE-R196)ECN-84-M1September 1984
365
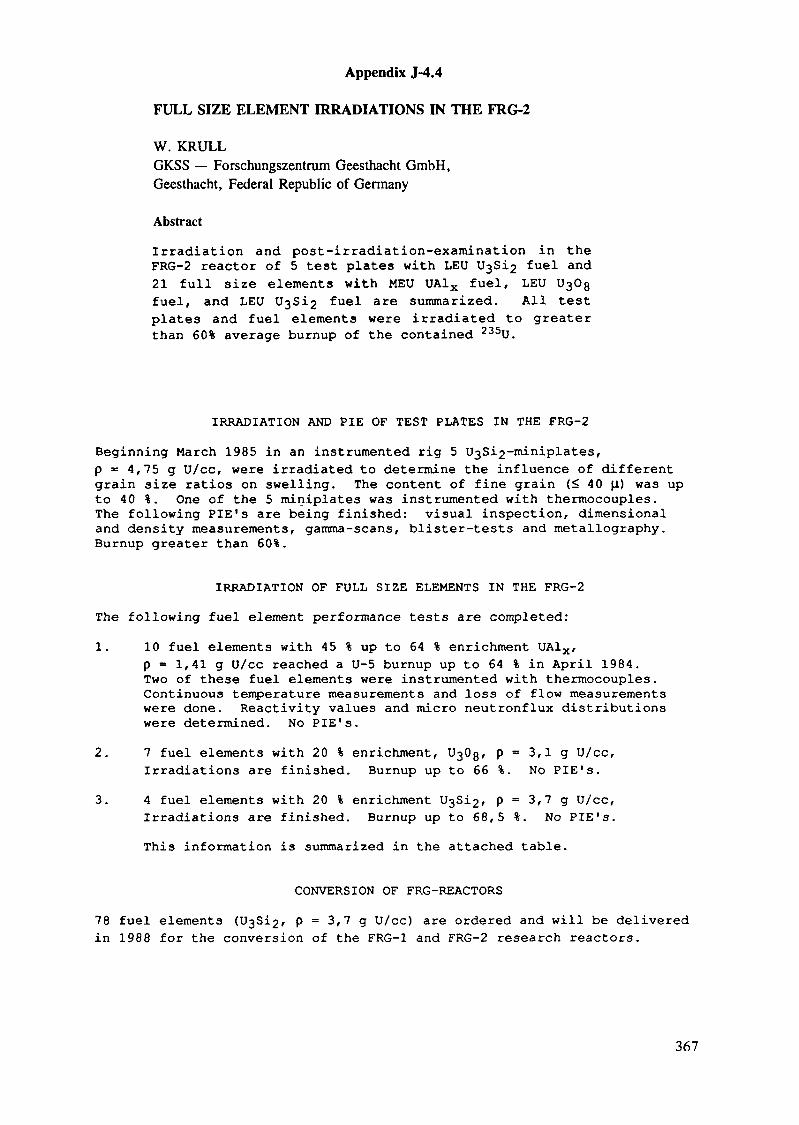
Appendix J-4.4
FULL SIZE ELEMENT IRRADIATIONS IN THE FRG-2
W. KRULLGKSS — Forschungszentrum Geesthacht GmbH,Geesthacht, Federal Republic of Germany
Abstract
Irradiation and post-irradiation-examination in theFRG-2 reactor of 5 test plates with LEU 1)38x2 fuel and21 full size elements with MEU UAlx fuel, LEU U308fuel, and LEU U3Si£ fuel are summarized. All testplates and fuel elements were irradiated to greaterthan 60% average burnup of the contained 235U.
IRRADIATION AND PIE OF TEST PLATES IN THE FRG-2
Beginning March 1985 in an instrumented rig 5 U3Si2-miniplates,p = 4,75 g U/cc, were irradiated to determine the influence of differentgrain size ratios on swelling. The content of fine grain {< 40 n) was upto 40 %. One of the 5 miniplates was instrumented with thermocouples.The following PIE's are being finished: visual inspection, dimensionaland density measurements, gamma-scans, blister-tests and metallography.Burnup greater than 60%.
IRRADIATION OF FULL SIZE ELEMENTS IN THE FRG-2
The following fuel element performance tests are completed:1. 10 fuel elements with 45 % up to 64 % enrichment UA1X,
p = 1,41 g U/cc reached a U-5 burnup up to 64 % in April 1984.Two of these fuel elements were instrumented with thermocouples.Continuous temperature measurements and loss of flow measurementswere done. Reactivity values and micro neutronflux distributionswere determined. No PIE's.
2. 7 fuel elements with 20 % enrichment, Og, p = 3,1 g U/cc,Irradiations are finished. Burnup up to 66 %. No PIE's.
3. 4 fuel elements with 20 % enrichment U3Si2, p = 3,7 g U/cc,Irradiations are finished. Burnup up to 68,5 %. No PIE's.This information is summarized in the attached table.
CONVERSION OF FRG-REACTORS
78 fuel elements (U3Si2, p = 3,7 g U/cc) are ordered and will be deliveredin 1988 for the conversion of the FRG-1 and FRG-2 research reactors.
367
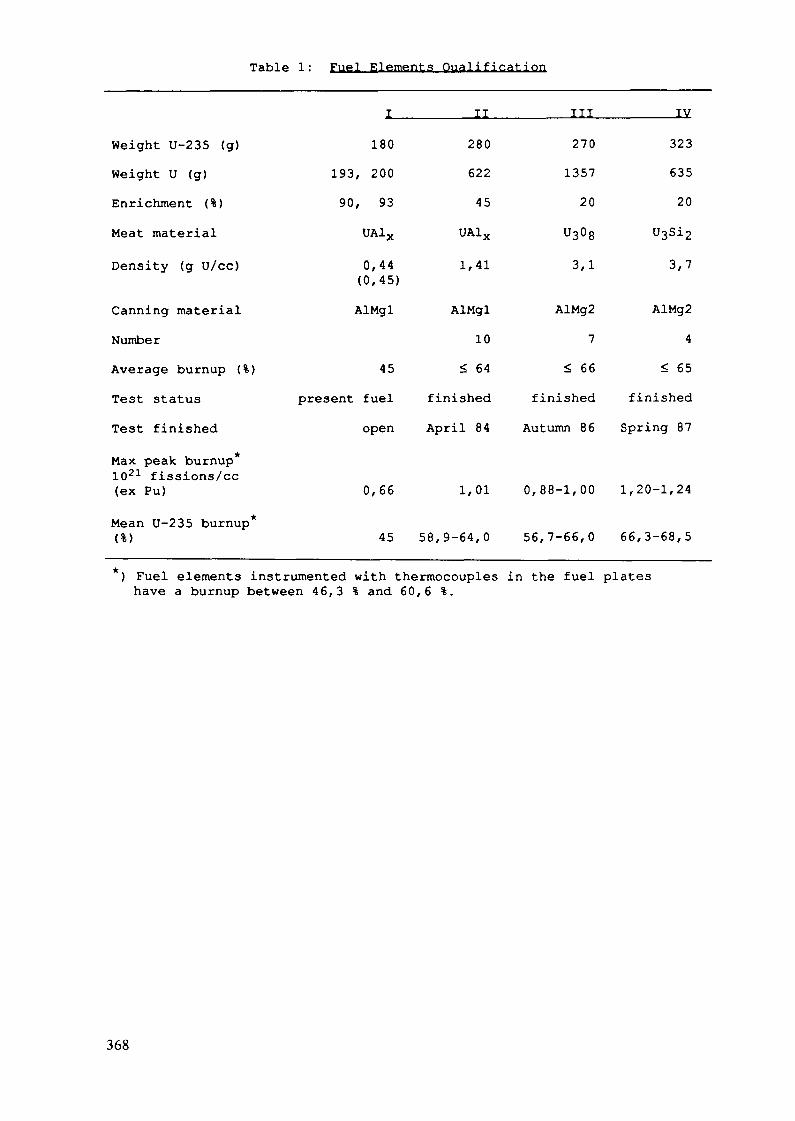
Table 1 : Fuel Elements Qualification
Weight U-235 (g)Weight U (g)Enrichment (%)Meat material
Density (g U/cc)
Canning materialNumber
Average burnup (%)Test statusTest finished
T
180193, 20090, 93
UA1X
0,44(0,45)AlMgl
45
present fuelopen
II
28062245
UA1X
1,41
AlMgl
10
< 64
finished
April 84
III
2701357
20
U308
3,1
AlMg27
< 66finished
Autumn 86
IV
323635
20U3si2
3,7
AlMg2
4
< 65
finished
Spring 87
Max peak burnup1021 fissions/cc(ex Pu)
Mean U-235 burnup*
0,66 1,01 0,88-1,00 1,20-1,24
45 58,9-64,0 56,7-66,0 66,3-68,5
) Fuel elements instrumented with thermocouples in the fuel plateshave a burnup between 46,3 % and 60,6 %.
368

Appendix J-4.5
THE CONVERSION OF NRU FROM HEU TO LEU FUEL*
D.F. SEARS, M.D. ATFIELD, I.C. KENNEDYChalk River Nuclear Laboratories,Atomic Energy of Canada Limited,Chalk River, Ontario,Canada
Abstract
The program at Chalk River Nuclear Laboratories (CRNL) todevelop and test low-enriched uranium fuel (LEU, <20% U-235) isreviewed, and the status of the conversion of the NRU reactorfrom highly enriched uranium (HEU, 93% U-235) to LEU fuel isdiscussed. The replacement LEU fuels developed and tested atCRNL contain high-density uranium suicide particles dispersedin aluminum, in cylindrical rods. The suicides tested includeU3Si, USiAl, USi*Al and U3Si2 (U-3.96 wt% Si; U-3.5 wt% Si-1.5wt% Al; U-3.2 wt% Si-3 wt% Al; U-7.3 wt% Si, respectively).Fuel elements were fabricated with uranium loadings suitablefor NRU, 3.15 gU/cm3, and for NRX, 4.5 gU/cm3, and wereirradiated under normal fuel-operating conditions. Eightexperimental irradiations involving 100 mini-elements and 84full-length elements (7xl2-element rods) were completed toqualify the LEU fuel and the fabrication technology. Post-irradiation examinations confirmed that the performance of theLEU fuel, and that of a medium-enrichment uranium (MEU, 45%U-235) alloy fuel tested as a back-up, was comparable to theHEU fuel. The uranium suicide dispersion fuel swelling wasapproximately linear up to burnups exceeding NRU's designterminal burnup (80 at%). NRU was partially converted to LEUfuel when the first 31 prototype fuel rods manufactured withthe production equipment were installed in the reactor. Therods were loaded in NRU at a fueling rate of about two rods perweek over the period 1988 September to December. This partialLEU core (one third of a full NRU core) has allowed the reactorengineers and physicists to evaluate the bulk effects of theLEU conversion on NRU operations. As expected, the irradiationis proceeding without incident.
1. INTRODUCTION
The NRU reactor at CRNL is a multipurpose, tank-type thermal researchreactor, using D2Û moderator and coolant and highly enriched uranium (HEU,93% U-235) U-A1 alloy driver fuel. Various kinds of rod assemblies aresuspended in the tank on a 7 1/4 in (19.7 mm) hexagonal lattice. Thereactor produces radioisotopes, provides neutron beams for research, andhas special facilities for testing metallurgical specimens and advancedpower reactor fuels, and for performing fuel damage (blowdown) tests.
* Paper presented at the International Symposium on Research Reactor Safety, Operations and Modifica-tions, Chalk River, Ontario, Canada, 23-27 October 1989 (AECL-9926, Vol. 3, Chalk River Nuclear Laborato-ries, Ontario (1990)).
369

The NRU reactor achieved criticality in 1957 and ran at 220 MW (Th) usingdriver fuel rods containing flat plates of natural uranium metal. It wasconverted to highly enriched, rod-type driver fuel in 1964, and currentlyruns at about 130 MW (Th). The linear-fissile loading of each 2.7 m longfuel element (twelve per rod) has risen from 0.3 g U-235/cm to the present1.8 g U-235/cm. Roughly 90 of the 227 reactor sites are occupied bydriver fuel, and these are taken to approximately 80% burnup in 11 months.As part of an international effort to reduce the use of HEU, and the riskof nuclear proliferation, a development program was undertaken in 1980 toproduce low enrichment uranium (LEU, <20% U-235) driver fuel for NRU.CRNL's progress has been reported at annual meetings sponsored by the U.S.Reduced Enrichment for Research and Test Reactors (RERTR) program [1-4].The salient features of the LEU fuel development and testing program, andthe current status of the NRU conversion program are reviewed in thispaper . The LEU fuel burnup analysis has recently been completed usinghigh-precision liquid chromatography, and where appropriate, the analyzedburnup values will be given.
2. FUEL DEVELOPMENT AND FABRICATION
The NRU fuel-rod design which consists of twelve elements, each containingan HEU-AI alloy core with finned aluminum cladding and aluminum end plugs(see Figure 1), has proven to be extremely durable and reliable. Thegeometry, dimensions and linear fissile loading of this 12-element fuelrod were maintained in the LEU conversion program for licensingsimplicity. CRNL physics studies showed very little effect on reactoroperations from using LEU driver rods, apart from the need to fuel 6 morereactor sites or reduce exit burnup by about 10%. The problem thus camedown to the development of a replacement fuel with five times the HEU fueluranium density, which would be stable to high burnup.
The replacement LEU fuel elements consist of a core, containing high-density uranium suicide particles dispersed in an aluminum matrix, withthe same finned aluminum cladding and end plugs. The fuel is made bymelting uranium and silicon in a high-frequency induction furnace. Castbillets are heat-treated to transform the as-cast structure to UjSi, thenthe billets are reduced to powders via a series of comminution processes.Uranium suicide powder is mixed with aluminum powder and hot-extrudedinto cores. The finned aluminum cladding is extruded onto the cores in asemi -continuous process, with the cores acting as a floating mandrel. Thecladding is welded to the end-plugs to hermetically seal the elements.
The high-density suicides tested were Si, Si alloyed with -1.5 wt% Aland 3 wt% Al , and U3Si2 (U-3.96 wt% Si; U-3.5 wt% Si-1.5 wt% AL; U-3.2 wt%Si-3 wt% Al, and U-7.3 wt% Si, respectively). Fuel elements werefabricated with uranium loadings suitable for NRU, 3.15 gU/cm , and forNRX, 4.5 gU/cm3. Following the decision to shut down NRX, testing of NRX-type fuel was discontinued.
Industrial-scale fuel -production equipment has been installed in temporaryfacilities at CRNL, and is currently being used to manufacture prototypefuel rods to familiarize the operators with the manufacturing process, andto confirm that the production rate is high enough to meet CRNL's annualfuel requirements. To date, more than 90 kg of LEU has been processed intoNRU rods (see section 4) and the production line is runningsatisfactorily. Most of the process variables and parameters established
370

I—nORIFICE SECTION
-.UM-
FLOW SPACER
TUT
mw
FUEL ELEMENTS 1121
FLOW SPACERS 161
FLOW TUBE
HANGER PLATE
DOUBLE BULGE END
Fig. 1 NRU fuel rod.
during the development program have been used in the production line andno problems have resulted from scaling up.
A new building has been constructed for LEU fuel fabrication. Themanufacturing equipment is scheduled for installation and re-commissioningin late 1989. It is anticipated that full-scale production of NRU LEU fuelwill commence early in 1990 in the new building, and the first productionfuel rods will be loaded into NRU later that year. NRU should becompletely converted to LEU fuel within a year of the first production ofLEU fuel rods in the new building.
3. LEU SILICIDE DISPERSION FUEL TESTING
3.1. Test ElementsThe test vehicle for irradiating suicide dispersion fuel in most testshas been the mini-element. The mini-element fuel-core diameter (5.5 mm)and clad wall thickness (0.76 mm) are the same as in full-size NRUelements. Mini-elements are, however, only 184 mm long compared with 2.9mfor NRU elements. The mini-elements also resemble NRU elements in thatthey have six cooling fins at 60° intervals around the cladding, the finwidth being 0.76 mm and fin height 0.96 mm. To date, approximately 100mini-elements have been successfully irradiated to burnups in the range56-93% U-235 depletion in the NRU and NRX reactors.
371
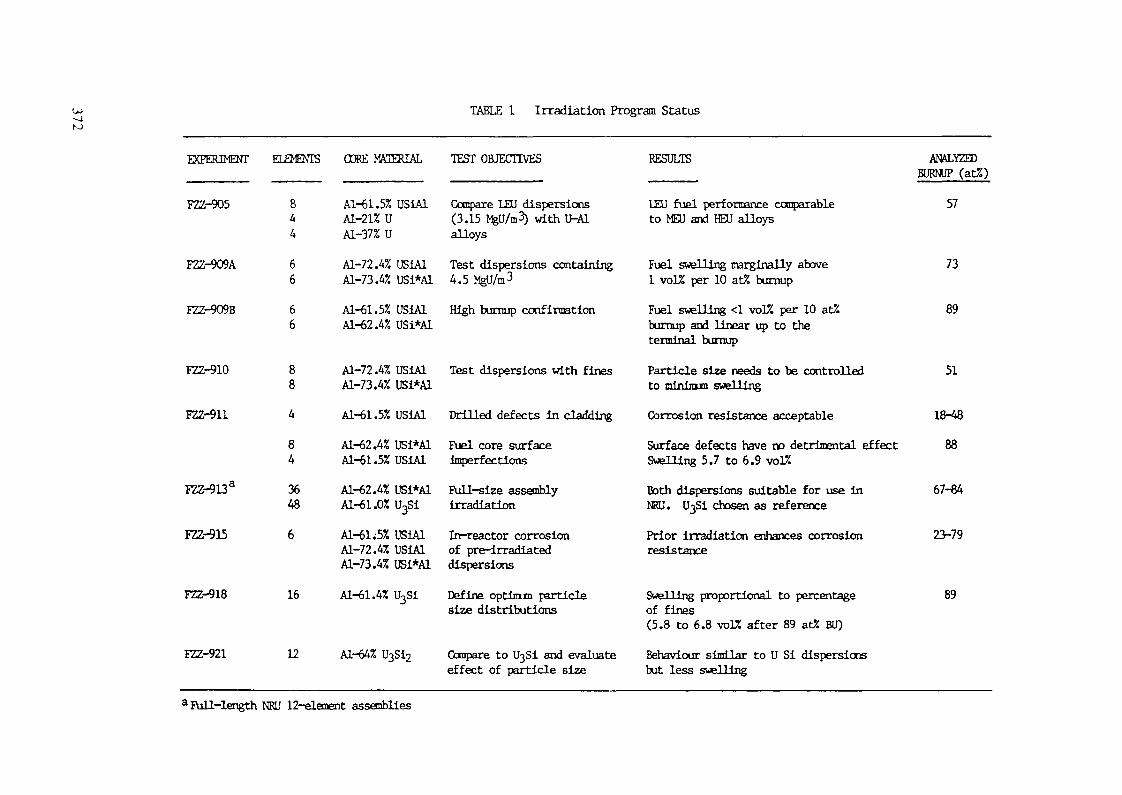
TABLE 1 Irradiation Program Status
EXPERIMENT
FZZ-905
FZZ-909A
FZZ-909B
FZZ-910
FZZ-911
FZZ-913a
FZZ-915
FZZ-918
FZZ-921
ELEMENTS
844
66
66
884
843648
6
16
12
CORE MATERIAL
Al-61.5% USIA1AI-21% UAI-37% U
Al-72.4% USiAlAl-73.4% USi*AlAl-61.5% USiAlAl-62.4% USi*Al
Al-72.4% USiAlAl-73.4% USi*AlAl-61.5% USiAlAl-62.4% USi*AlAl-61.5% USiAlAl-62.4% USi*AlAl-61.0% U3SiAl-61;5% USiAlAl-72.4% USiAlAl-73.4% USi*AlAl-61.4% U3Si
Al-64% U3Si2
TEST OBJECTIVES
Compare LEU dispersions(3.15 MgU/m3) with U-A1alloysTest dispersions containing4.5 MgU/m3
High burnup confirmation
Test dispersions with fines
Drilled defects in claddingFuel core surfaceimperfections
Full-size assemblyirradiationIn-reactor corrosionof pre-irradiateddispersionsDefine optimum particlesize distributions
Compare to U3Si and evaluateeffect of particle size
RESULTS
LEU fuel performance comparableto MEU and HEU alloys
Fuel swelling marginally above1 vol% per 10 at% burnupFuel swelling <1 volX per 10 at%burnup and Unpar up to theterminal burnup
Particle size needs to be controlledto tnininiTTi swelling
Corrosion resistance acceptableSurface defects have no detrimental effectSwelling 5.7 to 6.9 vo!2Both dispersions suitable for use inNRU. U3Si chosen as referencePrior irradiation enhances corrosionresistance
Swelling proportional to percentageof fines(5.8 to 6.8 vo!2 after 89 at% BU)
Behaviour similar to U Si dispersionsbut less swalling
ANALYZEDBURNUP (at%)
57
73
89
51
18-4888
67-84
23-79
89
aPull-length NRU 12-element assemblies

3.2. Irradiation Conditions
The LEU suicide dispersion fuels were irradiated in NRU. A medium-enrichment uranium (MEU, 45% U-235) fuel tested as a backup was irradiatedin NRX. The mini-elements were irradiated in a fuel carriage made from analuminum cylinder with four holes bored axially through it at 90°intervals. An aluminum liner containing a string of four mini-elementswas inserted into each hole or flow channel. The mini-elements werelocated centrally in the flow channels by four-pronged anodized spiderslocated on the end spigots of the mini -elements. The assembly could beloaded in any of the normal driver fuel positions in NRU.The mini-elements were irradiated at linear powers representative of atypical NRU driver fuel rod, ranging from 40 to 112 kW/m. The typicalneutron flux was approximately 1.1 x 10 ° n/ra /s, the heavy-water coolantflow approximately 7.28 L/s, and coolant velocity approximately 10.9 m/s.The coolant inlet temperature ranged between 30 to 37°C and the coolantoutlet temperature between 40 to 45°C during the mini-elementirradiations.
3.3. Mini-Element Test Results
The fuel test matrix is shown in Table 1. The detailed results werereported elsewhere [1-4], therefore only the salient features of theirradiations will be reported here.
3.3.1. Comparison of HEU-Al and LEU Suicide Dispersion Fuel Performance
In Exp-FZZ-905, mini-elements containing AI-21 wt% U alloy fuel (93%enriched U), Al-37 wt% U alloy fuel (45% enriched U) and Al-61.5 wt%USiAL (20% enriched U) suicide dispersion fuel, with 0.63 gU-235/cm3, thefissile loading suitable for use in NRU (and for the new MAPLE-Xreactors), were irradiated to 57% U-235 burnup (analyzed). The elementswere in excellent condition after irradiation; they appeared as they didin the as-fabricated condition except for a dull oxide layer on thecladding. Post-irradiation examinations (PIE) showed that the performanceof the uranium suicide dispersion and the MEU alloy fuel was comparableto the HEU alloy fuel. All element diametral changes were less than 1.6%and length changes were within 0.2% after 57 at% burnup. As shown inFigure 2, the Al-HEU fuel microstructure remained essentially unchangedafter irradiation but the LEU suicide particles reacted with the aluminummatrix material, forming a thin interfacial layer, probably UAlj withdissolved Si, around the fuel particles. Fission-gas bubbles ranging insize up to 5 /im were contained in the kernels of the fuel particles.Considerably less fission-gas bubbles were retained in the interfaciallayers. Fuel-core swelling ranged between 3.4 to 4.5 vol% at the exitburnup. From the results it appears that all three materials swell atroughly the same rate, up to 57 at% burnup.
3.3.2. High-Burnup Confirmation
In the Exp-FZZ-909B irradiation, mini-elements containing the USiAl andUSi*Al dispersions, with 3.15 gU/cra^, were irradiated up to 89 at% burnup(analyzed). Immersion density measurement indicated that the cores hadswollen by 5.92-7.63 vol% after 77 at% burnup and by 6.57-7.76 vol% after89 at% burnup, see Figure 3. These results showed swelling wasapproximately linear right up to 89 at% burnup, and confirmed that NRU-composition suicide dispersion fuels could exceed the design terminalburnup (80 at%) without exceeding the threshold of breakaway swelling.
373
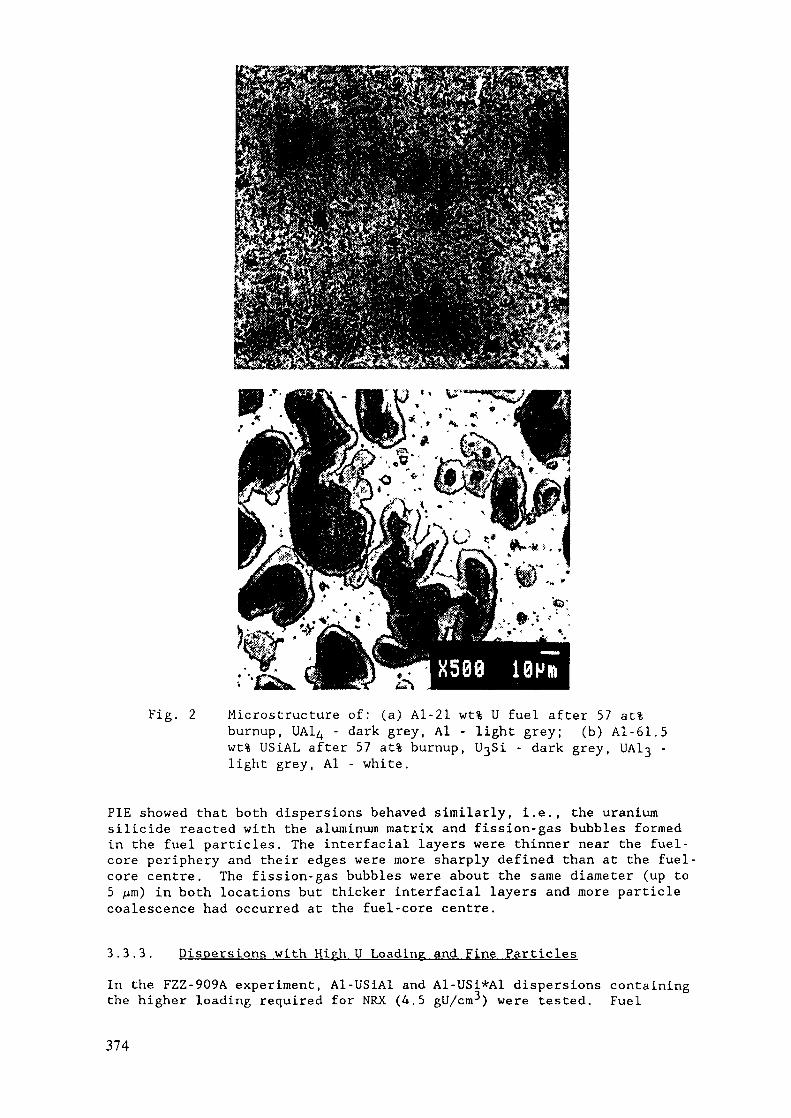
Fig. 2 Microstructure of: (a) Al-21 wt% U fuel after 57 at%burnup, UAl^ - dark grey, Al - light grey; (b) Al-61.5wt% USiAL after 57 at% burnup, U3Si - dark grey, UA13 -light grey, Al - white.
PIE showed that both dispersions behaved similarly, i.e., the uraniumsuicide reacted with the aluminum matrix and fission-gas bubbles formedin the fuel particles. The interfacial layers were thinner near the fuel-core periphery and their edges were more sharply defined than at the fuel-core centre. The fission-gas bubbles were about the same diameter (up to5 /jm) in both locations but thicker interfacial layers and more particlecoalescence had occurred at the fuel-core centre.
3.3.3. Dispersions with High U Loading and Fine Particles
In the FZZ-909A experiment, Al-USiAl and Al-USi*Al dispersions containingthe higher loading required for NRX (4.5 gU/cm^) were tested. Fuel
374
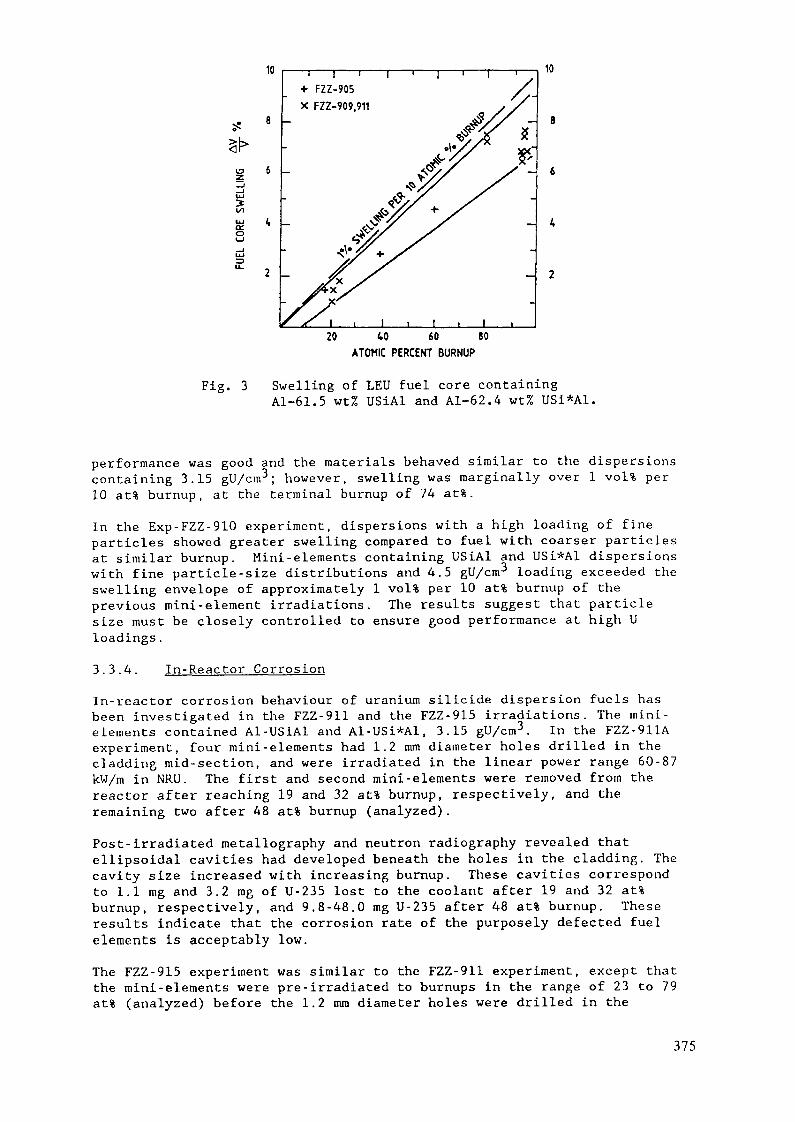
10
l>
u i,ce *o
2 _
' l ' l+ FZZ-905X FZ2-909.911
l
10
Fig. 3
20 40 60 80ATOMIC PERCENT BURNUP
Swelling of LEU fuel core containingAl-61.5 wt% USiAl and Al-62.4 wt% USi*Al,
performance was good and the materials behaved similar to the dispersionscontaining 3.15 gU/cm3; however, swelling was marginally over 1 vol% per10 at% burnup, at the terminal burnup of 74 at%.
In the Exp-FZZ-910 experiment, dispersions with a high loading of fineparticles showed greater swelling compared to fuel with coarser particlesat similar burnup. Mini-elements containing USiAl and USi*Al dispersionswith fine particle-size distributions and 4.5 gU/cm3 loading exceeded theswelling envelope of approximately 1 vol% per 10 at% burnup of theprevious mini-element irradiations. The results suggest that particlesize must be closely controlled to ensure good performance at high Uloadings.
3.3.4. In-Reactor CorrosionIn-reactor corrosion behaviour of uranium suicide dispersion fuels hasbeen investigated in the FZZ-911 and the FZZ-915 irradiations. The mini-elements contained Al-USiAl and Al-USi*Al, 3.15 gU/cm3. In the FZZ-911Aexperiment, four mini-elements had 1.2 mm diameter holes drilled in thecladding mid-section, and were irradiated in the linear power range 60-87kW/m in NRU. The first and second mini-elements were removed from thereactor after reaching 19 and 32 at% burnup, respectively, and theremaining two after 48 at% burnup (analyzed).
Post-irradiated metallography and neutron radiography revealed thatellipsoidal cavities had developed beneath the holes in the cladding. Thecavity size increased with increasing burnup. These cavities correspondto 1.1 mg and 3.2 mg of U-235 lost to the coolant after 19 and 32 at%burnup, respectively, and 9.8-48.0 mg U-235 after 48 at% burnup. Theseresults indicate that the corrosion rate of the purposely defected fuelelements is acceptably low.The FZZ-915 experiment was similar to the FZZ-911 experiment, except thatthe mini-elements were pre-irradiated to burnups in the range of 23 to 79at% (analyzed) before the 1.2 mm diameter holes were drilled in the
375

cladding. These elements were further irradiated in the NRU reactor toevaluate the performance of the defective fuel, and during the additional38 full-power days no increase in activity in the coolant above the normalbackground was detected. Neutron radiography and metallographicexaminations revealed that the cavities were typically 0.7 mm deep by 1.3mm across, i.e., only marginally larger than the original cavity made bythe drill tip. These results indicate that the corrosion resistance of theLEU fuel is possibly increased by previous burnup.
3.3.5. Fuel-Core Surface Imperfections
The objective of the FZZ-911B experiment was to evaluate the performanceof intact mini-elements having slight as-fabricated or deliberatelyintroduced imperfections (machined grooves) in .the core surface. However,the mini-elements contained the same fine particles that caused enhancedswelling in Exp-FZZ-910. Therefore, examinations were also carried out todetermine the effects of the fine particle size on the core swelling whenthe loading is 3.15 gU/cm .
Post-irradiation examinations revealed that the aluminum cladding hadflowed into and filled the surface defects. More importantly, the corevolume of the FZZ-911B mini-elements had only increased by approximately4.9% after approximately 60 at% burnup compared with 7.0 to 17.5% swellingin the FZZ-910 cores at about the same burnup. Swelling was 7.1 vol%after 80 at% burnup. These results indicate that core surface defects hadno detrimental effect on fuel performance, and fuel swelling wasacceptable at the lower suicide loading required for NRU, even when fineparticles were used.
3.3.6. Effect of Particle Size on Core Swelling
In the Exp-FZZ-918 experiment, 16 mini-elements containing Al-61.4 wt%uranium suicide were irradiated in NRU to help establish limits on theparticle-size distribution to be used in the manufacturing specifications.The mini-elements were divided into 4 groups, each group containingprogressively lower fractions of fines (particles less than 44 pm insize).
Fuel swelling was linear with burnup, and to a first approximationproportional to the percentage of fines contained. After 89 at% burnup(analyzed) the mini-elements containing a high proportion of fines swelledby 6.6 to 6.8 vol% while the mini-element with a low fraction of finesswelled by 5.8 vol%.
3.3.7. AL-UßSio Dispersion Fuel
We have recently expanded the program to include UjSi2 dispersions tocomplement the UßSi line. Twelve Al-U3Si2 mini-elements (3.15 gU/cnr) werefabricated with a variety of particle-size distributions and installed inNRU in 1988 June. The assembly was removed for interim post-irradiationexaminations after reaching approximately 60 and 80 at% burnup, then itwas returned to the reactor to continue the irradiation to 93 at% burnup.Metallographic examinations showed that the U^Si2 fuel behaved similarlyto the U3$i dispersions. An interfacial layer formed around the fuelparticles, and fission-gas bubbles, ranging in diameter up to 10 /im, couldbe seen in the fuel particles. The UßSi2 was not heat treated, andcontained 4 wt% free uranium, the highest level expected from local non-uniformity in full-size castings. This appeared to have no detrimentaleffect on fuel performance. However, no swelling dependence on particle-
376
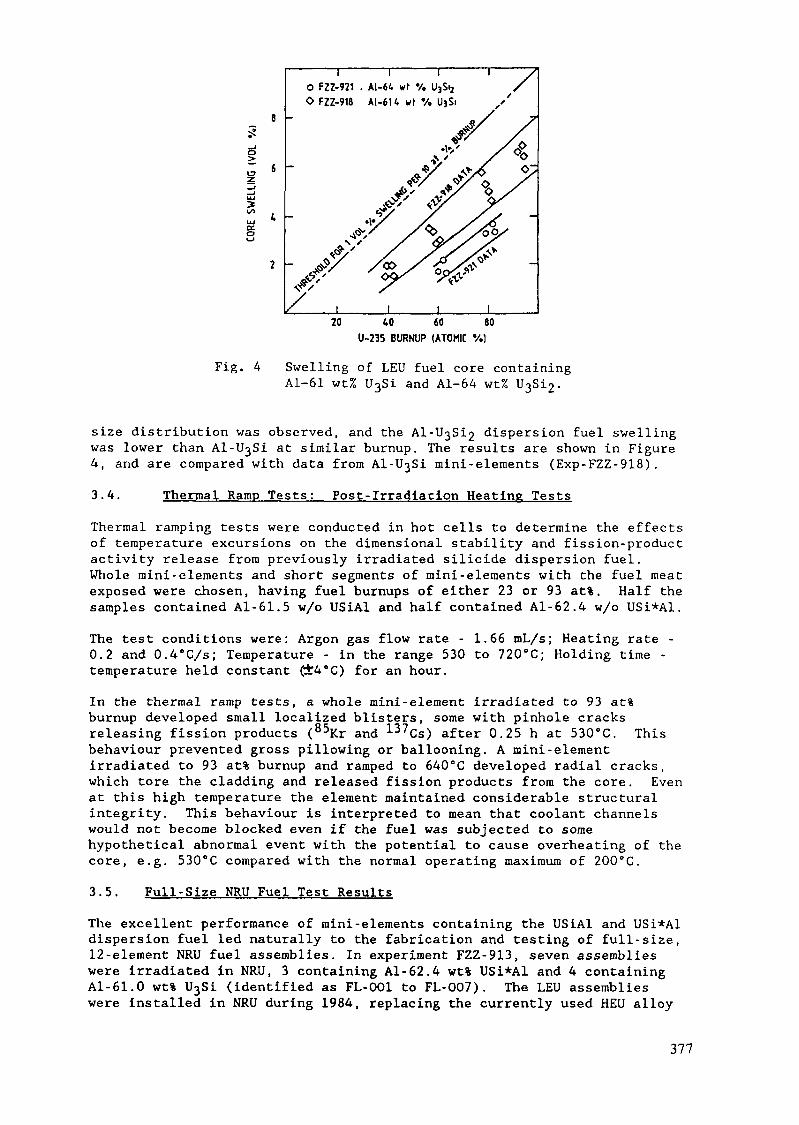
o>
l/l
I I IO FZZ-921 . Al-6t wf % U3Si2O FZZ-918 AI-614 wf V. UjSi
20 40 60 80U-235 BURNUP (ATOMIC V.)
Fig. 4 Swelling of LEU fuel core containingAl-61 wt% U3Si and Al-64 wt%
size distribution was observed, and the Al-U3Si2 dispersion fuel swellingwas lower than Al-U3Si at similar burnup. The results are shown in Figure4, and are compared with data from Al-U3Si mini-elements (Exp-FZZ-918).3.4. Thermal Ramp Tests: Post-Irradiation Heating Tests
Thermal ramping tests were conducted in hot cells to determine the effectsof temperature excursions on the dimensional stability and fission-productactivity release from previously irradiated suicide dispersion fuel.Whole mini-elements and short segments of mini-elements with the fuel meatexposed were chosen, having fuel burnups of either 23 or 93 at%. Half thesamples contained Al-61.5 w/o USiAl and half contained Al-62.4 w/o USi*Al.
The test conditions were: Argon gas flow rate - 1.66 mL/s; Heating rate -0.2 and 0.4°C/s; Temperature - in the range 530 to 720°C; Holding time -temperature held constant Ct4°C) for an hour.In the thermal ramp tests, a whole mini-element irradiated to 93 at%burnup developed small localized blisters, some with pinhole cracksreleasing fission products (85Kr and 137Cs) after 0.25 h at 530°C. Thisbehaviour prevented gross pillowing or ballooning. A mini-elementirradiated to 93 at% burnup and ramped to 640°C developed radial cracks,which tore the cladding and released fission products from the core. Evenat this high temperature the element maintained considerable structuralintegrity. This behaviour is interpreted to mean that coolant channelswould not become blocked even if the fuel was subjected to somehypothetical abnormal event with the potential to cause overheating of thecore, e.g. 530°C compared with the normal operating maximum of 200°C.
3.5. Full-Size NRU Fuel Test Results
The excellent performance of mini-elements containing the USiAl and USi*Aldispersion fuel led naturally to the fabrication and testing of full-size,12-element NRU fuel assemblies. In experiment FZZ-913, seven assemblieswere irradiated in NRU, 3 containing Al-62.4 wt% USi*Al and 4 containingAl-61.0 wt% U3Si (identified as FL-001 to FL-007). The LEU assemblieswere installed in NRU during 1984, replacing the currently used HEU alloy
377
fuel in NRU, and were irradiated at typical driver-fuel operatingconditions. The electrical conductivity of the coolant ranged between0.25 and 0.7 pmho/cm during irradiation. The pH was not routinelymeasured, but ranged between 5.5 and 7. The coolant inlet temperatureranged between 30-37°C and the outlet between 60-70°C. Inlet pressure wasapproximately 80 psi (579 KPa) and outlet approximately 30 psi (207 KPa).Each rod occupies an average of 5 core positions during its lifetime (~340d residence time (3 70% efficiency) as it is moved from the outside of thecore (low-flux site) to the centre (high-flux site) and back to theoutside. Average element linear power ranged from 40-50 kW/m, with themaximum being approximately 80 kW/m.
Burnup analysis showed that the rods were irradiated to 67 to 84 at%burnup (peak). Visual examinations showed that the fuel elements were ingood condition; they were identical in appearance to the HEU elements withthe normal aluminum oxide layer coating the surface. Dimensionalmeasurements indicated that elongation during irradiation was negligible;the USi*Al and the U^Si dispersion fuel elements were within 0.5% of theiroriginal length.
Post-irradiation metallography revealed that, as expected, the full-length elements' high burnup behaviour was similar to that of the mini-elements. The fuel particles had reacted with the matrix aluminum formingthe normal aluminide interfacial layer (UA13 with dissolved Si). Theinterfacial layer which formed around the UßSi particles was considerablythinner than that in the USi*Al dispersion. Small fission-gas bubbleswere contained in the kernels of the fuel particles and ranged in size upto 10 / m in diameter . Considerably fewer fission-gas bubbleshad been retained in the interfacial layers.
Evidence of the axial burnup gradient was observed in the full-lengthelements. In the high-burnup sections (mid-length) more particlecoalescence had occurred than at the lower burnup sections (ends). Therewas less evidence of particle coalescence in the UjSi dispersion.However, there was no evidence of the linking-up of fission-gas bubbles inany of the fuels examined, indicating that the fuels were well away fromthe onset of breakaway swelling. Immersion-density swelling measurementscould not be made on the full-length elements, so estimates based on thedimensional changes from the underwater and metallographic examinationshave been calculated. Core diameter increases of up to 3% and 4% havebeen measured at the ends and at the middle of the fuel elements,respectively. These give conservative estimates of the core's swelling byless than 1 vol% per 10 at% burnup at the terminal burnup of 84 at%.It is clear that the high-burnup performance of USi*Al and U^Si dispersionfuel containing 3.15 gU/cm --the loading required for the researchreactors at CRNL--is acceptable. Factors contributing to the goodperformance were the suitable particle-size distribution and the superiorrestraint provided by the thick-walled cladding.
4. STATUS OF NRU CONVERSION
NRU was partially converted to LEU when the first 31 LEU fuel rodsmanufactured using industrial-scale equipment were installed during 1988September to December. This partial (one third) LEU core allowed thereactor engineers and physicists to evaluate the bulk effects of LEUconversion on reactor operations. Table 2 shows the burnup profiles ofselected Al-UßSi dispersion fuel rods from the first campaign, as of 1989
378
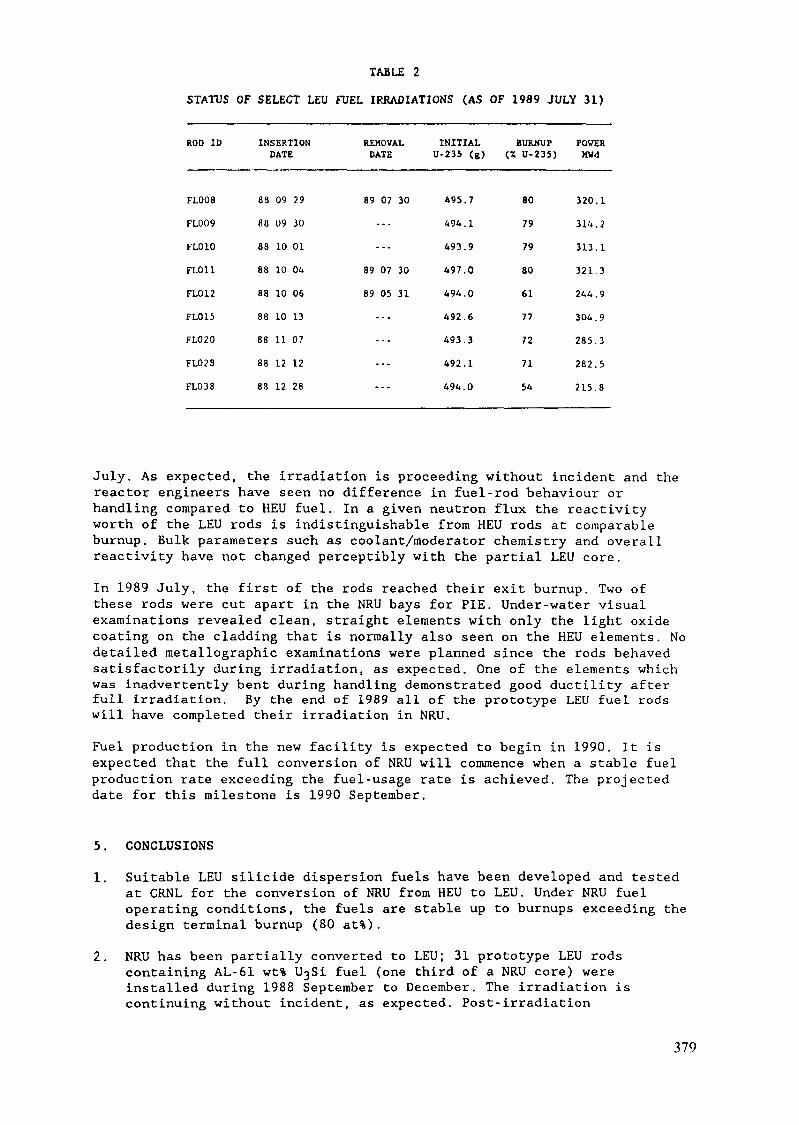
TABLE 2STATUS OF SELECT LEU FUEL IRRADIATIONS (AS OF 1989 JULY 31)
ROD ID INSERTION REMOVAL INITIAL BURNUP POWERDATE DATE U-235 (g) <Z U-235) MUd
FL008
FL009
FLO 10
FLO 11
FL012
FLO 15
FL020
FLO 2 3
FL038
as88
88
88
88
88
88
88
88
09
U9
10
10
10
1011
1212
29
30
01
04
06
13
07
1228
89 07 30 495
494
493
89 07 30 49789 05 31 494
492
493
492
494
.7
.1
.9
.0
.0
.6
.3
.1
.0
80
79798061
77
72
7154
320314
313
321244
304
285
282
215
.1
.2
.1
.3
.9
.9
.3
.5
.8
July. As expected, the irradiation is proceeding without incident and thereactor engineers have seen no difference in fuel-rod behaviour orhandling compared to HEU fuel. In a given neutron flux the reactivityworth of the LEU rods is indistinguishable from HEU rods at comparableburnup. Bulk parameters such as coolant/moderator chemistry and overallreactivity have not changed perceptibly with the partial LEU core.In 1989 July, the first of the rods reached their exit burnup. Two ofthese rods were cut apart in the NRU bays for PIE. Under-water visualexaminations revealed clean, straight elements with only the light oxidecoating on the cladding that is normally also seen on the HEU elements. Nodetailed metallographic examinations were planned since the rods behavedsatisfactorily during irradiation, as expected. One of the elements whichwas inadvertently bent during handling demonstrated good ductility afterfull irradiation. By the end of 1989 all of the prototype LEU fuel rodswill have completed their irradiation in NRU.
Fuel production in the new facility is expected to begin in 1990. It isexpected that the full conversion of NRU will commence when a stable fuelproduction rate exceeding the fuel-usage rate is achieved. The projecteddate for this milestone is 1990 September.
5. CONCLUSIONS
1. Suitable LEU suicide dispersion fuels have been developed and testedat CRNL for the conversion of NRU from HEU to LEU. Under NRU fueloperating conditions, the fuels are stable up to burnups exceeding thedesign terminal burnup (80 at%).
2. NRU has been partially converted to LEU; 31 prototype LEU rodscontaining AL-61 wt% UjSi fuel (one third of a NRU core) wereinstalled during 1988 September to December. The irradiation iscontinuing without incident, as expected. Post-irradiation
379
examinations of the first rods to be discharged confirmed that thefuel achieved the design burnup in good condition.
3. Construction of a new fuel-fabrication facility is essentiallycompleted and LEU fuel production is expected to begin in 1990. Thecomplete conversion of NRU is expected to begin in 1990 September.
ACKNOWLEDGEMENTS
Many people, some of whom have since left CRNL, have contributed to thesuccess of the LEU fuel development and conversion program. They are toonumerous to properly acknowledge here. However, we would especially liketo thank J.C. Wood, M.T. Foo, L.C. Berthiaume, L.N. Herbert, J.D.Schaefer, J.G. Goudreau, F.C. Iglesias, R.G. Barrand, J. Mitchell, J.R.Keim, R.J. Chenier and the CRNL hot-cell metallography group, and E.J.McKee and the rod-shop group, for their contributions.
REFERENCES
[1] J.C. Wood, M.T. Foo and L.C. Berthiaume, "The Development andTesting of Reduced Enrichment Fuels for Canadian ResearchReactors", Proceedings of the International Meeting on Researchand Test Reactor Core Conversions from HEU to LEU Fuels, Argonne,Illinois, 1982 November 8-10.
[2] J.C. Wood, M.T. Foo, L.C. Berthiaume, L.N. Herbert and J.D.Schaefer, "Advances in the Manufacturing and Irradiation Testingof Reduced Enrichment Fuels for Canadian Research Reactors",Proceedings of the International Meeting on RERTR, Tokai, Japan,1983 October 24-27.
[3] D.F. Sears, L.C. Berthiaume and L.N. Herbert, "Fabrication andIrradiation Testing of Reduced Enrichment Fuels For CanadianResearch Reactors", Proceedings of the International Meeting onRERTR, Gatlinburg, Tennessee, 1986 October.
[4] J.W. Schreader, I.C. Kennedy and D.F. Sears, "Status of CanadianLow-Enriched Uranium Conversion Program", Proceedings of theInternational Meeting on RERTR, San Diego, California, USA, 1988September 19-22.
380
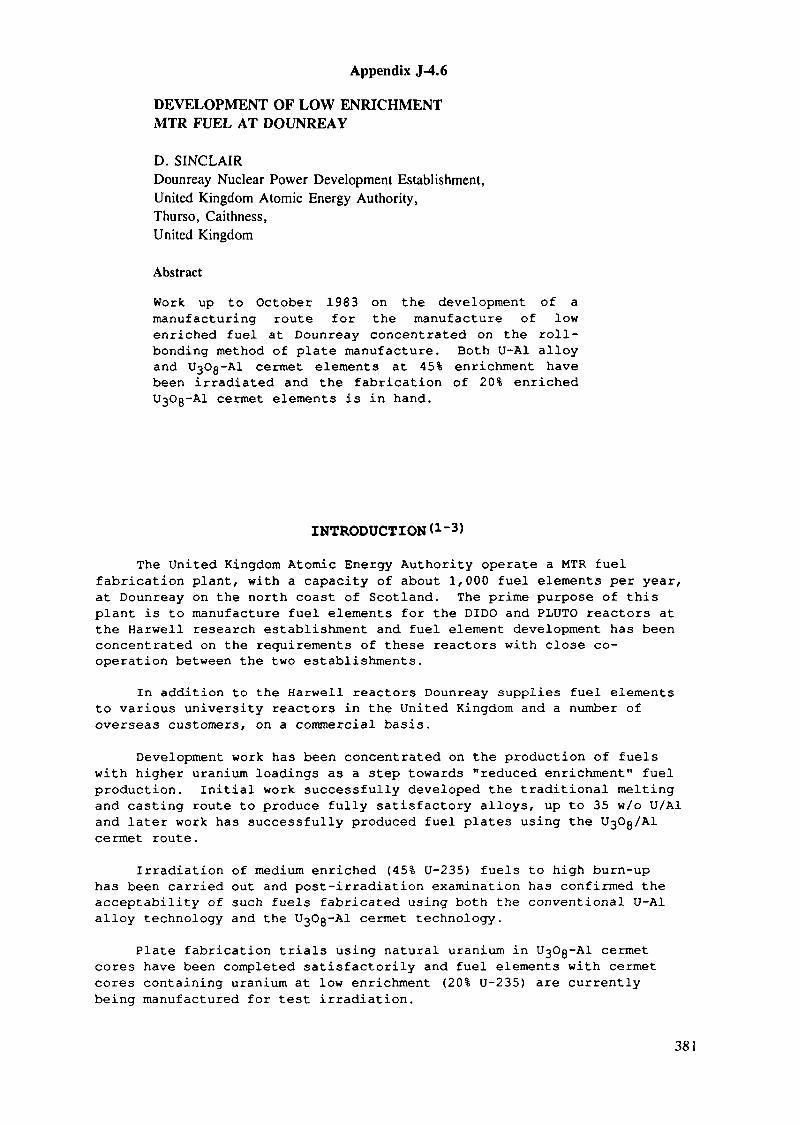
Appendix J-4.6
DEVELOPMENT OF LOW ENRICHMENTMTR FUEL AT DOUNREAY
D. SINCLAIRDounreay Nuclear Power Development Establishment,United Kingdom Atomic Energy Authority,Thurso, Caithness,United Kingdom
Abstract
Work up to October 1983 on the development of amanufacturing route for the manufacture of lowenriched fuel at Dounreay concentrated on the roll-bonding method of plate manufacture. Both U-A1 alloyand t^Og-Al cermet elements at 45% enrichment havebeen irradiated and the fabrication of 20% enriched
l cermet elements is in hand.
INTRODUCTION*1 -3>
The United Kingdom Atomic Energy Authority operate a MTR fuelfabrication plant, with a capacity of about 1,000 fuel elements per year,at Dounreay on the north coast of Scotland. The prime purpose of thisplant is to manufacture fuel elements for the DIDO and PLUTO reactors atthe Harwell research establishment and fuel element development has beenconcentrated on the requirements of these reactors with close co-operation between the two establishments.
In addition to the Harwell reactors Dounreay supplies fuel elementsto various university reactors in the United Kingdom and a number ofoverseas customers, on a commercial basis.
Development work has been concentrated on the production of fuelswith higher uranium loadings as a step towards "reduced enrichment" fuelproduction. Initial work successfully developed the traditional meltingand casting route to produce fully satisfactory alloys, up to 35 w/o U/A1and later work has successfully produced fuel plates using the UßOg/Alcermet route.
Irradiation of medium enriched (45% U-235) fuels to high burn-uphas been carried out and post-irradiation examination has confirmed theacceptability of such fuels fabricated using both the conventional U-A1alloy technology and the U^Og-Al cermet technology.
Plate fabrication trials using natural uranium in UßOg-Al cermetcores have been completed satisfactorily and fuel elements with cermetcores containing uranium at low enrichment (20% U-235) are currentlybeing manufactured for test irradiation.
381

FABRICATION METHODSTwo methods are currently (October 1983) in use at Dounreay for the
routine fabrication of MTR fuel, both using U-A1 alloy technology.
i. the traditional roll-bonding method of producing fuel plates whichcan either be assembled directly into flat-plate fuel elements orpreformed and electron-beam welded into fuel tubes for assembly intoconcentric-tube fuel elements, andii. the co-extrusion of alloy inserts contained within aluminiumsleeves to produce completely clad fuel tubes in a single operation.These tubes are then assembled into concentric-tube fuel elements.
PROGRESS TO DATE (October 1983) <3>Medium Enriched Fuel (45% U-235)
To date, work has been concentrated on the roll-bonding method topermit the production of medium enriched fuel plates in both alloy andcermet forms.
A 45% enriched concentric-tube fuel element incorporating U-A1alloy cores with a uranium density of 1.1 g U/cm^ has been irradiated(Table 1) to 52.3% burn-up and the post irradiation examination has beencompleted. The examination showed the surfaces of the fuel plates to befree of blisters and other gross defects. Both longitudinal andtransverse micro-sections, taken from positions along the length of thefuel tube, showed the cladding and core to be clean and sound with gooduniform dispersion of the intermetallic compounds UAlg and UAl4- Goodmetallurgical bonding between the cladding and fuel core had beenmaintained, and there was regular good axial alignment of the claddingand core with the cladding thickness within the original specifiedlimits. Tapering and dog-boning at the core ends were slight.
A fuel tube, electron-beam welded from l^Og-Al cermet core plateswith a uranium density of 1.1 g U/cm^ has been irradiated (Table 2) to68% burn-up and post irradiation examination has been completed. Visualexaminations of the irradiated tube showed it to be free from blisters orother gross defects. The irradiated tube was heated to 250°C and heldfor 15 minutes and then in 50°C steps to 500°C with an examination forblisters following each step. No blistering occurred at any stage ofthis test. Both longitudinal and transverse micro-sections, taken alongthe length of the plate, showed the thickness of the core and cladding tobe uniform with good axial alignment of the core and cladding. Goodmetallurgical bonding between cladding and the core had been maintained.Cracks observed in the core in some specimens were later demonstrated tohave formed during cutting operations carried out to obtain themetallographic samples. Variations in size and distribution of UßOgparticles in the core were as anticipated from pre-irradiation samples.Characteristic end effects - tapering and dog-boning - were typical andslight.
Two more 45% enriched fuel elements with U^Og-Al cermet cores arecurrently undergoing irradiation; one in a 5 MW light water researchreactor and the other in the 25 MW PLUTO research reactor at Harwell.Post irradiation results on the former will be available in about 18months and on the latter by the middle of 1984.
382
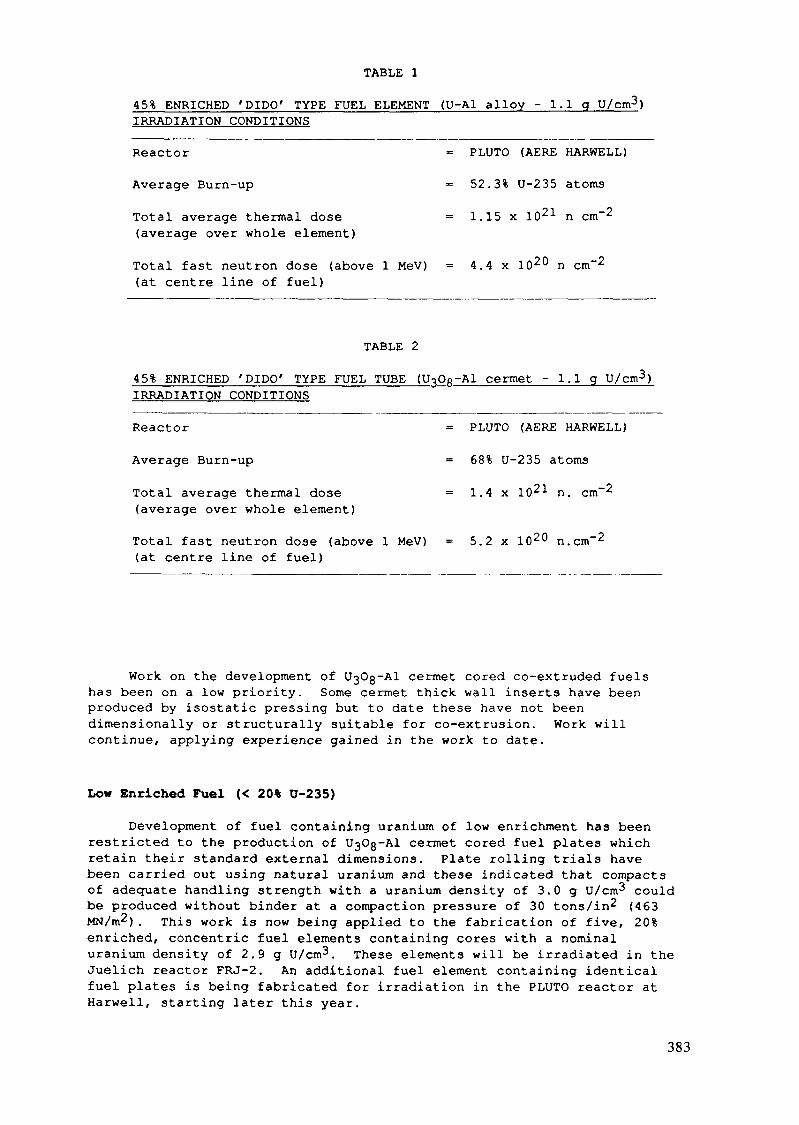
TABLE 1
45% ENRICHED 'DIDO' TYPE FUEL ELEMENT (U-A1 alloy - 1.1 g U/cm3)IRRADIATION CONDITIONS
Reactor = PLUTO (AERE HARWELL)
Average Burn-up = 52.3% U-235 atoms
Total average thermal dose = 1.15 x 10²¹ n cm"2(average over whole element)
Total fast neutron dose (above 1 MeV) = 4.4 x lO2^ n cm"2(at centre line of fuel)
TABLE 2
45% ENRICHED 'DIDO' TYPE FUEL TUBE ( Og-Al cermet - 1.1 g U/cm3)IRRADIATION CONDITIONS
Reactor = PLUTO (AERE HARWELL)
Average Burn-up = 68% U-235 atoms
Total average thermal dose = 1.4 x 10²¹ n. cm"2(average over whole element)
Total fast neutron dose (above 1 MeV) = 5.2 x 10²⁰ n.cm"2(at centre line of fuel)
Work on the development of UjOg-Al cermet cored co-extruded fuelshas been on a low priority. Some cermet thick wall inserts have beenproduced by isostatic pressing but to date these have not beendimensionally or structurally suitable for co-extrusion. Work willcontinue, applying experience gained in the work to date.
Low Enriched Fuel (< 20% U-235)
Development of fuel containing uranium of low enrichment has beenrestricted to the production of Og-Al cermet cored fuel plates whichretain their standard external dimensions. Plate rolling trials havebeen carried out using natural uranium and these indicated that compactsof adeo^aate handling strength with a uranium density of 3.0 g U/cm3 couldbe produced without binder at a compaction pressure of 30 tons/in2 (463MN/m2). This work is now being applied to the fabrication of five, 20%enriched, concentric fuel elements containing cores with a nominaluranium density of 2.9 g U/cm3. These elements will be irradiated in theJuelich reactor FRJ-2. An additional fuel element containing identicalfuel plates is being fabricated for irradiation in the PLUTO reactor atHarwell, starting later this year.
383
REFERENCES
1. B. Mickey, "Note on Current Position Regarding the Development bythe UKAEA of Reduced Enrichment Fuels for Research and TestReactors," Proceedings of the International Meeting on Development,Fabrication and Application of Reduced Enrichment Fuels forResearch and Test Reactors, Argonne, Illinois, November 12-14,1980, ANL/RERTR/TM-3, CONF-801144 (August 1983), pp. 250-251.
2. P. Chare and D. Sinclair, "Development of Low Enriched MTR Fuel atDounreay," IAEA Seminar on Research Reactor Operation and Use,Juelich, Federal Republic of Germany, 14-18 September 1981, IAEA-SR-77.
3. D. Sinclair, "Development of Low Enriched Fuel at Dounreay -Progress Report," Proceedings of the International Meeting onReduced Enrichment for Research and Test Reactors, Tokai, Japan,24-27 October 1983, JAERI-M 84-073 (May 1984), pp. 31-33.
384

Appendix J-4.7Parti
IRRADIATION OF MEU AND LEUTEST FUEL ELEMENTS IN DR 3
K.HAACKRise National Laboratory,Roskilde, Denmark
Abstract
Irradiation of three MEU and three LEU fuel elementsin the Danish reactor DR 3.
Thermal and fast neutron flux density scans of the corehave been made and the results, related to the U235-contentof each fuel element, are compared with the values from HEUfuel elements. The test elements were taken to burn-up percentagesof 50-60%. Reactivity values of the test elements at chargeand at discharge have been measured and the values are comparedwith those of HEU fuel elements.
1. INTRODUCTION
As a part of the current programme for evaluation ofthe feasibility of research reactor conversion to lower enrichedfuel organized by IAEA, irradiations of medium enriched uranium(MEU) and low enriched uranium (LEU) test fuel elements havebeen carried out in reactor DR 3, Rise, Denmark.
The irradiation of the 3 MEU elements was finished inFebruary 1983. The 3 LEU elements were irradiated in the samecore positions and in continuation of the MEU element series.The LEU element irradiation test was finished September 1983.
The test fuel elements were geometrically identicalto the remaining fuel elements in the core, which were 93%enriched cylindrical tube type (Mk 4) with an initial Ucontent of 150g (20 elements) and 120g (3 elements). Duringthe test period 7-12 irradiation rigs and isotope productionrigs were present in the core in some of the 50mm centralirradiation holes of the fuel elements. All other fuel elements
385
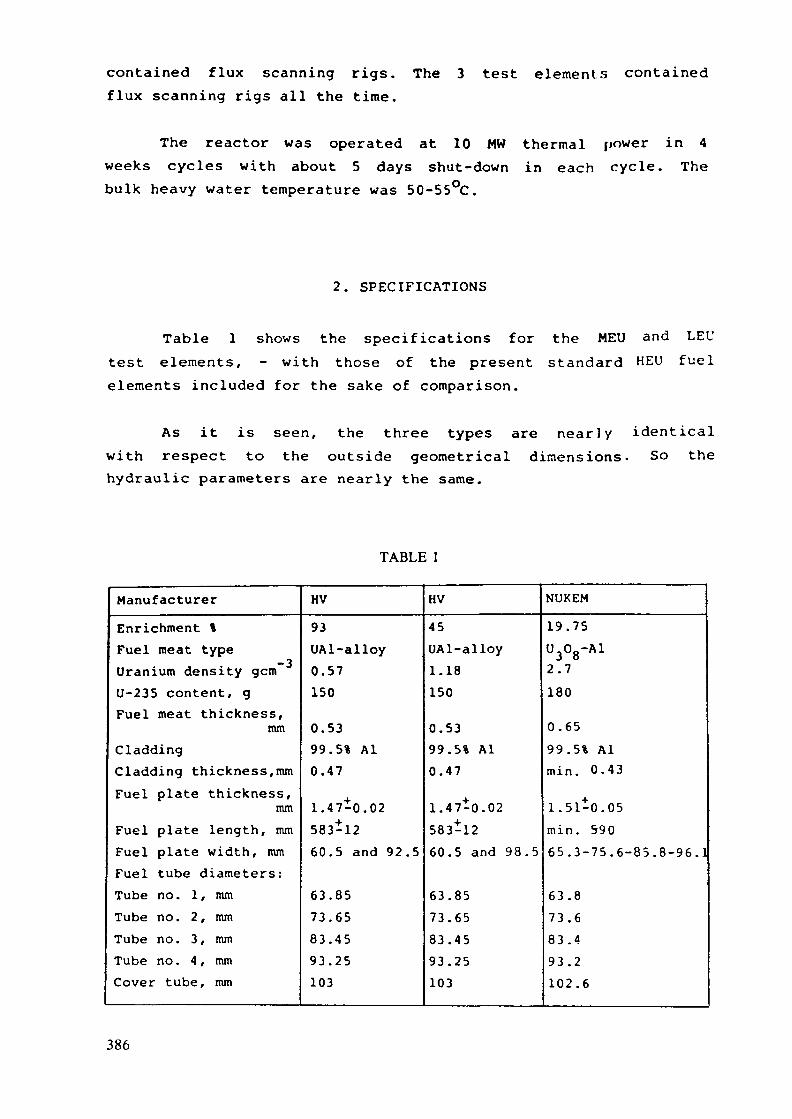
contained flux scanning rigs. Theflux scanning rigs all the time.
3 test elements contained
The reactor was operated at 10 MW thermal power in 4weeks cycles with about 5 days shut-down in each cycle. Thebulk heavy water temperature was 50-55°C.
2. SPECIFICATIONS
Table 1 shows the specifications for the MEU and LEUtest elements, - with those of the present standard HEU fuelelements included for the sake of comparison.
As it is seen, the three types are nearly identicalwith respect to the outside geometrical dimensions. So thehydraulic parameters are nearly the same.
TABLE 1
ManufacturerEnrichment %Fuel meat typeUranium density gemU-235 content, gFuel meat thickness,
mmCladdingCladding thickness, mmFuel plate thickness,
mmFuel plate length, mmFuel plate width, mmFuel tube diameters:Tube no. 1, mmTube no. 2, mmTube no. 3, mmTube no. 4, mmCover tube, mm
HV93UAl-alloy0.57150
0.5399.5% Al0.47
1.47^0.02583-1260.5 and 92.5
63.8573.6583.4593.25103
HV45UAl-alloy1.18150
0.5399.5% Al0.47
1.47-0.02583-1260.5 and 98.5
63.8573.6583.4593.25103
NUKEM19.75U308-A12.7180
0.6599.5% Almin. 0.43
1.51-0.05min. 59065.3-75.6-85.8-96.1
63.873.683.493.2102.6
386

Each type consists of four coaxial fuel tubes and anouter Al cover tube, fitted in 4 combs at top and bottom.In the centre is space for a 54mm o.d. experiment thimble.
The main differences between the types are the enrichmentand the consequent meat density change. Furthermore, the NUKEMtype differ with respect to
- meat material- meat thickness
U content.
3. IRRADIATION SCHEDULE
A3
C
D
E
1 2 3 4 51 2 3 4
Al
B2
C2
6
FIG. 1.
The MEU and LEU test elementswere irradiated in the corepositions Al, B2 and C2, seefig. 1. The MEU series werein the core from May 1982 toFebruary 1983, followed bythe LEU series which lasteduntil September 1983. The in-stallation of each elementwas displaced one operationcycle (4 weeks) relative to
the preceding element in the same series, in order to be ableto utilize the experience gained.
The burn-up percentages of the test elements at dischargewere:
Element no.MEULEU
15255
25851
35757
387
4. NEUTRON FLUX DENSITY MEASUREMENTS
Thermal and fast flux scannings have been made in allcore positions equipped with flux scan rigs, i.e. in 14-19fuel elements including the 3 test elements, in each operationcycle. Co and Ni foils have been used, 8 with 10cm distancefor each axial scanning in a fuel element.
The aim was to unveil possible flux differences betweenHEU, MEU and LEU fuel elements. The thermal neutron flux in a coreposition is mainly influenced by the U-content in the fuelelement and by the coarse control arm (CCA) angle. Thus, inorder to obtain good comparisons between HEU and MEU fluxes,it is necessary to select flux scans with HEU and MEU fuelcontaining nearly the same U amount and run with nearlythe same CCA-angle. Obvious, these conditions are coincidingvery rare, so that comparison would be based on a very fewexamples .
However, a more comprehensive utilization of all themeasurement results in the MEU and LEU test elements can be madeby plotting the fast/thermal flux ratio against the U-content,a method described by Wright 1) . As the power P in a fuelelement is proportional to the fast flux <£f and also proportional2 -je rto the product of the U-content MU235 times the thermalflux <D. :Jtn
P = KI x 9f P = K2 x
<?fhe obtained — — = K M - (1)J U
Thus the plot of equation (1) should be linear for specificfuel element types and flux scan rig types.
The method has been used earlier to unveil differencesbetween various fuel element and rig types.
Fig. 2 and 3 show the flux measurement results fromthe MEU and LEU testings, respectively. The lower graphs showthe measurements in the test elements, the upper ones show
388

i.i
0.3
3.8
0.1-
'th
0,2933
0,0475 MU235115,1130
0.1
0.1
0,3056-0 ,2933th
-, ' 10° = 4'2% increased -— ratio by MEU,2933 «
Q . 3 Q 5 6
0,0762
0,0762+0,001885^235
MEU
* Measurements inB2
Si 100 121,8 150g
FIG. 2. Difference in fast/thermal flux ratio between HEU and MEU fuel elements.
those in the remaining HEU elements present in the core duringthe test element irradiation cycles.
The thermal flux value used in the flux ratio is themean value of the axial thermal neutron flux distributionin the core section of the fuel element in question. The fastflux value used in the flux ratio is the maximum fast neutronflux, which is a good representative of the fast flux because
389

SLft«0.3368 - 0.2960" 0 . 2 9 6 0 100 - 13.8» increased —i - ratio by LEU
"th
Of-
toc 119.23 t$3 gttsU(Benchmark HEU-BOÇ)
ÎL
US-
0.336«
0.1262 + 0.00154
0.1-
LEU
So IJ6. /J j£0 ^(Benchmark LEU-BOO
FIG. 3. Difference in fast/thermal flux ratio between HEU and LEU fuel elements.
390
the axial fast flux distribution is roughly rectangular shapedand rather insensitive of absorber movements and other changesin the core.
On figs. 2 and 3 also the regression lines belongingto the flux ratios are shown. By means of the line equations,good estimates of the expected flux ratio changes owing toconversion to MEU and LEU can be obtained.
Calculations on the DR 3 core conversions 2), 3), 4)235show that the U-content has to be increased by 6.7 g inthe MEU core and 17.5 g in the LEU core. The flux ratio belongingto the mean 235U-content of the HEU elements, 115.1 g (fig.2)is read on the regression line: 0.2933. The correspondingflux ratio read on the MEU regression line at a 6.7 g highermean 235U-content, 121.8 g, is: 0.3056.
The depreciation of the 4>f/ 4> ,-ratio is thus for MEU:4.2%.
The corresponding depreciation for LEU can be obtainedin a similar way: 13.8%.
5.REACTIVITY MEASUREMENTS
The reactitivty change at the insertion and at the with-drawal of each MEU test element has been measured. The valuesare given in table 3 and compared to the expected values,which are based on statistics from several years of HEU fuelelement changes.
The main differences concerning reactivity between HEUelements and those with lower enrichments are the bigger contents
238of U and Pu in the lower enriched elements.
In table 3 the calculated Pu contents are added to theresidual U-content in order to get the total fissile contentto be used as input to the calculation of the estimated reactivitychanges at discharge of the elements. Consequently the deviations
391
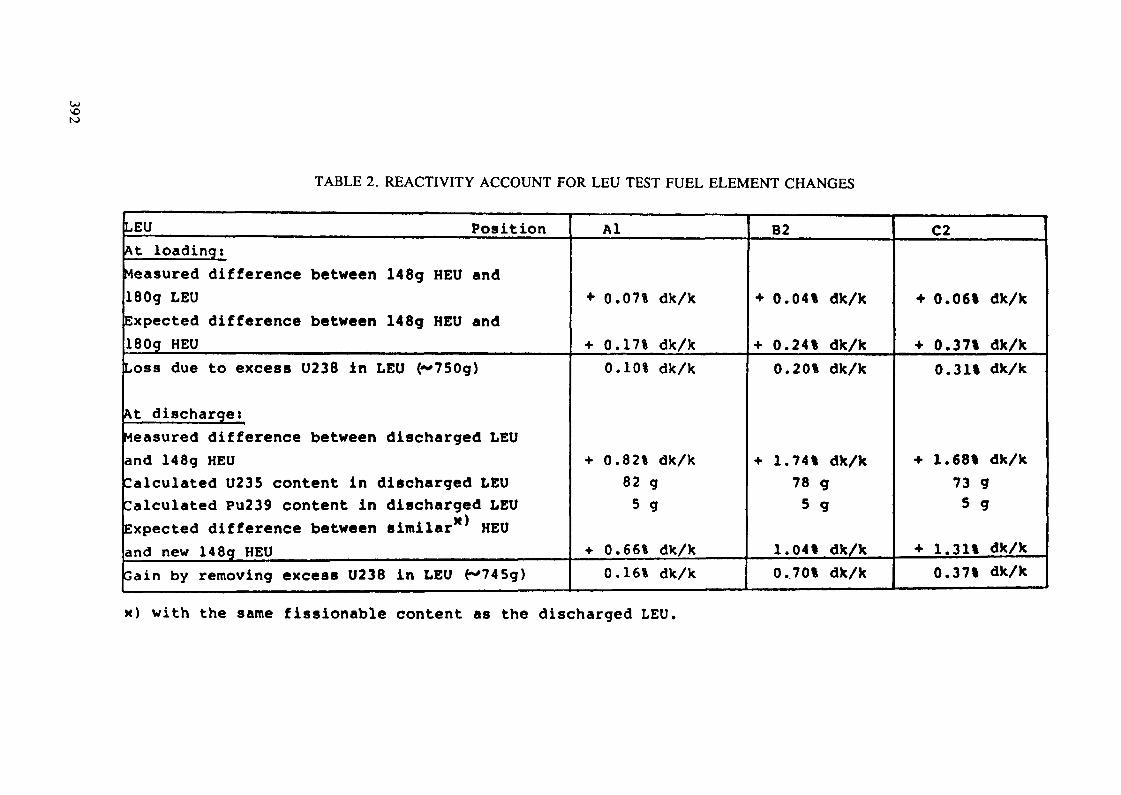
TABLE 2. REACTIVITY ACCOUNT FOR LEU TEST FUEL ELEMENT CHANGES
LEU PositionAt loading:measured difference between 14 8g HEU and180g LEUExpected difference between 148g HEU and180g HEULoss due to excess U238 in LEU (* 750g)It discharge:easured difference between discharged LEUnd 148g HEUalculated U235 content in discharged LEUalculated Pu239 content in discharged LEUM)xpected difference between similar HEUnd new 148g HEUain by removing excess U238 in LEU (-»745g)
Al
+ 0.07% dk/k
+ 0.17% dk/k0.10% dk/k
+ 0.82% dk/k82 g5 g
4- 0.66% dk/k0.16% dk/k
B2
+ 0.04% dk/k
+ 0.24% dk/k0.20% dk/k
+ 1.74% dk/k78 g5 g
1.04% dk/k0.70% dk/k
C2
+ 0.06% dk/k
+ 0.37% dk/k0.31% dk/k
+ 1.68% dk/k73 95 g
+ 1.31% dk/k0.37% dk/k
x) with the same fissionable content as the discharged LEU.

TABLE 3. REACTIVITY ACCOUNT FOR MEU TEST FUEL ELEMENT CHANGES
*EU PositionAt loading:Fissile content of discharged HEUMeasured difference between discharged HEUand 14 7g MEUExpected difference between discharged HEUand 14 7g HEULoss due to excess U238 in MEU (169g)
At discharge:Measured difference between discharged MEUand 147g HEUCalculated U235 content in discharged MEUCalculated Pu239 content in discharged MEU
M )Expected difference between similar ' HEUand new 14 7g HEUGain by removing excess U238 in MEU (167g)
Al
123 g
+ 0.22% dk/k
+ 0.24% dk/k0.02% dk/k
+ 0.73% dk/k71 g2 9
+ 0.81% dk/k- 0.09% dk/k
B2
81 g
+ 0.93% dk/k
+ 1.06% dk/k0.13% dk/k
+ 1.46% dk/k62 g2 g
+ 1.33% dk/k0.13% dk/k
C2
70 g
•»• 1.33% dk/k
+ 1.46% dk/k0.13% dk/k
+ 1.71% dk/k64 g2 g
+ 1.54% dk/k0.17% dk/k
x) with the same fissile content as the discharged MEU,
U)VOOJ

between measured and expected reactivity changes are mainly238owing to the absorbing influence of the U-contents.
At the loading of each LEU test element a new standardHEU element was previously installed in order to measure thevery difference between a new 180g LEU U,0ß element and anew 150g HEU UAl-alloy element. The estimated reactivity changeshave been calculated in this case using a special set of factors,valid for "new-to-new fuel element changes".
Except for the unusual high reactivity change measured238at the discharge from B2, the losses due to excess U at
loading and at discharge agree fairly well. The expected increases238of the reactivity worths of U from Al at the core edge
over B2 to C2 (close to the core center) are also distinct.
Core ctjcrirrii jwittilu«< Wment
FIG. 4.
Rough estimates of the reactivity238consumption due to U in
full MEU and LEU cores canbe made by plotting the measuredlosses of reactivity owing
238to U as a function ofthe distance of the fuelelement from the core center,see fig. 4.
reading the contributionsfrom the remaining fuel elements
Osfanc» iron on tne regression curves,the total reactivity lossis found at. 5.8% dk/k and2.6% dk/k for the LEU andMEU core, respectively.
These reactivity losses can be compensated for by adding., 235,,14g Uabout
MEU-element.to each LEU-element and about 6g 235U to each
394
6. POST IRRADIATION EXAMINATIONS
The routine procedure for preparing irradiated fuelelements for shipment to the reprocessing plant is to cutthe fuel tubes outside the fuel meat section. By this operationthe tubes separate and it is feasible to make a visual examinationof the individual fuel tubes in the cutting pond, by meansof bright light and using binoculars. It was intended to examinethe fuel elements more thoroughly in the Hot Cell* s if thevisual inspection unveiled blisters or other irregularities.
The MEU fuel elements were found to be in perfect condition.
Post irradiation examinations on the LEU test elementshave not yet been performed (Sep. 1983). They will be madewhen the elements have cooled about 3 months.
REFERENCES
1. S.B. Wright, Fast Neutron Fluxes in Mk III Fuel Elementsin DIDO and PLUTO, AERE-M 864, Harwell, U.K., 1961.
2. J. Matos. Enrichment Reduction Calculations for theDIDO, PR 3 and JRR-2 Reactors, ANL (USA), Appendix Ain "Research Reactor Core Conversion From the Use ofHighly Enriched Uranium to the Use og Low Enriched UraniumFuels", Guidebook Addendum, Heavy Water Research Reactors,IAEA, Wien, 1982.
3. C.F. Hajerup. Enrichment Reduction Calculations forthe PR 3 Reactor, Riso, Denmark, Appendix E to the GuidebookAddendum referred to above.
4. Benchmark Calculations, Appendix F to the GuidebookAddendum referred to above.
5. K.E. Beckurts, K. Wirtz, Neutron Physics, Springer Verlag,Berlin, 1964.
395

Appendix J-4.7Part II
IRRADIATION IN DR 3 OF THREE DANISH MANUFACTUREDLEU SILICIDE TEST FUEL ELEMENTS
RIS0 NATIONAL LABORATORYRoskilde, Denmark
Abstract
The 3 test fuel elements of the U7Si9-Al type enriched to21519.75% with 180g U was manufactured by ATLAS AED. The
suicide powder was delivered by Babcock & Wilcox, USA.The elements were irradiated in DR 3 from August 1986 toApril 1987 to burn-ups ranging from 51% to 57%. The elementsperformed perfect during the irradiation. The fuel tubeshave been visually inspected -for blisters and other irregulari-ties after cutting in the pond. No defects were found. Lateron thickness measurements of the fuel tube plates will beattempted and documentary photographing of the fuel tubesurfaces will be undertaken.
SPECIFICATIONS:
The table below shows the specifications of the test elementsand the present HEU elements, for comparison.
The outside geometrical dimensions are identical.
The fuel meat of the test element is 3.8% shorter and 0.8-2.7%narrower than that of the present fuel element. The reasonis that it is necessary to have better clearance from theedges to the meat for the cermet fuel types.
IRRADIATION DATA:
In table 2 is given the relevant irradiation data, the burn-upof U and the production of Pu.
Table 3 shows the irradiation positions in the core.
397
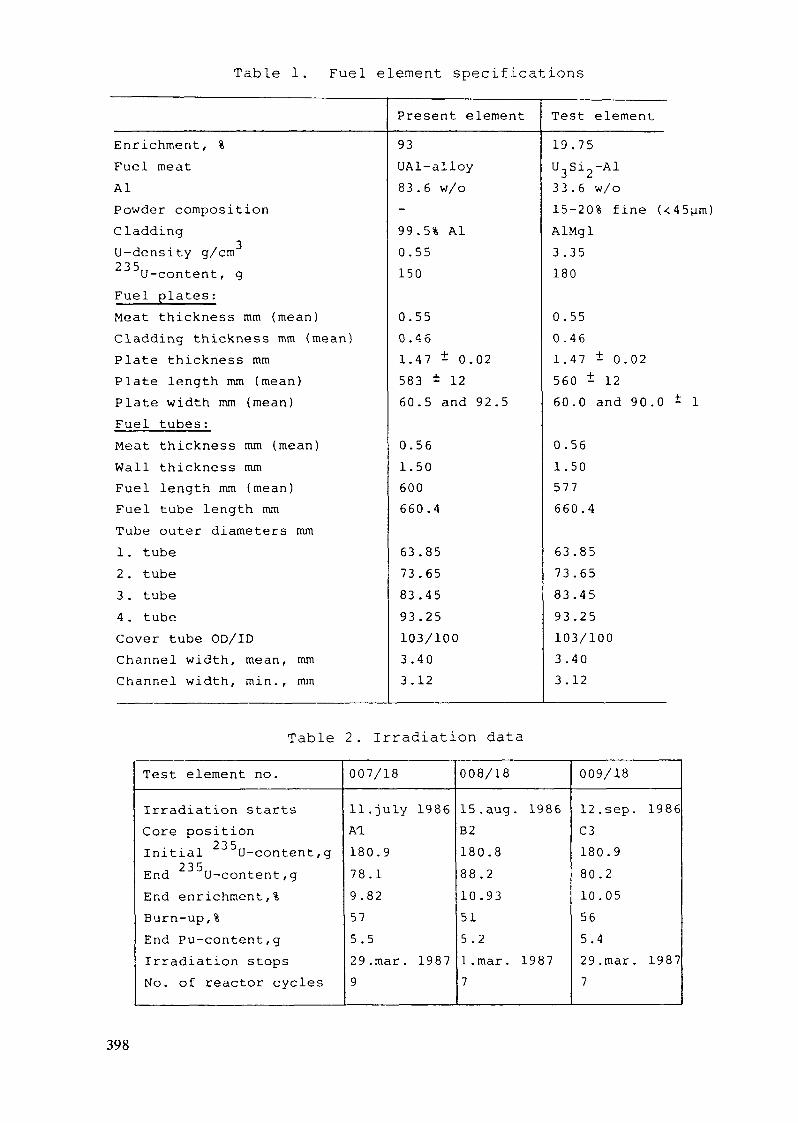
Table 1. Fuel element specifications
Enrichment, %Fuel meatAlPowder compositionCladdingU-density g/cra
U-content, gFuel plates:Meat thickness mm (mean)Cladding thickness mm (mean)Plate thickness mmPlate length mm (mean)Plate width mm (mean)Fuel tubes:Meat thickness mm (mean)Wall thickness mmFuel length mm (mean)Fuel tube length mmTube outer diameters mm1 . tube2 . tube3 . tube4 . tubeCover tube OD/IDChannel width, mean, mmChannel width, min., mm
Present element93UAl-alloy83 .6 w/o-99.5% Al0.55150
0.550.461.47 ± 0.02583 ± 1260.5 and 92.5
0.561.50600660.4
63.8573.6583.4593.25103/1003.403.12
Test element19.75U3Si2-Al33.6 w/o15-20% fine («AlMgl3.35180
0.550.461.47 ± 0.02560 ± 1260.0 and 90.0
0.561.50577660.4
63.8573.6583.4593.25103/1003 .403.12
Table 2. Irradiation data
Test element no.
Irradiation startsCore positionInitial U-content, gEnd U-content, gEnd enrichment, %Burn-up, %End Pu-content,gIrradiation stopsNo. of reactor cycles
007/18
11. July 1986Al180.978.19.82575.529. mar. 19879
008/18
IS.aug. 1986B2180.888.210.93515.2l.mar. 19877
009/18
12.sep. 1986C3180.980.210.05565.429. mar. 19877
398
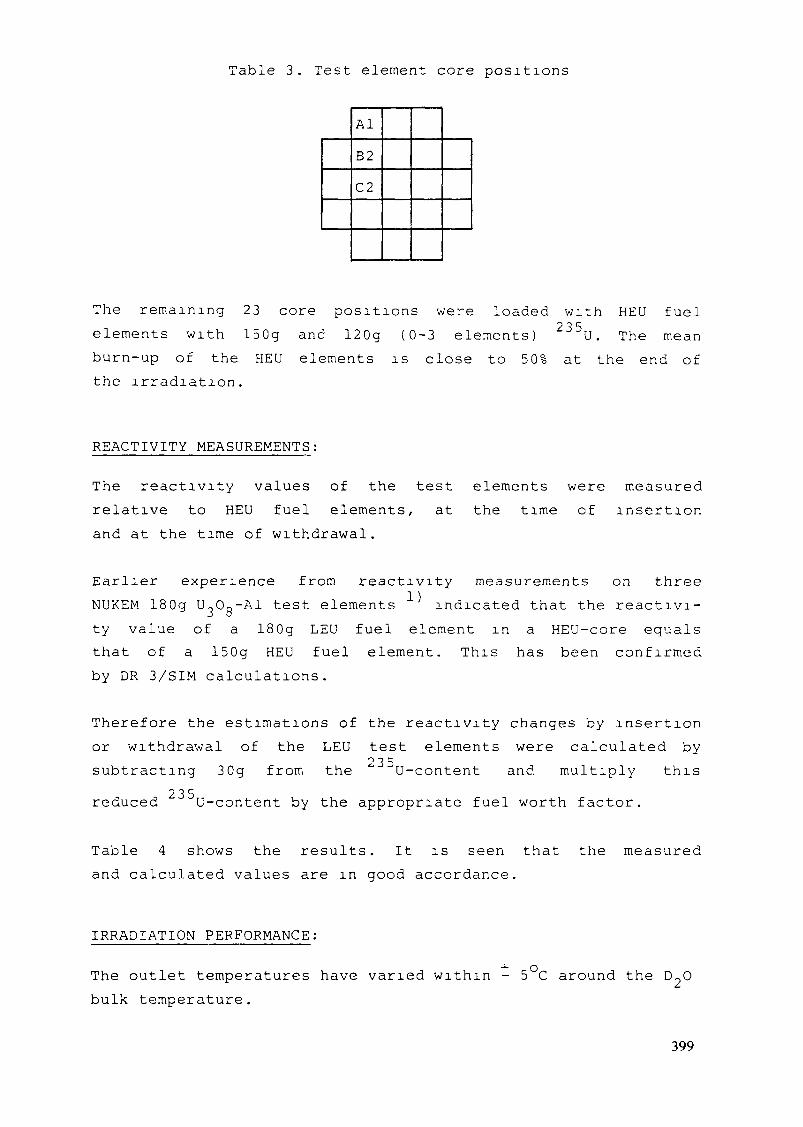
Table 3. Test element core positions
AlB2C2
The remaining 23 core positions wereelements with 150g and 120g (0-3 elements)burn-up of the HEU elements is close to 50%the irradiation.
loaded with235
HEU fuelU. The mean
at the end of
REACTIVITY MEASUREMENTS:
The reactivity values of the test elements were measuredrelative to HEU fuel elements, at the time of insertionand at the time of withdrawal.
Earlier experience from measurements on threereactivityNUKEM 180g U30g-Al test elements indicated that the reactivi-ty value of a 180g LEU fuel element in a HEU-core equalsathat of a 150g HEU fuelby DR 3/SIM calculations.
element.in
This has been confirmed
Therefore the estimations of the reactivity changes by insertionor withdrawal of the LEU test elements were calculated by
° 3 5subtracting 30g from the "~ U-content and multiply thisreduced 235U-content by the appropriate fuel worth factor.
Table 4 shows the results. It is seen that the measuredand calculated values are in good accordance.
IRRADIATION PERFORMANCE:
The outlet temperatures have varied within - 5 C around the D^Obulk temperature.
399
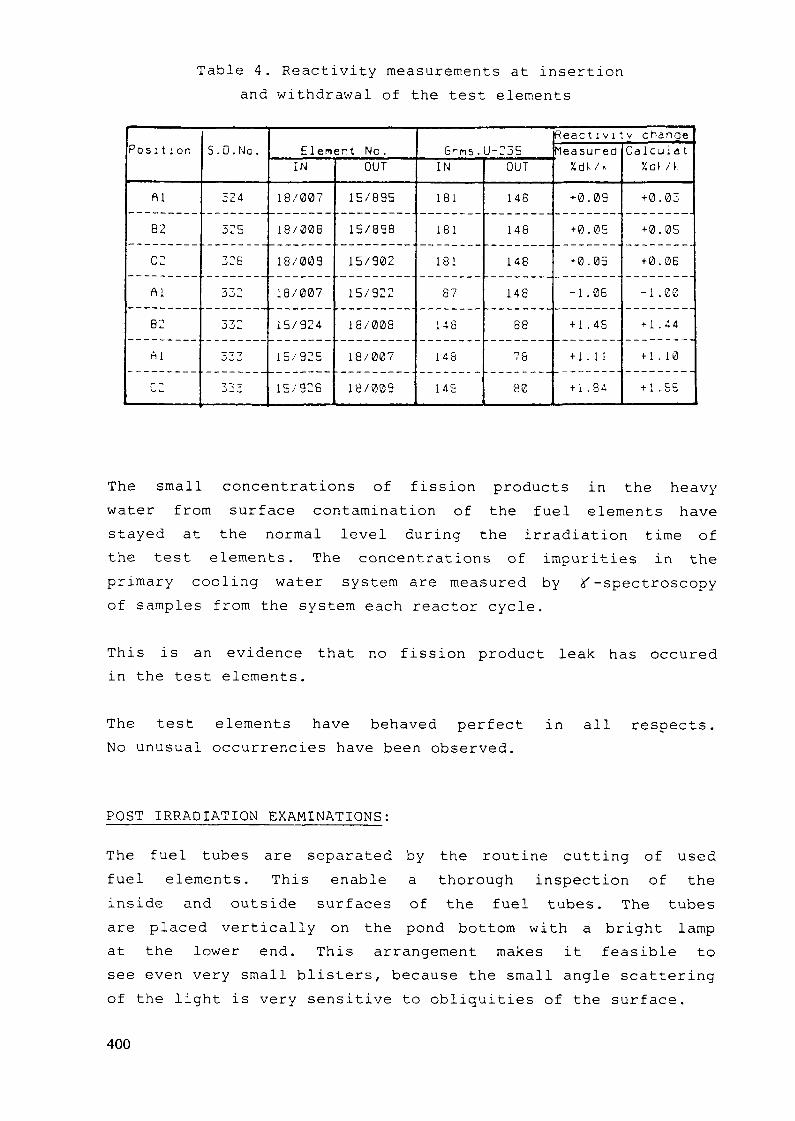
Table 4. Reactivity measurements at insertionand withdrawal of the test elements
Posi t ion
ftl
82
C2
Al
B2
Mr "*
S.D. No.
324
325
326
û j2
Jj2"A — "•*
333
Element No.IN
18/007
18/008
18/009
18/007
15/924
15/925
15/926
OUT
15/895
15/898
15/902
15/922
18/008
18/007
18/003
Grms.U-235IN
181
181
181
87
146
US
US
OUT
148
148
148
148
88
75
80
R e a c t i v i t y chanqeMeasured
%dk/k
+0.09
+ 0.05
+ 0.05
-1.06
+ 1 .46
+ 1 . 1 1
+ 1 .84
Calculât%dt /k
+0.03
+ 0.05
+ 0.06
-1 .00
+ 1.44
+ 1 . 10
+ 1.S6
The small concentrations of fission products in the heavywater from surface contamination of the fuel elements havestayed at the normal level during the irradiation time ofthe test elements. The concentrations of impurities in theprimary cooling water system are measured by y-spectroscopyof samples from the system each reactor cycle.
This is an evidence that no fission product leak has occuredin the test elements.
The test elements have behaved perfect in all respects.No unusual occurrencies have been observed.
POST IRRADIATION EXAMINATIONS:
The fuel tubes are separated by the routine cutting of usedfuel elements. This enable a thorough inspection of theinside and outside surfaces of the fuel tubes. The tubesare placed vertically on the pond bottom with a bright lampat the lower end. This arrangement makes it feasible tosee even very small blisters, because the small angle scatteringof the light is very sensitive to obliquities of the surface.
400
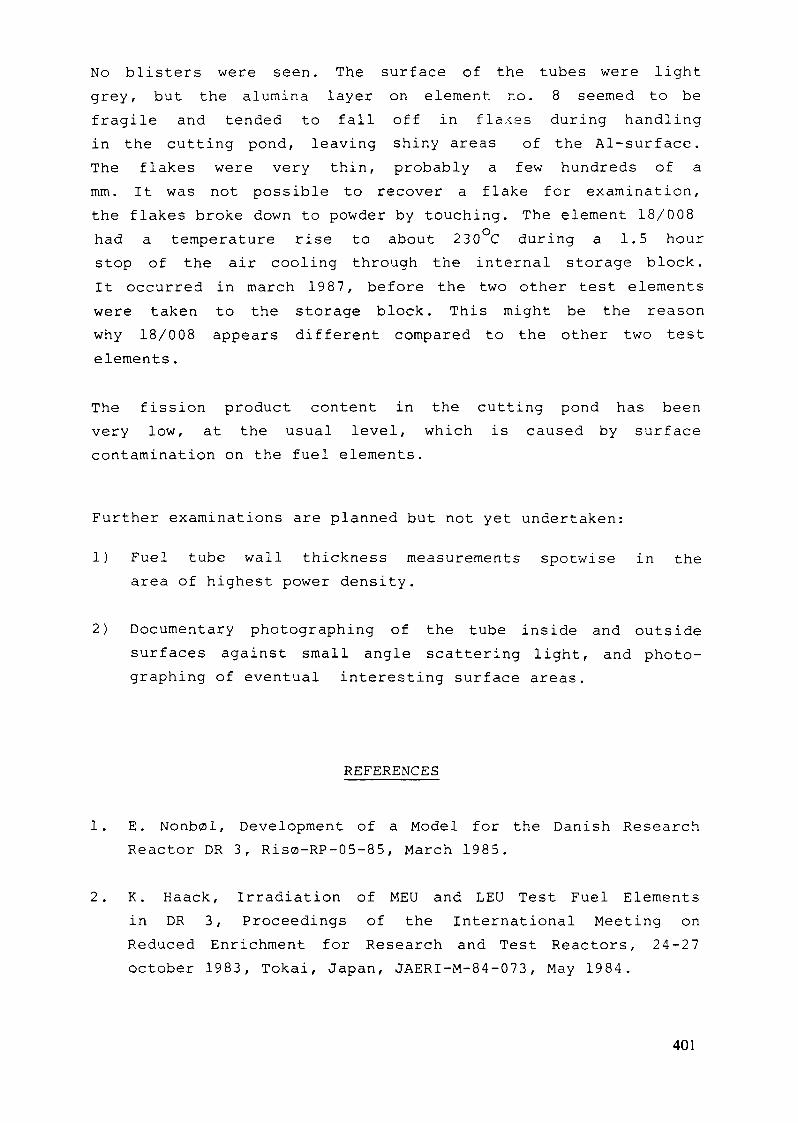
No blisters were seen. The surface of the tubes were lightgrey, but the alumina layer on element, no. 8 seemed to befragile and tended to fall off in flaxes during handlingin the cutting pond, leaving shiny areas of the Al-surface.The flakes were very thin, probably a few hundreds of amm. It was not possible to recover a flake for examination,the flakes broke down to powder by touching. The element 18/008had a temperature rise to about 230 C during a 1.5 hourstop of the air cooling through the internal storage block.It occurred in march 1987, before the two other test elementswere taken to the storage block. This might be the reasonwhy 18/008 appears different compared to the other two testelements.
The fission product content in the cutting pond has beenvery low, at the usual level, which is caused by surfacecontamination on the fuel elements.
Further examinations are planned but not yet undertaken:
1) Fuel tube wall thickness measurements spotwise in thearea of highest power density.
2) Documentary photographing of the tube inside and outsidesurfaces against small angle scattering light, and photo-graphing of eventual interesting surface areas.
REFERENCES
1. E. Nonb01, Development of a Model for the Danish ResearchReactor DR 3, Riso-RP-05-85, March 1985.
2. K. Haack, Irradiation of MEU and LEU Test Fuel Elementsin DR 3, Proceedings of the International Meeting onReduced Enrichment for Research and Test Reactors, 24-27October 1983, Tokai, Japan, JAERI-M-84-073, May 1984.
401

FIG. 1. Neutron flux
402
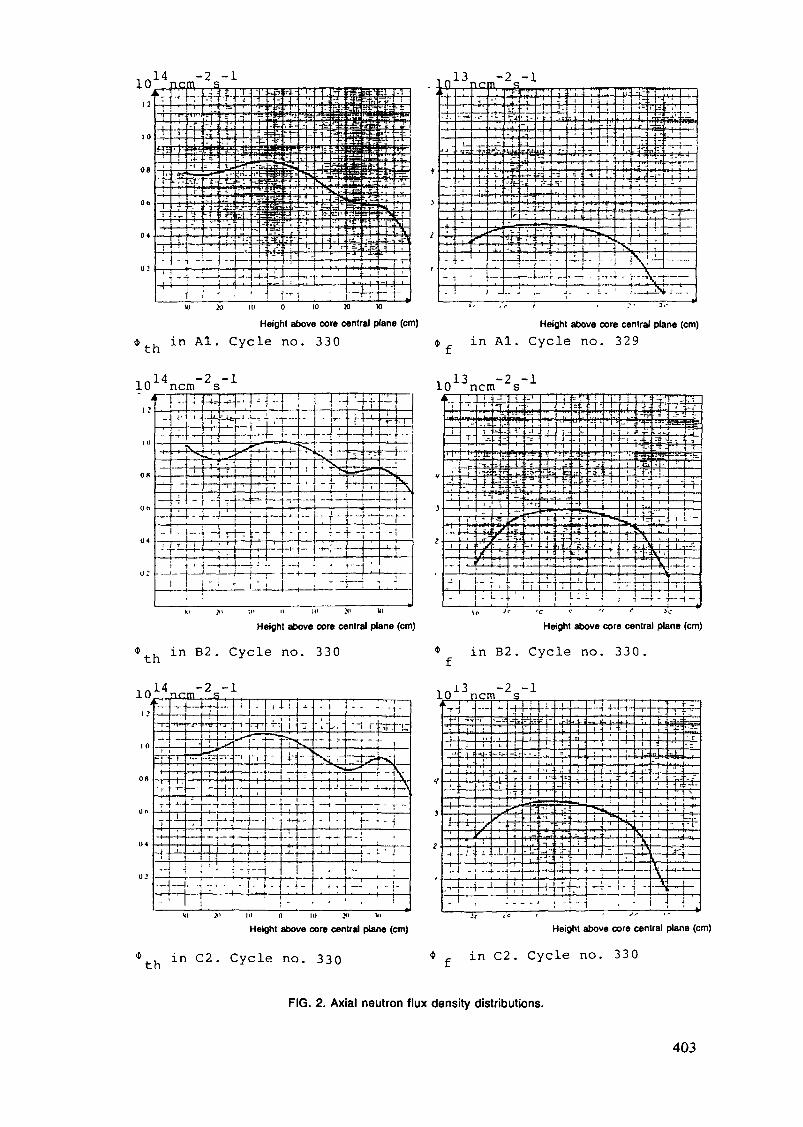
th
VI M 10 0 10 M W
Height above core central plane (cm)
in Al. Cycle no. 330
n^ ii
j j-r
- 1
L3
,. —— .
,
,
4
IP
.4
• 4ni
j -i
_ff
m
_rV'i
j -- ':
—
J
2" r
.
V :
- "
l-iiieiJ-'
• -™T _ ,,-k-«
-*-_ .
-il-i
tj.. .
-1
*M1
^
"V. n
Lft•CT- i- j
1
1 J
-4H
— •
-1-"I,
ci-j. •—i"t
i?4"_-
^-1-4
-
.,- .1 „
r.
"3
"~
; .:.
.1
J,
1 ;
ii
!"
•4-
-
1
|
i
• -
-t.
±- j-j«
,
t-.
-
;-
-,
- '
•
-
-'T -"3
-Ji
Uni
r-
\1
—— H
t -_
: ! "'-"f=
-Tîn3 ~
2 ~f]""'T
„_
i
Vu-iS
,1 1•"".îuip-"-
r ',
• 'I 1
. 1
_
!
-4-'
-——
———— •
,n14 -2 -110 ncm s
Height above core central plane (cm)
in Al. Cycle no. 329
10 ncm s
_J -ai J^
-•f-
-I
-A——\
Height above core central plane (cm)
* , in &2. Cycle no. 330
,„14 -2 -l10 ncm s
H i ; ' - -\--\ i.——,;:...-nrhTr:- • r i ' • i - i— j_ln
Height above core central plane (cm)
* in B2. Cycle no. 330 .
1r.l3 -2 -11.0 ncm s
fch
111 >l hl 0 10 Jl III
Height above core central plane (cm)
in C2. Cycle no. 330
Height above core central plane (cm)
* in C2. Cycle no. 330
FIG. 2. Axial neutron flux density distributions.
403

POWER DENSIÏÏ (KW/CM) LEU FUEL ELEMENT 007/18 (AI)15.00
10.00
POWER = 10MW, CCA = 19.0
X——X P.NO 325, U235=180GR, P=491KW
1———r P.NO 326, U235=162GR, P=461KW
D——Q P.N0327,U235=153GR,P=466KW
0——0 P.NO 328, U235=139GR. P=4OT
B——8 P.NO 329, U235=127GR, P=377W
8——8 P.NO 330, U235=117GR, P=34SW
ffl——ffl P.N0331.U235=MR,P=324W
P.NO 332, U235= 95GR, P=29(P
P.NO 333, U235= 86Gfi, P=298K*
0.00-30 -20 -10 0 10 20
DISTANCE FROM CORE CENTRAL PLANE (CM)FIG. 3. Axial power density distributions through the in-core life of test element 007/18.
404

POWER DENSIÏÏ15.00 _____
LEU FUEL ELEMENT 008/18 (82)
P O W E R - 1 0 M W , C C A = 19.0
10.00
X——X P.NO 326, U235=180GR, P=594W
•I———I- P.NO 327, U235=169GR, P=578KV(
D——B P.NO 328, U235=152GR, P=512W
0——0 P.NO 329, U235=137GR, P=46W
B——8 P.NO 330, U235=125GR, P=434W
8——8 P.NO 331, U235=109GR, P=394W»
D——ffl P.N0332,U235=98Gfi,P=357KI
0.00-20 -10 10 20
DISTANCE FROM CORE CENTRAL PU\NE (CM)
FIG. 4. Axial power density distributions through the in-core life of test element 008/18.
405
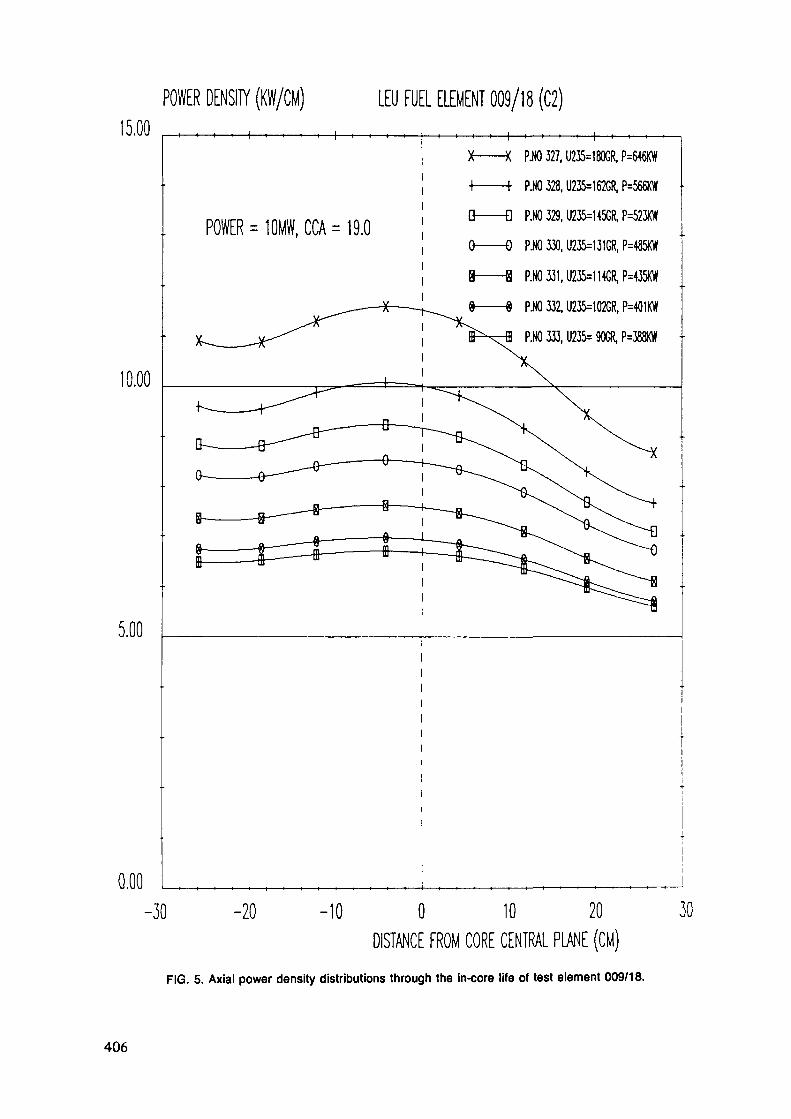
POWER DENSIÏÏ (KW/CM) LEU FUEL ELEMENT 009/18 (C2)15.00
10.00
5.00
0.00
POWER = 10MW, CCA = 19.0
X——X PJJ0327,U235=180GR,P=64€KW
———l- P.NO 328, U235=162GR, P=566W
Q——D P.N0329,U235=H5CR,P=523W
0——0 P.NO 330, U235=131GR, P=485W
§——B P.N0331,U235=1HCR,P=435W
P.NO 332, U235=102GR, P=4Q1W
'.NO 333,11235= 90GR, P=388K«
-30 -20 -10 0 10 20DISTANCE FROM CORE CENTRAL PIANE (CM)
FIG. 5. Axial power density distributions through the in-core life of test element 009/18.
30
406
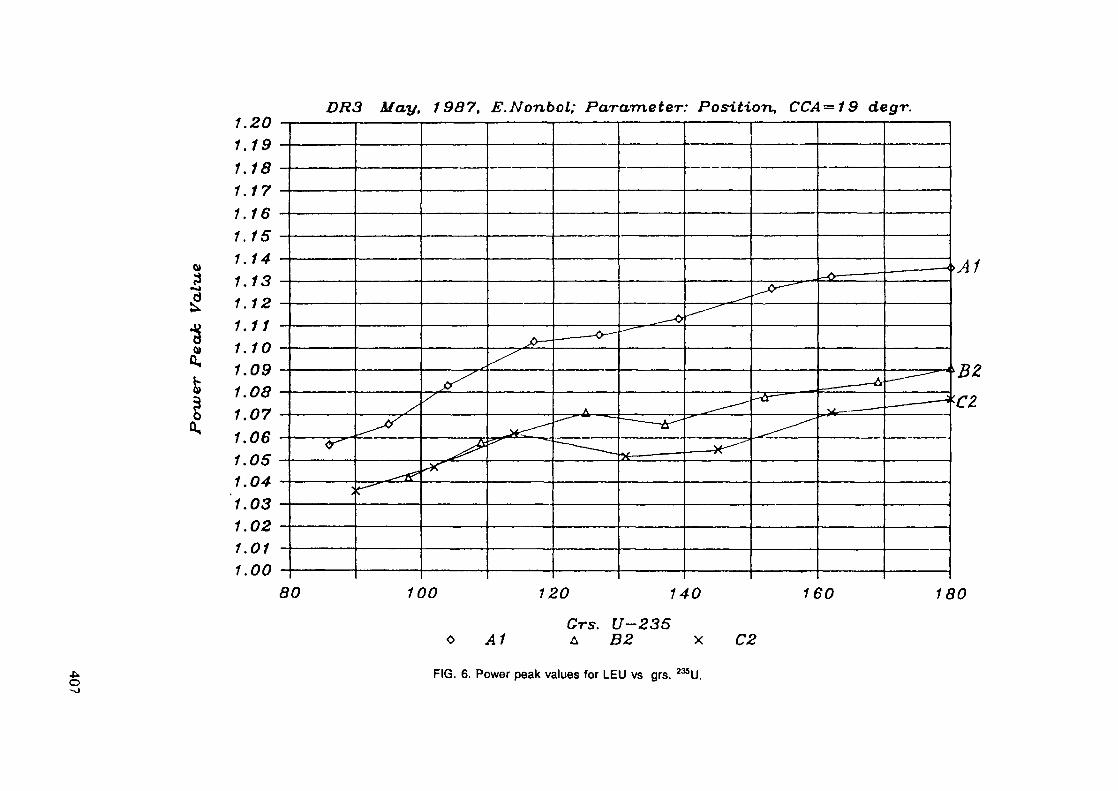
0)3
Q,fc
/..1.191.181.171.161.151.141.13
1.10
1.08r.ir.i1.05
1.1.021.011.00
80
DR3 May, 1987, E.Nonbol; Parameter: Position, CCA=19 degr.
100 120 140 160 180
Grs. U-235A B2 xo AI
FIG. 6. Power peak values for LEU vs grs. 235U.
C2

POWER DENSITY (KW/CM) LEU FUEL EŒMENT 007/18 (AI)15.00
10.00
0.00
PERIOD NO 328POWER=10MW, U235=139GR
x—x CCft=13.5, P=401KW
^——r CCA=19.0, P=415KW
o—Q CCA-24.0, P=437KW
-30 -20 -10 0 10 20DISTANCE FROM CORE CENTRAL PMNE (CM)
30
FIG. 7. Change of axial power density distribution through reactor cycle No. 328.
408
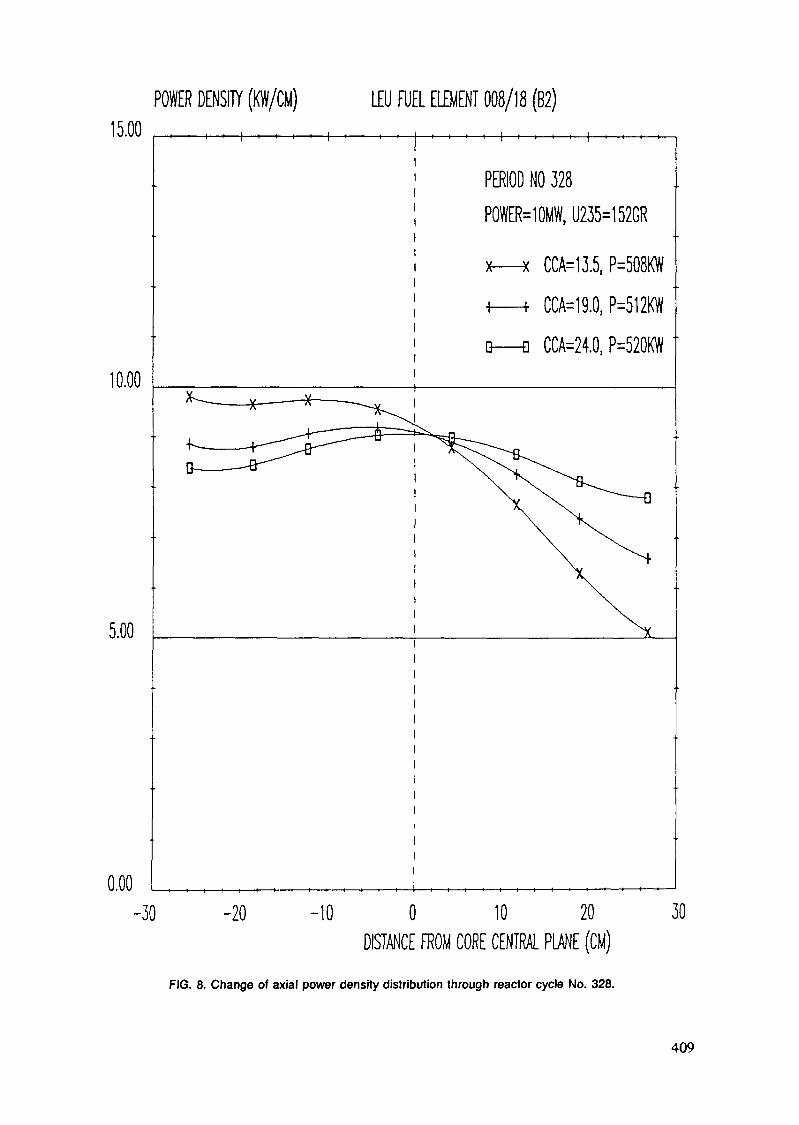
POWER DENSIÏÏ (KW/CM) LEU FUEL ELEMENT 008/18 (B2)15.00
10.00
5.00
0.00-30 -20
PERIOD NO 328PWER=10MW, U235=152GR
x—x CCA=13.5, P=508KW
*——h CCA=19.0, P=5OT
o—o CCA=24.0, P=520KY/
-10 0 10 20DISTANCE FROM CORE CENTRAL PU\NE (CM)
30
FIG. 8. Change of axial power density distribution through reactor cycle No. 328.
409
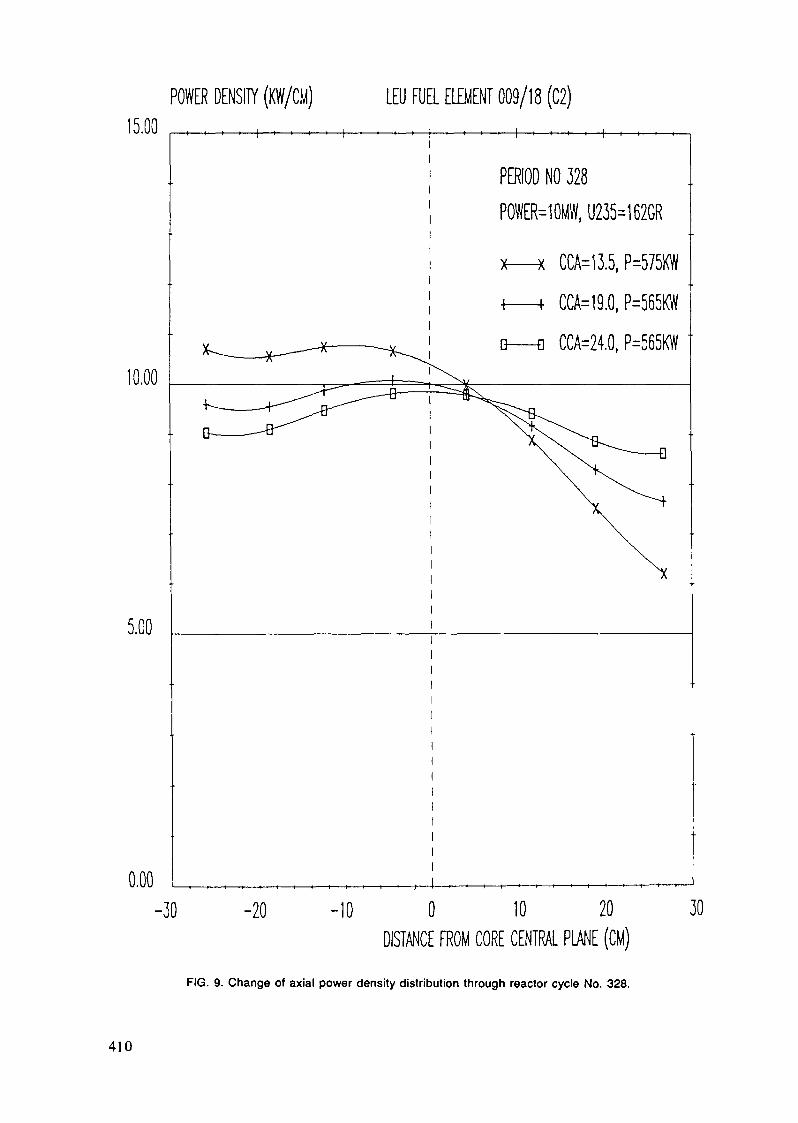
POWER DENSITY (KW/CM)15.00
10.00
5.00
0.00
LEU FUEL ELEMENT 009/18 (C2)
-30 -20
PERIOD NO 328POWENOMW, U235=162GR
x—x CCA-13.5, P=575KW
^——h CCA=19.0, P=565KW
Q—D CCA=24.0, P-565KW
-10 0 10 20DISTANCE FROM CORE CENTRAL PIM (CM)
30
FIG. 9. Change of axial power density distribution through reactor cycle No. 328.
410
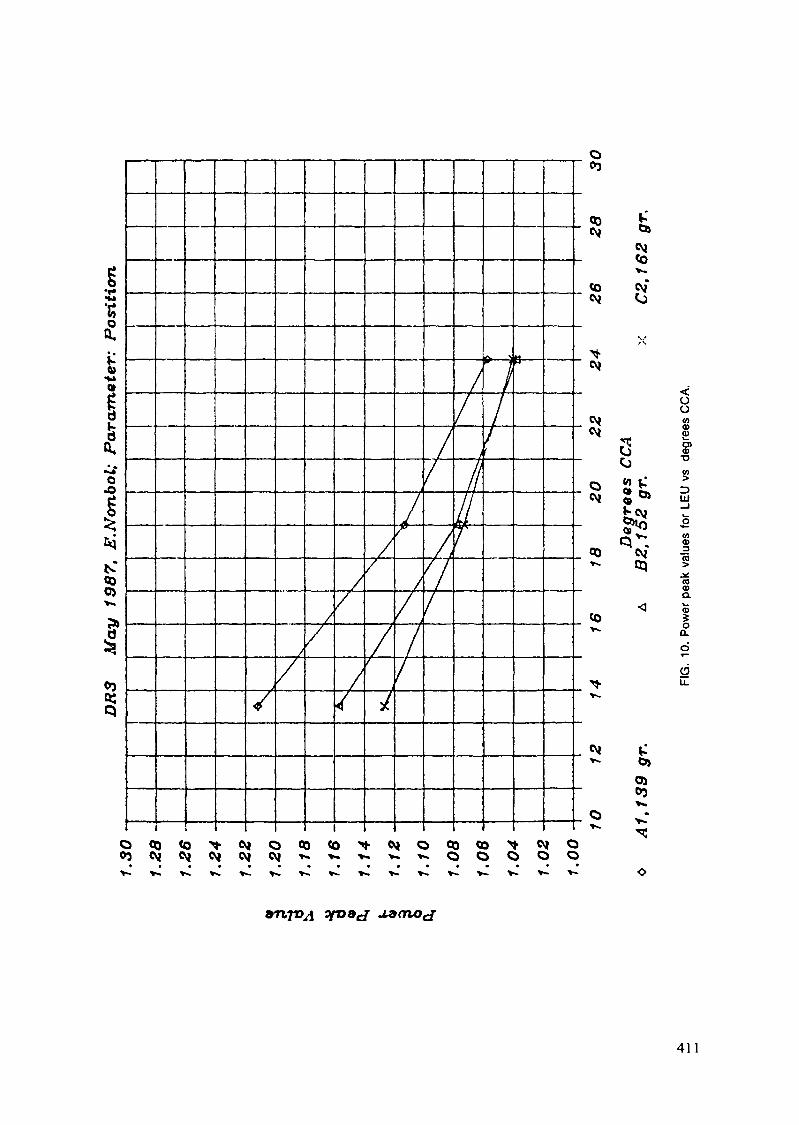
g•*•sa'SOft,• ,
»•v»a»iI
^N*COO>*
!COo;Q
o01
(Oc^
CM(ov.
cv»
«13Cj
ooU)o>2D)0)T3
tu
GOaa>a.
Io0.
ö>O)
411

Appendix J-5FISSION PRODUCT RELEASE
Appendix J-5.1
FISSION PRODUCT RELEASE FROM ALLOY,ALUMINIDE, OXIDE, AND SILICIDE FUELS
D. STAHL, J.L. SNELGROVERERTR Program,Argonne National Laboratory,Argonne, Illinois,United States of America
1. INTRODUCTION
Information on the release of fission products from plate-type fuels isrelatively scarce. Much of the early data is for uranium metal or U02fuels;1'2 however, some data are available from the 1960s for uranium-aluminum alloy fuels and for UA1X and U3O8 dispersion fuels. A renewedinterest in plate- and tube-type fuels during the 1980s, partly as a conse-quence of the RERTR Program, has resulted in new fission product releasemeasurements for U-A1 alloy and UAlx, l^Og, and uranium suicide dispersionfuels. As discussed in the following paragraphs, the out-of-pile data forall types of aluminum-based plate-type fuel shows a consistent pattern,namely that major release of fission gases begins when the aluminumcladding blisters or begins to melt. Once having reached the meltingpoint, however, the release of the noble gases is essentially complete inheating the fuel another 100°C. The volatile fission products are releasedmore slowly as a function of temperature, and their release rates vary withfuel type.
Available data from reactor accidents indicate that, in cases wherewater coolant is present in the core when fuel melts, only the noble gasesare released in any quantity. The iodines and less volatile fission prod-ucts are effectively retained by the water.
2. PLATE-TYPE FUELS
2.1 Releases During Controlled Out-of-Pile Experiments
Fission product release studies were performed on U-A1 alloy platefuels at ORNL during the late 1950s and early 1060s2'3 and at HEDL duringthe mid-1980s4'5. In the ORNL studies fuel plate samples were irradiatedto trace (13.5 to 60.5 h of irradiation), 3.2 at.%, 9.0 at.%, and 23.6 at.%burnups, while the HEDL samples had been irradiated to ~52 wt% burnup. Thefractional releases of the noble gases and iodine at a given temperatureincreased markedly between trace and 3.2% burnup and then remained approxi-mately the same for the higher burnups. The tests at ORNL and at HEDL wereconducted at several temperatures ranging between 700 and 1100°C and in in-ert gas, air, and steam atmospheres. Noble gas release was virtually 100%at the 700°C temperature in all atmospheres. Based on the results of a
413

study at INEL covering a wider temperature range,6 most of the fission gasis released from U-Al alloy fuel at about the 640°C eutectic temperature.At 700°C iodine release fractions were significantly lower for inert andsteam atmospheres than for air, but at 900°C at least 90% of the iodine hadbeen released in all atmospheres. The ORNL and HEDL data for cesiumrelease are not in good agreement, with the HEDL measurements indicatinglarger releases. There is some indication in the ORNL data that therelease fraction for cesium increases with increasing burnup; therefore,the much higher burnup of the HEDL samples might account for the higherreleases measured there. The HEDL study also showed larger release frac-tions for tellurium than did the ORNL study. The release of ruthenium wassmall (<1%) over the entire temperature range (700°C-1085°C) tested atORNL.
An irradiation program was carried out in the ETR and MTR on 1.27-cm-diameter high-density pellets of UA13, UA14, and 20 wt% U-Al alloy fuel(discussed above).6'7 After irradiation to a burnup of 18-35% of the 235U,the pellets were subjected to slow heating (presumably under evacuated con-ditions) to permit the collection of fission products and the monitoring ofnoble gas release by counting 85Kr. No activity release was found below600°C. The UA14 released 28% of its fission gas at about 730°C, the UA14peritectic temperature, with additional significant releases between 1165and 1395°C. For UA13, most fission gas was released at 1280°C, with anadditional release occurring at about 1350°C, the UA13 peritectic tempera-ture. In addition, it was noted that the major release of cesium occurrednear 730°C for UA14 and 1350°C for UA13.7 Smaller releases occurred at tem-peratures slightly above and below these peritectic temperatures. The rateof release of cesium was slower than that of the noble gases for UA14 andthe U-Al alloy, but was as rapid as the noble gases for the UA13,6 probablybecause of the much higher release temperature for UA13. These releases,however, are indicative of bulk fuel only. As discussed above for the U-Alalloy fuel and below for the dispersion fuels, however, the matrix plays akey role in the release of fission products from dispersion fuels.
One study was found in the literature® which compares the fission gasrelease from two plates of UA13-A1 fuel (-1.3 - 1.4 g U/cm3) and one plateof U308-A1 fuel (-1.3 g U/cm3). The burnup was 18-26% of the 235U. Theirradiated plates were heated under vacuum in Vycor tubes at 600°C, 630°C,then 675°C, each with a 30-minute hold. The temperature at which fissiongases began to evolve was in a narrow temperature range between 575 and600°C for both types of plates. No fission gases had been detected afterheating the plates at 500°C for 40 minutes. Since the solidus temperatureof type 6061 aluminum cladding is 582°C, it was inferred that fission gasrelease began at this temperature. The bulk of the fission gas wasreleased by 630°C, with the UA13 fuel releasing gas at a faster rate and ata lower temperature than the U308 fuel. Fission product cesium wasreleased from the fuels, but was deposited in copper tubing upstream fromthe gas collection reservoir. No cesium was found in the gas analysis.
Similar measurements on highly loaded (33 to 44 vol%) UA1X, U308, andU3Si dispersion fuel plates were made during the RERTR Program.9'1^ Thesemeasurements showed that the first significant release of fission gasesoccurred when the plates blistered. In the case of the U3Og and U3Sifuels, the blister temperatures were well below the cladding solidus tem-perature. Therefore, the threshold temperature for fission product releasefrom a dispersion fuel plate is the lower of the blister temperature or thecladding solidus temperature. A second large release of fission gas oc-curred during the 650°C test for each fuel type. This release is assumedto be related to the reaction of the U3O8 or U3Si with the aluminum matrix
414

and to the UA14-A1 eutectic. Although some data for iodine and cesiumreleases are reported, these data must not be used absolutely since theequipment was designed for accurate measurement of the noble gases only.On a qualitative basis, however, it was seen that cesium was released bythe U3Si sample much more readily than by the U308 sample.
At HEDL Woodley has measured the release of fission products from 0.9-gU/cm3 U3O8 at the temperatures and in the atmospheres discussed above forthe U-A1 alloy.4'^ Again, most of the noble gases were released by atemperature of 700°C. Iodine release rates were somewhat lower than forthe alloy fuel. Experiments are in progress in Japan to measure the fis-sion product release fractions for UA1X and U3Si2 dispersion fuels heatedin dry air. Preliminary data^1'1^'13 for 20%-burned fuel show releaserates similar to those measured at HEDL for U308 dispersion fuel, exceptfor Cs release from the U3Si2 dispersion samples, which is considerablymore rapid at the lower temperatures. With the exception of Cs releasefrom U3Si2, the release fractions for the UA1X and U3Si2 dispersions arelower than those measured by Parker et al.2 for U-A1 alloy at comparabletemperatures. Additional measurements using 70%-burnup fuel samples werescheduled to begin during January 1990.
A summary of some of the above data is presented in Fig. 1. The con-clusion is that no fission products are released below the melting point ofthe cladding (582°C) , unless the plate blisters first, and that essentiallyall of the fission gas is released by 675°C. As shown in the figure, fis-sion products such as iodine are released more slowly than the noble gases.
100
m<nto
uD•oo
co•HW
DE3U
U-AI (Ref. 2)
U-Al (Ref. 2 , 6 )
20 —
500 600 700 800 900
Temperature, C
Figure I Fission Product Release from Plate-Type Fuels(Burnup •= 20-25Z of 235U)
415
2.2 Releases During Reactor Accidents
The release of fission products during reactor accidents was alsoexamined. Several accidents involved U-A1 fuel which had undergone meltingdue to flow blockages caused by extraneous material. Partial melting ofone subassembly occurred in each case and the fission products, except forthe noble gases, were largely contained within the coolant water. Similarresults were obtained as a result of a 30-MJ excursion of the ISIS reac-tor.14 Releases into the water and air were monitored and were found to be0.06% and 0.001%, respectively, all significantly less than 1 Ci. Con-trolled overpower excursion tests at CABRI using a special control driveassembly produced significant (70%) melting of the control fuel plate withthe release of 100% of the noble gas and <10% release of iodine and tel-lurium from the molten fuel.15 However, both these elements were retainedin the water and only between 0.0005 and 0.005% was released to the reactorroom.
More extensive damage and somewhat greater releases occurred in theSPERT-1 destructive test and the SL-1 accident.16'17 The nuclear energiesand peak powers generated were 31 and 130 MJ, and 2.3 x 10 and1.9x 104 MW, respectively. In the SPERT-1 test, partial melting of all ofthe fuel plates occurred, and more than 50% of the plates were fullymelted. Fission product release, mainly due to fission gases, was esti-mated to be about 0.7% of the total inventory. Iodine release to the atmo-sphere was estimated to be less than 0.01%. The reactor building was onlymoderately contaminated and re-entry occurred about four hours after thetest. As a result of the SL-1 accident, the building was badly contami-nated, with an extensive low-level deposition of 131I. Total fission prod-uct release was estimated to be 5-10% of the total inventory, and releaseto the environment was estimated to be only about 0.01%. The iodinerelease to the environment was estimated to be less than 0.5%.
REFERENCES FOR FISSION PRODUCT RELEASE FROM RESEARCH REACTOR FUELS
1. G. W. Parker and C. J. Barton, "Fission Product Release," Chapter 18,Technology of Nuclear Reactor Safety, Volume 2, Thompson andBeckerley, Eds., MIT press, pp. 525-618, 1973.
2. G. W. Parker, G. E. Creek, C. J. Barton, W. J. Martin, andR. A. Lorenz, "Out-of-Pile Studies of Fission-Product Release fromOverheated Reactor Fuels at ORNL, 1955-1965," Oak Ridge NationalLaboratory Report ORNL-3981, pp. 59-66, July 1967.
3. G. E. Creek, W. J. Martin, and G. W. Parker, "Experiments on theRelease of Fission Products from Molten Reactor Fuels," Oak RidgeNational Laboratory Report ORNL-2616, pp. 11-12, July 1959.
4. R. E. Woodley, "The Release of Fission Products from Irradiated SRPFuels at Elevated Temperature: Data Report on the First Stage of theSRP Source Term Study," Hanford Engineering Development LaboratoryReport HEDL-7598, June 1986.
5. R. E. Woodley, "The Release of Fission Products from Irradiated SRPFuels at Elevated Temperatures: Data Report on the Second Stage ofthe SRP Source Term Study," Hanford Engineering Development LaboratoryReport HEDL-7651, March 1987.
416

6. R. R. Hammer, L. L. Dickerson, and R. R. Hobbins, "Fission ProductRelease from Uranium Aluminide Fuels," in Metallurgy and MaterialsScience Branch Annual Report—Fiscal Year 1970, W. C. Francis, Ed.,IN-1437, pp. 27-34, November 1970.
7. M. J. Graber and G. W. Gibson, "Bulk UA1X Fuel Irradiations," inReactor Engineering branch Annual Report—Fiscal Year 1969, IN-1335,pp. 47-49, November 1969.
8. M. J. Graber, M. Zukor, and G. W. Gibson, "Fission Gas Release fromFuel Plate Meltdown," Annual Progress Report on Reactor Fuels andMaterials Development for FY 1966, IDO-17218, pp. 52-58, November1966.
9. T. Shibata, T. Tamai, M. Hayashi, J. C. Posey, and J. L. Snelgrove,"Release of Fission Products from Irradiated Aluminide Fuel atElevated Temperatures," Nucl. Sei. and Eng. 87, 405-417, 1984.
10. J. C. Posey, "Release of Fission Products from Miniature Fuel Plates atElevated Temperatures," Proc. Int. Mtg. on Research and Test ReactorCore Conversions from HEU to LEU Fuels, Argonne, Illinois, November 8-10, 1982, Argonne National Laboratory Report ANL/RERTR/TM-4 (CONF-821155), pp. 117-133, September 1983.
11. F. Sakurai, Y. Komori, J. Saito, B. Komukai, H. Ando, H. Nakata,A. Sakakura, S. Niiho, M. Saito, and Y. Futamura, "Progress in SafetyEvaluation for the JMTR Core Conversion to LEU Fuel," Proc. 12th Int.Mtg. on Reduced Enrichment for Research and Test Reactors, BerlinGermany, September 10-14, 1989, in press.
12. M. Saito, Y. Futamura, H. Nakata, H. Ando, F. Sakurai, N. Ooka,A. Sakakura, M. Ugajin, and E. Shirai, "Further Data of Suicide Fuelfor the LEU Conversion of JMTR," paper presented at the Int. Symp. onResearch Reactor Safety, Operations and Modifications, Chalk River,Ontario, Canada, October 23-27, 1989.
13. Y. Komori, Japan Atomic Energy Research Institute, personalcommunication (November 1989).
14. P. Lebauleux, et al., "The Behavior of Fission Products Observed Duringthe Operation of the C.E.N. Saclay Reactors," Congress on Diffusion ofFission Products, Saclay, Nov. 4-6, 1969, AAEC-LIB/Trans -615, Feb.1977.
15. J. Dadillon, "Experimental Study of the Behavior of Fission Products ina Pool Reactor Accident," C.E.A. Bulletin d'Information Scientifiqueset Techniques, 112, pp. 13-18, 1967.
16. R. W. Miller, A. Sola, and R. K. McCardell, "Report of the SPERT 1Destructive Test Program on an Aluminum, Plate-type, Water-ModeratedReactor, IDO-16883, June 1964.
17. T. J. Thompson, "Accidents and Destructive Tests," Chapter 11, TheTechnology of Nuclear Reactor Safety, Volume 1, Thompson andBeckerley, Editors, MIT Press, pp. 608-708, 1973.
417
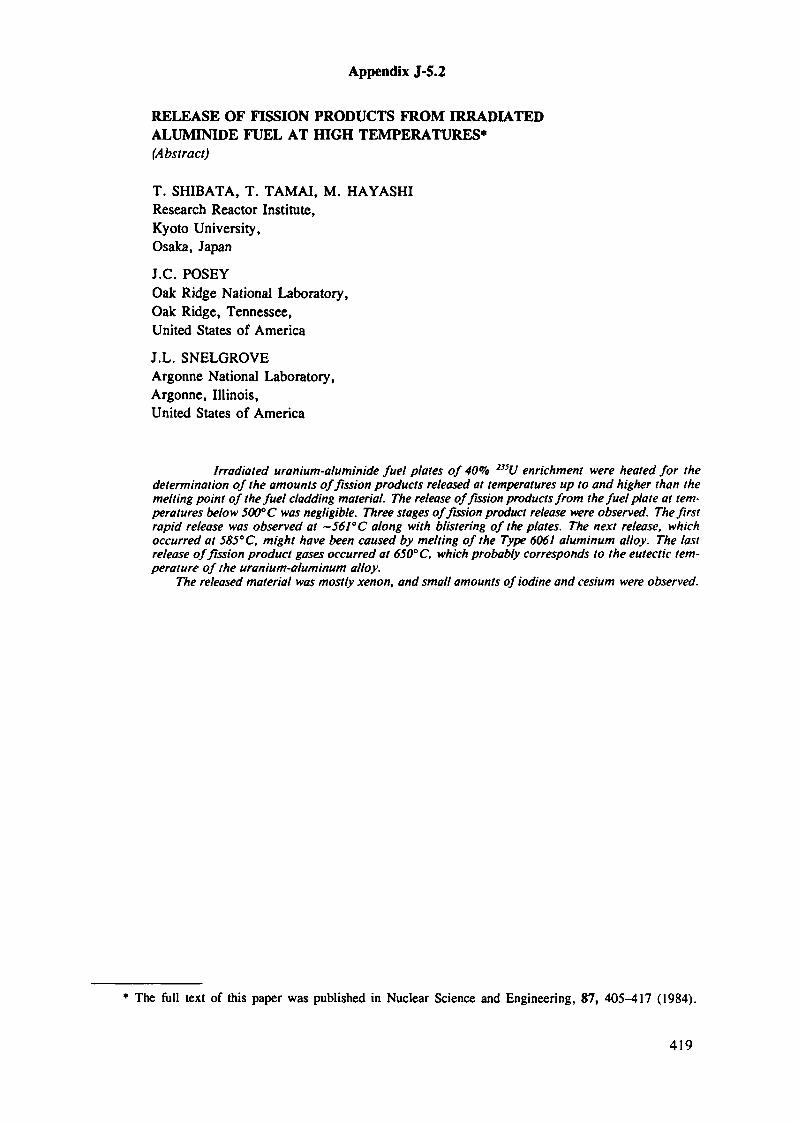
Appendix J-5.2
RELEASE OF FISSION PRODUCTS FROM IRRADIATEDALUMINIDE FUEL AT HIGH TEMPERATURES*(Abstract)
T. SHIBATA, T. TAMAI, M. HAYASHIResearch Reactor Institute,Kyoto University,Osaka, Japan
J.C. POSEYOak Ridge National Laboratory,Oak Ridge, Tennessee,United States of America
J.L. SNELGROVEArgonne National Laboratory,Argonne, Illinois,United States of America
Irradiated uranium-aluminide fuel plates of 40% 23iU enrichment were heated for thedetermination of the amounts of fission products released at temperatures up to and higher than themelting point of the fuel cladding material. The release of fission products from the fuel plate at tem-peratures below 500° C was negligible. Three stages of fission product release were observed. The firstrapid release was observed at ~561°C along with blistering of the plates. The next release, whichoccurred at 585° C, might have been caused by melting of the Type 6061 aluminum alloy. The lastrelease of fission product gases occurred at 650° C, which probably corresponds to the eutectic tem-perature of the uranium-aluminum alloy.
The released material was mostly xenon, and small amounts of iodine and cesium were observed.
The fall text of this paper was published in Nuclear Science and Engineering, 87, 405-417 (1984).
419
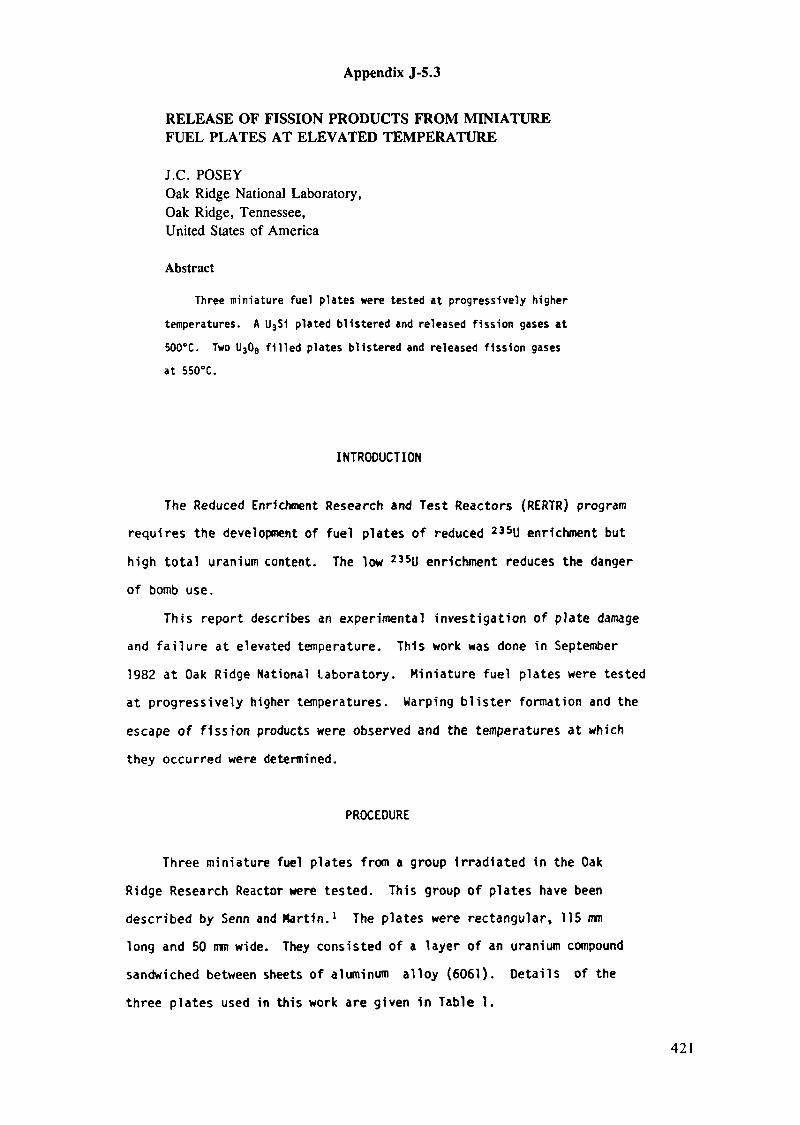
Appendix J-5.3
RELEASE OF FISSION PRODUCTS FROM MINIATUREFUEL PLATES AT ELEVATED TEMPERATURE
J.C. POSEYOak Ridge National Laboratory,Oak Ridge, Tennessee,United States of America
Abstract
Three miniature fuel plates were tested at progressively higher
temperatures. A U3Si plated blistered and released fission gases at
500°C. Two U30B filled plates blistered and released fission gases
at 550°C.
INTRODUCTION
The Reduced Enrichment Research and Test Reactors (RERTR) program
requires the development of fuel plates of reduced 235U enrichment but
high total uranium content. The low 235U enrichment reduces the danger
of bomb use.
This report describes an experimental investigation of plate damage
and failure at elevated temperature. This work was done in September
1982 at Oak Ridge National Laboratory. Miniature fuel plates were tested
at progressively higher temperatures. Warping blister formation and the
escape of fission products were observed and the temperatures at which
they occurred were determined.
PROCEDURE
Three miniature fuel plates from a group irradiated in the OakRidge Research Reactor were tested. This group of plates have beendescribed by Senn and Martin.1 The plates were rectangular, 115 mmlong and 50 mm wide. They consisted of a layer of an uranium compoundsandwiched between sheets of aluminum alloy (6061). Details of thethree plates used in this work are given in Table 1.
421

Table 1. Miniature fuel plates
NominalPlate thicknessnumber ————————
»m 1 nches
A-19 1270 0.050
0-50-1 1270 0.050
0-58-8 1524 0.060
Hssle Uraniumbearing densitycompound kg/»3
U3S1 4814
U30B 2759
U30e 3102
•"»-H*-« tas1"«s
19.88 2081
19.47 1154
19.47 1663
The plates had been removed from the reactor on Hay 24, 1982. Thetests described in this report were carried out during the period ofAug. 26 to Sept. 10, 1982. Consequently, nearly all of the 133Xe and1311 had decayed and they could not be used effectively as indicatorsof a breach of the containment of the fission products within the plate.The escape of 8SKr was used as an indicator of containment failure.
Figure 1 is a flow sheet of the equipment used in this work. Thefuel plate was contained in a quartz tube in the furnace. Helium gasflowed over the plate and then through a sample tray containing activatedcharcoal at liquid nitrogen temperature. Any 85Kr escaping from the
Throttle Volve
To Vacuum Pump •«—^»*- -*
lonuotionChamber
Sample Traps
FIG. 1. Flowsheet.
Check Volve
Rotometer
ThrottleValve
422

Boll Joints
Gloss Wool
Activoted Charcoal" - 20 y*
FIG. 2. Sample trap.
plate accumulated in this tray. The flow could be diverted through analternate trap of the same type. The gas flow then passed through asecond larger charcoal trap, followed by a throttle valve and a vacuumpump. The sample trap removed any volatile fission products from thegas stream. The back up trap was present as a safety precaution to trapany 131I that might pass the sample trap.
The helium flow and pressure were controlled by two throttle valves,one located in the helium inlet line outside of the hot cell, the otherlocated in the hot cell just before the vacuum pump. The flow was heldat 100 * 20 cc/min; the pressure was very slightly below atmospheric.
The sample traps (Fig. 2) were designed to lay flat on the crystalcover of a GeLi counter. This allowed an efficient geometry forcounting.
An ionization chamber was mounted on the outside of the vacuumflask that held the sample trap. The trapping of a large amount ofradioactive material could be detected by this instrument. This methodhad been very effective in detecting 133Xe released by fresh fuel platesbut was found to be ineffective in detecting 8SKr in the amounts involved.
423

The furnace was heated by a nichrome resistance coil. The tempera-ture was regulated by a proportional controller. The heated zone ofthe furnace was 7 in. long and 3 in. in diameter. Line of sight ganmaradiation from the intensely radioactive fuel plate to the sample trapionization chamber was blocked by 2 1n. of lead brick. The rest of thefurnace was covered with 1/4 1n. sheet lead. This absorbed much ofthe low energy gamma radiation which 1s especially prone to backscatter.
A quartz tube (Fig. 3) fit Inside the furnace. Two chrome!-alumelthermocroupies, sheathed in stainless steel entered the back of thetube through a small quartz tube. The helium gas entered through thesame tube. The other end of the tube terminated in a large groundquartz ball joint. The tube was connected through this joint to thesample collection system.
The fuel plate was held 1n a quartz sample holder (Fig. 4). Thefuel plate lay 1n this holder in a slanted position. As the holderslid into the quartz tube the slanted surface of the plate contacted athermocouple causing it to bend up slightly. This assured that the
FIG. 3. Furnace tube.
424
Sealed Volume, Quartz Wool Filled
Fuel Plate
FIG. 4. Sample holder.

thermocouple junction was 1n contact with the plate. The temperaturewas recorded by a single point recorder. The recorder could be read to2°F. A second thermocouple was bent upward so that its junction con-tacted the inner surface of the quartz tube. This thermocouple wasconnected to the proportional controller.
Each plate was tested in the following manner.
1. The plate was examined visually and photographed. Its thicknesswas measured in six places by means of a micrometer.
2. The plate was mounted in the sample holder which was placed inthe furnace tube. The tube was then connected to the samplecollection system.
3. The flow of helium was started and the sample trap was cooled toliquid nitrogen temperature.
4. The furnace was heated to the operating temperature which was main-tained for 30 min.
5. The furnace was allowed to cool.6. After the furnace had cooled to approximately 100°C below operating
temperature, the helium flow was diverted through the alternatetrap and the loaded trap was allowed to warm to room temperature.The adsorbed helium was allowed to escape through the down streamstopcock which was allowed to remain open.
7. The trap was then removed from the manifold and its openings werecapped. It was then removed from the hot cell and its outer surfacewas washed. Its radioactive content was then measured using theGeLi counter. Counting times of up to 16 h were used to measurevery,low levels of activity.
8. After the plate had cooled to •v250°C it was removed from thefurnace, inspected, and the thickness measured. Photographs weremade when blisters appeared. The thickness measurements were dis-continued after warping or blistering became severe. Plate A-19was not cooled or removed from the furnace after the tests at600aC and 650°C and plate 0-58-8 was not removed after the 650°Ctest.
425
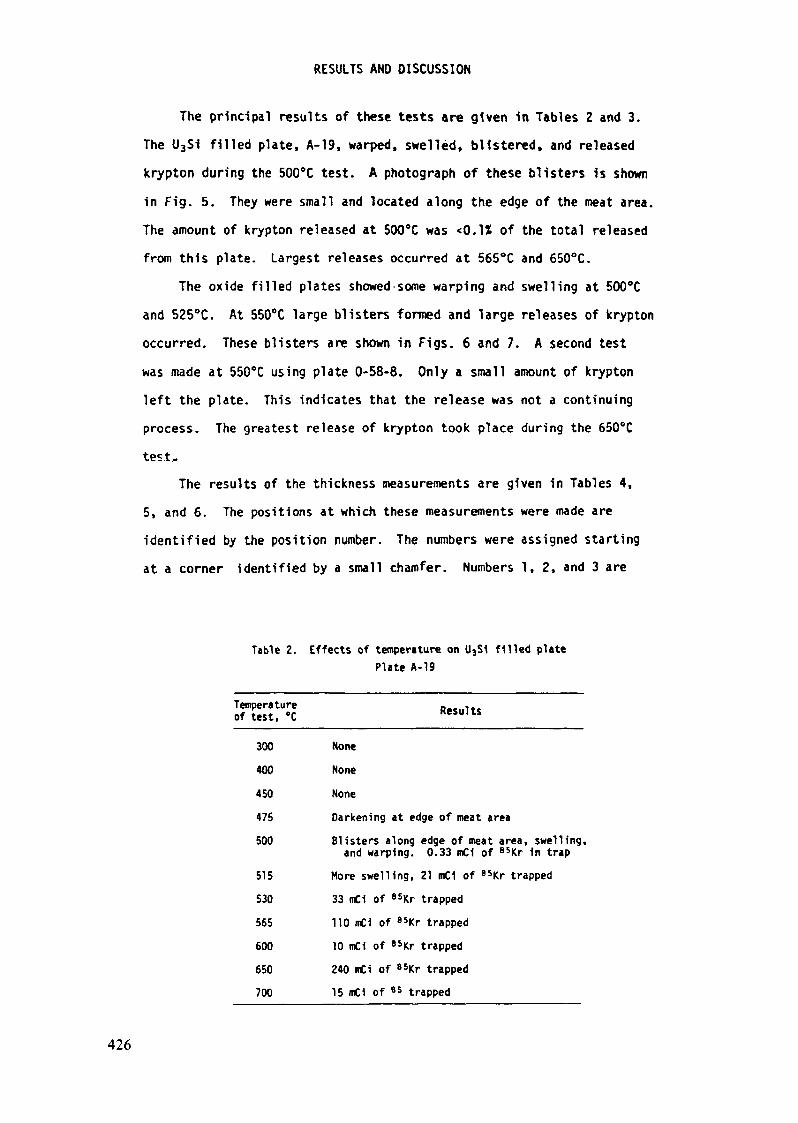
RESULTS AND DISCUSSION
The principal results of these tests are given 1n Tables 2 and 3.
The U3S1 filled plate, A-19, warped, swelled, blistered, and released
krypton during the 500°C test. A photograph of these blisters 1s shown
In Fig. 5. They were small and located along the edge of the meat area.
The amount of krypton released at 500eC was <0.1X of the total released
from this plate. Largest releases occurred at 565°C and 650°C.
The oxide filled plates showed some warping and swelling at 500°C
and 525°C. At 550°C large blisters formed and large releases of krypton
occurred. These blisters are shown in Figs. 6 and 7. A second test
was made at 550°C using plate 0-58-8. Only a small amount of krypton
left the plate. This indicates that the release was not a continuing
process. The greatest release of krypton took place during the 650°C
test.
The results of the thickness measurements are given in Tables 4,
5, and 6. The positions at which these measurements were made are
identified by the position number. The numbers were assigned starting
at a corner identified by a small chamfer. Numbers 1, 2, and 3 are
Table 2. Effects of temperature on U3S1 filled platePlate A-19
Temperature Result«of test, eC Results
300 None
400 None
450 None
475 Darkening at edge of meat area
500 Blisters along edge of meat area, swelling,and warping. 0.33 mCI of 85Kr in trap
515 More swelling, 21 mC1 of 85Kr trapped
530 33 mCi of 85Kr trapped
565 110 mCI of 85Kr trapped
600 10 mCi of 85Kr trapped
650 240 mCi of 85Kr trapped
700 15 mCi of 8S trapped
426

Table 3. Effects of temperature on U308 filledminiature fuel platesPlates 0-50-1 and 0-58-8
Temperatureof test, °C300400425450475500525550
1st 550"2nd SSO2'
600650700
Platenumber
0-58-80-58-80-50-10-58-80-50-10-58-80-50-10-50-10-58-80-58-80-58-80-58-80-58-8
Results
NoneNoneHeat area light grey, outer areaHeat area light grey, outer areaHeat area light grey, outer areaRêverai — meat area is now darkerand swellingWarping and swellingLarge blisters, 59 mCi of 85KrLarge blisters, 52 mCi of 85Kr1.2 mCi of 85Kr0.1 mCi of 85Kr150 mCi of 85Kr0.9 mCi of 85Kr
dark greydary greydark grey, slight warping
°Two tests were made at 550°C to determine whether or not kryptonrelease continued at this temperature.
FIG. 5. Plate A-19 after 500°C test.
in line along the plate about 3/4 in. in from the edge. They wereapproximately 1 1/8 in., 2 1/4 in., and 3 3/8 in. from the end of theplate. Numbers 4, 5, and 6 were in a similar row 3/4 in. from theother edge of the plate.
427

FIG. 6. Plate O-58-8 after 550°C test.
FIG. 7. Plate O-58-8 after 550°C test.
The U3Si filled plate A-19 showed swelling in the 500°C test;blistering and krypton release occurred in the same test. The U30efilled plate 0-58-8 showed some swelling at 500°C; blistering andkrypton release were not observed until the 550°C test. Plate 0-50-1showed no swelling at 475°C but did at 525°C. It was not tested at500°C.
Both 13<4Cs and 137Cs were found in the traps after the tests atthe higher temperatures. THese data are given in Table 7. Thesequantities are indicative of the relative amounts of cesium volatilizingfrom the plates but are in no sense quantitative measurements to thetotal amounts. Most of the cesium would be deposited on surfaces beforereaching the traps because of either condensation or reaction.
Much more cesium was found In the trap after the tests of thesuicide filled plate than was found after the tests of the oxide filled
428
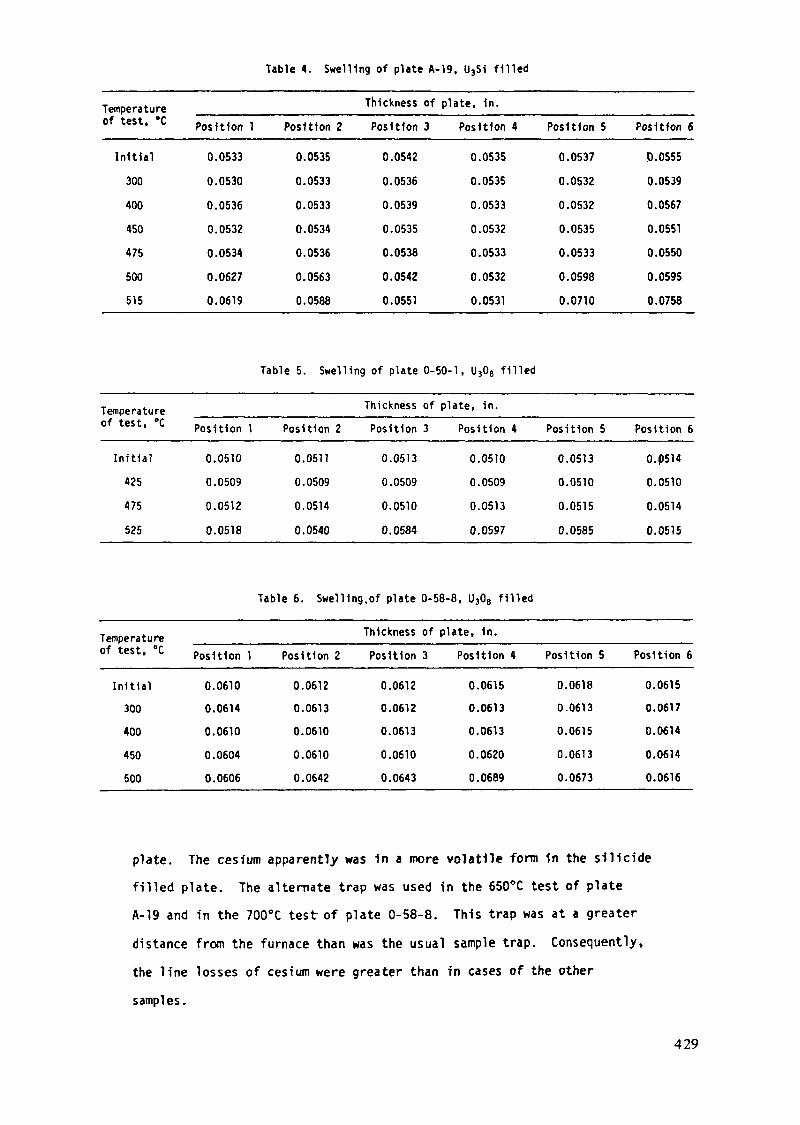
Table 4. Swelling of plate A-19, U3S1 filled
Temperatureof test, °C
Initial300400450475500515
Thickness of plate, In.Position 1
0.05330.05300.05360.05320.05340.06270.0619
Position 2
0.05350.05330.05330.05340.05360.05630.0588
Position 3
0.05420.05360.05390.05350.05380.05420.0551
Position 40.05350.05350.05330.05320.05330.05320.0531
Position 5
0.05370.05320.05320.05350.05330.05980.0710
Position 6
0.05550.05390.05670.05510.05500.05950.0758
Table 5. Swelling of plate 0-50-1, U308 filled
Temperatureof test, °C
Initial425475525
Thickness of plate, in.Position 1
0.05100.05090.05120.0518
Position 20.05110.05090.05140.0540
Position 3
0.05130.05090.05100.0584
Position 40.05100.05090.05130.0597
Position 5
0.05130.05100.05150.0585
Position 6
0.05140.05100.05140.0515
Table 6. Swelling,of plate 0-58-8, U308 filled
Temperatureof test, °C
Initial300400450500
Thickness of plate, in.Position 10.06100.06140.06100.06040.0606
Position 2
0.06120.06130.06100.06100.0642
Position 3
0.06120.06120.06130.06100.0643
Position 4
0.06150.06130.06130.06200.0689
Position 5
0.06180.06130.06150.06130.0673
Position 60.06150.06170.06140.06140.0616
plate. The cesium apparently was 1n a more volatile form 1n the slllcide
filled plate. The alternate trap was used In the 650°C test of plate
A-19 and in the 700°C testr of plate 0-58-8. This trap was at a greater
distance from the furnace than was the usual sample trap. Consequently,
the line losses of cesium were greater than in cases of the other
samples.
429

Table 7. Cesium found In traps after tests
PlateA-19A-19A-19A-190-58-80-58-80-58-80-58-8
Temperature °C565600650700550600650700
13"Cs, «CI
710.20
4151300
0.0030.00042.20.34
i"Cs, mC1
410.13
2517930.0020.00031.20.21
The presence of surface deposits of cesium in the system was
verified by surface smears made using Q-tips. One smear was taken from
plate 0-58-8 after the 600°C test at the sight of a small crack at the
edge of a blister. Another was taken from the plate holder near the
plate after the same test. A third was taken from plate A-19 after the
565°C test. All Q-tips gave survey meter readings of >10 R. Gamma
scans showed the presence of only 13**Cs and 137Cs.
Film deposits were observed on the sample holder after the 700°C
melt down of plate A-ig. These deposits were analyzed by spark source
mass spectrometry. The results are given in Table 8. The concentrations
are relative with cesium equal to 100. Sample 1 was taken at a point
just down stream with respect to helium flow, from the plate. Sample 2
was taken from a cooler zone farther down stream. The Isotopic com-
position of the cesium was 44X, 133Cs; 4Ï. i3«.Cs; 4X( i35Cs; and 48ît
137Cs. The iodine was 111. 127I and 89Ï. 129I. The isotopic composi-
tion of the cadmium was that of fission product cadmium.
Plate 0-58-8 has been turned over to the analytical division for
analysis. When the results are received the exact degree of bum-up
can be calculated.
SUMMARY
Three miniature fuel plates were tested at progressively higher
temperatures. A U3Si filled plate blistered, warped, and released 85Kr
430
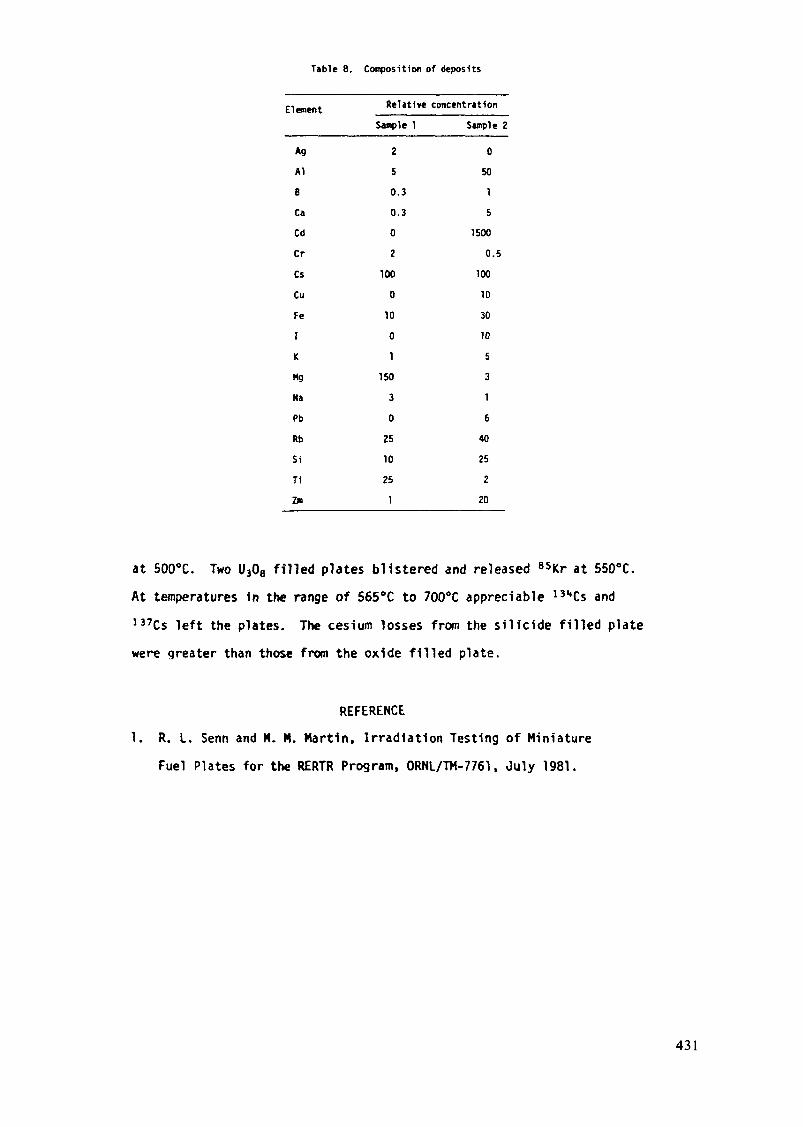
Table 8. Composition of deposits
Element
AgAlBÇaCdCrCsCuFeIKHgNaPbRbS1T1Zm
RelativeSample l
250.30.302
10001001
150302510251
concentrationSample 2
05015
15000.5
100103010531640Z5220
at 500°C. Two U308 filled plates blistered and released 85Kr at 550CC.At temperatures 1n the range of 565°C to 700°C appreciable 13<4Cs and137Cs left the plates. The cesium losses from the suicide filled platewere greater than those from the oxide filled plate.
REFERENCE1. R. L. Senn and H. H. Martin, Irradiation Testing of Miniature
Fuel Plates for the RERTR Program, ORNL/TM-7761. July 1981.
431

Appendix J-5.4
FURTHER DATA OF SILICIDE FUELFOR THE LEU CONVERSION OF JMTR*
M. SAITO, Y. FUTAMURA, H. NAKATA,H. ANDO, F. SAKURAI, N. OOKA,A. SAKAKURA, M. UGAJIN, E. SHIRAIOarai Research Establishment,Japan Atomic Energy Research Institute,Oarai-machi, Ibaraki-ken,Japan
Abstract
Data of suicide fuel for the safety assessment of the JHTRLEU fuel conversion are being measured. The data include releaseof fission products,thermal properties.behaviors under accidentcondition and metallurgical characters. Methods of the experi-ments are discussed. Results of fission products release athigh temperature are described. The release of iodine from thesuicide fuel considerably louer than the U-A1 alloy fuel.
1. INTRODUCTIONThe Japan Materials Testing Reactor (JMTR) is a 50-MH, tank-type reactor
and its core conversion from highly enriched uranium fuel to aluminide mediumenriched uranium (MEU) fuel was carried out in 1986. The effort to convert thecore to suicide low enriched uranium (LEU) fuel continues, which is a finalgoal.
In the suicide core, the U-235 content is increased to extend the operationcycle length and burnable absorber is introduced to reduce the reactivity swingduring the cycle. Neutronic calculations are continued for the LEU-fueled cores.Safety analysis is also to be conducted by more stringent method and criteriathan previous ones. Therefore,more detailed data such as temperature-dependentproperty data, R/B ratio (R:release, B: born) of fission products (FPs) etc. arenecessary in order to assess integrity of the uranium suicide fuel in thesafety assessment. These data are also required by the authorities concernedbecause there is no data for the uranium suicide fuel.
2. SAFETY REVIEW FOR LEU FUEL USEThe guideline of safety assessment in the application for the license of
the reactor installation is being allover revised based on LHR-base criteria.In the present safety analysis for the MEU-fueled core, the anticipated oper-ational transients (AOT) are included in the postulated accidents (PA), and nosafety criteria for PA are set up.
* Paper presented at the International Symposium on Research Reactor Safety, Operations and Modifica-tions, Chalk River, Ontario, Canada, 23-27 October 1989 (AECL-9926, Vol. 1, Chalk River Nuclear Laborato-ries, Ontario (1990)).
433
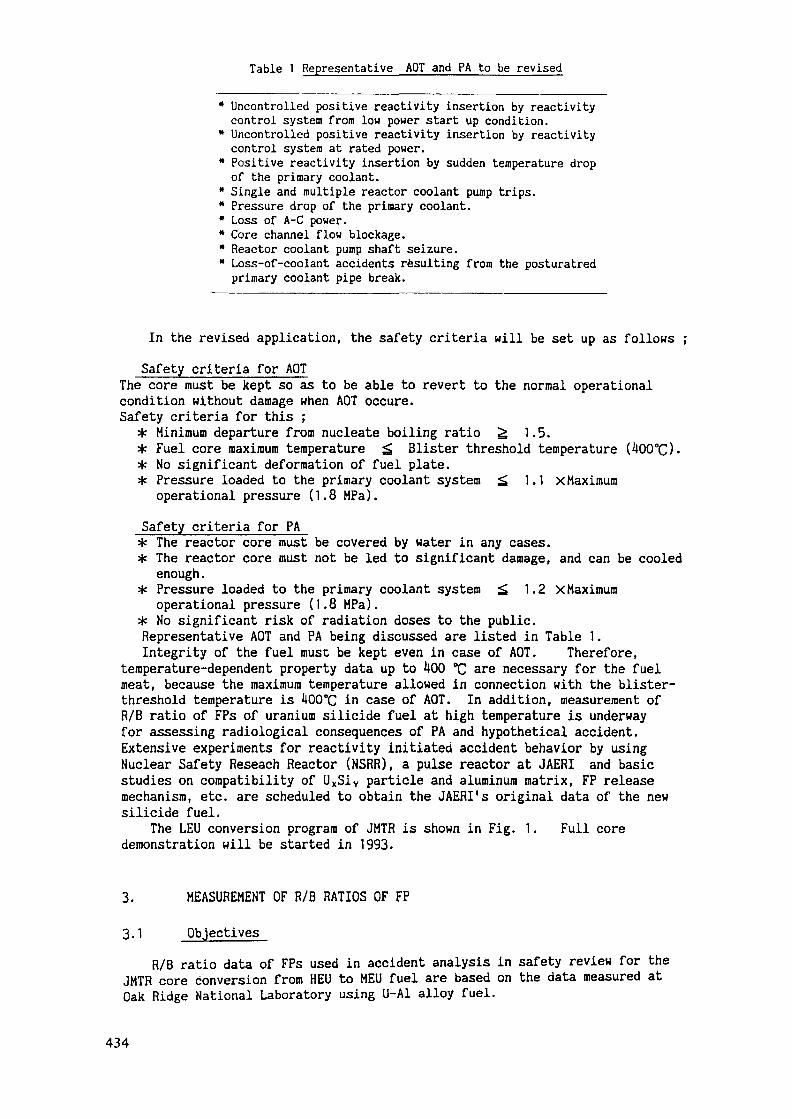
Table 1 Representative APT and PA to be revised
* Uncontrolled positive reactivity insertion by reactivitycontrol system from low power start up condition.
* Uncontrolled positive reactivity insertion by reactivitycontrol system at rated power.
" Positive reactivity insertion by sudden temperature dropof the primary coolant.
* Single and multiple reactor coolant pump trips.* Pressure drop of the primary coolant.* Loss of A-C power.* Core channel flow blockage." Reactor coolant pump shaft seizure.* Loss-of-coolant accidents resulting from the posturatredprimary coolant pipe break.
In the revised application, the safety criteria will be set up as follows ;Safety criteria for APT
The core must be kept so as to be able to revert to the normal operationalcondition without damage when AOT occure.Safety criteria for this ;* Minimum departure from nucleate boiling ratio ^ 1.5.* Fuel core maximum temperature ^ Blister threshold temperature (400°C).* No significant deformation of fuel plate.* Pressure loaded to the primary coolant system ^ 1.1 xMaximum
operational pressure (1.8 MPa).Safety criteria for PA* The reactor core must be covered by water in any cases.* The reactor core must not be led to significant damage, and can be cooled
enough.H« Pressure loaded to the primary coolant system ^ 1.2 X Maximum
operational pressure (1.8 MPa).* No significant risk of radiation doses to the public.Representative AOT and PA being discussed are listed in Table 1.Integrity of the fuel must be kept even in case of AOT. Therefore,
temperature-dependent property data up to 400 °C are necessary for the fuelmeat, because the maximum temperature allowed in connection with the blister-threshold temperature is 400°C in case of AOT. In addition, measurement ofR/B ratio of FPs of uranium suicide fuel at high temperature is underwayfor assessing radiological consequences of PA and hypothetical accident.Extensive experiments for reactivity initiated accident behavior by usingNuclear Safety Reseach Reactor (NSRR), a pulse reactor at JAERI and basicstudies on compatibility of UxSiY particle and aluminum matrix, FP releasemechanism, etc. are scheduled to obtain the JAERI's original data of the newsuicide fuel.
The LEU conversion program of JMTR is shown in Fig. 1. Full coredemonstration will be started in 1993.
3. MEASUREMENT OF R/B RATIOS OF FP
3.1 ObjectivesR/B ratio data of FPs used in accident analysis in safety review for the
JMTR core conversion from HEU to MEU fuel are based on the data measured atOak Ridge National Laboratory using U-A1 alloy fuel.
434
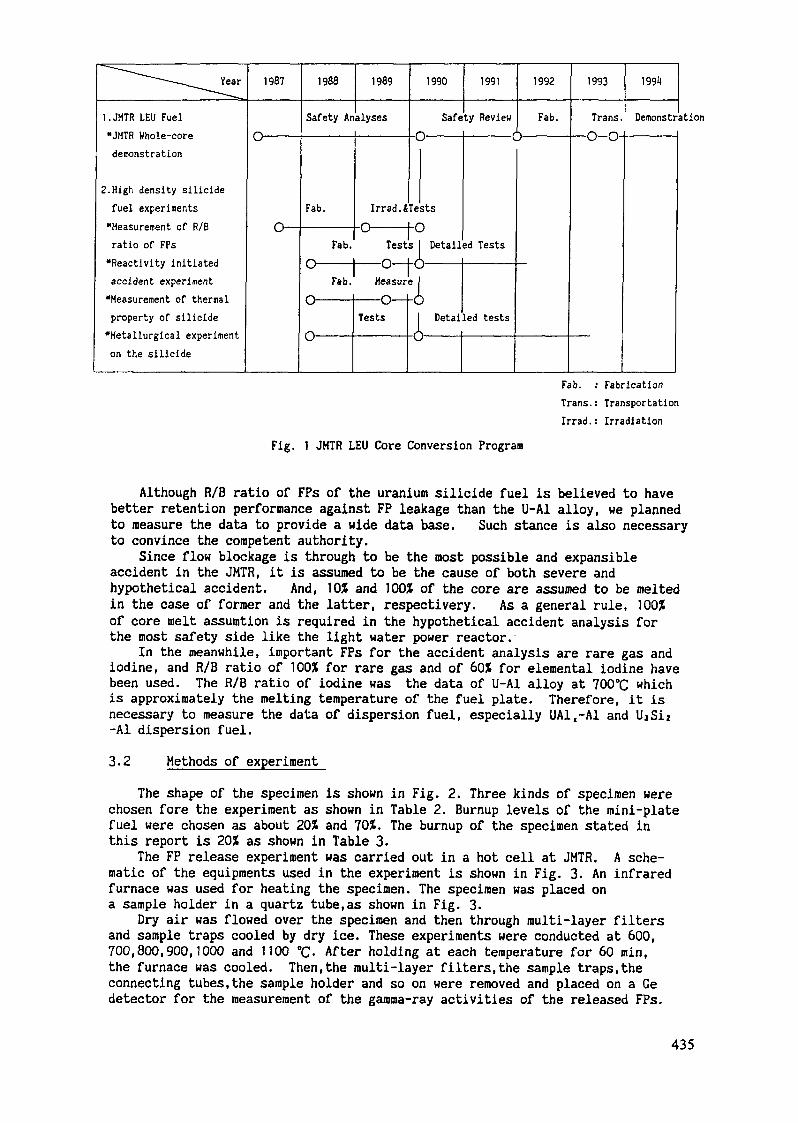
^ ~~~ -—~~ ^ year
l.JMTR LEU Fuel«JMTR Whole-coredemonstration
2. High density suicidefuel experiments»Measurement of R/Bratio of FPs
»Reactivity initiatedaccident experiment
»Measurement of thermalproperty of suicide
»Metallurgical experimenton the suicide
1987
o—
1988
Safety An
Fab.
1989
alyses
1990
Safe-o ——
Irrad.iTests-o —— i-o
Fab. Test'so —— U U<
1991
ty Review
1992
Fab.———— O —————
Detailed Tests3 — ——
Fab. Measure 1O ———— 1
0 ———
—— O — ITests
-o,1) Detailed tests———— ——————
1993
Trans.— o-o-
199U
Demons tration
Fab. : FabricationTrans.: TransportationIrrad.: Irradiation
Fig. 1 JMTR LEU Core Conversion Program
Although R/B ratio of FPs of the uranium suicide fuel is believed to havebetter retention performance against FP leakage than the U-A1 alloy, we plannedto measure the data to provide a wide data base. Such stance is also necessaryto convince the competent authority.
Since flow blockage is through to be the most possible and expansibleaccident in the JMTR, it is assumed to be the cause of both severe andhypothetical accident. And, 10* and 100* of the core are assumed to be meltedin the case of former and the latter, respectivery. As a general rule, 100*of core melt assumtion is required in the hypothetical accident analysis forthe most safety side like the light water power reactor.
In the meanwhile, important FPs for the accident analysis are rare gas andiodine, and R/B ratio of 100* for rare gas and of 60* for elemental iodine havebeen used. The R/B ratio of iodine was the data of U-A1 alloy at 700°C whichis approximately the melting temperature of the fuel plate. Therefore, it isnecessary to measure the data of dispersion fuel, especially UA1.-A1 and-Al dispersion fuel.3.2 Methods of experiment
The shape of the specimen is shown in Fig. 2. Three kinds of specimen werechosen fore the experiment as shown in Table 2. Burnup levels of the mini-platefuel were chosen as about 20* and 70*. The burnup of the specimen stated inthis report is 20* as shown in Table 3.
The FP release experiment was carried out in a hot cell at JMTR. A sche-matic of the equipments used in the experiment is shown in Fig. 3. An infraredfurnace was used for heating the specimen. The specimen was placed ona sample holder in a quartz tube,as shown in Fig. 3.
Dry air was flowed over the specimen and then through multi-layer filtersand sample traps cooled by dry ice. These experiments were conducted at 600,700,800,900,1000 and 1100 °C. After holding at each temperature for 60 min,the furnace was cooled. Then,the multi-layer filters,the sample traps,theconnecting tubes,the sample holder and so on were removed and placed on a Gedetector for the measurement of the gamma-ray activities of the released FPs.
435
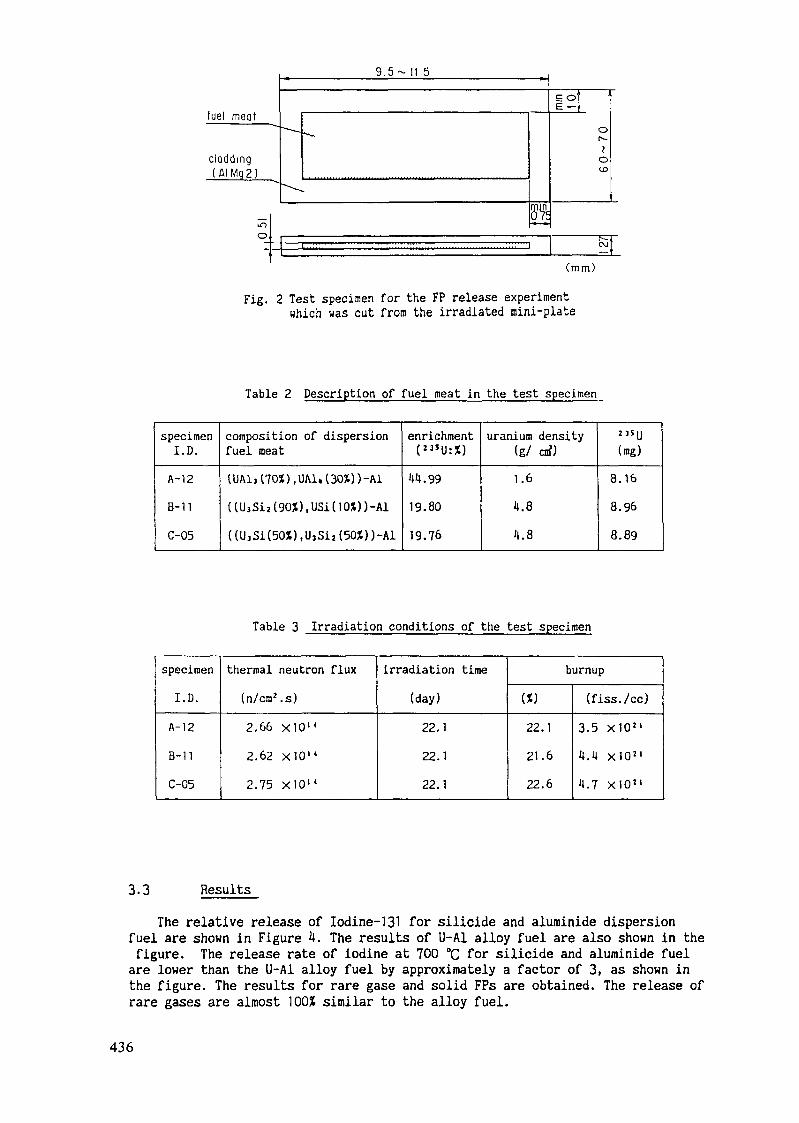
fue l meat
clodding( A I M g 2 )
9.5~ II 5= oE —
(mm)
Fig. 2 Test specimen for the FP release experimentwhich was cut from the irradiated mini-plate
Table 2 Description of fuel meat in the test specimen
specimenI.D.
A-12B-11
C-05
composition of dispersionfuel meat(UAlj(70X),UAl,(30j))-Al((UjSi2(90*),USi(10X))-Al((UjSi(50*),UjSi2(50*))-Al
enrichment(2»U:X)44.9919.8019.76
uranium density(g/ cm3)1.64.84.8
23SU(mg)
8.168.968.89
Table 3 Irradiation conditions of the test specimen
specimenI.D.
A-12B-11C-05
thermal neutron flux(n/cm'.s)2.66 x10M
2.62 xlO 1 4
2.75 X10M
irradiation time(day)22.122.122.1
burnup
(»22.121.622.6
(fiss./cc)3.5 X10"4.4 xlO 2 1
4.7 XlO 2 1
3.3 ResultsThe relative release of Iodine-131 for suicide and aluminide dispersion
fuel are shown in Figure 4. The results of LJ-A1 alloy fuel are also shown in thefigure. The release rate of iodine at 700 °C for suicide and aluminide fuelare lower than the U-A1 alloy fuel by approximately a factor of 3, as shown inthe figure. The results for rare gase and solid FPs are obtained. The release ofrare gases are almost 1003t similar to the alloy fuel.
436
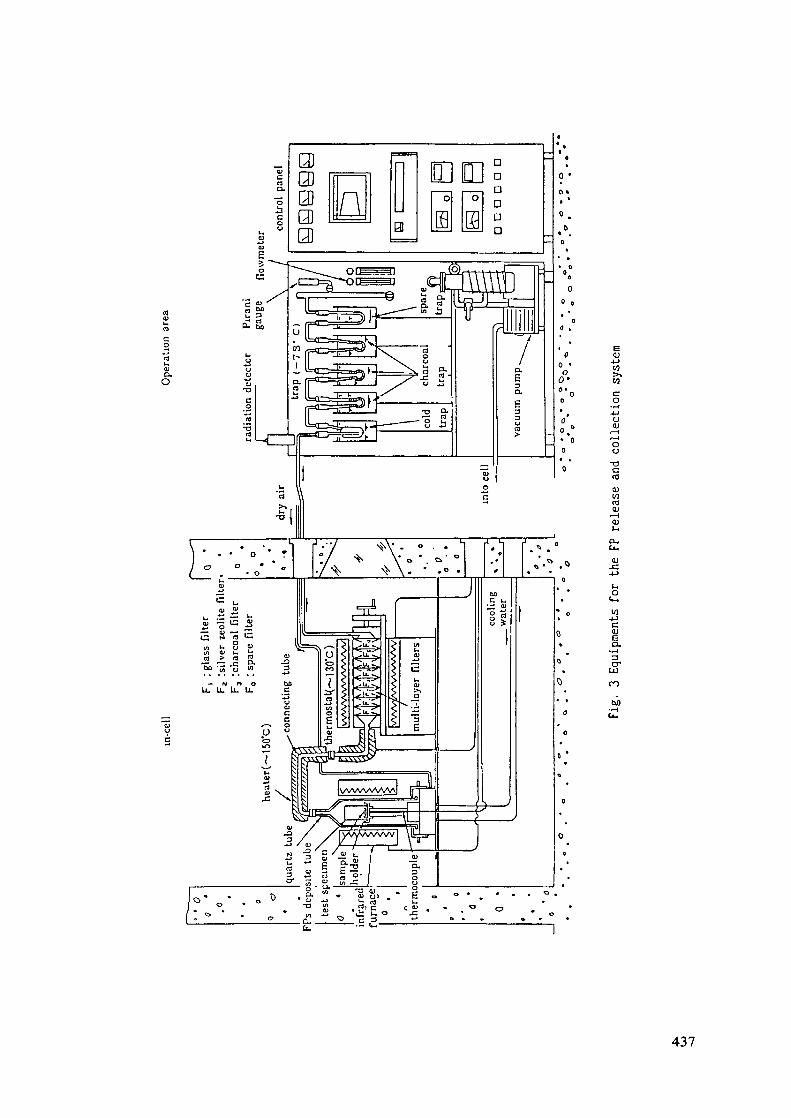
B<U-UW
co
aO)
oo-ac
CDMro
ex,u.OJx:
M-t->C
Ea,
erun
no
437
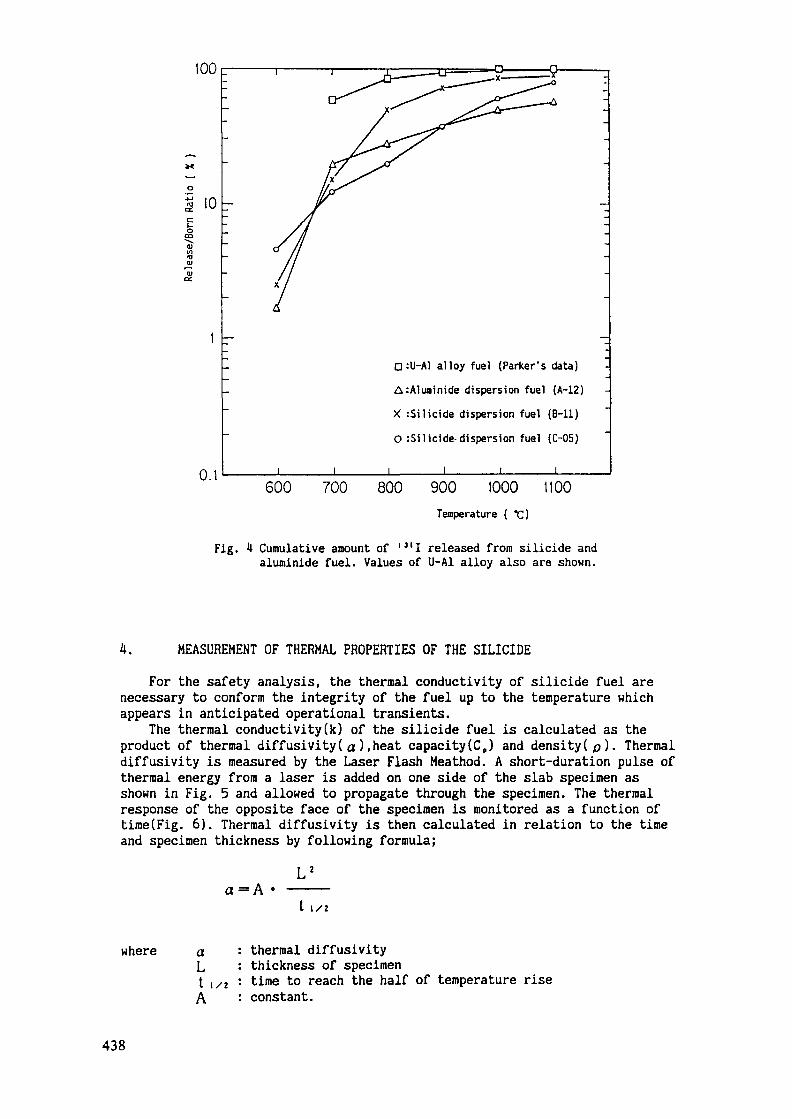
100 r
a:U-Al alloy fuel (Parker's data)
A:Aluainide dispersion fuel (A-12)
X :Silicide dispersion fuel (B-ll)
O :Silicide- dispersion fuel (C-05)
600 700 800 900 1000 1100Temperature ( *C)
Fig. 4 Cumulative amount of I 3 I I released from suicide andaluroinide fuel. Values of U-A1 alloy also are shown.
4. MEASUREMENT OF THERMAL PROPERTIES OF THE SILICIDEFor the safety analysis, the thermal conductivity of suicide fuel are
necessary to conform the integrity of the fuel up to the temperature whichappears in anticipated operational transients.
The thermal conductivity(k) of the suicide fuel is calculated as theproduct of thermal diffusivity(a ),heat capacity«?,) and density(p). Thermaldiffusivity is measured by the Laser Flash Meathod. A short-duration pulse ofthermal energy from a laser is added on one side of the slab specimen asshown in Fig. 5 and allowed to propagate through the specimen. The thermalresponse of the opposite face of the specimen is monitored as a function oftime(Fig. 6). Thermal diffusivity is then calculated in relation to the timeand specimen thickness by following formula;
a=A1/2
where aLt ,/2A
thermal diffusivitythickness of specimentime to reach the half of temperature riseconstant.
438
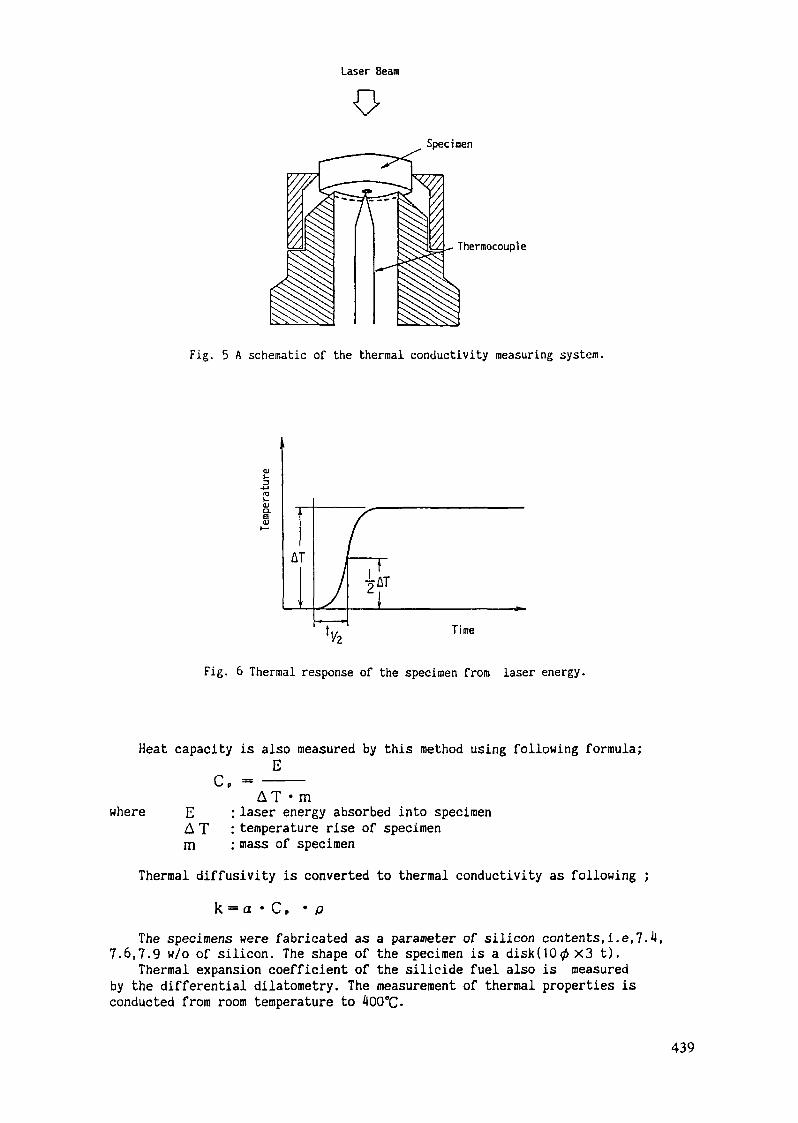
Laser Beam
Specimen
Therraocouple
Fig. 5 A schematic of the thermal conductivity measuring system.
Time
Fig. 6 Thermal response of the specimen from laser energy.
Heat capacity is also measured by this method using following formula;E
where EATm
AT • mlaser energy absorbed into specimentemperature rise of specimenmass of specimen
Thermal diffusivity is converted to thermal conductivity as following ;k = a • CP • p
The specimens were fabricated as a parameter of silicon contents,i.e,7.7.6,7.9 w/o of silicon. The shape of the specimen is a disk(100x3 t).
Thermal expansion coefficient of the suicide fuel also is measuredby the differential dilatometry. The measurement of thermal properties isconducted from room temperature to 400°C.
439
5. EXPERIMENT OF FUEL BEHAVIOR UNDER REACTIVITY INITIATED ACCIDENTCONDITION
The experiment is concerned with determining the behaviors of uraniumsuicide fuel when it is subjected to short period power excursion resultingin high energy densities in the fuel. It is necessary for the safetyassessment to clarify the defference of the behavior under the accidentcondition between the suicide and the aluminide , whose behavior have beenmade clear experimentally in the Transient Reactor Test Facility(TREAT).
The test specimens (mini-plates of suicide fuel) are encapsuled andirradiated at the Nuclear Safety Reactor (NSRR) in JAERI. Specifically,the following items will be studied;
(1) Fuel element failure thresholds and failure mechanisms.(2) Heat transfer processes and physical characteristics bearing on
failure mechanism.(3) Chemical reactions which can generate additional energy.(4) The pressure wave shock phenomena and water hammer resulting from
thermal to mechanical energy conversion.(5) Type and amount of fuel dispersed and fission products released
resulting from failure.The fuel plate will be subjected to series of tests designed to determine
the threshold of failure and also to tests at short periods which will causecomplete destruction of the fuel plate. The safety assessment of NSRR experi-ment is underway. Design and fabrication of irradiation capsule and testspecimen are scheduled in this year.
6. METALLURGICAL EXPERIMENTS ON THE SILICIDEThe experiment are aimed at understanding the metallurgical characters,
irradiation behavior, fission products release with regard to the suicidematerials for a basic research.
He consider that the system of uranium-silicon is incompletely understooddespite of the many studies. The candidate composition of the suicidecurrently considered is UsSij, which, however, involve a slight amount of USior UaSi. U3Si2 and UsSi react with aluminum matrix at relative hightemperature around 500°C for short time to form U(Al,Si)3,which cause thethermal growth of the plate. He feel that USi would also react with thealuminum at the temperature. Therefore, important is that the detailed data onthese reaction is obtained by our hands. The reactions mentioned above arestudied out-of-pile. Under irradiated conditions,however, the reaction rateis supporsedly changed from the unirradiated conditions due to, for instance,generation of fission products and acceleration of the diffusion coefficients.Therefore, it is necessary to establish the data base on the reaction kineticunder irradiation and unirradiation. For the purposes ,we will perform irradia-tion experiments in JMTR where the temperature is well controlled.
The following experiments are conducted using suicide fuel materialprepared in JAERI.(1) Preparing test;The uranium suicide alloy are produced in the shape of a button by melting
uranium metal and elemental silicon in an arc furnace. Buttons are crushedto powder in a glovebox using a steel mortal and pestle. And fuel powderand aluminium powder are mixed in the desired proportions and formed underpressure into a powder-metallurgical compact.(2) Phase transition and compatibility test;Phase transition of the uranium suicide alloys with aluminium are
investigated experimentaly. Chemical stability of the uranium suicide fuelwill be clarified through the experiments.
440

® Irradiation test;Irradiation of the uranium suicide fuel is conducted using a temperature-
controlled capsule in JHTR. FP gas release behavior and chemical stabilityunder irradiation will be clarified.
REFERENCES(1) PARKER,G.H., MARTIN,H.J., CREEK.G.E., LORENZ.R.A., Release of Fission
Products on Out-of-pile Melting of Reactor Fuel,ORNL-3483,Oak RidgeNatl Lab.(1963).
(2) SHIBATA.T., TAMAI.T., HAYASHI.M., POSEY.J.C., SNELGROVE,J.L., Releaseof Fission Products from Irradiated Aluminide Fuel at High Temperatures,Nucl. Sei. Eng. 87 (1984) 405.
441
Appendix KEXAMPLES OF FUEL SPECIFICATIONS
AND INSPECTION PROCEDURES
Abstract
Standardization of specifications and inspection proceduresfor LEU plate-type fuels are discussed and detailed examplesof fuel specifications and inspection procedures are providedfor several fuel element geometries and fuel types.Methodology for determination of cladding thickness is alsodescribed.

Appendix K-l
STANDARDIZATION OF SPECIFICATIONS ANDINSPECTION PROCEDURES FOR LEU PLATE-TYPERESEARCH REACTOR FUELS
W. KRULLGKSS — Forschungszentrum Geesthacht GmbH,Geesthacht, Federal Republic of Germany
Abstract
The subject of standardization of specifications andinspection procedures has become important as one meansof limiting fuel cost increases inherent with conversionsto LEU plate-type research reactor fuels. An editedversion of a draft report of an IAEA Consultant's Groupis presented here. It is concluded that specificationsshould be carefully reviewed when changing from HEU toLEU fuel in order to avoid perpetuating overly restric-tive requirements. Tentative recommendations are givenfor a number of specification topics.
1. INTRODUCTION
1.1 OverviewResearch reactors are beginning to operate with low-enriched, high-
uranium-density fuels that have been developed as part of the internationalprogramme to convert research reactor cores from high-enriched uranium (HEU)to low-enriched uranium (LEU). Most of the necessary irradiation tests, aspart of the fuel qualification test, are being performed, and many results anddata from post-irradiation examinations (PIE) are becoming available. As fuelup to a uranium density of 4,8 g U/cc is or will be soon qualified, moreresearch reactors will be converting to LEU. The decreasing availability ofHEU fuel for research reactors mandates that reactor operators consider theconversion of their reactors to LEU.
The IAEA has published several documents /1-4/ related to researchreactor core conversions. Annual international meetings have been held since1978 and proceedings published /5-10/. The IAEA can provide technicalassistance to reactor operators who wish to consider conversion of theirreactors from the use of HEU fuel to the use of LEU fuels.
With the transition to high-density LEU fuel, fabrication costs ofresearch reactor fuel elements have a tendency to increase because of tworeasons. First, the needed amount of powder of the uranium compound increasesby more than a factor of five. Second, fabrication requirements are in manycases nearer the fabrication limits. Therefore, it is important that effortsbe undertaken to eliminate or reduce unnecessary requirements in the specifica-tions or inspection procedures of research reactor fuel elements utilizing LEU.
445
An additional stimulus for standardizing specifications and inspectionprocedures at this time is provided by the fact that most LEU conversions willoccur within a short time span and that nearly all of them will require prepa-ration of new specifications and inspection procedures. In this sense, theLEU conversions offer an opportunity for improving the rationality andefficiency of the fuel fabrication and inspection processes.
This report focuses on the standardization of specifications and inspec-tion processes of high-uranium-density LEU fuels for research reactors.However, in many cases the results can be extended directly also to otherresearch reactor fuels.
1.2 Scope of the Report
This report is intended for the research reactor operator, researchreactor fuel element fabricator, licensing authorities and the consultants orexperts of the licensing authority or the operator, to be used as a manual orchecklist for designing, ordering, fabricating, inspecting and licensingresearch reactor fuel elements. The considerations and decisions to be mademust take into account the existing knowledge of the qualification status ofthe high-density, low-enriched-uranium fuel, design and safety demands,fabrication possibilities and economic questions.
It is believed that there are many reasons for the details of the existingspecifications and inspection procedures for research reactor fuel elements:
- tradition- others using the same specifications or the same fuel element- proposals by the fabricators
operation experience- nuclear and thermodynamic design- safety demands- authority and/or consultants recommendations- economic aspects
The goal of this report is to provide a more documented, rational andeconomic basis for the specifications and inspection procedures. This will beespecially important for the new LEU fuels, because many of them will be usinghigh volume fractions of the fuel particles in the fuel meat and will be closeto the fabrication limits. The uranium density must be increased by a factorof 5,5 or even more if converting from HEU to LEU fuel.
While most of HEU fuels had around, or less than, 20 vol% fuel in themeat, with a maximum around 33 vol%, many LEU fuels will be close to 45 vol%,which is considered the present fabrication limit. With 45 vol%, thecorresponding uranium densities are as follows:
UAlx p = 2,1 g U/ccU30n P = 3,2 g U/ccU3SI2 p = 5,1 g U/ccU3Si p = 6,6 g U/cc
With increasing vol% of fuel the fabrication difficulties increase rapidly.These fabrication difficulties are related to: white spots, homogeneity,cladding thickness, dog boning, etc. For this reason fabrication costs forLEU fuel elements are at present by far higher than for HEU fuel elements ifspecifications are unchanged. To limit the number of refused or rejected fuelplates and/or fuel elements, efforts are undertaken to reduce specification
446

demands wherever it is possible and acceptable. It is hoped that this willlimit the increase in LEU fuel fabrication costs to a reasonable amountwithout undue reduction in safety.
It should be emphasized that this report is intended to be used forgeneral guidance and is not to be construed as requirements that the reactoroperator, consultant or licensing authority must follow. The report is meantto assist the operator in developing his own specifications and inspectionprocedures for the fuel elements of his research reactor, taking all necessaryconsiderations into account, including detailed discussion with the selectedvendor.
This report complements the IAEA Guidebooks TECDOC-233 /!/, TECDOC-324 /2/,TECDOC-304 /3/ and the Guidebook /4/ that is expected to be published in 1986-1987. Therefore, in this report reference will often be made to Guidebooks aswell as other more specialized references.
Chapter 2 gives a detailed discussion of many special specificationsubjects and informs the operator in some cases about general economic impactsof specification variations. Some inspection procedures of more generalinterest are discussed in Chapter 3.
2. SPECIFICATIONS
2.1 GeneralThe fuel types considered for the fabrication of plate-type fuels with
HEU and LEU are UA1 , U-jOg, and UxSi . Individual fuel vendors do notmanufacture all fuel types with both HEU and LEU.
HEU as used here refers to 90% - 93% enrichment. In the case of UxSi ,HEU may be necessary if new reactor designs use the development potential ofthe high-density-uranium fuel. Such studies are underway. Since U-jOg andUA1X may continue to be used by some reactors, e.g., U.,0g in HFIR, RP-10,MPR-30 and UA1X for reactors with peak burnups >2 x lO^1 fissions/cc, the pos-sible cost reduction from having only one production line may not be realized.
Taking further into account that the so-called "unique purpose" reactors/II/ shall use the lowest qualified enrichment together with the correspondinghighest uranium density for their design, the future situation will beprobably more complicated than the present one. It is possible that enrich-ments other than 19,75% and 90% - 93% will be in common use. Due to the abovementioned demand, a larger number of different intermediate enrichments may bein use for many years. This will reduce the proliferation risk but increasethe fabrication cost.
One of the most important parameters for qualifying a fuel to certainlimits of operation is the swelling behavior as a function of burnup. ForU Si the swelling rate is influenced by the porosity, the volume ratio ofU^Si/U^Sij and vol% of U Si in the fuel meat. Therefore, in some cases thesevalues may need to be introauced into the specifications. There is absolutelyno requirement to have these corresponding parameters specified if low-enrichedUA1 or U^Og is used as meat material.
General information about different topics on the specifications ofresearch reactor fuel elements can be found in the literature ranging from a
447
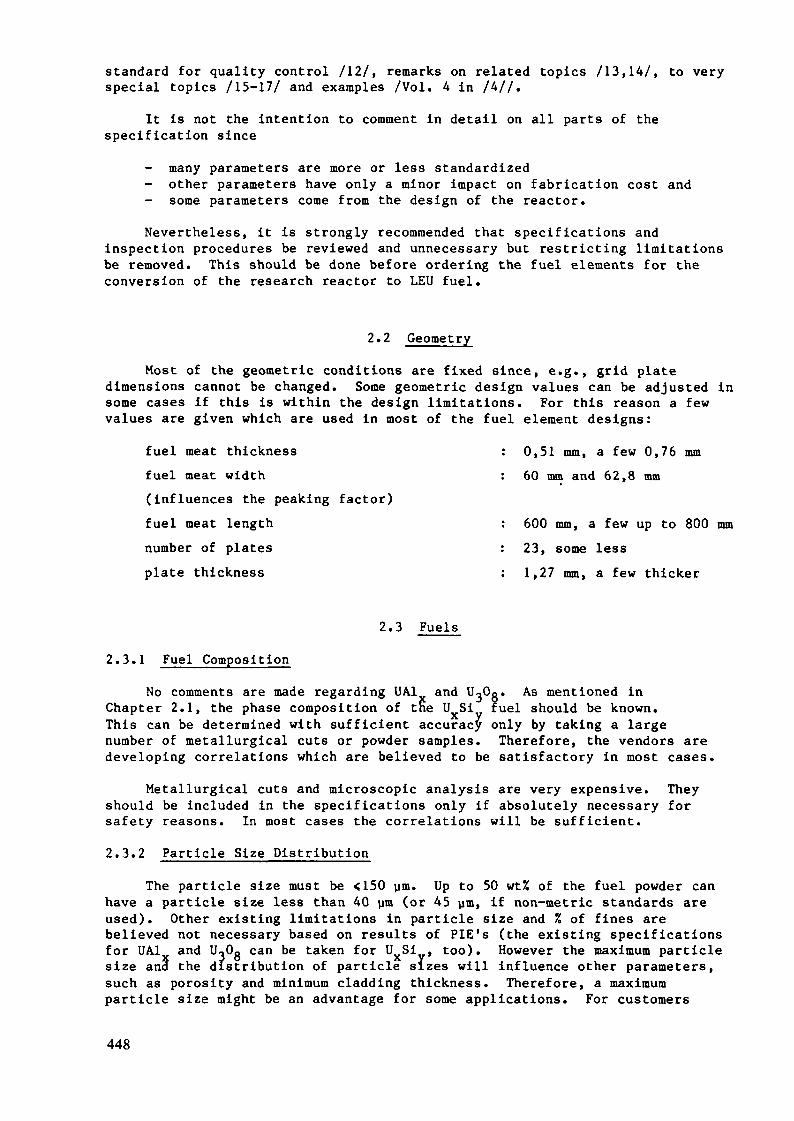
standard for quality control /12/, remarks on related topics /13.14/, to veryspecial topics /15-17/ and examples /Vol. 4 in /4//.
It is not the intention to comment in detail on all parts of thespecification since
many parameters are more or less standardized- other parameters have only a minor impact on fabrication cost and- some parameters come from the design of the reactor.
Nevertheless, it is strongly recommended that specifications andinspection procedures be reviewed and unnecessary but restricting limitationsbe removed. This should be done before ordering the fuel elements for theconversion of the research reactor to LEU fuel.
2.2 Geometry
Most of the geometric conditions are fixed since, e.g., grid platedimensions cannot be changed. Some geometric design values can be adjusted insome cases if this is within the design limitations. For this reason a fewvalues are given which are used in most of the fuel element designs:
fuel meat thicknessfuel meat width(influences the peaking factor)fuel meat lengthnumber of platesplate thickness
0,51 mm, a few 0,76 mm60 mm and 62,8 mm
600 mm, a few up to 800 mm23, some less1,27 mm, a few thicker
2.3 Fuels
2.3.1 Fuel Composition
No comments are made regarding UA1 and UoOg. As mentioned inChapter 2.1, the phase composition of the U Si fuel should be known.This can be determined with sufficient accuracy only by taking a largenumber of metallurgical cuts or powder samples. Therefore, the vendors aredeveloping correlations which are believed to be satisfactory in most cases.
Metallurgical cuts and microscopic analysis are very expensive. Theyshould be included in the specifications only if absolutely necessary forsafety reasons. In most cases the correlations will be sufficient.
2.3.2 Particle Size DistributionThe particle size must be <150 ym. Up to 50 wt% of the fuel powder can
have a particle size less than 40 gm (or 45 ym, if non-metric standards areused). Other existing limitations in particle size and % of fines arebelieved not necessary based on results of PIE's (the existing specificationsfor UA1 and U.,0g can be taken for UxSi , too). However the maximum particlesize and the distribution of particle sizes will influence other parameters,such as porosity and minimum cladding thickness. Therefore, a maximumparticle size might be an advantage for some applications. For customers
448
interested in a maximum particle size of 125 ym for example, the vendorsshould be contacted to determine the relative cost increase per fuel element.
The control sieving must be carried out with a set of sieves of 40 ym or45 urn, 150 ym and 180 ym. If all particles pass the sieve with 180 ym, it isallowed to have 1% of the fuel powder on the sieve of 150 ym.2.3.3 Porosity
The built-in porosity in the fuel meat provides space to accommodate theinitial swelling of the fuel particles. The amount of built-in porosity isdependent on the vendor, fabrication process and vol% of fuel in the meat./8,10/ For the dependence of swelling rates on porosity, see /8,10/. In somecritical applications of U Si , which can swell considerably due to the highfission density attainable, it may be desirable to specify the amount ofbuilt-in porosity in order to limit, for example, channel gap thicknesschanges during operation. Such a specification is not necessary for low-enriched UA1 and U.,0a or, in most cases, for U Si .X J 0 X j
2.3.4 Al-PowderThere are slight differences in the existing specifications which are
believed to be of minor importance. Care should be taken in limiting theamount of poisoning impurities such as B, Cd, and Li. Other impurities cannormally be varied over a greater range. The current specification limitsshould be used as a guideline for operators and fabricators. In order toavoid unwanted nuclear and metallurgical behavior, some limits should bespecified. These considerations can be applied to the fuel powder, too.2.3.5 U-Content of Fuel Plate
There is no problem with accuracy (ca. 2%). Total U-content cannot bestandardized.
2.4 Fuel Plate
2.4.1 Homogeneity
With increasing vol% of fuel and uranium density, the present homogeneitylimits will result in an increase in the number of rejected fuel plates.Homogeneity limits in the specifications may be a result of hot spot analysesand therefore part of the overall safety features. However, it may beworthwhile to discuss these limits with relevant authorities to determinewhether adequate safety margins can be maintained with looser homogeneitylimits so that fabrication cost can be reduced.
With the standard technique homogeneity deviations are determined over aplate surface area of 1 cm2. Smaller measuring areas will give, for physicalreasons, greater variations. All commonly used measuring techniques areacceptable.
Design or safety limits on homogeneity are related to the plus tolerancesof the homogeneity. The existing minus tolerances are not as critical. Greaterminus deviations may be acceptable, therefore, but their control allows aninsight into the overall quality of fuel plate fabrication.
449
Since homogeneity limits have a great impact on fabrication cost, theoperator should obtain cost factors related to different homogeneity limits fromthe vendor in order to perform a proper cost-benefit analysis.
2.4.2 Plate ThicknessThe tolerance on the overall plate thickness influences the minimum
cladding thickness and therefore must be limited. Also, if there are tightdemands on channel spacing, these cannot be achieved if the tolerance on theplate thickness is too large. For these reasons the tolerance of the platethickness will be based on the minimum cladding thickness and the tolerance onchannel spacing.
2.4.3 Minimum Cladding Thickness
A minimum cladding thickness is specified in order to protect against therelease of fission products, especially after the cladding surface may have beensubjected to corrosion.
Corrosion is influenced by many factors: cladding thickness, claddingmaterial, surface treatment, copper or chlorine impurities, temperature, pH andconductivity of the water, water quality (e.g. Cu, Cl), lifetime of the fuel,overall operating conditions over years, etc. Some of these factors are or maybe correlated. Typical types of corrosion ocurring on plate-type fuel elementsare pitting corrosion and uniform plate corrosion. Since fission productrelease from fuel elements will cause many problems, any type of corrosion mustbe minimized to avoid such difficulties.
The minimum cladding thickness can and will be different for differentresearch reactors depending on various conditions of use (e.g., if the fuellifetime is 3 weeks or 3 years). Any change of the minimum cladding thicknessshould be based on reported operating experience and documentation of the actualcladding thickness obtained for a specified minimum. One has to be sure thatthe reported operating experience is not the result of other factors but isrelated only to the specified values of minimum cladding thickness. The corre-lation between specified and actual minimum cladding thickness must be known.The first detailed measurements on this topic have been reported in /15/.
Historically the cladding thickness has been specified as 0,38 ± 0,08 mm inmost cases. Due to higher density fuel with a larger vol% of fuel in the meat(more fuel particles), an increasing number of fuel particles have been foundviolating the 0,30 mm minimum cladding thickness. In order to reduce the rejec-tion rate and the fabrication cost, fuel plates have been accepted with fuelparticles in the region down to 0,25 mm (0,23 mm in some cases) and even to0,20 mm for the HFIR. It is obvious that the acceptance of fuel plates withextremely low minimum cladding thickness will reduce the fabrication cost. Theacceptable minimum is closely related to the overall long term operating condi-tions, the materials used and the fabrication technique. For this reason nogeneral statement for the acceptable minimum cladding thickness can be given atpresent and may never be possible. Fission product release coming from pittingcorrosion was found in the past even in cases were the minimum claddingthickness was 0,30 mm.
To enable the reactor operator to make the best decision for his reactor,the fuel fabricators should be contacted to determine relative prices for dif-ferent minimum cladding thicknesses.
450

2.4.4 Cladding MaterialFabricators normally use aluminum cladding materials with specified addi-
tions and impurities following their national standards. In use have been:pure Al (99,5% Al), pure Al (99,85% Al), AI 1100, AlFeNi, and Mg-containingaluminum-alloys such as Al 6061, AG1NE, AG2NE, AG3NE, AlMgl, AlMg2, AlMg3. Withincreasing uranium density and increasing coolant flow velocity, weak Al-cladding materials cannot be used because bonding and cladding thicknessdifficulties may arise during the fabrication process and mechanical stabilitydifficulties of the fuel plate may arise during operation. One advantage of theMg-containing aluminum alloys is their increased corrosion resistance. For thisreason it is recommended that Mg-containing Al-alloys be used if possible.However, in most cases all cladding materials in use are acceptable. In orderto reduce cost, the fabricators should limit the number of different claddingmaterials in their fabrication lines to one or two.
Requirements on the acceptable impurities are the same as discussed for thefuel in Chapter 2.3.4. In some cases an increase of the boron content from 10ppm to 30 ppm can be accepted since the 10B will be totally consumed during thelifetime of the fuel.2.4.5 Surface Defects
Significant surface defects may be caused by some lack of attention duringthe fabrication process or by removing foreign particles from the cladding. Noforeign particles with unknown chemical composition can be accepted in thecladding. Surface defects must be limited in size and depth to avoid fissionproduct leakage during the whole lifetime of the fuel element. To date therehas been no report that surface defects and pitting corrosion are correlated.However, since there are other corrosion phenomena possible (plate type,potential effects) the depth of surface defects must be limited. The alloweddepth should inversely follow the minimum cladding thickness. It is recommendedthat the difference between the two not be less than 125 urn; otherwise, platesshould be rejected. For example:
minimum cladding thickness 250 ymmaximum surface defects 125 ym.
In the dogboning zone, if there is evidence of dogboning in the plates, surfacedefects not deeper than 75 ym are acceptable. Outside the meat zone, defects upto 300 ym may be acceptable depending on the number of these defects and theprevalence and location of white spots (see Chapter 2.4.7).2.4.6 Surface Treatment
The surface treatment selected may influence the corrosion behavior of thefuel plate. Therefore the surface must be absolutely free from Cl. In mostcases only etching and cleaning with demineralized water is used and issufficient. With an additional treatment with hot water (100°C) or steam, acorrosion resistant layer of stable Boehmite is produced, and the corrosionresistance is increased by more than a factor of 10. This additional treatmentwill increase the fuel element cost.2.4.7 White Spots
With increasing uranium density and increasing vol% of fuel in the meat asignificant number of so-called white spots have been detected on the x-rayfilms. These white spots are fuel particles located between the frame and the
451
cladding outside the specified meat zone. Limits on the location and clusteringof the fuel particles are necessary for two reasons:
to avoid fission product leaks
- to ensure the appropriate cooling of the plate even in zoneswhere the plate is not cooled by turbulent flow.
At present it has not been established that there is a correlation betweenblisters outside the meat zone and fuel particles at these positions.If such a correlation is found, this will become important only for high burnupvalues. PIE's are going on and results will be reported.
The specification given below is recommended for the acceptance of whitespots. This proposed specification avoids the measurement of the distancebetween the white spots and/or the necessity to calculate the overall area ofthe white spots. These measurements and/or calculations were found in the pastto be totally impractical and extremely expensive.a) No particles (evidenced as white spots on the position radiograph) shall be
within 0,4 mm of the edges or ends of the fuel plate.b) The maximum dimension of a stray particle shall be 0,5 mm. Touching
particles shall be considered as a single particle for the purpose ofdetermining the largest dimension.
c) The maximum number of stray particles in any 20 mm2 area located betweenthe maximum core length or width and within 0,4 mm of the plate edge or endshall not be greater than ten (10).
d) *) A stringer of fuel generated from the corners of the core ends isacceptable provided it comes no closer than 1,3 mm from the plate ends.
e) No stray particles shall be allowed in the comb or identification areas.f) Stray particles found within 0,4 mm of the plate edge or end may be removed
by filing. These handworked areas shall not be greater than0,5 mm in depth.
2.4.8 Surface Contamination
There is no present need to change the commonly specified values(ca. 5-10 yg U/plate).
2.4.9 Burnable Poisons
Burnable poisons are in use for higher power research reactors. Theseburnable poisons can be in side plates or at the top or bottom of fuel plates.The present knowledge is that some care may be necessary if poison is mixed withfuel. Experiments are going on to determine the swelling behavior in thesecases, especially for uranium suicide fuel.
2.5 Fuel ElementAs stated in Chapter 2.2, no recommendations on most of the geometry
factors can be given since they are specific to the overall design.
Discussions on this point are continuing.
452
2.5.1 Channel Gap SpacingThe minimum channel gap is one of the parameters in the calculations for
the hot channel, and for this reason the tolerances are included in thethermodynamic calculation and the safety report in most cases. But in general,since many reactors operate with large safety margins, the chosen tolerancesshould be rechecked, because fuel element fabrication cost is significantlyinfluenced by the chosen tolerances and the inspection procedure.
In almost all cases only the minimum tolerance is of importance andcontrolled. Therefore, to specify a plus tolerance is unnecessary in mostcases. The fuel fabricators should be contacted to obtain relative costsrelated to different requirements for tolerances and inspection procedure. Whenspecifying channel gaps one has to consider the gap between neighboring fuelelements with the same care. The cooling conditions between neighboring fuelelements are not as good as within the fuel elements in many cases.
2.5.2 Burnup Warranty
Any burnup warranty must be discussed between operator and vendor anddepends on too many conditions for a general recommendation.
3. INSPECTION PROCEDURES
The chosen inspection procedure depends on many different factors, such as- license requirement
consultants demands- fabricator experience- inspectors experience- changed or unchanged fabrication process- evidence of defects- reactor design.
The inspection can be performed by the independent quality control department ofthe fabricator and/or independent expert and/or customer. The extent ofinspection ranges between 100%, sampling (extended to 100% if a given percentageof values are found out of the specified ones) and 0%. The extent andpercentage of inspection may limit the throughput of the fabrication and,therefore, may have a great impact on the fuel element fabrication cost. It isestimated that inspection cost ranges between 1/3 and 2/3 of the totalfabrication cost, depending on the chosen procedure. It is strongly recommendedthat all inspectors be well trained and that the inspectors not reject plates orelements in all cases if the values are slightly outside the specified ones.The inspectors should use their experience to decide in such cases whether torecommend acceptance or rejection.
Since the chosen detailed inspection procedure is influenced by manydifferent factors, recommendations could be developed only for some selectedpoints.
3.1 Particle Size
See Chapter 2.3.2.
453
3.2 Bonding
The most effective quality check on bonding is the blister test. Thechosen blister temperature depends on the selected cladding material and shouldbe only slightly different from the hot rolling temperature. The temperaturerange is normally between 410°C and 500°C.
In addition to the blister test, the ultrasonic test is in use. With thismethod, defects >2 mm $ can be detected. With high uranium density there areincreasing difficulties near the ends and edges of the fuel core. Themeasurements need careful interpretation and the method should be separatelydiscussed between the customer and the fabricator.
3.3 White Spots
See Chapter 2.4.7.
3.4 Radiographie InspectionFluoroscopy and/or x-ray film is in use. The selected method depends on
the need for control and documentation. Care should be taken to cut the fuelplate symmetrically out of the rolled plate.
3.5 Surface ContaminationSmear test (sampling) and 100% control with a-counters are in use.
Normally only background is detected. If there are positive measuring results,the rolling process should be inspected.
3.6 Channel Gap SpacingMinimum check with go gauge only, or for extremely high requirements,
registered measurements are in use. See Chapter 2.5.1.
4. CONCLUSION
The specifications currently used for HEU fuel should not be taken asultimate demands when going to high-density LEU fuel. At that time, thespecification demands should be carefully reviewed to use this possibility forreducing the fuel element fabrication cost. This review should include themost important safety margins, the existing operating experience and theoperating conditions of the plant. The operator should discuss the specifi-cations finally chosen in detail with the fabricator and licensing authority.Whether additional parties need to be involved depends on the specialcircumstances and the experience of the operator, of his experts and of hisauthority. The IAEA may be contacted for assistance.
Excellent for discovering no bonding between Al-frame and cover plate.
454

REFERENCES
/!/ Research Reactor Core conversions from the Use of Highly Enriched Uraniumto the Use of Low Enriched Uranium Fuel, Guidebook, TECDOC-233, Vienna,1980.
/2/ Research Reactor Core Conversion from the Use of Highly Enriched Uraniumto the Use of Low Enriched Uranium Fuels, Guidebook Addendum, Heavy WaterModerator Reactors, TECDOC-324, Vienna, 1985.
/3/ Core Instrumentation and Pre-Operational Procedures for Core ConversionHEU to LEU, TECDOC-304, Vienna, 1984.
/4/ Research Reactor Core Conversion from the Use of Highly Enriched Uraniumto the Use of Low Enriched Uranium Fuels, Safety and Licensing Guidebook,Vol. 1 Summary, Vol. 2 Analyses, Vol. 3 Analytical Verification, Vol. 4Fuels, Vol. 5 Operations, TECDOC- , Estimated date of publication 1986-1987.
/5/ Proceedings of the International Meeting on Development, Fabrication andApplication of Reduced Enrichment Fuels for Research and Test Reactors,Argonne, USA, 12-14 November 1980, ANL/RERTR/TM-3.
/6/ Proceedings of the International Meeting on Research and Test ReactorCore Conversions from HEU to LEU Fuels, Argonne, USA, 8-10 November 1982,ANL/RERTR/TM-4.
Ill Proceedings of the International Meeting on Reduced Enrichment forResearch and Test Reactors, 24-27 October 1983, Tokai, Japan, JAERI-M 84-073.
/8/ Proceedings of the 1984 International Meeting on Reduced Enrichment forResearch and Test Reactors, Argonne, USA, 15-18 October 1984,ANL/RERTR/TM-6.
/9/ Proceedings of the International Meeting on Reduced Enrichment forResearch and Test Reactors, Petten, Netherlands, 14-16 October 1985,D. Reidel Publishing Company, Dordrecht
/10/ Proceedings of the International Meeting on Reduced Enrichment forResearch and Test Reactors, Gatlinburg, USA 3-6 November 1986,ANL/RERTR/TM-9 (these proceedings).
/II/ Limiting the Use of Highly Enriched Uranium in Domestically LicensedResearch and Test Reactors, U.S. Fed. Reg. Vol. 51, No. 37, 25 February1986.
/12/ Quality control for plate-type uranium-aluminum fuel elements, ANS-15.2(1974).
/13/ W. Krull: Remarks on the Demands for the Qualification of High DensityFuel, GKSS 84/E/40 (1984).
/14/ D. R. Harris, J. E. Matos, H. H. Young: Conversion and Standardizationof University Reactor Fuels Using Low-Enrichment Uranium-Operations andCost, in /9/.
455

/15/ T. Görgenyi, H. Hutch: Determination of Cladding Thickness in FuelPlates for Material Test and Research Reactors, IAEA-Seminar on ResearchReactor Operation and Use, JUlich, September 1981.
/16/ M. Neuberger, M. Müller, U. Schutt: Automatisch Kuhlspaltmessung mitRechnerauswertung, Jahrestagung Kerntechnik, 8-10.4..86, Aachen
/17/ W. H. Andersen, Jr.: Quality Assurance and Inspection Techniques in Useat Babcock and Wilcox, in /10/.
456
Appendix K-2FUEL ELEMENTS WITH LEU UA1X-A1 FUEL
FOR THE FORD NUCLEAR REACTOR
Appendix K-2.1
SPECIFICATIONS
ARGONNE NATIONAL LABORATORYArgonne, Illinois
FORD NUCLEAR REACTOR/UNIVERSITY OF MICHIGANAnn Arbor, Michigan
United States of America
Abstract
As part of the U.S. RERTR Program, a full-core demonstrationwith LEU fuel began in December 1981 in the Ford Nuclear Reactor(FNR) at the University of Michigan. The LEU standard andcontrol fuel elements were manufactured by CERCA and by NUK.EMusing specifications prepared by ANL. The ANL specificationswere derived from those prepared by EG&G-Idaho for HEU fuelelements manufactured for the FNR by Atomics International.
Due to differences among fabricators in some of the normalmanufacturing processes and materials, some of the specificationswere negotiated by ANL and the University of Michigan with eachmanufacturer to arrive at mutually agreeable specifications.
The specifications agreed to with NUKEM are presented hereas an illustration only. A similar set of specifications wasagreed to with CERCA. In this example, materials, materialnumbers, document numbers and drawing numbers specific to asingle fabricator have been deleted.
1.0 SCOPE1.1 Description
This Specification details the materials, components, testing, inspection,and quality control requirements for the fabrication of standard andcontrol Fuel Elements for the Ford Nuclear Reactor at the University ofMichigan, Ann Arbor, Michigan.
1.2 DefinitionsFor the purpose of this Specification, the following terms are identified.(Capitalization shall denote the use of a defined term.)1.2.1 Batch
A quantity of UA1X produced in one operation.
1.2.2 BlendTo mix or mingle constituents of a Batch.
457
1.2.3 CertificationA document form signed and dated by the responsible authority ofa pertinent function or activity, stating that a material or acomponent meets specified requirements.
1.2.4 ContractorThe primary vendor selected by Argonne National Laboratory tomanufacture the product.
1.2.5 DevelopmentA determination of processes, equipment, and parameters requiredto produce a product in compliance with this Specification.
1.2.6 Dogbone AreaThickening of Fuel Core at ends of Fuel Plates. This occurs dur-ing rolling process.
1.2.7 Dummy Fuel ElementAn element consisting of unfueled simulated Fuel Plates.
1.2.8 FailureThe condition arising when representative samples, which are thebasis for process control and product acceptance, fail to meetthe requirements of this Specification.
1.2.9 Fuel CoreThe uranium-bearing region of each Fuel Plate.
1.2.10 Fuel ElementThe bundle of Fuel Plates and hardware components, as defined inSection 3.0.
1.2.11 Fuel PlateThe Fuel Core complete with aluminum frame and cladding.
1.2.12 In-Process-ControlsChecks made during Production to assure that the manufacturingprocesses, equipment, and personnel are capable of producing aproduct meeting specified requirements.
1.2.13 LaboratoryArgonne National Laboratory (ANL).
1.2.14 LotA group of sequentially numbered pieces handled as a unit, ormaterial traceable to common processing step. A Lot shall con-sist of a minimum of sixteen (16) Fuel Plates.
1.2.15 Manufacture(ing)All fabrication, assembly, test, inspection, and quality controlprocesses.
458

1.2.16 ProductionThe phase of the program, following qualification, during whichthe product is in Manufacturéeing).
1.2.17 Production-Quality-ControlThe sampling plans, inspections, and tests required during Pro-duction to assure that the product is in compliance with thisSpecification.
1.2.18 QualificationA demonstration that the manufacturing processes and equipmentcan produce a product in compliance with this Specification.
1.2.19 RejectionMaterials, parts, components, or assembly products which willnot be accepted as part of the contract requirements of thisprogram because of non-compliance with this Specification.
1.2.20 RequalificationA demonstration that a single or group of manufacturing processes,equipment, and personnel can produce a product in compliance withthis Specification after the original Qualification has beencompleted.Requalification is required for a change in material, process, oroperator.
1.2.21 SpecificationAll parts and supplements of this document, its references,drawings, and standards.
1.2.22 Sub-tier SupplierAny vendor selected by the Contractor to furnish materials,services, or manufactured parts for the products.
1.2.23 UserFord Nuclear Reactor, University of Michigan.
2.0 APPLICABLE DOCUMENTS
This Specification was elaborated on the basis of the documents cited herein.In case of non-conformance, the latest revision of this Specification shallbe valid.
2.1 Specification for Standard Ford Fuel Element AssemblyNo. A0004-1000-SA.
2.2 Argonne National Laboratory ProceduresAQR-001 Quality Verification Program Requirements.
459

2.3 Drawings (ANL)A0004-0002-DC University of Michigan Standard and Control Fuel PlateA0004-0003-DC University of Michigan Standard and Control Fuel Element
AdaptorA0004-0004-DC University of Michigan Standard Fuel Element AssemblyA0004-0005-DC University of Michigan Control Fuel Element Assembly
2.4 Supplemental SpecificationsA0004-0114-SA Calibration RequirementsA0004-1005-SA Specification for Enriched U-Metal for UA1X Reactor Fuel
Elements
2.5 Contractor DocumentsProduction and control shall be effected acccording to the documents ofwork (drawings, inspection scheme, specifications) stated in the appendixin conformance with the respective latest revision which is given in thelist of documents.
3.0 TECHNICAL REQUIREMENTS
3.1 Product RequirementsThe Standard Fuel Element, Part Number A0004-0004-DC, consists of Ns FuelPlates, two (2) side plates, two (2) bail supports, one (1) bail, andone (1) adaptor. The Control Fuel Element, Part Number A0004-0005-DC,consists of Nc Fuel Plates, two (2) side plates, two (2) guide platesand one (1) adaptor. The Fuel Elements have Fuel Plates and control rodguide plates attached to the side plates by mechanical means; end adaptersare attached to the fuel section by screws.
3.2 Fuel Plates
3.2.1 Fuel LoadingEach Fuel Plate shall contain Mp grams + 2% U-235 based uponfinal weight of the final compact and chemical and isotopicanalysis of the constituents. Each loading of the Fuel Platesshall be recorded in grams to two (2) decimal places.
3.2.2 Fuel HomogeneityNon-homogeneity of the surface density in g/cvr of U-235 shallnot exceed + 30%-100% within the maximum and minimum limit linesof the meat area (zone 3) relative to the nominal value, + 30%-20%within the dog-boning area (zone 2), and + 20% in the nominal meatarea (zone 1).According to the determination in the inspection scheme, a definedquantity of Fuel Plates shall be continually examined by means ofgamma absorption in a trace with a 25 mm^ collimator (Round
460
window 5.6 mm diameter). The result shall be analogously re-corded together with (+) standards. For calibration Al-stepstandards of equal absorption shall be used which represent theminimum, nominal, and maximum uranium content.
3.2.3 Core ConfigurationThe outline of the Fuel Core shall be within the largest andsmallest areas as defined by the Fuel Core Drawing (Scheme), item7.4, dimensions and their respective tolerances. Fuel flakes areallowed except within 0.38 mm of the edge and the ends of the fuelplates.
3.2.4 Internal Defects and Bond IntegrityA bond across the clad/frame and clad/Fuel Core interfaces isrequired. Internal defects shall be examined and evaluated asdescribed in Paragraph 4.4.5.
3.2.5 Surface Finish and DefectsThe finished Fuel Plates shall be free from pits, dents, scratches,and other areas of metal removed in excess of 0.13 mm deep, exceptin the Dogbone Area, within 38 mm from the end of the Fuel Core.In this area, such depressions shall be limited to 0.08 mm deep.
3.2.6 CleanlinessThe Contractor shall take all precautions necessary to maintain ahigh standard of cleanliness during fabrication to ensure that noforeign materials or corrosion products are present in the finishedFuel Plates and Elements. The finished Fuel Elements shall becompletely free of dirt, scum, scale, graphite, grease, organiccompounds, and other foreign matter inside and outside.All metal chips, turnings, dusts, abrasives, weld spatter, scale,and other particles shall be removed without destroying the con-tinuity of the surfaces.All oil and grease shall be removed by the use of a degreasingagent approved by the Laboratory, and all surfaces, including allcrevices shall be thoroughly rinsed with distilled water.
3.2.7 IdentificationEach finished Fuel Plate shall be identified by a number stampedinto the top 3 mm of the Fuel Plate, not in excess of 0.15 mm indepth. The identification number shall be on the convex surfaceof the Fuel Plate before forming. Positive identification mustbe maintained relative to the complete fabrication history, includ-ing the Plate Lot, Fuel Blend, basic material lots, heat or melt,manufacturing cycle, and quality control phases.
3.2.8 StorageAll fuel plates that have received final cleaning shall be con-tained in clean polyethylene bags while (1) awaiting finalassembly, (2) being transferred into storage, or (3) being main-tained in storage. Any Fuel Plate exposed to contamination shallbe reinspected to the requirements of Paragraph 3.2.6. FuelPlates shall not be exposed to any chlorine-containing materialduring storage.
461
3.3 Fuel Elements
3.3.1 Fuel LoadingEach Standard Fuel Element shall contain Ms grams + 2% U-235.Each Control Fuel Element shall contain Mc grams + 2% U-235.(Note: See Appendix of this Specification for values Ms and Mc).
3.3.2 MaterialAll material used or contained in the product shall comply withall the requirements of this Specification unless exempted bywritten document by the Laboratory.
3.3.3 CleanlinessThe standards of cleanliness required for the Fuel Plates by Para-graph 3.2.6 are also required for the Fuel Elements.
3.3.4 AssemblyThe Fuel Plates shall be attached to the side plates by mechanicalswaging. Fuel Plate identification numbers shall be on the bailend of the element.
3.3.5 IdentificationEach Fuel Element shall have an identifying number such as MIXXX.The number shall be placed on the outside of the side plates asshown on the drawings and shall consist of 68 mm block characterscut 0.5 mm deep. The Fuel Elements shall be numbered serially.The Laboratory will provide consecutive serial numbers.
3.3.6 StorageAll Fuel Elements that have received final cleaning shall besealed in clean polyethylene bags while (1) being transferredinto storage, (2) being maintained in storage, or (3) being pre-pared for shipment or packaging. Any material exposed to con-tamination shall be reinspected according to the requirements ofParagraph 3.2.6. Fuel Elements shall not be exposed to anychlorine-containing material during storage.
3.4 Materials of ConstructionNote: Contractors located outside the United States territory may substi-tute materials and standards comparable to those listed, after approvalby the Laboratory.
3.4.1 Component MaterialsThe materials requirement for the components comprising the FuelElement are specified in the Appendix, item 7.6 Materials.
3.4.1.1 Fuel CoresThe Fuel Core of the Fuel Plate shall be UA1X inter-metallic powder dispersed in aluminum alloy powder.The UA1X powder and the Al powder shall be producedaccording to the Contractor's specifications, afterapproval by the Laboratory. Two one gram samples ofBlended UA1X Batches used in producing Fuel Coresshall be obtained by the Contractor for the Laboratory
462
and held at the Contractor's plant for the Laboratory'suse. During the course of the subcontract, any and allsamples not called for and in the possession of theContractor will be considered part of the Contractor'sscrap.
3.4.1.2 FramesThe frames shall be Aluminum Plate Alloy as specified inthe Appendix, item 7.6, unclad or clad on both sideswith Alloy 1100. If clad, the thickness of Alloy 1100on each side shall be as noted in Subparagraph 3.4.1.3.Maximum allowable boron content shall be 30 ppm.
3.4.1.3 Cover PlateThe fuel cladding (cover plate) shall be Aluminum Alloyas specified in the Appendix, item 7.6, unclad or cladon one side with Alloy 1100. Maximum allowable boroncontent shall be 30 ppm. If clad, each cover plateshall have an Alloy 1100 clad thickness no less than3 percent and a nominal maximum of 6 percent of thetotal thickness of the composite plate, provided thethree sigma limit does not exceed 7.5 percent.Compliance with the clad thickness requirements may beaccomplished by a Subcontractor-developed statisticalsampling and analytical method approved by the Laboratory.
4.0 QUALITY CONTROL AND QUALITY ASSURANCE REQUIREMENTS
4.1 Records and Reports
4.1.1 Distribution of Reports (Prior to Fabrication)The Contractor shall supply three (3) copies of the following dataand records to the Laboratory prior to fabrication of the initialelement for review and approval:4.1.1.1 Contractor Drawings
All shop drawings of component parts of the Fuel Elementand Fuel Element Assembly. Other current drawingsinitiated by Contractor shall be maintained and filedsubject to the Laboratory's review.
4.1.1.2 Integrated Manufacturing and Inspection Test PlanThe Contractor shall prepare a sequential listing of thevarious manufacturing and test steps with approximateschedule dates necessary for the fabrications.
4.1.1.3 Procedure for Fuel Plate U-235 ContentA detailed description as to the manner by which theContractor proposes to assign Fuel Plate U-235 content.Included in the description must be sampling, analytical,and quality control procedures and a statement as to theestimated absolute accuracy of the assigned Fuel Plateand Fuel Element U-235 content.
463

4.1.1.4 Manufacturing ProceduresAll programs, processes, and procedures, and all changesand modifications thereto, to be used to Manufacture theproduct, as listed in Section 4.2.
4.1.1.5 Plate Fabrication and Qualification RecordsAll records required by Paragraph 4.3.1.
4.1.1.6 Element Fabrication Qualification RecordsAll records required by Paragraph 4.3.2.
4.1.1.7 In-Process Controls ProceduresThose procedures established to comply with the require-ments of Paragraph 4.3.3.
4.1.2 Distribution of Reports (Prior to, or Concurrent with, Shipment)Prior to, or concurrent with, the shipment of each Fuel Elementthe Contractor shall provide the Laboratory with three (3)copies of the items listed in Paragraph 4.1.2.1 through 4.1.2.10(radiograph: one (1) copy).The three (3) copies required include the one (1) copy of thoseitems required to accompany shipment by Section 5.1.4.1.2.1 Material Certification
Certification of all material compliance to the require-ments of this Specification including any chemical andphysical test results pertaining thereto.
4.1.2.2 Certification of Product ComplianceCertification of product compliance to the requirementsof this Specification except, as the case may be, forprevious Laboratory-approved deviations, such deviationsto be detailed in the Certification. The Certificationshall include any test data pertaining thereto notspecifically listed in Subparagraphs 4.1.2.3 through4.1.2.10.
4.1.2.3 Dimensional Inspection ReportsInspection reports, including dimensional data, to therequirements of Paragraph 4.4.9.
4.1.2.4 Fuel Plate Uranium DataIndividual Fuel Plate uranium data as required to bereported by Paragraph 5.1.3.
4.1.2.5 Fuel Element Uranium DataIndividual Fuel Element uranium data as required to bereported by Paragraph 5.1.4.
4.1.2.6 Fuel Plate and Element Radiation CountsRadiation count from each Fuel Plate and Fuel Elementexterior, as required to be reported by Paragraph 5.1.5.
464

4.1.2.7 Pull Test ResultsResults of pull tests as required to be reported byParagraph 5.1.6.
4.1.2.8 Plate RadiographsPlate radiographs to the requirements of Paragraphs 4.4.3and 4.4.4.
4.1.2.9 Plate Section PhotomicrographsPlate section photomicrographs to the requirements ofParagraph 4.4.7.
4.1.2.10 Visual Inspection Reports and DataVisual inspection reports and data to the requirementsof Paragraph 4.4.6.
4.1.3 Distribution of Reports (as applicable)Three (3) copies of the following reports are required by thisSpecification:
4.1.3.1 ReportsUp to three (3) interim reports detailing program pro-gress against a previously submitted schedule shall besupplied by the Contractor to the Laboratory approxi-mately bimonthly.
4.1.3.2 Failure NotificationDuring production, complete records shall be kept bythe Contractor. In the event of a failure, the time,nature, description, corrective action taken, and pro-posed further corrective action shall be reported tothe Laboratory within five (5) working days after suchfailure.
4.1.3.3 Requalification RecordsThe results and data from any requalification work, asrequired by Paragraph 4.3.4.
4.2 Manufacturing ProceduresAll programs, processes, and procedures, and all changes and modifica-tions thereto, to be used to Manufacture the product shall be submittedto the Laboratory prior to use for review and approval. These shallinclude:
4.2.1 Materials SpecificationsContractor's specifications for all materials listed in Section3.4 and in the Appendix, item 7.6 (Materials).
4.2.2 Identification of Sub-tier SuppliersThis listing to include the addresses of all Sub-tier Suppliers.
465
4.2.3 Manufacturing ProceduresAll fabrication, assembly, cleaning, surface treatment, handlingand demonstration procedures.
4.2.3.1 The Fuel Plate fabrication procedure must include theprovision that the Fuel Plates will be first hot-rolled,then cold-rolled. The final reduction of the FuelPlate thickness shall be accomplished by cold-rolling.The final reduction shall be approximately 20 percentfollowed by annealing if required. Blister and ultra-sonic testing of the Fuel Plate in accordance withParagraph 4.4.5 may either precede or follow the cold-rolling step.
4.2.4 QA-QC ProceduresAll test, inspection, production, and Quality Control procedures,including all non-destructive tests, and all standards and samplesectioning drawings.
4.2.5 In Process Controls ProcedureThe In-Process Controls, sampling programs, and procedures.
4.2.6 Production Sampling ProceduresThe Production-Quality-Control sampling program and procedures.
4.2.7 Repair ProceduresAll repair programs and procedures.
4.2.8 Final Inspection ProceduresAll final inspection, washing, packaging, storage, and shippingprocedures.
4.3 Quality Assurance - Fuel Plate and Fuel Element
4.3.1 Plate Fabrication QualificationPlate fabrication Qualification shall be based upon production bythe Contractor of a minimum of two (2) Lots of Fuel Plates, usinguranium of the specified enrichment in the form of UA1X for thecores. All acceptable Fuel Plates may be used in Fuel Elementswith the Laboratory's approval. Three (3) copies of records forthe testing, inspection, and Qualification for the followingitems shall be submitted to the Laboratory, and the Laboratory'sapproval shall be obtained, prior to beginning Fuel PlateProduction.
4.3.1.1 Uranium DistributionPunchings from a minimum of one (1) randomly selectedFuel Plate per Lot during Qualification, shall betaken, and each punching shall be chemically analyzedfor uranium to the requirements of Paragraph 3.2.2.The number and location of the punchings from the FuelPlate shall be fixed in the inspection scheme.
466
4.3.1.2 Uranium ContentA minimum of one (1) randomly selected Fuel Core perLot during Qualification shall be destructively assayedfor uranium to the requirements of Paragraph 3.2.1.
4.3.1.3 Clad-Core-Clad DimensionsA minimum of one (1) randomly selected Fuel Plate perLot during Qualification shall be used to make sections,and these sections evaluated to the requirements of theapplicable drawings.The number and location of the sections shall be fixedin the inspection scheme.
4.3.1.4 Internal Defects and Bond IntegrityAll Fuel Plates produced for Qualification shall beevaluated to the requirements of Paragraph 3.2.4 byultrasonic and blister testing of each Fuel Plate.Any indication of non-bond, voids, blisters, lamina-tion, or other discontinuities in excess of 3 mm in anydimension, shall place the item in Failure. In addi-tion, a bending test shall be made.
4.3.1.5 Core ConfigurationAll Fuel Plates produced for Qualification shall beevaluated to the requirements of Paragraph 3.2.3 by theprocedure of Paragraph 4.4.4.
4.3.1.6 Surface Finish and DefectsAll Fuel Plates produced for Qualification shall beevaluated to the requirements of Paragraph 3.2.5 by theprocedure of Paragraph 4.4.6.
4.3.1.7 Cleanliness and Surface Contamination (Fuel)All Fuel Plates produced for Qualification shall beevaluated to the requirements of Paragraph 3.2.6 by theprocedure of Paragraph 4.4.8.
4.3.2 Element Fabrication QualificationElement fabrication qualification shall be based upon the produc-tion of the test pieces listed below. Three (3) copies ofrecords for the testing, inspection, and qualification for thefollowing items shall be submitted to the Laboratory, and theLaboratory's approval shall be obtained, prior to beginning FuelElement Production.
4.3.2.1 Mechanical IntegrityThe Contractor shall assemble three (3) 60 mm long dummysections of a Fuel Element. Each section shall beevaluated to the requirements of the procedure ofParagraph 4.4.10.
467

4.3.2.2 DimensionalThe Contractor shall fabricate a Dummy Fuel Elementwhich shall be evaluated to the dimensional require-ments of the drawings listed in Paragraph 2.1.4 of thisSpecification. The Dummy Fuel Element shall be shippedto the User for insertion tests in the reactor core.The Laboratory shall not authorize Production prior tocompletion of insertion tests by the User.
4.3.3 In-Process ControlsThe Contractor shall establish a process control program wherebychecks are made on Manufacturing processes, operational procedures,intermediate product characteristics, and equipment to demonstratethat process stability during Production is at least equal tothat demonstrated during Qualification. These In-Process Controlsshall include, but not necessarily be limited to, the following:
4.3.3.1 Evaluation of Fuel Plates with regard to the require-ments of Paragraphs 3.2.2, 3.2.3, 3.2.5 and 3.2.6 bythe procedures of Paragraphs 4.4.3, 4.4.4, 4.4.6 and4.4.8, respectively.
4.3.3.2 Fabrication of 60 mm test specimens, using unfueledsimulated plate sections, to the requirements ofParagraph 3.3.4, and pull tests by the procedures ofParagraph 4.4.10. Swaging of test specimens will beinterspersed in the normal production process withoutprevious adjustment of the operation. The extent ofinspection shall be fixed in the inspection scheme.
4.3.4 RequalificationUnless otherwise approved by the Laboratory, Requalification shallbe limited to swaging. Process Requalification shall meet thesame requirements as the original Qualification. All Requalifi-cation work shall meet all the requirements of this Specificationunless specifically exempted by the Laboratory.The Contractorshall notify the Laboratory of any intended Requalification work,and shall submit three (3) copies of the results and data there-from. Production may be resumed when the Contractor has met allof the requirements of this section and received written approvalfrom the Laboratory.
4.4 Test and Inspection RequirementsThe following tests and inspections shall be performed by the Contractorto assure that the product quality is in accordance with the requirementsof this Specification:
4.4.1 MaterialsA "Certification of Chemical Analysis" or a certified Mill TestReport shall be supplied to the Laboratory for each lot ofmaterial used in the fabrication of Fuel Elements to establishcompliance with the requirements of Paragraph 3.4.1. This certi-ficate shall give the actual results of the chemical analysis forthe material. The certification shall state the analytical methodused in making the determinations for each chemical element or
468

compound reported and shall give the precision and accuracy of themethod used. All materials shall be treaceable to the FuelElements fabricated from these materials.
4.4.2 Fuel LoadingThe requirements of Paragraph 3.2.1 for fuel loading shall beestablished in accordance with Paragraph 4.1.1.3 by the Contractorsubject to the approval of the Laboratory.
4.4.3 HomogeneityThe requirements of Paragraph 3.2.2 on the homogeneity of theplates shall be met.
4.4.4 Fuel Core ConfigurationCompliance with the Fuel Core Configuration requirements ofParagraph 3.2.3 shall be by visual inspection (X-ray filming andfluoroscopic examination). The extent of inspection shall befixed in the inspection scheme. Visual radiograph inspectionsshall be performed without magnification on a light table.
4.4.5 Bond IntegrityCompliance with internal defects and bond integrity requirementsof Paragraph 3.2.4 shall be established by ultrasonic examinationof one (1) randomly chosen Fuel Plate per Production Lot and byperforming a blister test on all Fuel Plates. The blister testshall be performed either before or after cold-rolling, by heat-ing each plate to a temperature between 424°C and 546°C, holdingat that temperature for a period of one hour. Any Fuel Plateexhibiting blisters or non-bonds exceeding 3 mm in any dimensionshall be rejected. In addition, a bending test shall be made.
4.4.6 Surface Conditions and DefectsCompliance with surface conditions and defect requirements ofParagraph 3.2.5 and Paragraph 3.2.6 shall be established by visualinspection without magnification of the Fuel Plates and Elements.The extent of inspection shall be fixed in the inspection scheme.
4.4.7 Clad-Core-Clad DimensionCompliance with the requirements of the applicable drawings withregard to clad-core-clad dimensions shall be established by Quali-fication and by examination of randomly selected Fuel Plates,which may have been rejected for reasons which do not affect cladand core dimensions. The Fuel Plate shall be sectioned, mountedfor metallographic examination, polished and etched, and evaluatedto the requirements of the applicable drawings. Photomicrographsshall be made of each section. The extent of inspection shall befixed in the inspection scheme. Should failure occur, three (3)additional Fuel Plates shall be randomly selected from the 100Fuel Plates last produced and examined in the same manner.Should failure occur in any of these samples, all 100 FuelPlates shall be rejected.
4.4.8 CleanlinessFuel Plate and Element cleanliness requirements of Paragraph 3.2.6and Paragraph 3.3.3 shall be established by visual inspection of
469
the Fuel Plates and Elements and by In-Process Controls. The sur-faces of the Fuel Plates and the completed Fuel Elements shall becounted for radioactive contamination. The surface contaminationshall be less than 54 micrograms uranium per square meter. Theextent of inspection shall be fixed in the inspection scheme.
4.4.9 Dimensional InspectionCompliance with all external dimensions of the Fuel Plates, thegap dimension of all coolant flow channels as measured in centersection, and external dimensions of the Fuel Element shall be byinspection. All dimensions of this Specification shall apply ata temperature of 21°C + 2.8°C. In addition, the fuel elementassembly shall be tested for external dimensional adherence andfor endfitting dimensions by use of two (2) functional fit gaugesfurnished by the User, to assure compatibility with the User'sreactor core components. The extent of inspection shall befixed in the inspection scheme.
4.4.10 Mechanical IntegrityMechanical integrity shall be established by the Contractor byperforming "pull tests" on the specimens required by Sub-paragraph4.3.3.2. "Roll-swaged" joints between the Fuel Plates and sideplates shall be able to withstand a load of not less than 27 N/mmof side plate joint. The extent of inspection shall be fixed inthe inspection scheme.
4.5 Calibration RequirementsAll Contractor's measuring and test equipment used for acceptance ofmaterials or components to the requirements of this Specification shallmeet Laboratory requirement A0001-0114-SA.
4.6 Nonconforming ItemsThe Contractor shall control nonconforming items per the requirements ofLaboratory Procedure AQR-001.
5.0 PREPARATION FOR DELIVERY
5.1 RecordsOne (1) copy (except as noted) of the following data and records shallaccompany the shipments:5.1.1 Certification of product compliance to the requirements of this
Specification including any test data pertaining thereto notspecifically listed in Paragraphs 5.1.2 through 5.1.10.
5.1.2 Dimensional data as required by Paragraph 4.4.9.5.1.3 Individual Fuel Plate uranium data including:
5.1.3.1 Contractor's core compact data sheets5.1.3.2 Serial number with batch identification5.1.3.3 Uranium content
470
5.1.3.4 Fuel Plate core weight5.1.3.5 U-235 enrichment5.1.3.6 Total U-235 content
5.1.4 Individual Fuel Element uranium data including:
5.1.4.1 Serial number of the Fuel Element5.1.4.2 Uranium content
5.1.4.3 U-235 content
5.1.4.4 Serial number of each Fuel Plate in the Fuel Element.5.1.5 Radiation count from Fuel Plate and Fuel Element exterior, as
required by Paragraph 4.4.8. The counting period, counter, back-ground, efficiency, and type of counter used shall be reported.
5.1.6 Results of pull tests specified in Paragraph 4.4.10.5.1.7 List of all applicable waivers and deviations for related Fuel
Plates or Fuel Elements.
5.1.8 Radiographs as specified in Paragraphs 4.4.3 and 4.4.4.
5.1.9 Photomicrographs as specified in Paragraph 4.4.7.5.1.10 Visual inspection reports and data as specified in Paragraph
4.4.6.
5.2 Packaging and Shipping
5.2.1 The Contractor shall provide suitable shipping boxes for theFuel Elements, in accordance with all U.S. Regulations.
5.2.2 The Contractor shall load the Fuel Elements into the shippingboxes in sealed polyethylene bags in a clean dry condition,free from extraneous materials. The polyethylene shall be atleast 0.15 mm thick.
5.2.3 The Contractor shall take all necessary precautions during pack-ing to prevent damage to the Fuel Elements during shipment.Each box shall be provided with a tamper-proof seal. Each boxshall be loaded and shipping documents shall be prepared inaccordance with all applicable regulations.
6.0 NOTES AND SUPPLEMENTAL INFORMATION
6.1 Compliance with SpecificationsAll materials, workmanship, and procedures shall be subject to inspection,examination, and test by the Laboratory, and to rejection by the Labora-tory for non-compliance with the Specifications at any and all timesduring Manufacture, and at any and all places where such Manufacture iscarried on. Final detailed inspection and acceptance or rejection (exceptfor defects due to shipping damage) will be made by the Laboratory at the
471

Contrator's Plant. The Laboratory shall have the right to reject any oneor more of the finished products for defects in workmanship, or defectsin any of the materials comprising the finished product which otherwisefail to meet the Specification.
6.2 Deviations from SpecificationsNotwithstanding other provisions of these Specifications, the Laboratorymay, at its option, when requested in writing, waive certain minor devia-tions from requirements of the Specifications and drawings where thefailure to meet any specific requirement either alone or in combinationwith other such failures will not, in the opinion of the Laboratory,significantly reduce the efficiency or performance of the assembly.Acceptance of a Fuel Element by the Laboratory with one or more suchdeviations from the Specifications shall not be construed to mean thatthe Laboratory approves or will approve similar deviations in Elementsnot yet delivered under the Contract.
6.3 Fuel Plate Sampling Procedures for Destructive TestsThe sampling procedure shall be fixed in the inspection scheme.
6.4 Distribution of DocumentsThe Laboratory shall receive three (3) copies of all documents (drawings,specifications, inspection scheme, reports, description, records, certi-ficates, etc.).
6.5 Approval of DocumentsThe Laboratory shall approve of or comment on all documents (seeSection 6.4) within two (2) weeks. The approved documents shall be atthe manufacturer at least two (2) weeks before starting production orinspection.
7.0 APPENDIX
7.1 Scope and Specification of QuantitiesThis appendix specifies the number of Fuel Plates contained in a StandardFuel Element (Ns), the number of Fuel Plates contained in a Control FuelElement (Nc), the mass of U-235 contained in a Fuel Plate (Mp), the massof U-235 contained in a Standard Fuel Element (Ms), and the mass of U-235contained in a Control Fuel Element (Mc).
7.1.1 Ns: The number of Fuel Plates in a Standard Fuel Element shall beeighteen (18).
7.1.2 Nc: The number of Fuel Plates in a Control Fuel Element shall benine (9).
7.1.3 Mp: The mass of U-235 contained in a Fuel Plate shall be 9.28 g+ 2%.
7.1.4 Ms: The mass of U-235 contained in a Standard Fuel Element shallbe 167.0 g + 2%.Mc: The ma83.5 g + 2%
472
7.1.5 Mc: The mass of U-235 contained in a Control Fuel Element shall be

7.2 Drawing and Inspection Scheme Numbers for Standard Fuel Element andControl Fuel Element
See table on page 474.7.3 U-235 Content, Surface Density, and Enrichment
U-235 ContentStandard Element 18 plates
9.28 g + 2% U-235 per plate167.0 g + 2% U-235 per element
Control Element 9 plates9.28 g + 2% U-235 per plate83.5 g + 2% U-235 per element
U-235 Surface DensityNominal Value 26.7 mg U-235/cm2Zone 1 nom. mg U-235/cm2 + 20%Zone 2 nom. mg U-235/cm2 + 30%
- 20%Zone 3 nom. mg U-235/cm2 + 30%
- 100%
U-235 Enrichment; 19.75 + 0.2 wt%- 0.5 wt%
7.4 Fuel Plate 19.75% U-235 (scheme)
See figure and table on page 475.
7.5 UA1V Powder and Al PowderUA1X Powder: according to Contractor Specification No. X.Al Powder: according to Contractor Specification No. X.
7.6 Materials for Standard Fuel Element and Control Fuel ElementSee table on page 476.
7.7 List of Revisions
To be listed on final pages of this Appendix.
473
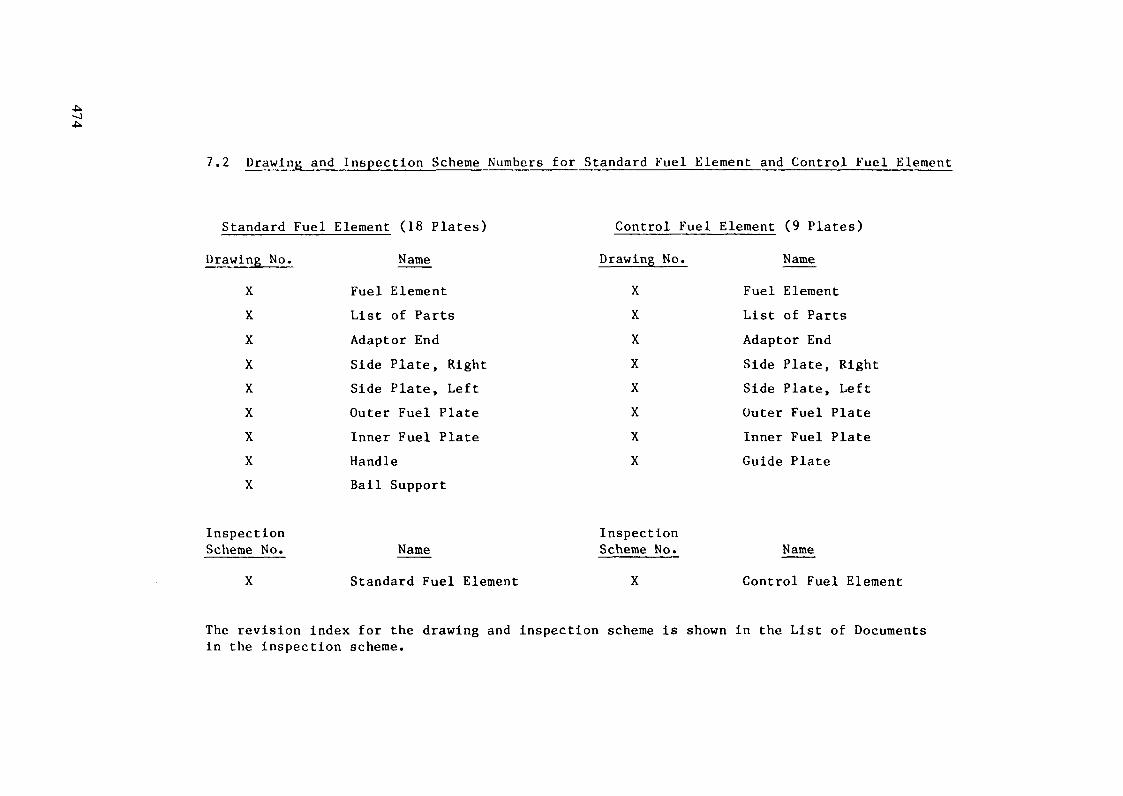
7.2 Drawing and Inspection Scheme Numbers for Standard Fuel Element and Control Fuel Element
Standard Fuel Element (18 Plates)
Name
Control Fuel Element (9 Plates)
Drawing No.
XXXXXXXXX
Fuel ElementList of PartsAdaptor EndSide Plate, RightSide Plate, LeftOuter Fuel PlateInner Fuel PlateHandleBail Support
Drawing No.XXXXXXXX
NameFuel ElementList of PartsAdaptor EndSide Plate, RightSide Plate, LeftOuter Fuel PlateInner Fuel PlateGuide Plate
InspectionScheme No. Name
Standard Fuel Element
InspectionScheme No. Name
Control Fuel Element
The revision index for the drawing and inspection scheme is shown in the List of Documentsin the inspection scheme.

7.4 Fuel Plate 19.75% U-235 (scheme)
18 plates per Standard Element / 9 plates per Control Element
Outer Fuel PlateDrawing No; XA
B
C
D
E
F
G
H
K
L
M
N
0
P
QR
S
T
U
727
min.
max.max.
max.
max.
max.max.
min.
Ref.1.52
Ref.
max.
69.4
max.
min.
max.
max.
max.
+ 0.2
58
61019
62
6.5
246.5
0.25
0.76
+ 0.05R 140*
38
+ 0.10
63.50
3.4
4.7
10.3
15.9
Inner Fuel PlateDrawing No; X
A
B
C
D
E
F
GH
K
L
M
N
0
P
QR
S
T
U
625.
min.
max.max.
max.
max.
max.max.
min.
Ref.1.52
Ref.
max.
69.4
max.
min.
max.
max.
max.
5 + 0.2
8
61019
62
6.5
246.5
0.25
0.76
+ 0.05
R 140*
38
+ 0.1063.50
3.4
4.7
10.3
15.9
*The radius shall be 140 mm In the Fuel Element Assembly
475
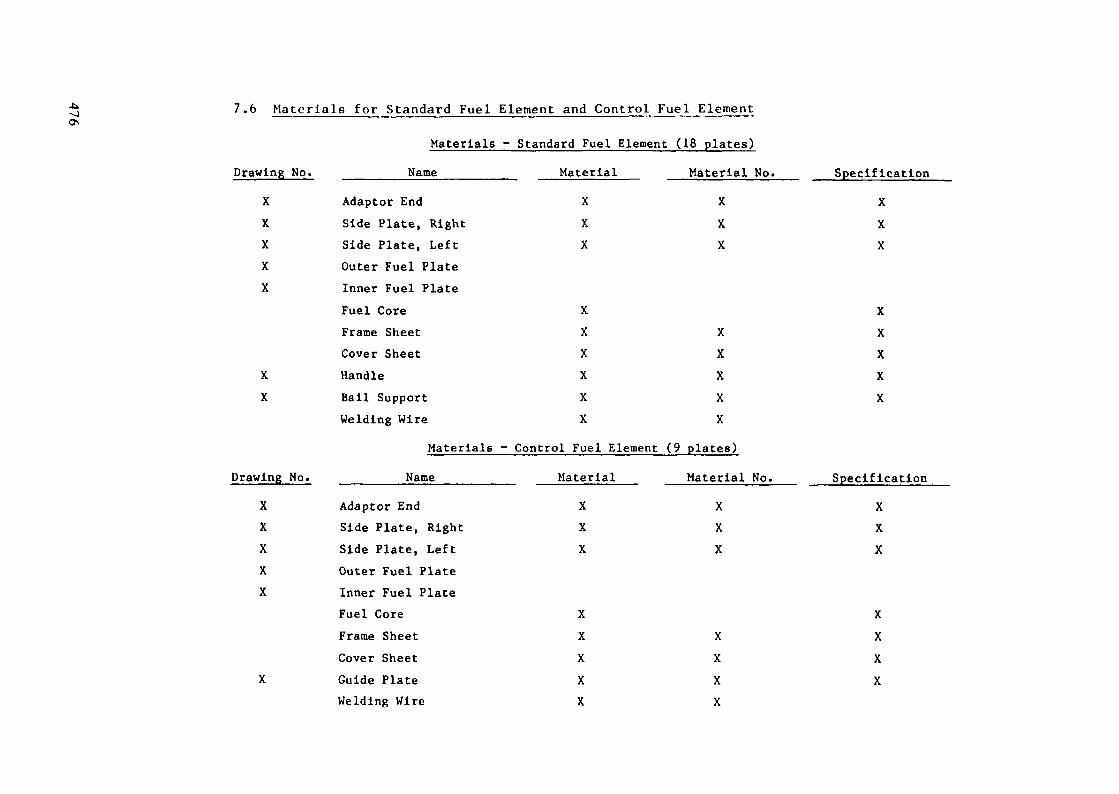
7.6 Materials for Standard Fuel Element and Control Fuel Element
Drawing No.XXXXX
XX
Drawing No.XXXXX
X
MaterialsName
Adaptor EndSide Plate, RightSide Plate, LeftOuter Fuel PlateInner Fuel PlateFuel CoreFrame SheetCover SheetHandleBail SupportWelding Wire
Materials
NameAdaptor EndSide Plate, RightSide Plate, LeftOuter Fuel PlateInner Fuel PlateFuel CoreFrame SheetCover SheetGuide PlateWelding Wire
- Standard Fuel Element (
MaterialXXX
XXXXXX
- Control Fuel Element (9
MaterialXXX
XXXXX
18 plates)Material No.
XXX
XXXXX
plates)
Material No.XXX
XXXX
SpecificationXXX
XXXXX
SpecificationXXX
XXXX
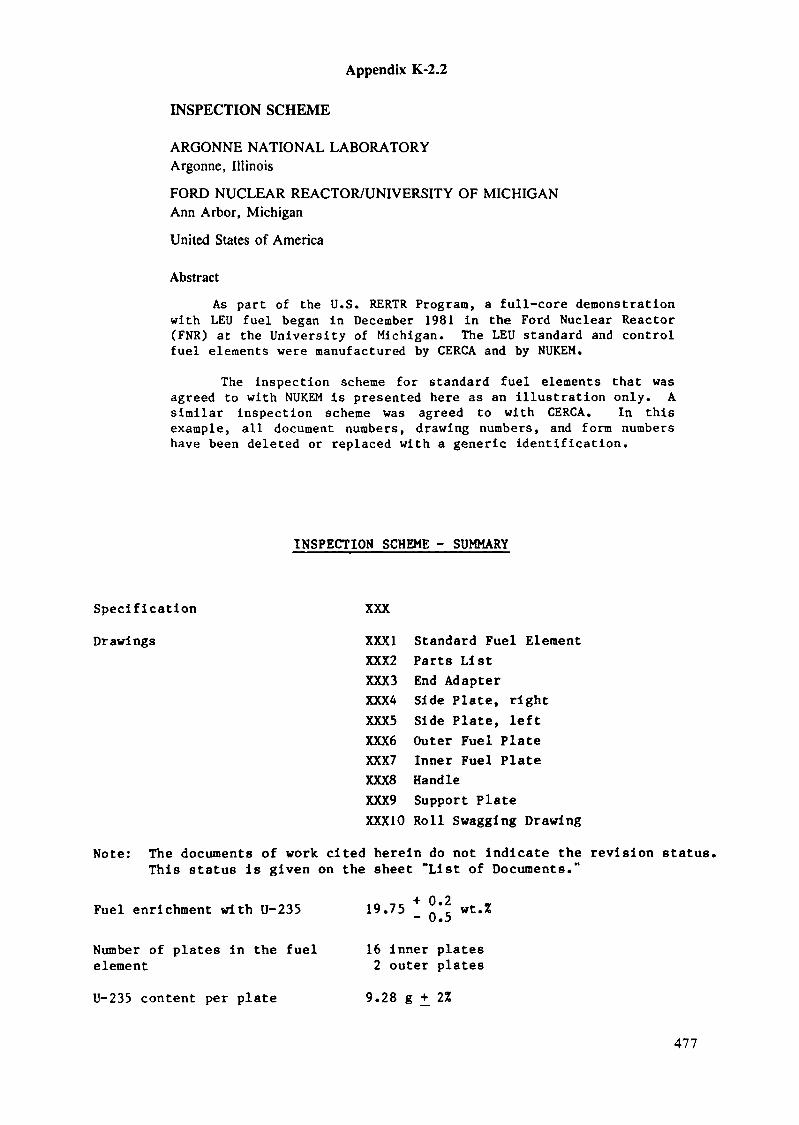
Appendix K-2.2
INSPECTION SCHEME
ARGONNE NATIONAL LABORATORYArgonne, Illinois
FORD NUCLEAR REACTOR/UNIVERSITY OF MICHIGANAnn Arbor, Michigan
United States of America
Abstract
As part of the U.S. RERTR Program, a full-core demonstrationwith LEU fuel began in December 1981 in the Ford Nuclear Reactor(FNR) at the University of Michigan. The LEU standard and controlfuel elements were manufactured by CERCA and by NUKEM.
The inspection scheme for standard fuel elements that wasagreed to with NUKEM is presented here as an illustration only. Asimilar inspection scheme was agreed to with CERCA. In thisexample, all document numbers, drawing numbers, and form numbershave been deleted or replaced with a generic identification.
INSPECTION SCHEME - SUMMARY
Specification XXX
Drawings XXXI Standard Fuel ElementXXX2 Parts ListXXX3 End AdapterXXX4 Side Plate, rightXXX5 Side Plate, leftXXX6 Outer Fuel PlateXXX7 Inner Fuel PlateXXX8 HandleXXX9 Support PlateXXX10 Roll Swagging Drawing
Note: The documents of work cited herein do not Indicate the revision status.This status is given on the sheet "List of Documents."
+ 02Fuel enrichment with U-235 19.75 ' wt.%*" u • j
Number of plates in the fuel 16 inner plateselement 2 outer platesU-235 content per plate 9.28 g +_ 2%
477
U-235 content per fuelelementSurface density of U-235
167.0 g +_ 2%Nominal value of 26.7 mg U-235/cm2
Zone 1 nom. mg. U-235/cm2 +_ 20Z
Zone 2 nom. mg U-235/cm2 _ -
Zone 3 nom. mg U-235/cm2 _ ^
Tests: 1. End adapter according to Test Sheet No. 12. Side plate according to Test Sheet No. 23. Fuel core according to Test Sheet No. 3
3.1. UAlx-powder according to Inspection CertificateForm A
A. Inner fuel plate according to Test Sheet No. 45. Outer fuel plate according to Test Sheet No. 5
5.1 Sections according to Inspection Certificate Form B5.2 Contamination Inspection according to Inspection
Certificate Form C5.3 Plate Acceptance Record Form D
6. Fuel box6.1 The roll swagglng stability side plate/fuel plate shall
be examined by test specimens before starting rollswagging operations and after having finished ten (10)fuel boxes in each case (Pull Test Specimen Form E).
6.2 Plate distance and dimension "x" shall be examined beforeassembly of the end adapter (Inspection Certificate Form F),
7. Fuel element test according to Inspection Certificate Form F7.1 Identification Form7.2 Contamination inspection
Acceptance records and Inspection Certificates according to DIN 50049 (3 each)for:
Certification that the fuel elements were manufactured andexamined according to specification.Dimensional inspection of the fuel element (Form F).Fuel weight and fuel enrichment level (Form G).Pull tests of roll swagging speciments (Form H).
- U contamination Inspection of the fuel plates and elements(Form C).X-ray films of the fuel plates (one copy).
478
Testing of cladding and core thickness of fuel plates(Form B).Records on x-ray absorption inspection (check for homo-geneity) of the fuel plates (one copy).Surface treatment of the fuel plates.Al powder used in the UA1X-A1 mixture.UAJ-x powder used in the UA1X-A1 mixture.U metal used in the UA1X.Semifinished products according to the parts list.Acceptance Record Sheet (Form I).
Test Equipment:
End Adapter Gauge (Form J)Calibration Steps (Form K)FNR Gauge 1FNR Gauge AEnd Adapter Gauge (Form L)Measurement Bridge (Form M)
479

IDENTIFICATION FORM
Order No: ..........Contractor Order No:Description: .......
The elements to be manufactured according to thedescription above shall be identified as follows:Element type: ..................................
Numbered from .................. to .............
Element type : ..................................Numbered from .................. to .............Element type : ..................................Numbered from .................. to .............
480

RANDOM SAMPLE PROCEDURE (RSP)
0 -
31 -
61 -
30
60
90
5
10
15
0 1
0 10 1
91 - 120 20 0 1
If the number of defective Items foundIn a random sample of n Items equals a,the related lot of N items shall be con-sidered as good and shall be accepted.If the number of defective items foundis equal to or greater than r, theentire lot of N items shall be examined.
N: lot sizen: random sample sizea: acceptance numberr: rejection number
481
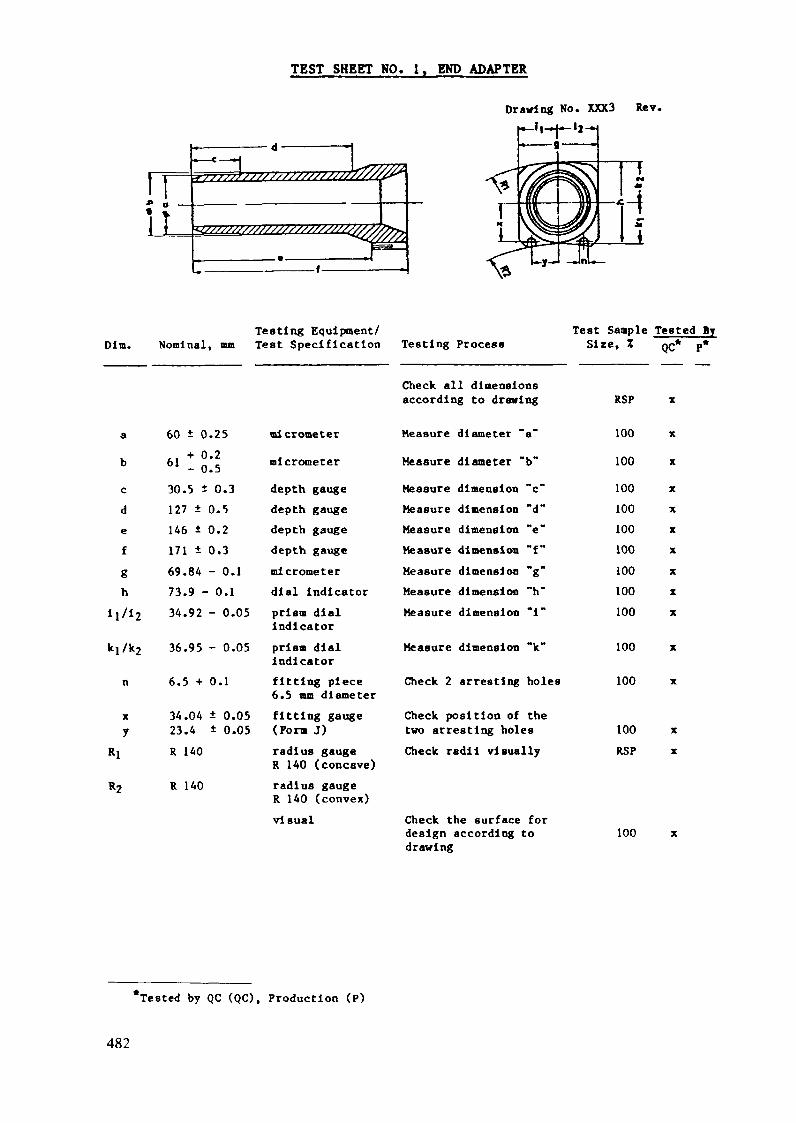
TEST SHEET NO. 1. END ADAPTER
Drawing No. XXX3 Rev.
I tirDim. Nomln
- ——————— d ——————— 1
^/////////////////////////{g/S/7**
1 ————————
Testing Equipment/al, mm Test Specification
a 60 ± 0.25 micrometer
b 61 * *_ micrometer0«-)
c 30.5 ± 0.3 depth gauged 127
e 146f 171
t 0.5 depth gauge± 0 . 2 depth gaugei 0.3 depth gauge
g 69.84 - 0.1 micrometerh 73.9 - 0.1 dial indicator
ij/12 34.92 - 0.05 prism dialindicator
ki/k2 36.95 - 0.05 prism dialindicator
n 6.5 + 0.1 fitting piece6.5 mm diameter
x 34.04 ± 0.05 fitting gaugey 23.4 ± 0.05 (Form J)
Rj R 140 radius gaugeR 140 (concave)
——— \
-- fanrc*^>Testing Process
Check all dimensionsaccording to drawing
Measure diameter "a"
Measure diameter "b"
Measure dimension "c"Measure dimension "d"Measure dimension "e"Measure dimension "fMeasure dimension "g"
Measure dimension "h"Measure dimension "1"
Measure dimension "k"
— •
^ '1PTest Sample
Size, Z
RSP
100
100
100100100100100100100
100
Check 2 arresting holes 100
Check position of thetwo arresting holesCheck radii visually
100RSP
Tested ByQC* P*
X
X
X
X
X
X
X
X
X
X
X
X
X
X
R 2 R 140 radius gaugeR 140 (convex)visual Check the surface for
design according todrawing
100
*Tested by QC (QC), Production (P)
482

TEST SHEET NO. 2. STANDARD FUEL ELEMENT SIDE PLATE
Drawing No. XXX4 (Right) Rev.XXX5 (Left)
g • plate length
Dim. Nominal, mm
ab
cde
f
g
4.75 ± 0.12.6 - 0.1
70 + 0.52.4 - 0.51.65 + 0.05
2.23 ± 0.2
727 i 0.2max. 0.1
Testing Equipment/Test Specification
micrometerdial Indicatormeasuring pln"J"slide gaugemlcrometermeasuring gaugeof 1.65 mmdevice
slide gaugemeasuring platesensor gauge
Testing ProcessTest Sample Tested By
Sire, X QC* p*
Check all dimensionsaccording to drawing.Measure thickness "a"*Measure dimension "b(front, middle, back)*Measure dimension "c"Measure dimension "d"Check groove width "e"
Measure dimension "f"+(front, middle, back)Measure length "g"Establish maximumdeflection onedge.*
RSP100
RSPRSPRSPRSP
RSPRSP
100
X
X
X
X
xx
*Tested by QC (QC), Production (P)^Record results on Record Form N.
483
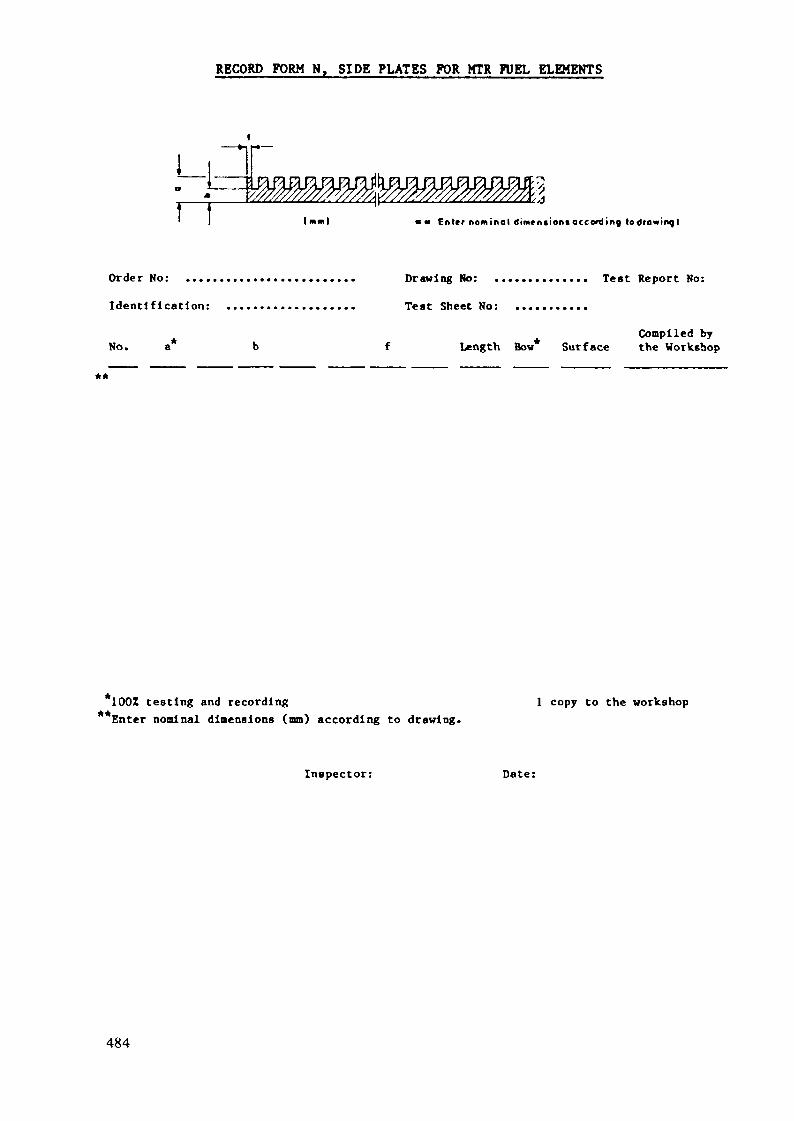
RECORD FORM N. SIDE PLATES FOR MTR FUEL ELEMENTS
I.m| • • Enter nominol dimcntioniocccxding to drawing I
Order No: ....
Identification:
No. a*
Drawing No: .............. Test Report No:
Test Sheet No: ...........
Compiled byLength Bow* Surface the Workshop
**
*100Z testing and recordingEnter nominal dimensions (am) according to drawing.** 1 copy to the workshop
Inspector: Date:
484
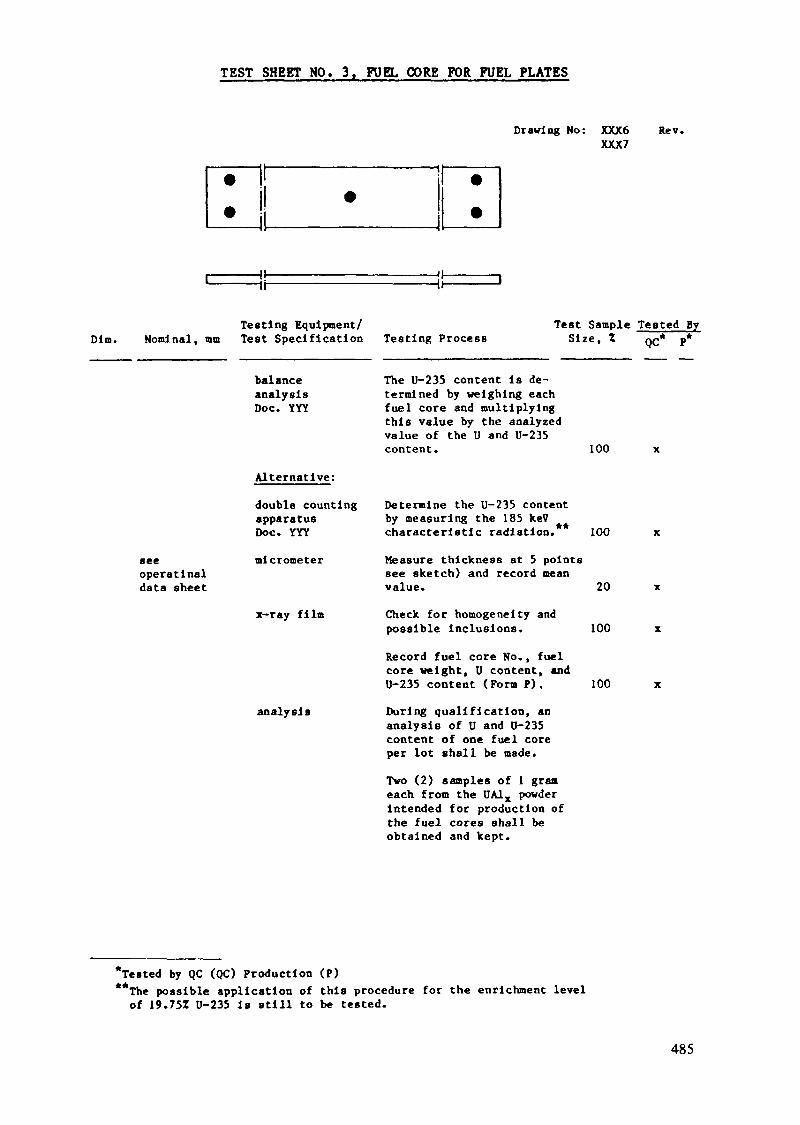
TEST SHEET NO. 3, FUEL CORE FOR FUEL PLATES
Drawing No: XXX6 Rev.XXX7
Dim.Testing Equipment/
Nominal, am Test Specification
balanceanalysisDoc. YYY
Testing ProcessTest Sample Tested By
Size, X
The U-235 content is de-termined by weighing eachfuel core and multiplyingthis value by the analyzedvalue of the U and U-235content.
QC"
100
seeoperatlnaldata sheet
Alternative;
double countingapparatusDoc. YYY
micrometer
x-ray film
analysis
Determine the U-235 contentby measuring the 185 keVcharacteristic radiation.** 100
Measure thickness at 5 pointssee sketch) and record meanvalue. 20
Check for homogeneity andpossible inclusions. 100
Record fuel core No., fuelcore weight, U content, and0-235 content (Form P). 100
During qualification, ananalysis of U and U-235content of one fuel coreper lot shall be made.
Two (2) samples of 1 grameach from the UA1X powderIntended for production ofthe fuel cores shall beobtained and kept.
*Tested by QC (QC) Production (P)**The possible application of this procedure for the enrichment level
of 19.75Z U-235 is still to be tested.
485

RECORD FORM P, FUEL CORE FOR FUEL PLATES
Key word:batch Ko:
Order No:
UAlx-Cermet
Enrichment of U-235 .....%
u3°8~Cerniet
Core Plate ElementNo. No. Weight,g U,g U-235,g Thickness*,mm No. No. Remarks
123456789
101112131415161718192021222324252627282930
Corrections: Distribution:
Inspector:
Date: ....
Median of 5 tests
486
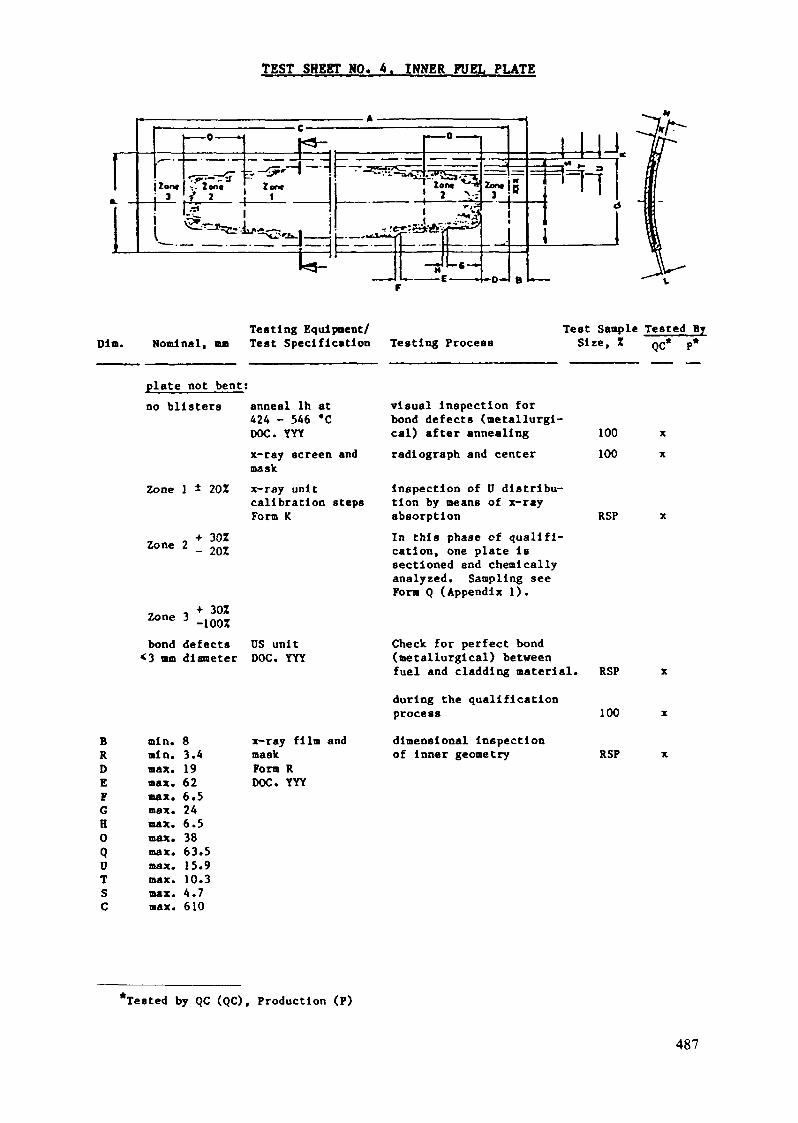
TEST SHEET HO. 4. INNER FUEL PLATE
11
*~-
Zont1
—— 0 ——— -
— . —— . —
*- 2entj -,&*— '\3& „~. ..
L— gj5-s*H —
Zone1
^ N '-tJ ____
—— t1*^~
. —— o —— «-i
•
lont *^^| I V
.3*J_. ——— ciî ~''-^ 'p*~
E: ——— ^fe. > . F.- «
Tj
«-n.»
Si
B
—— ,«* ^ ^H ne.
Din. Nominal,
plate not bent;no blisters
Testing Equipment/Test Specification
Test Sample Tested By
Zone l i 20Z
anneal Ih at424 - 546 "CDOC. YYYx-ray screen andmaskx-ray unitcalibration stepsForm K
Zone 2
Zone
+ 30Z- 20Z
+ 30Z-100Z
bond defects US unit<3 mm diameter DOC. YYY
BRDEFGHOQ0TSc
min.min.max.max.max.max.max.max.max.max.max.max.max.
83.419626.5246.53863.515.910.34.7610
x-raymaskForm RDOC. YYY
film and
Testing Process Size, Z QC"
100100
RSP
visual Inspection forbond defects (metallurgi-cal) after annealingradiograph and center
Inspection of 0 distribu-tion by means of x-rayabsorptionIn this phase of qualifi-cation, one plate issectioned and chemicallyanalyzed. Sampling seeForm Q (Appendix 1).
Check for perfect bond(metallurgical) betweenfuel and cladding material. RSPduring the qualificationprocess 100dimensional inspectionof inner geometry RSP
xx
*Tested by QC (QC), Production (P)
487

TEST SHEET NO. 4, INNER FUEL PLATE (Cont.)
Drawing No. XXX7 Rev.
Dim.Testing Equipment/
Nominal, mm Test Specification Testing Process
625.5 ± 0.2 measuring deviceDOC. YYY
Test Sample Tested BySize, % C* p*
dimensional Inspectionof outer geometry RSP
PM
69.4 ± 0.11.52 ± 0.05
KL
min. 0.25réf. 0.76
microscope Examine cladding andmeat thickness by meansof sections.
no bonddefects
clamping deviceDOC. YYY
Together with the sec-tions, samples shall beobtained for the photo-micrographs (see Inspec-tion Certificate Form B).Testing scope: duringqualification, 1 plate perlot; then
bend test at plate sections1RSP
plate bent;
<5 Mg U-235per 929 cm2
counting apparatus
allowable visualdamage light sectionZone 2<0.08 mm microscopeother <0.13 mm DOC. YYYdeep
contamination inspectionOne fuel plate per batch(100Z, if 5 Mm is exceeded),Surface inspectionIf necessary, measuresurface defects.
100
*Tested by OC (QC), Production (P)
488
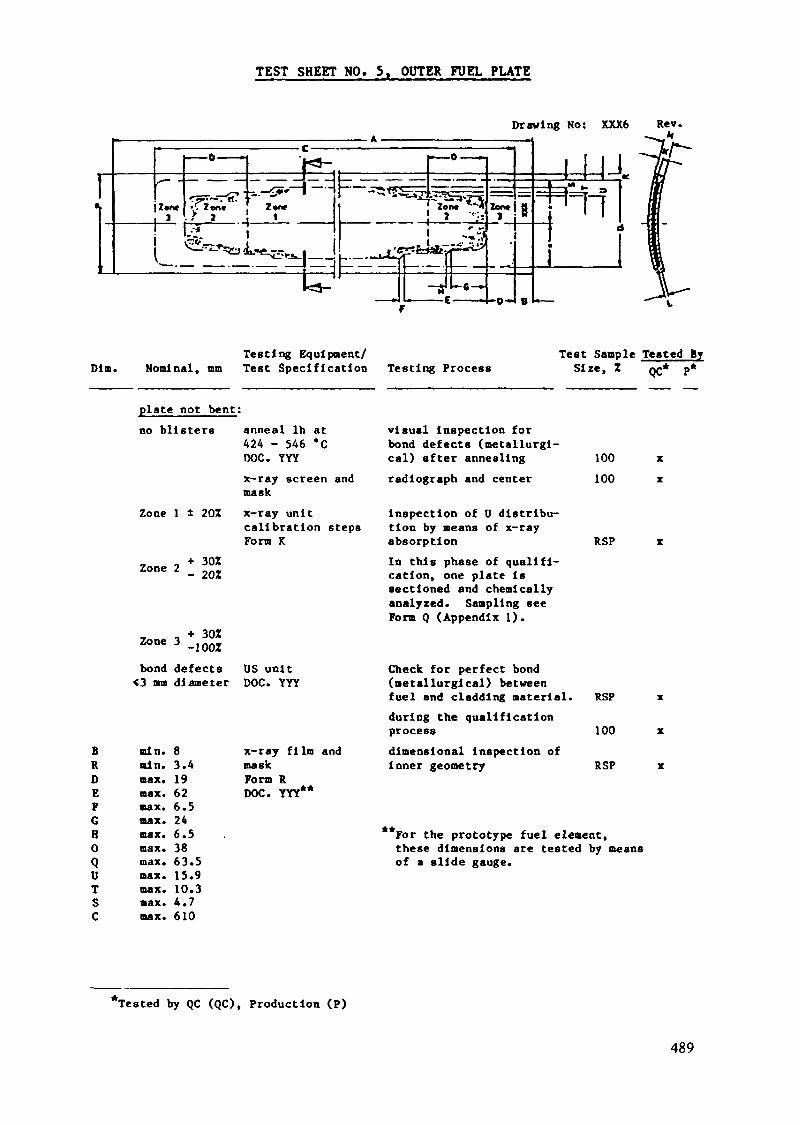
TEST SHEET NO. 5, OUTER FUEL PLATE
Drawing No: XXX6 Rev.
Dim. Nominal, mm
plate not bent:no blisters
Testing Equipment/Test Specification
Zone l ± 20Z
anneal Ih at424 - 546 *CDOC. YYYx-ray screen andmaskx-ray unitcalibration stepsForm K
Zone 2
Zone 3
+ 30Z- 20Z
+ 30X-100Z
bond defects<3 mm diameter
BRDBFGH0QUTSC
min.min.max.max.max.max.max.max.max.max.max.max.max.
83.419626.5246.53863.515.910.34.7610
US unitDOC. YYY
x-raymaskForm RDOC. YYY
f11m and
Testing ProcessTest Sample Tested By
Sire, Z QC* p*
visual Inspection forbond defects (metallurgi-cal) after annealing 100radiograph and center 100
Inspection of U distribu-tion by means of x-rayabsorption RSPIn this phase of qualifi-cation, one plate issectioned and chemicallyanalyzed. Sampling seeForm Q (Appendix 1).
Check for perfect bond(metallurgical) betweenfuel and cladding material. RSPduring the qualificationprocess 100dimensional Inspection ofinner geometry RSP
For the prototype fuel element,these dimensions are tested by meansof a slide gauge.
*Tested by QC (QC), Production (P)
489

TEST SHEET NO. 5. OUTER FUEL PLATE (Cont.)
Drawing No. XXX6 Rev.
Dim.Testing Equipment/
Nominal, mm Test Specification Testing Process
727 i 0.2 measuring deviceDOC. YYY
Test Sample Tested ByQC"Size, % oc* p*
dimensional inspectionof outer geometry RSP
PM
KL
69.4 ± 0.11.52 i 0.05min. 0.25réf. 0.76
microscope Examine cladding andmeat thickness by meansof sections.Together with the sec-tions, samples shall beobtained for the photo-micrographs (see Inspec-tion Certificate Form B).
no bond clamping devicedefects DOC. YYY
Testing scope: duringqualification, 1 plate perlot; then 1
bend test at plate sections RSP
plate bent:
<5 ug U-235per 929 cm2
allowabledamageZone 2<0.08other <0.13mm deep
counting apparatus
visuallight sectionmicroscopeDOC. YYY
contamination inspectionOne fuel plate per batch(100%, if 5 pm is exceeded).Surface inspectionIf necessary, measuresurface defects.
100
Tested by QC (QC), Production (P)
490
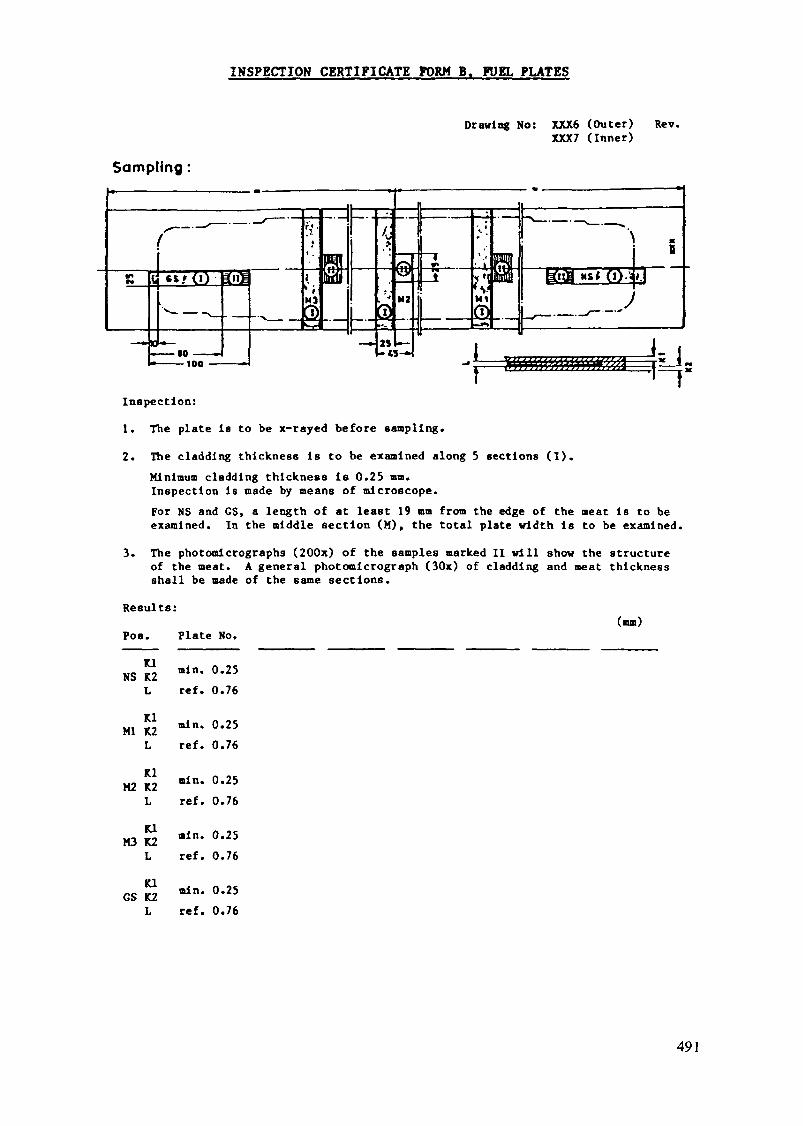
INSPECTION CERTIFICATE FORM B. FUEL PLATES
Drawing No: XXX6 (Outer) Rev.XXX7 (Inner)
Sampling :
Inspection:
1. The plate is to be x-rayed before sampling.
2. The cladding thickness is to be examined along 5 sections (I).
Minimum cladding thickness Is 0.25 mm.Inspection is made by means of microscope.For NS and GS, a length of at least 19 mm from the edge of the meat Is to beexamined. In the middle section (M), the total plate width is to be examined.
3. The photomicrographs (200x) of the samples marked II will show the structureof the meat. A general photomicrograph (30x) of cladding and meat thicknessshall be made of the same sections.
Results:
Pos. Plate No.(mm)
KlNS K2
L
KlMl K2
L
KlM2 K2
L
KlM3 K2
L
KlGS K2
L
min. 0.25réf. 0.76
min. 0.25
réf. 0.76
min. 0.25réf. 0.76
min. 0.25
réf. 0.76
min. 0.25réf. 0.76
491

INSPECTION CERTIFICATE FORM C. CONTAMINATION TEST
Order No: .................. Key Word: ................. ____Z U-235
Specification: .......................... Requirement: ........................
Large surface counter: 810 cm2. Calibration plate 7.2 Ug Ü-235 working voltage ... kV
Zero ..... pulses/ml n Calibration count ..... pulses/rain
number reverseType Plate No. side side* Element No. Batch pulses/mln pulses/min pulses/mln pulses/mln Result Date
Inspector: ........................
Date: ............................. Work Inspector
* I - Inner Plate 0 = Outer Plate FE - Fuel Element CE - Control Fuel Element
492
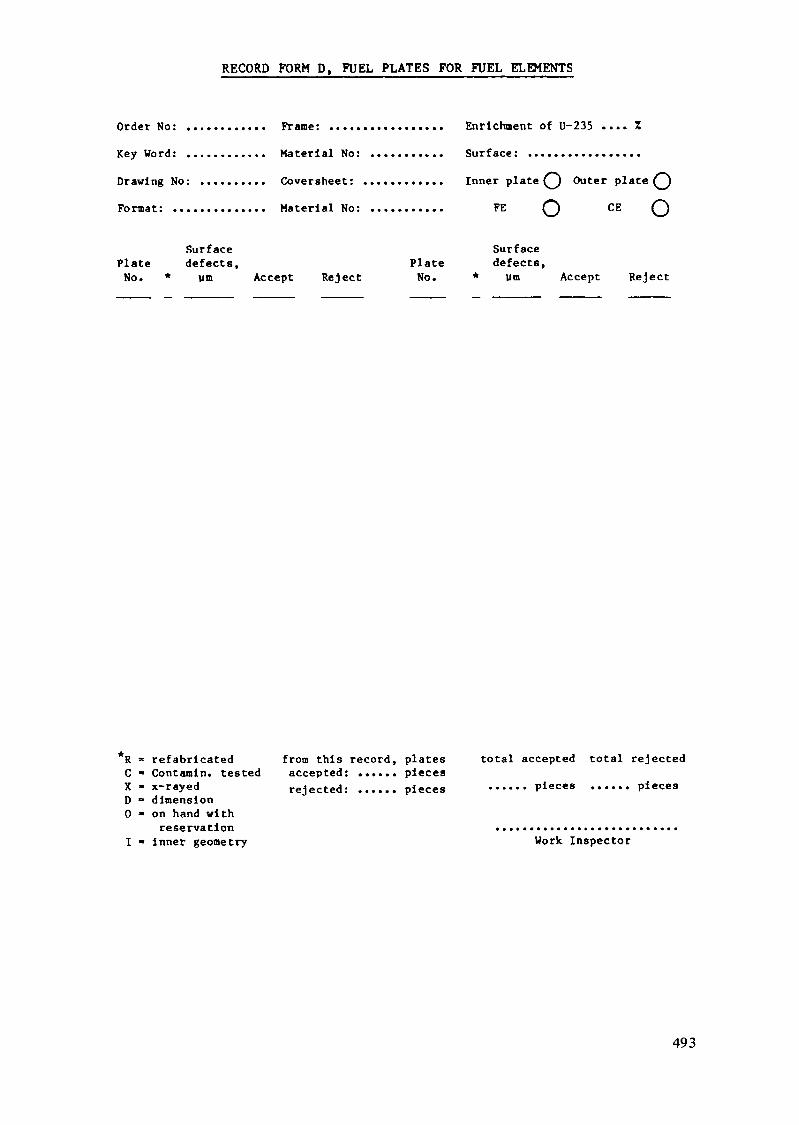
RECORD FORM D, FUEL PLATES FOR FUEL ELEMENTS
Order No: ............ Frame: ................. Enrichment of U-235 .... Z
K e y w o r d : ............ Material No: ........... Surface: .................
Drawing No: .......... Coversheet: ............ Inner plate Q Outer plate
Format: .............. Material No: ........... FE CE
Surface SurfacePlate defects, Plate defects,
No. * um Accept Reject No. * urn Accept Reject
*R » refabrlcated from this record, plates total accepted total rejectedC • Contamln. tested accepted: ...... piecesX - x-rayed rejected: ...... pieces ...... pieces ...... piecesD « dimension0 » on hand with
reservation ...........................I - Inner geometry Work Inspector
493
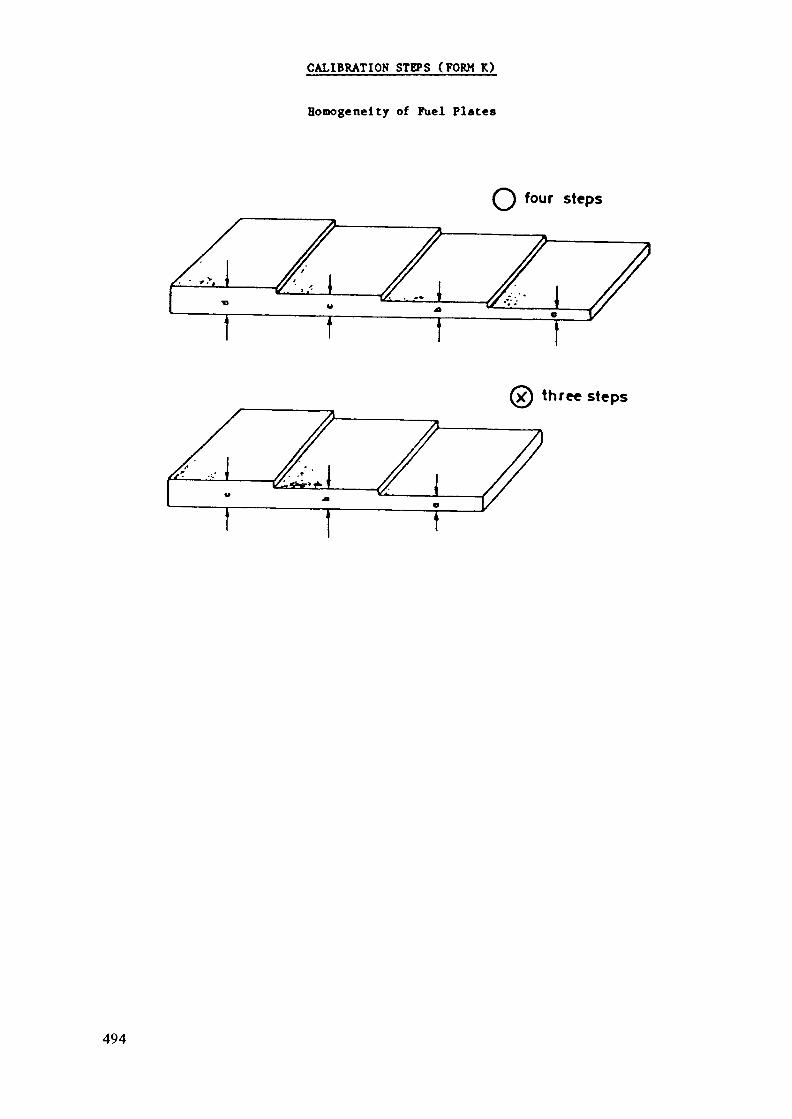
CALIBRATION STEPS (FORM K)
Homogeneity of Fuel Plates
four steps
three steps
494
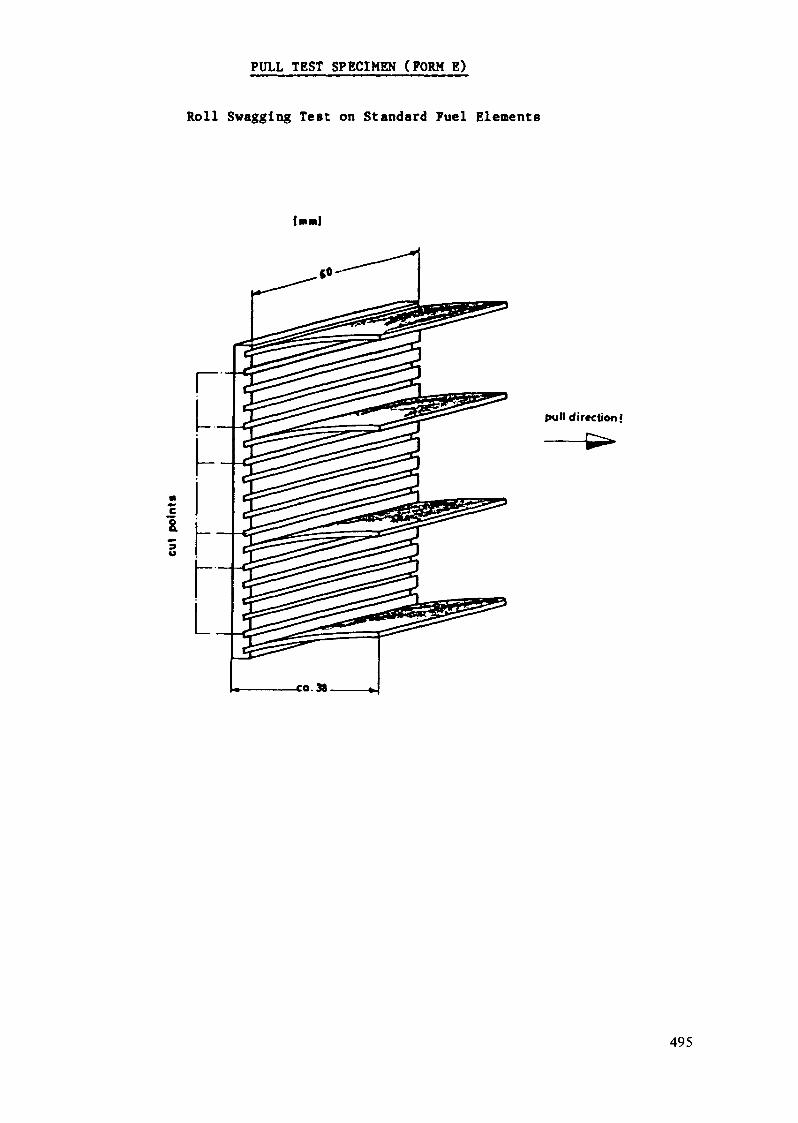
PULL TEST SPECIMEN (FORM E)
Roll Swagging Test on Standard Fuel Elements
j:&
pull direction!
495
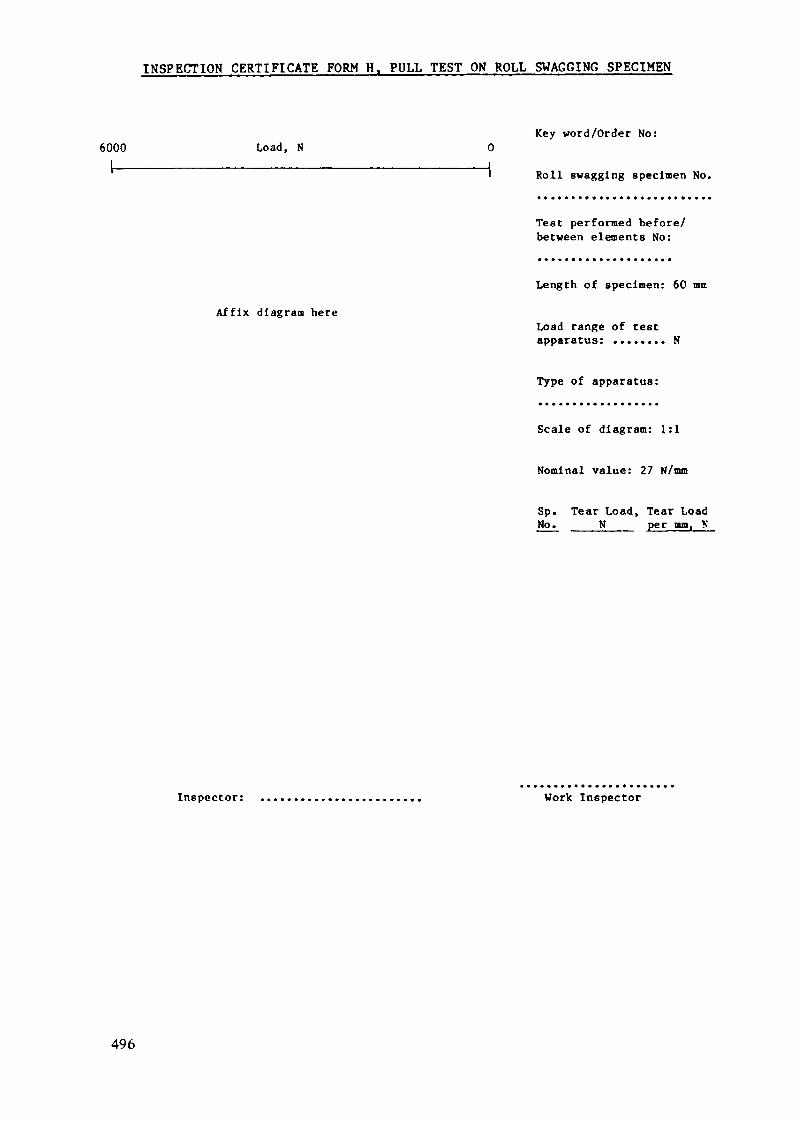
INSPECTION CERTIFICATE FORM H. PULL TEST ON ROLL SWAGGING SPECIMEN
6000 Load, NKey word/Order No:
Roll swagging specimen No.
496
Test performed before/between elements No:
Aff ix diagram here
Length of specimen: 60 ran
Load range of testapparatus : ........ N
Type of apparatus:
Scale of diagram: 1:1
Nominal value: 27 N/mm
Sp. Tear Load, Tear LoadNo. ___N___ per nun, V
Inspector: Work Inspector
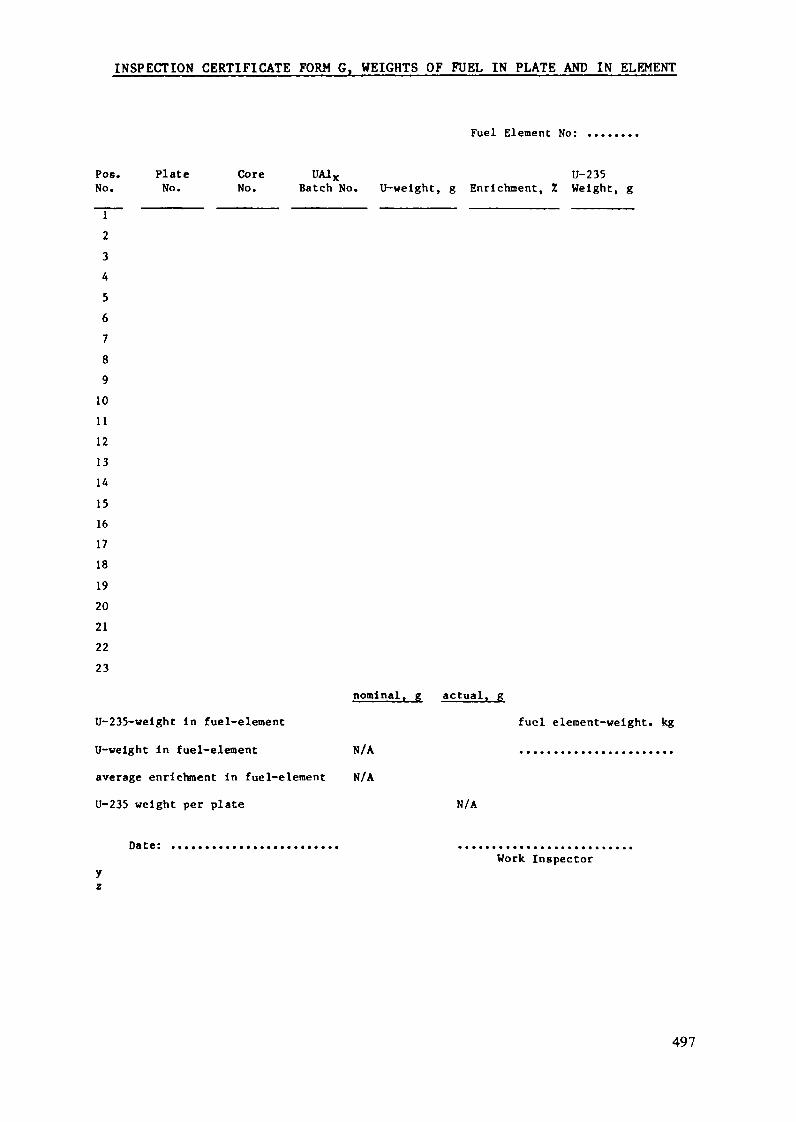
INSPECTION CERTIFICATE FORM G. WEIGHTS OF FUEL IN PLATE AND IN ELEMENT
Fuel Element No:
Pos. Plate Core UA1X U-235No. No. No. Batch No. U-weight, g Enrichment, t Weight, g
2
3
4
5
6
789
101112
13
14
15161718
19202122
23
nominal, g actual, g
U-235-weIght In fuel-element fuel element-weight, kg
U-weight in fuel-element N/A .......................
average enrichment in fuel-element N/A
U-235 weight per plate N/A
Date: ......................... .....................Work Inspector
yz
497

INSPECTION CERTIFICATE FORM F. STANDARD FUEL ELEMENT
Ford Fuel Element (18 Plate«)
top view
I- 1
HL rfkf& ^— i-" tl
!fc,r UPL/r
^A\-• YYY ààAAA "f
— a - plate gap
*Measure dimensions "d" and "e" by Dial Gauge on a Measurement Bridge (Form M).**1. Measure upper flat of element as faces Inspector. 2. Turn element 180° and
measure again.
Fuel Element No.
Dimension Nominal, torn Acutual Range, mm
!c **xi
•H
L**
[ *«
Clj:
bc
defggikl
c
mn
79.874.43
1.161.37
76.5960.5
59.7543.8937.2237.22145.5
872
- 80- 74.93- 1.36
min.- 77.59- 61.2- 60.25- 44.15- 37.47- 37.47- 146.5- 874
50.65 - 50.95tN X
l
•* Interlocking of end adapter (Form L).
Contamination Inspectionof entire surface < 1Z
Inspector:
The element Is to be freefrom contamination or damage.
Plate gap "a"1234567891011121314151617Check mln. gap with 2.7 mmdla. stainless steel wirebefore assembling endadapter and handle.
498
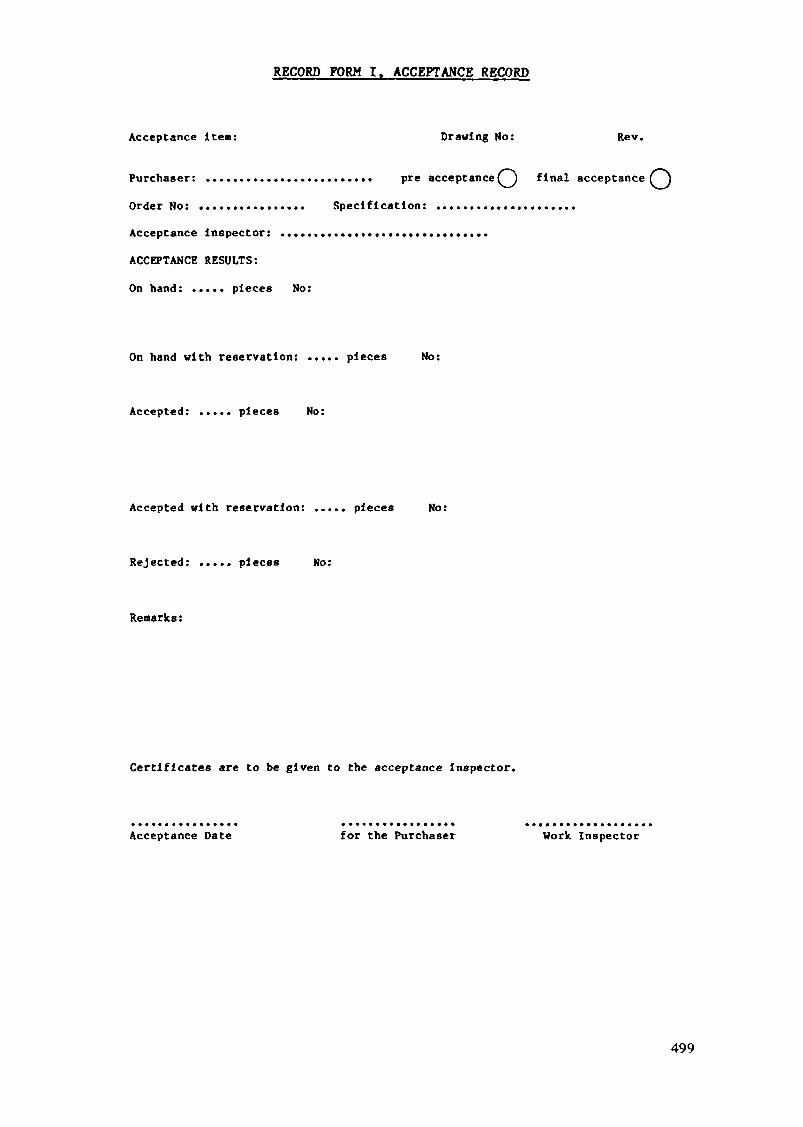
RECORD FORM I. ACCEPTANCE RECORD
Acceptance item: Drawing No: Rev.
Purchaser: ......................... pre acceptance(""j) final acceptance^)Order No: ................ Specification: .....................Acceptance inspector: ...............................
ACCEPTANCE RESULTS:
On hand: ..... pieces No:
On hand with reservation: ..... pieces No:
Accepted: ..... pieces No:
Accepted with reservation: ..... pieces No:
Rejected: ..... pieces No:
Remarks :
Certificates are to be given to the acceptance Inspector.
Acceptance Date for the Purchaser Work Inspector
499
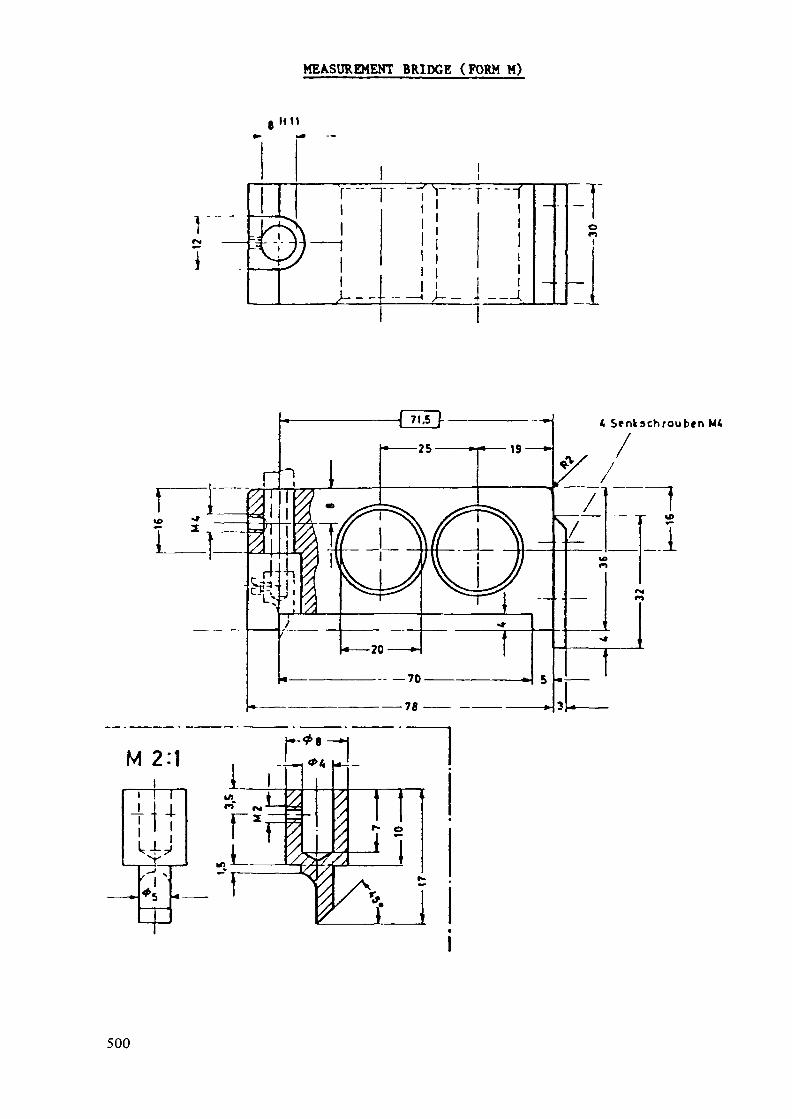
MEASUREMENT BRIDGE (FORM M)
H 11
- 4——l
:yor>l
Sfnkschraub*nM4
M 2:1 1 l"» ~LPr»t
"£?'/i
«p<*
^Sj
i-4
ff
—to
\xxxxx
/t
/
1 1- Î T^ î
500
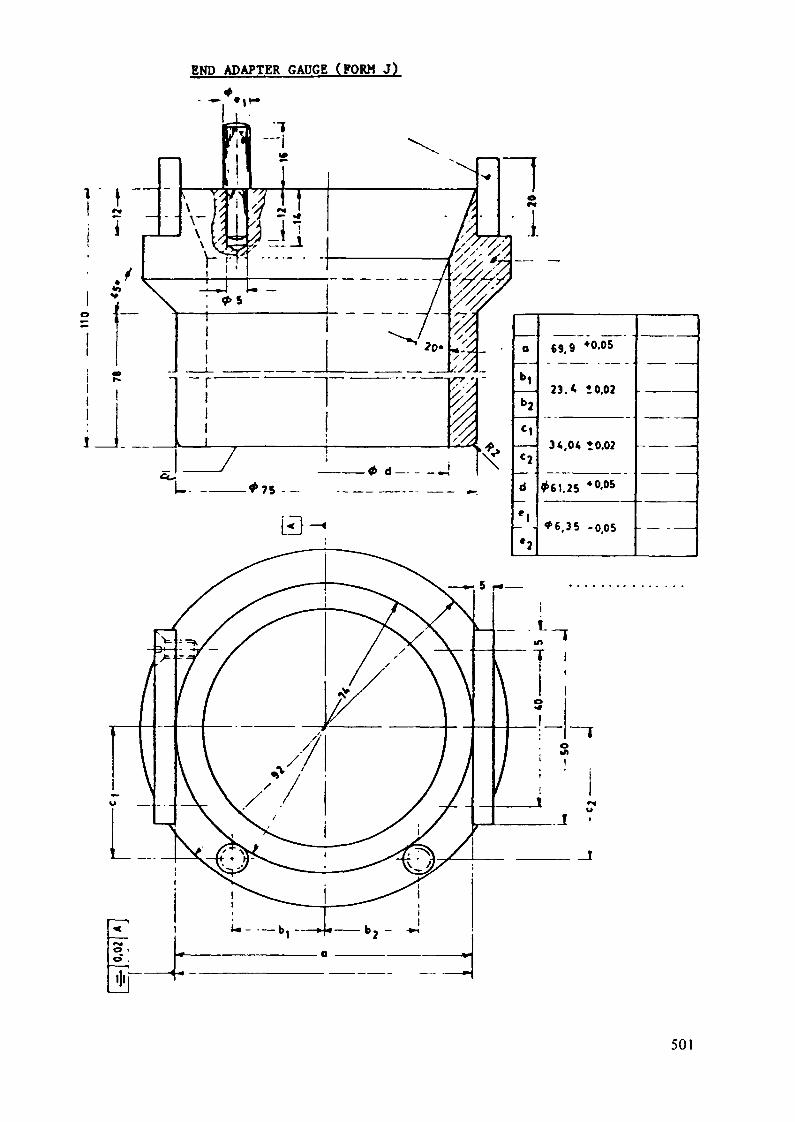
END ADAPTER GAUGE (FORM J)
0
»>2
«1
C2
d
el
*2
(99 «0.05
23.« «0.02
34.04 1 0,02
#61.25 *°-05
*6.35 -0,05
—— ——
—— - ——
501
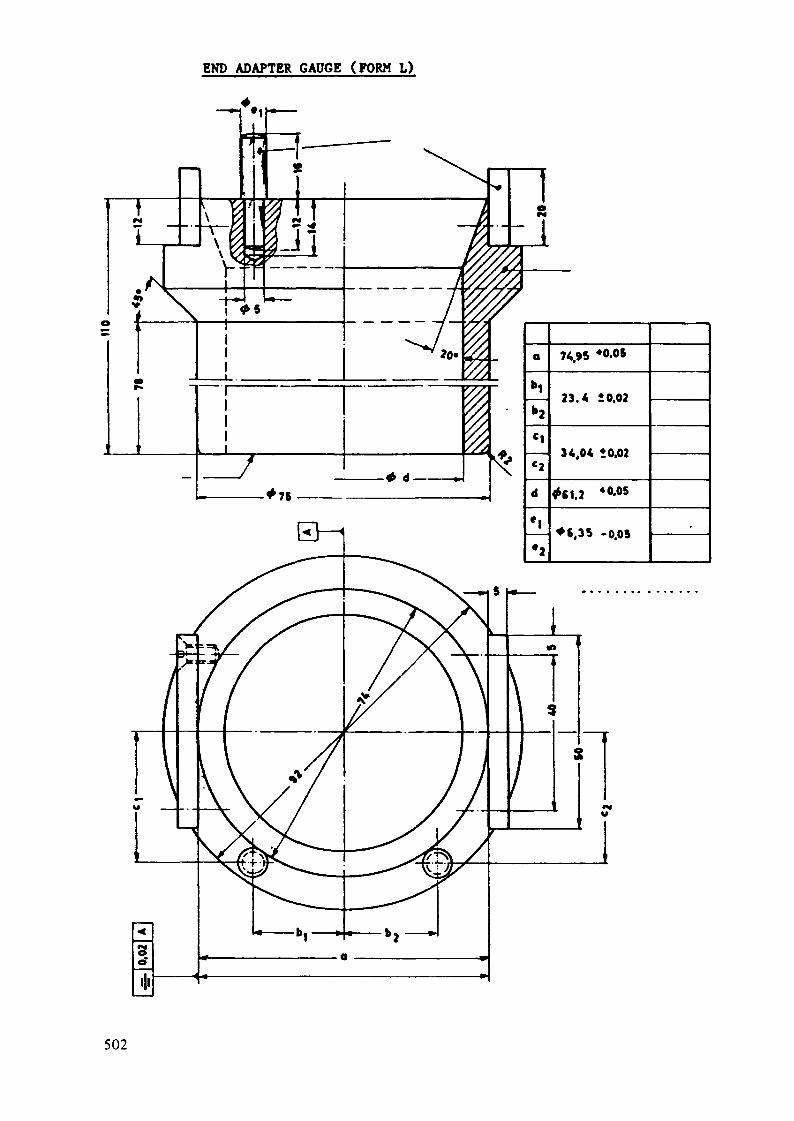
END ADAPTER GAUGE (FORM L)
a
h>2
«1«2
d
«|
•2
74.95 *0.08
« L «002
34 04 *OX>2
#«1.2 *°-05
*6.35 -005*l V,V 9
.
502

LIST OF DOCUMENTS
Contractor No:
Doc. XXX
Rev. Document Purchaser No. Rev.
Inspection scheme
specifications:
Doc. YYY specification
drawings:XXXIXXX2XXX3XXX4XXX5XXX6XXX7XXX8XXX9XXXI0
standard fuel elementparts listend adapterside plate, rightside plate, leftouter fuel plateinner fuel platehandlesupport plateroll swagging drawing
LIST OF REVISIONS
Date Page Revision Approved Rev.
503
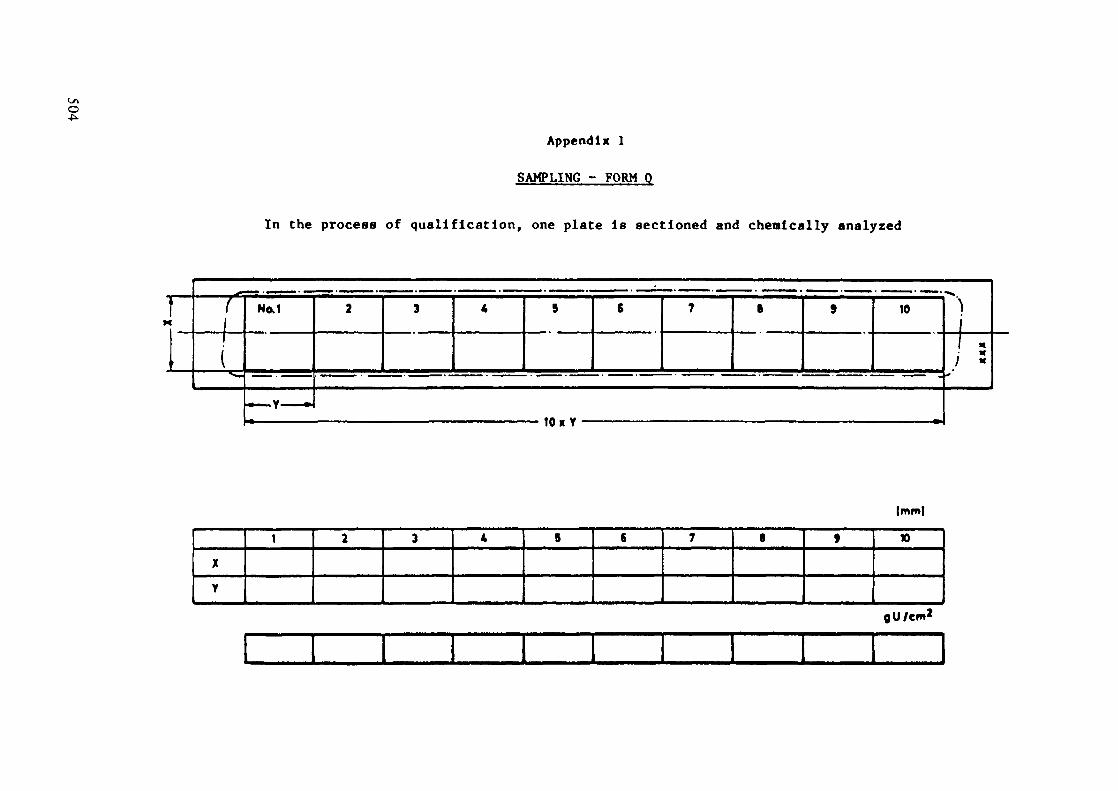
o-fiAppendix 1
SAMPLING - FORM 0
In the process of qualification, one plate Is sectioned and chemically analyzed
No.1 10
10 x Y
|mml
X
Y
1 2 3 4 ft 6 7 1
1
9 X)
9 U /em2

Appendix K-3FUEL ELEMENTS WITH LEU U3O8-A1 FUEL
FOR THE DR-3 REACTOR
Appendix K-3.1
SPECIFICATIONS
RIS0 NATIONAL LABORATORYRoskilde, Denmark
Abstract
As part of the Danish RERTR Program, three fuel elementswith LEU U30g-Al fuel and three fuel elements with LEUU^Sij-Al fuel were manufactured by NUKEM for irradiationtesting in the DR-3 reactor at the Risoe National Laboratoryin Denmark. The specifications for the elements with U^Og-Al fuel are presented here as an illustration only. Speci-fications for the elements with U^Si^-Al fuel were verysimilar. In this example, materials, material numbers,documents numbers, and drawing numbers specific to a singlefabricator have been deleted.
1.0 GENERAL
1.1 Introduction
This specification describes the production and inspection of the DR-3fuel element with LEU UßOg-Al fuel.
1.2 DefinitionsThe fuel element consists of a tubular fuel section, a tubular-unfueledupper section, and an end adapter.
The fuel section consists of four (4) concentrically arranged fuel tubesand an unfueled outer tube. The tubes are fixed at each end with four (4)spacers.Each fuel tube consists of three (3) fuel plates with aluminum cladding;the plates are connected to each other along longitudinally welded seams.The upper section of the fuel element contains an emergency cooling spraymechanism and a thermocouple protection tube. A perforated zone (approxi-mately 120 mm in circumference) is located immediately above the fuelsection, for the discharge of water.
505

l .3 Description of the Production Process
1.3.1 Production of the U308-A1 Fuel Core
To guarantee that the U-235 content required for the fuel coreis in a homogenous distribution, the 1)303 fuel powder andaluminum powder shall be weighed and mixed in portions corres-ponding to the desired fuel core composition. This compositionshall then be cold pressed to form the fuel core.
1.3.2 Production of the Fuel PlatesThe fuel plates shall be produced according to the "pictureframe technique." In this technique, the fuel core is her-metically enclosed on all sides by the cladding material thatis applied by roll bonding. The cladding process is carriedout in several steps at temperatures that ensure a perfectmetallurgical bond between the fuel and the cladding material.The fuel zone is then calibrated to the required geometry byfinal cold rolling.
1.3.3 Production of the Fuel TubesAfter bending, three (3) fuel plates of the same width and withthe same U content shall be welded together, to form each fueltube. The fuel tube has uranium-free zones along each of thethree longitudinally welded seams.
1.3.4 Production of the Fuel Elements
The individual fuel tubes shall be assembled by mechanicalmeans to form the fuel section. Specifically, the tubes will bepushed into the slots in upper and lower combs, and will be heldin these slots by pins or by squeezing the comb material againstthem. The fuel tube assembly will then be inserted in theunfueled-outer tube and fastened in place by welding the combsto the outer tube. Finally, the upper section and the endadapter are to be welded to the fuel section to complete thefuel element.
2.0 PRODUCT SPECIFICATIONS
2.1 DrawingsThe drawings listed in the Appendix are part of this Specification.
2.2 Materials2.2.1 1)303 Powder
The specifications for the l Oß powder are given in theAppendix.
2.2.2 Al PowderThe specifications for the Al powder are given in the Appendix.
506
2.2.3 Assembly PartsThe materials for the assembly parts are listed in the Appendix.
2.2.4 Other MaterialsOther materials are listed in the Appendix.
2.3 Surface Treatment and HandlingProper handling and storage shall be ensured through suitable measures.Procedures for surface treatment are listed in the Appendix.
3.0 INDENTIFICATION
3.1 Fuel CoreEach fuel core shall be marked with an identification number.
3.2 Fuel PlateEach fuel plate shall be marked with an identification number.
3.3 Fuel TubeAfter welding, each fuel tube shall be numbered.
3.4 Fuel ElementThe fuel element number shall be engraved into the fuel element.Details are given by the corresponding element designation. Thenumbering shall be provided by the Purchaser.
4.0 QUALITY INSPECTIONSAll quality inspections shall be carried out according to the InspectionScheme, which is part of this Specification.4.1 Fuel Core
4.1.1 Analysis of Starting Material- UßOg powder- Aluminum powder
4.1.2 Determining U-235 Content4.1.3 Check of Dimensions4.1.4 X-Ray Inspection
4.2 Fuel PlateSee Appendix for schematic drawing.
4.2.1 Homogeneity of Uranium Distribution in Fuel Plates
507
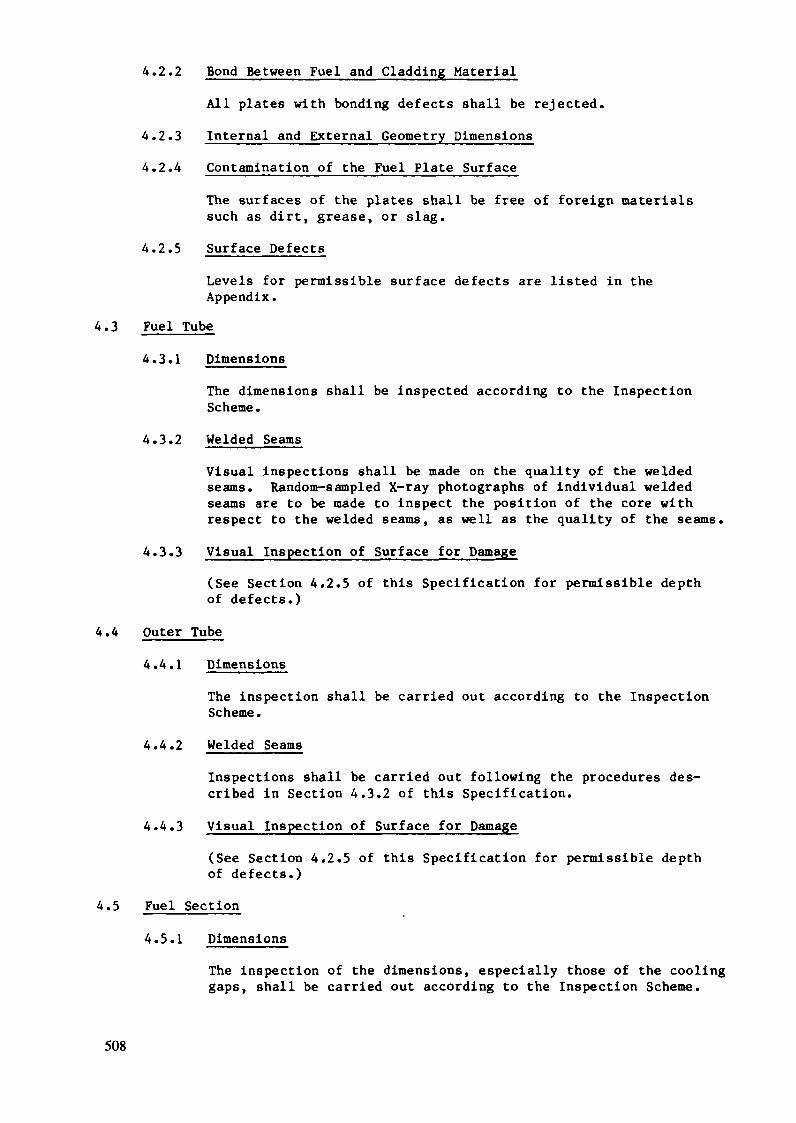
4.2.2 Bond Between Fuel and Cladding Material
All plates with bonding defects shall be rejected.4.2.3 Internal and External Geometry Dimensions4.2.4 Contamination of the Fuel Plate Surface
The surfaces of the plates shall be free of foreign materialssuch as dirt, grease, or slag.
4.2.5 Surface Defects
Levels for permissible surface defects are listed in theAppendix.
4.3 Fuel Tube4.3.1 Dimensions
The dimensions shall be inspected according to the InspectionScheme.
4.3.2 Welded SeamsVisual inspections shall be made on the quality of the weldedseams. Random-sampled X-ray photographs of individual weldedseams are to be made to inspect the position of the core withrespect to the welded seams, as well as the quality of the seams,
4.3.3 Visual Inspection of Surface for Damage(See Section 4.2.5 of this Specification for permissible depthof defects.)
4.4 Outer Tube4.4.1 Dimensions
The inspection shall be carried out according to the InspectionScheme.
4.4.2 Welded SeamsInspections shall be carried out following the procedures des-cribed in Section 4.3.2 of this Specification.
4.4.3 Visual Inspection of Surface for Damage(See Section 4.2.5 of this Specification for permissible depthof defects.)
4.5 Fuel Section
4.5.1 DimensionsThe inspection of the dimensions, especially those of the coolinggaps, shall be carried out according to the Inspection Scheme.
508
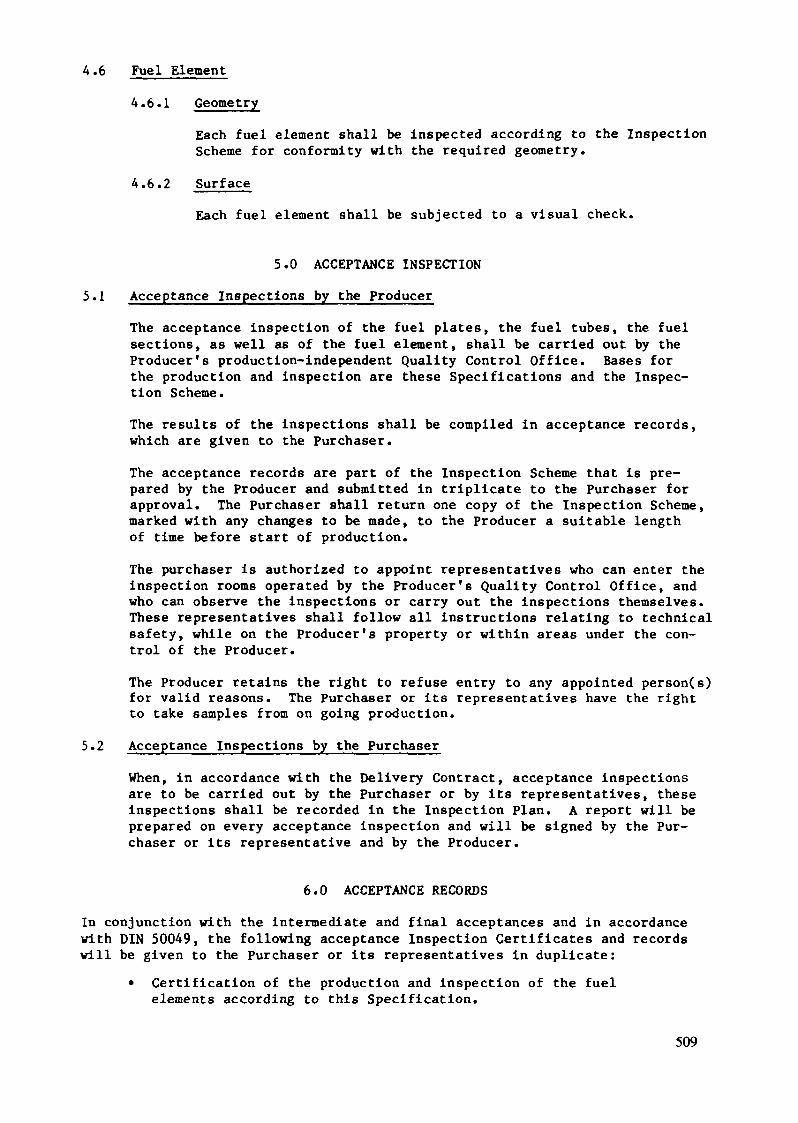
A.6 Fuel Element4.6.1 Geometry
Each fuel element shall be inspected according to the InspectionScheme for conformity with the required geometry.
4.6.2 SurfaceEach fuel element shall be subjected to a visual check.
5.0 ACCEPTANCE INSPECTION5.1 Acceptance Inspections by the Producer
The acceptance inspection of the fuel plates, the fuel tubes, the fuelsections, as well as of the fuel element, shall be carried out by theProducer's production-independent Quality Control Office. Bases forthe production and inspection are these Specifications and the Inspec-tion Scheme.The results of the inspections shall be compiled in acceptance records,which are given to the Purchaser.The acceptance records are part of the Inspection Scheme that is pre-pared by the Producer and submitted in triplicate to the Purchaser forapproval. The Purchaser shall return one copy of the Inspection Scheme,marked with any changes to be made, to the Producer a suitable lengthof time before start of production.The purchaser is authorized to appoint representatives who can enter theinspection rooms operated by the Producer's Quality Control Office, andwho can observe the inspections or carry out the inspections themselves.These representatives shall follow all instructions relating to technicalsafety, while on the Producer's property or within areas under the con-trol of the Producer.The Producer retains the right to refuse entry to any appointed person(s)for valid reasons. The Purchaser or its representatives have the rightto take samples from on going production.
5.2 Acceptance Inspections by the PurchaserWhen, in accordance with the Delivery Contract, acceptance inspectionsare to be carried out by the Purchaser or by its representatives, theseinspections shall be recorded in the Inspection plan. A report will beprepared on every acceptance inspection and will be signed by the Pur-chaser or its representative and by the Producer.
6.0 ACCEPTANCE RECORDS
In conjunction with the intermediate and final acceptances and in accordancewith DIN 50049, the following acceptance Inspection Certificates and recordswill be given to the Purchaser or its representatives in duplicate:
• Certification of the production and inspection of the fuelelements according to this Specification.
509
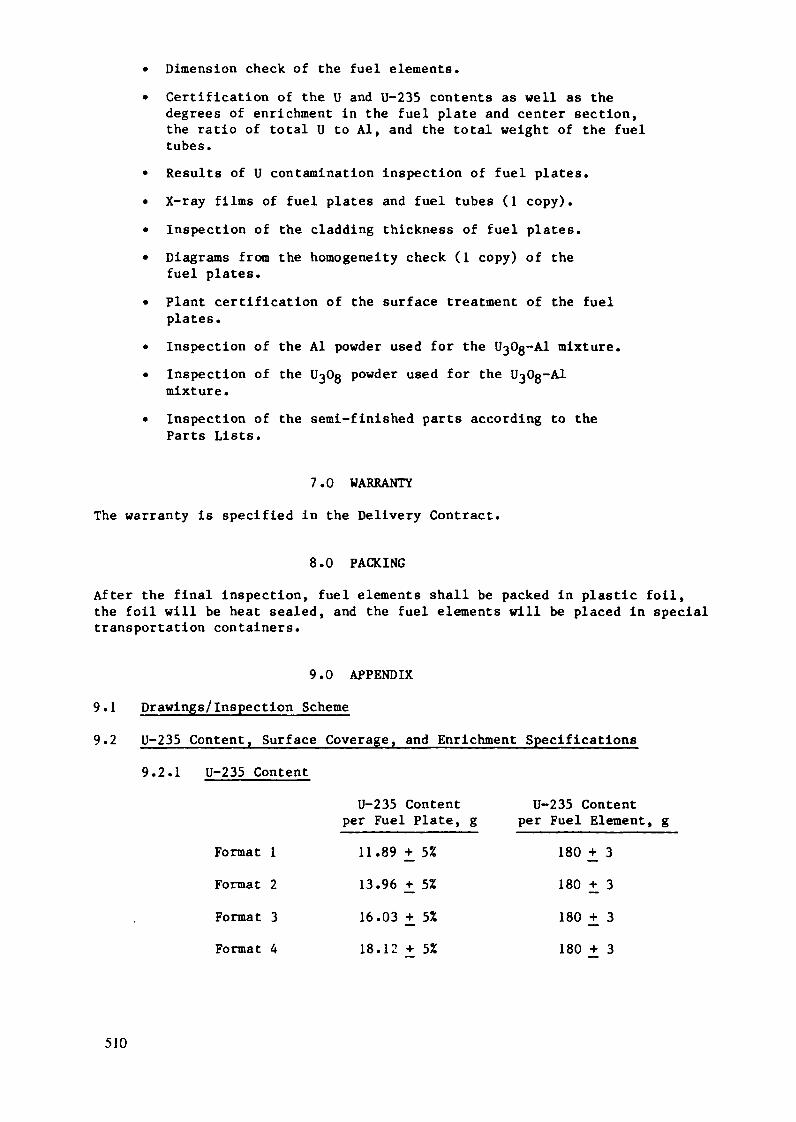
• Dimension check of the fuel elements.• Certification of the U and U-235 contents as well as the
degrees of enrichment in the fuel plate and center section,the ratio of total U to Al, and the total weight of the fueltubes.
• Results of U contamination inspection of fuel plates.• X-ray films of fuel plates and fuel tubes (1 copy).• Inspection of the cladding thickness of fuel plates.• Diagrams from the homogeneity check (1 copy) of the
fuel plates.• Plant certification of the surface treatment of the fuel
plates.• Inspection of the Al powder used for the UßOg-Al mixture.• Inspection of the UßOg powder used for the UßOg-Al
mixture.• Inspection of the semi-finished parts according to the
Parts Lists.
7.0 WARRANTY
The warranty is specified in the Delivery Contract.
8.0 PACKINGAfter the final inspection, fuel elements shall be packed in plastic foil,the foil will be heat sealed, and the fuel elements will be placed in specialtransportation containers.
9.0 APPENDIX9.1 Drawings/Inspection Scheme
U-235
9.2.1
Content, SurfaceU-235 Content
Format 1Format 2
Format 3Format 4
Coverage, and Enrichment
U-235 Contentper Fuel Plate, g
11.89 +_ 5%13.96 +. 5%16.03 +. 5%18.12 + 5%
Specifications
U-235 Contentper Fuel Element, g
180 + 3180 + 3180 + 3180 + 3
510

9.2.2 Surface Coverage with U-235
Nominal value of 33.5 mg D-235/cm2
Zone l* nominal mg Ü-235 * 12.52Zone 2* nominal mg Ü-235 + 16.OZ
-100.0%
* See Section 9.3, Fuel Plate (schematic drawing)
9.2.3 U-235 Enrichment of 19.75 + 0.22 by Weight- 0.5Z
9.2.4 Surface ContaminationThe surface contamination must not exceed 10 Wg Ü-235 per fuelplate.
9.3 Fuel Plate for DR-3 Reactor
— 1*K
_OJ*-B — »-
———————————————————— A ————————————————————— •-
UJ k)r f tZone 2 i
f
- rob)
-r^J (
'
Zonel
1
)
^^
Zone 2
1)
—f C*—\
( H ———1
- :c o
<
Surface defects with a depth of no more than 0.1 mm are acceptable,aB - C < I 3.41ku - E < I 1.6|
511
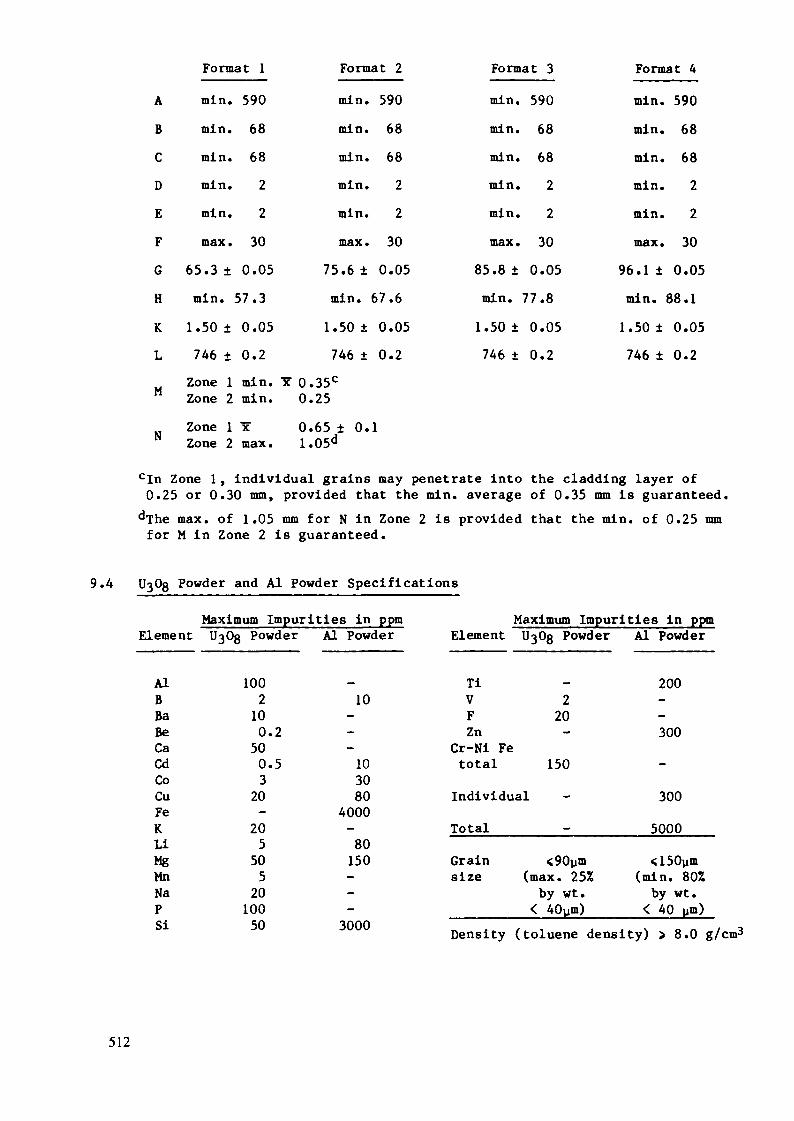
Format 1 Format 2 Format 3 Format 4ÀBCDEFGHKL
M
N
min.min.min.min.min.max.
65.3 ±min.
1.50 ±746 ±Zone 1Zone 2Zone 1Zone 2
59068682230
0.0557.30.050.2min. 1min.•xmax.
min.min.min.min.min.max.
75.6 ±min.
1.50 ±746 ±
r o.35c0.250.65 ± 0.1.05d
59068682230
0.0567.60.050.2
1
min.min.min.min.min.max.
85.8 ±min.
1.50 ±746 ±
59068682230
0.0577.80.050.2
min.min.min.min.min.max.
96.1 ±min.
1.50 ±746 ±
59068682230
0.0588.10.050.2
cln Zone l , individual grains may penetrate into the cladding layer of0.25 or 0.30 mm, provided that the min. average of 0.35 mm is guaranteed.
max. of 1.05 mm for N in Zone 2 is provided that the min. of 0.25 mmfor M in Zone 2 is guaranteed.
9.4 Powder and Al Powder Specifications
Maximum Impurities in ppmElement U
AIBBaBeCaCdCoCuFeKLiMgMnNaPSi
303 Powder
1002100.2500.5320-2055052010050
AI Powder
10---103080
4000
80150
3000
Maximum Impurities in ppmElement
TiVFZn
Cr-Ni Fetotal
t Oß Powder
220-
150Individual -Total
Grainsize
•»*_—_ j *_ __ à
-
<90ym(max. 25%
by wt.< 40ym)
' *_ _ _ . _ _ J _ _ _ j
Al Powder
200--300-
3005000<150ym
(min. 80%by wt.
< 40 ym)\ *_ _ \ .. rt f\ _
512

9.5 Materials List9.6 Surface Treatment
9.6.1 Level Fuel Plates- Degrease in perchloroethylene vapor- Mechanical cleaning
9.6.2 Fuel Tubes, Unfueled-Outer Tube, and Combs
- Degrease in perchloroethylene vapor- Pickle in NaOH (6-10% by wt.) for l min. at 60 °C- Rinse in running water for l min.- Neutralize in HN03 (30-50% by wt., density 1.2-1.3 g/cm3)
for l min.- Rinse in running water for 5 min.- Rinse in running, desalted water for 5 min.- Boil in desalted water for 30 min.- Dry in air
9.6.3 Upper Section and End Adapter- Degrease in perchloroethylene vapor- Pickle in HF/HN03 mixture (20 cm3 of HF, 40%, per 1000 cm3
of HN03, 20%) for about 10 min. at 20-25 °C- Rinse in running water for l min.- Pickle in 25% HN03 for 2 hours at 20-25 °C- Rinse in desalted water for 30 min.- Rinse in running, desalted water for 5 min.- Brief immersion in hot, desalted water- Dry in air
9.6.4 Final CleaningBefore the final visual inspection, every fuel element is rinsedin alcohol.
10.0 LIST OF REVISIONS
513

Appendix K-3.2
INSPECTION SCHEME
RIS0 NATIONAL LABORATORYRoskilde, Denmark
AbstractAs part of the Danish RERTR Program, three fuel elementswith LEU UoOg-Al fuel and three fuel elements with LEUU3Si2-Al fuel were manufactured by NUKEM for irradiationtesting in the DR-3 reactor at the Risoe National Laboratoryin Denmark. The inspection scheme for the elements withU,OQ-AI fuel is presented here as an illustration only. Theinspection scheme for the elements with U.,Si2-Al fuel wasvery similar. In this example, all document numbers,drawing numbers, and form numbers have been deleted orreplaced with a generic identification.
FUEL ELEMENT DRAWING
Transition Five*
EMrg«ncy Coelinj
Ctnttl S*eli«>
A-B
BEndfittingAdaplti End
UÜI.» moi.
515
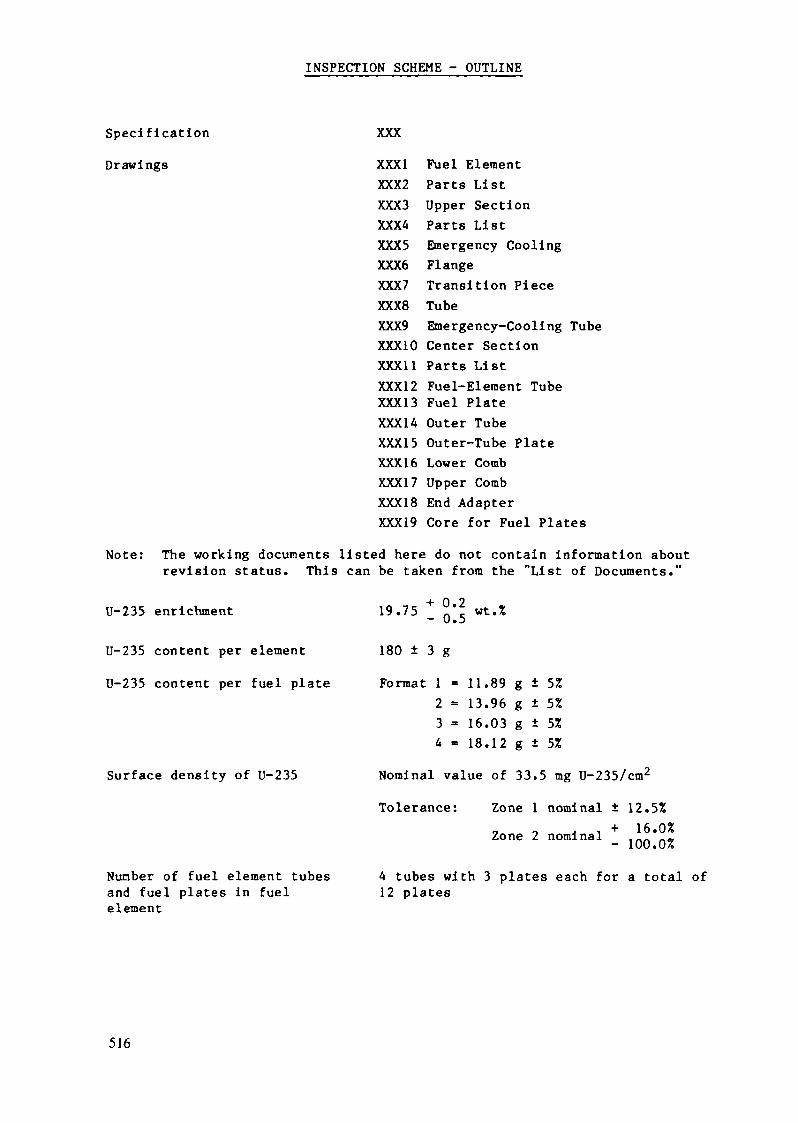
INSPECTION SCHEME - OUTLINE
Specification XXX
Drawings XXXI Fuel ElementXXX2 Parts ListXXX3 Upper SectionXXX4 Parts ListXXX5 Emergency CoolingXXX6 FlangeXXX7 Transition PieceXXX8 TubeXXX9 Emergency-Cooling TubeXXX10 Center SectionXXX11 Parts ListXXXI2 Fuel-Element TubeXXXI3 Fuel PlateXXX14 Outer TubeXXX15 Outer-Tube PlateXXX16 Lower CombXXXI7 Upper CombXXX18 End AdapterXXX19 Core for Fuel Plates
Note: The working documents listed here do not contain information aboutrevision status. This can be taken from the "List of Documents."
U-235 enrichment 19.75 + °"? wt.%"™ U » D
U-235 content per element 180 ± 3 g
U-235 content per fuel plate Format 1 «= 11.89 g ± 5%2 = 13.96 g ± 5%3 = 16.03 g ± 5%4 - 18.12 g ± 5%
Surface density of U-235 Nominal value of 33.5 mg U-235/cm2
Tolerance: Zone 1 nominal ± 12.5%„ o J i + 16.0%Zone 2 nominal _
— 1UU •(j/o
Number of fuel element tubes 4 tubes with 3 plates each for a total ofand fuel plates in fuel 12 plateselement
516

Tests: 1. End Adapter to Test Sheet No. 12. Comb to Test Sheet No. 23. Upper section to Test Sheet No. 3
3.1 Record Form A, Upper Section4. Core to Test Sheet No. 4
4.1. Record Form B, Core for Fuel Plates4.2 Inspection Certificate Form C, Og powder4.3 Inspection Certificate Form D, AI powder
5. Fuel Plate to Test Sheet No. 55.1 Inspection Certificate Form E, Cladding Thickness5.2 Calibration Steps5.3 Inspection Certificate Form F, U Contamination5.4 Record Form G, Chord Length
6. Fuel-Element Tube to Test Sheet No. 66.1 Inspection Certificate Form H, Fuel-Element Tube
7. Outer-Tube Plate to Test Sheet No. 78. Outer Tube to Test Sheet No. 8
8.1 Inspection Certificate Form I, Outer Tube8.2 Inspection Certificate Form J, Weld Seams
9. Center Section to Inspection Certificate Form K9.1 Inspection Certificate Form L, Fuel in the Fuel Element
10. Fuel Element to Inspection Certificate Form M11. Balance of Acceptance to Record Form N
Acceptance records and Inspection Certificates according to DIN 50049 (2 each)for:
Certification of the manufacture and examination of thefuel elements in accordance with the specification.Inspection of the dimensions of the Center Section (Form K).The Enrichment and the U and U-235 contents of Fuel Platesand Fuel Elements (Form L).Inspection of the dimensions of the Fuel Element (Form M).X-ray films of Fuel-Element Tubes (1 copy).Inspection of the Weld Seams (Form J).Testing of the Fuel-Element Tube (Form H).Testing of the Outer Tube (Form I).Testing of the Fuel Plates for contamination withUranium (Form F).
517

Test Equipment:
Verification of the cladding thickness of the FuelPlates (Form E).X-ray films of Fuel Plates (1 copy).Diagrams from the homogeneity tests (1 copy).Surface treatment of the Fuel Plates.Al powder used for the UßOg-Al mixture (Form D).UßOß powder (Form C).Semi-finished products according to the Parts List.Record Form N, Acceptance Record.
1) Reference Gauge (Form X)2) Template (Form P)3) Ring Gauge (Form Q)
4) Holding Device (Form R)
5) Ring Gauge (Form S)6) Testing Probe (Form T)7) Eccentricity Testing Device (Form U)
8) Calibration Gauge (Form V)9) Testing Probe (Form W)
518

IDENTIFICATION FORM
Order No: ..........Contractor Order No:Description: .......
The elements to be manufactured according to thedescription above shall be identified as follows:Element type : ..................................Numbered from .................. to .............
Element type: ..................................
Numbered from .................. to .............Element type: ..................................Numbered from .................. to .............
519

RANDOM SAMPLE PROCEDURE (RSP)
N n
0 - 30 3 0 l
31 - 60 6 0 l
61 - 90 9 0 l91 - 120 12 0 l
If the number of defective items foundin a random sample of n items equals a,the related lot of N items shall be con-sidered as good and shall be accepted.If the number of defective items foundis equal to or greater than r, theentire lot of N items shall be examined.
N: lot sizen: random sample sizea: acceptance numberr: rejection number
520

TEST SHEET HO. 1, END ADAPTER
a«
Drawing No. XXX18 Rev.
Dim.Testing Equipment/
Nominal, mm Test Specification Testing Process
a
b
c
d
e
73 ± 0.1
102.4 - 0.3
1.5 ± 0.1
137.6 ± 0.2
47.6 ± 0.1
micrometer
micrometer
micrometer
slide gauge
Ring Gauge(Form S)
visual
Test Sample Tested BySize, Z QC* p*
Check all dimensionsaccording to drawing
Measure diameter "a"
Measure diameter "b"Measure dimension "c"
Measure dimension "d"
Measure dimension "e"
Check the surface fordesign according todrawing
RSP
100100RSP
100
100
100
'Tested by QC (QC), Production (P)
521
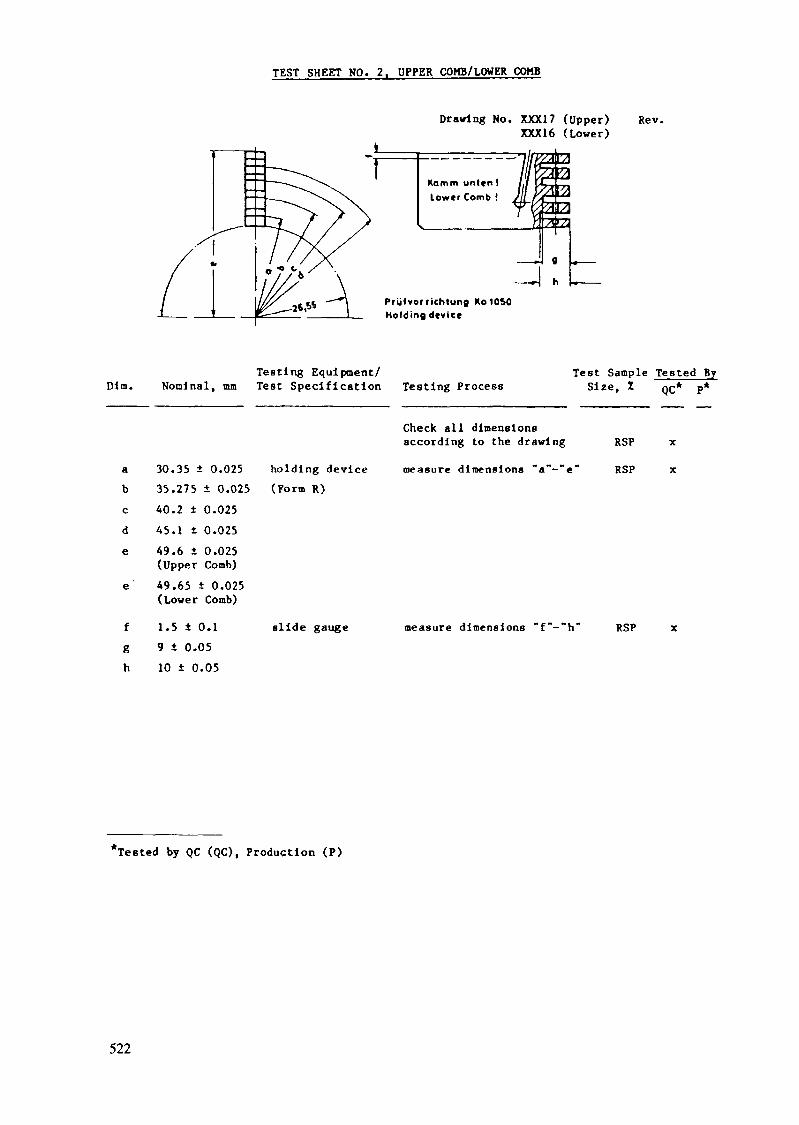
TEST SHEET NO. 2. UPPER COMB/LOWER COMB
Drawing No. XXX17 (upper)XXX16 (Lower)
Rev.
Kamm untvn !lower Comb !
Prutvorrichlung Ko 1050Holding drvlcc
Dim. Nominal, mmTesting Equipment/Test Specification Testing Process
Test Sample Tested BySize, Z QC* p*
a 30.35 ± 0.025b 35.275 ± 0.025c A0.2 ± 0.025d 45.1 ± 0.025e 49.6 ± 0.025
(Upper Comb)e 49.65 ± 0.025
(Lower Comb)f 1.5 ± 0.1g 9 ± 0.05h 10 ± 0.05
holding device(Form R)
Check all dimensionsaccording to the drawing
measure dimensions ~a"-~e"
RSP
RSP
slide gauge measure dimensions "f"-"h" RSP
*Tested by QC (QC), Production (P)
522

TEST SHEET NO. 3. UPPER SECTION
Drawing No. XXX3 Rev.
0,1 mo«.
MO.I max. 0/max 0,3 ma«.
0.1 mom
Dia. Nominal, mmTesting Equipment/Test Specification Testing Process
Test Sample Tested BySize, Z QC* p*
Reference Gauge(Form X)Template (Form P)
Ring Gauge(Form Q)PVC-Probe
Check all dimensionsaccording to the drawingPerformance test onflange (pegs out of 3holes)Inspection of the weldseam diameterInspection of the passage(Inside diameter) at theThermocouple guide tubeon "Z"
Liftlng the Upper Section with the Calibration Gauge (Form Y), inspecthorizontal distances between turning centers.
0.1/0.4/0.20.1 max.
792.3 ± 0.6
Dial Indicator
PVC-Probe3 mm diameter
PVC-Probe3 mm diameter
Slide Gauge
Visual
Check for eccentricity
Check the run-out toler-ances for the "X" and ~Y"faces.Upper surface of thetube Insert shall be 3 mmunder the upper surfaceof the top drill holes.Inspection of thepassage (Inside diameter)at the emergency coolingtubeMeasure length
Inspection of the weld seams
RSP
RSP
RSP
100
100
100
100
100100100
*Tested by QC (QC), Production (P)
523

(0
i
• O B «•-I to 30) 0) 0)3 W TH
u boC C -Htu 11 (0bO-H 3t* O OS<U O H
ol_lo
G>-i o e01 n tu tuCX u U (UO, O -ri t.
CLO!c
Zot-H
S
o:uo,Du
S <U 3t«
X —(0 •e o
§Oo
(UO •-(
T3 B B) <S^ nj M-É 3U (U U 00S W3 3 -H
M >
bfl .C 0)
T-1 AJT3 CC -MO Of D.
01 _u .o oW
B • l ,0e co o o•rt > Mro o a. pu
0) 4l *-*.to 4-1 bo tu o-
tu C BOTJ S i-) 3 B-H <a èi a u«) 11 O O
~^ tu«J 4-1 --bC 03 (fi CLC r-» E<0 D. U uO
7< B Ob. o; b. XH v^
L, .n o
DM Z
<u
a.eou
ctutu
u(Ua.tac
mbc
S.01003ra
l-i JOtU —lC -lC «-i O
00 CBC Oc —T-l *-)s «c01 -n0> Eu nx xE- u
524

TEST SHEET NO. 4. CORE FOR FUEL PLATES
Drawing No. XXXI3 Rev.
• II• '1 •-• —— II ——
II «
I" .—— n —— —i •———————— 1 1 ————— - ~i r
Dim. Nominal, mmTesting Equipment/Test Specification
Balance AnalysisDOC. YYY
Testing ProcessTest Sample Tested BySize, I C* p*
Alternative;
Double Counting-ApparatusDOC. YYYMicrometer
X-ray Film
The U-235 content isdetermined by weighingeach fuel core andmultiplying this valueby the analyzed value ofthe U and U-235 content. 100Determination of the0-235 content by measur-ing the 185-keV charac-teristic radiation. 100
Measure thickness at 5points (see sketch) andrecord mean value. 20Check for homogeneity andpossible Inclusions. 100Record fuel core No., fuelcore weight, D content,and 0-235 content(Fora B) 100
*Tested by QC (QC), Production (P)
525
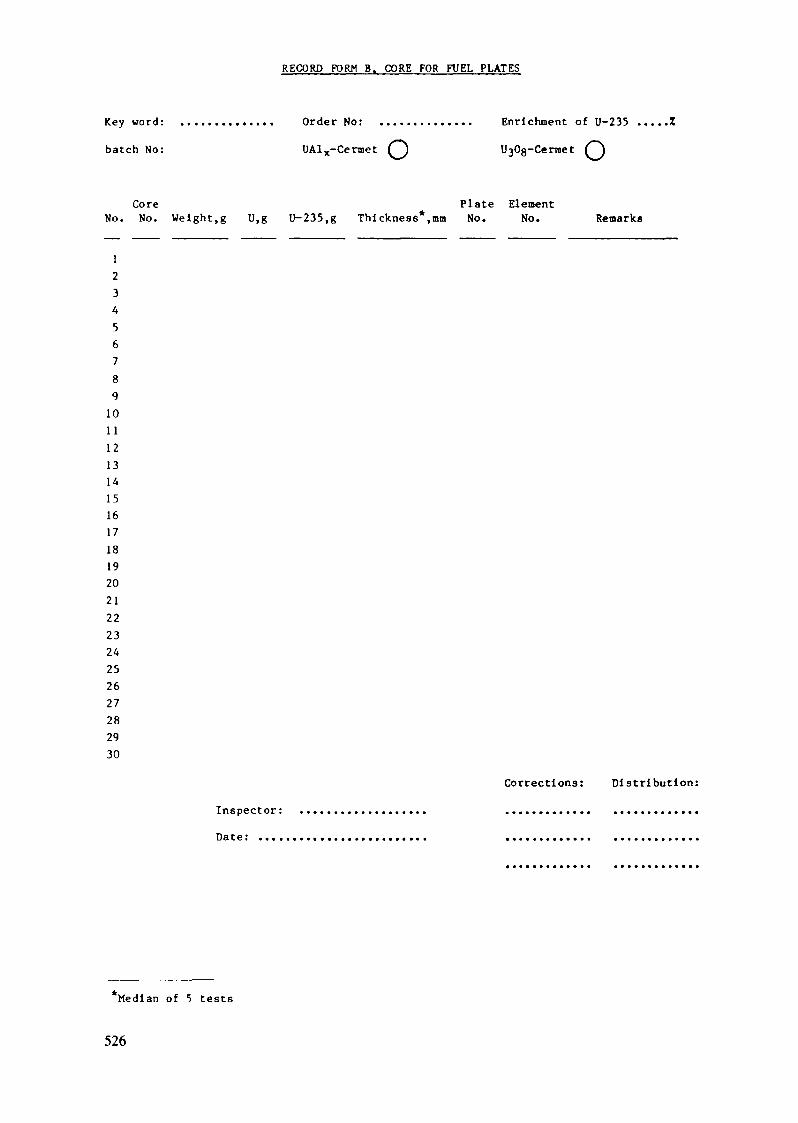
RECORD FORM B. CORE FOR FUEL PLATES
Key word:
batch No:
Order No:
UAlx-Cermet
Enrichment of U-235 .....Z
l^Og-Cermet
Core Plate ElementNo. No. Weight,g U,g U-235,g Thickness*,mm No. No. Remarks
123A56789101112131415161718192021222324252627282930
Corrections: Distribution:
Inspector:
Date: ...,
Median of 5 tests
526

INSPECTION CERTIFICATE FORM C, UßOß POWDER
Impurities
Sieve analysis
wt%
ElementsAlBBaBeCaCdCoCr*CuFe*KLiMgMnNaNi*PSiVFZ*Particle
max., ppm Actual, ppm1002100.2590.53-20-20550520-
10050220150
size Actual, %< 90 urn< 40 ym <_ 25%
Isotope analysis** U-234,nom.act.
U-235. % U-236. % U-238. %
The absolute uncertainty of the U-235 weight concentrationis ...............
Density nominal: 8.0 g/cm3 actual: .......... g/cm3
InspectorWork Inspector
527

INSPECTION CERTIFICATE FORM P. Al POWDER
Purchaser ..........
Purchase Order No. .Contractor Order No.
Chemical Impurities
Particle Size
Date
Charge No. .
Date: ......
Analysis No:
Elements
BCdCoCuFeKLiMgSiTiZn
OthersIndividualTotal
Grain Size
80%
Limit, ppm Results, ppm
10103080
400080
5150
3000200300
3005000
< 125 urn
< 40 urn
Determined by inspection sieving with mesh width125/40 urn.
Manufacturer:
Work Inspector
528

TEST SHEET NO. 5. FUEL PLATE
Drawing No. XXX13 Rev.
Format 1 Format 2ABCDEFGHKL
M
N
min. 590min. 68min. 68min. 2min. 2max. 30
65.3 ± 0.05min. 57.3
1.50 ± 0.05746 ± 0.2Zone 1 min.Zone 2 min.Zone 1 1cZone 2 max.
min.min.min.min.min.max.
75.6 ±min.
1.50 ±746 ±
x" 0.35°0.250.65 ± 0.1.05d
59068682230
0.0567.60.050.2
1
Format 3min. 590min. 68min. 68min. 2min. 2max. 30
85.8 ± 0.05min. 77.8
1.50 ± 0.05746 ± 0.2
Format 4min. 590min. 68min. 68min. 2min. 2max. 30
96.1 ± 0.05min. 88.1
1.50 ± 0.05746 ± 0.2
aB - C ± 13,41bD - E £ 11,61cln Zone 1, individual grains may penetrate into the cladding layer of
0.25 or 0.30 mm, provided that the min. average of 0.35 mm is guaranteed.max. of 1.05 mm for N in Zone 2 is provided that the min. of 0.25 mm
for M in Zone 2 is guaranteed.
Surface defects with a depth of at most 0.1 mm are acceptable.
529

TEST SHEET NO. 5, FUEL PLATE (CONT.)
Dim. Nominal, mmTesting Equipment/Test Specification
Drawing No. XXXI3
Testing Process
Rev.
Test Sample Tested BySize, Z QC-
Fuel plate not bent
No blisters Heating l h425 "CDOC. YYY
at
Nominal:33.5 mgU-235/cm2
Tolerance:Zone 1nominal ±12.5XZone 2
+ 16X
X-ray system andtemplateDOC. YYYX-ray systemcalibration-stepsDOC. YYY
noml nal -100%D/E
AB/C
HKGLM
min. 2D - E < |1.6min. 590min. 68B - C < |3.4see Table1.51 ± 0.05see Table746 ± 0.2min. le 0.35(Zone 1)min. 0.25(Zone 2)
< 10 ugÛ-235/perplatePlate No.on convexside
< 0 . 1 mmdeep
X-ray film andtemplate
Measuring deviceDOC. YYY
MicroscopeDOC. YYY
Fuel plate bentCountingApparatusDOC. YYYSlide Gauge
Visual light-sectionmlcrocscopeDOC. YYY
Visual evaluation forbond defects (metallur-gical bond) after theheating.X-ray and center
Inspection of the Udistribution by means ofX-ray absorption.(One line longltudlnalyper plate.)
Inspection of theInternal geometry
100100
RSP
RSP
Inspection of the outergeometry RSP
Examine cladding thicknessby means of sections(Inspection CertificateForm E).
Inspection Certificate(Form F).
Measure length (Form G).Check for plate No. position. 100
Surface inspection and, Ifnecessary, measuring ofsurface defects 100
*Tested by QC (QC), Production (P)
530
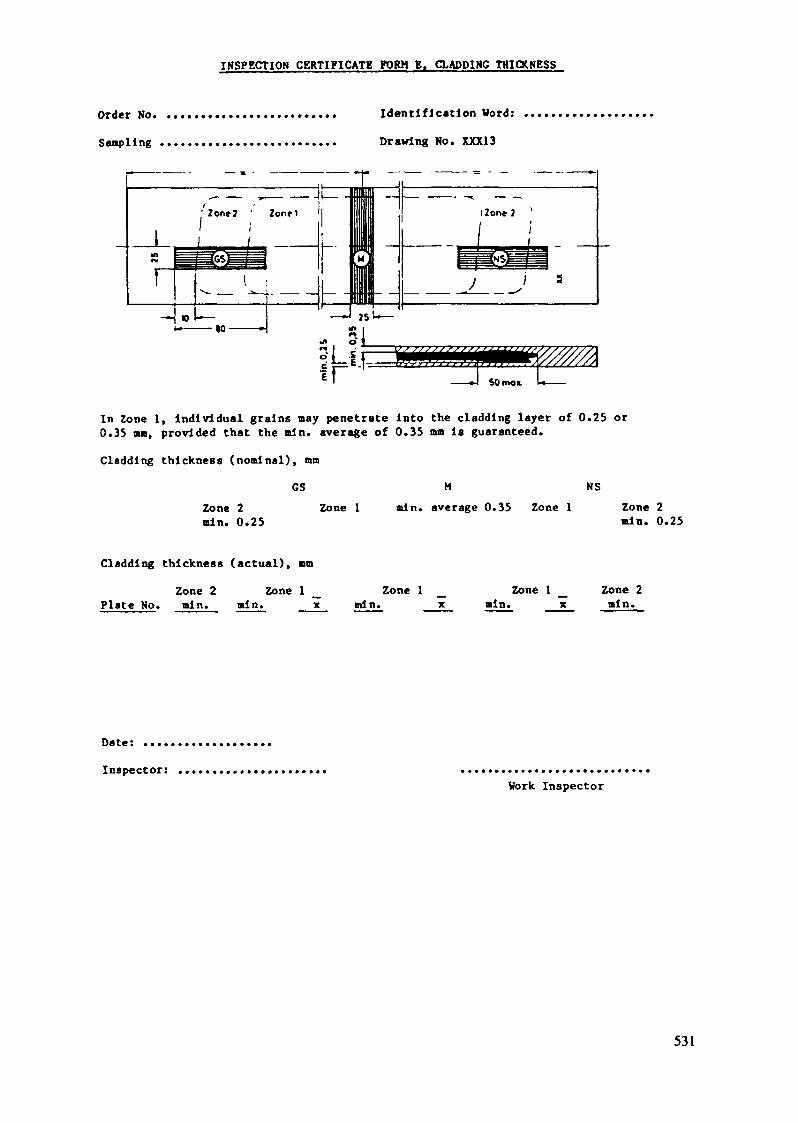
INSPECTION CERTIFICATE FORM E. CLAPPING THICKNESS
Order No.
Saapling ,
Identification Word:
Drawing No. XXX13
In Zone 1, individual grains may penetrate Into the cladding layer of 0.25 or0.35 mm, provided that the mln. average of 0.35 mm Is guaranteed.
Cladding thickness (nominal), mm
GS M NS
Zone 2 Zone 1 mln. average 0.35 Zone 1mln. 0.25
Zone 2mln. 0.25
Cladding thickness (actual), mmZone 2 Zone 1 _ Zone 1 _ Zone 1 _ Zone 2
Plate No. mln. mln. x mln. x mln. x mln.
Date: .....Inspector:
Work Inspector
531
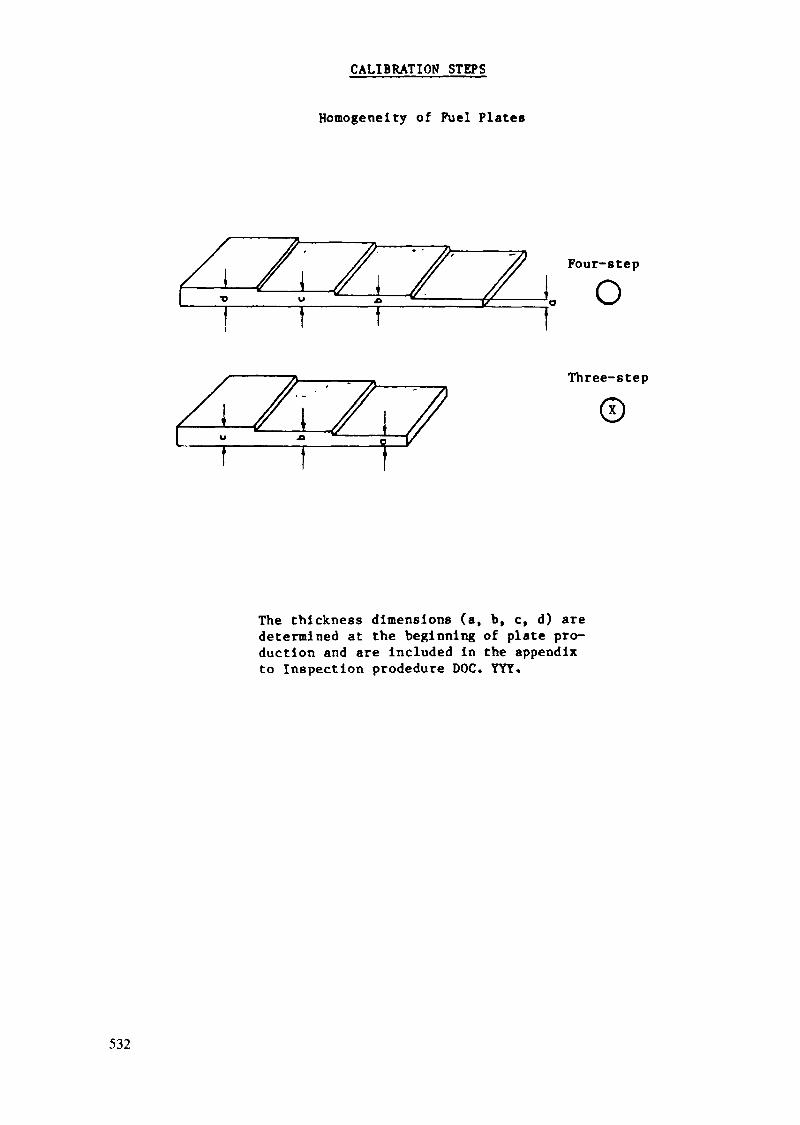
CALIBRATION STEPS
Homogeneity of Fuel Plates
Four-stepOThree-step
The thickness dimensions (a, b, c, d) aredetermined at the beginning of plate pro-duction and are included in the appendixto Inspection prodedure DOC. YYY.
532

INSPECTION CERTIFICATE FORM F, f CONTA>- I NATION
Places (~) Tubes Fuel E lements
Order "Jo. ................ Iden t i f i ca t ion Word ............... .......I U-;
S p e c i f i c a t i o n No. ................. R e q u i r e m e n t ...........................
Inspec t ion sys t em: large-area counter 810 crcz Ca l ib ra t i on plate 7.2 pg U-235 W o r k i n g vo l taRc ........V.V
Plate No.QCal ib ra t ion
Tube No.Q UAlj/UjOg- plate Number ReverseUXS1„ Zero rate, Count ra te side side Result :
Type** Elenent No.Q Charge No. pulses/nin- pulses/nln. pulses/mln. pulses/oln. * ug U-235 Date
InspectorWork Inspector
I - Inner Plate, 0 « Outer Plate
533

RECORD FORM G. CHORD LENGTH
part 1 - 55.0 - 55.5 am2 - 63.5 - 64.0 mm3 - 72.0 - 72.5 mm4 - 80.5 - 81.0 mm
Outer Cube • 88.3 - 88.7 mm
Part Plate No. Numb«rside, mm End, mm Part Plate No. Nuaberslde, am End,
Date/Inspector
534

TEST SHEET NO. 6. FUEL-ELEMENT TUBE
ul 1~i n~y /. ———————— » .... — .... —————— j
part Diameter (D)4 92.9-93.53 83.1-83.72 73.3-73.91 63.5-64.1
Drawing No. XXX12 Rev.
**Inspection Certificate Form H
Testing Equipment/Dim. Nominal, mm Test Specification Testing Process
Test Sample Tested BySize, X QC* p*
666.0 •«• 0.1- 0.4
C 1.5 ± 0.04
93.2 ± 0.383.4 ± 0.373.6 ± 0.363.8 ± 0.3max. 0.3
Defects< 0.1 mmdeep
Slide Gauge
Wall thicknessMicrometer
Slide Gauge
Measuring PlateSensor Gauge
Visual
Visual, light-sectionMicroscopeX-ray film
Balance
Measure Length
Measure wall thickness(3 x top, 3 x bottom)Measure diameter "D"(4 x)**
**
Determine max. on edge**
100
100
100
100
Inspection of the weld seam 100
Surface Inspection fordefects and tubeidentification 100Inspection of the weld seamquality and dimensions.Meat/weld seam min. 5Determine the tube weight(Form H) 100
*Tested by QC (QC), Production (P)
535
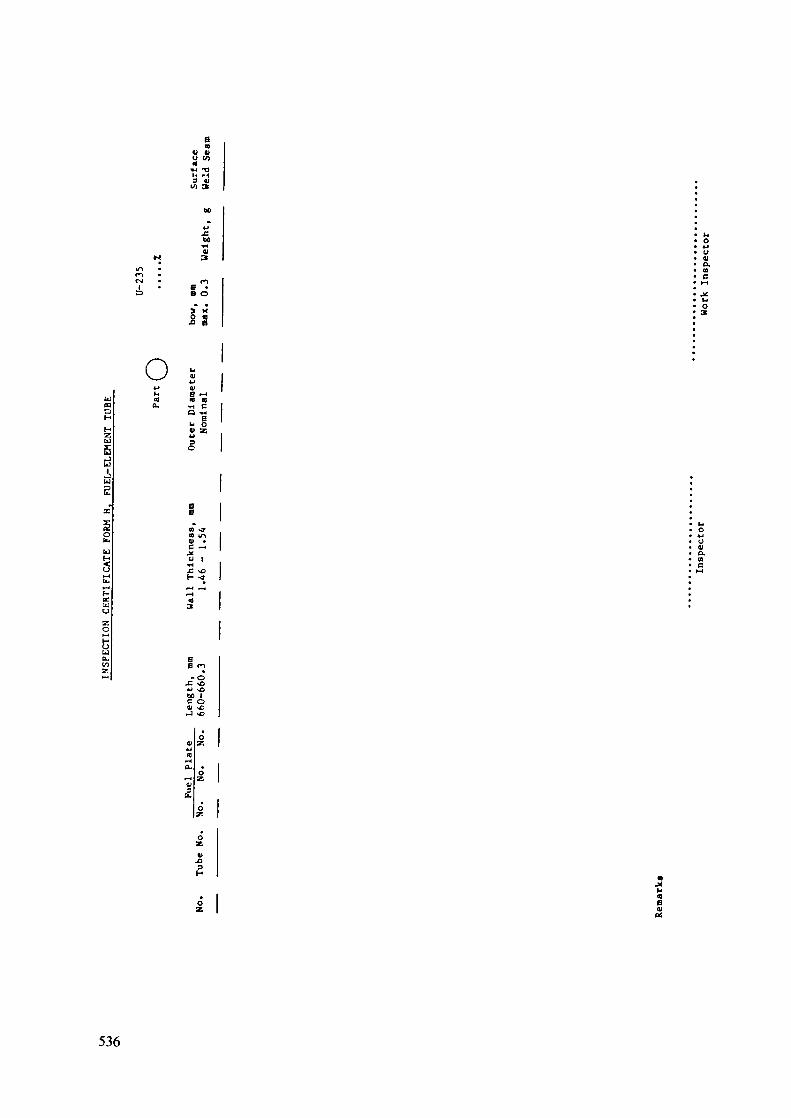
f.M ou
u«o.aaiöli
O
zu£-Jut.
•H CO -"
Bb O«l Z
<C
suozo
CO IA01 .B —JiU l
^H£ vOl- -I
uM
00 lC O
031>H lO. l
S.
536

TEST SHEET NO. 7, OUTER-TUBE PLATE
Drawing No. XXX15 Rev.
Testing Equipment/ Test Sample Tested B?Dim.
a
b
c
Nominal, mm
1.51 ± 0.03
105.9 ± 0.1
860 ± 0.5
Test Specification
Plate not bent
Micrometer
Slide Gauge
Slide Gauge
Plate bent
Testing Process Size, Z QC* p*
Measure thickness RSP x
Measure width RSP x
Measure length RSP x
convex slide Visual
88.3 - 88.7 Slide Gauge
Check for plate No.position 100
Measure dimension "S" andrecord results(Record Form G) 100
*Tested by QC (QC), Production (P)
537
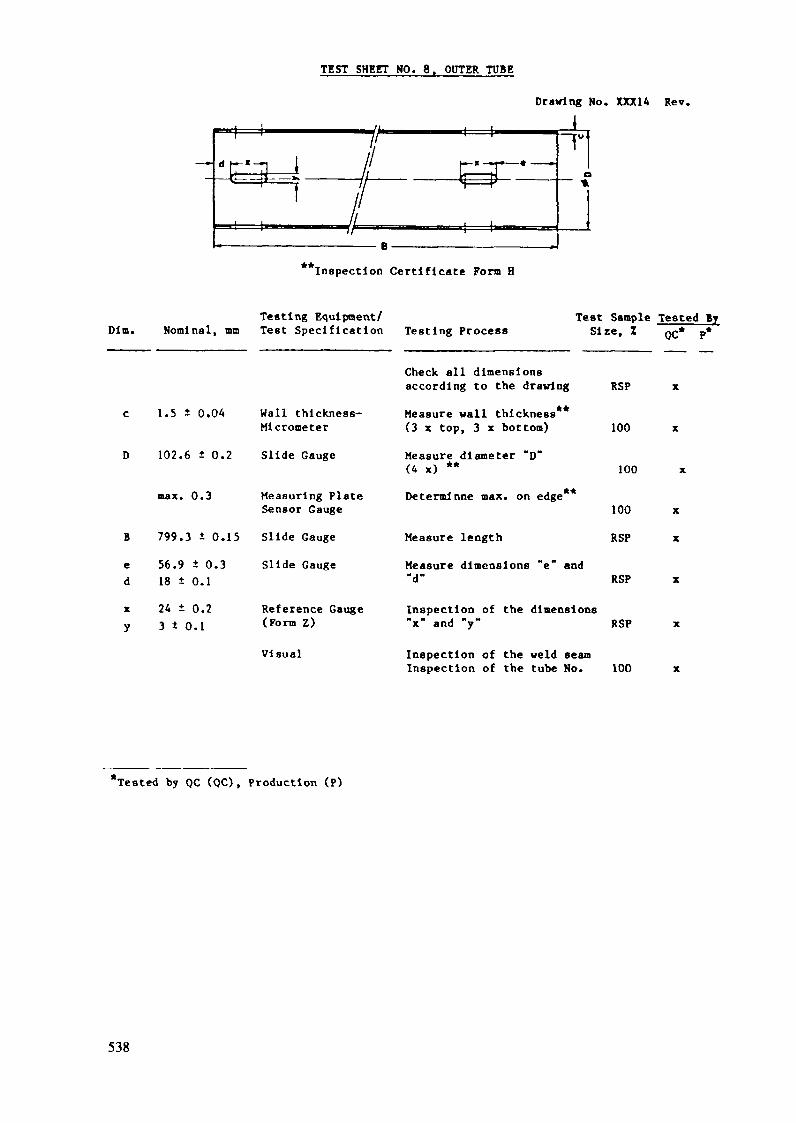
TEST SHEET MO. 8. OPTER TUBE
Drawing No. XXX14 Rev.
TT 1 /-*-*! / t=
•• ——— « ———— »
• m ———————————————————————————————— B . . . . . , . _
o
1**Inspection Certificate Fora H
Testing Equipment/Dim. Nominal, mm Test Specification Testing Process
Test Sample Tested By
xy
1.5 ± 0.04 Wall thickness-Micrometer
102.6 ± 0.2 Slide Gauge
max. 0.3 Measuring PlateSensor Gauge
B 799.3 i 0.15 Slide Gauge
56.9 ± 0.318 ± 0.1
24 ± 0.23 ± 0.1
Slide Gauge
Reference Gauge(Form Z)
Visual
Check all dimensionsaccording to the drawing
Measure wall thickness(3 x top, 3 x bottom)
Measure diameter "D"(4 x)
**
**
Determinne max. on edge
Measure length
Size, I
RSP
100
100
100
RSP
QC* P*
Measure dimensions "e" and"d" RSP
Inspection of the dimensions"x" and "y" RSP
Inspection of the weld seamInspection of the tube No. 100
*Tested by QC (QC), Production (P)
538
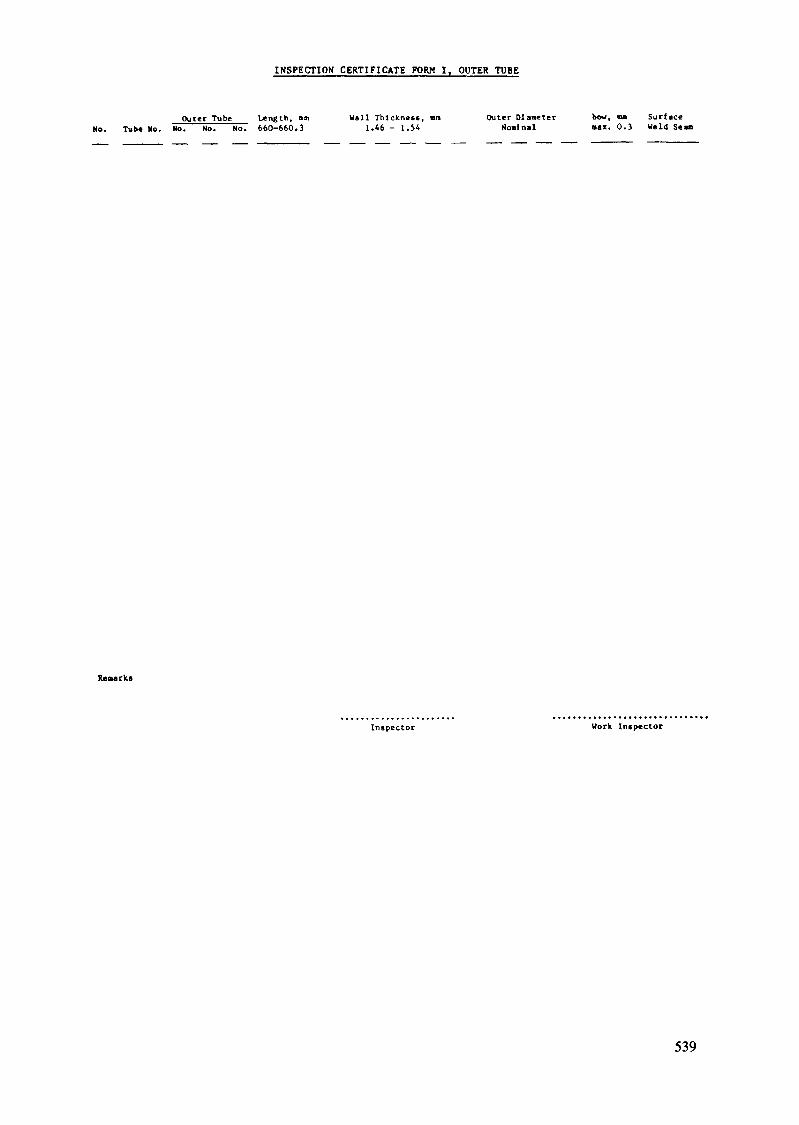
INSPECTION CERTIFICATE FORM I. OUTER TUBE
Outer Tube Length, »n Wal l Thickness, mm Outer Diameter bow. m> SurfaceTub« No. thTI Sol NOT 660-660.3 1.46 - 1.54 Nominal mn. 0.3 Weld Sea
Renarka
Inspector Work Inspector
539
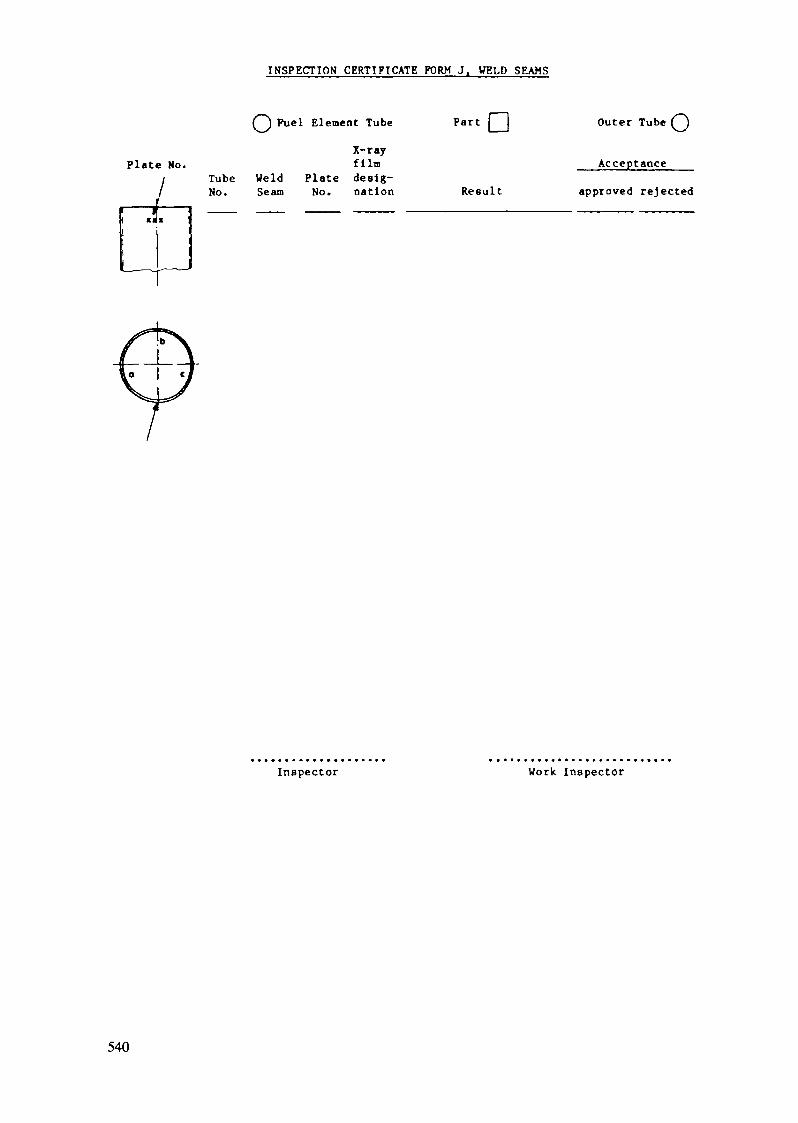
INSPECTION CERTIFICATE FORM J. UELD SEAMS
oFuel Element Tube
Plate No.TubeNo.
WeldSeam
X-rayfilm
Plate desig-No. nation
Part
Result
Outer Tube
Acceptance
approved rejected
Inspector Work Inspector
540
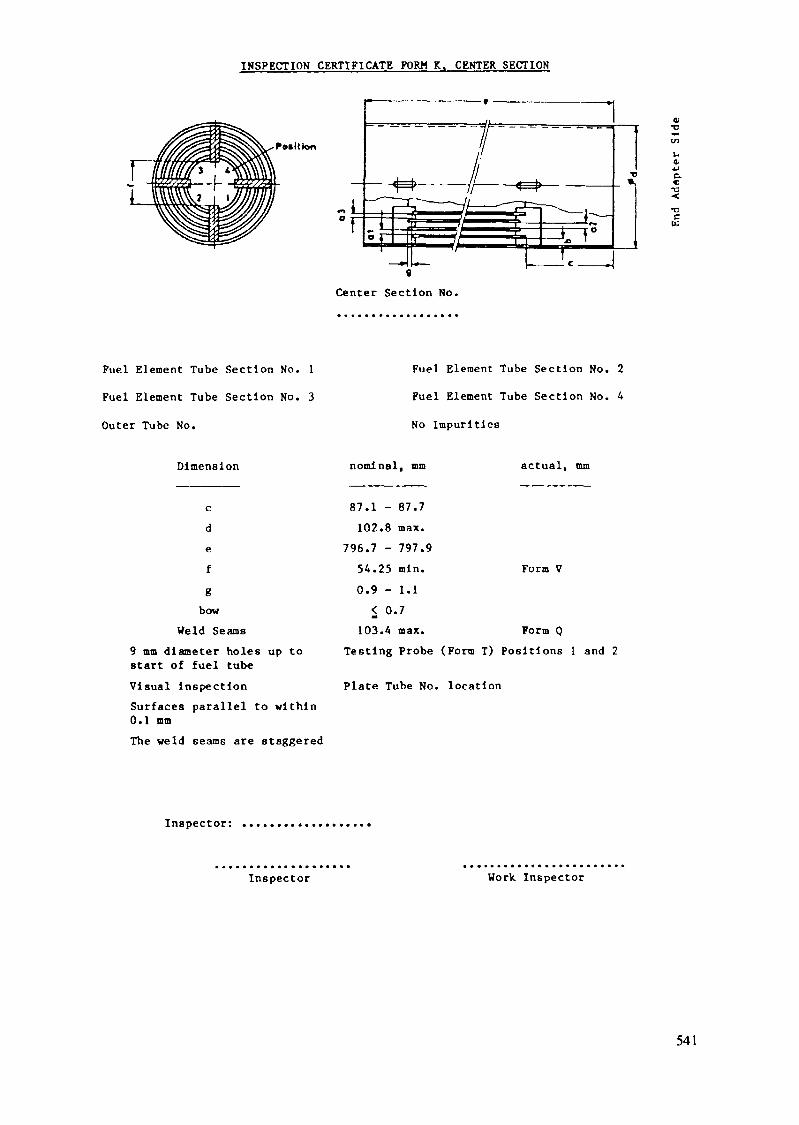
INSPECTION CERTIFICATE FORM K. CENTER SECTION
Position
01•c
•aCW
Center Section No.
Fuel Element Tube Section No. 1
Fuel Element Tube Section No. 3
Outer Tube No.
Fuel Element Tube Section No. 2
Fuel Element Tube Section No. 4No Impurities
Dimension
cdefgbow
Weld Seams9 mm diameter holes up tostart of fuel tubeVisual InspectionSurfaces parallel to within0.1 mmThe weld seams are staggered
nominal, mm actual, mm
87.1 - 87.7102.8 max.
796.7 - 797.954.25 min. Form V0.9 - 1.1< 0.7
103.A max. Form QTesting Probe (Form T) Positions 1 and 2
Plate Tube No. location
Inspector:
Inspector Work Inspector
541

INSPECTION CERTIFICATE FORM L. FUEL IN FUEL ELEMENT
Nominal U-235 Content/Center Section: ......gCenter Section No.
Nominal U-235 Content/Plate: ......g
U-235 U Total TubeU Enrlchm., Content, to Al, Weight,
Pos. Plate No. Core No. Charge Content Z g Z g
Tube Part No. 1
a _______ _____ ____b ______ ______ _____c _________ ______ ____
Total
Tube Part No. 2
a __________ _____ ____
b _______ ______ ____c _______ _________ ____
Total
Tube Part No. 3
a _______
b _______c
Total
Tube Part No. k ................
abc
Total
Average EnrichmentTotal content In the Center Section
Inspector Work Inspector
542
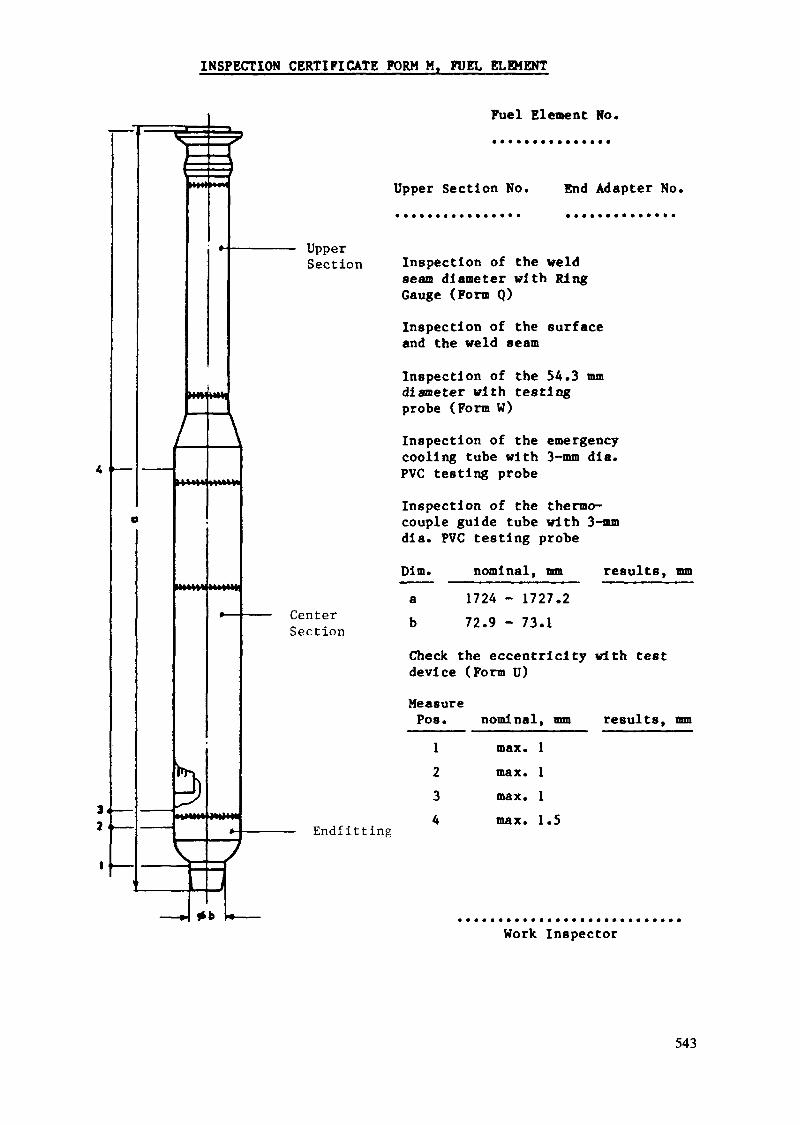
INSPECTION CERTIFICATE FORM Mt FUEL ELEMENT
**»•
«M
«MM >»MH
3>*MM<
UpperSection
\MMM*
mi»»
*b
CenterSection
Fuel Element No.
Upper Section No. End Adapter No,
Inspection of the weldseam diameter with RingGauge (Form Q)Inspection of the surfaceand the weld seamInspection of the 54.3 mmdiameter with testingprobe (Form W)Inspection of the emergencycooling tube with 3-mm dla.PVC testing probeInspection of the thermo-couple guide tube with 3-mmdia. PVC testing probe
Dim. nominal, mma 1724 - 1727.2b 72.9 - 73.1
results, mm
Check the eccentricity with testdevice (Form U)MeasurePos. nominal, mm results, mm
Endfitting
1234
max. 1max. 1max. 1max. 1.5
Work Inspector
543
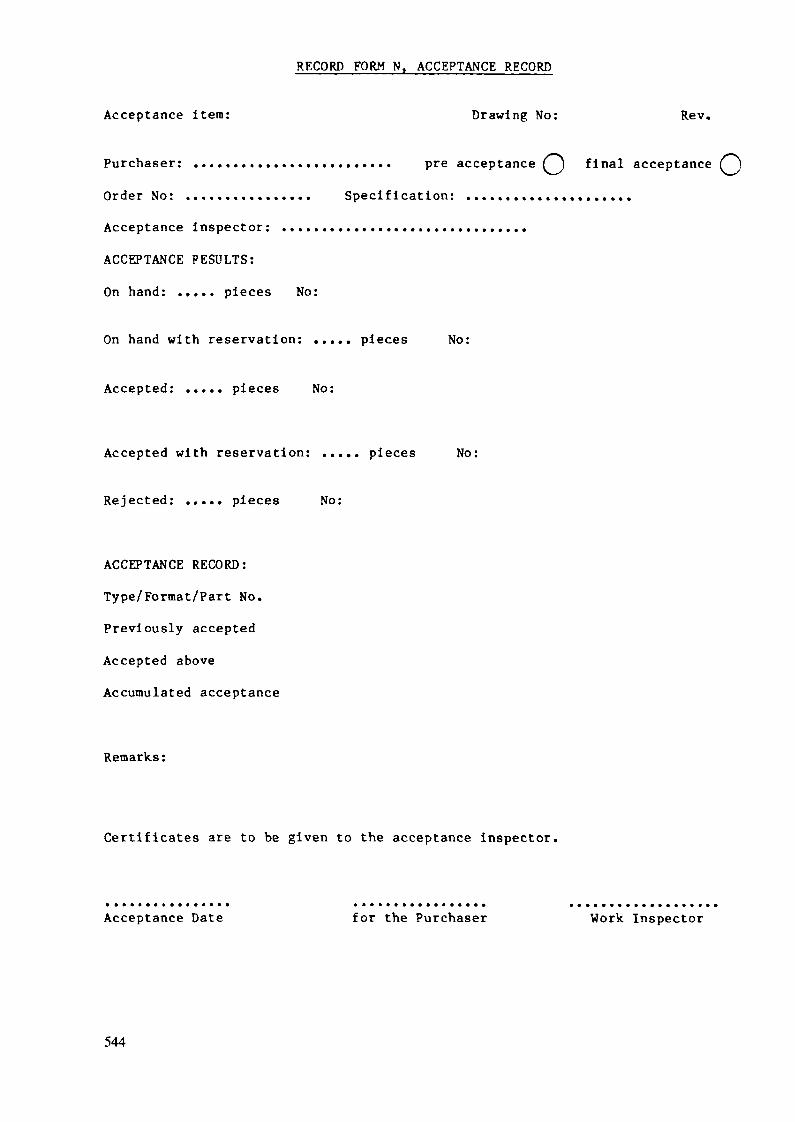
RECORD FORM N. ACCEPTANCE RECORD
Acceptance item: Drawing No: Rev.
Purchaser: ......................... pre acceptance () final acceptance^)
Order No: ................ Specification: .....................Acceptance inspector : ...............................
ACCEPTANCE PESULTS:
On hand: ..... pieces No:
On hand with reservation: ..... pieces No:
Accepted: ..... pieces No:
Accepted with reservation: ..... pieces No:
Rejected: ..... pieces No:
ACCEPTANCE RECORD:
Type/Format/Part No.Previously accepted
Accepted aboveAccumulated acceptance
Remarks:
Certificates are to be given to the acceptance inspector.
Acceptance Date for the Purchaser Work Inspector
544

- T5 I
10*
90»
4W
545

*56-
:76.1*0.1
546
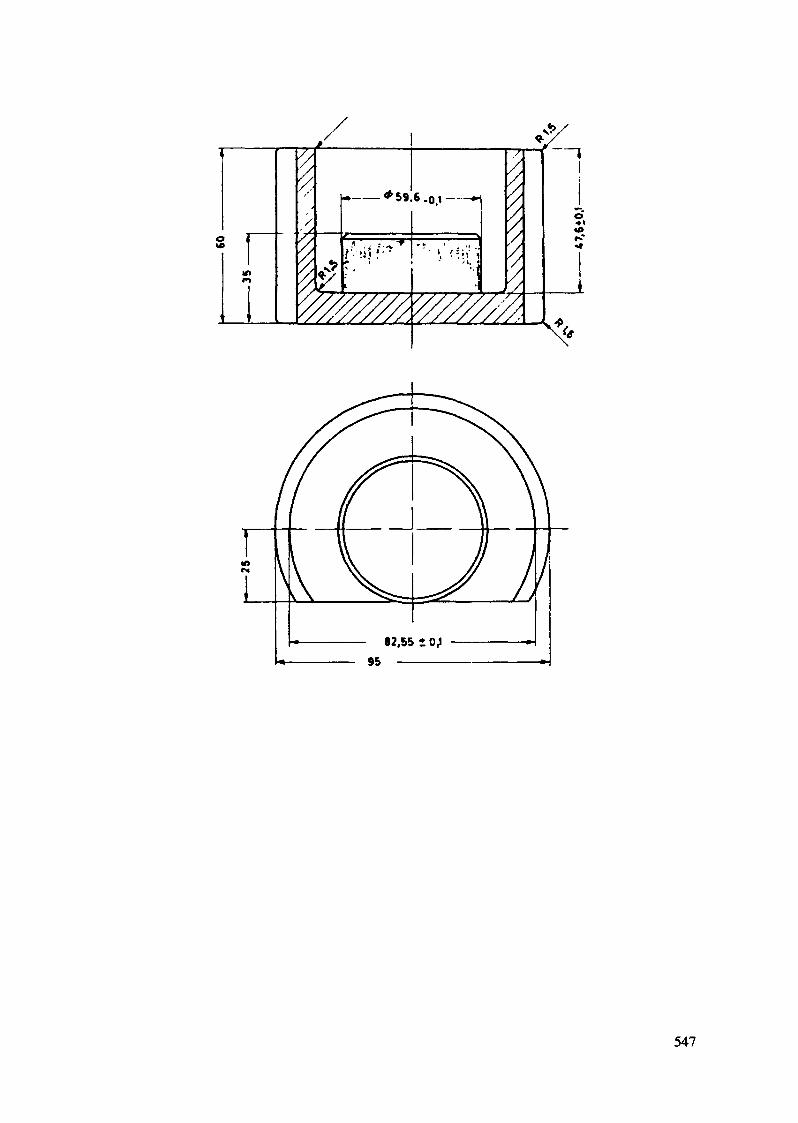
rin
}*/
-,ML
W///A
6 .0.1 —— "
v k t
• • i , 5 ; ,; -
\y////////.
<
«••c4Ur-«i
k-
547
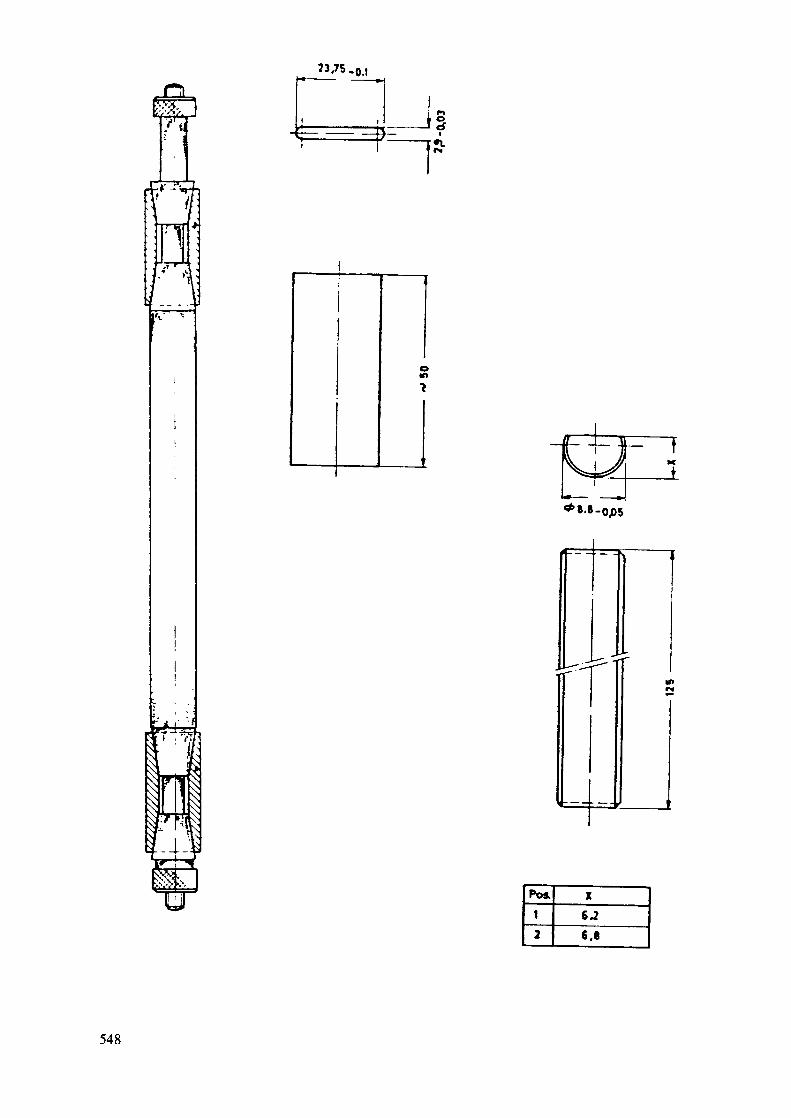
/ u 1 1 1"»s1 — 1
Poi6.2TT
548

4*
of-
10
o"«l
l
r
'20l
549

oo
1*0.15.
•
550
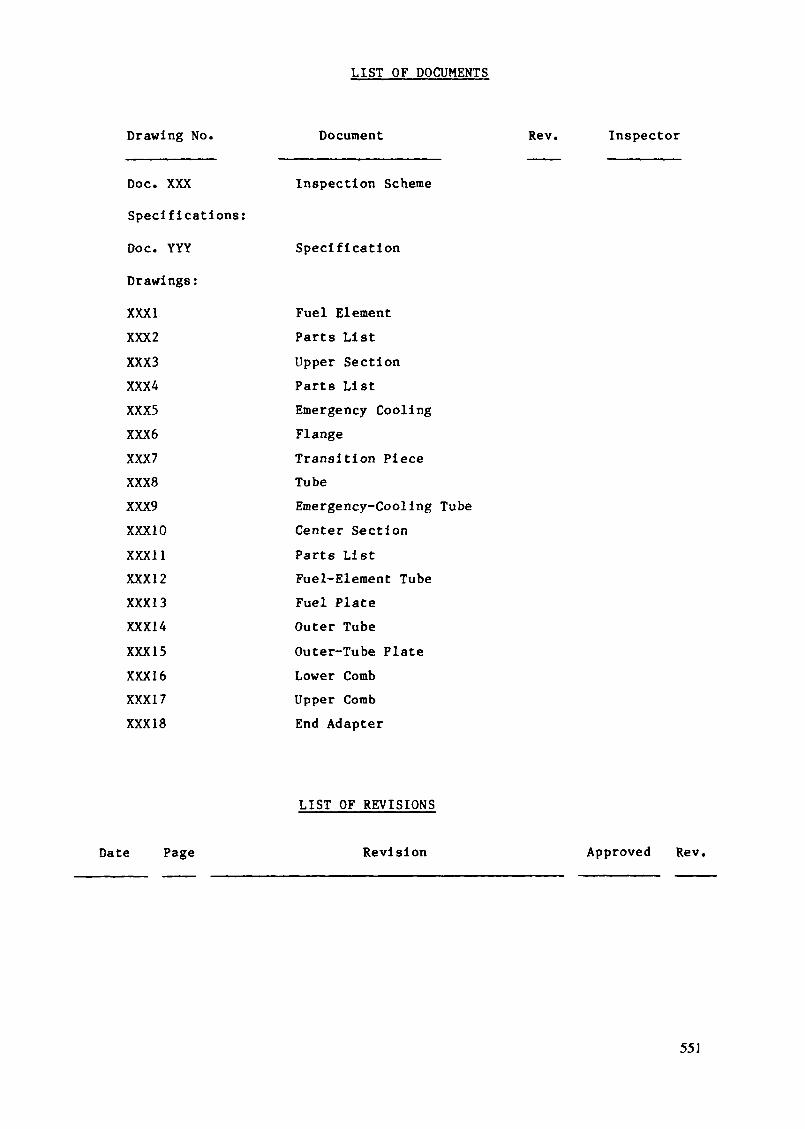
LIST OF DOCUMENTS
Drawing No.
Doc. XXXSpecifications:Doc. YYY
Drawings:XXXIXXX 2XXX3XXX4XXX5XXX6XXX7XXX8XXX9XXX10XXXI1XXXI2XXX13XXX14XXX15XXXI6XXX17XXX18
Document Rev. Inspector
Inspection Scheme
Specification
Fuel ElementParts ListUpper SectionParts ListEmergency CoolingFlangeTransition PieceTubeEmergency-Cooling TubeCenter SectionParts ListFuel-Element TubeFuel PlateOuter TubeOuter-Tube PlateLower CombUpper CombEnd Adapter
Date Page
LIST OF REVISIONS
Revision Approved Rev.
551

Appendix K-4
SPECIFICATIONS FOR FUEL PLATESWITH LEU U3SirAl FUELFOR THE OAK RIDGE RESEARCH REACTOR
ARGONNE NATIONAL LABORATORYArgonne, Illinois
OAK RIDGE NATIONAL LABORATORYOak Ridge, Tennessee
United States of America
Abstract
As part of the RERTR Program, a whole-core demonstration Inthe Oak Ridge Research Reactor using LEU U,Si--Al dispersionfuel began In December 1985 and was completed in March 1987.This specification describes the fabrication, inspection,and quality assurance provisions of the fuel plates for thefuel elements and shim rod fuel sections that were used inthe demonstration.
1.0 SCOPE
1.1 This specification covers the fabrication, inspection, and qualityassurance provisions of aluminum-clad fuel plates containing low-enricheduranium (LEU) for fuel elements and shim rod fuel sections for the Oak RidgeResearch Reactor (ORR), a light-water moderated and cooled, 30-MW(th) nuclearreactor. Each fuel-element grouping of fuel plates will contain 17 short and2 long plates, and each shim-rod-fuel-section grouping of fuel plates willcontain 15 short plates. The fuel plates will contain 235jj fuei in the formof an aluminum-clad u"3Si2-alualnum dispersion. The cladding shall be metallurgi-cally bonded to the fuel core, and the fuel core shall be hermetically sealed.
2.0 APPLICABLE DOCUMENTS
2.1 Applicable Standards
The following documents form a part of this specification except asmodified by this specification. Where there is a conflict between the docu-ments cited and the latest revisions thereof, the Contractor shall notifyArgonne National Laboratory (ANL), hereinafter referred to as the Laboratory,of the conflict and use the latest revision unless otherwise directed by theLaboratory. NOTE; Contractors located outside the United States territorymay submit standards comparable to the U.S. documents listed below to theLaboratory for approval as alternates.
2.1.1 ORNL Drawings
M-11495-OR-004-E Fuel Plate Details, ORR Fuel ElementsM-11495-OR-012-E ORR Shim Rod Fuel Section, Fuel Plate
Details
553

2.1.2 American Society for Testing and Materials Standards
ASTM-B209-70 Aluminum Alloy Sheet and PlateASTM-B214-76 Method of Test for Sieve-Analysis of
Granular Metal Powders
2.1.3 American Welding Society Standards
AWS-A5.10-69 Aluminum and Aluminum-AlloyWelding Rods and Bare Electrodes
2.1.4 Argonne Nat ional Laboratory Documents
AQR-001 Quali ty Verif icat ion Program Requirements
A0004-1020-SA-00 Specification for Low-Enriched UraniumMetal for 0ranium-Aluminide andUranium-Si Heide Reactor Fuel Elements
3.0 TECHNICAL REQUIREMENTS
3.1 Materials
The Contractor shall provide a certified report of the chemical analysisof each material listed showing confonnance to its respective requirements. TheContractor shall also provide a certified report of the chemical and isotopicanalysis of each lot of 03812- In addition to other requirements, all materialsspecified in Paragraphs 3.1.4 and 3.1.5 shall be certified by the Contractor tocontain less than 10 pptn boron, 80 ppm cadmium, and 80 ppm lithium. The quan-tities of these impurities (boron, cadmium, and lithium) in the finished plateshall not exceed those values.
3.1.1 uranium Metal
The U.S. Department of Energy shall provide the uranium metalneeded for the fabrication. The 235y enrichment of the uranium metal shallbe 19.75 +_ 0.2 wtZ. The uranium metal shall meet the technical requirements ofANL specification A0004-1020-SA-00 except for carbon impurity content, which shallbe less than 350 ppm by weight.
3.1.2 Uranium-Sllicide Powder
3.1.2.1 Uranium suicide, with U3$i2 as the primary constituent,shall be produced by melting together uranium metal and high-purity silicon. Thesilicon content of the uranium silicide, hereinafter called U3S12, shall be
+ 0 47.5 * . wtZ. It is desirable for the silicon content to be close to 7.5 wtZ,but in no case should it be less than 7.4 wtZ. Except for impurities, whose limitsare specified in Subparagraph 3.1.2.2, the balance of the U3S12 shall be uranium.
3.1.2.2 An analysis shall be required for each lot of 03812-The impurities In the U3S12 shall not exceed the limits specified in Table 1.
3.1.2.3 As used in the fuel core, the U3S12 powder shall be-100 + 325 mesh (44 to 149 pm) and shall not contain more than 25Z of -325 meshparticles, as determined in a standard screening test (ASTM B214-76).
3.1.2.4 A sample wi th a alnireum weight of 10 g shall be obtainedf rom each lot of 03812 by the Contractor and held at the Contractor 's plantfor the Laboratory's use. At the time of final delivery, all samples not calledfor will be considered part of the Contractor's scrap.
554

Table 1. Maximum Impurity Levels for 03512 (ppm)
AlBCCd
60010
100010
CoCuFe+NlH
1080
1000200
LIN0Zn
1050070001000
Other Elements Individual 500
Total 2500
3.1.2.S The Contractor shall obtain an Independent Isotopicanalysis of each lot of 1)3512 and shall provide to the Laboratory a copy ofthe results.
3.1.3 Aluminum Powder
3.1.3.1 All aluminum powder shall be atomized spheroidalparticles. One hundred percent of the powder shall pass through a 100 mesh(1A9 pm) U.S. Standard screen with 802 passing through a 325 mesh (44 pm) U.S.Standard screen.
3.1.3.2 The chemical composition of the aluminum powder shallbe within the limits listed in Table 2.
Table 2. Composition Limits for Al Powder (wtX)
BCdCoCu
0.001 max0.001 max0.001 max0.008 max
FeLiKgSi
0.400 max0.001 max0.015 max0.300 max
TiZnAl
0.030 max-0.030 max99.500 min
3.1.4 Aluminum Plate and Sheet
The aluminum for the core frames and cladding shall conform toASTM specification B209-70, alloy 6061-0. The core frames shall be one piece;frames made of multiple pieces welded together are not acceptable.
3.1.5 Aluminum Welding Rods
Aluminum welding rods shall conform to AWS-A5.10-69, Type ER-4043.
3.2 Mechanical Requirements
3.2.1 Fuel Core Fabrication
The fuel core shall consist of 19.75Z-enrlched 03512 powderdispersed in aluminum powder. The fuel core shall be fabricated according tostandard powder-metallurgical, roll-bonding techniques, modified If necessary,such that excessive oxidation of the fuel core prior to the f i rs t hot rollingpass does not occur. The Contractor shall provide to the Laboratory a wri t tenprocedure for the initial hot rolling step which describes the method used toprevent excessive oxidation or shall provide wri t ten certification that theprocedure used is the same as that used previously to produce similar Ö3S12-A1test elements for the ORR.
555
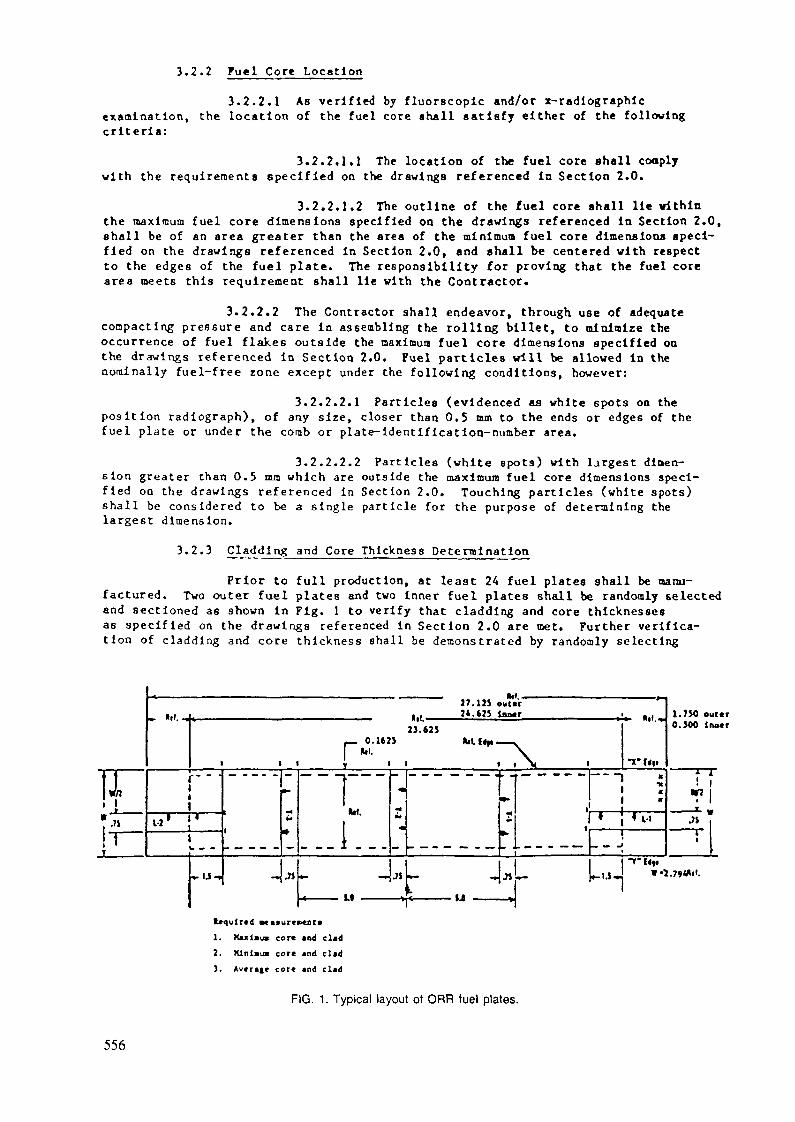
3.2.2 fuel Core Location
3.2.2.1 As verif ied by fluorscopic and/or r-radiographicexamination, the location of the fuel core shall satisfy either of the followingcriteria:
3.2.2.1.1 The location of the fuel core shall couplywi th the requ i rements specified on the drawings referenced in Section 2.0.
3.2.2.1.2 The outline of the fuel core shall lie withinthe maximum fuel core dimensions specified on the drawings referenced in Section 2.0,shall be of an area greater than the area of the minimum fuel core dimensions speci-fied on the drawings referenced in Section 2.0, and shall be centered with respectto the edges of the fuel plate. The responsibility for proving that the fuel corearea meets this requirement shall lie with the Contractor.
3.2.2.2 The Contractor shall endeavor, through use of adequatecompacting pressure and care in assembling the rolling billet, to minimize theoccurrence of fuel flakes outside the maximum fuel core dimensions specified onthe drawings referenced in Section 2.0. Fuel particles will be allowed in thenominally fuel-f ree rone except under the following conditions, however:
3.2.2.2.1 Particles (evidenced as white spots on theposition radiograph), of any size, closer than 0.5 mm to the ends or edges of thef u e l plate or under the comb or plate-identification-number area.
3.2.2.2.2 Particles (white spots) with largest dinen-sion greater than 0.5 mm which are outside the maximum fuel core dimensions speci-f ied on the drawings referenced in Section 2.0. Touching particles (white spots)shall be considered to be a single particle for the purpose of determining thelargest dimension.
3.2.3 Cladding and Core Thickness Determination
Prior to ful l production, at least 24 fuel plates shall be manu-factured. Two outer fuel plates and two inner fuel plates shall be randomly selectedand sectioned as shown in Fig. 1 to verify that cladding and core thicknessesas specified on the drawings referenced in Section 2.0 are met. Further verifica-tion of cladding and core thickness shall be demonst ra ted by randomly selecting
!Jr"! 1»
.. III. ^L ... ., . .
_ 0.1623I W -
1 I I Y ' '
f ~ '\11
u» }'
«- IJ-«
•-
*.2»jj
M.
I•- •*
4 1.9
•9
•4M
«
JÎ
17. 12) out« "„ | (. 2«. «25 Inner ,. . .
J3.425kilt* —— .
i l \ "
*" •»
'•-'I "
•»
•4
Vf «It
- — ——\ :. * * u• —————— '
3Lu.
1.750 outer0.500 iruxr
i ;?i— *• «Mi \}-run
• •5.794"''.
1. KuiauB cor* aod clad2. HinlauB cor« and clad3. Avcraft cor« and clad
FIG. 1. Typical layout of ORR fuel plates.
556

one fue l plate f rom each 100 fuel plates processed. (A plate which has beenrejected for reasons not affect ing the cladding and core dimensions may beused for this determination.) If production procedures relative to fuel platefabr ica t ion are changed, cladding and core thickness must be requallf led.
3.2.4 Cladding Temper
Each fuel plate shall be rolled by a combination of f i rs t , hotrolling, and second, cold rolling. The final reduction of the plate thicknessshall be accomplished by cold rolling and shall not be less than 4? nor greaterthan 25? of the final hot-rolled thickness.
3.2.5 Meta l lu rg ica l Bond
The existence of a metallurgical bond shall be verified byblister test, ul t rasonic test, and bending test on a strip sheared from theplate end trimming. The bending test may be replaced by demonstration of atleast 40Z gra in growth across the cladding/frame interface for all platessectioned to ve r i fy fuel core and cladding thickness.
3.3 Physical Properties
3.3.1 Fuel loading
The loading of each fuel plate shall be as specified below.The amount of 235jj in che fue l core is to be determined by a unifona, statis-tically sound saapllng procedure, proposed by the Contractor and approved bythe Laboratory. The weight of each core shall be measured and recorded towithin 0.01 g along w i t h the calculated value of the 235g content. Fuelcontent may be confirmed by the Laboratory by the use of reactivity measurements.
3.3.1.1 Fuel plates for fuel elements — Each fuel plate shallcontain 17.9 +_ 0.35 g of 235U.
3.3.1.2 Fuel plates for shim rod fuel sections — Each fuelplate shall contain 17.9 +_ 0.35 g of 235U unless a smaller loading is specifiedin the procurement contract.
3.3.2 Homogeneity
The tolerance on the surface densi ty in g/cnr of ''5jj withinthe maximum fuel core outline shall be +27 -100Z of the nominal value of thatspot as measured for any 5/64-inch (2.0-ram) -diam spot. The tolerance on anaverage 235jj s u r f ace density within the minimum core outline shall be +_12Zof the nominal value. In the area between the maximum and minimum core out-lines, the variation of the average shall be within +12Z -1002 of the specifiedvalue. These averages shall be measured for a surface area 5/64-inch (2.0-mm)wide and ~l/2-inch (12.7-mm) long, or over an equivalent circular surface areaof d iamete r 7/32-inch (5.6 m m ) . The scans shall be tangent one to the other.
3.4 Dimensional Requirements
3.4.1 Each fuel p la te shall be in conformance with the dimensionsspec i f i ed on the drawings re fe renced in Section 2.0. Preassembly fue l platewidth and curvature shall be chosen so that they will be compatible w i th thevalue speci f ied for the fue l element or shim rod fue l section in its assembledcondit ion.
3.5 Sur face Condit ions
3.5.1 Sur face Finish
The surface of the finished fue l plates shall be smooth and f reeof gouges (scratches, pits, or marks) In excess of 0.005 in. (0.127 mm) in depth.
557
Dents In the fuel plate shall not exceed 0.012 in. (0.3 mm) in depth or 0.25 in.(6.4 mm) in diameter. In the dogbonlng zone, if there is evidence of dogbonlng lothe plates, surface defects not deeper than 0.003 in. (0.076 mm) are acceptable.No degradation of the fuel plates beyond these limits shall be permitted.
3.5.2 Surface Contamination
The Contractor shall verify that the surface contamination of thefuel plates Is less than five mlcrograms of uranium per square foot (5 lig per929 cm2).
3.5.3 General Cleanliness
Precautions must be taken to maintain a high standard of clean-liness during fabrication and assembly to Insure that no foreign materials orcorrosion products are present in the finished elements. All surfaces oust befree from moisture, dirt, oil, organic compounds, scale, graphite, or otherforeign matter. Use of graphite for marking purposes is prohibited. The useof abrasives for cleaning the fuel plates or for any other purposes is prohi-bited, as is any procedure which removes more than 0.0004 in. (0.01 mm) ofaluminum f rom the surface of the finished fuel plates. If any chlorine-bearingmaterial is used for cleaning, it must be completely removed following thecleaning procedure before any elevated temperature treatment or welding.Moreover, the finished element must be free of any chlorine-bearing material.
3.6 Plate Identification
After rolling, a serial number shall be placed on each fuel plate forident i f icat ion as to 113812 powder lot number and compact number using proceduresapproved by the Laboratory. The Identification number shall be over the unfueledregion of the plate, as shown on the drawings referenced in Section 2.0.
4.0 QUALITY CONTROL AND QUALITY ASSURANCE REQUIREMENTS
4.1 Responsibility
Unless otherwise specified, the Contractor shall be responsible for theperformance of all tests and Inspections required prior to submission to theLaboratory of any fuel plate for acceptance. However, the performance of suchtests and Inspections is in addition to, and does not limit, the right of theLaboratory to conduct such other tests and Inspections as the Laboratory deemsnecessary to assure that all fuel plates are in conformance with all requirementsof this specification. The Contractor may use either his own or any commerciallaboratory acceptable to the Laboratory. Records of all tests and examinationsshall be kept by the Contractor, complete and available to the Laboratory asspecified In the contract or purchase order.
4.2 Quality Ver i f i ca t ion Plan
The Contractor shall develop and submit for approval wi th his bid aqual i ty ver i f ica t ion plan fu l f i l l ing the requirements of AKL Document AQR-001.
4.3 Prequalification Inspection
Before the contract Is awarded, the Laboratory may send a representativeto the Bidder's plant to Judge the capability of the Bidder to carry out the pro-visions of the contract and the adequacy of the steps to be taken in executing thequality verification program.
4.4 M ami fac t urIng P r oced u re s
A wr i t t en general description of the manufacturing procedures, shopdrawings, detailed cleaning procedures, and Inspection report forms shall be
558
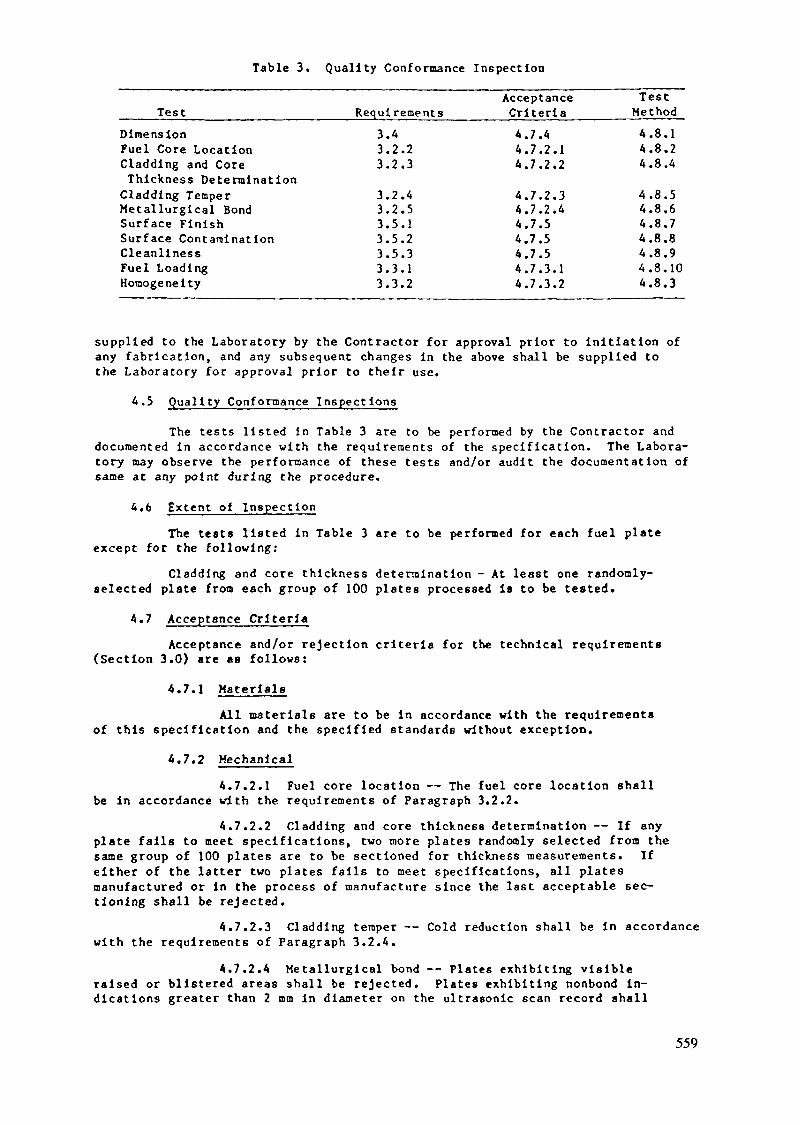
Table 3. Quality Conformante Inspection
TestDimensionFuel Core LocationCladding and CoreThickness DeterminationCladding TemperMetallurgical BondSurface FinishSurface ContaminationCleanlinessFuel LoadingHomogeneity
Requirements3.43.2.23.2.3
3.2.43.2.53.5.13.5.23.5.33.3.13.3.2
AcceptanceCriteria4.7.44.7.2.14.7.2.2
4.7.2.34.7.2.44.7.54.7.54.7.54.7.3.14.7.3.2
TestMethod4.8,14.8.24.8.4
4.8.54.8.64.8.74.8.84.8.94.8.104.8.3
supplied to the Laboratory by the Contractor for approval prior to initiation ofany fabrication, and any subsequent changes in the above shall be supplied tothe Laboratory for approval prior to their use.
4.5 Quality Conformance Inspections
The tests listed In Table 3 are to be performed by the Contractor anddocumented in accordance with the requirements of the specification. The Labora-tory may observe the performance of these tests and/or audit the documentation ofsame at any point during the procedure.
4.6 Extent of InspectionThe tests listed in Table 3 are to be performed for each fuel plate
except for the following:Cladding and core thickness determination - At least one randomly-
selected plate from each group of 100 plates processed IB to be tested.
4.7 Acceptance CriteriaAcceptance and/or rejection criteria for the technical requirements
(Section 3.0) are «a follows:4.7.1 Materials
All materials are to be In accordance with the requirementsof this specification and the specified standards without exception.
4.7.2 Mechanical4.7.2.1 Fuel core location — The fuel core location shall
be in accordance with the requirements of Paragraph 3.2.2.4.7.2.2 Cladding and core thickness determination — If any
plate fails to meet specifications, two more plates randomly selected from thesame group of 100 plates are to be sectioned for thickness measurements. Ifeither of the latter two plates falls to meet specifications, all platesmanufactured or In the process of manufacture since the last acceptable sec-tioning shall be rejected.
4.7.2.3 Cladding temper — Cold reduction shall be In accordancewith the requirements of Paragraph 3.2.4.
4.7.2.4 Metallurgical bond — Plates exhibiting visibleraised or blistered areas shall be rejected. Plates exhibiting nonbond in-dications greater than 2 mm in diameter on the ultrasonic scan record shall
559
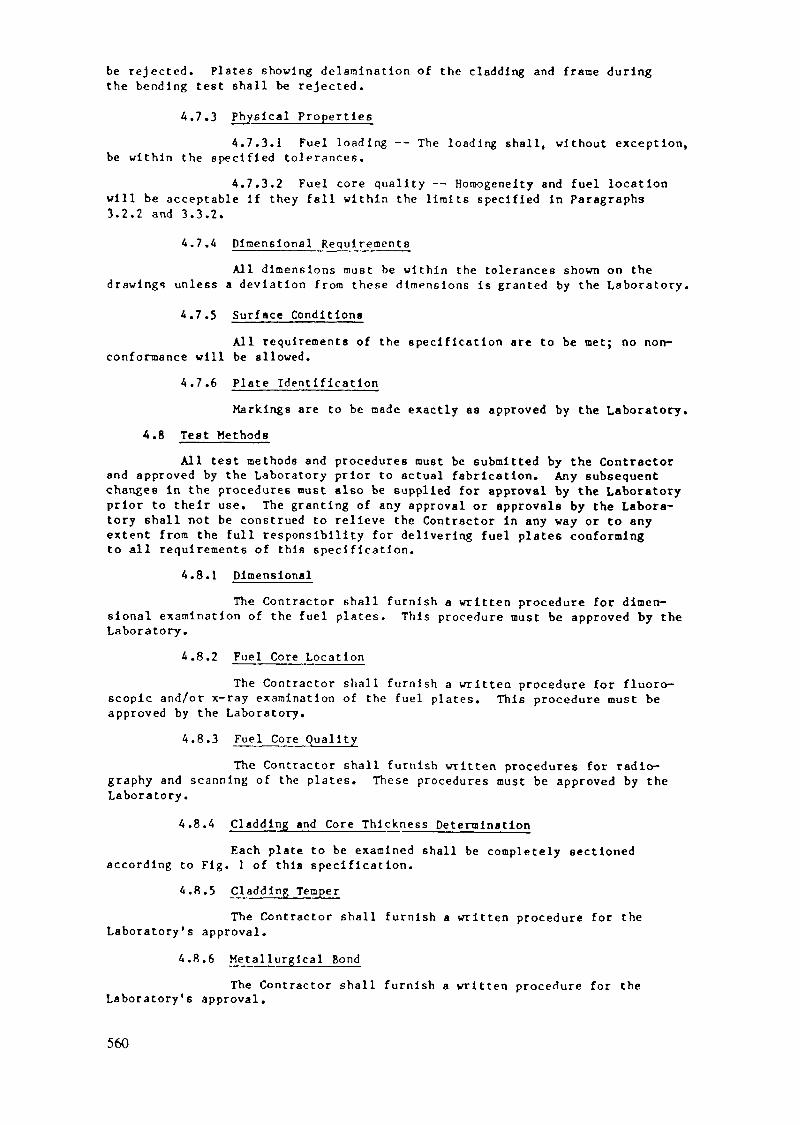
be rejected. Plates showing delaminntion of the cladding and frame duringthe bending test shall be rejected.
A.7.3 Physical PropertiesA.7.3.1 Fuel loading — The loading shall, without exception,
be within the specified tolerances.A.7.3.2 Fuel core quality — Homogeneity and fuel location
will be acceptable if they fall within the limits specified in Paragraphs3.2.2 and 3.3.2.
A.7.A Dimensional RequirementsAll dimensions must be within the tolerances shown on the
drawings unless a deviation from these dimensions is granted by the Laboratory.
A.7.5 Surface ConditionsAll requirements of the specification are to be met; no non-
conformance will be allowed.A.7.6 Plate Identification
Markings are to be made exactly as approved by the Laboratory.A.8 Test Methods
All test methods and procedures must be submitted by the Contractorand approved by the Laboratory prior to actual fabrication. Any subsequentchanges in the procedures must also be supplied for approval by the Laboratoryprior to their use. The granting of any approval or approvals by the Labora-tory shall not be construed to relieve the Contractor In any way or to anyextent from the full responsibility for delivering fuel plates conformingto all requirements of this specification.
A.8.1 DimensionalThe Contractor shall furnish a written procedure for dimen-
sional examination of the fuel plates. This procedure must be approved by theLaboratory.
A.8.2 Fuel Core LocationThe Contractor shall furnish a written procedure for fluoro-
scopic and/or x-ray examination of the fuel plates. This procedure must beapproved by the Laboratory.
A.8.3 Fuel Core QualityThe Contractor shall furnish written procedures for radio-
graphy and scanning of the plates. These procedures must be approved by theLaboratory.
A.8.A Cladding and Core Thickness DeterminationEach plate to be examined shall be completely sectioned
according to Fig. 1 of this specification.A.8.5 Cladding Temper
The Contractor shall furnish a written procedure for theLaboratory's approval.
A.8.6 Metallurgical BondThe Contractor shall furnish a written procedure for the
Laboratory's approval.
560

4.8.7 Surface FinishThe Contractor shall furnish a written procedure for the
Laboratory's approval.
A.8.8 Surface Contamination
The Contractor shall furnish a written procedure for theLaboratory's approval.
A.8.9 Cleanliness
The Contractor shall furnish a written procedure for theLaboratory's approval.
4.8.10 Fuel Loading
The Contractor shall furnish a written procedure for theLaboratory's approval.
4.9 Documents
4.9.1 Two certified copies of inspection and test records coveringthe items listed below shall be supplied the Laboratory. A duplicate copy ofthe records of each fuel assembly shall be included in the shipping containerwith the fuel plates.
4.9.1.1 The serial number of each plate within each unit,the calculated fuel loading of uranium and 2 u jn each fuel plate, and thetotal calculated loading of 1)3812 and 235u. The fuel loadings are to beas specified in Paragraph 3.3.1 of this specification.
4.9.1.2 Data on the examination of the surfaces of the fuelplates as specified in Section 3.5 of this specification.
4.9.1.3 Data regarding the location of fuel cores as prescribedin Paragraph 3.2.2 of this specification.
4.9.1.4 Results of the cladding and core thickness determina-tion as specified in Paragraph 3.2.3 of this specification.
4.9.1.5 Results of the inspection of bonding in each fuelplate examined as specified in Paragraph 3.2.5 of this specification.
4.9.1.6 A certified report of the chemical and Isotoplcanalysis of each U$Si2 lot as specified in Paragraph 3.1.2 of thisspecification,
4.9.1.7 A certified report of the chemical analysis of allother materials used In the fabrication of the fuel plates as specified inSection 3.1 of this specification.
4.9.1.8 A certificate of compliance for each fuel plate unitstating that the element meets all requirements of the contract.
4.9.2 Manufacturing Procedures
The Contractor shall submit to the Laboratory three copies ofthe manufacturing procedures required by Paragraph 3.2.1 and Section 4.4.
561

4.9.3 Test Procedures
The Contractor shall submit to the Laboratory three copies ofthe test procedures required by Section 4.8.
4.9.A Quality Verification planThe Contractor shall submit to the Laboratory with the bid
three copies of the quality verification plan required by Section 4.2.
562

Appendix K-5
NOTIONAL SPECIFICATION FOR MTR FUEL PLATES/TUBESAT URANIUM DENSITIES UP TO 1.6 g/cm3
B. HICKEYDounreay Nuclear Power Development Establishment,United Kingdom Atomic Energy Authority,Thurso, Caithness,United Kingdom
Abstract
Various representative conditions from the MTR range ofspecifications are presented. At densities up to 1.2 g U/ccthe manufacturing route can be by the traditional castingand rolling process. At densities greater than 1.2 g U/ccthe manufacturing route utilises the UoOg/Al cermet process.
Included are various representative conditions culled from the MTR rangeof specifications which might be of interest to a prospective customer.Note that at densities up to 1.2 g U/cc the manufacturing route can be bythe traditional casting and rolling process. At densities greater than1.2 g U/cc the manufacturing route utilises the UßOs/Al cermet process.
1. U235 content +_ 2% of nominal value specified.2. U Homogeneity Central region, +_ 10% (5 mm dia); dogbone,
+ 20% to - 100% (5 mm dia).3. Cladding-
material Can be to 1050 (MTRS2) or 6082 (Al 1% Mg).
thickness The cladding thickness shall be checked bydestructive examination to ensure (95% level)that the drawing requirements are satisfied.
bond The core/clad bond shall be checked by heatingeach fuel plate/tube to 500°C + 10°C for20 minutes. After cooling the plate shall beexamined for blisters which, if found, willcause rejection.
4. Surface Each finished fuel plate/tube shall be examinedcontamination for alpha contamination. Any contamination
greater than 3.2 x 10~5 grammes/m2 of Uranium(3 x 10~6g/ft2) will cause rejection.
5. Surface finish Any plate/tube which has a pit, scratch orother blemish greater than 0.076 mm deep overthe fuelled area shall be rejected.
563
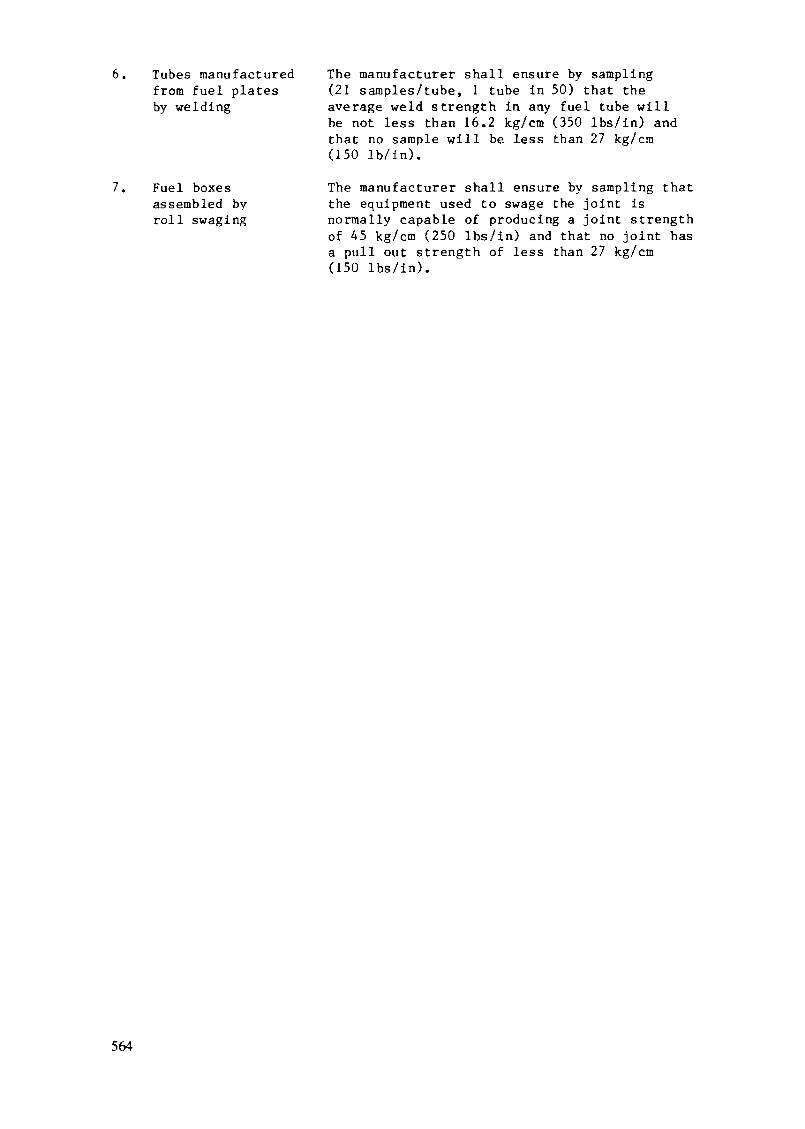
6. Tubes manufactured The manufacturer shall ensure by samplingfrom fuel plates (21 samples/tube, 1 tube in 50) that theby welding average weld strength in any fuel tube will
be not less than 16.2 kg/cm (350 lbs/in) andthat no sample will be less than 27 kg/cm(150 Ib/in).
7. Fuel boxes The manufacturer shall ensure by sampling thatassembled by the equipment used to swage the joint isroll swaging normally capable of producing a joint strength
of 45 kg/cm (250 lbs/in) and that no joint hasa pull out strength of less than 27 kg/cm(150 lbs/in).
564

Appendix K-6
FABRICATION OF MEDIUM ENRICHED URANIUM FUELPLATE FOR KUCA CRITICAL EXPERIMENTDesign, fabrication, inspection and transportation
K. KANDA, Y. NAKAGOME, T. SAGANE, T. SHIBATAResearch Reactor Institute,Kyoto University,Osaka, Japan
COMPAGNIE POUR L'ETUDE ET LA REALISATIONDE COMBUSTIBLES ATOMIQUES (CERCA)Créteil, France
Abstract
The design, fabrication, inspection and transportation offuel elements with MEU UA1 -Al fuel for the C-core of theKUCA critical facility at the Kyoto University ResearchReactor Institute are summarized. The C-core is a raockup ofthe annular coupled-core design for the 30 MW KyotoUniversity High Flux Reactor. The fuel elements werefabricated in France by CERCA.
INTRODUCTION
Due to mutual concerns in the USA and Japan about the proliferationpotential of highly-enriched uranium (HEU), a joint study program wasinitiated between Argonne National Laboratory (ANL) and Kyoto UniversityResearch Reactor Institute (KURRI) in 1978, In accordance with thereduced enrichment for research and test reactor (RERTR) program, thealternatives were studied for reducing the enrichment of the fuel to be
(2)used in the Kyoto University High Flux Reactor (KUHFR). ' The KUHFRhas a distinct feature in its core configuration : it is a coupled-core.Each annular shaped core is light-water-moderated and placed within aheavy water reflector with a certain distance between them. The phase Areports of the joint ANL-KURRI program independently prepared by two
/ o / \laboratories in February 1979, ' concluded that the use ofmedium-enrichment uranium (MEU, 45%) in the KUHFR is feasible, pendingresults of the critical experiments in the Kyoto University CriticalAssembly (KUCA) and of the burnup test in the Oak Ridge ResearchReactor (ORR). '
An application of safety review (Reactor Installation License) forMEU fuel to be used in the KUCA was submitted to the Japanese Government
565
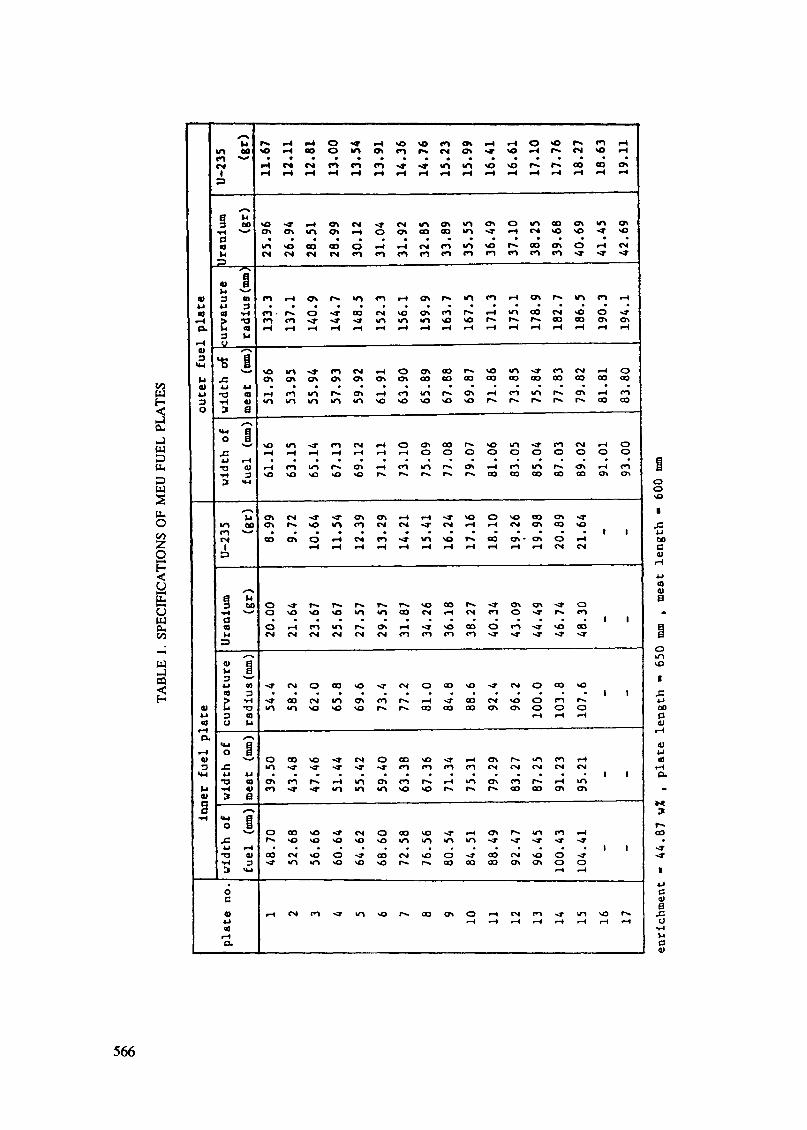
S3H
l_)
u
u-O
Ico
am
«4in to
3 nu 3cd -H£ T3<a3 klo___
•a B»oS
0 J.U r-l•O «U•H 33 «M
«nr«
kt3U «lOJ 3r* ^U TJ3 0)U kl
O
Si4JTJ 41
(3C
4lu
c < i o i f * > « n « * i ^ . » m , < n » o » o r > - f » c o e o o *
o i c M < M c N n n < n n « n « n p> -» •»
vo 10 -T i o o\ <o i»» »o m «n CM p-4 o
i n m i n i n m s O N O v o s O s o r ^ r ^ r ^ f ^ r ^ c o a o
^ l ^ l ^ f r - l r H l - l f - H O O O O O O O O O O
so so so so so i » r*» r*s r^ ^ oo 03 co ^3 oo os o\
CT\ • O> O f—l•-( r-4 Cs| C>J
l l
O * * f ^ r * * r ^ r ^ r ^ s o o o ^ * * r o \ C T \ ' * C 3l l
« M c N c s i c s i r s i r s i m n m >T ^T «T
oo
l
J5u00G4l
a)4la
O
sO
l
Si4-100
01i-H
u<drHO.
^»r~-co
l l
Ö4*
566
in March 1980, and a license was issued in August 1980. Subsequently,the application for "Authorization before Construction' was submittedand was authorized in September 1980. Fabrication of MEU fuel elementsfor the KUCA experiments by CERCA in France was started in September1980, and was completed in March 1981. The critical experiments in theKUCA with MEU fuel were started on a single-core in May 1981 as a firststep. Those on a coupled-core will follow.
The first critical state of the core using MEU fuel was achieved at3:12 p.m. in May 12, 1981. After that, several experiments wereperformed as follows : the reactivity effects of the side-platescontaining boron burnable-poison, the void reactivities, the temperaturecoefficients, neutron flux distributions and so on.
FABRICATION OF MEU FUEL ELEMENTS
MEU fuel elements for the KUCA critical experiments were fabricatedby Compagnie pour l'Etude et la Réalisation de Combustible Atomiques(CERCA) in France. One fuel element consists of two side-plates andeither fifteen or seventeen curved fuel plates. The fuel plate,side-plates, and fuel elements are illustrated in Figs. 2 and 3. Thetotal number of fuel plates fabricated is 294, of 32 different widths.The fuel plates were fabricated by the picture frame technique. Thedimension and uranium content of each fuel plate are listed in Table 1.
MEU fuel was supplied from the United States Department of Energy(USDOE) to CERCA for Kyoto University. The nominal enrichment is 45.0 +0.4 w/o. The chemical form of the meat (fuel core) is UA1 -Al
3 Xdispersion, and the density is about -4.0 g/cm . The Uranium density of
3 235 3the fuel core is 1.69 g/cm and U density is 0.7575 g/cm .The boron loaded side-plates were also fabricated by the picture
frame technique. The purity of natural boron contained in theside-plates is more than 98 %.
1. Fabrication ProceduresThe fabrication process of the MEU fuel plates is shown in Fig. 1,
and the fabrication procedure is as follows ;(1) fabrication of U-A1 alloy by melting uranium metal and aluminum,
uranium content of UA1 : 69 + 3 w/o(2) crushing and grinding UA1 into powder, and sieving,
UA1 grain size : <\40 urn (40 w/o maximum) and40 -125 urn (the rest)
567
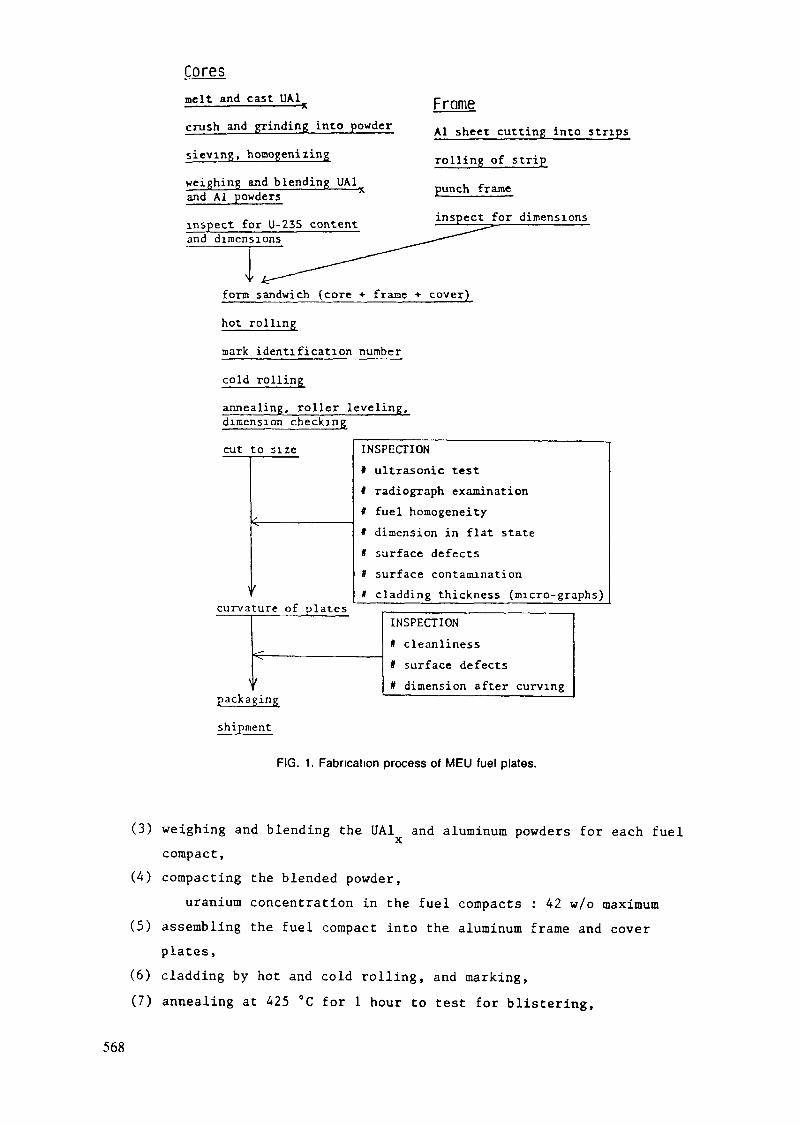
Coresmelt and cast UA1crush and grinding into powdersieving, homogenizing
weighing and blending UA1and AI powdersinspect for U-25S contentand dimensions
FrameAl sheet cutting into stripsrolling of strippunch frame
inspect for dimensions
form sandwich (core + frame + cover)
hot rollingmark identification number
cold rolling
annealing, roller leveling,dimension checking
cut to size
curvature of plates
INSPECTIONf ultrasonic testI radiograph examinationI fuel homogeneity* dimension in flat state* surface defects* surface contamination» cladding thickness (micro-graphs)
packaging
shipment
INSPECTION# cleanliness# surface defects# dimension after curving
FIG. 1. Fabrication process of MED fuel plates.
(3) weighing and blending the UA1 and aluminum powders for each fuelX
compact,(4) compacting the blended powder,
uranium concentration in the fuel compacts : 42 w/o maximum(5) assembling the fuel compact into the aluminum frame and cover
plates,(6) cladding by hot and cold rolling, and marking,(7) annealing at 425 °C for 1 hour to test for blistering,
568

wid(U!
IMidlh
m«otth 11 1
1
rrv\
( Q )
— j 3.17mm
Ü L75mmH"1 i09mm
Lk
(») : fuel( tt—— 5.5mm
— ] 38mm CO : sldi
1 I Ei ^'L. — L L5mm Q
L| 1 1L, . H
J _ 1 g . 0
"1. mm0.45mm0.5mm
( the width Is tabulated 1n Table 1 )side-plate containing no burnable-poison
Inner fuel element : L • 59.34 onouter fuel element : L • 67.41 mm
:-plate containing burnable-poison
Inner fuel element : L • 59.40 «mLc • 47.1 mm
outer fuel element : L • 67.00 «tnL„ • 54.7 mmo
44JL5mm-Hi mm
(b) (c)
FIG. 2. Illustration of the fuel plates and side-plates.
(8) cold rolling to specified thickness,(9) cutting the plates to specified sizes,
(10) chemically etching the plate surface,(11) curving the plates,(12) final cleaning and inspection,(13) packaging for shipment.
The fabrication procedure of the boron loaded side-plates is asfollows ;
(1) weighing and blending the natural boron and aluminum powders,weight of natural boron : 640 mg + 5 % for outer elements and
570 mg + 5 % for inner elementsboron grain size : 80 urn maximum
(2) assembling the blended powder and silver markers into thealuminum frame and cover plates,
(3) cladding by rolling,(4) annealing at 425 °C for 1 hour,(5) roller leveling to specified thickness,(6) cutting the plates and machining with grooves and engraving to
specified sizes,
569

Control Rod RegionCentral Island
Hook
Side Plate
Inner Fuel Element
f- Outer Fuel Element
Plate Stopper f~1| illl 11 || fl ,Supporting Grid
Positionar
FIG. 3. View of assembled fuel elements.
(7) chemically etching the plate surface,(8) packaging for shipment.
2. Inspection
The actual inspection of the fabrication of MEU fuel elements wasperformed by Compagnie Générale des Matières Nucléaires (COGEMA) inFrance, which was chosen by Kyoto University to be the acting inspector.The inspectors of Kyoto University visited CERCA three times - at thebeginning of fabrication, mid and final stages -, then Kyoto Universityauthorized the inspection results reported by COGEMA. The Science andTechnology Agency of the Japanese Government further inspected the MEUfuel elements in Japan.
570
The following items were considered in the inspection of the fuelplates ; uranium enrichment from the supplier's report, uranium and
235aluminum purities by chemical analysis, U content in each fuel plateby the gamma-ray counting examination, fuel homogeneity by the X-rayabsorption technique, cladding bond integrity by ultrasonic testing,cladding and dog bone thickness by destructive testing, dimension,surface defects, and surface contamination by the alpha counting method.
The inspection items for the side-plates were as follows ; boronand aluminum purities by chemical analysis, boron content in eachside-plate by weighing natural boron, boron core location by radiographexamination, cladding bond integrity by ultrasonic testing, cladding andcore thickness by destructive testing, dimension, surface condition, andsurface contamination by the alpha counting method.
The summary of the inspections for fuel plates and structural partsis shown in Table 2.
The inspection report and records such as X-ray absorptiondiagrams, radiographs, ultrasonic test diagrams and micro-photographstaken in the destructive testing, were delivered to Kyoto University.
3. Transport of MEU Fuel Elements
MEU fuel elements were transported from CERCA in France to KURRI inJapan as a Type A Fissile Class II Package. Four FS-13 containers wereused. These package were certified to satisfy the IAEA requirements ofthe package design by Ministère des Transports (French Government),Department of Transportation (Government of the United States) andScience and Technology Agency (Japanese Government).
The transport between France and Japan was performed by a cargoplane via Alaska.
571

NJ TABLE 2. SUMMARY OF THE INSPECTIONS FOR MEU FUEL PLATES AND STRUCTURAL PARTS
(a) MEU fuel plates inspection
Inspection item
Material- Uranium
Enrichment
Impurities- Aluminum
Inspection Method
Confirmation of USDOEcertificateConfirmation of mill sheetConfirmation of mill sheet
Judgement
45.0 ± 0.4 w/o
KUCA-spec.-Appendix BKUCA-apec.-Appendices C,E
Sample Quantity
One per lot
One per lotOne per melting lot
Report and/or Certificateto be submitted to KU
USDOE certificate
Vendor's mill sheetVendor's mill sheet
U-235 contentin the core
U-235 gamma counting KUCA-spec.-Appendix D Each fuel core U-235 contentCore weightRecord of the gammacounting
Radiographexamination
Cladding bondintegrity
Homogeneity
Inspection of the fuelcore location on theradiograph by matchinga gaugeInspection of the exist-ence of foreign substances
Drawing No.1375-001and KUCA-spec.-Appendix F
White spots on the radio-graphs must be smallerthan 0.5 mm dia.
Each fuel core Record of the fuelcore location(Good or No good, ormeasured values)Record of the white spocsradiographs
Ultrasonic testing Any defect must be smallerthan 1.5 mm dia.
Each fuel plate Test diagrams
X-ray absorption Maximum permissible variationof the uranium concentrationin any 10 mm surface is +20%(+ 30% on the dog-bone area)relatively to the averageloading.
Each fuel plate Record of X-ray absorption

TABLE 2. (cont.)
(a) MEU fuel plates inspection (cont.)
Inspection item Inspection Method Judgement Sample Quantity Report and/or Certificateto be submitted to KU
Dimension- Length- Width- Thickness- Curvature
By callipersquareBy micrometer (3 points)By micrometer (5 points)By gauge (3 points)
650 ±0.44 mmDrawing No.1375-0011.45 ± 0.05 mmDrawing No.1375-002
Each fuel plate Measured value
Destructiontesting
Appearance- ID No. and
U-cut- Surface
defects
-Surfacecleanliness
Taking five sections oneach fuel plate, whichare observed under alight microscope
Local minimum claddingthickness : 0.35 mmAverage claddingthickness : 0.45 ± 0.08 mm
3 fuel plates Measured valueMicro-photographs(magnification : 25)
Visual inspection
Visual inspection andlight section microscopemeasurements
Visual inspection
ID No. and U-cut must beconfirmed.Maximum depth must be 0.12 mmon the core area, and 0.3 mmoutside the core limits.
Must be clean
Each fuel plate Results of the inspection
Results of the inspection(Good or No good,or measured value)Results of the inspection(Good or No good)
Surfacecontamination Alpha counting Less than l ^gU-235/dm 10 % Measured value
Appendices and drawings are not attached in this document.

TABLE 2. (cont.)
(b) Structural parts inspection
Inspection item Inspection Method Judgement Sample Quantity Report and/or Certificateto be submitted to KU
Material- Boron purity- Aluminum- Stainless
Steel
Confirmation of mill sheetConfirmation of mill sheetConfirmation of mill sheet
More than 98 %KUCA-spec,- Appendix CZ6CN 18-09
One per lotOne per melting lotOne per lot
Vendor's mill sheetVendor's mill sheetVendor's mill sheet
Boron content inthe side plate
Weighing KUCA-spec.- Appendix D Each side plate B-10 contentTotal born content
Radiographexamination
Inspection of the boroncore location on the radio-graph by matching a gauge
Drawing No.1375-013and -014
Each side plate Record of the boron corelocation (Good or No good,or measured values)Radiographs
Cladding bondintegrity(Side plate)
Ultrasonic testing Maximum area of individualbonding defects : 100 mmMaximum length of defectbetween core and frame :50 mm total per plate
Each side plate Ultrasonic test diagrams
Dimension By callipersquare ormicrometer
Drawing No.1375-011,-012-013,-014,-015,-016 and-017
Each part Measured value
Destructiontesting
Taking three sections ona side plate, which isobserved under a lightmicroscope
Cladding thickness andcore thickness :Drawing No.1375-013 and-014
One side plate Measured valueMicrographs(Magnification : 12)

TABLE 2. (cont.)
(b) Structural parts inspection (cont.)
Inspection item
Surfacecondition
- ID No.- Surface
defects
- Surfacecleanliness
Surfacecontamination
Inspection Method
Visual inspectionVisual inspection andlight section microscopemeasurementsVisual inspection
Alpha counting
*Judgement
ID No. must be confirmedMaximum depth must be0.25 mm.
Must be clean
Less than 1 ^gU-235/dm
Sample Quantity
Each side plateEach side plate
Each part
10 %
Report and/or Certificateto be submitted to KU
Results of the inspectionResults of the inspection(Good or No good, ormeasured value)Results of the inspection(Good or No good)
Measured value
* Appendices and drawings are not attached in this document.

REFERENCES
(1) "Research Reactor Using Medium-Enriched Uranium", (ed. K. Kanda andY. Nakagome), KURJRI-TR-192 (1979).
(2) SHIBATA, T., "Construction of a High Flux Research Reactor andConversion of Kyoto University Reactor KUR to a TRIGA Type PulsedReactor", Research Reactor Renewal and Upgrading Program, IAEA-214(1978) 183.
(3) SHIBATA, T., KANDA, K., "ANL-KURRI Joint Study on the Use of ReducedEnrichment Fuel in KUHFR — Phase A Report —", (February 15,1979).
(4) TRAVELLI, A., STAHL, D., SHIBATA, T., "The U.S. RERTR Program, ItsFuel Development Activities, and Application in the KUHFR", ANSTrans., 36_ (1981) 92.
(5) KANDA, K., KOBAYASHI, K., HAYASHI, M., SHIBATA, T., "Reactor PhysicsExperiment Using Kyoto University Critical Assembly", J. At. EnergySoc. Japan, 2l_ (1979) 557, in Japanese.
(6) SHIBATA, T., TRAVELLI, A., "ANL-KURRI Joint Study on the Use ofReduced Enrichment Fuel in KUHFR — Status Report on Phase B —",(December 12, 1980).
576
Appendix K-7
SPECIFICATIONS FOR FUEL ELEMENTS WITH MEUUA1X-AI FUEL FOR THE JMTRC REACTOR
R. OYAMADA, Y. YOKEMURA, K. TAKEDAOarai Research Establishment,Japan Atomic Energy Research Institute,Oarai-machi, Ibaraki-ken,Japan
Abstract
The JMTRC is a pool-type critical facil i ty operated as aneutronics mockup for the 50 MW JMTR. Prior to conversionof the JMTR to MEU UA1 -Al fue l , extensive experiments wereperformed in the JMTRC to validate neutronics codes andobtain nuclear characteristics for the JMTR MEU core.
Specifications for the JMTRC elements with MEU UAlx~Al fuelare summarized along with the sampling rates for inspectionof the materials , parts, and finished elements.
1. Introduction
The JMTRC; a 100 W swimming pool type critical facility,moderated and cooled by light water, and utilizing 90 %enriched uranium-aluminum alloy fuel meat in the ETR-typeelement, has been operated as a neutronics mock-up for theJMTR (50 M W ) .
Prior to the JMTR core conversion to the MEU fuel ,extensive experiments using the JMTRC are scheduled tovalidate neutronics calculation code system used foranalyzing the JMTR MEU core, and to obtain nuclear charac-teristics for the JMTR MEU core.
The application of safety review ("Reactor InstallationModification License") for the MEU fuel to be used in theJMTRC was submitted to the Japanese Government in July 1981and the license was issued in March 1982. Subsequently,the application for "Authorization before Design and Con-struction Method" was authorized in September 1982.
Fabrication of the MEU fuel elements by NUKEM in theFRG was started in September 1982, and the finished elementsare scheduled to be delivered to the JMTRC site in August1983.
577
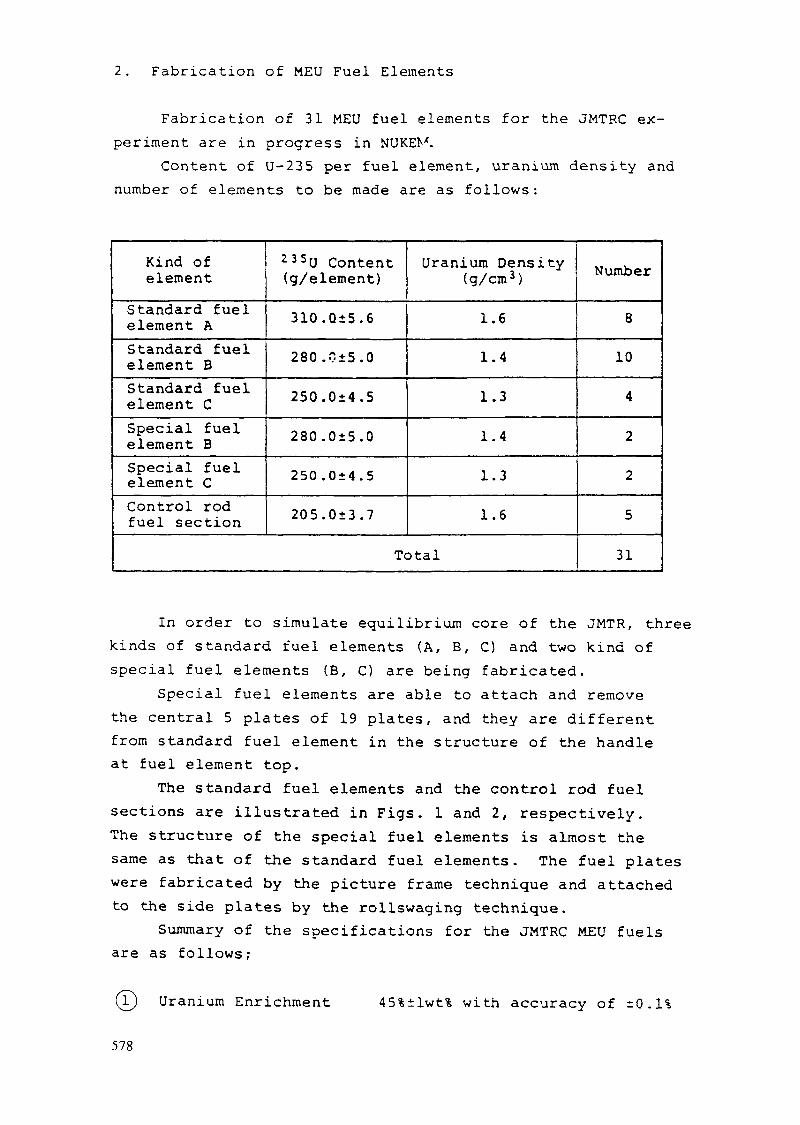
2. Fabrication of MEU Fuel Elements
Fabrication of 31 MEU fuel elements for the JMTRC ex-periment are in progress in NUKEM.
Content of U-235 per fuel element, uranium density andnumber of elements to be made are as follows:
Kind ofelement
Standard fuelelement AStandard fuelelement BStandard fuelelement CSpecial fuelelement BSpecial fuelelement CControl rodfuel section
235U Content(g/element)
310.Q±5.6
280.0±5.0
250.0+4.5
280.0±5.0
250 .0±4.5
205.0±3.7
Uranium Density(g/cm3)
1.61.4
1.3
1.4
1.3
1.6
Total
Number
8
10
4
2
2
5
31
In order to simulate equilibrium core of the JMTR, threekinds of standard fuel elements (A, B, C) and two kind ofspecial fuel elements (B, C) are being fabricated.
Special fuel elements are able to attach and removethe central 5 plates of 19 plates, and they are differentfrom standard fuel element in the structure of the handleat fuel element top.
The standard fuel elements and the control rod fuelsections are illustrated in Figs. 1 and 2, respectively.The structure of the special fuel elements is almost thesame as that of the standard fuel elements. The fuel plateswere fabricated by the picture frame technique and attachedto the side plates by the rollswaging technique.
Summary of the specifications for the JMTRC MEU fuelsare as follows;
(T) Uranium Enrichment 45%±lwt% with accuracy of rO.1%
578
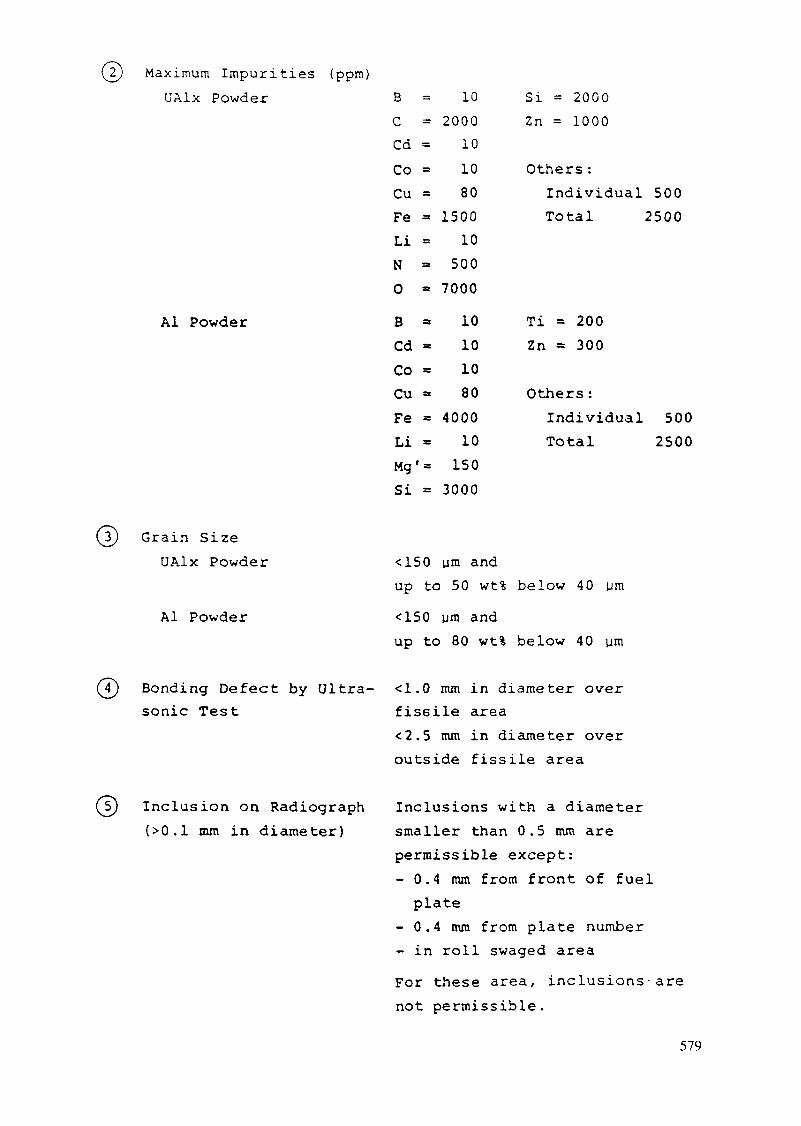
(2) Maximum Impurities (ppm)UAlx Powder
Al Powder
B =C =Cd =Co =Cu =Fe -Li =N =0 =B =Cd =Co =Cu =Fe =Li =Mg' =Si =
102000
101080
150010
500700010101080
4000101503000
Si = 2000Zn = 1000
Others :IndividualTotal
Ti = 200Zn = 300
Others :IndividualTotal
5002500
5002500
Grain SizeUAlx Powder
Al Powder
Bonding Defect by Ultra-sonic Test
<150 urn andup to 50 wt% below 40 urn<150 ym andup to 80 wt% below 40 ym
<1.0 mm in diameter overfissile area<2.5 mm in diameter overoutside fissile area
Inclusion on Radiograph(>0.1 mm in diameter)
Inclusions with a diametersmaller than 0.5 mm arepermissible except:- 0.4 mm from front of fuelplate
- 0.4 mm from plate number- in roll swaged areaFor these area, inclusions-arenot permissible.
579
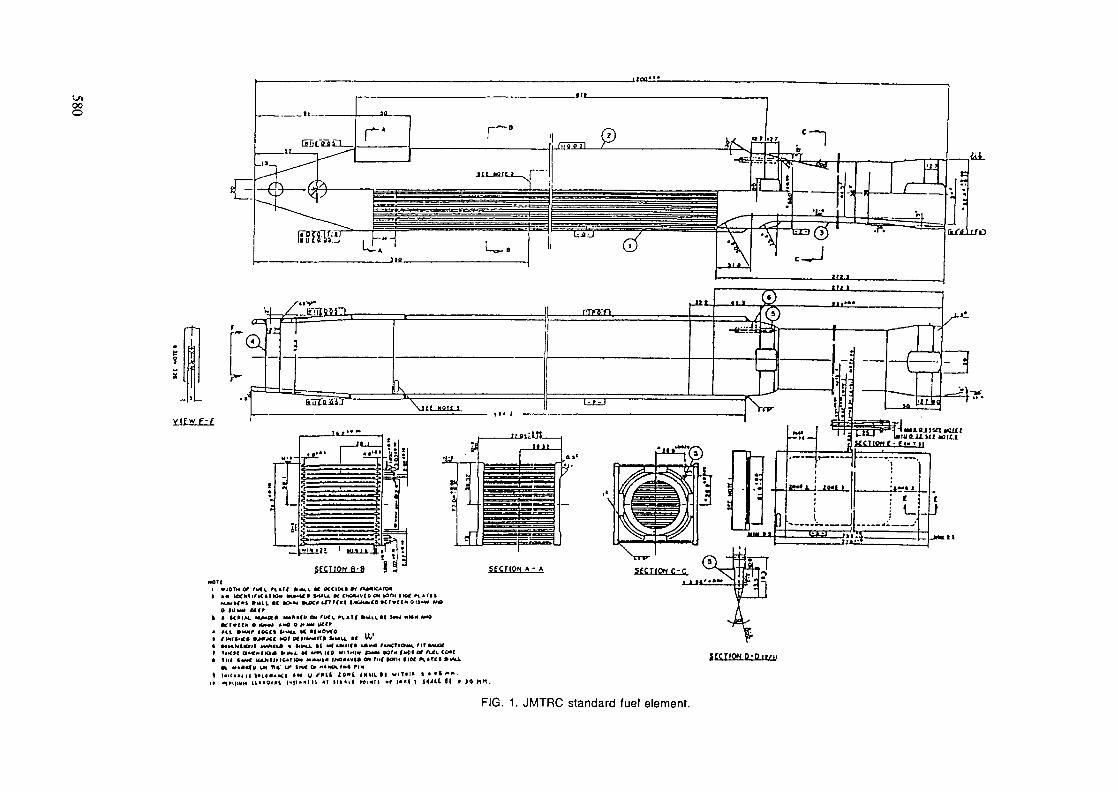
ooo
i
1
IX
1ji/
-r«rv--feâURri
!
HiLtaiiiJ[\
____ lil l1 «.II, __________
1 - ^ - 1
i» . .11.1
-«t/
j!
-fN
^>(s
R1
)
._'•1 1r»
»*•
:
• ••• '-—:i
-+
M >ir K
Li*
:.i
IilA.
- i
g»- —— •-i^kipitM l * . ? ! ' Hl» l» |j J • •
gCCTIQN B-B 1 3 * SECTION « - *
IOT* or rufi fv*u »<M.L M efciMa *r nMiCAn»N MX HI I r 1C «110« MUMtfli i**«U K CNÛA4VCO (* *0rn IKK «.4
IM. M**«* tMftlCU CM rt*l *t» O tt**J *•* O f* MM 4MCr1 iCkCfi i*MU. w »(-owe
«u. »l W*'tX tC ****J«JlC» Uivxfl fAXTlOM. ^If ***XMf AWI ICO wl IHII* «MM MTM f M«| Of A4L CO»tM»«»«« IMOIKVI» o* ?M< »ont lien K*r<i »MO.
M«ttf bM 1**! f III* <* HINM.IM« ^ti
SKTIQHP-Pii/n
•r ***t \ i<>nt M * >4 MM.
FIG. 1. JMTRC standard fuel element.

OEM}-
£_t:«I>«lx-«llîiSO'C«05 SINK ,
Mto'.iH
W.10"
DiS 5
, A-A
_9U-Hai£
ßj
à a-S}(e: :-A-
-
.
4i __
EE
if7" "T© 0
nS)
ÎT
1 T 2PIJCCloi .t;) a n0 , titttf
1J
= ;i
Ç'
s
hrrr-$Fj
T~'
.
T•tL
l*;
NY*
/i
J']
« W
-4 I THRUtcrcsK
Ϋ
1if-rv
30'«
i, - — — -
V. '
T— — 'i
J
iO».cos
*l1 rd w
Im,
rp ^ .
—-"-
rj
C05
7
. •ïï»-
.<" v^
*/•*! »•*• 1
7 X
yf >«QTg i
i
L tri":----u>.j _i_,»i
-i+•
$um
-Ç;
^
l WIOIM *» nA. nj»re IMM.I H orciMft •» ^••»K«ICK»
n.«TC& MMiVIIS BH*i.L H MMU HOOI UlfftiS f««*v<> MrMOHM» 00 «»MW MIP
1 • MAIM. MA4CI —'""tt «>* rvJCI. PiaTC *NMi M >*•« Hfl* ••«raff N «»M wooxix Mir
* «u »uiv «out ««u K «t -«wie• riM»(B »iWACI MOT OflllVMII» 1HALL M V^
CMC.
StCTIOH B'6
c
tITTING Of GUI!*
îljfi•illlj
yir-o>\j>c«»
/ ?
J"
tc3l*DtTAIL E
FIG. 2. JMTRC control rod section.

Uranium Distribution
Surface Contamination
Surface Defect
Void Content in Core
±10 % of average(+20/-100 % of average fordog bone area)
<10 yg of uranium per900 cm2
£80 ym deep over fissile area<200 ym deep over outsidefissile area
4 to 11 vol. %
3. Inspection
The sampling rates in inspection for the materials,the parts and the finished elements are shown in the follow-ing table.
Sampling rate in inspection
U-metal
UAlx powder
Al powder
Structuralmaterial
Fuel core
Inspection Item
Isotopic analysisChemical analysis
Total Uconcentra tionChemical analysisParticle size
Chemical analysisParticle size
Chemical analysisMechanicalproperties
U-235 contentX-ray diffraction
FabricatorSampling
Rate1 / batch1 / batch
1 / batch1 / batch1 / batch
1 / batch1 / batch
eachmaterialeachmaterial
100 t1 / batch
InspectorSampling
RateDocument
ooooooooooo
Approvalby JAERI*
need
Remarks
U-235 enrichmentComposition andimpurities
Composition andimpurities
Composition andimpurities
Composition andboron equivalent
* For a detailed description of inspection and examination method
582
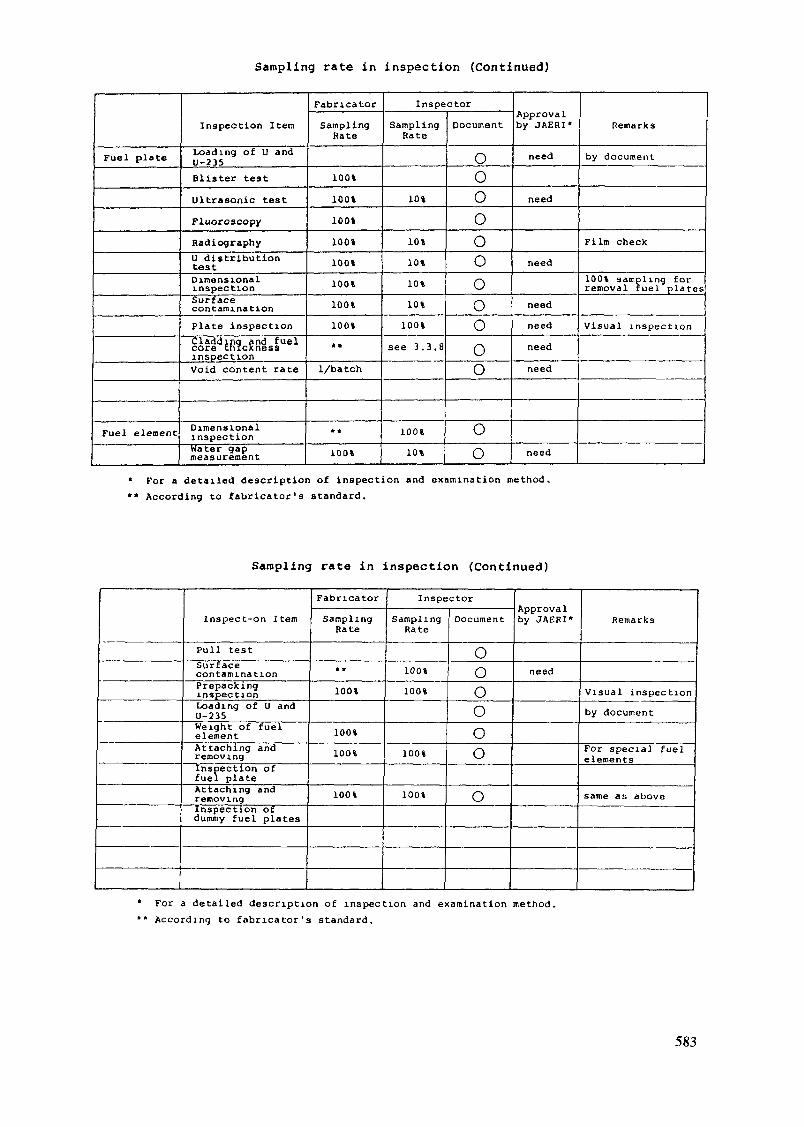
Sampling rate in inspection (Continued)
Fuel plate
Fuel element
Inspection Item
Loading of U andU-235Blister testUltrasonic testFluoroscopyRadiographyU distributiontestDimensionalinspectionSurfacecontaminationPlate inspectionCladding and fuelcore thicknessinspectionVoid content rate
DimensionalinspectionWater gapmeasurement
FabricatorSampling
Rate
100%loot100%100%100%100%100%100%* *
I/batch
* *
100%
InspectorSampling
Rate
10%
10%10%10%10%
100%see 3.3.8
100%10%
Document
oooooooo0oo
00
Approvalby JAERI«
need
need
need
needneedneedneed
need
Remarks
by document
Film check
100% sampling forremoval fuel plates
Visual inspection
* For a detailed description of inspection and examination method.** According to fabricator's standard.
Sampling rate in inspection (Continued)
Inspect-on Item
Pull testSurfacecontaminationPrepackinginspectionLoading of U andU-235Weight of fuelelementAttaching andremovingInspection offuel plateAttaching andremovingInspection ofdummy fuel plates
FabricatorSampling
Rate
* *
100%
lOOi100»
100%
InspectorSampling
Rate
100%100%
100%
100%
Document
Oo0oo0
o
by JAERI*
need
Remarks
Visual inspectionby document
For special fuelelements
same as above
* For a detailed description of inspection and examination method.** According to fabricator's standard.
583
Appendix K-8
SUMMARY OF SPECIFICATIONS FOR CANADIANENRICHED U-A1 PIN-TYPE FUEL
R.D. GRAHAMReactor Technology Branch,Chalk River Nuclear Laboratories,Atomic Energy of Canada Limited,Chalk River, Ontario,Canada
Abstract
A summary is presented of the general specifications whichapply to the fabrication of the fuel currently used in theNRX and NRU reactors at the Chalk River NuclearLaboratories, Canada. The actual specifications wouldcontain much greater detail.The fuel is a uranium-aluminium alloy pin-type design fab-ricated by extrusion of the U-A1 fuel cores, followed byextrusion cladding with aluminum and weld-sealing the endsof the cladding to aluminum end plugs attached to the fuelcores.
Following is a summary of the general specifications which applyto the fabrication of the fuel currently used in the NRX and NRU reactors atthe Chalk River Nuclear Laboratories (CRNL), Canada. The actualspecifications would contain much greater detail.
The fuel is a uranium-aluminum alloy pin-type design fabricated byextrusion of the U-A1 fuel cores, followed by extrusion cladding withaluminum and weld-sealing the ends of the cladding to aluminum end plugsattached to the fuel cores. Since the uranium concentration and somedimensions vary with different applications of the fuel, these items wouldbe specified in the drawings and purchase orders in each case.
Aluminum - for U-A1 alloy, fuel cladding, and fuel pin end plugs:a selected form of AA 1050 alloy (minimum 99.5% Al )which specifies maximum permissible percentage ofboron, cadmium, copper, and various other elements andboth maximum and minimum permissible iron andsilicon.
- a certificate of chemical analysis plus arepresentative sample (for testing) from each heat,batch, or order to be supplied for approval prior touse.
- bar or billets to be free of seams, slivers, cracks,grooves, inclusions or other defects which adverselyaffect subsequent fabrication or irradiationperformance.
585

Uranium
U-A1 Alloy
Fuel Core
Clad Fuel Pins
Flow Tubes
U-235 content: nominal weight percent ± 0.5% intotal weight of uraniumcertificates of chemical analysis of uranium and ofisotopic concentration of U-235 in total uranium to besupplied for approval prior to use.
uranium content in alloy to be nominal specifiedweight percent ± 1.0% of total alloy weight.
length: 2743.2 mm^± 1.6 mmdiameter: nominal ± 0.04 mmU-235 to be uniformly distributed along core. A
- uranium concentration at any point to be nominalweight percent enriched uranium ± 1.0% of totalalloy weight.
- upper limit of U-235 distribution to be confirmedby gamma scanning each core.
- the gamma scanning device to be calibrated usinga known standard fuel core (provided) withenriched uranium content 1.0% by weight greaterthan nominal.
cores are to be free of blisters, porosity,inclusions, and surface defects deeper than 0.25 mm.an eddy current device calibrated using adefected standard provided.fuel cores are to be cleaned and vacuum dried no morethan 48 hours prior to extrusion cladding.
aluminum billets for cladding are to be cleaned,chemically conditioned (NaOH, then H^) rinsed andvacuum dried no more than 12 hours prior toextrusion.clad thickness: 0.76 mm ± 10%.cladding is to be free of laps, seams, cracks,blisters, inclusions, and any surface defect deeperthan 0.10 mm.
- each clad fuel pin to be inspected visually andusing an eddy current device calibrated using adefected standard provided.
finished fuel pins are to be free of sharp bends, andbowing not to exceed 13 mm over length.
material either AA 1050 aluminum (minimum 99.5%), or aselected 3.5% magnesium aluminum alloy (with specifiedmaximum impurity levels) depending on application.
- certificate of chemical analysis plus arepresentative sample (for testing) from eachheat, batch or order to be supplied for approvalprior to use.
dimensions as specified (vary with differentapplications)inner and outer surfaces to be clean, smooth, and freefrom seams, slivers, laminations, grooves, cracks
Nominal values of U-235 content, U content of alloy, and fuel diametermay differ for NRX and NRU, and for different applications within eachreactor.
586

transverse welds, inclusions and other defects deeperthan 0.13 mm.- all tubes to be inspected using an eddy current
device calibrated using a defected standardprovided.
Handling, Storage, - to comply with all applicable government andand Shipping regulatory agency requirements concerning criticality,
health hazards, security, and accountability.
587

Appendix K-9
DETERMINATION OF CLADDING THICKNESSIN FUEL PLATES FOR MATERIAL TESTAND RESEARCH REACTORS (MTR)
T. GÖRGENYI, U. HUTHNUKEM GmbH,Hanau, Federal Republic of Germany
Abstract
Methodology for determination of cladding thickness isdescribed. One method involves selective measurements alonga sample picking out only locations of minimum claddingthickness. In the statistical method, cladding thicknessmeasurements are carried out in exactly 1 mm intervals onboth sides of the 60 mm sample length and the results areplotted on a "probability net." Investigations have shownthat the results from the statistical method confirm thoseof the first method.
1. Introduction
The fissile material in MTR-reactors is 20-93 % enriched uranium inthe dispersed form of (UA1 ), LUOQ or LLSi- in aluminium.X J O j Z .
These metal-ceramic cores of rectangular shape are sandwiched
between aluminium cladding and rolled out by the so called picture
frame technique to the thin (approx. 1,3 mm) fuel plates and are
finally assembled to the fuel element /!/.
A simplified flow sheet for the production of MTR fuel element,
(UAlx/Al-type) is shown in F
plate is illustrated in Fig. 2.
(UA1 /Al-type) is shown in Fig. 1, and the cross-section of one fuel
2. Determination of the "Cladding Thickness"
The cladding thickness of the fuel plate is of great importance for
the function of the fuel plate in the fuel element, therefore, it is
strictly specified. A fuel plate for this specification test is selected
589
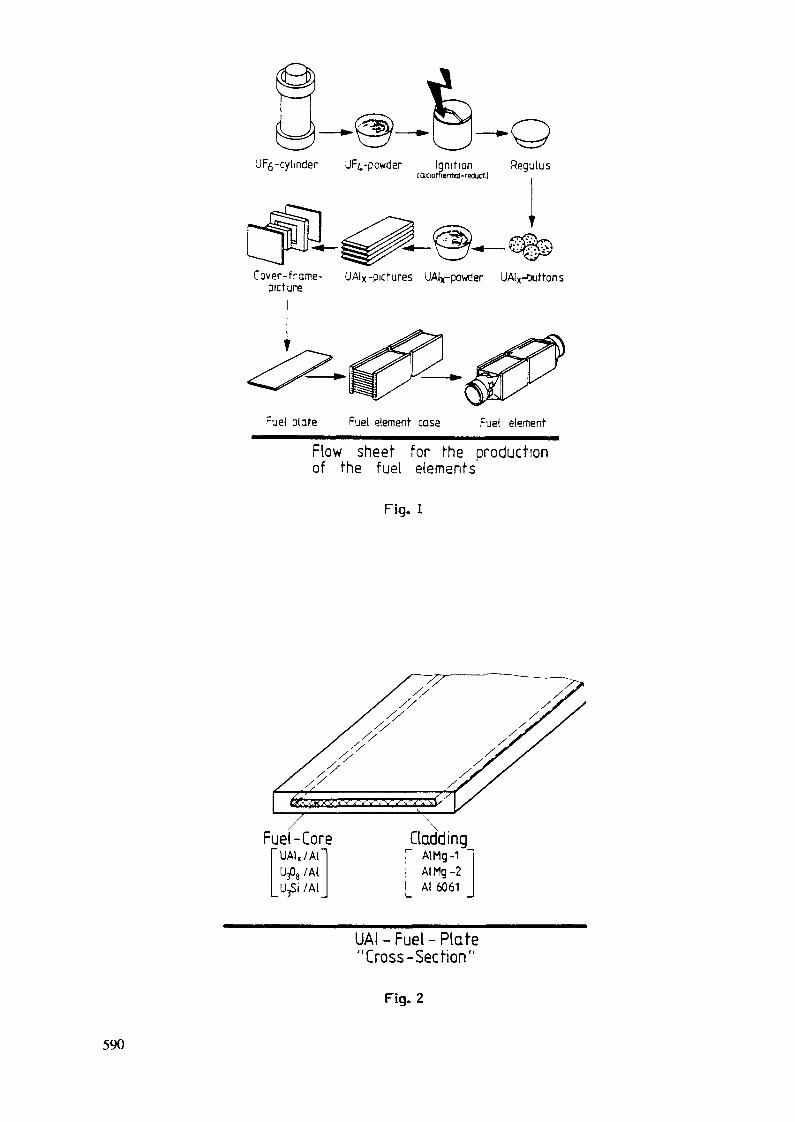
UFg -cylinder UFi,-powder Ignition RegulusIcGlciomermol-reduct.l
Cover-frame-picture
UAIX-pictures UAlx-powöer UAlx-outtons
Fuel plate Fuel element case Fuel element
Flow sheet for the productionof the fuel elements
Fig. 1
Fuel-CoreUAI,/Al
MlMl
CladdingAlMg-1AIMg-2Al 6061
UAI - Fuel - Plate"Cross-Section"
Fig. 2
590
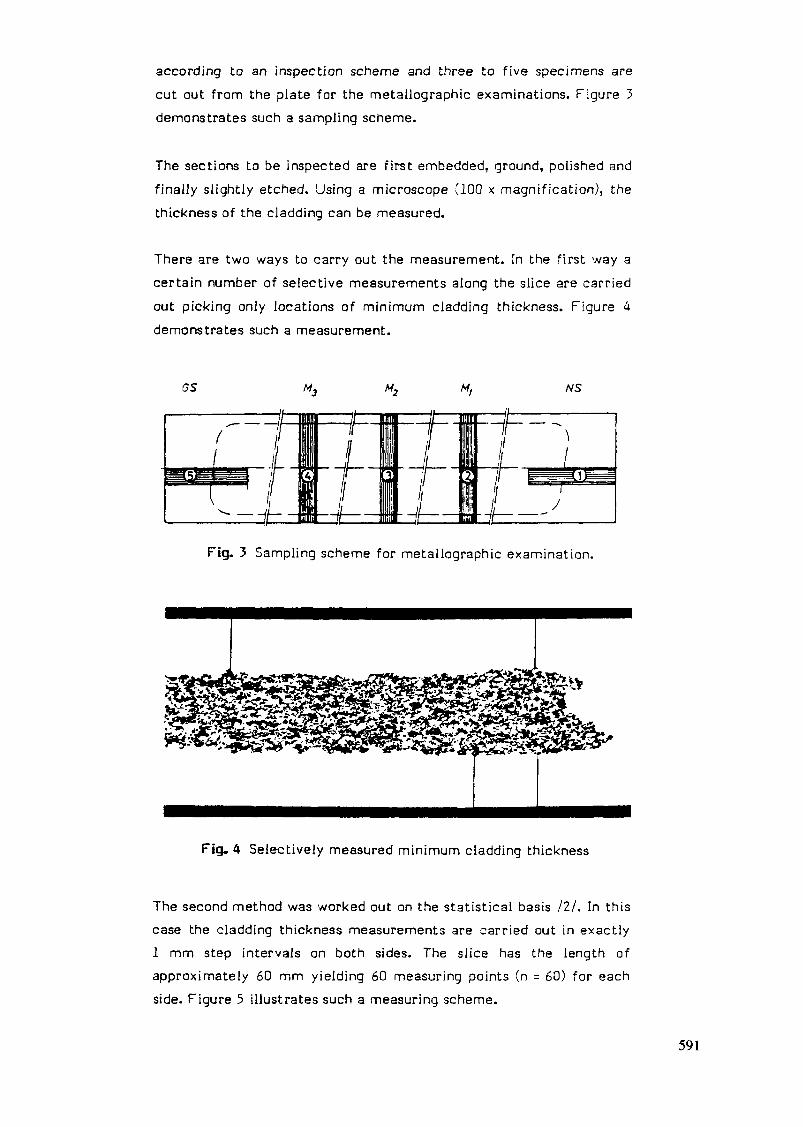
according to an inspection scheme and three to five specimens are
cut out from the plate for the metallographic examinations. Figure 3
demonstrates such a sampling scheme.
The sections to be inspected are first embedded, ground, polished and
finally slightly etched. Using a microscope (100 x magnification), the
thickness of the cladding can be measured.
There are two ways to carry out the measurement. In the first way a
certain number of selective measurements along the slice are carried
out picking only locations of minimum cladding thickness. Figure 4
demonstrates such a measurement.
NS
Fig. 3 Sampling scheme for metallographic examination.
Fig. 4 Selectively measured minimum cladding thickness
The second method was worked out on the statistical basis /2/. In this
case the cladding thickness measurements are carried out in exactly
1 mm step intervals on both sides. The slice has the length of
approximately 60 mm yielding 60 measuring points (n = 60) for each
side. Figure 5 illustrates such a measuring scheme.
591
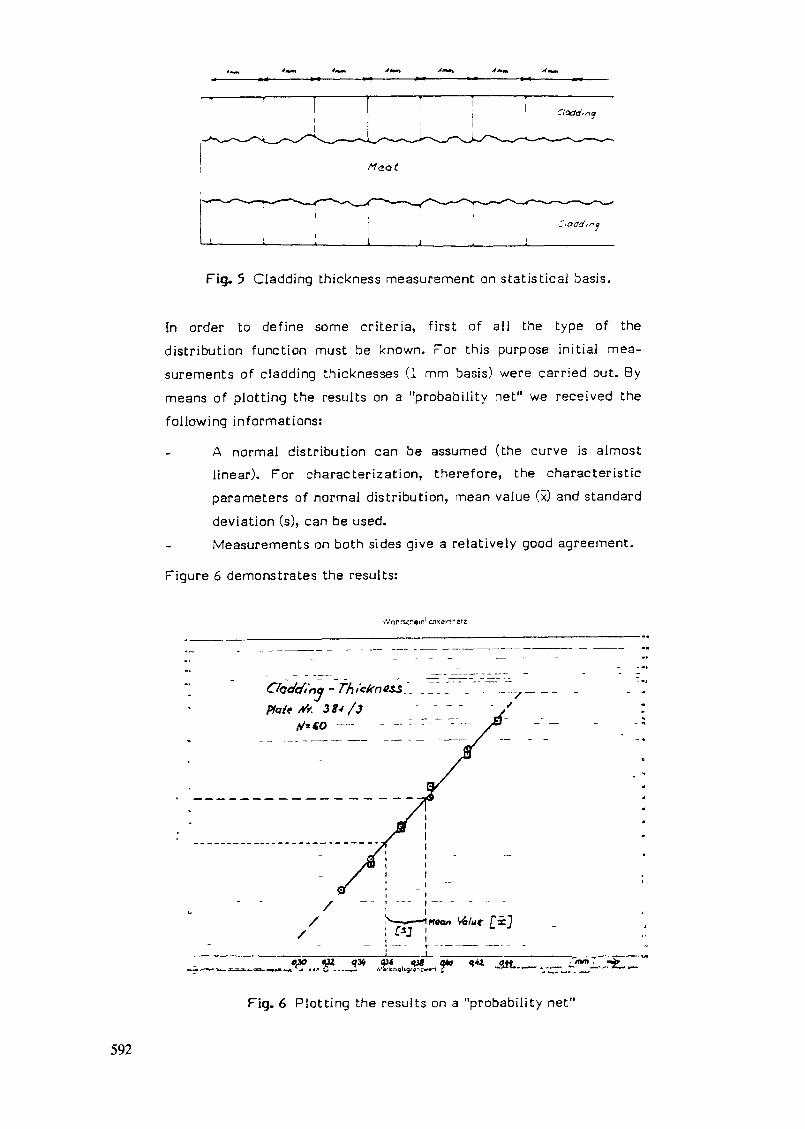
Fig. 5 Cladding thickness measurement on statistical basis.
In order to define some criteria, first of all the type of the
distribution function must be known. For this purpose initial mea-
surements of cladding thicknesses (1 mm basis) were carried out. By
means of plotting the results on a "probability net" we received the
following informations:
A normal distribution can be assumed (the curve is almostlinear). For characterization, therefore, the characteristic
parameters of normal distribution, mean value (x) and standard
deviation (s), can be used.Measurements on both sides give a relatively good agreement.
Figure 6 demonstrates the results:
ina -plait St. 33-f/J
--/•-
»« ay/ cat qa qtt 4+4...;. ~.--—— ».•ir.molig/TiIw.-l ~ ^
Fig. 6 Plotting the results on a "probability net"
592

Further investigations have shown, that the results gained from
further 60-60 measurements confirm those of the first measurement.
The evaluation of such measurements, carried out on one fuel plate
with five speciments, is illustrated in Fig. 7
Mean95199 Probability
Fig. 7 Statistical evaluation of the results for one fuel plate
The results demonstrate the following:
The mean cladding thickness values vary between 0,38 and 0,40
mm.
The lower tolerance limits for a confidence level of 95 % and
a portion of 99 % are between 0,31 and 0,34 mm (calculated
from fig. 8).
There is neither a significant difference between NS/GS and
M 1-M 3 positions, nor between the upper and lower cladding.
stateiische Sicherheit S - 3t%Anteil der Gesamttiert- (1-y)
- 30% -, 35% , 33%sMaftsche Sicherheit S-SS%
Arial derGesairfherf (1—y); 35%, 33%
S S 7 8 SV 20 X 40 SO SO S> 100n-
200 300 4OOSOOGOO 8001000
Fig. 8 One side tolerance limits («...-Faktors) for the confidence level
of 95 % and 99 % and the portions 90 %, 95 % and 99 %.
593

3. Final Remarks
It is the essential result of these investigations that even with a
limited number of measurements a representative statement on the
cladding thickness of a fuel plate is possible.
REFERENCES
/!/ M. Hrovath "Report on the status of the German Fuel and Fuel-
Element Development Programm";
IAEA-Seminar in Jiilich from 14.-18. September 1981;
IAEA-SR-77.
/2/ T. Görgenyi and W. Theymann
"Statistical evaluation of coating thickness measure-
ments"; Paper presented at the Informal Meeting onQuality Control of HTR-Fuels at the Atomic Energy
Establishment Winfrith, Dorchester, Dorset, 29 and 30
September, 1970.
594

HOW TO ORDER IAEA PUBLICATIONS
An exclusive sales agent for IAEA publications, to whom all orders andinquiries should be addressed, has been appointed for thefollowing countries:
CANADAUNITED STATES OF AMERICA UNIPUB, 4611-F Assembly Drive, Lanham, MD 20706-4391, USA
In the following countries IAEA publications may be purchased from thesales agents or booksellers listed or through major localbooksellers. Payment can be made in local currency orwith UNESCO coupons.
ARGENTINA
AUSTRALIABELGIUM
CHILE
CHINA
CZECHOSLOVAKIA
FRANCE
HUNGARY
INDIA
ISRAELITALY
JAPANPAKISTAN
POLAND
ROMANIARUSSIAN FEDERATION
SOUTH AFRICASPAIN
SWEDEN
UNITED KINGDOM
YUGOSLAVIA
Comisiôn Nacional de Energia Atömica, Avenida del Libertador 8250,RA-1429 Buenos AiresHunter Publications, 58 A Gipps Street, Collmgwood, Victoria 3066Service Courrier UNESCO, 202, Avenue du Roi, B-1060 BrusselsComisiôn Chilena de Energia Nuclear, Venta de Publicaciones,Amunategui 95, Casilla 188-D, SantiagoIAEA Publications in ChineseChina Nuclear Energy Industry Corporation, Translation Section,PO Box 2103, BeijmgIAEA Publications other than m ChineseChina National Publications Import & Export Corporation,Deutsche Abteilung, P O Box 88, BeijmgS N T L , Mikulandska 4, CS-116 86 Prague 1Alfa, Publishers, Hurbanovo namestie 3, CS-815 89 BratislavaOffice International de Documentation et Librairie, 48, rue Gay-Lussac,F-75240 Paris Cedex 05Kultura, Hungarian Foreign Trading Company,P O Box 149, H-1389 Budapest 62Oxford Book and Stationery Co , 17, Park Street, Calcutta-700 016Oxford Book and Stationery Co , Scmdia House, New Delhi-110 001YOZMOT (1989) Ltd, P O Box 56055, Tel Aviv 61560Librena Scientifica, Dotl Lucio de Biasio "aeiou",Via Meravigh 16, 1-20123 MilanMaruzen Company, Ltd, PO Box 5050, 100-31 Tokyo InternationalMirza Book Agency, 65, Shahrah Quaid-e-Azam, P O Box 729, Lahore 3Ars Polona-Ruch, Centrala Handlu Zagranicznego,Krakowskie Przedmiescie 7, PL-00-068 Warsawllexim, PO Box 136-137, BucharestMezhdunarodnaya Kniga, Smolenskaya-Sennaya 32-34, Moscow G-200Van Schaik Bookstore (Pty) Ltd, P O Box 724, Pretoria 0001Diaz de Santos, Lagasca 95, E-28006 MadridDîaz de Santos, Balmes 417, E-08022 BarcelonaAB Fntzes Kungl Hovbokhandel, Fredsgatan 2, P O Box 16356,S-103 27 StockholmHMSO, Publications Centre, Agency Section,51 Nine Elms Lane, London SW8 5DRJugoslavenska Knjiga, Terazije 27, P O Box 36, YU-11001 Belgrade
Orders from countries where sales agents have not yet been appointed andrequests for information should be addressed directly to:Division of PublicationsInternational Atomic Energy AgencyWagramerstrasse 5, P.O. Box 100, A-1400 Vienna, Austria