Use of Semiconductor-Based Oligonucleotide Microarrays for Influenza A Virus Subtype Identification...
10
JOURNAL OF CLINICAL MICROBIOLOGY, Apr. 2006, p. 1209–1218 Vol. 44, No. 4 0095-1137/06/$08.000 doi:10.1128/JCM.44.4.1209–1218.2006 Copyright © 2006, American Society for Microbiology. All Rights Reserved. Use of Semiconductor-Based Oligonucleotide Microarrays for Influenza A Virus Subtype Identification and Sequencing Michael J. Lodes, 1 †* Dominic Suciu, 1 † Mark Elliott, 1 Axel G. Stover, 1 Marty Ross, 1 Marcelo Caraballo, 1 Kim Dix, 1 James Crye, 1 Richard J. Webby, 2 Wanda J. Lyon, 3 David L. Danley, 1 and Andrew McShea 1 CombiMatrix Corporation, Mukilteo, Washington 98275 1 ; St. Jude Children’s Research Hospital, Memphis, Tennessee 38105 2 ; and AFIOH/SDE, Brooks City AFB, San Antonio, Texas 78235 3 Received 12 October 2005/Returned for modification 24 November 2005/Accepted 14 January 2006 In the face of concerns over an influenza pandemic, identification of virulent influenza A virus isolates must be obtained quickly for effective responses. Rapid subtype identification, however, is difficult even in well- equipped virology laboratories or is unobtainable in the field under more austere conditions. Here we describe a genome assay and microarray design that can be used to rapidly identify influenza A virus hemagglutinin subtypes 1 through 15 and neuraminidase subtypes 1 through 9. Also described is an array-based enzymatic assay that can be used to sequence portions of both genes or any other sequence of interest. Influenza A virus is a negative-strand RNA virus with a segmented genome that can infect a broad range of animals, including humans. Identification of a virus subtype is typically by serological or molecular identification of the subtype of the viral hemagglutinin (HA) and neuraminidase (NA) genes. Vi- ruses with any combination of the 16 HA (11) and 9 NA subtypes can infect aquatic birds, while fewer subtypes have been found to infect humans. However, interspecies transmis- sion can occur after recombination or mixing of subtypes in birds or pigs (14, 22, 26). In addition, new human strains of virus can arise by reassortment to accomplish antigenic shift when two or more subtypes infect the same host (24, 35). Maintenance of a subtype in the human population can also occur by antigenic drift (35), which occurs when genetic mu- tations of the HA and NA genes create virions that escape immune surveillance. Reference, clinical, and military laboratories must evaluate antigenic drift in the common influenza virus strains circulating each year so that these changes can be addressed in vaccine development. Also, avian influenza virus isolates must be mon- itored on a worldwide basis to detect virulent isolates that have the potential to infect humans and produce a future epidemic or pandemic. These needs have led to the creation of a global surveillance program to monitor outbreaks (13). The goal of sur- veillance is to gather information on the influenza virus subtypes that are circulating in human and animal populations so that recommendations can be made on the content of vaccines for the next season. This information is important, because genetic changes in certain influenza virus subtypes can occur rapidly. For example, variability of the H3N2 subtype has required 19 changes in the vaccine component over 29 years (from 1972) (13). New antigenic variants that require revisions in vaccine components can arise with a frequency of one every 1 to 2 years; and thus, diagnostic assays that are sensitive, specific, and accurate are required (13). In many situations, identification of the circulating subtype is not sufficient and a specific gene sequence is required. For example, genotype Z, the dominant avian H5N1 influenza vi- rus genotype currently circulating in Vietnam and Thailand, contains a mutation that is associated with resistance to aman- tadine and rimantadine (8, 36). Antiviral therapies generally should be given within 48 h of the onset of illness to be effective against human influenza (36). Thus, rapid and specific identifi- cation of this subtype and the availability of accurate sequence information are crucial for proper treatment. Identification of influenza virus subtypes is routinely accom- plished with viral detection (cell culture) and serological tech- niques, such as complement fixation, hemagglutination, hemag- glutination inhibition assays, and immunofluorescence methods (3, 5, 25, 31). Traditional methods are generally effective but involve labor-intensive and highly trained personnel. Because of their speed, specificity, and sensitivity, genomic assays are ideal complements to serological assays for the identification of the genotype of an unknown specimen, especially in cases where antigenic tests are not specific enough to differentiate closely related groups (10, 20, 27, 29, 33, 37). Reverse transcription-PCR (RT-PCR) is widely used for virus identification (1, 14, 30). How- ever, a positive amplification can be verified only by subsequent assays to elaborate sequence information. By overcoming this limitation, microarrays and biosensors have become valuable tools for viral discovery, detection, and genotyping (5, 6, 10, 15, 19, 20, 21, 28, 33, 34). Microarrays that contain several thousand different DNA sequences (probes) can theoretically identify several thousand different organisms. However, by using standard thermal hy- bridization, microarrays have their own issues, such as subop- timal hybridization conditions for all probes, mismatches that are difficult to detect (G-G or G-T, for example), or mis- matches that reside in a context (GC-rich) that makes detec- tion problematic. Even well-designed probes can display dif- ferences in maximal hybridization capacity of 2 orders of magnitude under different hybridization conditions (7); and thus, it is difficult to find one set of conditions that is optimal for all probes on an array (16, 32). New technologies must be developed to overcome the difficulties associated with tradi- * Corresponding author. Mailing address: CombiMatrix Corporation, 6500 Harbour Heights Parkway, Suite 301, Mukilteo, WA 98275. Phone: (425) 493-2272. Fax: (425) 493-2010. E-mail: [email protected]. † M.J.L. and D.S. contributed equally to this study. 1209 on February 18, 2016 by guest http://jcm.asm.org/ Downloaded from
-
Upload
independent -
Category
Documents
-
view
0 -
download
0
Transcript of Use of Semiconductor-Based Oligonucleotide Microarrays for Influenza A Virus Subtype Identification...
JOURNAL OF CLINICAL MICROBIOLOGY, Apr. 2006, p. 1209–1218 Vol. 44, No. 40095-1137/06/$08.00�0 doi:10.1128/JCM.44.4.1209–1218.2006Copyright © 2006, American Society for Microbiology. All Rights Reserved.
Use of Semiconductor-Based Oligonucleotide Microarrays forInfluenza A Virus Subtype Identification and Sequencing
Michael J. Lodes,1†* Dominic Suciu,1† Mark Elliott,1 Axel G. Stover,1 Marty Ross,1 Marcelo Caraballo,1Kim Dix,1 James Crye,1 Richard J. Webby,2 Wanda J. Lyon,3 David L. Danley,1 and Andrew McShea1
CombiMatrix Corporation, Mukilteo, Washington 982751; St. Jude Children’s Research Hospital, Memphis,Tennessee 381052; and AFIOH/SDE, Brooks City AFB, San Antonio, Texas 782353
Received 12 October 2005/Returned for modification 24 November 2005/Accepted 14 January 2006
In the face of concerns over an influenza pandemic, identification of virulent influenza A virus isolates mustbe obtained quickly for effective responses. Rapid subtype identification, however, is difficult even in well-equipped virology laboratories or is unobtainable in the field under more austere conditions. Here we describea genome assay and microarray design that can be used to rapidly identify influenza A virus hemagglutininsubtypes 1 through 15 and neuraminidase subtypes 1 through 9. Also described is an array-based enzymaticassay that can be used to sequence portions of both genes or any other sequence of interest.
Influenza A virus is a negative-strand RNA virus with asegmented genome that can infect a broad range of animals,including humans. Identification of a virus subtype is typicallyby serological or molecular identification of the subtype of theviral hemagglutinin (HA) and neuraminidase (NA) genes. Vi-ruses with any combination of the 16 HA (11) and 9 NAsubtypes can infect aquatic birds, while fewer subtypes havebeen found to infect humans. However, interspecies transmis-sion can occur after recombination or mixing of subtypes inbirds or pigs (14, 22, 26). In addition, new human strains ofvirus can arise by reassortment to accomplish antigenic shiftwhen two or more subtypes infect the same host (24, 35).Maintenance of a subtype in the human population can alsooccur by antigenic drift (35), which occurs when genetic mu-tations of the HA and NA genes create virions that escapeimmune surveillance.
Reference, clinical, and military laboratories must evaluateantigenic drift in the common influenza virus strains circulatingeach year so that these changes can be addressed in vaccinedevelopment. Also, avian influenza virus isolates must be mon-itored on a worldwide basis to detect virulent isolates that havethe potential to infect humans and produce a future epidemicor pandemic. These needs have led to the creation of a globalsurveillance program to monitor outbreaks (13). The goal of sur-veillance is to gather information on the influenza virus subtypesthat are circulating in human and animal populations so thatrecommendations can be made on the content of vaccines for thenext season. This information is important, because geneticchanges in certain influenza virus subtypes can occur rapidly. Forexample, variability of the H3N2 subtype has required 19 changesin the vaccine component over 29 years (from 1972) (13). Newantigenic variants that require revisions in vaccine componentscan arise with a frequency of one every 1 to 2 years; and thus,diagnostic assays that are sensitive, specific, and accurate arerequired (13).
In many situations, identification of the circulating subtype isnot sufficient and a specific gene sequence is required. Forexample, genotype Z, the dominant avian H5N1 influenza vi-rus genotype currently circulating in Vietnam and Thailand,contains a mutation that is associated with resistance to aman-tadine and rimantadine (8, 36). Antiviral therapies generallyshould be given within 48 h of the onset of illness to be effectiveagainst human influenza (36). Thus, rapid and specific identifi-cation of this subtype and the availability of accurate sequenceinformation are crucial for proper treatment.
Identification of influenza virus subtypes is routinely accom-plished with viral detection (cell culture) and serological tech-niques, such as complement fixation, hemagglutination, hemag-glutination inhibition assays, and immunofluorescence methods(3, 5, 25, 31). Traditional methods are generally effective butinvolve labor-intensive and highly trained personnel. Because oftheir speed, specificity, and sensitivity, genomic assays are idealcomplements to serological assays for the identification of thegenotype of an unknown specimen, especially in cases whereantigenic tests are not specific enough to differentiate closelyrelated groups (10, 20, 27, 29, 33, 37). Reverse transcription-PCR(RT-PCR) is widely used for virus identification (1, 14, 30). How-ever, a positive amplification can be verified only by subsequentassays to elaborate sequence information. By overcoming thislimitation, microarrays and biosensors have become valuabletools for viral discovery, detection, and genotyping (5, 6, 10, 15,19, 20, 21, 28, 33, 34).
Microarrays that contain several thousand different DNAsequences (probes) can theoretically identify several thousanddifferent organisms. However, by using standard thermal hy-bridization, microarrays have their own issues, such as subop-timal hybridization conditions for all probes, mismatches thatare difficult to detect (G-G or G-T, for example), or mis-matches that reside in a context (GC-rich) that makes detec-tion problematic. Even well-designed probes can display dif-ferences in maximal hybridization capacity of 2 orders ofmagnitude under different hybridization conditions (7); andthus, it is difficult to find one set of conditions that is optimalfor all probes on an array (16, 32). New technologies must bedeveloped to overcome the difficulties associated with tradi-
* Corresponding author. Mailing address: CombiMatrix Corporation,6500 Harbour Heights Parkway, Suite 301, Mukilteo, WA 98275. Phone:(425) 493-2272. Fax: (425) 493-2010. E-mail: [email protected].
† M.J.L. and D.S. contributed equally to this study.
1209
on February 18, 2016 by guest
http://jcm.asm
.org/D
ownloaded from

tional microarray thermal techniques and also to develop rapidand less expensive target labeling systems and, eventually, re-place expensive slide scanning devices (9).
Here we describe an improved assay that combines the sen-sitivity and specificity of enzymatic reactions with the cost-effective strategy of using a labeled common oligonucleotideprimer that is extended to the site of the match or mismatch.This assay system can be used to identify influenza A virussubtypes and sequence the subtype of interest and requiresonly a 1.0- to 1.5-h hybridization and enzymatic extension-ligation step.
MATERIALS AND METHODS
Influenza virus subtype reference samples and unknown samples. Influenzaviruses were isolated by using Madin-Darby canine kidney (MDCK) cells sup-plemented with 1 �g/ml L-(tosylamido-2-phenyl) ethyl chloromethyl ketone-treated trypsin. Briefly, the samples were added to monolayers of MDCK cellsand incubated for 1 h at 37°C to allow virus adsorption to the cells. The inoculumwas decanted, Eagle’s minimum essential medium supplemented with 0.2%bovine serum albumin was added, and the monolayers were incubated for 3 to 5days at 37°C. After cytopathic effects appeared, the presence of influenza viruswas confirmed by using hemagglutination of chicken erythrocytes and RT-PCRagainst the HA gene. A panel of reference influenza A virus RNA samples for 15HA and 9 NA subtypes was developed by conducting hemagglutination inhibi-tion assays with a panel of reference antisera against HA subtypes 1 through 15and NA subtypes 1 through 9. Reference virus sequences were confirmed foreach HA and NA subtype. Viral RNA was extracted from the supernatants ofcultures of infected cells by using the RNeasy mini kit (QIAGEN, Chatsworth,CA), according to the manufacturer’s instructions. Reverse transcription andPCR amplification were carried out under standard conditions by using influenzavirus-specific primers. The PCR products were purified with QIAquick PCRpurification kits (QIAGEN), and sequencing reactions were performed at theHartwell Center for Bioinformatics and Biotechnology at St. Jude Children’sResearch Hospital (Memphis, TN).
Broad scan array probe design. Viral sequence data were obtained from theGenBank database and from the Influenza Sequence Database (23). For HAserotypes, 1,614 animal isolates and 1,937 human isolates were selected; and forNA serotypes, 552 human isolates and 831 animal isolates were selected. Bothdata sets were treated in the same way by use of a modification of the method ofWang et al. (34), in which probe uniqueness was based on subtype differences.For each sequence, nonoverlapping appended primers were made, tiling theentire sequence. These oligonucleotides were designed to have similar annealingstabilities, as judged by a nearest-neighbor thermodynamic model (2), and weredesigned to have a melting temperature (Tm) of 50°C. Probes that had significantsecondary structures (Tm � 40°C) were taken out of the set. Finally, probesfrom only the first 500 bp of sequence were used (bp 50 to 500). After tilingand culling, 23,568 HA probes and 15,191 NA probes were left. Each sequenceand probe was grouped and labeled by its serotype, and databases were gener-ated from the compiled HA and NA sequences of the isolates. Probes wereselected to be exclusive to a given subtype, as judged by pairwise BLASTN search(4). Figure 1 shows the overall scope of the design. It shows the number ofsequences in the initial database, the number of probes designed, and the finalnumber of probes selected for each subtype. A poly(T)10 spacer was added to the3� ends of all probes to avoid surface inhibition. Probe design files for arraysynthesis were generated with Layout Designer (CombiMatrix Corp., Mukilteo,WA). Oligonucleotide microarrays were synthesized on semiconductor micro-chips containing over 12,000 independently addressable electrodes (CustomAr-ray; CombiMatrix Corp.).
Sequencing chip probe design. Sequencing chips were designed by using se-quences that were representative of each subtype of interest. For this study, wechose sequences that represented subtype H9N2 (GenBank accession numbersAF156378 and AF222654). Probes were tiled by one nucleotide to cover thesequences of interest, and probes were designed to have a Tm of approximately55°C. Four probes were designed for each nucleotide to be examined and wereidentical except for the 5� nucleotides, which consisted of either an A, C, T, orG (Fig. 2). This chip design was hybridized with both HA and NA gene targetsprepared from influenza A virus isolates A/Quail/Hong Kong/G1/97 (H9N2) andA/Chicken/Hong Kong/NT17/99 (H9N2).
Target preparation. A 500- to 600-bp amplicon that contained the 5� end ofeither the HA or NA gene was amplified from first-strand cDNA. First-strand
cDNA was produced from influenza virus RNA (Table 1) with SuperScript IIreverse transcriptase (Invitrogen, Carlsbad, CA) and a tagged universal primer,TAATACGACTCACTATAGGAGCAAAAGCAGG (the tag sequence is under-lined, and the universal influenza virus sequence is in boldface). Amplificationswere accomplished with a universal forward tag primer GCATCCTAATACGACTCACTATAGG and a specific reverse primer or, in the case of unknownsamples, a pool of 100 �M primers and the first-strand cDNA from reversetranscription. Specific reverse primers for reference isolate amplification wereselected to produce an amplicon of approximately 500 to 600 bp. Primer se-quences for HA (23 primers) and NA (15 primers) pools were designed byfollowing the probe design procedure presented above. However, sequences inthe 5� 500- to 600-bp region of the HA and NA genes that were common tomultiple subtypes (H1, H2, H3, H4, H5, H7, and H9 and N1, N2, N3, N7, andN8) were chosen. The reaction conditions consisted of a 5-min denaturation at94°C, followed by 40 cycles of a 30-s 94°C denaturation step, a 30-s 55°C anneal-ing step, and a 30-s 72°C extension; and finally, a 10-min extension at 72°C wasperformed. The resulting PCR product was cleaned with a QIAGEN QIAquickPCR purification kit, and a second, one-way amplification resulted in a single-stranded target. One-way amplifications were accomplished with the respectivespecific reverse primer or primer pool only and 2 to 5 �l of cleaned amplificationproduct from amplification 1. The reaction conditions were similar to thosedescribed above, with 50 cycles of amplification. The resulting tagged, single-stranded target was purified with a QIAGEN QIAquick PCR purification kit.For standard hybridizations, a biotinylated, single-stranded target was producedas described above for one-way PCR; however, biotin-14-dCTP (Invitrogen) wasincorporated into the product during amplification.
Hybridizations and enzymatic reactions. The oligonucleotide probes synthe-sized on the chip were 5� phosphorylated with T4 polynucleotide kinase (NewEngland Biolabs, Beverly, MA) for 30 min at 37°C. The single-stranded targetwas heated to 95°C for 10 min and placed on ice, and T4 ligase buffer was addedto a 1� concentration. A 5�-labeled T7 oligonucleotide (Cy3 or Cy5; IntegratedDNA Technologies, Inc., Coralville, IA) was added to a concentration of 1 �Mto provide a signal for detection and a primer for extension. This solution wasadded to the chip array hybridization chamber, and the chip was incubated at45°C for 1 h. After the array was washed with 2� phosphate-buffered saline(PBS)–0.5% Tween 20 (PBST), 2� PBS, and 1� Escherichia coli ligase buffer, amixture consisting of 1� E. coli ligase buffer, 0.2 mM deoxynucleoside triphos-phates, and 20 units each of AmpliTaq DNA polymerase, Stoffel fragment(Applied Biosystems, Foster City, CA), and E. coli ligase was added to the array
FIG. 1. Number of sequences in the initial database, number ofprobes designed, and final number of probes selected for each subtype.BinStr, subtype identity for each probe after BLASTN searches.
1210 LODES ET AL. J. CLIN. MICROBIOL.
on February 18, 2016 by guest
http://jcm.asm
.org/D
ownloaded from
and the array was incubated at 37°C for 30 min. The array was washed twice for2 min each time with 0.1 N NaOH at room temperature and viewed with a slidereader (GenePix 4000B; Axon Instruments, Molecular Devices, Sunnyvale, CA).
Standard hybridization conditions for the biotinylated target included pre-blocking for 15 min at 45°C with 6� SSPE (1� SSPE is 0.18 M NaCl, 10 mMNaH2PO4, and 1 mM EDTA [pH 7.7]) containing 0.05% Tween 20 (SSPET), 2.0mM EDTA, 5� Denhardt’s solution, and 0.05% sodium dodecyl sulfate, fol-lowed by hybridization of the biotinylated target in preblock solution for 1 h at45°C. The arrays were then washed once for 5 min with 6� SSPET at 45°C andthen for 30 s each with 3� SSPET, 0.5� SSPET, 2� PBST, and 2� PBS at roomtemperature. The hybridized array was then blocked with 5� casein-PBS buffer(BioFX Laboratories, Owings Mills, MD) for 15 min at room temperature andlabeled for 30 min with Cy5-streptavidin (GE Healthcare, Amersham Biosciences,Piscataway, NJ) diluted 1:1,000 in 5� casein-PBS buffer. The arrays were scannedafter they were washed twice with 2� PBST and twice with 2� PBS.
Data analysis. The microarrays were scanned for probe and target fluores-cence intensity with a GenePix 4000B optical scanner (Molecular Devices).Image intensities were quantified with Microarray Imager (CombiMatrix Corp.)and graphed with Microsoft Excel software. Subtype identification was accom-plished by averaging HA and NA subtype intensity values and then plotting theresults in Excel software. HA and NA subtype DNA sequence information wasgenerated from sequencing array intensity data with an Excel routine designed tointerrogate units of 4 datum points and then associate the most intense signalwith the nucleotide represented by that probe. Sequence strings were then usedto search the GenBank nonredundant database with the BLASTN program.
Statistical analysis of influenza virus subtype. The data used for analysiscomprised measurements carried out with 15 HA subtypes represented by 7,354probes and 9 NA subtypes represented by 4,646 probes. Data were collected inthree steps: after hybridization, after an enzymatic method was used to covalentlyattach the perfectly matched sequence at each probe, and after a stringent washprocedure was performed to remove spurious signals. In total, there were177,264 observations. Each observation comprised four categorical variables,hybridization label (hyblabel), hybridization type (wash), protein type (codeprot), and predicted bound sequence (imlabel), and seven continuous variables,sum of intensity (sumhit), average intensity (avg), standard deviation (standev),predicted number of BLAST hits (prednumhit), probes number of probes not hitby BLAST (predno), energy of hybridization (dG), and correlation of dG withaverage intensity (correl). The data were normalized and reported as standardscores (Z values). A binary variable (call) was coded as a correct influenza virusassociation (a value of 1) or an incorrect influenza virus association (a value of 0).
RESULTS
Broad-scan hybridization. The broad-scan microarray wasdesigned to identify influenza A virus subtypes based onunique probe sets for HA subtypes 1 through 15 and NAsubtypes 1 through 9. Figure 3A shows the pattern obtainedfrom the hybridization of the H2 and N2 amplicons to thearray. Figure 3B shows that much of the background hybrid-ization of the target to the probes was eliminated by the en-zymatic extension and ligation steps and stringent washing.The hybridization patterns correspond to the probe design onthe array (Fig. 3C). When HA and NA probe intensity datawere sorted and graphed to show the relationship betweensignal intensity and correct subtype hybridization, the majority
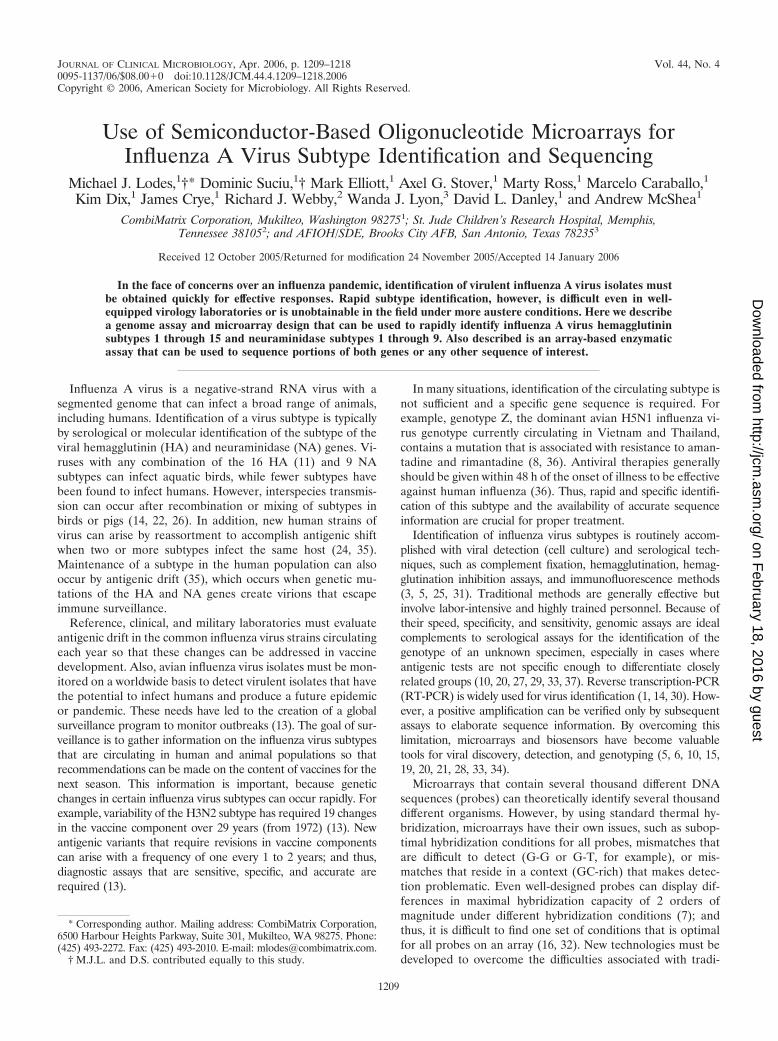
FIG. 2. Diagram of the strategy for microarray DNA sequencing.Four target-specific (antisense) probes, one set for each base of desiredsequence, are identical except for the 5�-terminal residue (the probeterminates in bases A, C, G, and T). After hybridization of the probes,target DNA, and Cy3-labeled primer, a mixture of enzymes, buffer, anddeoxynucleoside triphosphates is added to the array. The labeled primeris extended and ligated to the matching probe, and finally, the array iswashed with 0.1 N NaOH and scanned for fluorescence. High fluores-cence intensity indicates that the labeled primer is covalently bound to theprobe that is a perfect match to the target. The sequence can be extractedby joining bases that are associated with an elevated signal.
TABLE 1. Reference antigens for HA and NA subtypes
Serotypeand
subtypeVirus Subtype GenBank
accession no.
HAH1 A/PR/8/34 H1N1 ISDN13422H2 A/Mallard/NY/6750/78 H2N2 L11137H3 A/Duck/Ukraine/1/63 H3N8 V01087H4 Duck/Czech/56 H4N6 D90302H5 A/Ruddy Turnstone/DE/244/91 H5N2 U05330H6 A/Shearwater/Australia/1/72 H6N5 D90303H7 A/Equine/Prague/1/56 H7N7 X62552H8 A/Turkey/Ontario/6118/68 H8N4 D90304H9 A/Chicken/HK/NT16/99 H9N2 AF222608H9 A/Quail/Hong Kong/G1/97 H9N2 AF156378H10 A/Chicken/Germany/N/49 H10N7 M21647H11 A/Duck/England/56 H11N6 D90306H12 A/Mallard/Alberta/60/76 H12N5 D90307H13 A/Gull/MD/704/77 H13N6 M26090H14 A/Mallard/Gurjev/263/82 H14N5 M35997H15 A/Duck/Australia/341/83 H15N8 L43916
NAN1 A/NWS-A/NJ/76 H1N1 M27970N2 A/Chicken/HK/NT16/99 H9N2 AF222654N2 A/Quail/Hong Kong/G1/97 H9N2 AF156396N2 A/Duck/Hong Kong/Y280/97 H9N2 AF156394N3 A/NWS-A/Tern/South Africa H1N3 NAN4 A/NWS-A/Turkey/Ontario/
6118/68H1N4 K01013
N5 A/NWS-A/Shearwater/Australia/72
H1N5 M24740
N6 A/NWS-A/Duck/England/56 H1N6 NAN7 A/Equine/Prague/1/56 H7N7 U85989N8 A/Duck/Chabarovsk/1610/72 H3N8 L06573N9 A/Duck/Memphis/564/74 H11N9 #N/A
VOL. 44, 2006 INFLUENZA A VIRUS SUBTYPE IDENTIFICATION AND SEQUENCING 1211
on February 18, 2016 by guest
http://jcm.asm
.org/D
ownloaded from

of the high-intensity signal could be attributed to binding to thecorrect probes (Fig. 3D). For example, data for H2N2 hybrid-ization show that 43 of the first 50 H2 probes and 50 of the first50 N2 probes hybridized to the correct target.
The amplification of unknown human influenza A virus iso-lates was accomplished with a pool of reverse primers at aconcentration of 100 �M each. Two pools were used: one poolfor the HA gene and one pool for the NA gene. All unknowntargets were successfully amplified, and when they were hy-bridized to the arrays, they were identified as subtype H3N2(Fig. 4). The hybridization patterns of the three unknown sam-ples indicated that the HA and NA sequences from samples 2and 3 were very similar. The H3 hybridization pattern andintensity differed in sample 1 and showed a potential sequencerelationship to H1 (data not shown). Very distinct hybridiza-tion patterns were also seen for hemagglutinins H5 from H5N2(GenBank accession number U05330) and H5N1 (current birdinfluenza strain) (data not shown), indicating that the arrayscould potentially be used to identify subgroupings of influenzavirus subtypes.
Analysis of influenza virus HA and NA subtypes. Visual HAand NA subtype determinations were made in two ways: (i) bymarking the array images with the location of subtype-specificprobes and (ii) by graphing of the subtype probe intensities.Correct subtype-specific calls could be made by aligning areasof intense signal with the respective subtype-specific probes(Fig. 5). In addition, bar graphs of mean subtype intensityvalues could be used to predict the correct HA and NA sub-types (Fig. 6 and 7). All 15 HA subtypes generated from ref-erence isolates (Fig. 6) could be correctly identified with thearray, as could all 9 NA subtypes (Fig. 7). We also showed inmixing experiments that two different subtypes, present at a 1to 10 dilution, could be detected on the same array (array 1,1% H8, 9% H12, 1% N9, and 9% N8; array 2, 9% H8, 1% H12,9% N9, and 1% N8; data not shown). In several cases, themean signals for specific subtypes showed inverse relationshipswith the number of HA- and NA-specific probes. Intense pos-itive signals within subtype-specific groups of probes number-ing approximately 1,000 or more were averaged due to thelarge number of lower signals (Fig. 8). This effect can be
FIG. 3. Graphed probe intensity values for an array hybridized with an H2N2 target. When the data were extracted immediately afterhybridization (A), abundant cross hybridization was visible. After enzymatic reactions and stringent washing, the background signal was drasticallyreduced to expose specific hybridizations (B). Regions of the array that were populated with subtype-specific probes are shown (C). Data weresorted by gene (HA or NA), and the greatest intensities were identified (D).
1212 LODES ET AL. J. CLIN. MICROBIOL.
on February 18, 2016 by guest
http://jcm.asm
.org/D
ownloaded from

reduced or eliminated by clustering similar sequences within asubtype and then taking the mean of each cluster or by reduc-ing the number of probes for each subtype to between 50 and150 of the most universal subtype sequences.
Statistical analysis. Statistical analyses consisted of descrip-tive statistics and distribution analysis, univariate correlation,analysis of variance, logistic regression, and selection of thebest marker set. The histograms of the average intensities ofthe probes (Z scores) showed wide separation between thebackground (negative) and signal measurements (positive)(Fig. 9). Inspection of the distributions showed normality inthe independent variable correlation. Analysis of variance in-dicated that the statistically significant independent variableswere average intensity, standard deviation, the interaction ofdG and average intensity, protein type, and hybridizationmethod. The average intensity was the single most significantindependent variable for the identification of the viral subtypeand thus was used for analysis. The correlation matrix showedthat the most significant pairwise correlations were betweenthe average intensity and the variables sumhits, standard devi-ation, call, and correl.
Influenza subtype sequencing. Viral HA and NA subtypesequencing was accomplished with a simple and rapid enzy-matic assay. A mixture including DNA polymerase and ligase
was used to extend labeled common primers on single-stranded target DNA to the 5� end of the hybridized HA andNA sequencing probes and then ligate the extended primer toprobes that matched the target sequence. A 0.1 N NaOH washremoved any unligated signal; and after the array was scanned,intensity data were exported to an Excel worksheet. For exam-ple, a probe with a 5�-terminal match to the target DNA (e.g.,G) was ligated to the extended, labeled primer, while probeswith terminal mismatches (e.g., T, C, and A) were not ligatedand the labeled target was removed upon washing. Sequenceinformation was extracted with a routine designed to associatethe correct base with the highest signal from sets of four probesthat were tiled by 1 nucleotide to cover the sequence of interest(Fig. 2). Hybridization to the array probes was generally uni-form, as probes with matches and mismatches are identicalexcept for the 5� nucleotides. An example of neuraminidasesubtype sequencing on an array designed to interrogate 100nucleotides of both the HA and NA genes is shown in Fig. 10.Here we have sequenced target DNA that was identical to thearray probe sequences. Probe sequences for the HA gene weregenerated from the A/Chicken/Hong Kong/G1/97 (H9N2) HAgene sequence, and probes for the NA gene were generated fromthe A/Chicken/Hong Kong/NT16/99 (H9N2) NA gene sequence.Figure 10A illustrates the probe signal intensity data for the NAgene, while Fig. 10B shows the results of a search of the GenBankdatabase with the sequence generated from this array. With a12,000-point array, it is possible to sequence up to 3,000 bases.Here we sequenced approximately 500 to 600 nucleotides, de-pending upon the length of the target DNA, of both the HA andthe NA genes with an accuracy of over 90%. Even when the targetDNA was synthesized from isolates that differed in their HA andNA sequences (HA sequence from A/Chicken/Hong Kong/NT16/99 [H9N2] and NA sequence from A/Chicken/Hong Kong/G1/97 [H9N2]), the resulting sequence was still over 90% correct.The intensity of the hybridization signal for each probe was af-fected by the respective secondary structure of the probe, whichresulted in a weaker hybridization and a weaker resulting signal.However, the accuracy of base calling was not significantly af-fected by the secondary structure of the probe. In the sequencefrom approximately 500 nucleotides of both the HA and the NAgenes, approximately 4.3% of the base calls were inaccurate (45 of1,043 nucleotides). Inaccurate base calls were predominately dueto the ligated mismatches A-G (1.4%), A-A (1.0%), T-G (0.6%),G-G (0.3%), and T-T (0.2%). These mismatches are generallymore difficult to detect because of their low delta G values. In-accurate base calls that were due to mismatches with high delta Gvalues were relatively less common, with A-C, C-C, and C-Tmismatches accounting for 0.1, 0.1, and 0% of the missed calls,respectively.
DISCUSSION
While traditional assays for influenza virus detection andtyping represent the “gold standard,” they alone cannot meetthe future needs for rapid, sensitive, specific, and simple meth-ods. For example, although immunological methods are excel-lent for determining subtypes, they do not give detailed geneticinformation or information when antigenic shifts occur. RT-PCR techniques depend on specific primers, which may failwhen corresponding viral sequences mutate. We are develop-
FIG. 4. Identification of unknown human influenza A virus isolates.Three influenza A virus isolates of unknown subtype were amplified witha universal forward and pooled reverse primers, followed by one-wayamplification with the same pooled reverse primers; and then the isolateswere hybridized to the broad-scan influenza virus array. After the arraywas scanned, the extracted fluorescence intensity data for each subtypeprobe group were averaged and plotted. The correct subtypes were indi-cated by the highest average signal. The background signal (BG) wascalculated from the average signal of the quality control probes.
VOL. 44, 2006 INFLUENZA A VIRUS SUBTYPE IDENTIFICATION AND SEQUENCING 1213
on February 18, 2016 by guest
http://jcm.asm
.org/D
ownloaded from

ing a semiconductor-based oligonucleotide array technologythat can be used with fluorescent labels and traditional opticalscanning devices or used as a biodetector using electrochemi-cal techniques for analysis (9). This platform is extremely flexi-ble, which allows array designs to be rapidly and easily modifiedand synthesized, thus permitting oligonucleotides of interest to betested empirically. In addition, the ability to use electrochemicaldetection with semiconductor microchips eliminates the need forexpensive optical scanning equipment (9). Clearly, the cost perassay and the associated costs of the equipment needed to runand analyze the assay are critical for diagnostic applications suchas these. The instrumentation used to detect electrochemical sig-nals generated on semiconductor chips will be helpful for reduc-ing these laboratory expenses. Also, when the target sample thatwill be hybridized in the array is prepared, an end-point measure-ment in the PCR can be used as a gateway to limit the choice ofsamples to be run (i.e., assays are run only if the PCR result ispositive).
For this study we have developed an influenza A virus arraythat contains specific probes for each of the 15 HA subtypesand 9 NA subtypes and then hybridized targets generated fromall 15 HA and 9 NA subtypes by RT-PCR amplification ofinfluenza A reference virus RNA. The array was developedwith nonoverlapping probes with similar annealing stabilitiesthat were generated from the influenza virus sequence data-base, which consists of over 3,000 HA sequences and over1,000 NA sequences. Subtype-specific probes were then se-
lected from a pool of over 23,000 HA sequences and 15,000NA sequences and then compared to the database to ensurethat each probe was unique to the respective subtype andwould hybridize to the maximum number of variant sequences.Our goal is to have maximum coverage of all known influenzavirus strains and provide useful information even when a novelstrain is encountered. By shifting the burden of bioinformaticsto the beginning of the process rather than relying on sequenc-ing and a subsequent BLAST search and bioinformatic analy-sis, this system can be used by less sophisticated users or usersin the field, where access to complex analysis tools may belimited.
All HA and NA subtypes were correctly identified with thisassay platform. Weak average intensity profiles for some sub-types were due to dilution of a positive signal by subtypeprobes that were not hybridized or that weakly hybridized tothe subtype target. In these cases the average signals will bereduced by dilution of the signal. By eliminating unnecessaryor cross-reacting probes and limiting the probe number toapproximately 100 to 200 of the most universal sequences foreach subtype, we can correct this artifact of the array. Thisapproach would also reduce the number of probes so thatmultiple assays can be run on an array that is divided intoseveral sectors. This again could be used to provide cost sav-ings per assay with a minimal loss in capability. A secondapproach is to subdivide the probes for each subtype into similarclusters and thus concentrate the positive probes, which would
FIG. 5. Visual identification of HA and NA subtypes for H2N2 (top) and H15N9 (bottom). Arrays were hybridized with reference subtypetarget, labeled primer was extended and ligated, and the arrays were finally washed and scanned. The schematic below the arrays shows regionspopulated with subtype-specific probes.
1214 LODES ET AL. J. CLIN. MICROBIOL.
on February 18, 2016 by guest
http://jcm.asm
.org/D
ownloaded from

increase the average signal for a positive identification. Theseapproaches would also produce positive probe sequences that aretiled across the viral sequence of interest and should result in anapproximation or a best-fit sequence for the unknown subtype.
In addition, with the subtype sequencing array and protocolpresented here, we are able to sequence approximately 500 ormore nucleotides of the HA and NA genes after the subtypeshave been identified with our broad-scan subtyping array. Ourstrategy for sequencing probe selection is based upon severalcriteria, including Tm, length, and location in the HA and NAgene sequences. Published structural analysis and antigenicepitope mapping indicate that the HA receptor-binding struc-ture and surface antigenic epitopes are predominantly locatedwithin the 5� 720 bp (12, 17, 18).
With this sequencing assay, approximately 95% or more ofthe bases were accurately called (998 of 1,043 bases). Miscallswere predominately due to strong secondary structures, whichcan be predicted and avoided before the assay is carried out,and the ligated mismatches A-G, A-A, T-G, G-G, and T-T.These mismatches are generally more difficult to detect be-cause of their low delta G values. For example, sequence errorsresulting from A-G mismatches represented 1.4% of the totalerrors or 6% of the potential A-G mismatches (15 of 251).Strong secondary structures (hairpins and palindromes) inter-fere with probe-target hybridization and result in a reducedsignal. These sequencing arrays will eventually contain either aconsensus subtype sequence or a known subtype sequence thatlacks a high degree of secondary structure. Replicate probes
FIG. 6. Mean values of probe hybridization intensities for hemagglutinin reference subtypes 1 through 15. For each individual graph, probesignal intensity values are indicated on the left and specific subtype probes are indicated at the bottom. An asterisk indicates that standardhybridizations with biotinylated targets were used instead of the extension-ligation method and that labeling was with streptavidin-Cy5.
VOL. 44, 2006 INFLUENZA A VIRUS SUBTYPE IDENTIFICATION AND SEQUENCING 1215
on February 18, 2016 by guest
http://jcm.asm
.org/D
ownloaded from
for each base of sequence should reduce artifacts due to dif-ficult mismatches by averaging out the mismatch signal. Be-cause microarray-based sequencing is based on probe-targethybridization, the target sequence cannot diverge significantlyfrom the arrayed sequence. However, under nonstringent hy-bridization conditions, internal mismatches between the probeand the target sequences do not have as great an impact onhybridization and sequencing. This technique is best suited forthe sequencing of similar viruses, such as seasonal quasispeciescomplexes, or for surveys for mutations in an isolate over time.
We have shown that influenza A virus HA subtypes 1through 15 and NA subtypes 1 through 9 can be rapidly andspecifically identified and sequenced by using oligonucleotidemicroarrays by a protocol that requires less than 1 h for targethybridization. This assay precludes the need for traditionaltarget labeling systems and integrates an enzyme-based proce-dure that overcomes many of the shortfalls of traditional ther-mal hybridizations, such as optimal hybridization conditionsand difficult mismatch detection (28). However, the influenzavirus subtyping array is also compatible with traditional label-ing, hybridization, and washing protocols that can be com-pleted within 1.0 to 1.5 h. These methods lack the enzymaticstep and have slightly reduced single-base mismatch discrimi-nation. However, use of this method allows the array to be“stripped” and reused multiple times since there is no covalentcoupling of the label to the array. In addition, this array canalso benefit from the sectoring approach mentioned above tofurther bring costs to a minimum. This platform is a viablealternative to RT-PCR because of the combination of assayspeed; array sectoring, which would allow multiple assays onone array; the potential to strip and reuse the chip up to five
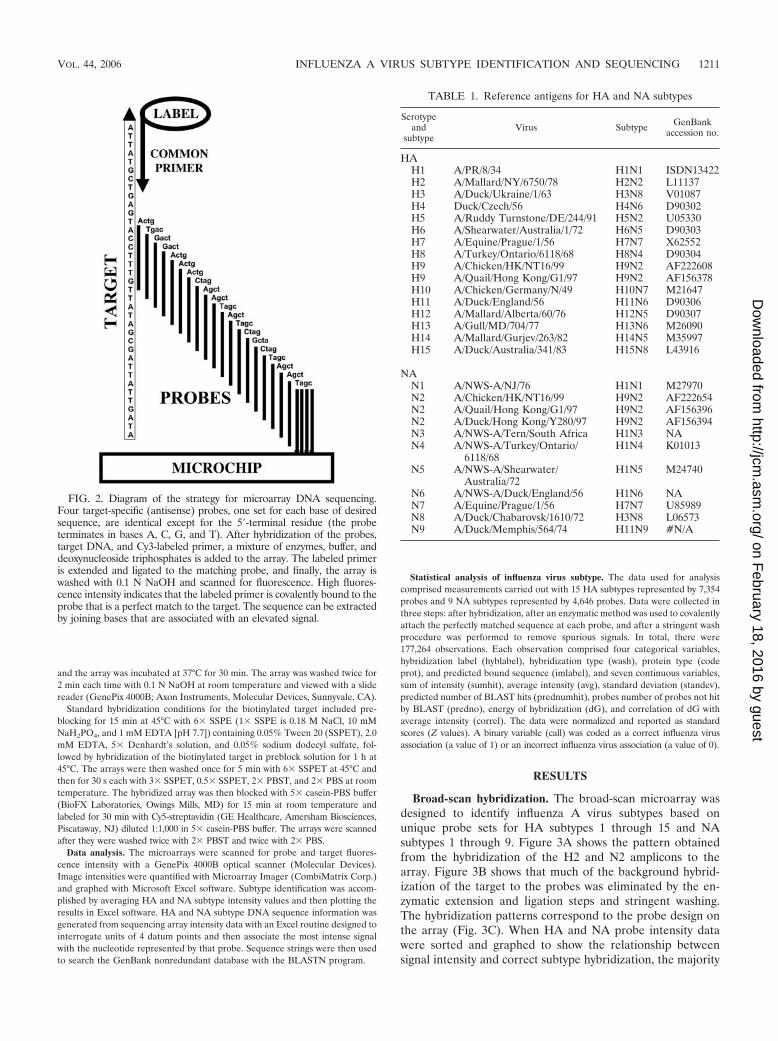
FIG. 7. Mean values of probe hybridization intensities for neuraminidase reference subtypes 1 through 9. For each individual graph, probesignal intensity values are indicated on the left, and specific subtype probes are indicated at the bottom. An asterisk indicates that standardhybridizations were used and that labeling was with streptavidin-Cy5.
FIG. 8. Comparison of the number of probes per HA (A) and NA(B) subtype with the average signal intensity for each subtype. In manycases, the two values show an inverse relationship due to the averagingof large numbers of probe intensity values.
1216 LODES ET AL. J. CLIN. MICROBIOL.
on February 18, 2016 by guest
http://jcm.asm
.org/D
ownloaded from
times (for conventional hybridizations); and the adaptability toinexpensive electrochemical scanning devices.
The target sample preparation system used here is similar tothat used for standard RT-PCR-based methods, except that ituses a very redundant consensus priming system that maxi-mizes the chance that novel strains of influenza virus will beamplified and thus minimizes false-negative results. The chipcontains multiple probes that correspond to key distinguishingelements of each HA or NA subtype. It is laid out in a visualpattern so that it can be read visually for quick identification aswell as analyzed with more advanced algorithms. The systemcan also identify rare versus more commonly seen geneticvariants based on the organization of subtype-specific probes(i.e., the probes are arranged in order from more universal tomore specific for each subtype).
Rapid identification of the HA and NA subtypes followed bysequencing from critical regions of the HA and NA genes, suchas surface antigenic epitopes, will significantly decrease thetime and cost for the identification of potential lethal virusstrains. This study and studies in other laboratories are dem-onstrating that the detection, identification, and sequencing ofviral genomes in samples by using the oligonucleotide microar-ray technology in combination with electrochemical detectionis a viable rapid approach that can complement traditionalmethods.
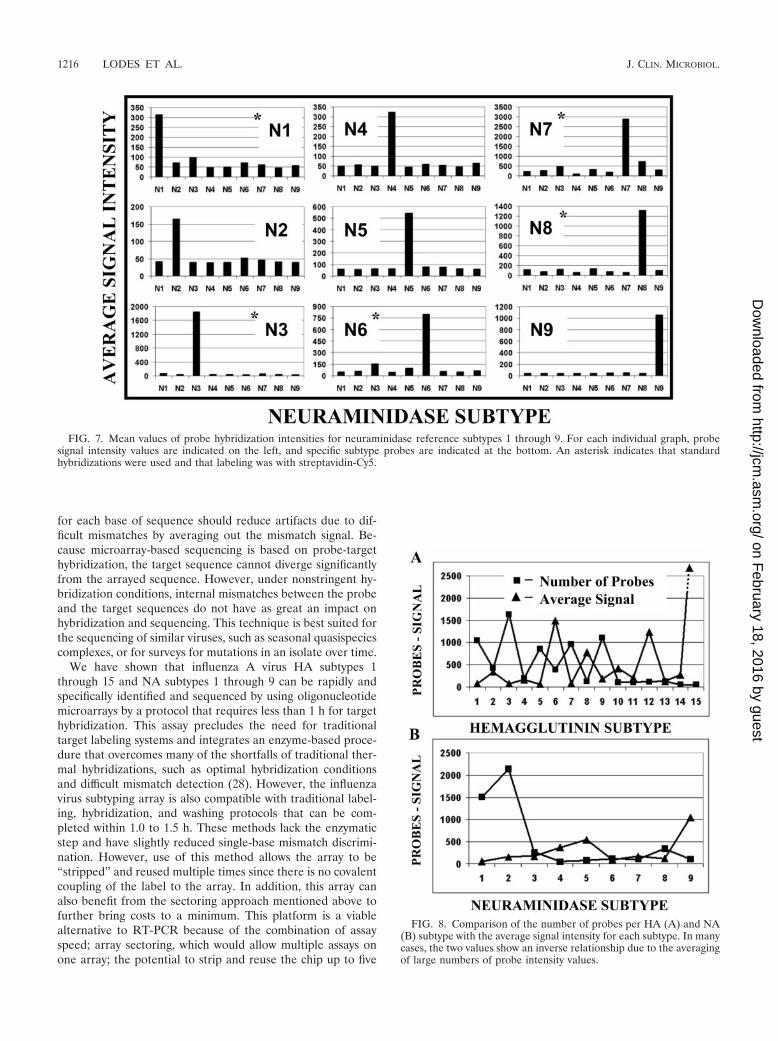
FIG. 9. Combined histogram of normalized, average probe intensityvalues (Z scores). The correct subtype prediction is indicated (positive),and all negative values are bracketed (negative). Data statistics are a meanof �0.01785, a standard deviation of 0.12136, and a sample number of177,264.
FIG. 10. Example of sequencing of the neuraminidase gene for target DNA from H9N2 isolate HK/NT16/99 with probes designed from thesame sequence (A/Chicken/Hong Kong/NT16/99 [H9N2]). Graphed probe signal intensities (A) and the results of a BLASTN search of theGenBank database with the resulting DNA sequence (B) are shown. The sequence was obtained with software designed to interrogate the signalintensities for each set of four probes and to associate a specific nucleotide with the highest signal and then string the sequence together in series.
1217
on February 18, 2016 by guest
http://jcm.asm
.org/D
ownloaded from
ACKNOWLEDGMENTS
This work was supported by CombiMatrix Corporation, and the U.S.Air Force Institute for Operational Health. Work in the laboratory ofR.J.W. is funded in part by grant AI95357 from the National Instituteof Allergy and Infectious Disease and by the American LebaneseSyrian Associated Charities.
We thank Philip Miller for help with statistical analysis of data andLuisa Dougan for microarray quality control tests.
REFERENCES
1. Adeyefa, C. A., K. Quayle, and J. W. McCauley. 1994. A rapid method for theanalysis of influenza virus genes: application to the reassortment of equineinfluenza virus genes. Virus Res. 32:391–399.
2. Allawi, H. T., and J. SantaLucia, Jr. 1999. Nearest-neighbor thermodynam-ics and NMR of DNA sequences with internal A.A, C.C, G.G, and T.Tmismatches. Biochemistry 38:3468–3477.
3. Allwinn, R., W. Preiser, H. Rabenau, S. Buxboum, M. Sturmer, and H. W.Doerr. 2002. Laboratory diagnosis of influenza—virology or serology? Med.Microbiol. Immunol. (Berlin) 191:157–160.
4. Altschul, S. F., T. L. Madden, A. A. Schaffer, J. Zhang, Z. Zhang, W. Miller,and D. J. Lipman. 1997. Gapped BLAST and PSI-BLAST: a new generationof protein database search programs. Nucleic Acids Res. 25:3389–3402.
5. Amano, Y., and Q. Cheng. 2005. Detection of influenza virus: traditionalapproaches and development of biosensors. Anal. Bioanal. Chem. 381:156–184.
6. Baxi, M. K., S. Baxi, A. Clavijo, K. M. Burton, and D. Deregt. Microarray-based detection and typing of foot-and-mouth disease virus. Vet. J., in press.
7. Bodrossy, L., and A. Sessitsch. 2004. Oligonucleotide microarrays in micro-bial diagnosis. Curr. Opin. Microbiol. 7:245–254.
8. Chen, H., G. Deng, Z. Li, G. Tian, Y. Li, P. Jiao, L. Zhang, Z. Liu, R. G.Webster, and K. Yu. 2004. The evolution of H5N1 influenza viruses in ducksin southern China. Proc. Natl. Acad. Sci. USA 101:10452–10457.
9. Dill, K., D. D. Montgomery, A. L. Ghindilis, K. R. Schwarzkopf, S. R.Ragsdase, and A. V. Oleinikov. 2004. Immunoassays based on electrochem-ical detection using microelectrode arrays. Biosensors Bioelectronics 20:736–742.
10. Ellis, J. S., and M. C. Zambon. 2002. Molecular diagnosis of influenza. Rev.Med. Virol. 12:375–389.
11. Fouchier, R. A., V. Munster, A. Wallensten, T. M. Bestebroer, S. Herfst, D.Smith, G. F. Rimmelzwaan, B. Olsen, and A. D. Osterhaus. 2005. Charac-terization of a novel influenza A virus hemagglutinin subtype (H16) obtainedfrom black-headed gulls. J. Virol. 79:2814–2822.
12. Gulati, U., C.-C. Hwang, L. Venkatramani, S. Gulati, S. J. Stray, J. T. Lee,W. G. Laver, A. Bochkarev, A. Zlotnick, and G. M. Air. 2002. Antibodyepitopes on the neuraminidase of a recent H3N2 influenza virus (A/Mem-phis/31/98). J. Virol. 76:12274–12280.
13. Hay, A., V. Gregory, A. R. Douglas, and Y. P. Lin. 2001. The evolution ofhuman influenza viruses. Phil. Trans. R. Soc. Lond. Ser. B 356:1861–1870.
14. Hoffmann, E., J. Stech, Y. Guan, R. G. Webster, and D. R. Perez. 2001.Universal primer set for the full-length amplification of all influenza Aviruses. Arch. Virol. 146:1–15.
15. Ivshina, A. V., G. M. Vodeiko, V. A. Kuznetsov, D. Volokhov, R. Taffs, V. I.Chizhikov, R. A. Levandowski, and K. M. Chumakov. 2004. Mapping ofgenomic segments of influenza B virus strains by an oligonucleotide microar-ray method. J. Clin. Microbiol. 42:5793–5801.
16. Kajiyama, T., Y. Miyahara, L. J. Kricka, P. Wilding, D. J. Graves, S. Surrey,and P. Fortina. 2003. Genotyping on a thermal gradient DNA chip. GenomeRes. 13:467–475.
17. Kaverin, N. V., I. A. Rudneva, N. A. Ilyushina, N. L. Varich, A. S. Lipatov,Y. A. Smirnov, E. A. Govorkova, A. K. Gitelman, D. K. Lvov, and R. G.Webster. 2002. Structure of antigenic sites on the haemagglutinin moleculeof H5 avisn influenza virus and phenotypic variation of escape mutants.J. Gen. Virol. 83:2497–2505.
18. Kaverin, N. V., I. A. Rudneva, N. A. Ilyushina, A. S. Lipatov, S. Krauss, andR. G. Webster. 2004. Structural differences among hemagglutinins of influ-enza A virus subtypes are reflected in their antigenic architecture: analysis ofH9 escape mutants. J. Virol. 78:240–249.
19. Kessler, N., O. Ferraris, K. Palmer, W. Marsh, and A. Steel. 2004. Use of theDNA Flow-Thru Chip, a three-dimensional biochip, for typing and subtypingof influenza viruses. J. Clin. Microbiol. 42:2173–2185.
20. Korimbocus, J., N. Scaramozzino, B. Lacroix, J. M. Crance, D. Garin, andG. Vernet. 2005. DNA probe array for the simultaneous identification ofherpesviruses, enteroviruses, and flaviviruses. J. Clin. Microbiol. 43:3779–3787.
21. Li, J., S. Chen, and D. H. Evans. 2001. Typing and subtyping influenza virususing DNA microarrays and multiplex reverse transcriptase PCR. J. Clin.Microbiol. 39:696–704.
22. Lipatov, A. S., E. A. Govorkova, R. J. Webby, H. Ozaki, M. Peiris, Y. Guan,L. Poon, and R. G. Webster. 2004. Influenza: emergence and control. J. Vi-rol. 78:8951–8959.
23. Macken, C., H. Lu, J. Goodman, and L. Boykin. 2001. The value of adatabase in surveillance and vaccine selection, p. 103–106. In. A. D. M. E.Osterhaus, N. Cox, and A. W. Hampson (ed.), Options for the control ofinfluenza IV. Elsevier Science, Amsterdam, The Netherlands.
24. Mizuta, K., N. Katsushima, S. Ito, K. Sanjoh, T. Murata, C. Abiko, and S.Murayama. 2003. A rare appearance of influenza A(H1N2) as a reassortantin a community such as Yamagata where A(H1N1) and A(H3N2) co-circu-late. Microbiol. Immunol. 47:359–361.
25. Palmer, D. F., M. T. Coleman, W. R. Dowdle, and G. C. Schild. 1975.Advanced laboratory techniques for influenza diagnosis, p. 51–52. Immunol-ogy series no. 6. U.S. Department of Health, Education, and Welfare, Wash-ington, D.C.
26. Scholtissek, C., H. Burger, O. Kistner, and K. F. Shortridge. 1985. Thenucleoprotein as a possible major factor in determining host specificity ofinfluenza H3N2 viruses. Virology 147:287–294.
27. Schweiger, B., I. Zadow, and R. Heckler. 2002. Antigenic drift and variabilityof influenza viruses. Med. Microbiol. Immunol. (Berlin) 191:133–138.
28. Sengupta, S., K. Onodera, A. Lai, and U. Melcher. 2003. Molecular detectionand identification of influenza viruses by oligonucleotide microarray hybrid-ization. J. Clin. Microbiol. 41:4542–4550.
29. Taubenberger, J. K., and S. P. Layne. 2001. Diagnosis of influenza virus:coming to grips with the molecular era. Mol. Diagn. 6:291–305.
30. Templeton, K. E., S. A. Scheltinga, M. F. C. Beersma, A. C. M. Kroes, andE. C. J. Claas. 2004. Rapid and sensitive method using multiplex real-timePCR for diagnosis of infections by influenza A and influenza B viruses,respiratory syncytial virus, and parainfluenza viruses 1, 2, 3, and 4. J. Clin.Microbiol. 42:1564–1569.
31. Ueda, M., A. Maeda, N. Nakagawa, T. Kase, R. Kubota, H. Takakura, A.Ohshima, and Y. Okuno. 1998. Application of subtype-specific monoclonalantibodies for rapid detection and identification of influenza A and B vi-ruses. J. Clin. Microbiol. 36:340–344.
32. Urakawa, H., S. El Fantroussi, H. Smidt, J. C. Smoot, E. H. Tribou, J. J.Kelly, P. A. Noble, and D. A. Stahl. 2003. Optimization of single-base-pairmismatch discrimination in oligonucleotide microarrays. Appl. Environ. Mi-crobiol. 69:2848–2856.
33. Wang, D., L. Coscoy, M. Zylberberg, P. C. Avila, H. A. Boushey, D. Ganem,and J. L. DeRisi. 2002. Microarray-based detection and genotyping of viralpathogens. Proc. Natl. Acad. Sci. USA 99:15687–15692.
34. Wang, D., A. Urisman, Y.-T. Liu, M. Springer, T. G. Ksiazek, D. D. Erdman,E. R. Mardis, M. Hickenbotham, V. Magrini, J. Eldred, J. P. Latreille, R. K.Wilson, D. Ganem, and J. L. DeRisi. 2003. Viral discovery and sequencerecovery using DNA microarrays. PLoS Biol. 1:257–260.
35. Webby, R. J., and R. G. Webster. 2001. Emergence of influenza A viruses.Phil. Trans. R. Soc. Lond. Ser. B 356:1815–1826.
36. Yuen, K. Y., and S. S. Y. Wong. 2005. Human infection by avian influenza AH5N1. Hong Kong Med. J. 11:189–199.
37. Zou, S. 1997. A practical approach to genetic screening for influenza virusvariants. J. Clin. Microbiol. 35:2623–2627.
1218 LODES ET AL. J. CLIN. MICROBIOL.
on February 18, 2016 by guest
http://jcm.asm
.org/D
ownloaded from