
Studying miRNA-mRNA interactions in Neuro-developmental disorders
Upload
independentCategory
view
0download
0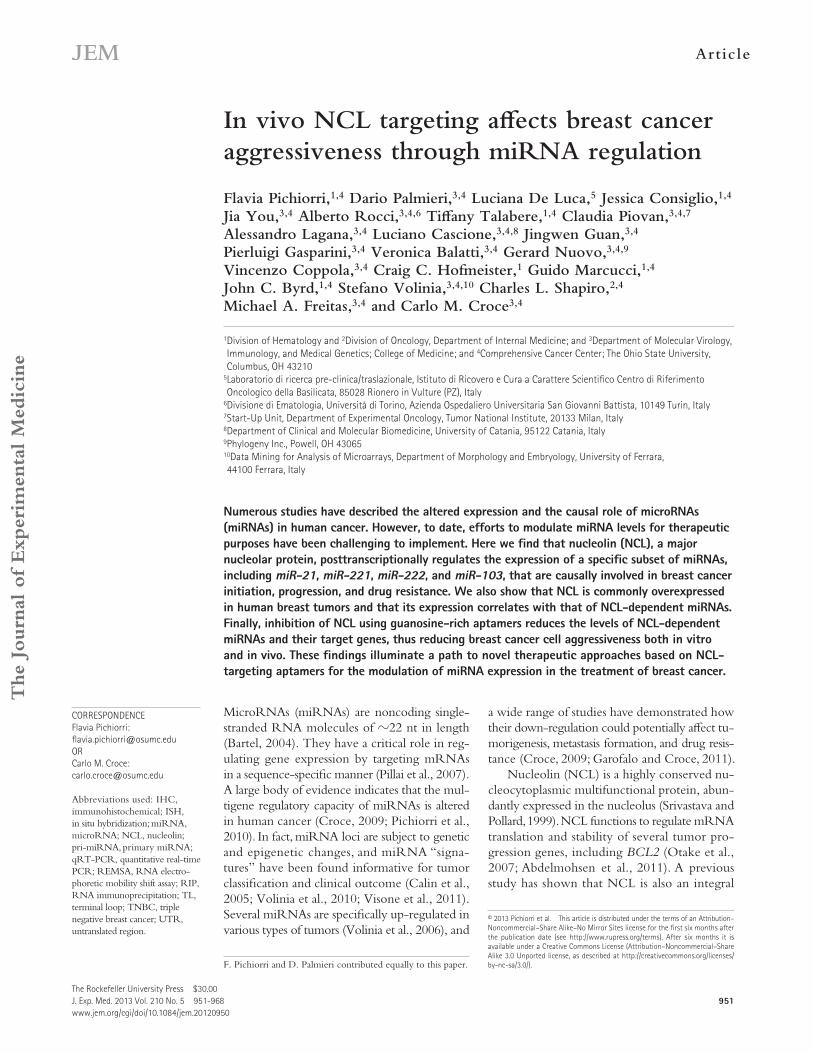
Article
The Rockefeller University Press $30.00J. Exp. Med. 2013 Vol. 210 No. 5 951-968www.jem.org/cgi/doi/10.1084/jem.20120950
951
MicroRNAs (miRNAs) are noncoding single-stranded RNA molecules of 22 nt in length (Bartel, 2004). They have a critical role in reg-ulating gene expression by targeting mRNAs in a sequence-specific manner (Pillai et al., 2007). A large body of evidence indicates that the mul-tigene regulatory capacity of miRNAs is altered in human cancer (Croce, 2009; Pichiorri et al., 2010). In fact, miRNA loci are subject to genetic and epigenetic changes, and miRNA “signa-tures” have been found informative for tumor classification and clinical outcome (Calin et al., 2005; Volinia et al., 2010; Visone et al., 2011). Several miRNAs are specifically up-regulated in various types of tumors (Volinia et al., 2006), and
a wide range of studies have demonstrated how their down-regulation could potentially affect tu-morigenesis, metastasis formation, and drug resis-tance (Croce, 2009; Garofalo and Croce, 2011).
Nucleolin (NCL) is a highly conserved nu-cleocytoplasmic multifunctional protein, abun-dantly expressed in the nucleolus (Srivastava and Pollard, 1999). NCL functions to regulate mRNA translation and stability of several tumor pro-gression genes, including BCL2 (Otake et al., 2007; Abdelmohsen et al., 2011). A previous study has shown that NCL is also an integral
CORRESPONDENCE Flavia Pichiorri: [email protected] OR Carlo M. Croce: [email protected]
Abbreviations used: IHC, immunohistochemical; ISH, in situ hybridization; miRNA, microRNA; NCL, nucleolin; pri-miRNA, primary miRNA; qRT-PCR, quantitative real-time PCR; REMSA, RNA electro-phoretic mobility shift assay; RIP, RNA immunoprecipitation; TL, terminal loop; TNBC, triple negative breast cancer; UTR, untranslated region.
F. Pichiorri and D. Palmieri contributed equally to this paper.
In vivo NCL targeting affects breast cancer aggressiveness through miRNA regulation
Flavia Pichiorri,1,4 Dario Palmieri,3,4 Luciana De Luca,5 Jessica Consiglio,1,4 Jia You,3,4 Alberto Rocci,3,4,6 Tiffany Talabere,1,4 Claudia Piovan,3,4,7 Alessandro Lagana,3,4 Luciano Cascione,3,4,8 Jingwen Guan,3,4 Pierluigi Gasparini,3,4 Veronica Balatti,3,4 Gerard Nuovo,3,4,9 Vincenzo Coppola,3,4 Craig C. Hofmeister,1 Guido Marcucci,1,4 John C. Byrd,1,4 Stefano Volinia,3,4,10 Charles L. Shapiro,2,4 Michael A. Freitas,3,4 and Carlo M. Croce3,4
1Division of Hematology and 2Division of Oncology, Department of Internal Medicine; and 3Department of Molecular Virology, Immunology, and Medical Genetics; College of Medicine; and 4Comprehensive Cancer Center; The Ohio State University, Columbus, OH 43210
5Laboratorio di ricerca pre-clinica/traslazionale, Istituto di Ricovero e Cura a Carattere Scientifico Centro di Riferimento Oncologico della Basilicata, 85028 Rionero in Vulture (PZ), Italy
6Divisione di Ematologia, Università di Torino, Azienda Ospedaliero Universitaria San Giovanni Battista, 10149 Turin, Italy7Start-Up Unit, Department of Experimental Oncology, Tumor National Institute, 20133 Milan, Italy8Department of Clinical and Molecular Biomedicine, University of Catania, 95122 Catania, Italy9Phylogeny Inc., Powell, OH 4306510Data Mining for Analysis of Microarrays, Department of Morphology and Embryology, University of Ferrara, 44100 Ferrara, Italy
Numerous studies have described the altered expression and the causal role of microRNAs (miRNAs) in human cancer. However, to date, efforts to modulate miRNA levels for therapeutic purposes have been challenging to implement. Here we find that nucleolin (NCL), a major nucleolar protein, posttranscriptionally regulates the expression of a specific subset of miRNAs, including miR-21, miR-221, miR-222, and miR-103, that are causally involved in breast cancer initiation, progression, and drug resistance. We also show that NCL is commonly overexpressed in human breast tumors and that its expression correlates with that of NCL-dependent miRNAs. Finally, inhibition of NCL using guanosine-rich aptamers reduces the levels of NCL-dependent miRNAs and their target genes, thus reducing breast cancer cell aggressiveness both in vitro and in vivo. These findings illuminate a path to novel therapeutic approaches based on NCL-targeting aptamers for the modulation of miRNA expression in the treatment of breast cancer.
© 2013 Pichiorri et al. This article is distributed under the terms of an Attribution–Noncommercial–Share Alike–No Mirror Sites license for the first six months after the publication date (see http://www.rupress.org/terms). After six months it is available under a Creative Commons License (Attribution–Noncommercial–Share Alike 3.0 Unported license, as described at http://creativecommons.org/licenses/by-nc-sa/3.0/).
The
Journ
al o
f Exp
erim
enta
l M
edic
ine

952 NCL targeting for miRNA regulation in cancer | Pichiorri et al.
Table S1), and Northern blot analysis confirmed that mature miR-21, miR-103, miR-10a, miR-222, and miR-221 levels were reduced upon NCL knockdown, whereas nonregulated miRNAs such as miR-155 and miR-30a were unaffected (Fig. 1 A). Next, we performed miRNA high-throughput sequencing of HeLa cells stably expressing double-strand inter-fering RNA against NCL or scrambled sequences (sh-NCL or sh-Scr). Cells were first infected with the indicated shRNAs and then, after 72 h, replated for an additional 48 h to avoid changes in miRNA half-lives associated with different con-fluence status (Hwang et al., 2009; Rissland et al., 2011). A distinct group of miRNAs was found significantly down-regulated (more than fivefold; P < 0.01; Table S2). Of note, both the analyses failed to identify up-regulated miRNAs upon NCL knockdown. Combining the two approaches, we observed a common core of 12 mature miRNAs, including miR-21, miR-103, miR-10a, miR-222, and miR-221 in which the down-regulation increased with prolonged treatments and was not associated with a reduction of their primary forms (Fig. 1, B and C; and not depicted).
We also observed differentially expressed miRNAs between the two approaches (Tables S1 and S2). These differences could stem from the ability of high-throughput sequencing to unveil different miRNA isoforms that are not detectable by pre-defined probes used by NanoString technology or quantita-tive real-time PCR (qRT-PCR) such as miR-191, miR-107, miR-744, miR-629, miR-574, miR-210, and miR-1249 (Table S2). Furthermore, by high-throughput screening, performed after 5 d (72 + 48 h), we observed the down-regulation of the ma-ture form of several miRNAs, such as miR-93, miR-181a/b, miR-192, miR-30a/c, and let-7 family, which was also associ-ated to the decrease of their primary transcripts upon NCL silencing (sh-NCL; Table S2 and not depicted), suggesting a different level of regulation other than posttranscriptional.
The down-regulation of miR-103, miR-10a, miR-222, and miR-221 was also observed in HEK-293 cells, in which the growth status does not affect miRNA expression (not depicted; Hwang et al., 2009). After 48 h of NCL knock-down, we also found a significant reduction of miR-21 and miR-103 levels in MCF-7 breast cancer cells, in which these two miRNAs are abundantly expressed (not depicted). To confirm that NCL–miRNA interaction also occurs in human cells, we performed RNA immunoprecipitation (RIP) ex-periments in HeLa cells using an anti-NCL antibody. NCL coimmunoprecipitated with endogenous pri–miR-221-222, pri–miR-103-1, and pri–miR-21 in HeLa cells (Fig. 1 D). Conversely, pri–miR-155 did not coimmunoprecipitate in this cell system (Fig. 1 D). Moreover, NCL silencing after exogenous expression of pri–miR-21 and pri–miR-221 de-creased their precursor and mature forms, increasing pri-miRNAs, whereas miR-155 was unaffected (Fig. 1, E and F). Addition of recombinant NCL protein to total HEK-293 cell extracts increased pri–miR-21 and pri–miR-221 in vitro processing (Fig. 1 G and not depicted). Thus, our data indi-cate that NCL is able to affect the biogenesis of a specific subset of miRNAs.
component of the DROSHA–DGCR8 microprocessor complex (Shiohama et al., 2007). Although the role of NCL and the DROSHA–DGCR8 microprocessor complex in ribo-somal RNA biogenesis is well characterized (Srivastava and Pollard, 1999; Wu et al., 2000; Fukuda et al., 2007; Jalal et al., 2007), only recently has its ability to modulate processing from primary miRNA (pri-miRNA) structures to precursor forms been reported (Pickering et al., 2011).
NCL has also been found on the cell surface, where it serves as an anchor protein for specific ligands (Farin et al., 2009; Watanabe et al., 2010; Tayyari et al., 2011; Greco et al., 2012). Several studies have demonstrated its localization on the sur-face of different types of cancer cells but not on their normal counterparts (Soundararajan et al., 2008; Bates et al., 2009a; Hovanessian et al., 2010; Destouches et al., 2011). These find-ings support the idea that NCL might be considered a cancer cell–specific receptor that is able to mediate tumor-selective uptake of specific molecules. The importance of NCL in can-cer biology was recently highlighted by studies showing that NCL plays a critical role in tumorigenesis and angiogenesis (Shi et al., 2007; Reyes-Reyes and Akiyama, 2008; El Khoury et al., 2010; Destouches et al., 2011; Farin et al., 2011; Wu et al., 2012). Furthermore, the ability of this protein to bind specific RNA and G-rich DNA elements with high affinity (Brooks and Hurley, 2010; Abdelmohsen et al., 2011; Sun et al., 2011) makes it targetable by the first G-rich aptamer (AS1411) that has reached phase II clinical trials for cancer therapy (Teng et al., 2007; Soundararajan et al., 2008; Bates et al., 2009a; Keefe et al., 2010).
Here we show that NCL promotes the maturation of a spe-cific set of miRNAs that are implicated in the pathogenesis of several human cancers, such as miR-21, miR-103, miR-221, and miR-222, whose overexpression is often associated with greater aggressiveness and resistance to antineoplastic thera-pies (Di Leva et al., 2010; Iliopoulos et al., 2010; Martello et al., 2010; Farazi et al., 2011). Our study focused on the potential use of NCL as a therapeutic target for the regulation of these miRNAs in breast cancer. We also report that AS1411 dimin-ishes breast cancer aggressiveness in vivo through miRNA regu-lation. Our results are, to our knowledge, the first to identify new molecular and therapeutic functions of this aptamer for breast cancer treatment.
RESULTSNCL affects the expression of a specific set of miRNAs through posttranscriptional regulationTo determine the extent to which miRNA expression is reg-ulated by NCL, we combined the results from a full-spectrum analysis of miRNA levels using NanoString technology (Fortina and Surrey, 2008; Ioffe et al., 2012) and miRNA next-generation sequencing in HeLa cells, in which the interaction between NCL and the microprocessor complex was previously shown (Shiohama et al., 2007). We first used NanoString analysis to isolate a signature associated with tran-sient NCL knockdown (si-NCL) at 72 h (Table S1). Several miRNAs were significantly down-regulated (>1.5-fold; P < 0.05;

JEM Vol. 210, No. 5
Article
953
region (UTR), whereas cotransfection of miR-103 reversed these effects (Fig. 2, D and E). Moreover, NCL impairment led to increased mRNA levels of several miR-221-222 and miR-21 target genes such as PDCD4 in MCF-7 cells (not depicted; Frankel et al., 2008) and TIMP3 (Fig. 2 F; Garofalo et al., 2009; Sayed et al., 2010), FAS (Fig. 2 G), and PTEN (Fig. 2 H; Sayed et al., 2010; Darido et al., 2011) in HeLa cells, whereas exogenous miR-221/222 and miR-21 res-cued these effects (Fig. 2, F–H). Notably, PTEN up-regulation upon NCL silencing resulted in reduced AKT activation (pAKT; Fig. 2 H). Stable NCL knockdown in HeLa and MCF-7 cells indicated that NCL impairment affects their clo-nogenic survival as previously published (Otake et al., 2007).
Previous studies have shown that NCL down-regulation affects tumorigenicity of cancer cells (El Khoury et al., 2010; Destouches et al., 2011; Krust et al., 2011). Here we investi-gated whether NCL-regulated miRNAs could have a direct role in this process. MDA-MB-231 breast cancer cells were
NCL knockdown results in significant reduction of posttranscriptional silencing of specific miRNA target genes in vitro and in vivoWe examined whether NCL impairment could modulate miRNA target genes in cancer cells. NCL knockdown abro-gated endogenous miR-21– and miR-103–mediated posttran-scriptional silencing of two reporter constructs containing six miR-21 (miR-21–6X-BS) or four miR-103 binding sites (miR-103–4X-BS; Fig. 2 A). This silencing was not detected when a reporter construct containing four miR-30 family binding sites (miR-30s–4X-BS) was used (Fig. 2 A). Reduced NCL expression significantly decreased the silencing effect of ectopic pri-miRNAs but did not affect the activity of exoge-nous mature forms (Fig. 2 B). According to these data, reduced levels of endogenous miR-103 upon 72 h of NCL knock-down in MCF-7 cells (Fig. 2 C) increased both the expression of DICER mRNA, its known direct target (Martello et al., 2010), and of a reporter gene containing its 3 untranslated
Figure 1. NCL modulates the biogenesis of a subset of miRNAs. (A) Northern blot analysis at 72 h of indicated miRNAs, after either control (si-Scr) transfection or NCL (si-NCL) knockdown in HeLa cells. (B) Mature miRNA expression levels in HeLa cells transfected with the indicated shRNAs were analyzed by qRT-PCR. (C) Mature and pri-miRNA expression levels in HeLa cells transfected with the indicated siRNAs were analyzed by qRT-PCR. (B and C) Values represent the mean ± SD from three independent sets of experiments performed in triplicate. *, P < 0.01. (D) qRT-PCR on HeLa cells after RIP performed using anti-NCL or normal control IgG followed by detection of the indicated pri-miRNAs. GAPDH mRNA was used as internal control. Val-ues were normalized to levels of immunoprecipitated pri-miRNAs using normal control IgG. Immunoprecipitated pri-miRNA levels using normal control IgG were used as normalizer for qRT-PCR experiments. Reported data represent the mean ± SD from three independent sets of experiments performed in triplicate. *, P < 0.01. f.c., fold change. (E) Northern blot analysis of total RNA from HeLa cells cotransfected with pri–miR-21 expression vector (pMIRNA1-pri–miR-21) and with si-NCL, si-DROSHA, and si-Scr, as indicated. RNU6 levels are shown as a loading control. (F) Northern blot analysis of total RNA from HeLa cells cotransfected with pri–miR-221 (left) or pri–miR-155 (right) expression vectors (pMIRNA1-pri–miR-221 and pri–miR-155) and with si-DICER and si-NCL, as indicated. (G) Processing assay of 32P internally labeled pri–miR-21 incubated with HEK-293 total cell extracts in the presence or absence of 50 nM NCL-35S. (F and G) Images are representative of different experiments at least performed in triplicate.

954 NCL targeting for miRNA regulation in cancer | Pichiorri et al.
miR-103 (Fig. 3 A). Scramble-treated tumors increased almost sevenfold in 3 wk, whereas si-NCL and si-NCL/scramble groups increased only twofold (Fig. 3 A). Notably, miRNA reexpression by intratumor injection in mice treated with si-NCL showed an approximately fourfold increase in tumor
subcutaneously injected into 50 nude mice, and 1 wk after injection, four groups of mice with comparable tumor size were treated with a combination of si-NCL or scrambled se-quence siRNA, plus intratumor injections of scramble double-stranded RNAs or a pool of miR-21, miR-221, miR-222, and
Figure 2. NCL, through the regulation of a subset of miRNAs, affects specific changes in their target gene levels. (A) Luciferase assay using pGL3–miR-21–6X-BS (Sponge–miR-21) and pGL3–miR-103–4X-BS (Sponge–miR-103) reporter vectors after knockdown of the indicated genes in HeLa cells. pGL3–miR-30s–4X-BS (Sponge–miR-30a) was used as negative control. (B) Luciferase assay using pGL3-Sponge reporter vectors after knockdown of the indicated genes in HeLa cells and transfection with primary or mature miRNAs, as indicated. (A and B) All data are presented as mean ± SD of four independent experiments performed in triplicate. a.u., arbitrary units. (C) qRT-PCR analysis of the indicated miRNAs performed on MCF-7 cells after 72 h of transfection with NCL (si-NCL) or control (si-Scr) siRNA transfection. Values represent the mean ± SD from three independent sets of experiments. *, P < 0.01. (D) Relative quantification of DICER mRNA levels from HeLa cells transfected with scrambled siRNA (si-Ctrl) and si-NCL in the presence or absence of mature miR-103. Each data sample was normalized to the endogenous reference gene GAPDH by the 2ct method. (E) Luciferase assay on HeLa cells transfected with a reporter vector containing the 3 UTR of DICER downstream the firefly luciferase gene along with the scrambled siRNA (si-Ctrl) and si-NCL in the presence or absence of mature miR-103. (D and E) Values represent the mean ± SD of three independent sets of experiments performed in triplicate. *, P < 0.01 compared with the si-Ctrl–transfected cells. (F and G) TIMP-3 (F) and FAS (G) protein levels in HeLa cells transfected with si-NCL or si-Ctrl with or without miR-221 or miR-21 rescue. -ACTIN was used as loading control. Numbers below the blots indicate densitometric analysis showing TIMP-3/-ACTIN and PTEN/ -ACTIN ratios. (H) Expression of the indicated proteins by immunoblot analysis of HeLa cells transiently transfected with si-NCL or si-Scr in the presence or absence of miR-221/222. miR-26a was used as a PTEN-targeting, NCL-independent miRNA con-trol. (F–H) Images are representative of at least three different experiments.

JEM Vol. 210, No. 5
Article
955
B and C), but no significant differences were observed in caspase-3 activation (Fig. 3, B and C), indicating a lower tumor proliferation rate in si-NCL–treated mice rather than increased apoptosis. Increased PTEN protein expression, and
size, partially reversing the effect of si-NCL. Immunohis-tochemical (IHC) analysis of tumor sections revealed that the si-NCL/miRNA-treated mice displayed higher Ki-67 staining compared with si-NCL treatment alone (Fig. 3,
Figure 3. NCL, through the regulation of a subset of miRNAs, modulates cancer cell proliferation in vivo. (A) MDA-MB-231 cells were injected subcutaneously into the flanks of nude mice. 1 wk after injection, mice with comparable tumor sizes were selected (n = 8 for each group of treatment). Mice were treated with intratumoral injections of si-Scr, si-NCL + miRNAs, si-NCL, or si-NCL + Scr. The graph represents the mean tumor volume (mm3) at the indicated days during the experiment for the four groups. Values represent the mean ± SD. (B) Representative images of hematoxylin and eosin (H&E) and IHC staining for Ki-67, NCL, PTEN, pAKT, and active Caspase-3 in xenograft tumors for each treatment group (si-NCL ± Scr groups were uni-fied). (C) Quantitative analysis of IHC stainings reported in B (n = 8). Reported data represent the mean ± SD from three independent slides stained in triplicate. (D) Representative images of immunoblot analysis of total protein extracts from xenograft tumors obtained from the four different groups of treatment using anti-NCL and anti-DICER antibodies (left). GAPDH was used as internal loading control, and densitometric analysis ± SD is also reported (n = 8; right). (A–D) All data reported are representative of three independent experiments. (E) Evaluation by qRT-PCR of mature miR-21, miR-103, miR-222, miR-221, and miR-30a expression levels in subcutaneous xenograft tumors from MDA-MB-231 cells after si-NCL or si-Scr treatment as described in A. Each data sample was normalized for the endogenous RNU48 by the 2ct method. Horizontal lines indicate the median.

956 NCL targeting for miRNA regulation in cancer | Pichiorri et al.
NCL-targeting compounds modulate expression of miR-21, miR-221, miR-222, and miR-103 and their related target genes in vitro and in vivoPrevious studies have shown that the aptamer AS1411 binds NCL with high affinity on the cell surface (Soundararajan et al., 2008) and, after internalization, acts as a molecular decoy, blocking and shortening the half-life of NCL-regulated RNAs (Ishimaru et al., 2010). Based on our previous findings, we hy-pothesized that AS1411 could inhibit the biogenesis of NCL-dependent miRNAs. Accordingly, we detected a significant decrease in expression of mature miR-221, miR-222, miR-21, miR-103, and miR-10a, but not miR-155 and let-7a, as well as up-regulation of the respective pri-miRNAs in HeLa cells after AS1411 treatment (not depicted). Furthermore, we observed an increasing down-regulation of these miRNAs, correlated with increased accumulation of pri-miRNA transcripts, after 48, 72, and 96 h of AS1411 treatment (Fig. 5 A) of MCF-7 cells. Interestingly, immunoblot analysis showed a partial delocaliza-tion of NCL from the nucleus to the cytosol in MCF-7 cells after 48 h of treatment (Fig. 5 B), indicating that AS1411 was internalized by the cells. Furthermore, coimmunoprecipitation experiments in cells exogenously expressing Flag-DGCR8 showed that AS1411 treatment can affect NCL ability to inter-act with the microprocessor complex (Fig. 5 C).
By global transcriptional profiling (GEO series no. GSE41971) and Gene Ontology enrichment analysis, we also explored the effects of AS1411 on gene expression in MCF-7 cells (not de-picted). Unsupervised hierarchical clustering segregated samples based on treatment assignment, suggesting common tran-scriptional consequences in response to AS1411 (not depicted). According to our results, RT-PCR in MCF-7 showed that changes in expression of mature miRNAs (Fig. 5 A) correlated with higher expression of their target mRNAs (Fig. 5 D). We also found that BCL-2 mRNA levels were significantly down-regulated only after 96 h of exposure (fold change 0.3 ± 0.1; P < 0.05) but not at 72 h after treatment, confirming our gene ex-pression profile data, for which down-regulation was not de-tected (Fig. 5 D). By using the miRò knowledge base (Laganà et al., 2009), we identified several validated and predicted targets of miR-21, miR-103, miR-221, and miR-222 among the most up-regulated genes (fold change > 1.3; P < 0.05) upon treatment (Table S3). Specifically, we performed an enrichment analysis for the biological processes in which the identified targets are in-volved. Upon AS1411 treatment, we identified the up-regulation of several genes involved in signal transduction, cell cycle regu-lation, apoptosis, and cell motility, including PTEN, DICER, PDCD4, and CDC25A (Table S3; Laganà et al., 2009).
In vivo, AS1411 had significant antitumorigenic activity (Fig. 6 A) in xenograft models of highly aggressive breast can-cer (MDA-MB-231). Immunoblot analysis of AS1411-treated tumors showed an increase in DICER and PTEN levels asso-ciated with a severe decrease of pAKT and Vimentin (Fig. 6, B and C), in line with previously published data (Martello et al., 2010; Shorning et al., 2011). qRT-PCR confirmed a sig-nificant reduction of mature miR-21, miR-221, miR-222, and miR-103 but not of nonspecific regulated miRNAs, including
a consequent reduction of AKT phosphorylation (pAKT), was also found upon NCL silencing, and this effect was re-versed by miRNA injections (Fig. 3, B and C). By Western blot analysis of the mouse xenograft tumors, we observed DICER up-regulation upon si-NCL in vivo transfection (Fig. 3 D), likely caused by negative regulation of miR-103 (Fig. 3 E), previously described as DICER-targeting miRNA (Martello et al., 2010). miR-21, miR-221, and miR-222 down-regulation after NCL knockdown was also ob-served (Fig. 3 E).
These findings demonstrate that the in vivo effects of NCL modulation on cell proliferation and tumorigenicity are caused in part by NCL-dependent miRNAs. This is com-patible with the fact that miRNA reexpression only partially reverts the effect of si-NCL and also highlights the impor-tance of cytoplasmic and cell membrane NCL (Fig. 3 B) in these processes.
NCL overexpression is associated with up-regulation of miR-21, miR-221, miR-222, and miR-103 in human breast cancerSeveral miRNAs directly regulated by NCL, such as miR-21, miR-103, miR-221, and miR-222, participate in the control of cell proliferation and tumorigenesis, particularly in breast cancer (Iliopoulos et al., 2010; Martello et al., 2010; Farazi et al., 2011). Thus, we sought to determine whether NCL-increased expres-sion was associated with higher levels of these miRNAs in breast cancer cells. We first observed that NCL is overexpressed in human breast cancer cell lines compared with normal-like breast cells (MCF-10F; Fig. 4 A). We also analyzed 15 specimens paired to normal controls (tumor and normal tissue from the same pa-tient) by IHC, Western blot, and RT-PCR and found higher NCL levels in tumor tissues (Fig. 4 B and not depicted) com-pared with their normal counterparts.
Moreover, by NanoString profiling of 57 normal breast and 183 triple negative breast cancer (TNBC) RNAs, we observed a significant (P < 0.005) overexpression of NCL- associated miRNAs in tumor RNAs in comparison with normal tissues (Fig. 4 C). To confirm a positive correlation between NCL and its target miRNA levels, we evaluated NCL expression by IHC in 70 out of 183 TNBC tissues previously used for miRNA profiling. We observed NCL staining in 80% of the cases (30% NCL ++, 50% NCL +; Fig. 4 D) and found a positive correlation between NCL and miR-21, miR-103, and miR-222 expression (Fig. 4 E). In contrast, no correlation was found with the expression of miRNAs not regulated by NCL, such as miR-30a and miR-155 (Fig. 4 E). Furthermore, miRNA in situ hybridization (ISH) and NCL IHC staining on 110 independent cases of breast cancers confirmed the positive correlation between NCL expression and miR-221 and miR-21 levels (Fig. 4 F), but no staining was detected when a nonspecific miRNA probe was used in breast cancer tissues (Fig. 4 G). These data indicate that the higher expression of a selected group of miRNAs is significantly associated with increased NCL levels in human breast cancer.

JEM Vol. 210, No. 5
Article
957
Figure 4. NCL and its target miRNAs are frequently overexpressed in breast cancer. (A) Immunoblot analysis of NCL in total protein extracts from different breast cancer cell lines. Numbers represent the densitometric analysis compared with -ACTIN as internal loading control. (B) Immunoblot analysis of NCL in total protein extracts from human breast cancer specimens (T) and their normal counterpart (N) that were nor-malized by total loaded proteins detected by Ponceau staining. “B” indicates benign specimens. (C) Overview of 240 breast samples (57 normal and 183 TNBC) analyzed by NanoString miRNA technology distributed in function of miR-103, miR-222, and miR-21 expression (red, up-regulation; blue, down-regulation). (D) IHC of NCL in three samples of TNBC, which are representative of the different scores assigned to the NCL staining. Insets represent higher magnification (40×) of selected areas. (E) miR-21, miR-103, miR-222, miR-30a, and miR-155 relative expression in NCL-negative, NCL-positive “+”, and NCL-positive “++” samples were determined by NanoString technology. The relative expression values were used to design box and whisker plots. Dots in the boxes indicate outlier points. Kruskal-Wallis analysis assessed that the three miRNAs were differen-tially expressed among NCL-negative versus NCL-positive “+” samples and NCL-negative versus NCL-positive “++” samples of the Bartlett test (P < 0.001). (F) Representative IHC and miRNA ISH for NCL (red) and miR-221 (left) or miR-21 (right; green) in breast cancer samples. Colocalization (yellow) between NCL and miRNAs was evaluated using the Nuance system. (G) Representative miRNA ISH using a specific miR-21 probe or a nonspecific miRNA scramble (Scr) probe on breast cancer samples.
958 NCL targeting for miRNA regulation in cancer | Pichiorri et al.
(Garofalo et al., 2008, 2009; Rao et al., 2011). Moreover, it has been shown that the up-regulation of these miRNAs has a causal role in the development of resistance to the antiestrogen drug Fulvestrant (Rao et al., 2011). Therefore, we evaluated whether AS1411 might sensitize cells to Fulves-trant. We found that AS1411 treatment or NCL knockdown in MCF-7 cells increased the sensitivity to Fulvestrant treat-ment (Fig. 7 A) compared with cysteine-rich aptamer (drug control [DCT]), which we used as a control drug, or scram-bled siRNA sequences (si-Scr). Reexpression of exogenous miR-221 and miR-222 in MCF-7 cells partially abrogated the inhibitory effect of AS1411 on cell growth (Fig. 7 A). We also noted that in Fulvestrant-resistant MCF-7 cells (MCF-7F; Rao et al., 2011), in which miR-221 and miR-222 were highly expressed in comparison with the parental cells, NCL targeting by siRNA or AS1411 led to a decrease of cell growth and increased apoptosis induced by Fulvestrant (Fig. 7, B and C). Knockdown of miR-221 and miR-222 by 2-O-methyl-antagonist reduced the growth of MCF-7F
miR-30a or let-7a (Fig. 6 D). IHC analysis showed an 50% decrease in Ki-67 nuclear staining, associated with a decrease of Vimentin, Fibronectin, and pAKT cytosolic staining in these samples but not significant caspase-3 activation (Fig. 6 E). Al-though the total NCL amount was almost unaffected (Fig. 6 E), NCL partially relocated to the cytosol in AS1411-treated tumors (Fig. 6 F). These results indicate that AS1411 modulates the expression of specific NCL-regulated miRNA target genes involved in cancer progression in vitro and in vivo. In line with the ability of NCL to regulate the expression of several miRNA target genes, cell proliferation assays in MDA-MB-231 cells stably interfered for PTEN showed that PTEN impairment only partially rescued the inhibitory effect of NCL-targeting treatments (not depicted).
Biological consequences of NCL targeting in breast cancer cells through miRNA regulationSeveral studies have reported an association of miR-221 and miR-222 up-regulation with drug resistance in cancer
Figure 5. AS1411, through posttranscriptional regulation of NCL-targeted miRNAs, affects gene expression in breast cancer cells. (A) miRNA (left) and pri-miRNA (right) expression levels from MCF-7 cells treated with 10 µM AS1411 or its control drug (DCT) at different time points (24, 48, 72, and 96 h) were analyzed by qRT-PCR. For miRNA and pri-miRNA analysis, values were normalized to DCT at the same treatment time. The experiments were per-formed in triplicate and represent the mean ± SD. The red line represents a trend toward miRNA down-regulation upon AS1411 treatment. (B) Immunoblot analysis of either cytoplasmic (Cyt) or nuclear (N) extracts from MCF-7 cells using antibodies directed to the indicated proteins in the presence of control (DCT) or AS1411 treatment. LAMIN-B1, HSP90, and DROSHA were used as internal control for nucleocytoplasmic separation. Reported data represent three independent experiments. (C) Immunoprecipitation (IP) experiments on HeLa cells transfected with Flag-DGCR8 expression vector and treated with 10 µM AS1411 or control (DCT) for 24 h. Total cell lysates were immunoprecipitated using anti-Flag or control IgG antibodies and analyzed by immunoblot using the indicated antibodies. Inputs are also reported. (D) qRT-PCR analysis of the indicated genes on MCF-7 cells after AS1411 at different time points. *, P < 0.05; **, P < 0.01, relative to DCT-treated cells. Reported data represent the mean ± SD from three independent experiments in triplicate.

JEM Vol. 210, No. 5
Article
959
expression of a pool of miR-103, miR-221, miR-222, and miR-21 (Fig. 8, E and F). Moreover, by Matrigel invasion assays using MDA-MB-436 cells after 48 h of NCL-inhibiting treatments (si-NCL or AS1411), we observed a >60% reduction in the ability of these cells to invade (Fig. 8 F). This effect was reversed by exogenous expression of spe-cific mature miRNAs during the treatments. Conversely, cell migration was only partially rescued in sh-PTEN MDA-MB-231 cells after si-NCL or AS1411 treatments (not depicted). Together, our findings suggest that AS411 can affect breast cancer cell biological properties through miRNA regulation.
G-rich NCL-targeting aptamer reduces breast cancer metastasis in vivoTo further examine the ability of AS1411 to control cellular migration and invasion in vivo, we inoculated highly metastatic, luciferase-positive MDA-MB-231 cells into the mammary fat pad of NOD-SCID mice. Mice with visible primary tumors were treated with intraperitoneal injections of AS1411 or DCT, alone or in combination with intratumoral injections of an miRNA pool or with a mixture of scrambled sequences (Fig. 9 A). We did not detect differences in primary tumors
to the same extent as NCL-targeting treatment (Fig. 7 B). By Annexin V analysis, we observed that exogenous reexpression of mature miR-221 and miR-222 upon AS1411 treatment in-terfered with the ability of AS1411 to drive cells to apoptosis (Fig. 7 C). Because of the ability of AS1411 to modulate the expression of genes such as DICER, PTEN, and PDCD4 involved in cancer metastasis control (Akar et al., 2010; Martello et al., 2010; Shorning et al., 2011), we next treated MDA-MB-231 cells in vitro at different time points (from 24 to 96 h) with AS1411 or DCT. We observed a difference in the levels of NCL-associated miRNA target genes after 96 h of treatment (Fig. 8 A). Confirming our in vivo data (Fig. 6, A–F), those changes were associated with increased NCL in the cytosol (Fig. 8 B), down-regulation of mesenchymal markers vimentin, fibronectin, and ICAM1 (Fig. 8 C), and subsequent down-regulation of NCL-regulated miRNAs (Fig. 8 D). We next asked whether inhibition of NCL di-minished the ability of highly metastatic breast cancer cells such as MDA-MB-231 and MDA-MB-436 to migrate and invade. After 48 h of AS1411 treatment or NCL silenc-ing, the ability of these cells to migrate was reduced by almost 50% without decreasing viability (Fig. 8, E and F) of the cells. The migration effects were reversed by exogenous
Figure 6. AS1411 affects NCL target miRNAs and cancer cell proliferation in vivo. (A) MDA-MB-231 cells were injected subcutaneously into the flanks of nude mice (n = 20), and at 1 wk after injection, mice with comparable tumor sizes (n = 16) were selected for treatment. Mice were treated with subcutaneous injection near the tumor area of 10 µM AS1411 or DCT (eight mice for each group of treatment). The graph represents the mean tumor volume (mm3) at the indicated days during the treatments for the two groups. Values represent the mean ± SD (n = 8). *, P < 0.01. (B and C) Immunoblot analysis showing DICER, NCL, VIMENTIN, total AKT, phosphorylated AKT (pAKT), PTEN, and BCL-2 protein expression levels from xenograft tumors of treated mice (AS1411 and DCT). GADPH and -ACTIN were the internal loading control. (C) Densitometric analysis is reported ± SD. *, P < 0.01. (D) qRT-PCR analysis of mature miR-21, miR-221, miR-222, miR-103, miR-30a, and let-7a on extracted tumoral RNA from AS1411-treated samples. Values rep-resent mean ± SD from three independent sets of experiments performed in triplicate. *, P < 0.05 in comparison with the DCT-treated cells. (A–D) All data reported are representative of at least three independent experiments. (E) Hematoxylin and eosin (H&E) and IHC analysis for Ki-67, vimentin, fibronectin, active Caspase-3, pAKT, and NCL in subcutaneous tumors. (F) Quantitative analysis of cytosolic NCL-positive staining from AS1411-treated mice (n = 8) compared with the control group (n = 8). All results are presented as mean ± SD. *, P < 0.01.

960 NCL targeting for miRNA regulation in cancer | Pichiorri et al.
Bates et al., 2009b). These findings strongly support the pos-sible use of drugs targeting NCL to decrease breast cancer ag-gressiveness in vivo.
DISCUSSIONThe RNA-binding protein NCL is a major component of the ribosomal RNA nucleolar-processing complex (Ginisty et al., 1998; Srivastava and Pollard, 1999). In line with its role in RNA processing, a previously published study (Pickering et al., 2011) and our data suggest a direct involvement of NCL in miRNA biogenesis. In this study, we demonstrated that abrogation of NCL expression affects the biogenesis of a specific cohort of miRNAs, including miR-10a, miR-21, miR-103, miR-221, and miR-222. The assumption that the loop structure of miRNA precursors could be important for NCL binding to the primary transcript and subsequently to the microprocessor complex has been previously reported (Pickering et al., 2011), but no studies have been conducted to characterize the nature of these interactions. Our bioin-formatic analysis revealed that NCL-regulated pre-miRNAs show UGU- and UG-rich elements in their terminal loop (TL) and/or stem loop regions (TL), and these motifs are con-served across mammalian species (unpublished data). Although these results are also compatible with the ability of G-rich aptamers to compete for NCL binding to a specific set of miRNAs, the nature of these interactions will require fur-ther investigations.
This is, to our knowledge, the first large-scale study show-ing a clear association of NCL with specific miRNAs causally
of mice subjected to different treatments (Fig. 9 A). After 6 wk from the beginning of the experiment, we detected enhanced bioluminescence signals from lungs of mice treated with DCT or AS1411 + miRNAs compared with those treated with AS1411 or AS1411 + Scr (Fig. 9 B). After 7 wk, primary tumors were dissected, and lungs were examined for the presence of metastatic lesions (Fig. 9, C and D). Intraperitoneal injection of AS1411 did not affect the growth of primary tumors (Fig. 9, A and B). However, histological examination confirmed a higher number of metastatic foci in the lungs of mice treated with DCT compared with AS1411-treated mice (Fig. 9, C and D). Of note, as previously shown in vitro (Fig. 8, E and F), the exogenous expression of NCL-regulated miRNAs overcame the effects of AS1411 treatment, resulting in increased metas-tasis from MDA-MB-231 cells (Fig. 9, B–D). We also repeated these experiments using another highly aggressive mouse breast cancer cell line (4T1) and observed that the size of the primary tumors was almost unaffected between the two treat-ments, whereas AS1411-treated mice displayed almost twofold fewer metastatic lung nodules than the control group (not de-picted). Notably, in both xenograft models, DCT-treated mice had a mean total body weight loss of 6% compared with AS1411-treated animals (not depicted), suggesting that the active aptamer is not toxic. In agreement with these data, previously published biodistribution studies have demon-strated that AS1411 and other related aptamers can be selectively accumulated in the tumors but are also rapidly eliminated in urine without causing toxicity (Ireson and Kelland, 2006;
Figure 7. NCL targeting increases the sensitivity of breast cancer cells to Fulvestrant treatment. (A) MTS assay per-formed in MCF-7 cells treated with increas-ing concentration of Fulvestrant (50–150 nM), transfected or treated as listed. *, P < 0.01 relative to control-treated cells. (B) Growth curves obtained by MTS assay on MCF-7F cells, cultured in standard conditions (100 nM Fulvestrant) and treated or transfected as indicated. *, P < 0.01 relative to control-transfected or untreated cells. (C) Apoptosis associated with different concentrations (100 nM [top] and 150 nM [bottom]) of Fulvestrant in MCF-7F cells treated with DCT + si-Scr, DCT + si-NCL, AS1411+ si-Scr, and AS1411 + miRNAs was evaluated at 72 h by Annexin V staining. PI, propidium iodide. (A–C) All data are presented as mean ± SD of three independent experi-ments performed in triplicate.

JEM Vol. 210, No. 5
Article
961
Figure 8. NCL impairment affects mobility and aggressiveness of breast cancer cells in vitro. (A and B) Immunoblot analysis using the indicated antibodies of total (A) and nuclear/cytoplasmic (B) extracts from MDA-MB-231 cells treated or transfected as indicated. Numbers under the blots indicate densitometric analysis, normalized for nuclear (DROSHA) or cytoplasmic (GAPDH) markers. (C) Vimentin, Fibronectin, and ICAM1 mRNA expression levels normalized to GADPH mRNA expression in MDA-MB-231 after 96 h of treatment and/or transfection with 10 µM of only aptamers (AS1411 or DCT), or aptamers + miRNAs, or RNA interference (si-NCL or si-Scr). Values represent the mean ± SD. *, P < 0.01. The experiments were performed in triplicate, in three independent experiments. (D) miRNA and pri-miRNA expression levels in MDA-MB-231 cells after different treatments as indicated. Controls (Ctrl) include DCT treatments and si-Scr transfection experiments. Values represent the mean ± SD. The experiments were repeated in triplicate. *, P < 0.01. All data reported are representative of at least three independent experiments. (E) Representative pictures of transwell migration assay (top) and absolute quantifications of cells migrated through the transwell measured by absorbance at 595 nm (bottom) performed on MDA-MB-231 cells transfected with si-Scr, si-Scr + miRNAs, si-NCL, and si-NCL + miRNAs or treated with 10 µM AS1411 or DCT with or without miRNAs. **, P < 0.001. (F) Matrigel invasion assay (top) and absolute quantification (bottom) performed on MDA-MB-436 cells treated as indicated. *, P < 0.01 relative to control-transfected or -treated cells. (E and F) Values represent mean ± SD from three independent sets of experiments performed in triplicate.

962 NCL targeting for miRNA regulation in cancer | Pichiorri et al.
The delivery of siRNAs, shRNAs, or anti-miRNAs spe-cifically to human cancer cells in vivo remains a major issue for novel anticancer therapies based on gene or miRNA silenc-ing. It has been previously reported that the aptamer AS1411 displays a decoy activity on NCL, preventing its binding to specific mRNAs (Bates et al., 2009a,b), and here our data demonstrated that AS1411 is able to modulate NCL binding to the microprocessor complex, affecting the processing of a specific group of miRNAs. We are also reporting that AS1411 affects cell motility and invasive properties of breast cancer cells both in vitro and in vivo by modulating the expression of several well-established targets of NCL-dependent miRNAs, including PTEN, DICER, and PDCD4 (Esteva et al., 2010; Martello et al., 2010; Chang et al., 2011). In our experimental set, we did not observe, after short-term NCL impairment (siRNAs or aptamers), differences in BCL-2 mRNA expression
involved in cancer (Mercatelli et al., 2008; Zhang et al., 2012). Although a recent study reported that NCL regulates the bio-genesis of miR-15a and miR-16 (Pickering et al., 2011), we may not have detected the same effects because of the low expression levels of this cluster in HeLa cells.
Notably, several NCL-dependent miRNAs, such as miR-21, miR-103, miR-221, and miR-222, play a relevant role in breast cancer, affecting aggressiveness and resistance to antineoplas-tic therapies (Di Leva et al., 2010; Iliopoulos et al., 2010; Martello et al., 2010; Farazi et al., 2011). The link between NCL expression and its regulated miRNAs in breast cancer is strengthened by our findings that NCL is up-regulated in breast cancer samples and positively correlated with its regulated miRNAs but not with other NCL-independent miRNAs also causally involved in breast cancer, such as miR-155 (Chang et al., 2011).
Figure 9. NCL-targeting compound interferes with aggressiveness of breast cancer cells in vivo. (A) 106 viable Luc+ MDA-MB-231 cells were injected into the fourth left-side mammary fat pad of female NOD-SCID mice (n = 34). 2 wk after orthotopic injections, mice with comparable visible tumors were treated with intraperitoneal injections (5 mg/kg) of AS1411 (n = 10) or control drug (DCT; n = 10) Monday through Friday for 3 wk. An additional 14 mice, treated with AS1411 as described above, were randomly divided into one group (n = 7) also treated Monday, Wednesday, and Friday for 3 wk with intratumoral injections of an miRNA pool including miR-103, miR-221, miR-222, and miR-21 and another group (n = 7) with a mixture of scrambled sequences. Once a week, the bioluminescence intensity of the injected mice was evaluated. Chart represents bioluminescence intensity (BLI) assessed every week in the four different groups of mice inoculated with 106 viable Luc+ MDA-MB-231 cells as indicated. 2 wk after cell inoculation, mice were treated with intraperitoneal injections of AS1411 (5 mg/kg) or DCT and, where indicated, with intratumoral injection of miRNAs/Scr. 4 wk after cell inoculation, the bioluminescence intensity signal in the primary tumors reached saturation in all experimental groups. (B) Representative biolumines-cence imaging after 5 wk of combined treatments showing increase of bioluminescence intensity signal in the lungs of the mice treated with control aptamer (DCT) or with intratumoral miRNA injection upon AS1411 treatment. (C) Representative hematoxylin and eosin staining of lung lesions for each group of treatments. (D) Quantification of metastatic dissemination in the different group of treatments. Analyses were performed on histological sec-tions of the lungs (four sections per lung) for each mouse stained with hematoxylin and eosin. Horizontal bars indicate the median. *, P < 0.01. (A–D) Data are representative of three independent experiments.

JEM Vol. 210, No. 5
Article
963
Technologies; Invitrogen). MCF-7 cells were grown in MEM supplemented with 10% FBS, l-glutamine, antibiotics, and 0.01 mg/ml bovine insulin. MCF-7F cells were grown in MEM supplemented with 10% FBS, l-glutamine, antibiotics, 0.01 mg/ml bovine insulin, and 100 nM Fulvestrant (Rao et al., 2011). MDA-MB-231, MDA-MB-436, and NIH-3T3 cells were grown in RPMI supplemented with 10% FBS, l-glutamine, antibiotics, and 0.01 mg/ml bovine insulin. Cell lines were purchased from the American Type Culture Collection and cultured in a humidified atmosphere containing 5% CO2. All of the transfections were performed by using Lipofectamine 2000 (Invitro-gen), as suggested by the manufacturer.
Tumor tissue and normal controls were obtained from a breast cancer tumor bank at the Ohio State University (OSU). Written informed consent was provided by patients for use of this breast tumor material after review and approval of a specified protocol by the OSU institutional review committee.
Plasmids. Human plasmids of pMIRNA1-pri–miR-21, pMIRNA1-pri–miR-103, pMIRNA1-pri–miR-30, pMIRNA1-pri–miR-221, pMIRNA1-pri–miR-222, and pMIRNA1-pri–miR-155, containing a GFP reporter gene, were provided by System Biosciences. Human plasmid of pri–miR-21 for in vitro processing was amplified by PCR and cloned into pCR4-TOPO (Invitro-gen): For, 5-CCACTAGTTGGGGTTCGATCTTAACAGG-3; Rev, 5-GGGCGGCCGCTTTCAAAACCCACAATGCAG-3. Luciferase re-porter gene plasmids containing multiple binding sites for miR-30 or miR-21 were provided by Addgene. Luciferase reporter gene plasmid containing four miR-103 binding sites (Sponge miR-103; 5-TCGAGTCATAGCCCTGAG-CATGCTGCTATGCTCATAGCCCTGAGCATGCTGCTATGCT-CATAGCCCTGAGCATGCTGCTATGCTCATAGGCATGCTGCT-ATGCGC-3) was generated and cloned into psiCHECK2. Luciferase reporter gene plasmid containing 3 UTR of Dicer was provided by M. Garofalo and G. Romano (OSU, Columbus, OH). Flag-DGCR8 and pcDNA4/TO/cmyc-Drosha were provided by Addgene. Human GFP-tagged NCL was amplified by PCR and cloned into NT-GFP Fusion TOPO-TA Expression vector (Invitrogen): For, 5-ATGGTGAAGCTCGCGAAGGTAAA-3; Rev, 5-TCAAACTTCGTCTTCTTTCCTTG-3. NCL–C-Term, in-cluding the C-terminal region of NCL protein from amino acid 308 to the end of the protein, was cloned into pET-29a(+) vector (EMD Millipore): For, 5-CGCATATGAATCTCTTTGTTGGAAACCTAAAC-3; Rev, 5-GCCTCGAGCTATTCAAACTTCGTCTTCTTTCC-3. H6-NCL RNA binding domains from 1 to 4 (RDB1–4; from amino acid 303 to 647) were cloned into pET-15b vector (EMD Millipore): For, 5-CCCCATAT-GCCGACTACGGCTTTCAAT-3; Rev, 5-CCCGGATCCTCAAGG-TTTGGCCCAGTCCAA-3. The pGL4.51[luc2/CMV/Neo] vector (Promega) was used to make the stable clone of MDA-MB-231 cells ex-pressing the luciferase reporter gene luc2 (Photinus pyralis) used for the animal experiments.
RNA electrophoretic mobility shift assay (REMSA). REMSAs were per-formed by using the LightShift Chemiluminescent EMSA kit (Thermo Fisher Scientific) according to the manufacturer’s instructions. In brief, 4 pmol of bio-tinylated TL of miR-155 miR-21 (see “Oligonucleotides” section) were incu-bated with increasing amounts (10–100 ng) of recombinant H6-NCL (RBD1–4) for 30 min as described by the manufacturer at room temperature. For super-shift experiments, recombinant proteins were preincubated with anti-H6 anti-body for 30 min at room temperature. Binding reactions were run on a native 5% polyacrylamide–1× TBE gel. Transfer of binding reactions to nylon membranes and detection were performed according to the manufacturer’s instruction.
Expression and purification of recombinant proteins. NCL–C-Term recombinant protein was expressed in rabbit reticulocytes using the TnT-Coupled Reticulocyte Lysate System (L4600; Promega), according to the manufacturer’s instructions. H6-NCL-RBD was expressed in Escherichia coli BL21 cells (DE3; Agilent Technologies) and purified using nickel affinity chromatography (QIAGEN) according to the manufacturer’s instructions (Qia-Expressionist Handbook). Protein purity and quantification were as-sessed using SDS-PAGE and Coomassie blue staining.
previously observed in MCF-7 cell stable colonies in which NCL expression was partially knocked down (Otake et al., 2007; Soundararajan et al., 2008). However, accordingly with these published data, we noticed a decrease of BCL-2 mRNA levels upon longer treatment with AS1411 (Fig. 5 D). We also observed that the impairment of one single target, such as PTEN, was not sufficient to completely rescue the ability of NCL-targeting treatments to affect cancer cell proliferation and migration. These data are in agreement with the widely dem-onstrated ability of a single miRNA to regulate cellular pro-cesses by affecting the expression of multiple genes (Garofalo and Croce, 2011). Thus, it is not surprising that the effects of NCL targeting on cancer cell biology are not completely de-pendent on one target gene.
Our study is the first to show that NCL targeting can partici-pate in control of breast cancer metastasis in vivo. In fact, al-though intraperitoneal injections of AS1411 in mice with highly aggressive breast cancer tumors established in the fat pad did not affect growth of primary tumors, we observed >50% reduction in lung lesions upon treatment with the active aptamer, whereas forced reexpression of miR-103, miR-21, miR-221, and miR-222 during the AS1411 treatment completely reverted these effects.
We are also reporting that NCL impairment in Fulvestrant-resistant breast cancer cells restored the drug-dependent inhibi-tion of proliferation and induction of apoptosis (Rao et al., 2011), suggesting that NCL-targeting compounds could im-prove the effectiveness of antineoplastic drugs conventionally used in clinical practice. Although in vivo experiments with enforced expression of NCL-regulated miRNAs did not com-pletely rescue the proliferative properties of cancer cells, we were able to significantly reverse the effect of AS1411 in inva-sion experiments. This is compatible with the fact that the gene network controlling the maintenance of aggressive pheno-type appears mainly under positive control by miRNAs (Polyak and Weinberg, 2009; Inui et al., 2010; Martello et al., 2010), whereas the effects on proliferation might not reveal immedi-ate phenotypic consequences in virtue of the “balancing effect” between miRNAs favoring and opposing the same process (Ventura and Jacks, 2009). Moreover, our data are in agreement with previously published data demonstrating that NCL also exerts an miRNA-independent role in cancer cell proliferation and tumorigenicity (Shi et al., 2007; Reyes-Reyes and Akiyama, 2008; El Khoury et al., 2010; Destouches et al., 2011; Farin et al., 2011; Wu et al., 2012).
This is the first study of the functional role of NCL in miRNA regulation with clear clinical implications. Our work provides data to support the idea that NCL pharmacologi-cal targeting could be relevant for the development of novel antineoplastic protocols. This new approach will modulate cancer aggressiveness and drug sensitivity through the inhibi-tion of NCL-dependent processing of specific miRNAs that are highly expressed in cancers.
MATERIALS AND METHODSCell lines, transfections, and human tissues. HEK-293 and HeLa cells were cultured in DMEM with 10% FBS, l-glutamine, and antibiotics (Life
964 NCL targeting for miRNA regulation in cancer | Pichiorri et al.
Bioinformatic analysis. Samples analyzed by NanoString assay were nor-malized using the variance stabilization normalization. The mean linkage hierarchical clustering algorithm was conducted to identify subgroups of significant miRNAs (Huber et al., 2002). These results have been obtained using both the Rank Product package (version 2.16.0) of the BioConductor Library under the R System and the Rank Product library in connection to the cluster analysis module of the Tmev system (Yeung et al., 2003). The obtained data were deposited in the GEO database (series no. GSE41971). The UGU motif was identified by computing a structural alignment of the most regulated pre-miRNAs using the LocARNA tool (Will et al., 2007). A consensus structure was generated by the RNAalifold tool.
Small RNA library generation and sequencing. Subconfluent HeLa cells were transfected with NCL shRNA or control shRNA plasmids, and stably transfected clones were selected by using 1 µg/ml puromycin. Total RNA was extracted by TRIzol, and libraries for deep sequencing were prepared from 2 µg of total RNA. Specifically, 2 µg of total RNA underwent size selection by Flash-page Fractionator (Life Technologies). RNA that was 40 bp and under was then quality checked by RNA Pico Chip from Agilent Technologies. The Total RNA-Seq kit (Applied Biosystems) was used to produce a cDNA library by the following steps. 5- and 3-specific adapters underwent hybridization and liga-tion to the RNA. cDNA was produced by reverse transcription and then puri-fied and size-selected on a gel. The gel slices containing the cDNA library were amplified by PCR with primers specific to the adapter sequences and then puri-fied and sized selected on a gel. Templated sequencing beads were produced via emulsion PCR with the EZ Bead system (Applied Biosystems). The tem-plated sequencing beads were sequenced on a SOLiD 5500 system (Applied Biosystems) according to the manufacturer’s protocol (Life Technologies).
Sequence processing and mapping. Mapping of SOLiD reads was per-formed using both the small RNA pipeline (Life Technologies) and PASS (Campagna et al., 2009). The small RNA pipeline and PASS were used to ex-tract counts and extensions of miRNA in small RNA reads, from 18 nt in length. When matching to either miRNome (precursor sequences from miRBase) or human genome, we recorded alignments with up to one mis-match. Only reads with at least three sequenced copies per sample were input-ted in the SQL database. We currently populated the miRNA expression database with >500 different human samples sequenced on SOLiD. Raw digi-tal expression values (read counts) were obtained by summing the number of reads that mapped to one of the reference databases, human genome hg19 or miRBase release 17.0. The confidence in the correct assignment of short reads to miRNAs or genomic locations was increased by discarding reads mapping to more than four loci (almost all known human miRNAs are equally or less repetitive). To quantify the short RNA reads, we used RPKM scaling (Mortazavi et al., 2008) based on the read count of each analyzed sample (reads per kilobase per million of total aligned reads). Thresholding was performed at ≤10 RPKM. Datasets with <250,000 matched reads were not analyzed further.
Statistical analysis of sequence processing and mapping. R (http://www.r-project.org) and ArrayTools were used for statistical and clustering analy-sis. Filtering of expression tables was performed as follows. Reads were not ana-lyzed further when <20% of the expression data had at least a 1.5-fold change in either direction from the median value and when percentage of data missing or filtered out exceeds 50%. Multivariate permutations test was computed based on 1,000 random permutations, and parametric p-values were calculated, alongside false detection rates. Additional iso-miRNAs are listed when more expressed or with higher fold changes than the mature form. Classification prediction was performed using different models, and misclassification error was estimated for each model by using leave-one-out cross-validation (Simon et al., 2003).
Luciferase assay. 1.5 × 10⁵ HeLa cells were transfected in 12-well plates with the aforementioned siRNAs. 24 h after siRNA transfection, cells were retransfected with 500 ng of the aforementioned firefly luciferase reporter plasmids along with 50 ng pCMV-Renilla. Luciferase and Renilla activity
Oligonucleotides. DNA aptamers (AS1411 and DCT) and biotinylated RNA oligonucleotides used for REMSA and oligonucleotide pull-down were purchased from Integrated DNA Technologies and are listed in the Supplemental materials and methods.
siRNAs and shRNAs. To transiently silence the expression of human NCL, Dicer, and Drosha proteins, siRNAs, consisting of a pool of three to five target-specific 19–25 nt siRNAs, were purchased from Santa Cruz Biotechnol-ogy, Inc. and transfected at a final concentration of 100 nM. Used siRNAs were NCL siRNA, Dicer siRNA, and RNase III Drosha siRNA. Control siRNA-A was used as negative control. shRNA NCL, shRNA PTEN, and shRNA control were provided by Santa Cruz Biotechnology, Inc.
Antibodies. Anti-C23, anti–hnRNP-U, anti-DICER, anti-FAS, anti-PTEN, anti-Vimentin, anti-Fibronectin, and anti-HSP90 were purchased from Santa Cruz Biotechnology, Inc.; anti-DROSHA, anti-GFP, anti-Biotin, anti–Ki-67, and anti-TIMP3 were purchased from Abcam; anti-Flag and anti–-ACTIN were purchased from Sigma-Aldrich; anti-GAPDH, Lamin-B1, AKT, phos-pho-AKT (Ser473), and cleaved Caspase-3 were purchased from Cell Signaling Technology; and anti-PTEN was purchased from Cascade BioScience.
Immunoblotting and immunoprecipitations. Proteins were extracted in lysis buffer (1% NP-40, 1 mm EDTA, 50 mm Tris–HCl, pH 7.5, and 150 mm NaCl, supplemented with complete protease inhibitors), subjected to SDS-PAGE, electroblotted onto Nitrocellulose membranes, and probed with anti-bodies as indicated, according to standard procedures. For immunoprecipitation experiments, subconfluent HeLa cells were transfected with the DGCR8-Flag expression vectors. 24 h after transfection, cells were treated with 10 µM AS1411 or control drug (DCT) for an additional 24 h. Total proteins were ex-tracted as described above, and 1–2 mg of total protein extracts was immuno-precipitated with 5 ml anti-Flag (Sigma-Aldrich)–specific resin overnight at 4°C with rotation. Immunoprecipitates were washed three times with buffer I (50 mM Tris-HCl, pH 7.5, 150 mM NaCl, 10% glycerol, and 0.5% NP-40) and once with buffer II (50 mM Tris-HCl, pH 7.5, 300 mM NaCl, 10% glycerol, and 0.5% NP-40). Proteins were subjected to SDS-PAGE, electroblotted onto Nitrocellulose membranes, and probed with antibodies as indicated.
RIP. RIPs were performed using the Magna RIP kit (EMD Millipore). HeLa cells were transfected as indicated, collected, and lysed in 500 µl RIP lysis buffer supplemented with protease inhibitor and RNase inhibitor. After 5 min of in-cubation on ice, 50 µl of magnetic bead suspension was transferred to each tube. The beads were washed two times using 500 µl RIP wash buffer, and then 5 µg anti-Flag or anti-NCL antibodies were added at room temperature for 30 min. The beads were washed five times with wash buffer then in 900 µl of immunoprecipitation buffer (0.5 M EDTA, RNase inhibitor, and RIP wash buffer), and 100 µl of cellular lysate was added at 4°C for overnight on rotation. Beads were then washed six times in RIP wash buffer. RNA was purified using proteinase K buffer (RIP wash buffer, 10% SDS, and 10 mg/ml proteinase K) and precipitated with salt solution I, salt solution II, precipitate enhancer, and ethanol. The isolated RNA from RIP was analyzed by qRT-PCR. The results were expressed as the relative fold enrichment of the target precipitation as compared with the normal rabbit IgG control. Data reported are the mean ± SD from three independent sets of experiments performed in triplicate.
Northern blotting. Total RNA was extracted with TRIzol (Invitrogen), and the integrity of RNA was assessed with an Agilent BioAnalizer 2100 (Agilent Technologies). Northern blotting was performed as described pre-viously (Pichiorri et al., 2010). Oligonucleotides used as probes were the complementary sequences of the mature miRNA (miRNA registry). All images were acquired using a Typhoon 9200 scanner (GE Healthcare).
miRNA profiling. HeLa cells were transiently transfected with either siRNA against NCL or siRNA control. Total RNA was prepared using TRIzol (Invitro-gen). The RNA was analyzed by NanoString assay, a novel digital technology, performed as described by the manufacturer (NanoString Technologies, Inc.).

JEM Vol. 210, No. 5
Article
965
Cell treatments. MCF-7F, MCF-7, MDA-MB-231, and MDA-MB-436 cells were treated with 10 or 20 µM AS1411 or control drug (DCT) and harvested at different time points. MCF-7F cells were treated with increasing concentra-tion of Fulvestrant (50–200 nM) and with 10 or 20 µM AS1411. To show the instability of miRNA at 24–48 h, HeLa and MCF-7 cells were treated with 5 µg/ml Actinomycin D and cultured for 24 and 48 h before RNA extraction.
miRNA locked nucleic acid ISH of formalin-fixed, paraffin-embed-ded tissue section. ISH was performed on deparaffinized human breast tis-sues using a previously published protocol (Nuovo et al., 2009), which includes a digestion in 1.3 mg/ml pepsin for 30 min. The sequences of the probes con-taining the six dispersed locked nucleic acid–modified bases with digoxigenin conjugated to the 5 end were miR-221, 5-GAAACCCAGCAGACAATG-TAGCT-3; and miR-21, 5-UAGCUUAUCAGACUGAUGUUGA-3. The probe cocktail and tissue miRNA were co-denatured at 60°C for 5 min, followed by hybridization at 37°C overnight and a low stringency wash in 0.2× SSC and 2% bovine serum albumin at 4°C for 10 min. The probe–target complex was seen as a result of the action of alkaline phosphatase on the chro-mogen nitroblue tetrazolium and bromochloroindolyl phosphate (NBT/BCIP). Negative controls included the use of a probe, which should yield a negative result in such tissues. No counterstain was used, to facilitate colabeling for NCL protein. After ISH for the miRNAs, as previously described (Nuovo et al., 2009), the slides were analyzed for IHC using the optimal conditions for NCL (1:100; cell conditioning for 30 min). For the IHC, we used the Ultrasensitive Universal Fast Red system from Ventana Medical Systems. The percentage of tumor cells expressing NCL and miR-221 and miR-21 was then analyzed with emphasis on colocalization of the respective targets. Co-expression analysis was performed with the Nuance system (Cambridge Research Institute) per the manufacturer’s recommendations.
Gene expression microarray. Experimental samples were prepared, labeled, and hybridized to Affymetrix H133 Plus 2.0 gene chips and scanned on a GeneChip scanner 3000 (Affymetrix). From the scanned images, the expression intensities were calculated and normalized using the robust mul-tichip average (RMA) method and its implementation in R/Bioconductor, consisting of three steps: a background adjustment, quantile normalization, and finally log-transformed perfect match value summarization. Linear Models for Microarray data (LIMMA) and its implementation in the Multi-Experiment Viewer (MeV version 4.2) software suite were used to identify the statistically deregulated genes. Multiple testing adjustments for false discovery rate based on Benjamini and Hochberg’s method were performed. The genes were filtered for significance (false discovery rate–adjusted p-value ≤ 0.05) and fold change (at least ±1.5). Using the deregulated genes, a hierarchical clustering was performed using TMeV 4.0 software from TIGR. The Pearson correlation was used as a measure of similarity or dis-tance between samples. As a rule for the linkage of clusters, the mean link-age method was used. The obtained data were deposited in the GEO database (series no. GSE41972).
Migration, invasion, and wound-healing assays. Transwell insert cham-bers with 8-µm porous membrane (Greiner bio-one) were used for the migra-tion assay, and Cell Invasion plates (EMD Millipore) were used for invasion assay. 48 h after transfection and/or treatments, 3 × 10⁴ cells were washed three times with PBS and added to the top chamber in serum-free media. The bottom chamber was filled with media containing 10% FBS. Cells were incu-bated for 24 h for the migration assay and 72 h for the invasion assay at 37°C in a 5% CO2 humidified incubator. To quantify migrating cells, cells on the top chamber were removed by using a cotton-tipped swab, and the migrated cells were fixed in PBS and 25% glutaraldehyde, stained with Crystal Violet stain, visualized under a phase-contrast microscope (E200; Nikon), and photo-graphed. Crystal violet–stained cells were moreover solubilized in acetic acid and methanol (1:1), and absorbance was measured at 595 nm. The results are means ± SD of three independent experiments performed in triplicate.
For wound-healing assays, confluent cells were treated for 24 h with 10 µM AS1411 or the control aptamer (DCT), and a scratch was made using a sterile
were assessed with the Dual-Light Luciferase system (Promega) according to the manufacturer’s instructions, 24 h after the transfection. The Luciferase activity was normalized for the Renilla activity. All the experiments were performed three times in triplicate, and the mean ± SD was reported.
qRT-PCR for miRNA and mRNA quantification. qRT-PCRs were performed with the TaqMan PCR kit (Applied Biosystems) according to the manufacturer’s instructions, followed by detection with the 7900HT Sequence Detection System (Applied Biosystems). The appropriate TaqMan probes for mRNA, miRNA, and pri-miRNA quantification were purchased from Applied Biosystems. All reactions were performed in triplicate. Simultaneous quantification of small endogenous nucleolar RNA U44/U48 or U6 was used as a reference for miRNA and pri-miRNA TaqMan assay data normal-ization. Simultaneous quantification of OAZ1 or GAPDH mRNAs was used as a reference for mRNA TaqMan assay data normalization. The comparative cycle threshold (Ct) method for relative quantification of gene and miRNA expression (User Bulletin #2; Applied Biosystems) was used to determine miRNA, pri-miRNA, or mRNA expression levels. SYBR green PCR master mix (Applied Biosystems) was used for pre-miRNA quantification. Simultaneous quantification of small endogenous nucleolar RNA U6 was used as a reference for assay data normalization. All primers used for am-plification steps are listed in the Supplemental materials and methods.
Statistical analysis. Student’s t test was used to determine significance (indi-cated as p-value). All error bars represent the SD of the mean. Pearson correla-tion index was calculated to test the association between NCL and its target miRNA expression levels. Expression values for NCL and miRNAs (obtained by IHC, real-time, and NanoString assays) from all the analyzed samples were tested using the Bartlett test to evaluate the homogeneity of variance among the samples. The Kruskal-Wallis was used to assess the significance of variations observed among different sample classes on the basis of the Bartlett test p-value. The Kruskal-Wallis test was used when the Bartlett test p-value was <0.001.
Preparation of RNA substrates and in vitro processing assays. For pri-miRNA processing assays, total cell extracts were prepared in 20 mM Tris-HCl, pH 8.0, 100 mM KCl, and 0.2 mM EDTA from either HeLa or HEK-293 cells and incubated (typically 40 µg per 40-µl reaction at 37°C for the indicated times) with in vitro synthesized and uniformly labeled pri-miRNA (1 µl of 104–5 cpm) in processing buffer containing 6.4 mM MgCl4, 0.5 µl RNasin (40 U/µl; Ambion), and NCL–C-Term, when required. The pri-miRNA was in vitro synthesized, and UTP was uniformly labeled using the Riboprobe In Vitro Transcription System (Promega).
Nuclear/cytoplasmic RNA and protein differential extraction. Nuclear/cytoplasmic RNA and protein differential extraction was performed using the Paris kit (Ambion) according to the manufacturer’s instructions.
Colony assay. Subconfluent HeLa and MCF-7 cells were transfected with NCL shRNA or control shRNA plasmids, and stably transfected clones were selected by using 1 µg/ml puromycin. After 10 d, cells were stained with 500 mg/ml crystal violet in 20% methanol, and resulting colonies were counted. The mean ± SD of three independent experiments performed in triplicate was reported.
IHC. Xenograft tumor samples were fixed in 10% neutral-buffered formalin, processed, embedded in paraffin, and sectioned at 4 µm. Slides with specimens were then placed in a 60°C oven for 1 h, cooled, deparaffinized, and rehydrated through xylene and graded ethanol solutions to water. All slides were placed for 5 min in a 3% hydrogen peroxide solution in water to block the endogenous peroxidase. Antigen retrieval was performed by HIER, in which the slides were placed in a citric acid solution, pH 6.1, for 25 min at 96°C and cooled for 15 min in solution. Slides were placed on a Dako Autostainer and immunostaining sys-tem for use with IHC. Thin sections were then treated with primary antibodies for Ki-67, Fibronectin, Vimentin, NCL, pAKT, active caspase-3, and PTEN, followed by biotinylated secondary antibodies and the DAB chromogen.
966 NCL targeting for miRNA regulation in cancer | Pichiorri et al.
Detection of tumor progression by bioluminescence imaging. Mice were injected with 75 mg/kg Luciferin (Xenogen), and tumor growth was detected by bioluminescence at 10 min after the injection. The home-built bioluminescence system used an electron multiplying charge-coupled device (Andor Technology Limited) with an exposure time of 30 s and an electron multiplication gain of 500 voltage gain × 200, 5-by-5 binning, and with background subtraction. Images were analyzed using ImageJ software (National Institutes of Health).
Online supplemental material. Table S1 shows a list of miRNAs, obtained by NanoString technology, differentially expressed at 72 h in HeLa cells trans-fected with si-NCL versus si-Scr. Table S2 shows a list of miRNAs differentially expressed between sh-NCL and sh-Scr at 72 + 48 h in HeLa cells obtained by high-throughput sequencing. Table S3, included as a separate Excel file, shows Gene Set Enrichment Analysis and Gene Ontology terms of miR-21, miR-103, miR-221, and miR-222 target genes after AS1411 treatments in MCF-7 cells. The Supplemental materials and methods section lists oligonucleotides used for in vivo and in vitro experiments. Online supplemental material is available at http://www.jem.org/cgi/content/full/jem.20120950/DC1.
We thank Dr. K. Huebner for careful reading of the draft manuscript and for helpful scientific discussion and D. Wernicke, S. Lutz, and S. Palko for administrative support. We thank B. Ogbemudia for his technical and experimental support. We are grateful to Dr. G. Di Leva for scientific advice, Dr. M. Garofalo and Dr. G. Romano for providing the reporter constructs for 3 UTR of Dicer, Dr. H. Alder and P. Fadda for the qRT-PCR and NanoString data (Nucleic Acid Shared Resource, the Ohio State University [OSU] Comprehensive Cancer Center [CCC]), and Mr. J. Palatini and the microarray shared resource facility (OSU CCC) for the high-throughput sequencing data. We also thank the campus microscopy and images facility (OSU CCC), D. Devor-Henneman, Dr. K. La Perle, Dr. B. Bolon, and all of comparative pathology and mouse phenotyping Shared Resource (OSU) for helping with the animals experiments, and Dr. A. Ferro for the help with bioinformatic analysis.
We are grateful for research support from National Cancer Institute (NCI) grants to C.M. Croce, the Kimmel Foundation award (to F. Pichiorri), OSU Start-up Funds (to F. Pichiorri), and National Institutes of Health grant CA107106 (to M.A. Freitas). This study was partially supported by NCI grant U01 CA154200 and by the Spielman Fund for breast cancer research (to C.L. Shapiro).
The authors declare no conflict of interests.
Submitted: 4 May 2012Accepted: 22 March 2013
REFERENCESAbdelmohsen, K., K. Tominaga, E.K. Lee, S. Srikantan, M.J. Kang, M.M.
Kim, R. Selimyan, J.L. Martindale, X. Yang, F. Carrier, et al. 2011. Enhanced translation by Nucleolin via G-rich elements in coding and non-coding regions of target mRNAs. Nucleic Acids Res. 39:8513–8530. http://dx.doi.org/10.1093/nar/gkr488
Akar, U., B. Ozpolat, K. Mehta, G. Lopez-Berestein, D. Zhang, N.T. Ueno, G.N. Hortobagyi, and B. Arun. 2010. Targeting p70S6K prevented lung metastasis in a breast cancer xenograft model. Mol. Cancer Ther. 9:1180–1187. http://dx.doi.org/10.1158/1535-7163.MCT-09-1025
Bartel, D.P. 2004. MicroRNAs: genomics, biogenesis, mechanism, and function. Cell. 116:281–297. http://dx.doi.org/10.1016/S0092-8674(04)00045-5
Bates, P.J., E.W. Choi, and L.V. Nayak. 2009a. G-rich oligonucleotides for cancer treatment. Methods Mol. Biol. 542:379–392. http://dx.doi.org/ 10.1007/978-1-59745-561-9_21
Bates, P.J., D.A. Laber, D.M. Miller, S.D. Thomas, and J.O. Trent. 2009b. Discovery and development of the G-rich oligonucleotide AS1411 as a novel treatment for cancer. Exp. Mol. Pathol. 86:151–164. http://dx .doi.org/10.1016/j.yexmp.2009.01.004
Brooks, T.A., and L.H. Hurley. 2010. Targeting MYC Expression through G-Quadruplexes. Genes Cancer. 1:641–649. http://dx.doi.org/10.1177/ 1947601910377493
Calin, G.A., M. Ferracin, A. Cimmino, G. Di Leva, M. Shimizu, S.E. Wojcik, M.V. Iorio, R. Visone, N.I. Sever, M. Fabbri, et al. 2005. A MicroRNA signature associated with prognosis and progression in
pipette tip. The experiment was performed four times in quadruplicate. Images of migrating cells were acquired at different time points, up to 8 h. Representa-tive images of each treatment at 6 and 8 h after the scratch are reported.
Cell viability and apoptosis assays. Where indicated, cells were previously transfected or treated as reported in the figure legends. 104 cells were counted and plated in 96-well plates in quadruplicate and incubated at 37°C in a 5% CO2 incubator. MCF-7 cells (treated with AS1411 or/and transfected with si-NCL, Scr, or miR-221-222) were treated with Fulvestrant (Sigma-Aldrich) for 24 h at different concentration (0, 50, 100, and 150 nM). MCF-7F cells (treated with AS1411 or/and transfected with si-NCL, Scr, or miR-221-222) were treated with Fulvestrant for 24–72 h at 100 nM. Cell viability was examined with a 3-(4, 5-dimethylthiazol-2-yl)-2, 5-dipheniltetrazolium bromide Cell Titer 96AQueous One Solution Cell Proliferation Assay (Promega) according to the manufacturer’s protocol. Metabolically active cells were detected by adding 20 µl of cell titer to each well. After 1-h incubation, the plates were analyzed in a Multilabel Counter (Bio-Rad Laboratories). Reported data were the mean ± SD of at least three independent experiments performed in quadruplicate.
Apoptosis was assessed using Annexin V–FITC apoptosis detection kits fol-lowed by flow cytometric analysis. For Annexin V staining, cells (treated with AS1411 or transfected with si-NCL or Scr) were treated with Fulvestrant at dif-ferent concentrations (100 or 150 nM) for 24 h and then treated as for DNA content analysis, except that fixation was omitted, and the cells (5 × 10⁵ per sample) were resuspended in PBS containing 25 µg/ml Annexin V–FLUOS (Roche) and 50 µg/ml propidium iodide before FACS analysis. The percentage of apoptosis indicated was corrected for background levels found in the corre-sponding untreated controls. The percentage of apoptotic cells was expressed as the mean ± SD of three experiments performed in quadruplicate.
In vivo experiments. Animal experiments were performed according to OSU institutional guidelines after review by an institutional review board. A total of 5 × 10⁶ viable MDA-MB-231 cells were injected subcutaneously into the right flank of 80 5-wk-old female nude mice (Foxn1nu/Foxn1nu; Charles River). The tumor size was measured three times per week using a caliper, and the volume was calculated in cubed millimeters using the formula L × W × H. 5 × 10⁶ viable MDA-MD-231 breast cancer cells were injected subcutane-ously into the right flank of 50 nude mice. At 1 wk after injection, a group of 32 mice with comparable tumor size (80 ± 20 mm3) were randomly divided into four groups, using 8 mice for each treatment. Specifically, we used the combination of si-NCL or scrambled sequence siRNA (si-Scr) mixed with Lipofectamine 2000 (Invitrogen) once a day every 3 d for 20 d plus direct tumor injection of double-stranded RNA scrambled sequence or a pool of mature miR-21, miR-221, miR-222, and miR-103 (miRNAs) diluted in Lipofectamine 2000 (100 µl total volume). RNA oligonucleotides for miRNA mix (miR-10a, miR-103, miR-221, and miR-222) were purchased from Ambion (100 nM final concentration). For the treatments with aptamers, 20 mice with tumors of com-parable size (50 ± 20 mm3) were selected and randomly divided into two groups using 8 mice for each treatment. Specifically, we used the combination of subcutaneous injection (adjacent to the tumor area) of AS1411 or aptamer control sequence (CCT-rich sequence; DCT) once a day (10 µM), every 5 d, for 20 d. For the NOD-SCID engraftment model, 2 × 10⁶ viable Luc+ MDA-MB-231 cells were injected into the fourth left-side mammary fat pad of 35 female NOD-SCID mice (NOD/ShiLtSz; Charles River). 2 wk after tumor cell inoculation, 20 mice were treated 5 d a week by intraperitoneal injec-tions of AS1411 (5 mg/kg) or DCT diluted in 100 µl PBS, and 14 mice, di-vided in two groups of 7 mice, were also treated with intratumoral injections with miRNA mix or scrambled (Santa Cruz Biotechnology, Inc.) diluted in Lipofectamine solution (100 µl total volume for mouse for treatment). Tumor size was assessed every 7 d by bioluminescence imaging, as described below. After 4 wk of treatment, mice were analyzed by bioluminescence images and then sacrificed after one more week.
106 viable 4T1 cells were injected into the fourth left-side mammary fat pad of 30 female NOD-SCID mice. After 1 wk of injection, all mice were treated every day for 3 wk with the regimens described above. Mice were sacrificed after 4 wk of injection. Tumors were isolated and used for RNA extraction, pro-tein extraction, and IHC analysis.
JEM Vol. 210, No. 5
Article
967
signatures of TRAIL resistance in human non-small cell lung cancer. Oncogene. 27:3845–3855. http://dx.doi.org/10.1038/onc.2008.6
Garofalo, M., G. Di Leva, G. Romano, G. Nuovo, S.S. Suh, A. Ngankeu, C. Taccioli, F. Pichiorri, H. Alder, P. Secchiero, et al. 2009. miR-221&222 regulate TRAIL resistance and enhance tumorigenicity through PTEN and TIMP3 downregulation. Cancer Cell. 16:498–509. http://dx.doi.org/10.1016/j.ccr.2009.10.014
Ginisty, H., F. Amalric, and P. Bouvet. 1998. Nucleolin functions in the first step of ribosomal RNA processing. EMBO J. 17:1476–1486. http://dx.doi.org/10.1093/emboj/17.5.1476
Greco, A., L. Arata, E. Soler, X. Gaume, Y. Couté, S. Hacot, A. Callé, K. Monier, A.L. Epstein, J.C. Sanchez, et al. 2012. Nucleolin interacts with US11 protein of herpes simplex virus 1 and is involved in its trafficking. J. Virol. 86:1449–1457. http://dx.doi.org/10.1128/JVI.06194-11
Hovanessian, A.G., C. Soundaramourty, D. El Khoury, I. Nondier, J. Svab, and B. Krust. 2010. Surface expressed nucleolin is constantly in-duced in tumor cells to mediate calcium-dependent ligand internaliza-tion. PLoS ONE. 5:e15787. http://dx.doi.org/10.1371/journal.pone .0015787
Huber, W., A. von Heydebreck, H. Sültmann, A. Poustka, and M. Vingron. 2002. Variance stabilization applied to microarray data calibration and to the quantification of differential expression. Bioinformatics. 18:S96–S104. http://dx.doi.org/10.1093/bioinformatics/18.suppl_1.S96
Hwang, H.W., E.A. Wentzel, and J.T. Mendell. 2009. Cell-cell contact globally activates microRNA biogenesis. Proc. Natl. Acad. Sci. USA. 106:7016–7021. http://dx.doi.org/10.1073/pnas.0811523106
Iliopoulos, D., S.A. Jaeger, H.A. Hirsch, M.L. Bulyk, and K. Struhl. 2010. STAT3 activation of miR-21 and miR-181b-1 via PTEN and CYLD are part of the epigenetic switch linking inflammation to cancer. Mol. Cell. 39:493–506. http://dx.doi.org/10.1016/j.molcel.2010.07.023
Inui, M., G. Martello, and S. Piccolo. 2010. MicroRNA control of sig-nal transduction. Nat. Rev. Mol. Cell Biol. 11:264–275. http://dx.doi .org/10.1038/nrm2868
Ioffe, Y.J., K.B. Chiappinelli, D.G. Mutch, I. Zighelboim, and P.J. Goodfellow. 2012. Phosphatase and tensin homolog (PTEN) pseudo-gene expression in endometrial cancer: a conserved regulatory mecha-nism important in tumorigenesis? Gynecol. Oncol. 124:340–346. http:// dx.doi.org/10.1016/j.ygyno.2011.10.011
Ireson, C.R., and L.R. Kelland. 2006. Discovery and development of anti-cancer aptamers. Mol. Cancer Ther. 5:2957–2962. http://dx.doi.org/10 .1158/1535-7163.MCT-06-0172
Ishimaru, D., L. Zuraw, S. Ramalingam, T.K. Sengupta, S. Bandyopadhyay, A. Reuben, D.J. Fernandes, and E.K. Spicer. 2010. Mechanism of regu-lation of bcl-2 mRNA by nucleolin and A+U-rich element-binding factor 1 (AUF1). J. Biol. Chem. 285:27182–27191. http://dx.doi.org/10 .1074/jbc.M109.098830
Jalal, C., H. Uhlmann-Schiffler, and H. Stahl. 2007. Redundant role of DEAD box proteins p68 (Ddx5) and p72/p82 (Ddx17) in ribosome biogenesis and cell proliferation. Nucleic Acids Res. 35:3590–3601. http://dx.doi.org/10.1093/nar/gkm058
Keefe, A.D., S. Pai, and A. Ellington. 2010. Aptamers as therapeutics. Nat. Rev. Drug Discov. 9:537–550. http://dx.doi.org/10.1038/nrd3141
Krust, B., D. El Khoury, C. Soundaramourty, I. Nondier, and A.G. Hovanessian. 2011. Suppression of tumorigenicity of rhabdoid tumor derived G401 cells by the multivalent HB-19 pseudopeptide that targets surface nucleolin. Biochimie. 93:426–433. http://dx.doi.org/10.1016/j.biochi.2010.10.015
Laganà, A., S. Forte, A. Giudice, M.R. Arena, P.L. Puglisi, R. Giugno, A. Pulvirenti, D. Shasha, and A. Ferro. 2009. miRò: a miRNA knowl-edge base. Database (Oxford). 2009:bap008. http://dx.doi.org/10.1093/ database/bap008
Martello, G., A. Rosato, F. Ferrari, A. Manfrin, M. Cordenonsi, S. Dupont, E. Enzo, V. Guzzardo, M. Rondina, T. Spruce, et al. 2010. A MicroRNA targeting dicer for metastasis control. Cell. 141:1195–1207. http://dx.doi .org/10.1016/j.cell.2010.05.017
Mercatelli, N., V. Coppola, D. Bonci, F. Miele, A. Costantini, M. Guadagnoli, E. Bonanno, G. Muto, G.V. Frajese, R. De Maria, et al. 2008. The inhi-bition of the highly expressed miR-221 and miR-222 impairs the growth of prostate carcinoma xenografts in mice. PLoS ONE. 3:e4029. http://dx.doi.org/10.1371/journal.pone.0004029
chronic lymphocytic leukemia. N. Engl. J. Med. 353:1793–1801. http:// dx.doi.org/10.1056/NEJMoa050995
Campagna, D., A. Albiero, A. Bilardi, E. Caniato, C. Forcato, S. Manavski, N. Vitulo, and G. Valle. 2009. PASS: a program to align short sequences. Bioinformatics. 25:967–968. http://dx.doi.org/10.1093/bioinformatics/ btp087
Chang, S., R.H. Wang, K. Akagi, K.A. Kim, B.K. Martin, L. Cavallone, D.C. Haines, M. Basik, P. Mai, E. Poggi, et al; Kathleen Cuningham Foundation Consortium for Research into Familial Breast Cancer (kConFab). 2011. Tumor suppressor BRCA1 epigenetically controls on-cogenic microRNA-155. Nat. Med. 17:1275–1282. http://dx.doi.org/ 10.1038/nm.2459
Croce, C.M. 2009. Causes and consequences of microRNA dysregulation in cancer. Nat. Rev. Genet. 10:704–714. http://dx.doi.org/10.1038/ nrg2634
Darido, C., S.R. Georgy, T. Wilanowski, S. Dworkin, A. Auden, Q. Zhao, G. Rank, S. Srivastava, M.J. Finlay, A.T. Papenfuss, et al. 2011. Targeting of the tumor suppressor GRHL3 by a miR-21-dependent proto-oncogenic network results in PTEN loss and tumorigenesis. Cancer Cell. 20:635–648. http://dx.doi.org/10.1016/j.ccr.2011.10.014
Destouches, D., N. Page, Y. Hamma-Kourbali, V. Machi, O. Chaloin, S. Frechault, C. Birmpas, P. Katsoris, J. Beyrath, P. Albanese, et al. 2011. A simple approach to cancer therapy afforded by multivalent pseudopep-tides that target cell-surface nucleoproteins. Cancer Res. 71:3296–3305. http://dx.doi.org/10.1158/0008-5472.CAN-10-3459
Di Leva, G., P. Gasparini, C. Piovan, A. Ngankeu, M. Garofalo, C. Taccioli, M.V. Iorio, M. Li, S. Volinia, H. Alder, et al. 2010. MicroRNA cluster 221-222 and estrogen receptor alpha interactions in breast cancer. J. Natl. Cancer Inst. 102:706–721. http://dx.doi.org/10.1093/jnci/djq102
El Khoury, D., D. Destouches, R. Lengagne, B. Krust, Y. Hamma-Kourbali, M. Garcette, S. Niro, M. Kato, J.P. Briand, J. Courty, et al. 2010. Targeting surface nucleolin with a multivalent pseudopeptide delays development of spontaneous melanoma in RET transgenic mice. BMC Cancer. 10:325. http://dx.doi.org/10.1186/1471-2407-10-325
Esteva, F.J., H. Guo, S.Y. Zhang, C. Santa-Maria, S. Stone, J.S. Lanchbury, A.A. Sahin, G.N. Hortobagyi, and D.H. Yu. 2010. PTEN, PIK3CA, p-AKT, and p-p70S6K status: association with trastuzumab response and survival in patients with HER2-positive metastatic breast can-cer. Am. J. Pathol. 177:1647–1656. http://dx.doi.org/10.2353/ajpath .2010.090885
Farazi, T.A., H.M. Horlings, J.J. Ten Hoeve, A. Mihailovic, H. Halfwerk, P. Morozov, M. Brown, M. Hafner, F. Reyal, M. van Kouwenhove, et al. 2011. MicroRNA sequence and expression analysis in breast tumors by deep sequencing. Cancer Res. 71:4443–4453. http://dx.doi .org/10.1158/0008-5472.CAN-11-0608
Farin, K., A. Di Segni, A. Mor, and R. Pinkas-Kramarski. 2009. Structure-function analysis of nucleolin and ErbB receptors interactions. PLoS ONE. 4:e6128. http://dx.doi.org/10.1371/journal.pone.0006128
Farin, K., S. Schokoroy, R. Haklai, I. Cohen-Or, G. Elad-Sfadia, M.E. Reyes-Reyes, P.J. Bates, A.D. Cox, Y. Kloog, and R. Pinkas-Kramarski. 2011. Oncogenic synergism between ErbB1, nucleolin, and mutant Ras. Cancer Res. 71:2140–2151. http://dx.doi.org/10.1158/0008-5472 .CAN-10-2887
Fortina, P., and S. Surrey. 2008. Digital mRNA profiling. Nat. Biotechnol. 26:293–294. http://dx.doi.org/10.1038/nbt0308-293
Frankel, L.B., N.R. Christoffersen, A. Jacobsen, M. Lindow, A. Krogh, and A.H. Lund. 2008. Programmed cell death 4 (PDCD4) is an important functional target of the microRNA miR-21 in breast cancer cells. J. Biol. Chem. 283:1026–1033. http://dx.doi.org/10.1074/jbc.M707224200
Fukuda, T., K. Yamagata, S. Fujiyama, T. Matsumoto, I. Koshida, K. Yoshimura, M. Mihara, M. Naitou, H. Endoh, T. Nakamura, et al. 2007. DEAD-box RNA helicase subunits of the Drosha complex are required for processing of rRNA and a subset of microRNAs. Nat. Cell Biol. 9:604–611. http://dx.doi.org/10.1038/ncb1577
Garofalo, M., and C.M. Croce. 2011. microRNAs: Master regulators as po-tential therapeutics in cancer. Annu. Rev. Pharmacol. Toxicol. 51:25–43. http://dx.doi.org/10.1146/annurev-pharmtox-010510-100517
Garofalo, M., C. Quintavalle, G. Di Leva, C. Zanca, G. Romano, C. Taccioli, C.G. Liu, C.M. Croce, and G. Condorelli. 2008. MicroRNA

968 NCL targeting for miRNA regulation in cancer | Pichiorri et al.
Soundararajan, S., W. Chen, E.K. Spicer, N. Courtenay-Luck, and D.J. Fernandes. 2008. The nucleolin targeting aptamer AS1411 destabi-lizes Bcl-2 messenger RNA in human breast cancer cells. Cancer Res. 68:2358–2365. http://dx.doi.org/10.1158/0008-5472.CAN-07-5723
Srivastava, M., and H.B. Pollard. 1999. Molecular dissection of nucle-olin’s role in growth and cell proliferation: new insights. FASEB J. 13:1911–1922.
Sun, D., K. Guo, and Y.J. Shin. 2011. Evidence of the formation of G-quadruplex structures in the promoter region of the human vascular endothelial growth factor gene. Nucleic Acids Res. 39:1256–1265. http://dx.doi.org/10.1093/nar/gkq926
Tayyari, F., D. Marchant, T.J. Moraes, W. Duan, P. Mastrangelo, and R.G. Hegele. 2011. Identification of nucleolin as a cellular receptor for human respiratory syncytial virus. Nat. Med. 17:1132–1135. http://dx.doi.org/ 10.1038/nm.2444
Teng, Y., A.C. Girvan, L.K. Casson, W.M. Pierce Jr., M. Qian, S.D. Thomas, and P.J. Bates. 2007. AS1411 alters the localization of a com-plex containing protein arginine methyltransferase 5 and nucleolin. Cancer Res. 67:10491–10500. http://dx.doi.org/10.1158/0008-5472.CAN-06-4206
Ventura, A., and T. Jacks. 2009. MicroRNAs and cancer: short RNAs go a long way. Cell. 136:586–591. http://dx.doi.org/10.1016/j.cell.2009.02.005
Visone, R., A. Veronese, L.Z. Rassenti, V. Balatti, D.K. Pearl, M. Acunzo, S. Volinia, C. Taccioli, T.J. Kipps, and C.M. Croce. 2011. miR-181b is a biomarker of disease progression in chronic lymphocytic leuke-mia. Blood. 118:3072–3079. http://dx.doi.org/10.1182/blood-2011- 01-333484
Volinia, S., G.A. Calin, C.G. Liu, S. Ambs, A. Cimmino, F. Petrocca, R. Visone, M. Iorio, C. Roldo, M. Ferracin, et al. 2006. A microRNA expression signature of human solid tumors defines cancer gene targets. Proc. Natl. Acad. Sci. USA. 103:2257–2261. http://dx.doi.org/10.1073/ pnas.0510565103
Volinia, S., M. Galasso, S. Costinean, L. Tagliavini, G. Gamberoni, A. Drusco, J. Marchesini, N. Mascellani, M.E. Sana, R. Abu Jarour, et al. 2010. Reprogramming of miRNA networks in cancer and leukemia. Genome Res. 20:589–599. http://dx.doi.org/10.1101/gr.098046.109
Watanabe, T., H. Tsuge, T. Imagawa, D. Kise, K. Hirano, M. Beppu, A. Takahashi, K. Yamaguchi, H. Fujiki, and M. Suganuma. 2010. Nucleolin as cell surface receptor for tumor necrosis factor-alpha inducing protein: a carcinogenic factor of Helicobacter pylori. J. Cancer Res. Clin. Oncol. 136: 911–921. http://dx.doi.org/10.1007/s00432-009-0733-y
Will, S., K. Reiche, I.L. Hofacker, P.F. Stadler, and R. Backofen. 2007. Inferring noncoding RNA families and classes by means of genome-scale structure-based clustering. PLOS Comput. Biol. 3:e65. http://dx.doi .org/10.1371/journal.pcbi.0030065
Wu, C.D., H.W. Chou, Y.S. Kuo, R.M. Lu, Y.C. Hwang, H.C. Wu, and C.T. Lin. 2012. Nucleolin antisense oligodeoxynucleotides induce apoptosis and may be used as a potential drug for nasopharyngeal carci-noma therapy. Oncol. Rep. 27:94–100.
Wu, H., H. Xu, L.J. Miraglia, and S.T. Crooke. 2000. Human RNase III is a 160-kDa protein involved in preribosomal RNA processing. J. Biol. Chem. 275:36957–36965. http://dx.doi.org/10.1074/jbc.M005494200
Yeung, K.Y., M. Medvedovic, and R.E. Bumgarner. 2003. Clustering gene-expression data with repeated measurements. Genome Biol. 4:R34. http://dx.doi.org/10.1186/gb-2003-4-5-r34
Zhang, B.G., J.F. Li, B.Q. Yu, Z.G. Zhu, B.Y. Liu, and M. Yan. 2012. microRNA-21 promotes tumor proliferation and invasion in gastric cancer by targeting PTEN. Oncol. Rep. 27:1019–1026.
Mortazavi, A., B.A. Williams, K. McCue, L. Schaeffer, and B. Wold. 2008. Mapping and quantifying mammalian transcriptomes by RNA-Seq. Nat. Methods. 5:621–628. http://dx.doi.org/10.1038/nmeth.1226
Nuovo, G., E.J. Lee, S. Lawler, J. Godlewski, and T. Schmittgen. 2009. In situ de-tection of mature microRNAs by labeled extension on ultramer templates. Biotechniques. 46:115–126. http://dx.doi.org/10.2144/000113068
Otake, Y., S. Soundararajan, T.K. Sengupta, E.A. Kio, J.C. Smith, M. Pineda-Roman, R.K. Stuart, E.K. Spicer, and D.J. Fernandes. 2007. Overexpression of nucleolin in chronic lymphocytic leukemia cells induces stabilization of bcl2 mRNA. Blood. 109:3069–3075.
Pichiorri, F., S.S. Suh, A. Rocci, L. De Luca, C. Taccioli, R. Santhanam, W. Zhou, D.M. Benson Jr., C. Hofmainster, H. Alder, et al. 2010. Downregulation of p53-inducible microRNAs 192, 194, and 215 impairs the p53/MDM2 autoregulatory loop in multiple myeloma development. Cancer Cell. 18:367–381. http://dx.doi.org/10.1016/j.ccr.2010.09.005
Pickering, B.F., D. Yu, and M.W. Van Dyke. 2011. Nucleolin protein interacts with the microprocessor complex to affect biogenesis of micro-RNAs 15a and 16. J. Biol. Chem. 286:44095–44103. http://dx.doi.org/10 .1074/jbc.M111.265439
Pillai, R.S., S.N. Bhattacharyya, and W. Filipowicz. 2007. Repression of protein synthesis by miRNAs: how many mechanisms? Trends Cell Biol. 17:118–126. http://dx.doi.org/10.1016/j.tcb.2006.12.007
Polyak, K., and R.A. Weinberg. 2009. Transitions between epithelial and mesenchymal states: acquisition of malignant and stem cell traits. Nat. Rev. Cancer. 9:265–273. http://dx.doi.org/10.1038/nrc2620
Rao, X., G. Di Leva, M. Li, F. Fang, C. Devlin, C. Hartman-Frey, M.E. Burow, M. Ivan, C.M. Croce, and K.P. Nephew. 2011. MicroRNA-221/222 confers breast cancer fulvestrant resistance by regulating mul-tiple signaling pathways. Oncogene. 30:1082–1097. http://dx.doi.org/10 .1038/onc.2010.487
Reyes-Reyes, E.M., and S.K. Akiyama. 2008. Cell-surface nucleolin is a sig-nal transducing P-selectin binding protein for human colon carcinoma cells. Exp. Cell Res. 314:2212–2223. http://dx.doi.org/10.1016/j.yexcr .2008.03.016
Rissland, O.S., S.J. Hong, and D.P. Bartel. 2011. MicroRNA destabiliza-tion enables dynamic regulation of the miR-16 family in response to cell-cycle changes. Mol. Cell. 43:993–1004. http://dx.doi.org/10.1016/ j.molcel.2011.08.021
Sayed, D., M. He, C. Hong, S. Gao, S. Rane, Z. Yang, and M. Abdellatif. 2010. MicroRNA-21 is a downstream effector of AKT that mediates its antiapoptotic effects via suppression of Fas ligand. J. Biol. Chem. 285:20281–20290. http://dx.doi.org/10.1074/jbc.M110.109207
Shi, H., Y. Huang, H. Zhou, X. Song, S. Yuan, Y. Fu, and Y. Luo. 2007. Nucleolin is a receptor that mediates antiangiogenic and anti-tumor activity of endostatin. Blood. 110:2899–2906. http://dx.doi.org/ 10.1182/blood-2007-01-064428
Shiohama, A., T. Sasaki, S. Noda, S. Minoshima, and N. Shimizu. 2007. Nucleolar localization of DGCR8 and identification of eleven DGCR8-associated proteins. Exp. Cell Res. 313:4196–4207. http://dx.doi.org/10 .1016/j.yexcr.2007.07.020
Shorning, B.Y., D. Griffiths, and A.R. Clarke. 2011. Lkb1 and Pten synergise to suppress mTOR-mediated tumorigenesis and epithelial-mesenchymal transition in the mouse bladder. PLoS ONE. 6:e16209. http://dx.doi .org/10.1371/journal.pone.0016209
Simon, R., M.D. Radmacher, K. Dobbin, and L.M. McShane. 2003. Pitfalls in the use of DNA microarray data for diagnostic and prog-nostic classification. J. Natl. Cancer Inst. 95:14–18. http://dx.doi.org/10 .1093/jnci/95.1.14
Copyright © 2022 FDOKUMEN