AGGRESSIVENESS AND PASSIVITY EVALUATED BY THE INVENTORY OF SOCIAL SKILL
Upload
independentCategory
view
3download
0
The accumulation of skin lesions and their use as
a predictor of individual aggressiveness in pigs§
Simon P. Turner a,*, Mark J. Farnworth a,1, Ian M.S. White b,Sue Brotherstone a, Mike Mendl c, Pieter Knap d,
Paul Penny e, Alistair B. Lawrence a
a Scottish Agricultural College, Sir Stephen Watson Building, Bush Estate,
Penicuik, Midlothian EH26 0PH, UKb Institute of Cell, Animal and Population Biology, University of Edinburgh,
West Mains Road, Edinburgh EH9 3JT, UKcCentre for Behavioural Biology, University of Bristol, Langford House, Langford BS40 5DU, UK
dPIC Germany GmbH, Ratsteich 31, 24837 Schleswig, Germanye JSR Farming Group, Southburn, Driffield, East Yorkshire, YO25 9ED, UK
Accepted 24 June 2005
Available online 1 August 2005
Abstract
Post-mixing aggression in commercially housed pigs can be intense and often results in the
accumulation of skin lesions. The number of lesions (lesion score, LS) has often been used as a proxy
indicator of post-mixing aggression. There has been no previous attempt to quantify the role of different
behaviours in the accumulation of lesions. The objective of this work was to investigate the factors that
contribute to LS in order to assess the validity of LS as a measure of individual aggressiveness. After
mixing into new groups of 12, the durations of reciprocal fighting and bullying, the proportions of fights
initiated, won and lost and physical attributes of the pigs were investigated for their impact on LS using
multiple regression on a sample of 342 growing pigs. Pig liveweight was the single greatest determinant
of LS. The duration spent in reciprocal fighting and being bullied were also significant determinants of
the LS and contributed to the total LS in proportions of 0.17 and 0.14, respectively. The proportion of
www.elsevier.com/locate/applanim
Applied Animal Behaviour Science 96 (2006) 245–259
§ Patent applied for.
* Corresponding author. Tel.: +44 131 535 3208; fax: +44 131 535 3121.
E-mail address: [email protected] (S.P. Turner).1 Present address: School of Natural Sciences, Unitec, Carrington Road, Mount Albert, Private Bag 92025,
Auckland, New Zealand.
0168-1591/$ – see front matter # 2005 Elsevier B.V. All rights reserved.
doi:10.1016/j.applanim.2005.06.009

fights initiated, won and lost did not influence the LS for pigs of a given weight. On an individual pig
basis, it was impossible to establish the relative importance of reciprocal fighting and the receipt of
bullying to the accumulation of lesions by reference to the total LS alone. Engagement in reciprocal
fighting was found to result in lesions to the anterior third of the body, whilst the receipt of bullying
resulted in lesions accruing on the caudal third of the body. Reference to the location of lesions, in
addition to their number, is a refinement of the methodology that potentially allows discrimination of
pigs that accumulate lesions as a result of reciprocal fighting or receipt of bulling.Apartial replication of
the experiment at a second unit (n = 84 pigs) with different genotypic, environmental and husbandry
conditions confirmed that the duration spent in reciprocal fighting and being bullied were significant
determinants of the LS and that the LS approach is applicable across units. Liveweight was not recorded
at Unit 2. These results suggest that the LS methodology provides a rapid means of estimating
aggressive behavioural phenotypes when reference is made to both the number and location of lesions
and pig weight and pen identity effects are accounted for.
# 2005 Elsevier B.V. All rights reserved.
Keywords: Pig; Mixing-related aggression; Lesion score; Fighting; Bullying
1. Introduction
Under wild conditions, the ancestors of the domestic pig cohabit in small, genetically
related matriarchal groups. Outside of the mating season, aggression between individuals is
infrequent and rarely injurious; a feature common to domestic pigs housed in an extensive
enclosure (Stolba and Wood-Gush, 1984, 1989; Mendl, 1995). Group social stability is
facilitated by the infrequent and gradual integration of newmembers to the group (Mauget,
1981), close kinship, the preservation of individual space and the use of threats and non-
aggressive behaviour to maintain dominance relationships (Mendl, 1995). In contrast,
many commercial pigs are repeatedly exposed to sudden mixing episodes with unrelated
animals in an environment that limits effective dispersal and the display of appropriate
submissive behaviour. Under these conditions, post-mixing aggression is intense during the
first 24 h after mixing (Meese and Ewbank, 1973), but varies considerably between
members of the group (Mount and Seabrook, 1993; Erhard et al., 1997).
Whilst fighting, pigs attempt to target the head, neck and ears of their opponent using
bites and slashes from the canine teeth (McGlone, 1985; Luescher et al., 1990; Geverink
et al., 1996; Weary and Fraser, 1999). This results in the accumulation of superficial skin
lesions predominantly to the front third of the body, but also to the flanks when delivered in
a reverse parallel posture (McGlone, 1985; Fraser and Rushen, 1987).
Intra-specific aggression in the pig poses a significant challenge to animal welfare and
productivity (Arey and Edwards, 1998; O’Connell and Beattie, 1999). Whereas the
problem of pig aggression has received much attention, detailed studies of aggressive
behaviour have largely been confined to staged paired encounters or small group sizes. We
have identified the need for an approach to rapidly and reliably quantify individual
differences in aggressiveness within the context of the social mixing that occurs on farms.
The number of skin lesions (lesion score, LS) has frequently been used as a proxy
indicator of the extent of post-mixing aggressive behaviour. This approach offers a rapid
means of assessing aggressiveness of a large number of pigs and has been used commonly
S.P. Turner et al. / Applied Animal Behaviour Science 96 (2006) 245–259246

when investigating the development of aggression over several days or weeks or when
using large social group sizes (e.g. Francis et al., 1996; Erhard et al., 1997; Spoolder et al.,
1999; Turner et al., 1999, 2000, 2002). Typically, group mean lesion scores have been used
to compare treatment effects on aggression. A limited number of experiments have
compared the LS of categories of pigs within the same social group (e.g. Erhard et al.,
1997; Turner et al., 2000), but no studies have fully examined the behaviours which
contribute to the accumulation of lesions at the level of the individual pig. Limited
evidence exists which demonstrates that the LS does relate to aspects of reciprocal fighting
behaviour (Olesen et al., 1996; Erhard et al., 1997), but these two indices have not always
been measured over the same time scale and the importance of bullying or physical damage
from the environment in the accumulation of lesions have not been considered.
This study formed part of a larger analysis investigating the heritability of aggressiveness
in pigs and its relationship to economically important production traits. Thesefindingswill be
reported in a separate publication. The use of lesion scoreswas identified as a potentialmeans
of rapidly assessing individual aggressiveness of a large sample of pigs when mixed under
commercial conditions. The aim of this study was to provide a behavioural validation for the
use of LS as a proxymeasure of individual aggressiveness.We approached this in the present
study by measuring LS post-mixing on two farms differing in genotype, housing and
management. We simultaneously collected behavioural records of aggressive behaviour in
addition to physical attributes of the pigs and the surrounding environment. We then used
multiple regression to analyse the contributions of physical and social environmental
covariates and behaviour to the accumulation of lesions.
2. Methods
2.1. Experimental design
The principal experiment was performed on one unit (Unit 1) where the effects of a
range of physical and environmental covariates on LS were assessed and a behavioural
validation of the LS methodology performed. A partial replication on a second farm (Unit
2) allowed the LS method to be validated under different genotypic, environmental and
management conditions. Both units were managed as commercial farms. A full replication
of the experiment at Unit 2 was not possible and a smaller range of environmental variables
was quantifiable at this unit.
2.1.1. Unit 1
2.1.1.1. Physical and environmental covariates determining LS. The total sample of 1132
purebred pigs (Large White, n = 597; 207 males, 390 females and Landrace, n = 535; 166
males, 369 females) were mixed into new social groups to investigate the effects of pig
liveweight, gender, genetic line, birth litter size, experimental group size and ambient
temperature on LS 24 h after mixing.
2.1.1.2. Behavioural validation. The overt post-mixing aggressive behaviour of a
sub-sample of 342 of the 1132 pigs (Large White, n = 186; 71 males, 115 females
S.P. Turner et al. / Applied Animal Behaviour Science 96 (2006) 245–259 247

and Landrace, n = 156; 49 males, 107 females) was observed in detail using the
protocol described below. All pigs mixed between two arbitrary dates spanning the
middle of the experimental period were used to form this sub-sample. The housing
and mixing procedure was the same for both the sub-sample of 342 and the remaining 790
pigs.
2.1.2. Unit 2
2.1.2.1. Behavioural validation. It was not possible to investigate the physical and
environmental covariates determining LS at Unit 2. To replicate the behavioural
observations performed on the sub-sample of 342 pigs at Unit 1, the aggressive behaviour
of 84 crossbred pigs (Large White � Landrace, 36 males, 48 females) was observed when
mixed at Unit 2.
2.2. Animals and housing
2.2.1. Unit 1
Pigs were farrowed in standard farrowing pens (mean total litter size at birth = 13.1 -
S.E.M. 0.09 pigs) and weaned at 4 weeks of age into first stage pens with fully perforated
plastic floors in mixed-sex groups of 45 S.E.M. 2.4 individuals. Floor space allowance was
0.34 m2/pig. At 27.9 S.E.M. 0.14 kg, experimental pigs were moved and mixed into the
experimental accommodation (96 pens) according to the protocol described below. The
pens comprised of a fully slatted concrete floor and a wet feeding trough of 4.5 m length.
Home-mixed feed was delivered on a four-hourly regime beginning at 07:00 h and ending
at 19:00 h. The median group size was 12 with a range of 10–13. The median floor space
allowance was 0.93 m2/pig (range 0.86–1.12 m2/pig) and the mean ambient temperature
was 20.9 S.E.M. 0.22 8C.
2.2.2. Unit 2
The farrowing accommodation and weaning procedure was similar to Unit 1. First
stage accommodation comprised of fully perforated, plastic-floored pens and group sizes
of either 16 or 32 individuals. Floor space allowance in the first stage accommodation
was 0.22 m2/pig. Pigs were observed at mixing into the second stage pens (seven pens) at
18–25 kg. The pens housed 16 pigs at a floor space allowance of 0.36 m2/pig had fully
slatted concrete floors and dry pelleted food was offered ad libitum.
2.3. Experimental mixing protocol
2.3.1. Units 1 and 2
Where possible, an equal number of pigs were selected from each of two non-adjacent
first stage pens to form a single-sex experimental group. Where an even number of pigs
was unavailable, a maximum of one additional pig was selected from one pen than from
the other. Mixing occurred between 09:00 and 12:00 h and all pigs were introduced
simultaneously into the clean second stage pen. Immediately before mixing into the
experimental pens, the unique ear tag number, pig liveweight, gender, genetic line and
experimental group size were recorded (Unit 1 only). Ambient temperature was recorded
S.P. Turner et al. / Applied Animal Behaviour Science 96 (2006) 245–259248

24 h after mixing at Unit 1. Only 12 pigs per pen of 16 were observed for the purposes of
the experiment at Unit 2 as this was the maximum number of individual spray paint
marks which could be reliably identified at that site. Six pigs from each of the two first
stage pens were selected at random to provide these 12 experimental pigs.
2.4. Lesion score recording protocol
2.4.1. Units 1 and 2
Immediately before entry into the experimental pen, a pre-mixing LS was recorded for
each pig and a spray mark, unique within the experimental group, was applied to all pigs.
Twenty-four hours after mixing, the LS was again recorded from which the pre-mixing LS
was subtracted to provide the number of lesions resulting from the 24 h post-mixing period.
This period was suggested by pilot studies as the point at which lesions could most
accurately be counted and encompasses the period when the majority of mixing-induced
aggression is believed to occur (Meese and Ewbank, 1973).
The lesion scores used in the analyses were recorded by one observer, but to quantify
the extent of inter-observer reliability in LS recording, a second observer also
independently lesion scored the first 48 animals in the study at Unit 1. Each observer was
blind to the scores allocated by the other individual. The scores recorded by the two
observers were closely correlated (Pearson correlation, r = 0.91, intercept 12.03, slope
0.79, P < 0.001).
To facilitate counting, the body was divided into three regions: front (head, neck,
shoulders and front legs), middle (flanks and back) and rear (rump, hind legs and tail). The
number of fresh lesions was recorded but weighting was not given to the length or diameter
of lesions. Freshness was judged subjectively by lesion colour and the estimated age of
scabbing.
2.5. Behavioural observations
Overt aggressive behaviour was recorded by one observer for the sub-sample of 342
pigs at Unit 1 and 84 pigs at Unit 2, using continuous observation of the 24 h post-mixing
period with the aid of time-lapse video equipment. The duration, to the nearest second, of
all bouts of reciprocated or non-reciprocated aggression were recorded using the
definitions provided in Table 1. Only aggressive behaviour which was likely to result in
injury was recorded. Aggression was recorded when bites were delivered at an
approximate rate of�1 per 3 s. The same ethogramwas used on both farms. The identity of
the initiator, winner and loser were noted if this was clear.
2.6. Statistical analysis
The non-reciprocal behaviour categories ‘resting during fight’ and ‘withdrawal at end of
fight’ occurred very infrequently and for short durations at both units. For the purposes of
analysis, the records from these two categories and those from the third category ‘attack not
associated with a fight’ were pooled and given the collective term ‘bullying/bullied’
dependent on the direction of the aggression.
S.P. Turner et al. / Applied Animal Behaviour Science 96 (2006) 245–259 249

In order to estimate the effects of physical and environmental covariates on LS and for
the behavioural validation, the data were examined for their approximation to the normal
distribution and log transformed where necessary.
The effect of a range of physical and environmental covariates on LS was examined at
Unit 1 (n = 1132) by incorporating pig liveweight, group size and litter size as fixed effects,
pen and genetic line as random effects and ambient temperature as a factor in a residual
maximum likelihood (REML; Gilmour et al., 2000) model to determine the effects on LS.
As litter and gender were confounded with pen identity, the inclusion of pen as a random
effect allowed gender and litter effects to be estimated by comparisons among pen mean
scores.
A multiple regression analysis which accounted for differences between pens was used
to generate a model to estimate the LS at Unit 1 using six variables based on the
behavioural data (durations of reciprocal fighting, bullying and being bullied, and the
proportion of reciprocal fights initiated, won and lost). Pig liveweight was also included as
a variable in the model. The strength of within-pen correlations between individual
variables was examined for both units using Pearson product moment correlations after log
transformation of the data where necessary and subtraction of between-pen effects. All
S.P. Turner et al. / Applied Animal Behaviour Science 96 (2006) 245–259250
Table 1
Ethogram of aggressive behaviours
Damaging aggression Periods of interaction during which bites were delivered at an
approximate rate of �1 per 3 s. This defines the severity of
aggression recorded under ‘reciprocal fighting’ and
‘non-reciprocated aggression’ described below
Reciprocal fight Reciprocal damaging aggression lasting �1 s
Fight initiation
Initiator Identity of the pig which delivered the first bite
Unclear initiator Antagonists bit each other apparently simultaneously with
<1 s between attack and retaliation
Fight outcome
Loser Identity of the pig which retreated �1 m from the winner and
was pursued over this distance. The loser did not show re-newed
damaging aggression towards the winner for �3 s
Winner Identity of the pig which pursued a retreating pig over a
distance of �1 m. The winner did not receive re-newed
damaging aggression from the loser for �3 s
Unclear winner Neither pig retreated for �1 m or was pursued over this
distance at the end of a fight
Non-reciprocated aggression
Rest during fight Damaging aggression was given/received whilst the recipient
was resting for �3 s during a reciprocal fight. The recipient
did not show damaging aggression during this period
Withdrawal at end of fight Damaging aggression was given/received whilst the recipient
was withdrawing at the end of a reciprocal fight. The recipient
did not show damaging aggression during this period
Attack not associated with a fight Damaging aggression was given/received without the recipient
showing damaging aggression during, or for �3 s before or
after, the attack

relationships are therefore presented as within-pen correlation coefficients after differences
resulting from pen effects were removed.
3. Results
3.1. Phenotypic variability in aggressive behaviour and LS
At both units, pigs spent a shorter duration being bullied and bullying other individuals
than engaging in reciprocal aggression (Table 2). All three behavioural variables and the
LS had frequency distributions with a positive skew (Table 2; Fig. 1(a and b)).
3.2. Physical and environmental covariates determining LS
Within the ranges studied at Unit 1, the impact of a variety of animal and environmental
covariates on the expression of the LS trait were quantified using the total sample of 1132
pigs. Factors group size (10–13 pigs/pen), ambient temperature (16–23 8C), total litter sizeat birth (4–21 pigs), gender and genetic line had no significant effect on LS. The correlation
of pig liveweight with LS was highly significant (P < 0.001). On the logarithmic scale, the
slope of the relationship was 0.019 S.E.M. 0.0056. On the untransformed scale, this
corresponds to approximately a 2% increase in LS for each additional kilogram of body
weight. Pen identity was also found to significantly influence the LS when included as a
random effect.
3.3. LS estimation from behavioural variates and pig attributes
3.3.1. Unit 1
A multiple regression analysis which accounted for differences between pens was used
to generate a model to estimate the LS using data from Unit 1 only. The initial model
incorporated the durations engaged in reciprocal fighting, being bullied and bullying other
pigs, the proportion of reciprocal fights initiated, won and lost and pig liveweight. Of these
seven variables, only the duration engaged in reciprocal fighting, the duration spent being
bullied and pig liveweight significantly affected the LS. The remaining variables were
removed from the model. Transformation did not normalise the data and a similar
S.P. Turner et al. / Applied Animal Behaviour Science 96 (2006) 245–259 251
Table 2
Durations (s/pig) spent being bullied, bullying and engaged in reciprocal fighting and the lesion score (LS) of pigs
on Units 1 and 2
Unit 1 Unit 2
Median Range Skewness Median Range Skewness
Bullied 3.0 0–84 3.43 0.0 0–17 2.39
Bullying 0.0 0–183 5.37 0.0 0–29 3.64
Reciprocal aggression 11.0 0–705 3.38 2.0 0–165 2.84
LS 28.0 1–140 1.34 24.0 0–112 1.45
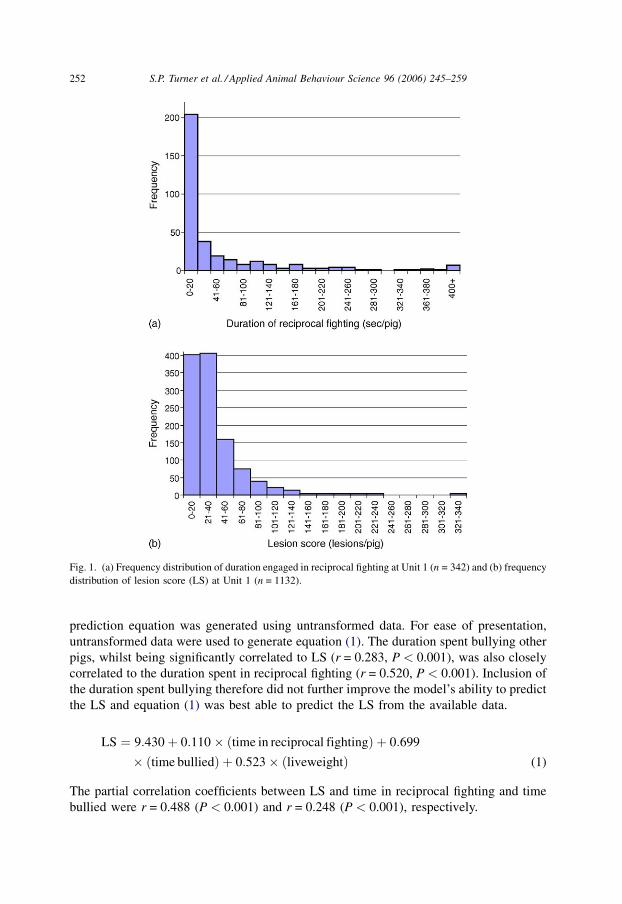
prediction equation was generated using untransformed data. For ease of presentation,
untransformed data were used to generate equation (1). The duration spent bullying other
pigs, whilst being significantly correlated to LS (r = 0.283, P < 0.001), was also closely
correlated to the duration spent in reciprocal fighting (r = 0.520, P < 0.001). Inclusion of
the duration spent bullying therefore did not further improve the model’s ability to predict
the LS and equation (1) was best able to predict the LS from the available data.
LS ¼ 9:430þ 0:110� ðtime in reciprocal fightingÞ þ 0:699
� ðtime bulliedÞ þ 0:523� ðliveweightÞ (1)
The partial correlation coefficients between LS and time in reciprocal fighting and time
bullied were r = 0.488 (P < 0.001) and r = 0.248 (P < 0.001), respectively.
S.P. Turner et al. / Applied Animal Behaviour Science 96 (2006) 245–259252
Fig. 1. (a) Frequency distribution of duration engaged in reciprocal fighting at Unit 1 (n = 342) and (b) frequency
distribution of lesion score (LS) at Unit 1 (n = 1132).

3.3.2. Unit 2
The inability to record pig liveweight at Unit 2 and the small sample size constrained
the full replication of the multiple regression analysis performed at Unit 1. It was
possible, however, to examine the impact of each of the behavioural variables on LS
independently. Significant correlations were found between the LS and the duration in
reciprocal fighting (r = 0.251, P < 0.05) and between the LS and the duration of time
spent being bullied (r = 0.195, P < 0.05). No significant correlations were detected
between the LS and the duration spent bullying other pigs, or between the LS and the
proportion of reciprocal fights initiated, won or lost. A significant correlation was found
between the duration spent in reciprocal fighting and the duration spent bullying other
pigs (r = 0.493, P < 0.001).
3.4. Relationship between LS and other characteristics of reciprocal fighting
LS was significantly correlated with the frequency of reciprocal fights (Unit 1,
r = 0.397, P < 0.001; Unit 2, r = 0.221, P < 0.05) and with the mean fighting bout length
(Unit 1, r = 0.388, P < 0.001; Unit 2, r = 0.253, tendency, P < 0.1). These two behavioural
variables were significantly correlated at Unit 1 (r = 0.360, P < 0.001), indicating that a
high duration spent in reciprocal fighting was often a combined consequence of a high
frequency of fights and a high mean fighting bout length. No significant correlation
between fight frequency and length was apparent at Unit 2. Pigs with a high LS also fought
a greater proportion of group members at both units (Unit 1, r = 0.379, P < 0.001; Unit 2,
r = 0.231, P < 0.05).
The proportion of reciprocal fights which were initiated, won or lost did not correlate
with LS at either unit. There was evidence, however, that pigs which spent a high duration
in reciprocal fighting tended to initiate (Unit 1, r = 0.128, P < 0.05; Unit 2, r = 0.289,
tendency, P < 0.1) and win (Unit 1, r = 0.314, P < 0.001; Unit 2, r = 0.266, tendency,
P < 0.1) a higher proportion of these encounters. Independently, the proportion of fights
which were initiated and won were significantly correlated (Unit 1, r = 0.377, P < 0.001;
Unit 2, r = 0.582, P < 0.001). No significant relationship was found at either unit between
the duration engaged in reciprocal fighting and the proportion of fights lost.
3.5. Relationship between fighting behaviour and liveweight at Unit 1
There was no significant correlation between the duration engaged in reciprocal fighting
and liveweight. However, there was a significant negative correlation between the duration
spent being bullied and liveweight (r = �0.218, P < 0.001).
3.6. Relationship between reciprocal fighting and being bullied
There was a significant and positive correlation between the duration spent in reciprocal
fighting and the duration being bullied at Unit 1 (r = 0.167, P < 0.005). Whilst this
relationship is statistically significant, the correlation coefficient accounts for little of the
total variance and no significant correlation was found between these two variables at Unit
2. It is likely that, whilst some pigs did accrue a high LS from being both heavily bullied
S.P. Turner et al. / Applied Animal Behaviour Science 96 (2006) 245–259 253

and being involved in a lot of reciprocal fighting, pigs were also able to acquire a high LS
through only one of these routes.
3.7. Location of lesions accrued during reciprocal fighting and when bullied
The location of lesions was examined as a possible indicator of the contribution made to
the LS by reciprocal fighting and the receipt of bullying. The pig’s body was divided into
three areas comprising front (head, neck, shoulders and front legs), middle (flanks and
back) and rear (rump, hind legs and tail). The durations of (i) reciprocal fighting and (ii)
being bullied were expressed as a proportion of the total time spent in both behaviours
(reciprocal fighting + being bullied). The correlation, accounting for between-pen effects,
between the proportion of time spent in either of these two behaviours and the proportion of
the LS located on each of the three body areas was examined. At Unit 1, a significant
positive correlation was found between the proportion of lesions located on the front third
of the body and the proportion of time spent in reciprocal fighting (r = 0.152, P < 0.01).
The regression equation for this relationship was:
Proportion of lesions located on the front
¼ 0:409þ 0:081 proportion of reciprocal fighting
Also at Unit 1, a significant positive correlation was found between the proportion of
lesions located on the rear third of the body and the proportion of time spent being bullied
(r = 0.148, P < 0.01), with the following regression equation:
Proportion of lesions located on the rear
¼ 0:208þ 0:040 proportion of time being bullied
The proportion of lesions located on the middle region was not significantly influence by
the proportion of time spent in reciprocal fighting or being bullied.
These analyses were based on a sample size of 320 after removal of pigs from the dataset
which had either (a) received no lesions or (b) engaged in no reciprocal fighting and been
the recipient of no bullying.
When these analyses were repeated at Unit 2 with a sample size of 60 pigs, no significant
relationship was found between pig behaviour and lesion location.
4. Discussion
In commercial group housing systems, pigs exhibit wide-ranging individual behavioural
differences, which persist over time, in response to a variety of challenging situations
(Lawrence et al., 1991; Forkman et al., 1995; Erhard and Mendl, 1999; van Erp-van der
Kooij et al., 2002) and there is evidence that this variability extends to the propensity to
show aggressive behaviour (Erhard et al., 1997). The current data would support the
presence of wide phenotypic variability in aggressiveness. The two populations were
characterised by a majority of pigs which showed small to moderate amounts of reciprocal
S.P. Turner et al. / Applied Animal Behaviour Science 96 (2006) 245–259254

fighting and a minority which engaged in a disproportionately large amount of fighting.
Erhard and Mendl (1997) found a similar tendency for a large part of the population to
show a low propensity towards aggressiveness, as measured by attack behaviour in a
standardised resident/intruder paradigm.
Lesion score is a measure of the outcome of aggression. If it is to be used as a proxy
measure of individual aggressiveness it is necessary to demonstrate which behaviours
contribute to the accumulation of lesions, and to identify which factors of the environment
are significant determinants of this trait. Both engagement in reciprocal fighting and being
bullied were found to be significant determinants of the LS at 24 h post-mixing. At Unit 1,
the mean durations per pig for the two variables was 53.6 and 7.1 s, respectively. A typical
pig accrued approximately the same quantity of lesions (5.91 lesions/pig versus
4.96 lesions/pig) from these two routes. Despite the disparity in the total observed
durations of these behaviours, they both contributed to the total LS in similar proportions
(proportionately 0.167 versus 0.140 of the total LS, respectively). Consequently, the
number of lesions received per second of being bullied was over six times greater than that
received from the same duration of reciprocal fighting.
The LS approach readily identifies pigs which had successfully avoided engagement in
reciprocal fighting and the receipt of bullying, due to their low LS. Whilst the correlation
between the duration engaged in reciprocal fighting and being bullied was positive and
statistically significant at Unit 1, a large residual variance remained and the relationship
between these variables did not approach statistical significance at Unit 2. It is likely that
many pigs received lesions disproportionately from one of these routes. It is difficult to
quantify the relative contribution of reciprocal fighting and the receipt of bullying to the
accumulation of injuries based on an individual’s LS alone. The use of lesion location may
allow the importance of these two routes to be identified at the level of the individual pig.
During reciprocal fights, bites are targeted primarily at the head, neck and shoulders
of the opponent (McGlone, 1985; Weary and Fraser, 1999) and lesions accumulate
predominantly in this area (Rundgren and Lofquist, 1989). Pigs which engage
predominantly in reciprocal fighting, but which receive little bullying, would be expected
to receive a greater proportion of their total LS around the front third of the body. The larger
dataset from Unit 1supports this proposition as a significant positive correlation was
identified between the LS to the front of the body and the proportion of time spent in
reciprocal fighting. Conversely, during retreat (a prerequisite for bullying as defined in
Table 1), bites are targeted at the rump of the retreating animal (Meese and Ewbank, 1973)
and a significant positive correlation was identified at Unit 1 between the proportion of
lesions located around the rear of the body and the proportion of time spent in receipt of
bullying. Whilst these relationships were statistically significant, the correlation
coefficients were not large, indicating that lesions were not received exclusively to the
front region during reciprocal fighting or to the rear region when bullied.
As the duration engaged in reciprocal fighting was a significant determinant of the LS, it
is worth considering what characteristics of reciprocal fighting differed between
individuals which showed little or much of this behaviour. A high duration in reciprocal
aggression was the product of both a high frequency of fights and a long mean fighting bout
length. As the total duration engaged in reciprocal fighting is a composite measure of these
two variables, its use would appear to offer the best single measure of reciprocal fighting
S.P. Turner et al. / Applied Animal Behaviour Science 96 (2006) 245–259 255
behaviour investigated in this study. A high LS resulting from reciprocal fighting was
unlikely to be attributable to a single prolonged fight with one individual opponent but
appears to reflect a more generally aggressive temperament. Pigs which won a high
proportion of reciprocal fights tended to initiate them and to engage in a high duration of
fighting overall. Evidence frommany taxa suggests that the experience of recent success or
defeat influences an individual’s subsequent willingness to engage in fighting and the
outcome of those fights (Rushen, 1988; Chase et al., 1994; Cloutier et al., 1995; Hsu and
Wolf, 1999). For the pigs studied, the experience of winning or losing encounters
immediately after mixing appears to have influenced the assessment of their likelihood of
success in subsequent encounters. However, Rushen (1988) observed that, until the end of
the encounter, the eventual losers of fights between pigs tended to fight with the same
vigour as eventual winners, which may explain the lack of a direct effect of fight success on
LS in the current experiment.
Within the limits of the environment, age and genetic background of the pigs and
husbandry practices used in this study at Unit 1, the total litter size at birth, gender and
genetic line of the pig and the group size and ambient temperature in the experimental
accommodation had no significant effect on LS. Before application of the LS approach in
an environment which differs from that studied, or when using pigs with a different genetic
or social history, the impact of these covariates on the LS may need to be reassessed. An
effect of the group on LS is a clear result from this work. As lesions accrue through social
interactions with other pigs, it is not surprising that the behaviour of the group influences
the LS of its individual members. However, after accounting for between-pen effects,
considerable within-pen variation in LS was still apparent which correlated to aspects of
aggressive behaviour.
A significant factor in this group-level effect was likely to be the group mean liveweight.
At the within-pen level, liveweight of the individual pig proved to be the single most
important determinant of the LS, accounting for proportionately 0.42 of the total LS at Unit
1. A positive correlation between liveweight and aggression has been demonstrated in pigs
before (Olesen et al., 1996; Pitts et al., 2000) and a considerable sexual dymorphism in
aggression occurs around the time of puberty, characterised by an increase in aggression in
intact males (Cronin et al., 2003). However, in the current experiment, the increased LS of
heavier pigs could not be attributed to a longer duration of reciprocal fighting or being
bullied. As the duration and intensity of fighting is greatest between pigs of closely
matched weight (Parker, 1974; Rushen, 1988), it is probable that heavy weight pigs
predominantly fought other heavy weight pigs. The weight-related increase in LS may
simply reflect the greater level of injury possible when heavier pigs, with greater strength
and larger canine teeth fight, rather than an increase in aggressive temperament per se.
5. Conclusions and practical implications
This study has concentrated on the expression of physically injurious aggression. Other
aspects of aggressive behaviour which do not lead to physical injury, such as pushing, are
not quantifiable using this approach but could be perceived as a significant stressor by the
pig. Additionally, using the LS approach, it is not possible to investigate whether
S.P. Turner et al. / Applied Animal Behaviour Science 96 (2006) 245–259256

individuals which expressed a high level of injurious aggression also performed a large
amount of non-injurious aggression. However, this work does suggest that the lesion score
approach can be used to provide a measure of the durations of physically injurious
aggression.
Awide phenotypic variability in overt aggressive behaviour and lesion scores has been
demonstrated, in which a disproportionate amount of lesions are received by a minority of
the population. The LS in this study was determined by the duration of time engaged in
reciprocal fighting, the duration of time being bullied and pig liveweight. The success in
reciprocal encounters did not significantly determine the LS. The LS approach readily
identifies pigs which had neither engaged in prolonged reciprocal fighting nor been the
recipients of prolonged bullying, due to the low number of lesions received. For other pigs,
it is more difficult, based on lesion number alone, to determine the contributions made by
reciprocal fighting and the receipt of bullying to the LS. Statistically, it is possible to use the
location of lesions to infer how they were accrued, since bites received during reciprocal
fighting are predominantly targeted towards the front third of the body and those received
when bullied typically accumulate on the rear. However, by making reference to both
lesion number and location, a large amount of error still remains unexplained. The LS
approach allows measurements to be efficiently made on a large sample size. The benefits
of the approach need to be considered in light of its limitations and when observations of
aggressive behaviour are feasible they should be used in preference to the LS approach.
Used with caution, however, the LS methodology can provide some insights into the
aggressive behaviour of large numbers of individual animals where other approaches
would be impossible.
When used in future studies it will be necessary to account for differences in individual
pig liveweight and between-pen effects, and also the impact of environmental variables
should be quantified if out-with the range studied in the present experiment. The findings
from the two units showed close agreement and indicate that the LS methodology is not
unit-specific but ought to be generally applicable when used at a liveweight of 20–30 kg.
Acknowledgements
The authors wish to thank Colin Morgan, Simon Cottam and the staff of the units for
their invaluable assistance. This project was funded through the LINK Sustainable
Livestock Production Programme by Defra with additional funding from the PIC
International Group, JSRGenetics, theMeat and Livestock Commission, the Royal Society
for the Prevention of Cruelty to Animals and the Scottish Society for the Prevention of
Cruelty to Animals. SAC receives financial support from SEERAD.
References
Arey, D.S., Edwards, S.A., 1998. Factors influencing aggression between sows after mixing and the consequences
for welfare and production. Livest. Prod. Sci. 56, 61–70.
S.P. Turner et al. / Applied Animal Behaviour Science 96 (2006) 245–259 257
Chase, I.D., Bartolomeo, C., Dugatkin, L.A., 1994. Aggressive interactions and inter-contest interval: how long do
winners keep winning? Anim. Behav. 48, 393–400.
Cloutier, S., Beaugrand, J.P., Lague, P.C., 1995. The effect of prior victory or defeat in the same site as that of
subsequent encounter on the determination of dyadic dominance in the domestic hen. Behav. Process. 34, 293–
298.
Cronin, G.M., Dunshea, F.R., Butler, K.L., McCauley, I., Barnett, J.L., Hemsworth, P., 2003. The effects of
immuno- and surgical-castration on the behaviour and consequently growth of group housed, male finisher
pigs. Appl. Anim. Behav. Sci. 81, 111–126.
Erhard, H.W., Mendl, M., 1997. Measuring aggressiveness in growing pigs in a resident-intruder situation. Appl.
Anim. Behav. Sci. 54, 123–136.
Erhard, H.W., Mendl, M., 1999. Tonic immobility and emergence time in pigs—more evidence for behavioural
strategies. Appl. Anim. Behav. Sci. 61, 227–237.
Erhard, H.W., Mendl, M., Ashley, D.D., 1997. Individual aggressiveness of pigs can be measured and used to
reduce aggression after mixing. Appl. Anim. Behav. Sci. 54, 137–151.
Forkman, B., Furuhaug, I.L., Jensen, P., 1995. Personality, coping patterns, and aggression in piglets. Appl. Anim.
Behav. Sci. 45, 31–42.
Francis, D.A., Christison, G.I., Cymbaluk, N.F., 1996. Uniform or heterogeneous weight groups as factors in
mixing weanling pigs. Can. J. Anim. Sci. 76, 171–176.
Fraser, D., Rushen, J., 1987. Aggressive behaviour. Vet. Clin. North Am.: Food Anim. Pract. 3, 285–305.
Geverink, N.A., Engel, B., Lambooij, E., Wiegant, V.M., 1996. Observations on behaviour and skin damage of
slaughter pigs and treatment during lairage. Appl. Anim. Behav. Sci. 50, 1–13.
Gilmour, A.R., Cullis, B.S., Welham, S.J., Thompson, R., 2000. ASREML. Reference Manual. NSWAgriculture,
Orange Agricultural Institute, Orange, Australia.
Hsu, Y., Wolf, L.L., 1999. The winner and loser effect: integrating multiple experiences. Anim. Behav. 57, 903–
910.
Lawrence, A.B., Terlouw, E.M.C., Illius, A.W., 1991. Individual differences in behavioural responses of pigs
exposed to non-social and social challenges. Appl. Anim. Behav. Sci. 30, 73–86.
Luescher, U.A., Friendship, R.M., McKeown, D.B., 1990. Evaluation of methods to reduce fighting among
regrouped gilts. Can. J. Anim. Sci. 70, 363–370.
Mauget, R., 1981. Behavioural and reproductive strategies in wild forms of Sus scrofa (European wild boar and
feral pigs). In: Sybesma, W. (Ed.), The Welfare of Pigs. A Seminar in the EEC Program of Coordination of
Research on Animal Welfare, Brussels. Martinus Nijhoff Publishers, London, pp. 3–13.
McGlone, J.J., 1985. A quantitative ethogram of aggressive and submissive behaviours in recently regrouped pigs.
J. Anim. Sci. 61, 559–565.
Meese, G.B., Ewbank, R., 1973. The establishment and nature of the dominance hierarchy in the domesticated pig.
Anim. Behav. 21, 326–334.
Mendl, M., 1995. The social behaviour of non-lactating sows and its implications for managing sow aggression.
Pig J. 34, 9–20.
Mount, N.C., Seabrook, M.F., 1993. A study of aggression when group housed sows are mixed. Appl. Anim.
Behav. Sci. 36, 377–383.
O’Connell, N.E., Beattie, V.E., 1999. Influence of environmental enrichment on aggressive behaviour and
dominance relationships in growing pigs. Anim. Welfare 8, 269–279.
Olesen, L.S., Nygaard, C.M., Friend, T.H., Bushong, D., Knabe, D.A., Vestergaard, K.S., Vaughan, R.K., 1996.
Effect of partitioning pigs on aggressive behaviour of pigs regrouped at weaning. Appl. Anim. Behav. Sci. 46,
167–174.
Parker, G.A., 1974. Assessment strategy and the evolution of fighting behaviour. J. Theor. Biol. 47, 223–
243.
Pitts, A.D., Weary, D.M., Pajor, E.A., Fraser, D., 2000. Mixing at young ages reduces fighting in unacquainted
domestic pigs. Appl. Anim. Behav. Sci. 68, 191–197.
Rundgren, M., Lofquist, I., 1989. Effects on performance and behaviour of mixing 20 kg pigs fed individually.
Anim. Prod. 49, 311–315.
Rushen, J., 1988. Assessment of fighting ability or simple habituation: what causes young pigs (Sus scrofa) to stop
fighting? Aggressive Behav. 14, 155–167.
S.P. Turner et al. / Applied Animal Behaviour Science 96 (2006) 245–259258

Spoolder, H.A.M., Edwards, S.A., Corning, S., 1999. Effects of group size and feeder space allowance on welfare
in finishing pigs. Anim. Sci. 69, 481–489.
Stolba, A., Wood-Gush, D.G.M., 1984. The identification of behavioural key features and their incorporation into
a housing design for pigs. Annales de Recherches Veterinaires 15, 287–298.
Stolba, A.,Wood-Gush, D.G.M., 1989. The behaviour of pigs in a semi-natural environment. Anim. Prod. 48, 419–
425.
Turner, S.P., Edwards, S.A., Bland, V.C., 1999. The influence of drinker allocation and group size on the drinking
behaviour, welfare and production of growing pigs. Anim. Sci. 68, 617–624.
Turner, S.P., Ewen, M., Rooke, J.A., Edwards, S.A., 2000. The effect of space allowance on performance,
aggression and immune competence of growing pigs housed on straw deep-litter at different group sizes.
Livest. Prod. Sci. 66, 47–55.
Turner, S.P., Dahlgren, M., Arey, D.S., Edwards, S.A., 2002. Effect of social group size and initial live weight on
feeder space requirement of growing pigs given food ad libitum. Anim. Sci. 75, 75–83.
van Erp-van der Kooij, E., Kuijpers, A.H., Schrama, J.W., van Eerdenburg, F.J.C.M., Schouten, W.G.P., Tielen,
M.J.M., 2002. Can we predict behaviour in pigs? Searching for consistency in behaviour over time and across
situations. Appl. Anim. Behav. Sci. 75, 293–305.
Weary, D.M., Fraser, D., 1999. Partial tooth-clipping of suckling pigs: effects on neonatal competition and facial
injuries. Appl. Anim. Behav. Sci. 65, 21–27.
S.P. Turner et al. / Applied Animal Behaviour Science 96 (2006) 245–259 259
Copyright © 2022 FDOKUMEN