Water Quality Quantification: Basics and Implementation
11
Primary Research Paper Water quality quantification: basics and implementation A. Parparov 1, *, K.D. Hambright 1,2 , L. Hakanson 3 & A. Ostapenia 4 1 Israel Oceanographic and Limnological Research, Kinneret Limnological Laboratory, Migdal, Israel 2 Department of Zoology, University of Oklahoma Biological Station, Kingston, OK, USA 3 Department of Earth Sciences, Uppsala University, Uppsala, Sweden 4 Laboratory of Hydroecology, Belarus State University, Minsk, Belarus (*Author for correspondence: E-mail: [email protected]) Received 18 October 2005; in revised form 27 October 2005; accepted 28 October 2005 Key words: water quality assessment, Lake Kinneret, Naroch Lakes, limnology, sustainable management Abstract Quantitative estimation of water quality and its relationships with management activities is a necessary step in efficient water resources management. However, water quality is typically defined in abstract terms and management activities are rarely quantified with respect to their impact on lake water quality. Here we show by demonstration of systems for Lake Kinneret, Israel and the Naroch Lakes of Belarus how water quality can be quantified in relation to lake management activities to be a part of sustainable management. Introduction ‘‘Water quality’’ is the term widely used in multiple scientific publications and normative documents relating to the necessities of ‘‘sustainable’’ and ‘‘optimal’’ management of water resources.The terms ‘‘water quality’’, ‘‘sustainable’’ and ‘‘man- agement’’ require concrete and quantitative defi- nitions of basic concepts: such as the objects and objectives of management, the environmental steady state (e.g., a ‘‘reference value’’) which should be sustained, and ecological and socio- economic effects of the management. Quantifica- tion of water quality is a challenging scientific problem and its solution should be an important stage in development of scientific background of water resources management (Ryding & Rast, 1989; Chapman, 1992; Hakanson & Peters, 1995; Parparov & Hambright, 1996; Boon & Howell, 1997; Hakanson et al., 2000; WFD, 2000). In this presentation we consider aspects of water resources management associated with the quantification of water quality (WQ). The problem itself: quantification of quality sounds rather oxymoronic. However, the task of optimal water resource management requires predefined stan- dards of water quality as integral components of the optimization criteria (Kalceva et al., 1982; Straskraba & Gnauck, 1985). Thus water quality should be expressed in measurable form to allow analytical expression of relationships between water quality and various driving factors that can affect water quality (e.g., external nutrient loading, intensity of water supply). The methodological approaches allowing quantitative expression of water qualilty are well known (Horton, 1965; Brown et al., 1970; Ott, 1978; Smith, 1987; 1990). Practical implementa- tions of these concepts have been concentrated in the US, while examples of quantitative estimates of lake water quality in Europe have been relatively rare. In many cases, particularly in the US, trophic classification was used as a gross indicator of water quality (U. S. Environmental Protection Agency, 1974). For example, oligotrophic lakes are con- sidered to be of ‘‘good’’ water quality; and eutro- phic lakes of ‘‘bad’’ water quality (e.g., see Fozzard et al., 1999). Such a system of trophic classification Hydrobiologia (2006) 560:227–237 Ó Springer 2006 DOI 10.1007/s10750-005-1642-y
Transcript of Water Quality Quantification: Basics and Implementation

Primary Research Paper
Water quality quantification: basics and implementation
A. Parparov1,*, K.D. Hambright1,2, L. Hakanson3 & A. Ostapenia41Israel Oceanographic and Limnological Research, Kinneret Limnological Laboratory, Migdal, Israel2Department of Zoology, University of Oklahoma Biological Station, Kingston, OK, USA3Department of Earth Sciences, Uppsala University, Uppsala, Sweden4Laboratory of Hydroecology, Belarus State University, Minsk, Belarus(*Author for correspondence: E-mail: [email protected])
Received 18 October 2005; in revised form 27 October 2005; accepted 28 October 2005
Key words: water quality assessment, Lake Kinneret, Naroch Lakes, limnology, sustainable management
Abstract
Quantitative estimation of water quality and its relationships with management activities is a necessary stepin efficient water resources management. However, water quality is typically defined in abstract terms andmanagement activities are rarely quantified with respect to their impact on lake water quality. Here weshow by demonstration of systems for Lake Kinneret, Israel and the Naroch Lakes of Belarus how waterquality can be quantified in relation to lake management activities to be a part of sustainable management.
Introduction
‘‘Water quality’’ is the term widely used in multiplescientific publications and normative documentsrelating to the necessities of ‘‘sustainable’’ and‘‘optimal’’ management of water resources.Theterms ‘‘water quality’’, ‘‘sustainable’’ and ‘‘man-agement’’ require concrete and quantitative defi-nitions of basic concepts: such as the objects andobjectives of management, the environmentalsteady state (e.g., a ‘‘reference value’’) whichshould be sustained, and ecological and socio-economic effects of the management. Quantifica-tion of water quality is a challenging scientificproblem and its solution should be an importantstage in development of scientific background ofwater resources management (Ryding & Rast,1989; Chapman, 1992; Hakanson & Peters, 1995;Parparov & Hambright, 1996; Boon & Howell,1997; Hakanson et al., 2000; WFD, 2000).
In this presentation we consider aspects ofwater resources management associated with thequantification of water quality (WQ). The problemitself: quantification of quality sounds rather
oxymoronic. However, the task of optimal waterresource management requires predefined stan-dards of water quality as integral components ofthe optimization criteria (Kalceva et al., 1982;Straskraba & Gnauck, 1985). Thus water qualityshould be expressed in measurable form to allowanalytical expression of relationships betweenwater quality and various driving factors that canaffect water quality (e.g., external nutrient loading,intensity of water supply).
The methodological approaches allowingquantitative expression of water qualilty are wellknown (Horton, 1965; Brown et al., 1970; Ott,1978; Smith, 1987; 1990). Practical implementa-tions of these concepts have been concentrated inthe US, while examples of quantitative estimates oflake water quality in Europe have been relativelyrare. In many cases, particularly in the US, trophicclassification was used as a gross indicator of waterquality (U. S. Environmental Protection Agency,1974). For example, oligotrophic lakes are con-sidered to be of ‘‘good’’ water quality; and eutro-phic lakes of ‘‘bad’’ water quality (e.g., see Fozzardet al., 1999). Such a system of trophic classification
Hydrobiologia (2006) 560:227–237 � Springer 2006DOI 10.1007/s10750-005-1642-y

allows one to rank lakes according to their pro-ductivity, oxygen and nutrient regime and therebyevaluate water quality changes (i.e., trophic statechanges) in response to various driving forces.
Water quality management then requires ask-ing (1) Is current water quality ‘‘good’’ or ‘‘bad’’?and (2) Will the management scenario under con-sideration (e.g., change in commercial fishingpressure, reduction in surface inflow) result in anincrease or decrease in water quality? It is obviousthat oligotrophication of a fishpond or eutrophi-cation of a drinking water reservoir should beequally considered as water quality deterioration.We suggest that detailed and concrete definitionsof water quality indices that take into consider-ation specific characteristics and uses of a givenwater resource (e.g., lake) can provide managerswith a necessary tool for formulating optimalmanagement strategies, particularly for waterresources that serve multiple uses.
Here we describe our development of the quan-tification of water quality and its implementation inLake Kinneret, Israel and the three Naroch Lakes(Batorino, Miastro and Naroch) of Belarus.
Material and methods
Study sites
Naroch LakesThe Naroch Lakes consist of three connectedbasins, Lakes Batorino, Miastro and Naroch.These kettle lakes are located in Northwest Bela-rus (Fig. 1). The limnology of the Naroch Lakeshas been intensely studied (Winberg, 1985). Mostpollution flowing into the Naroch Lakes is
entrapped upstream (mostly in Batorino, but alsoMiastro). Thus, WQ and hence, aesthetical andrecreational potential, in downstream LakeNaroch is relatively high compared with LakesBatorino and Miastro.
Until the mid 1980s, Lake Batorino was con-sidered as highly eutrophic; Lake Miastro aseutrophic, and Lake Naroch as mesotrophic.The trophic state of all three Naroch lakes de-clined (i.e., oligotrophied) substantially during thelast decade (Table 1). The main factors responsiblefor this oligotrophication are 1) a decrease ofexternal nutrient load following a decline in gen-eral economic activity, 2) instigation of remedialmeasures in the catchment area, and 3) the intro-duction of molluscan filtrator Dreissena polymor-pha (Ostapenya, 1999).
The oligotrophication of the Naroch Lakesconstituted water quality deterioration withrespect to the primary uses of Naroch waters(Ostapenya, 1999; Hakanson et al., 2000): con-servation (due to invasion of Dreissena polymor-pha); recreation (due to increase of areas occupiedby macrophytes), and commercial fisheries (due tolowering of the overall lake productivity).
Lake Kinneret (Israel)Lake Kinneret (the Biblical Sea of Galilee, thelargest fresh water body of the Middle East) is asubtropical eutrophic lake located at about)210 m altitude (i.e., below mean sea level) in thenorthern part of the Dead Sea Rift Valley (Fig. 2).The limnology of the lake is well-documented(Serruya, 1978). The main inflow (60 to 80% of thetotal) is via the Jordan River, while the mainoutflow is Israel’s National Water Carrier, sup-plying ca. one-third of the country’s freshwaterneeds. The water level of the lake depends on cli-matic inputs and withdrawal for water supply(Serruya, 1978, Hambright et al., 1997).
The lake is �22 km long and 12 km at maxi-mum width; maximum and mean depths are 42and 24 m, respectively, and the surface area is170 km2. The lake is amictic during most of sum-mer and fall, with surface temperaturesapproaching 30 �C (Hambright et al., 1997). Thehypolimnion becomes anoxic shortly after forma-tion.
Lake Kinneret is meso-eutrophic with a meanannual primary production of 650 g C m)2
Belarus
Lithuania
Latvia
Ukraine
Russia
Pol
and
Batorino
Naroch
Miastro
2 km
Nar
och
Lak
e s
2 km2 km
Fig. 1. The Naroch Lakes and their location in Belarus.
228

(Berman et al., 1995) and Secchi depths varyingfrom 0.7 to 5.5 m. A prominent biological featureof the lake has been the spring bloom of thedinoflagellate Peridinium gatunense (Pollingher,1978; Berman et al., 1992), though since 1994, thelake has exhibited uncharacteristic developmentsin the phytoplankton assemblage, including thefirst-ever bloom of a potentially toxic, N2-fixingcyanobacteria (Pollingher et al., 1998). Furtherdetail on the basic ecology of Lake Kinneret canbe found in Serruya, (1978).
Since 1965 (the inception of National WaterCarrier of Israel), and with the economic andpopulation growth both within the region and inIsrael, the main uses of Lake Kinneret waters havebeen consumptive — domestic ‘‘drinking water’’supply and agricultural irrigation (Shamir et al.,
1985). Owing to its historical significance and cli-matic characteristics, the lake has large recrea-tional potential. The lake is also supports arelatively large commercial fishery (Ben-Tuviaet al., 1992).
Methodology of Water Quality Quantification
Basic principlesWe have suggested the following principles of theWQ assessment as the initial stage of the quanti-fication process (Parparov & Hambright, 1996;Hambright et al., 2000):
1. The system of water quality indices (WQI)and their acceptable ranges must be decidedupon and quantified by an expert panel con-sisting of all partners in lake management:
Table 1. Limnological indices of the Naroch Lakes in 1977–1988 (I) and in 1989–1999 (II) (avg for ice-free season)
Indices Naroch Miastro Batorino
I II I II I II
S, m 5.1 6.1 1.7 3.8 0.78 1.1
TSS, mg L)1 1.81 0.96 6.2 2.29 16.7 9.2
BOD5, mgO2 L)1 1.06 1.03 2.05 1.39 3.55 2.63
Ctot, mg L)1 5.36 5.23 8.76 7.99 14.6 13
Ntot, mg L)1 0.87 0.58 1.14 0.70 1.62 0.94
Ptot, lg L)1 28 16 52 34 84 44
Chl, lg L)1 4.9 2.0 20.0 4.9 50.1 11.4
S – Secchi depth, TSS – Total Suspended Solids; Ctot – Total Carbon; Ntot – Total Nitrogen; Ptot – Total Phosphorus; Chl – chlorophyll
concentration (Ostapenya, 1999).
0 2 km
Jordan RiverJordan River
Jordan River
LAKE
20 km
SEA
ISRAELISRAELJordan RiverJordan River
KINNERET
ME
DIT
ER
RA
NE
AN
Red Sea
Dea
d S
e a
35˚
ISRAELISRAEL
EG
YPT
Figure 2. Lake Kinneret and its location in Israel.
229

Water Suppliers and Users, Limnologists,Fishermen and Fish-Farmers.
2. The WQIs and their driving processes must besuitable for mathematical modeling.
3. The WQIs and the model together shouldserve as a self-organizing tool for lake man-agement.
4. The WQI must be dynamic and adaptable tochanges in ecosystem functioning.
Assessment of WQ Indices and their permissiblerangesOur approach to water quality assessment (i.e.,establishment of the system of water quality indi-ces and their permissible ranges) was based onquantitative modifications of the expert panelmethod (Ott, 1978; Brown et al., 1970; Smith,1987; 1990). This step (as regards to Lake Kin-neret) was described in detail in Hambright et al.(2000). Here we provide a brief overview of theapproach. Initially, the correspondence betweenthe ecological values of WQI (e.g., nutrient con-centration or Secchi depth)) and some numericRating value (0<R<100) was established in aform of a rating curve (Fig. 3).
R=f(WQI) ð1Þ
Long-term monitoring data, including fre-quency distributions, means and standard devia-tions of physical, chemical and biologicalparameters in Lake Kinneret (1969–1992) and theNaroch Lakes (1970–2000) were provided toseparate expert panels for each lake. The panelswere asked to choose about 10 parameters mostindicative of water quality in the studied lakes,and to construct rating curves for each parame-ter, spanning the entire range of values observedin the lake. ‘‘Acceptable ranges’’ for the separatewater quality indices were restricted to the range60–100. Rating curves from individual panelmembers were averaged for each index. Linearapproximations of ratings and parameter valueswere used to construct graphic presentations ofthe temporal dynamics of the WQIs (Hambrightet al., 2000).
Results
The establishment of a system of water qualityindices
For Lake Kinneret and the Naroch Lakes, therating curves were established under the assump-tion that conservation of the lake ecosystem is theprime objective for the resource managers. The
0
20
40
60
80
100
0 2 4 6 8 10 12
TSS, mg L-1
Rat
ing
DrWatCons
EXCELLENT
GOOD
INTERMEDIATE
BAD
VERY BAD
Figure 3. Typical forms of the rating curves connecting quantitative value of water quality (Rating) with the value of the water quality
index (here total suspended solids, TSS) for different water uses: the ecosystem conservation (Cons) and the drinking water supply
(DrWat) established by the expert panel for Lake Kinneret. The acceptable WQ corresponds to 60<R<100 (from ‘GOOD’ to
‘EXCELLENT’).
230
rating curves will vary based on the primeobjective for management of the lake and the formand the shape of the rating curves will be stronglyaffected by the priorities of water use (e.g., eco-system conservation or drinking water supply, seeFig. 3). Integration of the rating curves into thesingle ‘‘national’’ water quality curve should bedone according to priorities established for themain directions of the water resources use. Suchpriorities were established for the Naroch Lakes(Table 2). The priorities of the water resourcesuses for Lake Kinneret are under consideration.
The established dependence (eq. 1) allowsassessment of the permissible ranges of WQI:
fWQILOW<WQIC<WQIHIGHg,60<R(WQI)<100; ð2Þ
where WQIC is the current value of the index;WQILOW is the lower permissible value andWQIHIGH is the upper permissible value of theindex;�means correspondence.
The established systems of water quality indicesfor conservation LK and the Naroch Lakes arepresented in Tables 3 and 4.
For Lake Kinneret, we distinguished betweentwo ecologically different periods owing to themagnitude of influence from the watershed andthe well-documented bloom period of the dino-flagellate Peridinium (see Serruya, 1978). There-fore, separate WQ ratings and parameter valuerelationships were established for these two peri-ods. The established system (Table 3) character-izes water quality of the upper layer (0–15 m) ofLake Kinneret water. This water layer approxi-mately corresponds to the euphotic zone and
epilimnion (during thermal stratification) in LakeKinneret.
Quantification of the relationships between WQand management
Establishment of the correspondence (if possible,functional) between the intensity of the manage-ment measures (MM) and the water qualitychanges caused by these measures, i.e.
WQI ¼ U(MM) ð3Þ
should be the next stage in quantification of waterquality.
Here, we apply the simplest regressional anal-yses to simulate potential relationships betweenmanagement measures (phosphorus loading forNaroch Lakes and the intensity of water supplyfor Lake Kinneret) and water quality indices(Fig. 4) for each lake. Being compared with theobserved limnological trends (e.g., increase ofsalinity with the lake water level lowering in LakeKinneret, or increase of water transparency withlowering of the phosphorus loading in LakeNaroch), these dependences are useful for illus-trating the process of the WQ quantification.
Discussion
The levels of WQI integration
Depending on both the target audience and thelevel of communication required, we propose threeseparate levels of WQI integration:
(A) An expanded system of water quality indices(Tables 3 and 4): This is the base system that issuitable for describing different aspects of waterresources use; it serves as a ‘‘common language’’for communication between partners in manage-ment.
(B) Reduced system of WQI: Modeling WQusing an expanded system (e.g., of 11 parametersfor Lake Kinneret) will lead to relatively highuncertainties of the estimates. Therefore, thenumber of WQ parameters and their WQIs shouldbe reduced using such techniques as correlationanalysis or other traditional mathematical meth-ods of minimization. This minimized system
p y y pp y) ( )
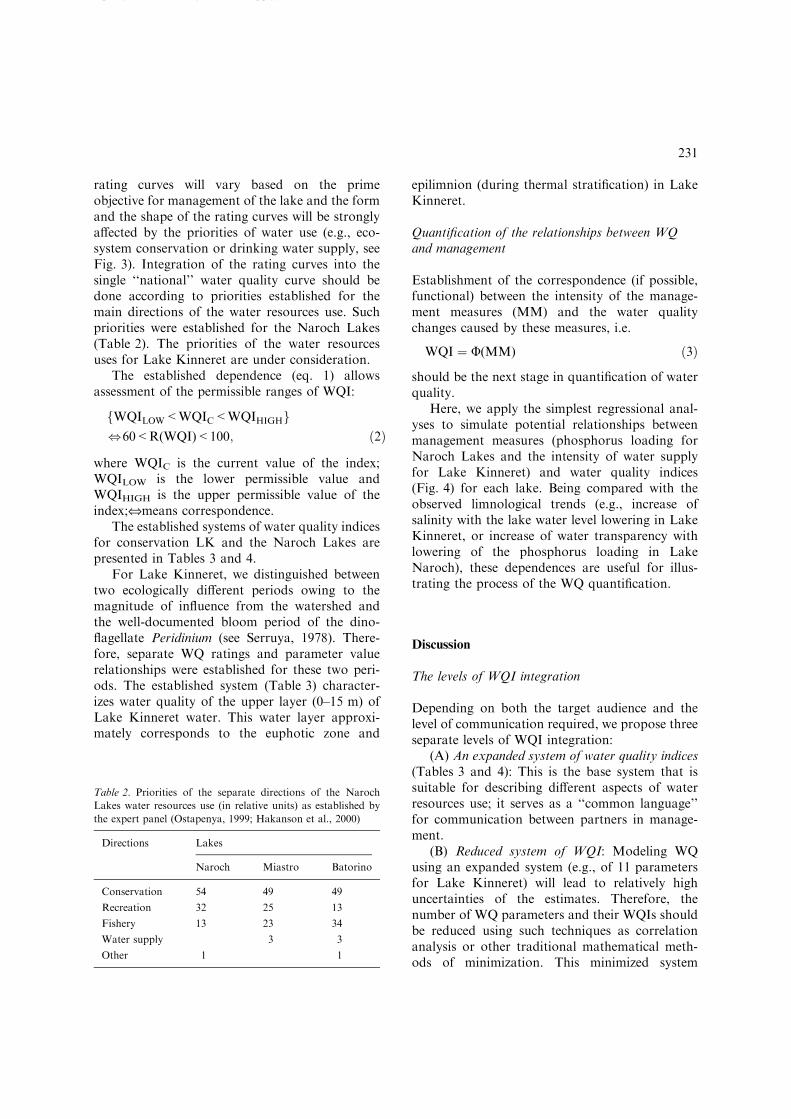
Table 2. Priorities of the separate directions of the Naroch
Lakes water resources use (in relative units) as established by
the expert panel (Ostapenya, 1999; Hakanson et al., 2000)
Directions Lakes
Naroch Miastro Batorino
Conservation 54 49 49
Recreation 32 25 13
Fishery 13 23 34
Water supply 3 3
Other 1 1
231

should represent a set of target variables formathematical modeling (see Table 3).
(C) Composite Water Quality Index, CWQI:Trials to express water quality as an integrated orcomposite value have a long tradition in limnology(e.g., a trophic state index (Carlson, 1977) or LakeEcosystem Index (Hakanson & Peters, 1995)). Thishighest level of integration of water quality esti-mating should be suitable for communication withthe policymakers andoptimization ofmanagement.
Usually, the CWQI is calculated using differentmethods of averaging. To illustrate how the esti-mates of the ‘‘overall’’ water quality depend on thealgorithm of the CWQI evaluating we calculatedCWQI dynamics in Lakes Kinneret and Naroch asthe arithmetic mean of the separate rating values,the weighted average and the minimum operator ofD. Smith (the CWQI value in the last case corre-sponds to the lowest rating value in the entire set ofthe water quality indices, Smith (1987; 1990),
g ( ) g
Table 3. Acceptable winter-spring and summer-autumn ranges (100 ‡ Rating ‡ 60) for selected water quality parameters for con-
servation of Lake Kinneret ecosystem. The WQIs included into the ‘Reduced’ WQI system are shown in bold (Parparov and
Hambright, 1996; Hambright et al., 2000)
Indices Winter-Spring Summer-Autumn
Chloride, mg L)1
(Cl) 184)244 184)246Total suspended solids, mg L)1 (TSS) 1.0)7.1 0.6)4.1
Turbidity, NTU (Tu) 1.2)4.9 0.7)3.0
Total phosphorus, lg L)1 (Ptot) 9)38 5)28
Total nitrogen, mg L)1 (Ntot) 0.3)1.2 0.2)0.9
Chlorophyll, lg L)1 (Chl) 5.5)40.5 1.5)10.1
Primary production, g C m)2
d)1
(PP) 1.1)3.2 0.7)2.2
Cyanobacteria, % total biomass (%Cyano) 0)3.7 1)10.8
Biomass of Zooplankton, g m)2 (Bzp) 13)52 7)37Fecal coliforms, No. 100 mL)1 (Fcoli) 0)1000 0)500
BOD5, mg O2 L)1 0.96)3.96 0.54)1.38
Table 4. The set of the water quality indices and their acceptable ranges (for the ‘‘Conservation’’ use) for the Naroch Lakes
(Ostapenya, 1999; Hakanson et al., 2000)
Indices Naroch Miastro Batorino
Secchi depth, m 4.7)7.9 2.1)5.4 0.7)2.1
Total Suspended Solids, mg L)1 0.3)2.5 0.6)2.6 4.3)18.0
Chlorophyll, lg L)1 0.8)6.9 3.1)28.4 7.0)72.0
Oxygen, % Saturation, at surface >70)120 >70)150 86)139
Oxygen, % Saturation, near bottom 58)110 62)120 65)147
Total Nitrogen, mg L)1 0.29)1.23 0.39)1.90 0.54)2.02
Total Phosphorus, mg L)1 0.01)0.04 0.02)0.07 0.03)0.10Total Carbon, mg L)1 3.9)6.3 6.4)9.4 9.0)16.4
Primary Production, mg C m)3 d)1 24)64 66)276 141)525
Destruction, mg C m)3 d)1 125)78 45)220 70)426
Phytoplankton Biomass, g m)3 0.3)1.9 1.0)7.2 3.0)23
Cyanobacteria, % of algal biomass 0.10)24 4)29 10)48
BOD5, mg O2 L)1 0.6)1.7 1.0)2.3 1.7)4.1
Zooplankton Biomass, g m)3 0.7)2.26 1.0)6.2 2.2)16.1
pH* 8.15)8.55Surface area accupied by macrophytes Should be established
*- for Lake Naroch only.
232

Nagels et al. (2001). For the Naroch lakes, the rel-ative weights of the separate water quality indiceswere proportional to the square correlation coeffi-cients of the respective temporal trends; for LakeKinneret the relative weights were inversely pro-portional to the rating values of the water qualityindices (Parparov & Hambright, in preparation.).
Of course, the long-term dynamics of CWQI(Fig. 5) are different depending on the integrationmethod used. The ‘‘average’’ CWQI varied withinacceptable rating values: between 60 and 100,indicating no drastic deterioration of water qualityin the both lakes. By contrast, the ‘‘minimumoperator’’ method clearly indicated a significant
tendency toward deterioration of water quality.The ‘‘weighted average’’ method produced anintermediate value. Note that the different esti-mates of water quality dynamics for Lake Narochindicated that oligotrophication yielded non-trivialWQ deterioration for all uses: conservation, rec-reation and fisheries.
Perhaps the most difficult aspect of WQI inte-gration to resolve is that related to the choice ofintegration. The approaches suggested above,whether ‘mean’ and ‘weighted’ averages are not
q y
S = 0.80Pload-0.82
R2 = 0.92
0
2
4
6
8
0 0.2 0.4 0.6 0.8Pload, g m
-2 yr
-1
Sec
chi d
epth
y = -10.1x - 1909.2
200
210
220
230
240
250
-213-212-211-210-209Water Level, m
Cl,
mg
L-1
(a)
(b)
Figure 4. (a) Scattering plot and approximating regressional
equation of the relationship between phosphorus load (Pload)
and Secchi depth (S) in the Naroch Lakes. (b) Scattering plot
and approximating regressional equation of the relationship
between water level (as a proxy of the intensity of water supply)
and chloride concentration (Cl) in Lake Kinneret.
Naroch Lake, 1979-1999
0
20
40
60
80
100
120
1979 1982 1985 1988 1991 1994 1997
Ar. Mean Minimum
Weighted
CW
QI
Lake Kinneret, 2000-2002
0
20
40
60
80
100
1 4 7 10 1 4 7 10 1 4 7 10
Minimum Ar. Mean
Weighted
CW
QI
(a)
(b)
Figure 5. (a) Dynamics of the composite water quality index
(CWQI) in Lake Naroch in 1979–1999. The CWQI was calcu-
lated as arithmetic mean (Ar. Mean), weighted average
(Weighted), and using ‘‘minimum operator’’ of Smith (1987;
1990) (‘‘Minimum’’); (b) Dynamics of the composite water
quality index (CWQI) in Lake Kinneret in 2000–2002. See
Figure 5(a) for designations.
233
objective and therefore reflect different interests ofthe different partners in water resources manage-ment.
Three considered approaches to calculating thecomposite water quality can be chosen under thefollowing management strategies:
– CWQI calculated as the arithmetic averagecorresponds to a management strategy forwhich general WQ deterioration would beindicated by substantial deterioration of morethan half of the separate WQIs;
– CWQI estimated using the minimum operatorcorresponds to a management strategy forwhich general WQ deterioration would beindicated by deterioration of only a singleWQI;
– CWQI estimated as the weighted average cor-responds to a management strategy for whichgeneral WQ deterioration would be indicatedby a combination of individual WQIs and theseverity their deterioration (e.g., the lower or‘‘worse’’ the rating value the higher its relativeweight (Parparov and Hambright, in prepara-tion). This system provides intermediate esti-mates of the overall water quality relative theabove-mentioned approaches and correspondsto a viewpoint of a ‘‘pragmatic limnologist’’:
20
60
100
-215-213-211-209Water Level, m
WS SA
CW
QI
Figure 6. Scattering plot of the composite water quality index
(CWQI, calculated as weighted average) versus water level in
Lake Kinneret (as a proxy of the intensity of water supply). The
calculations were done separately for the Winter-Spring and
Summer-Autumn periods (WS and SA, respectively). The
arrows indicate lower permissible ranges of the lake water level.
The lowering of the lake water level below this value can lead to
undesirable deterioration of the overall water quality.
0
20
40
60
80
100
0.0 3.0 6.0 9.0 12.0Secchi depth, m
Rat
ing
[S
]
0
20
40
60
80
100
0.0 0.1 0.2 0.3 0.4Pload, g m-2 yr -1
-1
Ra
tin
g [
S]
S = 0.80Pload-0.82
R2 = 0.92
0
2
4
6
8
0 0.2 0.4 0.6 0.8Pload, g m-2 yr
Sec
chi d
epth
(a)
(b)
(c)
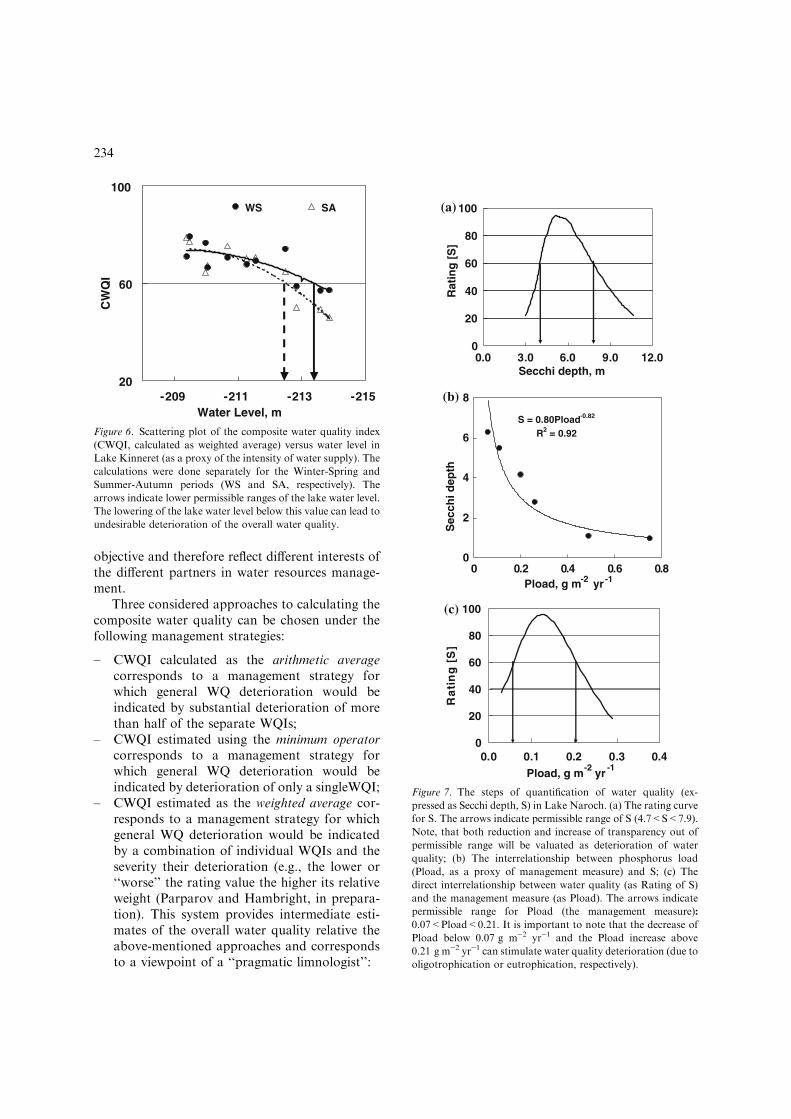
Figure 7. The steps of quantification of water quality (ex-
pressed as Secchi depth, S) in Lake Naroch. (a) The rating curve
for S. The arrows indicate permissible range of S (4.7<S<7.9).
Note, that both reduction and increase of transparency out of
permissible range will be valuated as deterioration of water
quality; (b) The interrelationship between phosphorus load
(Pload, as a proxy of management measure) and S; (c) The
direct interrelationship between water quality (as Rating of S)
and the management measure (as Pload). The arrows indicate
permissible range for Pload (the management measure):
0.07<Pload<0.21. It is important to note that the decrease of
Pload below 0.07 g m)2 yr)1 and the Pload increase above
0.21 g m)2 yr)1 can stimulate water quality deterioration (due to
oligotrophication or eutrophication, respectively).
234

Assessment of potential ecological riskof management measuresA new step in the quantification of water resourcesmanagement is to rank not only water quality butalso to quantify actual management measuresaccording to their potential ecological risk(Hakanson, 1999). The potential ecological risk(PER) of a management measure can be estimated(also by expert panel decision) as a product of thenumerically expressed dimensionless values of theoperational ecological effect variable (E) of amanagement measure, its areal distribution (A) (ifapplied to multiple lakes simultaneously) and timeduration (T):
PER ¼ E �A � T ð4Þ
If PER is calculated for a single entire lake,Awillbe a constant. Like the rating curves for variousWQparameters, E will be dependent on managementstrategy. For example, the disappearance of aparticular species may be qualified by limnologistsas an ‘‘ecological catastrophe’’ and therefore beassigned a very high value of E. However, drinkingwater suppliers may consider the extinction to be‘‘insignificant’’ and therefore assign a the manage-ment strategy a relatively low value of E.
Quantification of the relationships between WQand managementThe most well-known and widely-used example ofthe relationship between WQ (expressed as chlo-rophyll concentration) and management measure(as phosphorus loading) is the Vollenweider-Dil-lon-Rigler concept relating phosphorus loading tothe bioproductive parameters of a lake(Vollenweider, 1976; Dillon and Rigler, 1975).Such dependences are statistical and applicable toa given type of lakes, and therefore they haverelatively high uncertainties for individual lakes.
Existing databases in many cases are not suffi-cient for establishing such relationships, particu-larly in cases of non-linear and non-monotonousrelationships. A key direction in establishing thefunctional relationships between WQI and MM is theecological modeling, interconnected by informationalfeedbacks with the management and limnologicalinstitutions, and therefore forming a self-organizingtool for water resources management (Parparov &
Hambright, 1996). Search for the relationshipsWQI = F(MM) is one of the most exciting chal-lenges for modern limnology: both theoretical andapplied.
By combining equations (1) and (3) we estab-lish a direct relationship between the quantitativeestimates of water quality (as rating value, R) withthe intensity of the management measures (MM):
R=F(MM) ð5Þ
Such a relationship between managementmeasure and the composite water quality (Fig. 6)should be especially important for communicationwith the water policy makers and specialists inenvironmental economy.
The above-described system (equations 1, 3 and5) provides a direct correspondence between per-missible ranges for water quality indices and per-missible ranges for management measures:
fWQILOW WQI <WQIHIGHg, fMMLOW MM<MMHIGHg ð6Þ
The last expression provides the limits of manage-ment based on criteria of conservation of waterquality. Being supplemented with the requirementsof the socio-economical optimization, this expres-sion could be considered as an operational defini-tion of ‘‘sustainable management’’.
We illustrate the entire process of the WQquantification with two examples for Lake Kin-neret and Naroch Lake (Figs. 7 and 8). Note, thatthe obtained values of permissible ranges for themanagement measures are tentative because ofabsence of uncertainty analysis and/or possiblehysteresis of the processes. Nevertheless, theseexamples illustrate the sequence of the steps nec-essary for the quantification of water quality.Weemphasize again: the entire process of the waterquality quantification, as a part of a managementframework, must be strongly affected by therequirements of the management itself. Therefore,implementation of the expert panel method at eachstage of the quantification process is unavoidable.Unfortunately, both water resources managers andlimnologists often ignore this fact. The benefitsfrom improvement of the interaction between theseparate partners in the water resources manage-ment are obvious: establishment of a commonlanguage and quantifiable tools of management,transition from passive exploitation of water
235

resources to quantitatively valuated management,and stimulation of new directions in theoreticallimnology.
Acknowledgements
The authors are grateful to Prof. S. A. Ostroumov,Dr. J. K. Thompson, and Dr. R. Wotton forreviewing of the Manuscript.
References
Ben-Tuvia, A., E. B. Davidoff, J. Shapiro & D. Shefler, 1992.
Biology and management of Lake Kinneret Fisheries. The
Israeli Journal of Aquaculture - Bamidgeh 44: 48–65.
Berman, T., L. Stone, Y. Z. Yacobi, B. Kaplan, M. Schlichter,
A. Nishri & U. Pollingher, 1995. Primary production and
phytoplankton in Lake Kinneret: a long-term record (1972–
1993). Limnology and Oceanography 40: 1064–1076.
Berman, T., Y. Z. Yacobi & U. Pollingher, 1992. Lake Kinneret
phytoplankton: stability and variability during twenty years
(1970–1989). Aquatic Sciences 54: 104–127.
Boon, P. J., D. L. Howell, (eds), 1997. Freshwater quality:
defining the indefinable? Scottish Natural Heritage, Edin-
burgh.
Brown, P. M., N. I. McClelland, R. A. Deninger & R. G.
Tozer, 1970. A water quality index – do we dare? Water &
Sewage Word, October 1970: 339–343.
Carlson, R. E., 1977. A trophic state index for lakes. Limnol.
Oceanogr 22: 361–369.
Chapman, D., 1992. Water quality assessments . Chapman &
Hall, London.
Dillon, P. J. & F. H. Rigler, 1975. A simple method for pre-
dicting the capacity of a lake for development based on lake
trophic status. Journal of Fisheries Research Board Canada
32: 1511–1531.
Fozzard, I., R. Doughty, R. C. Ferrier, T. Leatherland &
R. Owen, 1999. A quality classification for management of
Scottish standing waters. Hydrobilogia 395/396: 443–453.
Hakanson, L., 1999. Water pollution - methods and criteria to
rank, model and remediate chemical threats to aquatic eco-
systems. Backhuys Publishers, Leiden 299 pp.
Hakanson, L. & R. H. Peters, 1995. Predictive limnology:
methods for predictive modeling . SPB Academic Publishing,
Amsterdam.
Hakanson, L., A. Parparov, A. Ostapenia, V. V. Boulion &
K. D. Hambright, 2000. Development of a system of water
quality as a tool for management. Final report to INTAS,
Uppsala university, Department of Earth Sciences 2000-11-07,
19 pp.
Hambright, K. D., M. Gophen & S. Serruya, 1994. Influence of
long-term climatic changes on the stratification of a sub-
tropical, warm monomictic lake. Limnology and Oceanog-
raphy 39: 1233–1242.
Hambright, K. D. H., A. Parparov & T. Berman, 2000. Indices
of water quality for sustainable management and conserva-
tion of an arid region lake, Lake Kinneret (Sea of Galilee),
Kinneret. Aquatic Conservation: Marine and Freshwater
Ecosystems 10: 393–406.
0
20
40
60
80
100
100 200 300 400
[C l] , mg L-1
Rat
ing
y = -10.1x - 1909.2
200
210
220
230
240
250
-213-212-211-210-209Water Level, m
Cl,
mg
L-1
20
60
100
-220-216-212- 208Water Level, m
Rat
ing
[ C
l]
(a)
(b)
(c)
Figure 8. The steps of quantification of water quality in Lake
Kinneret (expressed as chloride concentration, Cl). (a) The
rating curve for Cl. The arrows indicate permissible range for Cl
(182<Cl<244); (b) The interrelationship between water level
(as a proxy of intensity of water supply), and Cl; (c) The direct
interrelationship between water quality (as Cl) and the man-
agement measure (as water level). The arrow indicates the lower
permissible range for water level (i.e., lowering of the lake water
level below )213.0 m will stimulate deterioration of water
quality).
236
Horton, R. K., 1965. An index-number system for rating water
quality. Journal of the water Pollution Control Federation.
37(3): 300–306.
Kalceva, R., J. V. Outrata, Z. Schindler & M. Straskraba, 1982.
An optimization model for the economic control of reservoir
eutrophication. Ecological Modelling 17: 121–128.
Nagels, J. W., R. J. Davies-Colley & D. G. Smith, 2001. A
water quality index for contact recreation in New Zealand.
Water Science and Technology 43(5): 285–292.
Ostapenya, A., 1999. Naroch Lakes: problems and forecasts.
Lake ecosystems: biological processes, anthropogenic
transformation, water quality. Proceedings of International
Conference, 25 – 26 September, Minsk – Naroch: 282–292.
Ott, W., 1978. Water quality indices: a survey of indices used in
the United States. Environmental Monitoring Series. EPA-
600/4-78-005, 128 pp.
Parparov, A. & K. D. Hambright, 1996. A proposed framework
for the management of water quality in arid-region lakes. In-
ternationaleRevuederGesamtenHydrobiologie 81: 435–454.
Pollingher, U., 1978. The phytoplankton of Lake Kinneret. In
Serruya, C. (ed.), Lake Kinneret, Dr Junk Publishers, The
Hague: 229–242.
Pollingher, U., O. Hadas, Y. Z. Yacobi, T. Zohary & T. Ber-
man, 1998. Aphanizomenon ovalisporum (Forti) in Lake
Kinneret. Israel, Journal of Plankton Research 20: 1321–
1339.
Ryding, S.-O. & W. Rast, 1989. The control of eutrophication
of lakes and reservoirs. UNESCO, 314 p.
Serruya, C., (ed.), 1978. Lake Kinneret. Dr. Junk Publishers,
The Hague, p. 502.
Shamir,U., J. Bear, N. Arad, Y. Gal-Noor, N. Selbst &
Y. Vardi, 1985. National water policy: a methodology and
its application to Israel, IAHS Publ. No. 153: 369–379.
Smith, D. G., 1987. Water quality indexes for use in New
Zealand’s rivers and streams, Department of Scientific and
Industrial Research, Water Quality Centre.
Smith, D. G., 1990. A better water quality indexing system for
rivers and streams. Water Research 24: 1237–1244.
Straskraba, M. & A. H. Gnauck, 1985. Freshwater Ecosystems.
Modelling and Simulation. Development in Environmental
Modelling, 8. Elsevier, 373 pp.
U. S. Environmental Protection Agency, 1974. An approach to
a realative trophic index system for classifying lakes and
reservoirs. National Eutrophication Survey. Working Paper
No. 24.
Vollenweider, R. A., 1976. Advances in defining critical loading
levels for phosphorus in lake eutrophication. Memorie dell’
Istituto Italiano di Idrobiologia 33: 53–83.
WFD, 2000. Official text of the EUWater Framework Directive
Published on 22 December 2000 in the Official Journal of the
European Communities.
Winberg, G. G. (ed.), 1985. The Ecological System of the
Naroch Lakes. Minsk (in rus.), 289 pp.
237