Structural Performance of Shear Loaded Precast EPS-Foam ...
17
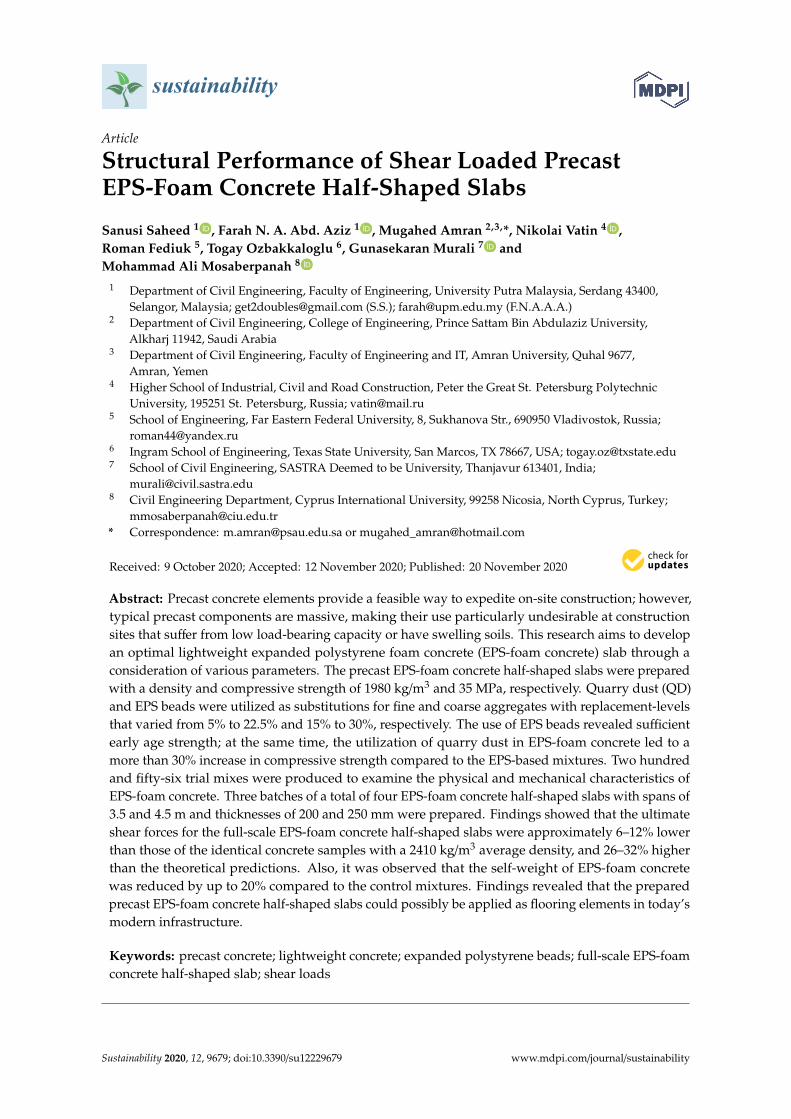
sustainability Article Structural Performance of Shear Loaded Precast EPS-Foam Concrete Half-Shaped Slabs Sanusi Saheed 1 , Farah N. A. Abd. Aziz 1 , Mugahed Amran 2,3, *, Nikolai Vatin 4 , Roman Fediuk 5 , Togay Ozbakkaloglu 6 , Gunasekaran Murali 7 and Mohammad Ali Mosaberpanah 8 1 Department of Civil Engineering, Faculty of Engineering, University Putra Malaysia, Serdang 43400, Selangor, Malaysia; [email protected] (S.S.); [email protected] (F.N.A.A.A.) 2 Department of Civil Engineering, College of Engineering, Prince Sattam Bin Abdulaziz University, Alkharj 11942, Saudi Arabia 3 Department of Civil Engineering, Faculty of Engineering and IT, Amran University, Quhal 9677, Amran, Yemen 4 Higher School of Industrial, Civil and Road Construction, Peter the Great St. Petersburg Polytechnic University, 195251 St. Petersburg, Russia; [email protected] 5 School of Engineering, Far Eastern Federal University, 8, Sukhanova Str., 690950 Vladivostok, Russia; [email protected] 6 Ingram School of Engineering, Texas State University, San Marcos, TX 78667, USA; [email protected] 7 School of Civil Engineering, SASTRA Deemed to be University, Thanjavur 613401, India; [email protected] 8 Civil Engineering Department, Cyprus International University, 99258 Nicosia, North Cyprus, Turkey; [email protected] * Correspondence: [email protected] or [email protected] Received: 9 October 2020; Accepted: 12 November 2020; Published: 20 November 2020 Abstract: Precast concrete elements provide a feasible way to expedite on-site construction; however, typical precast components are massive, making their use particularly undesirable at construction sites that suffer from low load-bearing capacity or have swelling soils. This research aims to develop an optimal lightweight expanded polystyrene foam concrete (EPS-foam concrete) slab through a consideration of various parameters. The precast EPS-foam concrete half-shaped slabs were prepared with a density and compressive strength of 1980 kg/m 3 and 35 MPa, respectively. Quarry dust (QD) and EPS beads were utilized as substitutions for fine and coarse aggregates with replacement-levels that varied from 5% to 22.5% and 15% to 30%, respectively. The use of EPS beads revealed sufficient early age strength; at the same time, the utilization of quarry dust in EPS-foam concrete led to a more than 30% increase in compressive strength compared to the EPS-based mixtures. Two hundred and fifty-six trial mixes were produced to examine the physical and mechanical characteristics of EPS-foam concrete. Three batches of a total of four EPS-foam concrete half-shaped slabs with spans of 3.5 and 4.5 m and thicknesses of 200 and 250 mm were prepared. Findings showed that the ultimate shear forces for the full-scale EPS-foam concrete half-shaped slabs were approximately 6–12% lower than those of the identical concrete samples with a 2410 kg/m 3 average density, and 26–32% higher than the theoretical predictions. Also, it was observed that the self-weight of EPS-foam concrete was reduced by up to 20% compared to the control mixtures. Findings revealed that the prepared precast EPS-foam concrete half-shaped slabs could possibly be applied as flooring elements in today’s modern infrastructure. Keywords: precast concrete; lightweight concrete; expanded polystyrene beads; full-scale EPS-foam concrete half-shaped slab; shear loads Sustainability 2020, 12, 9679; doi:10.3390/su12229679 www.mdpi.com/journal/sustainability
-
Upload
khangminh22 -
Category
Documents
-
view
0 -
download
0
Transcript of Structural Performance of Shear Loaded Precast EPS-Foam ...
sustainability
Article
Structural Performance of Shear Loaded PrecastEPS-Foam Concrete Half-Shaped Slabs
Sanusi Saheed 1 , Farah N. A. Abd. Aziz 1 , Mugahed Amran 2,3,*, Nikolai Vatin 4 ,Roman Fediuk 5, Togay Ozbakkaloglu 6, Gunasekaran Murali 7 andMohammad Ali Mosaberpanah 8
1 Department of Civil Engineering, Faculty of Engineering, University Putra Malaysia, Serdang 43400,Selangor, Malaysia; [email protected] (S.S.); [email protected] (F.N.A.A.A.)
2 Department of Civil Engineering, College of Engineering, Prince Sattam Bin Abdulaziz University,Alkharj 11942, Saudi Arabia
3 Department of Civil Engineering, Faculty of Engineering and IT, Amran University, Quhal 9677,Amran, Yemen
4 Higher School of Industrial, Civil and Road Construction, Peter the Great St. Petersburg PolytechnicUniversity, 195251 St. Petersburg, Russia; [email protected]
5 School of Engineering, Far Eastern Federal University, 8, Sukhanova Str., 690950 Vladivostok, Russia;[email protected]
6 Ingram School of Engineering, Texas State University, San Marcos, TX 78667, USA; [email protected] School of Civil Engineering, SASTRA Deemed to be University, Thanjavur 613401, India;
[email protected] Civil Engineering Department, Cyprus International University, 99258 Nicosia, North Cyprus, Turkey;
[email protected]* Correspondence: [email protected] or [email protected]
Received: 9 October 2020; Accepted: 12 November 2020; Published: 20 November 2020�����������������
Abstract: Precast concrete elements provide a feasible way to expedite on-site construction; however,typical precast components are massive, making their use particularly undesirable at constructionsites that suffer from low load-bearing capacity or have swelling soils. This research aims to developan optimal lightweight expanded polystyrene foam concrete (EPS-foam concrete) slab through aconsideration of various parameters. The precast EPS-foam concrete half-shaped slabs were preparedwith a density and compressive strength of 1980 kg/m3 and 35 MPa, respectively. Quarry dust (QD)and EPS beads were utilized as substitutions for fine and coarse aggregates with replacement-levelsthat varied from 5% to 22.5% and 15% to 30%, respectively. The use of EPS beads revealed sufficientearly age strength; at the same time, the utilization of quarry dust in EPS-foam concrete led to amore than 30% increase in compressive strength compared to the EPS-based mixtures. Two hundredand fifty-six trial mixes were produced to examine the physical and mechanical characteristics ofEPS-foam concrete. Three batches of a total of four EPS-foam concrete half-shaped slabs with spans of3.5 and 4.5 m and thicknesses of 200 and 250 mm were prepared. Findings showed that the ultimateshear forces for the full-scale EPS-foam concrete half-shaped slabs were approximately 6–12% lowerthan those of the identical concrete samples with a 2410 kg/m3 average density, and 26–32% higherthan the theoretical predictions. Also, it was observed that the self-weight of EPS-foam concretewas reduced by up to 20% compared to the control mixtures. Findings revealed that the preparedprecast EPS-foam concrete half-shaped slabs could possibly be applied as flooring elements in today’smodern infrastructure.
Keywords: precast concrete; lightweight concrete; expanded polystyrene beads; full-scale EPS-foamconcrete half-shaped slab; shear loads
Sustainability 2020, 12, 9679; doi:10.3390/su12229679 www.mdpi.com/journal/sustainability

Sustainability 2020, 12, 9679 2 of 17
1. Introduction
Prefabricated precast concrete slabs present numerous positive characteristics such as qualitycontrol, accurate design, the need for less-skilled labor, and fast installation and assembly,which ultimately leads to lower construction costs and a reduction in the volume of wastage atconstruction sites [1–3]. Several types of half-slab components such as hollow-core slabs (HoCSs),flat precast slabs (FPSs), double-tee slabs (DTSs), and multi-rib slabs (MrSs) have been industrialized,and associated investigations on their performances have been dynamically implemented. FPSs havea simple fabrication method and an easy reinforcement layout due to their thin flange design.Furthermore, they require no permanent work (e.g., installation shores) to withstand constructionloads at the point of forming their topping concrete layer [4,5]. Meanwhile, HoCSs contribute tolower self-weight due to the hollows in their design geometry, and can considerably enlarge the depthof the section at specific locations where the applied load is exceptionally high [3,6–8]. However,factory-made HoCSs using an extruder machine can be quite susceptible to shear stresses at theend-boundaries of their webs; as a result, it is difficult to position shear bars on the webs [3,9,10].In the meantime, MrSs and DTSs have different cross-sectional outlines that are quite effective atresisting positive moments as a consequence of the elimination of needless concrete segments on thebottom zone (tension side). This usually results in a thin top flange, which leads to continuationproblems at the end edges of the member [11–13]. In any case, the design of half-precast concrete slabsis commonly improved by ensuring that the bottom and top flanges are varied at the ends and centerof the component so that they can withstand negative and positive moments efficiently [1,11].
Moreover, the general application of precast concrete is made with either lightweight or normalconcrete. Lightweight aggregates are used to form lightweight concrete (LC), which is secured fromeither natural or artificial sources, namely, erupting volcanoes [14] or oil palm shells (OPSs) [15,16].Aggregates obtained from erupting volcanoes are very costly and not easy to acquire in localmarkets, while OPSs have high water absorption. On the other hand, artificial lightweight aggregates(e.g., expanded polystyrene (EPS) and fly ash [17–19]) can provide a feasible alternative solution.Several studies have investigated LC made with natural aggregates (vermiculite [20], scoria [14],pumice [18,21]), manufactured aggregates (e.g., expanded clay [22,23], expanded silt [17]) and industrialwaste aggregates [24–27]. Additionally, quarry dust (QD), a waste of crushed rock, can be utilized asa partial substitution for river sand, and makes environmentally sustainable LC, which contributesto the enhancement of the compressive strength of concrete at an earlier age [28]. Utilization of QDas a substitution material for fine aggregates by up to 20% can result in enhancement in the ultimateload capacity of lightweight expanded polystyrene (EPS) foam-based concrete from 17 to 35 MPa,and this can be utilized for the production of structural concrete elements [29]. Despite this, precastconcrete elements are usually produced using normal concrete, which results in components with aheavy weight [30]. Henceforth, the self-weight of the system becomes very important. The self-weightof slabs is responsible for 40–60% of the total deadweight of a residential house [30–33]. As such, a 10%reduction in floor slabs can result in a 5% reduction in the deadweight of the whole building [30,34,35].
Precast flooring systems without concrete toppings are popular nowadays, but they usually sufferfrom water leakage at the joints [16]. Furthermore, half-shaped slabs are typically chosen, as nopropping is required [16]. Over the past several years, designers have been searching for eco-friendlyand economical concrete products, such as foamed concrete (FC) [30,35]. Structural FC is mainlyapplied to lower the self-weight of buildings and deliver the most efficient structural components [36].Light structural elements facilitate easy construction and reduce on-site work, thereby lowering theoverall cost of construction [31]. Among the techniques used to lower the self-weight of precast concretepanels is the utilization of lightweight materials like EPS beads as a part of the mix design proportions.EPS beads are cheaper than other artificial aggregates and are made from a styrene monomer that isdeveloped in oriental sweet gum plants and natural gas. EPS beads are mainly used for packagingmaterials and are disposed of after unpacking, which leads to a large amount of non-biodegradable

Sustainability 2020, 12, 9679 3 of 17
waste. However, by employing heat treatment methods, this material can be modified to function as alightweight aggregate.
As a significant waste material in terms of ecological pollution, EPS makes up a substantial volumeof solid waste in garbage dumps in several countries. Since it is none-degradable, leading considerablyto the pollution of the environment, producers have become directly responsible for the collection,recycling and re-economizing this material. EPS is light in weight, has a superior thermal insulationcharacteristic, and has a lower cost, as a reduction in density contributes to reducing the consumptionof energy during production, transport, and construction processes in comparison with traditionalbuilding materials. It is therefore endorsed within the field of sustainability. The use of sustainabledevelopments in low-cost residential buildings has caused the construction industry to implementsuitable measurements to benefit the environment, such as decreasing building energy consumptionand CO2 emissions. In addition to economic and technical issues, the selection of building materials isalso in the basis of the environmental aspects behind the application and use of this material. In thissense, the development of substitutive, sustainable, and ecofriendly building materials such as EPS isimperative, as it can lead to reduced risks to human well-being, contributions to economies, solutions toenvironmental issues, and improvements to construction industry applications towards sustainabilityby increasing the design and structural integrity of building materials. Therefore, this study contributesto the development of an optimal EPS-foam concrete that could be used to produce full-scale EPS-foamconcrete half-shaped slabs, ultimately leading to self-weight reductions in the total self-weights ofconcrete structural systems of more than 20%. This study also aims to determine the ultimate shearforce of the EPS-foam concrete half-shaped slabs, and compare them with identical control concretesamples made of ordinary concrete.
2. Experimental Program; A Brief Description
Ordinary Portland cement (OPC) (Type 2) was used in this study, as originally presented in thefirst part of this research (Saheed et al. [37]). The fine and coarse aggregates used were river sandand crushed granite gravel, respectively, and are detailed in the first part of this study. To produce aworkable concrete, a 1% cement volume of naphthalene-based super-plasticizer was used [37]. In thisstudy, 16 different samples were prepared, which were then divided into four series. In the first series,the four samples were prepared with 0%, 15%, 22.5%, and 30% EPS contents without quarry dust(QD). The remaining three series samples were prepared with the same amount of EPS, while 7.5%,15%, and 22.5% QD were used as partial replacements for sand for the second, third, and fourth series,respectively. The mixed composition of the 16 samples and casting procedures are provided in theearlier study [37]. Overall, 16 concrete batches were accordingly prepared to fabricate 48 cylindricalspecimens with a 100- × 200-mm size and 144 cube specimens with a 100-mm size. Both cylindricaland cubical specimens were de-molded after 24 hours and placed in a curing container with a 27 ± 5 ◦Ctemperature for 15, 28, and 90 days [37].
A slump test was performed on wet concrete in accordance with BS 1881 [38] to ensure an adequateworkability for structural applications. The compressive test was performed on 100-mm cube samplesat 7, 28, and 90 days, in accordance with BS 1881 [39], using a universal testing machine with a 5000-kNcapacity with a 2.5-kN/s loading rate. The splitting tensile test was performed on cylindrical sampleswith 100-mm diameters and 200-mm heights in accordance with BS 1881 [39]. An ultrasonic pulsevelocity (UPV) test was performed in accordance with ASTM C 597 [40] on the cube samples at 28 daysbefore the destructive test. As mentioned above, a detailed explanation of the testing is discussed inthe earlier study [37].
3. Half-shaped Slab Configuration, Preparing, Casting Process and Production
The prepared slabs had spans of either 3500 or 4500 mm, and 1000-mm widths with either a 250- and200-mm entire thickness for the 4500- and 3500-mm span slabs, respectively (see Figure 8 [37]). The spandimensions were chosen following the PCI design code (PCI manual, 2003) [41,42]. In addition, steel bars

Sustainability 2020, 12, 9679 4 of 17
with 12- and 10-mm diameters and 20-mm concrete covers were used as the ribs, while 200 × 200 meshbars with 6-mm diameters were employed as the topping bars. The details of reinforcement, span,concrete type, notations and thickness are all tabulated in the earlier study [37]. The notations aregiven by the concrete type followed by the thickness of the slab. For instance, CC250 stands for anordinary slab with a 250-mm thickness.
3.1. Preparing, and Casting Process and Production
Formwork plywood was employed to form the half-shaped slab specimens (see Figure 9 [37]).It was initially brushed with oil to prevent water absorption during casting. After that, a plastic layerwas placed to ensure the reusability of the formworks, and to inhibit water loss while casting theconcrete. Prior to placing the steel bars in the formwork, strain gauges 5 mm in size were fixed on the10- and 12-mm diameter reinforcement bars. Similarly, strain gauges of 2 mm in length were mountedon the 6-mm reinforcement bars to enable the observation of strains as the half-shaped slabs wereloaded. To fix the strain gauges, the reinforcement bars’ outer surfaces were refined and later wipedwith alcohol to ensure they were smooth. After that, the strain gauges were glued using epoxy resin,and silicon glue was utilized to provide protection during the casting process.
3.2. Arrangement, Instrumenting and Setup of Shear Test
In total, four electrical strain gauges (ESGs) with 67-mm lengths were utilized in this test.These strain gauges were labeled SG1 to SG4 (see Figure 1). One ESG was utilized to record the strainat the top of the slab, while the remaining three ESGs formed a rosette shape to measure shear strainsalong the slabs’ depths, (as illustrated in Figure 8 [37]). Furthermore, strain gauges on the concreteinterfaces and steel bars were also used to monitor the strain curves at those locations. Furthermore,the LVDT located at a distance of 2 time of beam depth from left support was utilized to monitor thedeflection at a critical zone during shear testing. Also, three ESGs of 67-mm concrete were fixed justbelow the point load in the shear test setup. To record the readings during testing, the instruments andtheir individual cables were connected to a data logger throughout the test.
Sustainability 2020, 10, x FOR PEER REVIEW 4 of 19
The notations are given by the concrete type followed by the thickness of the slab. For instance, CC250 stands for an ordinary slab with a 250-mm thickness.
3.1. Preparing, and Casting Process and Production
Formwork plywood was employed to form the half-shaped slab specimens (see Figure 9 [37]). It was initially brushed with oil to prevent water absorption during casting. After that, a plastic layer was placed to ensure the reusability of the formworks, and to inhibit water loss while casting the concrete. Prior to placing the steel bars in the formwork, strain gauges 5 mm in size were fixed on the 10- and 12-mm diameter reinforcement bars. Similarly, strain gauges of 2 mm in length were mounted on the 6-mm reinforcement bars to enable the observation of strains as the half-shaped slabs were loaded. To fix the strain gauges, the reinforcement bars’ outer surfaces were refined and later wiped with alcohol to ensure they were smooth. After that, the strain gauges were glued using epoxy resin, and silicon glue was utilized to provide protection during the casting process.
3.2. Arrangement, Instrumenting and Setup of Shear Test
In total, four electrical strain gauges (ESGs) with 67-mm lengths were utilized in this test. These strain gauges were labeled SG1 to SG4 (see Figure 1). One ESG was utilized to record the strain at the top of the slab, while the remaining three ESGs formed a rosette shape to measure shear strains along the slabs’ depths, (as illustrated in Figure 8 [37]). Furthermore, strain gauges on the concrete interfaces and steel bars were also used to monitor the strain curves at those locations. Furthermore, the LVDT located at a distance of 2 time of beam depth from left support was utilized to monitor the deflection at a critical zone during shear testing. Also, three ESGs of 67-mm concrete were fixed just below the point load in the shear test setup. To record the readings during testing, the instruments and their individual cables were connected to a data logger throughout the test.
Figure 1. Location of strain gauges.
After 28 days of curing, the prepared slabs were positioned on the testing frame and their sides were glazed white to allow for easy monitoring of the cracks during testing. The precast EPS-foam concrete half-shaped slabs were installed with a simple support 100 mm from their free-end edges and loaded at 2 times the beam depth from the support, as shown in Figure 2a, b, where d is the thickness of the slab. To apply the load, a spreader beam was used, as shown in Figure 2b, and the beam was linked to a load cell with a 1500-kN capacity. A hydraulic jack was employed to impose the applied load on the slabs at a rate of 0.1 kN/s. Prior to testing, a trial loading was performed two times to ascertain an intact slab setup and stable readings from the instruments. Consequently, the specimens were loaded at 2-kN increments, and at each increment the load was kept constant for 15–35 seconds before the LVDT and EGS readings were recorded. At the same time, the cracks that appeared were marked and their sizes were determined by means of a handheld microscope with X40 amplification and a lowest count of 0.02 mm. The specimens were then loaded up until failure.
Figure 1. Location of strain gauges.
After 28 days of curing, the prepared slabs were positioned on the testing frame and their sideswere glazed white to allow for easy monitoring of the cracks during testing. The precast EPS-foamconcrete half-shaped slabs were installed with a simple support 100 mm from their free-end edges andloaded at 2 times the beam depth from the support, as shown in Figure 2a,b, where d is the thicknessof the slab. To apply the load, a spreader beam was used, as shown in Figure 2b, and the beam waslinked to a load cell with a 1500-kN capacity. A hydraulic jack was employed to impose the appliedload on the slabs at a rate of 0.1 kN/s. Prior to testing, a trial loading was performed two times toascertain an intact slab setup and stable readings from the instruments. Consequently, the specimenswere loaded at 2-kN increments, and at each increment the load was kept constant for 15–35 s beforethe LVDT and EGS readings were recorded. At the same time, the cracks that appeared were marked

Sustainability 2020, 12, 9679 5 of 17
and their sizes were determined by means of a handheld microscope with X40 amplification and alowest count of 0.02 mm. The specimens were then loaded up until failure.
Sustainability 2020, 10, x FOR PEER REVIEW 5 of 19
sizes were determined by means of a handheld microscope with X40 amplification and a lowest count
of 0.02 mm. The specimens were then loaded up until failure.
Figure 2. Typical setup of shear test.
4. Results and Discussions
4.1. Properties of EPS-foam Concrete
As presented in the first part of this research (Saheed et al. [37]), replacing large aggregates with
expanded polystyrene beads (30%) reduced the workability of concrete due to its hydrophobic
properties and an increase in the surface of the expanded polystyrene beads [37]. Additionally, 15%
and 30% substitutions of aggregate reduced the specific gravity of EPS-foam concrete by 5.8% and
18%, respectively, compared with that of the ordinary cement concrete [37]. A higher compressive
strength was observed at seven days in the case of EPS-foam concrete compared to traditional
concrete. This may have been be because of the thermal resistance of EPS-foam concrete maintaining
Commented [M1]:
Figure 2. Typical setup of shear test (a) schematic of testing device and (b) experimental test setup.
4. Results and Discussions
4.1. Properties of EPS-foam Concrete
As presented in the first part of this research (Saheed et al. [37]), replacing large aggregateswith expanded polystyrene beads (30%) reduced the workability of concrete due to its hydrophobicproperties and an increase in the surface of the expanded polystyrene beads [37]. Additionally, 15%and 30% substitutions of aggregate reduced the specific gravity of EPS-foam concrete by 5.8% and18%, respectively, compared with that of the ordinary cement concrete [37]. A higher compressivestrength was observed at seven days in the case of EPS-foam concrete compared to traditional concrete.This may have been be because of the thermal resistance of EPS-foam concrete maintaining the heatof hydration and subsequently upsurging the activity of the clinker minerals [37]. There was notmuch strength gain in EPS-foam concrete compared to traditional concrete, which experienced a greatimprovement in compressive strength as a result of the use of QD as a partial substitute for fineaggregates. Replacing sand with QD by 7.5% and 22.5% increased the strength of the reference concreteby almost 13% and 16%, respectively, at an age of 28 days. This may be attributable to the behaviorof small particles of QD that fill the pores. When substituting with 22.5% QD, the strength droppedby about 10% compared to the 15% substitution, at which EPS-foam concrete reached its maximumcompressive strength [37]. The same trend was observed for 90-day-old samples. The maximumcompressive strength was observed in the mixtures of EPS-foam concrete with 30% EPS and 15% QD,resulting in a 35.7-MPa compressive strength at a dry density of 1980 kg/m3. The splitting tensile

Sustainability 2020, 12, 9679 6 of 17
strength of EPS-foam concrete experienced a reduction as the EPS bead replacement increased. Tensilestrength increased with a 15% QD substitution, then decreased when the substitution was increasedto 22.5% [37]. The compressive strength obtained from the UPV exhibited a decreasing trend withincreases in the EPS content. Different sample series showed different treatments as the compressivestress ranges varied from 55 to 35.1 MPa, 53.7 to 33.9 MPa, 58.6 to 35.1 MPa, and 53.2 to 34.5 MPa forthe series-1, -2, -3, and -4 samples. Consequently, the maximum compressive strength was observed inthe sample containing 0% EPS and 15% QD.
4.2. Precast EPS-foam Concrete Half-Shaped Slabs
The shear test results were reported in terms of load-deflection behavior, strain on concretesurfaces, and crack patterns for two types of concrete (i.e., control concrete and EPS-foam concrete).For each concrete type, two slabs with thicknesses of 200 and 250 mm were prepared. Each half-shapedslab was tested twice, once on each end, giving two repetitive results. A total of four half-shaped slabswere tested, having two different spans (3.5 and 4.5 m) for each of the 200- and 250-mm thicknesses,respectively. The half-shaped slab specimens were notated as CC200A, CC200B, EPS200A, EPS200B,CC250A, CC250B, EPS250A, and EPS250B.
4.2.1. Load-Deflection Profiles
Figure 3 illustrates the load-deflection relationship for the slabs with a 200-mm thickness.The load-deflection profiles for the tested samples followed the uncracked response up to the crackingload, after which the load-deflection profile followed the cracked response due to a reduction instiffness caused by cracking, as seen in Figure 3. Eventually, as yielding of the reinforcements took placedue to an increase in load, the load-deflection profiles reached a plateau, indicating a rapid increase indeflection with little or no increase in applied load, followed by a drop after failure. The uncrackedload-deflection responses for the CC and EPS specimens were almost identical; interestingly, however,the cracked response for the EPS specimen was different from that of the CC sample, where theEPS-foam concrete specimen had less stiffness compared to the latter. It was also observed that thedeformation behavior of the EPS slabs had a slightly lower range than the ones for CC slabs due tothe CC slabs being more ductile than the EPS slabs. In particular, the pattern of the load deflectionprofile after the first cracks appeared resembled the research findings reported by Ibrahim et al. [43].In addition, the observed failure loads differed slightly, as the destruction load of sample CC200A was6% higher than that of sample EPS200A.
The maximum deflections of all specimens were within the range of 22.2 to 28 mm after the firstcrack formed. Furthermore, CC200 failed in shear-compression only, while EPS200 failed throughde-bonding and shear-compression, as given in Table 1. The theoretical and experimental shearcapacities of CC200 and EPS200 were compared together (in compliance with BS8110 (1985)), and aresummarized in Table 1. It is apparent that the experimental capacity for the slabs was greater thanthe corresponding theoretical calculations according to BS 8110. Moreover, the capacity ratio forEPS200 was 7–14% lower than that of CC200, indicating that the ordinary concrete slabs achieved agreater shear capacity. Finally, it can be seen from the Figure 3 that the toughness (the area under theload-deformation curve) of EPS200 was less than CC200, indicating a lower load bearing capacity.

Sustainability 2020, 12, 9679 7 of 17Sustainability 2020, 10, x FOR PEER REVIEW 7 of 19
Figure 3. Load-midspan deflection relationship for test specimens with a 200-mm thickness. CC200A = control concrete specimens; EPS200A = expanded polystyrene (EPS)-foam concrete specimens.
The maximum deflections of all specimens were within the range of 22.2 to 28 mm after the first crack formed. Furthermore, CC200 failed in shear-compression only, while EPS200 failed through de-bonding and shear-compression, as given in Table 1. The theoretical and experimental shear capacities of CC200 and EPS200 were compared together (in compliance with BS8110 (1985)), and are summarized in Table 1. It is apparent that the experimental capacity for the slabs was greater than the corresponding theoretical calculations according to BS 8110. Moreover, the capacity ratio for EPS200 was 7–14% lower than that of CC200, indicating that the ordinary concrete slabs achieved a greater shear capacity. Finally, it can be seen from the Figure 3 that the toughness (the area under the load-deformation curve) of EPS200 was less than CC200, indicating a lower load bearing capacity.
Table 1. Experimental shear force and mode of failure.
Specimen Fu, kN Mode of Failure CC200B 71.9
Shear-compression CC200A 65.8 CC250B 81.1 CC250A 93.7 EPS250A 82.2 Shear-compression EPS200A 61.8 Shear-compression and de-bonding
The load-deflection relationships for the 250-mm slabs are shown in Figure 4. Again, a similar behavior to the 200-mm slabs was observed, where the deflection increased gradually along the uncracked response until the first crack formed at approximately 47 kN for specimen CC250 and 26.7 kN for specimen EPS250. This represented a first-crack strength reduction of 55% for EPS250 when compared with CC250. Subsequently, the load-deflection profiles followed the cracked response until reinforcement yielding could take place, which was followed by failure of the specimens and immediate unloading. From the deflection profiles, it is clear that the CC250 specimen was a bit stiffer than its EPS counterpart, and that the pattern of the load-deflection curves was similar to that of Sarbini et al. [44]. The maximum deflections of all specimens were within the range of 14.8 to 20.6 mm, which was less than 18 L/d. In addition, both CC250 and EPS250 failed in shear-compression (Table 2), and the ultimate shear-load of CC250A was 12% greater than that of specimen EPS250A. The theoretical and experimental shear capacities of the CC250 and EPS250 samples are listed in Table
0
10
20
30
40
50
60
70
80
0 5 10 15 20 25 30
Load
kN
Deflection mm
CC200ACC200BEPS200A
Figure 3. Load-midspandeflectionrelationshipfor test specimenswitha200-mmthickness. CC200A=controlconcrete specimens; EPS200A = expanded polystyrene (EPS)-foam concrete specimens.
Table 1. Experimental shear force and mode of failure.
Specimen Fu, kN Mode of Failure
CC200B 71.9
Shear-compressionCC200A 65.8CC250B 81.1CC250A 93.7EPS250A 82.2 Shear-compressionEPS200A 61.8 Shear-compression and de-bonding
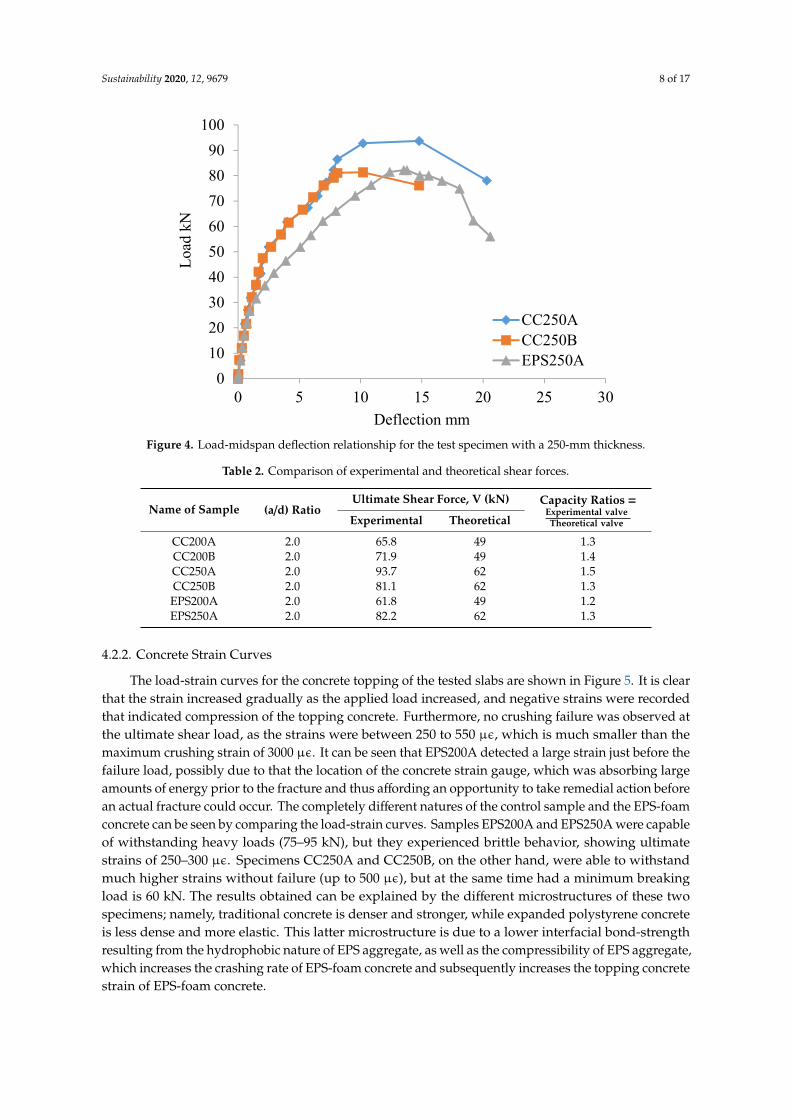
The load-deflection relationships for the 250-mm slabs are shown in Figure 4. Again, a similarbehavior to the 200-mm slabs was observed, where the deflection increased gradually along theuncracked response until the first crack formed at approximately 47 kN for specimen CC250 and26.7 kN for specimen EPS250. This represented a first-crack strength reduction of 55% for EPS250when compared with CC250. Subsequently, the load-deflection profiles followed the cracked responseuntil reinforcement yielding could take place, which was followed by failure of the specimens andimmediate unloading. From the deflection profiles, it is clear that the CC250 specimen was a bitstiffer than its EPS counterpart, and that the pattern of the load-deflection curves was similar to thatof Sarbini et al. [44]. The maximum deflections of all specimens were within the range of 14.8 to20.6 mm, which was less than 18 L/d. In addition, both CC250 and EPS250 failed in shear-compression(Table 2), and the ultimate shear-load of CC250A was 12% greater than that of specimen EPS250A.The theoretical and experimental shear capacities of the CC250 and EPS250 samples are listed in Table 2.The experimental shear capacity for specimen CC250 was 51% higher than the theoretical capacity,while the experimental shear strength of specimen EPS250 was 32.6% higher than the calculatedtheoretical shear capacity. In addition, the experimental shear strength of specimen EPS250-A was 12%lower than the experimental shear capacity of specimen CC250A, but 25% higher when compared tothe theoretical shear load. Therefore, the shear capacity of EPS precast slabs was adequate when relatedto the theoretical shear capacity of normal concrete. This shows that the theoretical shear calculation ofnormal concrete is practical for EPS-foam concrete. It can also be observed the load bearing of EPSwas less than CC250A, as the under curve area of load-deformation of EPS250 was clearly smallerthan CC250A.
Sustainability 2020, 12, 9679 8 of 17
Sustainability 2020, 10, x FOR PEER REVIEW 8 of 19
2. The experimental shear capacity for specimen CC250 was 51% higher than the theoretical capacity, while the experimental shear strength of specimen EPS250 was 32.6% higher than the calculated theoretical shear capacity. In addition, the experimental shear strength of specimen EPS250-A was 12% lower than the experimental shear capacity of specimen CC250A, but 25% higher when compared to the theoretical shear load. Therefore, the shear capacity of EPS precast slabs was adequate when related to the theoretical shear capacity of normal concrete. This shows that the theoretical shear calculation of normal concrete is practical for EPS-foam concrete. It can also be observed the load bearing of EPS was less than CC250A, as the under curve area of load-deformation of EPS250 was clearly smaller than CC250A.
Figure 4. Load-midspan deflection relationship for the test specimen with a 250-mm thickness.
Table 2 Comparison of experimental and theoretical shear forces.
Name of Sample
(a/d) Ratio
Ultimate Shear Force, V (kN)
Capacity Ratios = 𝐄𝐱𝐩𝐞𝐫𝐢𝐦𝐞𝐧𝐭𝐚𝐥 𝐯𝐚𝐥𝐯𝐞 𝐓𝐡𝐞𝐨𝐫𝐞𝐭𝐢𝐜𝐚𝐥 𝐯𝐚𝐥𝐯𝐞 Experimental Theoretical
CC200A 2.0 65.8 49 1.3 CC200B 2.0 71.9 49 1.4 CC250A 2.0 93.7 62 1.5 CC250B 2.0 81.1 62 1.3 EPS200A 2.0 61.8 49 1.2 EPS250A 2.0 82.2 62 1.3
4.2.2. Concrete Strain Curves
The load-strain curves for the concrete topping of the tested slabs are shown in Figure 5. It is clear that the strain increased gradually as the applied load increased, and negative strains were recorded that indicated compression of the topping concrete. Furthermore, no crushing failure was observed at the ultimate shear load, as the strains were between 250 to 550 µϵ, which is much smaller than the maximum crushing strain of 3000 µϵ. It can be seen that EPS200A detected a large strain just before the failure load, possibly due to that the location of the concrete strain gauge, which was absorbing large amounts of energy prior to the fracture and thus affording an opportunity to take remedial action before an actual fracture could occur. The completely different natures of the control
0102030405060708090
100
0 5 10 15 20 25 30
Load
kN
Deflection mm
CC250ACC250BEPS250A
Figure 4. Load-midspan deflection relationship for the test specimen with a 250-mm thickness.
Table 2. Comparison of experimental and theoretical shear forces.
Name of Sample (a/d) RatioUltimate Shear Force, V (kN) Capacity Ratios =
Experimental valveTheoretical valveExperimental Theoretical
CC200A 2.0 65.8 49 1.3CC200B 2.0 71.9 49 1.4CC250A 2.0 93.7 62 1.5CC250B 2.0 81.1 62 1.3EPS200A 2.0 61.8 49 1.2EPS250A 2.0 82.2 62 1.3
4.2.2. Concrete Strain Curves
The load-strain curves for the concrete topping of the tested slabs are shown in Figure 5. It is clearthat the strain increased gradually as the applied load increased, and negative strains were recordedthat indicated compression of the topping concrete. Furthermore, no crushing failure was observed atthe ultimate shear load, as the strains were between 250 to 550 µε, which is much smaller than themaximum crushing strain of 3000 µε. It can be seen that EPS200A detected a large strain just before thefailure load, possibly due to that the location of the concrete strain gauge, which was absorbing largeamounts of energy prior to the fracture and thus affording an opportunity to take remedial action beforean actual fracture could occur. The completely different natures of the control sample and the EPS-foamconcrete can be seen by comparing the load-strain curves. Samples EPS200A and EPS250A were capableof withstanding heavy loads (75–95 kN), but they experienced brittle behavior, showing ultimatestrains of 250–300 µε. Specimens CC250A and CC250B, on the other hand, were able to withstandmuch higher strains without failure (up to 500 µε), but at the same time had a minimum breakingload is 60 kN. The results obtained can be explained by the different microstructures of these twospecimens; namely, traditional concrete is denser and stronger, while expanded polystyrene concreteis less dense and more elastic. This latter microstructure is due to a lower interfacial bond-strengthresulting from the hydrophobic nature of EPS aggregate, as well as the compressibility of EPS aggregate,which increases the crashing rate of EPS-foam concrete and subsequently increases the topping concretestrain of EPS-foam concrete.

Sustainability 2020, 12, 9679 9 of 17
Sustainability 2020, 10, x FOR PEER REVIEW 9 of 19
sample and the EPS-foam concrete can be seen by comparing the load-strain curves. Samples EPS200A and EPS250A were capable of withstanding heavy loads (75–95 kN), but they experienced brittle behavior, showing ultimate strains of 250–300 µɛ. Specimens CC250A and CC250B, on the other hand, were able to withstand much higher strains without failure (up to 500 µɛ), but at the same time had a minimum breaking load is 60 kN. The results obtained can be explained by the different microstructures of these two specimens; namely, traditional concrete is denser and stronger, while expanded polystyrene concrete is less dense and more elastic. This latter microstructure is due to a lower interfacial bond-strength resulting from the hydrophobic nature of EPS aggregate, as well as the compressibility of EPS aggregate, which increases the crashing rate of EPS-foam concrete and subsequently increases the topping concrete strain of EPS-foam concrete.
Figure 5. Topping concrete strain results.
Rosette strain gauges were glued on the critical shear position of the slabs halfway between the point of load application and the support. Each rosette gauge measured strain readings at 45 degrees in both horizontal and vertical directions, and the results are shown in Figures 6–8 for the 200-mm slabs and Figures 9–11 for the 250-mm slabs. High strain values were expected to be recorded by the rosette strain gauges, followed by breaking of the gauges as shear cracks intercepted them. Considering the 200-mm slab specimens, strain observations of the entire tested samples showed lower strain values (below 300 µϵ) as the first cracks formed. However, as the loads passed 40 kN, higher strain values up to 2500 µϵ were observed for sample EPS200A (Figure 8). Generally, both EPS200 and CC200 showed similarities in shear strain distributions, and high strain values were recorded prior to failure.
Samples CC200A (Figure 9) and CC200B (Figure 10) showed the highest susceptibilities to vertical deformations, both in terms of maximum load and maximum stress, amounting to 65 kN and 800-1100 µɛ, respectively. On the other hand, the EPS200A (Figure 8) and EPS250A (Figure 11) samples showed the highest susceptibilities to 45-degree deformations. In this case, the maximum loads were 60–80 kN at strains of 1200–2100 µɛ. Samples CC250A (Figure 9) and CC250B (Figure 11) showed uniform behaviors only for loads at 45 degrees, while instability of behavior was noted for other loads up to the appearance of negative strains. Interesting results were observable for the EPS200A sample (Figure 8), where no horizontal or vertical strains were recorded with an increase in load from 0 to 43 kN, then horizontal strains increased sharply to 400 kN while the vertical strains did not change at all.
0102030405060708090
100
-600 -500 -400 -300 -200 -100 0 100
Load
kN
Strain (µϵ)Figure 5. Topping concrete strain results.
Rosette strain gauges were glued on the critical shear position of the slabs halfway between thepoint of load application and the support. Each rosette gauge measured strain readings at 45 degrees inboth horizontal and vertical directions, and the results are shown in Figures 6–8 for the 200-mm slabsand Figures 9–11 for the 250-mm slabs. High strain values were expected to be recorded by the rosettestrain gauges, followed by breaking of the gauges as shear cracks intercepted them. Considering the200-mm slab specimens, strain observations of the entire tested samples showed lower strain values(below 300 µε) as the first cracks formed. However, as the loads passed 40 kN, higher strain values upto 2500 µε were observed for sample EPS200A (Figure 8). Generally, both EPS200 and CC200 showedsimilarities in shear strain distributions, and high strain values were recorded prior to failure.Sustainability 2020, 10, x FOR PEER REVIEW 10 of 19
Figure 6. Load versus rosette strain on CC200A.
Figure 7. Load versus rosette strain on CC200B.
0
10
20
30
40
50
60
70
-200 0 200 400 600 800 1000 1200
Load
kN
Strain (µϵ)
Horizontal45vertical
0
10
20
30
40
50
60
70
80
-200 0 200 400 600 800 1000
Load
kN
Strain (µϵ)
Horizontal45vertical
Figure 6. Load versus rosette strain on CC200A.

Sustainability 2020, 12, 9679 10 of 17
Sustainability 2020, 10, x FOR PEER REVIEW 10 of 19
Figure 6. Load versus rosette strain on CC200A.
Figure 7. Load versus rosette strain on CC200B.
0
10
20
30
40
50
60
70
-200 0 200 400 600 800 1000 1200
Load
kN
Strain (µϵ)
Horizontal45vertical
0
10
20
30
40
50
60
70
80
-200 0 200 400 600 800 1000
Load
kN
Strain (µϵ)
Horizontal45vertical
Figure 7. Load versus rosette strain on CC200B.Sustainability 2020, 10, x FOR PEER REVIEW 11 of 19
Figure 8. Load versus rosette strain on EPS200A.
Figures 9–11 show the load-strain curves for the CC250 and EPS250 samples. In general, stain observation of the tested samples showed lower strain values (below 100 µϵ) before the first crack formed. As the load passed 45 kN, higher strain values of up to 1200 µϵ could be observed, and, as before, EPS250 and CC250 slabs showed similarity in terms of shear strain distributions, with high strain values recorded before failure. In addition, based on visual observations during testing, EPS-foam concrete samples were more compressible and able to withstand stress after failure due to the EPS aggregate, which caused a strain with increased absorption (and no destruction) compared to conventional concrete samples.
Figure 9. Load versus rosette strain on CC250A.
0
10
20
30
40
50
60
70
-400 0 400 800 1200 1600 2000 2400
Load
kN
Strain (µϵ)
Horizontal45vertical
0
10
20
30
40
50
60
70
80
-200 0 200 400 600 800 1000 1200 1400
Load
kN
Strain (µϵ)
Horizontal45vertical
Figure 8. Load versus rosette strain on EPS200A.
Samples CC200A (Figure 9) and CC200B (Figure 10) showed the highest susceptibilities tovertical deformations, both in terms of maximum load and maximum stress, amounting to 65 kN and800–1100 µε, respectively. On the other hand, the EPS200A (Figure 8) and EPS250A (Figure 11) samplesshowed the highest susceptibilities to 45-degree deformations. In this case, the maximum loads were60–80 kN at strains of 1200–2100 µε. Samples CC250A (Figure 9) and CC250B (Figure 11) showeduniform behaviors only for loads at 45 degrees, while instability of behavior was noted for other loads

Sustainability 2020, 12, 9679 11 of 17
up to the appearance of negative strains. Interesting results were observable for the EPS200A sample(Figure 8), where no horizontal or vertical strains were recorded with an increase in load from 0 to43 kN, then horizontal strains increased sharply to 400 kN while the vertical strains did not changeat all.
Figures 9–11 show the load-strain curves for the CC250 and EPS250 samples. In general,stain observation of the tested samples showed lower strain values (below 100 µε) before the firstcrack formed. As the load passed 45 kN, higher strain values of up to 1200 µε could be observed,and, as before, EPS250 and CC250 slabs showed similarity in terms of shear strain distributions,with high strain values recorded before failure. In addition, based on visual observations during testing,EPS-foam concrete samples were more compressible and able to withstand stress after failure due tothe EPS aggregate, which caused a strain with increased absorption (and no destruction) compared toconventional concrete samples.
Sustainability 2020, 10, x FOR PEER REVIEW 11 of 19
Figure 8. Load versus rosette strain on EPS200A.
Figures 9–11 show the load-strain curves for the CC250 and EPS250 samples. In general, stain observation of the tested samples showed lower strain values (below 100 µϵ) before the first crack formed. As the load passed 45 kN, higher strain values of up to 1200 µϵ could be observed, and, as before, EPS250 and CC250 slabs showed similarity in terms of shear strain distributions, with high strain values recorded before failure. In addition, based on visual observations during testing, EPS-foam concrete samples were more compressible and able to withstand stress after failure due to the EPS aggregate, which caused a strain with increased absorption (and no destruction) compared to conventional concrete samples.
Figure 9. Load versus rosette strain on CC250A.
0
10
20
30
40
50
60
70
-400 0 400 800 1200 1600 2000 2400
Load
kN
Strain (µϵ)
Horizontal45vertical
0
10
20
30
40
50
60
70
80
-200 0 200 400 600 800 1000 1200 1400
Load
kN
Strain (µϵ)
Horizontal45vertical
Figure 9. Load versus rosette strain on CC250A.
Sustainability 2020, 10, x FOR PEER REVIEW 12 of 19
Figure 10. Load versus rosette strain on CC250B.
Figure 11. Load versus rosette strain on EPS250A.
4.2.3. Steel Bar Strain Curves
Figures 12 and 13 show the moment-strain distributions of the main bars for the 200- and 250-mm precast half-shaped slabs; respectively. Initially, the moment-strain curves followed an elastic behavior until the opening of the first crack; subsequently, the steel strain was augmented consistently until the steel yielded at about 1172 and 1071 µε for the CC200 and EPS200 specimens, and 366 and 407 µε for the CC250 and EPS250 specimens, respectively. After yielding of the bars, the load-strain curve followed the strain-hardening response, and failure ultimately took place at 2025 and 2408 µε for the CC200 and EPS200 specimens, and 1177 and 1310 µε for the CC250 and EPS250 specimens, respectively. All EPS-foam concrete slabs showed a slower rise in strain in comparison with the half-shaped concrete reference slabs due to the former’s inherent higher ductility and ability to engross extra energy. It could also be observed that EPS-foam concrete was able to attain its full strain capacity under the shear load. Moreover, the topping steel strain was augmented elastically
0
10
20
30
40
50
60
70
80
90
-500 -300 -100 100 300 500 700 900 1100
Load
kN
Strain (µϵ)
Horizontal45vertical
0
10
20
30
40
50
60
70
80
90
100
-200 0 200 400 600 800
Load
kN
Strain (µϵ)
Horizontal45vertical
Figure 10. Load versus rosette strain on CC250B.

Sustainability 2020, 12, 9679 12 of 17
Sustainability 2020, 10, x FOR PEER REVIEW 12 of 19
Figure 10. Load versus rosette strain on CC250B.
Figure 11. Load versus rosette strain on EPS250A.
4.2.3. Steel Bar Strain Curves
Figures 12 and 13 show the moment-strain distributions of the main bars for the 200- and 250-mm precast half-shaped slabs; respectively. Initially, the moment-strain curves followed an elastic behavior until the opening of the first crack; subsequently, the steel strain was augmented consistently until the steel yielded at about 1172 and 1071 µε for the CC200 and EPS200 specimens, and 366 and 407 µε for the CC250 and EPS250 specimens, respectively. After yielding of the bars, the load-strain curve followed the strain-hardening response, and failure ultimately took place at 2025 and 2408 µε for the CC200 and EPS200 specimens, and 1177 and 1310 µε for the CC250 and EPS250 specimens, respectively. All EPS-foam concrete slabs showed a slower rise in strain in comparison with the half-shaped concrete reference slabs due to the former’s inherent higher ductility and ability to engross extra energy. It could also be observed that EPS-foam concrete was able to attain its full strain capacity under the shear load. Moreover, the topping steel strain was augmented elastically
0
10
20
30
40
50
60
70
80
90
-500 -300 -100 100 300 500 700 900 1100
Load
kN
Strain (µϵ)
Horizontal45vertical
0
10
20
30
40
50
60
70
80
90
100
-200 0 200 400 600 800
Load
kN
Strain (µϵ)
Horizontal45vertical
Figure 11. Load versus rosette strain on EPS250A.
4.2.3. Steel Bar Strain Curves
Figures 12 and 13 show the moment-strain distributions of the main bars for the 200- and 250-mmprecast half-shaped slabs; respectively. Initially, the moment-strain curves followed an elastic behavioruntil the opening of the first crack; subsequently, the steel strain was augmented consistently untilthe steel yielded at about 1172 and 1071 µε for the CC200 and EPS200 specimens, and 366 and 407 µε
for the CC250 and EPS250 specimens, respectively. After yielding of the bars, the load-strain curvefollowed the strain-hardening response, and failure ultimately took place at 2025 and 2408 µε for theCC200 and EPS200 specimens, and 1177 and 1310 µε for the CC250 and EPS250 specimens, respectively.All EPS-foam concrete slabs showed a slower rise in strain in comparison with the half-shaped concretereference slabs due to the former’s inherent higher ductility and ability to engross extra energy. It couldalso be observed that EPS-foam concrete was able to attain its full strain capacity under the shearload. Moreover, the topping steel strain was augmented elastically until reaching 95% of the ultimateshear load. The topping bars did not yield in either the reference concrete or EPS-foam concretehalf-shaped slabs.
Sustainability 2020, 10, x FOR PEER REVIEW 13 of 19
until reaching 95% of the ultimate shear load. The topping bars did not yield in either the reference concrete or EPS-foam concrete half-shaped slabs.
Figure 12. Steel-reinforcement load-strain relationship of specimens CC200A and EPS200A.
Figure 13. Steel-reinforcement load-strain relationship of specimens CC250B and EPS250B.
4.3. Crack Patterns
The location of crack patterns was carefully recorded and studied. The cracks on the EPS-foam concrete and reference half-shaped slab specimens showed similarities in terms of the gradual crushing of concrete, appearance of multiple crack lines during deflection, and lack of an explosion at failure. An example of the slab crack pattern observed can be seen in Figure 14, where the crack patterns are noticeable at each load increment. The observed cracks in the tested precast EPS-foam concrete half-shaped slabs are comparable to those exhibited in one-way reinforced concrete slabs [45,46]. Moreover, the failure mode of all samples was shear-compression, and two specific failure patterns were observed, including shear cracking and interface failure. For instance, sample CC200-A failed through shear cracking as the shear cracks spread from the base of the slab to the point of support at approximately 34 degrees, which is beneath the 45 degrees specified in BS8110 [47]. In
0
10
20
30
40
50
60
70
80
0 500 1000 1500 2000 2500 3000
Load
, kN
Strain, (µϵ)
CC200AEPS200A
0
10
20
30
40
50
60
70
80
90
0 250 500 750 1000 1250 1500
Load
, kN
Strain, (µϵ)
CC250BEPS250B
Figure 12. Steel-reinforcement load-strain relationship of specimens CC200A and EPS200A.

Sustainability 2020, 12, 9679 13 of 17
Sustainability 2020, 10, x FOR PEER REVIEW 13 of 19
until reaching 95% of the ultimate shear load. The topping bars did not yield in either the reference concrete or EPS-foam concrete half-shaped slabs.
Figure 12. Steel-reinforcement load-strain relationship of specimens CC200A and EPS200A.
Figure 13. Steel-reinforcement load-strain relationship of specimens CC250B and EPS250B.
4.3. Crack Patterns
The location of crack patterns was carefully recorded and studied. The cracks on the EPS-foam concrete and reference half-shaped slab specimens showed similarities in terms of the gradual crushing of concrete, appearance of multiple crack lines during deflection, and lack of an explosion at failure. An example of the slab crack pattern observed can be seen in Figure 14, where the crack patterns are noticeable at each load increment. The observed cracks in the tested precast EPS-foam concrete half-shaped slabs are comparable to those exhibited in one-way reinforced concrete slabs [45,46]. Moreover, the failure mode of all samples was shear-compression, and two specific failure patterns were observed, including shear cracking and interface failure. For instance, sample CC200-A failed through shear cracking as the shear cracks spread from the base of the slab to the point of support at approximately 34 degrees, which is beneath the 45 degrees specified in BS8110 [47]. In
0
10
20
30
40
50
60
70
80
0 500 1000 1500 2000 2500 3000
Load
, kN
Strain, (µϵ)
CC200AEPS200A
0
10
20
30
40
50
60
70
80
90
0 250 500 750 1000 1250 1500
Load
, kN
Strain, (µϵ)
CC250BEPS250B
Figure 13. Steel-reinforcement load-strain relationship of specimens CC250B and EPS250B.
4.3. Crack Patterns
The location of crack patterns was carefully recorded and studied. The cracks on the EPS-foamconcrete and reference half-shaped slab specimens showed similarities in terms of the gradual crushingof concrete, appearance of multiple crack lines during deflection, and lack of an explosion at failure.An example of the slab crack pattern observed can be seen in Figure 14, where the crack patternsare noticeable at each load increment. The observed cracks in the tested precast EPS-foam concretehalf-shaped slabs are comparable to those exhibited in one-way reinforced concrete slabs [45,46].Moreover, the failure mode of all samples was shear-compression, and two specific failure patternswere observed, including shear cracking and interface failure. For instance, sample CC200-A failedthrough shear cracking as the shear cracks spread from the base of the slab to the point of supportat approximately 34 degrees, which is beneath the 45 degrees specified in BS8110 [47]. In addition,the shear cracks cut across the rosette-shaped strain gauges, as shown in Figure 14 and all specimensexhibited similar shear cracks despite different failure loads. As for the location of the shear cracks inthe CC200 specimen, all cracks formed on the rib of the slab and propagated gradually upwards as theloading on the tested samples increased. Cracks were prolonged along the concrete’s topping andthere was no de-bonding, which indicates decent composite work.
Sustainability 2020, 10, x FOR PEER REVIEW 14 of 19
addition, the shear cracks cut across the rosette-shaped strain gauges, as shown in Figure 14 and all specimens exhibited similar shear cracks despite different failure loads. As for the location of the shear cracks in the CC200 specimen, all cracks formed on the rib of the slab and propagated gradually upwards as the loading on the tested samples increased. Cracks were prolonged along the concrete’s topping and there was no de-bonding, which indicates decent composite work.
Figure 14. Shear failure of slab (a) CC200A and (b) EPS200A.
Moreover, shear failure at the concrete interface occurred due to de-bonding of the topping layer from the precast unit (Figure 15), and a diagonal crack along the height of the slabs was clearly visible. Sample EPS200A failed as a result of interface shear from the extreme end up to the point of loading and shear cracking, as shown in Figure 14. Interface shear failure could be seen with 90–95% of the ultimate shear force applied. This mode of failure was similar to that observed by Girhammar [48], where de-bonding of the topping concrete took place with approximately 90-95% of the ultimate shear load applied. Despite both EPS200 and CC200 failing as a result of shear cracking, de-bonding of the topping concrete in the former was a significant difference between the two when considering the modes of failure.
Figure 15. Interface failure of EPS200A.
Furthermore, because the de-bonding of the topping concrete occurred at 95% of the ultimate load, the shear cracks shared the same pattern. The failure mode of the 250-mm precast half-shaped slabs was similar for both the normal and EPS-foam concrete slabs (Figure 16a). For CC250, shear cracks extended from the point of load application to about 100 mm from the supports. The crack cut across the rosette strain gauge to the base of the topping concrete, then to the point of load application (see Figure 16a, b). The shear crack of sample EPS250 started 100 to 110 mm away from the support. The crack cut across the 45-degree rosette strain gauge, and extended towards the topping concrete, ending at the point of load application. The ultimate failure load was relatively different for samples CC250A (Figure 13a) and EPS250A (Figure 13b), but the crack patterns were quite similar, regardless the type of concrete used to cast the EPS-foam concrete slabs.
Major shear cracks (Think cracking pattern)
a b
Major shear cracks (Thin cracking pattern)
De-bonding of topping concrete
Figure 14. Shear failure of slab (a) CC200A and (b) EPS200A.
Moreover, shear failure at the concrete interface occurred due to de-bonding of the topping layerfrom the precast unit (Figure 15), and a diagonal crack along the height of the slabs was clearly visible.Sample EPS200A failed as a result of interface shear from the extreme end up to the point of loading

Sustainability 2020, 12, 9679 14 of 17
and shear cracking, as shown in Figure 14. Interface shear failure could be seen with 90–95% of theultimate shear force applied. This mode of failure was similar to that observed by Girhammar [48],where de-bonding of the topping concrete took place with approximately 90–95% of the ultimate shearload applied. Despite both EPS200 and CC200 failing as a result of shear cracking, de-bonding of thetopping concrete in the former was a significant difference between the two when considering themodes of failure.
Sustainability 2020, 10, x FOR PEER REVIEW 14 of 19
addition, the shear cracks cut across the rosette-shaped strain gauges, as shown in Figure 14 and all specimens exhibited similar shear cracks despite different failure loads. As for the location of the shear cracks in the CC200 specimen, all cracks formed on the rib of the slab and propagated gradually upwards as the loading on the tested samples increased. Cracks were prolonged along the concrete’s topping and there was no de-bonding, which indicates decent composite work.
Figure 14. Shear failure of slab (a) CC200A and (b) EPS200A.
Moreover, shear failure at the concrete interface occurred due to de-bonding of the topping layer from the precast unit (Figure 15), and a diagonal crack along the height of the slabs was clearly visible. Sample EPS200A failed as a result of interface shear from the extreme end up to the point of loading and shear cracking, as shown in Figure 14. Interface shear failure could be seen with 90–95% of the ultimate shear force applied. This mode of failure was similar to that observed by Girhammar [48], where de-bonding of the topping concrete took place with approximately 90-95% of the ultimate shear load applied. Despite both EPS200 and CC200 failing as a result of shear cracking, de-bonding of the topping concrete in the former was a significant difference between the two when considering the modes of failure.
Figure 15. Interface failure of EPS200A.
Furthermore, because the de-bonding of the topping concrete occurred at 95% of the ultimate load, the shear cracks shared the same pattern. The failure mode of the 250-mm precast half-shaped slabs was similar for both the normal and EPS-foam concrete slabs (Figure 16a). For CC250, shear cracks extended from the point of load application to about 100 mm from the supports. The crack cut across the rosette strain gauge to the base of the topping concrete, then to the point of load application (see Figure 16a, b). The shear crack of sample EPS250 started 100 to 110 mm away from the support. The crack cut across the 45-degree rosette strain gauge, and extended towards the topping concrete, ending at the point of load application. The ultimate failure load was relatively different for samples CC250A (Figure 13a) and EPS250A (Figure 13b), but the crack patterns were quite similar, regardless the type of concrete used to cast the EPS-foam concrete slabs.
Major shear cracks (Think cracking pattern)
a b
Major shear cracks (Thin cracking pattern)
De-bonding of topping concrete
Figure 15. Interface failure of EPS200A.
Furthermore, because the de-bonding of the topping concrete occurred at 95% of the ultimate load,the shear cracks shared the same pattern. The failure mode of the 250-mm precast half-shaped slabswas similar for both the normal and EPS-foam concrete slabs (Figure 16a). For CC250, shear cracksextended from the point of load application to about 100 mm from the supports. The crack cut acrossthe rosette strain gauge to the base of the topping concrete, then to the point of load application(see Figure 16a,b). The shear crack of sample EPS250 started 100 to 110 mm away from the support.The crack cut across the 45-degree rosette strain gauge, and extended towards the topping concrete,ending at the point of load application. The ultimate failure load was relatively different for samplesCC250A (Figure 13a) and EPS250A (Figure 13b), but the crack patterns were quite similar, regardlessthe type of concrete used to cast the EPS-foam concrete slabs.Sustainability 2020, 10, x FOR PEER REVIEW 15 of 19
Figure 16. Shear cracking of CC250A and EPS250A half-shaped slabs: (a) thick cracking pattern, (b) thin cracking pattern.
5. Conclusions
This research study presented the findings of an experimental investigation into EPS-foam concrete half-shaped slabs subjected to shear loading. The experimental campaign started with the development of structural precast EPS-foam concrete half-shaped slabs using QD and EPSs as partial substitutes for sand and crushed stone, respectively. A trial and error procedure was performed to produce EPS-foam concrete with strength of 35 MPa. The replacement of fine and coarse aggregates was made testing different amounts of the two (0–30% and 0–22.5%, respectively). To ascertain that the optimum mix through which to achieve the required design strength, material tests (i.e., a compressive test, a splitting tensile test, and UPV non-destructive tests) were carried out on different mix proportions. In the process, a total of 256 trial mixes were made to investigate the physical and mechanical characteristics of the EPS-foam concrete mixtures, and a total of four EPS-foam concrete slabs (of 3.5- and 4.5-m spans) with different thicknesses (200 and 250 mm) were prepared. The findings showed that the ultimate shear force for the full-scale EPS-foam concrete half-shaped slabs was 6–12% lower when compared to identical control concrete samples with a 2410-kg/m3 average density, and 26–32% higher than the theoretical calculation values according to the BS 8110 design code. Furthermore, a substantial decrease in the density of the EPS-foam concrete mixes was observed (approximately a 20% reduction when compared to the control mixtures). From the aforementioned results, it can be asserted that EPS-foam concrete has the potential to be utilized for the slab systems of sustainable buildings in the present-day construction industry. Furthermore, this study suggests several recommendations for future research works:
• to concentrate on enhancing the structural behavior of EPS-foam concrete half-shaped slabs, (e.g., addressing the stiffness and allowable deflections of the design system in order to satisfy the serviceability limit state);
• to further predict the feasibility of the developed precast EPS-foam concrete half-shaped slab via numerical simulations; and
• to enhance the connection efficiency between precast EPS-foam concrete half-shaped slab elements.
Author Contributions: Conceptualization, S.S., and F.N.A.A.A.; methodology, S.S., F.N.A.A.A. and M.A.; resources, F.N.A.A.A., S.S., and M.A.; Investigation, S.S., F.N.A.A.A. and M.A.; data curation, F.N.A.A.A., M.A., T.O. and G.M.; formal analysis, S.S., F.N.A.A.A., M.A., T.O., G.M. and M.A.M.; supervision, F.N.A.A.A.; Validation, S.S., F.N.A.A.A., M.A., R.F., N.V., T.O., G.M., and M.A.M.; visualization, S.S., F.N.A.A.A., M.A., R.F., N.V., T.O., G.M., and M.A.M.; writing – original draft, S.S., and M.A.; writing – review & editing, S.S., F.N.A.A.A., M.A., R.F., N.V., T.O., G.M., and M.A.M.; project administration; F.N.A.A.A., N.V., R.F., and M.A.; funding acquisition, F.N.A.A.A. and N.V. All authors have read and agreed to the published version of the manuscript.
Funding: The experimental work was funded by Universiti Putra Malaysia (Vote No: 62302). This research was supported by Peter the Great St. Petersburg Polytechnic University, Russian Academic Excellence Project ‘5-100’.
Acknowledgments: The authors gratefully acknowledge the experimental work fund provided by the Universiti Putra Malaysia and the publication support given by the Peter the Great Polytechnic University, Saint
Major shear cracks (Thick cracking pattern)
a b
Major shear cracks (Thin cracking pattern) Figure 16. Shear cracking of CC250A and EPS250A half-shaped slabs: (a) thick cracking pattern, (b) thincracking pattern.
5. Conclusions
This research study presented the findings of an experimental investigation into EPS-foam concretehalf-shaped slabs subjected to shear loading. The experimental campaign started with the developmentof structural precast EPS-foam concrete half-shaped slabs using QD and EPSs as partial substitutes forsand and crushed stone, respectively. A trial and error procedure was performed to produce EPS-foamconcrete with strength of 35 MPa. The replacement of fine and coarse aggregates was made testingdifferent amounts of the two (0–30% and 0–22.5%, respectively). To ascertain that the optimum mixthrough which to achieve the required design strength, material tests (i.e., a compressive test, a splittingtensile test, and UPV non-destructive tests) were carried out on different mix proportions. In theprocess, a total of 256 trial mixes were made to investigate the physical and mechanical characteristicsof the EPS-foam concrete mixtures, and a total of four EPS-foam concrete slabs (of 3.5- and 4.5-m

Sustainability 2020, 12, 9679 15 of 17
spans) with different thicknesses (200 and 250 mm) were prepared. The findings showed that theultimate shear force for the full-scale EPS-foam concrete half-shaped slabs was 6–12% lower whencompared to identical control concrete samples with a 2410-kg/m3 average density, and 26–32% higherthan the theoretical calculation values according to the BS 8110 design code. Furthermore, a substantialdecrease in the density of the EPS-foam concrete mixes was observed (approximately a 20% reductionwhen compared to the control mixtures). From the aforementioned results, it can be asserted that EPS-foamconcrete has the potential to be utilized for the slab systems of sustainable buildings in the present-dayconstruction industry. Furthermore, this study suggests several recommendations for future research works:
• to concentrate on enhancing the structural behavior of EPS-foam concrete half-shaped slabs, (e.g.,addressing the stiffness and allowable deflections of the design system in order to satisfy theserviceability limit state);
• to further predict the feasibility of the developed precast EPS-foam concrete half-shaped slab vianumerical simulations; and
• to enhance the connection efficiency between precast EPS-foam concrete half-shaped slab elements.
Author Contributions: Conceptualization, S.S., and F.N.A.A.A.; methodology, S.S., F.N.A.A.A. and M.A.;resources, F.N.A.A.A., S.S., and M.A.; Investigation, S.S., F.N.A.A.A. and M.A.; data curation, F.N.A.A.A., M.A.,T.O. and G.M.; formal analysis, S.S., F.N.A.A.A., M.A., T.O., G.M. and M.A.M.; supervision, F.N.A.A.A.; Validation,S.S., F.N.A.A.A., M.A., R.F., N.V., T.O., G.M., and M.A.M.; visualization, S.S., F.N.A.A.A., M.A., R.F., N.V., T.O.,G.M., and M.A.M.; writing—original draft, S.S., and M.A.; writing—review & editing, S.S., F.N.A.A.A., M.A.,R.F., N.V., T.O., G.M., and M.A.M.; project administration; F.N.A.A.A., N.V., R.F., and M.A.; funding acquisition,F.N.A.A.A. and N.V. All authors have read and agreed to the published version of the manuscript.
Funding: The experimental work was funded by Universiti Putra Malaysia (Vote No: 62302). This research wassupported by Peter the Great St. Petersburg Polytechnic University, Russian Academic Excellence Project ‘5-100’.
Acknowledgments: The authors gratefully acknowledge the experimental work fund provided by the UniversitiPutra Malaysia and the publication support given by the Peter the Great Polytechnic University, Saint Petersburg,Russia, and the cooperation of the Deanship of Scientific Research at Prince Sattam bin Abdulaziz University,Alkharj, Saudi Arabia and the Department of Civil Engineering, Faculty of Engineering and IT, Amran University,Yemen, for this research.
Conflicts of Interest: The authors declare no conflict of interest.
References
1. Ju, H.; Han, S.-J.; Choi, I.; Choi, S.; Park, M.-K.; Kim, K. Experimental Study on an Optimized-Section PrecastSlab with Structural Aesthetics. Appl. Sci. 2018, 8, 1234. [CrossRef]
2. Elliott, K.S.; Jolly, C.K. Multi-Storey Precast Concrete Framed Structures; Elliott, K.S., Jolly, C.K., Eds.; John Wiley& Sons, Ltd.: Oxford, UK, 2013; ISBN 9781118587379.
3. Lee, D.H.; Park, M.K.; Oh, J.Y.; Kim, K.S.; Im, J.H.; Seo, S.Y. Web-shear capacity of prestressed hollow-coreslab unit with consideration on the minimum shear reinforcement requirement. Comput. Concr. 2014,14, 211–231. [CrossRef]
4. Newell, S.; Goggins, J. Real-time monitoring of concrete–lattice-girder slabs during construction. Proc. Inst.Civ. Eng. Struct. Build. 2017, 170, 885–900. [CrossRef]
5. Hou, H.; Liu, X.; Qu, B.; Ma, T.; Liu, H.; Feng, M.; Zhang, B. Experimental evaluation of flexural behavior ofcomposite beams with cast-in-place concrete slabs on precast prestressed concrete decks. Eng. Struct. 2016,126, 405–416. [CrossRef]
6. Yang, L. Design of Prestressed Hollow Core Slabs with Reference to Web Shear Failure. J. Struct. Eng. 1994,120, 2675–2696. [CrossRef]
7. Palmer, K.D.; Schultz, A.E. Factors affecting web-shear capacity of deep hollow-core units. PCI J. 2010,55, 123–146. [CrossRef]
8. Palmer, K.D.; Schultz, A.E. Experimental investigation of the web-shear strength of deep hollow-core units.PCI J. 2011, 56, 83–104. [CrossRef]
9. Pisanty, A. The shear strength of extruded hollow-core slabs. Mater. Struct. 1992, 25, 224–230. [CrossRef]

Sustainability 2020, 12, 9679 16 of 17
10. Fiset, M.; Bastien, J.; Mitchell, D. Methods for Shear Strengthening of Thick Concrete Slabs. J. Perform.Constr. Facil. 2017, 31, 04016103. [CrossRef]
11. Ju, H.; Han, S.-J.; Joo, H.-E.; Cho, H.-C.; Kim, K.; Oh, Y.-H. Shear Performance of Optimized-Section PrecastSlab with Tapered Cross Section. Sustainability 2018, 11, 163. [CrossRef]
12. Naito, C.; Cao, L.; Peter, W. Precast concrete double-tee connections, part 1: Tension behavior. PCI J. 2009,54, 49–66. [CrossRef]
13. Cao, L.; Naito, C. Precast concrete double-tee connectors, part 2: Shear behavior. PCI J. 2009, 54, 97–115.[CrossRef]
14. Shaw, C.S.J.; Woodland, A.B.; Hopp, J.; Trenholm, N.D. Structure and evolution of the RockeskyllerkopfVolcanic Complex, West Eifel Volcanic Field, Germany. Bull. Volcanol. 2010, 72, 971–990. [CrossRef]
15. Jong, L.Y.; Teo, D.C.L. Concrete Containing Palm Oil Fuel Ash (POFA) and Oil Palm Shell (OPS) Subjected toElevated Temperatures. J. Civ. Eng. Sci. Technol. 2014, 5, 13–17. [CrossRef]
16. Hiong, N.C.; Kameswara Rao, N.S.V.; Mannan, M.A. Precast c-channel floor for rural and estate housings.Malays. Constr. Res. J. 2011, 9, 63–72.
17. Babu, D.S.; Ganesh Babu, K.; Wee, T.H. Properties of lightweight expanded polystyrene aggregate concretescontaining fly ash. Cem. Concr. Res. 2005, 35, 1218–1223. [CrossRef]
18. Topçu, I.B.; Uygunoglu, T. Properties of autoclaved lightweight aggregate concrete. Build. Environ. 2007,42, 4108–4116. [CrossRef]
19. Lo, T.Y.; Cui, H.Z. Properties of Green Lightweight Aggregate Concrete. Int. Work. Sustain. Dev. Concr. Technol.2002, 81, 113–118.
20. Koksal, F.; Gencel, O.; Kaya, M. Combined effect of silica fume and expanded vermiculite on propertiesof lightweight mortars at ambient and elevated temperatures. Constr. Build. Mater. 2015, 88, 175–187.[CrossRef]
21. Johnson Alengaram, U.; Al Muhit, B.A.; bin Jumaat, M.Z.; Jing, M.L.Y. A comparison of the thermalconductivity of oil palm shell foamed concrete with conventional materials. Mater. Des. 2013, 51, 522–529.[CrossRef]
22. Rickard, W.D.A.; Gluth, G.J.G.; Pistol, K. In-situ thermo-mechanical testing of fly ash geopolymer concretesmade with quartz and expanded clay aggregates. Cem. Concr. Res. 2016, 80, 33–43. [CrossRef]
23. Mazaheripour, H.; Ghanbarpour, S.; Mirmoradi, S.H.; Hosseinpour, I. The effect of polypropylene fiberson the properties of fresh and hardened lightweight self-compacting concrete. Constr. Build. Mater. 2011,25, 351–358. [CrossRef]
24. Aslam, M.; Shafigh, P.; Jumaat, M.Z. Oil-palm by-products as lightweight aggregate in concrete mixture:A review. J. Clean. Prod. 2016, 126, 56–73. [CrossRef]
25. Amudhavalli, N.K.; Mathew, J. Effect of Silica Fume on Strength and Durability Parameters of Concrete.Int. J. Eng. Sci. Emerg. Technol. 2012, 3, 2231–6604.
26. He, J.; Jie, Y.; Zhang, J.; Yu, Y.; Zhang, G. Synthesis and characterization of red mud and rice husk ash-basedgeopolymer composites. Cem. Concr. Compos. 2013, 37, 108–118. [CrossRef]
27. Amran, Y.H.M.; Alyousef, R.; Alabduljabbar, H.; El-Zeadani, M. Clean production and properties ofgeopolymer concrete; A review. J. Clean. Prod. 2020, 251, 119679. [CrossRef]
28. Ukpata, J.O.; Ephraim, M.E. Flexural and tensile strength properties of concrete using lateritic sand andquarry dust as fine aggregate. ARPN J. Eng. Appl. Sci. 2012, 7, 324–331.
29. Sadrmomtazi, A.; Sobhani, J.; Mirgozar, M.A.; Najimi, M. Properties of multi-strength grade EPS concretecontaining silica fume and rice husk ash. Constr. Build. Mater. 2012, 35, 211–219. [CrossRef]
30. Mugahed Amran, Y.H.; Rashid, R.S.M.; Hejazi, F.; Abang Ali, A.A.; Safiee, N.A.; Bida, S.M. StructuralPerformance of Precast Foamed Concrete Sandwich Panel Subjected to Axial Load. KSCE J. Civ. Eng. 2018,22, 1179–1192. [CrossRef]
31. Thanoon, W.A.; Yardim, Y.; Jaafar, M.S.; Noorzaei, J. Development of interlocking mechanism for sheartransfer in composite floor. Constr. Build. Mater. 2010, 24, 2604–2611. [CrossRef]
32. Yip, C.C.; Marsono, A.K.; Wong, J.Y.; Amran, M.Y.H. Flexural strength of special reinforced lightweightconcrete beam for Industrialised Building System (IBS). J. Teknol. 2015, 77, 187–196. [CrossRef]
33. Mugahed Amran, Y.H.; Alyousef, R.; Rashid, R.S.M.; Alabduljabbar, H.; Hung, C.C. Properties andapplications of FRP in strengthening RC structures: A review. Structures 2018, 16, 208–238. [CrossRef]

Sustainability 2020, 12, 9679 17 of 17
34. Idriss, I.M.; Mathur, J.M.; Bolton Seed, H. Earth Dam-foundation interaction during earthquakes. Earthq. Eng.Struct. Dyn. 1973, 2, 313–323. [CrossRef]
35. Mugahed Amran, Y.H.; Abang Ali, A.A.; Rashid, R.S.M.; Hejazi, F.; Safiee, N.A. Structural behavior of axiallyloaded precast foamed concrete sandwich panels. Constr. Build. Mater. 2016, 107, 307–320. [CrossRef]
36. Mohamad, N.; Omar, W.; Abdullah, R. Structural Behaviour of Precast Lightweight Foamed ConcreteSandwich Panel as a Load Bearing Wall. OIDA Int. J. Sustain. Dev. 2012, 5, 49–58.
37. Saheed, S.; Amran, Y.H.M.; El-Zeadani, M.; Aziz, F.N.A.; Fediuk, R.; Alyousef, R.; Alabduljabbar, H. Structuralbehavior of out-of-plane loaded precast lightweight EPS-foam concrete C-shaped slabs. J. Build. Eng. 2021,33, 101597. [CrossRef]
38. BSI. BS 1881-116, BS-1881-Part 102: 1983 Method for Determination of Slump; BSI: London, UK, 1983.39. BSI. BS-1881: Part-110, Method for Making Test Cylinders from Fresh Concrete; BSI: London, UK, 1983.40. ASTM International. ASTM C597, Standard Test Method for Pulse Velocity Through Concrete; ASTM International:
West Conshohocken, PA, USA, 2016. [CrossRef]41. PCI. P.C.I.B.D. Manual; Precast/Prestressed Concrete Institute: Chicago, IL, USA, 2003.42. Wilden, H. PCI Design Handbook: Precast and Prestressed Concrete; Precast/Prestressed Concrete Institute:
Wakefield, MA, USA, 2010.43. Ibrahim, I.S.; Bakar, M.B.C.; Nabilah, N. Shear Capacity of Composite Slab Reinforced With Steel Fibre
Concrete Topping. Malays. J. Civ. Eng. 2011, 23, 1–23.44. Sarbini, N.N.; Ibrahim, I.S.; Saim, A.A.; Abdul Rahman, A.B.; Harun, N.F.; Hasbullah, N.N. Shear capacity of
composite slab reinforced with steel fibre to that of fabric reinforcement in concrete topping. Mater. Res. Innov.2014, 18, S6-236–S6-240. [CrossRef]
45. Amran, Y.H.M.; Rashid, R.S.M.; Hejazi, F.; Safiee, N.A.; Ali, A.A.A. Response of precast foamed concretesandwich panels to flexural loading. J. Build. Eng. 2016, 7, 143–158. [CrossRef]
46. Benayoune, A.; Samad, A.A.A.; Trikha, D.N.; Ali, A.A.A.; Ellinna, S.H.M. Flexural behaviour of pre-castconcrete sandwich composite panel—Experimental and theoretical investigations. Constr. Build. Mater. 2008,22, 580–592. [CrossRef]
47. BSI. BS 8110-2, Structural Use of Cocnrete. Part 2: Code of Practice for Special Circumstances; BSI: London, UK, 1985.48. Girhammar, U.A.; Pajari, M. Tests and analysis on shear strength of composite slabs of hollow core units and
concrete topping. Constr. Build. Mater. 2008, 22, 1708–1722. [CrossRef]
Publisher’s Note: MDPI stays neutral with regard to jurisdictional claims in published maps and institutionalaffiliations.
© 2020 by the authors. Licensee MDPI, Basel, Switzerland. This article is an open accessarticle distributed under the terms and conditions of the Creative Commons Attribution(CC BY) license (http://creativecommons.org/licenses/by/4.0/).