Influenza dei trattamenti termici sulla propagazione della cricca di fatica in una lega Ti-6Al-4V
Upload
independentCategory
view
2download
0
International Journal of Fatigue 33 (2011) 842–848
Contents lists available at ScienceDirect
International Journal of Fatigue
journal homepage: www.elsevier .com/locate / i j fa t igue
Fatigue crack initiation and growth behavior of Ti–6Al–4V undernon-proportional multiaxial loading
H. Nakamura a,⇑, M. Takanashi a, T. Itoh b, M. Wu c, Y. Shimizu c
a Structural Strength Department, Research Laboratory, IHI Corporation, 1, Shin Nakahara-Cho, Isogo-Ku, Yokohama-shi, Kanagawa 235-8501, Japanb Division of Mechanical Engineering, Graduate School of Engineering, University of Fukui, Japanc Graduate School of Engineering, University of Fukui, Japan
a r t i c l e i n f o a b s t r a c t
Article history:Received 31 August 2010Received in revised form 15 December 2010Accepted 29 December 2010Available online 1 January 2011
Keywords:Multiaxial fatigueLow cycle fatigueTitanium alloyCrack nucleationFatigue crack growth
0142-1123/$ - see front matter � 2011 Elsevier Ltd. Adoi:10.1016/j.ijfatigue.2010.12.013
⇑ Corresponding author. Tel.: +81 45 759 2864.E-mail address: [email protected] (H.
This paper deals with multiaxial low cycle fatigue crack behavior of Ti–6Al–4V under non-proportionalloading. Strain controlled fatigue tests under proportional loading and non-proportional loading with90� out-of-phase difference between the axial and shear strains e and c were carried out on tubular spec-imens at room temperature. As a result, Mises strain based fatigue lives under non-proportional loadingwere approximately 1/10 of those under proportional loading. The specimen surfaces were observed toevaluate life reduction. These results showed that non-proportional loading caused 10 times more cracksthan those of proportional loading. Non-proportional loading changes directions of the principal stressand strain axes, and high shear stresses acting on many planes stimulate more slip planes. Consequently,non-proportional loading resulted in many cracks. In addition, the high shear stresses also resulted in lar-ger misorientation under non-proportional loading. The crack initiation life defined as the length 2a of30 lm did not differ significantly between proportional loading and non-proportional loading. However,the fatigue cracks under non-proportional loading propagated faster those under proportional loading.This is because the fatigue cracks under non-proportional loading are subjected to more severe strainfield than those under proportional loading, even though the crack size and applied strain are the same.Thus, the significant reduction in fatigue life under non-proportional loading is caused by the acceleratedcrack growth due to a higher strain intensity factor.
� 2011 Elsevier Ltd. All rights reserved.
1. Introduction
Ti–6Al–4V has been used for aero engine components becauseof its excellent specific strength and corrosion resistance. Mechan-ical structures such as the rotating aero engine components areroutinely subjected to thermal stress and body force, and thesecyclic loading conditions cause multiaxial low cycle fatigue (LCF).It has been reported that the fatigue lives under the multiaxialLCF non-proportional loading, in which the directions of the prin-cipal axes are changed within a cycle, are seriously reduced [1–15]. In general, fatigue life reduction under non-proportional load-ing is accompanied by an additional strain hardening. Several stud-ies have reported the material dependence between life reductionand additional strain hardening [4,5,7,8,13,15]. Among them, onlya few papers deal with the multiaxial fatigue of Ti alloys [16–18],and the fatigue behavior under the non-proportional loading hasnot been clarified yet.
In this study, strain controlled fatigue tests were conducted onTi–6Al–4V using proportional loading and non-proportional load-
ll rights reserved.
Nakamura).
ing. Observations on microcrack initiation and propagation werecarried out by replicating the specimen surface during the fatiguetests. Since electron back-scattering diffraction (EBSD) measure-ments could identify crystal misorientation which relates to fati-gue damage [19], the EBSD measurements were used to evaluatethe damage to microstructure under proportional loading andnon-proportional loading. The fracture mechanism under non-pro-portional loading will be discussed in view of additional hardening,microcrack initiation and propagation and crystal misorientation.
2. Materials and experimental procedure
2.1. Material and specimen
Table 1 shows the chemical composition of the Ti–6Al–4V used.The material was forged and subjected to the following heat treat-ment: 960 �C for 1 h with water-cooling, and 705 �C for 2 h. withair-cooling. The bimodal a and b microstructure in Fig. 1 was ob-tained after the heat treatment. Table 2 lists the mechanical prop-erties of the material at room temperature. The shape of thespecimen for fatigue tests is shown in Fig. 2. The dimensions of
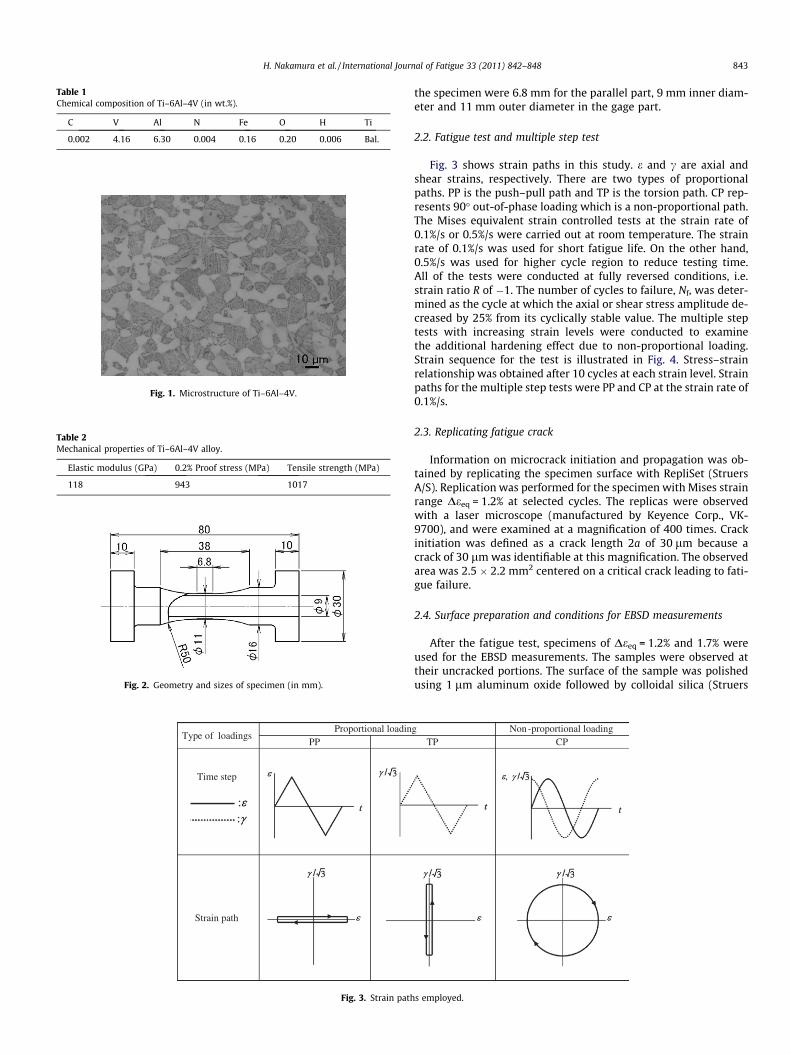
Table 1Chemical composition of Ti–6Al–4V (in wt.%).
C V Al N Fe O H Ti
0.002 4.16 6.30 0.004 0.16 0.20 0.006 Bal.
Fig. 1. Microstructure of Ti–6Al–4V.
Table 2Mechanical properties of Ti–6Al–4V alloy.
Elastic modulus (GPa) 0.2% Proof stress (MPa) Tensile strength (MPa)
118 943 1017
Fig. 2. Geometry and sizes of specimen (in mm).
Type of loadingsProportional loadin
PP
Time step
Strain path
Fig. 3. Strain path
H. Nakamura et al. / International Journal of Fatigue 33 (2011) 842–848 843
the specimen were 6.8 mm for the parallel part, 9 mm inner diam-eter and 11 mm outer diameter in the gage part.
2.2. Fatigue test and multiple step test
Fig. 3 shows strain paths in this study. e and c are axial andshear strains, respectively. There are two types of proportionalpaths. PP is the push–pull path and TP is the torsion path. CP rep-resents 90� out-of-phase loading which is a non-proportional path.The Mises equivalent strain controlled tests at the strain rate of0.1%/s or 0.5%/s were carried out at room temperature. The strainrate of 0.1%/s was used for short fatigue life. On the other hand,0.5%/s was used for higher cycle region to reduce testing time.All of the tests were conducted at fully reversed conditions, i.e.strain ratio R of �1. The number of cycles to failure, Nf, was deter-mined as the cycle at which the axial or shear stress amplitude de-creased by 25% from its cyclically stable value. The multiple steptests with increasing strain levels were conducted to examinethe additional hardening effect due to non-proportional loading.Strain sequence for the test is illustrated in Fig. 4. Stress–strainrelationship was obtained after 10 cycles at each strain level. Strainpaths for the multiple step tests were PP and CP at the strain rate of0.1%/s.
2.3. Replicating fatigue crack
Information on microcrack initiation and propagation was ob-tained by replicating the specimen surface with RepliSet (StruersA/S). Replication was performed for the specimen with Mises strainrange Deeq = 1.2% at selected cycles. The replicas were observedwith a laser microscope (manufactured by Keyence Corp., VK-9700), and were examined at a magnification of 400 times. Crackinitiation was defined as a crack length 2a of 30 lm because acrack of 30 lm was identifiable at this magnification. The observedarea was 2.5 � 2.2 mm2 centered on a critical crack leading to fati-gue failure.
2.4. Surface preparation and conditions for EBSD measurements
After the fatigue test, specimens of Deeq = 1.2% and 1.7% wereused for the EBSD measurements. The samples were observed attheir uncracked portions. The surface of the sample was polishedusing 1 lm aluminum oxide followed by colloidal silica (Struers
g Non-proportional loadingTP CP
s employed.
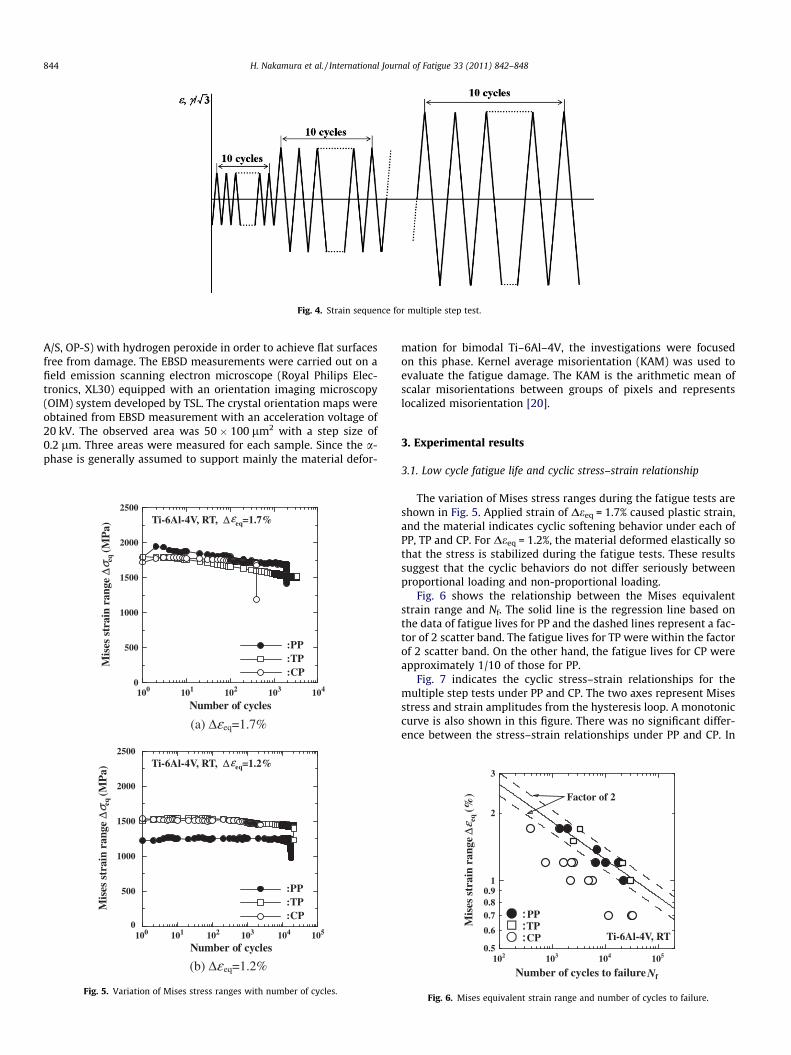
Fig. 4. Strain sequence for multiple step test.
844 H. Nakamura et al. / International Journal of Fatigue 33 (2011) 842–848
A/S, OP-S) with hydrogen peroxide in order to achieve flat surfacesfree from damage. The EBSD measurements were carried out on afield emission scanning electron microscope (Royal Philips Elec-tronics, XL30) equipped with an orientation imaging microscopy(OIM) system developed by TSL. The crystal orientation maps wereobtained from EBSD measurement with an acceleration voltage of20 kV. The observed area was 50 � 100 lm2 with a step size of0.2 lm. Three areas were measured for each sample. Since the a-phase is generally assumed to support mainly the material defor-
:PP:TP:CP
Ti-6Al-4V, RT, Δ eq=1.7%ε
(a) Δεeq=1.7%
Number of cycles
Mis
es s
trai
n ra
nge
Δeq
(MP
a)σ
100 101 102 103 1040
500
1000
1500
2000
2500
:PP:TP:CP
Ti-6Al-4V, RT, Δ eq=1.2%ε
(b) Δε eq=1.2%
Number of cycles100 101 102 103 105104
Mis
es s
trai
n ra
nge
Δeq
(MP
a)σ
0
500
1000
1500
2000
2500
Fig. 5. Variation of Mises stress ranges with number of cycles.
mation for bimodal Ti–6Al–4V, the investigations were focusedon this phase. Kernel average misorientation (KAM) was used toevaluate the fatigue damage. The KAM is the arithmetic mean ofscalar misorientations between groups of pixels and representslocalized misorientation [20].
3. Experimental results
3.1. Low cycle fatigue life and cyclic stress–strain relationship
The variation of Mises stress ranges during the fatigue tests areshown in Fig. 5. Applied strain of Deeq = 1.7% caused plastic strain,and the material indicates cyclic softening behavior under each ofPP, TP and CP. For Deeq = 1.2%, the material deformed elastically sothat the stress is stabilized during the fatigue tests. These resultssuggest that the cyclic behaviors do not differ seriously betweenproportional loading and non-proportional loading.
Fig. 6 shows the relationship between the Mises equivalentstrain range and Nf. The solid line is the regression line based onthe data of fatigue lives for PP and the dashed lines represent a fac-tor of 2 scatter band. The fatigue lives for TP were within the factorof 2 scatter band. On the other hand, the fatigue lives for CP wereapproximately 1/10 of those for PP.
Fig. 7 indicates the cyclic stress–strain relationships for themultiple step tests under PP and CP. The two axes represent Misesstress and strain amplitudes from the hysteresis loop. A monotoniccurve is also shown in this figure. There was no significant differ-ence between the stress–strain relationships under PP and CP. In
Ti-6Al-4V, RT
PPTPCP
Factor of 2
Mis
es s
trai
n ra
nge
Δeq
(%)
ε
Number of cycles to failure Nf
102 103 104 105
1
0.5
0.6
0.70.80.9
2
3
Fig. 6. Mises equivalent strain range and number of cycles to failure.

Ti-6Al-4V, RT
:PP:CP:Monotonic curve
Mises strain amplitude eq (%)ε
Mis
es s
tres
s am
plit
ude
eq
(MP
a)σ
0.5 1 1.50
200
400
600
800
1000
1200
Fig. 7. Cyclic stress–strain relationship in PP and CP.
H. Nakamura et al. / International Journal of Fatigue 33 (2011) 842–848 845
general, fatigue life reduction under non-proportional loading isaccompanied by additional strain hardening [1–15]. Although Ti–6Al–4V under non-proportional loading had not shown any addi-tional hardening effect, the fatigue lives were significantly reduced.Similar phenomenon has been reported for other titanium alloys aswell [18].
3.2. Microcrack initiation and propagation behavior
The replicated cracks at the later stage of the fatigue life areshown in Fig. 8. The PP specimen exhibited a few microcracksaround the critical crack in Fig. 8a. The number of microcrackswas eight in the observed area. On the other hand, Fig. 8b showsthat there were about 40 microcracks around the critical one forTP. Moreover, the CP specimen had much more microcracks thanthose of PP and TP in Fig. 8c. The number of cracks was more than200.
Fig. 9 indicates the number of microcracks, which are classifiedby angle and length, as a function of the life ratio N/Nf. The totalnumber of cracks for PP increased with the life ratio in Fig. 9a. Mostcracks were oriented at angles in the range between ±22.5� and 0�.The number of long cracks augmented with the life ratio in Fig. 9b.Each microcrack had grown independently.
Fig. 9c shows that the total number of cracks for TP increasesuntil N/Nf = 0.91, and then the number decreases slightly. Thenumber of cracks longer than 200 lm in length increased withthe life ratio, but the number of cracks from 100 to 200 lm de-creased at N/Nf = 0.97 in Fig. 9d. This result indicates that crackcoalescence had occurred at the later stage of the fatigue life.Fig. 9c shows that microcracks propagate primarily at 0�, and thatthey grow at other angles as well.
m1Axi
al d
irec
tion
(a) PP: N=10000 (N/Nf =0.99) (b) TP: N=204
Fig. 8. Critical cracks lead
The total number of cracks for CP indicates the local maximumat N/Nf = 0.65 in Fig. 9e. After that, the number decreased and thenincreased again. This tendency could be seen particularly in thenumber of cracks shorter than 100 lm in Fig. 9f. Thus, the crackcoalescence for CP had started in the middle stage of the fatiguelife. Fig. 9e shows that most cracks are oriented at angles in therange between ±22.5� and 0�.
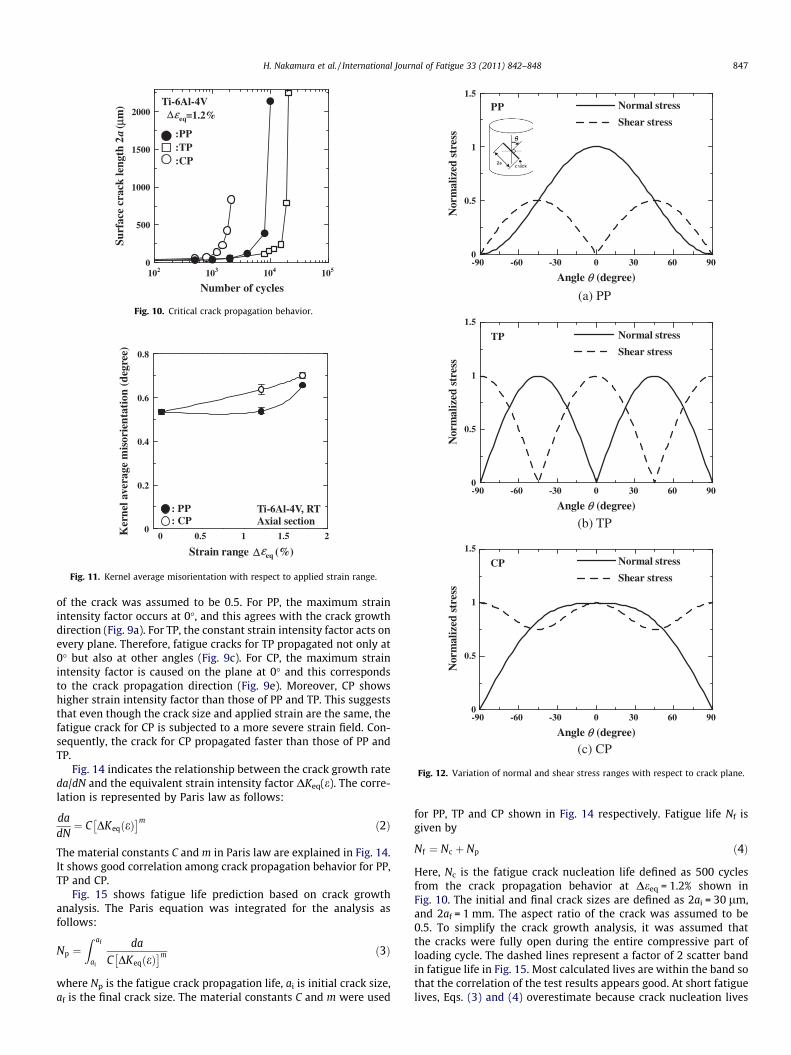
The critical crack length versus the number of cycles is shown inFig. 10. For PP, the critical crack longer than 30 lm in length wasobserved on the replica at 500 cycles (N/Nf = 0.05). The crack forPP propagated slowly during most of the fatigue life. The crackfor TP longer than 30 lm was seen at 2000 cycles (N/Nf = 0.1).The crack growth behavior was almost the same as that of PP.For CP, a crack longer than 30 lm was also observed at 500 cycles(N/Nf = 0.22). These results suggest that the crack initiation lives donot differ significantly between proportional loading and non-pro-portional loading. However, the critical crack for CP propagatedfaster than those of PP and TP.
3.3. Kernel average misorientation
Fig. 11 shows KAM for axial section versus applied total strainrange. The KAM for PP with Deeq = 1.7% increased compared to thatof pristine, but the KAM with Deeq = 1.2% indicated almost thesame magnitude as that of pristine. This suggests that Deeq = 1.2%for PP may be too small to cause enough change in misorientationto be detected by EBSD measurements. On the other hand, the KAMfor CP increased with the applied strain range and was larger thanthat of PP. These tendencies could also be seen in a round section.Therefore, non-proportional loading caused larger misorientationin the microstructure than proportional loading.
4. Discussion
The variation of normal and shear stress ranges acting on thecrack plane is shown in Fig. 12. These stresses are normalized withrespect to the applied axial or shear stress ranges. For PP, the max-imum normal stress, i.e. the principal stress, acts on a plane at anangle of 0� and maximum shear planes are on ±45� in Fig. 12a.The maximum normal stress planes for TP are on ±45� and themaximum shear stresses act on the 0� and ±90� planes inFig. 12b. For CP, it has been pointed out that both maximum nor-mal stress and maximum shear stress act on the same plane atan angle of 0� in Fig. 12c. Moreover, relatively greater shear stres-ses act on many planes for CP compared to PP and TP. Previousstudies have shown that non-proportional loading activates moreslip planes than proportional loading because the principal stressand strain axes are rotated during a cycle [4,7,11,13,15]. Therefore,high shear stresses acting on many planes stimulate more slipplanes so that CP caused 10 times more cracks than those of PP.
m
00(N/Nf =0.97) (c) CP: N=2100 (N/Nf =0.91)
ing to fatigue failure.

Ti-6Al-4VStrain path:PP
eq=1.2%εΔN
umbe
r of
cra
cks
Life ratio N/Nf
0 0.2 0.4 0.6 0.8 1
10
20
30
40
50
Num
ber
of c
rack
s
Life ratio N/Nf
0 0.2 0.4 0.6 0.8 1
10
20
30
40
50
Num
ber
of c
rack
s
Life ratio N/Nf
0 0.2 0.4 0.6 0.8 1
(a) Crack for PP classified by angle.
Ti-6Al-4VStrain path:TP
eq=1.2%εΔ
(c) Crack for TP classified by angle.
Ti-6Al-4VStrain path:CP
eq=1.2%εΔ
(e) Crack for CP classified by angle.
(b) Crack for PP classified by length.
(d) Crack for TP classified by length.
(f) Crack for CP classified by length.
50
100
150
200
250
Fig. 9. Number of fatigue cracks as a function of life ratio.
846 H. Nakamura et al. / International Journal of Fatigue 33 (2011) 842–848
In addition, these stresses also resulted in larger misorientation forCP.
For elastic–plastic loading conditions, a strain intensity factor isoften used. Socie et al. suggested the equivalent strain intensityfactor based on the strain energy release rate as follows [21]:
DKeqðeÞ ¼ Y1EDen
ffiffiffiffiffiffipap� �2 þ Y2GDcm
ffiffiffiffiffiffipap� �2
h i12 ð1Þ
where Y1 and Y2 are the Modes I and II geometry factors, E is elasticmodulus, G is shear modulus, Den is total tensile strain range normalto the maximum shear strain plane, Dcm is the total maximumshear strain range, a is the half surface crack length. Fig. 13 showsequivalent strain intensity factor DKeq(e) with respect to the surfacecrack direction. The crack length 2a = 100 lm and applied strainDe ¼ Dc=
ffiffiffi3p¼ 1:2% were used for the calculation. The aspect ratio
Number of cycles
:PP:TP:CP
Ti-6Al-4V
eq=1.2%Su
rfac
e cr
ack
leng
th 2
(μ
m)
aεΔ
102 103 104 1050
500
1000
1500
2000
Fig. 10. Critical crack propagation behavior.
Ker
nel a
vera
ge m
isor
ient
atio
n (d
egre
e)
Ti-6Al-4V, RTAxial section
: PP: CP
Strain range eq (%)εΔ0 0.5 1 1.5 2
0
0.2
0.4
0.6
0.8
Fig. 11. Kernel average misorientation with respect to applied strain range.
(a) PP
Normal stress
Shear stressTP
(b) TP
Normal stress
Shear stressPP
Nor
mal
ized
str
ess
Angle (degree)θ-90 -60 -30 0 30 60 900
0.5
1
1.5
Nor
mal
ized
str
ess
Angle (degree)θ-90 -60 -30 0 30 60 900
0.5
1
1.5
Normal stress
Shear stressCP
(c) CP
Nor
mal
ized
str
ess
Angle (degree)θ-90 -60 -30 0 30 60 900
0.5
1
1.5
Fig. 12. Variation of normal and shear stress ranges with respect to crack plane.
H. Nakamura et al. / International Journal of Fatigue 33 (2011) 842–848 847
of the crack was assumed to be 0.5. For PP, the maximum strainintensity factor occurs at 0�, and this agrees with the crack growthdirection (Fig. 9a). For TP, the constant strain intensity factor acts onevery plane. Therefore, fatigue cracks for TP propagated not only at0� but also at other angles (Fig. 9c). For CP, the maximum strainintensity factor is caused on the plane at 0� and this correspondsto the crack propagation direction (Fig. 9e). Moreover, CP showshigher strain intensity factor than those of PP and TP. This suggeststhat even though the crack size and applied strain are the same, thefatigue crack for CP is subjected to a more severe strain field. Con-sequently, the crack for CP propagated faster than those of PP andTP.
Fig. 14 indicates the relationship between the crack growth rateda/dN and the equivalent strain intensity factor DKeq(e). The corre-lation is represented by Paris law as follows:
dadN¼ C DKeqðeÞ
� �m ð2Þ
The material constants C and m in Paris law are explained in Fig. 14.It shows good correlation among crack propagation behavior for PP,TP and CP.
Fig. 15 shows fatigue life prediction based on crack growthanalysis. The Paris equation was integrated for the analysis asfollows:
Np ¼Z af
ai
da
C DKeqðeÞ� �m ð3Þ
where Np is the fatigue crack propagation life, ai is initial crack size,af is the final crack size. The material constants C and m were used
for PP, TP and CP shown in Fig. 14 respectively. Fatigue life Nf isgiven by
Nf ¼ Nc þ Np ð4Þ
Here, Nc is the fatigue crack nucleation life defined as 500 cyclesfrom the crack propagation behavior at Deeq = 1.2% shown inFig. 10. The initial and final crack sizes are defined as 2ai = 30 lm,and 2af = 1 mm. The aspect ratio of the crack was assumed to be0.5. To simplify the crack growth analysis, it was assumed thatthe cracks were fully open during the entire compressive part ofloading cycle. The dashed lines represent a factor of 2 scatter bandin fatigue life in Fig. 15. Most calculated lives are within the band sothat the correlation of the test results appears good. At short fatiguelives, Eqs. (3) and (4) overestimate because crack nucleation lives

:PP
:TP
:CP
eq(
)(M
Pa
m)
K
εΔ
Angle (degree)θ-90 -60 -30 0 30 60 90
5
10
15
20
Fig. 13. Variation of equivalent strain intensity factor with respect to crack plane.
:PP:TP:CP
Ti-6Al-4V
eq( ) (MPa m)K εΔ
eq=1.2%εΔ
(m/c
ycle
)a
d /d
N
1 10 10010-9
10-8
10-7
10-6
C m PP 9.79×10⁻¹¹ 2.04 TP 8.71×10⁻¹¹ 1.92 CP 9.86×10⁻¹¹ 2.37
Fig. 14. Surface crack growth rate versus equivalent strain intensity factor.
Experimental life
Pre
dict
ed li
fe
: PP: TP: CP
Ti-6Al-4V, RT
Factor of 2
102 103 104 105 106102
103
104
105
106
Fig. 15. Life prediction based on crack growth analysis.
848 H. Nakamura et al. / International Journal of Fatigue 33 (2011) 842–848
would be shorter than 500 cycles. On the contrary, fatigue lives athigher cycle region are underestimated because crack nucleationlives would be longer. Therefore, the significant life reductionshown in Ti–6Al–4V under non-proportional loading is attributed
to the accelerated crack growth due to higher strain intensity fac-tors than those under proportional loading.
5. Conclusion
This paper focused on the fatigue crack behavior of Ti–6Al–4Vunder non-proportional loading. The fatigue lives under non-pro-portional loading were approximately 1/10 of those under propor-tional loading. Observations of microcracks showed that therewere 10 times more cracks for CP than those of PP. The non-proportional loading changes directions of the principal stress andstrain axes, and high shear stresses acting on many planes stimu-late more slip planes. As a result, CP caused 10 times more cracksthan those of PP. In addition, high shear stresses also resulted inlarger misorientation for CP. The crack initiation lives did not differamong PP, TP and CP, but the fatigue crack for CP has propagatedfaster. This is because the fatigue cracks for CP are subjected tomore severe strain field than those of PP and TP, even though thecrack size and applied strain are the same. Thus, the significantreduction of fatigue life under non-proportional loading is causedby the accelerated crack growth due to higher strain intensity fac-tor than those under proportional loading.
References
[1] Kanazawa K, Miller KJ, Brown MW. Cyclic deformation of 1% Cr–Mo–V steelunder out-of-phase loads. Fatigue Eng Mater Struct 1979;2:217–28.
[2] Fatemi A, Socie DF. A critical plane approach to multi-axial fatigue damageincluding out-of-phase loading. Fatigue Eng Mater Struct 1988;11:149–65.
[3] McDowell DL, Stahl OK, Stock SR, Antolovich SD. Biaxial path dependence ofdeformation substructure of type 304 stainless steel. Metall Mater Trans A1988;19:1277–93.
[4] Doong SH, Socie DF, Robertson IM. Dislocation substructures andnonproportional hardening. Trans ASME J Eng Mater Technol 1990;112:456–64.
[5] Itoh T, Sakane M, Ohnami M, Socie DF. Nonproportional low cycle fatiguecriterion for type 304 stainless steel. J Eng Mater Technol 1995;117:285–92.
[6] Chen X, Gao Q, Sun XF. Low-cycle fatigue under non-proportional loading.Fatigue Fract Eng Mater Struct 1996;19:839–54.
[7] Kida S, Itoh T, Sakane M, Ohnami M, Socie DF. Dislocation structure and non-proportional hardening of type 304 stainless steel. Fatigue Fract Eng MaterStruct 1997;20–10:1375–86.
[8] Itoh T, Nakata T, Sakane M, Ohnami M. Nonproportional low cycle fatigue of6061 aluminum alloy under 14 strain paths. In: Proc 5th int conf biaxial/multiaxial fatigue fract, vol. I; 1997. p. 173–87.
[9] GO H, ChShu C, Gao Q. Non-proportional low cycle fatigue under multiaxialloading for 316L stainless steel. In: Proc 7th int fatigue cong; 1999. p. 917–22.
[10] Chen X, Xu S, Hung DX. Critical plane-strain energy density criterion formultiaxial low-cycle fatigue life. In: Proc 7th int fatigue cong; 1999. p. 959–64.
[11] Socie DF, Marquis GB. Multiaxial fatigue. SAE Int; 2000.[12] Chen X, An K, Kim KS. Low-cycle fatigue of 1Cr–18Ni–9Ti stainless steel and
related weld metal under axial, torsional and 90 out-of-phase loading. FatigueFract Eng Mater Struct 2004;27:439–48.
[13] Itoh T, Murashima K, Hirai T. Low-cycle fatigue of 1Cr–18Ni–9Ti stainless steeland related weld metal under axial, torsional and 90 out-of-phase loading. JSoc Mater Sci 2007;56:157–63.
[14] Borodii MV, Shukaev SM. Additional cyclic strain hardening and its relation tomaterial structure, mechanical characteristics, and lifetime. Int J Fatigue2007;29:1184–91.
[15] Yang T, Itoh T. Material dependence of multiaxial low cycle fatigue life undernon-proportional loading. In: Proc LCF6, CD; 2008.
[16] Kallmeyer AR, Krgo A, Kurath P. Evaluation of multiaxial fatigue life predictionmethodologies for Ti–6Al–4V. Eng Mater Technol 2001;124:229–37.
[17] Kallmeyer AR, Kurath P. Development of multiaxial fatigue damageassessment methods considering high cycle fatigue (HCF)/low cycle fatigue(LCF) interactions. AFRL-ML-WP-TR-2006-4112; 2006.
[18] Shamsaei N, Gladskyi M, Panasovskyi K, Shukaev S, Fatemi A. Multiaxialfatigue of titanium including step loading and load path alteration andsequence effects. Int J Fatigue 2010;32(11):1862–74.
[19] Kamaya M. Characterization of microstructural damage due to low-cyclefatigue by EBSD observation. Mater Char 2009;60(12):1454–62.
[20] Schwartz AJ, Kumar M, Adams BL, Field DP. Electron backscatter diffraction inmaterials science. 2nd ed. Springer; 2009.
[21] Socie DF, Hua CT, Worthem DW. Mixed mode small crack growth. Fatigue FractEng Mater Struct 1987;10(1):1–16.
Copyright © 2022 FDOKUMEN