Electrically Conductive Textile Materials—Application ... - MDPI
Upload
khangminh22Category
view
1download
0
applied sciences
Article
Influence of Electrically Powered Pedal Assistance onUser-Induced Cycling Loads and Muscle Activityduring Cycling
Sien Dieltiens 1,*, Carlos Jiménez-Peña 2 , Senne Van Loon 3 , Jordi D’hondt 1 , Kurt Claeys 4 andEric Demeester 5
�����������������
Citation: Dieltiens, S.; Jiménez-Peña,
C.; Van Loon, S.; D’hondt, J.; Claeys,
K.; Demeester, E. Influence of
Electrically Powered Pedal Assistance
on User-Induced Cycling Loads and
Muscle Activity during Cycling. Appl.
Sci. 2021, 11, 2032. https://doi.org/
10.3390/app11052032
Academic Editors: Redha Taiar and
Mario Bernardo-Filho
Received: 5 February 2021
Accepted: 16 February 2021
Published: 25 February 2021
Publisher’s Note: MDPI stays neutral
with regard to jurisdictional claims in
published maps and institutional affil-
iations.
Copyright: © 2021 by the authors.
Licensee MDPI, Basel, Switzerland.
This article is an open access article
distributed under the terms and
conditions of the Creative Commons
Attribution (CC BY) license (https://
creativecommons.org/licenses/by/
4.0/).
1 Department of Electromechanical Engineering, KU Leuven Technologiecampus Gent, 9000 Ghent, Belgium;[email protected]
2 Department of Materials Engineering, KU Leuven Technologiecampus Gent, 9000 Ghent, Belgium;[email protected]
3 Department of Physics, Universiteit Antwerpen, 2000 Antwerp, Belgium; [email protected] Department of Rehabilitation Sciences, KU Leuven Campus Brugge, 8200 Bruges, Belgium;
[email protected] Department of Electromechanical Engineering, KU Leuven Campus Diepenbeek, 3590 Diepenbeek, Belgium;
[email protected]* Correspondence: [email protected]
Abstract: Bicycles with electrically powered pedal assistance (PA) show great potential as ecologicalalternatives for engine-based vehicles. There is plenty of research available about the influence ofvarious bicycle parameters on cycling technique. Though, to the best of the authors’ knowledge,there is none about the influence of PA. In this study, a recreational bicycle is equipped with PA andunique instrumentation to measure the user-induced loads on seat, steer and pedals. Joint loadingis derived in the sagittal plane from inverse dynamics and muscle activity of the lower limbs isrecorded with an electromyography system integrated in cycling pants. An experiment is set up, inwhich volunteers cycle on an athletics track, with a varying level of PA and a varying seat height. AnANOVA is conducted to determine significant differences due to the level of PA and seat height andto analyze the interaction effect. No interaction effect was found and only differences due to the levelof PA were significant. Knowledge about the influence of PA provides insights into (i) electric bicycledesign; (ii) the usage of electric bicycle for physically challenged people; (iii) the usage of electricbicycles as a rehabilitation tool.
Keywords: electric bicycle; load cell; kinetics; kinematics; muscle activity; 5 bar linkage; derived ki-netics; joint loading; seat loading; steer loading; pedal loading; EMG; user-induced loading; pedaling
1. Introduction
Bicycles are ecological alternatives for engine-based vehicles. Though, due to theirrelatively small action radius and demand of high physical effort, bicycles are not widelyadapted for the everyday commute. Modern bicycles with electrically powered pedalassistance (PA) facilitate higher speeds with less effort, enabling physically challengedpeople to cycle, increasing the potential of bicycles as a means of transportation. Only littleis known about the cycling technique on bicycles with PA. Naturalistic studies point outthat when traditional cyclists ride a bicycle with PA (i) their average cycling speed increasesby 3–5 km/h; (ii) they require more reactive maneuvers braking; (iii) their decelerationsduring sharp braking are higher [1].
Unlike walking, cycling is more consistent since the pedals, steer and seat constrainsextremity movements. Cycling technique is often described by the bicycle–cyclist inter-action loading on the points of contact, comprising the loads induced by the user on theseat, steer and pedals [2,3]. Forces and moments are measured in the three dimensions
Appl. Sci. 2021, 11, 2032. https://doi.org/10.3390/app11052032 https://www.mdpi.com/journal/applsci

Appl. Sci. 2021, 11, 2032 2 of 16
and related to the pedal position within the pedal cycle. User-induced loads are usefulto design bicycle frames and components [4] and to derive lower limb joint loading atthe knees, hips and ankles by inverse dynamics [5]. Joint loading patterns are utilized toevaluate cycling for rehabilitation [6], to predict overuse joint injuries [7], to analyze musclefunction [8] and to optimize cycling performance [9]. There is plenty of research availableabout the influence of pedaling cadence [10,11], saddle height [12,13], muscle fatigue [14]and workload [15,16] on joint moments. Though, to the best of the authors’ knowledge,there is no information available about the influence of pedal assistance.
As cycling considers a smooth action without great impact, acute injuries are less likelyto occur. Overuse injuries on the other hand happen frequently [17], with the most commonregion being the lower extremities (e.g., the knees and the Achilles tendon). The kneeextensor is the prime mover to generate propelling power. Though, overdeveloped kneeextensor muscles increase the risk of knee injuries due to muscle imbalance [18,19]. Further-more, muscle activity patterns are indispensable to analyze cycling technique. Researchsuggests that muscle activity levels of the lower limbs are influenced by parameters asworkload level, pedaling cadence and body posture [20–22]. Though again, no informationhas been found about the influence of PA on muscle activation patterns in cycling.
The influence of PA on the user-induced loads is determined by using a conventionalrecreation bicycle by measuring the pedal loads, seat loads and steer loads with validatedinstrumentation [23–25]. Loads are derived to the lower limb joints with a verified methoddescribed by some of the authors in a previous investigation [26]. Muscle activation ismeasured with a system involving surfaces electrodes integrated in cycling pants, asin [27–29]. Knowledge about the influence of PA on the cycling interaction providesinsights of advantages and disadvantages of electric cycling for certain target groups.
2. Materials and Methods2.1. Participants
The study was approved by the Ethical Committee research of UZ/KU Leuven.Ten recreational cyclists, six women and four men, volunteered to participate. Theywere informed about the objectives, protocol and the procedures of the study and aninformed consent form was signed. The subjects presented the following mean values: age31 ± 5 years, height 171 ± 7 cm, body mass 64 ± 11 kg, Body Mass Index (BMI) 22 ± 3.They are all in good physical condition, suffer from no injuries and have a healthy BMI.Subject characteristics are presented in Table 1.
Table 1. Characteristics of the subjects.
Subject1
Subject2
Subject3
Subject4
Subject5
Subject6
Subject7
Subject8
Subject9
Subject10
Gender M F F F M M M F F FAge 28 26 33 32 40 28 31 26 30 37
Weight 77 62 66 51 80 77 65 49 60 56Height 182 172 171 157 173 171 179 164 175 169
BMI 23 21 23 20 27 26 20 18 20 20Dominant
foot R R R R R R R L R R
2.2. Experimental Design
The subjects cycle multiple rounds on an instrumented bicycle on an athletics trackwith a varying seat post height and level of pedal assistance. The instrumented bicyclecontains load cells in the seat, steer and pedals to determine the user-induced loads. Thelower limb segments are measured to derive the user-induced forces and moments at thelower limb joints. A mobile surface electromyography system (EMG system) integrated incycling pants is utilized to analyze muscle activity in the lower limbs.

Appl. Sci. 2021, 11, 2032 3 of 16
2.3. Instrumentation
There are three points of contact between the cyclist and the bicycle, namely, the pelvison the saddle, the hands on the steer and the feet on the pedals. The steer stem, seat postand pedals of a city bike for women with PA are replaced by instrumented ones to measurethe user-induced loads on all three points of contact. Encoders are inserted in the pedalsto determine pedal orientation and in the bottom bracket to relate the loads to the pedalarm angle. The cycling speed is measured with a reed switch and the muscle activity of thelower limbs are recorded with an EMG system integrated in cycling pants. An overview ofthe instrumentation is presented in Figure 1.
Appl. Sci. 2021, 11, 2032 3 of 16
2.3. Instrumentation There are three points of contact between the cyclist and the bicycle, namely, the pel-
vis on the saddle, the hands on the steer and the feet on the pedals. The steer stem, seat post and pedals of a city bike for women with PA are replaced by instrumented ones to measure the user-induced loads on all three points of contact. Encoders are inserted in the pedals to determine pedal orientation and in the bottom bracket to relate the loads to the pedal arm angle. The cycling speed is measured with a reed switch and the muscle activity of the lower limbs are recorded with an EMG system integrated in cycling pants. An over-view of the instrumentation is presented in Figure 1.
(a) (b)
Figure 1. (a) Schematic overview instrumented bicycle; (b) test subject on instrumented bicycle.
2.3.1. Bicycle All tests are performed under the same circumstances. As there is no control over the
delivered power output of the subjects, this parameter is disabled by letting the subjects cycle at a steadily and continuous speed of 20 km/h without changing the gears on an electric bicycle, from which the motor power output is based on the cyclist’s cadence with-out taking the pedaling power into account.
A typical city bike for woman is equipped with PA by a conversion kit, namely, the BBS01B of Bafang. The kit contains a pedal assist (PAS) sensor to determine the speed of the spinning bottom bracket, a speed sensor, safety break handles, a battery pack of 36 V and a middle motor of 250 W with the following specifications: no-load speed of 85 rpm, on-load speed of 81 rpm and a maximal torque of 80 Nm. The kit bases the PA on (i) the speed of the bottom bracket, not taking into account the amount of force the cyclist is applying, and (ii) on the level of PA the subject chooses with an interface. There are five degrees of pedal assistance. Depending the cadence of the user, the torque varies from zero until 20% of the maximal torque output for the first degree, from zero until 40% for the second degree, from zero until 60% for the third degree, from zero until 80% for the fourth degree and from zero until 100% for the fifth degree. Three PA setups are utilized during testing: no PA (PA 1), PA degree 2 (PA 2) and PA degree 4 (PA 3).
2.3.2. Instrumented Steer The cycling loads exerted by the user’s hands are measured with an instrumented
steer stem [25]. The stem contains a unique strain gauge based 6-component balance with a maximum standard error of full scale of 0.5% to measure three dimensional steering forces and moments.
Figure 1. (a) Schematic overview instrumented bicycle; (b) test subject on instrumented bicycle.
2.3.1. Bicycle
All tests are performed under the same circumstances. As there is no control over thedelivered power output of the subjects, this parameter is disabled by letting the subjectscycle at a steadily and continuous speed of 20 km/h without changing the gears on anelectric bicycle, from which the motor power output is based on the cyclist’s cadencewithout taking the pedaling power into account.
A typical city bike for woman is equipped with PA by a conversion kit, namely, theBBS01B of Bafang. The kit contains a pedal assist (PAS) sensor to determine the speed of thespinning bottom bracket, a speed sensor, safety break handles, a battery pack of 36 V and amiddle motor of 250 W with the following specifications: no-load speed of 85 rpm, on-loadspeed of 81 rpm and a maximal torque of 80 Nm. The kit bases the PA on (i) the speed ofthe bottom bracket, not taking into account the amount of force the cyclist is applying, and(ii) on the level of PA the subject chooses with an interface. There are five degrees of pedalassistance. Depending the cadence of the user, the torque varies from zero until 20% of themaximal torque output for the first degree, from zero until 40% for the second degree, fromzero until 60% for the third degree, from zero until 80% for the fourth degree and from zerountil 100% for the fifth degree. Three PA setups are utilized during testing: no PA (PA 1),PA degree 2 (PA 2) and PA degree 4 (PA 3).
2.3.2. Instrumented Steer
The cycling loads exerted by the user’s hands are measured with an instrumentedsteer stem [25]. The stem contains a unique strain gauge based 6-component balance with amaximum standard error of full scale of 0.5% to measure three dimensional steering forcesand moments.

Appl. Sci. 2021, 11, 2032 4 of 16
2.3.3. Instrumented Seat
The loads exerted by the user’s pelvis are measured with an instrumented seatpost [24]. The seat post contains a unique strain gauge based 6-component balance with amaximum standard error of full scale of 1.4%. The pelvis-induced forces and moments aremeasured in three dimensions.
2.3.4. Instrumented Pedals
The pedaling loads exerted by the user’s feet are recorded with instrumented ped-als [23]. The pedals contain a unique strain gauge based 3-component balance with amaximum standard error of 0.5% to measure the pedaling forces in three dimensions. Thepedal angle is measured with a magnetometer. Two dimensional forces and moments onthe lower limb joints are estimated in the sagittal plane utilizing the inverse dynamicsmodel [5].
2.3.5. Instrumented Bottom Bracket
The magnitude and direction of the cycling loads is highly dependent of the phasein the pedal cycle. The pedal cycle compromises two phases: the downstroke phaseand the upstroke phase. The downstroke phase, when the pedal is pushed down fromthe highest vertical position (the upper dead center) to the lowest vertical position (thelower dead center), is characterized by the generation of force to propel the bike. The aimof the upstroke phase, when the pedal is lifted from the lowest vertical position to thehighest vertical position, is to return the foot to the highest vertical position. Due to thehigh dependency of the location in the pedal cycle, all cycling loads and muscle activitymeasurements are related to the position in the pedal cycle. An incremental encoder isinstalled on the bottom bracket to determine the pedal arm angle [23].
2.3.6. EMG System
The muscle activity of the glutes (Gluteus Maximus), hamstrings and quadricepsare measured with a wireless surface EMG system integrated in sport shorts, namely, theMbody 3 (MYONTEC). Data are collected wireless, internally saved in data acquisitionunits of the EMG shorts (Mcells) and later uploaded to the computer. The accuracy andvalidity of the system were proved in earlier studies [27–29].
2.3.7. Data Acquisition System
A data acquisition system is integrated in a waterproof box attached to the luggagerack as presented in Figure 2a. The system is directly connected to an 11-inch notebook andcontrolled by a Matlab script. The bicycle’s data acquisition system contains a cDAQ-9178chassis (NATIONAL INSTRUMENTS), a universal analogue input module NI9219 to readthe strain gauge data and a universal analogue input module NI9215 to read the encoderand reed contact data. The magnetometer is connected to an Arduino Micro (ARDUINO).The Mcell of the EMG shorts are adapted for synchronization with the instrumented bicycle,as presented in Figure 2b. A wire is connected from the button of the Mcell to the ArduinoMicro. The Arduino continuously sends out a varying signal to the cDAQ and the Mcell toadd a unique high–low pattern. After the experiments, all data are shifted in time untilthey fully match the unique high-low pattern of the Arduino. Furthermore, the Arduinosends a long signal of 5 s to the Mcell to start and to end a measurement.
Appl. Sci. 2021, 11, 2032 5 of 16Appl. Sci. 2021, 11, 2032 5 of 16
(a) (b)
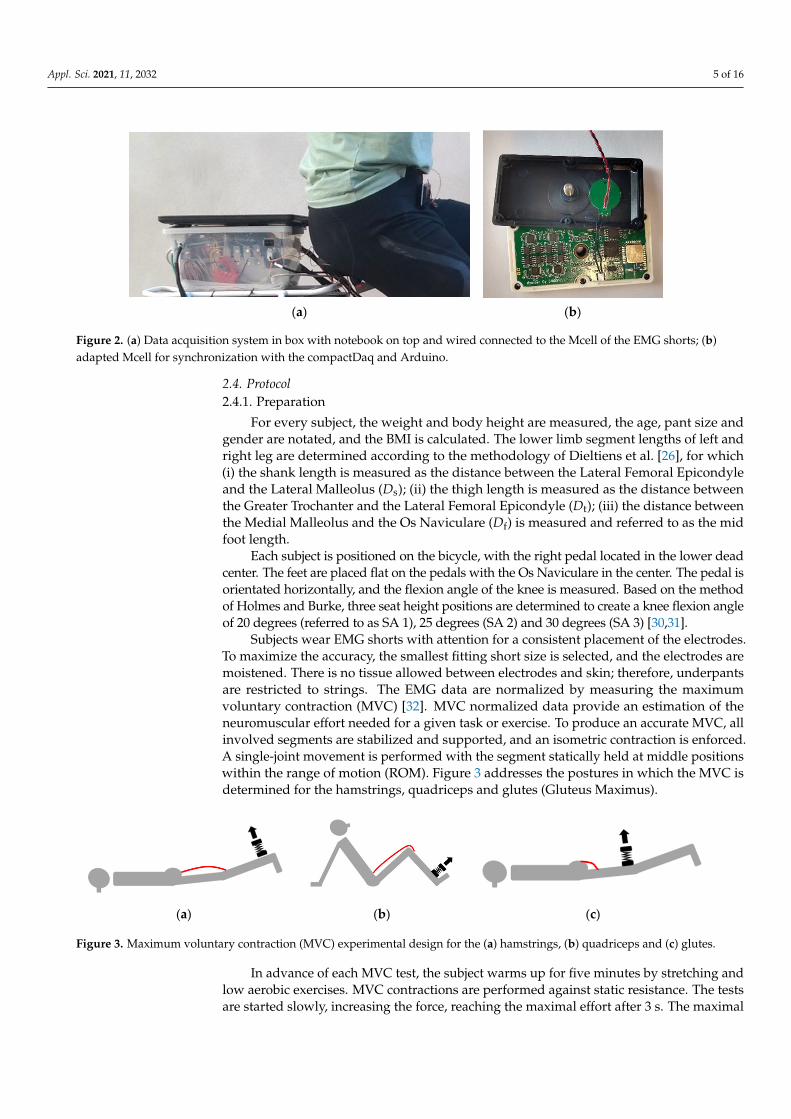
Figure 2. (a) Data acquisition system in box with notebook on top and wired connected to the Mcell of the EMG shorts; (b) adapted Mcell for synchronization with the compactDaq and Arduino.
2.4. Protocol 2.4.1. Preparation
For every subject, the weight and body height are measured, the age, pant size and gender are notated, and the BMI is calculated. The lower limb segment lengths of left and right leg are determined according to the methodology of Dieltiens et al. [26], for which (i) the shank length is measured as the distance between the Lateral Femoral Epicondyle and the Lateral Malleolus (Ds); (ii) the thigh length is measured as the distance between the Greater Trochanter and the Lateral Femoral Epicondyle (Dt); (iii) the distance between the Medial Malleolus and the Os Naviculare (Df) is measured and referred to as the mid foot length.
Each subject is positioned on the bicycle, with the right pedal located in the lower dead center. The feet are placed flat on the pedals with the Os Naviculare in the center. The pedal is orientated horizontally, and the flexion angle of the knee is measured. Based on the method of Holmes and Burke, three seat height positions are determined to create a knee flexion angle of 20 degrees (referred to as SA 1), 25 degrees (SA 2) and 30 degrees (SA 3) [30,31].
Subjects wear EMG shorts with attention for a consistent placement of the electrodes. To maximize the accuracy, the smallest fitting short size is selected, and the electrodes are moistened. There is no tissue allowed between electrodes and skin; therefore, underpants are restricted to strings. The EMG data are normalized by measuring the maximum vol-untary contraction (MVC) [32]. MVC normalized data provide an estimation of the neu-romuscular effort needed for a given task or exercise. To produce an accurate MVC, all involved segments are stabilized and supported, and an isometric contraction is enforced. A single-joint movement is performed with the segment statically held at middle positions within the range of motion (ROM). Figure 3 addresses the postures in which the MVC is determined for the hamstrings, quadriceps and glutes (Gluteus Maximus).
(a) (b) (c)
Figure 3. Maximum voluntary contraction (MVC) experimental design for the (a) hamstrings, (b) quadriceps and (c) glutes.
In advance of each MVC test, the subject warms up for five minutes by stretching and low aerobic exercises. MVC contractions are performed against static resistance. The tests
Figure 2. (a) Data acquisition system in box with notebook on top and wired connected to the Mcell of the EMG shorts; (b)adapted Mcell for synchronization with the compactDaq and Arduino.
2.4. Protocol2.4.1. Preparation
For every subject, the weight and body height are measured, the age, pant size andgender are notated, and the BMI is calculated. The lower limb segment lengths of left andright leg are determined according to the methodology of Dieltiens et al. [26], for which(i) the shank length is measured as the distance between the Lateral Femoral Epicondyleand the Lateral Malleolus (Ds); (ii) the thigh length is measured as the distance betweenthe Greater Trochanter and the Lateral Femoral Epicondyle (Dt); (iii) the distance betweenthe Medial Malleolus and the Os Naviculare (Df) is measured and referred to as the midfoot length.
Each subject is positioned on the bicycle, with the right pedal located in the lower deadcenter. The feet are placed flat on the pedals with the Os Naviculare in the center. The pedal isorientated horizontally, and the flexion angle of the knee is measured. Based on the methodof Holmes and Burke, three seat height positions are determined to create a knee flexion angleof 20 degrees (referred to as SA 1), 25 degrees (SA 2) and 30 degrees (SA 3) [30,31].
Subjects wear EMG shorts with attention for a consistent placement of the electrodes.To maximize the accuracy, the smallest fitting short size is selected, and the electrodes aremoistened. There is no tissue allowed between electrodes and skin; therefore, underpantsare restricted to strings. The EMG data are normalized by measuring the maximumvoluntary contraction (MVC) [32]. MVC normalized data provide an estimation of theneuromuscular effort needed for a given task or exercise. To produce an accurate MVC, allinvolved segments are stabilized and supported, and an isometric contraction is enforced.A single-joint movement is performed with the segment statically held at middle positionswithin the range of motion (ROM). Figure 3 addresses the postures in which the MVC isdetermined for the hamstrings, quadriceps and glutes (Gluteus Maximus).
Appl. Sci. 2021, 11, 2032 5 of 16
(a) (b)
Figure 2. (a) Data acquisition system in box with notebook on top and wired connected to the Mcell of the EMG shorts; (b) adapted Mcell for synchronization with the compactDaq and Arduino.
2.4. Protocol 2.4.1. Preparation
For every subject, the weight and body height are measured, the age, pant size and gender are notated, and the BMI is calculated. The lower limb segment lengths of left and right leg are determined according to the methodology of Dieltiens et al. [26], for which (i) the shank length is measured as the distance between the Lateral Femoral Epicondyle and the Lateral Malleolus (Ds); (ii) the thigh length is measured as the distance between the Greater Trochanter and the Lateral Femoral Epicondyle (Dt); (iii) the distance between the Medial Malleolus and the Os Naviculare (Df) is measured and referred to as the mid foot length.
Each subject is positioned on the bicycle, with the right pedal located in the lower dead center. The feet are placed flat on the pedals with the Os Naviculare in the center. The pedal is orientated horizontally, and the flexion angle of the knee is measured. Based on the method of Holmes and Burke, three seat height positions are determined to create a knee flexion angle of 20 degrees (referred to as SA 1), 25 degrees (SA 2) and 30 degrees (SA 3) [30,31].
Subjects wear EMG shorts with attention for a consistent placement of the electrodes. To maximize the accuracy, the smallest fitting short size is selected, and the electrodes are moistened. There is no tissue allowed between electrodes and skin; therefore, underpants are restricted to strings. The EMG data are normalized by measuring the maximum vol-untary contraction (MVC) [32]. MVC normalized data provide an estimation of the neu-romuscular effort needed for a given task or exercise. To produce an accurate MVC, all involved segments are stabilized and supported, and an isometric contraction is enforced. A single-joint movement is performed with the segment statically held at middle positions within the range of motion (ROM). Figure 3 addresses the postures in which the MVC is determined for the hamstrings, quadriceps and glutes (Gluteus Maximus).
(a) (b) (c)
Figure 3. Maximum voluntary contraction (MVC) experimental design for the (a) hamstrings, (b) quadriceps and (c) glutes.
In advance of each MVC test, the subject warms up for five minutes by stretching and low aerobic exercises. MVC contractions are performed against static resistance. The tests
Figure 3. Maximum voluntary contraction (MVC) experimental design for the (a) hamstrings, (b) quadriceps and (c) glutes.
In advance of each MVC test, the subject warms up for five minutes by stretching andlow aerobic exercises. MVC contractions are performed against static resistance. The testsare started slowly, increasing the force, reaching the maximal effort after 3 s. The maximal

Appl. Sci. 2021, 11, 2032 6 of 16
force is held for 3 s and the subjects relax promptly within 3 s. The test is repeated 4 timeswith a pausing period of 60 s in between.
2.4.2. Tests
The seat height is set to SA 1. The subject cycles 3 trials of 5 min. In the first trial, thebicycle is set to PA 1, in the second trial PA 2 and in the third trial PA 3. The test trials arerepeated with SA 2 and SA 3. In total, 9 trials are cycled. The subject cycles at a steadyand constant speed of 20 km/h without changing the gears. The feet are placed flat on thepedals with the Os Naviculare in the center. Both hands are on the steer at all times. Thesubject only pedals when riding straight. In turns or during maneuvering, the subject stopspedaling and lets the bicycle roll. A researcher cycles next to the subject to give instructionand to correct the subject when necessary.
2.5. Data Processing
The data are recorded and analyzed with Matlab. The datasets are synchronized byaligning the Arduino timing with the compact DAQ and the EMG shorts. Erroneous datacaused by turning, pedaling backwards, no pedaling, or pedaling unsteadily are removedbased on the encoder data. The following requirements are made to save the data: a minimumof five consecutive pedal cycles need to be counted, the deviation between the encoder peakswithin the pedal cycle (deviation in cadence) is less than 5% and the cycling speed is 20 km/hwith a maximal deviation of 2 km/h. No individual curves are analyzed. All cycles areaveraged to an ensemble average curve (AVC), related to the pedal cycle, for which theoriginal time scale is converted to a percent of a pedal cycle ranging from 0 to 100%.
2.5.1. Load Cells
Raw strain load signals are filtered with a third order Butterworth low-pass filter andresolved in x, y and z components utilizing the Least Square Global Regression method [33].As seen in Figure 4a, initially, the reference frames of the seat, steer and pedals are local. Thereference frames of the pedals vary relative to their pedal angle. The local reference framesof the steer and seat are transformed parallel to the bicycle reference frame. Based on thedata of the magnetometer and the encoder, the rotating reference frames of the pedalsare continuously transformed to the fixed bicycle reference frame, as seen in Figure 4b.The anterior force follows the x-direction, the normal force follows the z-direction and thelateral force follows the y-direction. The axial moment is defined by the x–y plane, thefrontal moment by the y–z plane and the sagittal moment by the x–z plane.
Appl. Sci. 2021, 11, 2032 6 of 16
are started slowly, increasing the force, reaching the maximal effort after 3 s. The maximal force is held for 3 s and the subjects relax promptly within 3 s. The test is repeated 4 times with a pausing period of 60 s in between.
2.4.2. Tests The seat height is set to SA 1. The subject cycles 3 trials of 5 min. In the first trial, the
bicycle is set to PA 1, in the second trial PA 2 and in the third trial PA 3. The test trials are repeated with SA 2 and SA 3. In total, 9 trials are cycled. The subject cycles at a steady and constant speed of 20 km/h without changing the gears. The feet are placed flat on the ped-als with the Os Naviculare in the center. Both hands are on the steer at all times. The sub-ject only pedals when riding straight. In turns or during maneuvering, the subject stops pedaling and lets the bicycle roll. A researcher cycles next to the subject to give instruction and to correct the subject when necessary.
2.5. Data Processing The data are recorded and analyzed with Matlab. The datasets are synchronized by
aligning the Arduino timing with the compact DAQ and the EMG shorts. Erroneous data caused by turning, pedaling backwards, no pedaling, or pedaling unsteadily are removed based on the encoder data. The following requirements are made to save the data: a min-imum of five consecutive pedal cycles need to be counted, the deviation between the en-coder peaks within the pedal cycle (deviation in cadence) is less than 5% and the cycling speed is 20 km/h with a maximal deviation of 2 km/h. No individual curves are analyzed. All cycles are averaged to an ensemble average curve (AVC), related to the pedal cycle, for which the original time scale is converted to a percent of a pedal cycle ranging from 0 to 100%.
2.5.1. Load Cells Raw strain load signals are filtered with a third order Butterworth low-pass filter and
resolved in x, y and z components utilizing the Least Square Global Regression method [33]. As seen in Figure 4a, initially, the reference frames of the seat, steer and pedals are local. The reference frames of the pedals vary relative to their pedal angle. The local ref-erence frames of the steer and seat are transformed parallel to the bicycle reference frame. Based on the data of the magnetometer and the encoder, the rotating reference frames of the pedals are continuously transformed to the fixed bicycle reference frame, as seen in Figure 4b. The anterior force follows the x-direction, the normal force follows the z-direc-tion and the lateral force follows the y-direction. The axial moment is defined by the x–y plane, the frontal moment by the y–z plane and the sagittal moment by the x–z plane.
(a) (b)
Figure 4. Transformation of local reference frames (a) to a global reference frame (b).
Figure 4. Transformation of local reference frames (a) to a global reference frame (b).
2.5.2. Joint Loading
The lower limb motion of the bicycle–rider system is modelled as a five-bar linkagesystem, based on the biomechanical model of Hull and Jorge [5], presented in Figure 5.The model singularly considers motion in the sagittal plane, neglecting lateral and axialmovement. The bars represent the cyclist’s thigh defined as Dt, shank defined as Ds,

Appl. Sci. 2021, 11, 2032 7 of 16
mid foot defined as Df, bicycle’s bottom bracket and the frame as a fixed link. The pivotpoints are located at the bottom bracket axis (o), pedal axis (p), ankle (a), knee (k) and hip(h). The hip is assumed to be fixed in (h) and the knee joint extends no further than thestraight leg position. To specify the linkage configuration, the angular position, velocityand acceleration of the bottom bracket and pedal relative to the pedal spindle are necessaryinputs. Based on the linkage configuration and the pedal loading, the anterior and normalforces are calculated in the hips, knees and ankles.
Appl. Sci. 2021, 11, 2032 7 of 16
2.5.2. Joint Loading The lower limb motion of the bicycle–rider system is modelled as a five-bar linkage
system, based on the biomechanical model of Hull and Jorge [5], presented in Figure 5. The model singularly considers motion in the sagittal plane, neglecting lateral and axial movement. The bars represent the cyclist’s thigh defined as Dt, shank defined as Ds, mid foot defined as Df, bicycle’s bottom bracket and the frame as a fixed link. The pivot points are located at the bottom bracket axis (o), pedal axis (p), ankle (a), knee (k) and hip (h). The hip is assumed to be fixed in (h) and the knee joint extends no further than the straight leg position. To specify the linkage configuration, the angular position, velocity and ac-celeration of the bottom bracket and pedal relative to the pedal spindle are necessary in-puts. Based on the linkage configuration and the pedal loading, the anterior and normal forces are calculated in the hips, knees and ankles.
Figure 5. Schematic overview of the bar linkage system from Hull et al.
The kinematics are described in the author’s previous work [26]. The kinetics of the hip, knee and ankle are described by Equations (1)–(9).
Ankle: 𝑭𝒂𝒙 = 𝑚 𝑨𝒇𝒙 + 𝑹𝒏𝑠𝑖𝑛𝛼 + 𝑹𝒕𝑐𝑜𝑠𝛼 (1)𝑭𝒂𝒛 = −𝑚 𝑨𝒇𝒛 + 𝑔 − 𝑹𝒏𝑐𝑜𝑠𝛼 + 𝑹𝒕𝑠𝑖𝑛𝛼 (2)𝑴𝒂 = +𝐼 𝛽 − 𝑚 𝑨𝒇𝒙𝐶𝐺 𝑠𝑖𝑛𝛽 + 𝑨𝒇𝒛𝐶𝐺 𝑐𝑜𝑠𝛽 − 𝑚 𝑔𝐶𝐺 𝑐𝑜𝑠𝛽− 𝐿 𝑐𝑜𝑠𝛽(𝑹𝒏𝑐𝑜𝑠𝛼 − 𝑹𝒕𝑠𝑖𝑛𝛼) − 𝐿 𝑠𝑖𝑛𝛽(𝑹𝒕𝑐𝑜𝑠𝛼 + 𝑹𝒏𝑠𝑖𝑛𝛼) (3)
Knee: 𝑭𝒌𝒙 = 𝑚 𝑨𝒔𝒙 + 𝑭𝒂𝒙 (4)𝑭𝒌𝒛 = −𝑚 ( 𝑨𝒔𝒛 + 𝑔) − 𝑭𝒂𝒛 (5)
Figure 5. Schematic overview of the bar linkage system from Hull et al.
The kinematics are described in the author’s previous work [26]. The kinetics of thehip, knee and ankle are described by Equations (1)–(9).
Ankle:Fax = m f Afx + Rnsinα + Rtcosα (1)
Faz = −m f(Afz + g
)− Rncosα + Rtsinα (2)
Ma = +I f..β − m f
(AfxCG f sinβ + AfzCG f cosβ
)− m f gCG f cosβ
−L f cosβ(Rncosα − Rtsinα)− L f sinβ(Rtcosα + Rnsinα)(3)
Knee:Fkx = ms Asx + Fax (4)
Fkz = −ms( Asz + g)− Faz (5)
Mk = −Ma − Is..Φ − ms(AszCGssinΦ − AszCGscosΦ)− FaxLssinΦ
+FazLscosΦ + msgCGscosΦ(6)
Hip:Fhx = mt Atx + Fkx (7)
Fhz = −mt( Atz + g)− Fkz (8)
Mh = −Mk − It..
γ3 − mt(AtxCGtcosγ3 + AtzCGtsinγ3)− Fkxcosγ3−FkzLtsinγ3 − mtgCGtcosγ3
(9)

Appl. Sci. 2021, 11, 2032 8 of 16
For which x and z refer to the direction. a, k and h refer to the joint (ankle, knee, hip).f , s, and t refer to the body parts (foot, shank, thigh). Mi is the moment, Fi is the force, Rnis the normal reaction force, Rt is the tangential reaction force, Ai is the acceleration, mi isthe mass, Li is the length and CGi is the center of gravity.
2.5.3. Muscle Activity
Raw EMG signals are exported from muscle monitor into Matlab. The quality of theMVC signals is controlled based on the noise of the baseline signal when the muscles arefully relaxed. The following requirements are made: the amplitude spikes cannot exceed15 µV, and the average noise level cannot exceed 5 µV. The baseline has to stay at the samelevel before and after contractions. When the muscles are contracted, the EMG signalcan reach up to maximally 5000 µV. The muscle monitor automatically corrects baselineoffsets. Additionally, it reflects all negative amplitudes by the baseline to positives ones.The EMG signals are normalized to the MVC, which is calculated as the mean amplitude ofthe highest signal portion with a duration of 500 ms. It is determined utilizing the movingaverage technique. Due to the neural interplay and coordination between muscle agonistsand antagonists, EMG curves present great standard deviation ranges and can only beinterpreted after averaging out multiple cycles to an AVC.
3. Results3.1. Variables
Table 2 presents an overview of the measured variables. For the seat and steer, threedimensional forces and moments are recorded. For both pedals, the three-dimensionalforces are measured, and the forces and moments of the ankle, knee and hip joints of bothlegs are derived in the sagittal plane. The muscle activity is determined for the quadriceps,hamstrings and glutes of both legs. All parameters regarding the legs are described for theright leg.
Table 2. List of analyzed variables.
Variables
Right Quadricep Activity (%max) Right Hamstring Activity (%max) Right Glute Activity (%max)
Right Ankle Loading:Normal force (N)Anterior force (N)Sagittal moment (N·m)
Right Knee Loading:Normal force (N)Anterior force (N)Sagittal moment (N·m)
Right Hip Loading:Normal force (N)Anterior force (N)Sagittal moment (N·m)
Seat Loading:Normal force (N)Anterior force (N)Lateral force (N)Axial moment (N·m)Frontal moment (N·m)Sagittal moment (N·m)
Steer Loading:Normal force (N)Anterior force (N)Lateral force (N)Axial moment (N·m)Frontal moment (N·m)Sagittal moment (N·m)
Right Pedal Loading:Normal force (N)Anterior force (N)Lateral force (N)
3.2. Visual Evaluation AVCs
AVCs and their standard deviations are determined for all variables in every setup(PA 1–3, SA 1–3). PA 2 and PA 3 are plotted combined with PA 1, similarly SA 2 and SA3 are plotted together with SA 1 for a visual evaluation. Figure 6 is an example of theAVC for PA 1 combined with PA 2 and PA 3. As seen, the influence by the level of PA isdependent of the phase in the pedal cycle. Four characteristic phases within the pedal cycleare selected to compare the data statistically, namely, the upper dead center (0%), the centerof the downstroke phase, addressed as the power phase (25%), the lower dead center (50%)and the center of the upstroke phase, addressed as the recovery phase (75%).

Appl. Sci. 2021, 11, 2032 9 of 16
Figure 6. Ensemble average curve (AVC) of the quadriceps for pedal assistance (PA) 1 and PA 2 (a); and for PA 1 and PA 3 (b).
3.3. Statistical Analysis
A factorial ANOVA is conducted to compare the main effects of (i) different levels ofpedal assistance, (ii) different levels of seat heights, and (iii) the interaction effect betweenboth on the variables in the four characteristic phases. The ANOVA reveals that onlythe level of PA significantly influences the variables; there are no significant influencesdetermined for the seat height. For none of the variables, an interaction effect is foundbetween the level of PA and the seat height. The variables presenting a significant effect(with p < 0.05) are addressed in Figures 7–10. Mean significant differences of the AVCsare presented for the four phases for PA 2 and PA 3, relatively to PA 1. When PA 3 issignificant, insignificant differences of PA 2 are also presented, though they have a wideroutline. All values are percentages with level 1 as the base line. Error bars are calculated asthe percentual ratio between the local standard deviation and the peak to peak amplitudeof the whole cycle. Not all visually observed differences are described in the ANOVA dueto the high subject-between variance. For this reason, the visually observable differencesare also discussed.
3.3.1. PA in the Upper Dead Center (Phase in Pedal Cycle = 0%)
The mean differences of the AVCs of the influence of PA in the upper dead center areaddressed by Figure 7. A significant increase in the values due to PA 3 is observed forthe steer normal force of 25.5% (18.8 N) and for the seat anterior force of 16.3% (−17.6 N).A significant decrease in the values due to PA 3 is observed for the hip sagittal moment,hip anterior force, knee sagittal moment, knee anterior force, ankle anterior force, seatlateral force, steer lateral force, steer frontal moment, steer axial moment, the hamstringactivity and the quadricep activity of −158% (−55.6 N·m), −83,1% (96.6 N), −41.3%(−21.1 N·m), −84.5% (96.3 N), −83.8% (96.1 N), −120.5% (−15.7 N), −90.1% (−9.2 N),of −67% (−0.9 N·m), −69.5% (3.8 N·m), −51% (−9.7% max) and −64.2% (−34.5% max),respectively. A significant decrease in the values due to PA 2 is observed for the hipanterior force, knee sagittal moment, knee anterior force, ankle anterior force, steer lateralforce, steer frontal moment, hamstring and quadriceps activity of −45% (52.3 N), −29.5%(−15.1 N·m), −45.8% (52.2 N), −45.4% (52 N), −74.9% (−7.7 N), −44.3% (−0.6 N·m),

Appl. Sci. 2021, 11, 2032 10 of 16
−27.9% (−5.3% max) and −38.3% (−20.6% max), respectively. Other differences were notsignificant because of the high standard deviations of the data.
Figure 7. Significant differences based on the level of PA for the upper dead center.
Figure 8. Significant differences based on the level of PA for the power phase.

Appl. Sci. 2021, 11, 2032 11 of 16
Figure 9. Significant differences based on the level of PA for the lower dead center.
Figure 10. Significant differences based on the level of PA for the recovery phase.
3.3.2. PA in the Power Phase (Phase in Pedal Cycle = 25%)
The mean differences of the AVCs of the influence of PA in the power phase areaddressed by Figure 8. A significant increase for the values due to PA 3 is observed for thesteer normal force of 46.9% (31.6 N). A significant decrease due to PA 3 is observed for theseat lateral force, ankle sagittal moment, steer lateral force, steer frontal moment, steeraxialmoment, the pedal lateral force, the pedal normal force, the glute activity, the hamstringactivity and the quadricep activity of −116% (−20.5 N), −64.3% (−3.6 N·m), −88.4%(−9.6 N), −57.4% (−1 N·m), −67.4% (4.2 N·m), −66.8% (−8.5 N), −63.2% (−118.8 N),−55.5% (−12.1%max), −48.9% (−12.8%max) and −68.5% (−31.9%max), respectively. Asignificant increase in the values due to PA 2 is observed for the steer normal force of 28.1%(18.9 N). Significant decreases due to PA 2 are observed for the steer lateral force, steerfrontal moment, ankle sagittal moment, the pedal normal force, the glute activity and thequadriceps activity of −72.9% (−7.9 N), −37.7% (−0.7 N·m), −34% (−1.9 N·m), −35.8%(−67.3 N), −38.3% (−8.3%max) and −44.3% (−20.6%max), respectively.
3.3.3. PA in the Lower Dead Center (Phase in Pedal Cycle = 50%)
The mean differences of the AVCs of the influence of PA in the lower dead centerare addressed by Figure 9. A significant increase in the values due to PA 3 is observedfor the seat anterior force of 15% (−16.2 N). A significant decrease in the values due toPA 3 is observed for the steer frontal moment, steer axial moment and the hamstringactivity of −65.8% (0.7 N·m), −50.6% (−3.6 N·m) and −52.2% (−18.9%max), respectively.A significant decrease in the values due to PA 2 is observed for the steer frontal moment,steer axial moment and the hamstring activity of −40.2% (0.4 N·m), −34.2% (−2.4 N·m)and −32.2% (−11.7%max), respectively.

Appl. Sci. 2021, 11, 2032 12 of 16
3.3.4. PA in the Recovery Phase (Phase in Pedal Cycle = 75%)
The mean differences of the AVCs of the influence of PA in the recovery phase areaddressed by Figure 10. A significant increase in the values due to PA 3 is observed forthe steer normal force of 27.1% (21.6 N). A significant decrease in the values due to PA 3is observed for the seat frontal moment, steer frontal moment and steer axial moment of−116% (0.5 N·m), −60.5% (1 N·m) and −55.4% (−4.8 N·m), respectively. A significantincrease in the values due to PA 2 is observed for the steer normal force of 15.6% (12.4 N).A significant decrease in the values due to PA 2 is observed for the seat frontal momentand steer axial moment of −63.7% (0.3 N·m) and −37.1% (−3.2 N·m), respectively.
4. Discussion
Changing PA when cycling an e-bike does not only influence the loading exerted bythe upper leg muscles but also steer and seat loading. In general, the level of PA doesnot change the shape of an entire pattern. Significant differences are found, though onlyin certain phases of the pedal cycle. As most power is exerted in the downstroke phase(from 0 degrees to 150 degrees), most significant differences are found in the upper deadcenter and power phase. For all analyzed variables, the significant differences escalatein magnitude in function of the amount of pedal assistance. Furthermore, the variationincreases in function of the amount of pedal assistance. This is in line with the literatureas PA reduces the effort and an increased effort improves the symmetry of pedalingkinetics [34].
The phase in the pedal cycle is addressed from the perspective of the right pedal. Theupper dead center and power phase of the right pedal are, respectively, the lower deadcenter and recovery phase of the left pedal. For this reason, seat and steer AVCs are expectedto be symmetric between the two halves of the pedal cycle. Significant differences that arepresent in the upper dead center or power phase should also be present in, respectively,the lower dead center or the recovery phase. Though, as seen in the Section 3, this is notthe case. Only the steer axial moment presents significant differences in opposing phases.When analyzing the AVCs, variation is significantly higher for the upper dead center andpower phase of the left pedal, which hinders the significance of differences due to thelevel of pedal assistance. In total, 90% of the tested subjects are right-legged, utilizing theirright leg as the leader and the left as the follower. Research states that increased pedalingeffort demands a more stable technique and results in a reduced variability [35]. Therefore,differences due to PA should be visible in both opposing phases, though will not always besignificant. Furthermore, multiple subjects are compared to each other, which increasesthe variation as each individual has his own cycling technique. Visual differences can beclinically relevant, even though they are not significantly relevant, and will be discussed inthis section.
Lateral loading originates from the pedaling movement and is predominantly gen-erated in the downstroke phase. When generating the push on the pedals, the mostcomfortable power exertion direction is enforced, resulting in a small lateral component.PA reduces the power exertion during the push and, therefore, also the lateral component.In the power phase, a significant decrease in the lateral pedal force is observed due to PA(maximally −66.8%). Lateral seat loading patterns are induced by the pelvis movement.Towards the downstroke phase, the pelvis rotates internally and laterally, causing the hipto translate anteriorly and inferiorly. The movement is presented by the right leg in thefirst half of the pedal cycle and by the left leg in the second half of the pedal cycle, resultingin locally increasing lateral seat forces. PA significantly decreases the lateral seat forcesmaximally in the upper dead center (maximally −120.5%) followed by the power phase(maximally −116%). The decrease in the left leg is observable in the visual evaluation,though not significant due to high variation. Lateral steer-loading patterns are induced bytrunk motion in the axial plane during pedaling. The trunk rotates medially towards thedownstroke phase, generating a pull on the allied handle and a push on the opposing one,resulting in locally increasing lateral steer forces and axial moments. Increasing the level

Appl. Sci. 2021, 11, 2032 13 of 16
of PA, decreases all steer axial moments significantly (maximally −69.5% for the upperdead center, maximally −67.4% for the power phase, maximally −50.6% for the lowerdead center and maximally −55.4% for the recovery phase), the difference is the largestin the first half of the pedal cycle as the right leg is dominant. The lateral force presentsa significant decrease maximally in the upper dead center (maximally −90.1%) followedby the power phase (maximally −88.3%). Decreases in the second half of the pedal cycleare visually observable though not significant due to high variation. The findings suggestthat lateral load components reduce in function of the level of pedal assistance, resultingin a reduced pelvis movement and axial trunk movement. Costes et al. state that theaccelerations of the trunk center of mass, hips and shoulders increases when cycling athigher workloads [36]. As PA decreases the workload, the results are in line.
The rider’s weight is distributed over all points of contact between the bicycle andcyclist. Increasing the level of PA decreases the normal pedal force significantly in thepower phase (maximally −63.3%) and insignificantly though observable in the recoveryphase. The variation in the recovery phase is notably higher as a lower workload results inhigher variation [35]. The normal steer forces are significantly increased in the upper deadcenter (maximally 25.5%), power phase (maximally 46.9%), recovery phase (maximally27.1%) and a small insignificant increase is observed in the lower dead center. Decreases inseat loading are visually observable (maximally −10% over the whole cycle) though notsignificant due to high variation (maximally 40%). An ANOVA was performed with loadvalues adjusted to the weight of the rider to analyze if the difference in body weight isthe reason of the high variation. The variation is uninfluenced by the rider’s weight, norby inter-individual differences as gender, age, experience or flexibility level. All subjectspresent a very high within-subject variation, uninfluenced by the level of pedal assistance,implying they tend to hop around a central value. The findings suggest that the weightdistribution over all points of contact between bicycle and cyclist is influenced by the levelof pedal assistance. When the reaction forces on the pedals decrease due to an enlargedlevel of pedal assistance, the body weight is more supported by seat and steer. The samefindings are presented by Stone and Hull for high workload levels [2].
Primary movements during pedaling are hip and knee extension in the downstrokephase (0–180 degrees) along with hip flexion in the backstroke phase (180–360 degrees).Knee flexion is less pronounced as it is mostly generated by the knee extension of theleg on the opposing pedal. The glutes extend the hip and are generally active from theupper dead center until the power phase [37]. Due to PA, an insignificant—though clearlyvisible—decrease in glutes activity is observed in the upper dead center and a significantdecrease in the power phase (maximally −55.5%). The quadriceps extend the knee andare generally active from the upper dead center until the power phase [38]. Due to PA, asignificant decrease in quadriceps activity is observed in the upper dead center (maximally−64.2%) and in the power phase (maximally −44.3%). The hamstrings are the knee flexorsand hip extensors and are active through the whole pedal cycle as they also support theknee extensors to regulate the net joint moments. The literature presents varying results onthe activation of the hamstrings. Ercison et al. presented activation between 150 degreesand 270 degrees [20], while Dorel et al. presented activation between 60 degrees and240 degrees [37]. In this research, the hamstrings are singularly inactive in the recoveryphase. An insignificant, though visually noticeable, decrease is observed in the lower deadcenter and a significant decrease is observed in the upper dead center (maximally 51%)and the power phase (maximally −48.9%). In the phases where muscles are most active, adecreased activity level in function of the amount of PA is observed. In the phases wheremuscles are less active, they present no observable differences.
Significant decreases in the joint forces are found in the upper dead center. The ankle,knee and hip anterior forces are significantly decreased to a similar extent (maximally83.3%, −84.5%, −83%, respectively). The ankle plantar flexion moment is significantlydecreased in the power phase, visually decreased in the lower dead center and visuallyincreased in the upper dead center. Less moment is transferred to the ankle when the foot

Appl. Sci. 2021, 11, 2032 14 of 16
is actively pushing downwards, and more moment is transferred to the ankle when the footis passively pushed upwards. Accordingly, the knee and hip flexion moments in the upperdead center are significantly decreased (maximally −41.3% and −158%, respectively), andthe knee and hip extension moments in the lower dead center are visually increased. Ingeneral, due to PA, the significance of the different phases within the pedal cycle is reduced.The motor generates a constant propulsion moment to the pedals, reducing the effortneeded to (i) cross the dead centers and (ii) lift the foot in the upstroke phase. This couldresult in a more limited pedal movement for which the cyclist does not distribute his/hereffort over the whole pedal cycle but focusses on the most comfortable phase of the pedalcycle, namely, the extension in the downstroke phase of the pedal cycle.
This concept presents itself furthermore in the anterior forces. Due to PA, the posteriorseat forces are significantly increased in the upper dead center (maximally 16.3%) andlower dead center (maximally 15.1%) and visually in the other phases. The posterior steerforces are visually decreased throughout the whole pedal cycle. The findings suggest thatthe cyclist pulls less on the steer and has a more bent forward posture, which is typicallyfor the lower limb extension movement.
Some of the findings present large percentage differences, though are mechanicallyand clinically not relevant as the actual values are small. This is the case for the steeraxial moment (maximal difference of 4.8 N·m) steer frontal moment (maximal differenceof 4.8 N·m), seat frontal moment (maximal difference of 4.7 N·m) and the sagittal anklemoment (maximal difference of 3.6 N·m). The normal and anterior forces present largeactual differences which are interesting for mechanical analysis such as electric bicycleframe design. The differences in the normal and lateral forces are clinically interesting asthese variables are related to overuse injuries as wrist, bottom, hip and knee [38–40]. PAinfluences joint loading possibly in a way that the cyclist applies most effort on the mostcomfortable phase of the pedal cycle and pedal forces and muscle activity are reduced.Therefore, an electric bicycle could be a valuable rehabilitation tool for hip and knee patientsand a transportation means for the physically challenged. The normal and posterior forceson the steer and seat increase in function of the level of PA which could imply that electricbicycles are less favorable for people who suffer from wrist, bottom or lower back pain.
5. Conclusions
The results of this study revealed that different levels of SA presented no significantinfluences on the cycling interaction, while different levels of PA presented multiple. Nointeraction effect was found between both parameters. Most of the significant differencesdue to PA were found in the upper dead center and power phase, where most pedalingpower was exerted. The variation is higher in the lower dead center and recovery phase.A higher amount of PA increases the magnitude of significant differences and the overallvariation. Lateral loading of the steer, seat and pedals is reduced in function of the levelof PA, suggesting a reduced pelvis and axial trunk movement. The normal forces onthe pedals are decreased in function of the level of PA and the normal seat and steerforces are increased. The reaction forces on the pedals are smaller and the body weightis more supported by seat and steer. In the phases that the muscles are most active, themuscles present a decreased activity level in function of the amount of PA. Joint loadingalso presents local increases as local decreases in function of the amount of pedal assistance.The anterior forces suggest a more bent forward posture with less pulling on the steer. Theidea is thus proposed that PA limits the flexion extension action to increased extensionaction. Results suggest that electric PA could be a valuable rehabilitation tool for hip andknee patients.
Author Contributions: Conceptualization, S.D.; Data curation, C.J.-P. and S.V.L.; Formal analysis,S.D. and C.J.-P.; Funding acquisition, K.C.; Investigation, S.D.; Methodology, S.D., C.J.-P. and K.C.;Project administration, S.D. and K.C.; Resources, E.D.; Software, C.J.-P., S.V.L. and J.D.; Supervision,K.C. and E.D.; Validation, S.D.; Visualization, S.D.; Writing—original draft, S.D.; Writing—review &

Appl. Sci. 2021, 11, 2032 15 of 16
editing, C.J.-P., S.V.L., J.D., K.C. and E.D. All authors have read and agreed to the published versionof the manuscript.
Funding: This research received no external funding.
Institutional Review Board Statement: The study was conducted according to the guidelines ofthe Declaration of Helsinki and approved by the Ethical Committee research of UZ/KU Leuven.(protocol code S63553, date of acceptance: 16/03/2020).
Informed Consent Statement: Informed consent was obtained from all subjects involved in the study.
Conflicts of Interest: The authors declare no conflict of interest.
References1. Huertas-Leyva, P.; Dozza, M.; Baldanzini, N. Investigating cycling kinematics and braking maneuvers in the real world: E-bikes
make cyclists move faster, brake harder, and experience new conflicts. Transp. Res. 2018, 54, 211–222. [CrossRef]2. Stone, C.; Hull, M.L. The effect of rider weight on rider-induced loads during common cycling situations. J. Biomech. 1995, 4,
365–375. [CrossRef]3. Hull, M.L.; Davis, R.R. Measurement of pedal loading in bicycling: I. Instrumentation. J. Biomech. 1981, 14, 843–856. [CrossRef]4. Hull, M.L.; Bolourchi, F. Contributions of rider induced loads to bicycle frame stresses. J. Strain Anal. 1988, 23, 105–114. [CrossRef]5. Hull, M.; Jorge, M. A method for biomechanical analysis of bicycle pedadalling. J. Biomech. 1985, 18, 631–644. [CrossRef]6. Ericson, M.O.; Nisell, R.; Ekholm, J. Varus and valgus loads on the knee jointduring ergometer cycling. Scand. J. Sports Sci. 1984,
6, 39–45.7. Ruby, P.; Hull, M.L.; Jenkins, D.; Kirby, K. Effect of anatomy on knee joint loads during seated cycling. J. Biomech. 1992, 25,
1195–1207. [CrossRef]8. Gregor, R.J.; Cavanaegh, P.R.; LaFortune, M. Knee flexor moments during propulsion in cycling: A creative solution to Lombard’s
paradox. J. Biomech. 1985, 18, 307–316. [CrossRef]9. Gonzalez, H.; Hull, M.L. Multivariable optimization of cycling biomechanics. J. Biomech. 1989, 22, 1151–1161. [CrossRef]10. Neptune, R.R.; Hull, M.L. A theoretical analysis of preferred rate selection in endurance cycling. J. Biomech. 1999, 32, 409–415.
[CrossRef]11. Marsh, A.P.; Martin, P.E.; Sanderson, D.J. Is a joint moment-based cost function associated with preferred cycling cadence?
J. Biomech. 2000, 33, 173–180. [CrossRef]12. Ericson, M.; Bratt, A.; Nisell, R.; Nemeth, G.; Ekholm, J. Load moments about the hip and knee joints during ergometer cycling.
Scand. J. Rehabil. Med. 1986, 18, 165–172.13. Horscroft, R.; Davidson, C.J.; McDaniel, J.; Wagner, B.M.; Martin, J. Effects of saddle height on joint power distribution. Med. Sci.
Sport Exerc. 2003, 35, S16. [CrossRef]14. Mornieux, G.; Guenette, J.A.G.; Sheel, A.W.; Sanderson, D.J. Influence of cadence, power output and hypoxia on the joint moment
distribution during cycling. Eur. J. Appl. Physiol. 2007, 102, 11–18. [CrossRef] [PubMed]15. Caldwell, G.E.; Hagberg, J.M.; McCole, S.D.; Li, L. Lower extremity joint moment during uphill cycling. J. Appl. Biomech. 1999, 15,
166–181. [CrossRef]16. Ericsson, M. Mechanical muscular power output and work during ergometer cycling at different work loads and speeds. Eur. J.
Appl. Physiol. 1988, 57, 382–387. [CrossRef]17. Dettori, N.; Norvel, D. The effects of exercise on patellar tracking in lateral petellar compression syndrome. Sports Med. 2006, 36,
7–18. [CrossRef] [PubMed]18. Mariani, P.P.; Caruso, I. An electromyographic investigation of subluxation of the patella. J. Bone Jt. Surg. 1979, 61, 169–171.
[CrossRef] [PubMed]19. Souza, D.R.; Gross, M.T. Comparison of vastus medialis obliquus vastus lateralis muscle integrated electromyographic ratios
between healthy subjects and patients with patellofemoral pain. Phys. Ther. 1991, 71, 310–316. [CrossRef]20. Ericson, M.O.; Nissel, R.; Arborelius, U.P.; Ekhorn, J. Muscular activity during ergometer cycling. Scand. J. Rehabil. Med. 1985, 17,
53–61. [PubMed]21. Baum, B.S.; Li, L. Lower extremity muscle activities during cycling are influenced by load and frequency. J. Electromyogr. Kinesiol.
2003, 2, 181–190. [CrossRef]22. Laplaud, D.; Hug, F.; Grelot, L. Reproducibility of eight lower limb muscles activity level in the course of an incremental pedaling
exercise. J. Electromyogr. Kinesiol. 2006, 15, 158–166. [CrossRef]23. Dieltiens, S.; D’hondt, J.; Juwet, M.; Versteyhe, M. Development of A Low-Cost Measurement System to Determine 3-Dimensional
Pedal Loads During in-Situ Cycling. Transp. Probl. 2018, 14, 151–160. [CrossRef]24. Dieltiens, S.; D’hondt, J.; Juwet, M. Design and Calibration of an Instrumented Seat Post to Measure Sitting Loads While Cycling.
Sensors 2020, 20, 1384.25. D’hondt, J.; Dieltiens, S.; Juwet, M. Design and Calibration of a 6-component Balance in a Bicycle Steer. In Proceedings of the 18th
International Conference on Experimental Mechanics (ICEM18), Brussels, Belgium, 1 July 2018.

Appl. Sci. 2021, 11, 2032 16 of 16
26. Dieltiens, S.; Claeys, K.; D’hondt, J.; Devroey, H.; Juwet, M.; Demeester, E. Validation of a Bar Linkage Model for Joint AngleEstimation during Cycling. Appl. Sci. 2020, 10, 5104. [CrossRef]
27. Tikkanen, O. Physiological Loading during Normal Daily Life and Excercise Assessed with Electromyography; University of Jyvaskyla:Jyvaskyla, Finland, 2014.
28. Pesola, O. Reduced Muscle Inactivity, Sedentary Time and Cardio-Metabolic Benefits; University of Jyvaskyla: Jyvaskyla, Finland, 2016.29. Colyer, S.I.; McGuigan, P.M. Textile electrodes embedded in clothing: A practical alternative to traditional surface electromyogra-
phy when assesing muscle excitation during functional movements. J. Sport Sci. Med. 2018, 17, 101–109.30. Holmes, J.C.; Pruitt, A.L.; Whalen, N.J. Lower Extremity overuse in bicycling. Clin. Sports Med. 1994, 13, 187–203. [CrossRef]31. Burke, E.R. Perfect positioning. In Serious Cycling, Champaign (IL); Human Kinetics: Champaign, IL, USA, 2002; pp. 235–245.32. Burden, A. How should we normalize electromyograms obtained from healthy participants? What we have learned from over 25
years of research. J. Electromyogr. Kinesiol. 2010, 20, 1023–1035. [CrossRef]33. Yanamashetti, G.; Murthy, H.S. Application of Global Regression method for Calibration of Wind Tunnel. In Proceedings of the
Symposium on Applied Aerodynamics and Design of Aerospace Vehicles, Bangalore, India, 16–18 November 2011.34. Carpes, F.P.; Mota, C.B.; Faria, I.E. On the bilateral asymmetry during running and cycling—A review considering leg preference.
Phys. Ther. Sport 2010, 11, 136–142. [CrossRef] [PubMed]35. Carpes, F.P.; Rossato, M.; Faria, I.E.; Mota, C.B. Bilateral pedaling asymmetry during a simulated 40-km cycling time-trial. J. Sports
Med. Phys. Fit. 2008, 47, 51–57. [CrossRef]36. Costes, A.; Turpin, N.A.; Villeger, D.; Moretto, P.; Watier, B. A reduction of the saddle vertical force triggers the sit–stand transition
in cycling. J. Biomech. 2015, 48, 2998–3003. [CrossRef]37. Dorel, S.; Couterier, A.; Hug, F. Intra-session repeatability of lower limb muscles activation pattern during pedaling. J. Electromyogr.
Kinesiol. 2008, 18, 857–865. [CrossRef] [PubMed]38. Richmond, D.R. Handlebar problems in bicycling. Clin. Sports Med. 1994, 13, 165–173. [CrossRef]39. Schwarzer, U.; Sommer, F.; Klotz, T.; Cremer, C.; Engelmann, U. Cycling and penile pressure: The type of saddle matters. Eur.
Urol. 2002, 41, 139–143. [CrossRef]40. Callaghan, M.J.; Phil, M. Lower body problems and injury in cycling. J. Bodyw. Mov. Ther. 2005, 9, 226–236. [CrossRef]
Copyright © 2022 FDOKUMEN