Natural Gas Anodes of Porous Graphite for Aluminium ...
129
ISBN 978-82-326-2600-7 (printed ver.) ISBN 978-82-326-2601-4 (electronic ver.) ISSN 1503-8181 Doctoral theses at NTNU, 2017:266 Babak Khalaghi Natural Gas Anodes of Porous Graphite for Aluminium Electrolysis Doctoral thesis Doctoral theses at NTNU, 2017:266 Babak Khalaghi NTNU Norwegian University of Science and Technology Thesis for the Degree of Philosophiae Doctor Faculty of Natural Sciences Department of Materials Science and Engineering
-
Upload
khangminh22 -
Category
Documents
-
view
0 -
download
0
Transcript of Natural Gas Anodes of Porous Graphite for Aluminium ...

ISBN 978-82-326-2600-7 (printed ver.)ISBN 978-82-326-2601-4 (electronic ver.)
ISSN 1503-8181
Doctoral theses at NTNU, 2017:266
Babak Khalaghi
Natural Gas Anodes of PorousGraphite for AluminiumElectrolysisD
octo
ral t
hesi
s
Doctoral theses at N
TNU
, 2017:266B
abak Khalaghi
NTN
UN
orw
egia
n U
nive
rsity
of S
cien
ce a
nd T
echn
olog
yTh
esis
for
the
Deg
ree
ofP
hilo
soph
iae
Doc
tor
Facu
lty
of N
atur
al S
cien
ces
Dep
artm
ent o
f Mat
eria
ls S
cien
ce a
ndEn
gine
erin
g

Thesis for the Degree of Philosophiae Doctor
Trondheim, September 2017
Norwegian University of Science and TechnologyFaculty of Natural SciencesDepartment of Materials Science and Engineering
Babak Khalaghi
Natural Gas Anodes of PorousGraphite for AluminiumElectrolysis

NTNUNorwegian University of Science and Technology
Thesis for the Degree of Philosophiae Doctor
Faculty of Natural SciencesDepartment of Materials Science and Engineering
© Babak Khalaghi
ISBN 978-82-326-2600-7 (printed ver.)ISBN 978-82-326-2601-4 (electronic ver.)ISSN 1503-8181
Doctoral theses at NTNU, 2017:266
Printed by NTNU Grafisk senter

iii
Preface The first year of my PhD studies in Norway was affected by an unexpected event. After a very long processing time, my application for visa was rejected by the Norwegian Directorate of Immigration (UDI). A same decision was made for many other Iranian students and work applicants as well. Such decision was made based on the EU and UN sanctions on Iran in connection with Iran’s activities on developing nuclear energy. Most of the students who were affected by this policy were in Iran and had not yet entered Norway. Therefore, they could not do much about it, and I guess they just relinquished. As for me, I was among a group of 12 people who had already entered Norway. I did my master studies in Sweden, and having received the contract for PhD from Norwegian University of Science and Technology (NTNU), I moved to Norway. I was granted a temporary work permit by Norwegian police to start my work while my work application was being processed by UDI.
As stated earlier, my application was rejected after seven months. This was a very unexpected and unreasonable decision as I was an ordinary Iranian citizen, who had nothing to do with Iran’s activities on nuclear energy regardless of whether such activities were right or wrong. Together with my other 11 Iranian fellows, I started to find a solution to this awkward problem. That was the beginning of a series of activities to prove that the decision made by UDI was incorrect. So, we embarked on making a case against the decision made by UDI. Fortunately, our efforts ended in success and the decision was reversed for many of us, who resumed their studies after few months pause. Sadly, the appeal for two of our friends was rejected again, and they elevated the case to the court level. After further follow-up, finally the problem of those two was also

iv
resolved. This was mainly due to their perseverance and also because of achievement of the nuclear deal between Iran and six world powers.
Undoubtedly, the scope of this event was beyond my control and reach. In fact, final accomplishment in changing the decision could not have been achieved without the support, endeavours, and help of many people and organisations.
First of all, NTNU and in particular, Department of Materials Science and Engineering had a great role. It was NTNU, which clearly showed and proved that our projects and scientific activities here at NTNU were only for peaceful, unwarlike and benevolent goals.
I do not know and in fact, cannot know all the people who took a step to help us through this hardship. Certainly, I am deeply thankful to all of them. Nevertheless, I wish to thank some people in particular as follows:
Gunnar Bovim, Rector of NTNU, Jostein Mårdalen, Head of Department of Materials Science and Engineering, who undoubtedly had an immense role, and I appreciate his great endeavour. Geir Martin Haarberg, my supervisor, who supported me all the way. Additionally, my co-supervisors, Tommy Mokkelbost and Ole Kjos from SINTEF research foundation. All the professors and supervisors of other affected students. Christian Fossen, Director of Communication Division (NTNU), Pernille Feilberg, Communications Adviser (NTNU), and Kathrine Vangen, International Senior Advisor (NTNU). All Norwegian friends who stood up not only for us, but also for the humane values and principles of their beautiful country. All Iranian friends who did whatever they could to solve this problem; also, our friends from other nationalities who saw this problem not as something solely related to Iranians but as their own problem and supported us all the way to the end. Finally, anyone who took the smallest step in this regard. I owe a great deal to all of you.
Probably, the occurrence of such events is evitable. However, these things happen and nobody is faultless. I am happy that in this case Norwegian authorities (including UDI) showed rationality and changed their decision. However, this was achieved at substantial expense.
The problem that happened to me and my friends was probably a tiny one in comparison to all the tragic and terrible things going on in the world today.

v
There are many problems and challenges that must be dealt with. I believe this can be achieved if we remember that we are living together on this planet. We share all the beauties, evils and problems.
“If we have no peace, it is because we have forgotten that we belong to each other”
Mother Teresa

vi
The outline of the thesis
This thesis contains the results of research carried out at the Department of Materials Science and Engineering at the Norwegian University of Science and Technology in the time span 2013-2017.
This thesis consists of five chapters. The first chapter is an introductory part giving a general introduction and motivation to the main topics of the thesis. In the second chapter the details of experimental work, different techniques and instruments are explained. Results and discussion are presented in chapter 3 in five papers. The three first papers have already been published. The last two are manuscripts. The results and findings of this study have been presented and published as this work progressed. Chapter four and five are conclusions and some suggestions for future studies, respectively.

vii
Acknowledgment First of all, I would like to thank my main supervisor Prof. Geir Martin Haarberg at the Norwegian University of Science and Technology (NTNU). He provided me this great opportunity to do a PhD. I am grateful for the scientific discussions we had, all his supports and patience.
I would also like to thank my co-supervisors Tommy Mokkelbost and Ole Kjos, both senior research scientist at SINTEF research organization. Tommy was always a source of encouragement and helped a lot with organising and progressing this work. I also benefitted a lot from discussions with Ole and his helps and experiences in lab. It was unlucky for me that Ole moved to Oslo and I missed these helps and supports to some extent.
I wish to express my gratitude to my friend, Wojciech Gębarowski, who was a postdoc during my PhD studies and now is a lecturer at AGH University of Science and Technology, Krakow, Poland. I could not have managed to carry out impedance spectroscopy without his help and support. Also, the scientific discussions with him were quite productive.
In addition, I received great help from other SINTEF employees. Henrik Gudbrandsen was a big help in the beginning of the experimental work as well as during the progress of it. Thor Anders Aarhaug helped a lot with gas analysis. Ove Paulsen and Karen Osen had fruitful contributions to this work which I wish to acknowledge. Thanks to Anne Støre for carrying out air-permeability measurements and Jannicke Kvello for performing the porosimetry analysis.

viii
I greatly appreciate the decent work done by Aksel Alstad and other employees at mechanical workshop and glass workshop in preparing the graphite samples and other equipment.
Thanks to past and present staff at the Department of Materials Science and Engineering, NTNU for their kind helps and kindness.
I also wish to thank Roger Overå, staff engineer at the Department of Geoscience and Petroleum, NTNU, for helping me with measuring the air-permeability of the graphite samples and explaining all the details.
Many thanks to Prof. Alex Hansen, Department of Physics, NTNU, who allotted his precious time for discussing with me about the fluids flow in the porous graphites.
I also would like to thank my friends Ehsan Khalili, PhD candidate at the Department of Energy and Process Engineering, and Massoud Hassanabadi, PhD candidate at the Department of Materials Science and Engineering, who also helped me about flow problems and pressure changes in the process.
I should also express my gratitude to all my friends and colleagues at Department of Materials Science and Engineering, both former and present for their helps and supports and also, for the good moments I spent with them.
I would like to thank my friend Morteza Haeri for helping in writing the preface of this thesis.
This work was funded by the Research Council of Norway, GASSMAKS program, and grant number 224985. I am very grateful for their support.
Last but certainly not least, I would like to thank my family. My parents, Kouros and Jaleh, have been an ever-present support throughout my academic career and I would not be where I am without their support and love. Finally, I would like to thank my wife, Shohreh for her unconditional love, patience, and encouragement.
Babak Khalaghi Trondheim, 31st August 2017

ix
Summary Over the past few decades, significant improvements have been made regarding CO2 emissions and other environmental impacts of the industrial aluminium electrolysis process. However, a large part of such emissions is related to the source of electrical energy. Nevertheless, process optimizations have led to remarkable reduction in CO2 emissions directly coming from the electrolysis process. Further reduction in such emissions can only be achieved by changing the electrolysis reaction. A so-called inert anode has been the most important considered alternative. Such an anode does not react with the bath and only oxygen is evolved as the gas product of the anodic reaction. However, this idea has not been realized so far and it is unlikely to become so in the foreseeable future. Another alternative is to employ gas-permeable anodes and supply them with a reducing gas so that the gas participates in the anodic reaction. Depending on the selected reducing gas and anode material the amount of generated CO2 will be reduced.
After considering various aspects of the process and previous studies graphite and methane were selected as the anode material and reducing gas, respectively. Graphite seems to be the best option for the anode material since today there is no sufficiently inert anode available which can be used on industrial scale. Among various reducing gases natural gas/methane is the best option. The abundance and low price of methane makes it an attractive option. Besides, when a hydrogen-containing gas is used for this process it leads to generation of extra hydrogen fluoride which is undesirable. Hence, methane is a better choice compared to hydrogen and many other gases in this respect.

x
There have been few studies on this concept for aluminium electrolysis. Thus, many aspects of such a process are unexplored. As this work progressed a better understanding was obtained and influencing parameters were revealed.
Galvanostatic electrolysis experiments were run to see the effect of methane supply during aluminium electrolysis. At the beginning three different types of graphites were tried as anode. The amount of anode consumption was found by measuring the weight change of the anode during electrolysis. This reflected how much methane was involved in the anodic reaction. In addition, the off-gas was analysed and the concentration of water and hydrogen fluoride was monitored in each experiment. The pressure changes before the anode were also observed. Among the graphite grades used one of them showed a better performance. Besides, the pressure changes suggested that gas-permeability and pore size distribution (PSD) of the graphite are of great importance for the efficient oxidation of methane. Therefore, other types of graphite were purchased from different suppliers. Mercury porosimetry and air-permeability measurements were carried out and those with the more suitable properties were tried.
Finally, cyclic voltammetry was done using different graphites and the effect of supply of methane was studied. Also, electrochemical impedance measurements were performed to find the double layer capacitance.
It was found that among the graphite materials tested in this study, the grade with a pore size distribution in the range from 1 - 10 µm and air-permeability equal to 5 md had the best performance. Such graphite can better establish the three-phase boundary between the methane, electrolyte and the anode. Cyclic voltammograms were clarifying and confirmed the electrolysis results. The carbon consumption is indicative of the degree of methane involvement in the anodic reaction. However, it might be influenced by other parameters. Nevertheless, the anode consumption was reduced up to 35% and higher efficiencies can be achieved by optimization the process.
xi
Contents Preface ................................................................................................................ iii
Acknowledgment ............................................................................................... vii
Summary ............................................................................................................. ix
1. Introduction ................................................................................................. 1
1.1. Aluminium production process: Challenges, shortcomings and future 1
1.2. Alternatives .......................................................................................... 7
1.2.1. Carbothermal reduction processes .............................................. 7
1.2.2. Inert anodes ............................................................................... 10
1.2.3. Gas anodes ................................................................................. 13
1.3. Aim of the thesis ................................................................................ 19
1.4. Anodic reactions ................................................................................ 20
1.4.1. Anodic reaction in aluminium electrolysis ................................. 20
1.4.2. Electrochemical oxidation of methane ...................................... 22
2. Experimental Techniques ........................................................................... 27
2.1. Setup .................................................................................................. 27
2.1.1. Electrolyte and the reference electrode .................................... 29
2.2. Anode materials and assembly .......................................................... 32

xii
2.2.1. Graphite grades .......................................................................... 32
2.2.2. Anode assembly ......................................................................... 32
2.3. Gas analysis ........................................................................................ 33
2.4. Electrochemical methods................................................................... 36
2.4.1. Galvanostatic electrolysis .......................................................... 36
2.4.2. Cyclic voltammetry (CV) and electrochemical impedance spectroscopy (EIS) ...................................................................................... 37
2.5. Anode transport properties ............................................................... 37
2.5.1. Air-permeability ......................................................................... 38
2.5.2. Porosimetry ................................................................................ 40
2.6. Microscopy observations (SEM)......................................................... 40
3. Results and Discussion ............................................................................... 43
3.1. Paper 1 ............................................................................................... 43
3.2. Paper 2 ............................................................................................... 57
3.3. Paper 3 ............................................................................................... 81
3.4. Paper 4 ............................................................................................... 97
3.5. Paper 5 ............................................................................................. 123
Conclusions ...................................................................................................... 143
Suggestions for Future Work ........................................................................... 145
Bibliography ..................................................................................................... 147
1
Chapter 1
1. Introduction
1.1. Aluminium production process: Challenges, shortcomings and future
Aluminium is the third most abundant element on earth. It is also the second highest tonnage metal produced in the world; more than the combined production of all other nonferrous metals [1]. It is produced in a multistage process. First, aluminium ore, e.g. bauxite, is converted to pure aluminium oxide. This first step is by the Bayer process. Secondly, liquid aluminium is produced from aluminium oxide by electrolysis in the so-called Hall-Héroult process [2]. The world primary aluminium production was about 270 million tonnes during the last five years (2011-2015); where about 62 million tonnes were produced in 2015 [3].
The current industrial aluminium production method – Bayer process followed by Hall-Héroult process – is the only way which aluminium is commercially produced today. Other alternatives do not seem to be very competitive to this method, but this method is not flawless. Specifically, the Hall-Héroult process has two major drawbacks; first, it is an energy-intensive process; it is one of the top five most energy-intensive industries, after the chemicals and petrochemicals, iron and steel, cement and pulp and paper industries [4]. Secondly, large amounts of greenhouse gases (GHG) are emitted as by-products during this process. The required energy is itself the cause of considerable

2
amounts of GHG emissions depending on the energy sources. However, aluminium is considered as a material promoting sustainability [5] for several reasons. It can be recycled relatively easily and repeatedly without losing its unique properties. In fact, approximately 75% of all aluminium ever produced since the late 19th century is still in use. Besides, aluminium recycling only needs 5% of the energy required for primary production. In addition, due to its superior properties such as high strength-to-weight ratio and corrosion resistance it is considered to be a sustainable material [6].
It is very difficult and probably impossible to detect and assess all the environmental impacts associated with aluminium production; like any other industry. In fact, for any Life Cycle Assessment (LCA) a group of these environmental impacts (impact categories) is selected and used. But, some impact categories cannot be included due to different reasons such as limited availability of data and other uncertainties [7].
The LCA assessment delivered in Environmental metrics report, year 2010 data [7] is a cradle-to-gate assessment, meaning it covers the life cycle from bauxite mining to aluminium ingot. In this assessment, several impact categories are included; see Table 1.1-1. Perhaps, among these impact categories the Global Warming Potential (GWP) is more widely known. It is “an index used to compare the relative radiative forcing of different gases without directly calculating the changes in atmospheric concentrations. GWPs are calculated as the ratio of the radiative forcing that would result from the emission of one kilogram of a greenhouse gas to that from the emission of one kilogram of carbon dioxide over a fixed period of time, such as 100 years” [8].
Table 1.1-1. Impact categories per kg of aluminium ingot [7]
Impact category Unit (per kg Al)
Acidification potential (AP) kg SO2e
Depletion of fossil energy resources MJ
Eutrophication potential (EP) kg PO4e
Global warming potential (GWP 100 years) kg CO2e
Ozone depletion potential (ODP) kg CCl3Fe
Photo-oxidant creation potential (POCP) kg C2H4e
Water scarcity footprint (WSFP) m3 H2Oe

3
Here, only the Global Warming Potential (GWP) is mainly focused. The other impact categories are presented to demonstrate the fact that the magnitude and extent of environmental impacts are much more than what is known in common knowledge. A more complete description of these selected impact categories can be found in the report [7].
In Table 1.1-2 and Figure 1.1-1 the greenhouse gas (GHG) emissions and primary energy required (from both renewable and non-renewable) for each of the processes in aluminium production are presented. The unit, unless otherwise indicated, is CO2-Equiv.1 /kg Al [7]. As can be seen from Table 1.1-2 for 1 kg of aluminium ingot 16.5 kg CO2 is produced. The most significant factor is the electrical energy required for electrolysis. Average global smelter electrical (AC) power consumption is in the range of 14-15 kWh per kg of primary aluminium. This is responsible for about 56% of the total GWP for production of 1 kg aluminium ingot. This is in fact the energy required to split strong bonds between Al3+ and O2- in alumina. Undoubtedly, the most effective way to make the production more environmentally friendly is to use cleaner energy resources.
Table 1.1-2. Global greenhouse emissions split by unit process and process type and primary energy input split by process type. The unit, unless otherwise indicated, is CO2-Equiv. /kg Al. [7].
Global Bauxite mining
Alumina refining
Anode/paste production
Electrolysis Ingot casting
Total Primary Energy (MJ)
Electricity ˂ 0.1 0.4 ˂ 0.1 9.2 ˂ 0.1 9.7 131
Process & Auxiliary
˂ 0.1 0.7 0.4 2.3 ˂ 0.1 3.5 19
Thermal Energy
˂ 0.1 2.2 0.1 ˂ 0.1 0.1 2.4 31
Transport 0 0.5 ˂ 0.1 0.4 0 0.8 10
Total ˂ 0.1 3.8 0.6 11.9 0.2 16.5 190
1 Carbon dioxide equivalent: The amount of carbon dioxide by weight emitted to the atmosphere that would produce the same estimated radiative forcing as a given weight of another radiatively (i.e. with regard to radiation) active gas. Carbon dioxide equivalents are computed by multiplying the weight of the gas being measured (for example, methane)by its estimated global warming potential (which is 21 for methane) [8] Glossary; US Energy Information Administration <https://www.eia.gov/tools/glossary/index.cfm?id=G >, 2017 (accessed 09.03.2017.2017).

4
Figure 1.1-1: Global GWP (global warming potential) split by unit process and process type. The unit is CO2-Equiv. /kg Al [7].
Currently, low GHG-emitting, renewable and reliable hydroelectricity constitutes around 40% of the industry’s power mix. This figure was larger a few decades ago. Since the beginning of 21st century the aluminium production in China has increased remarkably and as China provides the electrical energy largely from fossil fuel resources the share of hydro power in the global power mix has decreased during the last two decades; see Figure 1.1-2 . Meanwhile, the global production of aluminium has increased [9].
Figure 1.1-2: Global aluminium industry power mix (GWh) for different years (1995, 2005, and 2015) during the last three decades. This diagram is plotted based on data from [10].
0
10
20
30
40
50
60
70
0
100
200
300
400
500
600
700
800
900
1995 2005 2015
Annu
al g
loba
l Al.
Prod
uctio
n /m
illio
n to
nnes
Elec
tric
al E
nerg
y /G
Wh
NuclearNatural GasOilCoalHydro

5
Apart from the electrical energy for electrolysis, the factor “process and auxiliary” (Table 1.1-2 and Figure 1.1-1) also constitutes around 14% of the total GWP. This part is due to the reaction of carbon anodes with the oxygen-containing ions in the bath during the electrolysis process. Equation (1) presents the overall primary reaction during electrolysis; Hall- Héroult process:
1 2⁄ 𝐴𝐴𝑙𝑙2𝑂𝑂3(𝑑𝑑𝑑𝑑𝑑𝑑𝑑𝑑. ) + 3 4⁄ 𝐶𝐶(𝑑𝑑) = 𝐴𝐴𝑙𝑙 (𝑙𝑙) + 3 4⁄ 𝐶𝐶𝑂𝑂2(𝑔𝑔) (1)
This amount of CO2 from anode consumption now constitutes around two third of the direct emissions of the process, with PFCs (perfluorocarbons) making up the remainder. In industry about 430 kg anode carbon are consumed to produce 1 tonne of molten aluminium. This corresponds to 1.6 tonnes CO2 [6]. However, according to the stoichiometry of reaction (1) 333 kg carbon (equivalent to 1222 kg CO2) is needed to be consumed. This difference is due to the unwanted reactions of the anode and also due to the fact that the current efficiency of the process (with respect to produced aluminium) is in the range of 90 – 92 % [2].
One of most advanced aluminium plants in the world will start operation in 2017 in Karmøy, Norway. It is expected that the direct CO2 emissions at this pilot plant will be at 1.40-1.45 kg CO2 equivalents per kg aluminium and this is 0.8 kg lower the world average [11]. This corresponds to 0.382 – 0.395 kg anode carbon consumption which is a remarkable improvement. It also shows that the modern industrial cells are getting closer to the stoichiometric carbon consumption (0.333 kg/kg of Al.). Bearing in mind the fact that the Hall-Héroult process - without a fundamental change - has been optimized and amended since its establishment in the late 19th century; it is unlikely that further improvements can lead the industrial electrolysis process to get much closer to this stoichiometric limit, as the unwanted reactions are almost inevitable. Nevertheless, even if this limit can be achieved it would be the final achievement regarding carbon consumption by such process optimizations. Therefore, to decrease the undesired CO2 emissions from electrolysis cell the overall reaction, or more specifically the anodic reaction must be changed.
This seems more important when the future of primary aluminium production is also considered. Figure 1.1-3 demonstrates an estimated primary aluminium production for the period 2009 – 2050. This prediction was based on a model assuming that the primary aluminium production increases by gross domestic

6
product (GDP); though the secondary aluminium production was not considered in this study [12].
It is worth mentioning that unsurprisingly, such estimations cannot predict the future with a very high degree of precision due to simplifications and limitations of the used models for such studies. The above mentioned estimation matches well to predictions under low demand scenario to which primary aluminium production will rise to 90-100 Mtonnes by 2050; whereas under high demand scenario, primary aluminium production is expected to increase to 120-135 Mtonnes by that time [13]. This may explain some of the errors; e.g. the fact that Chinese primary aluminium production has already passed the estimated value for 2035 in this study. Nevertheless, such estimates can shed some light to the forthcoming trends and give rough values for the future. Undoubtedly, the global primary aluminium production will increase in the following decades and any step forward towards sustainability and environmentally friendly processes is highly desirable and necessary.
Figure 1.1-3: Estimated future primary aluminium production in the world [13].

7
On the other hand, in recent decades the aluminium industry has made significant improvements regarding the undesirable environmental impacts. This was achieved mainly by investment in new large-scale production plants with more advanced technologies and phasing out old plants. From 2005 to 2010 perfluorocarbon (PFC) air emissions and polycyclic aromatic hydrocarbons (PAH) were reduced respectively by 40% and 50% per tonne of Al. Spent pot lining (SPL) solid landfilled was also reduced by 45% per tonne of Al [9]. However, there is a long way to make primary aluminium production sufficiently sustainable.
1.2. Alternatives As mentioned before, the current production of aluminium is based upon two established processes; i.e. the Bayer process for production of alumina from ore and the Hall-Héroult process which is the electrolytic production of aluminium from alumina. The most important alternative methods include modified Hall-Héroult process utilizing inert anodes, direct carbothermal reduction of alumina, and indirect carbothermal reduction of alumina [14, 15]. Here these methods are briefly presented.
1.2.1. Carbothermal reduction processes
1.2.1.1. Direct carbothermic reduction processes This method has been considered as an interesting alternative due to the advantages it potentially possesses when compared with Hall-Héroult process. These advantages include higher productivity, lower overall greenhouse gases emissions, lower capital investment, and less consumption of electrical power. The process can be presented by these overall reactions:
𝐴𝐴𝑙𝑙2𝑂𝑂3(𝑑𝑑) + 3𝐶𝐶(𝑑𝑑) = 2𝐴𝐴𝑙𝑙 (𝑑𝑑) + 3𝐶𝐶𝑂𝑂(𝑔𝑔) (2)
𝐴𝐴𝑙𝑙2𝑂𝑂3(𝑑𝑑) + 3𝐶𝐶𝐶𝐶4(𝑔𝑔) = 2𝐴𝐴𝑙𝑙(𝑑𝑑) + 3𝐶𝐶𝑂𝑂 (𝑔𝑔) + 3𝐶𝐶2(𝑔𝑔) (3)
Thermodynamically, these reactions are shifted to right above 2057 °C and 1497 °C, respectively. The main downside with this process is that the yield of aluminium is low; reduction of alumina does not proceed straightforward and it is complicated by formation of intermediate and volatile sub-compounds. Furthermore, when the products are cooled down a mixture of carbide and oxycarbide might form which then must be separated in an extra process.
8
This method has been developed to a two-stage process. The most important development of this method is being performed by Alcoa and Elkem companies (ARP-Advanced Reactor Process). First, Al2O3 is reduced by carbon at about 2000 °C which leads to formation of Al2O3 - Al4C3 slag melt. This occurs in the first reaction compartment. Then, in the second compartment the reaction follows between alumina and aluminium carbide at 2200 °C and an aluminium-carbon alloy is formed. The following reactions represent each of the as mentioned stages:
3𝐴𝐴𝑙𝑙2𝑂𝑂3(𝑑𝑑) + 9𝐶𝐶(𝑑𝑑) = (𝐴𝐴𝑙𝑙4𝐶𝐶3.𝐴𝐴𝑙𝑙2𝑂𝑂3)(𝑙𝑙) + 6𝐶𝐶𝑂𝑂(𝑔𝑔) (4)
(𝐴𝐴𝑙𝑙4𝐶𝐶3.𝐴𝐴𝑙𝑙2𝑂𝑂3)(𝑙𝑙) = 6𝐴𝐴𝑙𝑙 (𝑙𝑙) + 3𝐶𝐶𝑂𝑂(𝑔𝑔) (5)
There have been other studies based on this method such as ENEXAL project in which carbothermic reduction happens under vacuum. The final product is a mixture of aluminium (up to 19%), Al4C3 and Al4O4C. Another study proposed a carbothermic process where carbon and Al2O3 are injected into superheated aluminium (˃ 1400 °C). This leads to formation of aluminium carbide which is later treated with alumina and finally aluminium is extracted through the reaction given in equation (5) at temperatures about 1700 – 2000 °C.
Direct carbothermic process still has a very low yield besides the other problems such as formation of other compounds other than aluminium. Therefore, no full plant scale has been developed so far based on this method [15].
1.2.1.2. Indirect carbothermal reduction process Another approach is to produce aluminium through an aluminium intermediate compound. This is usually done by a two or multi-stage process. First, alumina or an aluminium ore is converted to an intermediate aluminium compound such as aluminium chloride or nitride and then this compound is reduced to aluminium metal in the successive stage(s). Different types of this approach such as carbochlorination, carbosulphidation and carbonitridation have been studied.
The most important one is the chloride route. In this method, first aluminium chloride intermediate compounds are formed by reaction of alumina or aluminium ore with carbon and chlorine sources. This stage can be represented by the following reactions:
9
𝐴𝐴𝑙𝑙2𝑂𝑂3(𝑑𝑑) + 3𝐶𝐶(𝑑𝑑) + 3𝐶𝐶𝑙𝑙2(𝑔𝑔) = 2𝐴𝐴𝑙𝑙𝐶𝐶𝑙𝑙3(𝑔𝑔) + 3𝐶𝐶𝑂𝑂(𝑔𝑔) (6)
𝐴𝐴𝑙𝑙2𝑂𝑂3(𝑑𝑑) + 3𝐶𝐶𝑂𝑂 (𝑔𝑔) + 3𝐶𝐶𝑙𝑙2(𝑔𝑔) = 2𝐴𝐴𝑙𝑙𝐶𝐶𝑙𝑙3(𝑙𝑙) + 3𝐶𝐶𝑂𝑂2(𝑔𝑔) (7)
The chlorination temperature varies between 400 to 1000 °C depending upon the reacting agents. Second stage is to extract aluminium from its chlorides. Disproportionation and electrolysis are the common routes. Other routes such as distillation and direct reduction with other metals are of minor importance. Disproportionation reaction leads to production of pure aluminium as follows:
3𝐴𝐴𝑙𝑙𝐶𝐶𝑙𝑙 (𝑔𝑔) = 2𝐴𝐴𝑙𝑙 (𝑙𝑙) + 2𝐴𝐴𝑙𝑙𝐶𝐶𝑙𝑙3(𝑔𝑔) (8)
Electrolysis of AlCl3 is also an attractive option due to its potential advantages. These advantages include:
• Longer cell lifetime since chlorides are less corrosive than fluorides • Electrolysis of AlCl3 must be done in a closed system. Therefore, the
emission of gases is limited. • Due to higher conductivity of chlorides than fluorides the process
would have higher power and current efficiency and lower energy consumption.
• There is no anode effect due to broad operational range of aluminium • This process can be done in cells with bipolar electrodes. Therefore,
the cells can be more compact.
During the 70’s Alcoa developed and commercialized aluminium production by carbochlorination followed by electrolysis. But, this production was later stopped because there were problems with production and handling of aluminium chloride and chlorine gas at elevated temperature [15].
As mentioned earlier, the same principle can be applied to produce aluminium through other compounds such as aluminium sulphide (Al2S3) or aluminium nitride (AlN). There have been some studies to develop these routes but, in these cases also there are unresolved issues and none of them have become successfully commercialized [15].

10
1.2.2. Inert anodes The term “Inert anode” for aluminium electrolysis cell means any oxygen-evolving anode. If such an anode is utilized in the cell then the primary cell reaction changes to the following:
1 2⁄ 𝐴𝐴𝑙𝑙2𝑂𝑂3(𝑑𝑑𝑑𝑑𝑑𝑑𝑑𝑑. ) = 𝐴𝐴𝑙𝑙 (𝑙𝑙) + 3 4⁄ 𝑂𝑂2(𝑔𝑔) (9)
In this case, the anode does not participate in the anodic reaction and it is not consumed; therefore, it is considered inert. However, it is most likely that the material slowly and gradually corrodes. The realization of this idea has been the long-standing dream of researchers. If a suitable material which can serve as an inert anode is discovered, the atmospheric pollution from the electrolysis process (see Table 1.1-2) and some other impurities will be eliminated. Furthermore, there is no need to adjust and change the anode during electrolysis. Currently, anode changing causes the largest operating disturbance in cells with prebaked anodes. Besides, the anode/paste production plant is not required. Though inert anodes must also be produced but inert anodes will have much longer lifetime [2].
The emf of reaction (9) is 2.2 V at 960 °C which is 1 V higher than reaction (1). This means that more electrical energy is required to run the electrolysis. However, if the cell is equipped with inert anodes other changes can be made which may reduce the cell voltage and the required energy [2]. This will be addressed in successive sections.
The advantages of an inert anode can be best accomplished if it is used with wettable cathodes and in a modified electrolysis cell. Therefore, alongside the quest for inert anodes, there has also been a search for wettable cathodes for a long time. A wettable cathode can also bring about significant improvements to the electrolysis process. There are serious candidate materials for wettable cathodes such as TiB2 and ZrB2. When inert anodes are utilized together with wettable cathodes major changes can be made to the cell design, which in turn, leads to several noticeable enhancements. Different designs have been proposed. The electrodes can be positioned vertically or horizontally; they can even have trapezoid shapes which facilitates the release of oxygen bubbles. The cathode can be made perforated so the liquid aluminium will be collected at the bottom of the cell. The cathodes can be changed during the process and the lifetime of the cell will be longer. The liquid aluminium film on the wettable

11
cathode will be much thinner. Therefore, the influence of the electromagnetic field and in turn, the movement of liquid aluminium will be limited. This leads to higher current efficiency. In addition, the thickness of the layer of oxygen bubbles is less than that for CO2 bubbles. These enables a much smaller interpolar distance and less heat loss which means saving of electrical energy. On the other hand, since less heat is produced in the cell the electrolyte must be kept at the process temperature in another way. This can be achieved by changing the thermal insulation, or using a lower-temperature electrolyte which enables reducing the process temperature. Such an electrolyte is interesting from another aspect too. At lower temperature corrosion/dissolution of the inert anode is slowed down. Besides, the solubility of aluminium is also lower and the current efficiency can be increased further. The most promising candidate for such an electrolyte is KF-AlF3. By using this electrolyte (with addition of some other salts) the electrolysis temperature can be lowered to 700-750 °C. The alumina solubility in this electrolyte was reported about 4.5 wt. % at 700 °C [16] which is much higher than the alumina solubility in industrial electrolyte at such low temperatures. However, there are still some unresolved issues with usage of this electrolyte. There is up to 0.5 % Na2O in alumina from Bayer process. And this can lead to contamination of this electrolyte by NaF. Besides, the electrical resistance and density of this electrolyte are not suitable for the process. The carbon lining must also be resistant to potassium attack [17].
But as mentioned before, the principal problem in the use of inert anodes is that to this date, a material which can serve as an inert anode in Hall-Héroult cell has not been found. Such a material, once called “the ultimate material challenge” [18], must have very many superior properties in order to be suitable for this purpose. The most important requirements are that it must be inert in terms of reacting with oxygen, stable and resistant towards reacting with electrolyte, physically stable at working temperature, sufficiently resistant to thermal shock, have high enough electrical conductivity and be mechanically robust [18].
So far, mostly three groups of materials have been considered candidate for inert anodes: ceramics, cermets and metallic alloys.
Among ceramic materials, mainly oxides have become candidates for such inert anodes; mainly due to having high melting point and resistance to attack by
12
oxygen and because of being electrochemically stable. However, almost these oxides show low electrical conductivity and unacceptable high solubility in the electrolyte. Even, in the case of tin oxide which has comparatively higher electrical conductivity and once was considered a potential anode material, the low solubility is not tolerable by aluminium industry. In addition, there are other unresolved issues with ceramic materials such as thermal shock resistance, scalability, operational challenges and mechanical robustness. Other ceramic materials have also been tried, mostly semiconducting oxides such as ferrites, spinels and perovskites. They lack sufficient electrical conductivity even after being doped, in addition to high solubility in the electrolysis bath [18]. Due to these unresolved issues there has not been much research on these materials in recent years [19, 20].
Cermets are a type of composite materials which are composed of ceramic and metallic phases. These seem attractive since they potentially possess the desirable properties of both of their constituents. In reality, this is true to some extent. The metallic phase brings high electrical conductivity and mechanical robustness while the ceramic phase provides the chemical stability. However, the problem with solubility in the bath persists. It was suggested that an alumina-saturated bath can resolve this problem. But, running the electrolysis with such a bath has its own problems and challenges. In addition, cermets are prone to become unstable under electrolysis conditions over long-term due to their dual-phase microstructure [18]. The most important cermet material studied recently has been nickel ferrite (NiFe2O4) – based cermets which is usually combined with copper or a Cu-Ni alloy as the metallic part. These were tested in low melting electrolytes. But, as mentioned earlier, anodes made of these materials will dissolve/corrode during long-time electrolysis [19].
Metals and metallic alloys candidates for inert anodes possess most of the requirements except the chemical and electrochemical stability. These properties are provided by a surface oxide layer which has a critical role; it must be thick enough to protect the underlying metallic phase from bath and oxygen and at the same time thin enough to provide sufficient electronic conductivity. Aluminium bronze is an example of this type of inert anodes. It is a copper base alloy containing 7-15 wt. % aluminium. On the anode surface a layer of alumina forms that can be best described as a reaction layer while it protects the metallic bulk of the anode [18]. Between different alloys, Ni-Fe based alloys have been
13
found to be the most promising ones in recent years. Although, most of the anodes made of this group have not shown enough corrosion resistance and stability, but there have been some cases where the anode performance was promising. Laboratory electrolysis tests lasting about 270 hours at Rusal’s Engineering & Technology Centre at Krasnoyarsk were carried out using Ni-Fe-Cu anodes. These anodes were consumed less than 2.5 cm/y and the aluminium purity was higher than 99.2%. It was reported that Rusal will start running tests in industrial electrolysis cells of 100 kA equipped with this type of anodes in the near future [19]. However, any news about such activities has not been announced to this date.
In conclusion, if the concept of inert anodes, together with the wettable cathodes, becomes realized, it can revolutionize the aluminium production. This means electrolysis is performed at temperatures of 700-750 ° with a short interpolar distance which lead to the lowest possible energy consumption for aluminium; oxygen will be evolved instead of CO2 and emission of greenhouse gases will be eliminated [17]. Although, this seems quite interesting but considering the history of this field of research and the status of the current activities, most likely this idea cannot become realized yet, at least not in the near future.
1.2.3. Gas anodes
1.2.3.1. Introduction Another alternative to the Hall-Héroult process is to apply a reducing gas for the anodic reaction, i.e. to supply a reducing gas, such as methane (CH4) to the anode-electrolyte interface through a porous anode. Then, the overall reaction will become:
𝐴𝐴𝑙𝑙2𝑂𝑂3(𝑑𝑑𝑑𝑑𝑑𝑑𝑑𝑑. ) + 3 4⁄ 𝐶𝐶𝐶𝐶4(𝑔𝑔) = 2𝐴𝐴𝑙𝑙(𝑙𝑙) + 3 4⁄ 𝐶𝐶𝑂𝑂2 (𝑔𝑔) + 3 2⁄ 𝐶𝐶2𝑂𝑂 (𝑔𝑔) (10)
As can be seen from the stoichiometry of the above reaction, the amount of generated CO2 is half the amount produced in the current industrial process; equation (1). This is a significant decrease in CO2 emission from the electrolysis cell. In addition, the emf of reaction (10) is 1.1 V at 960 °C which is slightly lower than the emf of reaction (1) (1.2 V) at the same temperature [21]. Therefore, the required energy for this process is same (or even less) than the Hall-Héroult process.

14
To have an effective reaction between the gas and the bath, the reducing gas must be introduced to the electrolysis bath in a proper way. More precisely, an electrochemical reaction must occur between the gas, the oxygen-containing ions dissolved in the bath and the bulk of the anode (for the transfer of electrons to the outer circuit). Therefore, the anode must be porous and permeable to transport the gas effectively and also it must have a high electric conductivity to transfer the current efficiently. The anodic reaction can be represented as follows:
3𝑂𝑂2−(𝑑𝑑𝑑𝑑𝑑𝑑𝑑𝑑. ) + 3 4⁄ 𝐶𝐶𝐶𝐶4(𝑔𝑔) = 3 4⁄ 𝐶𝐶𝑂𝑂2 (𝑔𝑔) + 3 2⁄ 𝐶𝐶2𝑂𝑂 (𝑔𝑔) + 2𝑒𝑒−(𝑎𝑎𝑎𝑎𝑎𝑎𝑑𝑑𝑒𝑒) (11)
Therefore, a three-phase boundary must form between the bath, the gas and the anode. The proper establishment of this three-phase boundary is vital and necessary for the effective participation of the gas in the anodic reaction.
The porous anode can be inert or made from carbon. If it is made of a supposedly inert material then either reaction (9) or (10) occurs at the anode. However, when the anode is supplied with methane then most likely reaction (10) will be the sole anodic reaction since its emf is 1 V lower than reaction (9).
Figure 1.2-1 (a) demonstrates such a case where a porous SnO2-based anode was used for galvanostatic electrolysis of aluminium. During the first 100 minutes, the anode was supplied with firstly no gas and later Ar. So, only reaction (1) could have been taking place at the anode. Later, the anode gas was shifted to methane and as it can be seen the anode potential dropped which is an indication of change in anodic reaction from reaction (1) to reaction (10). However, due to an unknown reason (possibly disturbance of the three-phase boundary) this depolarization did not last very long and the anode potential increased again to its former value [22].
Here, it is necessary to make a clarification regarding the term “depolarisation”. Depolarisation is defined as the partial or complete elimination of polarisation of an electrode during electrochemical process by adding a compound (depolariser) that is oxidized or reduced on an electrode [23]. If the methane supplied to the anode during aluminium electrolysis is considered as a depolariser then the consequent change in the anode potential can be referred to as depolarisation. Yet, it must be bear in mind that such change in anode

15
potential is a result of a new anodic reaction which is a thermodynamic phenomenon.
Nevertheless, as it was emphasised earlier there is no sufficiently inert anode material available at this date. So, a porous anode made of carbon seems to be a more practical choice. But, when the anode is made of carbon both reactions (1) and (10) might occur at the anode. This is because of the emfs of these reactions are almost same. Therefore, reactions (1) and (10) will be competing anodic reactions.
Figure 1.2-1 (b) presents two similar galvanostatic electrolysis experiments where in one, Ar and in the other one, methane was used as anode gas. Obviously, participation of methane in the anodic reaction led to a slight decrease in anode potential. But, weight changes of the anodes after these electrolysis runs showed that supplying the anode with methane led to 20% lower anode carbon consumption; confirming the fact that both reactions (1) and (10) were going on during the course of electrolysis with methane [22]. As much as the reaction (10) dominates as the anodic reaction the reduction in CO2 emission would be larger and according to the stoichiometry of this reaction this reduction can be up to 50% compared to reaction (1).
It is necessary to emphasise here that the reducing gas is not bound to be methane. It can be any other suitable option. Hydrogen is one of the most interesting reducing agents in metallurgical research and it can be used for this purpose as well. In the case of hydrogen, the overall reaction will be:
𝐴𝐴𝑙𝑙2𝑂𝑂3(𝑑𝑑𝑑𝑑𝑑𝑑𝑑𝑑. ) + 3𝐶𝐶2(𝑔𝑔) = 2𝐴𝐴𝑙𝑙(𝑙𝑙) + 3𝐶𝐶2𝑂𝑂 (𝑔𝑔) (12)
The emf of reaction (12) is equal to 1.28 V at 960 °C. And according to the stoichiometry of this reaction 0.1 kg hydrogen is required to make 1 kg aluminium [24].
1.2.3.2. The environmental challenge: Formation of excessive hydrogen fluoride
Although using a gas anode for aluminium production reduces the greenhouse gas emissions but, there exists also an environmental challenge with using such anodes. Supplying the anode with hydrogen-containing reducing gases such as

16
methane and hydrogen causes the formation of considerable amount of moisture; see reactions (10) and (12).
This will lead to formation of gaseous HF according to the following reaction [25]:
𝐴𝐴𝑙𝑙𝑙𝑙3(𝑑𝑑𝑑𝑑𝑑𝑑𝑑𝑑. ) + 3 2⁄ 𝐶𝐶2𝑂𝑂 (𝑔𝑔) = 3𝐶𝐶𝑙𝑙(𝑔𝑔) + 1 2⁄ 𝐴𝐴𝑙𝑙2𝑂𝑂3 (𝑑𝑑𝑑𝑑𝑑𝑑𝑑𝑑. ) (13)
In addition, considerable amount of fluoride will be lost from the bath as a result of this reaction. This has been reported in earlier studies as well [26].
Figure 1.2-1: Anode potential vs. time during constant current electrolysis in molten Na3AlF6-AlF3-Al2O3 (4.5 wt pct) at 1123 K (850 °C). (a) SnO2-based gas anode (0.1 A; 0.1 A cm-2); numbers in the figure corresponds to the gas flow rate, cm3 min-1. (b) Carbon based gas anode with the introduction of Ar and CH4 (0.4 A; 0.5 A cm-2) [22].
(a)
(b)
17
In case of using hydrogen as gas anode, it can directly react with bath and as a result, form hydrogen fluoride according to the following reaction:
𝐴𝐴𝑙𝑙𝑙𝑙3(𝑑𝑑𝑑𝑑𝑑𝑑𝑑𝑑. ) + 3 2⁄ 𝐶𝐶2 (𝑔𝑔) = 𝐴𝐴𝑙𝑙 (𝑙𝑙) + 3𝐶𝐶𝑙𝑙(𝑔𝑔) (14)
Equilibrium calculations have been done for such reactions using Factsage Thermodynamic software. These calculations showed that in general, HF formation is enhanced by water; reaction (13). However, reactions between hydrogen and bath will produce considerably less HF due to the fact that aluminium is less noble than hydrogen (and methane) and therefore, reaction (14) is forced to left side of the equilibrium [25].
Direct electrochemical reaction between hydrogen and bath may also occur as follows:
𝑁𝑁𝑎𝑎3𝐴𝐴𝑙𝑙𝑙𝑙6(𝑙𝑙) + 3 2⁄ 𝐶𝐶2 (𝑔𝑔) = 𝐴𝐴𝑙𝑙 (𝑙𝑙) + 3𝑁𝑁𝑎𝑎𝑙𝑙 (𝑙𝑙) + 3𝐶𝐶𝑙𝑙(𝑔𝑔) (15)
Emf of reactions (13) and (15) have been reported equal to 0.1 V and 1.74 V at 750 °C, respectively [24]. These values also confirm that direct reaction between hydrogen and bath is less probable.
In comparison, using hydrogen as the gas anode removes all the CO2 from the products of electrolysis reaction whereas using methane will only reduce the amount of CO2 up to 50%. However, the amount of generated H2O is two times larger in the case of hydrogen; see reactions (10) and (12). Therefore, the challenge with HF formation is much bigger especially, when considering other probable reactions such as reaction (14).
1.2.3.3. Suggested method to overcome the challenge: Closed fluoride looping
As stated above, utilization of hydrogen-containing reducing gases for aluminium production causes some problems. First, considerable amount of gaseous HF is formed. Furthermore, fluoride content of the bath is reduced and oxide-containing species are accumulated in the bath. It seems a conventional gas scrubbing system currently used in aluminium plants cannot handle these issues. To overcome these problems a modified cell design has been suggested. In this design, the off gas from the electrolysis cell is directly fed to a fluorination plant where it reacts with the Al2O3 and forms AlF3. If all the fluoride from HF is recovered by this method and Al2O3 is fed to the cell as the as-produced AlF3

18
then, the bath chemistry will be stable and the ratio of Al2O3:AlF3 will stay balanced. This fluorination can be carried out similar to the commercial fluidized bed AlF3 plants. In these plants fluorination of Al2O3 is done without considerable fluoride emission. Hence, it is likely that this technology can be adapted for gas anode aluminium production without causing major difficulties [25].
1.2.3.4. Previous studies The idea of utilizing a reducing gas for the anodic reaction of aluminium electrolysis dates back to late 50’s. Injecting methane to graphite anodes in two series of experiments resulted in lowering the polarization voltage by 0.2 V on average [27]. In another study, anodes made of different materials were tested. Flushing methane to graphite anodes (50% porosity) was not successful due to clogging of the anode by soot [28]. This is because of methane cracking and carbon deposition inside the porous structure of anode. Flushing the graphite anode by H2 and CO led to some depolarization; though the carbon consumption increased and the anodes disintegrated. Among different inert anodes that were tested those made of magnetite showed higher stability. However, these anodes eventually disintegrated after long time electrolysis [28]. In a similar study, different reducing gases were tried. Supplying porous graphite anodes with methane and hydrogen resulted in some depolarization. But, carbon monoxide reacted only in the presence of catalysts and showed much less reactivity. It was stated that due to high temperature of the process, methane decomposition occurs considerably and methane can be considered electrochemically equivalent to hydrogen. Considerable fluoride losses from electrolyte occurred when hydrogen-containing fuels were used [26]. A US patent filed in 2000 used the same idea of using a fuel gas, e.g. reformed natural gas, for electrowinning of aluminium by using a non-consumable gas anode based on the type used for Solid Oxide Fuel Cells (SOFC) [29]. Despite the potential advantages claimed for this invention, later studies revealed that this type of anode is not suitable for the cryolite-based electrolytes currently used in the aluminium electrolysis process. The yttria-stabilized zirconia (YSZ) layer showed considerable solubility in cryolite-based electrolyte and was not suitable for this application [30]. Another patent in this field is about a gas anode system using reducing gases for metal (primarily aluminium) production. The anode is made of porous graphite or another carbon-based material. The anode has the roles of both conducting electricity and conveying and distributing the reducing gas. Different designs for the gas anode system are suggested in this patent [21]. Lately, some studies

19
were done at the University of Auckland, New Zealand, to use hydrogen for electrowinning of aluminium. Porous anodes made of carbon with different gas transport properties were tested. The anode reaction between hydrogen and bath was confirmed. However, the carbon anode was also consumed during electrolysis [31]. They also tried using hydrogen with inert gas anodes made of a nickel alloy in a potassium-based electrolyte for production of aluminium. Although a noticeable depolarization was observed, but the anode showed relatively low stability [24]. Some research has been carried out at the Norwegian University of Science and Engineering (NTNU) in recent years. Previously, the studies were more focused on inert anodes. These anodes were supplied with methane and hydrogen for metal electrowinning processes and depolarization effect was observed in most cases [32-36]. More specifically, SnO2-based anodes and porous carbon anodes were used for aluminium electrowinning with a modified electrolyte at 850 °C. When SnO2-based anodes were supplied with hydrogen and methane depolarization was observed. In the case of carbon anodes supplied with methane the depolarization was small and the consumption of carbon was less when compared with experiments where carbon anodes were supplied with Ar [22, 25, 37, 38].
1.3. Aim of the thesis The main motivation of this work was to explore and study this alternative anodic reaction for aluminium electrolysis; namely electrochemical oxidation of methane by supplying graphite anodes. A former study, had shown that supply of porous anodes with methane or hydrogen in electrowinning of metals in molten salts leads to oxidation of these gases. This was well demonstrated by change of anodic reaction and depolarization of porous inert anodes. The aim of this study was to focus on methane-supplied graphite electrodes for aluminium electrolysis. Thus, finding the influencing parameters of this process and the desired properties of such graphite anode. And therefore, try to increase the efficiency of this process. This means to provide the condition under which oxidation of methane become the dominant anodic reaction.

20
1.4. Anodic reactions
1.4.1. Anodic reaction in aluminium electrolysis
1.4.1.1. The main product and the competing reactions As stated before, the overall reaction during the Hall-Héroult process results in evolution of carbon dioxide at the anode surface and formation of liquid aluminium at the cathode. Earlier, this reaction was given as equation (1) and here it is presented again:
1 2⁄ 𝐴𝐴𝑙𝑙2𝑂𝑂3(𝑑𝑑𝑑𝑑𝑑𝑑𝑑𝑑. ) + 3 4⁄ 𝐶𝐶(𝑑𝑑) = 𝐴𝐴𝑙𝑙 (𝑙𝑙) + 3 4⁄ 𝐶𝐶𝑂𝑂2(𝑔𝑔) (1)
However, in theory there are other possibilities for the anodic reaction; i.e. evolution of perfluorocarbon gases (CF4 or C2F6) or CO instead of CO2. Discharge of fluoride ions is very unlikely, unless the bath close to the anode surface is depleted of oxygen-containing ions; which provokes the so-called anode effect. But, formation of CO instead of CO2 is quite probable. The reaction of dissolved oxygen-containing ions and carbon anodes which leads to CO formation can be presented as the following equation:
1 2⁄ 𝐴𝐴𝑙𝑙2𝑂𝑂3(𝑑𝑑𝑑𝑑𝑑𝑑𝑑𝑑. ) + 3 2⁄ 𝐶𝐶(𝑑𝑑) = 𝐴𝐴𝑙𝑙 (𝑙𝑙) + 3 2⁄ 𝐶𝐶𝑂𝑂(𝑔𝑔) (16)
The reversible potentials of equations (1) and (16) at 1000 °C are -1.19 and -1.07 V, respectively [39]. Thus, reaction (16) is thermodynamically more favourable. This means that the so-called Boudouard reaction, presented below, is shifted far to the right at this temperature:
𝐶𝐶𝑂𝑂2(𝑔𝑔) + 𝐶𝐶(𝑑𝑑) = 2𝐶𝐶𝑂𝑂(𝑔𝑔) (17)
However, studies have shown that when current density is above 0.05 – 0.1 A cm-2 - as it is at normal current densities - the primary anode product is CO2 (equation 1). The reason is that the reaction occurs far from the equilibrium state; and there is a considerable anodic overvoltage (around 0.5 V) at normal current densities [40].
1.4.1.2. Carbon consumption Assuming primary CO2 formation, the theoretical consumption is equal to 0.112 g Carbon /Ah according to reaction (1) while reaction (16), where CO is the main anodic product, requires twice as much carbon as reaction (1) per Faraday.

21
Formation of CO occurs at very low current densities (0.05 – 0.1 A cm-2). As the current density is increased on a positively polarised carbon anode the Boudouard reaction ceases. However, it is not clear whether CO is the primary product or it is still CO2 followed by the Boudouard reaction. Secondary reactions can occur between CO2 and other reactants such as carbon dust in the melt, the part of the anode not immersed in the melt, and dissolved metal in the electrolyte. Among all, carbon dust and the interior of the porous anode structure are more significant. The oxygen partial pressure at these locations is different from the surface of the anode. Therefore, the Boudouard reaction can take place. There are different sources of carbon dust. However, the important one in laboratory studies is the one the in which carbon is disintegrated from the anode surface and is swept away into the melt [2].
1.4.1.3. Anodic overvoltage At normal current densities (0.6 - 1 A cm-2) the anode potential is of the order of 1.5 - 1.8 V, referred to the aluminium electrode, while the reversible potential is 1.2 V. Many researchers have studied the anodic reaction of aluminium electrolysis and the results are widely scattered. However, in most cases the results could be presented by Tafel plots where the Tafel coefficient was in a wide range from 0.09 to 0.4 (or even higher up to 0.68). There exist many reasons for the scattered results; the main reasons are quality of carbon (graphite or amorphous carbon of industrial grade with different porosities), cell design, gas bubble coverage, experimental set-up, the way of correcting for ohmic resistance, carbon dust, and the anode shape [2].
Despite discrepancies in reported results, today the mostly agreed mechanism of the anode reaction is a so-called ECE mechanism; two electrochemical steps with an intermediate adsorption step [41, 42]. Such a mechanism has been presented by the following reactions [41]:
𝐴𝐴𝑙𝑙2𝑂𝑂2𝑙𝑙64− + 𝐶𝐶 → 𝐴𝐴𝑙𝑙2𝑂𝑂𝑙𝑙62− + 𝐶𝐶𝑂𝑂𝑎𝑎𝑎𝑎𝑎𝑎 + 2𝑒𝑒− (18)
𝐴𝐴𝑙𝑙2𝑂𝑂2𝑙𝑙64− + 𝐶𝐶𝑂𝑂𝑎𝑎𝑎𝑎𝑎𝑎 → 𝐴𝐴𝑙𝑙2𝑂𝑂𝑙𝑙62− + 𝐶𝐶𝑂𝑂2 + 2𝑒𝑒− (19)
Though, the specific oxyfluoride species involved in these reactions are not known [43, 44]. It is also widely accepted that the rate-determining step is charge transfer with contributions of intermediate adsorption and desorption of oxygen-containing surface compounds [2].

22
The uncompensated anode potential measured versus a reference electrode has been expressed by equation (20) [45, 46]:
𝐸𝐸𝑎𝑎𝑎𝑎𝑎𝑎𝑎𝑎𝑎𝑎,𝑚𝑚𝑎𝑎𝑎𝑎𝑎𝑎𝑚𝑚𝑚𝑚𝑎𝑎𝑎𝑎 = 𝐸𝐸𝑚𝑚𝑎𝑎𝑟𝑟 + |𝜂𝜂𝑐𝑐| + 𝜂𝜂𝑚𝑚′ + 𝜂𝜂ℎ + 𝐼𝐼. (𝑅𝑅𝑎𝑎′ + 𝛿𝛿𝑅𝑅𝑎𝑎) (20)
As can be seen, there are various parameters influencing the anode potential. In this equation ηc represents the concentration overpotential. The gas produced at the anode also adds to the anode potential in two ways. The first effect is that the gas bubbles block the anode surface and reduce the effective/active surface area of the anode; as a result, the ohmic resistance is increased. This term is denoted by δRs in the above equation where R’s is the ohmic resistance in absence of bubble screening. These together form the total series resistance: Rs; in other words, Rs = R’s + δRs. The second effect of gas bubbling on anode overpotential is due to the enlarged current density at the reduced surface area of the anode. This contribution is observed as an increase in reaction overpotential. The reaction overpotential of the anodic reaction in aluminium electrolysis is a specific charge transfer overpotential relating to the electrode reactions where intermediate adsorption/desorption plays a decisive role. The additional overpotential due to reduced effective surface are caused by bubble screening is commonly denoted hyperpolarisation, ηh. In a similar representation as for series resistance, ηr = η’r + ηh, where η’r equals the reaction overpotential with no bubbles screening of the anode surface and ηr is the total reaction overpotential. The remaining parameters in equation (20) are Erev and I which are equal to the reversible potential of anode reaction producing CO2 (equation 1) and the current, respectively [45, 46].
1.4.2. Electrochemical oxidation of methane
1.4.2.1. Natural gas - Methane Natural gas is a mixture of combustible hydrocarbon gases. Though, it is primarily composed of methane it may include ethane, propane, butane, pentane and some other gases. The composition of natural gas can vary widely. Table 1.4-1 gives the typical makeup of natural gas before it is refined [47].
In addition to natural gas, methane is also the main component of coal-bed gas and biogas [48-50]. adding the recent discoveries of massive reserves of shale gas [51], the availability of methane has extended far more than before.

23
Table 1.4-1: Typical composition of natural gas [47].
Gas Composition Range
Methane CH4 70-90%
Ethane C2H6
Propane C3H8 0-20%
Butane C4H10
Pentane and higher hydrocarbons C5H12 0-10%
Carbon dioxide CO2 0-8%
Oxygen O2 0-0.2%
Nitrogen N2 0-5%
Hydrogen sulphide, carbonyl sulphide H2S, COS 0-5%
Rare gases: Argon, Helium, Neon, Xenon Ar, He, Ne, Xe trace
It is an attractive energy source since it possesses higher energy content per mass unit (= 55.7 kJ g-1) compared to other hydrocarbons. Currently, the predominant use of methane in the energy sector is via combustion [51]. Compared to conventional fossil fuels like coal and oil it is considered as a much cleaner fuel since it is the least carbon-intensive fossil fuel; it yields only 45% of the carbon dioxide emissions of coal. Consumption of natural gas will have the largest increase in world primary energy production during the successive decades [52]. From some aspects, it is a preferable fuel even more than hydrogen, because it is abundant in nature and it can be easily exploited.
For the same reasons just mentioned above, methane has also been considered as a reducing agent for many metal oxides [53-55]. Today, it is extensively used in direct reduction (DR) processes of iron oxide. In such processes, the reduction process occurs chemically [53].
1.4.2.2. Electrochemical oxidation of methane Natural gas is an important energy resource for electric power generation. Since, it is the least carbon-intensive fossil fuel with abundant reserves it may serve as the “bridge fuel” during the next several decades to transition into a low-carbon economy. However, most of the current combustion-based power plants

24
running on natural gas operate at efficiencies in the low 30 %, while the efficiency of electrochemical conversion of natural gas is considerably higher (in case of SOFCs the efficiency exceeds 60 %). Electrochemical conversion of natural gas also reduces the CO2 emissions by a factor of 2 [49]. Therefore, methane has been considered as a feedstock for fuel cells. But, due to the high stability of methane, direct electrochemical oxidation does not occur easily; even at elevated temperatures [56]. Thus, in some cases methane first goes through a reforming process (either externally or internally) to be converted to CO and H2 (syngas) and then, the gas mixture product is oxidised at the fuel cell anode. This is the so-called indirect oxidation. Nevertheless, the electrochemical oxidation of methane can be conducted directly; i.e. without any preceding reforming process. There have been studies on direct electrochemical oxidation of methane both at low and high temperatures.
Low temperature (60-150 °C) studies date back to the 60’s [57-59]. In one study using an acidic sulphate electrolyte the electrochemical oxidation of methane occurred on platinum electrodes at 80 °C and it was suggested that the reaction proceeds as follows:
𝐶𝐶𝐶𝐶4 + 2𝐶𝐶2𝑂𝑂 → 𝐶𝐶𝑂𝑂2 + 8𝐶𝐶+ + 8𝑒𝑒− (21)
The results showed that the products were almost entirely composed of CO2 and water [60]. Later studies also considered the above reaction as the overall anode reaction [61, 62]. The research on direct electrochemical oxidation of methane has been performed mainly in acidic electrolytes and using Pt anodes [57-60, 63]; though in few studies other electrolytes were used [62, 64]. In conclusion, direct electrochemical oxidation of methane at low temperatures is a slow process; even on Pt electrodes [61] and activation of methane is challenging [62]. Though, by using noble metals as electrocatalyst it seems activation of methane is possible [63].
The devices that operate at elevated temperatures such as molten carbonate fuel cells and solid oxide fuel cells (SOFC) are potentially more suitable to use methane as the primary fuel [56]. But, even at high temperature direct oxidation does not occur readily. In molten carbonate fuel cells running on methane, the electrochemical oxidation of methane is done indirectly [65] and for SOFCs only by employing suitable anode material and electrocatalysts direct oxidation of methane is achievable. Nickel cermets exhibit superior performance as anode
25
material and therefore, they are the most commonly used anode material for SOFCs. However, it seems these materials incite carbon deposition from methane (cracking) which leads to deactivation of the anode. Therefore, alternative anode materials or structures for direct methane SOFCs have become an active research area. Other candidate materials (e.g. some type of perovskite oxides) must also be equipped with catalysts such as Pd, Pt, Ce and Ni to perform efficiently [66, 67].
The full electrochemical oxidation of methane to CO2 and water in SOFCs can be expressed as below:
𝐶𝐶𝐶𝐶4 + 4𝑂𝑂𝑂𝑂𝑥𝑥 → 2𝐶𝐶2𝑂𝑂 + 𝐶𝐶𝑂𝑂2 + 4𝑉𝑉𝑂𝑂¨ + 8𝑒𝑒′ (22)
In this expression OxO represents an oxygen ion in oxidation state-II on an oxygen
site in the oxide electrolyte lattice and V¨O is a vacant oxygen site with a charge two times more positive than the lattice site. This is Krӧger-Vink notation which is used for identifying point defects [68]. This notation is here used whenever a reaction involves materials with such defects.
However, reaction (22) requires an eight-electron transfer and this is not likely to occur simultaneously in one step; especially when there exist competitive pathways.
An alternative reaction pathway leads to CO formation:
𝐶𝐶𝐶𝐶4 + 3𝑂𝑂𝑂𝑂𝑥𝑥 → 2𝐶𝐶2𝑂𝑂 + 𝐶𝐶𝑂𝑂 + 3𝑉𝑉𝑂𝑂¨ + 6𝑒𝑒′ (23)
and this can be followed by water gas shift reaction:
𝐶𝐶𝑂𝑂 + 𝐶𝐶2𝑂𝑂 → 𝐶𝐶2 + 𝐶𝐶𝑂𝑂2 (24)
which produces hydrogen that acts as a fuel.
In reaction (23) a total number of 6 electrons are transferred. For electrochemical conversion of CH4 this is still a big number to occur in one single step. Therefore, this equation cannot represent an elementary reaction.
The other competitive reaction pathway to the direct electrochemical oxidation of methane is the reforming reactions. In presence of water and at temperatures above 600 °C steam reforming might take place:

26
𝐶𝐶𝐶𝐶4 + 𝐶𝐶2𝑂𝑂 → 3𝐶𝐶2 + 𝐶𝐶𝑂𝑂 (25)
And the other competitor reaction is cracking of methane which leads to carbon formation:
𝐶𝐶𝐶𝐶4 → 𝐶𝐶 + 𝐶𝐶2 (26)
The various reactions and processes such as electrochemical oxidation, reforming and cracking will strongly be influenced by the (electro-) catalytic properties of the electrode (anode) material [69]. On the other hand, it has been shown that in addition to anode material, microstructure and operating conditions are also important parameters for the activity of the anode. Optimizing the process can even supress carbon deposition [66].

27
Chapter 2
2. Experimental Techniques
In this chapter, the details of the experimental work are presented. All the materials, apparatus and experimental techniques which are employed in this study are introduced. First, the experimental setup for the electrochemical studies is described. This includes the electrochemical cell, all the electrodes, crucible and the furnace. Next, the graphite grades used in this study are introduced and the anode assembly is described in detail. Then, gas analysis apparatus and setup are explained which is followed by description of electrolysis and electrochemical measurements. Finally, the studies related to transport properties of the graphite grades are presented and the last section, the electronic microscope which was briefly used in this research is introduced.
2.1. Setup The schematic of the experimental setup is depicted in Figure 2.1-1. A conventional three-electrode cell was used in this study. The electrochemical cell was placed in a vertical tube furnace. The furnace was heated by resistance wires and it was equipped with a temperature controller. A flow of nitrogen (50 ml min-1) was flushed into the furnace from the bottom to provide a controlled atmosphere.
The anode was made of porous graphite and it was supplied with gas through a steel tube entering the furnace from top. Carbon (graphite) crucibles Grafitdegel

28
G330 Tokai, Ø90/76.5×130/126 mm were used. The bottom of the crucible acted as the cathode/counter electrode during electrolysis and electrochemical measurements. The inner wall of the crucible was lined with an alumina tube. Using such a side-lining ensures a fixed cathode area and helps to maintain the electrolyte saturated with alumina. The reference electrode was also inserted into the cell from the top. The off gas exited from the furnace top through an alumina tube which was connected to a gas cleaning and analysis system.
The anode gas, either nitrogen (AGA 99.95%) or methane (AGA 99.95%), was introduced to the anode by a gas controlling panel. This is depicted in Figure 2.1-2.
Figure 2.1-1: Schematic of the experimental setup.

29
The gas flow was switched on and off by mechanical and electronic valves (Flow-Teknikk AS). These valves were also used for adjustment of the flow rates of the gases. A safe valve was placed after the joint of the anode gases tubes to prevent any overpressure larger than 1.2 bars. The electronic valves were connected to a computer and run by LabView software version 8.5 (National Instruments). By using this software, the flow rates of the gases could also be adjusted. Furthermore, it enabled monitoring the pressure, the temperature, and the cell voltage. The pressure was measured before the anode. The temperature was determined by a type S thermocouple (90%Pt/10%Rh–Pt, by weight) while it was immersed in the bath.
2.1.1. Electrolyte and the reference electrode The industrial electrolyte mainly consists of molten cryolite (Na3AlF6) to which several additives are added to improve the physiochemical properties of the melt. A typical industrial electrolyte contains 6-13 wt. % AlF3, 4-6 wt. % CaF2, and 2-4 wt. % Al2O3. In industry it is common to characterize the cryolite melt composition by using the cryolite ratio (CR), which is defined as the molar ratio of NaF and AlF3 [2]. Many important properties of electrolyte such as solubility of alumina and aluminium, liquidus temperature and electrical conductivity depend on cryolite ratio. Therefore, by adjusting the cryolite ratio an electrolyte with desirable properties can be achieved. This in return leads to higher current efficiency. However, if the cryolite ratio is smaller or larger than the optimised value then, either the cell performance will decline or the current efficiency will decrease. In old cells, the cryolite ratio was high; 2.7. But this ratio has decreased gradually and now in modern cells the cryolite ratio is 2.2 [70]. In the current study, the electrolyte composition was chosen to be like the modern industrial cells except that it was saturated with alumina.
The saturation concentration of alumina was calculated using the following equation:
[𝐴𝐴𝑙𝑙2𝑂𝑂3]𝑎𝑎𝑎𝑎𝑠𝑠 = 𝐴𝐴 � 𝑠𝑠1000
�𝐵𝐵
(27)
where

30
𝐴𝐴 = 11.9− 0.062[𝐴𝐴𝑙𝑙𝑙𝑙3] − 0.0031[𝐴𝐴𝑙𝑙𝑙𝑙3]2 − 0.062[𝐿𝐿𝑑𝑑𝑙𝑙]− 0.20[𝐶𝐶𝑎𝑎𝑙𝑙2]
− 0.048[𝑀𝑀𝑔𝑔𝑙𝑙2] +42[𝐿𝐿𝑑𝑑𝑙𝑙] ∙ [𝐴𝐴𝑙𝑙𝑙𝑙3]
2000 + [𝐿𝐿𝑑𝑑𝑙𝑙] ∙ [𝐴𝐴𝑙𝑙𝑙𝑙3] (28)
and
𝐵𝐵 = 4.8− 0.048[𝐴𝐴𝑙𝑙𝑙𝑙3] +2.2[𝐿𝐿𝑑𝑑𝑙𝑙]1.5
10 + [𝐿𝐿𝑑𝑑𝑙𝑙] + 0.001[𝐴𝐴𝑙𝑙𝑙𝑙3]3 (29)
where the square brackets denote weight percent of the components in the system Na3AlF6-Al2O3 (sat)-AlF3-CaF2-MgF2-LiF and t is the temperature in degrees Celsius [71].
Hence, an electrolyte with the following composition was prepared: 9.3 wt. % AlF3 (≥ 90%, rest mainly free Al2O3; industrial grade, Alcoa), 5.0 wt. % CaF2 (≥ 99.8%, Merck), and 9.0 wt. % Al2O3 (99.5%, Merck). The cryolite ratio was 2.3. Using an alumina-saturated electrolyte minimized the attack of the electrolyte on alumina materials used in the cell.
Batches of 250 g electrolyte with the as-mentioned composition were prepared and poured into the graphite crucible. The crucible filled with electrolyte was then placed in a drying cabinet at 120 °C for at least 24 h prior to electrochemical measurements and electrolysis runs.
Figure 2.1-2: Schematic of the gas transport system.
CH4
N2
gas resource
valve electronic valve
overpressure valve
valve pressure meter
to the anode

31
Reference electrodes were prepared based on and similar to the WMH (Wetted Molybdenum Hook) Al3+/Al reference electrode reported by Burgman et al [72]. The reference electrode consisted of an Ø6/10×450 mm alumina tube (99.0% Al2O3) with one closed end. This tube was filled with 0.5 g pure aluminium, small cut pieces, which after melting made an aluminium pool at the bottom of the tube. Another alumina tube (99.0% Al2O3) Ø6/10×450 mm was placed inside the larger tube. A Ø1.0 mm molybdenum wire (99.95% Mo), Goodfellow Cambridge Ltd., was passed through the inner alumina tube. This inner tube served as the sheath of the Mo wire. Around 5 mm of the Mo wire was left unshielded and the gap between the alumina and the wire was sealed by Sauereisen Electrotemp Cement No. 8. This unshielded portion of the wire was later completely immersed in the aluminium pool. A small hole was made 20 mm above the closed end of the outer alumina tube to enable the electrolyte entering the reference electrode. The top part of the reference electrode was sealed by silicon blue. The reference electrode is depicted in Figure 2.1-3.
It can clearly be seen that the Sauereisen Electrotemp Cement No. 8 sealed the sheath-wire gap effectively and prevented the penetration of liquid aluminium into the sheath (inner alumina tube). The Mo wire was wetted by aluminium and its shape was unaffected during the experiment. This makes the reference electrode more stable and reliable [72].
During the electrolysis run, the dissolved alumina was gradually consumed and its content in the electrolyte close to anode gradually decreased. Since the RE was made of alumina and it was also placed close to anode, the outer alumina tube was dissolved to compensate the shortage of alumina. When the applied current density was high this could result in severe dissolution of alumina tube and possible failure of the reference electrode. Therefore, in some of the experiments the reference electrode was slightly different. The outer part of the RE consisted of a Ø6×50 mm boron nitride tube with on closed end and the other end screwed on to a Ø6×450 mm stainless steel tube. The aluminium pool formed at the bottom of the BN section, along with the shielded Mo wire were placed inside the combined BN-steel tube. This type of reference electrode was used when the current density during electrolysis was high.

32
Figure 2.1-3: Al3+/Al reference electrode used in this study.
2.2. Anode materials and assembly
2.2.1. Graphite grades Different graphite grades purchased from various suppliers were tested in this study to find the best material for the anode. These graphite anodes were tested in electrolysis and electrochemical method measurements. Typical properties of the graphite grades are presented in Table 2.2-1. These properties are provided by the suppliers’ datasheets.
2.2.2. Anode assembly The as-received graphite bars from the suppliers were cut into cylindrical pieces of Ø20×25 or Ø20×20 mm to be used as anode. One such anode is shown in Figure 2.2-1. A hollow steel tube was used both as the current collector and as the carrier of the anode gas. Stainless steel tubes 316L Ø3.5/6×500 or Ø3.5/6.35×500 mm were used for this purpose. A hole with Ø6 and 15-20 mm long was drilled into the graphite cylinders. M6 threads were made in the hole as well on the steel tube, so that cylindrical graphite and steel tube could be screwed together. An empty space of 5 mm long was left in front of the steel tube. The thickness of the anode bottom was ~3-5 mm. Figure 2.3-1 (a) and (b) show the schematic and picture of the anode assembly.
A slightly different design was also tried in some of the electrolysis experiments. In this design, the as-mentioned graphite cylinder was covered by another cup-shaped graphite piece to minimize the gas escape from the anode assembly.

33
Table 2.2-1: Typical properties of different graphite grades used in this study [73-76]
Grade No.
Grade name
Specific gravity (g/cm3)
Porosity (%)
Grain size (μm)
Supplier
1 G348 1.92 8 8 Tokai 2 G347 1.85 12 11 Tokai 3 EG-92E 1.75 16 800 Tanso 4 TM 1.82 20 10 POCO 5 G140 1.7 20 1000 Tokai 6 KWPSY 1.6 20 20002 Tokai 7 PC-100 1.1 30 - Graftech
Figure 2.2-1: The graphite piece used as anode.
The cup-shaped graphite piece was made from a much denser grade (G348; see Table 2.2-1) with very low air permeability to prevent the anode gas from escaping from the anode assembly. This second anode assembly is presented in Figure 2.3-1 (c) and (d).
2.3. Gas analysis In this study for the analysis of the electrolysis cell off gas two instruments were used. A tuneable diode laser (TDL) NEO LaserGas II was used to analyse the levels of H2O and HF in the raw gas. It was connected to a computer and the values were read and recorded every 10 s. In some experiments a Protea LTD ProtIR
2 Maximum grain size [73] Graphite & carbon specialistes Tokai Carbon Europe.

34
204M process analyser, which is an FTIR multi-component gas analyser was also employed for analysis of other gas components in the off gas.
Figure 2.3-2 demonstrates a schematic of the experimental setup and the instruments used in this study.
(a)
(c)
Figure 2.3-1: The anode assemblies used in this study; schematics and pictures of the anodes.
Steel tube Ø6
M6 threads
Empty space
20
25
30
Steel tube Ø6
M6 threads Empty space
(b)
(d)

35
Figure 2.3-2: A schematic of the off-gas analysis setup.

36
The electrolysis off gas exited the furnace through an alumina tube Ø6 mm which was placed about 10 cm above the electrolysis bath. Then, the gas was transported from top of the furnace to a laser gas analyser through a PFA tubing Ø1/4”. A flow of dry nitrogen (100 ml min-1) was also flushed to the analyser compartment of the instrument to dilute the off gas coming from the furnace. Nitrogen was also flushed to the outer circuits of the laser to remove any moisture from the transmitter and receiver compartments of the instrument.
After exiting from the laser instrument, the gas passed through a plastic container of alumina beads (alumina scrubber). At this step, the HF was removed from the gas. This is due to an irreversible reaction, aided by water, which leads to adsorption of hydrogen fluoride on the alumina beads [2]. Then, the gas was conveyed through tubes to the final gas ventilation duct.
In those experiments where the FTIR gas analyser was used, the off gas was conveyed to this instrument after the HF cleaning step. A flow of dry nitrogen (200-500 ml min-1) was also mixed in with the gas stream before the FTIR instrument to dilute the off gas. Finally, after exiting FTIR instrument the gas was conveyed through tubes to the final gas ventilation duct.
All the connections between furnace, the analyser instruments and the final ventilation duct were PFA tubing Ø1/4”.
2.4. Electrochemical methods
2.4.1. Galvanostatic electrolysis The galvanostatic electrolysis experiments were mostly performed using an Agilent 6032A DC Power Supply. This was equipped with LabVIEW software version 8.5, National Instruments, for controlling the flow rate of the anode gas and recording the cell voltage, temperature and the pressure before the anode. In some experiments an Autolab potentiostat, PGSTAT20, was employed for galvanostatic electrolysis. The potentiostat was operated with GPES (General Purpose Electrochemical System) software (version 4.9, Eco Chemie B.V. Utrecht, Netherlands) with an upper limit of 1 A. Therefore, an Autolab 10A power booster was also utilized to perform electrolysis and electrochemical measurements at higher currents. Galvanostatic electrolysis was carried out at 2.26, 2.51, 3.52 and 7 A and at different current densities. The desired current density was set by dipping the anode in the bath. The depth of the anode in the

37
bath exposed the desired geometrical surface of the anode to the bath and in turn, determined the current density. This submerged area of the anode was clearly visible after the experiments. It is noteworthy to mention that only the apparent current density could be controlled since anodes were porous and the real active surface area could not be determined in this way. All the electrolysis runs were performed at 970 °C. After reaching the target temperature the furnace contents could equilibrate for at least 1.5 h before starting the electrochemical measurement.
2.4.2. Cyclic voltammetry (CV) and electrochemical impedance spectroscopy (EIS)
Cyclic voltammetry (CV) and electrochemical impedance spectroscopy (EIS) were also carried out using the as-mentioned Autolab potentiostat and power booster. The impedance measurements were controlled by FRA (Frequency Response Analyser) software (version 4.9, Eco Chemie B.V. Utrecht, Netherlands) and for the cyclic voltammetry measurements the GPES software, same as electrolysis, was used.
The electrochemical measurements were carried out in five steps: First, impedance spectroscopy was run at open circuit potential (OCP) without flushing any gas to the anode. This was followed by galvanostatic polarization of the anode at 3.52 A (0.4 A cm-2) for a period of 20 min while nitrogen was supplied to the anode (20 ml min-1). As the third step, cyclic voltammetry was performed at different scan rates (5–1000 mV s-1) with and without supplying gas (CH4) to the anode. Afterwards, multi-potential EIS measurements were run both with and without supplying gas (CH4, 20 ml min-1) to the anode. Finally, galvanostatic electrolysis was carried out as explained in the previous section. The EIS was performed at frequency range 0.1 - 1.0×10⁵ Hz with 20 mVapp AC amplitude.
2.5. Anode transport properties As discussed in earlier chapters the transport properties of graphite anodes have a key role in proper transport of reactants and products and also in establishing the three-phase boundary between the gas, electrolyte and anode. Therefore, gas permeation measurements and mercury porosimetry were carried out to characterize the graphites regarding their transport properties.

38
2.5.1. Air-permeability
The fluid flow through porous media has been formulated by Darcy’s law. This law is expressed as:
𝑉𝑉 = −𝐾𝐾𝜇𝜇
(∇𝑃𝑃 − 𝜌𝜌𝑔𝑔) (30)
where V, μ and ρ represent the average velocity, viscosity and density of the fluid, respectively. K is the permeability, P is pressure, and g is the gravity vector. This law relates the average fluid velocity to a morphological property of the media; i.e. permeability. The concept of permeability of porous medium is a measure of how easily a fluid flows through the medium. The permeability K depends on the porosity φ of the medium. The porosity is the volume fraction of the medium’s pore space.
When the porous media under study is isotropic, then a cylindrical core sample is usually used to measure the permeability. According to Darcy’s law, equation (30), the permeability can be measured if there is a single steady-state flow rate. However, in order to minimize the experimental errors, it is better to do the measurement at different pressure gradients, measure the volume flow rate and estimate the permeability from the best straight-line fit of data. When the permeability is measured by using a gas, then compressibility must be taken into account. In such cases the following formulae is used:
𝑉𝑉𝑥𝑥
(2) = −�𝐾𝐾𝜇𝜇��𝑃𝑃22 − 𝑃𝑃12
2𝑃𝑃2𝐿𝐿� (31)
where 𝑉𝑉𝑥𝑥(2)is the fluid velocity at point two (exit) and x is the direction of the
macroscopic flow [77].
The fundamental SI unit of permeability is meter squared (m2). The practical units are darcy (d) and millidarcy (md). The conversions are as below [78]:
1 md =1×10⁻³ d
1 d = 0.986923 µm2
1 µm2 = 1×10-12 m2

39
The air permeability of the graphite samples was measured. For this purpose, first a Carbon R&D RDC-145 Air Permeability apparatus was used; see Figure 2.6-1. This apparatus determines the air permeability by measuring the time that a gas (air) needs to pass through a sample to refill a partly evacuated system. The sample must be in shape of a cylinder Ø50×50 mm. The results are calculated by a microprocessor and presented on a display. It has been designed for measuring baked carbon electrodes. Therefore, the sensitivity of the detectors, the maximum possible vacuum and the units of measure has been selected accordingly. This apparatus can measure the samples having permeability in the range from 10 to 300 millidarcy [79].
However, the gas permeability of some of the graphite samples was out of range of the RDC-145 Air Permeability apparatus. Therefore, another apparatus was used for these samples. Obviously, both apparatus measure the gas permeability based on same principles. Generally, for measuring gas permeability a gas with a fixed flow rate is streamed through the porous sample and the consequent pressure gradient generated over the length of the sample is measured. This second apparatus has been made and developed in-house at the Department of geoscience and petroleum, Norwegian University of Science and Technology (NTNU), Trondheim, Norway. A schematic of this second apparatus is presented in Figure 2.6-2. It consists of a cylindrical sample holder which is placed horizontally; barometers for measuring the upstream and downstream pressures, a flowmeter for measuring the flow rate at the downstream, and needle valves for adjusting the flows and pressures. The graphite samples were cut into cylinders of Ø1.5” to be fitted to the sample holder. In order to ensure that the test gas is only streamed through the porous specimen, the graphite sample was placed in a rubber sleeve before being placed in the sample holder. In addition, a 15-bar pressure was applied to the rubber which makes the sample – rubber sleeve connection completely gas-tight. This pressure was applied by nitrogen gas from the cylinder; see Figure 2.6-2. After measurement of each sample a partial vacuum was applied to the rubber sleeve which facilitated the detachment of the sample. The air permeability was measured at different positive inlet pressures, which were regulated by needle valves. After allowing sufficient time for reaching the steady state, the upstream and downstream pressures were recorded and the measurement was repeated at a different inlet

40
pressure. This repetition minimizes the experimental errors and gives more precise results.
2.5.2. Porosimetry The pore size distribution of the graphite samples was determined by a mercury porosimeter (AutoPore IV 9500, Micromeritics). This technique is based on the intrusion of mercury into a porous structure under stringently controlled pressures. This instrument can determine a broad pore size distribution (0.003 to 360 micrometres) [80]. The graphite samples were ~ 2 g. The graphite samples had fractured surfaces to have a more accurate measurement since when graphite is cut it might end up with smeared surfaces.
2.6. Microscopy observations (SEM) After electrolysis, the graphite anodes were studied by Scanning Electron Microscope (SEM) Hitachi S-3400 N. This was equipped with Energy-dispersive X-ray Spectroscopy (EDS) Oxford Instruments INCA 7021.
Figure 2.6-1: Carbon R&D RDC-145 Air Permeability apparatus.

41
Figure 2.6-2: Schematic of the permeability experimental setup.
Needle valve
Sample Pressure gauge
Pressure gauge
Test gas (air) in
To water tap and vacuum
Outlet
Needle valve
Flow meter
Nitrogen cylinder
Rubber

42

43
Chapter 3
3. Results and Discussion
3.1. Paper 1
Porous carbon anodes for the supply of methane during electrowinning of aluminium
Babak Khalaghi1, Henrik Gudbrandsen2, Ole Sigmund Kjos2, Karen Sende Osen2, Tommy Mokkelbost2, Geir Martin Haarberg1
1Department of Materials Science and Engineering, Norwegian University of Science and Technology (NTNU), NO-7491, Trondheim, Norway 2Sintef Materials and Chemistry, Trondheim 7465, Norway
Keywords: Aluminium electrolysis, Porous anodes, Methane
This paper has been published in TMS Light Metals 2016 pp 915-920 [81], However, note that some minor corrections have been made to this paper post-acceptance for spelling/typos and to improve clarity.

44
Abstract
One of the major downsides of the current aluminium production process is the high amount of CO2 emission. One alternative is to replace the consumable carbon anodes with inert anodes so that oxygen evolves instead of CO2 and PFC emissions. However, so far a sufficiently inert anode has not been found. Another option is to utilize natural gas through porous anodes. This will decrease CO2 emission remarkably and also eliminate PFC emissions and anode effect. The porous anode could be made of carbon or it can be inert. However, the as-mentioned problem still exists regarding porous inert anodes. Therefore, at the moment porous carbon anodes seem to be the best practical option. In this study, porous anodes made of different grades of graphite were used for electrolysis experiments. Also, off-gas analysis was performed to get an insight of the ongoing reactions. Our results show that for some types of graphite anodes, methane participates effectively in the anodic reaction.
Introduction
In the current industrial aluminium production process (Hall-Héroult process) consumable carbon anodes react with the oxygen-containing ions in the electrolyte at the anode/electrolyte interface. As a result, a large amount of CO2 as the main gaseous product is emitted. The following reaction can be considered as the overall reaction of the process [2]:
Al2O3 (diss.) + 3/2C (s) = 2Al (l) + 3/2CO2 (g) (1)
This large amount of generated CO2 is one of the major weaknesses of aluminium production process; since CO2 is a greenhouse gas. To solve this problem an inert anode can be used which changes the anodic reaction to oxygen evolution. But a suitable material as an inert anode in the current aluminium electrolysis process must fulfil several requirements [18]. There have been only laboratory and bench scales tests to try inert anodes so far [19]. In conclusion, a prospective industrial inert anode still seems to be unreachable; at least in the near future.
Another possibility is to supply a reducing gas (e.g. CH4) to the anode/electrolyte interface through a porous anode. Then, the gas participates in the anodic reaction and the overall reaction changes from (1) to the one shown below:
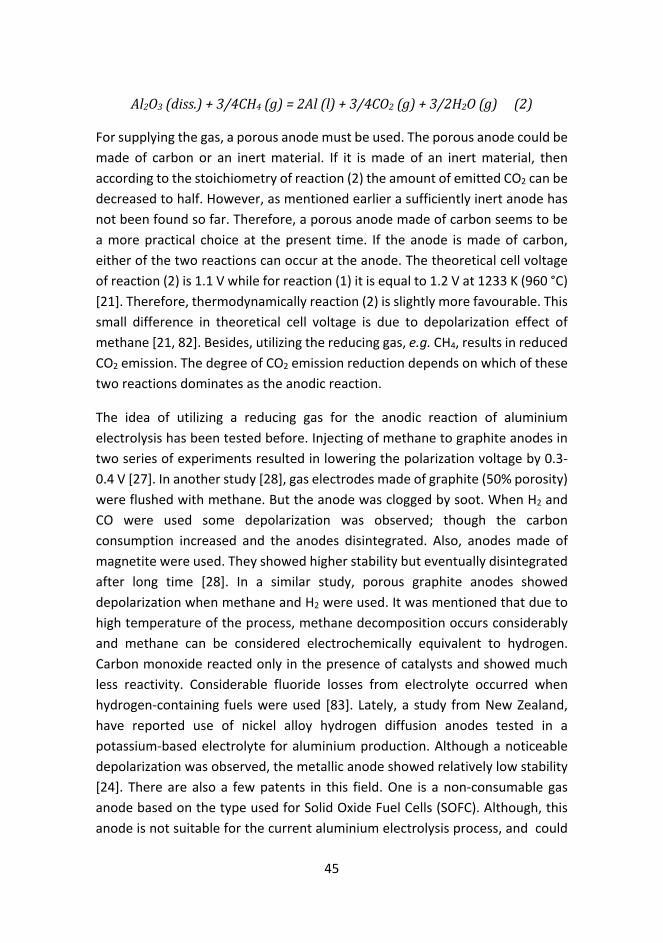
45
Al2O3 (diss.) + 3/4CH4 (g) = 2Al (l) + 3/4CO2 (g) + 3/2H2O (g) (2)
For supplying the gas, a porous anode must be used. The porous anode could be made of carbon or an inert material. If it is made of an inert material, then according to the stoichiometry of reaction (2) the amount of emitted CO2 can be decreased to half. However, as mentioned earlier a sufficiently inert anode has not been found so far. Therefore, a porous anode made of carbon seems to be a more practical choice at the present time. If the anode is made of carbon, either of the two reactions can occur at the anode. The theoretical cell voltage of reaction (2) is 1.1 V while for reaction (1) it is equal to 1.2 V at 1233 K (960 °C) [21]. Therefore, thermodynamically reaction (2) is slightly more favourable. This small difference in theoretical cell voltage is due to depolarization effect of methane [21, 82]. Besides, utilizing the reducing gas, e.g. CH4, results in reduced CO2 emission. The degree of CO2 emission reduction depends on which of these two reactions dominates as the anodic reaction.
The idea of utilizing a reducing gas for the anodic reaction of aluminium electrolysis has been tested before. Injecting of methane to graphite anodes in two series of experiments resulted in lowering the polarization voltage by 0.3-0.4 V [27]. In another study [28], gas electrodes made of graphite (50% porosity) were flushed with methane. But the anode was clogged by soot. When H2 and CO were used some depolarization was observed; though the carbon consumption increased and the anodes disintegrated. Also, anodes made of magnetite were used. They showed higher stability but eventually disintegrated after long time [28]. In a similar study, porous graphite anodes showed depolarization when methane and H2 were used. It was mentioned that due to high temperature of the process, methane decomposition occurs considerably and methane can be considered electrochemically equivalent to hydrogen. Carbon monoxide reacted only in the presence of catalysts and showed much less reactivity. Considerable fluoride losses from electrolyte occurred when hydrogen-containing fuels were used [83]. Lately, a study from New Zealand, have reported use of nickel alloy hydrogen diffusion anodes tested in a potassium-based electrolyte for aluminium production. Although a noticeable depolarization was observed, the metallic anode showed relatively low stability [24]. There are also a few patents in this field. One is a non-consumable gas anode based on the type used for Solid Oxide Fuel Cells (SOFC). Although, this anode is not suitable for the current aluminium electrolysis process, and could

46
be utilized in a modified Hall-Héroult process [84]. The other patent is an anode made of porous graphite or a carbon-based material. The anode has the roles of both conducting electricity and conveying and distributing the reducing gas [21].
We have been working on this concept of reducing gas-supplied anodes for aluminium electrolysis using porous anodes; both inert (e.g. SnO2) and graphitic; where methane and H2 were chosen as reducing gases and a modified electrolyte at 850 °C was used [82, 85, 86] Considerable depolarization was detected when using SnO2 anodes. Flushing methane through graphite anodes also showed a tiny depolarization effect [82]. Due to probable dissolution of SnO2 anode in the electrolyte, in the present study we have focused on graphite anodes using an electrolyte similar to what is used in industry for production of aluminium.
Experimental
The electrolyte composition was 6 wt. % AlF3 (Noralf, Boliden Odda AS) and 5 wt. % CaF2 (Merck, > 97 %), 4.5 wt. % anhydrous γ-Al2O3 (Merck, > 98 %) and remaining Na3AlF6 (natural cryolite, Greenland). The cryolite ratio was 2.5 and it was saturated with alumina. Figure 3.1-1 illustrates the schematic of the experimental set-up. A graphite crucible contained the electrolyte. The walls of the crucible were lined with alumina and its bottom served as the cathode. A hollow steel tube screwed to the porous carbon anode was used as current collector. The anode and cathode were positioned horizontally in respect to each other. A molybdenum wire (Norsk Spesialmetall, 99.9 pct) wire (1 mmØ) was used as the current collector. The wire was passed through an alumina tube and both were placed into another alumina tube. The outer alumina tube contained aluminium at the bottom. There was a small hole near the bottom of the outer alumina tube where electrolyte could enter the reference electrode. The whole system served as an Al3+/Al reference electrode. All of the potentials were measured versus this aluminium reference electrode. The crucible containing the bath was dried in air at 120 °C overnight. Furnace and bath were also dried at 200 °C in N2 for a few hours before heating up the furnace to the working temperature at 970 °C. The furnace was continuously flushed with N2. The inlet gas composition for the anode was controlled using mass flow controllers (Bronkhorst) and the inlet gas pressure was measured. The whole electrochemical cell was placed in a vertical tube furnace heated by resistance

47
wires, and connected to a temperature controller. The gases were flushed into the porous anode with the gas flow equal to 20 ml min-1.
Galvanostatic electrolysis experiments were performed using porous anodes made of three different graphite grades (Tokai Carbon Group). Some of the properties of graphite grades used for preparing anodes are given in Table 3.1-1. Each experiment was started by applying a constant current of 2.3 A to the cell - corresponding to an apparent current density of 0.4 Acm-2 – while N2 was passed through the porous anode for the first 45 min of the electrolysis time and afterwards changing the gas to CH4 and continuation of the electrolysis for 4 h (total time: 285 min). This procedure enabled us to detect if there is any depolarization upon introduction of the CH4 to the anode. Also, another series of electrolysis experiments were carried out without using methane for comparison and in order to have a better insight of the process and for comparison. In this series, only nitrogen was flushed into the anode; while the rest of the experimental conditions were unchanged.
Figure 3.1-1: Schematic of the electrolysis cell.
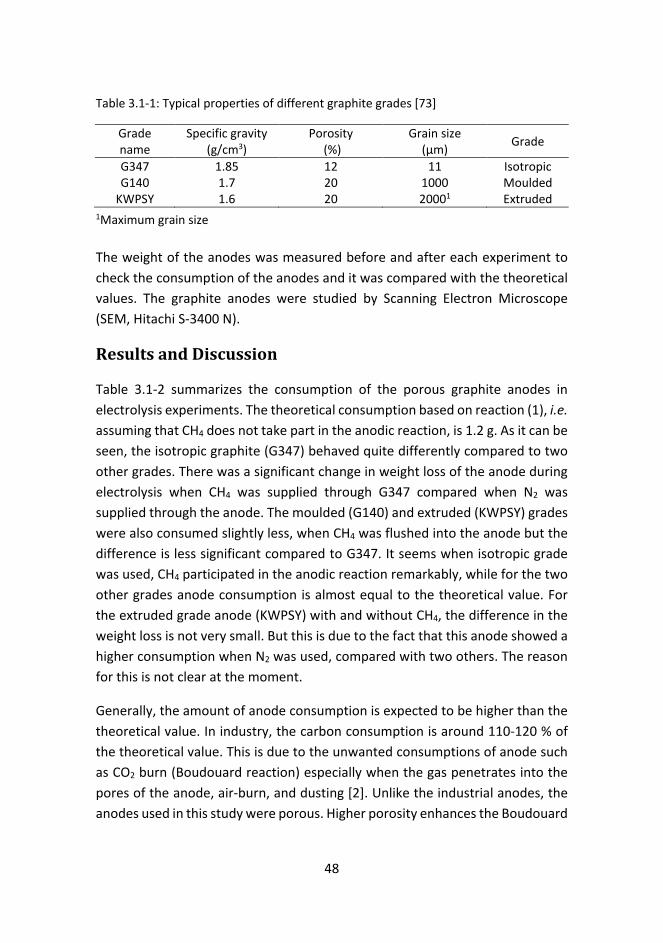
48
Table 3.1-1: Typical properties of different graphite grades [73]
Grade name
Specific gravity (g/cm3)
Porosity (%)
Grain size (μm) Grade
G347 1.85 12 11 Isotropic G140 1.7 20 1000 Moulded
KWPSY 1.6 20 20001 Extruded 1Maximum grain size The weight of the anodes was measured before and after each experiment to check the consumption of the anodes and it was compared with the theoretical values. The graphite anodes were studied by Scanning Electron Microscope (SEM, Hitachi S-3400 N).
Results and Discussion
Table 3.1-2 summarizes the consumption of the porous graphite anodes in electrolysis experiments. The theoretical consumption based on reaction (1), i.e. assuming that CH4 does not take part in the anodic reaction, is 1.2 g. As it can be seen, the isotropic graphite (G347) behaved quite differently compared to two other grades. There was a significant change in weight loss of the anode during electrolysis when CH4 was supplied through G347 compared when N2 was supplied through the anode. The moulded (G140) and extruded (KWPSY) grades were also consumed slightly less, when CH4 was flushed into the anode but the difference is less significant compared to G347. It seems when isotropic grade was used, CH4 participated in the anodic reaction remarkably, while for the two other grades anode consumption is almost equal to the theoretical value. For the extruded grade anode (KWPSY) with and without CH4, the difference in the weight loss is not very small. But this is due to the fact that this anode showed a higher consumption when N2 was used, compared with two others. The reason for this is not clear at the moment.
Generally, the amount of anode consumption is expected to be higher than the theoretical value. In industry, the carbon consumption is around 110-120 % of the theoretical value. This is due to the unwanted consumptions of anode such as CO2 burn (Boudouard reaction) especially when the gas penetrates into the pores of the anode, air-burn, and dusting [2]. Unlike the industrial anodes, the anodes used in this study were porous. Higher porosity enhances the Boudouard

49
reaction even more effectively [2]. So, higher consumption of porous anodes was expected in these cases.
However, it is seen here that for all the graphite grades when CH4 was applied, the weight loss was less than theoretical consumption. Hence, it is likely that CH4 was involved in the anodic reaction - at least to some extent - for all graphite grades. This conjecture sounds more probable when we consider the probable thermal cracking of CH4 resulting in precipitation of carbon in the porous structure of the anode. Methane becomes unstable in terms of its elements from 530 °C. However, the reaction kinetics is slow. The equilibrium constant for cracking of methane is around 87 at T = 970 °C [87]. Therefore, this reaction is most likely to happen in our experiments, at least to some extent. Precipitated carbon can add to the final weight of the anodes. One experiment was performed to check this, where all the conditions were unchanged, except that no current was passed. So, the sole factor influencing the anode weight was the amount of carbon precipitation. It was found that around 0.2 g carbon was precipitated in 4 h (the same time CH4 was flushed into anodes during electrolysis experiments).
Consequently, the amount of graphite consumption was probably even less than the values reported in Table 3.1-2. This means that methane has been involved in the anodic reaction even more. Apart from the electrochemical reaction and cracking reaction, there exists another factor which might have changed the anode weights. This is the electrolyte which enters the porous structure of the graphite during electrolysis and can add to the final weight of the anode.
Table 3.1-2: The consumption of graphite anodes when supplied with only N2 and when supplied with N2 + CH4 during electrolysis in cryolite-based electrolyte at 970 °C for 285 min. The theoretical consumption is 1.2 g.
Graphite type Anode gas Weight loss (g) Consumption (%)
Isotropic (G347) N2 + CH4 0.67 56
N2 1.28 107
Moulded (G140) N2 + CH4 1.15 96
N2 1.24 103
Extruded (KWPSY) N2 + CH4 1.16 97
N2 1.4 117

50
However, this seems to be negligible since in all the experiments when the electrolysis was finished the anode was pulled out of the bath and was flushed with N2 for 1 hour. This caused the remained electrolyte, if some, to be pushed out of the anode. SEM studies of the graphite anodes also confirmed that the graphites structure was essentially electrolyte free after the experiments.
Figure 3.1-2, shows the pressure measured before the anode, upon introduction of gas (N2) to the anode for different graphite grades. As can be seen, different graphite grades behaved differently when the gas (N2) was introduced into the anode. This was before submerging the anode into the salt bath and the anode was placed 2 cm above the melt. The isotropic grade showed the largest pressure increase, around 0.5 bars, the moulded grade showed less increase, around 0.25 bars; while the extruded grade did not show any pressure increase. This difference can be attributed to the large difference in grain/pore size of these graphite grades. The pores in the extruded grade were large enough to avoid any resistance for the flow of the gas.
Figure 3.1-3 shows the cell potential and pressure changes during aluminium electrolysis using isotropic grade (G347) anode for two different experiments.
Figure 3.1-2: Measured pressure before the anode, upon introduction of gas (N2) to the graphite anode for different graphite grades; Solid line: Isotropic (G347), dotted line: Moulded (G140) and dashed line: Extruded (KWPSY).
0 10 20 30 40
time /min
0.5
1.0
1.5
2.0
P /b
ar
Isotropic (G347)
Moulded (G140)
Extruded (KWPSY)
anode out,
N2
anode out,
no gas
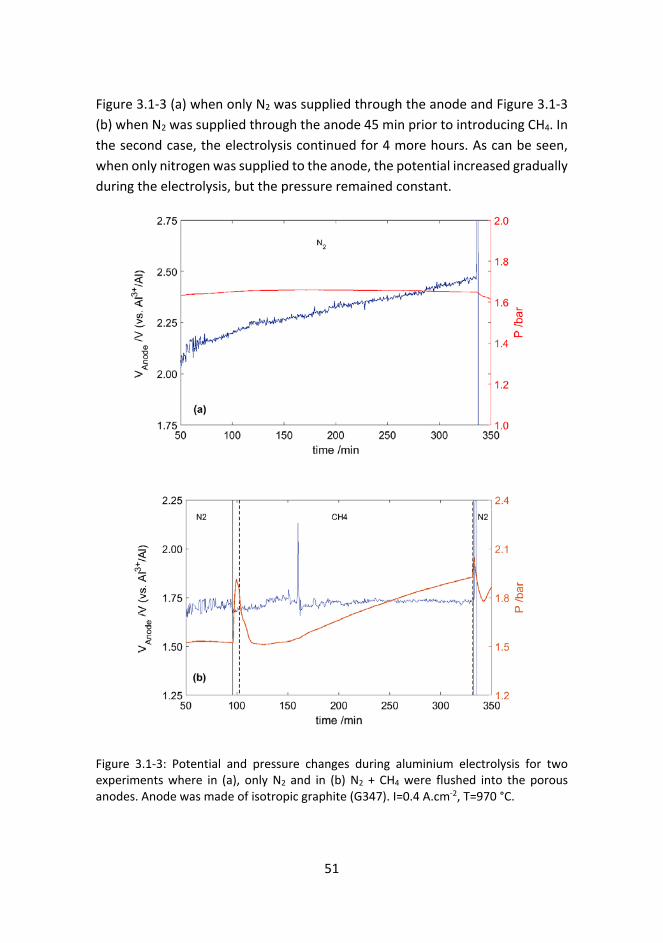
51
Figure 3.1-3 (a) when only N2 was supplied through the anode and Figure 3.1-3 (b) when N2 was supplied through the anode 45 min prior to introducing CH4. In the second case, the electrolysis continued for 4 more hours. As can be seen, when only nitrogen was supplied to the anode, the potential increased gradually during the electrolysis, but the pressure remained constant.
Figure 3.1-3: Potential and pressure changes during aluminium electrolysis for two experiments where in (a), only N2 and in (b) N2 + CH4 were flushed into the porous anodes. Anode was made of isotropic graphite (G347). I=0.4 A.cm-2, T=970 °C.

52
This is due to the consumption of graphite resulting in decrease of surface area and consequently increased current density. This is in agreement with previous studies demonstrating an increase in the anodic overvoltage when current density is increased [88]. A rough calculation demonstrates that the change in the surface area was noticeable. The surface area prior to electrolysis was 6.28 cm2 and the approximate value for the final surface area was: Af ≈ 5 cm2. The final surface area was calculated based on the geometrical surface of the anode after electrolysis. Assuming the change in surface area and a constant current the apparent current density increased from 0.37 A.cm-2 to 0.46 A.cm-2 during electrolysis.
However, when CH4 was introduced to the anode the potential became stable and it remained almost constant throughout the electrolysis period. The vertical lines in Figure 3.1-3 (b) represent the time when the gas anode was shifted from nitrogen (dashed line) to methane (solid line). There was an abrupt increase and decrease in pressure which is because of supply of both gases during the shifting time. After that as can be seen, introduction of methane to the anode caused a gradual pressure increase which lasted as long as methane was flushed; i.e. until the end of electrolysis. This is due to carbon precipitation from the cracking reaction of methane. If the electrolysis had continued for a longer time, it might have led to clogging; as observed earlier in another study [28].
The change in cell voltage agrees with the weight loss data (Table 3.1-2). It is clear that methane was significantly involved in the anodic reaction, so the potential was stable and did not increase. However, the problem of clogging might prevent long term electrolysis. A suitable anode design could possibly prevent the probable and undesirable clogging. There is a small difference in the cell potential in the beginning between these two experiments, although the anodes were similar and both experiments were started by supplying N2 to the anode. The reason is not clear.
The potential and pressure changes for the two other graphite grades (G140 and KWPSY) are illustrated in Figure 3.1-4; both when there was only N2 Figure 3.1-4 (a), and when CH4 was also used as the gas anode, Figure 3.1-4 (b) and (c). As can be seen, when N2 was introduced through the anode the potential showed the gradual increase during electrolysis as also observed for isotropic grade Figure 3.1-4 (a); which was due to increased current density.

53
In contrast to the isotropic grade (G347), Figure 3.1-3 (b), providing the anode made of the other two graphite grades with methane, did not change the potential behaviour, Figure 3.1-4 (b) and (c). The potential behaviours were similar to the experiments where only N2 was flushed to the anode, Figure 3.1-4 (a). So, it suggests that the contribution of the methane in the anodic reaction was not significant in these cases and this is in agreement with results from the weight change results. Moreover, by comparing the cell voltage during electrolysis between the isotropic grade and the two other grades, it is revealed that the potential fluctuations were much less pronounced. The observed fluctuations in cell voltage can be due to bubble formation when introducing the gas though the anode. It is assumed that smaller grain pore size due to smaller grain size will result in smaller bubble sizes which finally will result in weaker fluctuations in the cell voltage.
Pressure changes are also shown for the experiments were CH4 was used as reducing gas, Figure 3.1-4. It is clear that in the case of moulded grade, Figure 3.1-4 (b), similar to isotropic grade (G347), carbon precipitation led to pressure build up; although to a lower degree. However, the extruded grade, Figure 3.1-4 (c), did not show any pressure build up. This can be attributed to the larger grain/pore size of this grade, as mentioned before.

54
Figure 3.1-4: Potential and pressure changes during aluminium electrolysis where only N2 (a), or N2 + CH4 were flushed into the porous anodes made of moulded (b), and extruded (c) graphite grades. I=0.4 A.cm-2, T=970 °C.
The pressure changes during electrolysis for these grades are consistent with those observed upon introduction of gas to the anode, Figure 3.1-2. In the

55
experiments were only N2 was used no pressure build-up was observed; since there was no carbon precipitation from the gas.
Figure 3.1-5 shows micrographs of fracture surfaces of the extruded (KWPSY) and isotropic (G347) graphite grades after electrolysis in cryolite-based electrolyte for 285 min at 970 °C; i = 2.3 A. For the extruded grade Figure 3.1-5 (a) and (b)) it is clear that there was no electrolyte left inside as little elemental contrast is observed in the back scattered electron micrograph after electrolysis and consecutive N2 flushing. This grade is quite coarse as can be seen in the images. Figure 3.1-5 (c) and (d) show fracture surface areas from and isotropic (G347) graphite grade. This grade is much finer. There are small amounts of electrolyte left inside the structure very close to outer surface. Chemical analysis confirmed that the second phase is electrolyte. This might be due to smaller size of pores and finer structure of graphite which hinders the exit of electrolyte from the anode. Nevertheless, this amount seems to be negligible regarding the weight change of the anode.
Figure 3.1-5: SEM images of porous anodes. (a) SE and (b) BS image (extruded grade). (c) SE image, (d) BS image (isotropic grade).
(b) (a)
(c) (d)

56
Conclusion
In conclusion, the isotropic graphite grade (G347) showed a better performance as a gas anode compared to the moulded and extruded grades. From the weight change results and potential behaviour, it is clear that methane participates in the anodic reaction in a large extent when isotropic grade was used compared to the two other grades of graphite. The fact that isotropic grade behaved differently from the two others is mainly due to the much finer structure. It seems the finer grain/pore of the isotropic grade provided a better gas distribution and the three-phase boundary was well established. Further studies including off-gas analysis which can confirm our findings is undergoing.
Acknowledgment
Financial support is gratefully acknowledged from the Research Council of Norway, GASSMAKS program, and grant number 224985.
57
3.2. Paper 2
Natural gas anodes for aluminium electrolysis in molten fluorides Geir Martin Haarberg1, Babak Khalaghi1, and Tommy Mokkelbost2
1Department of Materials Science and Engineering, Norwegian University of Science and Technology (NTNU), NO-7491, Trondheim, Norway 2Sintef Materials and Chemistry, Trondheim 7465, Norway
This paper has been published in Faraday Discussions 2016 (190) pp 71-84 [89], However, note that some minor corrections have been made to this paper post-acceptance for spelling/typos and to improve clarity.

58
Abstract
Industrial primary production of aluminium has been developed and improved over more than 100 years. The molten salt electrolysis process is still suffering from low energy efficiency and considerable emissions of greenhouse gases (CO2 and PFC). A new concept has been suggested where methane is supplied through the anode so that the CO2 emissions may be reduced significantly, the PFC emissions may be eliminated and the energy consumption may decrease significantly. Porous carbon anodes made from different graphite grades were studied in controlled laboratory experiments. The anode potential, the anode carbon consumption and the level of HF gas above the electrolyte were measured during electrolysis. In some cases, it was found that the methane oxidation was effectively participating in the anode process.
Introduction
Aluminium is produced by the Hall-Héroult process, which was patented independently by Hall and Héroult in 1886. The overall primary cell reaction is:
𝐴𝐴𝑙𝑙2𝑂𝑂3(𝑑𝑑𝑑𝑑𝑑𝑑𝑑𝑑. ) + 3 2⁄ 𝐶𝐶(𝑑𝑑) = 2𝐴𝐴𝑙𝑙 (𝑙𝑙) + 3 2⁄ 𝐶𝐶𝑂𝑂2(𝑔𝑔) (1)
Alumina is dissolved in a molten fluoride electrolyte based on cryolite (Na3AlF6) containing AlF3 and CaF2 [2]. Modern cells are equipped with so-called prebaked carbon anodes and operate at ~955 °C in a horizontal electrode design. The theoretical anode carbon consumption is 333 g per kg Al, and consumed anodes must be replaced. Research to find inert anodes for oxygen evolution has not been successful. An alternative is to supply natural gas (methane) through the anode, which will give the following cell reaction:
𝐴𝐴𝑙𝑙2𝑂𝑂3(𝑑𝑑𝑑𝑑𝑑𝑑𝑑𝑑. ) + 3 4⁄ 𝐶𝐶𝐶𝐶4(𝑔𝑔) = 2𝐴𝐴𝑙𝑙(𝑙𝑙) + 3 4⁄ 𝐶𝐶𝑂𝑂2 (𝑔𝑔) + 3 2⁄ 𝐶𝐶2𝑂𝑂 (𝑔𝑔) (2)
The reversible cell potentials of reactions (1) and (2) are very similar; the standard potentials are ~1.2 V. The use of methane will reduce the amount of CO2 evolved by up to 50 %, and the anode process will occur at a lower anode potential due to the very low overvoltage. In principle, methane oxidation will eliminate replacement of anodes and the so-called anode effect which leads to the formation of PFC gases (CF4 and C2F6) that are strong greenhouse gases. The main challenge related to the use of methane in this process is the formation of water vapour which may lead to the presence of HF gas. Consumption of carbon

59
anodes according to reaction (1), the yield of methane consumption in reaction (2) and possible cracking of methane are other important issues.
The anodic overvoltage during industrial aluminium electrolysis is quite high, about 0.4 V at ~0.7 A/cm2 for so-called prebaked anodes [2]. At lower current densities, there is a linear relationship between anodic overvoltage and log current density.
Considerable research has been carried out to develop an inert oxygen evolving anode to replace the consumable carbon anode [90]. So far, no inert anode material has been developed for industrial operation. The most promising inert anode candidates have been based on tin oxide and nickel ferrite. In the case of using an inert anode the cell reaction will be the following:
𝐴𝐴𝑙𝑙2𝑂𝑂3(𝑑𝑑𝑑𝑑𝑑𝑑𝑑𝑑. ) = 2𝐴𝐴𝑙𝑙 (𝑙𝑙) + 3 2⁄ 𝑂𝑂2(𝑔𝑔) (3)
The reversible potential of reaction (3) is ~2.2 V.
Studies of so-called gas anodes for electrowinning in molten salts have been reported to some extent. Porous carbon was mainly used as the anode and a small depolarisation effect was observed in molten cryolite for aluminium electrolysis [26-28]. Magnetite has also been studied as the anode, but it was found to be unstable in molten cryolite during electrolysis. The use of hydrogen as an anodic reactant in porous or non-porous non-carbon electrodes, including metallic, metal oxide and refractory materials, was reported in a US patent in 1972 [91]. In 2000, another US patent on designing a non-consumable anode of the type used for solid oxide fuel cells (SOFC) with solid oxide membrane supplied with reformed natural gas was suggested for aluminium electrolysis [29]. More recent papers [92-94] are related to applying the solid oxide membrane technology to produce metals from their oxides in molten salts, with the introduction of hydrogen. A similar approach was applied in magnesium production in molten chlorides resulting in the depolarisation effect and the formation of HCl gas [95]. In addition, a thermodynamic analysis considering carbon and nickel-based hydrogen diffusion anodes in the electrolyte (Na3AlF6-AlF3-Al2O3) was carried out to identify optimum operating parameters in aluminium production in 2007 [96] and a nickel-based hydrogen diffusion anode was used in an experimental study of aluminium electrowinning, showing measurable depolarization of the anode potential in 2011 [24].
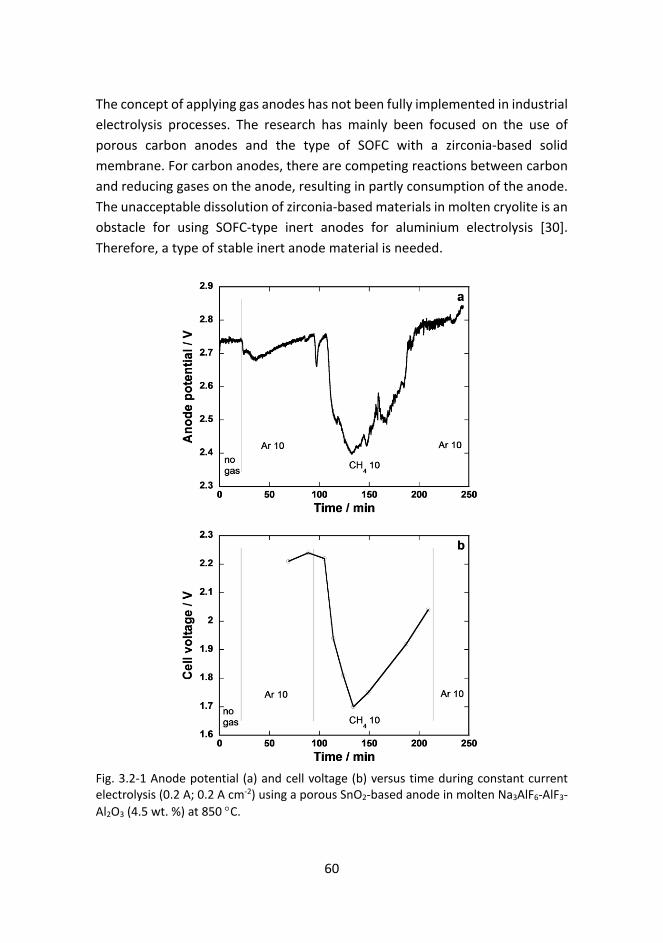
60
The concept of applying gas anodes has not been fully implemented in industrial electrolysis processes. The research has mainly been focused on the use of porous carbon anodes and the type of SOFC with a zirconia-based solid membrane. For carbon anodes, there are competing reactions between carbon and reducing gases on the anode, resulting in partly consumption of the anode. The unacceptable dissolution of zirconia-based materials in molten cryolite is an obstacle for using SOFC-type inert anodes for aluminium electrolysis [30]. Therefore, a type of stable inert anode material is needed.
Fig. 3.2-1 Anode potential (a) and cell voltage (b) versus time during constant current electrolysis (0.2 A; 0.2 A cm-2) using a porous SnO2-based anode in molten Na3AlF6-AlF3-Al2O3 (4.5 wt. %) at 850 °C.
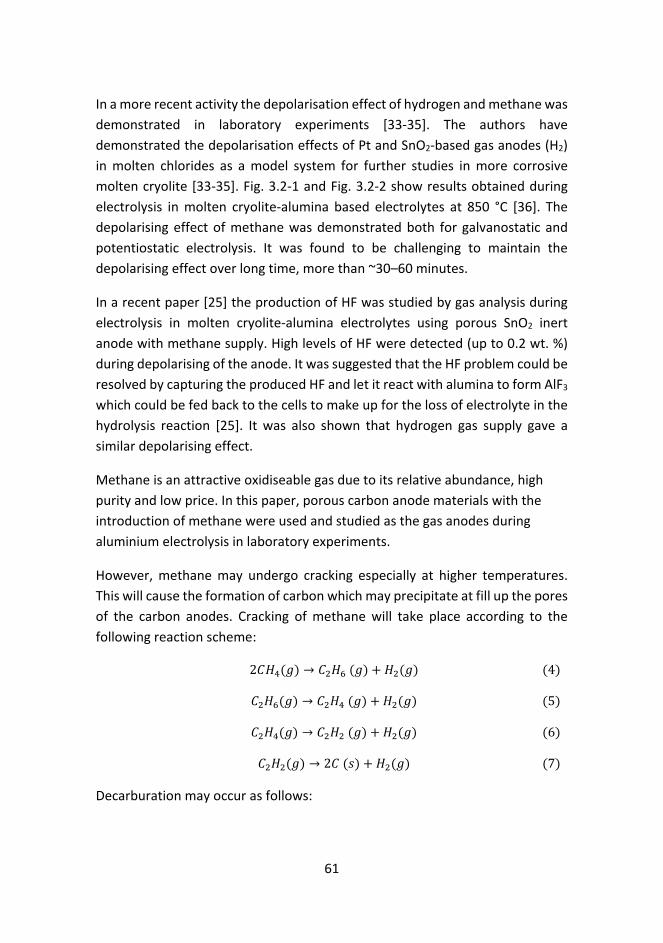
61
In a more recent activity the depolarisation effect of hydrogen and methane was demonstrated in laboratory experiments [33-35]. The authors have demonstrated the depolarisation effects of Pt and SnO2-based gas anodes (H2) in molten chlorides as a model system for further studies in more corrosive molten cryolite [33-35]. Fig. 3.2-1 and Fig. 3.2-2 show results obtained during electrolysis in molten cryolite-alumina based electrolytes at 850 °C [36]. The depolarising effect of methane was demonstrated both for galvanostatic and potentiostatic electrolysis. It was found to be challenging to maintain the depolarising effect over long time, more than ~30–60 minutes.
In a recent paper [25] the production of HF was studied by gas analysis during electrolysis in molten cryolite-alumina electrolytes using porous SnO2 inert anode with methane supply. High levels of HF were detected (up to 0.2 wt. %) during depolarising of the anode. It was suggested that the HF problem could be resolved by capturing the produced HF and let it react with alumina to form AlF3 which could be fed back to the cells to make up for the loss of electrolyte in the hydrolysis reaction [25]. It was also shown that hydrogen gas supply gave a similar depolarising effect.
Methane is an attractive oxidiseable gas due to its relative abundance, high purity and low price. In this paper, porous carbon anode materials with the introduction of methane were used and studied as the gas anodes during aluminium electrolysis in laboratory experiments.
However, methane may undergo cracking especially at higher temperatures. This will cause the formation of carbon which may precipitate at fill up the pores of the carbon anodes. Cracking of methane will take place according to the following reaction scheme:
2𝐶𝐶𝐶𝐶4(𝑔𝑔) → 𝐶𝐶2𝐶𝐶6 (𝑔𝑔) + 𝐶𝐶2(𝑔𝑔) (4)
𝐶𝐶2𝐶𝐶6(𝑔𝑔) → 𝐶𝐶2𝐶𝐶4 (𝑔𝑔) +𝐶𝐶2(𝑔𝑔) (5)
𝐶𝐶2𝐶𝐶4(𝑔𝑔) → 𝐶𝐶2𝐶𝐶2 (𝑔𝑔) +𝐶𝐶2(𝑔𝑔) (6)
𝐶𝐶2𝐶𝐶2(𝑔𝑔) → 2𝐶𝐶 (𝑑𝑑) + 𝐶𝐶2(𝑔𝑔) (7)
Decarburation may occur as follows:

62
2𝐶𝐶𝐶𝐶4(𝑔𝑔) → 2𝐶𝐶 (𝑑𝑑) + 4𝐶𝐶2(𝑔𝑔) (8)
Reaction (5) is not complete at temperatures lower than 1350 °C without the use of a catalyst such as nickel.
The presence of CO2 may change the methane reaction according to:
𝐶𝐶𝐶𝐶4(𝑔𝑔) + 𝐶𝐶𝑂𝑂2(𝑔𝑔) → 2𝐶𝐶𝑂𝑂 (𝑔𝑔) + 2𝐶𝐶2(𝑔𝑔) (9)
Small amounts of moisture are introduced to the electrolyte by surrounding air and alumina. This will cause the formation of gaseous HF according to the following reaction:
𝐴𝐴𝑙𝑙𝑙𝑙3(𝑑𝑑𝑑𝑑𝑑𝑑𝑑𝑑. ) + 3 2⁄ 𝐶𝐶2𝑂𝑂 (𝑔𝑔) = 3𝐶𝐶𝑙𝑙 (𝑔𝑔) + 1 2⁄ 𝐴𝐴𝑙𝑙2𝑂𝑂3(𝑑𝑑𝑑𝑑𝑑𝑑𝑑𝑑. ) (10)
Using a methane oxidising anode will cause the formation of a significant amount of moisture according to reaction (2). This may represent a major challenge for the gas anode concept if high amounts of HF are produced. Another concern is the consumption of electrolyte in the form of AlF3.
Fig. 3.2-2 Current versus time during electrolysis at constant anode potential (2.2 V; apparent anode area, 1 cm2) using a porous SnO2-based anode in molten Na3AlF6-AlF3-Al2O3 (4.4 wt. %) at 850 °C.

63
Experimental
The electrolyte composition was Na3AlF6 (natural cryolite, Greenland) with an excess of 6 wt. % AlF3 (Noralf, Boliden Odda AS) and 5 wt. % CaF2 (Merck, > 97 %) in addition to ~4.5 wt. % anhydrous γ-Al2O3 (Merck, > 98 %). The amount of alumina was close to saturation. The electrolyte composition is close to the electrolyte commonly used in industrial aluminium electrolysis. Fig. 3.2-3 shows the schematic of the experimental setup. The electrolyte was contained in a graphite crucible with a lining of sintered alumina, while the bottom of the crucible was the cathode. A hollow steel tube attached to the porous carbon anode was used as the current collector. The anode and cathode were positioned horizontally with respect to each other. A Mo wire (Norsk Spesialmetall, 99.9 pct, 1 mmØ) was used as the current lead. The wire was passed through an alumina tube which was placed inside another alumina tube with a closed bottom. The closed tube contained aluminium at the bottom, and was fitted with a hole above the metal so that electrolyte could enter. The whole system served as an Al3+/Al reference electrode. All potentials were measured against this aluminium reference electrode. The crucible containing the bath was dried in air at 120 °C overnight. The furnace and the cell with electrolyte were also dried at 200 °C in N2 for a few hours before heating up the furnace to the working temperature at 970 °C. The furnace was continuously flushed with N2. The inlet gas composition for the anode was controlled using mass flow controllers (Bronkhorst) and the inlet gas pressure was measured. The whole electrochemical cell was placed in a vertical tube furnace heated by resistance wires, and connected to a temperature controller. The gases were purged into the porous anode with a gas flow equal to 20 ml min-1. Galvanostatic electrolysis experiments were performed using porous anodes made of three different graphite grades. Some of the properties of the graphite grades used for preparing anodes are given in Table 3.2-1.
Table 3.2-1: Typical properties of different graphite grades [73] Grade name
Specific gravity (g/cm3)
Porosity (%)
Grain size (μm) Grade
G347 1.85 12 11 Isotropic G348 1.92 8 8 Isotropic G140 1.7 20 1000 Moulded
KWPSY 1.6 20 20001 Extruded 1Maximum grain size

64
Each experiment was started by applying a constant current of 2.3 A to the cell, corresponding to an apparent current density of 0.4 Acm-2, while N2 was passed through the porous anode for the first 45 min of the electrolysis time and afterwards changing the gas to CH4 and continuing the electrolysis for an additional time of 4 h. This procedure made it possible to detect if there was any depolarisation due to the oxidation of methane at the anode. Also, another series of electrolysis experiments was carried out without using methane to have a better insight of the process and for comparison. In this series, only nitrogen was purged through the anode; while the rest of the experimental conditions were unchanged.
Fig. 3.2-3 Sketch of the experimental electrolysis cell.

65
The weight of the anodes was measured before and after each experiment to check the consumption of the anodes and it was compared with the theoretical values. The graphite anodes were studied by Scanning Electron Microscope (SEM, Hitachi S-3400 N).
A new anode concept was designed in order to try to improve the methane oxidation reaction in more recent experiments. A denser graphite (G348, Table 3.2-1) with low permeability was used to shield the main graphite anode (G347, Table 3.2-1). The new anode is shown in Fig. 3.2-4.
Results and Discussion
The desired situation is when methane oxidation, reaction (2), is the only anode process. In this case the anode potential will be considerably lower than the anode potential during normal electrolysis due to the high overvoltage during normal electrolysis without supplying methane. In reality, these two oxidation reactions will take place at the same time, and the carbon anode will be depolarised based on the partial current densities of these two reactions.
Fig. 3.2-4 Sketch of a new anode design with two different graphite grades. The values in the figure are in millimetre.
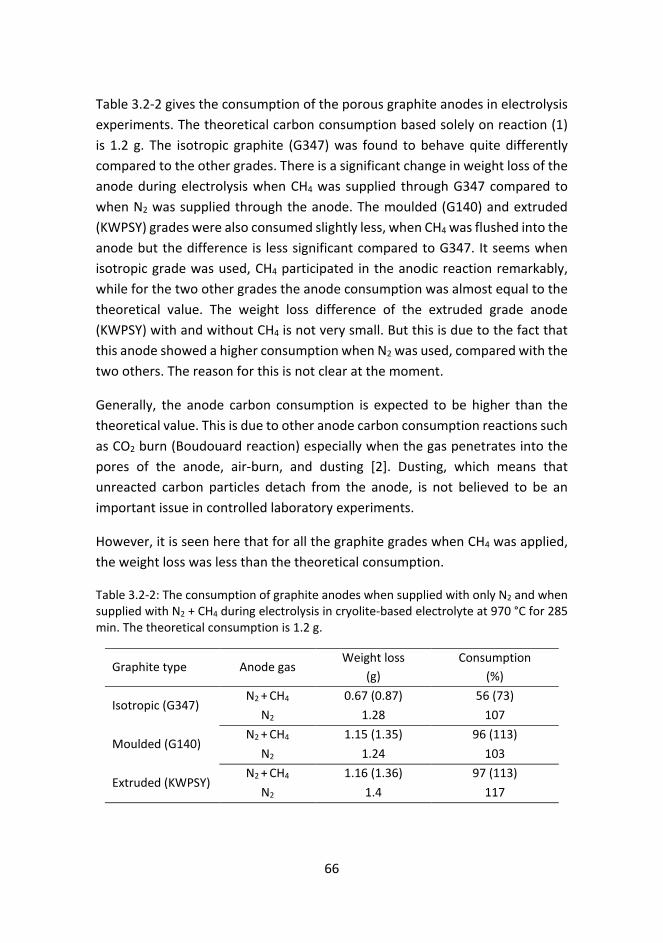
66
Table 3.2-2 gives the consumption of the porous graphite anodes in electrolysis experiments. The theoretical carbon consumption based solely on reaction (1) is 1.2 g. The isotropic graphite (G347) was found to behave quite differently compared to the other grades. There is a significant change in weight loss of the anode during electrolysis when CH4 was supplied through G347 compared to when N2 was supplied through the anode. The moulded (G140) and extruded (KWPSY) grades were also consumed slightly less, when CH4 was flushed into the anode but the difference is less significant compared to G347. It seems when isotropic grade was used, CH4 participated in the anodic reaction remarkably, while for the two other grades the anode consumption was almost equal to the theoretical value. The weight loss difference of the extruded grade anode (KWPSY) with and without CH4 is not very small. But this is due to the fact that this anode showed a higher consumption when N2 was used, compared with the two others. The reason for this is not clear at the moment.
Generally, the anode carbon consumption is expected to be higher than the theoretical value. This is due to other anode carbon consumption reactions such as CO2 burn (Boudouard reaction) especially when the gas penetrates into the pores of the anode, air-burn, and dusting [2]. Dusting, which means that unreacted carbon particles detach from the anode, is not believed to be an important issue in controlled laboratory experiments.
However, it is seen here that for all the graphite grades when CH4 was applied, the weight loss was less than the theoretical consumption.
Table 3.2-2: The consumption of graphite anodes when supplied with only N2 and when supplied with N2 + CH4 during electrolysis in cryolite-based electrolyte at 970 °C for 285 min. The theoretical consumption is 1.2 g.
Graphite type Anode gas Weight loss
(g) Consumption
(%)
Isotropic (G347) N2 + CH4 0.67 (0.87) 56 (73)
N2 1.28 107
Moulded (G140) N2 + CH4 1.15 (1.35) 96 (113)
N2 1.24 103
Extruded (KWPSY) N2 + CH4 1.16 (1.36) 97 (113)
N2 1.4 117

67
Hence, it is likely that CH4 was involved in the anodic reaction - at least to some extent - for all the graphite grades. This conjecture sounds more probable when we consider the likely thermal cracking of CH4 resulting in precipitation of carbon in the porous structure of the anode. Methane becomes unstable in terms of its elements from 530 °C. However, the kinetics is slow. The equilibrium constant for cracking of methane is 87 at T = 970 °C [87]. Therefore, this reaction is most likely to happen in our experiments, at least to some extent.
Precipitated carbon can add to the final weight of the anodes. One experiment was performed to check this, where all the conditions were unchanged, except that no current was passed. So, the sole factor influencing the anode weight was the amount of carbon precipitation. It was found that around 0.2 g carbon was precipitated in 4 h (the same time CH4 was flushed into anodes during electrolysis experiments). This suggests that the real carbon consumption was more than the values reported in Table 3.2-2. By considering the possible added weight from carbon precipitation, new values for the weight loss and consumption are found. These are also mentioned in Table 3.2-2; the values in parentheses. It is clear that even by considering this added value, the isotropic graphite (G347) has worked well and introduction of methane has resulted in less consumption which implies the participation of methane in the anodic reaction. However, it seems for the other two graphite grades, when methane was used the consumption was almost same or even more compared to the experiments when nitrogen was supplied. The over-consumption of porous graphite anode in the presence of reducing gases (CO and H2) has also been reported in another study [28]. After the experiments, there was some soot on the surface of the graphite anodes which might be due to such reactions. The reaction of the anode with reducing gases such as methane might result in excess consumption of the anode. Therefore, such reactions must also be considered in the evaluation of the anode weight changes. Their occurrence depends on graphite properties such as porosity and grain size. In the case of isotropic graphite (G347), methane participation was the dominating effect. A more recent experiment using the new anode design (see Table 3.2-2) gave a carbon consumption of 87 % of theoretical during electrolysis with a mixture of nitrogen and methane supply to the anode.
Apart from the electrochemical reaction and cracking reaction, there exists another factor which might have caused weight loss changes. This is due to

68
possible penetration of electrolyte into the porous structure of the graphite during electrolysis and can add to the final weight of the anode. However, this should be negligible since the anode was pulled out of the bath and flushed with N2 for 1 hour after electrolysis. The fracture surface of the anodes was studied by SEM/EDS. These studies also confirmed that the graphite structure was essentially free from electrolyte after the experiments.
The gas pressure before the anode was measured while the anode was placed above the molten electrolyte. The isotropic grade showed the largest pressure increase, around 0.5 bar, the moulded grade showed less increase, around 0.25 bar, while the extruded grade did not show any pressure increase. This difference can be attributed to the large difference in grain/pore size of these graphite grades.
Fig. 3.2-5 - Fig. 3.2-7 show the cell potential and pressure changes during electrolysis using isotropic grade (G347) anode for two different experiments; The upper part in Fig. 3.2-5 shows anode potential when only N2 was supplied through the anode and the lower part shows when N2 was supplied through the anode for 45 min prior to introducing CH4 and the electrolysis was continued for 4 more hours.
As can be seen, when only nitrogen was supplied to the anode, the potential increased gradually during the electrolysis (Fig. 3.2-5), but the pressure remained constant (Fig. 3.2-6). This is due to the consumption of graphite resulting in decrease of surface area and consequently increased current density. This is in agreement with previous studies demonstrating an increase in the anodic overvoltage when current density is increased [97].
A rough calculation demonstrates that the change in the surface area was noticeable. The surface area prior to electrolysis was 6.28 cm2 and the approximate value for the final surface area was ~5 cm2. The final surface area was calculated based on the geometrical surface of the anode after electrolysis. Assuming the change in surface area and a constant current the apparent current density increased from 0.37 A.cm-2 to 0.46 A.cm-2 during electrolysis.

69
Fig. 3.2-5 Anode potential vs time during aluminium electrolysis for two experiments where in (a), only N2 and in (b) N2 + CH4 were flushed into the porous anodes. The anode was made of isotropic graphite (G347). i = 0.4 A.cm-2, T = 970 °C. The values in the figure are flow of the gas in ml.min-1.
Fig. 3.2-6 Pressure changes during aluminium electrolysis where only N2 was flushed into the porous anodes. The anode was made of isotropic graphite (G347). i = 0.4 A.cm-2, T = 970 °C. The values in the figure are flow of the gas in ml.min-1.

70
Fig. 3.2-7 Pressure changes during aluminium electrolysis for where in N2 + CH4 were flushed into the porous anodes. Anode was made of isotropic graphite (G347). i = 0.4 A.cm-2, T = 970 °C. The values in the figure are flow of the gas in ml.min-1.
However, when CH4 was introduced to the anode the potential became stable and it remained almost constant throughout the electrolysis period. The vertical lines in Fig. 3.2-5 - Fig. 3.2-7 represent the time where the gas anode was shifted from nitrogen (dashed line) to methane (solid line).
There was an abrupt increase and decrease in pressure which is because of supply of both gases during the shifting time. After that, as can be seen, introduction of methane to the anode caused a gradual pressure increase which lasted as long as methane was flushed; i.e. until the end of electrolysis (Fig. 3.2-7). This increase in pressure was due to carbon precipitation from the cracking reaction of methane. If the electrolysis continued for a longer time, this might have led to clogging, as observed earlier [28].
The change in anode potential (Fig. 3.2-5) agrees with the weight loss data (Table 3.2-2). It is clear that methane was significantly involved in the anodic reaction, so the potential was stable and did not increase. However, the problem of clogging might prevent long term electrolysis. A suitable anode design could possibly prevent the probable and undesirable clogging.

71
There is a small difference in the anode potential in the beginning between these two experiments, although the anodes were similar and both experiments were started by supplying N2 to the anode. The reason is not clear. However, it is expected that during supply of methane the anode potential should be lower due to lower overpotential.
Similar electrolysis experiments using moulded (G140) and extruded (KWPSY) graphite grades did not give significant anode potential differences when supplying nitrogen and methane. In both cases the anode potential was found to increase during the course of electrolysis due to the consumption of carbon which will change the active anode area. These results suggest that the contribution of the methane in the anodic reaction was not significant for these graphite grades, which is in agreement with results from the weight change results as given in Table 3.2-2. Also, the pressure build-up was much less for these anodes.
Fig. 3.2-8 and Fig. 3.2-10 show results from a recent electrolysis experiment using the new anode design consisting of two graphite grades as shown in Fig. 3.2-4. Based on the carbon weight loss, the carbon consumption was ~87 %, indicating that methane participated in the anode process to some extent. This is also supported by the results from measuring the HF level above the electrolyte and the anode potential variation. The anode potential (Fig. 3.2-10) was not found to increase significantly during the course of electrolysis, although short time variations were observed. This might be due to the larger surface area of the anode in this experiment. High levels of HF were measured during methane supply. These observations indicate that methane oxidation was more important than the carbon weight loss indicated, which suggests that cracking of methane must have contributed to carbon formation. Also, the pressure build-up increased significantly upon introduction of methane, as shown in Fig. 3.2-8.
Shielding of the carbon anode by using carbon is not ideal. Using an insulating shielding material is challenging due to the aggressiveness of molten cryolite. Sintered alumina may be used in alumina saturated electrolytes, but it is difficult to obtain a good seal between graphite and alumina.

72
Fig. 3.2-8 Pressure changes during aluminium electrolysis when supplying N2 + CH4 to the porous anode. i = 0.5 A.cm-2, T = 970 °C. The values in the figure are flow of the gas in ml.min-1.
Fig. 3.2-9 Changes in HF level of the off-gas during aluminium electrolysis when supplying N2 + CH4 to the porous anode. i = 0.5 A.cm-2, T = 970 °C. The values in the figure are flow of the gas in ml.min-1.
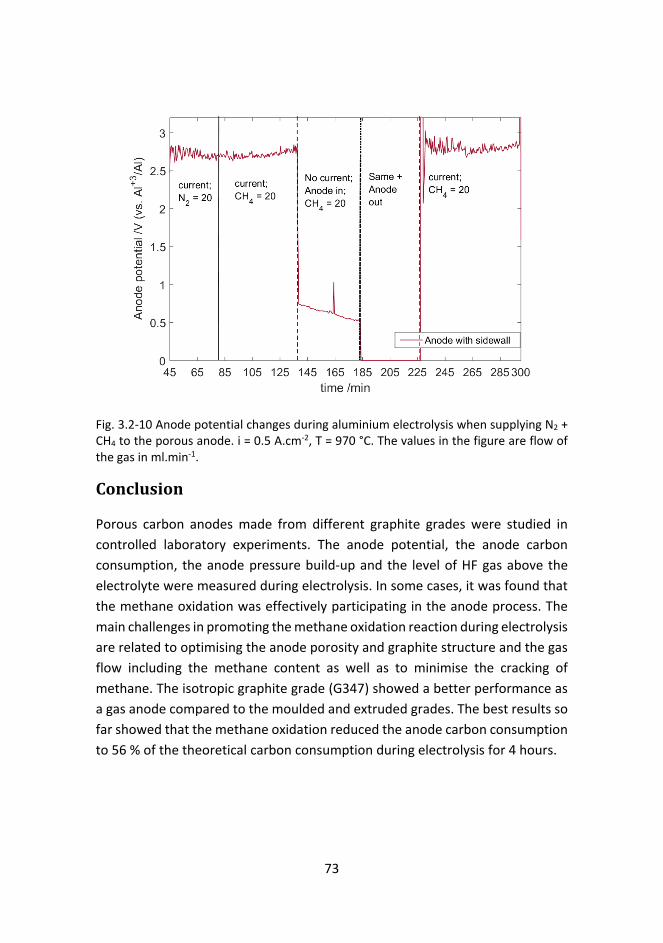
73
Fig. 3.2-10 Anode potential changes during aluminium electrolysis when supplying N2 + CH4 to the porous anode. i = 0.5 A.cm-2, T = 970 °C. The values in the figure are flow of the gas in ml.min-1.
Conclusion
Porous carbon anodes made from different graphite grades were studied in controlled laboratory experiments. The anode potential, the anode carbon consumption, the anode pressure build-up and the level of HF gas above the electrolyte were measured during electrolysis. In some cases, it was found that the methane oxidation was effectively participating in the anode process. The main challenges in promoting the methane oxidation reaction during electrolysis are related to optimising the anode porosity and graphite structure and the gas flow including the methane content as well as to minimise the cracking of methane. The isotropic graphite grade (G347) showed a better performance as a gas anode compared to the moulded and extruded grades. The best results so far showed that the methane oxidation reduced the anode carbon consumption to 56 % of the theoretical carbon consumption during electrolysis for 4 hours.

74
Acknowledgment
The authors gratefully acknowledge financial support from the Research Council of Norway in the project NOVAL (grant number 224985) of the GASSMAKS program.

75
Paper 2: Discussions section
Toru H. Okabe, Olga Kuzmina, John M. Slattery, Cairong Jiang, Tim Sudmeier, Linpo Yu, Han Wang, Wei Xiao, Liang Xu, Xiangling Yue, Yiyang Kong, Andrew Doherty, Geir Martin Haarberg, Shuqiang Jiao, Qian Xu, Hongmin Zhu, Dihua Wang, Paul Madden, Daniel Cooper, Kathie McGregor, Chaohui Wei, Binjie Hu, Andrew Mount, John Irvine, Ali Kamali, Babak Khalaghi, Xianbo Jin, Yingjun Liu, George Zheng Chen, Xingli Zou, Gang Chen, Ye Liu, Majd Eshtaya, Derek Fray and Yating Yuan
This part was published in Faraday Discussions 2016 (190), pp 161-204 [98]. Here only the questions and answers related to paper 2 are presented.

76
George Zheng Chen opened a discussion of the paper by Geir Martin Haarberg: It is an interesting and good idea to introduce a fuel gas, particularly hydrocarbons, to reduce CO2 emission from the anode reactions. Anode materials should have an impact on the performance. For example, I think tin oxide and graphite will cause different kinetics and even anode reactions. Is this the case for example when methane is used as the fuel gas? Also, for electrolysis of a metal oxide, either dissolved in the molten salt, or in the solid state via the FFC Cambridge Process, have you observed any oxidation of the graphite anode itself to carbon monoxide or dioxide?
Geir Martin Haarberg answered: I agree that different anode materials have different kinetics. It's very difficult to achieve a complete participation of methane, so in our experiments the usual anode process (CO and CO2 formation) takes place in parallel with methane oxidation. We always observe consumption of the graphite anode when passing methane.
Liang Xu asked: Thanks for your nice talk. It is an interesting concept, replacing the conventional graphite anode by CH4 for the Al electrolysis. My question is, in this case, hydrogen will be introduced into the system which could result in H2O formation. I am afraid the generated H2O could cause serious problems in the molten salt at high temperatures. What do you think about this?
Geir Martin Haarberg responded: I agree that water vapour will be produced in the anode reaction when using methane. This will cause the formation of HF which is undesired in the process. In the current industrial process HF will be formed due to the presence of humidity, but using methane may lead to an increased level of HF. It may be challenging to reduce the extra level of HF, but it should be addressed in a possible implementation of the methane concept. It is however believed that most of the HF exiting the cells will be captured by alumina in the dry scrubbers.
Dihua Wang remarked: What is the optimized current density for this kind of gas anode? How do you optimize and control the solid/liquid/gas three phase reaction boundary?

77
Geir Martin Haarberg responded: The normal current density in the current process is 0.7–0.8 A cm2. The aim is to achieve a similar current density when using methane. It's challenging to obtain an efficient action of the methane, so we are working on an improved design of the supply of the gas.
George Zheng Chen asked: Would it be possible to use the carbonate fuel cell electrode, e.g. porous nickel, in your gas anode?
Geir Martin Haarberg responded: The molten fluoride electrolyte based on cryolite is very corrosive, and nickel will dissolve if used as an anode. A candidate inert anode is based on nickel ferrite, which may be a possibility for the gas anode.
Shuqiang Jiao remarked: When using Sn oxide, oxygen ion is discharged on the anode to form oxygen. However, if switching to graphite anode, what is the mechanism to explain the difference. How does the electrochemical reaction happen?
Geir Martin Haarberg answered: When using graphite, methane will be oxidised to form CO2 and H2O. Also on tin oxide the methane oxidation should happen, but some oxygen evolution will take place as well.
Hongmin Zhu commented: It is a nice ideal to use natural gas as the anode feeding material for aluminium electrolysis. I have a question about the electrode potential during the electrolysis. In Fig. 3.2-1, before you start the bubbling of CH4, the anode production should be oxygen, O2, while after the CH4 it should be H2O, CO and CO2. There should be more than 1 V potential difference between these electrode reactions. But, the potential drop in Fig. 3.2-1 is only 0.5 V. Do you have any ideas to explain the loss of the potential?

78
Geir Martin Haarberg replied: I believe that the measured potential is a mixed potential because it's likely that the normal reaction of CO2 formation also takes place during the introduction of methane.
Paul Madden addressed Geir Martin Haarberg and Toru H. Okabe: I have given lectures to undergraduates to explain how difficult it is to separate aluminium from oxygen and shown the famous Napoleon's Helmet to illustrate. The (brighter) students have then asked, how was the aluminium for the helmet extracted as this was made before the development of the Hall–Héroult process? Can you help?
Geir Martin Haarberg answered: Prior to the Hall–Héroult process, elemental aluminium was made by reducing the ore (bauxite) by elemental sodium or potassium in a vacuum, as explained by Prof. Okabe. Carbothermal reduction of alumina is very difficult. I believe that Napoleon III is the best person for this question.
Toru H. Okabe responded: In the old days, aluminium was produced by potassium reduction of aluminium chlorides, not by electrochemical methods.
AlCl3 (or complex chlorides) + 3K → Al + 3KCl (or complex chlorides).
In some cases, amalgam (Hg alloy) was utilized for facilitating reactions. Sodium can also be utilized as a reduction agent for this type of metallothermic reduction. But production of metallic K or Na was very difficult and costly in those days. For this reason, Al was a “precious metal” worthy for Napoleon's Helmet. Development of an electrochemical technique around 1900s was really a “revolution” in Al smelting history.
Andrew Mount addressed Geir Martin Haarberg and Babak Khalaghi: To be able to judge what is a significant difference between the data in Table 3.2-2, it would be useful to know what the experimental error is in the weight data in this Table. It also seems that only the isotropic graphite may produce a significant decrease in the amount of graphite consumption when the effects of carbon deposition are taken into account. Is there an explanation for why this is the case?

79
Babak Khalaghi replied: Regarding the first part of the question I could say that in Table 3.2-2 the results of specific experiments are given. But for the isotropic graphite (G347) the more accurate value for the weight loss would be: 0.60 ± 0.07 (0.80 ± 0.07) (g). And for the other samples only one experiment was run. My answer to part two of the question is that it seems the important factor and property is the porosity and pore/grain size of the graphite and not the production method. Because better porosity and pore size establish the three-phase boundary (electrolyte–gas–electrode) more efficiently and lead to more effective participation of gas (CH4) in the anodic reaction. So, the fact that the graphite is isotropic or not, does not seem to have a key role in the performance of the anodes when there is considerable difference in porosity and pore/grain size of the graphite grades.
Qian Xu commented: The Al3+/Al electrode was used as the reference electrode in your research. Can the reaction Al + Al3+ → Al+ affect the reversibility of the Al3+/Al electrode?
Geir Martin Haarberg responded: It's correct that aluminium dissolves to form Al(I). But the solubility of Al is very low (~0.05 wt. %), so it won't affect the electrode potential.
Daniel Cooper commented: A question was asked earlier about water being produced as a result of the reaction which leads to the production of HF, which is potentially hazardous. There are a number of processes which use methane as a source of hydrogen. Could you couple your process to one which utilises the hydrogen in order to prevent production of water and consequently HF, or would this hinder the mechanism of operation?
Geir Martin Haarberg replied: Using hydrogen instead of methane is an option. However, water vapour will still be formed in the anode process, so it will not prevent this problem.

80
Linpo Yu said: Steam will be generated at the anode, I believe water can react with the graphite anode at high temperature. Did you observe any broken graphite anode after your experiment?
Geir Martin Haarberg replied: I agree that water may react with the graphite anode. However, we did not observe any serious damage of the anode after experiments. The main challenge with the formation of water is believed to be due to the formation of HF.
John Irvine remarked: I was wondering about methane cracking as well. Pass the methane without driven current in batch mode, and see if you can oxidise the carbon. Then switch on the current. Utilize the carbon that's formed from the methane. You wouldn't have water forming and the hydrogen will be given off.
Geir Martin Haarberg replied: Thanks for your comment. We would like to try this procedure in future experiments.

81
3.3. Paper 3
Gas anode made of porous graphite for aluminium electrowinning
Babak Khalaghi1, Henrik Gudbrandsen2, Ole Sigmund Kjos2, Karen Sende Osen2, Ove Bjørn Paulsen2, Tommy Mokkelbost2, and Geir Martin Haarberg1
1Department of Materials Science and Engineering, Norwegian University of Science and Technology (NTNU) NO-7491 Trondheim, Norway 2SINTEF Materials and Chemistry, NO-7465 Trondheim, Norway
Keywords: Aluminium electrolysis, Porous anodes, Methane
This paper has been published in TMS Light Metals 2017 pp 1333-1339 [99], However, note that some minor corrections have been made to this paper post-acceptance for spelling/typos and to improve clarity.
82
Abstract
One of the major downsides of the current aluminium production process is the high CO2 emission. One alternative is to replace the consumable carbon anodes with inert anodes so that oxygen evolves instead of CO2. Also, PFC emissions will be eliminated by using inert anodes. However, so far a sufficiently inert anode has not been found. Another option is to utilize natural gas through porous anodes in order to change the anode process. This will decrease CO2 emission remarkably and also eliminate PFC emissions and anode effect. The porous anode could be made of carbon or it can be inert. However, the as-mentioned problem still exists regarding porous inert anodes. Therefore, at the moment porous carbon anodes seem to be the best practical option. In this study, porous anodes made of different grades of graphite were used for electrolysis experiments in a laboratory cell. Also, off-gas analysis was performed to get an insight of the ongoing reactions. Our results show that for some types of graphite anodes, methane participates effectively in the anodic reaction.
Introduction
Environmental issues related to Hall-Héroult process is one of the major concerns of the aluminium industry. A large amount of CO2 is emitted from electrolysis cells. The overall reaction is as follows [2]:
Al2O3 (diss.) + 3/2C (s) = 2Al (l) + 3/2CO2 (g) (1)
There has been a lot of research to tackle the problem of CO2 emissions. An inert anode for the Hall-Héroult process has been called “The ultimate material challenge” [18]. It shows the high requirements of such a material. There have been only laboratory and bench scales tests to try inert anodes so far [19]. In conclusion, a prospective industrial inert anode still seems to be unreachable; at least in the near future.
Another alternative to the current industrial process is to supply a reducing gas (e.g. CH4) to the anode/electrolyte interface through a porous anode. Then, the gas participates in the anodic reaction and the overall reaction changes from (1) to the following:
Al2O3 (diss.) + 3/4CH4 (g) = 2Al (l) + 3/4CO2 (g) + 3/2H2O (g) (2)

83
For this purpose, a porous anode must be used. The porous anode could be made of carbon or an inert material. Certainly, a porous anode made of an inert material enables maximum gain of this concept; i.e. the amount of emitted CO2 can be decreased to half according to the stoichiometry of reaction (2).
However, as mentioned earlier a sufficiently inert anode has not been found so far. Therefore, a porous anode made of carbon seems to be a more practical choice at the present time. When the anode is made of porous carbon, reactions (1) and (2) will be competing anodic reactions. The theoretical cell voltage of reaction (2) is 1.1 V while for reaction (1) it is equal to 1.2 V at 1233 K (960 °C) [21]. This leads to a small depolarization of the cell voltage when methane is used in such a way [21, 22]. More importantly, utilizing the reducing gas, e.g. CH4, results in reduced CO2 emission. The degree of CO2 emission reduction depends on which of these competing reactions dominates as the anodic reaction.
The concept of supplying a reducing gas to a porous anode in aluminium electrolysis has been tried before. In some studies carbon or graphite anodes were use [26-28]. A 0.3 - 0.4 V depolarization effect was detected when methane was used [27]. In another study, porous graphite anodes showed depolarization when methane and H2 were used. It was mentioned that due to high temperature of the process, methane decomposition occurs considerably and methane can be considered electrochemically equivalent to hydrogen. On the other hand, when hydrogen-containing fuels such as methane or hydrogen were used considerable fluoride losses from electrolyte occurred [26]. In addition, the anode might become clogged by soot when flushed by methane. When H2 and CO were used some depolarization was observed; though the carbon consumption increased and the anodes disintegrated [28]. Inert porous anodes have also been tested in some studies. But, none of the inert anodes showed sufficient stability and were either disintegrated or dissolved to some extent after long time electrolysis [24, 28, 29]. One of the candidate inert anodes was a non-consumable gas anode based on the type used for Solid Oxide Fuel Cells (SOFC). It was reported that this anode is not suitable for the current aluminium electrolysis process, but could be utilized in a modified Hall-Héroult process [84].
We have reported our studies on this concept using both inert (e.g. SnO2) and graphitic porous anodes. Aluminium electrolysis experiments were carried out

84
at 850 °C in a modified electrolyte where methane and hydrogen, in separate experiments, were used as reducing gases [22, 35, 37]. In a recent work different graphites were tested as anode material and one showed better results [81]. In this paper, the continuation of previous studies are presented. Here, other parameters which might play a role have been studied. Establishment of the three-phase boundary between the gas, anode and electrolyte is crucial for the accomplishment of this process [22]. In addition, it was observed earlier that cracking of the methane during the electrolysis leads to partial or even complete clogging of the anode which is detrimental for this process [27, 81, 89]. In order to establish the three-phase boundary and to prevent the clogging of the anode, the flow of the gas from top and the flow of the electrolyte from the bottom through the porous structure of the anode must be considered. Also, the flow properties of the porous graphite such as permeability, porosity and pore size are of great importance. Usually the electrolyte in the lab experiments is almost stagnant. They hydrostatic pressure of the electrolyte is negligible and therefore, the main factor causing the electrolyte to penetrate the anode is the capillary pressure. On the other hand, the fluid flow through a porous medium is described by Darcy’s equation:
𝑉𝑉 = − 𝐾𝐾𝜇𝜇
(∇P − ρg) (3)
Where V is the average fluid velocity, K is permeability of the porous material, μ is the fluid viscosity, P is the pressure, ρ is the density of the fluid and g is the gravitational acceleration [77]. The three-phase boundary might be established on the outer surface of the anode or inside the porous structure of the graphite. This depends on the properties of the porous graphite as well as the flows of the gas and electrolyte.
In a similar study Namboothiri et .al made pressure calculations and permeability measurements in order to find the suitable permeability for the porous material to be used as the gas anode [31]. Between four different carbon materials which were candidates for anode the one with 30 % porosity and average pore diameter 10 μm gave the best performance. The permeability of this sample was equal to 1.30 × 10⁻¹⁴ ± 0.200 × 10⁻¹⁴ m2. Recalling that 1 darcy is equivalent to 9.8692 × 10⁻¹³ m2 [78], then the permeability was equal to 13.2 md (millidarcys). The air permeability of industrial carbon anodes typically varies from 2 × 10-14 to 20 × 10-14 m2 (20 -200 md) [100]. In our previous studies inert

85
anodes based on tin oxide were used. The porous tin oxide-based anodes were supplied with methane and hydrogen and depolarisation was observed [22, 37]. The porosity of the inert tin oxide anodes used was approximately 28%. The gas permeability of anodes was in the range of 3-13 × 10-13 m2 (300 to 1300 md). The gas permeability increased slightly with increasing particle diameter. This was attributed to enhanced gas transport due to larger pore sizes [34]. However, a much denser graphite in comparison to these anodes (see grade 1/G347 in Table 3.3-1) was the most efficient in our previous study [81]. Though, no fluid flow or pressure balance calculations were made.
Experimental
Mercury porosimetry was used to characterize the graphites. This technique is based on the intrusion of mercury into a porous structure under stringently controlled pressures [80]. A Micromeritics AutoPore IV 9500 Mercury Porosimeter was used. This instrument can determine a broad pore size distribution (0.003 to 360 micrometres) [80]. The graphite samples were ~ 2 g. The graphite samples had fractured surfaces in order to have a more accurate measurement since when graphite is cut it might end up with smeared surfaces. The permeability of the graphite samples was measured by Carbon R&D RDC-145 Air Permeability apparatus. This apparatus has been designed for measuring baked carbon electrodes. Therefore, the sensitivity of the detectors, the maximum possible vacuum and the units of measure has been selected accordingly. So, the samples having permeability in the range of 0.1 to 30 nPm (10 to 300 md) can be measured [79]. The electrolyte composition was chosen similar to the modern industrial cells except that it was saturated with alumina. The electrolyte composition was 9.3 wt % AlF3 (Noralf, Boliden Odda AS), 5.0 wt % CaF2 (Merck, > 97 %), and 9.0 wt % Al2O3 (Merck, > 98 %) and the remaining Na3AlF6 (natural cryolite, Greenland). The cryolite ratio was 2.3. Figure 3.3-1 illustrates the schematic of the experimental set-up. A graphite crucible contained the electrolyte. The walls of the crucible were lined with alumina and its bottom served as the cathode. A hollow steel tube screwed to the porous carbon anode was used as current collector. The anode and cathode were positioned horizontally in respect to each other. The crucible containing the bath was dried in air at 120 °C overnight. After the crucible was put inside the furnace, the furnace was dried at 200 °C in flushing N2 until the next morning when the temperature was raised to 980 °C. The furnace was continuously flushed with

86
N2. The inlet gas composition for the anode was controlled using mass flow controllers (Bronkhorst) and the inlet gas pressure was measured. The whole electrochemical cell was placed in a vertical tube furnace heated by resistance wires, and connected to a temperature controller. Galvanostatic electrolysis experiments were performed using porous anodes made of different graphite grades (supplied from different companies). Some of the properties of grades used for preparing anodes are given in Table 3.3-1. Each experiment was started by applying a constant current of 2.5 A to the cell while N2 was passed through the porous anode for the first 40 min of the electrolysis time and afterwards changing the gas to CH4 and continuation of the electrolysis for 216 min (total time: 256 min).
Table 3.3-1 summarizes some of the properties of the graphites used in this study. With this procedure, it is possible to detect if there is any depolarization upon introduction of the CH4 to the anode. Also, another series of electrolysis experiments were carried out without using methane for comparison and in order to have a better insight of the process and for comparison.
Figure 3.3-1: Schematic of the electrolysis cell.
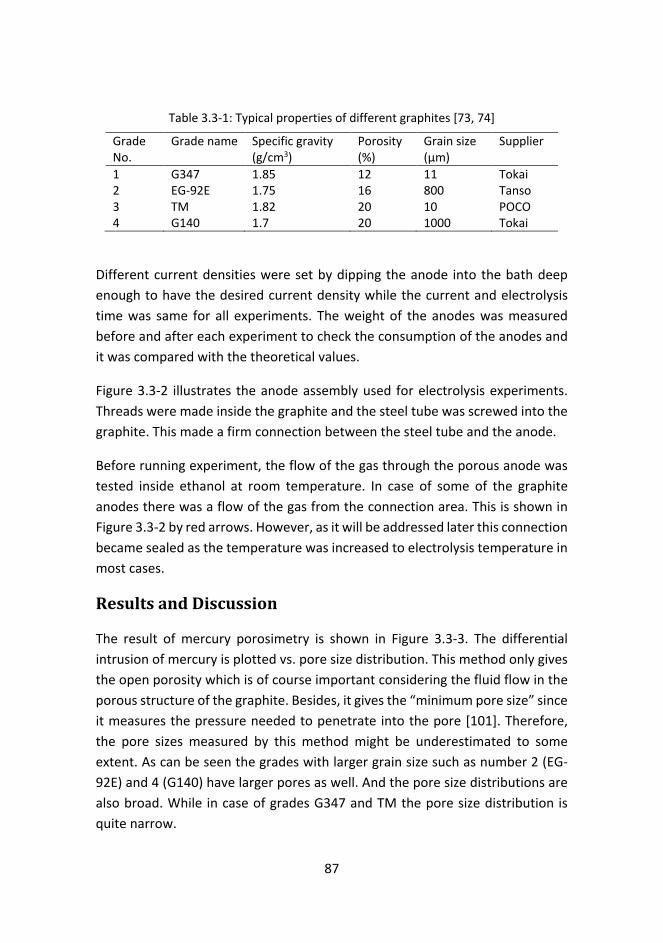
87
Table 3.3-1: Typical properties of different graphites [73, 74]
Grade No.
Grade name Specific gravity (g/cm3)
Porosity (%)
Grain size (μm)
Supplier
1 G347 1.85 12 11 Tokai 2 EG-92E 1.75 16 800 Tanso 3 TM 1.82 20 10 POCO 4 G140 1.7 20 1000 Tokai
Different current densities were set by dipping the anode into the bath deep enough to have the desired current density while the current and electrolysis time was same for all experiments. The weight of the anodes was measured before and after each experiment to check the consumption of the anodes and it was compared with the theoretical values.
Figure 3.3-2 illustrates the anode assembly used for electrolysis experiments. Threads were made inside the graphite and the steel tube was screwed into the graphite. This made a firm connection between the steel tube and the anode.
Before running experiment, the flow of the gas through the porous anode was tested inside ethanol at room temperature. In case of some of the graphite anodes there was a flow of the gas from the connection area. This is shown in Figure 3.3-2 by red arrows. However, as it will be addressed later this connection became sealed as the temperature was increased to electrolysis temperature in most cases.
Results and Discussion
The result of mercury porosimetry is shown in Figure 3.3-3. The differential intrusion of mercury is plotted vs. pore size distribution. This method only gives the open porosity which is of course important considering the fluid flow in the porous structure of the graphite. Besides, it gives the “minimum pore size” since it measures the pressure needed to penetrate into the pore [101]. Therefore, the pore sizes measured by this method might be underestimated to some extent. As can be seen the grades with larger grain size such as number 2 (EG-92E) and 4 (G140) have larger pores as well. And the pore size distributions are also broad. While in case of grades G347 and TM the pore size distribution is quite narrow.

88
Figure 3.3-2: Anode Assembly. On the right-hand side, a schematic of the anode assembly is shown and on left a photo of the real anode assembly. The arrows show the place where anode gas might escape from the system.
The permeability of grade EG-92E was measured to 0.79 nPm (nanoPerm). This is equal to 0.79 × 10⁻¹³ m2 or 80 md. But, the permeability of grade G347 was not in the range of the apparatus and the measurement failed. This grade is denser and considering the range of the apparatus its permeability must be lower than 10 md.
Figure 3.3-3: Differential intrusion of mercury into pores vs. pore size distribution for different graphites. The graphites are depicted by grade numbers given in Table 3.3-1.
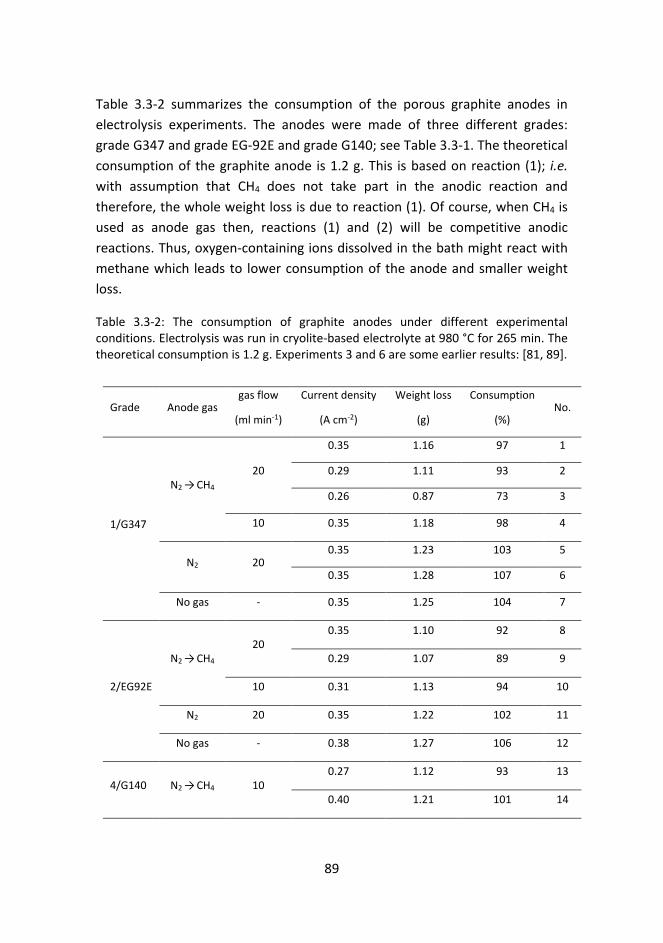
89
Table 3.3-2 summarizes the consumption of the porous graphite anodes in electrolysis experiments. The anodes were made of three different grades: grade G347 and grade EG-92E and grade G140; see Table 3.3-1. The theoretical consumption of the graphite anode is 1.2 g. This is based on reaction (1); i.e. with assumption that CH4 does not take part in the anodic reaction and therefore, the whole weight loss is due to reaction (1). Of course, when CH4 is used as anode gas then, reactions (1) and (2) will be competitive anodic reactions. Thus, oxygen-containing ions dissolved in the bath might react with methane which leads to lower consumption of the anode and smaller weight loss.
Table 3.3-2: The consumption of graphite anodes under different experimental conditions. Electrolysis was run in cryolite-based electrolyte at 980 °C for 265 min. The theoretical consumption is 1.2 g. Experiments 3 and 6 are some earlier results: [81, 89].
Grade Anode gas gas flow
(ml min-1)
Current density
(A cm-2)
Weight loss
(g)
Consumption
(%) No.
1/G347
N2 → CH4 20
0.35 1.16 97 1
0.29 1.11 93 2
0.26 0.87 73 3
10 0.35 1.18 98 4
N2 20 0.35 1.23 103 5
0.35 1.28 107 6
No gas - 0.35 1.25 104 7
2/EG92E
N2 → CH4 20
0.35 1.10 92 8
0.29 1.07 89 9
10 0.31 1.13 94 10
N2 20 0.35 1.22 102 11
No gas - 0.38 1.27 106 12
4/G140 N2 → CH4 10 0.27 1.12 93 13
0.40 1.21 101 14

90
By comparing the weight loss in experiments with CH4 with those without CH4 the degree of CH4 participation in the anodic reaction can be identified. As can be seen, the consumptions of anodes were lower in all experiments when CH4 was used as the anode gas. This suggests that in all of these experiments CH4 was involved in the anodic reaction; at least to some extent. However, the difference in weight loss and consumption is very small in most cases and it implies that CH4 involvement in anodic reaction was not significant. Though, this is in contradiction to some of our earlier findings [81, 89] where in case of grade G347 the consumption was much lower; experiment 3 in Table 3.3-2.
Figure 3.3-4 shows the variation of cell voltage during galvanostatic electrolysis using gas anodes made of grade G347 for experiments 1, 2, 3 and 5; see Table 3.3-2. The vertical dashed line corresponds to anode gas shift from nitrogen to methane in experiment 1, 2 and 3. In experiment 5 only nitrogen was used as anode gas and here it is illustrated only for comparison.
The current density in experiments 1-3 was equal to 0.35, 0.29 and 0.26 A.cm-2, respectively. The current was same in all experiments and different current densities was established by dipping the anode in the bath to different depths. So, the wetted surface area was different. It seems that when the current density was low enough the cell voltage variation showed a different behaviour. During experiment 2 and 3 the cell voltage was almost constant and stable. This cannot be only due to the supply of methane since in experiment 1 also the anode was supplied with methane. But, in experiment 1 the cell voltage variations were quite similar to the case where there was no supply of methane; experiment 5. It implies that when the anode was dipped sufficiently in the bath and/or current density was low enough the methane became involved in the anodic reaction much more efficiently. However, the weight loss changes in experiment 2 and 3 are not very close. And there must be other factors influencing the results. One apparent observation is that in experiment 2 the cell voltage fluctuations were more intense during the first 100 min of electrolysis.
Figure 3.3-5 shows the measured pressure before the anode upon introduction of N2 to the anodes and during heating up the furnace; the anode was out of the bath and electrolysis had not started. The data for experiment 1, 2, 3 and 5 are presented.

91
Figure 3.3-4: The variations of cell voltage during galvanostatic electrolysis of aluminium for experiments 1, 2, 3 and 5. In experiment 1, 2 and 3 the anode gas was N2 (for the first 40 minutes) followed by CH4 (until the end of electrolysis). In experiment 5 the anode gas was N2. Anodes were identical and were made of grade 1 (G347), i = 2.5 A, T = 980 °C.
Figure 3.3-5: Measured pressure before the anode, upon introduction of gas (N2) to the graphite anode and after increasing the temperature from 200 °C to 950 °C during experiments 1, 2, 3 and 5. The anode was out of the bath and the electrolysis had not started. All anodes had same dimensions and were made of grade 1 (G347). The flow rate of N2 = 20 ml min-1.

92
Unfortunately, the pressure data for experiment 3 was recorded only after introduction of the gas to anode at high temperature. So, the data at lower temperatures are not shown in Figure 3.3-5. However, based on the following discussion the pressure changes for experiment 3 upon introduction of gas and during heating can be estimated. At the time of gas introduction to the anode the temperature was equal to 200 °C. Introduction of the gas into the porous anode immediately caused an increase in pressure. This is due to the resistance of the porous structure against the gas flow which can be identified by equation (3). Because grade G347 is not very porous and has low pore size (see Figure 3.3-3) and low permeability, the pressure increase was high. Furthermore, as the temperature inside the furnace was elevated the pressure also increased. When the temperature increased both the anode and the steel tube expanded. Since the thermal coefficient of steel is much larger than the graphite, the steel expanded more and the connection became firm and sealed at high temperature. This explains the gradual pressure increase after the initial immediate increase at 200 °C. However, it is obvious that the porous anodes behaved quite differently though they had same dimensions and they were made from same graphite; grade G347. The pressure changes in experiment 1 were quite different in comparison to the other experiments. Neither introduction of the gas to the anode, nor the following heating up made a considerable change in the pressure of anode 1. This might be due to leakage from the connection between the anode and the steel tube or a crack or fracture in anode. In any case, most likely a major part of the gas escaped from the anode assembly without passing through the porous structure and entering the bath. This explains the cell voltage variations and weight loss of this anode. For experiment 2, the pressure increase was greater than experiment 1 but perhaps not high enough. In experiment 3 the pressure increased to 1.8 bars while in experiment 2 it reached 1.55 bars. Although data for experiment 3 is only shown at high temperature (only prior to electrolysis) but it is apparent that the anode assembly was completely tight and the graphite behaved well so the methane became efficiently involved in the anodic reaction. Besides, the anode was deeper inside the bath which in turn could facilitate the methane reaction with the bath.
On the whole, the performance of anodes made of grade EG-92E was slightly better than those made of grade G347. The results of anodes made of grade EG-92E are also presented in Table 3.3-2; experiments 8-12. According to

93
Namboothiri et al. [31] the permeability of grade EG-92E is more suitable than grade G347 for this process. The variation of cell voltage during electrolysis for these experiments together with the experiment where only nitrogen was used as gas anode (experiment 11) is presented in Figure 3.3-6 (a). Note that here again the vertical dashed line only corresponds to gas anode shift in experiments 8-10; and not experiment 11. As can be seen, the variation of cell voltage in experiment 10 (gas flow: 10 ml min-1, I = 0.31 A cm-2) is quite similar to experiment 11 (no methane). It seems the methane was not much involved in the anodic reaction. This is in accordance with weight loss results. However, when the methane flow rate was higher (experiments 8 and 9; gas flow: 20 ml min-1) the cell voltage variations became different. These results can be seen more clearly in Figure 3.3-6 (b). During these two experiments cell voltage gradually increased while nitrogen was being supplied. This gradual increase continued for almost 1 hour after introduction of methane. Then the cell voltage showed a small decrease and kept almost constant until the end of electrolysis with much less pronounced voltage fluctuations. This is similar to cell voltage variations in experiment 2 and 3; see Figure 3.3-4. Though, it seems the overall participation of methane in anodic reaction in these two experiments was not very large.

94
Figure 3.3-6: The variations of cell voltage during galvanostatic electrolysis of aluminium. (a) Experiments 8 - 11. (b) Experiment 8 and 9. In experiment 8-10 anode gas was N2 (for the first 40 minutes) followed by CH4 (until the end of electrolysis). In experiment 11 the anode gas was N2. Anodes were identical and were made of grade EG-92E, i = 2.5 A, T = 980 °C.
Nevertheless, here again the effect of larger immersion of the anode in the bath/lower current density is evident. In experiment 9 the anode was immersed deeper into the bath, corresponding to I = 0.29 A cm-2, whereas in experiment 8 the current density was equal to 0.35 A cm-2. Experiment 9 showed a lower cell voltage and smaller anode consumption.
As it was demonstrated before, the pressure changes might give an idea of how the flow properties of different anodes might influence the flow of the gas and in turn, the participation of methane in anodic reaction. However, since the grade EG-92E, in comparison to grade G347, has higher porosity, larger grain/pore size and larger air permeability, the pressure changes were negligible and similar. The maximum pressure increase was equal to 0.15 bars (the results are not shown here). Similar results were observed in a previous study [81].
Two electrolysis experiments were also carried out using anodes made of grade G140; experiments 13 and 14 (Table 3.3-2). Here again the impact of higher current density and/or depth of the anode in the bath was obvious and it resulted in noticeable change; see Table 3.3-2.

95
Grade G347 has low permeability and therefore, imposes high resistance toward the flow of the gas. Consequently, the anode gas escapes from the anode assembly in case of any leakage and methane does not participate in anodic reaction. Nevertheless, if the anode assembly is gas tight, supply of methane can lead to significant reduction in carbon consumption; as it was observed in experiment 3. Grade EG-92E has higher permeability and seems to be more appropriate for this process.
It seems in most cases involvement of methane in the anodic reaction did not happen right after the introduction of methane to anode; but more than one hour later, Figure 3.3-6 (b). The reason might be due to partial consumption of graphite at the bottom of the anode. This made the bottom part of the anode thinner which in turn facilitates the flow of the gas into the bath.
In case of all grades, when the anode had been dipped deeper into the bath the trend of cell voltage variation changed and led to a more efficient involvement of methane in the anodic reaction. This might be due to the change of gas flow or/and lower current density. Further studies must be carried out to distinguish the effect of each parameter.
Conclusions
Results confirmed that supply of methane to porous graphite anode lead to participation of methane in the anodic process during electrowinning of aluminium in a laboratory cell. The effect of methane was observed as a change in the trend of cell voltage variations as well as in the consumption of the anodes.
Appropriate establishment of the three-phase boundary between the gas, the electrolyte and the anode is crucial for this process. According to the findings, this depends on congruence between different parameters such as graphite (anode) flow properties, flow rate of methane, the positioning of the anode in the bath and the gas tightness of the anode assembly. When the graphite was less porous and had lower gas permeability (grade G347) the anode assembly was more prone to gas leakage; also, the pressure changes were scattering.
For all graphites deeper immersion of the anode into the bath led to more efficient participation of methane in the anode reaction; probably due to
96
enhanced gas flow through the porous graphite. However, deeper anode immersion in the bath also caused lower current density since the current was the same for all experiments. Therefore, the effect of current density must be addressed separately in future studies.
Acknowledgment
Financial support is gratefully acknowledged from the Research Council of Norway, GASSMAKS program, and grant number 224985.

97
3.4. Paper 4
Reducing CO2 emissions from aluminium electrolysis cell by supplying porous anodes with methane Babak Khalaghi1, Ole S. Kjos2, Tommy Mokkelbost2, and Geir Martin Haarberg1 1 Department of Materials Science and Engineering, Norwegian University of Science and Technology, N-7491 Trondheim, Norway 2 SINTEF Materials and Chemistry, N-7465 Trondheim, Norway
Keywords: Aluminium electrolysis, Porous graphite, Gas anodes, Methane
This is a paper manuscript and has not been submitted for publication yet.

Is not included due to copyright

122

123
3.5. Paper 5
Cyclic voltammetry and double layer capacitance of porous graphite electrodes in cryolite-alumina melts
Babak Khalaghi1, Wojciech Gębarowski2, Ole S. Kjos3, Tommy Mokkelbost3, and Geir Martin Haarberg1 1 Department of Materials Science and Engineering, Norwegian University of Science and Technology, N-7491 Trondheim, Norway 2 Faculty of Non-ferrous Metals, AGH University of Science and Technology, 30-059 Kraków, Poland 3 SINTEF Materials and Chemistry, N-7465 Trondheim, Norway
Keywords: Cyclic voltammetry, Double layer capacitance, Porous anodes, Methane
This is a paper manuscript and has not been published yet.

Is not included due to copyright

142

143
Chapter 4
Conclusions
The present research has revealed the most important influencing parameters in this process. Microstructure and flow properties of the anode material are of great importance. More specifically, the pore size distribution (PSD) and air-permeability of the anode proved to play key roles. Firstly, proper establishment of the three-phase boundary (TPB) is achieved through employment of a material with suitable air-permeability and PSD. The penetration of electrolyte into the anode and the flow of methane through the porous structure of the anode are opposing forces that must balance each other for the establishment of TPB. However, two other ongoing phenomena i.e. precipitation of carbon due to methane pyrolysis and consumption of the carbon anode complicate this picture furthermore. Secondly, air-permeability and PSD of the anode material influence the bubbling and hyperpolarization to a great extent.
One of the graphite grades used in this study (grade 1: G347, Tokai) proved to have the best performance as gas anode. Though, when this grade was used precipitation of carbon due to methane pyrolysis caused partial clogging of the anode. Therefore, it seems a graphite with a PSD that covers slightly larger pores (up to 40 µm) and possesses a bit higher porosity (˃ 15%) should be employed.
One of the pitfalls of such a process is the gas leakage from the anode assembly. It was demonstrated that in the case of some of the graphite grades pressure changes can give an idea of how well the anode assembly is sealed. These grades
144
with lower air-permeability showed the highest resistance against the gas flow. This resistance can even become larger during electrolysis when methane pyrolysis causes partial clogging of the anode. This hinders the supply of methane and also increases the probability of gas leakage. Fluid flow calculations and modelling can clarify this issue and provide a better understanding.
Electrolysis parameters were also studied in this work; though to a limited range. The apparent current density was mainly in range from 0.3 - 0.5 A cm-2. However, increasing the current density to 0.8 A cm-2 promoted the oxidation of methane. This is still lower than the current density in modern industrial cells. It is likely that current densities higher than 0.8 A cm-2 further promotes methane oxidation. Such current densities must be tried in the future.
Cyclic voltammetry demonstrated that the electrochemical oxidation of methane at the graphite anode occurs at a lower overpotential compared to oxidation of the graphite. Therefore, it seems likely that by optimizing the process it is possible to provide the necessary condition for the domination of methane oxidation as the anodic reaction.
The feasibility of electrochemical oxidation of methane at the graphite anodes in aluminium electrolysis was demonstrated. This process leads to a remarkable decrease in CO2 emissions from electrolysis cell. This work can be considered as an initial step towards developing this process. Consumption of graphite anodes was decreased up to 35 wt. %. This is a promising result since there is a large room for optimizing this process and achieving higher efficiencies.

145
Chapter 5
Suggestions for Future Work
Reported research and studies on developing gas-supplied anode system for aluminium electrolysis are scarce. When compared to the massive number of studies that have been carried out on inert anodes, they can be regarded as negligible. Therefore, there are still many unknown aspects that can be topics for future research. Nevertheless, based on the conclusions of this work, here are some suggestions with higher priority presented:
As mentioned earlier, one of the pitfalls of this process is the likelihood of gas leakage from the anode assembly. Thus, a more robust anode assembly with an advanced design must be fabricated. Such an anode assembly must be well sealed and gas-tight. It could be equipped with a gas plenum chamber. The level of gas-tightness might be estimated by pressure – fluid flow calculations and observations.
The gas analysis conducted in this study was useful and clarifying. But, the data did not show high reproducibility. One reason was the procedure that was carried out to avoid blockage of the off-gas tube. This led to interruptions in gas analysis. A solution could be utilizing a tube with larger diameter for this purpose. Though, all experimental considerations must be taken into account.
Anode weight changes (carbon consumption) and cell voltage variation data which are extracted from galvanostatic electrolysis runs are in principle, good

146
and indicative measures for evaluating this process. However, both of these measures are influenced by other parameters that cannot be controlled easily or are not well known at this stage. This can obscure the conclusions. Therefore, it seems better to begin the studies with electrochemical measurements such as cyclic voltammetry. Then, most of the experimental parameters can be varied easily and different condition can be tested in fewer experiments. Hence, more reliable data can be collected and the best material and experimental conditions can be found. Impedance measurements could be done in a more extensive way. Apart from calculating the double layer capacitance, this method can be used for studying the mechanism of the reaction which is crucial for further improvements. In addition, it seems beneficial to run the electrochemical measurements using the electrode with more defined surfaces. Namely, with only vertical or horizontal surfaces.
More effort must be made to reveal the mechanism of the anodic reaction(s), the role of different parameters and the contribution of other possible reactions. Microscopic studies together with chemical analysis (SEM/EDX) of different parts of the anode can be helpful in this regard. In addition, gas-permeability of the anode material can be measured both before and after electrolysis runs; comparison of the two values can reveal the extent of methane pyrolysis and progress of the gas – bath reaction.
A graphite anode seems the suitable option for such an application, but it is worthy to run experiments with one or two baked carbon anode samples as well. This enables a comparison between graphite samples and baked carbon anodes. This could be valuable especially since there is a massive number of studies on carbon anodes in the literature. On the other hand, synthesis of graphite/carbon samples can be considered as an option since common graphite grades found in the market are not suitable for this application. In addition, information about other properties such as gas-permeability are crucial but usually not given in data sheets.
Other material characterisation methods such as nitrogen adsorption measurements based on Brunauer-Emmett-Teller (BET) could be useful. The extracted data from such measurements can be used by a density functional theory (DFT) based model to determine the relative contribution of edge:basal:defect sites of the carbon material.
147
Bibliography
[1] W. Haupin, Aluminum, in: R.A. Meyers (Ed.) Encyclopedia of Physical Science and Technology, Academic Press, San Diego, 2002, pp. 495-518. [2] J. Thonstad, P. Fellner, G.M. Haarberg, J. Híveš, Å. Sterten, Aluminium Electrolysis: Fundamentals of the Hall-Héroult Process, 3rd ed., Aluminium-Verlag Marketing & Kommunikation GmbH, Düsseldorf, Germany, 2001. [3] Primary Aluminium Production. <http://www.world-aluminium.org/statistics/>, 2016 (accessed 23.12.2016.). [4] Tracking industrial energy efficiency and CO2 emissions, International Energy Agency (IEA), Paris, France, 2007. [5] Aluminium: The Element of Sustainabilty, The Aluminium Association, 2011, p. 70. [6] Aluminium for Future Generations, International Aluminium Institute, 2009. [7] Environmental metrics report, year data 2010, International Aluminium Institute (IAI), 2014, p. 23. [8] Glossary; US Energy Information Administration <https://www.eia.gov/tools/glossary/index.cfm?id=G >, 2017 (accessed 09.03.2017.2017). [9] Global Life Cycle Inventory Data for the Primary Aluminium Industry (2010 Data), Intenational Aluminium Institute (IAI), 2013, p. 53. [10] Primary Aluminium Smelting Power Consumption. <http://www.world-aluminium.org/statistics/primary-aluminium-smelting-power-consumption/#data>, 2017 (accessed 30.01.2017.2017). [11] Karmøy Technology Pilot, Hydro, 2016. [12] E. Balomenos, D. Panias, I. Paspaliaris, Energy and Exergy Analysis of the Primary Aluminum Production Processes: A Review on Current and Future Sustainability, Mineral Processing & Extractive Metallurgy Review 32(2) (2011) 69-89.

148
[13] K. Kermeli, P.H. ter Weer, W. Crijns-Graus, E. Worrell, Energy efficiency improvement and GHG abatement in the global production of primary aluminium, Energy Efficiency 8(4) (2015) 629-666. [14] M.A. Dewan, M.A. Rhamdhani, G.A. Brooks, B.J. Monaghan, L. Prentice, Alternative Al production methods: Part 2 - Thermodynamic analyses of indirect carbothermal routes, Transactions of the Institutions of Mining and Metallurgy, Section C: Mineral Processing and Extractive Metallurgy 122(2) (2013) 113-121. [15] M.A. Rhamdhani, M.A. Dewan, G.A. Brooks, B.J. Monaghan, L. Prentice, Alternative Al production methods: Part 1 - A review of indirect carbothermal routes, Transactions of the Institutions of Mining and Metallurgy, Section C: Mineral Processing and Extractive Metallurgy 122(2) (2013) 87-104. [16] J. Yang, J.N. Hryn, B.R. Davis, A. Roy, G.K. Krumdick, J.A. Pomykala Jr, New opportunities for aluminum electrolysis with metal anodes in a low temperature electrolyte system, TMS Light Metals, 2004, pp. 321-326. [17] I. Galasiu, R. Galasiu, Aluminium Electrolysis with Inert Anodes and Wettable Cathodes and with Low Energy Consumption, Molten Salts Chemistry and Technology2014, pp. 27-37. [18] Donald R Sadoway, Inert anodes for the Hall-Héroult cell: The ultimate materials challenge, JOM 53(5) (2001) 34-35. [19] R.P. Pawlek, Inert Anodes: An Update, Light Metals 2014, John Wiley & Sons, Inc.2014, pp. 1309-1313. [20] R.P. Pawlek, Inert anodes: An update, TMS Light Metals, 2008, pp. 1039-1045. [21] J. Xue, A.P. Ratvik, Anode system for use in metal reduction processes and method for the same, in: S. AS (Ed.) NORWAY, 2003. [22] S. Xiao, T. Mokkelbost, O. Paulsen, A.P. Ratvik, G.M. Haarberg, SnO2-based gas (methane) anodes for electrowinning of aluminum, Metallurgical and Materials Transactions B: Process Metallurgy and Materials Processing Science 44(5) (2013) 1311-1316. [23] Electrochemical Dictionary, in: A.J. Bard, G. Inzelt, F. Scholz (Eds.) Springer-Verlag Berlin Heidelberg, Germany, 2008, pp. XIV, 723. [24] Sankar Namboothiri, Mark P.Taylor, John J. J.Chen, Margaret M.Hyland, Mark A. Cooksey, An experimental study of aluminium electrowinning using a nickel-based hydrogen diffusion anode, Electrochimica Acta 56(9) (2011) 3192-3202. [25] T. Mokkelbost, O. Kjos, O. Paulsen, B. Øye, H. Gudbrandsen, A.P. Ratvik, G.M. Haarberg, A Concept for Electrowinning of Aluminium Using Depolarized Gas Anodes, Light Metals 2014, John Wiley & Sons, Inc.2014, pp. 765-769. [26] M.L. Kronenberg, Gas Depolarized Graphite Anodes for Aluminum Electrowinning, Journal of The Electrochemical Society 116(8) (1969) 1160-1164. [27] M Louis Ferrand, Note to Bull.Soc.Franc. Electriciens, Bull. Soc. Franc. Electriciens 79 (1957) 412.

149
[28] V. V. Stender, V. V. Trofimenko, One solution to the anode problem in electrolytic production of aluminium, Khim. Tekhnol. 12 (1969) 41. [29] R.A. Rapp, Method featuring a non-consumable anode for the electrowinning of aluminum, Google Patents, 2000. [30] R.A. Rapp, Y. Zhang, Fate of SOFC-type inert anode for production of primary aluminum, Light Metals: Proceedings of Sessions, TMS Annual Meeting (Warrendale, Pennsylvania), 2002, pp. 463-468. [31] S. Namboothiri, M.P. Taylor, J.J.J. Chen, M.M. Hyland, M. Cooksey, Characterisation and performance of carbon based hydrogen diffusion anode for molten salt electrowinning, in: D. Bhattacharyya, R.J.T. Lin, T.S. Srivatsan (Eds.) Processing and Fabrication of Advanced Materials XIX Auckland, New Zealand, 2011, p. 18. [32] S. Xiao, T. Mokkelbost, G.M. Haarberg, A.P. Ratvik, J. Kvello, K.S. Osen, H. Zhu, Electrochemical Behaviour of Depolarized Reducing Gas Anodes in Molten Salts, ECS Transactions 16(49) (2009) 6. [33] G.M. Haarberg, E. Kvalheim, A.P. Ratvik, S.J. Xiao, T. Mokkelbost, Depolarised gas anodes for aluminium electrowinning, Transactions of Nonferrous Metals Society of China 20(11) (2010) 2152-2154. [34] T. Mokkelbost, O. Paulsen, S. Xiao, G.M. Haarberg, A.P. Ratvik, Fabrication and properties of SnO 2-based inert gas anodes for electrowinning, ECS Transactions, 2010, pp. 211-219. [35] S. Xiao, T. Mokkelbost, G.M. Haarberg, A.P. Ratvik, H. Zhu, Depolarized gas anodes for electrowinning of metals in molten salts, ECS Transactions, 2010, pp. 361-366. [36] S. Xiao, Depolarized gas anodes for electrowinning in molten salts, Department of Materials Science and Engineering, Norwegian University of Science and Technology, Trondheim, Norway, 2011. [37] G.M. Haarberg, S. Xiao, A.P. Ratvik, T. Mokkelbost, Depolarized Gas Anodes for Electrowinning of Aluminium from Cryolite-Alumina Melts in a Laboratory Cell, Light Metals 2012, John Wiley & Sons, Inc.2012, pp. 779-781. [38] S. Xiao, T. Mokkelbost, O. Paulsen, A.P. Ratvik, G.M. Haarberg, SnO2-based gas (hydrogen) anodes for aluminum electrolysis, Transactions of Nonferrous Metals Society of China 24(12) (2014) 3917-3921. [39] NIST-JANAF Thermochemical Tables, National Institute of Standards and Technology. [40] J. Thonstad, On the Anode Gas Reactions in Aluminum Electrolysis, II, Journal of The Electrochemical Society 111(8) (1964) 959-965. [41] A. Kisza, J. Thonstad, T. Eidet, An Impedance Study of the Kinetics and Mechanism of the Anodic Reaction on Graphite Anodes in Saturated Cryolite-Alumina Melts, Journal of The Electrochemical Society 143(6) (1996) 1840-1847. [42] G.S. Picard, E.C. Prat, Y.J. Bertaud, M.J. Leroy, EVIDENCING THE ELECTROCHEMICAL MECHANISM AT CARBON/BATH INTERFACE BY MEANS OF
150
IMPEDANCE MEASUREMENT: AN IMPROVED APPROACH TO THE ALUMINUM REDUCTION PROCESS, Light Metals: Proceedings of Sessions, AIME Annual Meeting (Warrendale, Pennsylvania), 1987, pp. 507-517. [43] J. Thonstad, A. Kisza, J. Kazmierczak, Kinetics and mechanism of the Al(iii)/Al electrode reaction in cryolite-alumina melts, J Appl Electrochem 26(1) (1996) 102-112. [44] Å. Sterten, Structural entities in NaFAlF3 melts containing alumina, Electrochimica Acta 25(12) (1980) 1673-1677. [45] R.J. Thorne, C. Sommerseth, A.P. Ratvik, S. Rørvik, E. Sandnes, L.P. Lossius, H. Linga, A.M. Svensson, Bubble Evolution and Anode Surface Properties in Aluminium Electrolysis, Journal of The Electrochemical Society 162(8) (2015) E104-E114. [46] R.J. Thorne, C. Sommerseth, A.P. Ratvik, S. Rørvik, E. Sandnes, L.P. Lossius, H. Linga, A.M. Svensson, Correlation between Coke Type, Microstructure and Anodic Reaction Overpotential in Aluminium Electrolysis, Journal of The Electrochemical Society 162(12) (2015) E296-E306. [47] J.G. Speight, CHAPTER 3 - Composition and Properties, Natural Gas, Gulf Publishing Company2007, pp. 61-83. [48] R. Ciccoli, V. Cigolotti, R. Lo Presti, E. Massi, S.J. McPhail, G. Monteleone, A. Moreno, V. Naticchioni, C. Paoletti, E. Simonetti, F. Zaza, Molten carbonate fuel cells fed with biogas: Combating H2S, Waste Management 30(6) (2010) 1018-1024. [49] T.M. Gür, Comprehensive review of methane conversion in solid oxide fuel cells: Prospects for efficient electricity generation from natural gas, Progress in Energy and Combustion Science 54 (2016) 1-64. [50] J.G. Speight, CHAPTER 1 - History and Uses, Natural Gas, Gulf Publishing Company2007, pp. 3-33. [51] R.A. Kerr, Natural Gas From Shale Bursts Onto the Scene, Science 328(5986) (2010) 1624-1626. [52] International Energy Outlook 2016, U.S. Energy Information Administration (EIA), 2016, p. 290. [53] L. Kolbeinsen, Modelling of DRI Processes with Two Simultaneously Active Reducing Gases, Steel Research International 81(10) (2010) 819-828. [54] O. Ostrovski, G. Zhang, Reduction and carburization of metal oxides by methane-containing gas, AIChE Journal 52(1) (2006) 300-310. [55] R. Alizadeh, E. Jamshidi, H. Ale Ebrahim, Kinetic Study of Nickel Oxide Reduction by Methane, Chemical Engineering & Technology 30(8) (2007) 1123-1128. [56] A.K. Manohar, S.R. Narayanan, Efficient Generation of Electricity from Methane using High Temperature Fuel Cells - Status, Challenges and Prospects, Israel Journal of Chemistry 54(10) (2014) 1443-1450.
151
[57] W.T. Grubb, C.J. Michalske, Electrochemical Oxidation of Methane in Phosphoric Acid Fuel Cells at 150[deg]C, Nature 201(4916) (1964) 287-288. [58] L.W. Niedrach, Galvanostatic and Volumetric Studies of Hydrocarbons Adsorbed on Fuel Cell Anodes, Journal of The Electrochemical Society 111(12) (1964) 1309-1317. [59] L.W. Niedrach, Studies of Hydrocarbon Fuel Cell Anodes by the Multipulse Potentiodynamic Method: II . Behavior of Methane on Conducting Porous Teflon Electrodes, Journal of The Electrochemical Society 113(7) (1966) 645-650. [60] S.Y. Hsieh, K.M. Chen, Anodic Oxidation of Methane, Journal of The Electrochemical Society 124(8) (1977) 1171-1174. [61] G. Psofogiannakis, A. St-Amant, M. Ternan, Methane Oxidation Mechanism on Pt(111): A Cluster Model DFT Study, The Journal of Physical Chemistry B 110(48) (2006) 24593-24605. [62] M. Joglekar, V. Nguyen, S. Pylypenko, C. Ngo, Q. Li, M.E. O'Reilly, T.S. Gray, W.A. Hubbard, T.B. Gunnoe, A.M. Herring, B.G. Trewyn, Organometallic Complexes Anchored to Conductive Carbon for Electrocatalytic Oxidation of Methane at Low Temperature, Journal of the American Chemical Society 138(1) (2016) 116-125. [63] F. Hahn, C.A. Melendres, Anodic oxidation of methane at noble metal electrodes: an ‘in situ’ surface enhanced infrared spectroelectrochemical study, Electrochimica Acta 46(23) (2001) 3525-3534. [64] P. Jacquinot, B. Müller, B. Wehrli, P.C. Hauser, Determination of methane and other small hydrocarbons with a platinum-Nafion electrode by stripping voltammetry, Analytica Chimica Acta 432(1) (2001) 1-10. [65] M. Cassir, A. Ringuedé, V. Lair, Molten Carbonates from Fuel Cells to New Energy Devices, Molten Salts Chemistry2013, pp. 355-371. [66] Y. Jiao, L. Zhang, W. An, W. Zhou, Y. Sha, Z. Shao, J. Bai, S.-D. Li, Controlled deposition and utilization of carbon on Ni-YSZ anodes of SOFCs operating on dry methane, Energy 113 (2016) 432-443. [67] X. Kong, Y. Tian, X. Zhou, X. Wu, J. Zhang, Surface tuned La0.9Ca0.1Fe0.9Nb0.1O3-δ based anode for direct methane solid oxide fuel cells by infiltration method, Electrochimica Acta 234 (2017) 71-81. [68] C.B. Carter, M.G. Norton, Ceramic Materials: Science and Engineering, Springer New York: New York, NY, New York, NY, 2013. [69] Handbook of Fuel cells: Fundamentals, Technology, Applications, John Wiley & Sons, England, 2003. [70] A. Solheim, Polyvalent Impurities and Current Efficiency in Aluminium Cells: A Model Concerning Electrochemical Short Circuiting, Light Metals 2016, John Wiley & Sons, Inc.2016, pp. 371-376. [71] E. Skybakmoen, A. Solheim, Å. Sterten, Alumina solubility in molten salt systems of interest for aluminum electrolysis and related phase diagram data, Metall and Materi Trans B 28(1) (1997) 81-86.

152
[72] J.W. Burgman, J.A. Leistra, P.J. Sides, Aluminum/Cryolite Reference Electrodes for Use in Cryolite-Based Melts, Journal of The Electrochemical Society 133(3) (1986) 496-500. [73] Graphite & carbon specialistes Tokai Carbon Europe. [74] Grade Chart, Industrial Grades, POCO GRAPHITE; An Entegris Company, 2014. [75] Technical Data Sheet 6022, in: GrafTech (Ed.) GrafTech International Holding Inc., 2011. [76] Technical Data Sheet in: S.T. AB (Ed.) Svenska Tanso [77] M. Sahimi, Flow and Transport in Porous Media and Fractured Rock: From Classical Methods to Modern Approaches, 2nd ed., Wiley-VCH, Weinheim, Germany, 2011. [78] The SI Metric System of Units and SPE Metric Standard, Society of Petroleum Engineers, USA, 1984, p. 42. [79] RDC-145 Air Permeability Apparatus User Manual, R&D Carbon Ltd, Switzerland. [80] Micromeritics, AutoPore IV 9500, operator's Manual VI.09., 2011. [81] B. Khalaghi, H. Gudbrandsen, O.S. Kjos, K.S. Osen, T. Mokkelbost, G.M. Haarberg, Porous Carbon Anodes for the Supply of Methane during Electrowinning of Aluminium, Light Metals 2016, John Wiley & Sons, Inc.2016, pp. 915-920. [82] Saijun Xiao, Tommy Mokkelbost, Ove Paulsen, Arne Petter Ratvik, Geir Martin Haarberg, SnO2-Based Gas (Methane) Anodes for Electrowinning of Aluminum, Metallurgical and Materials Transactions 44B (2013) 1-6. [83] M.L. Kronenberg, Gas Depolarized Graphite Anodes for Aluminum Electrowinning, Journal of The Electrochemical Society 116(8) (1969) 1160-1164. [84] Robert A. Rapp, Method featuring a non-consumable anode for the electrowinning of aluminum, The Ohio State University (Columbus, OH), United States, 2000, p. 18. [85] Geir Martin Haarberg, Saijun Xiao, Arne Petter Ratvik, Tommy Mokkelbost, Depolarized gas anodes for electrowinning of aluminium from cryolite alumina melts in a laboratory cell, in: C.E. Suarez (Ed.), Light Metals 2012, Minerals, Metals & Materials Soc, Warrendale, 2012, pp. 779-781. [86] Saijun Xiao, Tommy Mokkelbost, Geir Martin Haarberg, Arne Patter Ratvik, Hongmin Zhu, Depolarized Gas Anodes for Electrowinning of Metals in Molten Salts, ECS Transactions 28(6) (2010) 361-366. [87] C. Guéret, M. Daroux, F. Billaud, Methane pyrolysis: thermodynamics, Chemical Engineering Science 52(5) (1997) 815-827. [88] M.P. Taylor, B.J. Welch, J.T. Keniry, Effect of electrochemical changes on the heat balance in aluminium smelting cells, Journal of Electroanalytical Chemistry and Interfacial Electrochemistry 168(1) (1984) 179-192.

153
[89] G.M. Haarberg, B. Khalaghi, T. Mokkelbost, Natural gas anodes for aluminium electrolysis in molten fluorides, Faraday Discussions 190(0) (2016) 71-84. [90] I. Galasiu, R. Galasiu, J. Thonstad, Inert Anodes for Aluminium Electrolysis, Aluminium Verlag, Dusseldorf, 2007. [91] J. Levitan, H. Park, Electrolytic Production of Aluminum, US, 1972. [92] U.B. Pal, D.E. Woolley, G.B. Kenney, Emerging SOM technology for the green synthesis of metals from oxides, JOM 53(10) (2001) 32. [93] A. Krishnan, U.B. Pal, X.G. Lu, Solid oxide membrane process for magnesium production directly from magnesium oxide, Metall and Materi Trans B 36(4) (2005) 463-473. [94] U.B. Pal, A.C.I.V. Powell, The Use of Solid-Oxide-Membrane Technology for Electrometallurgy, JOM 59(5) (2007) 44-49. [95] G. Van Weert, Electrolytic production of magnesium, Google Patents, 2002. [96] S. Namboothiri, M.P. Taylor, J.J.J. Chen, M.M. Hyland, M. Cooksey, Aluminium production options with a focus on the use of a hydrogen anode: a review, Asia-Pacific Journal of Chemical Engineering 2(5) (2007) 442-447. [97] M. P. Taylor, B. J. Welch, J. T. Keniry, Effect of electrochemical changes on the heat balance in aluminium smeltins cells, Journal of Electroanalytical Chemistry and Interfacial Electrochemistry 168(1) (1984) 179-192. [98] T.H. Okabe, O. Kuzmina, J.M. Slattery, C. Jiang, T. Sudmeier, L. Yu, H. Wang, W. Xiao, L. Xu, X. Yue, Y. Kong, A. Doherty, G.M. Haarberg, S. Jiao, Q. Xu, H. Zhu, D. Wang, P. Madden, D. Cooper, K. McGregor, C. Wei, B. Hu, A. Mount, J. Irvine, A. Kamali, B. Khalaghi, X. Jin, Y. Liu, G.Z. Chen, X. Zou, G. Chen, Y. Liu, M. Eshtaya, D. Fray, Y. Yuan, Benefits to energy efficiency and environmental impact: general discussion, Faraday Discussions 190(0) (2016) 161-204. [99] B. Khalaghi, H. Gudbrandsen, O. Kjos, K.S. Osen, O. Paulsen, T. Mokkelbost, G.M. Haarberg, Gas anodes made of porous graphite for aluminium electrowining, in: A.P. Ratvik (Ed.), Light Metals 2017, Springer2017. [100] Anodes for the Aluminium Industry, 1st ed., R&D Carbon Ltd., Sierre, Swithzerland, 1995. [101] S. Rorvik, H.A. Oye, Method for characterization of anode pore structure by image analysis, Light Metals: Proceedings of Sessions, TMS Annual Meeting (Warrendale, Pennsylvania), 1996, pp. 561-568. [102] E. Perry Murray, T. Tsai, S.A. Barnett, A direct-methane fuel cell with a ceria-based anode, Nature 400(6745) (1999) 649-651. [103] P. Seungdoo, J.M. Vohs, Direct oxidation of hydrocarbons in a solid-oxide fuel cell, Nature 404(6775) (2000) 265. [104] C. Sommerseth, R. Thorne, A. Ratvik, E. Sandnes, H. Linga, L. Lossius, A. Svensson, The Effect of Varying Mixing Temperatures and Baking Level on the Quality of Pilot Scale Anodes—A Factorial Design Analysis, Metals 7(3) (2017) 74.

154
[105] R. Byron Bird, Warren E. Stewart, E.N. Lightfoot, Transport Phenomena, 2nd. ed., John Wiley & Sons, Inc., United States of America, 2007. [106] F. Chevarin, K. Azari, L. Lemieux, D. Ziegler, M. Fafard, H. Alamdari, Active pore sizes during the CO2 gasification of carbon anode at 960 °C, Fuel 178 (2016) 93-102. [107] D. Pletcher, R. Greff, R. Peat, L.M. Peter, J. Robinson, 6 - Potential sweep techniques and cyclic voltammetry, Instrumental Methods in Electrochemistry, Woodhead Publishing2010, pp. 178-228. [108] K. Grjotheim, C. Krohn, M. Malinovský, K. Matiašovský, J. Thonstad, Aluminium Electrolysis; Fundamentals of Hall-Héroult Process, 2nd ed., Aluminium-Verlag, Düsseldorf, 1982. [109] J. Thonstad, Double layer capacity of graphite in cryolite-alumina melts and surface area changes by electrolyte consumption of graphite and baked carbon, J Appl Electrochem 3(4) (1973) 315-319. [110] A.J. Calandra, C.E. Castellano, C.M. Ferro, The electrochemical behaviour of different graphite/cryolite alumina melt interfaces under potentiodynamic perturbations, Electrochimica Acta 24(4) (1979) 425-437. [111] S. Jarek, J. Thonstad, Fast voltammetry study of anodic reactions in graphite in cryolite-alumina melts, Electrochimica Acta 32(5) (1987) 743-747. [112] S. Jarek, J. Thonstad, Voltammetric Study of Anodic Adsorption Phenomena on Graphite in Cryolite-Alumina Melts, Journal of The Electrochemical Society 134(4) (1987) 856-859. [113] S.S. Djokić, B.E. Conway, T.F. Belliveau, Specificity of anodic processes in cyclic voltammetry to the type of carbon used in electrolysis of cryolite-alumina melts, J Appl Electrochem 24(9) (1994) 827-834. [114] A. Kisza, J. Kazmierczak, J. Thonstad, T. Eidet, J. Hives, Kinetics and mechanism of the electrode reactions in aluminum electrolysis, Light Metals: Proceedings of Sessions, TMS Annual Meeting (Warrendale, Pennsylvania), 1999, pp. 423-429. [115] E.J. Frazer, B.J. Welch, REACTIONS OCCURRING AT THE ANODE DURING ALUMINIUM ELECTROLYSIS, Proc Australas Inst Min Metall (260) (1976) 17-22. [116] W. Gebarowski, C. Sommerseth, A.P. Ratvik, E. Sandnes, L.P. Lossius, H. Linga, A.M. Svensson, Interfacial Boundary between Carbon Anodes and Molten Salt Electrolyte, Light Metals (2016) 6. [117] S. Jarek, Z. Orman, The faradaic impedance of the carbon anode in cryolite-alumina melt, Electrochimica Acta 30(3) (1985) 341-345. [118] S. Jarek, J. Thonstad, Double-layer capacitance and polarization potential of baked carbon anodes in cryolite-alumina melts, J Appl Electrochem 17(6) (1987) 1203-1212. [119] J. Thonstad, The electrode reaction on the C, CO2 electrode in cryolite-alumina melts—II. Impedance measurements, Electrochimica Acta 15(10) (1970) 1581-1595.

155
[120] C. Sommerseth, R.J. Thorne, A.P. Ratvik, E. Sandnes, S. Rørvik, L.P. Lossius, H. Linga, A.M. Svensson, Electrochemical Reactivity and Wetting Properties of Anodes Made From Anisotropic and Isotropic Cokes, Light Metals (2016) 6. [121] R.J. Thorne, C. Sommerseth, A.M. Svensson, E. Sandnes, L.P. Lossius, H. Linga, A.P. Ratvik, Understanding Anode Overpotential, Light Metals 2014, John Wiley & Sons, Inc.2014, pp. 1213-1217. [122] B. Khalaghi, O. Kjos, T. Mokkelbost, G.M. Haarberg, Reducing CO2 emissions from aluminium electrolysis cell by supplying porous anodes with methane, 2017.

156